Embed Size (px)
Citation preview

CAPCOG Overview The Capital Area Council of Governments (CAPCOG), a Regional Planning Commission organized under Chapter 391, Local Government Code, is a voluntary association of counties, cities and special districts.
Our primary focus is to serve as advocate, planner and coordinator of initiatives that, when undertaken on a regional basis, can be more effective and efficient. CAPCOG was organized in 1970 to serve local governments in its ten‐county region, known as State Planning Region 12. CAPCOG is commonly referred to as a Council of Governments (COG). A COG is defined by law as political subdivision of the state, but has no regulatory power or the authority possessed by cities, counties, or other local governments. CAPCOG full membership currently consists of 10 counties and 60 municipalities. Associate members represent school districts, special purpose governmental districts and conservation organizations.
Vision Statement CAPCOG’s vision is to exemplify the spirit of regional cooperation by transcending boundaries, developing partnerships, maximizing resources, eliminating duplication, and addressing common challenges.
Mission Statement Serve the Capital Area as a regional advocate, planner, coordinator, and service provider.
Goals 1. To lead in the promotion of regionalism;
2. To build partnerships for the economic, environmental, and social development of the region;
3. To identify needs within the region and provide access to resources; and
4. To provide exceptional service.

Table of Contents Budget Resolution ....................................................................................................... 1 Budget Summary ........................................................................................................ 5 Budget Charts .............................................................................................................. 13 Area Agency on Aging ............................................................................................... 19 Community & Economic Development...................................................................... 27 Emergency Communications ...................................................................................... 33 Homeland Security ...................................................................................................... 39 Regional Planning ....................................................................................................... 45 Regional Training Academy ....................................................................................... 53 Administrative Services .............................................................................................. 59 Personnel & Salary Schedules .................................................................................... 65 Supplemental Information .......................................................................................... 73


Budget Resolution
11

22
3
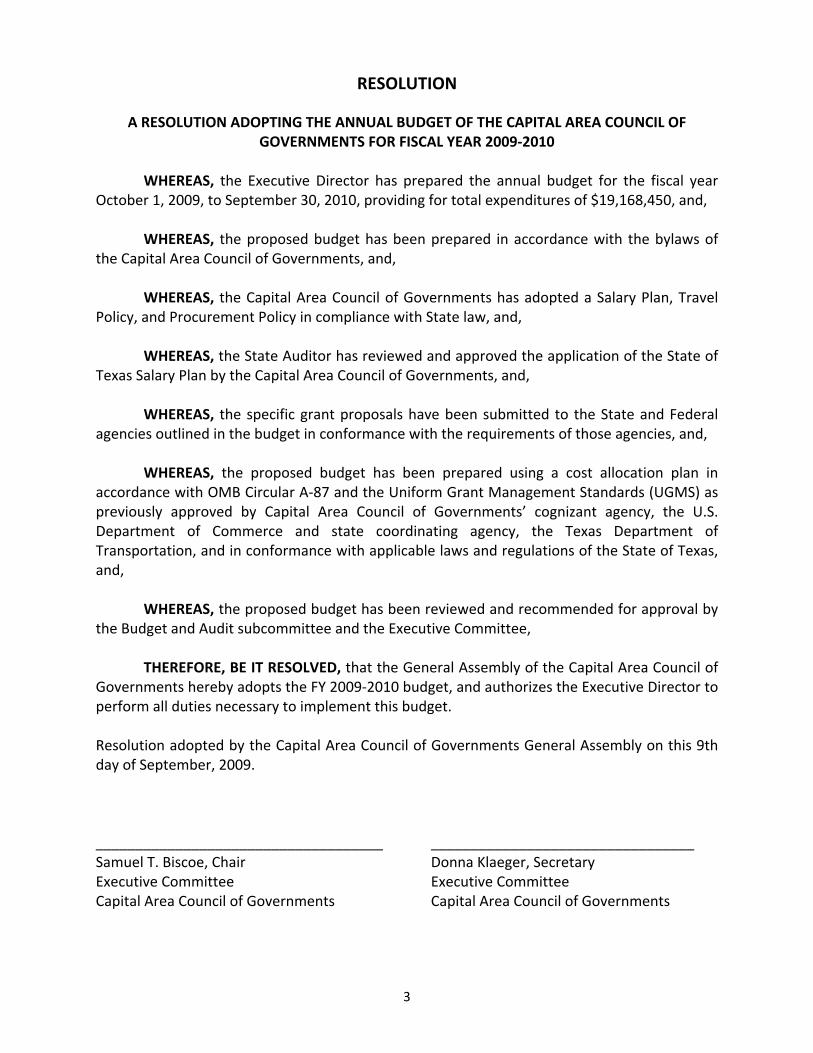
RESOLUTION
A RESOLUTION ADOPTING THE ANNUAL BUDGET OF THE CAPITAL AREA COUNCIL OF GOVERNMENTS FOR FISCAL YEAR 2009‐2010
WHEREAS, the Executive Director has prepared the annual budget for the fiscal year October 1, 2009, to September 30, 2010, providing for total expenditures of $19,168,450, and, WHEREAS, the proposed budget has been prepared in accordance with the bylaws of the Capital Area Council of Governments, and,
WHEREAS, the Capital Area Council of Governments has adopted a Salary Plan, Travel Policy, and Procurement Policy in compliance with State law, and,
WHEREAS, the State Auditor has reviewed and approved the application of the State of
Texas Salary Plan by the Capital Area Council of Governments, and,
WHEREAS, the specific grant proposals have been submitted to the State and Federal agencies outlined in the budget in conformance with the requirements of those agencies, and,
WHEREAS, the proposed budget has been prepared using a cost allocation plan in
accordance with OMB Circular A‐87 and the Uniform Grant Management Standards (UGMS) as previously approved by Capital Area Council of Governments’ cognizant agency, the U.S. Department of Commerce and state coordinating agency, the Texas Department of Transportation, and in conformance with applicable laws and regulations of the State of Texas, and,
WHEREAS, the proposed budget has been reviewed and recommended for approval by the Budget and Audit subcommittee and the Executive Committee, THEREFORE, BE IT RESOLVED, that the General Assembly of the Capital Area Council of Governments hereby adopts the FY 2009‐2010 budget, and authorizes the Executive Director to perform all duties necessary to implement this budget. Resolution adopted by the Capital Area Council of Governments General Assembly on this 9th day of September, 2009. ____________________________________ _________________________________ Samuel T. Biscoe, Chair Donna Klaeger, Secretary Executive Committee Executive Committee Capital Area Council of Governments Capital Area Council of Governments

4

Budget Summary
5 5
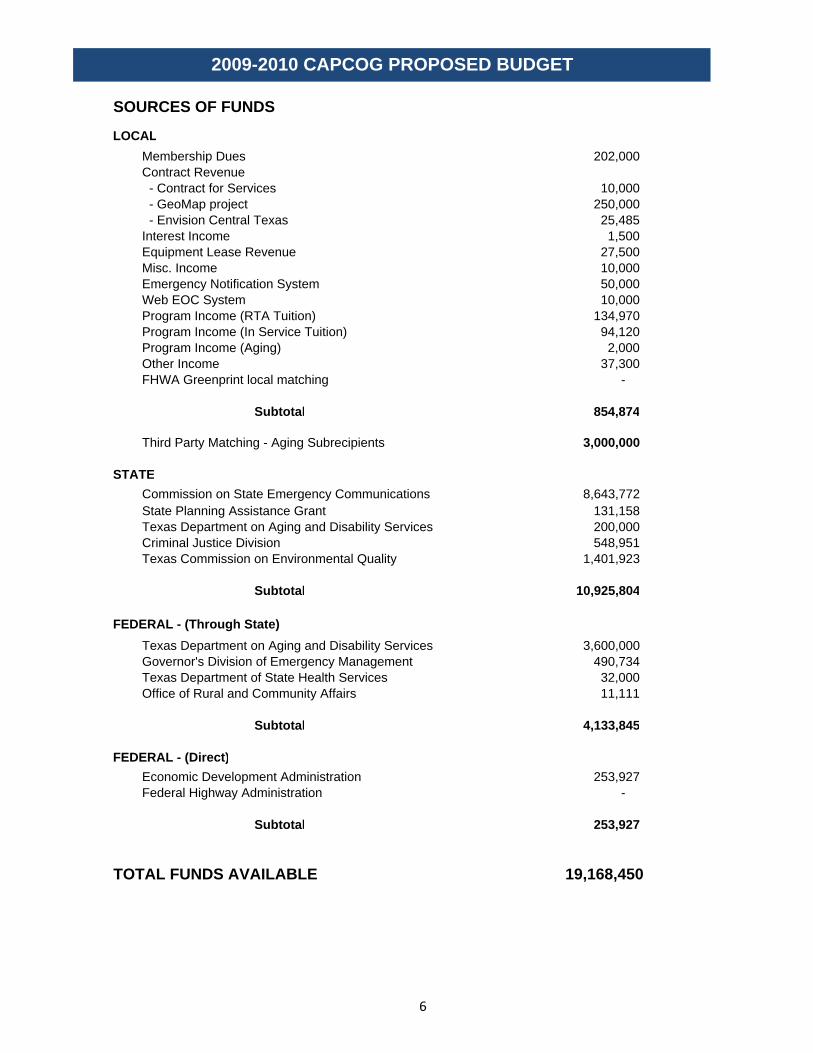
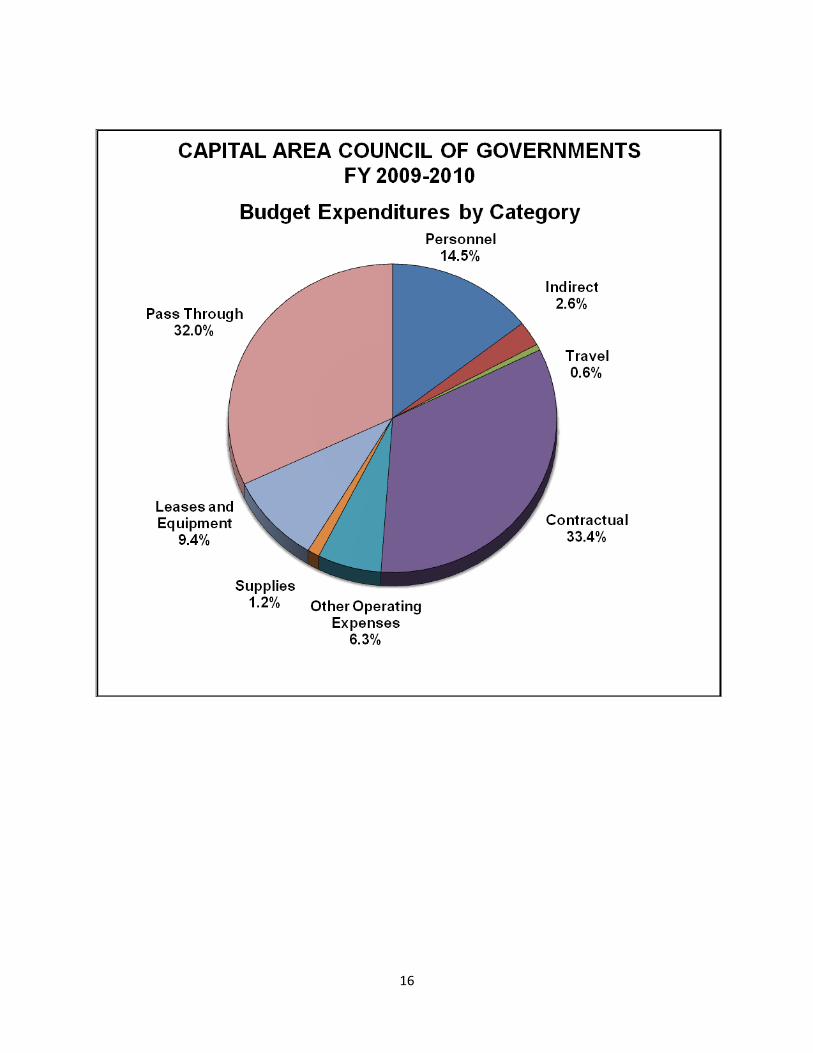
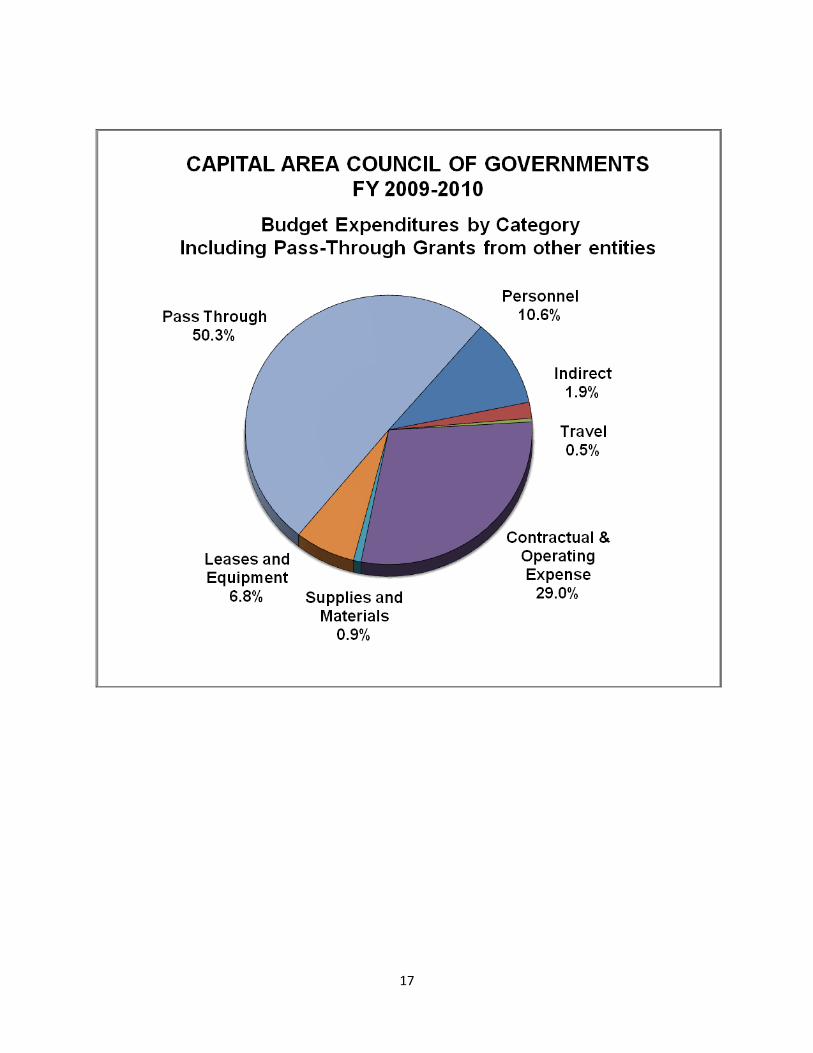
SOURCES OF FUNDS
LOCALMembership Dues 202,000 Contract Revenue - Contract for Services 10,000 - GeoMap project 250,000 - Envision Central Texas 25,485 Interest Income 1,500 Equipment Lease Revenue 27,500 Misc. Income 10,000 Emergency Notification System 50,000 Web EOC System 10,000 Program Income (RTA Tuition) 134,970 Program Income (In Service Tuition) 94,120 Program Income (Aging) 2,000 Other Income 37,300 FHWA Greenprint local matching -
Subtotal 854,874
Third Party Matching - Aging Subrecipients 3,000,000
STATECommission on State Emergency Communications 8,643,772 State Planning Assistance Grant 131,158 Texas Department on Aging and Disability Services 200,000 Criminal Justice Division 548,951 Texas Commission on Environmental Quality 1,401,923
Subtotal 10,925,804
FEDERAL - (Through State)Texas Department on Aging and Disability Services 3,600,000 Governor's Division of Emergency Management 490,734 Texas Department of State Health Services 32,000 Office of Rural and Community Affairs 11,111
Subtotal 4,133,845
FEDERAL - (Direct)Economic Development Administration 253,927 Federal Highway Administration -
Subtotal 253,927
TOTAL FUNDS AVAILABLE 19,168,450
2009-2010 CAPCOG PROPOSED BUDGET
6
USES OF FUNDS
AGING SERVICESCAPCOG Aging Program Administration 200,000 CAPCOG Aging Program 2,280,500 Aging Program Sub-recipients (pass-through 1,400,000 Aging Program Third party match 3,000,000
Sub-total 6,880,500
COMMUNITY AND ECONOMIC DEVELOPMENTEconomic Development 303,927 Community Development 54,057 Solid Waste Management 208,000 Solid Waste Pass through Grants 484,333 Criminal Justice Planning 207,154 Community and Regional Planning/Regional Review Committee (CEDAF 11,111
Sub-total 1,268,582
REGIONAL PLANNINGAir Quality Programs 709,590 Regional Planning 170,118 Greenprint - GeoMap project 249,715
Sub-total 1,129,423
REGIONAL TRAINING ACADEMYRegional Training Cente 94,119 Regional Law Enforcement Academy 476,767
Sub-total 570,886
EMERGENCY COMMUNICATIONS9-1-1 Regional Planning/Implementation 778,945 9-1-1 Regional Programs 7,864,827
Sub-total 8,643,772
HOMELAND SECURITYHomeland Security Planning 373,775 Interoperability Planning 116,959 Bioterrorism Planning 32,000 Emergency Notification System 50,000 Web EOC System 10,000
Sub-total 582,734
OTHEROther local 67,066 Envision Central Texas Contrac 25,485
Sub-total 92,552
TOTAL EXPENDITURES 19,168,450
2009-2010 CAPCOG PROPOSED BUDGET
7
CAPITAL AREA COUNCIL OF GOVERNMENTSANNUAL BUDGET
OCTOBER 1, 2009 - SEPTEMBER 30, 2010
RegionalEconomic Community CEDAF TCEQ Task CJD CJD Regional GeoMap TCEQ Training Bioterrorism Interoperability Homeland
AGING Dev. Dev. ORCA RSWM Force Planning Stimulus Planning Air Quality Academy Planning Planning Security ENS WebEOCREVENUE
Sources of FundsFederal 3,600,000 253,927 11,111 - - - 32,000 116,959 373,775 State 200,000 - 650,000 42,333 137,063 70,091 - - 709,590 341,797 - - - - - State Planning Grant - - 29,543 - - 101,615 - Other Local Income 50,000 50,000 24,514 - - - 41,500 250,000 25,485 50,000 10,000 Program Income 2,000 - - 134,970 Other income 28,500 8,800 - - - Interfund transfers - - Third Party 3,000,000 - -
TOTAL REVENUE 6,880,500 303,927 54,057 11,111 650,000 42,333 137,063 70,091 151,915 250,000 709,590 25,485 476,767 32,000 116,959 373,775 50,000 10,000
EXPENDITURES Salaries 622,788 60,339 16,242 5,506 80,311 18,738 59,486 29,810 80,182 3,327 190,293 - 153,039 13,162 9,769 161,315 - - Temporary Salaries - - Benefits 270,010 26,160 7,042 2,387 34,819 8,124 25,790 12,924 34,763 1,443 82,502 - 66,350 5,707 4,235 69,938 - -
TOTAL PERSONNEL 892,798 86,499 23,283 7,893 115,130 26,863 85,276 42,735 114,946 4,770 272,795 - 219,389 18,869 14,004 231,253 - - -
Photocopy Expense 4,000 600 400 - 1,200 1,000 500 - 1,000 1,000 5,000 250 - 2,000 Printing Expense 4,000 500 400 - 600 700 400 - 500 - 2,500 250 - 518 Postage and Delivery 4,000 200 - - 600 1,500 750 - 250 1,000 2,500 - - 500 Telecommunications 28,169 2,817 1,408 - 4,225 - 1,408 1,408 1,408 - 4,225 2,817 7,042 704 - 6,338 - - Insurance and Bonding - - - - - - 800 - - Advertising and Promotions 10,000 - - 3,700 1,000 500 - 2,000 - - - Publications and Subscriptions - 200 250 125 - - - 500 - - Professional Development 12,000 1,500 - 1,400 1,500 700 2,000 - 1,745 - 1,500 - - 2,500 Dues and Memberships 2,100 1,000 - - 617 - - - - - - 200 - - 270 Contractual Services 1,000,000 163,917 15,000 - - - - 240,000 300,000 - 69,000 - 69,751 - 50,000 10,000 Legal Services 3,000 500 - - 400 500 500 500 - 500 - 500 - - 500 Auditing - - - - - - - - - - Professional Services - - - - - 2,000 - - - -
TOTAL CONTRACTUAL & OPERATING EXPENSE 1,067,269 171,034 17,208 - 12,942 - 7,858 4,883 3,908 240,000 312,220 4,817 89,542 1,204 69,751 12,626 50,000 10,000
Office Supplies 7,000 1,000 500 2,000 1,500 500 1,500 - 4,000 - 3,500 550 2,000 2,000 Other Supplies 5,120 250 - - 12,000 1,000 291 - - 2,000 - 6,000 Computer Supplies 1,600 - - - 500 - 500 - 1,400 305 1,000 2,000 Educational Supplies - - - - - - - - - - 20,000 - Safety Supplies - - - - - - - - - - - Meeting Supplies - - - - - - - - - - -
Total Supplies and Materials 13,720 1,000 750 - 2,000 12,000 3,000 791 1,500 - 4,500 - 26,900 855 9,000 4,000 - -
Out of Region Travel 9,000 5,000 - 2,000 2,000 450 2,500 - 1,250 - 2,000 500 - 6,000 Mileage 33,000 662 500 - 1,000 750 300 750 - 750 - 2,327 1,300 2,000 1,650
Travel 42,000 5,662 500 - 3,000 2,750 750 3,250 - 2,000 - 4,327 1,800 2,000 7,650 - -
Office Space 77,500 1,550 1,550 - 6,200 - 6,200 2,325 775 - 18,600 3,100 54,250 1,240 - 8,060 - - Utilities/Facilities Maintenance - - - - - - - - - - - Equipment Maintenance - - - - - - - - - - - - Equipment - - - - - - - - - - - - Equipment Depreciation - - - - - - - - - Equipment Lease - - - - - - - - - Other - 739 147 - - 14,000 10,000
Total Leases and Equipment 77,500 1,550 1,550 739 6,200 6,347 2,325 775 - 18,600 3,100 54,250 1,240 14,000 18,060 - -
Indirect Program Expenses 170,544 13,116 4,021 992 35,084 3,470 11,235 5,746 13,945 2,436 45,871 2,089 37,934 2,623 4,690 30,639 - - Accounting Services 64,926 2,710 1,382 818 7,729 - 3,601 1,455 11,967 2,273 11,439 8,184 13,331 2,728 2,728 7,184 - - Payroll/Personnel Services 68,828 4,720 1,573 669 9,439 - 5,310 4,720 8,141 236 14,159 - 11,799 787 787 13,766 - - GIS Services 3,000 3,500 - - 6,000 - 5,000 - 5,000 - 12,500 - - - - 26,000 - - Data Services 4,139 10,348 - - 2,897 - 2,897 2,897 2,897 - 4,139 - 4,139 - - 2,897 - - Training Services - - - - - - - - - - - - - - - 6,439 - - Computer Support 75,776 3,789 3,789 - 7,578 - 3,789 3,789 3,789 - 11,366 7,295 15,155 1,894 - 13,261 - -
Total Operational 2,480,500 303,927 54,057 11,111 208,000 42,333 137,063 70,091 170,118 249,715 709,590 25,485 476,767 32,000 116,959 373,775 50,000 10,000
Pass Through - Delegate Agency 1,400,000 442,000 - - - - Third Party Match 3,000,000 - -
Total Pass Through 4,400,000 - - - 442,000 - - - - - -
TOTAL EXPENDITURES 6,880,500 303,927 54,057 11,111 650,000 42,333 137,063 70,091 170,118 249,715 709,590 25,485 476,767 32,000 116,959 373,775 50,000 10,000
Homeland SecurityRegional PlanningCommunity and Economic Development EnvisionCentralTexas
8
CAPITAL AREA COUNCIL OF GOVERNMENTSANNUAL BUDGET
OCTOBER 1, 2009 - SEPTEMBER 30, 2010
REVENUESources of Funds
FederalStateState Planning GrantOther Local IncomeProgram IncomeOther incomeInterfund transfersThird Party
TOTAL REVENUE
EXPENDITURES SalariesTemporary SalariesBenefits
TOTAL PERSONNEL
Photocopy ExpensePrinting ExpensePostage and DeliveryTelecommunicationsInsurance and BondingAdvertising and PromotionsPublications and SubscriptionsProfessional DevelopmentDues and MembershipsContractual ServicesLegal ServicesAuditingProfessional Services
TOTAL CONTRACTUAL & OPERATING EXPENSE
Office SuppliesOther SuppliesComputer SuppliesEducational SuppliesSafety SuppliesMeeting Supplies
Total Supplies and Materials
Out of Region TravelMileage
Travel
Office SpaceUtilities/Facilities MaintenanceEquipment MaintenanceEquipmentEquipment DepreciationEquipment LeaseOther
Total Leases and Equipment
Indirect Program ExpensesAccounting ServicesPayroll/Personnel ServicesGIS ServicesData ServicesTraining ServicesComputer Support
Total Operational
Pass ThroughDelegate AgencyThird Party Match
Total Pass Through
TOTAL EXPENDITURES
911 ALI 911 Public Regional Other GIS Data Regional Payroll/ Computer InterfundAdmin/Plg Maint Training Education Program Local Services Services Training Personnel Accounting Support Indirect TOTAL Transfers TOTAL
4,387,772 - 4,387,772 778,945 2,513,281 371,679 135,000 4,844,867 10,794,646 - 10,794,646
131,158 - 131,158 84,985 586,484 - 586,484
94,119 231,089 - 231,089 - 37,300 - 37,300
255,000 41,392 34,663 236,848 353,363 268,721 597,815 1,787,802 1,787,802 - 3,000,000 - 3,000,000
- 778,945 2,513,281 371,679 135,000 4,844,867 84,985 255,000 41,392 128,782 236,848 353,363 268,721 597,815 20,956,251 1,881,921 19,168,449
190,329 240,562 - - - - 121,169 21,261 33,408 61,571 162,763 101,924 267,519 2,704,814 769,615 1,935,199 - - -
82,517 104,296 - - - - 52,533 9,218 14,484 26,694 70,566 44,189 115,983 1,172,673 333,667 839,006 - - -
272,846 344,858 - - - - 173,702 30,478 47,892 88,266 233,329 146,113 383,501 3,877,487 1,103,282 2,774,205 - - -
2,500 - 250 500 750 500 6,000 27,450 8,000 19,450 2,500 650 - 500 - 1,500 - 5,500 21,018 7,500 13,518 7,700 - 200 250 100 750 100 4,500 24,900 5,900 19,000 7,042 7,042 - - - - 5,634 1,408 1,408 2,817 4,225 2,817 5,634 100,000 23,944 76,056
13,500 - - - - 1,500 - 10,000 25,800 11,500 14,300 500 - - - 2,000 500 - 500 20,700 3,000 17,700 150 - - - 250 200 1,500 3,175 1,950 1,225
8,193 2,750 1,750 1,000 1,250 2,000 6,190 3,350 51,328 15,540 35,788 6,492 5,025 - - 200 450 500 24,000 40,854 25,150 15,704
- 298,710 343,455 3,754,643 - - 50,000 - 35,000 2,500 6,401,976 (6,619) 6,408,595 2,000 - - - 1,000 1,000 - 5,000 15,900 7,000 8,900
- - - - - 15,000 - - 15,000 15,000 - - - - - - 2,000 - 1,500 5,500 3,500 2,000
- - -
50,577 305,752 343,455 - 3,754,643 8,425 7,834 2,158 52,408 7,867 29,925 45,307 69,984 6,753,601 121,364 12,180,647 - - -
14,430 - 1,000 1,000 2,000 2,500 500 10,000 57,480 17,000 40,480 3,000 900 - - 500 - - 2,000 33,061 2,500 30,561
18,271 - - - 1,500 15,000 1,000 43,076 17,500 25,576 100,000 - - - 1,000 - - - 121,000 1,000 120,000
- - - - - - - - - 9,000 - - - - 1,000 10,000 1,000 9,000
- - -
35,701 - - 100,000 - 9,900 1,000 - 2,500 2,000 4,000 15,500 14,000 264,617 39,000 225,617
24,543 6,000 2,000 - 1,650 2,020 - 14,000 80,913 19,670 61,243 13,000 - 1,500 500 600 1,500 2,100 64,189 6,200 57,989 37,543 - - - - 6,000 3,500 - 500 1,650 2,620 1,500 16,100 145,102 25,870 119,232
- - - 96,750 15,500 35,000 - - 11,625 - 3,100 3,100 24,800 15,500 44,950 431,675 103,075 328,600
- - - - - - - - - - 9,840 - 6,100 500 16,440 16,440 -
1,090,224 - - - - - 1,090,224 - 1,090,224 - - - - - - - - - - - - - - 27,500 27,500 27,500 -
50,355 299,822 1,000 - - 4,000 2,600 - 382,663 6,600 376,063 - - -
147,105 315,322 - 35,000 1,090,224 1,000 21,465 - 3,100 3,100 28,800 24,200 72,950 1,948,502 153,615 1,794,887
113,036 - - - - 2,261 20,903 3,393 6,458 19,415 28,966 18,946 - 597,815 98,081 499,734 70,091 - - - - - 4,728 0 8,202 106,973 - 9,093 11,821 353,363 140,818 212,545 14,159 21,238 - - - - 10,501 1,573 3,933 - 14,356 8,063 18,092 236,848 56,518 180,330
- 194,000 - - - - - - - - - - - 255,000 - 255,000 - 4,139 - - - - - - - - - - - 41,392 - 41,392 - - 28,224 - - - - - - - - - - 34,663 - 34,663
37,888 30,310 - - - - 11,366 3,789 3,789 7,578 11,366 11,366 268,721 49,254 219,467 778,945 1,215,620 371,679 135,000 4,844,867 27,586 255,000 41,392 128,782 236,848 353,363 268,721 597,815 14,777,110 1,787,802 18,461,664
- - - -
1,297,661 3,139,661 - 3,139,661 3,000,000 - 3,000,000
1,297,661 - - - - - - - - 6,139,661 - 6,139,661
778,945 2,513,281 371,679 135,000 4,844,867 27,586 255,000 41,392 128,782 236,848 353,363 268,721 597,815 20,916,771 1,787,802 19,128,970
Emergency Communications Cost Allocation Pools
9
FY 2008-09 FY 2008-09 FY 2009-10Unrestricted Local Funding: Budget Projection Proposed
Membership Dues 202,000 212,000 202,000 Contract for Services 22,370 - 10,000 Interest Income 4,500 1,200 1,500 Misc. Income - 13,400 10,000 Equipment Lease from Indirect 27,500 27,500 27,500 Envision Central Texas Contract 38,116 27,510 25,485 Web EOC system 20,000 - 10,000 Emergency Notification System 50,000 44,000 50,000
Total Revenue 364,486 325,610 336,485
FY 2008-09 FY 2008-09 FY 2009-10Local Match Allocations/Expenditures: Budget Projection Proposed
Program/Grant
Area Agency on Aging 50,000 50,000 50,000Economic Development (EDA) 134 124 68 000 50 000
October 1, 2009 - September 30, 2010
CAPITAL AREA COUNCIL OF GOVERNMENTS
UNRESTRICTED LOCAL FUNDING/ALLOCATIONS
10
Economic Development (EDA) 134,124 68,000 50,000Community Development - 19,000 24,514Regional Planning 41,500 91,000 41,500Other Local 30,746 26,000 84,986Envision Central Texas Contract 38,116 27,510 25,485Web EOC System 20,000 - 10,000Emergency Notification System 50,000 44,000 50,000
Total Expenditures 364,486 325,510 336,485
Balance 0 100 0
10
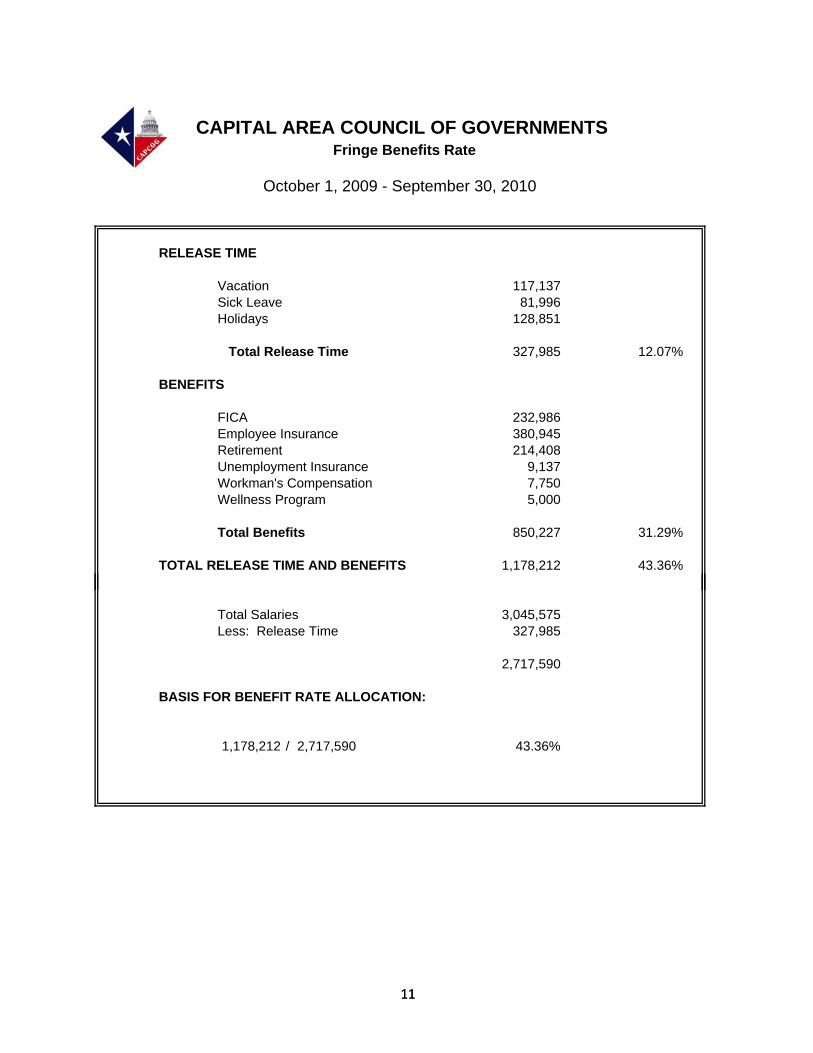
RELEASE TIME
Vacation 117,137Sick Leave 81,996 Holidays 128,851
Total Release Time 327,985 12.07%
BENEFITS
FICA 232,986Employee Insurance 380,945Retirement 214,408 Unemployment Insurance 9,137Workman's Compensation 7,750Wellness Program 5,000
Total Benefits 850,227 31.29%
TOTAL RELEASE TIME AND BENEFITS 1,178,212 43.36%
CAPITAL AREA COUNCIL OF GOVERNMENTS Fringe Benefits Rate
October 1, 2009 - September 30, 2010
11
Total Salaries 3,045,575Less: Release Time 327,985
2,717,590
BASIS FOR BENEFIT RATE ALLOCATION:
1,178,212 / 2,717,590 43.36%
11
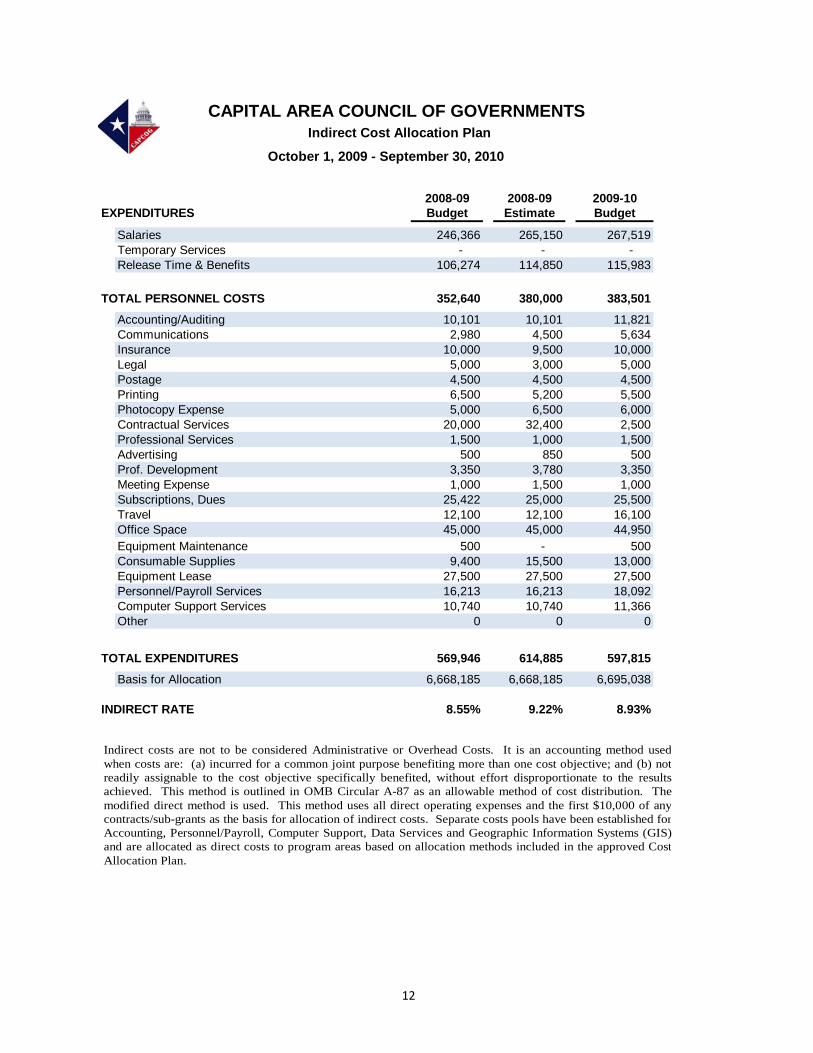
2008-09 2008-09 2009-10EXPENDITURES Budget Estimate Budget
Salaries 246,366 265,150 267,519Temporary Services - - - Release Time & Benefits 106,274 114,850 115,983
TOTAL PERSONNEL COSTS 352,640 380,000 383,501
Accounting/Auditing 10,101 10,101 11,821Communications 2,980 4,500 5,634Insurance 10,000 9,500 10,000Legal 5,000 3,000 5,000Postage 4,500 4,500 4,500Printing 6,500 5,200 5,500Photocopy Expense 5,000 6,500 6,000Contractual Services 20,000 32,400 2,500Professional Services 1,500 1,000 1,500Advertising 500 850 500Prof. Development 3,350 3,780 3,350Meeting Expense 1,000 1,500 1,000Subscriptions, Dues 25,422 25,000 25,500Travel 12,100 12,100 16,100Office Space 45,000 45,000 44,950Equipment Maintenance 500 - 500Consumable Supplies 9,400 15,500 13,000Equipment Lease 27,500 27,500 27,500Personnel/Payroll Services 16,213 16,213 18,092Computer Support Services 10,740 10,740 11,366Other 0 0 0
TOTAL EXPENDITURES 569,946 614,885 597,815
Basis for Allocation 6,668,185 6,668,185 6,695,038
INDIRECT RATE 8.55% 9.22% 8.93%
Indirect Cost Allocation Plan
October 1, 2009 - September 30, 2010
CAPITAL AREA COUNCIL OF GOVERNMENTS
Indirect costs are not to be considered Administrative or Overhead Costs. It is an accounting method usedwhen costs are: (a) incurred for a common joint purpose benefiting more than one cost objective; and (b) notreadily assignable to the cost objective specifically benefited, without effort disproportionate to the resultsachieved. This method is outlined in OMB Circular A-87 as an allowable method of cost distribution. The modified direct method is used. This method uses all direct operating expenses and the first $10,000 of any contracts/sub-grants as the basis for allocation of indirect costs. Separate costs pools have been established forAccounting, Personnel/Payroll, Computer Support, Data Services and Geographic Information Systems (GIS) and are allocated as direct costs to program areas based on allocation methods included in the approved CostAllocation Plan.
12

Budget Charts
1313
14
15
16
17

18
This page intentionally left blank.
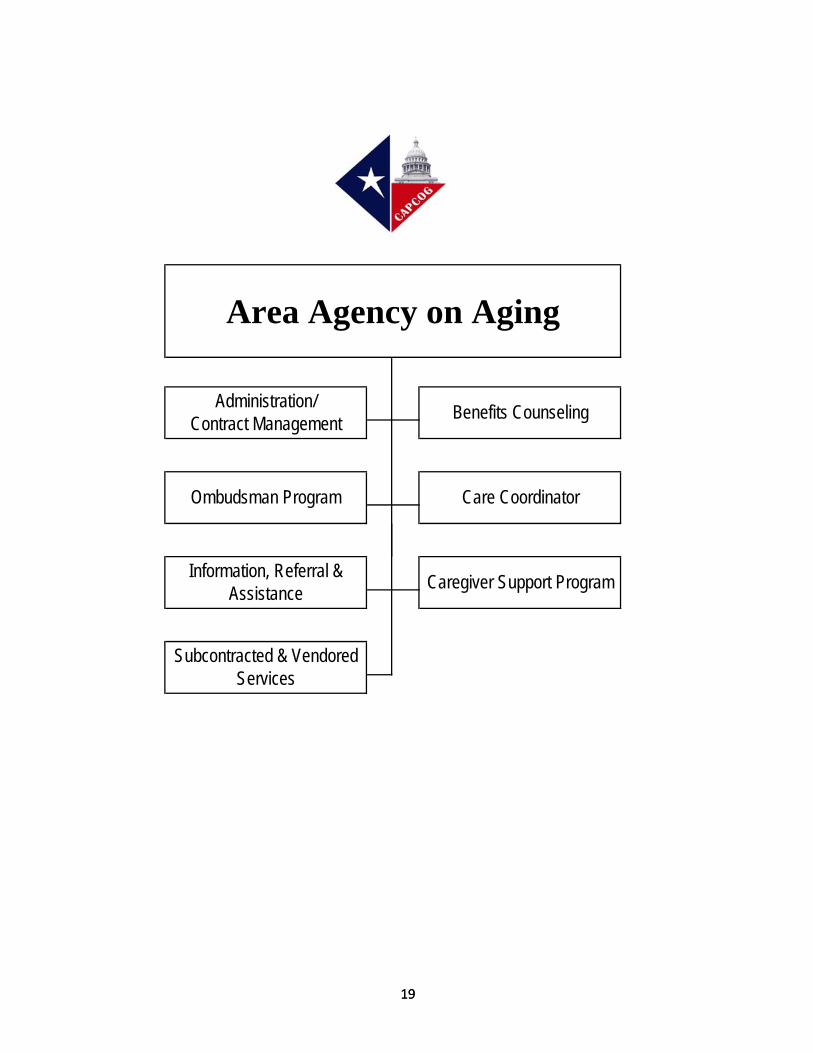
Area Agency on Aging
Administration/ Contract Management Benefits Counseling
Ombudsman Program Care Coordinator
19
Subcontracted & Vendored Services
Information, Referral & Assistance Caregiver Support Program
19
20
AREA AGENCY ON AGING
Program Description Administration/Contract Management The Area Agency on Aging of the Capital Area (AAACAP) provides quality services to support and advocate for the health, safety, and well‐being of the older individual in the Region. AAACAP provides services designed to promote independence for those persons 60 years of age and older and their caregivers with a primary focus on frail, rural and low‐income minority individuals. The program is authorized through the Older Americans Act of 1965, as amended (OAA), and supported by the Texas Department of Aging and Disability Services. Primary funding to support service delivery is made through Title III of the OAA. Additional funding is provided through State General Revenue, grants, local governments, foundations and client contributions. In addition to its role as planner and contractor, the agency is also an active participant in service delivery. It provides, through its Access and Assistance program, Benefits Counseling, Nursing and Assisted Living Facilities Ombudsman services, Care Coordination and Information, Referral and Assistance services. The area agency also provides services under the National Family Caregiver Support Program and is actively involved in Health Promotion for older adults. Benefits Counseling This program includes the provision of supportive services that assist older adults in accessing benefits to which they may be entitled. Activities range from the provision of simple information and assistance with problems related to Medicare, Social Security, Medicaid, pensions and other benefits, to more in‐depth assistance with enrollment processes and appeals for denial of benefits. Ombudsman Program This program consists of paid regional Ombudsman staff and a cadre of specially trained and certified volunteers who advocate for quality care in Texas nursing and assisted living facilities. Ombudsmen provide information to residents and families about their individual rights, help identify additional resources in or out of the nursing facility, and assist in the resolution of complaints by or on behalf of residents. Care Coordination Care Coordination is a process that links older adults with services and supports in the community‐based care system. Its purpose is to make the system work more effectively and efficiently in order to assure individuals receive assistance that is responsive to their needs using all available funding sources and monitoring the quality of the care provided throughout the service provision period. Information, Referral and Assistance (IR&A) IR&A is the doorway into the aging network and the service delivery system itself. The intent is to provide information, guidance, direction and linkage for older persons or their family and caregivers to appropriate and available service resources within their communities. The Information, Referral and Assistance Specialist acts as a navigator for inquirers, and advocate on behalf of the older individual with agencies when the need is indicated.
21
Caregiver Support Program Families are the foundation for the provision of long‐term services and support for older persons in the United States. The AAACAP implemented the National Family Caregiver Support Program for the CAPCOG region by offering programs and services which target family caregivers of adults 60 years of age and older, and for older individuals, age 55 years or older, who are a relative caregiver of a child, no older than 18 years of age or who is an individual with a disability. The program will provide caregivers with information about resources; education and training; assistance to access services; respite care; and other services on a limited basis.
Health Promotion
Health promotion is the process of enabling people to increase control over their health and its determinants, thereby improving their health. According to the Center for Disease Control (CDC), among older adults, falls are the leading cause of injury deaths. They are also the most common cause of nonfatal injuries and hospital admissions for trauma. The AAACAP, in partnership with the Texas Association of Area Agencies on Aging, provides falls prevention awareness and training in an attempt to have a positive impact on the health, and ultimately the level of independence, of community‐dwelling older adults. Additional Services Through contracts, vendor agreements and the use of vouchers, the AAACAP provides, within the limits of its funding, the following services and supports:
• Congregate and home delivered meals;
• Senior centers;
• Transportation;
• In‐home services such as homemaker, chore maintenance, and personal care; and
• Limited financial assistance with dental and vision care, and hearing aids. Work Plan Projects/Initiatives that are in planning and development phase:
Care Coordination and Depression in Older Adults. As an outcome of AACAP’s 2009 work with the University of Texas School of Social Work to address depression in older adults, two programs will be evaluated this year for possible implementation by care coordinators. Healthy IDEAS (Identifying Depression, Empowering Activities for Seniors) and PEARLS (Program to Encourage Active, Rewarding Lives for Seniors) are currently being replicated in area agencies on aging across the county. Healthy IDEAS integrates depression awareness and management into existing case management services provided to older adults. It ensures older adults get the help they need to manage depression and improve quality of life by screening for symptoms of depression and assessing their severity, educating older adults and caregivers about depression, linking older adults to primary care and mental health providers, and empowering older adults to manage their depression through a behavioral activation approach that encourages involvement in meaningful activities. PEARLS is a counseling program that teaches depression management techniques to seniors through in‐home counseling sessions and follow‐up phone contact. The program ensures that other potential factors contributing to depression, such as untreated or partially treated chronic medical conditions, are also adequately assessed and treated.
22
Projects/Initiatives that are ready for, or in, implementation phase:
• Drug Interaction Alerts. According to the American Medical Association, a recent report estimated that U.S. adults older than 65 years make more than 175,000 emergency department visits annually for adverse drug events; commonly prescribed medications accounted for one‐third of these events. Late in fiscal year 2009, AAACAP began using an evidence‐based model developed by Partners in Care for screening client medications for drug interactions by care coordinators using an integrated software. Through a vendor agreement with an Austin‐based pharmacist, possible drug interaction alerts generated by the software are reviewed, and recommendations for medication adjustments, when indicated, are made to the client’s physician.
• Problem Solving Treatment. In collaboration with Dr. Namkee Choi, a University of Texas at Austin School of Social Work gerontologist and researcher, care coordinators are identifying homebound older individuals who self‐identify as suffering from depression, and who may benefit from a telehealth problem‐solving treatment (PST) intervention. The short‐term structured PST focuses on teaching and strengthening problem‐solving coping skills for older adults in the Travis and Williamson County areas. Once individuals are indentified, they are referred to Dr. Choi for a detailed depression screening and participation in the intervention.
Projected Productivity and Performance GOAL: To connect seniors and their families with information and services to maintain or
improve quality of life.
Objective: To link older persons and their families or caregivers to useful information that assists them in accessing services and benefits.
Strategy: Link older persons and their families or caregivers through the Information, Referral, and Assistance Program.
Outcome: Percentage of individuals surveyed find the information provided through the Information, Referral and Assistance Program or agency website as useful. (95%)
Output: Number of calls answered by the Information, Referral and Assistance Program. (5,050)
Output: Number of agency website visits to obtain information. (112,000)
GOAL: To ensure the preservation of the rights of older persons residing in a nursing facility.
Objective: Provide a presence in nursing home facilities throughout the region to educate residents and advocate for their rights.
Strategy: Maintain the Ombudsman Program in nursing home facilities throughout the region.
Outcome: Percentage of individuals surveyed describes the assistance and advocacy received through the Ombudsman program as helpful. (95%)
Output: Percentage of Long Term Care Regulatory Licensure surveys attended in person by a certified Ombudsman. (65%)
Output: Percentage of long‐term care facility‐related complaints responded to within two business days. (100%)

23
GOAL: To ensure provision of services to the maximum number of elderly persons with the funds available.
Objective: To assist the elderly with available government benefit programs.
Strategy: Provide benefits counseling to the elderly.
Outcome: Percent of individuals served describe the assistance received as helpful. (95%)
Output: Number of people receiving benefits counseling. (800)
Objective: To assist with care coordination for the elderly and/or their caregivers.
Strategy: Provide Care Coordination to the elderly and/or their caregivers.
Outcome: Percent of individuals served describe the assistance received as helpful. (95%)
Output: Number of elderly and their caregivers receiving care coordination. (648)
Objective: To provide nutrition services to the elderly.
Strategy: Provide congregate meals to the elderly.
Output: Number of meals served. (116,900 Title III)
Strategy: Provide home‐delivered meals to the elderly.
Output: Number of meals provided. (276,180 Title III)

24
This page intentionally left blank.
REVENUE Aging ServicesSource of Funds:Federal 3,600,000 State 200,000 State Planning Grant - Other Local 50,000 Program Income 2,000 Other Income 28,500 Third Party matching 3,000,000
TOTAL REVENUE 6,880,500
Salaries 622,788 Benefits 270,010
Total Personnel 892,798
Contractual & Operating Expense 1,067,269 Supplies and Materials 13,720 Travel 42,000 Leases and Equipment 77,500
Indirect Costs 170,544 Accounting Services 64,926 Payroll/Personnel Services 68,828 GIS Services 3,000 Data Services 4,139 Computer Support Services 75,776
Total Operational 2,480,500
Delegate Agency 1,400,000 Third Party Match 3,000,000
Total Pass Through 4,400,000
TOTAL EXPENDITURES 6,880,500
Personnel SchedulePay Salary Range
Grade Minimum Maximum
Director of Aging Services Director III B-19 72,833 117,408Asst Director of Aging Services Manager III B-15 53,249 85,926Admin Assistant/Data Entry Clerk Admin Asst III/Data Entry Operator II A-13 29,146 40,455I & R Specialist Program Specialist I B-9 36,764 52,198Program Manager Manager I B-13 47,049 71,523Care Coordinator Clerk Case Worker I B-4 27,601 38,677Ombudsman Protective Services Spec. I B-5 29,146 41,044Care Coordinator Case Manager II B-5 29,146 41,044Care Coordinator Case Manager II B-5 29,146 41,044Ombudsman Protective Services Spec. I B-5 29,146 41,044Lead Ombudsman Program Administrator II B-12 44,254 67,270Care Coordinator Case Manager II B-5 29,146 41,044Care Coordinator Case Manager II B-5 29,146 41,044Benefits Counselor Case Manager II B-5 29,146 41,044Health & Wellness Coordinator Program Specialist I B-9 36,764 52,198Data Entry Manager Data Entry Operator III A-10 24,832 33,929Benefits Counselor Case Manager II B-5 29,146 41,044Data Entry Manager (1/2 time) Data Entry Operator III A-10 24,832 33,929
AREA AGENCY ON AGING
CAPCOG Working Job Title State Job Title
25

This page intentionally left blank.
Criminal Justice Planning
Community and Economic Development
Member Services
Economic Development
Environmental Enforcement
Solid Waste Management Planning
Census Information Center
27
28
COMMUNITY & ECONOMIC DEVELOPMENT Program Description The Community and Economic Development division assists entities in the Capital Area with a range of activities to advance regional planning and program coordination among diverse groups of regional stakeholders. The division’s individual planning activities are largely grant funded, with local funds supporting data‐related activities and requests for information and analysis as required by our communities. Data Services CAPCOG collects and distributes demographic, economic, and other data in support of planning and related activities in the region and in support of programs at CAPCOG. In addition, CAPCOG is designated as a Census Information Center under an agreement with the U.S. Census Bureau. The goal of the program is to ensure that all communities have access to census information and data products for planning, grant writing, and other needs. Criminal Justice Planning CAPCOG is designated by the Office of the Governor as the agency responsible for regional criminal justice planning in Region 12. CAPCOG provides technical assistance to grant applicants, administers state and federal funds, and assists with development of criminal justice, juvenile justice, and victim services programs. CAPCOG works with the Criminal Justice Advisory Committee to review and prioritize grant applications that are submitted for funding consideration to the Office of the Governor. Economic Development CAPCOG administers the federally‐funded Capital Area Economic Development District through planning, technical assistance, and development of the region’s Comprehensive Economic Development Strategy. CAPCOG also supports local economic development efforts, including projects such as market studies, economic impact analysis, presentations, and training workshops. Environmental Enforcement CAPCOG administers the Capital Area Regional Environmental Task Force (RETF), which is a multi‐jurisdictional law enforcement effort of 12 government agencies in Central Texas. RETF was formed to address the problems associated with illegal dumping and other environmental crimes. RETF also provides support with technical expertise, outreach and education, and training in environmental laws. Solid Waste CAPCOG is the state‐designated planning agency for solid waste management in Region 12. CAPCOG allocates approximately $440,000 in state funding annually for local government projects, including source reduction, recycling, local illegal dumping enforcement, solid waste studies, household hazardous waste collections, and public information efforts. CAPCOG also reviews applications for landfill permits and provides technical assistance on solid waste issues to local governments. Community Development CAPCOG also manages the Texas Review and Comment System (TRACS), and supports the Capital Area Economic Development District and the Governor’s Area Regional Review Committee (RRC). Staff manage the monthly Grant Alert Report, organize workshops, maintain the CAPCOG Library, conduct

29
grant research for membership organizations, and provide technical assistance to local governments and other regional agencies. Work Plan Data Services and Census Information Center
• Conduct outreach activities in preparation for the 2010 Census, including public meetings, presentations, media releases, and the CAPCOG Census Coordination blog.
• Provide Census and related demographic data and information upon request to member governments and other organizations within the Capital Area.
Criminal Justice
• Coordinate grant application review and prioritization process, including grant writing workshops, scoring meetings, technical assistance requests, and other duties.
• Develop criteria and publish statistical data for local criminal justice community planning • Develop criteria and format for regional criminal justice community plan. • Provide technical assistance and monitor visits for Edward Byrne Memorial Justice Assistance
grantees. Economic Development
• Engage the CAPCOG membership in support of economic development planning, including activities such as public presentations, media stories, and the Data Points blog.
• Provide technical assistance to CAPCOG members in the form of collecting, analyzing, and presenting data for economic and workforce development purposes.
• Complete the 2010‐2015 Comprehensive Economic Development Strategy. • Support the development of “smart grid” demonstration projects in the Capital Area, through a
new grant from the U.S. Economic Development Administration. Environmental Enforcement
• Coordinate the RETF, including Environmental Law Training classes. • Provide technical assistance for environmental enforcement, such as monitoring the Illegal
Dumping Hotline and referring reports to authorities. • Coordinate education and outreach events.
Solid Waste
• Coordinate the Solid Waste Advisory Committee, conduct the FY 2011‐2012 solid waste grant request for proposals process, and provide technical assistance to grant recipients.
• Conduct regional outreach, education, and training programs, such as the quarterly Capital Area Resource Recovery Roundtable and Household Hazardous Waste clean‐up events.
• Coordinate review of Municipal Solid Waste permit applications. Community Development
• Coordinate training and workshops for local government officials, staff, and other stakeholders. • Update and improve information availability on the CAPCOG website. • Research grant and funding opportunities, and provide information to local governments in the
region through grant alerts and Texas Review and Comment System (TRACS) meetings. • Seek opportunities to partner with state, private, and other regional agencies on programs and
initiatives.
30
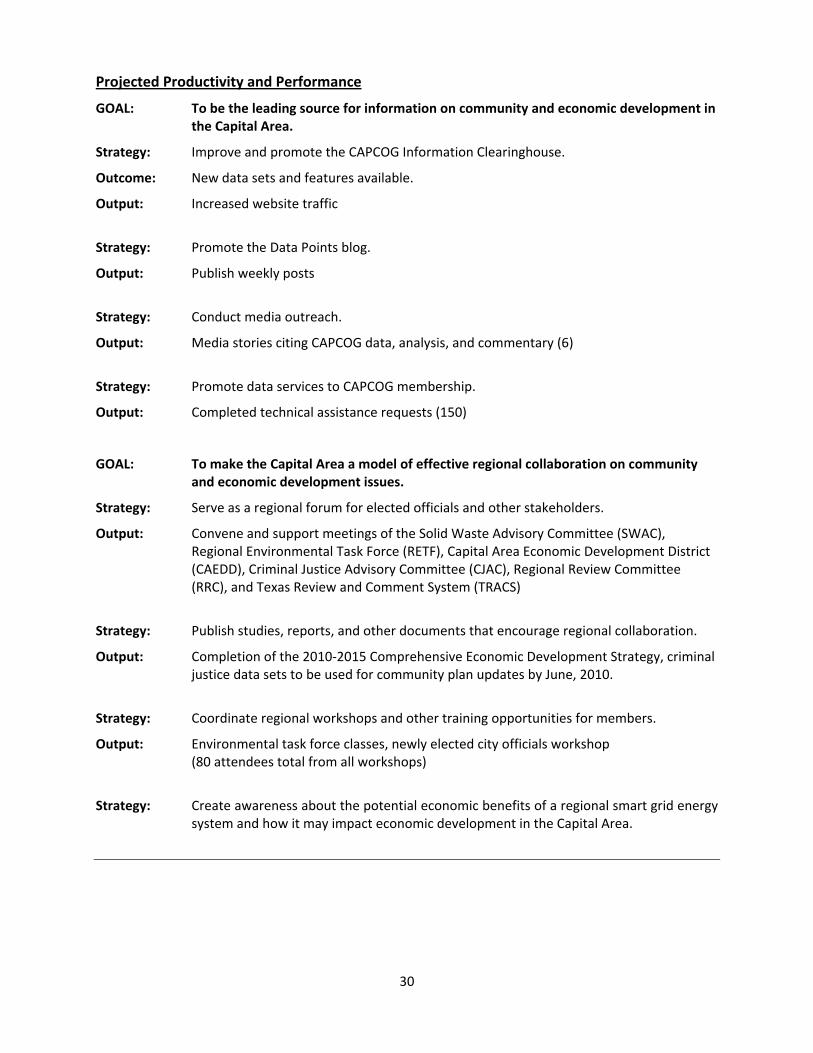
Projected Productivity and Performance
GOAL: To be the leading source for information on community and economic development in the Capital Area.
Strategy: Improve and promote the CAPCOG Information Clearinghouse.
Outcome: New data sets and features available.
Output: Increased website traffic
Strategy: Promote the Data Points blog.
Output: Publish weekly posts
Strategy: Conduct media outreach.
Output: Media stories citing CAPCOG data, analysis, and commentary (6)
Strategy: Promote data services to CAPCOG membership.
Output: Completed technical assistance requests (150)
GOAL: To make the Capital Area a model of effective regional collaboration on community and economic development issues.
Strategy: Serve as a regional forum for elected officials and other stakeholders.
Output: Convene and support meetings of the Solid Waste Advisory Committee (SWAC), Regional Environmental Task Force (RETF), Capital Area Economic Development District (CAEDD), Criminal Justice Advisory Committee (CJAC), Regional Review Committee (RRC), and Texas Review and Comment System (TRACS)
Strategy: Publish studies, reports, and other documents that encourage regional collaboration.
Output: Completion of the 2010‐2015 Comprehensive Economic Development Strategy, criminal justice data sets to be used for community plan updates by June, 2010.
Strategy: Coordinate regional workshops and other training opportunities for members.
Output: Environmental task force classes, newly elected city officials workshop (80 attendees total from all workshops)
Strategy: Create awareness about the potential economic benefits of a regional smart grid energy system and how it may impact economic development in the Capital Area.
Regional ORCA Criminal Economic Community Solid Waste Regional Justice Data
Development Development Planning Review Planning Services TotalREVENUE
Source of FundsFederal 253,927 11,111 265,038 State 692,333 207,154 - 899,487 State Planning 29,543 29,543 Other 50,000 24,514 41,392 115,906
TOTAL REVENUE 303,927 54,057 692,333 11,111 207,154 41,392 1,309,974
Salaries 60,339 16,242 99,050 5,506 89,296 21,261 291,693 Benefits 26,160 7,042 42,943 2,387 38,714 9,218 126,463 Total Personnel 86,499 23,283 141,993 7,893 128,010 30,478 418,156
Contractual & Operating Expense 171,034 17,208 12,942 - 12,742 2,158 216,085 Supplies and Materials 1,000 750 14,000 - 3,791 - 19,541 Travel 5,662 500 3,000 - 3,500 - 12,662 Leases and Equipment 1,550 1,550 6,200 739 8,672 - 18,711
Indirect Costs 13,116 4,021 38,554 992 16,981 3,393 77,058 Accounting Services 2,710 1,382 7,729 818 5,056 0 17,696 Payroll/Personnel Services 4,720 1,573 9,439 669 10,029 1,573 28,003 GIS Services 3,500 - 6,000 - 5,000 - 14,500 Data Services 10,348 - 2,897 - 5,795 - 19,040 Computer Support Services 3,789 3,789 7,578 - 7,578 3,789 26,521
Total Operational 303,927 54,057 250,333 11,111 207,154 41,392 867,974
Total Pass Through - - 442,000 - - - 442,000
TOTAL EXPENDITURES 303,927 54,057 692,333 11,111 207,154 41,392 1,309,974
Personnel SchedulePay Salary Range
CAPCOG Working Job Title State Job Title Grade Minimum Maximum
Director of Community & Eco. Dev. Director I B-17 60,476 97,494Asst Director of Community & Eco. Dev. Program Supervisor II B-11 41,606 63,231Administrative Assistant III Administrative Assistant III A-11 26,180 35,975Regional Services Coordinator Program Specialist I B-9 36,764 52,198Community Planner Planner I B-9 36,764 52,198Solid Waste Program Coordinator Planner II B-11 41,606 63,231Reg Envir Task Force Coordinator Planner I B-9 36,764 52,198Criminal Justice Planner Planner I B-9 36,764 52,198
COMMUNITY AND ECONOMIC DEVELOPMENT
31

This page intentionally left blank.

Emergency Communications
33 33

34
EMERGENCY COMMUNICATIONS Program Description
The Capital Area Council of Governments is charged by law with the responsibility to oversee the provision of 9‐1‐1 emergency services within its region. The Emergency Communications Division provides that oversight through planning, development, technical, implementation, training and public education assistance to public safety agencies throughout the 10‐county region to enable those agencies to deliver high quality 9‐1‐1 service to citizens. The Division also works with local telephone companies, Voice over Internet Providers (VoIP), County 9‐1‐1 Addressing Coordinators, and others in the region to ensure that each 9‐1‐1 call reaches the correct Public Safety Answering Point (PSAP) with accurate location and telephone number information.
The Emergency Communications Division also:
1) Develops and monitors a five‐year Strategic Plan, with input from city and county representatives, which is approved bi‐annually by the Commission on State Emergency Communications;
2) Monitors performance of the operation and the provision of 9‐1‐1 service throughout the region;
3) Operates a fully equipped training facility used to instruct call‐takers on the use of 9‐1‐1 equipment and other related topics such as stress management, handling difficult callers, or Emergency Medical Dispatching. This facility also serves as a back‐up PSAP for local governments within the region should their primary center become unusable for any reason; and
4) Provides support material to PSAPs and other public safety agencies designed and developed to enhance the understanding of the 9‐1‐1 program throughout the region. The materials supplied cover a broad range of topics associated with the proper usage of 9‐1‐1.
Work Plan
• Ensure regional mapping remains at a high degree of accuracy to support Mapped ALI.
• Address Voice over Internet Protocol (VoIP) issues and deploy any solutions, both short and long term, to minimize potential impact on 9‐1‐1 services.
• Maintain the Quality Assurance program to measure and assist agencies in meeting all aspects of 9‐1‐1 call delivery based on state guidelines.
• Implement an Internet Protocol based network connecting all CAPCOG PSAPs to the host sites allowing migration/transition to the NENA i3 standard.
• Revamp training program to better meet the needs of supported agencies within the region.
35
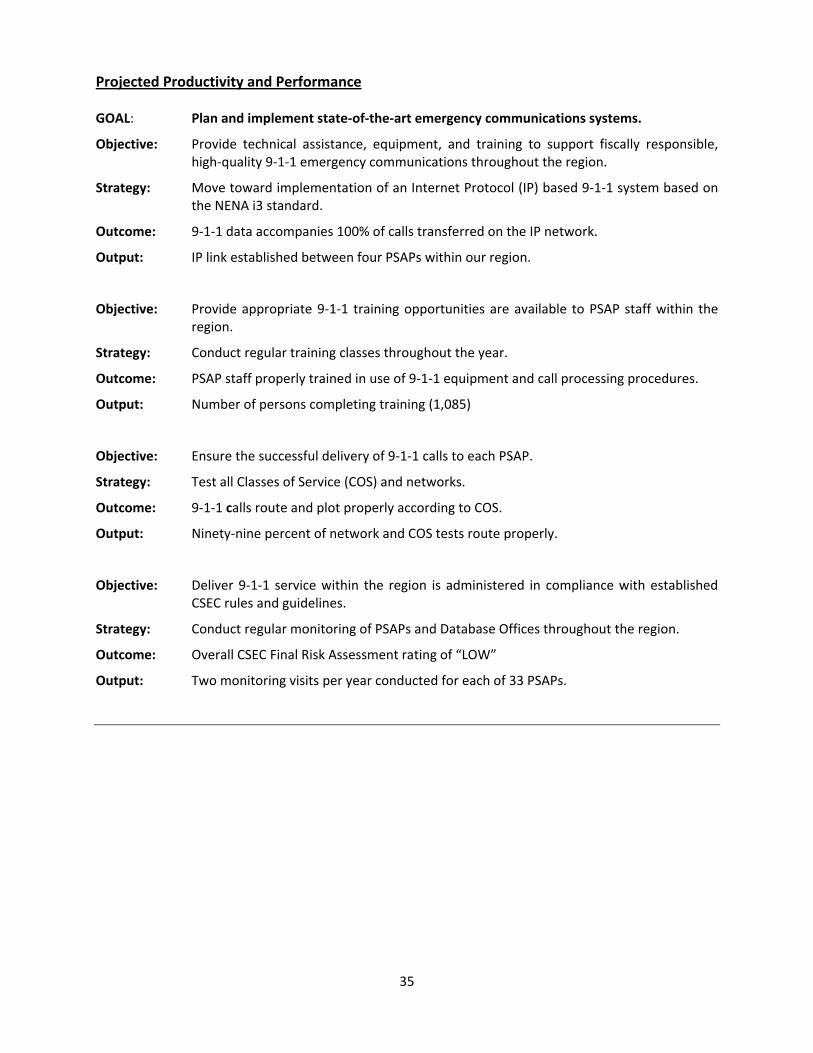
Projected Productivity and Performance GOAL: Plan and implement state‐of‐the‐art emergency communications systems.
Objective: Provide technical assistance, equipment, and training to support fiscally responsible, high‐quality 9‐1‐1 emergency communications throughout the region.
Strategy: Move toward implementation of an Internet Protocol (IP) based 9‐1‐1 system based on the NENA i3 standard.
Outcome: 9‐1‐1 data accompanies 100% of calls transferred on the IP network.
Output: IP link established between four PSAPs within our region.
Objective: Provide appropriate 9‐1‐1 training opportunities are available to PSAP staff within the region.
Strategy: Conduct regular training classes throughout the year.
Outcome: PSAP staff properly trained in use of 9‐1‐1 equipment and call processing procedures.
Output: Number of persons completing training (1,085)
Objective: Ensure the successful delivery of 9‐1‐1 calls to each PSAP.
Strategy: Test all Classes of Service (COS) and networks.
Outcome: 9‐1‐1 calls route and plot properly according to COS.
Output: Ninety‐nine percent of network and COS tests route properly.
Objective: Deliver 9‐1‐1 service within the region is administered in compliance with established CSEC rules and guidelines.
Strategy: Conduct regular monitoring of PSAPs and Database Offices throughout the region.
Outcome: Overall CSEC Final Risk Assessment rating of “LOW”
Output: Two monitoring visits per year conducted for each of 33 PSAPs.

36
This page intentionally left blank.
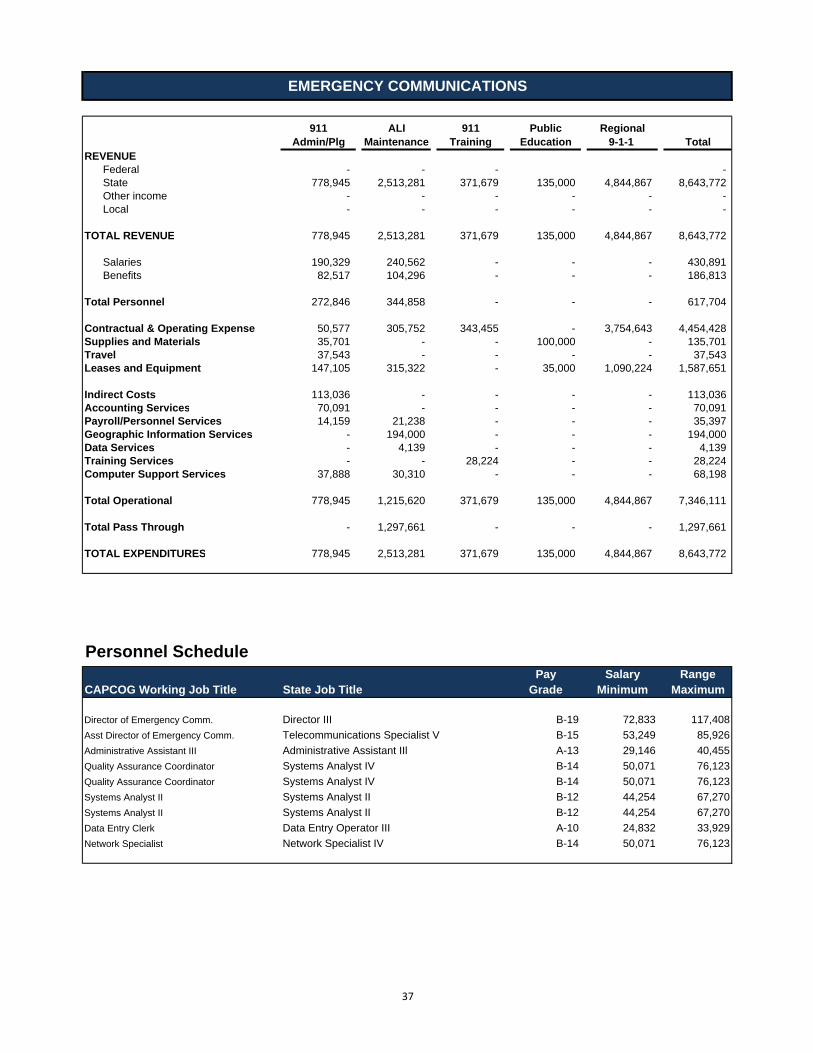
911 ALI 911 Public RegionalAdmin/Plg Maintenance Training Education 9-1-1 Total
REVENUEFederal - - - - State 778,945 2,513,281 371,679 135,000 4,844,867 8,643,772 Other income - - - - - - Local - - - - - -
TOTAL REVENUE 778,945 2,513,281 371,679 135,000 4,844,867 8,643,772
Salaries 190,329 240,562 - - - 430,891 Benefits 82,517 104,296 - - - 186,813
Total Personnel 272,846 344,858 - - - 617,704
Contractual & Operating Expense 50,577 305,752 343,455 - 3,754,643 4,454,428 Supplies and Materials 35,701 - - 100,000 - 135,701 Travel 37,543 - - - - 37,543 Leases and Equipment 147,105 315,322 - 35,000 1,090,224 1,587,651
Indirect Costs 113,036 - - - - 113,036 Accounting Services 70,091 - - - - 70,091 Payroll/Personnel Services 14,159 21,238 - - - 35,397 Geographic Information Services - 194,000 - - - 194,000 Data Services - 4,139 - - - 4,139 Training Services - - 28,224 - - 28,224 Computer Support Services 37,888 30,310 - - - 68,198
Total Operational 778,945 1,215,620 371,679 135,000 4,844,867 7,346,111
Total Pass Through - 1,297,661 - - - 1,297,661
TOTAL EXPENDITURES 778,945 2,513,281 371,679 135,000 4,844,867 8,643,772
Personnel SchedulePay Salary Range
CAPCOG Working Job Title State Job Title Grade Minimum Maximum
Director of Emergency Comm. Director III B-19 72,833 117,408Asst Director of Emergency Comm. Telecommunications Specialist V B-15 53,249 85,926Administrative Assistant III Administrative Assistant IIl A-13 29,146 40,455Quality Assurance Coordinator Systems Analyst IV B-14 50,071 76,123Quality Assurance Coordinator Systems Analyst IV B-14 50,071 76,123Systems Analyst II Systems Analyst II B-12 44,254 67,270Systems Analyst II Systems Analyst II B-12 44,254 67,270Data Entry Clerk Data Entry Operator III A-10 24,832 33,929Network Specialist Network Specialist IV B-14 50,071 76,123
EMERGENCY COMMUNICATIONS
37

This page intentionally left blank.

Homeland Security
3939
40
HOMELAND SECURITY Program Description The Homeland Security Division focuses on issues related to equipment, training, and innovative programs centered on improving preparedness and regional response. The division works closely with the Homeland Security Task Force, created in 2002 as a region‐wide advisory group, to facilitate regional planning and consensus problem solving for issues related to homeland security, terrorism, disaster planning, and regional response. CAPCOG receives several grants from federal agencies for all hazard and public health preparedness planning. Grant activities include:
1) assisting local jurisdictions in writing emergency management plans;
2) promoting regional mutual aid;
3) facilitating stakeholder discussions to determine allocation of regional homeland security funds and regional preparedness planning;
4) implementing the National Incident Management System;
5) local planning for communications interoperability; and
6) citizen/community preparedness through local volunteer coordination. Since 2002, CAPCOG has also had an agreement with the Texas Department of State Health Services, through Health Service Region 7, for a public health preparedness planning project. The scope of the project follows the Centers for Disease Control and Prevention guidance and focuses on preparedness and response planning for terrorism, pandemic influenza, and other public health emergencies in the seven CAPCOG counties without a local health department. Work Plan
• Revise and update Regional Communications Interoperability Plan and develop a strategy for enhancing interoperability capacity across the region in accordance with the Texas State Communications Interoperability Plan (SCIP).
• Facilitate the regional administration of the Communications Assets Survey and Mapping (CASM) tool in accordance with the State of Texas Communications Interoperability Plan (SCIP).
• Continue integration of medical and public health preparedness planning among all ten counties, including increasing coordination and cooperation with the Capital Area Trauma Regional Advisory Council.
• Support volunteer coordination for citizen/community preparedness.
• Continue working with communities in updating and submitting the emergency management plans.
• Enhance Regional Response Plan to maximize the coordination and effective use of resources region‐wide through mutual aid.
• Administer and maintain the Regional Emergency Notification System and Regional WebEOC Program.
41
• Facilitate the use of the Regional Emergency Notification System and Regional WebEOC Program, including training of new and existing users and implementing enhancements.
• Ensure plans are in place for accessing and deploying regional response assets.
• Manage the regional homeland security grant program and provide homeland security grant technical assistance to jurisdictions.
• Assist stakeholders in planning and executing exercises and trainings for the region.
• Assist with interpreting state and federal guidance on NIMS compliance and facilitate the delivery of advanced NIMS training courses.
• Assist local governments in identifying Critical Infrastructure and Key Resources and maintaining in a national database for statewide data calls.
• Integrate the Central Texas School Safety Consortium planning with COG planning efforts.
• Provide input to state homeland security working groups and planning activities. Projected Productivity and Performance
GOAL: Increase response capability in the region for terrorism and other major public safety events.
Objective: Assist fire, EMS, public health and police agencies in obtaining and coordinating equipment and training to facilitate multi‐jurisdictional regional response.
Strategy: Promote regional homeland security planning, training and funding opportunities for local governments and public health/safety agencies.
Outcome: Coordination among all disciplines throughout the ten county region at the city and county level.
Output: Percentage of jurisdictions participating in preparedness and response coordination. (95%)
Output: Complete revision of the CAPCOG Regional Response Plan by December 31, 2009.
Output: Percentage of cities and counties in the CAPCOG region meeting state‐mandated emergency preparedness standards at the Intermediate level.
Output: Percentage of cities and counties in the CAPCOG region meet federally‐mandated standards for compliance with requirements of the National Incident Management System (NIMS).
Output: Coordinate trainings opportunities such as NIMS Incident Command position specific courses and discipline specific courses.
Strategy: Coordinate at least one regional full‐scale exercise annually.
Output: Percentage of cities and counties in the CAPCOG region participating.

42
This page intentionally left blank.
Regional Radio Homeland EmergencyBioterrorism Interoperability Security Notification Web EOC
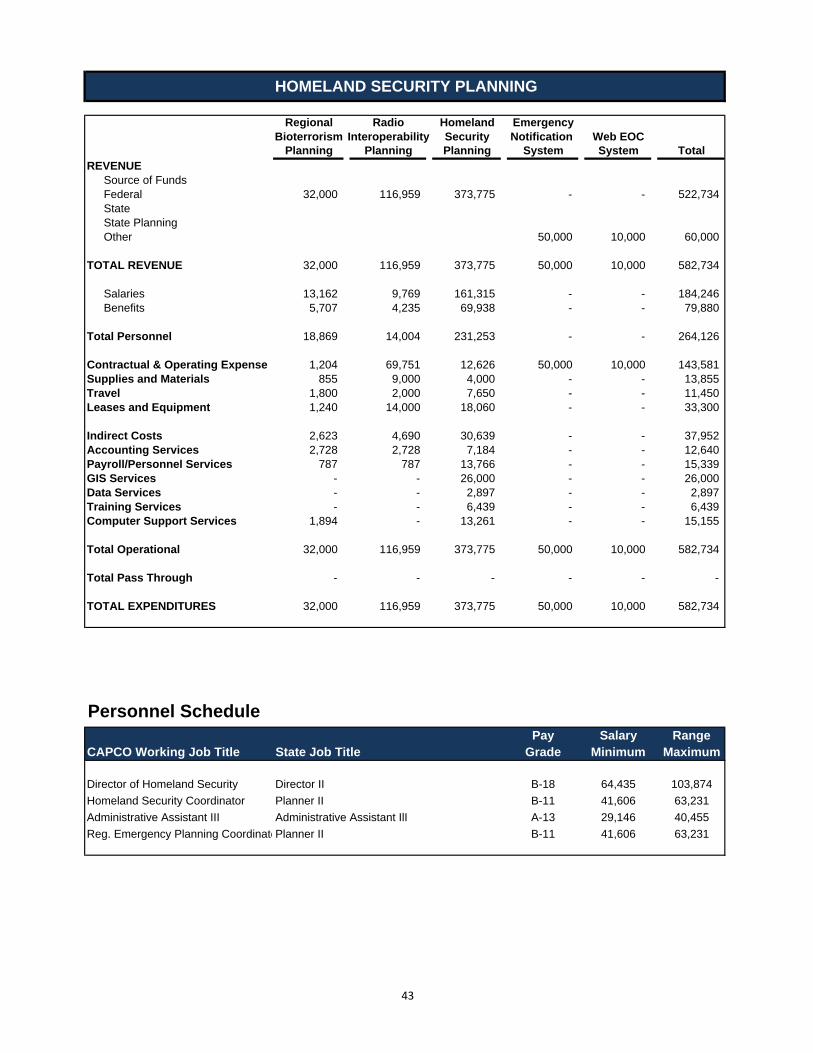
Planning Planning Planning System System TotalREVENUE
Source of FundsFederal 32,000 116,959 373,775 - - 522,734 State State PlanningOther 50,000 10,000 60,000
TOTAL REVENUE 32,000 116,959 373,775 50,000 10,000 582,734
Salaries 13,162 9,769 161,315 - - 184,246 Benefits 5,707 4,235 69,938 - - 79,880
Total Personnel 18,869 14,004 231,253 - - 264,126
Contractual & Operating Expense 1,204 69,751 12,626 50,000 10,000 143,581 Supplies and Materials 855 9,000 4,000 - - 13,855 Travel 1,800 2,000 7,650 - - 11,450 Leases and Equipment 1,240 14,000 18,060 - - 33,300
Indirect Costs 2,623 4,690 30,639 - - 37,952 Accounting Services 2,728 2,728 7,184 - - 12,640 Payroll/Personnel Services 787 787 13,766 - - 15,339 GIS Services - - 26,000 - - 26,000 Data Services - - 2,897 - - 2,897 Training Services - - 6,439 - - 6,439 Computer Support Services 1,894 - 13,261 - - 15,155
Total Operational 32,000 116,959 373,775 50,000 10,000 582,734
Total Pass Through - - - - - -
TOTAL EXPENDITURES 32,000 116,959 373,775 50,000 10,000 582,734
Personnel SchedulePay Salary Range
CAPCO Working Job Title State Job Title Grade Minimum Maximum
Director of Homeland Security Director II B-18 64,435 103,874Homeland Security Coordinator Planner II B-11 41,606 63,231Administrative Assistant III Administrative Assistant IlI A-13 29,146 40,455Reg. Emergency Planning CoordinatoPlanner II B-11 41,606 63,231
HOMELAND SECURITY PLANNING
43

This page intentionally left blank.
Regional Planning
Air Quality
Geographic Information Services
Transportation & Land Use Planning
45
46
REGIONAL PLANNING Program Description Transportation & Land Use Planning
CAPCOG strives to offer a regional perspective to local planning needs. We help communities acquire and maintain data, facilitate regional cooperation to address planning needs. How we use land shapes our neighborhoods, defines our communities, and sets our region apart from others. Maintaining a sprawling water, wastewater, transportation, emergency service, solid waste, and school infrastructure, much less paying for added capacity, is becoming a major challenge. Recognizing this challenge, CAPCOG is working with our member governments to facilitate an informed dialog on land use and its impact on important regional issues as air quality, transportation, solid waste, and social programs. CAPCOG staff also supports the Capital Area Regional Transportation Planning Organization (CARTPO). The Capital Area Regional Transportation Planning Organization enhances regional mobility through education, coordination, and advocacy. CARTPO serves as a forum for elected officials to come together on transportation issues to recommend changes in policy and practice, advocate for legislation, recommend regional priorities, direct certain planning and data initiatives, oversee the federally‐prescribed local consultation process, and collaborate with the Capital Area Metropolitan Planning Organization (CAMPO).
Air Quality
CAPCOG’s Regional Air Quality Program provides technical assistance and information to area businesses, government entities, and community groups on regional air quality issues, with an emphasis on ground‐level ozone pollution. Participation by local governments in community‐focused air quality improvement plans, with technical support provided by CAPCOG, has enabled the Central Texas region to maintain compliance with the federal 8‐hour ozone standard – despite a significant growth in population. With a new, more stringent standard recently promulgated by the Environmental Protection Agency (EPA), a nonattainment designation for the area is looking more likely. This would require the Texas Commission on Environmental Quality (TCEQ) to develop and implement mandatory programs to improve air quality for the region. Currently, officials in the 5‐county area subject to nonattainment designation have agreed to continue supporting a series of proactive programs for achieving early emission reductions. CAPCOG’s Air Quality Program staff assess and report on activities required by the Early Action agreements and coordinate technical work, documentation and reporting needed to evaluate the status of emission reduction measures. Financial support for air quality planning initiatives related to attainment of the ozone standard has been made available to CAPCOG through a TCEQ administered grant. Efforts are directed at gaining a better understanding of the sources and extent of air quality problems by operating air monitoring stations, estimating and modeling emissions and evaluating emission reduction measures and supporting implementation of effective attainment strategies for the area. Air Quality Program staff are involved in initiating a variety of technical air quality studies, analyzing the results of those studies, and providing technical advice and reports to policy decision makers.
47
GIS Services
Geographic Information Systems (GIS) Services collects, assimilates, distributes, and presents demographic, economic, political, infrastructure, and natural resource data in support of regional and local planning activities. One of CAPCOG’s most notable services is the Capital Area Geospatial Base Map (GeoMap) Program. GeoMap is a multi‐year, cost‐sharing initiative to produce and maintain current geospatial base map data for our region. Since 2005, the GeoMap participants have purchased over $4.5 million in mapping data and realized almost $1 million in cost savings. GIS Services also provides geospatial support services (e.g., mapping, GIS, and GPS) to other CAPCOG divisions, member governments, and the public. For example, GIS Services maintains and distributes the base map that 9‐1‐1 call takers use to dispatch emergency services. Our 9‐1‐1 base map includes address points and street centerlines for all ten counties and boasts a 99% success rate in mapping over 1 million landline telephones located in the Capital Area. Lastly, CAPCOG works with the Geographic Information Planning Council (GISPC) to encourage data use and exchange within our region. The GISPC maintains an open forum for agencies, organizations and interested individuals within the Capital Area to promote cost‐sharing, provide training, and offer technical support to local governments and their constituents. Work Plan
Transportation & Land Use Planning
• Serve as Administrative Lead Agency for developing County Transportation Plans for our non‐MPO counties (i.e. Caldwell and Blanco Counties).
• Coordinate and support the Capital Area Regional Transportation Planning Organization (CARTPO) and its efforts to serve as a regional advocate for transportation related issues.
• Support CAMPO and the Regional Transit Coordination Committee (RTCC) in updating the Regional Transportation Plan for the Capital Area.
• Work with regional agencies, local governments, economic development organizations, and representatives of the development community to assess growth and its impact on the Capital Area.
• Complete the Central Texas Greenprint for Growth – a tool for balancing sustainable conservation goals with the infrastructure needs of our rapidly urbanizing MSA.
• Participate in the development of CAMPO’s growth concept plan for guiding land use within the five‐county MSA.
• Publish a review of existing county land use authority and host a workshop to support increasing capacity for counties.
Air Quality
• Continue collection of ozone concentration and meteorological data through the operation of six supplemental air monitoring stations.
• Perform canister sampling for speciated volatile organic compounds during ozone season.
• Conduct airborne or other mobile platform‐based monitoring of ozone for analysis of regional source impacts and emissions transport.
48
• Update base‐year emissions inventory data to represent the 2008 ozone season.
• Develop new modeling emissions files for use in 2006 photochemical modeling episode.
• Continue to use the EAC‐ approved photochemical modeling episode to evaluate emissions impacts of major new point sources on the area’s ozone attainment status and update the area’s conceptual model with 2007, 2008 and 2009 monitoring data.
• Provide for modeling analysis of revised ozone standards on nonattainment designation of region, likelihood of meeting attainment compliance date and what local emission reduction measures may be effective in attaining the new standard.
• Support implementation efforts for emission reduction commitments in the 8‐O3 Flex Program, including the regional rideshare initiative, and continue to analyze control strategies for effectiveness as needed to insure air quality improvements are maintained.
• Coordinate meetings and provide technical support for the Central Texas Clean Air Coalition (CAC) and its efforts to serve as a regional advocate for air quality improvement.
GIS Services
• Enhance our enterprise data server architecture for maintaining and distributing data via the Information Clearinghouse.
• Plan, coordinate and complete the GeoMap 2009 and 2010 orthoimagery and elevation data acquisition efforts.
• Provide geospatial support services (e.g. mapping, location analysis, etc.) for organizations within the Capital Area.
• Draft 9‐1‐1 Mapping Guidelines that compliment the recently completed 9‐1‐1 Addressing Guidelines.
• Continue expanding datasets (e.g. tabular and geospatial data) offered on the CAPCOG Information Clearinghouse.
PROJECTED PRODUCTIVITY AND PERFORMANCE Goal: To promote sustainable growth via regionally coordinated transportation, land use,
and air quality planning.
Objective: Local governments coordinating regionally in growth and development issues.
Strategy: Serve as a regional forum for elected officials and community leaders.
Strategy: Staff and administer the CAPCOG committees that serve as a regional forum for elected officials and professional staff.
Output: Percentage participation by counties in the GISPC, GMUG, CARTPO and the Clean Air Coalition.
Objective: Increased awareness of regional approaches.
Strategy: Advocate for economic, environmental, and social regionalism and serve as a catalyst for a regional dialogue when participating in planning initiatives.
Output: Outreach through committee work, newsletters, reports and activities that support
49
regional initiatives.
Objective: Encourage participation by public and private stakeholders in air quality planning activities.
Strategy: Support public outreach to gain maximum involvement of local citizens, public and private entities in the successful implementation of the 8‐O3 Flex emission reduction measures.
Output: Results of the latest monitoring, emissions and modeling data, along with the progress and problems of emission reduction strategy Implementation.
Output: Provide support for implementation of regional clean air action plan emission reduction measures as committed to in the State Air Quality Implementation Plan Revision.
Goal: To promote CAPCOG as an objective source for regional data and analysis.
Objective: Provide appropriate data through scientific measurement and assessment to support regional air quality planning, education and the selection and implementation of effective emission reduction strategies.
Strategy: Reduce and prevent air pollution by monitoring and assessing air quality, developing plans to address problems, evaluating emission reduction measures and completing performance verification of selected control strategies.
Outcome: Improved air quality for the region.
Output: Percent of air quality planning grant expended in the year for monitoring, emissions inventory, modeling and control strategy evaluation projects.
Output: Ozone air quality monitoring sites operated for the 2008 ozone season.
Objective: Develop the CAPCOG Information Clearinghouse as a resource for regional data and analysis.
Strategy: Augment and enhance CAPCOG’s geospatial data, tabular data, mapping, and publications.
Output: Increased number of data downloads.
Goal: To maximize the capacity among local governments to plan and implement programs
supporting efficient growth and development.
Objective: Increase capacity to use tools and resources at the local and regional level.
Strategy: Provide technical assistance and education.
Outcome: Inclusive and transparent regional planning processes.
Output: Conduct three workshops annually.
Output: Support for regional plans based on a unified strategy, including County Transportation Plans, the Capital Area Regional Transportation Coordination Plan, and the Central Texas Greenprint for Growth.

50
This page intentionally left blank.
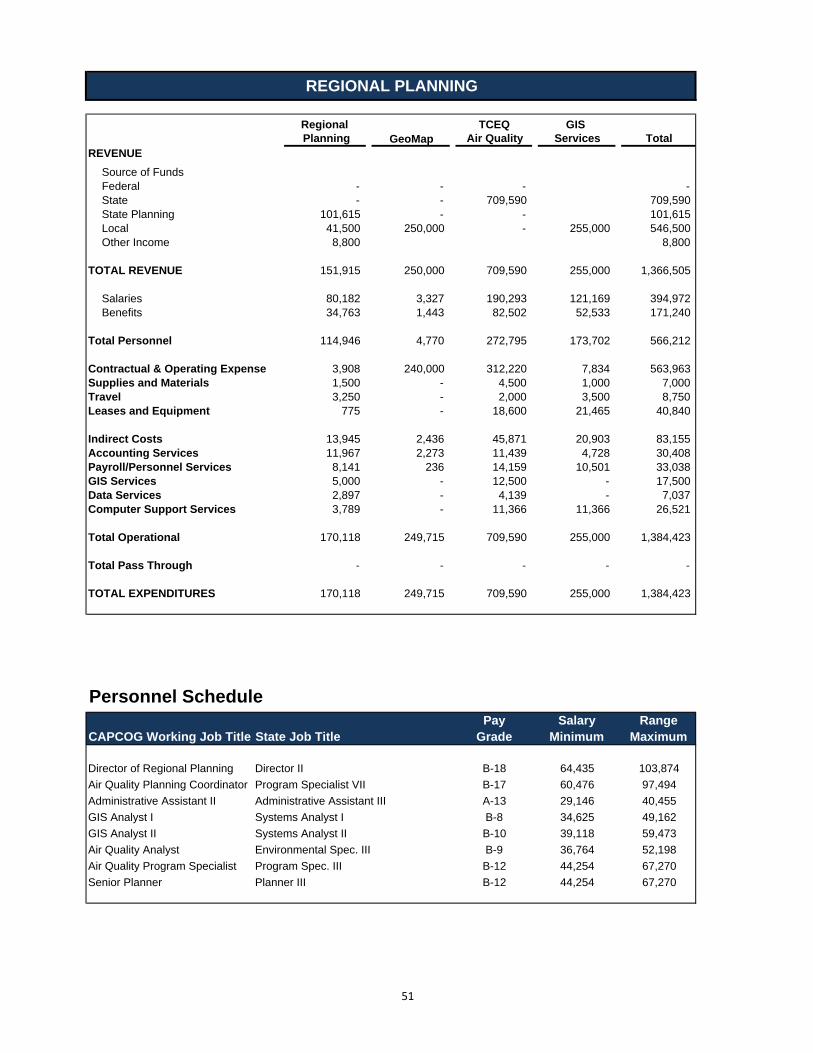
Regional TCEQ GIS Planning Air Quality Services Total
REVENUESource of FundsFederal - - - - State - - 709,590 709,590 State Planning 101,615 - - 101,615 Local 41,500 250,000 - 255,000 546,500 Other Income 8,800 8,800
TOTAL REVENUE 151,915 250,000 709,590 255,000 1,366,505
Salaries 80,182 3,327 190,293 121,169 394,972 Benefits 34,763 1,443 82,502 52,533 171,240
Total Personnel 114,946 4,770 272,795 173,702 566,212
Contractual & Operating Expense 3,908 240,000 312,220 7,834 563,963 Supplies and Materials 1,500 - 4,500 1,000 7,000 Travel 3,250 - 2,000 3,500 8,750 Leases and Equipment 775 - 18,600 21,465 40,840
Indirect Costs 13,945 2,436 45,871 20,903 83,155 Accounting Services 11,967 2,273 11,439 4,728 30,408 Payroll/Personnel Services 8,141 236 14,159 10,501 33,038 GIS Services 5,000 - 12,500 - 17,500 Data Services 2,897 - 4,139 - 7,037 Computer Support Services 3,789 - 11,366 11,366 26,521
Total Operational 170,118 249,715 709,590 255,000 1,384,423
Total Pass Through - - - - -
TOTAL EXPENDITURES 170,118 249,715 709,590 255,000 1,384,423
Personnel SchedulePay Salary Range
CAPCOG Working Job Title State Job Title Grade Minimum Maximum
Director of Regional Planning Director II B-18 64,435 103,874Air Quality Planning Coordinator Program Specialist VII B-17 60,476 97,494Administrative Assistant II Administrative Assistant III A-13 29,146 40,455GIS Analyst I Systems Analyst I B-8 34,625 49,162GIS Analyst II Systems Analyst II B-10 39,118 59,473Air Quality Analyst Environmental Spec. III B-9 36,764 52,198Air Quality Program Specialist Program Spec. III B-12 44,254 67,270Senior Planner Planner III B-12 44,254 67,270
REGIONAL PLANNING
GeoMap
51

This page intentionally left blank.

Regional Training Academy
53
54
REGIONAL TRAINING ACADEMY Program Description The Regional Training Academy (RTA) was created within the Capital Area Council of Governments (CAPCOG), State Planning Region 12, to establish a centrally‐managed method of delivering professional law enforcement training within the ten‐county region. For the last 13 years, the RTA has played a critical role in providing training to law enforcement personnel and individuals looking to begin a career in law enforcement. The Basic Peace Officer’s Course (BPOC) is designed to address the region’s need for trained law enforcement applicants by providing students with the essential knowledge needed to begin a law enforcement career, and to take the State Peace Officer Licensing Examination. The RTA provides a minimum of three BPOC classes per year; two day classes and one night class. The Basic County Corrections Course provides training to correctional officers working for sheriff’s departments within our region. This state‐mandated course prepares correctional officers with the knowledge needed to successfully pass the correctional officer’s licensing examination administered by the Texas Commission on Law Enforcement Officer Standards and Education (TCLEOSE). The RTA provides this for counties on an as‐needed basis. The RTA also provides in‐service training coordination for law enforcement, emergency communications, and homeland security. In‐service training courses are designed to correspond with all mandated learning objectives set out by TCLEOSE or other certifying agency, as well as address the needs of public safety personnel throughout our region. Regional training needs are assessed through multiple sources, including but not limited to: bi‐annual training coordinator meetings, twice annual surveys, the RTA’s Law Enforcement Education Committee (LEEC), area chiefs and training coordinators, and the community planning process. The RTA also provides administrative services for local law enforcement agencies by sponsoring in‐service training courses that are taught by their own personnel to members their own department. RTA staff approves the instructor’s qualifications and lesson content, provides TCLEOSE credit and maintains all essential record keeping for each course. Work Plan
• Projects/Initiatives that are in planning and development phase.
1. Develop in‐service training schedule to reflect training needs. 2. Schedule Class 54 and 56 (Night Courses) of the Basic Peace Officer Course. 3. Schedule Classes 55 and 57 (Day Courses) of the Basic Peace Officer Course. 4. Evaluate and up‐date the Basic Peace Officer Course curriculum. 5. Evaluate and up‐date in‐service training curriculum. 6. Schedule Law Enforcement Education Committee meetings throughout the year. 7. Evaluate and up‐date lesson plans for the Basic County Corrections Course. 8. Provide the Basic County Corrections Course in CAPCOG Region.
• Projects/Initiatives that are ready for or in implementation phase
1. Identify in‐service training needs through bi‐annual training coordination meetings. 2. Provide in‐service training courses.
55
3. Provide legislatively mandated and intermediate law enforcement certification courses within our region.
4. Provide Basic Peace Officer Courses for Classes 54, 55, 56 and 57. 5. Implement use of force training for agencies throughout the region.
• Projects/Initiatives to complete or close out during fiscal year 2009.
1. Complete Basic Peace Officer Courses 52 and 53. 2. Provide lesson plan and instructor approval, submit TCLEOSE credit and archive lesson
documentation for local law enforcement and non‐profit agencies that provide law enforcement training within our region.
3. To organize bi‐annual training coordinators’ meetings Projected Productivity and Performance
GOAL: To provide effective law enforcement education and training throughout the Region.
Objective: Provide training to meet the law enforcement agency needs of the region.
Strategy: Provide Basic Peace Officer Courses (BPOC) and Continuing Education based on identified demand of local law enforcement agencies of the region.
Outcome: Percentage passing rate for cadets on the state licensing exam for BPOC courses. (100%)
Output: Number of Basic Peace Officer Courses conducted. (4)
Output: Number of cadets trained. (90)
Output: Number of Basic County Correctional Courses as requested by local Sheriff’s Departments within our region. (3)
Output: Number of in‐service schools provided, including courses necessary to facilitate license renewal requirements. (36)
Output: Number of officers/persons trained in‐service (800)

56
This page intentionally left blank.
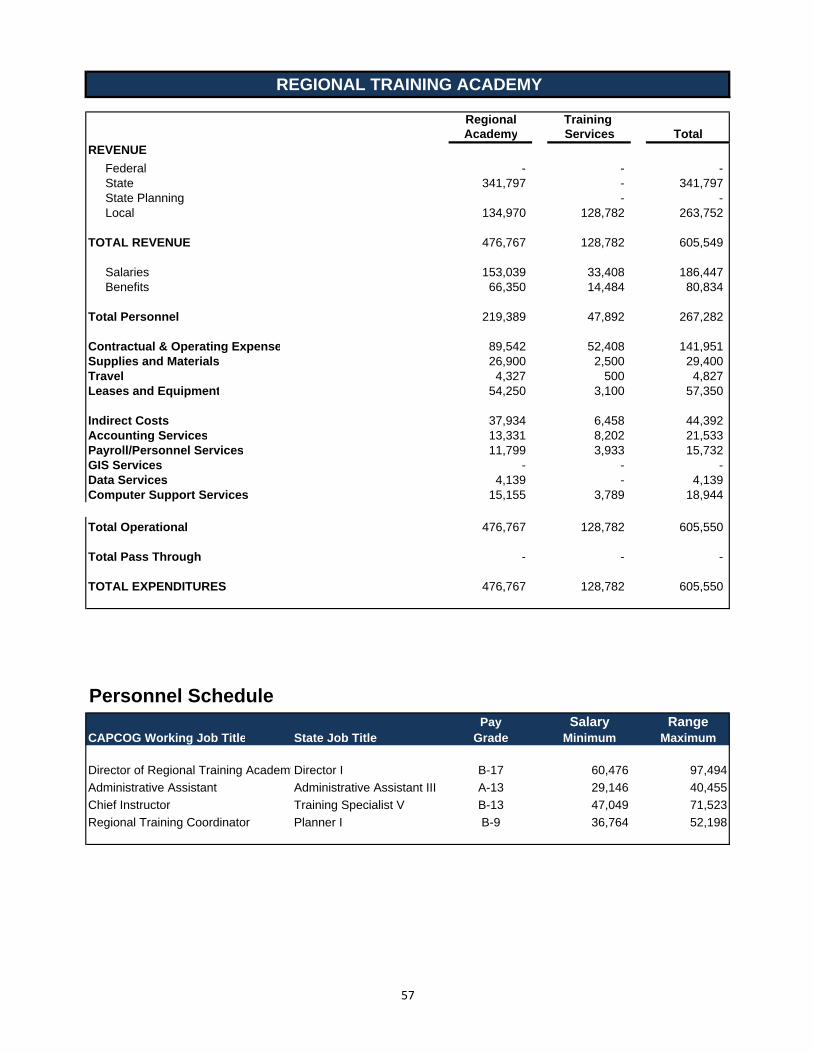
Regional Training Academy Services Total
REVENUEFederal - - - State 341,797 - 341,797 State Planning - - Local 134,970 128,782 263,752
TOTAL REVENUE 476,767 128,782 605,549
Salaries 153,039 33,408 186,447 Benefits 66,350 14,484 80,834
Total Personnel 219,389 47,892 267,282
Contractual & Operating Expense 89,542 52,408 141,951 Supplies and Materials 26,900 2,500 29,400 Travel 4,327 500 4,827 Leases and Equipment 54,250 3,100 57,350
Indirect Costs 37,934 6,458 44,392 Accounting Services 13,331 8,202 21,533 Payroll/Personnel Services 11,799 3,933 15,732 GIS Services - - - Data Services 4,139 - 4,139 Computer Support Services 15,155 3,789 18,944
Total Operational 476,767 128,782 605,550
Total Pass Through - - -
TOTAL EXPENDITURES 476,767 128,782 605,550
Pay Salary RangeCAPCOG Working Job Title State Job Title Grade Minimum Maximum
Director of Regional Training AcademyDirector I B-17 60,476 97,494Administrative Assistant Administrative Assistant III A-13 29,146 40,455Chief Instructor Training Specialist V B-13 47,049 71,523Regional Training Coordinator Planner I B-9 36,764 52,198
REGIONAL TRAINING ACADEMY
Personnel Schedule
57

This page intentionally left blank.
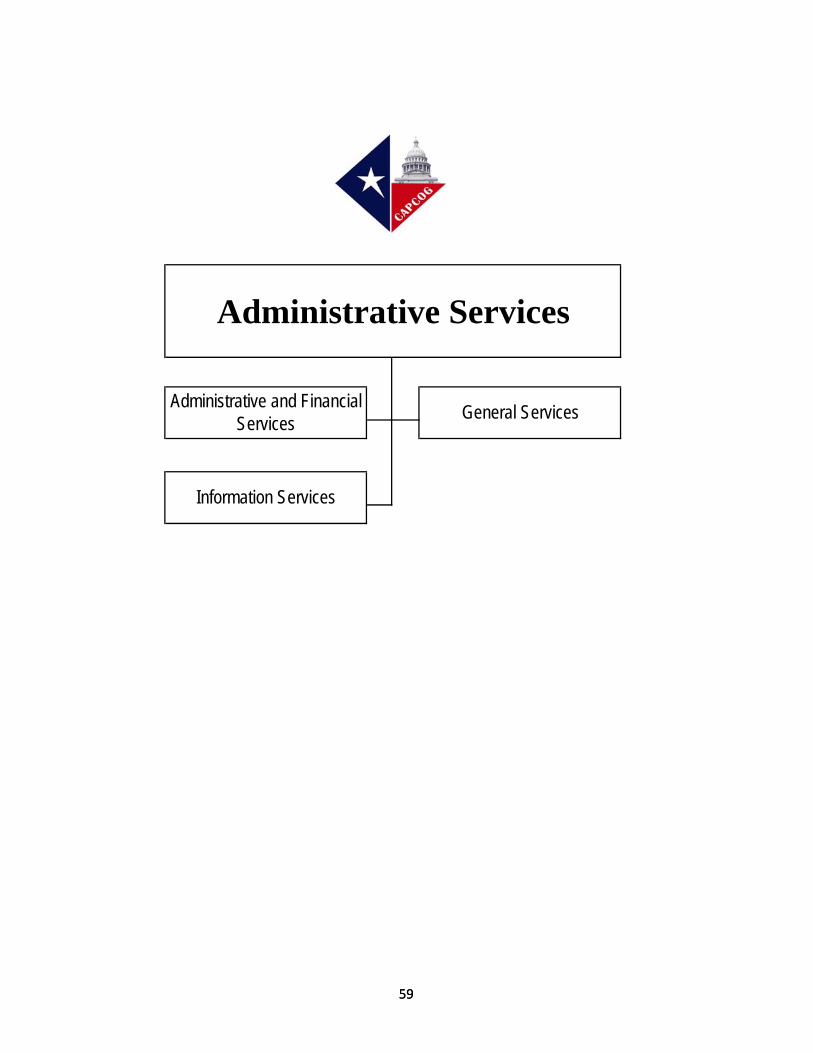
Administrative Services
Administrative and Financial Services General Services
Information Services
5959
60
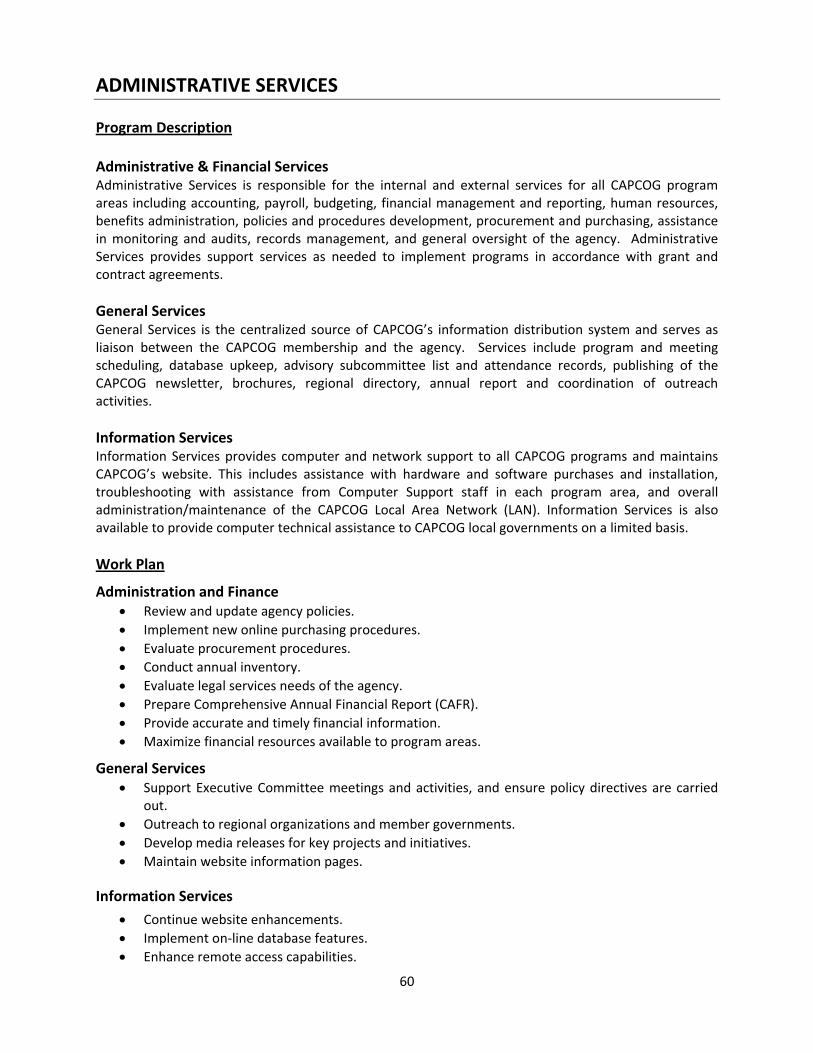
ADMINISTRATIVE SERVICES Program Description Administrative & Financial Services Administrative Services is responsible for the internal and external services for all CAPCOG program areas including accounting, payroll, budgeting, financial management and reporting, human resources, benefits administration, policies and procedures development, procurement and purchasing, assistance in monitoring and audits, records management, and general oversight of the agency. Administrative Services provides support services as needed to implement programs in accordance with grant and contract agreements. General Services General Services is the centralized source of CAPCOG’s information distribution system and serves as liaison between the CAPCOG membership and the agency. Services include program and meeting scheduling, database upkeep, advisory subcommittee list and attendance records, publishing of the CAPCOG newsletter, brochures, regional directory, annual report and coordination of outreach activities. Information Services Information Services provides computer and network support to all CAPCOG programs and maintains CAPCOG’s website. This includes assistance with hardware and software purchases and installation, troubleshooting with assistance from Computer Support staff in each program area, and overall administration/maintenance of the CAPCOG Local Area Network (LAN). Information Services is also available to provide computer technical assistance to CAPCOG local governments on a limited basis. Work Plan
Administration and Finance • Review and update agency policies. • Implement new online purchasing procedures. • Evaluate procurement procedures. • Conduct annual inventory. • Evaluate legal services needs of the agency. • Prepare Comprehensive Annual Financial Report (CAFR). • Provide accurate and timely financial information. • Maximize financial resources available to program areas.
General Services • Support Executive Committee meetings and activities, and ensure policy directives are carried
out. • Outreach to regional organizations and member governments. • Develop media releases for key projects and initiatives. • Maintain website information pages.
Information Services
• Continue website enhancements. • Implement on‐line database features. • Enhance remote access capabilities.
61
• Increase access to on‐line resources • Improve network access and reliability
Projected Productivity and Performance GOAL: Accurate administration of CAPCOG finances and program reporting in compliance
with all applicable guidelines, rules, and government regulations.
Objective: Provide accurate and timely financial reports and information that comply with appropriate state and federal requirements as well as general accounting principles.
Strategy: Prepare budgets and issue financial reports to program areas and funding agencies in a timely manner.
Outcome: Percentage of all financial reports, as required by grant agreements, submitted in a timely manner.
Output: Preparation of a Single Audit in accordance with state and federal regulations.
Output: Preparation of the annual budget for CAPCOG and individual program areas.
Output: Preparation of accurate financial reports by the 15th of the month for internal review.
Output: Respond to audit and monitoring reports as needed.
GOAL: Ensure CAPCOG implements appropriate administrative and program procedures in
compliance with all applicable guidelines, rules, and government regulations and in the interest of best practices and efficient management.
Objective: Maintain accurate and effective policies and procedures.
Strategy: Update and/or develop policies and procedures related to administration of the agency’s activities and programs.
Output: Prepare procedures for open records requests, purchasing online.
Output: Complete continuity of business plan documentation.
Output: Develop business plan for GIS activities.
GOAL: Facilitate access to information on all CAPCOG programs by member governments and
organizations.
Objective: Dissemination of information on CAPCOG programs, services, and activities to ensure access by member organizations and regional partners.
Strategy: Coordinate and compile information from all CAPCOG departments for timely distribution.
Output: Bi‐monthly publication of newsletter in both paper and electronic formats.
Output: Publication of Regional Directory and CAPCOG Annual Report.
Output: Maintenance of Information pages on website.

62
This page intentionally left blank.
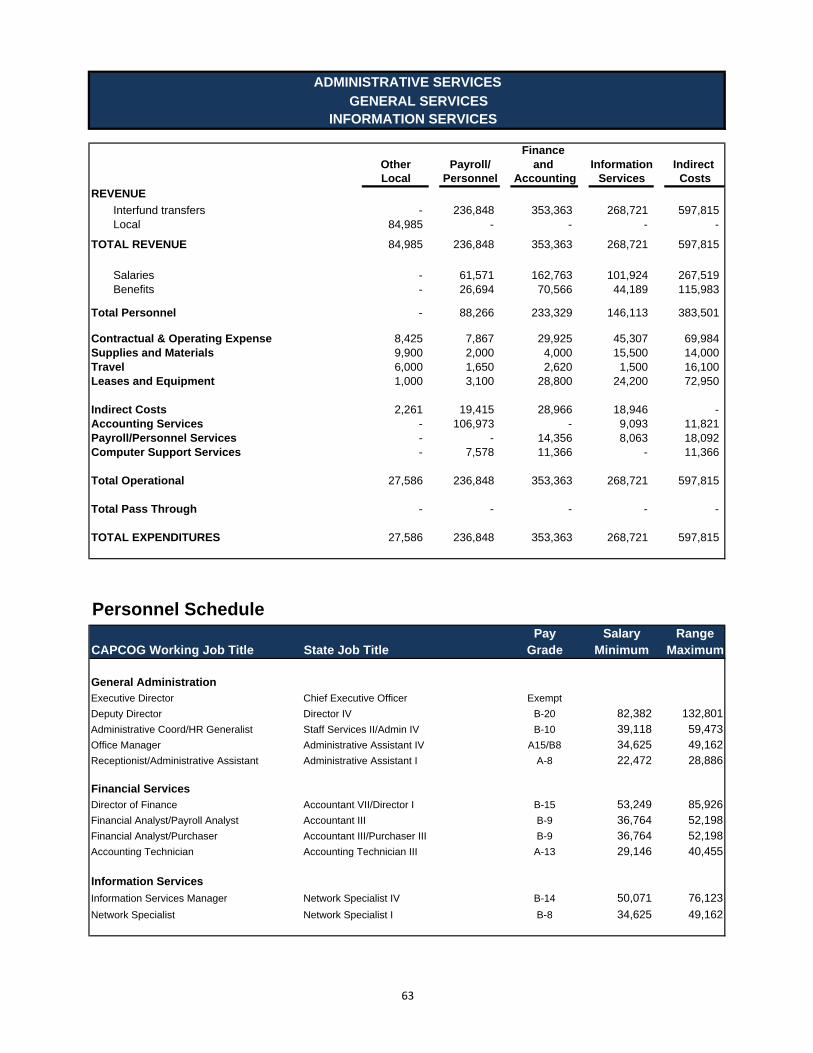
Finance Other Payroll/ and Information Indirect Local Personnel Accounting Services Costs
REVENUEInterfund transfers - 236,848 353,363 268,721 597,815 Local 84,985 - - - -
TOTAL REVENUE 84,985 236,848 353,363 268,721 597,815
Salaries - 61,571 162,763 101,924 267,519 Benefits - 26,694 70,566 44,189 115,983
Total Personnel - 88,266 233,329 146,113 383,501
Contractual & Operating Expense 8,425 7,867 29,925 45,307 69,984 Supplies and Materials 9,900 2,000 4,000 15,500 14,000 Travel 6,000 1,650 2,620 1,500 16,100 Leases and Equipment 1,000 3,100 28,800 24,200 72,950
Indirect Costs 2,261 19,415 28,966 18,946 - Accounting Services - 106,973 - 9,093 11,821 Payroll/Personnel Services - - 14,356 8,063 18,092 Computer Support Services - 7,578 11,366 - 11,366
Total Operational 27,586 236,848 353,363 268,721 597,815
Total Pass Through - - - - -
TOTAL EXPENDITURES 27,586 236,848 353,363 268,721 597,815
Personnel SchedulePay Salary Range
CAPCOG Working Job Title State Job Title Grade Minimum Maximum
General AdministrationExecutive Director Chief Executive Officer ExemptDeputy Director Director IV B-20 82,382 132,801Administrative Coord/HR Generalist Staff Services II/Admin IV B-10 39,118 59,473Office Manager Administrative Assistant IV A15/B8 34,625 49,162Receptionist/Administrative Assistant Administrative Assistant I A-8 22,472 28,886
Financial ServicesDirector of Finance Accountant VII/Director I B-15 53,249 85,926Financial Analyst/Payroll Analyst Accountant III B-9 36,764 52,198Financial Analyst/Purchaser Accountant III/Purchaser III B-9 36,764 52,198Accounting Technician Accounting Technician III A-13 29,146 40,455
Information ServicesInformation Services Manager Network Specialist IV B-14 50,071 76,123Network Specialist Network Specialist I B-8 34,625 49,162
ADMINISTRATIVE SERVICES GENERAL SERVICES
INFORMATION SERVICES
63

This page intentionally left blank.

Personnel & Salary Schedules
65
y
65

6666
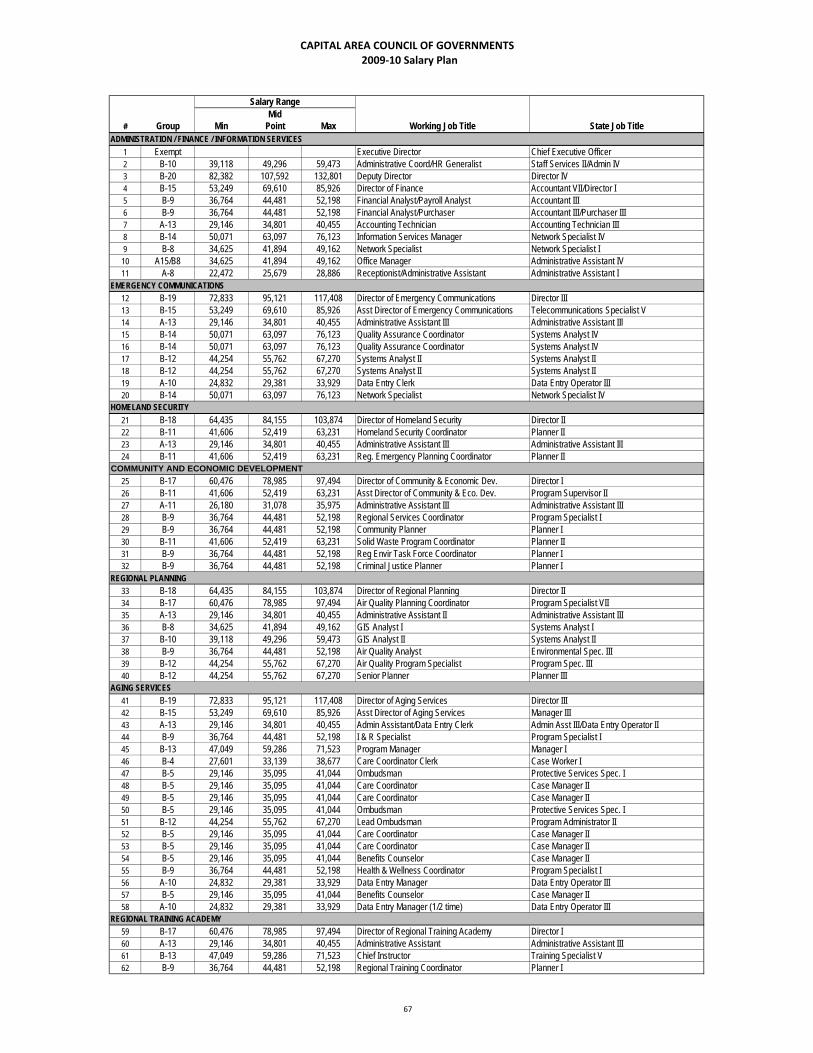
CAPITAL AREA COUNCIL OF GOVERNMENTS 2009‐10 Salary Plan
Mid# Group Min Point Max Working Job Title State Job Title
ADMINISTRATION / FINANCE / INFORMATION SERVICES1 Exempt Executive Director Chief Executive Officer2 B-10 39,118 49,296 59,473 Administrative Coord/HR Generalist Staff Services II/Admin IV3 B-20 82,382 107,592 132,801 Deputy Director Director IV4 B-15 53,249 69,610 85,926 Director of Finance Accountant VII/Director I5 B-9 36,764 44,481 52,198 Financial Analyst/Payroll Analyst Accountant III 6 B-9 36,764 44,481 52,198 Financial Analyst/Purchaser Accountant III/Purchaser III7 A-13 29,146 34,801 40,455 Accounting Technician Accounting Technician III8 B-14 50,071 63,097 76,123 Information Services Manager Network Specialist IV9 B-8 34,625 41,894 49,162 Network Specialist Network Specialist I 10 A15/B8 34,625 41,894 49,162 Office Manager Administrative Assistant IV11 A-8 22,472 25,679 28,886 Receptionist/Administrative Assistant Administrative Assistant I
EMERGENCY COMMUNICATIONS12 B-19 72,833 95,121 117,408 Director of Emergency Communications Director III13 B-15 53,249 69,610 85,926 Asst Director of Emergency Communications Telecommunications Specialist V14 A-13 29,146 34,801 40,455 Administrative Assistant III Administrative Assistant IIl15 B-14 50,071 63,097 76,123 Quality Assurance Coordinator Systems Analyst IV16 B-14 50,071 63,097 76,123 Quality Assurance Coordinator Systems Analyst IV17 B-12 44,254 55,762 67,270 Systems Analyst II Systems Analyst II18 B-12 44,254 55,762 67,270 Systems Analyst II Systems Analyst II19 A-10 24,832 29,381 33,929 Data Entry Clerk Data Entry Operator III20 B-14 50,071 63,097 76,123 Network Specialist Network Specialist IV
HOMELAND SECURITY21 B-18 64,435 84,155 103,874 Director of Homeland Security Director II22 B-11 41,606 52,419 63,231 Homeland Security Coordinator Planner II23 A-13 29,146 34,801 40,455 Administrative Assistant III Administrative Assistant IlI24 B-11 41,606 52,419 63,231 Reg. Emergency Planning Coordinator Planner II
25 B-17 60,476 78,985 97,494 Director of Community & Economic Dev. Director I 26 B-11 41,606 52,419 63,231 Asst Director of Community & Eco. Dev. Program Supervisor II27 A-11 26,180 31,078 35,975 Administrative Assistant III Administrative Assistant III28 B-9 36,764 44,481 52,198 Regional Services Coordinator Program Specialist I29 B-9 36,764 44,481 52,198 Community Planner Planner I30 B-11 41,606 52,419 63,231 Solid Waste Program Coordinator Planner II31 B-9 36,764 44,481 52,198 Reg Envir Task Force Coordinator Planner I32 B-9 36,764 44,481 52,198 Criminal Justice Planner Planner I
REGIONAL PLANNING33 B-18 64,435 84,155 103,874 Director of Regional Planning Director II34 B-17 60,476 78,985 97,494 Air Quality Planning Coordinator Program Specialist VII35 A-13 29,146 34,801 40,455 Administrative Assistant II Administrative Assistant III36 B-8 34,625 41,894 49,162 GIS Analyst I Systems Analyst I37 B-10 39,118 49,296 59,473 GIS Analyst II Systems Analyst II38 B-9 36,764 44,481 52,198 Air Quality Analyst Environmental Spec. III39 B-12 44,254 55,762 67,270 Air Quality Program Specialist Program Spec. III40 B-12 44,254 55,762 67,270 Senior Planner Planner III
AGING SERVICES41 B-19 72,833 95,121 117,408 Director of Aging Services Director III42 B-15 53,249 69,610 85,926 Asst Director of Aging Services Manager III43 A-13 29,146 34,801 40,455 Admin Assistant/Data Entry Clerk Admin Asst III/Data Entry Operator II44 B-9 36,764 44,481 52,198 I & R Specialist Program Specialist I45 B-13 47,049 59,286 71,523 Program Manager Manager I 46 B-4 27,601 33,139 38,677 Care Coordinator Clerk Case Worker I47 B-5 29,146 35,095 41,044 Ombudsman Protective Services Spec. I48 B-5 29,146 35,095 41,044 Care Coordinator Case Manager II49 B-5 29,146 35,095 41,044 Care Coordinator Case Manager II50 B-5 29,146 35,095 41,044 Ombudsman Protective Services Spec. I51 B-12 44,254 55,762 67,270 Lead Ombudsman Program Administrator II52 B-5 29,146 35,095 41,044 Care Coordinator Case Manager II53 B-5 29,146 35,095 41,044 Care Coordinator Case Manager II54 B-5 29,146 35,095 41,044 Benefits Counselor Case Manager II55 B-9 36,764 44,481 52,198 Health & Wellness Coordinator Program Specialist I56 A-10 24,832 29,381 33,929 Data Entry Manager Data Entry Operator III57 B-5 29,146 35,095 41,044 Benefits Counselor Case Manager II58 A-10 24,832 29,381 33,929 Data Entry Manager (1/2 time) Data Entry Operator III
REGIONAL TRAINING ACADEMY59 B-17 60,476 78,985 97,494 Director of Regional Training Academy Director I60 A-13 29,146 34,801 40,455 Administrative Assistant Administrative Assistant III 61 B-13 47,049 59,286 71,523 Chief Instructor Training Specialist V62 B-9 36,764 44,481 52,198 Regional Training Coordinator Planner I
COMMUNITY AND ECONOMIC DEVELOPMENT
Salary Range
67
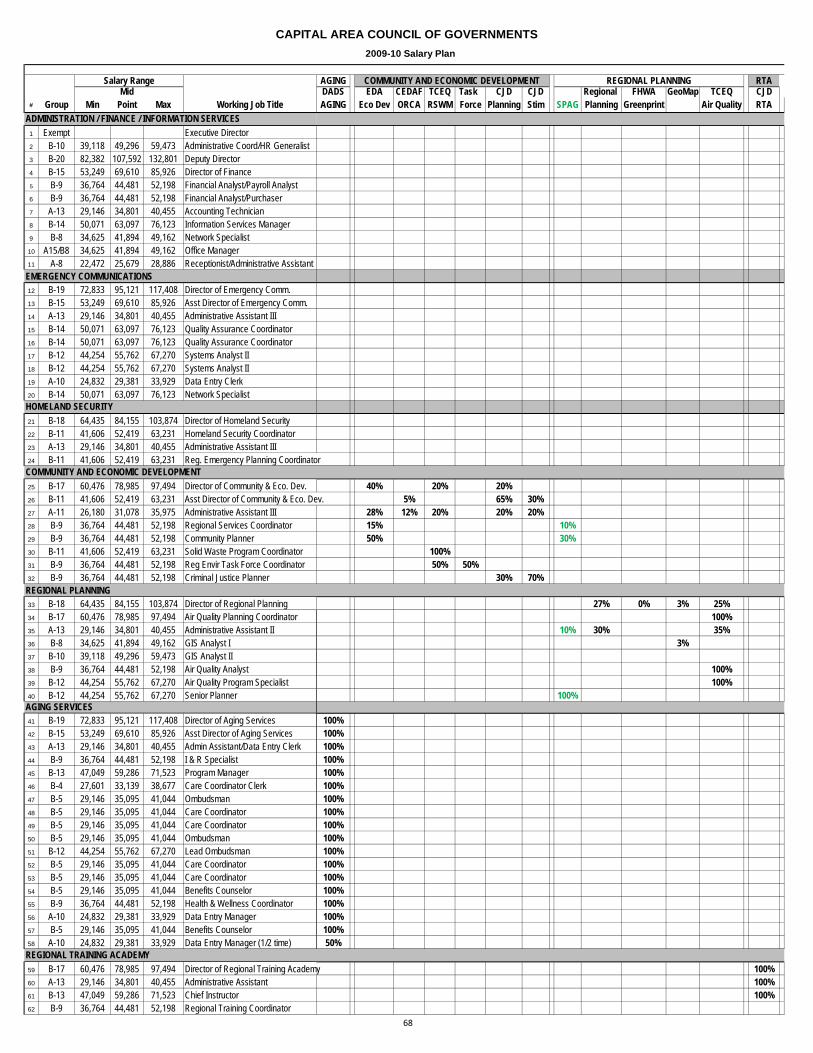
CAPITAL AREA COUNCIL OF GOVERNMENTS 2009-10 Salary Plan
AGING RTAMid DADS EDA CEDAF TCEQ Task CJD CJD Regional FHWA GeoMap TCEQ CJD
# Group Min Point Max Working Job Title AGING Eco Dev ORCA RSWM Force Planning Stim SPAG Planning Greenprint Air Quality RTAADMINISTRATION / FINANCE / INFORMATION SERVICES
1 Exempt Executive Director2 B-10 39,118 49,296 59,473 Administrative Coord/HR Generalist3 B-20 82,382 107,592 132,801 Deputy Director4 B-15 53,249 69,610 85,926 Director of Finance5 B-9 36,764 44,481 52,198 Financial Analyst/Payroll Analyst6 B-9 36,764 44,481 52,198 Financial Analyst/Purchaser7 A-13 29,146 34,801 40,455 Accounting Technician8 B-14 50,071 63,097 76,123 Information Services Manager9 B-8 34,625 41,894 49,162 Network Specialist10 A15/B8 34,625 41,894 49,162 Office Manager11 A-8 22,472 25,679 28,886 Receptionist/Administrative Assistant
EMERGENCY COMMUNICATIONS12 B-19 72,833 95,121 117,408 Director of Emergency Comm.13 B-15 53,249 69,610 85,926 Asst Director of Emergency Comm.14 A-13 29,146 34,801 40,455 Administrative Assistant III15 B-14 50,071 63,097 76,123 Quality Assurance Coordinator16 B-14 50,071 63,097 76,123 Quality Assurance Coordinator17 B-12 44,254 55,762 67,270 Systems Analyst II18 B-12 44,254 55,762 67,270 Systems Analyst II19 A-10 24,832 29,381 33,929 Data Entry Clerk 20 B-14 50,071 63,097 76,123 Network Specialist
HOMELAND SECURITY21 B-18 64,435 84,155 103,874 Director of Homeland Security22 B-11 41,606 52,419 63,231 Homeland Security Coordinator23 A-13 29,146 34,801 40,455 Administrative Assistant III24 B-11 41,606 52,419 63,231 Reg. Emergency Planning Coordinator
25 B-17 60,476 78,985 97,494 Director of Community & Eco. Dev. 40% 20% 20%26 B-11 41,606 52,419 63,231 Asst Director of Community & Eco. Dev. 5% 65% 30%27 A-11 26,180 31,078 35,975 Administrative Assistant III 28% 12% 20% 20% 20%28 B-9 36,764 44,481 52,198 Regional Services Coordinator 15% 10%29 B-9 36,764 44,481 52,198 Community Planner 50% 30%30 B-11 41,606 52,419 63,231 Solid Waste Program Coordinator 100%31 B-9 36,764 44,481 52,198 Reg Envir Task Force Coordinator 50% 50%32 B-9 36,764 44,481 52,198 Criminal Justice Planner 30% 70%
REGIONAL PLANNING33 B-18 64,435 84,155 103,874 Director of Regional Planning 27% 0% 3% 25%34 B-17 60,476 78,985 97,494 Air Quality Planning Coordinator 100%35 A-13 29,146 34,801 40,455 Administrative Assistant II 10% 30% 35%36 B-8 34,625 41,894 49,162 GIS Analyst I 3%37 B-10 39,118 49,296 59,473 GIS Analyst II38 B-9 36,764 44,481 52,198 Air Quality Analyst 100%39 B-12 44,254 55,762 67,270 Air Quality Program Specialist 100%40 B-12 44,254 55,762 67,270 Senior Planner 100%
AGING SERVICES41 B-19 72,833 95,121 117,408 Director of Aging Services 100%42 B-15 53,249 69,610 85,926 Asst Director of Aging Services 100%43 A-13 29,146 34,801 40,455 Admin Assistant/Data Entry Clerk 100%44 B-9 36,764 44,481 52,198 I & R Specialist 100%45 B-13 47,049 59,286 71,523 Program Manager 100%46 B-4 27,601 33,139 38,677 Care Coordinator Clerk 100%47 B-5 29,146 35,095 41,044 Ombudsman 100%48 B-5 29,146 35,095 41,044 Care Coordinator 100%49 B-5 29,146 35,095 41,044 Care Coordinator 100%50 B-5 29,146 35,095 41,044 Ombudsman 100%51 B-12 44,254 55,762 67,270 Lead Ombudsman 100%52 B-5 29,146 35,095 41,044 Care Coordinator 100%53 B-5 29,146 35,095 41,044 Care Coordinator 100%54 B-5 29,146 35,095 41,044 Benefits Counselor 100%55 B-9 36,764 44,481 52,198 Health & Wellness Coordinator 100%56 A-10 24,832 29,381 33,929 Data Entry Manager 100%57 B-5 29,146 35,095 41,044 Benefits Counselor 100%58 A-10 24,832 29,381 33,929 Data Entry Manager (1/2 time) 50%
REGIONAL TRAINING ACADEMY59 B-17 60,476 78,985 97,494 Director of Regional Training Academy 100%60 A-13 29,146 34,801 40,455 Administrative Assistant 100%61 B-13 47,049 59,286 71,523 Chief Instructor 100%62 B-9 36,764 44,481 52,198 Regional Training Coordinator
COMMUNITY AND ECONOMIC DEVELOPMENT
Salary Range COMMUNITY AND ECONOMIC DEVELOPMENT REGIONAL PLANNING
68
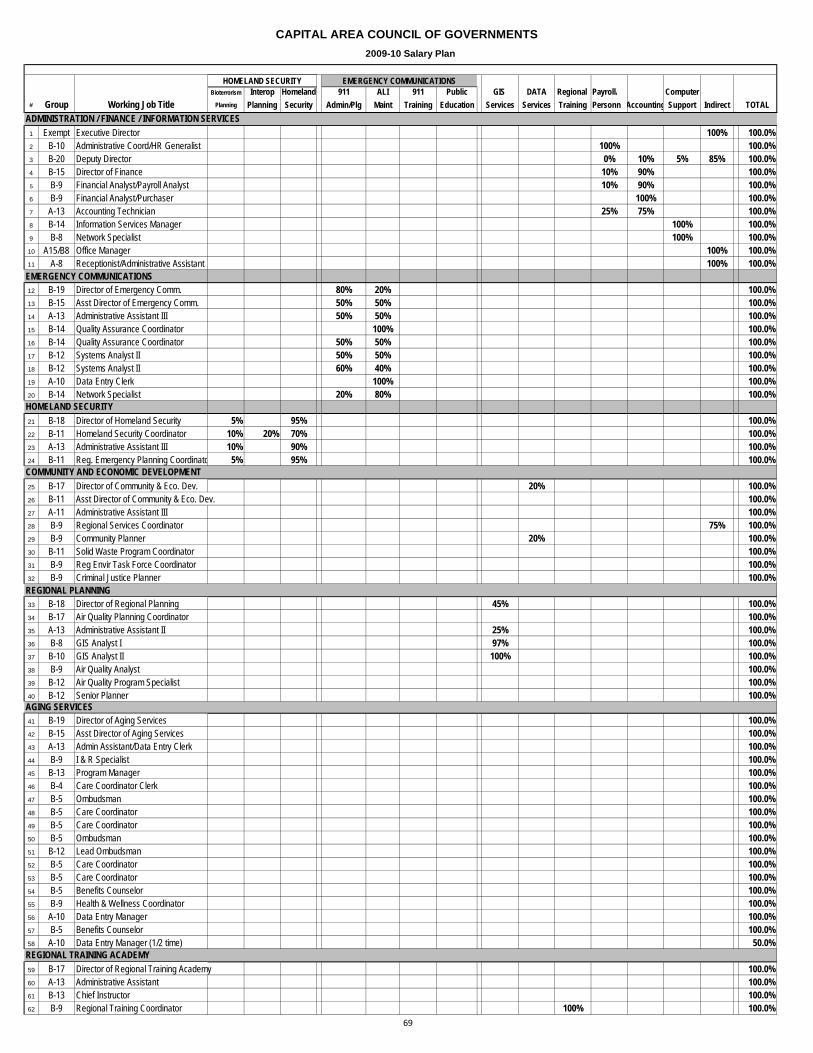
CAPITAL AREA COUNCIL OF GOVERNMENTS 2009-10 Salary Plan
Bioterrorism Interop Homeland 911 ALI 911 Public GIS DATA Regional Payroll/ Computer# Group Working Job Title Planning Planning Security Admin/Plg Maint Training Education Services Services Training Personn Accounting Support Indirect TOTAL
ADMINISTRATION / FINANCE / INFORMATION SERVICES1 Exempt Executive Director 100% 100.0%2 B-10 Administrative Coord/HR Generalist 100% 100.0%3 B-20 Deputy Director 0% 10% 5% 85% 100.0%4 B-15 Director of Finance 10% 90% 100.0%5 B-9 Financial Analyst/Payroll Analyst 10% 90% 100.0%6 B-9 Financial Analyst/Purchaser 100% 100.0%7 A-13 Accounting Technician 25% 75% 100.0%8 B-14 Information Services Manager 100% 100.0%9 B-8 Network Specialist 100% 100.0%10 A15/B8 Office Manager 100% 100.0%11 A-8 Receptionist/Administrative Assistant 100% 100.0%
EMERGENCY COMMUNICATIONS12 B-19 Director of Emergency Comm. 80% 20% 100.0%13 B-15 Asst Director of Emergency Comm. 50% 50% 100.0%14 A-13 Administrative Assistant III 50% 50% 100.0%15 B-14 Quality Assurance Coordinator 100% 100.0%16 B-14 Quality Assurance Coordinator 50% 50% 100.0%17 B-12 Systems Analyst II 50% 50% 100.0%18 B-12 Systems Analyst II 60% 40% 100.0%19 A-10 Data Entry Clerk 100% 100.0%20 B-14 Network Specialist 20% 80% 100.0%
HOMELAND SECURITY21 B-18 Director of Homeland Security 5% 95% 100.0%22 B-11 Homeland Security Coordinator 10% 20% 70% 100.0%23 A-13 Administrative Assistant III 10% 90% 100.0%24 B-11 Reg. Emergency Planning Coordinato 5% 95% 100.0%
25 B-17 Director of Community & Eco. Dev. 20% 100.0%26 B-11 Asst Director of Community & Eco. Dev. 100.0%27 A-11 Administrative Assistant III 100.0%28 B-9 Regional Services Coordinator 75% 100.0%29 B-9 Community Planner 20% 100.0%30 B-11 Solid Waste Program Coordinator 100.0%31 B-9 Reg Envir Task Force Coordinator 100.0%32 B-9 Criminal Justice Planner 100.0%
REGIONAL PLANNING33 B-18 Director of Regional Planning 45% 100.0%34 B-17 Air Quality Planning Coordinator 100.0%35 A-13 Administrative Assistant II 25% 100.0%36 B-8 GIS Analyst I 97% 100.0%37 B-10 GIS Analyst II 100% 100.0%38 B-9 Air Quality Analyst 100.0%39 B-12 Air Quality Program Specialist 100.0%40 B-12 Senior Planner 100.0%
AGING SERVICES41 B-19 Director of Aging Services 100.0%42 B-15 Asst Director of Aging Services 100.0%43 A-13 Admin Assistant/Data Entry Clerk 100.0%44 B-9 I & R Specialist 100.0%45 B-13 Program Manager 100.0%46 B-4 Care Coordinator Clerk 100.0%47 B-5 Ombudsman 100.0%48 B-5 Care Coordinator 100.0%49 B-5 Care Coordinator 100.0%50 B-5 Ombudsman 100.0%51 B-12 Lead Ombudsman 100.0%52 B-5 Care Coordinator 100.0%53 B-5 Care Coordinator 100.0%54 B-5 Benefits Counselor 100.0%55 B-9 Health & Wellness Coordinator 100.0%56 A-10 Data Entry Manager 100.0%57 B-5 Benefits Counselor 100.0%58 A-10 Data Entry Manager (1/2 time) 50.0%
REGIONAL TRAINING ACADEMY59 B-17 Director of Regional Training Academy 100.0%60 A-13 Administrative Assistant 100.0%61 B-13 Chief Instructor 100.0%62 B-9 Regional Training Coordinator 100% 100.0%
EMERGENCY COMMUNICATIONS
COMMUNITY AND ECONOMIC DEVELOPMENT
HOMELAND SECURITY
69
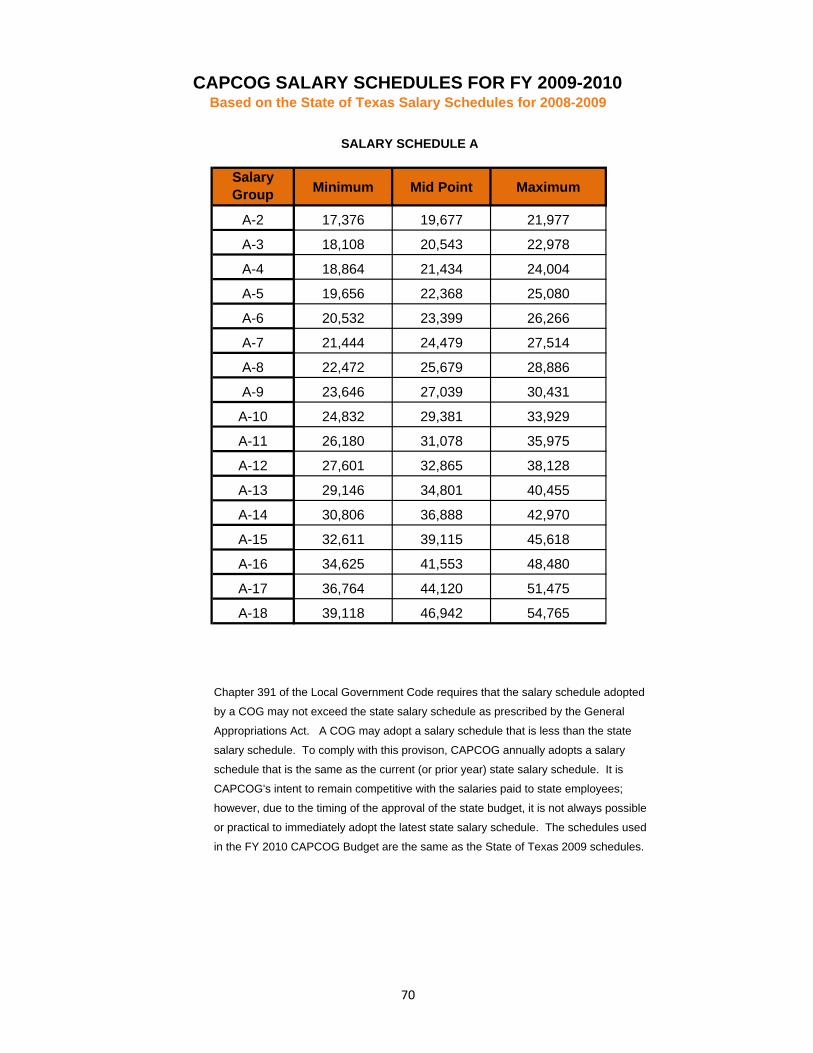
CAPCOG SALARY SCHEDULES FOR FY 2009-2010Based on the State of Texas Salary Schedules for 2008-2009
Salary Group Minimum Mid Point Maximum
A-2 17,376 19,677 21,977
A-3 18,108 20,543 22,978
A-4 18,864 21,434 24,004
A-5 19,656 22,368 25,080
A-6 20,532 23,399 26,266
A-7 21,444 24,479 27,514
A-8 22,472 25,679 28,886
A-9 23,646 27,039 30,431
A-10 24,832 29,381 33,929
A-11 26,180 31,078 35,975
A-12 27,601 32,865 38,128
A-13 29,146 34,801 40,455
A-14 30,806 36,888 42,970
A-15 32,611 39,115 45,618
A-16 34,625 41,553 48,480
A-17 36,764 44,120 51,475
A-18 39,118 46,942 54,765
Chapter 391 of the Local Government Code requires that the salary schedule adopted
by a COG may not exceed the state salary schedule as prescribed by the General
Appropriations Act. A COG may adopt a salary schedule that is less than the state
salary schedule. To comply with this provison, CAPCOG annually adopts a salary
schedule that is the same as the current (or prior year) state salary schedule. It is
CAPCOG's intent to remain competitive with the salaries paid to state employees;
however, due to the timing of the approval of the state budget, it is not always possible
or practical to immediately adopt the latest state salary schedule. The schedules used
in the FY 2010 CAPCOG Budget are the same as the State of Texas 2009 schedules.
SALARY SCHEDULE A
70
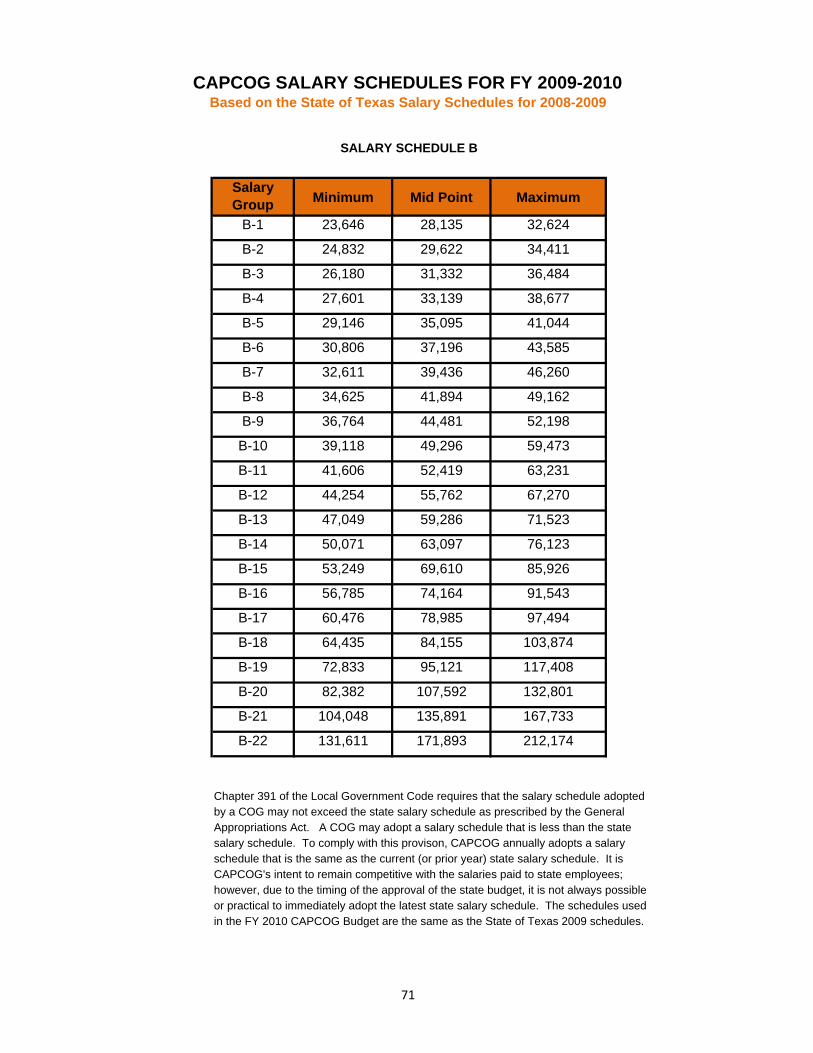
CAPCOG SALARY SCHEDULES FOR FY 2009-2010Based on the State of Texas Salary Schedules for 2008-2009
Salary Group Minimum Mid Point Maximum
B-1 23,646 28,135 32,624
B-2 24,832 29,622 34,411
B-3 26,180 31,332 36,484
B-4 27,601 33,139 38,677
B-5 29,146 35,095 41,044
B-6 30,806 37,196 43,585
B-7 32,611 39,436 46,260
B-8 34,625 41,894 49,162
B-9 36,764 44,481 52,198
B-10 39,118 49,296 59,473
B-11 41,606 52,419 63,231
B-12 44,254 55,762 67,270
B-13 47,049 59,286 71,523
B-14 50,071 63,097 76,123
B-15 53,249 69,610 85,926
B-16 56,785 74,164 91,543
B-17 60,476 78,985 97,494
B-18 64,435 84,155 103,874
B-19 72,833 95,121 117,408
B-20 82,382 107,592 132,801
B-21 104,048 135,891 167,733
B-22 131,611 171,893 212,174
Chapter 391 of the Local Government Code requires that the salary schedule adoptedby a COG may not exceed the state salary schedule as prescribed by the GeneralAppropriations Act. A COG may adopt a salary schedule that is less than the statesalary schedule. To comply with this provison, CAPCOG annually adopts a salaryschedule that is the same as the current (or prior year) state salary schedule. It isCAPCOG's intent to remain competitive with the salaries paid to state employees;however, due to the timing of the approval of the state budget, it is not always possibleor practical to immediately adopt the latest state salary schedule. The schedules usedin the FY 2010 CAPCOG Budget are the same as the State of Texas 2009 schedules.
SALARY SCHEDULE B
71

This page intentionally left blank.

Supplemental Information
7373
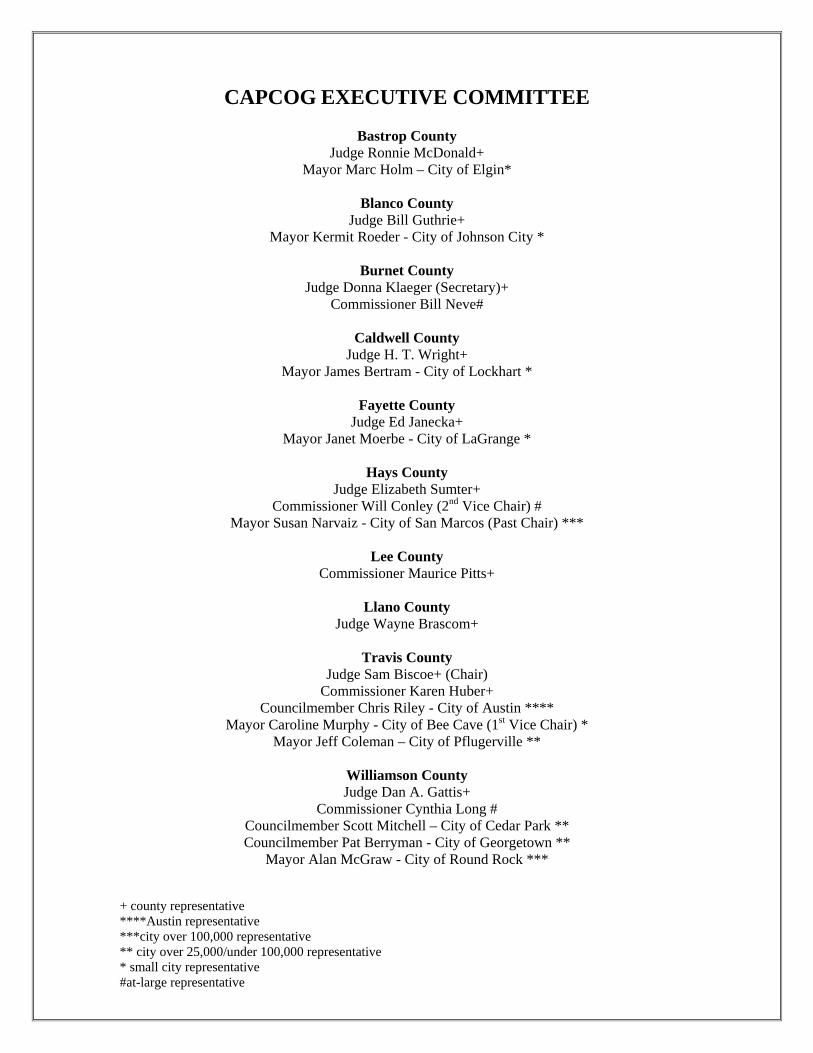
CAPCOG EXECUTIVE COMMITTEE
Bastrop County Judge Ronnie McDonald+
Mayor Marc Holm – City of Elgin*
Blanco County Judge Bill Guthrie+
Mayor Kermit Roeder - City of Johnson City *
Burnet County Judge Donna Klaeger (Secretary)+
Commissioner Bill Neve#
Caldwell County Judge H. T. Wright+
Mayor James Bertram - City of Lockhart *
Fayette County Judge Ed Janecka+
Mayor Janet Moerbe - City of LaGrange *
Hays County Judge Elizabeth Sumter+
Commissioner Will Conley (2nd Vice Chair) # Mayor Susan Narvaiz - City of San Marcos (Past Chair) ***
Lee County
Commissioner Maurice Pitts+
Llano County Judge Wayne Brascom+
Travis County
Judge Sam Biscoe+ (Chair) Commissioner Karen Huber+
Councilmember Chris Riley - City of Austin **** Mayor Caroline Murphy - City of Bee Cave (1st Vice Chair) *
Mayor Jeff Coleman – City of Pflugerville **
Williamson County Judge Dan A. Gattis+
Commissioner Cynthia Long # Councilmember Scott Mitchell – City of Cedar Park ** Councilmember Pat Berryman - City of Georgetown **
Mayor Alan McGraw - City of Round Rock ***
+ county representative ****Austin representative ***city over 100,000 representative ** city over 25,000/under 100,000 representative * small city representative #at-large representative

CAPCOG MEMBERS
Bastrop County Travis County Bastrop County Travis County City of Bastrop City of Austin City of Elgin Village of Bee Cave City of Smithville City of Creedmoor City of Jonestown Blanco County City of Lago Vista Blanco County City of Lakeway City of Blanco City of Manor City of Johnson City City of Mustang Ridge City of Round Mountain City of Pflugerville City of Rollingwood Burnet County Village of San Leanna Burnet County City of Sunset Valley City of Bertram City of West Lake Hills City of Burnet City of Cottonwood Shores Williamson County City of Granite Shoals Williamson County City of Highland Haven City of Cedar Park City of Marble Falls City of Florence City of Meadowlakes City of Georgetown City of Granger Caldwell County City of Hutto Caldwell County City of Jarrell City of Lockhart City of Leander City of Luling City of Liberty Hill City of Martindale City of Round Rock City of Taylor Fayette County City of Thrall Fayette County City of Weir City of Carmine City of Fayetteville City of Flatonia Associate Members City of La Grange Austin Independent School District Town of Round Top Barton Springs/Edwards Aquifer Conservation District City of Schulenburg Bluebonnet Electric Cooperative, Inc. Buda Economic Development Corporation Hays County Capital Area Metropolitan Planning Organization Hays County Dripping Springs Independent School District City of Buda Eanes Independent School District City of Dripping Springs Fayette County Central Appraisal District City of Kyle Georgetown Chamber of Commerce City of Mountain City Georgetown Economic Development Department City of Niederwald Giddings Independent School District City of San Marcos Guadalupe‐Blanco River Authority City of Uhland Hays County Central Appraisal District Village of Wimberley Hutto Independent School District La Grange Area Chamber of Commerce Lee County La Grange Independent School District Lee County Lower Colorado River Authority City of Giddings Pedernales Electric Co‐Op City of Lexington Round Rock Chamber of Commerce Round Rock Independent School District Llano County Travis County Emergency Services, Dist. 4 Llano County City of Llano City of Horseshoe Bay City of Sunrise Beach Village
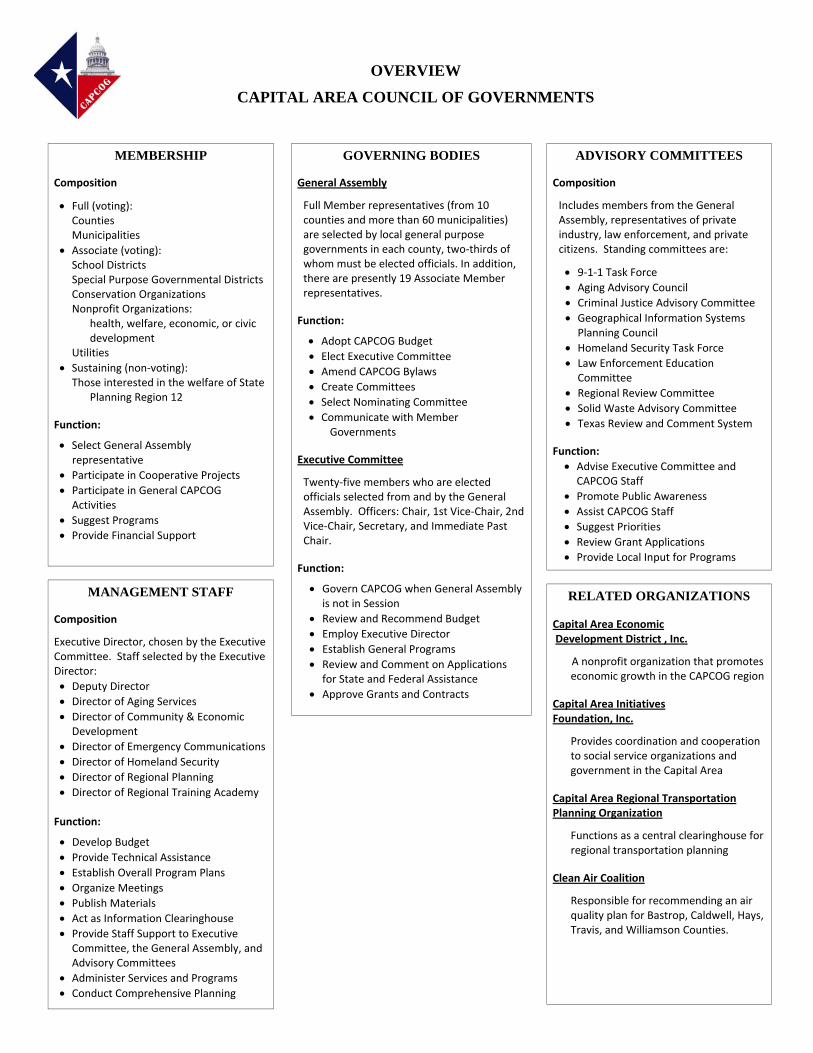
MEMBERSHIP Composition
• Full (voting): Counties Municipalities • Associate (voting):
School Districts Special Purpose Governmental Districts
Conservation Organizations Nonprofit Organizations: health, welfare, economic, or civic
development Utilities • Sustaining (non‐voting): Those interested in the welfare of State
Planning Region 12 Function:
• Select General Assembly representative
• Participate in Cooperative Projects • Participate in General CAPCOG Activities
• Suggest Programs • Provide Financial Support
GOVERNING BODIES General Assembly
Full Member representatives (from 10 counties and more than 60 municipalities) are selected by local general purpose governments in each county, two‐thirds of whom must be elected officials. In addition, there are presently 19 Associate Member representatives.
Function:
• Adopt CAPCOG Budget • Elect Executive Committee • Amend CAPCOG Bylaws • Create Committees • Select Nominating Committee • Communicate with Member
Governments Executive Committee
Twenty‐five members who are elected officials selected from and by the General Assembly. Officers: Chair, 1st Vice‐Chair, 2nd Vice‐Chair, Secretary, and Immediate Past Chair.
Function:
• Govern CAPCOG when General Assembly is not in Session
• Review and Recommend Budget • Employ Executive Director • Establish General Programs • Review and Comment on Applications
for State and Federal Assistance • Approve Grants and Contracts
MANAGEMENT STAFF Composition
Executive Director, chosen by the Executive Committee. Staff selected by the Executive Director: • Deputy Director • Director of Aging Services • Director of Community & Economic Development
• Director of Emergency Communications • Director of Homeland Security • Director of Regional Planning • Director of Regional Training Academy
Function:
• Develop Budget • Provide Technical Assistance • Establish Overall Program Plans • Organize Meetings • Publish Materials • Act as Information Clearinghouse • Provide Staff Support to Executive Committee, the General Assembly, and Advisory Committees
• Administer Services and Programs • Conduct Comprehensive Planning
OVERVIEW
CAPITAL AREA COUNCIL OF GOVERNMENTS
ADVISORY COMMITTEES Composition
Includes members from the General Assembly, representatives of private industry, law enforcement, and private citizens. Standing committees are:
• 9‐1‐1 Task Force • Aging Advisory Council • Criminal Justice Advisory Committee • Geographical Information Systems Planning Council
• Homeland Security Task Force • Law Enforcement Education Committee
• Regional Review Committee • Solid Waste Advisory Committee • Texas Review and Comment System
Function: • Advise Executive Committee and CAPCOG Staff
• Promote Public Awareness • Assist CAPCOG Staff • Suggest Priorities • Review Grant Applications • Provide Local Input for Programs
RELATED ORGANIZATIONS
Capital Area Economic Development District , Inc.
A nonprofit organization that promotes economic growth in the CAPCOG region
Capital Area Initiatives Foundation, Inc.
Provides coordination and cooperation to social service organizations and government in the Capital Area
Capital Area Regional Transportation Planning Organization
Functions as a central clearinghouse for regional transportation planning
Clean Air Coalition
Responsible for recommending an air quality plan for Bastrop, Caldwell, Hays, Travis, and Williamson Counties.
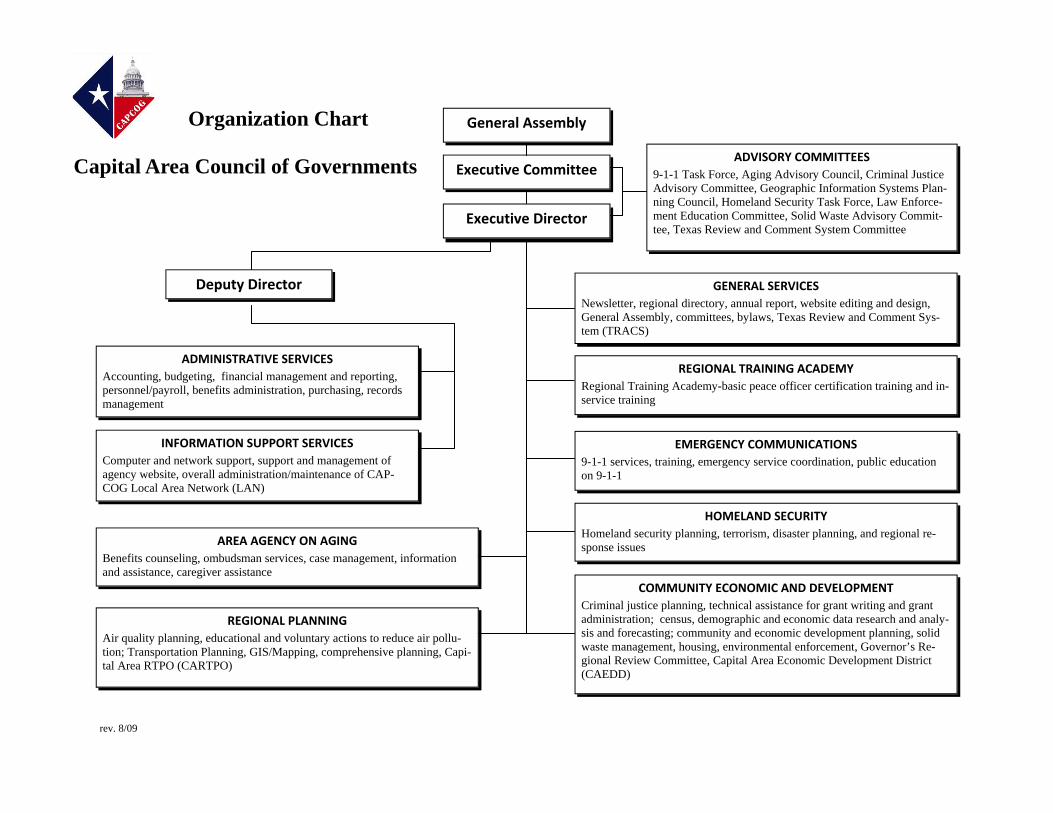
rev. 8/09
ADMINISTRATIVE SERVICES Accounting, budgeting, financial management and reporting, personnel/payroll, benefits administration, purchasing, records management
REGIONAL PLANNING Air quality planning, educational and voluntary actions to reduce air pollu-tion; Transportation Planning, GIS/Mapping, comprehensive planning, Capi-tal Area RTPO (CARTPO)
AREA AGENCY ON AGING Benefits counseling, ombudsman services, case management, information and assistance, caregiver assistance
Executive Committee
General Assembly
EMERGENCY COMMUNICATIONS 9-1-1 services, training, emergency service coordination, public education on 9-1-1
INFORMATION SUPPORT SERVICES Computer and network support, support and management of agency website, overall administration/maintenance of CAP-COG Local Area Network (LAN)
COMMUNITY ECONOMIC AND DEVELOPMENT Criminal justice planning, technical assistance for grant writing and grant administration; census, demographic and economic data research and analy-sis and forecasting; community and economic development planning, solid waste management, housing, environmental enforcement, Governor’s Re-gional Review Committee, Capital Area Economic Development District (CAEDD)
ADVISORY COMMITTEES 9-1-1 Task Force, Aging Advisory Council, Criminal Justice Advisory Committee, Geographic Information Systems Plan-ning Council, Homeland Security Task Force, Law Enforce-ment Education Committee, Solid Waste Advisory Commit-tee, Texas Review and Comment System Committee
Executive Director
GENERAL SERVICES Newsletter, regional directory, annual report, website editing and design, General Assembly, committees, bylaws, Texas Review and Comment Sys-tem (TRACS)
Deputy Director
REGIONAL TRAINING ACADEMY Regional Training Academy-basic peace officer certification training and in-service training
Organization Chart
Capital Area Council of Governments
HOMELAND SECURITY Homeland security planning, terrorism, disaster planning, and regional re-sponse issues