Embed Size (px)
Citation preview

Annual Report 1996

Contents
A Message from the Management 2
Management’s Discussion and Analysis 5
Non-consolidated Financial Statements 18
Consolidated Financial Statements 32
Corporate Information Section 42

1
Nippon Yusen Kabushiki Kaisha (NYK) is one of theworld’s major shipping companies. With logisticalsolutions and a global network, NYK is respondingboldly to the shifting patterns of world trade. TheCompany is well-positioned as a megacarrier: providingseamless, door-to-door container and logistics services;operating competitive fleets of liner, tramp and speciali-zed carriers; and transporting vital energy resourceswith state-of-the-art tankers.
From a solid foundation in transport services, NYKis diversifying its business portfolio with cruise ship,marine leisure and real estate operations. Building onover 110 years of tradition, NYK is poised to achievesound and profitable growth in the 21st century andbeyond.

2
The rapid changes of our time are ushering in a
new age of borderless, global economic progress.
Maritime transport is now more than ever an
indispensable infrastructure for world commerce.
NYK is poised to ride a new wave on these
megatrends by fully utilizing its expanded, global
logistics capabilities. To create a sound and
profitable business foundation, we are drastically
reforming our operations, maximizing economies
of scale and upgrading efficiency and quality
throughout the NYK Group.
PerformanceIn the United States, economic activity began to
slow during the second half of the term. Eco-
nomic performance in Europe, especially Ger-
many, was sluggish. In Asia, high levels of expan-
sion continued, although Hong Kong and
Singapore experienced temporary slowdowns.
Economic conditions in Japan were mixed; the
appreciation of the yen to historic highs during
the first half of the term gave way to a sharp
weakening during the second half, leading to a
brighter outlook.
In the shipping markets, although liner cargo
volume grew briskly in Asia, competition
remained severe on major North American and
European routes, and freight rates declined.
Conditions in the tanker market were favorable,
supported by the scrapping of older tankers in
the world’s fleet and strong demand growth for
the safe transport of energy sources. In tramp
services, favorable market conditions prevailed at
the beginning of the term, but rates began weak-
ening in the summer.
In liner operations, NYK’s global marketing
forces responded to the shift of cargo sourcing to
emerging economies and growth in FOB (free on
A Message from the Management
Jiro Nemoto, Chairman (right) and Kentaro Kawamura, President

3
board) cargo controlled by importers. Our
tanker and specialized carrier operations main-
tained stable revenues through long-term
contracts. Tramp services recorded revenue
growth based on our balanced vessel portfolio
for both long-term and spot charter operations.
NYK transported 118.2 million revenue tons
of cargo, another all-time high and 5.2% above
the previous term’s level. On a non-consoli-
dated basis, total revenue edged up 0.7% to
¥521,386 million and operating income grew by
38.7% to ¥18,483 million. Net income for the
term rose by 4.9% to ¥2,597 million. Net income
per share was ¥2.21, compared with ¥2.13 last
fiscal year. We maintained dividends of ¥4.00
per share.
Sound Growth through Drastic ReformGuided by NYK 21, its revised long-term man-
agement vision, the NYK Group is strategically
expanding its operating base. We welcome new
opportunities arising from the shifting currents
of world trade. Our commitment to sound and
profitable operations is demonstrated by a
reform program of unprecedented scope.
First, in our liner operations we set the stage
for a dramatic restructuring by forming the
Grand Alliance with Hapag-Lloyd A.G. (HL), of
Germany, Neptune Orient Lines Ltd. (NOL), of
Singapore, and P&O Containers Limited
(P&OCL), of the United Kingdom. This consor-
tium will contribute to shorter transit times and
increased frequency of trunk line services with
the operation of over 70 containerships. It will
significantly boost economies of scale and
operating efficiency throughout the NYK
Group’s global operations - from vessel de-
ployment, container yard operations and inland
transportation to marketing and information
systems. During the term, we reorganized major
routes to prepare for the beginning of the
Grand Alliance in June 1996.
The NYK Group’s expanded marketing
presence and revitalized administration have
made considerable progress in improving the
cost management of container operations, based
on the net contribution project, which quantifies
each container’s net earnings. The strategic use of
information, an essential element in these efforts,
is made possible by our exclusive information
systems. Building on the success of our advanced
information infrastructures in North America and
Europe, we launched our new information
network for Asia.
A new method of profit and loss accounting
for container services was introduced in April
1996 to improve the accuracy and timeliness of
accounting information for our increasingly
complicated and seamless network of global
container services. This new accounting method
enhances oversight in each region by quantify-
ing earnings contributions and clarifying re-
gional responsibilities.
Combined with these measures to boost
efficiency, NYK has refocused on quality liner
services. Our emphasis on quality is symbolized
by the effective use of the world’s most advanced
multi-cargo simulator, which was installed at the
newly established NYK Ocean Carrier Technology
Laboratory in Yokohama, Japan.
Second, in tanker services we have reaffirmed
our commitment to transporting fossil fuels as an
important source of stable earnings. In Japan,
demand for crude oil is strong and the use of
clean energy such as LNG is growing. NYK has
strengthened safety-first operations of its fleet of
VLCCs and LNG tankers - the most modern in the
world. Reliability and technical expertise represent
our competitive advantages to win long-term
contracts.
NYK is expanding cross trade in its tanker
operations, including the transport of refined
petroleum and chemicals, in the high-growth
markets of Asia. NYK’s aggressive response to
shifts in cargo demand is also reflected in its
specialized Ro / Ro (Roll-on / Roll-off) carrier
services for the transport of automobiles and auto
parts, as well as the construction machinery
necessary for economic development in emerging
markets.
Third, our reform program is backed by a
total commitment to safety. NYK received a

4
certificate of compliance with the International
Safety Management (ISM) Code in June 1995, well
ahead of the 1998 deadline. We have also ob-
tained a certificate of compliance under the ISO
9002 safety-management guidelines prescribed by
the International Organization for Standardization.
NYK’s maritime staff is multinational - only
1,500 out of 10,000 seafarers come from Japan.
NYK-Fil Ship Management Inc., based in Manila, is
at the forefront of our safety education program.
NYK-Fil has trained more than 10,000 highly
skilled, safety-conscious seafarers since its estab-
lishment in 1989. International staffing, for both
ashore and onboard, contributes to increasing the
portion of dollar-based costs to help neutralize the
effects of exchange rate fluctuations.
Finally, our long-term vision calls for steady
growth of diversified businesses. In our cruise
ship operations, Crystal Cruises, Inc., our wholly
owned U.S. subsidiary, is well positioned in the
promising luxury cruise market with Crystal
Harmony and Crystal Symphony, both Five Star
Plus-rated ships. With a crew from 30 countries,
Crystal Cruises symbolizes the international spirit
of NYK. We also operate Asuka - Japan’s largest
and most luxurious cruise ship. Asuka’s first
round-the-world cruise, in 1996, was completely
sold out, and bookings for the second one,
scheduled for 1997, are also fully booked. Com-
bined with office leasing operations, including our
office building on the Tokyo waterfront, these
diversified businesses in Japan are boosting yen-
based revenues.
Stable TransportIndustrywide shipping forums contribute to the
stabilization of maritime transport. NYK is
taking a leadership role in such world shipping
forums as the Transpacific Stabilization Agree-
ment (TSA), the Europe-Asia Trade Agreement
(EATA), the Intra-Asia Discussion Agreement
(IADA) and the Asian Shipowners’ Forum
(ASF).
Asian countries are great trading nations and
their primary links with each other amd the rest
of the world are seaways. This reinforces the
importance of these markets to the world ship-
ping industry. Consequently, the ASF plays an
increasingly important role in supporting stable
seaborne trade. In May 1996, the fifth annual
meeting of the ASF was held in Hong Kong.
Building on the success of earlier meetings in
Tokyo, Seoul, Beijing and Taipei, ASF made
further progress in bolstering cooperation
among shipping companies to improve safety
and enhance stability on the shipping routes of
Asia. The participation of China’s largest ship-
ping company made the scope of discussions
especially meaningful.
A Vital MissionNYK’s respected position in the shipping
industry has been built up over more than a
century of maritime history. Markets and ser-
vices have changed over the years, but our
essential mission remains the same: to provide
the infrastructure for global trade and economic
prosperity.
The megatrends of world commerce are
fueling demand for ever more complex trans-
portation services in nearly every corner of the
world. NYK is decentralizing operations and
reorganizing headquarters to clarify the respon-
sibilities and contributions of every member of
its global team. Despite the difficulty of the
tasks that lie before us, people throughout the
NYK Group are energized by their mission.
Their enthusiasm drives our efforts to create a
sound and profitable base for NYK’s second
century of progress.

5
Operational Overview
Revenue Analysis
During the fiscal year ended March 31, 1996, NYK trans-ported 118.2 million revenue tons of cargo, an all-timehigh and an increase of 5.2% from last fiscal year’s level.Non-consolidated total revenue increased 0.7 % to¥521,386 million (US$4,902.6 million). Liner revenuedeclined slightly, by 1.5 %, reflecting lower freight ratesdue to intensified competition. In the tramp and special-ized carrier segment, long-term contracts and strategicvessel deployment minimized the impact of marketvolatility and supported growth of 1.3 %. In tankerservices, NYK secured new long-term contracts andrecorded strong revenue growth of 9.8 %.
Management’s Discussion and Analysis (Non-consolidated)
(Thousand Revenue Tons)
l996 1995 1994
Transported cargovolume ........................ 118,196 112,407 104,914
Revenues by Segment (¥ Millions)
1996 1995 1994
Liner ............................... ¥240,411 ¥244,146 ¥257,933Tramp & Specialized
Carrier ......................... 204,458 201,842 201,750Tanker ............................ 67,651 61,610 61,302Other .............................. 8,864 9,937 10,206
Total ............................... ¥521,386 ¥517,536 ¥531,194

6
Liner Services
Operating HighlightsNYK provides global liner services with one of the world’s largest fleets of containerships. During the
fiscal year, liner services recorded revenues of ¥240,411 million (US$2,260.6 million), a 1.5% decline
from the previous term’s level, accounting for 46.1% of total non-consolidated revenue.
Intensified competition and lower rates on major North American and European routes adversely
affected performance. NYK responded by maximizing operational efficiency through higher volumes
and economies of scale. We leveraged our global marketing forces with value-added transport services
and accelerated our response to the rise of cargo sourcing in Asia. Container inventory management
was upgraded through our net contribution project. These measures were reinforced by the restructur-
ing of routes and the rationalization of vessel deployment for our global liner services, to be taken over
by the four-company Grand Alliance during the current fiscal year, ending March 31, 1997.
Coupled with the sharp weakening of the yen in the second half of the term, these effective strate-
gies contributed to lower losses on our liner services.
Performance and InitiativesASIA-NORTH AMERICA ROUTES■ The coordinated marketing power of the global NYK Group succeeded in boosting cargo volume
on westbound routes, which offset sluggish performance on eastbound routes and intensified
competition in the industry.
■ Asia-North America routes were reorganized in June 1996 around five express loops as part of the
Grand Alliance. Direct service was added to Shanghai and Laem Chabang. We also established a
direct route between Los Angeles and Hong Kong.
ASIA-EUROPE ROUTES■ Cargo volume on Asia-Europe routes increased on both eastbound and westbound voyages,
reflecting the success of aggressive marketing activities focused on Asian markets. An earnings
recovery, however, was delayed as higher volume was undercut by lower rates.
The containership NYK Sunrise

7
■ In January 1996, NYK, Hapag-Lloyd and Neptune Orient Lines began service on three loops on Asia-
Europe routes, with a weekly fixed-day service for each loop. P&OCL joined the consortium in June
1996, following the close of the fiscal year, and a fourth loop was added to begin the “Japan-Far East /
Europe Container Service” of the four-company Grand Alliance.
■ NYK reorganized its Mediterranean routes to better leverage the benefits of its competitive trunk line
services. Our dedicated and common feeder routes link Mediterranean ports with our Asia-Europe trunk
line through Malta, realizing a dramatic reduction in transit time between the Mediterranean and Asia.
■ During the term, NYK ordered five new 5,700-TEU (20-foot-equivalent unit) containerships to be de-
ployed on Asia-Europe routes. We will take delivery of these Over-Panamax vessels, the largest class in
the world, between mid-1997 and mid-1998.
INTRA-ASIA AND OCEANIA ROUTES■ NYK used its marketing bases in the region to answer high growth in demand for quality cargo trans-
port. Favorable performance continued, represented by brisk volume growth on our busy Japan-
Bangkok route.
■ We launched AsiaLink, our advanced computer network, to link our frontline offices in Asia. This was a
significant step toward establishing a competitive information infrastructure able to satisfy growing
demand in the region for quality transport services. To strengthen our marketing power in a dynamic
market, we established P.T. NYK Line Indonesia in March 1996.
■ Services between Japan and Australia were bolstered in January 1996 with the start of container services
on fixed days of the week. This will meet increasing requirements for complete knock down (CKD) and
other types of cargo transport to Australia.
ASIA-LATIN AMERICA ROUTES■ NYK is responding to growing demand for cargo transport between Asia and Latin America; during the
term, we expanded liner services linking Asia and the west coast of South and Central America.

8
Operating HighlightsWith one of the world’s largest fleets of tramp and specialized carriers, including ore and coal carriers,
car carriers, various sizes of dry bulk carriers, woodchip carriers and reefer carriers, NYK has a strong
competitive position.
Revenues of tramp and specialized carrier services rose by 1.3% to ¥204,458 million (US$1,922.5
million), accounting for 39.2% of total non-consolidated revenue.
The tramp market, which had been strong since the fall of 1994, began weakening in June 1995.
Reasons for the downturn included inventory adjustments by Japanese and European steelmakers and
lower-than-expected Chinese grain purchases. Market conditions remain weak.
NYK’s strategy to minimize the impact of market volatility on performance is to emphasize both
long-term contracts and strategic vessel deployment. To improve profitability, we are reducing ship-
ping costs in all categories of cargo transport.
We achieved steady volume growth in cross-trade shipping by making maximum use of our bulk
shipping network: NYK Bulkship (USA) Inc., NYK Bulkship (Europe) Ltd. and NYK Bulkship
(Singapore) Pte., Ltd.
Performance and InitiativesIRON ORE AND COAL CARRIERS
■ Iron ore and coking coal carriers, which supply Japanese steelmakers, recorded favorable results, as
strength in the first half of the term offset weakness in the second half. Coal carriers also turned in
a sound performance, supported by strong demand from Japan’s electric power industry.
Tramp and Specialized Carrier Services
The bulk carrier Onoe Maru

9
WOODCHIP CARRIERS
■ Our woodchip carrier operations benefited from growing demand for woodchips by paper produc-
ers, reflecting Japan’s economic recovery. Marketing efforts succeeded in securing a new long-term
contract to support stable revenue contributions.
CAR CARRIERS
■ Volume from Japan to North America declined during the term, despite a slight recovery in the
second half. Demand was firm on Japan-Australia routes, and volume on Japan-Europe routes was
about the same as during the previous fiscal year. We are emphasizing cross-trade business to offset
structural declines in automobile shipments from Japan.
■ Ro / Ro (Roll-on / Roll-off) service is an important element of our strategy for meeting the specific
needs of the emerging economies of Asia. Ro / Ro vessels provide efficient transport not only for
cars and auto parts but also for construction machinery needed for infrastructure development.
During the fiscal year under review, NYK commenced its intra-Asia Ro / Ro service.
REEFER CARRIERS
■ NYK is a leading global carrier in the transport of fresh and frozen food, with a fleet of high-speed,
large-capacity reefer carriers. To meet increasing demand for quality, atmosphere-controlled trans-
port, we significantly expanded the number of reefer carriers in operation.

10
Operating HighlightsNYK operates one of the world’s top-class tanker fleets of very large crude carriers (VLCCs), other oil
tankers, and liquefied natural gas (LNG) and liquefied petroleum gas (LPG) carriers. Long-term contracts
for the transport of vital energy sources have resulted in stable revenue growth despite market volatility
and overtonnage in the world VLCC fleet.
Tanker services recorded revenue growth of 9.8% to ¥67,651 million (US$636.1 million), com-
prising 13.0% of total non-consolidated revenue.
Although crude oil imports to Japan declined slightly due to lower demand from electric power
utilities, market conditions for VLCCs improved considerably from the previous term, reflecting the
scrapping of older vessels amid rising environmental concerns. NYK added two new carriers to its VLCC
fleet, already the youngest in the world. We also maintained our total commitment to the safe transport
of energy sources, symbolized by the new state-of-the-art crude oil cargo handling simulator at our crew
training center in Yokohama, Japan.
Demand is growing steadily in Japan for LNG as a clean energy source for the 21st century. NYK’s
fleet of LNG carriers, one of the largest in the industry, continued to record a solid performance during
the term.
NYK improved its position in the transport of refined petroleum products and chemicals by building
on a strong base of customer loyalty through reliable, safety-first transport services.
Performance and InitiativesCRUDE OIL
■ NYK’s advanced fleet of VLCCs recorded stable earnings growth based on long-term contracts. We
reinforced our position as one of the world’s leading carriers of crude oil by adding two new carriers
to our fleet, for a total of 20 VLCCs.
Tanker Services
The LNG Flora

11
REFINED PETROLEUM PRODUCTS AND CHEMICALS
■ During the term, NYK entered into a charter contract for three 60,000-ton naphtha carriers to join
its two 40,000-ton carriers. Our naphtha carrier fleet recorded solid growth, supported by strong
market conditions.
■ In chemical transport, NYK serves the Asia-Oceania region through a joint venture with Stolt
Parcel Tankers, Inc., a major multinational chemical tanker company. Growth in this cargo
category remained steady.
■ NYK began operations of its first two methanol carriers, one serving a plant in Venezuela and the
other, which is jointly operated, serving a plant in New Zealand.
LNG AND LPG
■ The reliable transport of LNG on long-term contracts is a stable source of earnings for NYK. We
are at the forefront of this growing market, with a fleet of 11 modern carriers transporting over 10
million tons of LNG annually to Japan from Indonesia, West Australia and Malaysia.
■ NYK and four other shipping companies signed a long-term charter contract to operate seven
carriers transporting 400 million tons of LNG from Qatar to Japan, to supply a Japanese
electric power company, from the end of 1996 to 2021. An additional agreement was reached
to add three carriers to transport another 200 million tons per year. This will make it the
world’s largest LNG project in terms of the number of carriers in service, with NYK playing a
leading role.
■ NYK plans to add two small LNG tankers over the next two years to flexibly meet the needs of
Japanese regional gas utilities.
■ Our three LPG carriers recorded solid revenues during the fiscal year.

12
GROSS OPERATING TONNAGE
No. ofVessels DWT(kt)
NYK-owned vessels 60 5,273,727Chartered vessels 347 14,252,846Total 407 19,526,573
Fleet (As of March 31, 1996)

13
( )CONTAINER LINER SERVICESAsia-Europe 133North Europe-Portugal 199Asia-West Mediterranean 76Asia-Arabian Gulf 100Asia-U.S. Atlantic (via Panama) 60Asia-U.S. Atlantic (via Suez) 55Asia-California 170Asia-Hawaii 10Asia-Southeast Australia 141Asia-West Australia 31Australia/New Zealand-Arabian Gulf 57Asia-New Zealand 31Intra-Asia 981Japan-China 63Asia-South Africa-East Coast of South America 62Asia-West Coast of Central America 22Asia-West Coast of South America 64Europe-West Coast of South America 22TOTAL 2,277
CONVENTIONAL LINER SERVICESAsia-Red Sea-East Mediterranean 12Asia-West Coast of Central America 3Asia-East Coast of South America 14Japan-Venezuela 7Asia-East Africa 12Japan-Southeast Australia 11Asia-New Zealand 34Japan/Korea-Papua New Guinea 11Japan/Korea-South Pacific 16Japan/Korea-Micronesia 49Asia-Manaus 17TOTAL 186
TRAMP SERVICESAutomobiles,coal,grain,knock-down,metals,woodchips,woodproducts,iron ore,nonferrous metals, fresh and frozen
foodstuffs,and others
Japan-North America 565Japan-Africa 96Japan-Middle East 54Japan-India 52Japan-East Asia 149Japan-Australia 444Japan-Europe 153Cross-trade 448TOTAL 1,961
TANKER SERVICES(Crude oil, clean petroleum products, LNG, LPG)
Arabian Gulf-Japan/Southeast Asia 129Japan-Southeast Asia 228Japan-West Australia 33Japan-China 9Cross-trade 53Other Services 20TOTAL 472
Total Number of Voyages (For the year ended March 31, 1996)

14
Income Analysis
NYK continued to expand the dollar-based share ofits expenses and boost the efficiency of its shippingservices. As a result, total vessel and voyage expensesdeclined by 0.1% to ¥463,335 million (US$4,356.7million), and vessel and voyage earnings grew 12.8%to ¥49,186 million (US$462.5 million).
Vessel and Voyage Earnings (¥ Millions)
1996 1995 1994Revenues ............................ ¥512,521 ¥507,599 ¥520,987Expenses ............................ 463,335 463,982 482,131Earnings ............................. 49,186 43,617 38,856
Due to across-the-board cost-cutting measures, gen-eral and administrative expenses declined 0.6% fromthe previous fiscal year to ¥34,971 million (US$328.8million), and operating income increased 38.7% to¥18,483 million (US$173.8 million).
(¥ Millions)
1996 1995 1994General and administrativeexpenses .......................... ¥34,971 ¥35,191 ¥37,203
Operating income .............. 18,483 13,329 6,506
Interest expenses declined 9.4%, while otherincome, principally interest received and dividendincome, was down 8.1%. Consequently, total otherexpenses declined to ¥4,219 million (US$39.7 mil-lion). Income before income taxes and special items
was ¥14,264 million (US$134.1 million), an increase of68.3% from the prior fiscal year. However, the Com-pany recorded total special losses of ¥5,663 million(US$53.2 million) due primarily to charges related tothe liquidation of a subsidiary. As a result, incomebefore income taxes declined 9.7% to ¥8,601 million(US$80.9 million). Income taxes were ¥6,004 million(US$56.5 million), for an effective tax rate of 69.8%,compared with 74.0% during the previous fiscal year.(See note 4 to the non-consolidated financial state-ments for a detailed explanation of income taxes.)
As a result of the above factors, net income was¥2,597 million (US$24.4 million), an increase of 4.9%.Net income per share was ¥2.21 (US$0.021).
(¥ Millions)
1996 1995 1994
Income before incometaxes ............................. ¥8,601 ¥9,520 ¥6,808
Net income ..................... 2,597 2,476 5,395

15
Analysis of Liquidity
Total current assets increased by ¥24,167 million fromthe end of the previous fiscal year to ¥154,958 million(US$1,457.1 million). The largest reason for thisincrease was a rise of ¥26,264 million in cash andtime deposits. Total current liabilities grew by ¥12,084million to ¥213,626 million (US$2,008.7 million),primarily as a result of an increase of ¥20,653 millionin the current portion of long-term debt. The currentratio improved from 0.65 to 0.73.
1996 1995 1994Current ratio ..................... 0.73 0.65 0.97
Analysis of Financial Condition
At the end of the fiscal year, investments in andadvances to subsidiaries and affiliates, at cost, were¥109,989 million (US$1,034.2 million), a decrease of5.9%. The decrease included the effect of liquidatingan unprofitable subsidiary.
Capital expenditures during the fiscal year declined¥19,900 million to ¥21,700 million (US$204.0 million),due in part to the absence of investment in the NYKTennoz Building, which was completed during theprevious period. During the term under review, invest-ment included the purchase of vessels and constructionwork on the NYK Ocean Carrier Technology Laboratory.Funding came from internal cash flows and increaseddebt. The Company made three domestic note offerings,with interest rates between 2.5% and 3.0%, for a total of¥50,000 million (US$470.1 million), and 10 Euroyenmedium-term note issues totaling ¥11,000 million
(US$103.4 million). Long-term loans from banks andother financial institutions declined by ¥5,441 million to¥207,969 million (US$1,955.5 million). In aggregate,interest-bearing debt increased by ¥32,491 million to¥426,720 million (US$4,012.4 million).
Total stockholders’ equity declined 0.9% to ¥223,898million (US$2, 105.3 million), while total assets grew2.6% to ¥737,625 million (US$6,935.8 million). Theequity ratio declined from 31.4% to 30.4%. Stockhold-ers’ equity per share was ¥190.66 (US$1.793).
(¥ Millions)
1996 1995 1994Capital expenditures ....... ¥21,700 ¥41,600 ¥29,200Depreciation &amortization ................... 17,996 17,417 27,739
(¥ Millions)
1996 1995 1994
Total assets (A) ............... ¥737,625 ¥718,969 ¥767,720Stockholders’ equity (B) .. 223,898 225,953 219,823Equity ratio (B/A) (%) ...... 30.4 31.4 28.6

16
Scope of Consolidation and Equity Method
In accordance with generally accepted accountingprinciples in Japan, the consolidated financial state-ments for the fiscal year ended March 31, 1996, in-cluded the accounts of NYK and 195 major subsidiar-ies, compared with 184 during the previous term.Prior-period accounts have not been restated to reflectthis change in consolidated subsidiaries. Newly con-solidated subsidiaries included Yusen ComputerSystem Co., Ltd. There were one non-consolidatedsubsidiary (compared with three during the previousperiod) and 34 affiliates (compared with 28 in theprevious period) accounted for by the equity method.
Number of Consolidated and Equity-Method-Applied Companies
1996 1995 1994
Consolidated companies .... 195 184 102Equity-method-applied
companies:Non-consolidatedcompanies .................... 1 3 3
Affiliates .......................... 34 28 10
Analysis of Revenues and Income
During the fiscal year ended March 31, 1996, consoli-dated total revenues grew 2.8% to ¥891,729 million(US$8,384.9 million). Shipping sales grew 4.7% to
Management’s Discussion and Analysis (Consolidated)
¥644,624 million (US$6,061.3 million). Oil wholesalingsales were ¥106,029 million (US$997.0 million), a declineof 8.2% from the previous term. Real estate revenuesgrew 3.8%, to ¥20,977 million (US$ 197.2 million). Theothers segment, which includes warehousing, air cargotransportation, information services and travel agencyrevenues, edged down 1.0% to ¥139,396 million(US$1,310.7 million). The above sales by segmentfigures include intersegment sales of ¥19,297 million(US$ 181.4 million).
Total cost and expenses increased by 1.7% to¥759,034 million (US$7,137.1 million). The ratio of costsand expenses to total revenues improved 0.9 per-centage point to 85.1%. Selling, general and administra-tive (SG&A) expenses rose 10.8% to ¥97,760 million(US$919.2 million), while the ratio of SG&A expenses tototal revenues increased 0.8 percentage point to 11.0%.
Operating income advanced 6.0% to ¥34,935 million(US$328.5 million). By business segment, operatingincome from shipping climbed 16.6% to ¥28,881 million(US$271.6 million). Operating income from oil wholesal-ing fell 93.6% to ¥25 million (US$0.2 million). Operatingincome from real estate declined 6.9% to ¥4,329 million(US$40.7 million) and operating income from the otherssegment decreased 60.9% to ¥1,594 million (US$15.0million). Total operating income reflects intersegmentelimination and unallocation of ¥106 million (US$1.0million).
The cruise ship AsukaThe cruise ship Crystal Sympony

17
Total other expenses declined 8.0% to ¥16,519million (US$155.3 million), as an increase in otherincome, net, principally interest and dividend income,offset higher interest expenses. Income before incometaxes and special items rose 22.7% to ¥18,416 million(US$173.2 million). However, after total special lossesof ¥7,512 million (US$70.6 million), income beforeincome taxes declined 13.0% to ¥10,904 million(US$102.5 million). Income taxes increased just 1.4% to¥9,338 million (US$87.8 million), and net incomeadvanced 5.9% to ¥3,334 million (US$31.4 million). Netincome per share was ¥2.84 (US$0.027).
(¥ Millions)
1996 1995 1994Total revenues .................. ¥891,729 ¥867,711 ¥857,842Total costs and expenses .. 759,034 746,489 745,416Operating income ............ 34,935 32,971 20,251Net income ....................... 3,334 3,147 6,097
Analysis of Liquidity and Financial Condition
As of March 31, 1996, total assets were ¥1,403,289million (US$13,195.0 million), an increase of 2.9% fromthe previous fiscal year. Total current assets grew by3.1% to ¥373,910 million (US$3,515.8 million), while
total current liabilities increased 3.9% to ¥463,975million (US$4,362.7 million). The current ratio re-mained unchanged at 0.81.
1996 1995 1994
Current ratio ................. 0.81 0.81 1.00
Consolidated capital investment was ¥50,137 million(US$471.4 million), with 90.8% allocated to the shippingsegment. Depreciation and amortization was ¥53,266million (US$500.9 million).
Total vessels, property and equipment, net of depre-ciation, rose 7.5% to ¥636,385 million (US$5,983.9 mil-lion). Total liabilities increased 3.6% to ¥1,175,535 million(US$11,053.5 million). Total stockholders’ equity edgeddown 0.2% to ¥227,754 million (US$2,141.6 million). Theratio of stockholders’ equity to total assets decreasedfrom 16.7% to 16.2%. Stockholders’ equity per share was¥193.94 (US$1.824) at March 31, 1996.
(¥ Millions)
1996 1995 1994Total assets (A) ............... ¥1,403,289 ¥1,363,447 ¥1,276,437Stockholders’ equity (B) .. 227,754 228,233 229,680Equity ratio (B/A) (%) ...... 16.2 16.7 18.0

18
Six-Year Summary (Non-consolidated)NIPPON YUSEN KABUSHIKI KAISHAYears ended 31st March ¥ Million
1996 1995 1994 1993 1992 1991
For the year:Vessel and voyage revenues and other
operating revenues ................................... ¥ 521,386 ¥ 517,536 ¥ 531,194 ¥ 575,568 ¥ 569,052 ¥ 532,705Vessel and voyage expenses and other
operating expenses ................................... 467,932 469,016 487,485 514,622 508,916 475,760General and administrative expenses ........... 34,971 35,191 37,203 40,363 40,877 38,917
Operating income ..................................... 18,483 13,329 6,506 20,583 19,259 18,027Other (income) and expenses ...................... 4,219 4,853 475 6,802 5,119 3,501
Income before income taxes andspecial items .......................................... 14,264 8,476 6,031 13,781 14,140 14,526
Special items (losses) .................................... (5,663) 1,044 777 581 (2,471) (31)Income before income taxes .................... 8,601 9,520 6,808 14,362 11,699 14,494
Income taxes ................................................. 6,004 7,044 1,413 6,676 5,142 9,346Net income ................................................ 2,597 2,476 5,395 7,686 6,527 5,148
At year’s end:Current assets ................................................ ¥ 154,958 ¥ 130,791 ¥ 161,049 ¥ 172,368 ¥ 205,607 ¥ 217,732Current liabilities ........................................... 213,626 201,542 165,906 229,926 193,322 220,688Vessels, property and equipment, net of
depreciation .............................................. 223,590 218,443 240,422 251,947 236,986 233,693Total assets .................................................... 737,625 718,969 767,720 785,411 805,612 805,144Long-term debt ............................................. 289,447 279,039 369,506 318,881 376,842 352,558Stockholders’ equity ...................................... 223,898 225,953 219,823 218,985 215,990 212,161Retained earnings ......................................... 60,241 62,390 64,601 63,908 60,932 59,076
Per 100 shares of common stock (¥) :Income before income taxes and special
items .......................................................... ¥ 1,215 ¥ 728 ¥ 521 ¥ 1,190 ¥ 1,221 ¥ 1,267Net income ................................................... 221 213 466 664 567 449Stockholders’ equity ...................................... 19,066 19,245 18,980 18,914 18,656 18,484Dividends ...................................................... 400 400 400 400 400 400Earnings per 100 shares are calculated on a weighted average basis, but not adjusted for free distribution of common stock.

19
Non-consolidated Statements of IncomeNIPPON YUSEN KABUSHIKI KAISHAYears ended 31st March, 1996 and 1995 ¥ Million US$ Thousand
1996 1995 1996
Vessel and voyage revenue .............................................................................................. ¥512,521 ¥507,599 $4,819,192Other operating revenues ............................................................................................... 8,865 9,937 83,360
Toal revenue ......................................................................................................... 521,386 517,536 4,902,552
Vessel and voyage expenses (notes 10 and 11):Depreciation of vessels ................................................................................................. 12,942 12,967 121,690Other vessel and voyage expenses ............................................................................... 450,393 451,015 4,235,009
Total vessel and voyage expenses ........................................................................ 463,335 463,982 4,356,699
Other operating expenses .............................................................................................. 4,597 5,034 43,234
Gross profit ......................................................................................................... 53,454 48,520 502,619General and administrative expenses (notes 10 and 11) .................................................. 34,971 35,191 328,828
Operating income ............................................................................................... 18,483 13,329 173,791
Other (income) and expenses (notes 11 and 12):Interest expenses ...................................................................................................... 16,962 18,720 159,489Other, principally interest received and dividend income ....................................... (12,743) (13,867) (119,821)
Total other (income) and expenses ...................................................................... 4,219 4,853 39,668
Income before income taxes and special items ................................................... 14,264 8,476 134,123
Special items (note 11):Gains (losses) on disposal of vessels, property and equipment, and investment
seurities . ................................................................................................................... 2,645 2,216 24,871Other items, net gains (losses) ...................................................................................... (8,308) ( 1,172) ( 78,117)
Total special items (losses) .................................................................................... (5,663) 1,044 (53,246)
Income before income taxes ............................................................................... 8,601 9,520 80,877Income taxes (note 4) ....................................................................................................... 6,004 7,044 56,461
Net income ......................................................................................................... ¥ 2,597 ¥ 2,476 $ 24,416
¥ US$
Net income per share .................................................................................................... ¥ 2.21 ¥ 2.13 $ 0.021The accompanying notes are an integral part of this statement.

20
Non-consolidated Balance SheetsNIPPON YUSEN KABUSHIKI KAISHAAs at 31st March, 1996 and 1995 ¥Million US$ Thousand
ASSETS 1996 1995 1996
Current assets:Cash .......................................................................................................................... ¥ 8,971 ¥ 10,693 $ 84,355Time deposits ............................................................................................................ 27,986 - 263,158Marketable securities (note 16) ................................................................................. 30,483 33,272 286,626Notes and accounts receivable - trade (note 11) .................................................... 33,595 30,772 315,890Allowance for doubtful accounts .............................................................................. (361) (603) (3,397)Inventories ................................................................................................................. 5,421 5,032 50,970Deferred vessel and voyage expenses (note 11) ...................................................... 13,960 14,474 131,271Receivables from overseas agencies (note 11) ......................................................... 7,504 6,478 70,558Other receivables (note 11) ...................................................................................... 23,111 24,319 217,310Other current assets (note 11) ................................................................................... 4,288 6,354 40,317
Total current assets ........................................................................................... 154,958 130,791 1,457,058
Investments and long-term receivables:Investments in and advances to subsidiaries and affiliates, at cost (notes 13
and 16) ................................................................................................................... 109,989 116,924 1,034,218Investments in other securities (note 16) .................................................................. 119,803 113,739 1,126,496Loans to employees .................................................................................................. 2,711 3,198 25,491Other loans receivable (note 13) .............................................................................. 603 85 5,670Insured pension funds and endowment ................................................................... 104,265 98,788 980,394Other investments and long-term receivables, at cost (notes 11 and 13) ................ 20,610 34,954 193,790Allowance for doubtful accounts .............................................................................. (856) (224) (8,047)
Total investments and long-term receivables ................................................... 357,125 367,464 3,358,012
Vessels, property and equipment, at cost (notes 3 and 6):Vessels ....................................................................................................................... 326,316 325,822 3,068,325Equipment ................................................................................................................. 21,714 22,869 204,173Buildings .................................................................................................................... 55,361 53,700 520,555
403,391 402,391 3,793,053Less accumulated depreciation ................................................................................. 243,776 236,590 2,292,205
159,615 165,801 1,500,848Land .......................................................................................................................... 40,555 38,563 381,342Vessels and equipment under construction .............................................................. 23,420 14 ,079 220,215
Total vessels, property and equipment ............................................................ 223,590 218,443 2,102,405
Deferred assets .............................................................................................................. 215 416 2,021
Other assets ................................................................................................................... 1,737 1,855 16,328
Total assets ...................................................................................................... ¥ 737,625 ¥ 718,969 $ 6,935,824The accompanying notes are an integral part of this statement.

21
¥ Million US$ Thousand
LIABILITIES AND STOCKHOLDERS’ EQUITY 1996 1995 1996
Current liabilitie:Short-term bank loans (note 3) .................................................................................. ¥ 52,982 ¥ 51,552 $ 498,183Current portion of long-term debt (note 3) ............................................................... 84,291 63,638 792,587Notes and accounts payable (note 11) ....................................................................... 39,976 38,269 375,890Income taxes payable ................................................................................................. 3,550 5,629 33,382Freight received for uncompleted voyages (note 11) ................................................ 20,245 21,471 190,363Employees’ bonuses accrued ..................................................................................... 2,400 2,609 22,567Other current liabilities (notes 11 and 12) ................................................................. 10,182 18,374 95,739
Total current liabilities ........................................................................................ 213,626 201,542 2,008,711
Long-term debt (notes 3, 11, 12 and 13) ........................................................................ 289,447 279,039 2,721,647
Employees’ severance indemnities accrued (note 5) ...................................................... 10,290 10,662 96,750
Periodical overhaul of vessels accrued ........................................................................... 364 1,773 3,421
Total liabilities ..................................................................................................... 513,727 493,016 4,830,529
Commitments and contingent liabilities (notes 7 and 9)
Stockholders’ equity:Common stock, par value ¥50 per shareauthorized 3,000,000,000 shares, issued and outstanding 1,174,334,405
shares in 1996 and 1,174,085,410 shares in 1995 ................................................... 79,643 79,606 748,880Additional paid-in capital ........................................................................................... 84,014 83,957 789,976Retained earnings:
Appropriated for legal reserve (note 8) .................................................................. 9,542 9,067 89,723Appropriated for general reserve (notes 8 and 9) .................................................. 27,794 27,494 261,345Appropriated for special reserve (note 8) .............................................................. 20,301 23,351 190,883Unappropriated (notes 8 and 15) ........................................................................... 2,604 2,478 24,488
Total stockholders’ equity ................................................................................... 223,898 225,953 2,105,295
Total liabilities and stockholders’ equity ............................................................. ¥737,625 ¥718,969 $6,935,824
¥ US$
Stockholders’ equity per share ....................................................................................... ¥ 190.66 ¥ 192.45 $ 1.793
22
Non-consolidated Statements of Stockholders’ EquityNIPPON YUSEN KABUSHIKI KAISHAYears ended 31st March, 1996 and 1995
¥ MillionNumber ofshares of Additional
common stock Common paid-in Legal Special Retainedin thousands stock capital reserve reserve earnings
Balance at 31st March, 1994 .................................................. 1,158,169 ¥75,431 ¥79,791 ¥8,598 ¥23,453 ¥32,550Net inome for the year .................................................... 2,476Cash dividends ................................................................. (4,632)Directors’ bonuses ........................................................... (55)Appropriations for legal reserve and special reserve ...... 469 (102) (367)Shares issued on conversion of convertible bonds and
on exercise of warrants ................................................ 15,916 4,175 4,166
Balance at 31st March 1995 .................................................. 1,174,085 ¥79,606 ¥83,957 ¥9,067 ¥23,351 ¥29,972Net inome for the year .................................................... 2,597Cash dividends ................................................................. (4,697)Directors’ bonuses ........................................................... (50)Appropriations for legal reserve and special reserve ...... 475 (3,050) 2,576Shares issued on conversion of convertible bonds and
on exercise of warrants ................................................ 249 37 57
Balance at 31st March, 1996 .................................................. 1,174,334 ¥79,643 ¥84,014 ¥9,542 ¥20,301 ¥30,398
US$ Thousand
Number ofshares of Additional
common stock Common paid-in Legal Special Retainedin thousands stock capital reserve reserve earnings
Balance at 31st March, 1994 .................................................. 1,158,169 $709,268 $750,266 $80,846 $220,528 $306,069Net inome for the year .................................................... 23,286Cash dividends ................................................................. (43,561)Directors’ bonuses ........................................................... (517)Appropriations for legal reserve and special reserve ...... 4,410 (956) (3,454)Shares issued on conversion of convertible bonds and
on exercise exercise of warrants .................................. 15,916 39,263 39, 176
Balance at 31st March, 1995 .................................................. 1,174,085 $748,531 $789,442 $85,256 $219,572 $281,823Net inome for the year .................................................... 24,416Cash dividends ................................................................. (44,159)Directors’ bonuses ........................................................... (470)Appropriations for legal reserve and special reserve ...... 4,467 (28,689) 24,222Shares issued on conversion of convertible bonds and
on execise of warrants ................................................. 249 349 534
Balance at 31st March, 1996 .................................................. 1,174,334 $748,880 $789,976 $89,723 $ 190,883 $285,832The accompanying notes are an integral part of this statement.

23
NIPPON YUSEN KABUSHIKI KAISHA
1. Summary of Significant Accounting Policies:
A. Basis of presenting financial statementsThe accompanying financial statements are an Englishtranslation of the non-consolidated financial statementsmade public for filing with the Ministry of Finance andthe Stock Exchanges in Japan. The original financialstatements, which are prepared in accordance with gener-ally accepted accounting principles in Japan, include theaccounts of Nippon Yusen Kabushiki Kaisha (the “Com-pany”) only. Investments in the common stock of allsubsidiaries and affiliates are accounted for by the costmethod.
In the English translation, certain account reclassifica-tions are made, and additional information is provided inorder to present the financial statements in a formatfamiliar to the international readers. The results of thesereclassifications do not affect the financial position orresults of operation of the Company as reported in theoriginal financial statements.
B. Marketable and investment securitiesListed marketable and investment securities are stated atthe lower of cost or market on an individual investmentbasis, with cost determined by the moving averagemethod. Investments in unlisted securities and in subsid-iaries are stated generally at cost, with cost determined bythe moving average method. If there is a permanentdecline in value of the underlying net assets, such invest-ments are adjusted to estimated net realizable value.
C. Money in trustsMoney in trusts (mostly marketable securities) are stated atcost, which is determined on a “basket basis” (similar to aportfolio basis by each contract).
D. InventoriesFuel is stated at the lower of cost or market, with costdetermined by the moving average method. Supplies andstores are stated at cost, determined by the first-in, first-out method.
E. Depreciation and amortization(1) Vessels, property and equipmentVessels and buildings are depreciated by the straight-linemethod, other tangible fixed assets are depreciated by thedeclining-balance method. Estimated useful lives of theseassets are as follows:
Years
Tankers ......................................................................... 13Oher vessels .................................................................. 15Containers ..................................................................... 7Buildings ....................................................................... 2 to 65Equipment .................................................................... 2 to 60
(2) Other assetsOther assets consist of lease of land and other intangiblefixed assets. Lease of land is an unamortizable asset.Intangible fixed assets are amortized by the straight-linemethod over periods prescribed by the Japanese law.(3) Deferred assetsTotal issuance expenses for bonds which the Companyissued during the year ended March 31, 1996 were capital-ized and amortized over three years based on the straight-line method. Experimental and research expense arecharged to income as incurred.(4) Capitalization policyAll significant renewals and additions are capitalized.
Maintenance and repairs, including minor renewals andimprovements, are charged to income as incurred.
Remuneration and travelling expenses of seamenassigned to vessels before completion of construction arecapitalized as part of the cost of the vessels and depreci-ated over the estimated life of the vessels.
Interest expenses are generally charged to income asincurred. However, interest costs incurred during con-struction of certain assets, including project of vesselswhich requires substantial period of time and significantcosts, are capitalized and included in the costs of theassets. Such capitalized interest amounted to ¥903 million($8,489 thousand) for the current year.
F. Provisions(1) Allowance for doubtful accountsThe allowance for doubtful accounts is provided at anestimated amount of probable loss of bad debts plus themaximum amount which could be charged to incomeunder the Japanese Corporation Tax Law.(2) Employees’ bonuses accruedEmployees’ bonuses accrued are provided for the futurepayment of employees’ bonuses which is accrued over thecorrespondent period of their service to the extent they aretax-deductible.
Notes to Non-consolidated Financial Statements

24
(3) Employees’ severance indemnities accrued and pensionplan
Employees of the Company, excluding directors andstatutory auditors, with more than three years of serviceare entitled to receive a lump-sum payment upon sever-ance of employment or retirement. In all cases, theamount paid is determined according to whether thetermination is voluntary or involuntary, length of serviceand rate of pay at the time of termination.
Employees’ severance indemnities accrued are provided tothe extent of 40 per cent of the amount which would berequired if all employees terminated their employmentvoluntarily as of the balance sheet date. The cost of theseverance indemnity is not funded.
The Company also has a qualified pension plan whichcovers 95 per cent of the retirement allowance, for theemployees retiring at the age of 50 or more. The cost of thepension plan is funded. Prior service costs to be funded areamortized by the declining-balance method at the annual rateof 30 per cent.(4) Periodical overhaul of vessels accruedPeriodical overhaul of vessels accrued is provided for thepayment of the estimated future costs of overhaul whichis required periodically, charging to income on astraight-line basis over the periods to the date of theanticipated overhaul.
G. Income taxesIncome taxes are provided on the accrual basis.
Interperiod tax allocations are not made for timingdifferences in recognizing income or expenses for tax andfinancial reporting purposes. (See note 4.)
H. Freight revenues and expenses recognitionFreight revenues and related direct voyage expenses of allvessels are recognized by the completed-round-voyagemethod under which these items and the resulting profits(losses) are recognized on the completion of the voyage.Freight revenues and related direct voyage expenses for thevoyages uncompleted at the end of a fiscal period aredeferred in the balance sheet under the accounts “Freightreceived for uncompleted voyages” and “Deferred vesseland voyage expenses,” respectively.
Expenses in respect of vessels, and charterage forbareboat and time charter agreements, except forcharterage for short period time charter agreements, arecharged to income as incurred.
I. Translation of foreign currenciesShort-term foreign monetary items are translated into yenat the exchange rate in effect at the balance sheet date.Long-term foreign monetary items, property and
equipment in foreign countries, and relaed depreciationare translated at the historical rates. Revenues and ex-penses originating in foreign currency transactions aretranslated at rates which approximate the rates prevailingat the time of transactions.
Gains and losses arising from foreign currency transla-tions are included in the determination of net income.
J. Deferred exchange differencesBonds and notes denominated in foreign currencies, andhedged by forward exchange contracts are translated intoJapanese yen at the contracted exchange rates.
The exchange differences in translating bonds and notesat the historical rates and the contracted rates are recog-nized as income over the period from the date of theforward exchange contract to the maturity date on thestraight-line basis.
K. Net income per shareNet income per share is computed based on the weightedaverage number of shares of common stock outstandingduring the year.
L. Special reservesSpecial reserves represent the aggregate of reserves re-corded in the books under the Special Taxation MeasuresLaw of Japan. Japanese tax law requires retained earningsbe appropriated for such reserves so that they are deduct-ible for tax purposes.
These reserves must be added to taxable income infuture years.
M. Accounting for price changesProcedures to reflect the impact on financial statements ofeither specific price changes or changes in the general levelof prices are not required in Japan.
N. Consumption taxIn Japan, the consumption tax law imposes a consumptiontax at the flat rate of 3 per cent on all domestic consump-tion of goods and services (with certain exemptions).
The Company has adopted an accounting method underwhich the consumption tax does not primarily affect netincome.

25
2. United States Dollar Amounts:
The Company maintains its accounting records in Japaneseyen. The dollar amounts included in the accompanyingfinancial statements represent the arithmetical results oftranslating yen to dollars on a basis of ¥106.35 to US$1,the rate of exchange at 31st March, 1996. The inclusion
¥ Million US$ Thousand
Loans from Japan Development Bank at interest rates ranging from 3.25 per cent to 7.5 per cent due from 1996 to 2010 .................................................................................................................... ¥ 87,224 $ 820,164Loans from other banks and financial institutions at interest rates ranging from 0.1243 per cent to 9.02 per cent due from 1996 to 2031 .......................................................................................... 120,744 1,135,3485.3 per cent Convertible Mortgage Bonds, due on 30th September, 1996 (Conversion price ¥290.40) ................................................................................................................................................... 690 6,4882.1 per cent Convertible Bonds, due on 29th March, 2002 (Conversion price ¥461.50) ......................... 57 5365.3 per cent Mortgage Bonds due on 25th January, 2000 ........................................................................ 2,000 18,8061.125 per cent Swiss Franc Notes due 1996 with warrants (Subscription price ¥1,189.00) ..................... 21,768 204,68310.0 per cent Dual Currency Yen/Australian Dollar Bonds due 1996 ..................................................... 20,000 188,0586.2 per cent Notes due 1997 ..................................................................................................................... 5,000 47,0151.7 per cent Convertible Bonds, due on 30th September, 1997 (Conversion price ¥525) ....................... 7,311 68,7452.0 per cent Convertible Bonds, due on 29th September, 2000 (Conversion price ¥525) ....................... 24,328 228,7541.875 per cent United States Dollar Notes due 1997 with warrants (Subscription price ¥525) ............... 11,679 109,8162.5 per cent Notes due on 22nd September, 2000 ................................................................................... 30,000 282,0872.75 per cent Notes due on 21st September, 2001 ................................................................................... 10,000 94,0293.00 per cent Notes due on 20th September, 2002 .................................................................................. 10,000 94,029Floating/fixed rate Euro Medium term notes due 2000 - 2003 ................................................................ 11,000 103,432Other long-term debt ................................................................................................................................ 11,937 112,244
373,738 3,514,234Less portion due within one year ............................................................................................................. 84,291 792,587
¥289,447 $2,721,647
3. Short-Term Borrowings and Long-Term Debt:
Short-term loans outstanding at 31st March, 1996, wererepresented generally by 30-day to 180-day notes issuedby the Company to banks and bear interest at annual ratesranging from 0.76563 to 6.22656 per cent. Substantiallyall of the loans are from banks which have general writtenagreements with the Company to the effect that, withrespect to all present or future loans from such banks, the
of such dollar amounts is solely for convenience, and is notintended to imply that the yen amounts have been orcould be readily converted, realized or settled in dollars at¥106.35 to US$1 or at any other rate.
Company shall provide collateral (including deposits withsuch banks), or guarantors therefor, immediately upon thebanks’ request and that any collateral furnished pursuantto such agreement or otherwise will be applicable to allindebtedness of the Company to such banks.
Long-term debt at 31st March, 1996, consisted of thefollowing:

26
At 31st March, 1996, the following assets were pledged ascollateral for certain short-term borrowings and long-termdebts:
Net Book Value
¥ Million US$ Thousand
Vessels ................................... ¥109,068 $1,025,556Buildings ................................ 5,073 47,704Land ....................................... 1,836 17,267Investment securities ............... 2,459 23,125
At 31st March, 1996, the aggregate annual maturities oflong-term loans from Japan Development Bank and otherbanks and financial institutions, exclusive of bonds and otherlong-term debt, were as follows:
Years ending 31st March, ¥ Million US$ Thousand
1997 ....................................... ¥ 36,834 $ 346,3431998 ....................................... 28,697 269,8311999 ....................................... 26,958 253,4842000 ....................................... 19,599 184,2872001 ....................................... 17,235 162,0642002 and after ........................ 78,646 739,502
¥ 207,969 $1,955,511
The number of shares issuable upon conversion of theconvertible bonds and exercise of the warrants are 62,764,304and 44,980,952, respectively.
4. Income Taxes:
The Company is subject to a number of different taxes,based on income, which in the aggregate indicate aneffective statutory tax rate of approximately 50 per cent forthe years ended 31st March, 1996 and 1995. Income taxesas shown in the accompanying Non-Consolidated State-ments of Income are different from the amount computedby applying the above-mentioned tax rate to income beforeincome taxes.
Such difference is primarily due to the following factors:(i) There is a reduction in the tax rate applicable to earn-ings paid out as dividends, and essentially no tax is leviedon domestic dividend income.
(ii) In the calculation of taxable income, undistributedprofits earned by some foreign subsidiaries located in thetax-haven countries are included in the Company’s grossincome in proportion to Company-owned shares.(iii) The enterprise tax which is levied at the approximaterate of 13 per cent on taxable income is charged to “Gen-eral and administrative expenses.”(iv) There are limits on certain types of deductions, such asexpenses for entertainment and donations.(v) In the calculation of taxable income, net appropriation(reversal) to appropriated retained earnings for specialreserve is deductible (additional). (See note 1 (L).)
Charges to income for employees’ severance indemnitiesaccrued for the years ended 31st March, 1996 and 1995were ¥1,253 million ($11,778 thousand) and ¥868 million($8,169 thousand), respectively. Pension costs for theyears ended 31st March, 1996 and 1995 were ¥703
million ($6,615 thousand) and ¥743 million ($6,988thousand), respectively. The funded balance of the pensionplan as at 30th September, 1995 was ¥26,495 million($249,129 thousand).
6. Deferred Capital Gains:
In accordance with corporation tax regulations and theopinion of the Japanese Institute of Certified PublicAccountants, a capital gain of ¥1,706 million ($16,045
thousand) mainly on insurance claims is deferred bydeducting it from the cost of the replaced property at 31stMarch, 1996.
5. Employees’ Severance Indemnities Accrued and Pension Plan:
27
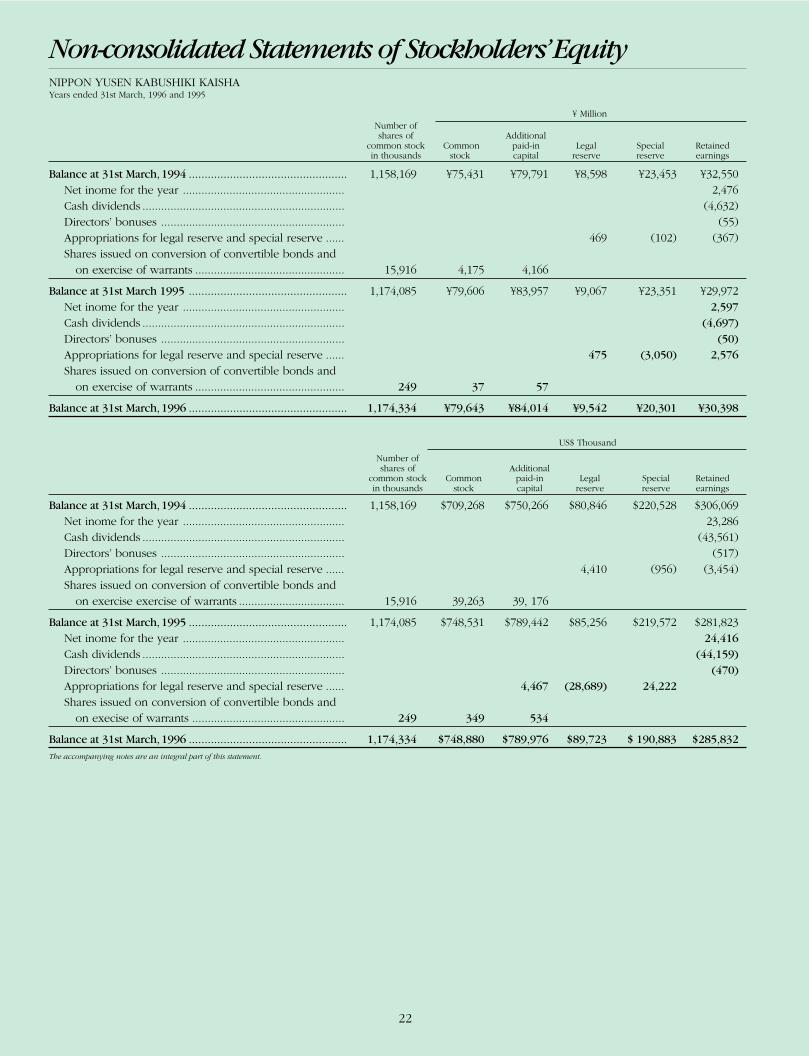
7. Commitments and Contingent Liabilities:
At 31st March, 1996, the Company had outstandingpurchase commitments for the construction of vesselsaggregating ¥69,402 million ($652,581 thousand).
At 31st March, 1996, the Company was contingentlyliable as a guarantor or a joint debtor of indebtedness of
subsidiaries, affiliates and others, amounting to ¥109,053million ($1,025,413 thousand).
At 31st March, 1996, the Company had no materiallitigation or claim outstanding, pending or threatenedagainst it.
8. Retained Earnings:
The Japanese Commercial Code provides that unappropri-ated retained earnings equivalent to at least 10 per cent ofcash dividends and directors’ bonuses paid by a companybe appropriated as a legal reserve until such reserve equals25 per cent of its capital stock. This legal reserve may beused to reduce a deficit upon approval of a general meetingof the stockholders, or transferred to capital stock uponapproval of the Board of Directors, but is not available forpayment of dividends.
The Board of Directors, with subsequent approval of thestockholders, has made annual appropriations of retainedearnings as a general reserve. Its disposition is at the
discretion of the Board of Directors, subject to stockhold-ers’ approval.
Special reserves represent appropriations of retainedearnings required in order to qualify for favorable treat-ment under the Japanese tax law.
In Japan, dividends proposed by the Board of Directorsout of earnings accumulated as of the end of a year areapproved at the general stockholders’ meeting In thefollowing year. In the accompanying financial statements,dividends are shown as a reduction of retained earnings inthe year approved and paid.
9. Government Subsidy and Interest Expense:
Under a Japanese government shipbuilding program,interest payable on long-term bank loans obtained pursu-ant to certain loan agreements for the construction ofocean-going vessels is subsidized at rates which range from1.8 per cent to 3.5 per cent per annum and apply from theinitial drawdown of a subsidized loan until 8 years afterdelivery of the vessel in question. Interest subsidies aresubject to repayment if, in the 15 years following the dateof a subsidized loan agreement, the recipient company hasnon-consolidated net income in any year in excess of 13per cent of its issued share capital. The amount of thesubsidy to be repaid is determined according to a slidingscale ranging up to 75 per cent of any net income in
excess of 18 per cent of the issued share capital. Netincome is determined for this purpose after reserve for,among others, special reserves which the Special TaxationMeasures Law of Japan permits to be deducted. In the caseof ocean-going vessels specified by cabinet order, compa-nies have been permitted to transfer from income to“Vessel construction reserve” an amount up to an annualmaximum of 10 per cent of their capital stock andamounts so transferred are not treated as net income forthe purposes of calculating subsidy repayments. Changesof subsidies during the year ended 31st March, 1996, wereas follows:
¥ Million US$ Thousand
Balance at 31st March, 1995 ................................................................................................................. ¥15,244 $143,342Amount accrued ............................................................................................................................. 485 4,558Amount decreased by prescription ................................................................................................ 8,323 78,258
Balance at 31st March, 1996 ............................................................................................................... ¥ 7,406 $ 69,642

28
10. Depreciation:
The amounts of depreciation of vessels and other property and equipment allocated for the two years ended 31st March,1996 and 1995 were as follows:
¥ Million US$ Thousand
1996 1995 1996 1995
Vessels (vessel and voyage expenses) ................................................................ ¥12,942 ¥12,968 $121,690 $121,935Other property and equipment (general and administrative expenses and other operating expenses) ................................................................................ 2,298 2,374 21,607 22,326
¥15,240 ¥15,342 $143,297 $144,261
11. Transactions and Balances with Subsidiaries and Affiliates:
Transactions and balances with subsidiaries and affiliates for the year ended 31st March, 1996 were as follows:
¥ Million US$ Thousand
Vessel and voyage expenses and general and administrative expenses........................................ ¥150,669 $1,416,724Other income .................................................................................................................................. 2,289 21,527Special items (gains) ....................................................................................................................... (861) (8,092)Receivables other than investments in and advances to subsidiaries and affiliates ....................... 14,873 139,854Payables .......................................................................................................................................... 6,669 62,707
12. Deferred Exchange Differences:
Deferred exchange differences arising from translatingbonds and notes at the forward contracted exchange rates
were credited to income and deferred as follows for the year ended 31st March, 1996.
¥ Million US$ Thousand
Other income (credited) ................................................................................................................. ¥166 $1,564Other current liabilities (deferred) .................................................................................................. 125 1,173

29
13. Long-Term Receivables and Debt in Foreign Currencies:
A comparison of the yen amounts stated in the BalanceSheet at 31st March, 1996, for these items with the yen
amounts which would have resulted from translating themat the applicable current year-end rate is as follows:
(1) Long-term receivables in foreign currencies ¥ Million
Yen amount stated on Balance Sheet .......................................................................................................................................... ¥4,072Yen amount translated at the applicable year-end rate ............................................................................................................... 3,337
(2) Long-term debt in foreign currencies ¥ Million
Yen amount stated on Balance Sheet ......................................................................................................................................... ¥28,361Yen amount translated at the applicable year-end rate .............................................................................................................. 27,375
14. Accounting for Leases:
Finance leases other than those which are deemed totransfer the ownership of the leased assets to lessees areaccounted for by the method similar to that applicable to
ordinary operating leases. Lease payments at 31st March,1996 and 1995 were ¥4,516 million ($42,467 thousand)and ¥4,227 million ($39,748 thousand), respectively.
15. Subsequent Event:
Subsequent appropriation of retained earningsThe following plan of appropriation of retained earningsfor the year ended 31st March,1996, was approved by thegeneral meeting of stockholders held on 27th June,1996.
The future payments of the above mentioned finance leasesat 31st March, 1996 were ¥19,357 million ($182,008thousand). The future payments of the operating leases at31st March, 1996 were ¥12,425 million ($116,832thousand).
¥ Million US$ Thousand
Opening balance .................................................................................................................................. ¥2,604 $24,488Add :
Transfer from special reserve ........................................................................................................... 3,788 35,62lDeduct :
Cash dividends ................................................................................................................................. 4,697 44,169Transfer to legal reserve ................................................................................................................... 475 4,466Directors’ bonuses ............................................................................................................................ 50 470Transfer to general reserve .............................................................................................................. 340 3,197Transfer to special reserve ............................................................................................................... 822 7,736
Closing balance ..................................................................................................................................... ¥ 8 $ 7l

30
16. Investments and Marketable Securities (Unaudited):
At 31st March, 1996, the aggregate cost and market valueof the current and non-current portfolios of marketablesecurities (included in “Marketable securities,” “Invest-ments in and advances to subsidiaries and affiliates” and
“Investments in other securities,” respectively) were asfollows:
¥ Million US$ Thousand
Current:Cost .................................................................................................................................................... ¥ 26,741 $ 251,444Market value ...................................................................................................................................... 75,131 706,449Unrealized gains ................................................................................................................................ 48,390 455,005
Non-current:Cost .................................................................................................................................................... 109,754 1,032,004Market value ...................................................................................................................................... 351,520 3,305,311Unrealized gains ................................................................................................................................ 241,766 2,273,307
Unrealized gains total .............................................................................................................................. ¥290,156 $2,728,312

31
Report of Independent Certified Public Accountants
31

32
NIPPON YUSEN KABUSHIKI KAISHA AND SUBSIDIARIESYears ended 31st March ¥ Million
1996 1995 1994 1993 1992 1991
For the year :Revenues ........................................................ ¥ 891,729 ¥ 867,711 ¥ 857,842 ¥ 896,676 ¥ 888,707 ¥ 842,482Costs and expenses ....................................... 759,034 746,489 745,416 759,875 758,573 728,085Selling, general and administrative
expenses ..................................................... 97,760 88,251 92,175 99,400 96,373 85,249Operating income ................................... 34,935 32,971 20,251 37,401 33,761 29,147
Other (income) and expenses ....................... 16,519 17,957 14,637 21,681 20,545 13,754Income before income taxes and special
items ....................................................... 18,416 15,014 5,614 15,719 13,216 15,393Special items (losses) ..................................... (7,512) (2,484) 3,102 (575) (2,218) 1,004
Income before income taxes ..................... 10,904 12,530 8,716 15,144 10,997 16,397Income taxes .................................................. 9,338 9,207 2,876 8,562 7,678 11,825Minority interest (credit) ................................ (606) 403 (102) (132) 129 (78)Amortization of unallocated excess of
cost over stockholders’ equity atacquisition (credit) ..................................... 256 314 5 291 274 395
Net income accounted for by equitymethod (credit) .......................................... (1,418) (541) (160) (1,008) (3,618) (2,022)
Net income ............................................. 3,334 3,147 6,097 7,431 6,535 6,277
At year’s end :Current assets ................................................. ¥ 373,910 ¥ 362,561 ¥ 388,599 ¥ 393,281 ¥ 446,387 ¥ 530,708Current liabilities ............................................ 463,975 446,764 387,651 470,617 393,446 479,226Vessels, property and equipment, net of
depreciation ............................................... 636,385 592,028 499,505 479,615 456,781 382,242Total assets ..................................................... 1,403,289 1,363,447 1,276,437 1,261,924 1,269,418 1,271,970Long-term debt .............................................. 681,980 656,185 628,365 523,945 608,936 530,368Stockholders’ equity ....................................... 227,754 228,233 229,680 231,557 229,877 227,734Retained earnings .......................................... 64,100 64,672 74,463 76,482 74,820 67,159
Per 100 shares of common stock (¥):Income before income taxes and special
items ........................................................... ¥ 1,568 ¥ 1,290 ¥ 485 ¥ 1,357 ¥ 1,141 ¥ 1,342Net income .................................................... 284 270 527 642 566 547Stockholders’ equity ....................................... 19,394 19,439 19,851 20,000 19,856 19,840Dividends ....................................................... 400 400 400 400 400 400Earnings per 100 shares are calculated on a weighted average basis, but not adjusted for free distribution of common stock.
Six-Year Summary (Consolidated)

33
Consolidated Statements of Income and Retained EarningsNIPPON YUSEN KABUSHIKI KAISHA AND SUBSIDIARIESYears ended 31st March, 1996 and 1995 ¥ Million US$ Thousand
1996 1995 1996
Revenues:Vessel and voyage revenues and other revenues ........................................................ ¥759,377 ¥ 717,583 $7,140,361Net sales ....................................................................................................................... 132,352 150,128 l,244,494
Total revenues ...................................................................................................... 891,729 867,711l 8,384,855
Cost and expenses:Vessel and voyage expenses and other expenses ....................................................... 630,794 603,242 5,931,305Cost of sales ................................................................................................................. 128,240 143,247 1,205,832
Total cost and expenses ....................................................................................... 759,034 746,489 7,137,137
Gross profit ......................................................................................................... 132,695 121,222 1,247,718Selling, general and administrative expenses ................................................................... 97,760 88,251 919,227
Operating income ............................................................................................... 34,935 32,971 328,491
Other (income) and expenses:Interest expenses ......................................................................................................... 36,035 33,864 338,838Others, net, principally interest and dividend income ................................................ (19,516) (15 ,907) (183,511)
Total other (income) and expenses ...................................................................... 16,519 17,957 155,327
Income before income taxes and special items ................................................... 18,416 15,014 173,164Special items:
Gains (losses) on disposal of vessels, property and equipment and investmentsecurities ..................................................................................................................... 2,820 927 26,518
Others, net (losses) ...................................................................................................... (10,332) (3,411) (97,152)
Total special items (losses) ................................................................................... (7,512) (2,484) (70,634)
Income before income taxes ............................................................................... 10,904 12,530 102,530Income taxes .................................................................................................................. 9,338 9,207 87,806Minority interest (credit) ................................................................................................... (606) 403 (5,699)Amortization of unallocated excess of cost over stockholders’ equity
at acquisition (credit) ................................................................................................... 256 314 2,409Net income accounted for by equity method (credit) ...................................................... (1,418) (541) (13,338)
Net income ......................................................................................................... ¥ 3,334 ¥ 3,147 $ 31,352
Retained earnings:Balance at beginning of year ....................................................................................... ¥ 55,153 ¥ 65,454 $ 518,603Increase:
Due to increase of consolidated subsidiaries ......................................................... 2,030 4,650 19,089Due to decrease of consolidated subsidiaries ........................................................ 1,027 - 9,655Due to increase of equity consolidated subsidiaries and affiliates ......................... 2,115 1,807 19,891Due to decrease of equity consolidated subsidiaries and affiliates ........................ 9 - 82
Decrease:Transfer to legal reserve .......................................................................................... 486 483 4,569Cash dividends ........................................................................................................ 4,696 4,632 44,159Directors’ bonuses ................................................................................................... 209 252 1,967Due to increase of consolidated subsidiaries ......................................................... 3,727 12,350 35,044Due to increase of equity consolidated subsidiaries and affiliates ......................... 96 2,449 904
4,033 13,709 37,926Net income ..................................................................................................................... 3,334 3,147 31,352Foreign statements translation adjustments (credit) .......................................................... 362 (261) 3,404
Balance at end of year ......................................................................................... ¥ 54,092 ¥ 55,153 $ 508,625
¥ US$
Net income per share ..................................................................................................... ¥ 2.84 ¥ 2.70 $ 0.027
The accompanying notes to consolidated and non-consolidated financial statements are an integral part of this statement.

34
Consolidated Balance SheetsNIPPON YUSEN KABUSHIKI KAISHA AND SUBSIDIARIESAs at 31st March, 1996 and 1995 ¥ Million US$ Thousand
ASSETS 1996 1995 1996
Current assets:Cash .............................................................................................................. ¥ 62,508 ¥ 30,872 $ 587,763Time deposits ................................................................................................ 18,048 47,145 169,701Marketable securities ...................................................................................... 103,379 109, 350 972,066Notes and accounts receivable - trade (notes 6 and 7) ................................... 101,012 99,177 949,807Allowance for doubtful accounts .................................................................... (876) (1,088) (8,242)Inventories, principally fuel and supplies ........................................................ 16,886 17,566 158,778Deferred vessel and voyage expenses ............................................................ 15,537 14,683 146,093Other current assets (note 7) .......................................................................... 57,416 44,856 539,878
Total current assets .................................................................................. 373,910 362,561 3,515,844
Investments and long-term receivables:Investments in securities (note 7) .................................................................... 226,569 215,943 2,130,413Long-term loans receivable (notes 7 and 8) ..................................................... 8,304 24,968 78,082Insured pension fund ..................................................................................... 103,118 97,842 969, 608Other long-term receivables, at cost (notes 7 and 8) ........................................ 39,364 49,049 370,141Allowance for doubtful accounts .................................................................... (720) (462) (6,778)
Total investments and long-term receivables ............................................ 376,635 387,340 3,541,466
Vessels, property and equipment, net of depreciation (notes 4 and 5):Vessels ........................................................................................................... 423,246 391,033 3,979,742Buildings and structures ................................................................................. 102,296 99,262 961,878Equipment and fixtures .................................................................................. 5,758 4,952 54,146Land .............................................................................................................. 57,184 55,175 537,700Construction in progress ................................................................................. 39,200 32,076 368,598Others ........................................................................................................... 8,701 9,530 81,819
Total vessels, property and equipment, net of depreciation ....................... 636,385 592,028 5,983,883
Other assets (note 3) ............................................................................................ 5,508 5,507 51,795
Foreign statements translation adjustments .......................................................... 10,523 15,330 98,946
Unallocated excess of cost over stockholders’ equity at acquisition ........................ 328 681 3,085
Total assets ............................................................................................ ¥1,403,289 ¥1,363,447 $13,195,009The accompanying notes to consolidated and non-consolidated financial statements are an integral part of this statement.

35
¥ Million US$ Thousand
LIABILITIES AND STOCKHOLDERS’ EQUITY 1996 1995 1996
Current liabilities:Short-term bank loans ..................................................................................... ¥ 230,364 ¥ 226,706 $ 2,166,093Notes and accounts payable (note 7) .............................................................. 93,881 90,367 882,758Income taxes payable ..................................................................................... 7,195 8,235 67,653Freight received for uncompleted voyages ...................................................... 20,964 22,523 197,124Employees’ bonuses accrued .......................................................................... 5,611 5,859 52,761Other current liabilities (note 7) ....................................................................... 105,960 93,074 996,332
Total current liabilities .............................................................................. 463,975 446,764 4,362,721
Long-term debt (notes 7 and 8) ............................................................................ 681,980 656,185 6,412,602
Employees’ severance indemnities accrued ........................................................... 19,322 19,854 181,682
Periodical overhaul of vessels accrued .................................................................. 905 2,526 8,510
Directors’ retirement benefits accrued .................................................................. 897 574 8,434
Minority interest ................................................................................................. 8,456 9,311 79,508
Total liabilities .......................................................................................... 1,175,535 1,135,214 11,053,457
Commitments and contingent liabilities (note 6)
Stockholders’ equity:Common stock, par value ¥50 per share
authorized 3,000,000,000 shares, issued and outstanding 1,174,334,405shares in 1996 and 1,174,085,410 shares in 1995 ....................................... 79,643 79,606 748,880
Additional paid-in capital ................................................................................ 84,014 83,957 789,976Retained earnings:
Legal reserve ............................................................................................... 10,008 9,518 94,102Other retained earnings ............................................................................... 54,092 55,154 508,626
227,757 228,235 2,141,584Treasury stock ..................................................................................................... (3) (2) (32)
Total stockholders’ equity ......................................................................... 227,754 228,233 2,141,552
Total liabilities and stockholders’ equity ..................................................... ¥ 1,403,289 ¥ 1,363,447 $ 13,195,009
¥ US$
Stockholders’ equity per share ............................................................................. ¥ 193.94 ¥ 194.39 $ 1.824

36
Notes to Consolidated Financial Statements
C. Accounting periodThe consolidated accounting period begins on 1st Apriland ends on 31st March of the following year.
The accounts of 79 subsidiaries are closed on 31stDecember each year. The accounts of 2 subsidiaries areclosed on 30th September each year. The account of 1subsidiary is closed on 31st January each year. The accountof 1 subsidiary is closed on 29th February each year.
As to the above companies, necessary adjustments onconsolidation are made.
D. Valuation of assetsInvestments in marketable and other securities, except forinvestments in subsidiaries and affiliates accounted for bythe equity method, are generally stated at the lower of costor market value on an individual investment basis, withcost determined by the moving average method. Money intrusts (mostly marketable securities) are stated at cost,which are determined on a “basket basis” (similar to aportfolio basis by each contract).
Inventories are generally stated at the lower of cost ormarket, with cost determined on a moving average basis.
E. Depreciation and amortization(1) Vessels and buildings are depreciated generally by thestraight-line method. Other tangible fixed assets aredepreciated generally by the declining-balance method.(2) Pre-operating costs of 2 subsidiaries, and organizationalcosts of 1 subsidiary are amortized by the straight-linemethod over the period of 5 years. Bond issuance expensesof the Company are amortized by the straight-line methodover the period of 3 years. Stock issuance expenses of 2subsidiaries are amortized by the straight-line method over
NIPPON YUSEN KABUSHIKI KAISHA AND SUBSIDIARIES
1. Basis of Presenting Consolidated Financial Statements:
The accompanying consolidated financial statements are anEnglish translation of the consolidated financial statementsprepared in accordance with generally accepted accountingprinciples in Japan, for filing with the Ministry of Financeand the Stock Exchanges in Japan.
In the English translation, certain account reclassifica-tions are made and additional information is provided inorder to present the consolidated financial statements in aformat familiar to the international readers. The results ofthese reclassifications do not affect the financial position orresults of operation of the consolidated companies asreported in the original consolidated financial statements.
2. United States Dollar Amounts:
The accompanying consolidated financial statements arestated in Japanese yen, and the dollar amounts representthe arithmetical results of translating yen to dollars on abasis of ¥106.35 to US$1, the rate of exchange at 31stMarch, 1996. The inclusion of such dollar amounts is
solely for convenience and is not intended to imply thatthe yen amounts have been or could be readily converted,realized or settled in dollars at ¥106.35 to US$1 or at anyother rate.
3. Consolidated Accounting Policies:
A. Scope of consolidation(1) The consolidated financial statements include theaccounts of the Company and the 195 major subsidiaries.In the year ended 31st March, 1996, 14 subsidiariesincluding Yusen Computer System Co., Ltd. have beennewly included in this consolidation as their effect on theconsolidated financial statements became material.(2) The accounts of the non-consolidated subsidiaries (161companies and 160 companies for the years ended 31stMarch, 1996 and 1995, respectively) of the Company werenot included in the financial statements, because of thefact that the aggregate assets, revenues and equity in netincome and surplus of these subsidiaries were minor forthe totals of the consolidated companies, respectively, andthe effect of exclusion from consolidation was not material.
B. The equity method(1) Investments in non-consolidated subsidiaries (1 com-pany and 3 companies for the years ended 31st March,1996 and 1995, respectively) and in affiliates, 20 per centto 50 per cent owned (34 companies and 28 companiesfor the years ended 31st March, 1996 and 1995), areaccounted for by the equity method.(2) The accounts of the non-consolidated subsidiaries (160companies and 157 companies for the years ended 31stMarch, 1996 and 1995, respectively) and affiliates (78companies and 90 companies for the years ended 31stMarch, 1996 and 1995, respectively) of the Company arestated at cost as they were not considered to be material.(3) The treatment of differences between the cost ofinvestments and underlying net assets is made in principleon the basis of step-by-step acquisitions and amortized ona straight-line basis over a period of five years.

37
3 years. Experimental and research expenses of 4 subsidiar-ies are amortized by the straight-line method over theperiod of 5 years.
F. ProvisionsEmployees’ bonuses accrued, periodical overhaul of vesselsaccrued, and allowance for doubtful accounts are providedat the equivalent amounts which are deductible underJapanese Income Tax Law to calculate taxable income.Employees’ severance indemnities accrued are providedprincipally to the extent of 40 per cent of the amountwhich would be required if all employees terminated theiremployment voluntarily as of the balance sheet date.
13 consolidated subsidiaries provided 100 per cent ofvested amount of their directors’ retirement benefits.
The Company and 21 consolidated subsidiaries alsohave a qualified pension plan covering the employeesretiring at certain ages of service.
G. Capitalization of interest expensesInterest expenses are generally charged to income asincurred. However, interest costs incurred during con-struction of certain assets, including project of vesselswhich requires substantial period of time and significantcosts, are capitalized and included in the costs of the assets.
H.Elimination of investments against stockholders’ equityThe elimination of the Company’s and its subsidiaries’investments against the relevant stockholders’ equity of itssubsidiaries is made in principle on the basis of step-by-step acquisitions.
The difference between the cost of investments insubsidiaries and the underlying net assets is carried for-ward as “Unallocated excess of stockholders’ equity overcost at acquisition” or “Unallocated excess of cost overstockholders’ equity at acquisition,” and amortized on astraight-line basis over a period of five years.
I. Elimination of intercompany profits and lossesOne hundred per cent of the intercompany profits andlosses contained in assets have been eliminated and allo-cated to the Minority Interest in proportion to the relevantequity held in the capital stock equity of the consolidatedsubsidiaries.
Intercompany profits and losses contained in the assetssubject to depreciation or amortization are realized by theamount of depreciation or amortization each year.
Intercompany profits and losses are also eliminatedunder the equity method.
J. Translation of foreign currency financial statementsAll the items, except for stockholders’ equity at theacquisition dates and intercompany transactions translatedat historical rates in the financial statements of consoli-dated foreign subsidiaries, and subsidiaries and affiliates
accounted for by the equity method, are translated intoyen at the applicable year-end rate, and the amount ofgains and losses relating to the translation is included in“Foreign statements translation adjustments,” in accor-dance with the accounting and reporting standards withrespect to foreign currency transaction which was promul-gated by the Business Accounting Deliberation Council,an advisory committee of the Ministry of Finance.
K. Appropriation of retained earningsThe Consolidated Statements of Income and RetainedEarnings are prepared on the basis of appropriation ofretained earnings approved by the general meetings ofstockholders of the consolidated companies and subsidi-aries and affiliates accounted for by the equity method,held in the consolidated accounting period.
The legal reserves of consolidated subsidiaries areincluded in the consolidated legal reserve in proportion tothe consolidated equity in the consolidated subsidiariesaccrued after the dates of the acquisition.
L. Income tax allocationExcept for 22 consolidated foreign subsidiaries, interperiodtax allocations are not provided for timing differences inincome or expenses for tax and financial reportingpurposes.
M. Deferred exchange differencesBonds and notes denominated in foreign currencies, andhedged by forward exchange contracts are translated intoJapanese yen at the contracted exchange rates.
The exchange differences in translating bonds and notesat the historical rates and the contracted rates are recog-nized as income over the period from the date of theforward exchange contract to the maturity date on thestraight-line basis.
N. Consumption taxIn Japan, the consumption tax law imposes a consumptiontax at the flat rate of 3 per cent on all domestic consump-tion of goods and services (with certain exemptions).
The Company has adopted the accounting methodunder which the consumption tax does not primarily affectnet income.
O. Other significant accounting policiesAs the accounting policies followed in the preparation ofthe accompanying consolidated financial statements areidentical in all material aspects to those of the non-consolidated financial statements included elsewhere inthis annual report, reference should be made to suchstatements.

38
4. Accumulated Depreciation:
At 31st March, 1996 and 1995, accumulated depreciation amounted to ¥434,535 million ($4,085,899 thousand) and¥388,057 million ($3,648,867 thousand), respectively.
5. Deferred Capital Gains:
Deferred capital gains of ¥5,655 million ($53,178 thousand) mainly on insurance claims were deducted from the cost ofreplaced properties at 31st March, 1996.
6. Notes Receivable Discounted and Endorsed:
Contingent liabilities for notes receivable discounted and endorsed were ¥477 million ($4,492 thousand) at 31st March,
1996.
7. Balances with Non-Consolidated Subsidiaries and Affiliates:
Balances with non-consolidated subsidiaries and affiliates for the years as at 31st March, 1996 and 1995 were as follows:
¥ Million US$ Thousand
1996 1995 1996 1995Notes and accounts receivable - trade ....................................................... ¥ 5,528 ¥ 4,881 $ 51,982 $ 45,896Other current assets ................................................................................... 6,397 7,982 60,158 75,054Investments in securities ............................................................................ 35,032 35,405 329,410 332,910Long-term loans receivable ........................................................................ 2,516 3,147 23,661 29,591Other long-term receivables ....................................................................... 222 47 2,095 442Notes and accounts payable ...................................................................... 4,862 4,382 45,723 41,204Other current liabilities ............................................................................... 1,124 3,628 10,577 34,114Long-term debt .......................................................................................... 103 130 973 1,222
8. Long-Term Receivables and Debt in Foreign Currencies:
A comparison of the yen amounts stated in the Consoli-dated Balance Sheet at 31st March, 1996 for these itemsand the yen amounts which would have resulted from
translating them at the applicable year-end rate is asfollows:
(1) Long-term receivables in foreign currencies ............................................................................................................ ¥ Million
Yen amount stated on Balance Sheet ........................................................................................................................... ¥570Yen amount translated at the applicable year-end rate .................................................................................................. 418
(2) Long-term debt in foreign currencies ...................................................................................................................... ¥ Million
Yen amount stated on Balance Sheet ........................................................................................................................... ¥32,801Yen amount translated at the applicable year-end rate .................................................................................................. 31,701
9. Accounting for Leases:
Finance leases other than those which are deemed totransfer the ownership of the leased assets to lessees are
accounted for by the method similar to that applicable toordinary operating leases.

39
10. Financial Information by Segment:
(1) Line-of-Business Segment InformationThe Company and its consolidated subsidiaries operateprincipally in three businesses: shipping, oil wholesalingand real estate.
The following tabulation presents certain segmentinformation for the year ended 31st March, 1996.
¥ Million
Elimination and ConsolidatedShipping Oil wholesaling Real estate Others Total Unallocation total
Sales:(1) Sales to outside customers,
non-consolidated subsidiaries andaffiliates ................................. ¥ 643,920 ¥ 104,794 ¥ 16,885 ¥ 126,130 ¥ 891,729 ¥ - ¥ 891,729
(2) Intersegment sales................. 704 1,235 4,092 13,266 19,297 (19,297) -
Total sales .................................. 644,624 106,029 20,977 139,396 911,026 (19,297) 891,729
Operating expenses ........................ 615,743 106,004 16,648 137,802 876,197 (19,403) 856,794
Operating income .......................... 28,881 25 4,329 1,594 34,829 106 34,935
Assets ............................................. 715,590 24,105 98,760 327,533 1,165,988 237,301 1,403,289
Depreciation and amortization ........ 44,710 32 2,266 6,128 53,136 130 53,266
Capital investments ......................... 45,502 5 1,940 2,543 49,990 147 50,137
US$ Thousand
Elimination and Consolidated
Shipping Oil wholesaling Real estate Others Total Unallocation total
Sales :(1) Sales to outside customers,
non-consolidated subsidiaries andaffiliates ................................. $6,054,723 $985,372 $ 158,765 $ 1,185,995 $ 8,384,855 $ - $ 8,384,855
(2) Intersegment sales................. 6,617 11,617 38,476 124,738 181,448 (181,448) -
Total sales .................................. 6,061,340 996,989 197,241 1,310,733 8,566,303 (181,448) 8,384,855
Operating expenses ........................ 5,789,778 996,750 156,541 1,295,743 8,238,812 (182,448) 8,056,364
Operating income .......................... 271,562 239 40,700 14,990 327,491 1,000 328,491
Assets ............................................. 6,728,634 226,659 928,634 3,079,767 10,963,694 2,231,315 13,195,009
Depreciation and amortization ........ 420,405 291 21,298 57,621 499,615 1,222 500,837
Capital investments ......................... 427,851 38 18,242 23,902 470,033 1,373 471,406

40
(2) Geographical Segment Information¥ Million
Elimination and ConsolidatedJapan International Total Unallocation total
Sales :(1) Sales to outside customers,
non-consolidated subsidiaries andaffiliates ........................................................................ ¥ 779,038 ¥ 112,691 ¥ 891,729 ¥ - ¥ 891,729
(2) Intersegment sales ...................................................... 5,206 43,677 48,883 (48,883) -
Total sales ........................................................................ 784,244 156,368 940,612 (48,883) 891,729
Operating expenses ............................................................... 749,815 155,860 905,675 (48,881) 856,794
Operating income ................................................................. 34,430 507 34,937 (2) 34,935
Assets .................................................................................... 860,545 277,279 1,137,824 265,465 1,403,289
US$ Thousand
Elimination and ConsolidatedJapan International Total Unallocation total
Sales :(1) Sales to outside customers,
non-consolidated subsidiaries andaffiliates ........................................................................ $ 7,325,229 $ 1,059,626 $ 8,384,855 $ - $ 8,384,855
(2) Intersegment sales ...................................................... 48,953 410,691 459,644 (459,644) -
Total sales ........................................................................ 7,374,182 1,470,317 8,844,499 (459,644) 8,384,855
Operating expenses ............................................................... 7,050,443 1,465,545 8,515,988 (459,624) 8,056,364
Operating income ................................................................. 323,739 4,772 328,511 (20) 328,491
Assets .................................................................................... 8,091,630 2,607,237 10,698,867 2,496,142 13,195,009
(3) Overseas Sales InformationOverseas sales were ¥624,194 million ($5,869,243 thou-sand), which is 70.0 per cent of consolidated sales
(¥891,729 million, $8,384,852 thousand). Overseassales consist of principally ocean-going vessel andvoyage revenue.
11. Related Party Transactions:
A. Affiliates(1) Tokyo Senpaku Kaisha, Ltd.Tokyo Senpaku Kaisha, Ltd. (“TSK”) is a 39.69% ownedaffiliate of the Company, and owns and operates ocean-going freight vessels. The Company bare- and time-chartered out its vessels to TSK, chartered slots of itscontainer vessels to TSK, and provided stevedoring ser-vices to TSK. In the current year, the Company receivedfrom TSK charterage of ¥3,837 million ($36,083 thou-sand) container rental charge of ¥3,803 million ($35,763thousand) and fees for stevedoring services of ¥2,933million ($27,582 thousand).(2) Taiheiyo Kaiun Co., Ltd.Taiheiyo Kaiun Co., Ltd. (“TKC”) is a 22.73% ownedaffiliate of the Company, and owns and operates ocean-going freight vessels. The Company chartered In TKC’svessels. The Company paid to TKC charterage of ¥3,593million ($33,790 thousand) in the current year.(3) Arun LNG Transport, Inc.Arun LNG Transport, Inc. (“ALT”) is a 30.63% owned
affiliate of the Company, and charters in and operates LNGvessels. The Company charters out its LNG vessels toALT. The Company received charterage of ¥10,298million ($96,831 thousand) from ALT in the current year.(4) Badak LNG Transport, Inc.Badak LNG Transport, Inc. (“BLT”) is a 25% ownedaffiliate of the Company, and charters in and operates LNGvessels. The Company charters out its LNG vessels toBLT. The Company received charterage of ¥4,741 million($44,587 thousand) from BLT in the current year.
B. Other related partyPacific LNG Transport Ltd.Pacific LNG Transport Ltd. (“PLT”) is owned by theCompany by 13.88%. PLT owns and charters out LNGvessels. The Company had an agreement with a financialinstitution whereby the Company guaranteed PLT’srepayment of its loan obligation. Such loan obligation was¥8,689 million ($81,703 thousand) at 31st March, 1996.

41
Report of Independent Certified Public Accountants
41

42
Corporate Structure(AS of July 1996)
Sapporo Branch Tomakomai Office Muroran Office Kushiro Office
Yokohama Branch Nagoya Branch Osaka Branch Kobe Branch Kyushu Branch (Hakata) Kyushu Branch (Moji)
General Meeting ofShareholders
Board of Directors
Chairman of Board of DirectorsVice Chairman of the Board of Directors
President
Executive Vice President
Senior Managing Directors
Managing Directors
Directors
Head Office
Corporate Auditors
Auditors Staff Chamber
Board Counselors
Adviser to the President
Advisers
General Affairs Group Corporate Communication Group Human Resources Group Business Management Group Container Operation Group Container Marketing Group Container Administrative Group Container Sales Support Group Container Export Group Container Import Group Harbour Group Logistics Group Tramp Co-ordination Group Car Carrier Group (1) Car Carrier Group (2) Handy Bulker Group Reefer Cargo Group Open Hatch Bulker Group Semi-Liner Group Liner Group Iron Ore and Coal Group Panamax Bulker Group Forest Products Group Steaming Coal Group Petroleum Group Gas Carrier Group Management Coordination Group Planning Group Research Group Cruise GroupReal Estate Group Corporate Affiliate Management Group Law and Insurance Group Marine Technical Group Manpower Development Group Ship Administration Group Technical Group NYK Ocean Carrier Technology Laboratory Finance Group Accounting Group
Vessels
NYK Line (Hong Kong) Ltd. NYK Shipping Service (Thailand) Co., Ltd. NYK Agencies (M) Sdn. Bhd. N.Y.K. Line 1993 (S) Pte., Ltd. NYK Line (China) Co., Ltd. P.T. NYK Line Indonesia NYK Bulkship (Singapore) Pte., Ltd. NYK Line (Canada) Inc. NYK Line (North America) Inc. NYK Bulkship (USA) Inc. NYK Sudamerica (Chile) S.A. NYK Line (Europe) Ltd. NYK Line (Sverige) AB NYK Line (Deutschland) GmbH NYK Line (Benelux) B.V. NYK Bulkship (Europe) Ltd. NYK Line (Australia) Pty., Ltd. NYK Shipping (New Zealand) Ltd.
Resident Representative, Seoul Resident Representative, Beijing Resident Representative, Tianjin Resident Representative, Qingdao Resident Representative, Taipei Resident Representative, Kaohsiung Resident Representative, Ho Chi Minh City Resident Representative, Hanoi Resident Representative, Mexico City Resident Representative, São Paulo Resident Representative, Buenos Aires Resident Representative, Dubai
Major Overseas Subsidiariesand Affiliates
Resident RepresentativesAbroad
Home Branches
,

43
Major Consolidated Subsidiaries and Affiliates(AS of March 1996)
DOMESTICpaid-in
NYK’s Revenues Total assets capitalCompany ownership(%) (¥ millions) (¥ millions) (¥ millions)
Shipowners and vessel operators
Asahi Shipping Co., Ltd.* 38.54 3,833 5,286 550
Camellia Line Co., Ltd. 51.00 2,203 338 400
Chiyoda Shipping Co., Ltd. 56.88 5,011 3,297 160
Cirius Marine Co., Ltd. 100.00 1,224 180 30
Hachiuma Steamship Co., Ltd. 68.72 10,167 5,394 500
Kinkai Yusen Kaisha, Ltd. 72.75 17,379 15,622 1,449
Kyoei Tanker Co., Ltd.* 30.00 16,082 16,188 2,850
Mitsubishii Ore Transport Co., Ltd.* 22.23 5,283 6,623 1,500
Mari-Tech Management Inc. 78.31 7,952 4,343 610
Ogasawara Kaiun Co., Ltd.* 50.00 1,625 2,124 10
Shinwa Kaiun Kaisha Ltd.* 26.70 69,273 48,553 8,100
Taiheiyo Kaiun Co., Ltd.* 22.73 9,752 13,189 3,500
Taiheiyo Kisen Kaisha, Ltd.* 31.37 5,123 4,828 2,100
Toho Shipping Co., Ltd. 85.00 6,350 8,110 150
Tokyo Senpaku Kaisha, Ltd.* 39.70 47,716 14,764 1,299
Tugboat and other port services
Kaiyo Kogyo Co., Ltd. 98.00 3,647 3,333 90
Naikai Tug Boat Service Co., Ltd.* 43.08 5,809 7,471 97
Nippon Kaiyosha, Ltd.* 50.00 4,775 8,345 480
Nishinihon Kaiun Kaisha, Ltd.* 30.00 2,618 3,643 50
Sanyo Kaiji Co., Ltd.* 48.61 5,551 6,591 90
Tomakomai Kaiun Co., Ltd. 95.00 1,322 1,215 40
Cruise & marine leisure
Asuka Ship Co., Ltd. 100.00 6,856 2,952 2,000
Crystal Yacht Club Inc. 100.00 606 457 300
NYK Cruises Co., Ltd. 100.00 1,938 486 490
Harbour transportation and stevedoring services
Asahi Unyu Kaisha, Ltd.* 50.00 9,822 4,899 100
Chiba Kaiun Sangyo Co., Ltd. 100.00 409 1,129 30
Hirokura Co., Ltd. 72.22 1,211 915 90
Honma Corporation 91.00 3,500 2,258 50
Kitakyushu Transporcation Co., Ltd.* 35.00 17,147 18,156 242
Nippon Container Terminal Co., Ltd. 51.00 7,917 5,087 250
Nippon Container Yuso Co., Ltd. 51.00 8,043 2,607 250
UNI-X Corporation 55.26 22,535 22,501 934
Yashio Kairiku Co., Ltd. 100.00 1,142 448 120
Yokohama Kyoritsu Warehouse Co., Ltd. 70.90 2,508 4,005 445
Yusen Kairiku Unyu Kaisha Ltd. 55.25 3,349 1,246 50
Yusen Koun Co., Ltd. 76.00 8,120 2,216 100
Transportation and logistics services
Kyokuto Nenryo Yuso Co., Ltd. 100.00 2,325 1,148 60
Sanpo Unyu Co., Ltd.* 20.00 12,342 4,869 200
Yusen Air & Sea Service Co., Ltd. 78.38 39,781 32,535 1,343
Yusen Fresh Chain Co., Ltd. 91.67 1,510 489 300
Yusen Travel Co., Ltd. 100.00 5,343 6,012 450
†

44
Paid-inNYK’s Revenues Total assets capital
Company ownership(%) (¥ millions) (¥ millions) (¥ millions)
Real estate
Meiyu Real Estate Co. Ltd.* 50.00 340 1,256 225
NYK Tennoz Building Inc. 100.00 2,350 42,383 3,200
Yusen Real Estate Corp. 100.00 11,542 14,706 750
Shipping-related technology
NYK Engineering Co., Ltd. 100.00 528 955 10
Yusen Marine Science Inc. 100.00 1,522 1,208 420
Computers and communications
Nippon Denshin Kogyo Co., Ltd. 87.35 1,071 638 480
NYK Systems Research Institute (NSRI) 100.00 5,526 1,984 99
Yusen Computer System Co., Ltd. 100.00 1,308 611 11
Yusen Joho Kaihatsu Co., Ltd. 100.00 2,069 783 80
Manufacturing
Daito Marine Engineering Co., Ltd. 81.00 1,704 976 40
Keihin Dock Co., Ltd. 100.00 2,446 1,003 30
Nippon Yuka Kogyo Co., Ltd. 100.00 909 913 20
Yokohama Denko (Electric) Co., Ltd. 75.00 1,543 1,222 30
Merchandising
Asahi Mechatronic Corp. 59.67 10,531 6,341 150
Fuso Sekiyu Co., Ltd.* 30.00 4,756 1,992 10
Hikawa Marine Co., Ltd. 100.00 2,512 817 50
Hlkawa Sekiyu Co., Ltd. 60.00 1,542 225 50
Hikawa Shoji Kaisha, Ltd. 67.94 101,241 36,046 1,025
Kansai Hikawa Sekiyu Kaisha, Ltd. 66.11 4,798 1,506 90
Sanyo Trading Co., Ltd.* 42.25 7,493 6,051 100
Finance and accounting
Yusen Accounting and Finance Co., Ltd. 100.00 1,355 32,948 99
Others
Hikawamaru Marine Tower Co. Ltd. 55.22 1,718 1,985 460
Taiyo Printing Co., Ltd. 99.86 1,313 1,247 66
†
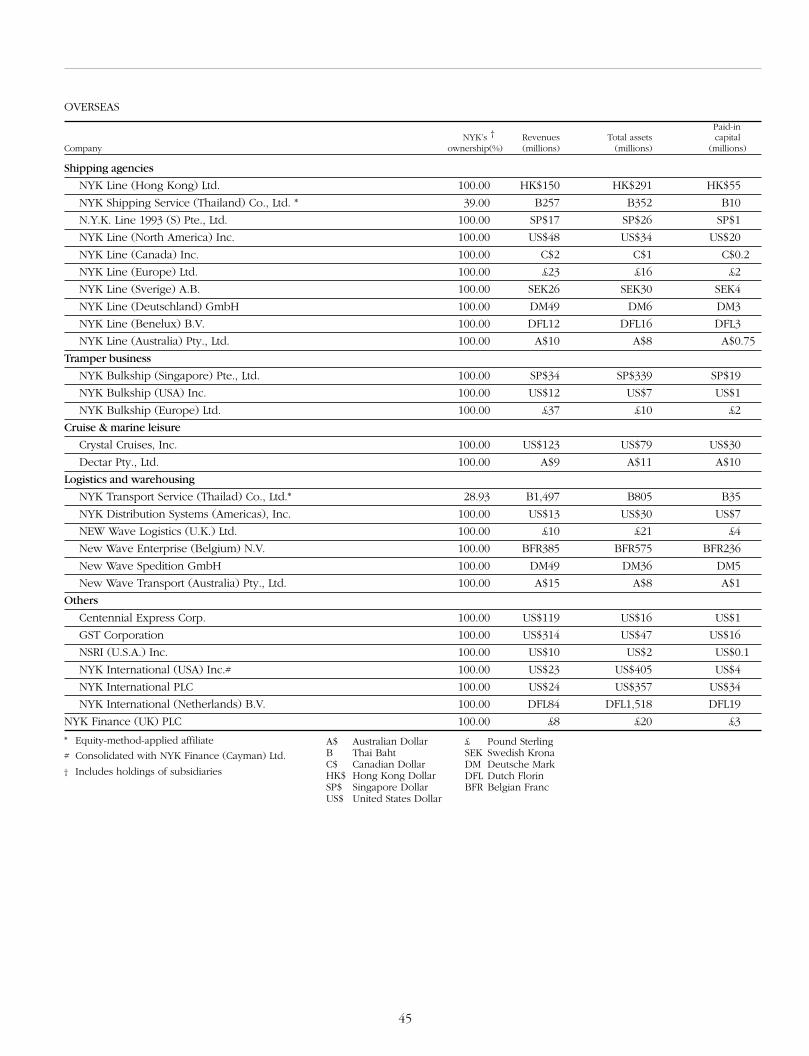
45
OVERSEAS
Paid-inNYK’s Revenues Total assets capital
Company ownership(%) (millions) (millions) (millions)
Shipping agencies
NYK Line (Hong Kong) Ltd. 100.00 HK$150 HK$291 HK$55
NYK Shipping Service (Thailand) Co., Ltd. * 39.00 B257 B352 B10
N.Y.K. Line 1993 (S) Pte., Ltd. 100.00 SP$17 SP$26 SP$1
NYK Line (North America) Inc. 100.00 US$48 US$34 US$20
NYK Line (Canada) Inc. 100.00 C$2 C$1 C$0.2
NYK Line (Europe) Ltd. 100.00 £23 £16 £2
NYK Line (Sverige) A.B. 100.00 SEK26 SEK30 SEK4
NYK Line (Deutschland) GmbH 100.00 DM49 DM6 DM3
NYK Line (Benelux) B.V. 100.00 DFL12 DFL16 DFL3
NYK Line (Australia) Pty., Ltd. 100.00 A$10 A$8 A$0.75
Tramper business
NYK Bulkship (Singapore) Pte., Ltd. 100.00 SP$34 SP$339 SP$19
NYK Bulkship (USA) Inc. 100.00 US$12 US$7 US$1
NYK Bulkship (Europe) Ltd. 100.00 £37 £10 £2
Cruise & marine leisure
Crystal Cruises, Inc. 100.00 US$123 US$79 US$30
Dectar Pty., Ltd. 100.00 A$9 A$11 A$10
Logistics and warehousing
NYK Transport Service (Thailad) Co., Ltd.* 28.93 B1,497 B805 B35
NYK Distribution Systems (Americas), Inc. 100.00 US$13 US$30 US$7
NEW Wave Logistics (U.K.) Ltd. 100.00 £10 £21 £4
New Wave Enterprise (Belgium) N.V. 100.00 BFR385 BFR575 BFR236
New Wave Spedition GmbH 100.00 DM49 DM36 DM5
New Wave Transport (Australia) Pty., Ltd. 100.00 A$15 A$8 A$1
Others
Centennial Express Corp. 100.00 US$119 US$16 US$1
GST Corporation 100.00 US$314 US$47 US$16
NSRI (U.S.A.) Inc. 100.00 US$10 US$2 US$0.1
NYK International (USA) Inc.# 100.00 US$23 US$405 US$4
NYK International PLC 100.00 US$24 US$357 US$34
NYK International (Netherlands) B.V. 100.00 DFL84 DFL1,518 DFL19
NYK Finance (UK) PLC 100.00 £8 £20 £3
* Equity-method-applied affiliate
# Consolidated with NYK Finance (Cayman) Ltd.
† Includes holdings of subsidiaries
A$ Australian DollarB Thai BahtC$ Canadian DollarHK$ Hong Kong DollarSP$ Singapore DollarUS$ United States Dollar
£ Pound SterlingSEK Swedish KronaDM Deutsche MarkDFL Dutch FlorinBFR Belgian Franc
†

46
Worldwide Services Network
46

4747

48
Company Information(AS of March 31,1996)
ESTABLISHEDSeptember 29, 1885
PAID-IN CAPITAL¥79,643,430,076
MAIN ACTIVITIES1. Marine transportation2. Land transportation3. Agency business for marine and land transportation4. Warehousing5. Harbour transportation6. Combined transportation by sea, land and air, and agency
business connected therewith7. Marine-related business development8. Sale and purchase of vessels9. Consulting related to building and repair of vessels and
marine structures10. Business related to information on transportation11. Loans, guarantees and investments in businesses other than
those enumerated above12. Sale, purchase and lease of real estate13. Possession, lease, maintenance and management of marine
leisure facilities14. Business related to travel pursuant to the Travel Agency
Law15. Other undertakings incidental to or connected with the
above items
EMPLOYEESLand ....................................................................................... 1,548Sea ............................................................................................. 744Total ....................................................................................... 2,292
HEAD OFFICE3-2, Marunouchi 2-chome, Chiyoda-ku, Tokyo 100, JapanTelephone: (03) 3284-5151Mailing Address: C.P.O. Box 1250, Tokyo 100-91, JapanCable Address: YUSEN TOKYOTelex: J22236, J22465, J22466, J24473 , J24479Fax: (03)3284-6361
Investor Information(AS of March 31, 1996)
CLOSING DATEThe Company’s books are closed on March 31 each year.
REGULAR GENERAL MEETINGThe regular general meeting of shareholders is held in June eachyear. 1996 Regular General Meeting: June 27
COMMON STOCKNumber of authorized shares:3,000,000,000 sharesNumber of issued and outstanding shares:1,174,334,405 shares
PRINCIPAL SHAREHOLDERSNumber of Percentage of’shares held total shares(thousands) outstanding
The Tokio Marine and Fire Insurance Company, Limited 57,915 4.93%Mitsubishi Heavy Industries, Limited 54,472 4.64The Meiji Mutual Life Insurance Company 51,899 4.42The Mitsubishi Trust and Banking Corporation 50,176 4.27The Mitsubishi Bank, Limited 47,461 4.04The Industrial Bank of Japan, Limited 42,609 3.63The Sumitomo Trust and Banking Company, Limited 41,646 3.55The Long-Term Credit Bank of Japan, Limited 31,403 2.67Nippon Life Insurance Company 29,708 2.53The Chase Manhattan Bank NA, London 26,446 2.25
Total 433,735 36.93
LISTING OF SHARESNYK’s shares are listed for trading on the followingstock exchanges:
Domestic -Tokyo, Osaka, Nagoya, Fukuoka, Hiroshima, Kyoto,Niigata and Sapporo
Overseas -Frankfurt
STOCK TRANSACTION UNITSThe Company’s stock is traded in units of 1,000 shares each.
STOCK TRANSFER AGENTThe Mitsubishi Trust and Banking CorporationHead Office: 4-5, Marunouchi 1-chome, Chiyoda-ku, Tokyo100, Japan
PUBLICATION FOR PUBLIC NOTICESThe Company’s public notices appear in the Nihon KeizaiShimbun published in Tokyo, Japan.
INDEPENDENT CERTIFIED PUBLIC ACCOUNTANTSChuo Audit CorporationHead Office: Kasumigaseki Bldg., 32nd Floor,2-5, Kasumigaseki 3-chome, Chiyoda-ku, Tokyo 100, Japan


PRINTED IN JAPAN