Embed Size (px)
Citation preview

Behavioral Health Treatment ServicesState Profile
2021Annual Report

[Page intentionally left blank]

Community Behavioral Health Treatment ServicesV
Community Behavioral
Health Treatment Services
September 2021 | 1 ii

Community Behavioral Health Treatment ServicesV
9
Survey Respondents………………………………………………………..…………………………………………….13
Definitions…………………………………………………………………………………………..13
Survey Responses………………………………………………………………………………………………..14
Familiarity of Services……………………...……………………………………………………………..14
Client Support………………………………………………………………………………………………………………….15
Positive Outcomes………………………………………………………………………………...………………………15
Location of Services………………………………………………………...…………………………………………………………………16
Group Times……………………………………………………………………………………..16
Staff Respectfulness…………………………………………………………………………..17
Trained Staff………………………………………………………………………………………………………………….17
Staff Competencies…………………………………………………….......................…………18
Agency Responsivity………………………………………………………...…………………………………………………………………18
Staff Communication……………………………………………………………………………………..19
Utilization of Evidence-Based or Emerging/Promising Practices……………………………………19
Quality of Services……………………………………………………………………………………..20
SUD Treatment Services State Information………………………………………………...………………….
Outcome Tool Return Rate Information for SUD Treatment Services…………………………………………………………………………………….
Discharge Reasons for SUD Treatment Services………………………………………………………………………………………………………………….
Primary Diagnostic Information for SUD Treatment Services……………………………………………………………
Impact of SUD Treatment Services………………………………………………………...…………………………………………………………………
Utilization of High Cost Services for SUD Treatment Services……………………………………………………………………………………..
Quality of Life Information for SUD Treatment Services………………………………………………...………………………………………………………………..
Public Safety Information for SUD Treatment Services…………………………………………………………………………………..………………………………..
Outpatient Treatment Services State Information…………………………………………...……………
Outcome Tool Return Rate Information for Outpatient Treatment Services…………………………………………………………………………………….
Discharge Reasons for Outpatient Treatment Services………………………………………………………………………………………………………………….
Impact of Outpatient Treatment Services………………………………………………………...…………………………………………………………………
Utilization of High Cost Services for Outpatient Treatment Services……………………………………………………………………………………..
Quality of Life Information for Outpatient Treatment Services………………………………………………...………………………………………………………………..
Public Safety Information for Outpatient Treatment Services…………………………………………………………………………………..………………………………..
Level 2.5 Day Treatment Services State Information…………………………………………
Outcome Tool Return Rate Information for Day Treatment Services…………………………………………………………………………………….
Discharge Reasons for Day Treatment Services………………………………………………………………………………………………………………….
Impact of Day Treatment Services………………………………………………………...…………………………………………………………………
Utilization of High Cost Services for Day Treatment Services……………………………………………………………………………………..
Quality of Life Information for Day Treatment Services………………………………………………...………………………………………………………………..
Public Safety Information for Day Treatment Services…………………………………………………………………………………..………………………………..
Stakeholder Survey Summary
35
36
37
39
41
41
28
30
31
33
33
34
42
43
44
45
Data Collection Methodology………………………………………………………………………………..
SUD Treatment Services23
25
25
26
27
26
Table of Contents
September 2021 | 2 ii

Community Behavioral Health Treatment ServicesV
Impact of Low-Intensity Residential Treatment Services………………………………………………………...…………………………………………………………………
Utilization of High Cost Services for Low-Intensity Residential Treatment Services……………………………………………………………………………………..
Quality of Life Information for Low-Intensity Residential Treatment Services………………………………………………...………………………………………………………………..
Public Safety Information for Low-Intensity Residential Treatment Services…………………………………………………………………………………..………………………………..
Level 3.7 Medically-Monitored Intensive Inpatient Treatment Services State Information…………………………………………
Outcome Tool Return Rate Information for Inpatient Treatment Services…………………………………………………………………………………….
Discharge Reasons for Inpatient Treatment Services………………………………………………………………………………………………………………….
Impact of Inpatient Treatment Services………………………………………………………...…………………………………………………………………
Utilization of High Cost Services for Inpatient Treatment Services……………………………………………………………………………………..
Quality of Life Information for Inpatient Treatment Services………………………………………………...………………………………………………………………..
Public Safety Information for Inpatient Treatment Services…………………………………………………………………………………..………………………………..
Intensive Methamphetamine Treatment (IMT) Services State Information………………………………..
Outcome Tool Return Rate Information for IMT Services…………………………………………………………………………………….
Discharge Reasons for IMT Services………………………………………………………………………………………………………………….
Impact of IMT Services………………………………………………………...…………………………………………………………………
Utilization of High Cost Services for IMT Services……………………………………………………………………………………..
Quality of Life Information for IMT Services………………………………………………...………………………………………………………………..
Public Safety Information for IMT Services…………………………………………………………………………………..………………………………..
Performance Measures for IMT Services…....................................................................................70
Pregnant Woman and Woman with Dependant Children………………………………..
Outcome Tool Return Rate Information for PW/WDC Program…………………………………………………………………………………….
Discharge Reasons for PW/WDC Program………………………………………………………………………………………………………………….
Impact of PW/WDC Program………………………………………………………...…………………………………………………………………
Utilization of High Cost Services for PW/WDC Program……………………………………………………………………………………..
Quality of Life Information for PW/WDC Program………………………………………………...………………………………………………………………..
Public Safety Information for PW/WDC Program…………………………………………………………………………………..………………………………..
77
78
Discharge Reasons for Low-Intensity Residential Treatment Services …...…….........
54
56
67
68
69
70
81
72
74
74
75
58
58
59
60
61
62
Level 3.1 Clinically-Managed Low-Intensity Residential Treatment Services State
Information…………….……………………………………………………….……………
Outcome Tool Return Rate Information for Low-Intensity Residential Treatment
Services ……………………………………………………………….
64
49
50
51
52
47
49
66
66
September 2021 | 3 ii

Community Behavioral Health Treatment ServicesV
SUD Treatment Services Treatment Services State Information………………………………………….
83
Outcome Tool Return Rate Information for SUD Treatment Services…………………………………………………………………………………….
Discharge Reasons for SUD Treatment Services………………………………………………………………………………………………………………….
Primary Diagnostic Information for SUD Treatment Services……………………………………………………………
Impact of SUD Treatment Services………………………………………………………...…………………………………………………………………
Utilization of High Cost Services for SUD Treatment Services……………………………………………………………………………………..
Quality of Life Information for SUD Treatment Services………………………………………………...………………………………………………………………..
Public Safety Information for SUD Treatment Services…………………………………………………………………………………..………………………………..
Outcome Tool Return Rate Information for SUD Treatment Services…………………………………………………………………………………….
Impact of SUD Treatment Services………………………………………………………...…………………………………………………………………
Utilization of High Cost Services for SUD Treatment Services……………………………………………………………………………………..
Quality of Life Information for SUD Treatment Services………………………………………………...………………………………………………………………..
Public Safety Information for SUD Treatment Services…………………………………………………………………………………..………………………………..
Outpatient Treatment Services State Information………………..…………………………….
95
Outcome Tool Return Rate Information for Outpatient Treatment Services…………………………………………………………………………………….
Discharge Reasons for Outpatient Treatment Services………………………………………………………………………………………………………………….
Impact of Outpatient Treatment Services………………………………………………………...…………………………………………………………………
Utilization of High Cost Treatment Services for Outpatient Treatment Services……………………………………………………………………………………..
Quality of Life Information for Outpatient Treatment Services………………………………………………...………………………………………………………………..
Public Safety Information for Outpatient Treatment Services…………………………………………………………………………………..………………………………..
Outcome Tool Return Rate Information for Outpatient Treatment Services…………………………………………………………………………………….
Impact of Outpatient Treatment Services………………………………………………………...…………………………………………………………………
Utilization of High Cost Treatment Services for Outpatient Treatment Services……………………………………………………………………………………..
Quality of Life Information for Outpatient Treatment Services………………………………………………...………………………………………………………………..
Public Safety Information for Outpatient Treatment Services…………………………………………………………………………………..………………………………..
107
Outcome Tool Return Rate Information for PRTF Treatment Services…………………………………………………………………………………….
Discharge Reasons for PRTF Treatment Services………………………………………………………………………………………………………………….
Impact of PRTF Treatment Services………………………………………………………...…………………………………………………………………
Utilization of High Cost Treatment Services for PRTF Treatment Services……………………………………………………………………………………..
Quality of Life Information for PRTF Treatment Services………………………………………………...………………………………………………………………..
Public Safety Information for PRTF Treatment Services…………………………………………………………………………………..………………………………..
Outcome Tool Return Rate Information for PRTF Treatment Services…………………………………………………………………………………….
Impact of PRTF Treatment Services………………………………………………………...…………………………………………………………………
Utilization of High Cost Treatment Services for PRTF Treatment Services……………………………………………………………………………………..
105
83
101
101
102
103
104
83
84
95
96
98
99
100
89
90
101
Youth Information…………….………………………………...……………………………………….
Family Information……………………………………………………….………………………..
89
Youth Information…………….………………………………...……………………………………….
Family Information……………………………………………………….………………………..
Family Information……………………………………………………….………………………..
Youth Information…………….………………………………...……………………………………….
Psychiatric Residential Treatment Facility (PRTF) Treatment Services State
Information………………………………………………………………………………………
86
87
88
89
Youth Substance Use Disorder Treatment Services
81
108
109
91
92
93
95
110
111
113
113
114
84
107
107
113
September 2021 | 4 ii

Community Behavioral Health Treatment ServicesV
Quality of Life Information for PRTF Treatment Services………………………………………………...………………………………………………………………..
Public Safety Information for PRTF Treatment Services…………………………………………………………………………………..………………………………..116
115
September 2021 | 5 ii

Community Behavioral Health Treatment ServicesV
CARE and IMPACT Services State Information……………..…………………………………………………..…………….
Outcome Tool Return Rate Information for CARE and IMPACT Services…………………………………………………………………………………….
Primary Diagnostic Information for CARE and IMPACT Services……………………………………………………………
Impact of CARE and IMPACT Services………………………………………………………...…………………………………………………………………
Utilization of High Cost Services for CARE and IMPACT Services……………………………………………………………………………………..
Quality of Life Information for CARE and IMPACT Services………………………………………………...………………………………………………………………..
Public Safety Information for CARE and IMPACT Services…………………………………………………………………………………..………………………………..
CARE Services State Information……………….................….................…...…..…………………….
Outcome Tool Return Rate Information for CARE Services…………………………………………………………………………………….
Impact of CARE Services………………………………………………………...…………………………………………………………………
Utilization of High Cost Services for CARE Services……………………………………………………………………………………..
Quality of Life Information for CARE Services………………………………………………...………………………………………………………………..
Public Safety Information for CARE Services…………………………………………………………………………………..………………………………..
IMPACT Services State Information……..………..........…...………..………………...……….
Outcome Tool Return Rate Information for IMPACT Services…………………………………………………………………………………….
Impact of IMPACT Services………………………………………………………...…………………………………………………………………
Utilization of High Cost Services for IMPACT Services……………………………………………………………………………………..
Quality of Life Information for IMPACT Services………………………………………………...………………………………………………………………..
Public Safety Information for IMPACT Services…………………………………………………………………………………..………………………………..
Children, Youth, Family (CYF) Treatment Services State Information………………………………………….
145
Outcome Tool Return Rate Information for CYF Treatment Services…………………………………………………………………………………….
Primary Diagnostic Information for CYF Treatment Services……………………………………………………………
Impact of CYF Treatment Services………………………………………………………...…………………………………………………………………
Utilization of High Cost Treatment Services for CYF Treatment Services……………………………………………………………………………………..
Quality of Life Information for CYF Treatment Services………………………………………………...………………………………………………………………..
Public Safety Information for CYF Treatment Services…………………………………………………………………………………..………………………………..
Outcome Tool Return Rate Information for CYF Treatment Services…………………………………………………………………………………….
Impact of CYF Treatment Services………………………………………………………...…………………………………………………………………
Utilization of High Cost Treatment Services for CYF Treatment Services……………………………………………………………………………………..
Quality of Life Information for CYF Treatment Services………………………………………………...………………………………………………………………..
Public Safety Information for CYF Treatment Services…………………………………………………………………………………..………………………………..
Targeted Services for Justice Involved Adults Table of Contents
Targeted Services for Justice Involved Adults Table of Contents…....................................... 159
181
141
Youth Information…………….………………………………...……………………………………….
Family Information…………………………..…………………….………………………..
Youth Mental Health Treatment Services
152
154
155
156
122
146
149
150
151
152
152
140
143
145
147
Mental Health Services
121
135
137
138
Targeted Services for Justice-Involved Youth Table of Contents
Targeted Services for Justice-Involved Youth Table of Contents…..........................................
139
127
129
129
131
132
133
119
122
124
125
126
September 2021 | 6 ii

Community Behavioral Health Treatment ServicesV
Appendix C: Youth Substance Use Disorder Treatment Services………………………………………
Appendix D: Adult Mental Health Services………………………………………...…
Appendix E: Youth Mental Health Treatment Services…………………...…………………..
Appendix A: Stakeholder Survey………………..……………………………………….219
Supporting Data
Appendix B: Adult Substance Use Disorder Treatment Services……………………………………….221
265
299
318
September 2021 | 7 ii

Community Behavioral Health Treatment ServicesV
[Page intentionally left blank]
September 2021 | 8 ii

Data Collection Methodology V
Data Collection
Methodology
September 2021 | 9 ii

Data Collection Methodology V
The Division of Behavioral Health collaborated closely with members of the Data and Outcomes Work Group
(DOWG) to identify the information found in this executive summary and the state and agency profiles. This work
group is comprised of representatives from mental health and substance use disorder agencies as well as Division
of Behavioral Health staff.
For FY21 agency profiles, contracted behavioral health agencies collected data from in-person questionnaires. The
surveyed population included adults and youth receiving publicly funded behavioral health services between June
1st, 2020, through May 31st, 2021. In addition, parents and guardians of youth receiving services were surveyed.
Publicly funded behavioral health services are funded through state general funds, block grant funding, and
Medicaid funding.
Data Collection Process
Stakeholder Survey
The Division of Behavioral Health (DBH) collects Stakeholder Survey data once a year for all accredited mental
health and substance use disorder agencies. As part of the survey process, accredited agencies are asked to share
the survey with at least three stakeholders in their community. In addition, the DBH surveys the Department of
Corrections (DOC), Unified Judicial System (UJS), and Child Protection Services (CPS) regarding the accredited
agencies.
Mental Health Services
Contracted agencies collect mental health outcome data at admission, every six months until discharge from
services, and at successful discharge from services. The most significant improvements in mental health are made
between admission and the first 6 months of services. However, the DBH requires contracted agencies to continue
to collect data every six months to ensure clinical services continue to support changes made in the first 6 months
of services. Clients completing the surveys do have the option to skip or refuse to answer questions. As a result,
total data points collected may change between questions.
Substance Use Disorder Services and Targeted Services for Justice-Involved Clients
Contracted agencies collect substance use disorder outcome data at admission and at successful discharge from
services. Clients completing the surveys have the option to skip or refuse to answer questions. As a result, total
data points collected may change between questions. The Texas Christian University Criminal Thinking Scales
(TCU), How I Think Questionnaire (HIT), Gain Short Screener, (Gain-SS) and Aggression Questionnaire (AQ)
are secondary tools utilized to measure the impact of Targeted Services for Justice-Involved clients.
Data Reporting
Appendices contain the data used to build this report. Information includes each data point identified in the State
Profile, the total number of clients who responded, and their responses.
September 2021 | 10 ii

Stakeholder Survey
Stakeholder Survey
Summary
September 2021 | 11 ii

Stakeholder Survey
[Page intentionally left blank]
September 2021 | 12 ii

Stakeholder Survey
Prevention Service Providers
County Board of Mental Illness
Other
525370431383-Total Responses
DefinitionsCPS-Child Protection Services
DBH-Division of Behavioral Health
DOC-Department of Corrections (Juvenile Correction Agents, Parole Services)
EA-Economic Assistance
EAP-Employee Assistance Program
SUD-Substance Use Disorder
UJS-Unified Judicial Services (Court Services Officer)
- 6 - 0 -
- - 19 16 25
- - 4 2 4
School (Administrator/Counselor/
Teacher/Social Worker)- 49 61 69 52
Treatment Agency (Mental
Health/SUD/EAP/Therapist/
Counselor/Case Manager)
- 35 50 64 34
Medical (Doctor/Nurse/Hospital
Social Worker/Psychiatric
Nurse/Community Health)
- 11 19 23 24
Department of Social Services-
State/Tribal (EA/CPS/Adult
Services/Child Welfare)
- 53 45 27 88
Court Staff- UJS (State, Federal,
Tribal, Judge, Attorney, DOC,
Drug Court, Teen Court)
- 219 217 145 271
FY17 FY18 FY19 FY20 FY21
Law Enforcement (Sheriff, Police
Department, Highway Patrol)- 10 16 24
Stakeholder Survey Summary
State InformationPrinted September 2021
Survey Respondents
The Division of Behavioral Health (DBH) recognizes the need for strong community collaboration at the local
level between agencies accredited with the DBH and their local referral sources seeking services for clients.
Accredited agencies are asked to share a stakeholder survey with local referral sources such as schools,
healthcare providers, and other entities of their choosing. The Stakeholder Survey is intended to create a
dialogue between referral sources and accredited agencies to encourage collaboration to best meet the needs
of clients.
Stakeholder Types
27
September 2021 | 13 ii

Stakeholder Survey
Not Familiar
Somewhat Familiar
Familiar
Very Familiar
Total Responses
22% 16% 23%
37% 75% 81% 74%
Not Collected
4% 0% 0% 0%
13% 3% 3% 3%
46%
383 431 370 532
Survey Responses
The following data reflect stakeholders’ perceptions regarding treatment services provided by accredited
agencies.
Familiarity of Services: How familiar are you with the services that are offered by this agency…
FY17 FY18 FY19 FY20 FY21
0% 4% 0% 0% 0%13%
3% 3% 3%
46%
22% 16%23%
37%
75% 81%74%
0%
20%
40%
60%
80%
100%
FY17 FY18 FY19 FY20 FY21
Familiarity of Services
Not Familiar Somewhat Familiar Familiar Very Familiar
September 2021 | 14 ii

Stakeholder Survey
Disagree
Undecided
Agree
Total Responses
Disagree
Undecided
Agree
Total Responses
11% 12% 14%
79%
7% 3% 5% 6%
90%
84% 85% 81%
367 418 359 514
Not Collected
6% 5% 3% 5%
15%
Client Support: This agency is supportive of client needs…
FY17 FY18 FY19 FY20 FY21
Positive Outcomes: Clients that receive services from this agency have positive outcomes…
FY17 FY18 FY19 FY20 FY21
92% 92% 91%
368 419 364 511
Not Collected
3% 4% 4% 3%
0% 3% 4% 4% 3%7% 3% 5% 6%
90% 92% 92% 91%
0%
20%
40%
60%
80%
100%
FY17 FY18 FY19 FY20 FY21
Client Support
Disagree Undecided Agree
0% 6% 5% 3% 5%15% 11% 12% 14%
79% 84% 85% 81%
0%
20%
40%
60%
80%
100%
FY17 FY18 FY19 FY20 FY21
Positive Outcomes
Disagree Undecided Agree
September 2021 | 15 ii

Stakeholder Survey
Disagree
Undecided
Agree
Total Responses
Disagree
Undecided
Agree
Total Responses
12%
82%
6% 7%
82%
80% 84% 80%
367 413 354 508
Not Collected
7% 6% 6% 8%
11% 14% 10%
Group Times: The services are available at times that are convenient for clients…
FY17 FY18 FY19 FY20 FY21
85% 89% 88%
367 417 358 512
Not Collected
7% 7% 5% 5%
11% 8%
Location of Services: The location of services is convenient for clients…
FY17 FY18 FY19 FY20 FY21
0%7% 7% 5% 5%11% 8% 6% 7%
82% 85% 89% 88%
0%
20%
40%
60%
80%
100%
FY17 FY18 FY19 FY20 FY21
Location of Services
Disagree Undecided Agree
0%7% 6% 6% 8%11% 14% 10% 12%
82% 80% 84% 80%
0%
20%
40%
60%
80%
100%
FY17 FY18 FY19 FY20 FY21
Group Times
Disagree Undecided Agree
September 2021 | 16 ii

Stakeholder Survey
Disagree
Undecided
Agree
Total Responses
Disagree
Undecided
Agree
Total Responses
91%
86% 90% 84%
368 413 350 508
Not Collected
5% 5% 2% 4%
10% 9% 8% 12%
85%
Trained Staff: Staff at this agency are well trained
FY17 FY18 FY19 FY20 FY21
94% 94% 94%
370 416 360 516
Not Collected
3% 3% 2% 2%
6% 3% 4% 4%
Staff Respectfulness: Staff at this agency are respectful
FY17 FY18 FY19 FY20 FY21
0% 3% 3% 2% 2%6% 3% 4% 4%
91% 94% 94% 94%
0%
20%
40%
60%
80%
100%
FY17 FY18 FY19 FY20 FY21
Staff Respectfulness
Disagree Undecided Agree
0% 5% 5% 2% 4%10% 9% 8% 12%
85% 86% 90% 84%
0%
20%
40%
60%
80%
100%
FY17 FY18 FY19 FY20 FY21
Trained Staff
Disagree Undecided Agree
September 2021 | 17 ii

Stakeholder Survey
Disagree
Undecided
Agree
Total Responses
Disagree
Undecided
Agree
Total Responses
87% 92% 88%
371 412 355 496
Not Collected
6% 2% 5%
9% 7% 6% 7%
84%
7%
Agency Responsivity: This agency is responsive to the needs within the community
FY17 FY18 FY19 FY20 FY21
88% 92% 87%
363 407 348 506
Not Collected
4% 4% 2% 3%
9% 8% 6% 10%
87%
Staff Competencies: Staff at this agency are competent to deliver treatment services
FY17 FY18 FY19 FY20 FY21
0% 4% 4% 2% 3%9% 8% 6% 10%
87% 88% 92% 87%
0%
20%
40%
60%
80%
100%
FY17 FY18 FY19 FY20 FY21
Staff Competencies
Disagree Undecided Agree
0%7% 6% 2% 5%9% 7% 6% 7%
84% 87% 92% 88%
0%
20%
40%
60%
80%
100%
FY17 FY18 FY19 FY20 FY21
Agency Responsivity
Disagree Undecided Agree
September 2021 | 18 ii

Stakeholder Survey
Disagree
Undecided
Agree
Total Responses
Disagree
Undecided
Agree
Total Responses
83% 85% 79%
352 389 338 487
Not Collected
4% 3% 2% 1%
19% 14% 13% 20%
77%
Utilization of Evidence-Based or Emerging/Promising Practices: This agency utilizes Evidence Based or
Emerging/Promising Practices
FY17 FY18 FY19 FY20 FY21
81% 81% 79%
356 399 345 496
Not Collected
8% 8% 9%
14% 11% 11% 12%
78%
8%
Staff Communication: Staff actively communicate regarding the client's treatment
FY17 FY18 FY19 FY20 FY21
0%8% 8% 8% 9%14% 11% 11% 12%
78% 81% 81% 79%
0%
20%
40%
60%
80%
100%
FY17 FY18 FY19 FY20 FY21
Staff Communication
Disagree Undecided Agree
0% 4% 3% 2% 1%
19% 14% 13%20%
77% 83% 85% 79%
0%
20%
40%
60%
80%
100%
FY17 FY18 FY19 FY20 FY21
Utilization of Evidence-Based or Emerging/Promising Practices
Disagree Undecided Agree
September 2021 | 19 ii

Stakeholder Survey
Disagree
Undecided
Agree
Total Responses
88% 89% 87%
Quality of Services: This agency provides quality services
FY17 FY18 FY19 FY20 FY21
370 415 361 514
Not Collected
3% 5% 2% 5%
12% 7% 9% 8%
85%
0% 3% 5% 2% 5%12% 7% 9% 8%
85% 88% 89% 87%
0%
20%
40%
60%
80%
100%
FY17 FY18 FY19 FY20 FY21
Quality of Services
Disagree Undecided Agree
September 2021 | 20 ii

SUD Treatment Services
Fiscal Year 2021 (FY21) Program Activity
Adults
Youth
White
Black or African American
Asian
18 and below 5%
19 to 64 94% Two or More Races
65 and above 1% Other
Accreditation Information
Administrative Score
SUD Chart Score
Total Accreditation Score
11,281
11,189
10,630
4%
7%
*All clients served includes all funding sources including private
pay, insurance, and other funding sources.
** Publicly funded includes only clients served through state and
federal funding, including Medicaid.
State Avg.
94.7%
92.4%
93.8%
Accreditation Review
24%
Publicly Funded**
Substance Use Disorder (SUD) Treatment Services Profile
Non-Justice Involved State InformationPrinted September 2021
RaceSUD
Clients
85%
2%
1%
3%
NA
0%
9%American Indian and Alaska
Native33%
Native Hawaiian and Other
Pacific Islander0.2%
State Pop.
50%
0.4%
5%
Age SUD Clients Pop. State Pop.
17%
11,875
594
559
58%
All Clients Served*
Youth
Adults
Demographic Information
Clients Served
The DBH accredits 42 SUD treatment
agencies utilizing the standards set forth in
Administrative Rules of South Dakota
(ARSD 67:61).
42 accredited agencies provide
Substance Use Disorder
Treatment Services across South
Dakota
In FY21, the Division of Behavioral Health (DBH) accredited 42
SUD agencies. Of the 42 agencies, 34 agencies were contracted
by the DBH to provide SUD treatment services.
This state profile page reflects adult and youth clients who were
publicly funded in FY21, which runs from June 2020 - May
2021. This does not include clients who received targeted
services for justice-involved individuals.
The demographic information includes all clients who
were funded through state and federal funds, including
Medicaid.
September 2021 | 21 v

Adult SUD Treatment Services
[Page intentionally left blank]
September 2021 | 22 v

Adult SUD Treatment Services
Adult SUD
Treatment Services
September 2021 | 23 v

Adult SUD Treatment Services
[Page intentionally left blank]
September 2021 | 24 v

Adult SUD Treatment Services
# of Admissions
# of Tools Submitted
Return Rate
Target Return Rate
# of Successful Discharges
# of Tools Submitted
Return Rate
Target Return Rate
State Average
Treatment Completed
Terminated by Facility
Incarcerated
Other
National Average
Treatment Completed
Terminated by Facility
Incarcerated
Other
The Data and Outcomes Work Group members set a goal for all contracted agencies to meet or exceed a 60%
outcome tool return rate for FY21.
2% 2% 2% 1% 1%
4% 4% 5% 5% 5%
Transferred to Another Facility or
Program15% 16% 22% 18% 20%
40%
7% 7% 7% 5% 4%
45% 43% 39% 30% 30%
Left Against Professional Advice 27% 29% 25% 41%
3% 3% 3% 2% 2%
4% 4% 4% 4% 3%
Transferred to Another Facility or
Program4% 3% 4% 4% 3%
13%
6% 5% 5% 4% 3%
69% 71% 73% 75% 75%
Left Against Professional Advice 14% 15% 12% 12%
This information is collected in the State Treatment Activity Reporting System (STARS) for clients discharged
from SUD treatment services. The DBH has set a benchmark of a 70% successful completion rate.
FY17 FY18 FY19 FY20 FY21
60% 60% 60% 60% 60%
Discharge Reasons for SUD Treatment Services
SUD Treatment Discharge Reasons
76% 73% 81%
Discharge Outcome Tool Return Rate
2,148 1,921 2,048 2,320 2,080
44% 74% 84% 80% 85%
60% 60% 60% 60% 60%
597 1,065 1,563 1,703 1,686
28% 55%
2,025 3,340 3,917 4,071 4,444
FY17 FY18 FY19 FY20 FY21
Initial Outcome Tool Return Rate
4,578 4,495 4,689 5,080 5,206
Outcome Tool Return Rate Information for SUD Treatment Services
The DBH accredits and contracts with SUD treatment agencies across the state to provide quality treatment
services to adults. This is a reflection of the 34 agencies who provide contracted treatment services. The
information below includes clients in Outpatient Treatment Services, which includes Level 0.5 Early
Intervention, Level 1.0 Outpatient and Level 2.1 Intensive Outpatient Treatment Services, Level 2.5 Day
Treatment Services (Day Treatment Services), Level 3.1 Clinically-Managed Low-Intensity Residential
Treatment Services (3.1 Low-Intensity Residential Treatment Services), Level 3.7 Medically-Monitored
Intensive Inpatient Treatment Services (3.7 Inpatient Treatment Services), and Intensive Methamphetamine
Treatment Services (IMT).
Statewide Program Outcomes for SUD Treatment Services
SUD Treatment Return Rates
September 2021 | 25 v

Adult SUD Treatment Services
State Primary SUD Diagnosis
SUD Treatment Services
State Average
SUD Treatment Services
State Average
SUD Treatment Services
State Average
SUD Treatment Services
State Average
Quality and Appropriateness of Services: Perception of the quality and appropriateness of treatment services received
FY17 FY18 FY19 FY20 FY21
90% 91% 91% 91% 92%
Outcome of Services: Perception of treatment outcomes as a result of services received
FY17 FY18 FY19 FY20 FY21
93% 94% 94% 95% 95%
90% 92% 92% 93% 94%
FY17 FY18 FY19 FY20 FY21
94% 95% 95% 94% 94%
Impact of treatment services is measured by surveying client perception of the quality of services received
including the following: general satisfaction with services, access to services, quality and appropriateness of
services, outcome of services, and participation in treatment planning. Additionally, impacts are measured by
improvements in social connectedness and overall functioning. Impact of treatment services is relevant because
clients who feel empowered, motivated, have positive family relationships, and feel they have the ability to
change may be more likely to have positive treatment outcomes.
The following information represents data from those clients who agreed or strongly agreed at time of
successful discharge.
General Satisfaction with Services: Overall satisfaction with treatment services received
FY17 FY18 FY19 FY20 FY21
Access to Services: Perception of the ease and convenience of treatment services received
2% 4% 4% 3% 1%
Impact of SUD Treatment Services
3% 4% 4% 3%
Number/Percent of Clients with a
Primary Other Substance Use
Disorder
132 221 234 248 93
25% 27% 30%
Number/Percent of Clients with a
Primary Opioid Use Disorder
253 209 225 276 210
4%
8% 8%
Number/Percent of Clients with a
Primary Amphetamine Use Disorder
1,175 1,227 1,420 1,921 1,898
17% 20%
58%
Number/Percent of Clients with a
Primary Cannabis Use Disorder
559 743 577 604 508
8% 12% 10%
Number/Percent of Clients with a
Primary Alcohol Use Disorder
3,389 3,137 3,234 4,232 3,654
50% 51% 56% 59%
Primary Diagnostic Information for SUD Treatment ServicesThe DBH monitors data and outcomes for publicly funded behavioral health treatment services. The table
below reflects information entered into STARS by contracted providers for publicly funded clients receiving
SUD treatment services. This does not include individuals who received only an assessment or justice-involved
individuals.
FY17 FY18 FY19 FY20 FY21
September 2021 | 26 v

Adult SUD Treatment Services
SUD Treatment Services
State Average
Social Connectedness: Perception of their support system in the community at…
SUD Treatment Services
State Average
Admission
Discharge
SUD Treatment Services
State Average
Admission
Discharge
SUD Treatment Services
State Average
Admission
Discharge
SUD Treatment Services
State Average
Admission
Discharge
SUD Treatment Services
State Average
Admission
Discharge
FY17
FY21
6%
71%
7%
FY18
FY20
73% 72% 71%
7% 8%
FY17 FY18 FY19
FY18 FY19 FY20 FY21FY17
85% 86% 86% 89%88%
Emergency Department: Clients who reported emergency department visit(s) within 30 days of…
- 12% 11%
Illness, Injury, or Surgery: Clients who reported night(s) spent in a facility for illness, injury, or surgery within 30 days
of…
High cost services include the following: treatment for illness, injury, or surgery, emergency department visits,
hospital admissions for mental health care, detoxification services, inpatient substance use disorder treatment
services, or detention in a correctional facility. Participation in treatment services may help reduce the
frequency of client utilization of high cost services. Data from FY17 and June through December FY18 are not
reported due to a change in the reporting process. The following section includes data at admission into
services and at successful discharge from services.
Utilization of High Cost Services for SUD Treatment Services
Functioning: Perception of their mental health and social well-being at…
- 10% 9% 8% 9%
- 8% 5% 5% 4%
FY17 FY18 FY19 FY20
- 9% 10% 9%
-
12% 11%
- 9% 6% 6% 16%
9%
Hospital Admissions for Mental Health Care: Clients who reported hospital admission(s) for mental health care within
30 days of…
FY21
71%
91% 93% 92% 93% 94%
FY17 FY18 FY19 FY20 FY21
91% 91% 93% 93% 93%
FY19 FY20 FY21
73%
Participation in Treatment Planning: Perception of participation in treatment planning
FY17 FY18 FY19
The following two sections include data at admission into services and at successful discharge from services as
a means to demonstrate improvement in social connectedness and functioning.
FY20 FY21
74% 74% 74% 75%
September 2021 | 27 v

Adult SUD Treatment Services
SUD Treatment Services
State Average
Admission
Discharge
SUD Treatment Services
State Average
Admission
Discharge
SUD Treatment Services
State Average
Admission
Discharge
SUD Treatment Services
State Average
Admission
Discharge
SUD Treatment Services
State Average
Admission
Discharge
Inpatient Substance Use Disorder Treatment Services: Clients who reported inpatient treatment services for substance
use disorders within 30 days of…
Data from FY17 and June through December FY18 are not reported for suicide attempt(s) due to a change in
the reporting process.
9% 11% 14%
FY17 FY18 FY19 FY20 FY21
16%
- 16%
Detoxification Services: Clients who reported night(s) spent in a facility for detoxification within 30 days of…
- 17% 18% 19%
Suicide Attempts: Clients who reported suicide attempt(s) within 30 days of…
FY17 FY18 FY19 FY20 FY21
- 12% 11% 11% 10%
- 9% 5% 5% 4%
83% 80% 80% 80% 78%
91% 91% 90% 92% 90%
FY17 FY18 FY19 FY20 FY21
- 51% 43% 42% 36%
- 36% 23% 19% 7%
Quality of life is measured in several key life domains including the following: general health, suicide attempts,
employment status, homelessness, and other domains as shown in the tables below. Improvements in these
areas may indicate the effectiveness of treatment services. The following section includes data at admission
into services and at successful discharge from services.
Quality of Life Information for SUD Treatment Services
General Health: Clients who reported their general health as good, very good, or excellent at…
FY17 FY18 FY19 FY20 FY21
- 17% 16% 16% 15%
- 33% 22% 21% 36%
FY17 FY18 FY19 FY20 FY21
Correctional Facility: Clients who reported night(s) spent in a correctional facility within 30 days of…
September 2021 | 28 v

Adult SUD Treatment Services
SUD Treatment Services
State Average
Admission
Discharge
National Average
Admission
Discharge
SUD Treatment Services
State Average
Admission
Discharge
National Average
Admission
Discharge
Federally Required; Discharge data includes successful and unsuccessful discharges
SUD Treatment Services
State Average
Admission
Discharge
SUD Treatment Services
State Average
Before Program
End of Program
SUD Treatment Services
State Average
Admission
Discharge
SUD Treatment Services
State Average
Admission
Discharge
Federally Required; Due to STARS limitations, both adult and youth population are included; Discharge data includes
successful and unsuccessful discharges
51% 46% 42% 44% 48%
83% 81% 81% 83% 85%
Engagement in Treatment Services: Clinicians who reported clients had positive or optimal engagement in treatment
services at…
FY17 FY18 FY19 FY20 FY21
68% 49% 65% 63% 63%
87% 79% 87% 88% 89%
Motivation to Not Use Substances: Clients who reported motivation to not use substances at…
FY17 FY18 FY19 FY20 FY21
39% 38% 39% 38% 39%
98% 98% 98% 98% 98%
Ability to Control Use: Clients who reported the ability to control their substance use…
FY17 FY18 FY19 FY20 FY21
23% 21% 22% 23% 21%
10% 6% 5% 7% 7%
Missing School/Work: Clients who reported missing school/work due to their substance use within 30 days of…
FY17 FY18 FY19 FY20 FY21
15% 15% 16% 12% 14%
10% 10% 10% 9% 9%
5% 7% 8%
4% 10% 12% 14% 14%
Homelessness: Clients who reported homelessness at…
FY17 FY18 FY19 FY20 FY21
55% 44% 46% 45% 45%
25% 24% 24% 19% 18%
25% 25% 23% 19% 18%
3% 7%
33% 30%
FY17 FY18 FY19 FY20 FY21
Employment Status: Adult and youth clients who reported employment at…
46% 33% 34%
September 2021 | 29 v

Adult SUD Treatment Services
SUD Treatment Services
State Average
Admission
Discharge
National Average
Admission
Discharge
Federally Required; Discharge data includes successful and unsuccessful discharges
SUD Treatment Services
State Average
Admission
Discharge
Trouble as a Result of Substance Use: Clients who reported getting in trouble at home, school, work, or in the
community as a result of substance use within 30 days of…
29% 30% 31% 32% 29%
12% 8% 8% 8% 8%
FY17 FY18 FY19 FY20 FY21
19% 19% 16% 35% 32%
24% 23% 24% 37% 35%
14% 18% 15% 14% 11%
15% 11% 11% 9% 7%
Public Safety Information for SUD Treatment Services
Public safety information includes history of arrest and trouble as a result of substance use. Reductions in
these areas may indicate how clients are able to positively contribute to their families and communities. The
following section includes data at admission into services and at successful discharge from services.
History of Arrest: Clients who reported arrest(s) within 30 days of…
FY17 FY18 FY19 FY20 FY21
September 2021 | 30 v
Adult SUD Treatment Services
Outpatient
Treatment Services
September 2021 | 31 v

Adult SUD Treatment Services
[Page intentionally left blank]
September 2021 | 32 v

Adult SUD Treatment Services
# of Admissions
# of Tools Submitted
Return Rate
Target Return Rate
# of Successful Discharges
# of Tools Submitted
Return Rate
Target Return Rate
State Average
Treatment Completed
Terminated by Facility
Incarcerated
Other
7% 5% 5% 4% 4%
8% 8% 10% 11% 10%
Transferred to Another Facility or
Program6% 5% 5% 5% 5%
28%
7% 7% 9% 8% 8%
43% 45% 44% 46% 45%
Left Against Professional Advice 29% 30% 27% 27%
Discharge Reasons for Outpatient Treatment Services
This information is collected in STARS for clients discharged from outpatient treatment services.
FY17 FY18 FY19 FY20 FY21
24% 54% 79% 75% 85%
60% 60% 60% 60% 60%
Outpatient Treatment Discharge
Reasons
1,511 1,293 1,327 1,395 1,175
359 695 1,043 1,051 1,003
60% 60% 60% 60% 60%
Discharge Outcome Tool Return Rate
1,470 2,535 2,719 2,643 2,881
46% 76% 82% 80% 87%
Initial Outcome Tool Return Rate
3,229 3,338 3,312 3,297 3,322
FY17 FY18 FY19 FY20 FY21
Outcome Tool Return Rate Information for Outpatient Treatment Services
Outpatient Treatment Return Rates
Outpatient Treatment Services include the following: Level 0.5 Early Intervention, Level 1.0 Outpatient
Treatment Services, and Level 2.1 Intensive Outpatient Treatment Services. These services provide outpatient
counseling to individuals diagnosed with substance use disorders. This is a reflection of the 23 agencies who
provide contracted outpatient treatment services.
The Data and Outcomes Work Group members set a goal for all contracted agencies to meet or exceed a 60%
outcome tool return rate for FY20.
Statewide Program Outcomes for Outpatient Treatment Services
September 2021 | 33 v

Adult SUD Treatment Services
Outpatient Treatment Services
State Average
Outpatient Treatment Services
State Average
Outpatient Treatment Services
State Average
Outpatient Treatment Services
State Average
Outpatient Treatment Services
State Average
Social Connectedness: Perception of their support system in the community at…
Outpatient Treatment Services
State Average
Admission
Discharge
Outpatient Treatment Services
State Average
Admission
Discharge
Quality and Appropriateness of Services: Perception of the quality and appropriateness of treatment services received
General Satisfaction with Services: Overall satisfaction with treatment services received
The following information represents data from those clients who agreed or strongly agreed at time of
successful discharge.
Impact of Outpatient Treatment Services
FY18 FY19 FY20 FY21
94% 94% 96% 96% 96%
FY17 FY18 FY19 FY20 FY21
FY17
91% 94% 93% 95% 96%
Access to Services: Perception of the ease and convenience of treatment services received
Impact of treatment services is measured by surveying client perception of the quality of services received
including the following: general satisfaction with services, access to services, quality and appropriateness of
services, outcome of services, and participation in treatment planning. Additionally, impacts are measured by
improvements in social connectedness and overall functioning. Impact of treatment services is relevant because
clients who feel empowered, motivated, have positive family relationships, and feel they have the ability to
change may be more likely to have positive treatment outcomes.
75% 75% 76% 77% 78%
92% 93% 93% 94% 95%
Functioning: Perception of their mental health and social well-being at…
FY17 FY18 FY19 FY20 FY21
76% 76% 78% 78% 79%
87% 89% 89% 90% 92%
The following two sections include data at admission into services and at successful discharge from services as
a means to demonstrate improvement in social connectedness and functioning.
FY17 FY18 FY19 FY20 FY21
92% 94% 94% 94% 95%
Participation in Treatment Planning: Perception of participation in treatment planning
FY17 FY18 FY19 FY20 FY21
90% 92% 91% 93% 94%
Outcome of Services: Perception of treatment outcomes as a result of services received
FY17 FY18 FY19 FY20 FY21
93% 95% 95% 96% 95%
FY17 FY18 FY19 FY20 FY21
September 2021 | 34 v

Adult SUD Treatment Services
Outpatient Treatment Services
State Average
Admission
Discharge
Outpatient Treatment Services
State Average
Admission
Discharge
Outpatient Treatment Services
State Average
Admission
Discharge
Outpatient Treatment Services
State Average
Admission
Discharge
Outpatient Treatment Services
State Average
Admission
Discharge
Outpatient Treatment Services
State Average
Admission
Discharge
- 50% 42% 38% 33%
- 33% 22% 17% 6%
Correctional Facility: Clients who reported night(s) spent in a correctional facility within 30 days of…
FY17 FY18 FY19 FY20 FY21
- 12% 11% 11% 7%
- 8% 7% 6% 6%
Inpatient Substance Use Disorder Treatment Services: Clients who reported inpatient treatment services for substance
use disorders within 30 days of…
FY17 FY18 FY19 FY20 FY21
- 13% 12% 11% 11%
- 8% 4% 3% 2%
Detoxification Services: Clients who reported night(s) spent in a facility for detoxification within 30 days of…
FY17 FY18 FY19 FY20 FY21
- 6% 7% 7% 5%
- 4% 2% 3% 2%
Hospital Admissions for Mental Health Care: Clients who reported hospital admission(s) for mental health care within
30 days of…
FY17 FY18 FY19 FY20 FY21
- 10% 9% 8% 8%
- 4% 3% 3% 2%
Emergency Department: Clients who reported emergency department visit(s) within 30 days of…
FY17 FY18 FY19 FY20 FY21
- 9% 8% 7% 7%
- 8% 4% 4% 2%
Utilization of High Cost Services for Outpatient Treatment Services
High cost services include the following: treatment for illness, injury, or surgery, emergency department visits,
hospital admissions for mental health care, detoxification services, inpatient substance use disorder treatment
services, or detention in a correctional facility. Participation in treatment services may help reduce the
frequency of client utilization of high cost services. Data from FY17 and June through December FY18 are not
reported due to a change in the reporting process. The following section includes data at admission into
services and at successful discharge from services.
Illness, Injury, or Surgery: Clients who reported night(s) spent in a facility for illness, injury, or surgery within 30 days
of…
FY17 FY18 FY19 FY20 FY21
September 2021 | 35 v

Adult SUD Treatment Services
Outpatient Treatment Services
State Average
Admission
Discharge
Outpatient Treatment Services
State Average
Admission
Discharge
Outpatient Treatment Services
State Average
Admission
Discharge
Outpatient Treatment Services
State Average
Admission
Discharge
Federally Required; Discharge data includes successful and unsuccessful discharges
Outpatient Treatment Services
State Average
Admission
Discharge
Outpatient Treatment Services
State Average
Before Program
End of Program
Employment Status: Adult and youth clients who reported employment at…
FY17 FY18 FY19 FY20 FY21
- 9% 9% 7% 7%
-
Ability to Control Use: Clients who reported the ability to control their substance use…
Missing School/Work: Clients who reported missing school/work due to their substance use within 30 days of…
Homelessness: Clients who reported homelessness at…
47% 43% 43% 44% 46%
98% 98% 98% 99% 98%
FY17 FY18 FY19 FY20 FY21
18% 19% 18% 17% 15%
7% 4% 4% 4% 3%
FY17 FY18 FY19 FY20 FY21
3% 4% 3% 4% 4%
3% 6% 7% 9% 7%
FY17 FY18 FY19 FY20 FY21
45% 42% 43% 44% 41%
56% 53% 53% 55% 56%
Federally Required; Due to STARS limitations, both adult and youth population are included; Discharge data includes
successful and unsuccessful discharges
4% 3% 3% 2%
Suicide Attempts: Clients who reported suicide attempt(s) within 30 days of…
FY17 FY18 FY19 FY20 FY21
86% 83% 83% 83% 82%
91% 93% 91% 93% 91%
Data from FY17 and June through December FY18 are not reported for suicide attempt(s) due to a change in the
reporting process.
Quality of Life Information for Outpatient Treatment Services
Quality of life is measured in several key life domains including the following: general health, suicide attempts,
employment status, homelessness, and other domains as shown in the tables below. Improvements in these
areas may indicate the effectiveness of treatment services. The following section includes data at admission
into services and at successful discharge from services.
General Health: Clients who reported their general health as good, very good, or excellent at…
FY17 FY18 FY19 FY20 FY21
September 2021 | 36 v

Adult SUD Treatment Services
Outpatient Treatment Services
State Average
Admission
Discharge
Outpatient Treatment Services
State Average
Admission
Discharge
Outpatient Treatment Services
State Average
Admission
Discharge
Federally Required; Discharge data includes successful and unsuccessful discharges
Outpatient Treatment Services
State Average
Admission
Discharge
Engagement in Treatment Services: Clinicians who reported clients had positive or optimal engagement in treatment
services at…
Motivation to Not Use Substances: Clients who reported motivation to not use substances at…
25% 27% 27% 26% 24%
10% 5% 5% 5% 4%
FY17 FY18 FY19 FY20 FY21
10% 17% 15% 14% 11%
17% 13% 12% 10% 9%
Trouble as a Result of Substance Use: Clients who reported getting in trouble at home, school, work, or in the
community as a result of substance use within 30 days of…
FY17 FY18 FY19 FY20 FY21
52% 48% 46% 48% 56%
86% 83% 84% 87% 87%
FY17 FY18 FY19 FY20 FY21
History of Arrest: Clients who reported arrest(s) within 30 days of…
Public safety information includes history of arrest and trouble as a result of substance use. Reductions in
these areas may indicate how clients are able to positively contribute to their families and communities. The
following section includes data at admission into services and at successful discharge from services.
Public Safety Information for Outpatient Treatment Services
70% 54% 70% 70% 72%
88% 82% 90% 91% 91%
FY17 FY18 FY19 FY20 FY21
September 2021 | 37 v

Adult SUD Treatment Services
[Page intentionally left blank]
September 2021 | 38 v

Adult SUD Treatment Services
Level 2.5 Day
Treatment Services
September 2021 | 39 v

Adult SUD Treatment Services
[Page intentionally left blank]
September 2021 | 40 v

Adult SUD Treatment Services
# of Admissions
# of Tools Submitted
Return Rate
Target Return Rate
# of Successful Discharges
# of Tools Submitted
Return Rate
Target Return Rate
Day Treatment Discharge Reasons
State Average
Treatment Completed
Terminated by Facility
Incarcerated
Other
0% 1% 0% 0% 0%
1% 1% 0% 2% 0%
Transferred to Another Facility or
Program0% 1% 0% 0% 2%
9%
15% 14% 9% 12% 8%
70% 75% 82% 78% 81%
Left Against Professional Advice 14% 9% 10% 9%
Discharge Reasons for Day Treatment Services
This information is collected in STARS for clients discharged from Day Treatment Services.
FY17 FY18 FY19 FY20 FY21
88% 99% 99% 97% 86%
60% 60% 60% 60% 60%
89 106 91 90 74
78 105 90 87 64
60% 60% 60% 60% 60%
Discharge Outcome Tool Return Rate
110 131 103 113 86
82% 100% 100% 96% 97%
Initial Outcome Tool Return Rate
134 131 103 118 89
The Data and Outcomes Work Group members set a goal for all contracted agencies to meet or exceed a 60%
outcome tool return rate for FY20.
FY17 FY18 FY19 FY20 FY21
Statewide Program Outcomes for Level 2.5 Day Treatment Services Level 2.5 Day Treatment Services (Day Treatment Services) offers clinically intensive programming to
individuals with substance use disorders. This is a reflection of 1 agency who provides contracted day
treatment services.
Outcome Tool Return Rate Information for Day Treatment Services
Day Treatment Return Rates
September 2021 | 41 v

Adult SUD Treatment Services
Day Treatment Services
State Average
Day Treatment Services
State Average
Day Treatment Services
State Average
Day Treatment Services
State Average
Day Treatment Services
State Average
Social Connectedness: Perception of their support system in the community at…
Day Treatment Services
State Average
Admission
Discharge
Day Treatment Services
State Average
Admission
Discharge
Quality and Appropriateness of Services: Perception of the quality and appropriateness of treatment services received
General Satisfaction with Services: Overall satisfaction with treatment services received
59% 69% 64% 59% 62%
93% 95% 92% 95% 95%
Functioning: Perception of their mental health and social well-being at…
FY17 FY18 FY19 FY20 FY21
62% 72% 68% 64% 64%
78% 83% 84% 82% 82%
The following two sections include data at admission into services and at successful discharge from services as
a means to demonstrate improvement in social connectedness and functioning.
FY17 FY18 FY19 FY20 FY21
96% 96% 97% 96% 98%
Participation in Treatment Planning: Perception of participation in treatment planning
FY17 FY18 FY19 FY20 FY21
91% 90% 93% 90% 92%
Outcome of Services: Perception of treatment outcomes as a result of services received
FY17 FY18 FY19 FY20 FY21
97% 98% 98% 97% 98%
FY17 FY18 FY19 FY20 FY21
96% 98% 98% 95% 97%
Access to Services: Perception of the ease and convenience of treatment services received
FY17 FY18 FY19 FY20 FY21
99% 100% 100% 97% 98%
FY17 FY18 FY19 FY20 FY21
Impact of treatment services is measured by surveying client perception of the quality of services received
including the following: general satisfaction with services, access to services, quality and appropriateness of
services, outcome of services, and participation in treatment planning. Additionally, impacts are measured by
improvements in social connectedness and overall functioning. Impact of treatment services is relevant because
clients who feel empowered, motivated, have positive family relationships, and feel they have the ability to
change may be more likely to have positive treatment outcomes.
Impact of Day Treatment Services
The following information represents data from those clients who agreed or strongly agreed at time of
successful discharge.
September 2021 | 42 v

Adult SUD Treatment Services
Day Treatment Services
State Average
Admission
Discharge
Day Treatment Services
State Average
Admission
Discharge
Day Treatment Services
State Average
Admission
Discharge
Day Treatment Services
State Average
Admission
Discharge
Day Treatment Services
State Average
Admission
Discharge
Day Treatment Services
State Average
Admission
Discharge
- 72% 53% 50% 39%
- 49% 24% 17% 9%
Correctional Facility: Clients who reported night(s) spent in a correctional facility within 30 days of…
FY17 FY18 FY19 FY20 FY21
- 58% 62% 65% 68%
- 83% 83% 73% 80%
Inpatient Substance Use Disorder Treatment Services: Clients who reported inpatient treatment services for substance
use disorders within 30 days of…
FY17 FY18 FY19 FY20 FY21
- 34% 29% 21% 29%
- 24% 16% 15% 17%
Detoxification Services: Clients who reported night(s) spent in a facility for detoxification within 30 days of…
FY17 FY18 FY19 FY20 FY21
- 11% 11% 14% 9%
- 2% 9% 6% 3%
Hospital Admissions for Mental Health Care: Clients who reported hospital admission(s) for mental health care within
30 days of…
FY17 FY18 FY19 FY20 FY21
- 21% 15% 19% 15%
- 17% 5% 5% 5%
Emergency Department: Clients who reported emergency department visit(s) within 30 days of…
FY17 FY18 FY19 FY20 FY21
- 0% 7% 6% 7%
- 10% 7% 5% 5%
Utilization of High Cost Services for Day Treatment Services
High cost services include the following: treatment for illness, injury, or surgery, emergency department visits,
hospital admissions for mental health care, detoxification services, inpatient substance use disorder treatment
services, or detention in a correctional facility. Participation in treatment services may help reduce the
frequency of client utilization of high cost services. Data from FY17 and June through December FY18 are not
reported due to a change in the reporting process. The following section includes data at admission into
services and at successful discharge from services.
Illness, Injury, or Surgery: Clients who reported night(s) spent in a facility for illness, injury, or surgery within 30 days
of…
FY17 FY18 FY19 FY20 FY21
September 2021 | 43 v

Adult SUD Treatment Services
Day Treatment Services
State Average
Admission
Discharge
Day Treatment Services
State Average
Admission
Discharge
Day Treatment Services
State Average
Admission
Discharge
Day Treatment Services
State Average
Admission
Discharge
Federally Required; Discharge data includes successful and unsuccessful discharges
Day Treatment Services
State Average
Admission
Discharge
Day Treatment Services
State Average
Before Program
End of Program
Ability to Control Use: Clients who reported the ability to control their substance use…
Employment Status: Clients who reported employment at…
Suicide Attempts: Clients who reported suicide attempt(s) within 30 days of…
30% 28% 31% 31% 23%
100% 99% 98% 99% 100%
FY17 FY18 FY19
Federally Required; Discharge data includes successful and unsuccessful discharges
FY21
14% 9% 10% 12% 17%
27%
Missing School/Work: Clients who reported missing school/work due to their substance use within 30 days of…
FY17 FY18 FY19 FY20 FY21
13% 5% 6% 8% 7%
5% 2% 9% 3% 7%
Homelessness: Clients who reported homelessness at…
FY17 FY18 FY19 FY20 FY21
FY20
28% 26% 31% 22% 31%
31% 24% 26% 24%
44% 31% 38% 43% 28%
FY17 FY18 FY19 FY20 FY21
FY17 FY18 FY19 FY20 FY21
- 11% 14% 14% 8%
- 15% 10% 5% 5%
76% 73% 68% 74% 83%
92% 88% 88% 94% 100%
Data from FY17 and June through December FY18 are not reported for suicide attempt(s) due to a change in
the reporting process.
Quality of Life Information for Day Treatment Services
Quality of life is measured in several key life domains including the following: general health, suicide attempts,
employment status, homelessness, and other domains as shown in the tables below. Improvements in these
areas may indicate the effectiveness of treatment services. The following section includes data at admission
into services and at successful discharge from services.
General Health: Clients who reported their general health as good, very good, or excellent at…
FY17 FY18 FY19 FY20 FY21
September 2021 | 44 v

Adult SUD Treatment Services
Day Treatment Services
State Average
Admission
Discharge
Day Treatment Services
State Average
Admission
Discharge
Day Treatment Services
State Average
Admission
Discharge
Federally Required; Discharge data includes successful and unsuccessful discharges
Day Treatment Services
State Average
Admission
Discharge
Motivation to Not Use Substances: Clients who reported motivation to not use substances at…
FY17 FY18 FY19 FY20 FY21
50% 48% 52% 53% 75%
96% 90% 87% 92%
History of Arrest: Clients who reported arrest(s) within 30 days of…
Public safety information includes history of arrest and trouble as a result of substance use. Reductions in
these areas may indicate how clients are able to positively contribute to their families and communities. The
following section includes data at admission into services and at successful discharge from services.
Public Safety Information for Day Treatment Services
97%
Trouble as a Result of Substance Use: Clients who reported getting in trouble at home, school, work, or in the
community as a result of substance use within 30 days of…
48% 43% 53% 52% 39%
11% 14% 21% 15% 11%
FY17 FY18 FY19 FY20 FY21
14% 19% 26% 25% 23%
1% 6% 6% 5% 3%
FY17 FY18 FY19 FY20 FY21
51% 30% 54% 42% 51%
90% 83% 86% 85% 90%
FY17 FY18 FY19 FY20 FY21
Engagement in Treatment Services: Clinicians who reported clients had positive or optimal engagement in treatment
services at…
September 2021 | 45 v

Adult SUD Treatment Services
[Page intentionally left blank]
September 2021 | 46 v

Adult SUD Treatment Services
Level 3.1 Clinically-
Managed Low-Intensity
Residential Treatment
Services
September 2021 | 47 v

Adult SUD Treatment Services
[Page intentionally left blank]
September 2021 | 48 v

Adult SUD Treatment Services
# of Admissions
# of Tools Submitted
Return Rate
Target Return Rate
# of Successful Discharges
# of Tools Submitted
Return Rate
Target Return Rate
State Average
Treatment Completed
Terminated by Facility
Incarcerated
Other
4% 4% 5% 5% 5%
5% 3% 3% 4% 3%
Transferred to Another Facility or
Program5% 10% 3% 3% 5%
35%
27% 16% 22% 17% 17%
36% 43% 38% 39% 35%
Left Against Professional Advice 22% 25% 30% 32%
Discharge Reasons for Low-Intensity Residential Treatment Services
This information is collected in STARS for clients discharged from Low-Intensity Residential Treatment
Services.
FY17 FY18 FY19 FY20 FY21
27% 51% 78% 65% 77%
60% 60% 60% 60% 60%
Low-Intensity Residential
Treatment Discharge Reasons
195 135 209 227 147
53 69 164 147 113
60% 60% 60% 60% 60%
Discharge Outcome Tool Return Rate
310 344 455 388 415
49% 83% 81% 75% 80%
Initial Outcome Tool Return Rate
634 413 561 519 517
The Data and Outcomes Work Group members set a goal for all contracted agencies to meet or exceed a 60%
outcome tool return rate for FY20.
FY17 FY18 FY19 FY20 FY21
Statewide Program Outcomes for
Level 3.1 Clinically-Managed Low-Intensity Residential Treatment Services
Level 3.1 Clinically-Managed Low-Intensity Residential Treatment Services (Low-Intensity Residential
Treatment Services) include residential, peer-oriented treatment programs for individuals with substance use
disorders whose living situation or recovery environment is incompatible with recovery goals. To prepare the
client to live successfully in the community, the program provides substance use disorder counseling along with
case management services. This is a reflection of the 7 agencies who provide contracted low-intensity treatment
services.
Outcome Tool Return Rate Information for Low-Intensity Residential Treatment Services
Low-Intensity Residential
Treatment Return Rates
September 2021 | 49 v

Adult SUD Treatment Services
State Average
State Average
State Average
State Average
State Average
Social Connectedness: Perception of their support system in the community at…
State Average
Admission
Discharge
Participation in Treatment Planning: Perception of participation in treatment planning
Quality and Appropriateness of Services: Perception of the quality and appropriateness of treatment services received
General Satisfaction with Services: Overall satisfaction with treatment services received
The following information represents data from those clients who agreed or strongly agreed at time of
successful discharge.
69% 75% 69% 68% 73%
88% 88% 83% 86% 89%
79% 91% 89% 88% 93%
The following two sections include data at admission into services and at successful discharge from services as
a means to demonstrate improvement in social connectedness and functioning.
Low-Intensity Residential
Treatment Services
FY17 FY18 FY19 FY20 FY21
FY21
79% 88% 87% 87% 93%
Low-Intensity Residential
Treatment Services
Low-Intensity Residential
Treatment Services
Low-Intensity Residential
Treatment Services
94%88%88%88%84%
FY17 FY18 FY19 FY20
92% 87% 83% 90%
87% 91% 88% 87% 95%
Outcome of Services: Perception of treatment outcomes as a result of services received
FY17 FY18 FY19 FY20 FY21
FY17 FY18 FY19 FY20 FY21
FY17 FY18 FY19 FY20 FY21Low-Intensity Residential
Treatment Services
Low-Intensity Residential
Treatment Services
Impact of treatment services is measured by surveying client perception of the quality of services received
including the following: general satisfaction with services, access to services, quality and appropriateness of
services, outcome of services, and participation in treatment planning. Additionally, impacts are measured by
improvements in social connectedness and overall functioning. Impact of treatment services is relevant because
clients who feel empowered, motivated, have positive family relationships, and feel they have the ability to
change may be more likely to have positive treatment outcomes.
Impact of Low-Intensity Residential Treatment Services
Access to Services: Perception of the ease and convenience of treatment services received
FY17 FY18 FY19 FY20 FY21
87%
September 2021 | 50 v

Adult SUD Treatment Services
State Average
Admission
Discharge
State Average
Admission
Discharge
State Average
Admission
Discharge
State Average
Admission
Discharge
State Average
Admission
Discharge
- 27% 20% 19% 13%
- 19% 3% 2% 2%
Detoxification Services: Clients who reported night(s) spent in a facility for detoxification within 30 days of…
FY17 FY18 FY19 FY20 FY21Low-Intensity Residential
Treatment Services
- 13% 11% 12% 10%
- 3% 3% 4% 2%
Hospital Admissions for Mental Health Care: Clients who reported hospital admission(s) for mental health care within
30 days of…
FY17 FY18 FY19 FY20 FY21Low-Intensity Residential
Treatment Services
- 13% 10% 10% 9%
- 7% 3% 1% 2%
Functioning: Perception of their mental health and social well-being at…
FY17 FY18 FY19 FY20 FY21Low-Intensity Residential
Treatment Services
Emergency Department: Clients who reported emergency department visit(s) within 30 days of…
FY17 FY18 FY19 FY20 FY21Low-Intensity Residential
Treatment Services
- 10% 7% 8% 5%
- 0% 2% 3% 5%
Utilization of High Cost Services for Low-Intensity Residential Treatment Services
High cost services include the following: treatment for illness, injury, or surgery, emergency department visits,
hospital admissions for mental health care, detoxification services, inpatient substance use disorder treatment
services, or detention in a correctional facility. Participation in treatment services may help reduce the
frequency of client utilization of high cost services. Data from FY17 and June through December FY18 are not
reported due to a change in the reporting process. The following section includes data at admission into
services and at successful discharge from services.
Illness, Injury, or Surgery: Clients who reported night(s) spent in a facility for illness, injury, or surgery within 30 days
of…
FY17 FY18 FY19 FY20 FY21Low-Intensity Residential
Treatment Services
69% 71% 71% 72% 74%
90% 91% 92% 89% 96%
September 2021 | 51 v

Adult SUD Treatment Services
State Average
Admission
Discharge
State Average
Admission
Discharge
State Average
Admission
Discharge
State Average
Admission
Discharge
State Average
Admission
Discharge
Federally Required; Discharge data includes successful and unsuccessful discharges
82% 78% 81% 83% 85%
91% 89% 93% 94% 92%
Data from FY17 and June through December FY18 are not reported for suicide attempt(s) due to a change in the
reporting process.
Quality of Life Information for Low-Intensity Residential Treatment Services
Quality of life is measured in several key life domains including the following: general health, suicide attempts,
employment status, homelessness, and other domains as shown in the tables below. Improvements in these
areas may indicate the effectiveness of treatment services. The following section includes data at admission
into services and at successful discharge from services.
Low-Intensity Residential
Treatment Services
Low-Intensity Residential
Treatment Services
FY18 FY19 FY20 FY21
FY17 FY18 FY19 FY20 FY21
- 20% 15% 16% 14%
-
Employment Status: Clients who reported employment at…
Suicide Attempts: Clients who reported suicide attempt(s) within 30 days of…
76% 11% 8% 8% 7%
47% 37% 50% 46%
FY17
43%
6% 2% 2% 1%
General Health: Clients who reported their general health as good, very good, or excellent at…
FY17 FY18 FY19 FY20 FY21Low-Intensity Residential
Treatment Services
- 63% 48% 51% 43%
- 21% 3% 3% 1%
Correctional Facility: Clients who reported night(s) spent in a correctional facility within 30 days of…
FY17 FY18 FY19 FY20 FY21Low-Intensity Residential
Treatment Services
- 34% 32% 34% 27%
- 88% 61% 56% 40%
Inpatient Substance Use Disorder Treatment Services: Clients who reported inpatient treatment services for substance
use disorders within 30 days of…
FY17 FY18 FY19 FY20 FY21Low-Intensity Residential
Treatment Services
September 2021 | 52 v

Adult SUD Treatment Services
State Average
Admission
Discharge
State Average
Admission
Discharge
State Average
Before Program
End of Program
State Average
Admission
Discharge
State Average
Admission
Discharge
Low-Intensity Residential
Treatment Services
Federally Required; Discharge data includes successful and unsuccessful discharges
Low-Intensity Residential
Treatment Services
Low-Intensity Residential
Treatment Services
Low-Intensity Residential
Treatment Services
Low-Intensity Residential
Treatment Services
89% 94%
FY17 FY18 FY19 FY21
40% 39% 38% 39% 37%
98% 100%
Engagement in Treatment Services: Clinicians who reported clients had positive or optimal engagement in treatment
services at…
Motivation to Not Use Substances: Clients who reported motivation to not use substances at…
Ability to Control Use: Clients who reported the ability to control their substance use…
FY20 FY21
28% 24% 24% 22%
18% 24%
18%
61% 43% 63% 62% 68%
89% 83%
98% 99% 100%
FY17 FY18 FY19
90%
FY20
FY20 FY21
14% 7% 2% 3% 4%
Missing School/Work: Clients who reported missing school/work due to their substance use within 30 days of…
FY17 FY18 FY19
54% 37% 28% 32% 39%
68% 73% 73% 74% 75%
FY17 FY18 FY19 FY20 FY21
FY20 FY21
15% 17% 14%
32% 32% 42% 39% 41%
Homelessness: Clients who reported homelessness at…
FY17 FY18 FY19
September 2021 | 53 v

Adult SUD Treatment Services
State Average
Admission
Discharge
Federally Required; Discharge data includes successful and unsuccessful discharges
State Average
Admission
Discharge
Trouble as a Result of Substance Use: Clients who reported getting in trouble at home, school, work, or in the
community as a result of substance use within 30 days of…
33% 30% 28% 28% 21%
9% 7% 5% 5% 5%
FY17 FY18 FY19 FY20 FY21
13% 19% 13% 14% 12%
10% 12% 11% 8% 8%
FY17 FY18 FY19 FY20 FY21Low-Intensity Residential
Treatment Services
History of Arrest: Clients who reported arrest(s) within 30 days of…
Public safety information includes history of arrest and trouble as a result of substance use. Reductions in
these areas may indicate how clients are able to positively contribute to their families and communities. The
following section includes data at admission into services and at successful discharge from services.
Public Safety Information for Low-Intensity Residential Treatment Services
Low-Intensity Residential
Treatment Services
September 2021 | 54 v

Adult SUD Treatment Services
[Page intentionally left blank]
September 2021 | 55 v

Adult SUD Treatment Services
Level 3.7 Medically-
Monitored Intensive
Inpatient Treatment
Services
September 2021 | 56 v

Adult SUD Treatment Services
[Page intentionally left blank]
September 2021 | 57 v

Adult SUD Treatment Services
Inpatient Treatment Return Rates
# of Admissions
# of Tools Submitted
Return Rate
Target Return Rate
# of Successful Discharges
# of Tools Submitted
Return Rate
Target Return Rate
State Average
Treatment Completed
Terminated by Facility
Incarcerated
Other
Inpatient Treatment Discharge
Reasons
1% 1% 1% 0% 1%
0% 1% 1% 1% 1%
Transferred to Another Facility or
Program2% 3% 2% 2% 3%
18%
4% 5% 2% 4% 5%
75% 73% 77% 76% 73%
Left Against Professional Advice 18% 18% 17% 17%
Discharge Reasons for Inpatient Treatment Services
This information is collected in STARS for those clients discharged from inpatient treatment services.
FY17 FY18 FY19 FY20 FY21
30% 53% 59% 65% 73%
60% 60% 60% 60% 60%
353 336 382 511 553
107 178 227 333 404
60% 60% 60% 60% 60%
Discharge Outcome Tool Return Rate
135 289 474 678 790
23% 54% 89% 81% 85%
Initial Outcome Tool Return Rate
581 537 533 832 933
The Data and Outcomes Work Group members set a goal for all contracted agencies to meet or exceed a 60%
outcome tool return rate for FY20.
FY17 FY18 FY19 FY20 FY21
Statewide Program Outcomes for
Level 3.7 Medically-Monitored Intensive Inpatient Treatment ServicesLevel 3.7 Medically-Monitored Intensive Inpatient Treatment Services (Inpatient Treatment Services) provide
residential treatment for individuals with severe substance use disorders. This is a reflection of the 8 agencies
who provide contracted inpatient treatment services.
Outcome Tool Return Rate Information for Inpatient Treatment Services
September 2021 | 58 v

Adult SUD Treatment Services
Inpatient Treatment Services
State Average
Inpatient Treatment Services
State Average
Inpatient Treatment Services
State Average
Inpatient Treatment Services
State Average
Inpatient Treatment Services
State Average
Social Connectedness: Perception of their support system in the community at…
Inpatient Treatment Services
State Average
Admission
Discharge
Inpatient Treatment Services
State Average
Admission
Discharge
45%
91% 92%94% 92%
Functioning: Perception of their mental health and social well-being at…
Access to Services: Perception of the ease and convenience of treatment services received
53% 53% 54% 52%
89%
FY17 FY18 FY19 FY20 FY21
62% 59% 64% 66% 63%
82% 78% 81% 83% 84%
The following two sections include data at admission into services and at successful discharge from services as
a means to demonstrate improvement in social connectedness and functioning.
FY17 FY18 FY19 FY20 FY21
91% 92% 93% 94% 89%
Participation in Treatment Planning: Perception of participation in treatment planning
FY17 FY18 FY19 FY20 FY21
88% 88% 88% 88% 89%
Outcome of Services: Perception of treatment outcomes as a result of services received
FY17 FY18 FY19 FY20 FY21
93% 94% 94% 94% 93%
Quality and Appropriateness of Services: Perception of the quality and appropriateness of treatment services received
FY17 FY18 FY19 FY20 FY21
91% 88% 91% 92% 91%
FY17 FY18 FY19 FY20 FY21
93% 97% 95% 95% 92%
Impact of treatment services is measured by surveying client perception of the quality of services received
including the following: general satisfaction with services, access to services, quality and appropriateness of
services, outcome of services, and participation in treatment planning. Additionally, impacts are measured by
improvements in social connectedness and overall functioning. Impact of treatment services is relevant because
clients who feel empowered, motivated, have positive family relationships, and feel they have the ability to
change may be more likely to have positive treatment outcomes.
The following information represents data from those clients who agreed or strongly agreed at time of
successful discharge.
General Satisfaction with Services: Overall satisfaction with treatment services received
FY17 FY18 FY19 FY20 FY21
Impact of Inpatient Treatment Services
September 2021 | 59 v

Adult SUD Treatment Services
Inpatient Treatment Services
State Average
Admission
Discharge
Inpatient Treatment Services
State Average
Admission
Discharge
Inpatient Treatment Services
State Average
Admission
Discharge
Inpatient Treatment Services
State Average
Admission
Discharge
Inpatient Treatment Services
State Average
Admission
Discharge
FY17 FY18 FY19 FY20 FY21
Emergency Department: Clients who reported emergency department visit(s) within 30 days of…
Illness, Injury, or Surgery: Clients who reported night(s) spent in a facility for illness, injury, or surgery within 30 days
of…
High cost services include the following: treatment for illness, injury, or surgery, emergency department visits,
hospital admissions for mental health care, detoxification services, or detention in a correctional facility.
Participation in treatment services may help reduce the frequency of client utilization of high cost services.
Data from FY17 and June through December FY18 are not reported due to a change in the reporting process.
The following section includes data at admission into services and at successful discharge from services.
Utilization of High Cost Services for Inpatient Treatment Services
- 15% 13% 14% 16%
- 12% 11% 10% 9%
42% 34% 12%
FY17 FY18 FY19 FY20 FY21
- 45% 40% 43% 38%
- 47%
Correctional Facility: Clients who reported night(s) spent in a correctional facility within 30 days of…
- 28% 51% 48% 34%
- 38% 31% 34% 38%
FY17 FY18 FY19 FY20 FY21
- 17% 19% 19% 19%
- 20% 19% 21% 21%
FY17 FY18 FY19 FY20 FY21
Detoxification Services: Clients who reported night(s) spent in a facility for detoxification within 30 days of…
- 25% 23% 25% 24%
- 23% 24% 16% 11%
FY17 FY18 FY19 FY20 FY21
Hospital Admissions for Mental Health Care: Clients who reported hospital admission(s) for mental health care within
30 days of…
September 2021 | 60 v

Adult SUD Treatment Services
Inpatient Treatment Services
State Average
Admission
Discharge
Inpatient Treatment Services
State Average
Admission
Discharge
Inpatient Treatment Services
State Average
Admission
Discharge
Inpatient Treatment Services
State Average
Admission
Discharge
Federally Required; Discharge data includes successful and unsuccessful discharges
Inpatient Treatment Services
State Average
Admission
Discharge
Inpatient Treatment Services
State Average
Before Program
End of Program
Federally Required; Due to STARS limitations, both adult and youth population are included; Discharge data includes
successful and unsuccessful discharges
23% 29% 31% 30% 32%
99% 98% 98% 97% 97%
Ability to Control Use: Clients who reported the ability to control their substance use…
FY17 FY18 FY19 FY20 FY21
47% 39% 42% 42% 41%
17% 11% 9% 13% 14%
Missing School/Work: Clients who reported missing school/work due to their substance use within 30 days of…
FY17 FY18 FY19 FY20 FY21
6% 13% 7% 14% 13%
16% 13% 11% 13% 16%
Homelessness: Clients who reported homelessness at…
FY17 FY18 FY19 FY20 FY21
43% 11% 12% 14% 13%
65% 9% 11% 12% 12%
FY17 FY18 FY19 FY20 FY21
- 28% 18% 20% 21%
- 24% 13% 13% 9%
Employment Status: Adult and youth clients who reported employment at…
Suicide Attempts: Clients who reported suicide attempt(s) within 30 days of…
FY17 FY18 FY19 FY20 FY21
Data from FY17 and June through December FY18 are not reported for suicide attempt(s) due to a change in
the reporting process.
General Health: Clients who reported their general health as good, very good, or excellent at…
Quality of life is measured in several key life domains including the following: general health, suicide attempts,
employment status, homelessness, and other domains as shown in the tables below. Improvements in these
areas may indicate the effectiveness of treatment services. The following section includes data at admission
into services and at successful discharge from services.
Quality of Life Information for Inpatient Treatment Services
92% 87% 87% 91% 87%
63% 60% 64% 67% 61%
FY17 FY18 FY19 FY20 FY21
September 2021 | 61 v

Adult SUD Treatment Services
Inpatient Treatment Services
State Average
Admission
Discharge
Inpatient Treatment Services
State Average
Admission
Discharge
Inpatient Treatment Services
State Average
Admission
Discharge
Federally Required; Discharge data includes successful and unsuccessful discharges
Inpatient Treatment Services
State Average
Admission
Discharge
24% 32% 27% 34% 25%
70% 73% 71% 74% 84%
Engagement in Treatment Services: Clinicians who reported clients had positive or optimal engagement in treatment
services at…
50% 51% 49% 53% 49%
20% 15% 13% 16% 15%
FY17 FY18 FY19 FY20 FY21
13% 9% 11% 11% 12%
3% 2% 2% 1% 1%
Public Safety Information for Inpatient Treatment Services
Public safety information includes history of arrest and trouble as a result of substance use. Reductions in
these areas may indicate how clients are able to positively contribute to their families and communities. The
following section includes data at admission into services and at successful discharge from services.
History of Arrest: Clients who reported arrest(s) within 30 days of…
FY17 FY18 FY19 FY20 FY21
Trouble as a result of Substance Use: Clients who reported getting in trouble at home, school, work, or in the
community as a result of substance use within 30 days of…
FY17 FY18 FY19 FY20 FY21
50% 25% 46% 42% 39%
86% 65% 79% 81% 83%
Motivation to Not Use Substances: Clients who reported motivation to not use substances at…
FY17 FY18 FY19 FY20 FY21
September 2021 | 62 v

Adult SUD Treatment Services
[Page intentionally left blank]
September 2021 | 63 v

Adult SUD Treatment Services
Intensive
Methamphetamine
Treatment (IMT) Services
September 2021 | 64 v

Adult SUD Treatment Services
[Page intentionally left blank]
September 2021 | 65 v

Adult SUD Treatment Services
# of Admissions
# of Tools Submitted
Return Rate
Target Return Rate
# of Successful Discharges
# of Tools Submitted
Return Rate
Target Return Rate
IMT Discharge Reasons
State Average
Treatment Completed
Terminated by Facility
Incarcerated
Other
FY17 FY18 FY19 FY20 FY21
-
2% 17% 11%
35%
- 6% 11% 5% 8%
- 41% 31% 35% 40%
Left Against Professional Advice - 38% 51% 37%
Transferred to Another Facility or
Program- 3%
This information is collected in STARS for clients discharged from IMT services. The DBH has set a
benchmark of a 45% successful completion rate.
- 7% 2% 4% 5%
- 4% 2% 3% 2%
35% 100% 88% 78%
- 60% 100% 100% 100%
- 51 39 97 131
- 18 39 85 102
- 60% 100% 100% 100%
- 41 166 249 272
- 54% 92% 79% 79%
Discharge Outcome Tool Return Rate
- 76 180 314 345
Starting in FY19, the DBH set a goal of a 100% outcome tool return rate for IMT services.
FY17 FY18 FY19 FY20 FY21
Statewide Program Outcomes for Intensive Methamphetamine TreatmentIntensive Methamphetamine Treatment (IMT) services support treatment for individuals with severe
methamphetamine use disorder. IMT services offer long-term treatment with multiple entry points into services
to address the needs of each individual. This is a reflection of the 6 agencies who provide contracted IMT
services.
Outcome Tool Return Rate Information for IMT Services
Initial Outcome Tool Return Rate
IMT Return Rates
Discharge Reasons for IMT Services
September 2021 | 66 v

Adult SUD Treatment Services
IMT Services
State Average
IMT Services
State Average
IMT Services
State Average
IMT Services
State Average
IMT Services
State Average
Social Connectedness: Perception of their support system in the community at…
IMT Services
State Average
Admission
Discharge
IMT Services
State Average
Admission
Discharge
FY21
92% 60% 89% 94% 93%
FY17 FY18 FY19
Functioning: Perception of their mental health and social well-being at…
General Satisfaction with Services: Overall satisfaction with treatment services received
The following information represents data from those clients who agreed or strongly agreed at time of
successful discharge.
FY20
Outcome of Services: Perception of treatment outcomes as a result of services received
FY17 FY18 FY19
Participation in Treatment Planning: Perception of participation in treatment planning
FY21
92% 67%
74% 58%
FY20
Impact of treatment services is measured by surveying client perception of the quality of services received
including the following: general satisfaction with services, access to services, quality and appropriateness of
services, outcome of services, and participation in treatment planning. Additionally, impacts are measured by
improvements in social connectedness and overall functioning. Impact of treatment services is relevant because
clients who feel empowered, motivated, have positive family relationships, and feel they have the ability to
change may be more likely to have positive treatment outcomes.
97% 95%
FY17 FY18 FY19 FY20 FY21
72% 63% 71% 75% 73%
92% 67% 89% 94% 93%
70% 70% 65%
92% 60% 91%
The following two sections include data at admission into services and at successful discharge from services as
a means to demonstrate improvement in social connectedness and functioning.
FY17 FY18 FY19 FY20 FY21
100% 100% 91% 92% 94%
91% 90%
Access to Services: Perception of the ease and convenience of treatment services received
FY17 FY18 FY19 FY20 FY21
91% 93% 95%
Quality and Appropriateness of Services: Perception of the quality and appropriateness of treatment services received
FY17 FY18 FY19 FY20 FY21
85% 67% 89%
96%
FY17 FY18 FY19 FY20 FY21
Impact of IMT Services
92% 75% 86% 92%
September 2021 | 67 v

Adult SUD Treatment Services
IMT Services
State Average
Admission
Discharge
IMT Services
State Average
Admission
Discharge
IMT Services
State Average
Admission
Discharge
IMT Services
State Average
Admission
Discharge
IMT Services
State Average
Admission
Discharge
Detoxification Services: Clients who reported night(s) spent in a facility for detoxification within 30 days of…
Hospital Admissions for Mental Health Care: Clients who reported hospital admission(s) for mental health care within
30 days of…
Illness, Injury, or Surgery: Clients who reported night(s) spent in a facility for illness, injury, or surgery within 30 days
of…
High cost services include the following: treatment for illness, injury, or surgery, emergency department visits,
hospital admissions for mental health care, detoxification services, or detention in a correctional facility.
Participation in treatment services may help reduce the frequency of client utilization of high cost services.
Data from FY17 and June through December FY18 are not reported due to a change in the reporting process.
The following section includes data at admission into services and at successful discharge from services.
Utilization of High Cost Services for IMT Services
- 78% 66% 71% 56%
- 50% 17% 5% 2%
FY17 FY18 FY19 FY20 FY21
Correctional Facility: Clients who reported night(s) spent in a correctional facility within 30 days of…
- 29% 18% 15% 10%
- 0% 0% 6% 5%
FY17 FY18 FY19 FY20 FY21
9% 7% 7%
- 0% 6% 1% 1%
FY17 FY18 FY19 FY20 FY21
- 26% 12% 11% 7%
- 0% 6% 2% 2%
- 24%
FY17 FY18 FY19 FY20 FY21
- 6% 12% 7% 7%
- 17% 6% 1% 1%
FY17 FY18 FY19 FY20 FY21
Emergency Department: Clients who reported emergency department visit(s) within 30 days of…
September 2021 | 68 v

Adult SUD Treatment Services
IMT Services
State Average
Admission
Discharge
IMT Services
State Average
Admission
Discharge
IMT Services
State Average
Admission
Discharge
Federally Required; Discharge data includes successful and unsuccessful discharges
IMT Services
State Average
Admission
Discharge
Federally Required; Discharge data includes successful and unsuccessful discharges
IMT Services
State Average
Admission
Discharge
IMT Services
State Average
Before Admission
End of Program
28% 24% 31%
94% 96%
FY17
Ability to Control Use: Clients who reported the ability to control their substance use…
Missing School/Work: Clients who reported missing school/work due to their substance use within 30 days of…
Homelessness: Clients who reported homelessness at…
Employment Status: Clients who reported employment at…
Suicide Attempts: Clients who reported suicide attempt(s) within 30 days of…
Data from FY17 and June through December FY18 are not reported for suicide attempt(s) due to a change in
the reporting process.
General Health: Clients who reported their general health as good, very good, or excellent at…
Quality of life is measured in several key life domains including the following: general health, suicide attempts,
employment status, homelessness, and other domains as shown in the tables below. Improvements in these
areas may indicate the effectiveness of treatment services. The following section includes data at admission
into services and at successful discharge from services.
Quality of Life Information for IMT Services
35% 35%
92% 96% 100%
FY18 FY19 FY20 FY21
22% 20% 26% 27% 23%
0% 4% 0% 1% 5%
FY17 FY18 FY19 FY20 FY21
- 20% 10% 13% 20%
- 30% 41% 36% 29%
FY17 FY18 FY19 FY20 FY21
- 24% 9% 7% 9%
- 54% 43% 38% 48%
FY17 FY18 FY19 FY20 FY21
- 28% 24% 19% 10%
- 17% 0% 0% 1%
FY17 FY18 FY19 FY20 FY21
78% 82% 79% 79% 83%
85% 91% 90% 91% 91%
FY17 FY18 FY19 FY20 FY21
September 2021 | 69 v

Adult SUD Treatment Services
IMT Services
State Average
Admission
Discharge
IMT Services
State Average
Admission
Discharge
IMT Services
State Average
Admission
Discharge
Federally Required; Discharge data includes successful and unsuccessful discharges
IMT Services
State Average
Admission
Discharge
Matrix Training
Matrix Key Supervisor Trainings
Motivation to Not Use Substances: Clients who reported motivation to not use substances at…
11% 11% 10%
25% 26% 21% 36% 28%
0% 4% 0% 4% 5%
Trouble as a Result of Substance Use: Clients who reported getting in trouble at home, school, work, or in the
community as a result of substance use within 30 days of…
FY17 FY18 FY19 FY20 FY21
11%
FY17 FY18 FY19 FY20 FY21
89% 58% 43% 47% 45%
92% 78% 75% 81% 79%
- 12%
History of Arrest: Clients who reported arrest(s) within 30 days of…
Public safety information includes history of arrest and trouble as a result of substance use. Reductions in
these areas may indicate how clients are able to positively contribute to their families and communities. The
following section includes data at admission into services and at successful discharge from services.
Public Safety Information for IMT Services
16% 15% 9%
-
FY17 FY18 FY19 FY20 FY21
81% 45% 59% 56% 53%
81% 74% 92% 88% 87%
FY17 FY18 FY19 FY20 FY21
Engagement in Treatment Services: Clinicians who reported clients had positive or optimal engagement in treatment
services at…
Performance Measures for IMT Services
IMT Service Curriculum Trainings
The DBH contracts with the Matrix Clare Foundation to provide Matrix and Key Supervisor trainings for
continued skill development.
IMT Services FY17 FY18 FY19 FY20 FY21
- - 1 2 3
- - 1 2 2
September 2021 | 70 v

Adult SUD Treatment Services
[Page intentionally left blank]
September 2021 | 71 v

Adult SUD Treatment Services
Pregnant Woman and
Women with Dependent
Children Program
September 2021 | 72 v

Adult SUD Treatment Services
[Page intentionally left blank]
September 2021 | 73 v

Adult SUD Treatment Services
# of Admissions
# of Tools Submitted
Return Rate
Target Return Rate
# of Successful Discharges
# of Tools Submitted
Return Rate
Target Return Rate
State Average
Treatment Completed
Terminated by Facility
Incarcerated
Other
Statewide Program Outcomes for
Pregnant Women and Women with Dependant Children Program
The Pregnant Women and Women with Dependant Children Program includes Low Intensity residential
Treatment Services (3.1 Services) and Inpatient Treatment Services (3.7 Services) from Behavior Management
Services and Volunteers of America. This program focuses on aiding women who struggle with substance use
and are the caregivers for children or are expectant mothers.
Outcome Tool Return Rate Information for Pregnant Women and Women with Dependant
Children Program
The Data and Outcomes Work Group members set a goal for all contracted agencies to meet or exceed a 60%
outcome tool return rate for FY21.
Pregnant Women and Women with
Dependant Children Program
Return Rates
FY17 FY18 FY19 FY20 FY21
Initial Outcome Tool Return Rate
133 116 117 169 145
66 76 86 168 139
50% 66% 74% 99% 96%
60% 60% 60% 60% 60%
62 37 37 68 29
27 31 33 50 17
44% 84% 89% 74% 59%
60% 60% 60% 60% 60%
Discharge Reasons for Pregnant Women and Women with Dependant Children Program
This information is collected in STARS for clients discharged from the Pregnant Women and Women with
Dependant Children Program.
Pregnant Women and Women with
Dependant Children Program
Discharge Reasons
FY17 FY18 FY19 FY20 FY21
51% 46% 44% 50% 38%
Left Against Professional Advice 40% 39% 48%30% 41%
13% 8% 8% 6% 12%
Transferred to Another Facility or
Program5% 1% 3% 4% 0%
1% 4% 4% 1% 2%
0% 0% 1% 0% 0%
September 2021 | 74 v

Adult SUD Treatment Services
State Average
State Average
State Average
State Average
State Average
Impact of Pregnant Women and Women with Dependant Children Program
Impact of treatment services is measured by surveying client perception of the quality of services received
including the following: general satisfaction with services, access to services, quality and appropriateness of
services, outcome of services, and participation in treatment planning. Additionally, impacts are measured by
improvements in social connectedness and overall functioning. Impact of treatment services is relevant because
clients who feel empowered, motivated, have positive family relationships, and feel they have the ability to
change may be more likely to have positive treatment outcomes.
The following information represents data from those clients who agreed or strongly agreed at time of
successful discharge.
General Satisfaction with Services: Overall satisfaction with treatment services received
Pregnant Women and Women with
Dependant Children ProgramFY17 FY18 FY19 FY20 FY21
100% 100% 100% 95% 85%
Access to Services: Perception of the ease and convenience of treatment services received
Pregnant Women and Women with
Dependant Children ProgramFY17 FY18 FY19 FY20 FY21
100% 100% 100% 98% 85%
Quality and Appropriateness of Services: Perception of the quality and appropriateness of treatment services received
Pregnant Women and Women with
Dependant Children ProgramFY17 FY18 FY19 FY20 FY21
100% 100% 100% 95% 95%
Outcome of Services: Perception of treatment outcomes as a result of services received
Pregnant Women and Women with
Dependant Children ProgramFY17 FY18 FY19 FY20 FY21
100% 100% 88% 93% 95%
Participation in Treatment Planning: Perception of participation in treatment planning
Pregnant Women and Women with
Dependant Children ProgramFY17 FY18 FY19 FY20 FY21
100% 100% 100% 98% 90%
September 2021 | 75 v

Adult SUD Treatment Services
Social Connectedness: Perception of their support system in the community at…
State Average
Admission
Discharge
State Average
Admission
Discharge
The following two sections include data at admission into services and at successful discharge from services as
a means to demonstrate improvement in social connectedness and functioning.
Pregnant Women and Women with
Dependant Children ProgramFY17 FY18 FY19 FY20 FY21
62% 65% 67% 71% 70%
100% 100% 92% 95% 95%
Functioning: Perception of their mental health and social well-being at…
Pregnant Women and Women with
Dependant Children ProgramFY17 FY18 FY19 FY20 FY21
50% 65% 45% 59% 65%
100% 100% 100% 95% 100%
September 2021 | 76 v

Adult SUD Treatment Services
State Average
Admission
Discharge
State Average
Admission
Discharge
State Average
Admission
Discharge
State Average
Admission
Discharge
Utilization of High Cost Services for Pregnant Women and Women with Dependant Children Program
High cost services include the following: treatment for illness, injury, or surgery, emergency department visits,
hospital admissions for mental health care, detoxification services, inpatient substance use disorder treatment
services, or detention in a correctional facility. Participation in treatment services may help reduce the
frequency of client utilization of high cost services. Data from FY17 and June through December FY18 are not
reported due to a change in the reporting process. The following section includes data at admission into
services and at successful discharge from services.
Illness, Injury, or Surgery: Clients who reported night(s) spent in a facility for illness, injury, or surgery within 30 days
of…
Pregnant Women and Women with
Dependant Children ProgramFY17 FY18 FY19 FY20 FY21
- 3% 3% 6% 6%
- 0% 0% 0% 10%
Emergency Department: Clients who reported emergency department visit(s) within 30 days of…
Pregnant Women and Women with
Dependant Children ProgramFY17 FY18 FY19 FY20 FY21
- 3% 6% 10% 6%
- 0% 0% 0% 0%
Hospital Admissions for Mental Health Care: Clients who reported hospital admission(s) for mental health care within
30 days of…
Pregnant Women and Women with
Dependant Children ProgramFY17 FY18 FY19 FY20 FY21
- 0% 1% 4% 3%
- 0% 4% 2% 20%
Detoxification Services: Clients who reported night(s) spent in a facility for detoxification within 30 days of…
Pregnant Women and Women with
Dependant Children ProgramFY17 FY18 FY19 FY20 FY21
- 15% 15% 16% 12%
- 0% 0% 0% 0%
September 2021 | 77 v

Adult SUD Treatment Services
State Average
Admission
Discharge
This program includes level 3.7 Inpatient Treatment so increases from admission to discharge are expected.
State Average
Admission
Discharge
State Average
Admission
Discharge
State Average
Admission
Discharge
Inpatient Substance Use Disorder Treatment Services: Clients who reported inpatient treatment services for substance
use disorders within 30 days of…
Pregnant Women and Women with
Dependant Children ProgramFY17 FY18 FY19 FY20 FY21
- 25% 15% 30% 11%
- 100% 94% 94% 100%
Correctional Facility: Clients who reported night(s) spent in a correctional facility within 30 days of…
Pregnant Women and Women with
Dependant Children ProgramFY17 FY18 FY19 FY20 FY21
- 24% 21% 30% 29%
- 0% 0% 0% 0%
Quality of Life Information for Pregnant Women and Women with Dependant Children Program
Quality of life is measured in several key life domains including the following: general health, suicide attempts,
employment status, homelessness, and other domains as shown in the tables below. Improvements in these
areas may indicate the effectiveness of treatment services. The following section includes data at admission
into services and at successful discharge from services.
General Health: Clients who reported their general health as good, very good, or excellent at…
Pregnant Women and Women with
Dependant Children ProgramFY17 FY18 FY19 FY20 FY21
61% 68% 67% 68% 72%
100% 96% 97% 94% 86%
Data from FY17 and June through December FY18 are not reported for suicide attempt(s) due to a change in the
reporting process.
Suicide Attempts: Clients who reported suicide attempt(s) within 30 days of…
Pregnant Women and Women with
Dependant Children ProgramFY17 FY18 FY19 FY20 FY21
- 43% 34% 24% 25%
- 0% 0% 0% 0%
September 2021 | 78 v

Adult SUD Treatment Services
State Average
Admission
Discharge
State Average
Admission
Discharge
State Average
Admission
Discharge
State Average
Before Program
End of Program
State Average
Admission
Discharge
State Average
Admission
Discharge
Employment Status: Clients who reported employment at…
Pregnant Women and Women with
Dependant Children ProgramFY17 FY18 FY19 FY20 FY21
80% 3% 6% 9% 3%
70% 18% 20% 33% 30%
Federally Required; Discharge data includes successful and unsuccessful discharges
Homelessness: Clients who reported homelessness at…
Pregnant Women and Women with
Dependant Children ProgramFY17 FY18 FY19 FY20 FY21
24% 25% 22% 21% 30%
31% 23% 34% 28% 32%
Federally Required; Discharge data includes successful and unsuccessful discharges
Missing School/Work: Clients who reported missing school/work due to their substance use within 30 days of…
Pregnant Women and Women with
Dependant Children ProgramFY17 FY18 FY19 FY20 FY21
47% 32% 34% 29% 20%
0% 0% 0% 0% 0%
Ability to Control Use: Clients who reported the ability to control their substance use…
Pregnant Women and Women with
Dependant Children ProgramFY17 FY18 FY19 FY20 FY21
38% 13% 23% 26% 30%
100% 100% 100% 100% 100%
Motivation to Not Use Substances: Clients who reported motivation to not use substances at…
Pregnant Women and Women with
Dependant Children ProgramFY17 FY18 FY19 FY20 FY21
55% 33% 56% 56% 56%
100% 84% 97% 92% 100%
Engagement in Treatment Services: Clinicians who reported clients had positive or optimal engagement in treatment
services at…
Pregnant Women and Women with
Dependant Children ProgramFY17 FY18 FY19 FY20 FY21
10% 31% 48%
100% 100% 90% 90% 85%
19% 18%
September 2021 | 79 v

Adult SUD Treatment Services
State Average
Admission
Discharge
Federally Required; Discharge data includes successful and unsuccessful discharges
State Average
Admission
Discharge
Public Safety Information for Pregnant Women and Women with Dependant Children Program
Public safety information includes history of arrest and trouble as a result of substance use. Reductions in
these areas may indicate how clients are able to positively contribute to their families and communities. The
following section includes data at admission into services and at successful discharge from services.
History of Arrest: Clients who reported arrest(s) within 30 days of…
Pregnant Women and Women with
Dependant Children ProgramFY17 FY18 FY19 FY20 FY21
36% 35% 38% 36% 28%
0% 0% 3% 0% 0%
29% 23% 25% 23% 21%
6% 8% 8% 4% 3%
Trouble as a Result of Substance Use: Clients who reported getting in trouble at home, school, work, or in the
community as a result of substance use within 30 days of…
Pregnant Women and Women with
Dependant Children ProgramFY17 FY18 FY19 FY20 FY21
September 2021 | 80 v

Youth SUD Treatment Services
Youth SUD
Treatment Services
September 2021 | 81 v

Youth SUD Treatment Services
[Page intentionally left blank]
September 2021 | 82 v

Youth SUD Treatment Services
# of Admissions
# of Tools Submitted
Return Rate
Target Return Rate
# of Successful Discharges
# of Tools Submitted
Return Rate
Target Return Rate
State Average
Treatment Completed
Terminated by Facility
Incarcerated
Other
SUD Treatment Return Rates
- 2% 1% 1% 1%
- 30% 8% 5% 6%
Transferred to Another Facility or
Program- 6% 9% 8% 4%
16%
- 11% 8% 10% 8%
- 51% 56% 59% 65%
Left Against Professional Advice - 24% 19% 16%
Discharge Reasons for SUD Treatment Services
This information is collected in STARS for youth discharged from SUD treatment services. The DBH has set a
benchmark of a 70% successful completion rate.
FY17 FY18 FY19 FY20 FY21
Statewide Program Outcomes for SUD Treatment Services
- 60% 60% 60% 60%
Discharge Outcome Tool Return Rate
- 251 345 445 309
- 45% 65% 85% 79%
Initial Outcome Tool Return Rate
- 562 532 523 389
- 47% 70% 84% 72%
- 60% 60%
SUD Treatment Discharge
Reasons
The DBH accredits and contracts with SUD treatment agencies across the state to provide quality treatment
services to youth. This is a reflection of the 17 agencies who provide contracted treatment services. The
information below includes youth in Outpatient Treatment Services that include Level 0.5 Early Intervention,
Level 1.0 Outpatient, and Level 2.1 Intensive Outpatient Treatment Services and Psychiatric Residential
Treatment Facility (PRTF) treatment services.
Outcome Tool Return Rate Information for SUD Treatment Services
The Data and Outcomes Work Group members set a goal for all contracted agencies to meet or exceed a 60%
outcome tool return rate for FY20.
FY17 FY18 FY19 FY20 FY21
60% 60%
- 243 254 256 195
- 115 179 216 140
September 2021 | 83 v

Youth SUD Treatment Services
State Primary SUD Diagnosis
SUD Treatment Services
State Average
SUD Treatment Services
State Average
SUD Treatment Services
State Average
SUD Treatment Services
State Average - 82% 84% 83% 84%
Outcome of Services: Perception of treatment outcomes as a result of services received
FY17 FY18 FY19 FY20 FY21
- 89% 88% 88% 89%
Cultural Sensitivity: Perception of staff sensitivity to cultural beliefs
FY17 FY18 FY19 FY20 FY21
- 80% 81% 85% 88%
Access to Services: Perception of the ease and convenience of treatment services received
FY17 FY18 FY19 FY20 FY21
- 89% 95% 93% 92%
Impact of treatment services is measured by surveying youth perception of the quality of services received
including the following: general satisfaction with services, access to services, cultural sensitivity, outcome of
services, and participation in treatment planning. Additionally, impacts are measured by improvements in
social connectedness and overall functioning. Impact of treatment services is relevant because youth who feel
empowered, motivated, have positive family relationships, and feel they have the ability to change may be
more likely to have positive treatment outcomes.
The following information represents data from those youth who agreed or strongly agreed at time of
successful discharge.
General Satisfaction with Services: Overall satisfaction with treatment services received
FY17 FY18 FY19 FY20 FY21
2% 2% 3% 2% 3%
Impact of SUD Treatment Services
1% 1% 0.2% 0%
Number/Percent of Youth with a
Primary Other Substance Use
Disorder
12 11 11 11 12
5% 8% 13%
Number/Percent of Youth with a
Primary Opioid Use Disorder
3 7 6 1 1
1%
59% 52%
Number/Percent of Youth with a
Primary Amphetamine Use Disorder
30 19 19 35 51
6% 3%
28%
Number/Percent of Youth with a
Primary Cannabis Use Disorder
315 319 262 271 203
63% 58% 63%
Number/Percent of Youth with a
Primary Alcohol Use Disorder
131 200 121 152 110
26% 36% 29% 33%
Primary Diagnostic Information for SUD Treatment ServicesThe DBH monitors data and outcomes for publicly funded behavioral health treatment services. The table
below reflects information entered into STARS by contracted providers for publicly funded youth receiving
SUD treatment services. This does not include individuals who received only an assessment or youth who
received targeted services for justice-involved youth.
FY17 FY18 FY19 FY20 FY21
September 2021 | 84 v

Youth SUD Treatment Services
SUD Treatment Services
State Average
Social Connectedness: Perception of their support system in the community at…
SUD Treatment Services
State Average
Admission
Discharge
SUD Treatment Services
State Average
Admission
Discharge
Admission
Discharge
Admission
Discharge
Admission
Discharge
- 58% 51% 51% 50%
- 10% 17% 15% 13%
State Average
Substance Disorder: Measures SUD symptoms at…
Substance Disorder Screener FY17 FY18 FY19 FY20 FY21
- 64% 61% 61% 59%
- 59% 51% 58% 53%
State Average
Externalizing Disorder: Measures attention deficits, hyperactivity, impulsivity, conduct problems, and/or
other impulse control disorders at…
Externalizing Disorder Screener FY17 FY18 FY19 FY20 FY21
- 68% 69% 69% 75%
- 72% 67% 68% 68%
State Average
GAIN Short Screener (GAIN-SS) Scoring
The GAIN-SS is used as a simple measure of change after intervals of a month or more. The following tables
report the information gathered at admission into services and at successful discharge from services. These
results can be used at the group level as an outcome measure by monitoring over time.
Internalizing Disorder: Measures somatic complaints, depression, anxiety, trauma, suicide, and other serious
mental illness at…
Internalizing Disorder Screener FY17 FY18 FY19 FY20 FY21
- 64% 67% 68% 67%
- 82% 84% 83% 83%
Functioning: Perception of their mental health and social well-being at…
FY17 FY18 FY19 FY20 FY21
- 79% 84% 82% 81%
- 87% 95% 92% 89%
The following two sections include data at admission into services and at successful discharge from services
as a means to demonstrate improvement in social connectedness and functioning.
FY17 FY18 FY19 FY20 FY21
- 90% 91% 88% 92%
Participation in Treatment Planning: Perception of participation in treatment planning
FY17 FY18 FY19 FY20 FY21
September 2021 | 85 v

Youth SUD Treatment Services
Admission
Discharge
SUD Treatment Services
State Average
Admission
Discharge
SUD Treatment Services
State Average
Admission
Discharge
SUD Treatment Services
State Average
Admission
Discharge
SUD Treatment Services
State Average
Admission
Discharge
SUD Treatment Services
State Average
Admission
Discharge
- 46% 41% 39% 36%
- 60% 31% 20% 7%
Correctional Facility: Youth who reported night(s) spent in a correctional facility within 30 days of…
FY17 FY18 FY19 FY20 FY21
- 25% 11% 9% 14%
- 70% 8% 0% 63%
Inpatient Substance Use Disorder Treatment Services: Youth who reported inpatient treatment services for
substance use disorders within 30 days of…
FY17 FY18 FY19 FY20 FY21
- 18% 16% 15% 17%
- 27% 15% 12% 8%
Hospital Admissions for Mental Health Care: Youth who reported a hospital admission(s) for mental health care
within 30 days of…
FY17 FY18 FY19 FY20 FY21
- 20% 19% 17% 21%
- 26% 22% 12% 8%
Emergency Department: Youth who reported emergency department visit(s) within 30 days of…
FY17 FY18 FY19 FY20 FY21
- 13% 8% 7% 8%
- 12% 9% 5% 4%
Utilization of High Cost Services for SUD Treatment Services
High cost services include the following: treatment for illness, injury, or surgery, emergency department
visits, hospital admissions for mental health care, inpatient substance use disorder treatment services, or
detention in a correctional facility. Participation in treatment services may help reduce the frequency of youth
utilization of high cost services. The following section includes data at admission into services and at
successful discharge from services.
Illness, Injury, or Surgery: Youth who reported night(s) spent in a facility for illness, injury, or surgery within 30 days
of…
FY17 FY18 FY19 FY20 FY21
- 41% 40% 38% 39%
- 21% 12% 13% 13%
State Average
Crime/Violence: Measures interpersonal violence, drug-related crimes, property crimes, and
interpersonal/violent crimes at…
Crime/Violence Screener FY17 FY18 FY19 FY20 FY21
September 2021 | 86 v

Youth SUD Treatment Services
SUD Treatment Services
State Average
Admission
Discharge
SUD Treatment Services
State Average
Admission
Discharge
SUD Treatment Services
State Average
Admission
Discharge
SUD Treatment Services
State Average
Admission
Discharge
SUD Treatment Services
State Average
Admission
Discharge
SUD Treatment Services
State Average
Before Admission
End of Program
Federally Required; Discharge data includes successful and unsuccessful discharges
- 21% 27% 25% 34%
- 90% 92% 92% 93%
Ability to Control Use: Youth who reported the ability to control their substance use…
FY17 FY18 FY19 FY20 FY21
- 33% 31% 35% 30%
- 19% 17% 18% 11%
Missing School/Work: Youth who reported missing school/work due to their substance use within 30 days of…
FY17 FY18 FY19 FY20 FY21
- 0% 0% 1% 1%
- 1% 1% 0% 0%
Homelessness: Youth who reported homelessness at…
FY17 FY18 FY19 FY20 FY21
- 33% 34% 33% 30%
- 44% 46% 45% 45%
Federally Required; Due to STARS limitations, both adult and youth population are included; Discharge data includes
successful and unsuccessful discharges
Employment Status: Adult and youth clients who reported employment at…
FY17 FY18 FY19 FY20 FY21
- 25% 23% 24% 34%
- 34% 32% 23% 9%
Suicide Attempts: Youth who reported suicide attempt(s) within 30 days of…
FY17 FY18 FY19 FY20 FY21
- 83% 84% 85% 84%
- 92% 95% 97% 91%
Quality of Life Information for SUD Treatment Services
Quality of life is measured in several key life domains including the following: general health, suicide
attempts, employment status, homelessness, and other domains as shown in the tables below. Improvements in
these areas may indicate the effectiveness of treatment services. The following section includes data at
admission into services and at successful discharge from services.
General Health: Youth who reported their general health as good, very good, or excellent at…
FY17 FY18 FY19 FY20 FY21
September 2021 | 87 v

Youth SUD Treatment Services
SUD Treatment Services
State Average
Admission
Discharge
SUD Treatment Services
Admission
Discharge
SUD Treatment Services
State Average
Admission
Discharge
Federally Required; Discharge data includes successful and unsuccessful discharges
SUD Treatment Services
State Average
Admission
Discharge
56% 52%
Engagement in Treatment Services: Clinicians who reported youth had positive or optimal engagement in treatment
services at…
- 53% 53% 54% 50%
- 23% 21% 20% 14%
Trouble as a Result of Substance Use: Youth who reported getting in trouble at home, school, work, or in the
community as a result of substance use within 30 days of…
FY17 FY18 FY19 FY20 FY21
- 29% 25% 25% 26%
- 10% 8% 11% 14%
Public Safety Information for SUD Treatment Services
History of Arrest: Youth who reported arrest(s) within 30 days of…
FY17 FY18 FY19 FY20 FY21
- 30% 52% 54% 52%
- 43% 69% 72% 70%
FY17 FY18 FY19 FY20 FY21
- 35% 36% 32% 31%
- 64% 68%
Public safety information includes history of arrest and trouble as a result of substance use. Reductions in
these areas may indicate how youth are able to positively contribute to their families and communities. The
following section includes data at admission into services and at successful discharge from services.
Motivation to Not Use Substances: Youth who reported motivation to not use substances at…
FY17 FY18 FY19 FY20 FY21
September 2021 | 88 v

Youth SUD Treatment Services
SUD Treatment Return Rates
# of Admissions
# of Tools Submitted
Return Rate
Target Return Rate
# of Successful Discharges
# of Tools Submitted
Return Rate
Target Return Rate
SUD Treatment Services
State Average
SUD Treatment Services
State Average
SUD Treatment Services
State Average
SUD Treatment Services
State Average - 80% 77% 83% 80%
Outcome of Services: Parent/Guardian perception of treatment outcomes as a result of services their youth received
FY17 FY18 FY19 FY20 FY21
- 94% 94% 95% 88%
Cultural Sensitivity: Parent/Guardian perception of staff sensitivity to cultural beliefs
FY17 FY18 FY19 FY20 FY21
- 89% 87% 88% 86%
Access to Services: Parents/Guardians who reported the ease and convenience of treatment services their youth
received
FY17 FY18 FY19 FY20 FY21
- 89% 93% 93% 90%
Impact of SUD Treatment Services
Impact of treatment services is measured by surveying parent/guardian perception of the quality of services
received including the following: general satisfaction with services, access to services, cultural sensitivity,
outcome of services, and participation in treatment planning. Additionally, impacts are measured by
improvements in social connectedness and overall functioning.
The following information represents data from those parents/guardians who agreed or strongly agreed at the
time of successful discharge.
General Satisfaction with Services: Parents/Guardians who reported overall satisfaction with treatment services their
youth received
FY17 FY18 FY19 FY20 FY21
- 41% 40% 80% 66%
- 60% 60% 60% 60%
- 243 250 250 194
- 100 99 200 129
- 60% 60% 60% 60%
Discharge Outcome Tool Return Rate
- 177 180 423 285
- 31% 34% 82% 73%
Initial Outcome Tool Return Rate
- 562 527 518 390
Family Outcome Tool Return Rate Information for SUD Treatment Services
The Data and Outcomes Work Group members set a goal for all contracted agencies to meet or exceed a 60%
outcome tool return rate for FY20.
FY17 FY18 FY19 FY20 FY21
September 2021 | 89 v

Youth SUD Treatment Services
SUD Treatment Services
State Average
Social Connectedness: Parent/Guardian perception of their youth's support system in the community at…
SUD Treatment Services
State Average
Admission
Discharge
SUD Treatment Services
State Average
Admission
Discharge
SUD Treatment Services
State Average
Admission
Discharge
SUD Treatment Services
State Average
Admission
Discharge
SUD Treatment Services
State Average
Admission
Discharge
- 21% 22% 20% 23%
- 31% 27% 14% 6%
Hospital Admissions for Mental Health Care: Parents/Guardians who reported their youth had hospital admission(s)
for mental health care within 30 days of…
FY17 FY18 FY19 FY20 FY21
- 28% 29% 24% 29%
- 21% 29% 23% 7%
Emergency Department: Parents/Guardians who reported their youth had emergency department visit(s) within 30
days of…
FY17 FY18 FY19 FY20 FY21
- 14% 9% 9% 9%
- 10% 10% 6% 0%
Utilization of High Cost Services for SUD Treatment Services
High cost services include the following: treatment for illness, injury, or surgery, emergency department
visits, hospital admissions for mental health care, inpatient substance use disorder treatment services, or
detention in a correctional facility. Participation in treatment services may help reduce the frequency of youth
utilization of high cost services. The following section includes data at admission into services and at
successful discharge from services.
Illness, Injury, or Surgery: Parents/Guardians who reported their youth spent night(s) in a facility for illness, injury, or
surgery within 30 days of…
FY17 FY18 FY19 FY20 FY21
- 62% 58% 59% 52%
- 78% 76% 81% 80%
FY17 FY18 FY19 FY20 FY21
Functioning: Parent/Guardian perception of their youth's mental health and social well-being at…
- 85% 85% 79% 68%
- 92% 94% 95% 82%
The following two sections include data at admission into services and at successful discharge from services
as a means to demonstrate improvement in social connectedness and functioning.
FY17 FY18 FY19 FY20 FY21
- 76% 79% 82% 82%
Participation in Treatment Planning: Parent/Guardian perception of participation in treatment planning
FY17 FY18 FY19 FY20 FY21
September 2021 | 90 v

Youth SUD Treatment Services
SUD Treatment Services
State Average
Admission
Discharge
SUD Treatment Services
State Average
Admission
Discharge
SUD Treatment Services
State Average
Admission
Discharge
SUD Treatment Services
State Average
Admission
Discharge
SUD Treatment Services
State Average
Admission
Discharge
SUD Treatment Services
State Average
Before Program
End of Program
10% 15% 19%
- 79% 77% 87% 91%
Ability to Control Use: Parents/Guardians who reported their youth's ability to control their substance use…
FY17 FY18
- 6%
FY19 FY20 FY21
- 61% 48% 57% 57%
- 14% 17% 18% 18%
Missing School/Work: Parents/Guardians who reported their youth missing school/work due to their substance use
within 30 days of…
FY17 FY18 FY19 FY20 FY21
FY17 FY18 FY19 FY20 FY21
- 85% 87% 89% 87%
- 98% 93% 97% 88%
Quality of Life Information for SUD Treatment Services
Quality of life is measured in several key life domains including the following: general health, suicide
attempts, and other domains as shown in the tables below. Improvements in these areas may indicate the
effectiveness of treatment services. The following section includes data at admission into services and at
successful discharge from services.
General Health: Parents/Guardians who reported their youth's general health as good, very good, or excellent at…
FY17 FY18 FY19 FY20 FY21
- 28% 27% 22% 35%
- 31% 28% 14% 9%
Suicide Attempts: Parents/Guardians who reported suicide attempt(s) by their youth within 30 days of…
- 58% 44% 42% 37%
- 49% 38% 14% 6%
Correctional Facility: Parents/Guardians who reported their youth had spent night(s) in a correctional facility within
30 days of…
FY17 FY18 FY19 FY20 FY21
- 34% 22% 17% 12%
- 77% 33% 13% 64%
Inpatient Substance Use Disorder Treatment Services: Parents/Guardians who reported their youth received
inpatient treatment services for substance use disorders within 30 days of…
FY17 FY18 FY19 FY20 FY21
September 2021 | 91 v

Youth SUD Treatment Services
SUD Treatment Services
State Average
Admission
Discharge
SUD Treatment Services
State Average
Admission
Discharge
SUD Treatment Services
State Average
Admission
Discharge
Engagement in Treatment Services: Clinicians who reported youth had positive or optimal engagement in treatment
services at…
FY17 FY18 FY19 FY20 FY21
Motivation to Not Use Substances: Parents/Guardians who reported their youth had motivation to not use substances
at…
FY17 FY18 FY19 FY20 FY21
- 63% 60% 73% 66%
- 14% 14% 15% 18%
Trouble as a Result of Substance Use: Parents/Guardians who reported their youth getting in trouble at home, school,
work, or in the community as a result of substance use within 30 days of…
FY17 FY18 FY19 FY20 FY21
Public Safety Information for SUD Treatment Services
Public safety information includes trouble as a result of substance use. A reduction in this area may indicate
how youth are able to positively contribute to their families and communities. The following section includes
data at admission into services and at successful discharge from services.
- 13% 28% 24% 32%
- 40% 50% 54% 51%
- 48% 56% 44%
50% 55% 57%
41%
- 69%
September 2021 | 92 v

Youth SUD Treatment Services
Outpatient
Treatment Services
September 2021 | 93 v

Youth SUD Treatment Services
[Page intentionally left blank]
September 2021 | 94 v

Youth SUD Treatment Services
# of Admissions
# of Tools Submitted
Return Rate
Target Return Rate
# of Discharges
# of Tools Submitted
Return Rate
Target Return Rate
State Average
Treatment Completed
Terminated by Facility
Incarcerated
Other
- 2% 2% 2% 2%
- 9% 11% 11% 10%
Transferred to Another Facility or
Program- 6% 12% 12% 5%
26%
- 10% 10% 12% 7%
- 44% 45% 44% 50%
Left Against Professional Advice - 28% 21% 20%
Discharge Reasons for Outpatient Treatment Services
This information is collected in STARS for youth discharged from outpatient treatment services.
FY17 FY18 FY19 FY20 FY21
- 15% 67% 85% 82%
- 60% 60% 60% 60%
- 59 96 107 67
- 9 64 91 55
- 60% 60% 60% 60%
Discharge Outcome Tool Return Rate
- 96 196 194 144
- 45% 70% 82% 83%
Initial Outcome Tool Return Rate
- 215 279 236 173
Statewide Program Outcomes for Outpatient Treatment ServicesOutpatient Treatment Services include the following: Level 0.5 Early Intervention, Level 1.0 Outpatient
Treatment Services, and Level 2.1 Intensive Outpatient Treatment Services. These services provide outpatient
counseling to individuals diagnosed with substance use disorders. This is a reflection of the 16 agencies who
provide contracted outpatient treatment services to youth.
Outcome Tool Return Rate Information for Outpatient Treatment Services
The Data and Outcomes Work Group members set a goal for all contracted agencies to meet or exceed a 60%
outcome tool return rate for FY20.
FY17 FY18 FY19 FY20 FY21Outpatient Treatment Return
Rates
Outpatient Treatment Discharge
Reasons
September 2021 | 95 v

Youth SUD Treatment Services
Outpatient Treatment Services
State Average
Outpatient Treatment Services
State Average
Outpatient Treatment Services
State Average
Outpatient Treatment Services
State Average
Outpatient Treatment Services
State Average
Social Connectedness: Perception of their support system in the community at…
Outpatient Treatment Services
State Average
Admission
Discharge
Outpatient Treatment Services
State Average
Admission
Discharge
- 66% 74% 73% 70%
- 54% 87% 83% 83%
Functioning: Perception of their mental health and social well-being at…
FY17 FY18 FY19 FY20 FY21
- 76% 84% 81% 81%
- 50% 95% 90% 83%
The following two sections include data at admission into services and at successful discharge from services
as a means to demonstrate improvement in social connectedness and functioning.
FY17 FY18 FY19 FY20 FY21
- 75% 88% 88% 89%
Participation in Treatment Planning: Perception of participation in treatment planning
FY17 FY18 FY19 FY20 FY21
- 50% 87% 83% 83%
Outcome of Services: Perception of treatment outcomes as a result of services received
FY17 FY18 FY19 FY20 FY21
- 100% 90% 90% 94%
Cultural Sensitivity: Perception of staff sensitivity to cultural beliefs
FY17 FY18 FY19 FY20 FY21
- 75% 88% 88% 94%
Access to Services: Perception of the ease and convenience of treatment services received
FY17 FY18 FY19 FY20 FY21
- 75% 93% 92% 94%
Impact of treatment services is measured by surveying youth perception of the quality of services received
including the following: general satisfaction with services, access to services, cultural sensitivity, outcome of
services, and participation in treatment planning. Additionally, impacts are measured by improvements in
social connectedness and overall functioning. Impact of treatment services is relevant because youth who feel
empowered, motivated, have positive family relationships, and feel they have the ability to change may be
more likely to have positive treatment outcomes.
The following information represents data from those youth who agreed or strongly agreed at time of
successful discharge.
General Satisfaction with Services: Overall satisfaction with treatment services received
FY17 FY18 FY19 FY20 FY21
Impact of Outpatient Treatment Services
September 2021 | 96 v

Youth SUD Treatment Services
State Average
Admission
Discharge
State Average
Admission
Discharge
State Average
Admission
Discharge
State Average
Admission
Discharge
- 31% 24% 20% 32%
- 0% 6% 10% 17%
Crime/Violence: Measures interpersonal violence, drug-related crimes, property crimes, and
interpersonal/violent crimes at…
Crime/Violence Screener FY17 FY18 FY19 FY20 FY21
- 42% 30% 34% 32%
- 0% 0% 3% 5%
Substance Disorder: Measures SUD symptoms at…
Substance Disorder Screener FY17 FY18 FY19 FY20 FY21
- 52% 52% 54% 57%
- 50% 28% 34% 42%
Externalizing Disorder: Measures attention deficits, hyperactivity, impulsivity, conduct problems, and/or
other impulse control disorders at…
Externalizing Disorder Screener FY17 FY18 FY19 FY20 FY21
- 60% 61% 62% 68%
- 33% 44% 41% 42%
GAIN Short Screener (GAIN-SS) Scoring
The GAIN-SS is used as a simple measure of change after intervals of a month or more. The following tables
report the information gathered at admission into services and at successful discharge from services. These
results can be used at the group level as an outcome measure by monitoring over time.
Internalizing Disorder: Measures somatic complaints, depression, anxiety, trauma, suicide, and other serious
mental illness at…
Internalizing Disorder Screener FY17 FY18 FY19 FY20 FY21
September 2021 | 97 v

Youth SUD Treatment Services
Outpatient Treatment Services
State Average
Admission
Discharge
Outpatient Treatment Services
State Average
Admission
Discharge
Outpatient Treatment Services
State Average
Admission
Discharge
Outpatient Treatment Services
State Average
Admission
Discharge
Outpatient Treatment Services
State Average
Admission
Discharge
- 46% 31% 24% 23%
- 60% 3% 0% 3%
Correctional Facility: Youth who reported night(s) spent in a correctional facility within 30 days of…
FY17 FY18 FY19 FY20 FY21
- 25% 11% 9% 11%
- 70% 8% 0% 3%
Inpatient Substance Use Disorder Treatment Services: Youth who reported inpatient treatment services for
substance use disorders within 30 days of…
FY17 FY18 FY19 FY20 FY21
- 18% 10% 9% 9%
- 27% 3% 2% 0%
Hospital Admissions for Mental Health Care: Youth who reported a hospital admission(s) for mental health care
within 30 days of…
FY17 FY18 FY19 FY20 FY21
- 20% 14% 12% 8%
- 26% 5% 0% 3%
Emergency Department: Youth who reported emergency department visit(s) within 30 days of…
FY17 FY18 FY19 FY20 FY21
- 13% 5% 4% 6%
- 12% 0% 0% 6%
Utilization of High Cost Services for Outpatient Treatment Services
High cost services include the following: treatment for illness, injury, or surgery, emergency department
visits, hospital admissions for mental health care, inpatient substance use disorder treatment services, or
detention in a correctional facility. Participation in treatment services may help reduce the frequency of youth
utilization of high cost services. The following section includes data at admission into services and at
successful discharge from services.
Illness, Injury, or Surgery: Youth who reported night(s) spent in a facility for illness, injury, or surgery within 30 days
of…
FY17 FY18 FY19 FY20 FY21
September 2021 | 98 v

Youth SUD Treatment Services
Outpatient Treatment Services
State Average
Admission
Discharge
Outpatient Treatment Services
State Average
Admission
Discharge
Outpatient Treatment Services
State Average
Admission
Discharge
Outpatient Treatment Services
State Average
Admission
Discharge
Federally Required; Discharge data includes successful and unsuccessful discharges
Outpatient Treatment Services
State Average
Admission
Discharge
Outpatient Treatment Services
State Average
Before Program
End of Program
FY19 FY20 FY21
88% 93% 97% 88%
Ability to Control Use: Youth who reported the ability to control their substance use…
FY17 FY18
FY18 FY19
56%
Employment Status: Adult and youth clients who reported employment at…
FY18 FY20 FY21
- 18% 5% 0% 0%
Missing School/Work: Youth who reported missing school/work due to their substance use within 30 days of…
FY17 FY18 FY19 FY20 FY21
- 44% 51% 42% 56%
-
FY19
- 19% 19% 19% 16%
- 0% 0% 0% 0%
- 0% 0% 0% 0%
Homelessness: Youth who reported homelessness at…
FY17 FY18 FY19 FY20 FY21
55%
FY17
- 42% 43% 44% 41%
- 53% 53%
Federally Required; Due to STARS limitations, both adult and youth population are included; Discharge data includes
successful and unsuccessful discharges
- 80% 85% 88% 88%
- 67% 95% 98% 97%
- 25% 18% 20% 22%
- 34% 8% 5% 4%
Suicide Attempts: Youth who reported suicide attempt(s) within 30 days of…
FY17
Quality of Life Information for Outpatient Treatment Services
Quality of life is measured in several key life domains including the following: general health, suicide
attempts, employment status, homelessness, and other domains as shown in the tables below. Improvements in
these areas may indicate the effectiveness of treatment services. The following section includes data at
admission into services and at successful discharge from services.
General Health: Youth who reported their general health as good, very good, or excellent at…
FY17 FY18 FY19 FY20 FY21
FY21FY20
September 2021 | 99 v

Youth SUD Treatment Services
Outpatient Treatment Services
State Average
Admission
Discharge
Outpatient Treatment Services
State Average
Admission
Discharge
Outpatient Treatment Services
State Average
Admission
Discharge
Federally Required; Discharge data includes successful and unsuccessful discharges
Outpatient Treatment Services
State Average
Admission
Discharge
59%
- 35% 61% 61% 63%
Motivation to Not Use Substances: Youth who reported motivation to not use substances at…
FY17
- 55% 79% 85% 69%
- 42% 40% 41% 34%
- 18% 17% 17% 2%
FY18 FY19
Trouble as a result of Substance Use: Youth who reported getting in trouble at home, school, work, or in the
community as a result of substance use within 30 days of…
FY17 FY18 FY19 FY20 FY21
- 18% 17% 19% 17%
- 11% 10% 11% 15%
FY20 FY21
Public Safety Information for Outpatient Treatment Services
Public safety information includes history of arrest and trouble as a result of substance use. Reductions in
these areas may indicate how youth are able to positively contribute to their families and communities. The
following section includes data at admission into services and at successful discharge from services.
History of Arrest: Youth who reported arrest(s) within 30 days of…
FY17 FY18 FY19 FY20 FY21
- 42% 39% 44% 51%
- 45% 76% 80%
Engagement in Treatment Services: Clinicians who reported youth had positive or optimal engagement in treatment
services at…
FY17
FY18 FY19 FY20 FY21
September 2021 | 100 v

Youth SUD Treatment Services
Outpatient Service Return Rates
# of Admissions
# of Tools Submitted
Return Rate
Target Return Rate
# of Successful Discharges
# of Tools Submitted
Return Rate
Target Return Rate
Outpatient Treatment Services
State Average
Outpatient Treatment Services
State Average
Outpatient Treatment Services
State Average
Outpatient Treatment Services
State Average
Outpatient Treatment Services
State Average
Participation in Treatment Planning: Parent/Guardian perception of participation in treatment planning
FY17 FY18 FY19 FY20 FY21
- 100% 89% 91% 75%
- 100% 89% 85% 80%
FY17 FY18 FY19 FY20 FY21
- 100% 100% 100% 100%
Cultural Sensitivity: Parent/Guardian perception of staff sensitivity to cultural beliefs
FY17 FY18 FY19 FY20 FY21
Outcome of Services: Parent/Guardian perception of treatment outcomes as a result of services their youth received
- 100% 100% 100% 75%
Access to Services: Parents/Guardians who reported the ease and convenience of treatment services their youth
received
FY17 FY18 FY19 FY20 FY21
Impact of Outpatient Treatment Services
Impact of treatment services is measured by surveying parent/guardian perception of the quality of services
received including the following: general satisfaction with services, access to services, cultural sensitivity,
outcome of services, and participation in treatment planning. Additionally, impacts are measured by
improvements in social connectedness and overall functioning.
General Satisfaction with Services: Parents/Guardians who reported overall satisfaction with treatment services their
youth received
FY17 FY18 FY19 FY20 FY21
- 100% 100% 96% 100%
The following information represents data from those parents/guardians who agreed or strongly agreed at
time of successful discharge.
- 3% 13% 75% 75%
- 60% 60% 60% 60%
- 59 95 102 67
- 2 12 76 50
- 60% 60% 60% 60%
Discharge Outcome Tool Return Rate
- 33 88 174 120
- 15% 32% 75% 69%
Initial Outcome Tool Return Rate
- 215 278 232 173
Family Outcome Tool Return Rate Information for Outpatient Treatment Services
The Data and Outcomes Work Group members set a goal for all contracted agencies to meet or exceed a 60%
outcome tool return rate for FY20.
FY17 FY18 FY19 FY20 FY21
September 2021 | 101 v

Youth SUD Treatment Services
Social Connectedness: Parent/Guardian perception of their youth's support system in the community at…
Outpatient Treatment Services
State Average
Admission
Discharge
Outpatient Treatment Services
State Average
Admission
Discharge
Outpatient Treatment Services
State Average
Admission
Discharge
Outpatient Treatment Services
State Average
Admission
Discharge
Outpatient Treatment Services
State Average
Admission
Discharge
- 7% 20% 20% 14%
- 0% 13% 4% 0%
Hospital Admissions for Mental Health Care: Parents/Guardians who reported their youth had hospital admission(s)
for mental health care within 30 days of…
FY17 FY18 FY19 FY20 FY21
- 17% 22% 16% 13%
- 100% 11% 4% 0%
Emergency Department: Parents/Guardians who reported their youth had emergency department visit(s) within 30
days of…
FY17 FY18 FY19 FY20 FY21
- 10% 9% 7% 8%
- 0% 0% 0% 0%
Illness, Injury, or Surgery: Parents/Guardians who reported their youth spent night(s) in a facility for illness, injury, or
surgery within 30 days of…
FY17 FY18 FY19 FY20 FY21
Utilization of High Cost Services for Outpatient Treatment Services
High cost services include the following: treatment for illness, injury, or surgery, emergency department
visits, hospital admissions for mental health care, inpatient substance use disorder treatment services, or
detention in a correctional facility. Participation in treatment services may help reduce the frequency of youth
utilization of high cost services. The following section includes data at admission into services and at
successful discharge from services.
- 63% 63% 68% 59%
- 100% 89% 87% 75%
Functioning: Parent/Guardian perception of their youth's mental health and social well-being at…
FY17 FY18 FY19 FY20 FY21
- 83% 87% 85% 86%
- 100% 100% 100% 75%
The following two sections include data at admission into services and at successful discharge from services
as a means to demonstrate improvement in social connectedness and functioning.
FY17 FY18 FY19 FY20 FY21
September 2021 | 102 v

Youth SUD Treatment Services
Outpatient Treatment Services
State Average
Admission
Discharge
Outpatient Treatment Services
State Average
Admission
Discharge
Outpatient Treatment Services
State Average
Admission
Discharge
Outpatient Treatment Services
State Average
Admission
Discharge
Outpatient Treatment Services
State Average
Admission
Discharge
Outpatient Treatment Services
State Average
Before Program
End of Program 86% 91%
Ability to Control Use: Parents/Guardians who reported their youth's ability to control their substance use…
FY17 FY18
FY20
-
- 86% 89% 93%
- 100% 95% 77%
- 21% 27% 21% 11%
- 0% 0% 0% 8%
Quality of Life Information for Outpatient Treatment Services
Quality of life is measured in several key life domains including the following: general health, suicide
attempts, and other domains as shown in the tables below. Improvements in these areas may indicate the
effectiveness of treatment services. The following section includes data at admission into services and at
successful discharge from services.
General Health: Parents/Guardians who reported their youth's general health as good, very good, or excellent at…
FY17 FY18 FY19 FY20 FY21
- 38% 30%
Suicide Attempts: Parents/Guardians who reported suicide attempt(s) by their youth within 30 days of…
FY17 FY18 FY19 FY20
19%
FY21
0%-
19%
Correctional Facility: Parents/Guardians who reported their youth had spent night(s) in a correctional facility within
30 days of…
95%
FY21
35% 36%
- 100%
0%
13% 4% 0%
0%
90%
100%
- 23% 21% 24% 50%
- 67% 11% 15% 0%
FY19 FY20 FY21
Missing School/Work: Parents/Guardians who reported their youth missing school/work due to their substance use
within 30 days of…
FY17 FY18 FY19
FY17 FY18 FY19 FY20 FY21
- 14% 22% 17% 13%
- 100% 33% 13% 0%
Inpatient Substance Use Disorder Treatment Services: Parents/Guardians who reported their youth received
inpatient treatment services for substance use disorders within 30 days of…
FY17 FY18 FY19 FY20 FY21
September 2021 | 103 v

Youth SUD Treatment Services
Outpatient Treatment Services
State Average
Admission
Discharge
Outpatient Treatment Services
State Average
Admission
Discharge
Outpatient Treatment Services
State Average
Admission
Discharge
FY18 FY19 FY20 FY21
Engagement in Treatment Services: Clinicians who reported youth had positive or optimal engagement in treatment
services at…
FY20 FY21
Motivation to Not Use Substances: Parents/Guardians who reported their youth had motivation to not use substances
at…
FY17
82%
Public Safety Information for Outpatient Treatment Services
Public safety information includes trouble as a result of substance use. A reduction in this area may indicate
how youth are able to positively contribute to their families and communities. The following section includes
data at admission into services and at successful discharge from services.
- 35% 39% 52% 38%
- 33% 11% 15% 0%
Trouble as a result of Substance Use: Parents/Guardians who reported their youth getting in trouble at home, school,
work, or in the community as a result of substance use within 30 days of…
FY17 FY18 FY19 FY20 FY21
- 100% 78% 85% 92%
FY17 FY18 FY19
- 15% 38% 31% 43%
- 0% 67% 70%
- 34% 53% 55% 54%
September 2021 | 104 v

Youth SUD Treatment Services
Psychiatric Residential
Treatment Facility (PRTF)
Services
September 2021 | 105 v

Youth SUD Treatment Services
[Page intentionally left blank]
September 2021 | 106 v

Youth SUD Treatment Services
PRTF Return Rates
# of Admissions
# of Tools Submitted
Return Rate
Target Return Rate
# of Successful Discharges
# of Tools Submitted
Return Rate
Target Return Rate
State Average
Treatment Completed
Terminated by Facility
Incarcerated
Other
PRTF Discharge Reasons
- 2% 0% 0% 0%
- 3% 3% 1% 3%
Transferred to Another Facility or
Program- 5% 5% 6% 3%
13%
- 12% 5% 11% 10%
- 58% 70% 67% 72%
Left Against Professional Advice - 21% 18% 15%
Discharge Reasons for PRTF Services
This information is collected in STARS for youth discharged from PRTF services.
FY17 FY18 FY19 FY20 FY21
- 68% 72% 84% 66%
- 60% 60% 60% 60%
- 157 159 149 128
- 106 115 125 85
Statewide Program Outcomes for PRTF ServicesPsychiatric Residential Treatment Facilities (PRTF) provide residential treatment with medically monitored
intensive treatment for youth with severe substance use disorders. This is a reflection of the 3 agencies who
provide contracted PRTF services to youth.
Outcome Tool Return Rate Information for PRTF Services
The Data and Outcomes Work Group members set a goal for all contracted agencies to meet or exceed a 60%
outcome tool return rate for FY20.
FY17 FY18 FY19 FY20 FY21
- 60% 60% 60% 60%
Discharge Outcome Tool Return Rate
- 155 149 251 165
- 55% 59% 87% 76%
Initial Outcome Tool Return Rate
- 283 253 287 216
September 2021 | 107 v

Youth SUD Treatment Services
PRTF Services
State Average
PRTF Services
State Average
PRTF Services
State Average
PRTF Services
State Average
PRTF Services
State Average
Social Connectedness: Perception of their support system in the community at…
PRTF Services
State Average
Admission
Discharge
PRTF Services
State Average
Admission
Discharge
- 61% 59% 65% 65%
- 83% 83% 82% 83%
Functioning: Perception of their mental health and social well-being at…
FY17 FY18 FY19 FY20 FY21
- 82% 84% 82% 80%
- 90% 95% 93% 91%
This following two sections include data at admission into services and at successful discharge from services
as a means to demonstrate improvement in social connectedness and functioning.
FY17 FY18 FY19 FY20 FY21
- 91% 93% 89% 93%
Participation in Treatment Planning: Perception of participation in treatment planning
FY17 FY18 FY19 FY20 FY21
- 84% 83% 82% 85%
Outcome of Services: Perception of treatment outcomes as a result of services received
FY17 FY18 FY19 FY20 FY21
- 88% 88% 88% 88%
Cultural Sensitivity: Perception of staff sensitivity to cultural beliefs
FY17 FY18 FY19 FY20 FY21
- 80% 78% 83% 87%
Access to Services: Perception of the ease and convenience of treatment services received
FY17 FY18 FY19 FY20 FY21
- 89% 95% 93% 92%
Impact of treatment services is measured by surveying youth perception of the quality of services received
including the following: general satisfaction with services, access to services, cultural sensitivity, outcome of
services, and participation in treatment planning. Additionally, impacts are measured by improvements in
social connectedness and overall functioning. Impact of treatment services is relevant because youth who feel
empowered, motivated, have positive family relationships, and feel they have the ability to change are more
likely to have positive treatment outcomes.
The following information represents data from those youth who agreed or strongly agreed at time of
successful discharge.
General Satisfaction with Services: Overall satisfaction with treatment services received
FY17 FY18 FY19 FY20 FY21
Impact of PRTF Services
September 2021 | 108 v

Youth SUD Treatment Services
State Average
Admission
Discharge
State Average
Admission
Discharge
State Average
Admission
Discharge
State Average
Admission
Discharge
PRTF Services
State Average
Admission
Discharge
- 14% 12% 10% 10%
- 13% 13% 8% 3%
Utilization of High Cost Services for PRTF Services
High cost services include the following: treatment for illness, injury, or surgery, emergency department
visits, hospital admissions for mental health care, or detention in a correctional facility. Participation in
treatment services may help reduce the frequency of youth utilization of high cost services. The following
section includes data at admission into services and at successful discharge from services.
Illness, Injury, or Surgery: Youth who reported night(s) spent in a facility for illness, injury, or surgery within 30 days
of…
FY17 FY18 FY19 FY20 FY21
- 48% 53% 48% 44%
- 22% 13% 14% 12%
Crime/Violence: Measures interpersonal violence, drug-related crimes, property crimes, and
interpersonal/violent crimes at…
Crime/Violence Screener FY17 FY18 FY19 FY20 FY21
- 69% 68% 60% 65%
- 10% 20% 18% 14%
Substance Disorder: Measures SUD symptoms at…
Substance Disorder Screener FY17 FY18 FY19 FY20 FY21
- 72% 68% 64% 61%
- 62% 55% 62% 54%
Externalizing Disorder: Measures attention deficits, hyperactivity, impulsivity, conduct problems, and/or
other impulse control disorders at…
Externalizing Disorder Screener FY17 FY18 FY19 FY20 FY21
- 73% 76% 74% 81%
- 74% 71% 74% 72%
GAIN Short Screener (GAIN-SS) Scoring
The GAIN-SS is used as a simple measure of change after intervals of a month or more. The following tables
report the information gathered at admission into services and at successful discharge from services. These
results can be used at the group level as an outcome measure by monitoring over time.
Internalizing Disorder: Measures somatic complaints, depression, anxiety, trauma, suicide, and other serious
mental illness at…
Internalizing Disorder Screener FY17 FY18 FY19 FY20 FY21
September 2021 | 109 v

Youth SUD Treatment Services
PRTF Services
State Average
Admission
Discharge
PRTF Services
State Average
Admission
Discharge
PRTF Services
State Average
Admission
Discharge
PRTF Services
State Average
Admission
Discharge
PRTF Services
State Average
Admission
Discharge
PRTF Services
State Average
Admission
Discharge
- 11% 12% 14% 13%
- 9% 11% 12% 12%
Employment Status: Adult and youth clients who reported employment at…
FY17 FY18 FY19 FY20 FY21
Federally Required; Due to STARS limitations, both adult and youth population are included; Discharge data includes
successful and unsuccessful discharges
- 32% 29% 28% 42%
- 37% 41% 31% 11%
Suicide Attempts: Youth who reported suicide attempt(s) within 30 days of…
FY17 FY18 FY19 FY20 FY21
- 86% 83% 84% 80%
- 95% 95% 97% 89%
Quality of Life Information for PRTF Services
Quality of life is measured in several key life domains including the following: general health, suicide
attempts, employment status, homelessness, and other domains as shown in the tables below. Improvements in
these areas may indicate the effectiveness of treatment services. The following section includes data at
admission into services and at successful discharge from services.
General Health: Youth who reported their general health as good, very good, or excellent at…
FY17 FY18 FY19 FY20 FY21
- 63% 54% 54% 49%
- 64% 41% 29% 8%
Correctional Facility: Youth who reported night(s) spent in a correctional facility within 30 days of…
FY17 FY18 FY19 FY20 FY21
- 26% 24% 21% 25%
- 30% 20% 18% 12%
Hospital Admissions for Mental Health Care: Youth who reported a hospital admission(s) for mental health care
within 30 days of…
FY17 FY18 FY19 FY20 FY21
- 28% 26% 22% 34%
- 27% 29% 18% 10%
Emergency Department: Youth who reported emergency department visit(s) within 30 days of…
FY17 FY18 FY19 FY20 FY21
September 2021 | 110 v

Youth SUD Treatment Services
PRTF Services
State Average
Admission
Discharge
PRTF Services
State Average
Admission
Discharge
PRTF Services
State Average
Before Program
End of Program
PRTF Services
State Average
Admission
Discharge
PRTF Services
State Average
Admission
Discharge
PRTF Services
State Average
Admission
Discharge
Federally Required; Discharge data includes successful and unsuccessful discharges
Federally Required; Discharge data includes successful and unsuccessful discharges
19% 22% 25% 19%
- 45% 48% 44%
26% 33% 23% 11%
48%
-
- 40% 35% 33% 34%
- 9% 6% 10% 13%
Public Safety Information for PRTF Services
Public safety information includes history of arrest and trouble as a result of substance use. Reductions in
these areas may indicate how youth are able to positively contribute to their families and communities. The
following section includes data at admission into services and at successful discharge from services.
History of Arrest: Youth who reported arrest(s) within 30 days of…
FY17 FY18 FY19 FY20 FY21
- 26% 42% 47% 39%
- 42% 65% 65% 70%
FY17 FY18 FY19 FY20 FY21
- 67% 65% 46% 49%
-
Motivation to Not Use Substances: Youth who reported motivation to not use substances at…
FY17 FY18 FY19 FY20 FY21
- 18% 18% 18% 26%
- 90% 91% 90% 96%
Ability to Control Use: Youth who reported the ability to control their substance use…
FY17 FY18 FY19 FY20 FY21
Missing School/Work: Youth who reported missing school/work due to their substance use within 30 days of…
FY17 FY18 FY19 FY20 FY21
- 0% 0% 2% 2%
- 1% 1% 0% 0%
Homelessness: Youth who reported homelessness at…
FY17 FY18 FY19 FY20 FY21
Engagement in Treatment Services: Clinicians who reported youth had positive or optimal engagement in treatment
services at…
September 2021 | 111 v

Youth SUD Treatment Services
PRTF Services
State Average
Admission
Discharge
- 65% 67% 64% 66%
- 24% 22% 21% 21%
Trouble as a result of Substance Use: Youth who reported getting in trouble at home, school, work, or in the
community as a result of substance use within 30 days of…
FY17 FY18 FY19 FY20 FY21
September 2021 | 112 v

Youth SUD Treatment Services
PRTF Return Rates
# of Admissions
# of Tools Submitted
Return Rate
Target Return Rate
# of Successful Discharges
# of Tools Submitted
Return Rate
Target Return Rate
PRTF Services
State Average
PRTF Services
State Average
PRTF Services
State Average
PRTF Services
State Average
PRTF Services
State Average - 75% 78% 82% 82%
Participation in Treatment Planning: Parent/Guardian perception of participation in treatment planning
FY17 FY18 FY19 FY20 FY21
- 79% 75% 81% 80%
Outcome of Services: Parent/Guardian perception of treatment outcomes as a result of services their youth received
FY17 FY18 FY19 FY20 FY21
- 94% 93% 93% 87%
Cultural Sensitivity: Parent/Guardian perception of staff sensitivity to cultural beliefs
FY17 FY18 FY19 FY20 FY21
- 88% 84% 84% 87%
Access to Services: Parents/Guardians who reported the ease and convenience of treatment services their youth
received
FY17 FY18 FY19 FY20 FY21
- 89% 92% 92% 89%
Impact of PRTF Services
Impact of treatment services is measured by surveying parent/guardian perception of the quality of services
received including the following: general satisfaction with services, access to services, cultural sensitivity,
outcome of services, and participation in treatment planning. Additionally, impacts are measured by
improvements in social connectedness and overall functioning.
General Satisfaction with Services: Parents/Guardians who reported overall satisfaction with treatment services their
youth received
FY17 FY18 FY19 FY20 FY21
The following information represents data from those parents/guardians who agreed or strongly agreed at
time of successful discharge.
- 62% 56% 84% 62%
- 60% 60% 60% 60%
- 157 155 148 127
- 98 87 124 79
- 60% 60% 60% 60%
Discharge Outcome Tool Return Rate
- 144 92 249 165
- 50% 37% 87% 76%
Initial Outcome Tool Return Rate
- 287 249 286 217
Family Outcome Tool Return Rate Information for PRTF Services
The Data and Outcomes Work Group members set a goal for all contracted agencies to meet or exceed a 60%
outcome tool return rate for FY20.
FY17 FY18 FY19 FY20 FY21
September 2021 | 113 v

Youth SUD Treatment Services
Social Connectedness: Parent/Guardian perceptions of their youth's support system in the community at…
PRTF Services
State Average
Admission
Discharge
PRTF Services
State Average
Admission
Discharge
PRTF Services
State Average
Admission
Discharge
PRTF Services
State Average
Admission
Discharge
PRTF Services
State Average
Admission
Discharge
- 27% 24% 20% 30%
- 32% 29% 18% 8%
Hospital Admissions for Mental Health Care: Parents/Guardians who reported their youth had hospital admission(s)
for mental health care within 30 days of…
FY17 FY18 FY19 FY20 FY21
- 33% 35% 28% 43%
- 18% 32% 29% 10%
Emergency Department: Parents/Guardians who reported their youth had emergency department visit(s) within 30
days of…
FY17 FY18 FY19 FY20 FY21
- 16% 8% 10% 11%
- 10% 11% 8% 0%
Utilization of High Cost Services for PRTF Services
High cost services include the following: treatment for illness, injury, or surgery, emergency department
visits, hospital admissions for mental health care, or detention in a correctional facility. Participation in
treatment services may help reduce the frequency of youth utilization of high cost services. The following
section includes data at admission into services and at successful discharge from services.
Illness, Injury, or Surgery: Parents/Guardians who reported their youth spent night(s) in a facility for illness, injury, or
surgery within 30 days of…
FY17 FY18 FY19 FY20 FY21
- 61% 55% 54% 48%
- 78% 75% 79% 80%
Functioning: Parent/Guardian perception of their youth's mental health and social well-being at…
FY17 FY18 FY19 FY20 FY21
- 85% 84% 76% 60%
- 92% 93% 93% 83%
This following two sections include data at admission into services and at successful discharge from services
as a means to demonstrate improvement in social connectedness and functioning.
FY17 FY18 FY19 FY20 FY21
September 2021 | 114 v

Youth SUD Treatment Services
PRTF Services
State Average
Admission
Discharge
PRTF Services
State Average
Admission
Discharge
PRTF Services
State Average
Admission
Discharge
PRTF Services
State Average
Admission
Discharge
PRTF Services
State Average
Before Program
End of Program
PRTF Services
State Average
Admission
Discharge
- 12% 19% 20% 23%
- 41% 48% 49% 44%
Motivation to Not Use Substances: Parents/Guardians who reported their youth had motivation to not use substances
at…
FY17 FY18 FY19 FY20 FY21
- 6%
- 78% 76% 85% 91%
Ability to Control Use: Parents/Guardians who reported their youth's ability to control their substance use…
FY17 FY18 FY19 FY20 FY21
- 78% 70% 71% 61%
- 10% 18% 19% 20%
11% 10% 15%
Missing School/Work: Parents/Guardians who reported their youth missing school/work due to their substance use
within 30 days of…
FY17 FY18 FY19 FY20 FY21
- 31% 27% 23% 47%
- 32% 32% 19% 10%
Suicide Attempts: Parents/Guardians who reported suicide attempt(s) by their youth within 30 days of…
FY17 FY18 FY19 FY20 FY21
- 85% 86% 89% 82%
- 98% 92% 97% 91%
Quality of Life Information for PRTF Services
Quality of life is measured in several key life domains including the following: general health, suicide
attempts, and other domains as shown in the tables below. Improvements in these areas may indicate the
effectiveness of treatment services. The following section includes data at admission into services and at
successful discharge from services.
General Health: Parents/Guardians who reported their youth's general health as good, very good, or excellent at…
FY17 FY18 FY19 FY20 FY21
- 68% 56% 55% 53%
- 50% 41% 18% 8%
Correctional Facility: Parents/Guardians who reported their youth had spent night(s) in a correctional facility within
30 days of…
FY17 FY18 FY19 FY20 FY21
September 2021 | 115 v

Youth SUD Treatment Services
PRTF Services
State Average
Admission
Discharge
PRTF Services
State Average
Admission
Discharge
Public Safety Information for PRTF Services
Public safety information includes trouble as a result of substance use. A reduction in this area may indicate
how youth are able to positively contribute to their families and communities. The following section includes
data at admission into services and at successful discharge from services.
- 75% 77% 82% 80%
- 13% 15% 14% 20%
Trouble as a result of Substance Use: Parents/Guardians who reported their youth getting in trouble at home, school,
work, or in the community as a result of substance use within 30 days of…
FY17 FY18 FY19 FY20 FY21
- 54% 60% 40% 31%
- 68% 74% 47% 47%
Engagement in Treatment Services: Clinicians who reported youth had positive or optimal engagement in treatment
services at…
FY17 FY18 FY19 FY20 FY21
September 2021 | 116 v

MH Treatment Services
Fiscal Year 2021 (FY21) Program Activity
All Clients Served*
Adults
Adults
Youth
Demographic Information
White
Black or African American
Asian
18 and below 33%
19-64 60%
65 and above 7% Two or More Races
Other
Accreditation Information
Administrative Score
MH Chart Score
Total Accreditation Score
5,516
12,370
Youth
11,346
6,526
94.7%
94.2%
93.8%
3%
16,862
*All clients served includes the following funding sources: private
pay, insurance, and other funding sources.
** Publicly funded includes only clients served through state and
federal funding, including Medicaid.
3%
17%
State Avg.
Mental Health (MH) Treatment Services ProfileState InformationPrinted September 2021
RaceMH
ClientsState Pop.
72%
1%
3%
American Indian and
Alaska Native
Native Hawaiian and Other
Pacific Islander0.1%
17%
85%
2%
1%
18,896
3%
Publicly Funded**
Age MH Clients Pop. State Pop.
24%
NA
9%
0%58%
Accreditation Review
The DBH accredits 11 CMHCs utilizing
the standards set forth in Administrative
Rules of South Dakota (ARSD 67:62).
Clients Served
In FY21, the Division of Behavioral Health (DBH) accredited
11 Community Mental Health Centers (CMHCs) that cover
catchment areas across the state of South Dakota. The target
population for services is adults with a Serious Mental Illness
(SMI) and youth with Serious Emotional Disturbance (SED).
This state profile page reflects adult and youth clients who were
publicly funded in FY21, which runs from June 2020 - May
2021.
The demographic information includes all clients
funded through state and federal funds, including
Medicaid and targeted services for justice-involved
youth..
September 2021 | 117 v

Adult MH Treatment Services
[Page intentionally left blank]
September 2021 | 118 v

Adult MH Treatment Services
Comprehensive Assistance
with Recovery and
Empowerment (CARE)
Services
and
Individualized
and Mobile Programs of
Assertive Community
Treatment (IMPACT)
Services
September 2021 | 119 v

Adult MH Treatment Services
[Page intentionally left blank]
September 2021 | 120 v

Adult MH Treatment Services
Initial Outcome Tool Return Rate
# of Admissions
# of Tools Submitted
Return Rate
Target Return Rate
First 6 Month Outcome Tool Return Rate
# of First 6 Month Updates
# of Tools Submitted
Return Rate
Target Return Rate
Most Recent Outcome Tool Return Rate
# of Most Recent Updates
# of Tools Submitted
Return Rate
Target Return Rate
FY18 FY19 FY20 FY21
1,082 1,118 1,101 1,002 1,017
394 436 492
5,952 6,855 7,496
36% 39% 45% 71% 82%
60% 60% 60% 60% 60%
36% 50% 56% 79% 86%
60% 60% 60% 60% 60%
714 830
57%
CARE/IMPACT Service Return
Rates
10,915 10,593
Statewide Program Outcomes for CARE and IMPACT ServicesComprehensive Assistance with Recovery and Empowerment (CARE) and Individualized and Mobile
Programs of Assertive Community Treatment (IMPACT) Services provide counseling, case management
services, and psychiatric medication management for adults with Serious Mental Illness (SMI). This is a
reflection of 11 agencies who provide CARE services and 6 agencies who provide IMPACT services.
60% 60% 60%
8,677
1,285
898 1,178 1,252
60%60%
FY17
5,340
8,678
3,970
75% 84% 95%
10,686
70%
1,581 1,681 1,664 1,427
1,200 1,219
Outcome Tool Return Rate Information for CARE and IMPACT Services
The Data and Outcomes Work Group members set a goal for all contracted agencies to meet or exceed a
60% outcome tool return rate.
September 2021 | 121 v

Adult MH Treatment Services
State Primary MH Disorders
CARE and IMPACT Services
State Average
National Average
Federally Required
88% 91% 90% 89% 90%
Impact of treatment services is measured by surveying client perception of the quality of services received
including the following: general satisfaction with services, access to services, quality and appropriateness
of services, outcome of services, and participation in treatment planning. Additionally, impacts are
measured by improvements in social connectedness and overall functioning. Impact of treatment services is
relevant because clients who feel empowered, motivated, have positive family relationships, and feel they
have the ability to change may be more likely to have positive treatment outcomes.
The following information represents data from those clients who agreed or strongly agreed at the time of
most recent update.
General Satisfaction with Services: Overall satisfaction with treatment services received
FY17 FY18 FY19 FY20 FY21
Impact of CARE and IMPACT Services
28% 30% 31%
Number/Percent of Clients with
Schizophrenia Spectrum Disorder
(Includes Schizoaffective Disorder)
1,371 1,408 1,389 1,342 1,345
12% 11% 11% 11% 11%
Number/Percent of Clients with
Bipolar Disorders
1,003 1,038 1,070 1,036 1,029
Number/Percent of Clients with
Anxiety, Stress and Trauma Disorders
(Includes Post Traumatic Stress
Disorder)
2,293 2,263 2,728 2,793 2,864
26% 25%
Number/Percent of Clients with Other
Disorders (Including Personality
Disorders, etc.)
97%96%97%96%95%
Primary Diagnostic Information for MH Services
FY17 FY18 FY19 FY20 FY21
800 810 732 713
9% 9% 8%
Number/Percent of Clients with
Depressive Disorders
3,284
The DBH monitors data and outcomes for publicly funded behavioral health treatment services. The table
below reflects information entered into the State Treatment Activity Reporting System (STARS) by
Community Mental Health Centers (CMHCs) for publicly funded clients receiving MH treatment services.
Due to updating from ICD9 diagnostic codes, data may not match previously published statistics as data
was re-downloaded from STARS which is an active database.
3,671 3,651 3,512
36%
751
3,379
38% 40% 38% 37%
15% 14% 14% 14%16%
8% 8%
September 2021 | 122 v

Adult MH Treatment Services
CARE and IMPACT Services
State Average
National Average
Federally Required
CARE and IMPACT Services
State Average
National Average
Federally Required
CARE and IMPACT Services
State Average
National Average
Federally Required
CARE and IMPACT Services
State Average
National Average
Federally Required
CARE and IMPACT Services
State Average
Admission
First 6 Month Update
Most Recent Update
National Average
National Average
Federally Required
74% 79% 77% 76% 79%
61% 61% 67% 62% 61%
80% 80% 81% 78% 75%
The following two sections include data at admission into services, at the first 6 month update, and at the
most recent update of services as a means to demonstrate improvement in social connectedness and
functioning.
Social Connectedness: Perception of their support system in the community at…
FY17 FY18 FY19 FY20 FY21
73%74%78%76%77%
93% 95% 96% 95% 96%
82% 87% 86% 85% 87%
Participation in Treatment Planning: Perception of participation in treatment planning
FY17 FY18 FY19 FY20 FY21
74% 77% 77% 75% 73%
68% 83% 80% 75% 80%
FY20 FY21
94% 83% 96% 95% 96%
88% 91% 90% 89% 91%
Quality and Appropriateness of Services: Perception of the quality and appropriateness of treatment services received
FY17 FY18 FY19 FY20 FY21
Outcome of Services: Perception of treatment outcomes as a result of services received
FY17 FY18 FY19
86% 89% 88% 87% 89%
Access to Services: Perception of the ease and convenience of treatment services received
FY17 FY18 FY19 FY20 FY21
94% 96% 96% 96% 96%
September 2021 | 123 v

Adult MH Treatment Services
CARE and IMPACT Services
State Average
Admission
First 6 Month Update
Most Recent Update
National Average
National Average
Federally Required
CARE and IMPACT Services
State Average
Admission
First 6 Month Update
Most Recent Update
CARE and IMPACT Services
State Average
Admission
First 6 Month Update
Most Recent Update
CARE and IMPACT Services
State Average
Admission
First 6 Month Update
Most Recent Update
Hospital Admissions for Mental Health Care: Clients who reported hospital admission(s) for mental health care
within 6 months of…
FY17 FY18 FY19 FY20 FY21
23%
7% 5% 7% 6% 5%
20% 8% 9% 10% 12%
10% 10% 9% 9% 8%
28% 24% 23% 23% 24%
9% 6% 7% 7% 5%
Emergency Department: Clients who reported emergency department visit(s) within 6 months of…
FY17 FY18 FY19 FY20 FY21
14% 9% 10% 10% 12%
9% 9% 9% 7% 6%
Utilization of High Cost Services for CARE and IMPACT Services
High cost services include the following: treatment for illness, injury, or surgery, emergency department
visits, hospital admissions for mental health care, detoxification services, inpatient substance use disorder
treatment services, or detention in a correctional facility. Participation in treatment services may help
reduce the frequency of client utilization of high cost services.
Illness, Injury, or Surgery: Clients who reported night(s) spent in a facility for illness, injury, or surgery within 6
months of…
FY17 FY18 FY19 FY20 FY21
74% 79% 77% 76% 80%
10% 11% 12% 12% 11%
53% 48% 58% 54% 53%
76% 66% 77% 76% 72%
Functioning: Perception of their mental health and social well-being at…
FY17 FY18 FY19 FY20 FY21
74% 62% 74% 72% 71%
29% 25% 26% 24%
September 2021 | 124 v

Adult MH Treatment Services
CARE and IMPACT Services
State Average
Admission
First 6 Month Update
Most Recent Update
CARE and IMPACT Services
State Average
Admission
First 6 Month Update
Most Recent Update
CARE and IMPACT Services
State Average
Admission
First 6 Month Update
Most Recent Update
CARE and IMPACT Services
State Average
Admission
First 6 Month Update
Most Recent Update
CARE and IMPACT Services
State Average
Admission
First 6 Month Update
Most Recent Update
FY20 FY21
5% 6% 6% 8%
Quality of Life Information for CARE and IMPACT ServicesQuality of life is measured in several key life domains including the following: general health, suicide
attempts, employment status, and homelessness as shown in the tables below. Improvements in these areas
may indicate the effectiveness of treatment services.
7% 8% 8%
21% 22%
4% 4% 5%
16%
General Health: Clients who reported their general health as good, very good, or excellent at…
FY17 FY18 FY19 FY20 FY21
1% 1%
6% 6%
22% 22%
9% 5%
FY17 FY18 FY19
FY21
2%
2% 1% 1% 2% 1%
6% 2% 2% 2% 4%
Detoxification Services: Clients who reported night(s) spent in a facility for detoxification within 6 months of…
FY17 FY18 FY19 FY20 FY21
6% 5% 5% 6% 7%
6% 7% 7% 9%
1%
32%
Inpatient Substance Use Disorder Treatment Services: Clients who reported inpatient treatment services for
substance use disorders within 6 months of…
FY17 FY18 FY19 FY20 FY21
Correctional Facility: Clients who reported night(s) spent in a correctional facility within 6 months of…
FY17 FY18 FY19 FY20
1%
2% 3%
56% 56% 56% 56% 57%
60% 59% 58% 58% 59%
60%
11%
Suicide Attempts: Clients who reported suicide attempt(s) within 6 months of…
15% 15% 17% 17%
3% 2% 3% 4% 4%
18%
65% 59% 58% 59%
5% 2% 2%
September 2021 | 125 v

Adult MH Treatment Services
CARE and IMPACT Services
State Average
Admission
First 6 Month Update
Most Recent Update
National Average
National Average
Federally Required
CARE and IMPACT Services
State Average
Admission
First 6 Month Update
Most Recent Update
National Average
National Average
Federally Required
CARE and IMPACT Services
State Average
Admission
First 6 Month Update
Most Recent Update
National Average
National Average
Federally Required * This data was not released by SAMHSA by the time this report was compiled.
4%
4% 4% 4% 3% N/A*
23% 9% 9% 10% 11%
7% 2% 2% 2% 3%
13% 4% 4% 3% 4%
Public Safety Information for CARE and IMPACT Services
Public safety information includes history of arrest. A reduction in this area may indicate how clients are
able to positively contribute to their families and communities.
History of Arrest: Clients who reported arrest(s) within 30 days of…
FY17 FY18 FY19 FY20 FY21
2% 1% 1% 1% 2%
Homelessness: Clients who reported homelessness at...
FY17 FY18 FY19 FY20 FY21
4% 4% 4% 4%
4% 4%
29%
36% 32% 32% 33% 33%
26% 24% 24% 25% 34%
Employment Status: Clients who reported employment at…
FY17
35%
25% 21% 22% 22% 24%
2% 2% 2% 2% 3%
FY18 FY19 FY20 FY21
34%
4% 4% 4%
29% 27%
September 2021 | 126 v

Adult MH Treatment Services
CARE Services
September 2021 | 127 v

Adult MH Treatment Services
[Page intentionally left blank]
September 2021 | 128 v

Adult MH Treatment Services
CARE Return Rates
Initial Outcome Tool Return Rate
# of Admissions
# of Tools Submitted
Return Rate
Target Return Rate
First 6 Month Outcome Tool Return Rate
# of First 6 Month Updates
# of Tools Submitted
Return Rate
Target Return Rate
Most Recent Outcome Tool Return Rate
# of Most Recent Updates
# of Tools Submitted
Return Rate
Target Return Rate
CARE Services
State Average
Federally Required
95% 95% 97% 96% 98%
Impact of CARE Services
Impact of treatment services is measured by surveying client perception of the quality of services received
including the following: general satisfaction with services, access to services, quality and appropriateness
of services, outcome of services, and participation in treatment planning. Additionally, impacts are
measured by improvements in social connectedness and overall functioning. Impact of treatment services is
relevant because clients who feel empowered, motivated, have positive family relationships, and feel they
have the ability to change may be more likely to have positive treatment outcomes.
The following information represents data from those clients who agreed or strongly agreed at the time of
most recent update.
General Satisfaction with Services: Overall satisfaction with treatment services received
FY17 FY18 FY19 FY20 FY21
36% 50% 55% 79% 86%
60% 60% 60% 60% 60%
10,425 10,123 10,239 8,227 8,223
3,723 5,030 5,599 6,470 7,042
36% 39% 45% 71% 81%
60% 60% 60% 60% 60%
The Data and Outcomes Work Group members set a goal for all contracted agencies to meet or exceed a
60% outcome tool return rate.
FY17 FY18 FY19 FY20 FY21
1,063 1,093 1,087 979 996
382 426 484 693 811
58% 70% 76% 85% 95%
60% 60% 60% 60% 60%
1,531 1,636 1,609 1,358 1,264
884 1,150 1,215 1,149 1,198
Statewide Program Outcomes for CARE ServicesComprehensive Assistance with Recovery and Empowerment (CARE) services may include outpatient
counseling, case management services, and psychiatric medication management for adults with serious
mental illness (SMI). This is a reflection of the 11 agencies who provide CARE services.
Outcome Tool Return Rate Information for CARE Services
September 2021 | 129 v

Adult MH Treatment Services
CARE Services
State Average
Federally Required
CARE Services
State Average
Federally Required
CARE Services
State Average
Federally Required
CARE Services
State Average
Federally Required
CARE Services
State Average
Admission
First 6 Month Update
Most Recent Update
Federally Required
CARE Services
State Average
Admission
First 6 Month Update
Most Recent Update
Federally Required
58% 53% 52%
74% 62% 74% 72% 70%
76% 65% 76% 75% 72%
94% 96% 96% 95% 96%
Functioning: Perception of their mental health and social well-being at…
FY17 FY18 FY19 FY20 FY21
61% 61% 67% 61% 60%
76% 75% 77% 74% 72%
80% 80% 78% 75%79%
The following two sections include data at admission into services, at the first 6 month update, and at the
most recent update of services as a means to demonstrate improvement in social connectedness and
functioning.
Social Connectedness: Perception of their support system in the community at…
FY17 FY18 FY19
94% 83% 96% 95% 97%
Quality and Appropriateness of Services: Perception of the quality and appropriateness of treatment services received
FY17 FY18 FY19 FY20 FY21
94% 96% 96% 96% 96%
Access to Services: Perception of the ease and convenience of treatment services received
FY17 FY18 FY19 FY20 FY21
Participation in Treatment Planning: Perception of participation in treatment planning
FY17 FY18 FY19 FY20 FY21
73% 76% 77% 75% 73%
Outcome of Services: Perception of treatment outcomes as a result of services received
FY17 FY18 FY19 FY20 FY21
FY20 FY21
53% 48%
September 2021 | 130 v

Adult MH Treatment Services
CARE Services
State Average
Admission
First 6 Month Update
Most Recent Update
CARE Services
State Average
Admission
First 6 Month Update
Most Recent Update
CARE Services
State Average
Admission
First 6 Month Update
Most Recent Update
CARE Services
State Average
Admission
First 6 Month Update
Most Recent Update
14% 9% 9% 10% 12%
1% 2% 1%
6%
Emergency Department: Clients who reported emergency department visit(s) within 6 months of…
FY17 FY18 FY19 FY20 FY21
9%
11%
5% 5% 6% 6% 5%
FY17
1%
28% 24% 23% 23% 23%
10% 11% 12% 13% 11%
10% 10% 9% 9% 8%
9% 9% 7%
FY17 FY18 FY19 FY20 FY21
28% 25% 25% 24% 23%
20% 7% 8% 9%
FY18 FY19 FY20 FY21
8% 5%
Utilization of High Cost Services for CARE Services
High cost services include the following: treatment for illness, injury, or surgery, emergency department
visits, hospital admissions for mental health care, detoxification services, inpatient substance use disorder
treatment services, or detention in a correctional facility. Participation in treatment services may help
reduce the frequency of client utilization of high cost services.
Illness, Injury, or Surgery: Clients who reported night(s) spent in a facility for illness, injury, or surgery within 6
months of…
FY17 FY18 FY19 FY20 FY21
2%
6% 7% 5%
6% 5% 5% 6% 7%
6% 2% 2% 2% 3%
Detoxification Services: Clients who reported night(s) spent in a facility for detoxification within 6 months of…
Hospital Admissions for Mental Health Care: Clients who reported hospital admission(s) for mental health care
within 6 months of…
September 2021 | 131 v

Adult MH Treatment Services
CARE Services
State Average
Admission
First 6 Month Update
Most Recent Update
CARE Services
State Average
Admission
First 6 Month Update
Most Recent Update
CARE Services
State Average
Admission
First 6 Month Update
Most Recent Update
CARE Services
State Average
Admission
First 6 Month Update
Most Recent Update
CARE Services
State Average
Admission
First 6 Month Update
Most Recent Update
Federally Required
34%
Employment Status: Clients who reported employment at…
FY17 FY18 FY19 FY20 FY21
Not reported by level of care
34% 29% 28% 29% 36%
16% 15% 15% 17% 17%
12% 5% 5% 6% 8%
3% 2% 3% 4% 4%
27% 24% 25% 26%
22% 22% 21%
18% 6%
Suicide Attempts: Clients who reported suicide attempt(s) within 6 months of…
FY17 FY18 FY19 FY20 FY21
55% 55% 56% 56% 57%
64% 58% 58% 59% 60%
59% 58% 58% 57% 58%
3%
7% 7% 9%
FY17 FY18 FY19 FY20 FY21
General Health: Clients who reported their general health as good, very good, or excellent at…
FY18 FY19 FY20 FY21
Quality of Life Information for CARE Services
Quality of life is measured in several key life domains including the following: general health, suicide
attempts, employment status, and homelessness as shown in the tables below. Improvements in these areas
may indicate the effectiveness of treatment services.
FY17
10% 5% 4% 4% 4%
32% 21%
6% 6% 7% 8% 8%
2% 1% 1% 1% 2%
Inpatient Substance Use Disorder Treatment Services: Clients who reported inpatient treatment services for
substance use disorders within 6 months of…
FY17 FY18 FY19 FY20 FY21
Correctional Facility: Clients who reported night(s) spent in a correctional facility within 6 months of…
4% 2% 2% 2%
September 2021 | 132 v

Adult MH Treatment Services
CARE Services
State Average
Admission
First 6 Month Update
Most Recent Update
Federally Required
CARE Services
State Average
Admission
First 6 Month Update
Most Recent Update
Federally Required
13%
FY21
2% 2% 2% 2%
Not reported by level of care
2%
3% 4% 3% 4%
History of Arrest: Clients who reported arrest(s) within 30 days of…
Public Safety Information for CARE Services
Public safety information includes history of arrest. A reduction in this area may indicate how clients are
able to positively contribute to their families and communities.
2% 1% 1% 1%
Homelessness: Clients who reported homelessness at...
FY17 FY18 FY19 FY20 FY21
7% 0% 2% 2% 3%
2%
23% 9% 8% 10% 11%
FY17 FY18 FY19 FY20
September 2021 | 133 v

Adult MH Treatment Services
[Page intentionally left blank]
September 2021 | 134 v

Adult MH Treatment Services
IMPACT Services
September 2021 | 135 v

Adult MH Treatment Services
[Page intentionally left blank]
September 2021 | 136 v

Adult MH Treatment Services
IMPACT Return Rates
Initial Outcome Tool Return Rate
# of Admissions
# of Tools Submitted
Return Rate
Target Return Rate
First 6 Month Outcome Tool Return Rate
# of First 6 Month Updates
# of Tools Submitted
Return Rate
Target Return Rate
Most Recent Outcome Tool Return Rate
# of Most Recent Updates
# of Tools Submitted
Return Rate
Target Return Rate
50% 66% 79% 86% 100%
60% 60% 60% 60%
310 353 385 454
63%
60%
490 470 447 450 455
247
40% 57% 91% 90%
60% 60% 60% 60% 60%
19 25 14 23 21
12 10 8 21 19
67% 74% 100%
60% 60% 60% 60% 60%
50 45 55 69 21
14 28 37 51 21
Statewide Program Outcomes for IMPACT ServicesIndividualized and Mobile Programs of Assertive Community Treatment (IMPACT) services provide
intensive outpatient counseling, case management services, and psychiatric medication management for
adults with Serious Mental Illness (SMI). This is a reflection of the 6 agencies who provide IMPACT
services.
Outcome Tool Return Rate Information for IMPACT
The Data and Outcomes Work Group members set a goal for all contracted agencies to meet or exceed a
60% outcome tool return rate.
FY17 FY18 FY19 FY20 FY21
28% 62%
September 2021 | 137 v

Adult MH Treatment Services
IMPACT Services
State Average
Federally Required
IMPACT Services
State Average
Federally Required
IMPACT Services
State Average
Federally Required
IMPACT Services
State Average
Federally Required
IMPACT Services
State Average
Federally Required
88% 92% 95% 91% 91%
Participation in Treatment Planning: Perception of participation in treatment planning
FY17 FY18 FY19 FY20 FY21
80% 82% 85% 83% 70%
Outcome of Services: Perception of treatment outcomes as a result of services received
FY17 FY18 FY19 FY20 FY21
92% 82% 96% 94% 89%
Quality and Appropriateness of Services: Perception of the quality and appropriateness of treatment services received
FY17 FY18 FY19 FY20 FY21
93% 96% 96% 93% 91%
Access to Services: Perception of the ease and convenience of treatment services received
FY17 FY18 FY19 FY20 FY21
91% 92% 95% 95% 86%
Impact of IMPACT Services
Impact of treatment services is measured by surveying client perception of the quality of services received
including the following: general satisfaction with services, access to services, quality and appropriateness
of services, outcome of services, and participation in treatment planning. Additionally, impacts are
measured by improvements in social connectedness and overall functioning. Impact of treatment services is
relevant because clients who feel empowered, motivated, have positive family relationships, and feel they
have the ability to change may be more likely to have positive treatment outcomes.
The following information represents data from those clients who agreed or strongly agreed at the time of
most recent update.
General Satisfaction with Services: Overall satisfaction with treatment services received
FY17 FY18 FY19 FY20 FY21
September 2021 | 138 v

Adult MH Treatment Services
IMPACT Services
State Average
Admission
First 6 Month Update
Most Recent Update
Federally Required
IMPACT Services
State Average
Admission
First 6 Month Update
Most Recent Update
Federally Required
IMPACT Services
State Average
Admission
First 6 Month Update
Most Recent Update
IMPACT Services
State Average
Admission
First 6 Month Update
Most Recent Update 13%
Emergency Department: Clients who reported emergency department visit(s) within 6 months of…
27% 31% 24%
21% 19%
9%
FY20 FY21
21% 29%
19% 19%
FY17 FY18 FY19
14% 12% 15%
FY20 FY21
82% 67% 75% 74% 75%
79% 70% 84% 85% 82%
4% 8% 4% 7% 10%
6% 8% 10% 10% 8%
19%
8% 5% 10% 6% 5%
Utilization of High Cost Services for IMPACT Services
High cost services include the following: treatment for illness, injury, or surgery, emergency department
visits, hospital admissions for mental health care, detoxification services, inpatient substance use disorder
treatment services, or detention in a correctional facility. Participation in treatment services may help
reduce the frequency of client utilization of high cost services.
Illness, Injury, or Surgery: Clients who reported night(s) spent in a facility for illness, injury, or surgery within 6
months of…
FY17 FY18 FY19 FY20 FY21
73% 72% 77% 74% 76%
83% 83% 84% 79% 79%
85% 85% 87% 84% 82%
82% 68% 80% 78% 81%
Functioning: Perception of their mental health and social well-being at…
FY17 FY18 FY19
The following two sections include data at admission into services, at the first 6 month update, and at the
most recent update of services as a means to demonstrate improvement in social connectedness and
functioning.
Social Connectedness: Perception of their support system in the community at…
FY17 FY18 FY19 FY20 FY21
September 2021 | 139 v

Adult MH Treatment Services
IMPACT Services
State Average
Admission
First 6 Month Update
Most Recent Update
IMPACT Services
State Average
Admission
First 6 Month Update
Most Recent Update
IMPACT Services
State Average
Admission
First 6 Month Update
Most Recent Update
IMPACT Services
State Average
Admission
First 6 Month Update
Most Recent Update
IMPACT Services
State Average
Admission
First 6 Month Update
Most Recent Update 69% 66%
12% 25% 32% 28%
31% 5% 6% 8%
73% 69% 69%
66% 66% 71%
71% 67% 67%
Quality of Life Information for IMPACT Services
Quality of life is measured in several key life domains including the following: general health, suicide
attempts, employment status, and homelessness as shown in the tables below. Improvements in these areas
may indicate the effectiveness of treatment services.
General Health: Clients who reported their general health as good, very good, or excellent at…
FY17 FY18 FY19 FY20 FY21
63% 69%
78% 70%
28%
4% 8% 5% 5% 7%
0% 2% 3% 4% 5%
2%
Inpatient Substance Use Disorder Treatment Services: Clients who reported inpatient treatment services for
substance use disorders within 6 months of…
FY17 FY18 FY19 FY20 FY21
FY20 FY21
8% 12% 11% 9%
2% 0%
11% 19% 10%
12%
6% 2% 2% 4% 8%
22%
4% 5% 12%3% 6%
1% 2% 2%
Detoxification Services: Clients who reported night(s) spent in a facility for detoxification within 6 months of…
FY17 FY18 FY19 FY20 FY21
0% 0%
Correctional Facility: Clients who report night(s) spent in a correctional facility within 6 months of…
FY17 FY18 FY19
2% 0%
42% 42% 46% 37% 46%
13% 19% 20% 19% 17%
FY19 FY20 FY21
12%18%
Hospital Admissions for Mental Health Care: Clients who reported hospital admission(s) for mental health care
within 6 months of…
FY17 FY18
September 2021 | 140 v

Adult MH Treatment Services
IMPACT Services
State Average
Admission
First 6 Month Update
Most Recent Update
IMPACT Services
State Average
Admission
First 6 Month Update
Most Recent Update
Federally Required
IMPACT Services
State Average
Admission
First 6 Month Update
Most Recent Update
Federally Required
IMPACT Services
State Average
Admission
First 6 Month Update
Most Recent Update
Federally Required
19% 9% 12% 11%
FY18 FY19 FY20 FY21
18%
Employment Status: Clients who reported employment at…
FY17
18% 16% 16%
FY18 FY19 FY20 FY21
FY21
14% 15% 15%
18%
6% 1% 5% 3% 0%
5% 3% 5% 4% 7%
20% 18% 13% 15% 27%
6% 3%
Homelessness: Clients who reported homelessness at...
FY17
22%
4% 4%
Public Safety Information for IMPACT Services
Public safety information includes history of arrest. A reduction in this area may indicate how clients are
able to positively contribute to their families and communities.
History of Arrest: Clients who reported an arrest(s) within 30 days of…
FY17 FY18 FY19 FY20 FY21
11% 1% 2% 2% 4%
2% 1% 3% 2% 2%
15%
Not reported by level of care
Suicide Attempts: Clients who reported suicide attempt(s) within 6 months of…
FY17 FY18 FY19 FY20
13%
0% 8% 9% 10% 12%
Not reported by level of care
33%
September 2021 | 141 v

Adult MH Treatment Services
[Page intentionally left blank]
September 2021 | 142 v

Youth MH Treatment Services
Children, Youth, and
Family (CYF)
Treatment Services
September 2021 | 143 v

Youth MH Treatment Services
[Page intentionally left blank]
September 2021 | 144 v

Youth MH Treatment Services
# of Admissions
# of Tools Submitted
Return Rate
Target Return Rate
# of First 6 Month Updates
# of Tools Submitted
Return Rate
Target Return Rate
# of Most recent Updates
# of Tools Submitted
Return Rate
Target Return Rate
CYF Treatment Return Rates
- 60% 60% 60% 60%
1,575
- 848 1,024 1,401 1,831
- 18% 20% 40% 55%
Most Recent Outcome Tool Return Rate
- 4,708 5,174 3,467 3,341
- 34% 33% 54% 64%
- 60% 60% 60% 60%
- 915 1,102 1,093 950
- 310 367 586 610
- 60% 60% 60% 60%
First 6 Month Outcome Tool Return Rate
- 747 912 1,197 1,239
- 45% 55% 76% 86%
Initial Outcome Tool Return Rate
- 1,645 1,645 1,433
Outcome Tool Return Rate Information for CYF Treatment Services
The Data and Outcomes Work Group members set a goal for all contracted agencies to meet or
exceed a 60% outcome tool return rate.
FY17 FY18 FY19 FY20 FY21
Statewide Program Outcomes for Children, Youth, and Family (CYF) Treatment
Services
Children, Youth, and Family (CYF) Treatment Services are specialized outpatient services provided to
youth living with Serious Emotional Disturbance (SED). Services may include case management,
psychiatric care, individual, group, and/or family counseling. This is a reflection of the 11 agencies
who provide CYF treatment services.
September 2021 | 145 v

Youth MH Treatment Services
State MH Primary Disorders
8%
Number/Percent of Youth with
Developmental Disorders (Includes
Asperger's Syndrome Disorders)
159 166 136 93 72
3% 3% 2%
Number/Percent of Youth with
Conduct and Impulse-Control
Disorders (Includes ODD)
598 685 652 569
1% 1%
467
11% 11% 10% 9%
808
17% 16% 15% 14% 13%
0.5% 0.3% 0.3% 0.3% 0.3%
Number/Percent of Youth with
ADHD Disorders950 999 964 918
0% 0% 0%0%
Number/Percent of Youth with
Bipolar Disorders
25 21 17 17 18
59% 62% 64%
Number/Percent of Youth with
Schizophrenia Spectrum Disorder
(Includes Schizoaffective Disorder)
14 16 18 13 18
0%
0% 0%
Number/Percent of Youth with
Anxiety, Trauma, and Stress
Disorders (Includes Post-
Traumatic Stress Disorder)
3,156 3,655 3,822 3,935 3,881
57% 57%
13%
Number/Percent of Youth with
Other Disorders (Including
Personality Disorder, etc.)
32 34 30 24 24
1% 1% 0%
Number/Percent of Youth with
Depressive Disorders
617 791 831 784 765
11% 12% 13% 12%
Primary Diagnostic Information for CYF Treatment Services
The DBH monitors data and outcomes for publicly funded behavioral health treatment services. The
table below reflects information entered into the State Treatment Activity Reporting System (STARS)
by Community Mental Health Centers (CMHCs) for publicly funded youth receiving MH treatment
services. Due to updating from ICD 9 diagnostic codes to ICD 10 diagnostic codes, data may not
match previously published statistics as data was re-downloaded from STARS which is an active
database.
FY17 FY18 FY19 FY20 FY21
September 2021 | 146 v

Youth MH Treatment Services
CYF Treatment Services
State Average
National Average
Federally Required
CYF Treatment Services
State Average
National Average
Federally Required
CYF Treatment Services
State Average
National Average
Federally Required
CYF Treatment Services
State Average
National Average
Federally Required
CYF Treatment Services
State Average
National Average
Federally Required
- 91% 92% 88% 89%
- 89% 87% 88% 89%
Participation in Treatment Planning: Perception of participation in treatment planning
FY17 FY18 FY19 FY20 FY21
- 76% 77% 78% 72%
- 73% 72% 72% 75%
Outcome of Services: Perception of treatment outcomes as a result of services received
FY17 FY18 FY19 FY20 FY21
- 95% 96% 96% 96%
- 93% 93% 94% 95%
Cultural Sensitivity: Perception of staff sensitivity to cultural beliefs
FY17 FY18 FY19 FY20 FY21
- 95% 92% 95% 95%
- 87% 85% 87% 89%
Access to Services: Perception of the ease and convenience of treatment services received
FY17 FY18 FY19 FY20 FY21
- 92% 91% 91% 91%
- 88% 87% 88% 89%
General Satisfaction with Services: Overall satisfaction with treatment services received
FY17 FY18 FY19 FY20 FY21
Impact of CYF Treatment Services
Impact of treatment services is measured by surveying youth perception of the quality of services
received including the following: general satisfaction with services, access to services, cultural
sensitivity, outcome of services, and participation in treatment planning. Additionally, impacts are
measured by improvements in social connectedness and overall functioning. Impact of treatment
services is relevant because youth who feel empowered, motivated, have positive family relationships,
and feel they have the ability to change may be more likely to have positive treatment outcomes.
The following information represents data from those youth who agreed or strongly agreed at the time
of most recent update.
September 2021 | 147 v

Youth MH Treatment Services
CYF Treatment Services
State Average
Admission
First 6 Month Update
Most Recent Update
National Average
National Average
Federally Required
CYF Treatment Services
State Average
Admission
First 6 Month Update
Most Recent Update
National Average
National Average
Federally Required
State Average
Admission
First 6 month Update
Most Recent Update
State Average
Admission
First 6 month Update
Most Recent Update
- 61% 61% 63% 66%
- 59% 58% 57% 58%
Externalizing Disorder: Measures attention deficits, hyperactivity, impulsivity, conduct problems, and/or
other impulse control disorders at…
Externalizing Disorder Screener FY17 FY18 FY19 FY20 FY21
-
-
- 72% 72% 72% 73%
GAIN Short Screener (GAIN-SS) Scoring
The GAIN-SS is used as a simple measure of change after intervals of a month or more. The following
tables report the information gathered at admission, the first 6 month update, and at the most recent
update of services. These results can be used at the group level as an outcome measure by monitoring
over time.
Internalizing Disorder: Measures somatic complaints, depression, anxiety, trauma, suicide, and other serious
mental illness at…
Internalizing Disorder Screener FY17 FY18 FY19 FY20 FY21
64% 67% 62% 70%
- 77% 80% 80% 80%
71% 72% 69% 70%
Functioning: Perception of their mental health and social well-being at…
FY17 FY18 FY19 FY20 FY21
- 76% 76% 78% 73%
- 75% 73% 72% 75%
- 56% 60% 60% 60%
- 69% 72% 71% 70%
- 78% 89% 90% 87%
- 87% 86% 88% 88%
- 65% 80% 79% 78%
- 76% 87% 86% 87%
The following two sections include data at admission into services, at the first 6 month update, and at
the most recent update of services as a means to demonstrate improvement in social connectedness
and functioning.
Social Connectedness: Perception of their support system in the community at…
FY17 FY18 FY19 FY20 FY21
September 2021 | 148 v

Youth MH Treatment Services
State Average
Admission
First 6 month Update
Most Recent Update
State Average
Admission
First 6 month Update
Most Recent Update
CYF Treatment Services
State Average
Admission
First 6 Month Update
Most Recent Update
CYF Treatment Services
State Average
Admission
First 6 Month Update
Most Recent Update
CYF Treatment Services
State Average
Admission
First 6 Month Update
Most Recent Update
- 15% 14% 11% 13%
- 7% 9% 7% 6%
- 0% 7% 5% 5%
- 16% 16% 15% 15%
0% 9% 6% 6%
Hospital Admissions for Mental Health Care: Youth who reported hospital admission(s) for mental health
care within 6 months of…
FY17 FY18 FY19 FY20 FY21
- 7% 9% 9% 8%
-
0% 2% 3% 2%
- 25% 7% 7% 5%
26% 5% 4% 4%
Emergency Department: Youth who reported emergency department visit(s) within 6 months of…
FY17 FY18 FY19 FY20 FY21
-
-
- 24% 29% 26% 25%
Utilization of High Cost Services for CYF Treatment Services
High cost services include the following: treatment for illness, injury, or surgery, emergency
department visits, hospital admissions for mental health care, inpatient substance use disorder
treatment services, or detention in a correctional facility. Participation in treatment services may
reduce the frequency of youth utilization of high cost services.
Illness, Injury, or Surgery: Youth who reported night(s) spent in a facility for illness, injury, or surgery within
6 months of…
FY17 FY18 FY19 FY20 FY21
- 16% 20% 20% 19%
- 19% 17% 17% 18%
Crime/Violence: Measures interpersonal violence, drug-related crimes, property crimes, and
interpersonal/violent crimes at…
Crime/Violence Screener FY17 FY18 FY19 FY20 FY21
- 7% 7% 6% 7%
- 7% 9% 13% 9%
Substance Disorder Screener FY17 FY18 FY19 FY20 FY21
- 12% 13% 12% 11%
Substance Disorder: Measures Substance Use Disorder (SUD) symptoms at…
September 2021 | 149 v

Youth MH Treatment Services
CYF Treatment Services
State Average
Admission
First 6 Month Update
Most Recent Update
CYF Treatment Services
State Average
Admission
First 6 Month Update
Most Recent Update
CYF Treatment Services
State Average
Admission
First 6 Month Update
Most Recent Update
CYF Treatment Services
State Average
Admission
First 6 Month Update
Most Recent Update
CYF Treatment Services
State Average
Admission
First 6 Month Update
Most Recent Update
Not reported by level of care
Federally Required
- 19% 18% 16% 16%
- 18% 14% 12% 13%
Employment Status: Youth who are 15 years or older who reported employment at…
FY17 FY18 FY19 FY20 FY21
- 10% 12% 10% 11%
- 0% 9% 8% 9%
79%
84% 87% 88% 89%
Suicide Attempts: Youth who reported suicide attempt(s) within 6 months of…
FY17 FY18 FY19 FY20 FY21
-
-
- 21% 21% 20% 20%
- 31% 8% 6% 6%
89% 89% 89% 87%
Quality of Life Information for CYF Treatment Services
Quality of life is measured in several key life domains including the following: general health, suicide
attempts, employment status, and homelessness as shown in the tables below. Improvements in these
areas may indicate the effectiveness of treatment services.
General Health: Youth who reported their general health as good, very good, or excellent at…
FY17 FY18 FY19 FY20 FY21
- 41% 3% 3% 4%
- 0% 3% 5% 2%
- 84% 83% 82%
Correctional Facility: Youth who reported night(s) spent in a correctional facility within 6 months of…
FY17 FY18 FY19 FY20 FY21
- 1% 1% 1% 1%
- 0% 1% 1% 1%
3% 3% 2% 3%
Inpatient Substance Use Disorder Treatment Services: Youth who reported inpatient treatment services for
substance use disorders within 6 months of…
FY17 FY18 FY19 FY20 FY21
-
September 2021 | 150 v

Youth MH Treatment Services
CYF Treatment Services
State Average
Admission
First 6 Month Update
Most Recent Update
CYF Treatment Services
State Average
Admission
First 6 Month Update
Most Recent Update
National Average
National Average
Federally Required; National Data includes adults and youth
* This data was not released by SAMHSA by the time this report was compiled.
- 4% 3% 1% N/A*
- 3% 4% 5% 4%
- 0% 2% 2% 2%
Federally Required
Public Safety Information for CYF Treatment Services
Public safety information includes history of arrest. A reduction in this area may indicate how youth
are able to positively contribute to their families and communities.
History of Arrest: Youth who reported arrest(s) within 30 days of…
FY17 FY18 FY19 FY20 FY21
-
-
- 0% 3% 2% 1%
Homelessness: Youth who reported homelessness at...
FY17 FY18 FY19 FY20 FY21
0% 0% 0% 0%
- 0% 0% 0% 0%
0% 0% 0% 0%
September 2021 | 151 v

Youth MH Treatment Services
# of Admissions
# of Tools Submitted
Return Rate
Target Return Rate
# of First 6 Month Updates
# of Tools Submitted
Return Rate
Target Return Rate
# of Most Recent Updates
# of Tools Submitted
Return Rate
Target Return Rate
CYF Treatment Services
State Average
National Average
Federally Required
CYF Treatment Services
State Average
National Average
Federally Required
CYF Treatment Return Rates
- 98% 98% 98% 98%
- 87% 85% 87% 89%
Access to Services: Parents/Guardians who reported the ease and convenience of treatment services their
youth received
FY17 FY18 FY19 FY20 FY21
- 97% 97% 95% 96%
- 88% 87% 88% 89%
Impact of CYF Treatment Services
Impact of treatment services is measured by surveying parent/guardian perception of the quality of
services received including the following: general satisfaction with services, access to services,
cultural sensitivity, outcome of services, and participation in treatment planning. Additionally,
impacts are measured by improvements in social connectedness and overall functioning.
General Satisfaction with Services: Parents/Guardians who reported overall satisfaction with treatment
services their youth received
FY17 FY18 FY19 FY20 FY21
The following information represents data from those parents/guardians who agreed or strongly
agreed at the time of most recent update.
- 60% 60% 60% 60%
- 1,482 1,867 2,324 2,888
- 20% 23% 44% 58%
Most Recent Outcome Tool Return Rate
- 7,520 8,118 5,291 5,010
- 30% 31% 53% 69%
- 60% 60% 60% 60%
- 1,898 2,088 2,006 1,625
- 569 648 1,064 1,121
- 60% 60% 60% 60%
First 6 Month Outcome Tool Return Rate
- 1,179 1,723 2,209 1,104
- 40% 57% 78% 45%
Initial Outcome Tool Return Rate
- 2,924 3,003 2,817 2,477
Family Outcome Tool Return Rate Information for CYF Treatment Services
The Data and Outcomes Work Group members set a goal for all contracted agencies to meet or
exceed a 60% outcome tool return rate.
FY17 FY18 FY19 FY20 FY21
September 2021 | 152 v

Youth MH Treatment Services
CYF Treatment Services
State Average
National Average
Federally Required
CYF Treatment Services
State Average
National Average
Federally Required
CYF Treatment Services
State Average
National Average
Federally Required
CYF Treatment Services
State Average
Admission
First 6 Month Update
Most Recent Update
National Average
National Average
Federally Required
CYF Treatment Services
State Average
Admission
First 6 Month Update
Most Recent Update
National Average
National Average
Federally Required
FY17 FY18 FY19 FY20 FY21
- 76% 75% 75% 74%
- 75% 73% 72% 75%
- 65% 59% 62% 64%
- 75% 73% 72% 73%
Functioning: Parent/Guardian perception of their youth's mental health and social well-being at…
- 0% 95% 94% 93%
- 87% 86% 88% 88%
- 86% 87% 86% 87%
- 93% 94% 93% 93%
The following two sections include data at admission into services, at the first 6 month update, and at
the most recent update of services as a means to demonstrate improvement in social connectedness
and functioning.
Social Connectedness: Parent/Guardian perception of their youth's support system in the community at…
FY17 FY18 FY19 FY20 FY21
- 97% 97% 96% 96%
- 89% 87% 88% 89%
Participation in Treatment Planning: Parent/Guardian perception of participation in treatment planning
FY17 FY18 FY19 FY20 FY21
- 71% 76% 76% 74%
- 73% 72% 72% 75%
Outcome of Services: Parent/Guardian perception of treatment outcomes as a result of services their youth
received
FY17 FY18 FY19 FY20 FY21
- 90% 99% 99% 98%
- 93% 93% 94% 95%
Cultural Sensitivity: Parent/Guardian perception of staff sensitivity to cultural beliefs
FY17 FY18 FY19 FY20 FY21
September 2021 | 153 v

Youth MH Treatment Services
CYF Treatment Services
State Average
Admission
First 6 Month Update
Most Recent Update
CYF Treatment Services
State Average
Admission
First 6 Month Update
Most Recent Update
CYF Treatment Services
State Average
Admission
First 6 Month Update
Most Recent Update
CYF Treatment Services
State Average
Admission
First 6 Month Update
Most Recent Update
CYF Treatment Services
State Average
Admission
First 6 Month Update
Most Recent Update
- 1% 2% 2% 2%
- 0% 3% 3% 2%
Correctional Facility: Parents/Guardians who reported their youth had spent night(s) in a correctional facility
within 6 months of…
FY17 FY18 FY19 FY20 FY21
- 1% 0% 1% 0%
- 0% 0% 0% 1%
- 4% 3% 3% 3%
2% 1% 1% 2%
Inpatient Substance Use Disorder Treatment Services: Parents/Guardians who reported their youth received
inpatient treatment services for substance use disorders within 6 months of…
FY17 FY18 FY19 FY20 FY21
-
- 10% 9% 7% 8%
- 3% 4% 4% 4%
- 3% 4% 3% 3%
Emergency Department: Parents/Guardians who reported their youth had emergency department visit(s)
within 6 months of…
FY17 FY18 FY19 FY20 FY21
-
-
- 9% 8% 8% 8%
Hospital Admissions for Mental Health Care: Parents/Guardians who reported their youth had hospital
admission(s) for mental health care within 6 months of….
FY17 FY18 FY19 FY20 FY21
- 5% 5% 5% 4%
- 1% 5% 5% 3%
Utilization of High Cost Services for CYF Treatment Services
High cost services include the following: treatment for illness, injury, or surgery, emergency
department visits, hospital admissions for mental health care, inpatient substance use disorder
treatment services, or detention in a correctional facility. Participation in treatment services may help
reduce the frequency of youth utilization of high cost services.
Illness, Injury, or Surgery: Parents/Guardians who reported their youth spent night(s) in a facility for illness,
injury, or surgery within 6 months of…
FY17 FY18 FY19 FY20 FY21
2% 1% 2% 1%
- 4% 4% 4% 4%
2% 2% 3% 2%
September 2021 | 154 v

Youth MH Treatment Services
CYF Treatment Services
State Average
Admission
First 6 Month Update
Most Recent Update
CYF Treatment Services
State Average
Admission
First 6 Month Update
Most Recent Update
CYF Treatment Services
State Average
Admission
First 6 Month Update
Most Recent Update
Federally Required
CYF Treatment Services
State Average
Admission
First 6 Month Update
Most Recent Update
Federally Required
Not reported by level of care
Homelessness: Parents/Guardians who reported their youth's homelessness at…
FY17 FY18 FY19 FY20 FY21
0% 0% 0% 0%-
-
-
0% 0% 0% 0%
0% 0% 0% 0%
-
6% 6% 6% 5%
6% 7% 6% 5%
Suicide Attempts: Parents/Guardians who reported suicide attempt(s) by their youth within 6 months of…
FY17 FY18 FY19 FY20 FY21
Employment Status: Parents/Guardians who reported their youth's employment at…
FY17 FY18 FY19 FY20 FY21
- 4% 4%
- 95% 96% 95% 95%
-
- 7% 7% 6% 7%
-
96% 97% 95% 98%
4% 3%
- 2% 3% 3% 2%
Quality of Life Information for CYF Treatment Services
General Health: Parents/Guardians who reported their youth's general health as good, very good, or excellent
FY17 FY18 FY19 FY20 FY21
- 95% 94% 94% 93%
Quality of life is measured in several key life domains including the following: general health, suicide
attempts, employment status, and homelessness as shown in the tables below. Improvements in these
areas may indicate the effectiveness of treatment services.
September 2021 | 155 v

Youth MH Treatment Services
CYF Treatment Services
State Average
Admission
First 6 Month Update
Most Recent Update
National Average
National Average
Federally Required; National Data includes adults and youth
* This data was not released by SAMHSA by the time this report was compiled.
- 1% 3% 2% 2%
- 4% 3% 1% N/A*
- 2% 2% 5% 2%
- 1% 1% 1% 1%
Public Safety Information for CYF Treatment Services
Public safety information includes history of arrest. A reduction in this area may indicate how youth
are able to positively contribute to their families and communities.
History of Arrest: Parents/Guardians who reported arrest(s) of their youth within 30 days of…
FY17 FY18 FY19 FY20 FY21
September 2021 | 156 v

Targeted Services for Justice-Involved Adults
Fiscal Year 2021 (FY21) Program Activity
9
57% CBISA
5%
31% MRT
0.5% MRT Telehealth
`
6%
2%
99
Clients Served
Clients Served Totals
CBISA Telehealth 237
929
Other
2,193
Race
White
Black or African American
Asian
Native Hawaiian and Other Pacific
Islander
American Indian or Alaska Native
Two or More Races
0.2%
NA
Targeted Services for Justice-Involved Adults Profile
State InformationPrinted September 2021
Demographic Information
State Pop.
3%
1%
Totals
0%
9%
85%
2%
The demographic information includes clients who were funded
through state and federal funds, including Medicaid.
South Dakota is committed to providing quality
services to justice-involved adults by funding
evidence-based services to address substance use
disorder (SUD) and criminal thinking behavioral
health needs. Services are available in person or
via telehealth to ensure access statewide.
This state profile page reflects publicly funded
clients in FY21, which runs from June 2020 -
May 2021.
September 2021 | 157 v

Targeted Services for Justice-Involved Adults
[Page intentionally left blank]
September 2021 | 158 v

Targeted Services for Justice-Involved Adults
Targeted Services for Justice-Involved Adults
CBISA Treatment Services…………………………………………………………………….161
Outcome Tool Return Rate Information for CBISA……………………………….………………………………………163
Discharge Reasons for CBISA…………………………………………………...………………………….163
Primary Diagnostic Information for CBISA………………………………………………….………………………….164
Impact of CBISA…………………………………………...…………..………………………………….164
Utilization of High Cost Services for CBISA…………………………………….………………………………..165
Quality of Life Information for CBISA……………………………………………………………..………………………166
Public Safety Information for CBISA…………………………………………………………………..………………..168
Curriculum Fidelity for CBISA………………………….……………………………………..………168
MRT Treatment Services………………………………………..…………………...…………..170
Outcome Tool Return Rate Information for MRT…………………………….………………………………….….172
Discharge Reasons for MRT……………………………………….………………………………………….173
Impact of MRT…………………………………………...…..………….…………………………….173
Texas Christian University (TCU) Criminal Thinking Sub-Scales for MRT…………….…..174
Utilization of High Cost Services for MRT……………………..…………………………………………………..175
Quality of Life Information for MRT………………………………………………….……………………………………176
Public Safety Information for MRT………………………………………………..……………………………………..178
Curriculum Fidelity for MRT…….…………………………….………………………………………………..178
Appendix F: Targeted Services for Justice-Involved Adults………………………………………………………………335
Table of Contents
September 2021 | 159 v

Targeted Services for Justice-Involved Adults
[Page intentionally left blank]
September 2021 | 160 v

Targeted Services for Justice-Involved Adults
CBISA Treatment
Services
September 2021 | 161 v

Targeted Services for Justice-Involved Adults
[Page intentionally left blank]
September 2021 | 162 v
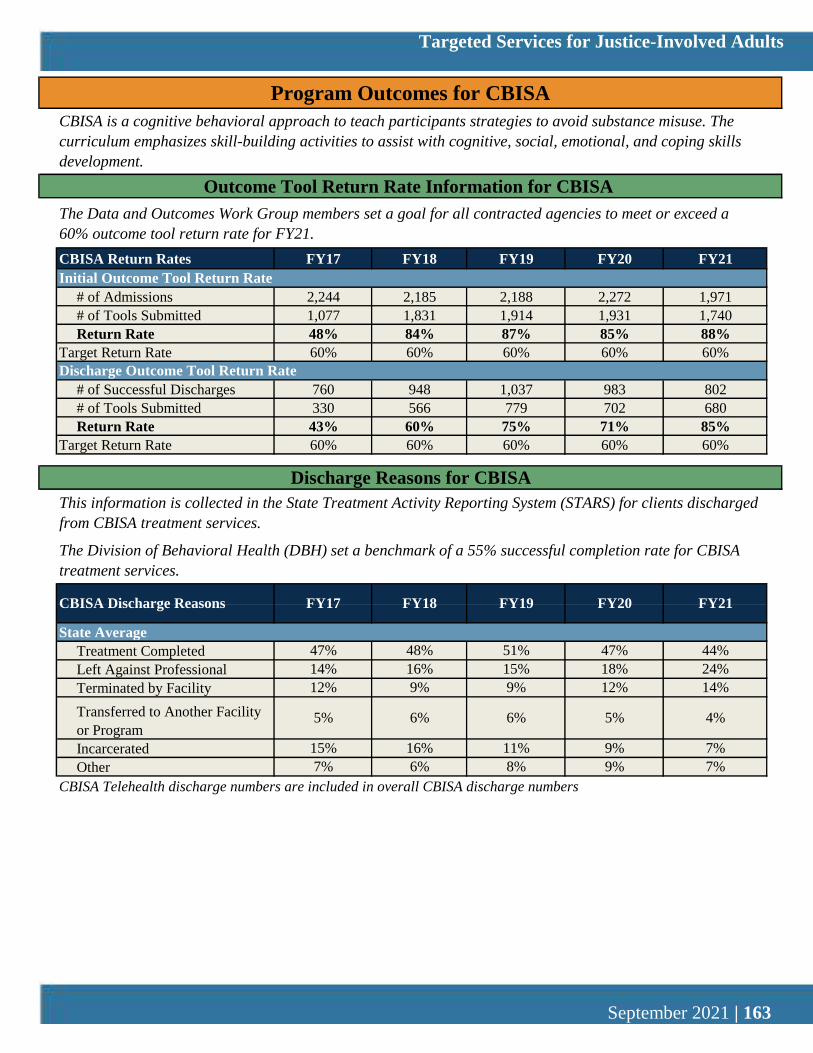
Targeted Services for Justice-Involved Adults
CBISA Return Rates
# of Admissions
# of Tools Submitted
Return Rate
Target Return Rate
# of Successful Discharges
# of Tools Submitted
Return Rate
Target Return Rate
State Average
Discharge Outcome Tool Return Rate
43% 60%
60%
Other 7%
948
9%
680
1,037 983
12%
60%
60% 60%
The Data and Outcomes Work Group members set a goal for all contracted agencies to meet or exceed a
60% outcome tool return rate for FY21.
60%
FY18
2,185
9%
Initial Outcome Tool Return Rate
760
60%
87% 85%
14%
16%
CBISA is a cognitive behavioral approach to teach participants strategies to avoid substance misuse. The
curriculum emphasizes skill-building activities to assist with cognitive, social, emotional, and coping skills
development.
1,931 1,740
15%
330
85%
60%
The Division of Behavioral Health (DBH) set a benchmark of a 55% successful completion rate for CBISA
treatment services.
802
5%
84% 88%
60%
Outcome Tool Return Rate Information for CBISA
FY17
14%
9%
4%
1,971
60%
This information is collected in the State Treatment Activity Reporting System (STARS) for clients discharged
from CBISA treatment services.
Discharge Reasons for CBISA
60%
48%
FY20 FY21
1,077
566
11%
Transferred to Another Facility
or Program5% 6% 6%
779
FY19
2,244
1,831 1,914
75%
702
Left Against Professional
12%
2,188 2,272
71%
6% 8% 9% 7%
FY18 FY19 FY20
48% 51% 47% 44%
Incarcerated 16%
Terminated by Facility
FY21
7%
47%
15%
CBISA Discharge Reasons
Treatment Completed
24%
CBISA Telehealth discharge numbers are included in overall CBISA discharge numbers
Program Outcomes for CBISA
18%
FY17
September 2021 | 163 v

Targeted Services for Justice-Involved Adults
State Average
Primary SUD Diagnosis
CBISA
State Average
-
0%
85
Terminated by Facility
Impact of treatment services is measured by surveying client perception of the quality of services received
including the following: general satisfaction with services, access to services, quality and appropriateness of
services, outcome of services, and participation in treatment planning. Additionally, impacts are measured by
improvements in social connectedness and overall functioning. Impact of treatment services is relevant
because clients who feel empowered, motivated, have positive family relationships, and feel they have the
ability to change may be more likely to have positive treatment outcomes.
60%
20%
58%
95%
CBISA Telehealth Discharge
Reasons
Left Against Professional 3%
FY20
FY17
11%
11%
15%
FY17
11% 12%
93% 95% 94% 96%
FY21
FY19FY18
8%
7%
Treatment Completed
Number/Percent of Clients with a
Primary Alcohol Use Disorder
776
2%
The following information represents data from those clients who agreed or strongly agreed at the time of
successful discharge.
FY20FY19
16% 13%
General Satisfaction with Services: Overall satisfaction with treatment services received
Number/Percent of Clients with a
Primary Amphetamine Use
Disorder
4% 3%5%
-
3%
109
40
18%
Number/Percent of Clients with a
Primary Cannabis Use Disorder
Number/Percent of Clients with a
Primary Other Use Disorder
117 86
-
890
-
80Number/Percent of Clients with a
Primary Opioid Use Disorder 5%-
7%
34%
423
5%
8%
27%
FY17
9%
FY21
- 35%
0%
399
0%
Transferred to Another Facility
or Program10%
955
35% 35% 38%
792
335350
FY21
43%- 39%
57% 45% 50%
39%
867
2%
Primary Diagnostic Information for CBISA
FY20
950
The DBH monitors data and outcomes for publicly funded behavioral health treatment services. The table
below reflects information entered into STARS by contracted providers for publicly funded clients receiving
CBISA treatment services. This does not include individuals who received only an assessment.
3%
FY19
1%
- 794
- 19%
1045
41%
5%
FY18
8%
Incarcerated
Other
36
Impact of CBISA
FY18
2%
70
3%
-
12%
September 2021 | 164 v

Targeted Services for Justice-Involved Adults
CBISA
State Average
CBISA
State Average
CBISA
State Average
CBISA
State Average
CBISA
State Average
Admission
Discharge
CBISA
State Average
Admission
Discharge
CBISA
State Average
Admission
Discharge
FY17
FY20
FY19
FY18
84%
81% 82% 83%
FY19 FY20
FY19
84%
94% 94%
5%
84%
- 7% 4%
- 5% 3%
4%
94%
Utilization of High Cost Services for CBISA
FY18
93%
1%
High cost services include the following: treatment for illness, injury, or surgery, emergency department
visits, hospital admissions for mental health care, detoxification services, inpatient substance use disorder
treatment services, or detention in a correctional facility. Participation in treatment services may help reduce
the frequency of client utilization of high cost services. Data from FY17 and June through December FY18
are not reported due to a change in the reporting process. The following section includes data at admission
into services and at successful discharge from services.
FY21
95%
FY17
Social Connectedness: Perception of their support system in the community at…
87% 92% 94%
93% 98% 92% 94% 95%
FY17 FY18 FY19 FY20 FY21
Access to Services: Perception of the ease and convenience of treatment services received
FY21
95%
FY20 FY21
Functioning: Perception of their mental health and social well-being at…
95%
84%
93%
Illness, Injury, or Surgery: Clients who reported night(s) spent in a facility for illness, injury, or surgery within 30
days of…
94%
4%
FY20
FY20
-
FY19
FY21
95%
93%90%
84%
95% 95%
Participation in Treatment Planning: Perception of participation in treatment planning
FY18
FY19
FY18
FY21
Quality and Appropriateness of Services: Perception of the quality and appropriateness of treatment services
received
91%
FY19
92% 91%
-
93% 95%
Outcome of Services: Perception of treatment outcomes as a result of services received
FY18 FY21
94%
FY17
95%95%
FY18
FY17 FY20
The following two sections includes data at admission into services and at successful discharge from services
as a means to demonstrate improvement in social connectedness and functioning.
FY17
FY17
September 2021 | 165 v

Targeted Services for Justice-Involved Adults
CBISA
State Average
Admission
Discharge
CBISA
State Average
Admission
Discharge
CBISA
State Average
Admission
Discharge
CBISA
State Average
Admission
Discharge
CBISA
State Average
Admission
Discharge
CBISA
State Average
Admission
Discharge
General Health: Clients who reported their general health as good, very good, or excellent at…
FY18
FY20 FY21
6%
7%
Inpatient Substance Use Disorder Treatment Services: Clients who reported inpatient treatment services for
substance use disorders within 30 days of…
5% 5%
21%
2% 1%
10%
-
15%
Quality of life is measured in several key life domains including the following: general health, suicide
attempts, employment status, homelessness, and other domains as shown in the tables below. Improvements
in these areas may indicate the effectiveness of treatment services. The following section includes data at
admission into services and at successful discharge from services.
1%
2%
FY17
-
90%
89%
52%
Correctional Facility: Clients who reported night(s) spent in a correctional facility within 30 days of…
FY17
1%2%
FY20
3%
FY21
FY18
FY21
93% 93%
FY18
90%
3%
1%
FY19
3%
- 69%
FY19
5%
2%
FY18
-
FY19
2%
Detoxification Services: Clients who reported night(s) spent in a facility for detoxification within 30 days of…
3%
Hospital Admissions for Mental Health Care: Clients who reported hospital admission(s) for mental health care
within 30 days of…
3%
4%
FY17
-
FY17
5%
FY20
49%
90%89%
Quality of Life Information for CBISA
FY19
-
FY20
0%
FY20
5%
FY21
FY21
FY18
7%
FY19
-
FY17
56%
FY18
5%
-
2%
4%
2% 2%
-
FY19 FY20
FY21
2%
6%
93%-
Emergency Department: Clients who reported emergency department visit(s) within 30 days of…
FY17
4%
4%
-
-
September 2021 | 166 v

Targeted Services for Justice-Involved Adults
CBISA
State Average
Admission
Discharge
CBISA
State Average
Admission
Discharge
6 Months Post-Treatment
CBISA
State Average
Admission
Discharge
CBISA
State Average
Admission
Discharge
CBISA
State Average
Before Program
End of Program
6 Months Post-Treatment
CBISA
State Average
Admission
Discharge
6 Months Post-Treatment
Because of low return rates on CBISA 6-Month survey, data may not accurately reflect this population.
98%
7%
Suicide Attempts: Clients who reported suicide attempt(s) within 30 days of…
FY17
48%
5%
50%
Because of low return rates on CBISA 6-Month survey, data may not accurately reflect this population.
FY21
Federally Required; Discharge data includes successful and unsuccessful discharges
78%
47%
86%
FY20
FY17
94%
FY18 FY19
86%87%
8% 6%
61%
Data from FY17 and June through December FY18 are not reported for suicide attempt(s) due to a change in
the reporting process.
FY18
1%
Ability to Control Use: Clients who reported the ability to control their substance use…
FY21
98%
50%
3% 2% 2%
FY21
8%
98%
94%
Because of low return rates on CBISA 6-Month survey, data may not accurately reflect this population.
FY17 FY18
94% 93%
97%
2%
Homelessness: Clients who reported homelessness at...
98%
67%
FY17
12%
Missing School/Work: Clients who reported missing school/work due to their substance use within 30 days of…
87%
54%
FY18
77%
FY20
FY20
95%
57% 53%
90%
12% 10%
3%
FY20 FY21
FY19
99%
11%
FY19
Motivation to Not Use Substances: Clients who reported motivation to not use substances at…
-
9%
64%57% 67%
37%
61%
48%
97%
FY18
FY19
-
92% 93%
87%
2% 2%
-
77%
69%
FY17 FY18 FY19
-
-
FY21
-
5%
FY20
-
FY20
2%
85%
Employment Status: Clients who reported employment at…
7%
FY19
- 2%
FY21
45%
2%
5%
FY17
85%
-
Federally Required; Discharge data includes successful and unsuccessful discharges
September 2021 | 167 v

Targeted Services for Justice-Involved Adults
CBISA
State Average
Admission
Discharge
CBISA
State Average
Admission
Discharge
CBISA
State Average
Admission
Discharge
CBISA Trainings 3
Public safety information includes history of arrest and trouble as a result of substance use. Reductions in
these areas may indicate how clients are able to positively contribute to their families and communities. The
following section includes data at admission into services and at successful discharge from services.
-
FY19
3
88%
FY20
3
53%
Public Safety Information for CBISA
History of Arrest: Clients who reported arrest(s) within 30 days of…
FY17
4%
FY21FY18
-
7%
4%
15%18%
9% 10%
FY17 FY18 FY19 FY20
89%
52%
20% 18%
FY18
58%
89% 92%
Engagement in Treatment Services: Clinicians who reported clients had positive or optimal engagement in treatment
services at…
FY21FY20FY17
10%24%
Curriculum Fidelity for CBISA
- 55% 60%
-
FY19
7%
FY21
Trouble as a Result of Substance Use: Clients who reported getting in trouble at home, school, work, or in the
community as a result of substance use within 30 days of…
5%
The University of Cincinnati Corrections Institute (UCCI) certified the DBH Training Team to provide
training of the CBISA curriculum.
CBISA Training FY17 FY18 FY20 FY21
CBISA Curriculum Trainings
3 2
FY19
4%
- 17% 16%
Federally Required; Discharge data includes successful and unsuccessful discharges
September 2021 | 168 v

Targeted Services for Justice-Involved Adults
[Page intentionally left blank]
September 2021 | 169 v

Targeted Services for Justice-Involved Adults
MRT Treatment Services
September 2021 | 170 v

Targeted Services for Justice-Involved Adults
[Page intentionally left blank]
September 2021 | 171 v

Targeted Services for Justice-Involved Adults
MRT Return Rates
# of Admissions
# of Tools Submitted
Return Rate
Target Return Rate
# of Successful Discharges
# of Tools Submitted
Return Rate
Target Return Rate
TCU Return Rates
# of Admissions
# of Tools Submitted
Return Rate
Target Return Rate
# of Successful Discharges
# of Tools Submitted
Return Rate
Target Return Rate
838
60% 60% 60%
FY18
792
84%
83%
FY21
Pre-Test Return Rate
Texas Christian University (TCU) Criminal Thinking Sub-Scales
60%60%
169
67%
60%
Discharge Outcome Tool Return Rate
1,001
202
45%
289 254
60%
88%
1,067 940
43%
FY17 FY18 FY19
187
416
91%
FY20
965 734
56%
289 350 448
76%
649
343
87%
60%
55%
131
457
80%
290
60%
409
434589 843
FY19
60%
1,067
94%
FY20
711
Outcome Tool Return Rate Information for MRT
85%
496
Initial Outcome Tool Return Rate
284 341
Program Outcomes for MRT
904
461
220
FY17
328
65% 69% 52%
84%
81%
819589
60% 60%
898
60%
Post-Test Return Rate
60%
287
64%
The Data and Outcomes Work Group members set a goal for all contracted agencies to meet or exceed a
60% outcome tool return rate for FY20.
FY21
MRT combines education, group and individual activities, and structured exercises to assist participants in
addressing negative thought and behavior patterns. The program promotes higher moral reasoning by
increasing self-image and promoting a productive identity. MRT includes 12 steps focusing on issues such as
honesty, trust, acceptance, healing, relationships, and setting goals.
414823
60% 60% 60%
60% 60%
60%
September 2021 | 172 v

Targeted Services for Justice-Involved Adults
State Average
MRT
State Average
MRT
State Average
The information is collected in the State Treatment Activity Reporting System (STARS) for clients discharged
from MRT treatment services.
Terminated by Facility
43%53%
11%9%
Treatment Completed
Other
State Average
Transferred to Another Facility
or Program
5% 10% 7%
Treatment Completed
10%
FY21
22%
The following information represents data from those clients who agreed or strongly agreed at the time of
successful discharge.
8%
0%
12%
6%
Terminated by Facility
Transferred to Another Facility
or Program
Other
18%
17% 25%
61% 33%
3%
8%
93% 93%92%
7% 3%Incarcerated
17%
FY18
91%
FY17
Impact of MRT
FY18
FY19
Impact of treatment services is measured by surveying client perception of the quality of services received
including the following: general satisfaction with services, access to services, quality and appropriateness of
services, outcome of services, and participation in treatment planning. Additionally, impacts are measured by
improvements in social connectedness and overall functioning. Impact of treatment services is relevant
because clients who feel empowered, motivated, have positive family relationships, and feel they have the
ability to change may be more likely to have positive treatment outcomes.
FY20
9%
0% 0%
FY19 FY20
3%
MRT Telehealth Discharge
Reasons
21%
31%
10%
7%
4%
40%
3%
Left Against Professional
Advice
FY20FY18
0%
50%
13%
32%
0%
FY21
3%
51%
33%
42%
17%
5%
The Division of Behavioral Health (DBH) set a benchmark of a 48% successful completion rate for MRT
treatment services.
46%
3%
FY17 FY19
4% 5%14%
FY17 FY18 FY19
Discharge Reasons for MRT
10%
40%
14%
Incarcerated
18% 13%
FY17
Access to Services: Perception of the ease and convenience of treatment services received
89%
MRT Telehealth discharge numbers are included in overall MRT discharge numbers
FY21
88% 96% 93% 96% 89%
5%
MRT Discharge Reasons
23% 25%
FY20
6%
11%Left Against Professional
Advice
FY21
General Satisfaction with Services: Overall satisfaction with treatment services received
September 2021 | 173 v

Targeted Services for Justice-Involved Adults
MRT
State Average
MRT
State Average
MRT
State Average
MRT
State Average
Admission
Discharge
MRT
State Average
Admission
Discharge
MRT
State Average
Pre-Test
Post-Test
Reduction
MRT
State Average
Pre-Test
Post-Test
Reduction
FY20
FY21
Entitlement: Sense of ownership and privilege, misidentifying wants as needs
89% 94%
82%
FY17 FY18
Outcome of Services: Perception of treatment outcomes as a result of services received
FY21
FY18
1.6
18.2
16.7
FY19
92%
87%
FY17
94%
FY17 FY18
90%
FY19
90% 91%
84%
92% 93%
FY21
15.2 14.8
16.1
FY21
18.0
16.1
Justification: Justifies actions based on external circumstances or actions of others
93%
The following two sections include data at admission into services and at successful discharge from services
as a means to demonstrate improvement in social connectedness and functioning.
TCU Criminal Thinking Sub-Scales from Pre-Test to Post-Test
94% 91%
95%
85%
FY19 FY20
92%
Quality and Appropriateness of Services: Perception of the quality and appropriateness of treatment services
received
FY18
83% 83%
84%
FY20 FY21
93%
92%
82%
FY20
FY19FY17
FY19 FY21
88%
1.7 0.9 1.1
17.9
FY19
94%
Social Connectedness: Perception of their support system in the community at…
-
FY20
94%
Participation in Treatment Planning: Perception of participation in treatment planning
82%
FY20
The TCU Criminal Thinking Sub-Scales is the tool used at admission into and at discharge from MRT
treatment services. The sub-scales were developed to assess cognitive functioning expected to be related to
criminal conduct. A reduction in any of the six sub-scales from pre-test to post-test may indicate a reduction
in criminal thinking.
FY17
92%
FY18FY17
FY21
FY18
1.8
15.9
2.21.8
15.8 15.3
16.116.5
17.9
96%
FY19FY18FY17
1.9
18.5
Functioning: Perception of their mental health and social well-being at…
20.2
94%
1.4
16.7
-
17.8
16.6
89%
1.7
16.4
93%
FY20
September 2021 | 174 v

Targeted Services for Justice-Involved Adults
MRT
State Average
Pre-Test
Post-Test
Reduction
MRT
State Average
Pre-Test
Post-Test
Reduction
MRT
State Average
Pre-Test
Post-Test
Reduction
MRT
State Average
Pre-Test
Post-Test
Reduction
MRT
State Average
Admission
Discharge
MRT
State Average
Admission
Discharge
6%
21.5 21.5
5%
17.2
24.1
21.7
23.9
FY17
9%
FY20
Illness, Injury, or Surgery: Clients who reported night(s) spent in a facility for illness, injury, or surgery within 30
days of…
FY19
Cold Heartedness: Callousness and lack of emotional involvement in relationships
21.4
1.3
6% 4%
19.1
5% 4%
FY17
Power Orientation: Need for power, control, and retribution
FY21
- 5%
2.0
5%
4%
3%
FY20
FY21
Utilization of High Cost Services for MRT
FY17
FY19
3%
Personal Irresponsibility: Unwillingness to accept ownership for criminal actions
FY19 FY20
FY17 FY18
21.9
1.8 2.4 2.5
FY18FY17
Criminal Rationalization: Negative attitude toward the law and authority figures
23.2
17.3
23.1
FY18
1.9
-
23.7 23.3 23.5
0.4
20.0
FY20
FY19
19.9
2.4
19.1 19.1
22.0
FY19
-
2.4
4%
FY21FY18
0.8
1.9
21.1
23.0 24.4
FY21
21.7
24.3
FY21
FY20 FY21
24.5
1.9 2.2
1.7
FY17
1.8
23.3 19.2
21.1
16.6
1.4
Emergency Department: Clients who reported emergency department visit(s) within 30 days of…
16.7 16.8
High cost services include the following: treatment for illness, injury, or surgery, emergency department
visits, hospital admissions for mental health care, detoxification services, inpatient substance use disorder
treatment services, or detention in a correctional facility. Participation in treatment services may help reduce
the frequency of client utilization of high cost services. Data from FY17 and June through December FY18
are not reported due to a change in the reporting process. The following section includes data at admission
into services and at successful discharge from services.
FY19
23.5
6%
21.6
4%
4%
FY18
1.9 2.1
18.4
FY18
24.5 24.8
19.3 19.0
FY20
19.6
1.31.0
-
September 2021 | 175 v

Targeted Services for Justice-Involved Adults
MRT
State Average
Admission
Discharge
MRT
State Average
Admission
Discharge
MRT
State Average
Admission
Discharge
MRT
State Average
Admission
Discharge
MRT
State Average
Admission
Discharge
MRT
State Average
Admission
Discharge
7%
Suicide Attempts: Clients who reported suicide attempt(s) within 30 days of…
-
-
2%
FY19
Data from FY17 and June through December FY18 are not reported for suicide attempt(s) due to a change in the
reporting process.
FY18
2%
- 85%
FY20
2%2%
FY17
- 4%
Inpatient Substance Use Disorder Treatment Services: Clients who reported inpatient treatment services for
substance use disorders within 30 days of…
5%
84% 92%
FY17 FY20
- 1%
FY19 FY20FY17
90%
FY18
- 92%
85%
4%
33%
14%
86% 86%
FY18 FY19 FY20
8% 5% 3%
FY21
1%
3%
- 11%
6%
FY21
Correctional Facility: Clients who reported night(s) spent in a correctional facility within 30 days of…
10%
2%
1%
General Health: Clients who reported their general health as good, very good, or excellent at…
1%
FY20 FY21
3% 2% 2%
-
FY17
7%
FY20
Quality of life is measured in several key life domains including the following: general health, suicide
attempts, employment status, homelessness, and other domains as shown in the tables below. Improvements
in these areas may indicate the effectiveness of treatment services. The following section includes data at
admission into services and at discharge from services.
-
1%
25%
1%
FY17
-
-
47%
FY18 FY19
1%
FY21
Detoxification Services: Clients who reported night(s) spent in a facility for detoxification within 30 days of…
Hospital Admissions for Mental Health Care: Clients who reported hospital admission(s) for mental health care
within 30 days of…
Quality of Life Information for MRT
3%
7%
FY21
FY17
3%
FY19
4%
FY18 FY19
FY21
71% 49%
10% 8% 8%
FY18
-
September 2021 | 176 v

Targeted Services for Justice-Involved Adults
MRT
State Average
Admission
Discharge
MRT
State Average
Admission
Discharge
MRT
State Average
Admission
Discharge
MRT
State Average
Before Program
End of Program
MRT
State Average
Admission
Discharge
MRT
State Average
Admission
Discharge
69%
-
FY17 FY21
FY17
51%63%
53%
3%
FY17
2%
FY19
3%
FY18 FY19 FY20
70%
-
96%
98%
-
FY20
-
-
60%
2%
FY19
FY19 FY20 FY21
78%
50%
FY19FY18
90%
2%
11% 10%
FY21
Engagement in Treatment Services: Clinicians who reported clients had positive or optimal engagement in treatment
services at…
FY20
FY17
99%
1%
FY18
3%
85%
-
Missing School/Work: Clients who reported missing school/work due to their substance use within 30 days of…
2% 3%
100%
89%
FY18 FY19
-
8%
FY21
99%
49%
-
FY21
47%
Motivation to Not Use Substances: Clients who reported motivation to not use substances at…
58%
88% 87%
78%
61%
FY21
91% 94% 94%
FY17
FY17
FY20
10%
67%
FY18
60%
FY18
Ability to Control Use: Clients who reported the ability to control their substance use…
5%
-
-
48% 56%
Employment Status: Clients who reported employment at…
59% 71%
-
Homelessness: Clients who reported homelessness at…
2%
-
2%
FY20
Federally Required; Discharge data includes successful and unsuccessful discharges
Federally Required; Discharge data includes successful and unsuccessful discharges
September 2021 | 177 v

Targeted Services for Justice-Involved Adults
MRT
State Average
Admission
Discharge
MRT
State Average
Admission
Discharge
MRT Trainings
Advanced MRT Trainings
11%
Public Safety Information for MRT
FY17 FY18
2
FY19 FY20 FY21
FY17
Public safety information includes history of arrest and trouble as the result of substance use. Reductions in
these areas may indicate how clients are able to positively contribute to their families and communities. The
following section includes data at admission into services and at successful discharge from services.
1 1
FY20
5%
4%
- 11%
FY19
MRT Curriculum Trainings
18%
FY20
14%
Correctional Counseling, Inc. (CCI) provides both MRT trainings and advanced MRT trainings for continued
skill development.
Curriculum Fidelity for MRT
1 2 1 2
MRT Training FY17 FY18 FY19
1
Trouble as a Result of Substance Use: Clients who reported getting in trouble at home, school, work, or in the
community as a result of substance use within 30 days of…
2 2
FY21
- 24%
FY21
Federally Required; Discharge data includes successful and unsuccessful discharges
FY18
18%
- 5% 5%
History of Arrest: Clients who reported arrest(s) within 30 days of…
9%17% 10%
12%
4%
- 18%
September 2021 | 178 v

Targeted Services for Justice-Involved Youth
Fiscal Year 2021 (FY21) Program Activity
FFT
ART*
MRT*
UJS
DOC
Clients Served Totals
433
58
263
44
141
430
Black or African American
American Indian and Alaska Native
Two or More Races
Source of Referrals
*Other Sources
MRT Telehealth
18%
Asian
0.1%
70%
TotalsRace
TotalsSource
276
Targeted Services for Justice-Involved Youth
State InformationPrinted September 2021
7%
1%
Clients ServedDemographic Information
1%
ART Telehealth 19
Other
Native Hawaiian and Other Pacific
Islander
White
3%
Targeted services for justice-involved youth were established in
2015 by Senate Bill 73. The Department of Social Services (DSS)
worked with the Department of Corrections (DOC) and the Unified
Judicial System (UJS) to identify and implement community-based
treatment services for justice-involved and at-risk youth. Those
services include Functional Family Therapy (FFT), Aggression
Replacement Training (ART), and Moral Reconation Therapy
(MRT). As of FY19, substance use disorder services are also
available. Additional Services include Systems of Care (SOC) and
Family Support Program (FSP). Outcomes for these programs are
monitored separately from this document.
This state profile page reflects JJRI publicly funded clients in FY21,
which runs from June 2020 - May 2021.
The demographic information includes clients funded
through state and federal funds, including Medicaid.
*Other sources includes any referral received
outside of UJS or DOC such as schools, parents,
Child Protection Services, or diversion programs
*MRT and ART Telehealth clients served are counted
in the overall MRT and ART total.
September 2021 | 179 v

Targeted Services for Justice-Involved Youth
[Page intentionally left blank]
September 2021 | 180 v

Targeted Services for Justice-Involved Youth
FFT Treatment Services
Youth Information……………………………………………………………………………….
Outcome Tool Return Rate Information for FFT…………………………………………………….……….
Discharge Reasons for FFT………………………………………………………………………………………
Impact of FFT……………………………………………………………………………………………..
Utilization of High Cost Services for FFT………………………………………………………………..
Quality of Life Information for FFT……………………………………………………………………………………………………..
Public Safety Information for FFT……………………………………………………………………………………………………………………………………
Family Information……………………………………………………………………………
Family Outcome Tool Return Rate Information for FFT…………………………………………………………………………………………………………
Impact of FFT…………………………………………………………………………………………………………………..
Utilization of High Cost Services for FFT……………………………………………………………………………………………………………………………….
Quality of Life Information for FFT…………………………………………………………………………………………………………………………
Public Safety Information for FFT…………………………………………………………………………………………………………………………..
Curriculum Fidelity for FFT………………………………………………………………….
ART Treatment Services
Youth Information……………………………………………………………………………….
Outcome Tool Return Rate Information for ART………………………………………………………………………………………………………
Discharge Reasons for ART………………………………………………………………………………………………………………….
Impact of ART…………………………………………………………………………………………………………………..
Utilization of High Cost Services for ART……………………………………………………………………………………………………………
Quality of Life Information for ART……………………………………………………………………….………………………………………………………….
Public Safety Information for ART………………………………………………………………………………………..………………………………………….
AQ Sub-Scales for ART………………………………………………………………..…..…………………………………….
HIT Sub-Scales for ART……………………………………………………………………………...…………………………………..
Family Information……………………………………………………………………………
Family Outcome Tool Return Rate Information for ART……………………………………………………………………………
Impact of ART…………………………………………………………………………………………………………………………….
Utilization of High Cost Services for ART……………………………………………………………………………………………………………………
Quality of Life Information for ART…………………………………………………………………………………...………………………………………………………
Public Safety Information for ART………………………………………………………………………………………………………………………………………………
Curriculum Fidelity for ART………………………………………………………………….
MRT Treatment Services
Youth Information……………………………………………………………………………………………………….
Outcome Tool Return Rate Information for MRT………………………………………………………………………………………………………
Discharge Reasons for MRT………………………………………………………………………………………………………………………….
Impact of MRT…………………………………………………………………………………………………………………..
Utilization of High Cost Services for MRT……………………………………………………………………………………………………………
Quality of Life Information for MRT……………………………………………………………………….………………………………………………………….
Public Safety Information for MRT………………………………………………………………………………………..………………………………………….
HIT Sub-Scales for MRT…………………………………….……………………………………………………………………..
Targeted Services for Justice-Involved Youth
196
197
198
198
207
208
209
209
210
Table of Contents
183
184
185
186
188
189
190
191
191
191
193
194
195
195
200
201
202
202
203
201
204
204
205
206
207
212
213
213
214
September 2021 | 181 v

Targeted Services for Justice-Involved Youth
Family Information……………………………………………………………………………
Family Outcome Tool Return Rate Information for MRT………………………………………………………………………………………………………
Impact of MRT…………………………………………………………………………………………………………………………….
Utilization of High Cost Services for MRT……………………………………………………………………………………………………………………
Quality of Life Information for MRT…………………………………………………………………………………...………………………………………………………
Public Safety Information for MRT………………………………………………………………………………………………………………………………………………
Curriculum Fidelity for MRT………………………………………………………………….218
215
215
215
216
217
218
351
Supporting Data
Appendix G: Targeted Services for Justice-Inolved Youth….......................................
September 2021 | 182 v

Targeted Services for Justice-Involved Youth
FFT Treatment Services
September 2021 | 183 v

Targeted Services for Justice-Involved Youth
FFT Return Rates
# of Admissions
# of Tools Submitted
Return Rate
Target Return Rate
# of Successful Discharges
# of Tools Submitted
Return Rate
Target Return Rate
TOM Return Rates
# of Discharges
# of Tools Submitted
Return Rate
Target Return Rate
199 217
- 151 275 177 190
Program Outcomes for FFT
Initial Outcome Tool Return Rate
FFT is a family-based therapy that focuses on building skills to improve family relationships, reduce
behavioral issues and improve school performance. FFT is a clinical model that increases a family’s
motivation to change and tailors interventions to each family’s unique risk and protective factors.
Outcome Tool Return Rate Information for FFT
The Data and Outcomes Work Group members set a goal for all contracted agencies to meet or exceed a 60%
outcome tool return rate.
FY17 FY19
- 448 470
FFT Treatment Services
211 308 128 82
- 69 141 107 61
-
- 60% 60%
Discharge Outcome Tool Return Rate
59% 89% 88%
60% 60%
- 33% 46%
-
74%
60% 60%
Post-Test Return Rate
314 353 538 448
270 329 522 350 377
86%
84%
439
Therapist Outcome Measure (TOM) Return Rate
FY17 FY18 FY19 FY20 FY21
60% 60%
- 34%
FY20 FY21FY18
93% 97% 80% 84%
80% 80% 80% 80% 80%
September 2021 | 184 v

Targeted Services for Justice-Involved Youth
COM-A Return Rates
# of Successful Discharges
# of Tools Submitted
Return Rate
Target Return Rate
FFT Completion Rate
State Average
FFT
State Average
Completion Outcomes
Living at Home
In School/Working
No New Violations
FFT
State Average
General Change
Communication Skills
Adolescent Behavior
Parenting Skills
Supervision Levels
Levels of Conflict
FY21FY19FY18 FY20
85% 86% 86% 85% 74%
85%
91% 90% 88% 89% 87%
81%
90%
92% 92% 90%
89%
92%
98%
84% 85%
91%
*No New Violations means the youth did not have a new offense and/or did not violate probation or aftercare during the
course of FFT treatment services. Violations prior to admission into FFT treatment services do not count as new
violations.
90% 87%
90%
Discharge Reasons for FFT
FY17
199
FY18 FY19
FY21
The Division of Behavioral Health (DBH) has set a benchmark of a 70% completion rate for FFT treatment
services.
FY20 FY21
Program Outcome Tools
314
97%93%
FY18 FY19 FY20
96% 98%
61%63% 68% 71% 58%
The Program Outcome Tools and TOM information are derived from the Tri-Yearly Performance Evaluation
(TYPE) report. This information is collected from the FFT therapist and entered into the Clinical Service
System (CSS) on all families who complete FFT treatment services.
FY17
81%
96%
90%
93% 90% 90% 92% 92%
96%93%
TOM - Completed Services
FY17
94%
84%
95%
76% 81% 82%
Post-Test Return Rate
353 308 199 198
Client Outcome Measure-Adolescent (COM-A) Return Rate
FY17 FY18 FY19 FY20 FY21
The TOM is completed by the therapist when the family is discharged from FFT treatment services. The TOM
measures changes in behavior and functioning of the youth and family. Higher percentages indicates better
outcomes and positive increases in the indicated areas.
282 331 299 164 140
90% 94% 97% 82% 71%
80% 80% 80% 80% 80%
September 2021 | 185 v

Targeted Services for Justice-Involved Youth
FFT
State Average
General Change
Communication Skills
Adolescent Behavior
Parenting Skills
Supervision Levels
Levels of Conflict
FFT
State Average
Federally Required
FFT
State Average
Federally Required
FFT
State Average
Federally Required
FFT
State Average
Federally Required
FFT
State Average
Federally Required
77%
FY20
84%
FY21
FY18
-
FY20
- 80% 83% 77% 79%
82%
FY17
FY19
FY21
79%
17%
FY17 FY18 FY19 FY20 FY21
- 86% 84%
95%
FY17 FY18 FY19 FY20
18%
85% 90%
- 94% 89% 92%
FY21
FY17 FY18
- 82% 89% 85%
FY19
94%
TOM - Attempted Services: The FFT therapists complete this survey on all families who attended at least one session
but did not complete services.
FY17 FY18 FY19 FY20 FY21
14%
35% 17% 21% 16% 15%
34% 17% 19% 13%
16%
16% 13%
35% 17% 20% 16%
27% 16%
Impact of FFT
Impact of treatment services is measured by surveying youth perception of the quality of services received
including the following: general satisfaction with services, access to services, cultural sensitivity, outcome of
services, and participation in treatment planning. Additionally, impacts are measured by improvements in
social connectedness and overall functioning. Impact of treatment services is relevant because youth who feel
empowered, motivated, have positive family relationships, and feel they have the ability to change may be more
likely to have positive treatment outcomes.
FY17
The following information represents data from those youth who agreed or strongly agreed at the time of
successful discharge.
General Satisfaction with Services: Overall satisfaction with treatment services received
FY21
FY18 FY19 FY20
Access to Services: Perception of the ease and convenience of treatment services received
Cultural Sensitivity: Perception of staff sensitivity to cultural beliefs
Outcome of Services: Perception of treatment outcomes as a result of services received
Participation in Treatment Planning: Perception of participation in treatment planning
27% 16% 14%
31% 16% 19% 12% 15%
11%
September 2021 | 186 v

Targeted Services for Justice-Involved Youth
FFT
State Average
Admission
Discharge
Federally Required
FFT
State Average
Admission
Discharge
Federally Required
State Average
Admission
Discharge
State Average
Admission
Discharge
State Average
Admission
Discharge
FY18 FY19
-
66%
62% 66% 71%
- 48% 50%
69%
85% 79% 78%
-
77% 82%
-
FY21
60%
80% 84%
The GAIN-SS is used as a simple measure of change after intervals of a month or more. The following tables
report the information gathered at admission into services and at successful discharge from services. These
results can be used at the group level as an outcome measure by monitoring over time.
The following two sections include data at admission into services and at successful discharge from services as
a means to demonstrate improvement in social connectedness and functioning.
78%
65%-
65%
Internalizing Disorder Screener FY17 FY18 FY19 FY20 FY21
-
Substance Disorder Screener
FY19
FY21
-
70%
89%
74%
-
63%
FY17 FY18
FY20 FY21
-
GAIN Short Screener (GAIN-SS) Scoring
Externalizing Disorder Screener FY20
58% 53%
FY17
Substance Disorder: Measures substance use disorder (SUD) symptoms at…
FY19
66%
FY18
FY17 FY21
57%
16% 18%
-
FY20
90% 84% 89%
FY17
55% 49% 52%
12% 14%
8% 5% 11% 3%
Externalizing Disorder: Measures attention deficits, hyperactivity, impulsivity, conduct problems, and/or other impulse
control disorders at…
FY18 FY19 FY20
Social Connectedness: Perception of their support system in the community at…
Functioning: Perception of their mental health and social well-being at…
Internalizing Disorder: Measures somatic complaints, depression, anxiety, trauma, suicide, and other serious mental
illness at…
September 2021 | 187 v

Targeted Services for Justice-Involved Youth
State Average
Admission
Discharge
FFT
State Average
General Change
Communication Skills
Adolescent Behavior
Parenting Skills
Supervision Levels
Levels of Conflict
FFT
State Average
Admission
Discharge
FFT
State Average
Admission
Discharge
FFT
State Average
Admission
Discharge
Crime/Violence: Measures interpersonal violence, drug-related crimes, property crimes, and interpersonal/violent crimes
at…
High cost services include the following: treatment for illness, injury, or surgery, emergency department visits,
hospital admissions for mental health care, inpatient substance use disorder treatment services, or detention in
a correctional facility. Participation in treatment services may help reduce the frequency of youth utilization of
high cost services.
25% 32%22%
10%-
9% 7% 11%
5%
83% 89%
1%
Crime/Violence Screener FY18
FY19 FY20 FY21
-
80% 81% 80% 85% 74%
84% 85% 81%
89% 84%
FY20 FY21
79% 86% 84%
FY17 FY18 FY19 FY20
85% 84%
86% 91% 84%
86%
20% 19% 23%
FY17
28%
FY19 FY20 FY21
The COM-A is completed by the adolescent when the family completes FFT treatment services. The COM-A
measures changes in behavior and functioning of the youth and family. Higher percentages indicates better
outcomes and positive increases in the indicated areas.
COM-A
FY17 FY18
Utilization of High Cost Services for FFT
Illness, Injury, or Surgery: Youth who reported night(s) spent in a facility for illness, injury, or surgery within 6 months
of…
FY17 FY18 FY19
8% 9% 8%
- 9% 0%
- 8%
- 13% 15% 17% 21%
- 10% 17% 19% 21%
- 10% 12% 11% 5%
Emergency Department: Youth who reported emergency department visit(s) within 6 months of…
Hospital Admissions for Mental Health Care: Youth who reported hospital admission(s) for mental health care within
6 months of…
FY17 FY18 FY19 FY20 FY21
83%
80% 86%
FY21
79% 87% 80%
- 7%
86% 83% 88%
September 2021 | 188 v

Targeted Services for Justice-Involved Youth
FFT
State Average
Admission
Discharge
FFT
State Average
Admission
Discharge
FFT
State Average
Admission
Discharge
FFT
State Average
Admission
Discharge
FFT
State Average
Discharge
Federally Required
FFT
State Average
Discharge
Federally Required
97%99%
- 0% 1% 0% 0%
FY20 FY21
16%- 36% 22% 18%
- 8% 8% 5% 7%
- 4% 5%
- 25% 26%
-
2% 3%
FY20 FY21
Correctional Facility: Youth who reported night(s) spent in a correctional facility within 6 months of…
FY17
Suicide Attempts: Youth who reported suicide attempt(s) within 6 months of…
13% 22% 16%
-
Employment Status: Youth who reported employment at…
FY17 FY18 FY19 FY20 FY21
- 16% 11% 15% 11%
86%
FY18 FY19
Quality of life is measured in several key life domains including the following: general health, suicide attempts,
employment status, and homelessness. Improvements in these areas may indicate the effectiveness of treatment
services.
89% 87% 89% 85%
FY21
19% 22% 22%
Inpatient Substance Use Disorder Treatment Services: Youth who reported inpatient treatment services for substance
use disorders within 6 months of…
FY17 FY18 FY19 FY20 FY21
23%
FY17
26% 23%
-
Homelessness: Youth who reported homelessness at...
FY17 FY18 FY19
92%
FY17 FY18 FY19
3%
Quality of Life Information for FFT
General Health: Youth who reported their general health as good, very good, or excellent at…
FY20
FY18 FY19 FY20 FY21
-
September 2021 | 189 v

Targeted Services for Justice-Involved Youth
FFT
State Average
Admission
Discharge
Federally Required
FFT
State Average
Public safety information includes history of arrest and legal violations. Reductions in these areas may indicate
how youth are able to positively contribute to their families and communities.
FY17 FY18 FY19 FY20
3% 2% 1% 3% 0%
Public Safety Information for FFT
History of Arrest: Youth who reported arrest(s) within 30 days of…
FY17 FY18 FY19 FY20 FY21
- 14% 16% 11% 13%
- 6% 5% 8% 8%
Legal Violations that Resulted in Youth Not Completing FFT: This information is reported by the FFT therapist
FY21
September 2021 | 190 v

Targeted Services for Justice-Involved Youth
FFT Return Rates
# of Admissions
# of Tools Submitted
Return Rate
Target Return Rate
# of Successful Discharges
# of Tools Submitted
Return Rate
Target Return Rate
COM-P Return Rates
# of Successful Discharges
# of Tools Submitted
Return Rate
Target Return Rate
FFT
State Average
Federally Required
Post-Test Return Rate
314 353 308 199 198
General Satisfaction with Services: Parents/Guardians who reported overall satisfaction with treatment services their
youth received
285 326 305 166 151
91% 92% 99% 83% 76%
80% 80% 80% 80% 80%
Impact of treatment services is measured by surveying parent/guardian perception of the quality of services
received including the following: general satisfaction with services, access to services, cultural sensitivity,
outcome of services, and participation in treatment planning. Additionally, impacts are measured by
improvements in social connectedness and overall functioning.
The following information represents data from those parents/guardians who agreed or strongly agreed at the
time of successful discharge.
FY19 FY21
The Data and Outcomes Work Group members set a goal for all contracted agencies to meet or exceed a 60%
outcome tool return rate.
FY17 FY21FY18 FY19 FY20
Family Outcome Tool Return Rate Information for FFT
FY17 FY18 FY19 FY20 FY21
Initial Outcome Tool Return Rate
- 448
-
486
97
Client Outcome Measure-Parent (COM-P)
- 91% 91% 91% 92%
- 21% 55% 81% 71%
- 60% 60%
FY20
280 192 192
- 22% 58% 88% 84%
60% 60%
Discharge Outcome Tool Return Rate
45 151 112 62
60% 60%
Impact of FFT
FY17 FY18
219 228
- 60% 60%
- 211 277 138 87
-
September 2021 | 191 v

Targeted Services for Justice-Involved Youth
FFT
State Average
Federally Required
FFT
State Average
Federally Required
FFT
State Average
Federally Required
FFT
State Average
Federally Required
FFT
State Average
Admission
Discharge
Federally Required
FFT
State Average
Admission
Discharge
Federally Required
Outcome of Services: Parent/Guardian perception of treatment outcomes as a result of services their youth received
Access to Services: Parents/Guardians who reported the ease and convenience of treatment services their youth received
FY17
Participation in Treatment Planning: Parent/Guardian perception of participation in treatment planning
-
Cultural Sensitivity: Parent/Guardian perception of staff sensitivity to cultural beliefs
93%
56%
- 80% 79% 78% 80%
86% 86% 87%
91%
- 58% 59% 60%
FY20 FY21
FY17 FY18 FY19 FY20 FY21
- 91%
The following two sections include data at admission into services and at successful discharge from services as
a means to demonstrate improvement in social connectedness and functioning.
85%
FY18 FY19
- 99% 98% 96% 98%
79% 79% 79%
FY17 FY18 FY19
80%
- 96% 89% 93%
FY17 FY18 FY19 FY20 FY21
95% 93%
100% 99% 98% 100%
FY17 FY18 FY19 FY20 FY21
-
FY17 FY20 FY21
FY18 FY19 FY20 FY21
-
Social Connectedness: Parent/Guardian perception of their youth's support system in the community at…
Functioning: Parent/Guardian perception of their youth's mental health and social well-being at…
September 2021 | 192 v

Targeted Services for Justice-Involved Youth
FFT
State Average
General Change
Communication Skills
Adolescent Behavior
Parenting Skills
Supervision Levels
Levels of Conflict
FFT
State Average
Admission
Discharge
FFT
State Average
Admission
Discharge
FFT
State Average
Admission
Discharge
84%80%
FY21
14% 18% 20%
FY17
2%
Hospital Admissions for Mental Health Care: Parents/Guardians who reported their youth had hospital admission(s)
for mental health care within 6 months of…
Emergency Department: Parents/Guardians who reported their youth had emergency department visit(s) within 6
months of…
7% 8% 8% 10%
86%
92% 81%88% 92% 87%
FY17 FY18 FY19 FY20 FY21
10%
5% 6% 7%
- 4% 2%
FY21
Illness, Injury, or Surgery: Parents/Guardians who reported their youth spent night(s) in a facility for illness, injury, or
surgery within 6 months of…
FY17
-
FY18 FY19 FY20
- 21% 19% 20% 20%
92%
7%
20%
Utilization of High Cost Services for FFT
High cost services include the following: treatment for illness, injury, or surgery, emergency department visits,
hospital admissions for mental health care, inpatient substance use disorder treatment services, or detention in
a correctional facility. Participation in treatment services may help reduce the frequency of youth utilization of
high cost services.
93% 87%
FY21
3%
FY18
-
FY19
88%
-
9% 10% 11%-
FY17 FY18 FY19 FY20
81% 86% 77%
88% 92% 90% 91% 88%
81% 88% 85%
FY20
86% 80%
86% 88% 84% 87% 82%
The Client Outcome Measure-Parent (COM-P) is completed by the parents/guardians when the family
completes FFT treatment services. The COM-P measures changes in behavior and functioning of the youth and
family. Higher percentages indicates better outcomes and positive increases in the indicated areas.
COM-P
September 2021 | 193 v

Targeted Services for Justice-Involved Youth
FFT
State Average
Admission
Discharge
FFT
State Average
Admission
Discharge
FFT
State Average
Admission
Discharge
FFT
State Average
Admission
Discharge
FFT
State Average
Discharge
Federally Required
FFT
State Average
Discharge
Federally Required
6% 6%
11%
95%
FY20
18%
Inpatient Substance Use Disorder Treatment Services: Parents/Guardians who reported their youth received inpatient
treatment services for substance use disorders within 6 months of…
Correctional Facility: Parents/Guardians who reported their youth had spent night(s) in a correctional facility within 6
months of…
6%
FY17 FY18 FY19
93%
Quality of Life Information for FFT
FY17 FY18 FY19 FY20 FY21
89%
0%
FY18
6% 6%
3%
9%-
FY18 FY19 FY20 FY21
FY19 FY20 FY21
Suicide Attempts: Parents/Guardians who reported suicide attempt(s) by their youth within 6 months of…
Employment Status: Parents/Guardians who reported their youth's employment at…
16%
FY20
FY17
FY21
16% 15%
- 7%
FY19FY17 FY20 FY21
12%
Homelessness: Parents/Guardians who reported their youth's homelessness at…
-
12%
10%
23%
FY18
15%
5%
- 1% 2% 2%
- 94%
General Health: Parents/Guardians who reported their youth's general health as good, very good, or excellent at…
FY17 FY18 FY19
Quality of life is measured in several key life domains including the following: general health, suicide attempts,
employment status, and homelessness. Improvements in these areas may indicate the effectiveness of treatment
services.
17%
- 29%
95%
-
7%
1% 0%
- 91% 94% 87%
FY17
FY21
26% 21% 22%-
- 0%
September 2021 | 194 v

Targeted Services for Justice-Involved Youth
FFT
State Average
Admission
Discharge
Federally Required
State Average Totals
Completed Cases
Non-Completed Cases
*This data does not include clients actively receiving services
State Average Totals
Completed Cases
Non-Completed Cases
*This data does not include clients actively receiving services
FFT Trainings
The DBH has set a goal of seven days or less from the date of referral for the family to have their first FFT
session. This is measured by counting the number of days from the date the referral was entered into the CSS to
the date of the first session recorded. More timely engagement and entry into services may result in improved
client outcomes.
Referral to First Session
FFT: Days from Referral to First
Session*FY17 FY18 FY19 FY20 FY21
4.94 2.55 2.85 2.46 2.24
3.88 2.19 2.09 2.64 2.07
11.90 15.14
17.84 16.25 16.27 15.67 12.94
Public Safety Information for FFT
History of Arrest: Parents/Guardians who reported arrest(s) of their youth within 30 days of…
FFT Curriculum Trainings
FFT, LLC provides trainings to agencies providing FFT.
FFT Training
FFT: Days from Referral to First
Contact*
FY21
18 2
12% 12%
8% 2%
14%
2 3 1
Average Length of Time from Referral to First Session with the Family for FFT
-
FY21
3%
Curriculum Fidelity for FFT
FY17 FY18 FY19 FY20 FY21
14.40 13.36 13.48
Public safety information includes history of arrest. A reduction in this area may indicate how youth are able to
positively contribute to their families and communities.
FY17 FY18 FY19 FY20
Referral to First Contact
Average Length of Time from Referral to First Contact with the Family for FFT
The DBH has set a goal of two days or less from the date of referral for the therapist to first contact the family.
This is measured by counting the number of days from the date the referral was entered into the CSS to the date
of the first contact recorded. More timely engagement and entry into services may result in improved client
outcomes.
- 5%
15%
FY20FY17 FY18 FY19
September 2021 | 195 v

Targeted Services for Justice-Involved Youth
ART Treatment Services
September 2021 | 196 v

Targeted Services for Justice-Involved Youth
ART Return Rates
# of Admissions
# of Tools Submitted
Return Rate
Target Return Rate
# of Successful Discharges
# of Tools Submitted
Return Rate
Target Return Rate
HIT Return Rates
# of Admissions
# of Tools Submitted
Return Rate
Target Return Rate
# of Successful Discharges
# of Tools Submitted
Return Rate
Target Return Rate
- 70% 85% 84% 84%
60%
- 60% 60% 60% 60%
14
- 60% 60% 60% 60%
-
60% 60%
Post-Test Return Rate
- 69 46 32 25
- 48 39 27 21
Pre-Test Return Rate
- 109 84 74 46
- 78 72 63 38
- 72% 86% 85% 83%
How I Think (HIT) Questionnaire Return Rates
FY17 FY18 FY19 FY20 FY21
33 42
FY20 FY21
17
-
Initial Outcome Tool Return Rate
ART is designed to alter behaviors of chronically aggressive youth by using guided group discussions to
correct anti-social thinking. ART uses repetitive learning techniques to teach coping skills for managing anger
and impulsiveness. ART includes three interventions; social skills, anger control, and moral reasoning.
The Data and Outcomes Work Group members set a goal for all contracted agencies to meet or exceed a 60%
outcome tool return rate.
- 50
Program Outcomes for ART
FY18 FY19
27
86% 64%
-
46 19
- 60%
FY17
28%
11
Discharge Outcome Tool Return Rate
50 42
- 1020
43
60%60% 60%
Outcome Tool Return Rate Information for ART
80
-
85
60%
ART Treatment Services
39% 53%
-
43% 58% 59%
September 2021 | 197 v

Targeted Services for Justice-Involved Youth
AQ Return Rates
# of Admissions
# of Tools Submitted
Return Rate
Target Return Rate
# of Successful Discharges
# of Tools Submitted
Return Rate
Target Return Rate
ART Completion Rate
State Average
ART
State Average
Federally Required
ART
State Average
Federally Required
ART
State Average
Federally Required
The DBH has set a benchmark of a 70% completion rate for ART treatment services.
Impact of treatment services is measured by surveying youth perception of the quality of services received
including the following: general satisfaction with services, access to services, cultural sensitivity, outcome of
services, and participation in treatment planning. Additionally, impacts are measured by improvements in
social connectedness and overall functioning. Impact of treatment services is relevant because youth who feel
empowered, motivated, have positive family relationships, and feel they have the ability to change may be more
likely to have positive treatment outcomes.
The following information represents data from those youth who agreed or strongly agreed at the time of
successful discharge.
General Satisfaction with Services: Overall satisfaction with treatment services received
Access to Services: Perception of the ease and convenience of treatment services received
Cultural Sensitivity: Perception of staff sensitivity to cultural beliefs
67%
FY17
-
100%
FY18 FY19
95% 92%
100%
FY20 FY21
Post-Test Return Rate
- 69 46 32 25
- 47 37 29 19
- 68% 80% 91% 76%
- 60% 60% 60% 60%
Pre-Test Return Rate
- 109 84 74 46
- 74 64 50 35
- 68% 76% 68% 76%
- 60% 60% 60% 60%
Aggression Questionnaire (AQ) Return Rates
FY17 FY18 FY19 FY20 FY21
FY18
- 100% 85% 100% 100%
FY19
FY20 FY21
FY17
-
FY20 FY21
FY19 FY20 FY21
FY17
FY19
75% 77% 64%
Impact of ART
92% 100%
52%
88%
Discharge Reasons for ART
FY17 FY18
FY18
-
September 2021 | 198 v

Targeted Services for Justice-Involved Youth
ART
State Average
Federally Required
ART
State Average
Federally Required
ART
State Average
Admission
Discharge
Federally Required
ART
State Average
Admission
Discharge
Federally Required
State Average
Admission
Discharge
State Average
Admission
Discharge
Outcome of Services: Perception of treatment outcomes as a result of services received
Participation in Treatment Planning: Perception of participation in treatment planning
Social Connectedness: Perception of their support system in the community at…
Functioning: Perception of their mental health and social well-being at…
The GAIN-SS is used as a simple measure of change after intervals of a month or more. The following tables
report the information gathered at admission into services and at successful discharge from services. These
results can be used at the group level as an outcome measure by monitoring over time.
Internalizing Disorder: Measures somatic complaints, depression, anxiety, trauma, suicide, and other serious mental
illness at…
Externalizing Disorder: Measures attention deficits, hyperactivity, impulsivity, conduct problems, and/or other impulse
control disorders at…
88%
89% 83% 67%
GAIN Short Screener (GAIN-SS) Scoring
75%
100%
FY21
-
Externalizing Disorder Screener FY17
FY20
67%
FY19 FY20
71%
-
- 94%
- 63% 75% 70% 71%
75% 64%
95%
FY21
The following two sections include data at admission into services and at successful discharge from services as
a means to demonstrate improvement in social connectedness and functioning.
100%
- 94% 90% 92%
Internalizing Disorder Screener
-
FY18
94%
52% 47%
FY19 FY20 FY21
FY19
FY17
90%
FY20
FY18 FY19
FY18 FY19 FY21
92% 67%
FY17
56% 58%
FY20FY17 FY18
- 57% 67%
87%
FY17
76% 84%
-
- 77%
54% 49%
FY18 FY19 FY20
60% 33%
FY17
FY21
-
FY18 FY21
50%
0%
September 2021 | 199 v

Targeted Services for Justice-Involved Youth
State Average
Admission
Discharge
State Average
Admission
Discharge
ART
State Average
Admission
Discharge
ART
State Average
Admission
Discharge
ART
State Average
Admission
Discharge
ART
State Average
Admission
Discharge
-
- 4% 0%
Crime/Violence: Measures interpersonal violence, drug-related crimes, property crimes, and interpersonal/violent crimes
8%
8%
7%
-
Hospital Admissions for Mental Health Care: Youth who reported hospital admission(s) for mental health care within
6 months of…
0%
FY17
3%
0%
Emergency Department: Youth who reported emergency department visit(s) within 6 months of…
Crime/Violence Screener FY18
-
FY17
- 6% 10% 8%
8%
16% 20% 0%
FY21
9%
High cost services include the following: treatment for illness, injury, or surgery, emergency department visits,
hospital admissions for mental health care, inpatient substance use disorder treatment services, or detention in
a correctional facility. Participation in treatment services may help reduce the frequency of youth utilization of
high cost services.
Illness, Injury, or Surgery: Youth who reported night(s) spent in a facility for illness, injury, or surgery within 6 months
of…
18% 32%
FY20
4% 0%
0%
FY20 FY21
13% 5%
FY21
13% 6%
- 10%
-
Substance Disorder Screener FY17 FY18 FY19
Utilization of High Cost Services for ART
4%
25%
31%
FY17 FY18
24% 48%
FY18 FY19 FY20 FY21
FY19 FY20
- 25%
27%
FY19 FY20
0%
16%
- 7%
FY17
9% 0% 0%
FY21
FY18
8%
FY19
FY19
0%
FY20 FY21
- 3% 9% 10% 0%
16%
-
Inpatient Substance Use Disorder Treatment Services: Youth who reported inpatient treatment services for substance
use disorders within 6 months of…
FY17 FY18
- 0% 5%
Substance Disorder: Measures substance use disorder (SUD) symptoms at…
September 2021 | 200 v

Targeted Services for Justice-Involved Youth
ART
State Average
Admission
Discharge
ART
State Average
Admission
Discharge
ART
State Average
Admission
Discharge
ART
State Average
Discharge
Federally Required
ART
State Average
Discharge
Federally Required
Quality of life is measured in several key life domains including the following: general health, suicide attempts,
employment status, and homelessness. Improvements in these areas may indicate the effectiveness of treatment
services.
FY18
Correctional Facility: Youth who reported night(s) spent in a correctional facility within 6 months of…
FY17
- 84%
- 6%
FY19 FY20 FY21
Employment Status: Youth who reported employment at…
FY17
General Health: Youth who reported their general health as good, very good, or excellent at…
0% 29% 0% 0%
- 19% 20% 15% 17%
Suicide Attempts: Youth who reported suicide attempt(s) within 6 months of…
FY17 FY18
100% 100% 100%
Homelessness: Youth who reported homelessness at...
FY17 FY18 FY19 FY20 FY21
33%
- 17% 39% 24% 25%
9%
Quality of Life Information for ART
FY19 FY20
0% 0%
-
FY17
13% 0%
FY19 FY20 FY21FY18
41% 28%
0% 0%
FY18 FY19 FY20 FY21
45%
-
FY21
91% 91% 88%
-
-
94%
September 2021 | 201 v

Targeted Services for Justice-Involved Youth
ART
State Average
Admission
Discharge
Federally Required
ART
State Average
Percent Improved
ART
State Average
Percent Improved
ART
State Average
Percent Improved
ART
State Average
Percent Improved
ART
State Average
Percent Improved
ART
State Average
Percent Improved
Overall AQ Change
FY17 FY18 FY19 FY20 FY21
54%- 62%
Public safety information includes history of arrest. A reduction in this area may indicate how youth are able to
positively contribute to their families and communities.
67%
AQ Sub-Scales for ART
Hostility: Represents attitudes of bitterness, social alienation, and paranoia
76%
Anger: Aspects of anger related to arousal and sense of control
Physical Aggression: Physical force when expressing anger or aggression
FY17 FY18 FY19 FY20 FY21
7% 4%
Public Safety Information for ART
History of Arrest: Youth who reported arrest(s) within 30 days of…
FY17 FY18
- 10%
FY21
7% 0%
FY19 FY20
FY17
70% 60% 65%
Verbal Aggression: Quarrelsome and hostile speech
3%
- 6% 9%
- 60% 53% 66% 43%
FY17 FY18 FY19 FY20 FY21
- 63%
FY17 FY18 FY19 FY20 FY21
59%
FY18 FY19 FY20 FY21
- 68% 57% 63%
FY17 FY18 FY19 FY20 FY21
- 65% 57% 72% 52%
- 60% 63% 56% 50%
The AQ is a brief measure to assess for anger and aggression including the following five scales: physical
aggression, verbal aggression, anger, hostility, and indirect aggression. The AQ is completed at admission into
services and at completion of services. The below data reflects the percentage of youth who improved in each
domain.
Indirect Aggression: Tendency to express anger in actions that avoid direct confrontation
September 2021 | 202 v

Targeted Services for Justice-Involved Youth
ART
State Average
Percent Improved
ART
State Average
Percent Improved
ART
State Average
Percent Improved
HIT Sub-Scales for ART
FY17 FY18 FY19 FY20 FY21
FY21
- 82% 46% 72% 72%
FY17 FY18 FY19 FY20 FY21
- 75% 47% 81% 78%
- 76%
FY20
71%
The HIT measures four categories of self-serving cognitive distortions including the following: self-centered,
blaming others, minimizing/mislabeling, and assuming the worst. The questionnaire is useful in assessment,
treatment planning, tracking therapeutic progress, and individual or program level outcome evaluation. The
HIT is completed at admission into services and at completion of services. The below data reflects the
percentage of youth who improved in each domain.
58% 77%
FY17 FY18 FY19
Overt: Reflects behaviors that usually involve direct confrontation of a victim
Overall: Derived from all eight of the subscores that make up the overt and covert scales
Covert: Reflects antisocial behaviors that typically do not involve direct confrontation of a victim
September 2021 | 203 v

Targeted Services for Justice-Involved Youth
ART Return Rates
# of Admissions
# of Tools Submitted
Return Rate
Target Return Rate
# of Successful Discharges
# of Tools Submitted
Return Rate
Target Return Rate
ART
State Average
Federally Required
ART
State Average
Federally Required
ART
State Average
Federally Required
FY20 FY21
- 100% 100% 100% 100%
Access to Services: Parents/Guardians who reported the ease and convenience of treatment services their youth received
FY17 FY18 FY19 FY20 FY21
- 100% 93% 100% 67%
Impact of ART
Impact of treatment services is measured by surveying parent/guardian perception of the quality of services
received including the following: general satisfaction with services, access to services, cultural sensitivity,
outcome of services, and participation in treatment planning. Additionally, impacts are measured by
improvements in social connectedness and overall functioning.
The following information represents data from those parents/guardians who agreed or strongly agreed at time
of successful discharge.
General Satisfaction with Services: Parents/Guardians who reported overall satisfaction with treatment services their
youth received
FY17 FY18 FY19 FY20 FY21
100% 93% 100% 100%
Cultural Sensitivity: Parent/Guardian perception of staff sensitivity to cultural beliefs
FY17 FY18 FY19
-
- 14% 48% 79% 62%
-
- 12 40 41 26
Family Outcome Tool Return Rate Information for ART
FY21
-
- 3 16 10 10
59%-
FY20
60% 60% 60%
6% 35% 50%
60% 60% 60% 60%
1750 46 20
60%
85 84 52 42
Initial Outcome Tool Return Rate
FY17 FY18 FY19
Discharge Outcome Tool Return Rate
-
-
The Data and Outcomes Work Group members set a goal for all contracted agencies to meet or exceed a 60%
outcome tool return rate.
September 2021 | 204 v

Targeted Services for Justice-Involved Youth
ART
State Average
Federally Required
ART
State Average
Federally Required
ART
State Average
Admission
Discharge
Federally Required
ART
State Average
Admission
Discharge
Federally Required
ART
State Average
Admission
Discharge
- 4% 5% 5% 5%
- 0% 11% 0% 0%
Utilization of High Cost Services for ART
High cost services include the following: treatment for illness, injury, or surgery, emergency department visits,
hospital admissions for mental health care, inpatient substance use disorder treatment services, or detention in
a correctional facility. Participation in treatment services may help reduce the frequency of youth utilization of
high cost services.
Illness, Injury, or Surgery: Parents/Guardians who reported their youth spent night(s) in a facility for illness, injury, or
surgery within 6 months of…
FY17 FY18 FY19 FY20 FY21
- 61% 58% 60% 63%
- 92% 84% 93% 89%
- 100% 88% 87% 88%
- 100% 94% 100% 100%
Functioning: Parent/Guardian perception of their youth's mental health and social well-being at…
FY17 FY18 FY19 FY20 FY21
The following two sections include data at admission into services and at successful discharge from services as
a means to show improvement in social connectedness and functioning.
Social Connectedness: Parent/Guardian perception of their youth's support system in the community at…
FY17 FY18 FY19 FY20 FY21
Participation in Treatment Planning: Parent/Guardian perception of participation in treatment planning
FY17 FY18 FY19 FY20 FY21
- 100% 96% 93% 67%
Outcome of Services: Parent/Guardian perception of treatment outcomes as a result of services their youth received
FY17 FY18 FY19 FY20 FY21
- 93% 84% 94% 90%
September 2021 | 205 v

Targeted Services for Justice-Involved Youth
ART
State Average
Admission
Discharge
ART
State Average
Admission
Discharge
ART
State Average
Admission
Discharge
ART
State Average
Admission
Discharge
ART
State Average
Admission
Discharge
ART
State Average
Admission
Discharge
- 24% 15% 7% 10%
- 0% 22% 0% 0%
- 92% 98% 98% 87%
- 100% 100% 80% 100%
Suicide Attempts: Parents/Guardians who reported suicide attempt(s) by their youth within 6 months of…
FY17 FY18 FY19 FY20 FY21
Quality of Life Information for ART
Quality of life is measured in several key life domains including the following: general health, suicide attempts,
employment status, and homelessness. Improvements in these areas may indicate the effectiveness of treatment
services.
General Health: Parents/Guardians who reported their youth's general health as good, very good, or excellent at…
FY17 FY18 FY19 FY20 FY21
- 21% 44% 33% 18%
- 0% 22% 20% 0%
- 12% 13% 5% 0%
- 0% 0% 0% 0%
Correctional Facility: Parents/Guardians who reported their youth had spent night(s) in a correctional facility within 6
months of…
FY17 FY18 FY19 FY20 FY21
Inpatient Substance Use Disorder Treatment Services: Parents/Guardians who reported their youth received inpatient
treatment services for substance use disorders within 6 months of…
FY17 FY18 FY19 FY20 FY21
- 13% 10% 7% 9%
- 0% 0% 0% 0%
Hospital Admissions for Mental Health Care: Parents/Guardians who reported their youth had hospital admission(s)
for mental health care within 6 months of…
FY17 FY18 FY19 FY20 FY21
- 8% 18% 11% 23%
- 0% 11% 0% 0%
Emergency Department: Parents/Guardians who reported their youth had emergency department visit(s) within 6
months of…
FY17 FY18 FY19 FY20 FY21
September 2021 | 206 v

Targeted Services for Justice-Involved Youth
ART
State Average
Discharge
Federally Required
ART
State Average
Discharge
Federally Required
ART
State Average
Admission
Discharge
Federally Required
ART Trainings
- 16% 22% 14% 9%
- 0% 11% 0% 0%
FY19 FY20 FY21
1 2 2 2
Public Safety Information for ART
Public safety information includes history of arrest. A reduction in this area may indicate how youth are able to
positively contribute to their families and communities.
History of Arrest: Parents/Guardians who reported arrest(s) of their youth within 30 days of…
FY17 FY18 FY19 FY20 FY21
- 0% 0% 0% 0%
- 0% 10% 0% 0%
Homelessness: Parents/Guardians who reported their youth's homelessness at…
FY17 FY18 FY19 FY20 FY21
Employment Status: Parents/Guardians who reported their youth's employment at…
FY17 FY18 FY19 FY20 FY21
Curriculum Fidelity for ART
ART Curriculum Trainings
Education and Treatment Alternatives (ETA) provides ART trainings for agencies providing ART services.
ART Training FY17 FY18
1
September 2021 | 207 v

Targeted Services for Justice-Involved Youth
MRT Treatment Services
September 2021 | 208 v

Targeted Services for Justice-Involved Youth
MRT Return Rates
# of Admissions
# of Tools Submitted
Return Rate
Target Return Rate
# of Successful Discharges
# of Tools Submitted
Return Rate
Target Return Rate
HIT Return Rates
# of Admissions
# of Tools Submitted
Return Rate
Target Return Rate
# of Successful Discharges
# of Tools Submitted
Return Rate
Target Return Rate
MRT Completion Rate
State Average
Post-Test Return Rate
- 64 64 39 55
- 44 40 30 36
- 69% 63% 77% 65%
- 60% 60% 60% 80%
Pre-Test Return Rate
- 161 191 166 203
- 95 116 123 153
- 59% 61% 74% 75%
- 60% 60% 60% 80%
How I Think (HIT) Questionnaire Return Rates
FY17 FY18 FY19 FY20 FY21
MRT Treatment Services
The Data and Outcomes Work Group members set a goal for all contracted agencies to meet or exceed a 60%
outcome tool return rate.
88%
60% 60% 60%
40 64 32 28
-
-
Initial Outcome Tool Return Rate
FY19 FY20 FY21
MRT is an evidence-based program combining education and structured exercises to assist participants in
addressing negative thought and behavior patterns. MRT includes 12 steps which focus on issues such as
honesty, trust, acceptance, healing relationships, and setting goals.
Program Outcomes for MRT
Outcome Tool Return Rate Information for MRT
FY17 FY18
73%36%
The DBH has set a benchmark of a 70% completion rate for MRT treatment services.
41% 45%
FY17 FY18 FY19 FY20 FY21
52%
21 18
22%
Discharge Outcome Tool Return Rate
69 43 55
191 49 75
-
-
- 60%
47%
60% 60% 60%
- 115
Discharge Reasons for MRT
25
15% 41% 64%
- 60%
6
-
26
66%
-
September 2021 | 209 v

Targeted Services for Justice-Involved Youth
MRT
State Average
Federally Required
MRT
State Average
Federally Required
MRT
State Average
Federally Required
MRT
State Average
Federally Required
MRT
State Average
Federally Required
MRT
State Average
Admission
Discharge
Federally Required
FY17 FY18 FY19 FY20 FY21
-
Outcome of Services: Perception of treatment outcomes as a result of services received
FY19 FY20 FY21
- 100% 94% 75% 100%
Participation in Treatment Planning: Perception of participation in treatment planning
- 100%
Social Connectedness: Perception of their support system in the community at…
Access to Services: Perception of the ease and convenience of treatment services received
- 100% 100%
Cultural Sensitivity: Perception of staff sensitivity to cultural beliefs
FY17 FY18 FY19 FY20 FY21
- 100% 89% 100% 100%
89%
89%90%74%
94% 100%
87%-
100%
The following two sections include data at admission into services and at successful discharge from services as
a means to demonstrate improvement in social connectedness and functioning.
100%
100%
94% 92% 75%
FY17 FY18 FY19 FY20 FY21
Impact of MRT
FY17 FY18 FY19 FY20
Impact of treatment services is measured by surveying youth perception of the quality of services received
including the following: general satisfaction with services, access to services, cultural sensitivity, outcome of
services, and participation in treatment planning. Additionally, impacts are measured by improvements in
social connectedness and overall functioning. Impact of treatment services is relevant because youth who feel
empowered, motivated, have positive family relationships, and feel they have the ability to change may be more
likely to have positive treatment outcomes.
The following information represents data from those youth who agreed or strongly agreed at the time of
successful discharge.
General Satisfaction with Services: Overall satisfaction with treatment services received
FY21
- 100%
75%
FY17
89% 75%
FY17 FY18 FY19 FY20 FY21
FY18
September 2021 | 210 v

Targeted Services for Justice-Involved Youth
MRT
State Average
Admission
Discharge
Federally Required
State Average
Admission
Discharge
State Average
Admission
Discharge
State Average
Admission
Discharge
State Average
Admission
Discharge
Crime/Violence: Measures interpersonal violence, drug-related crimes, property crimes, and interpersonal/violent crimes
at…
Crime/Violence Screener
- 41% 24% 37% 24%
- 0% 17% 14% 33%
Substance Disorder: Measures substance use disorder (SUD) symptoms at…
Substance Disorder Screener
- 37% 24% 19% 20%
- 40% 0% 7% 33%
FY20
56%
50%
Externalizing Disorder: Measures attention deficits, hyperactivity, impulsivity, conduct problems, and/or other impulse
control disorders at…
Externalizing Disorder Screener
- 59% 57% 68% 68%
- 20% 33% 43% 67%
Functioning: Perception of their mental health and social well-being at…
FY17 FY18
100%
The GAIN-SS is used as a simple measure of change after intervals of a month or more. The following tables
report the information gathered at admission into services and at successful discharge from services. These
results can be used at the group level as an outcome measure by monitoring over time.
Internalizing Disorder: Measures somatic complaints, depression, anxiety, trauma, suicide, and other serious mental
illness at…
Internalizing Disorder Screener
FY20 FY21
76% 79%
FY21
GAIN Short Screener (GAIN-SS) Scoring
FY18FY17
50%
FY19 FY20FY17 FY18
FY18
FY19 FY20
62% 66%
-
63%
-
FY17 FY18
100%
- 56%
FY17
79%
67%20%
FY21
FY19 FY20
FY19
-
FY21
FY19
94% 83%
FY21
September 2021 | 211 v

Targeted Services for Justice-Involved Youth
MRT
State Average
Admission
Discharge
MRT
State Average
Admission
Discharge
MRT
State Average
Admission
Discharge
MRT
State Average
Admission
Discharge
MRT
State Average
Admission
Discharge
Correctional Facility: Youth who reported night(s) spent in a correctional facility within 6 months of…
FY17 FY18 FY19 FY20 FY21
- 54% 30%
- 50% 16% 9% 50%
Inpatient Substance Use Disorder Treatment Services: Youth who reported inpatient treatment services for substance
use disorders within 6 months of…
FY17 FY18 FY19 FY20 FY21
4%
- 17% 21% 8% 0%
Emergency Department: Youth who reported emergency department visit(s) within 6 months of…
FY19 FY20
- 4% 8% 8% 5%
- 0% 11% 0% 25%
5% 8% 50%
Hospital Admissions for Mental Health Care: Youth who reported hospital admission(s) for mental health care within
6 months of…
- 0% 5% 6%
Utilization of High Cost Services for MRT
High cost services include the following: treatment for illness, injury, or surgery, emergency department visits,
hospital admissions for mental health care, inpatient substance use disorder treatment services, or detention in
a correctional facility. Participation in treatment services may help reduce the frequency of youth utilization of
high cost services.
Illness, Injury, or Surgery: Youth who reported night(s) spent in a facility for illness, injury, or surgery within 6 months
of…
FY17 FY18
FY17
FY17
FY21
FY18
12% 5% 9%
- 0% 0% 0% 0%
37% 23%
FY19 FY20 FY21
- 14%
FY19
FY21
FY20
FY18
- 15% 15% 13% 9%
- 0%
September 2021 | 212 v

Targeted Services for Justice-Involved Youth
MRT
State Average
Admission
Discharge
MRT
State Average
Admission
Discharge
MRT
State Average
Discharge
Federally Required
MRT
State Average
Discharge
Federally Required
MRT
State Average
Admission
Discharge
Federally Required
FY20 FY21
- 0% 0% 0% 0%
Public Safety Information for MRT
Public safety information includes history of arrest. A reduction in this area may indicate how youth are able to
positively contribute to their families and communities.
General Health: Youth who reported their general health as good, very good, or excellent at…
FY17 FY18
- 17% 11% 0% 25%
Employment Status: Youth who reported employment at…
FY17 FY18 FY19 FY20 FY21
- 100% 100% 100% 100%
Suicide Attempts: Youth who reported suicide attempt(s) within 6 months of…
FY17 FY18 FY19 FY20 FY21
Quality of Life Information for MRT
Quality of life is measured in several key life domains including the following: general health, suicide attempts,
employment status, and homelessness. Improvements in these areas may indicate the effectiveness of treatment
services.
- 31% 16% 17% 13%
- 0% 10% 0% 0%
History of Arrest: Youth who reported arrest(s) within 30 days of…
FY17 FY18 FY19 FY20 FY21
- 67% 35% 33% 50%
Homelessness: Youth who reported homelessness at...
FY17 FY18 FY19
- 11% 14% 11% 9%
FY19 FY20 FY21
- 94% 93% 92% 89%
September 2021 | 213 v

Targeted Services for Justice-Involved Youth
MRT
State Average
Percent Improved
MRT
State Average
Percent Improved
MRT
State Average
Percent Improved
HIT Sub-Scales for MRT
- 74% 71% 58% 84%
FY17 FY18 FY19 FY20 FY21
FY17 FY18 FY19 FY20 FY21
- 74% 74% 62% 88%
- 69% 79% 66% 87%
FY17 FY18 FY19 FY20 FY21
Overall: Derived from all eight of the subscores that make up the overt and covert scales
Overt: Reflects behaviors that usually involve direct confrontation of a victim
Covert: Reflects antisocial behaviors that typically do not involve direct confrontation of a victim
The HIT measures four categories of self-serving cognitive distortions including the following: self-centered,
blaming others, minimizing/mislabeling, and assuming the worst. The questionnaire is useful in assessment,
treatment planning, tracking therapeutic progress, and individual or program level outcome evaluation. The
HIT is completed at admission into services and at completion of services. The below data reflects the
percentage of youth who improved in each domain.
September 2021 | 214 v

Targeted Services for Justice-Involved Youth
MRT Return Rates
# of Admissions
# of Tools Submitted
Return Rate
Target Return Rate
# of Successful Discharges
# of Tools Submitted
Return Rate
Target Return Rate
MRT
State Average
Federally Required
MRT
State Average
Federally Required
MRT
State Average
Federally Required
Impact of MRT
Impact of treatment services is measured by surveying parent/guardian perception of the quality of services
received including the following: general satisfaction with services, access to services, cultural sensitivity,
outcome of services, and participation in treatment planning. Additionally, impacts are measured by
improvements in social connectedness and overall functioning.
- 100% 83% 87% 100%
-
Family Outcome Tool Return Rate Information for MRT
FY17
- 100% 100% 92% 100%
Cultural Sensitivity: Parent/Guardian perception of staff sensitivity to cultural beliefs
FY17 FY18 FY19 FY20 FY21
1 20 22 18
- 3% 31% 69% 64%
- 60% 60% 60% 60%
The following information represents data from those parents/guardians who agreed or strongly agreed at the
time of successful discharge.
General Satisfaction with Services: Parents/Guardians who reported overall satisfaction with treatment services their
youth received
FY17 FY18 FY19 FY20 FY21
- 100% 100% 100% 100%
Access to Services: Parents/Guardians who reported the ease and convenience of treatment services their youth received
FY17 FY18 FY19 FY20 FY21
Discharge Outcome Tool Return Rate
- 40 64 32 28
FY18 FY19 FY20 FY21
Initial Outcome Tool Return Rate
- 115 191 49 75
- 14% 32% 82% 71%
- 60% 60% 60% 60%
The Data and Outcomes Work Group members set a goal for all contracted agencies to meet or exceed a 60%
outcome tool return rate.
- 16 62 40 53
September 2021 | 215 v

Targeted Services for Justice-Involved Youth
MRT
State Average
Federally Required
MRT
State Average
Federally Required
MRT
State Average
Admission
Discharge
Federally Required
MRT
State Average
Admission
Discharge
Federally Required
MRT
State Average
Admission
Discharge
MRT
State Average
Admission
Discharge
High cost services include the following: treatment for illness, injury, or surgery, emergency department visits,
hospital admissions for mental health care, inpatient substance use disorder treatment services, or detention in
a correctional facility. Participation in treatment services may help reduce the frequency of youth utilization of
high cost services.
- 0% 6% 8% 7%
- 65% 69% 62% 68%
- 50% 53% 68% 95%
Utilization of High Cost Services for MRT
- 0% 0% 10% 0%
- 0% 0% 0% 0%
Emergency Department: Parents/Guardians who reported their youth had emergency department visit(s) within 6
months of…
FY17 FY18 FY19 FY20 FY21
- 6% 8% 10% 10%
- 100% 100% 100% 100%
FY17 FY18 FY19 FY20 FY21
Functioning: Parent/Guardian perception of their youth's mental health and social well-being at…
Illness, Injury, or Surgery: Parents/Guardians who reported their youth spent night(s) in a facility for illness, injury, or
surgery within 6 months of…
FY17 FY18 FY19 FY20 FY21
FY17 FY18 FY19 FY20 FY21
- 88% 90% 90% 80%
The following two sections include data at admission into services and at successful discharge from services as
a means to demonstrate improvement in social connectedness and functioning.
- 50% 55% 67% 95%
FY17 FY18 FY19 FY20 FY21
Social Connectedness: Parent/Guardian perception of their youth's support system in the community at…
FY17 FY18
- 100% 100% 70% 44%
FY19 FY20 FY21
Participation in Treatment Planning: Parent/Guardian perception of participation in treatment planning
Outcome of Services: Parent/Guardian perception of treatment outcomes as a result of services their youth received
September 2021 | 216 v

Targeted Services for Justice-Involved Youth
MRT
State Average
Admission
Discharge
MRT
State Average
Admission
Discharge
MRT
State Average
Admission
Discharge
MRT
State Average
Admission
Discharge
MRT
State Average
Admission
Discharge
MRT
State Average
Discharge
Federally Required
- 0% 0%
FY19 FY20 FY21
40% 33%
100%
Correctional Facility: Parents/Guardians who reported their youth had spent night(s) in a correctional facility within 6
months of…
FY17 FY18 FY19 FY20 FY21
- 53% 29% 24% 29%
Inpatient Substance Use Disorder Treatment Services: Parents/Guardians who reported their youth received inpatient
treatment services for substance use disorders within 6 months of…
FY17 FY18 FY19 FY20 FY21
- 0% 33% 0% 0%
- 29% 8%
6% 4% 10% 4%
Quality of Life Information for MRT
Quality of life is measured in several key life domains including the following: general health, suicide attempts,
employment status, and homelessness. Improvements in these areas may indicate the effectiveness of treatment
services.
Hospital Admissions for Mental Health Care: Parents/Guardians who reported their youth had hospital admission(s)
for mental health care within 6 months of…
FY17 FY18 FY19 FY20 FY21
-
FY18 FY19 FY20
- 100% 100%
- 11% 7% 10% 2%
FY21
- 100% 98% 95% 96%
Suicide Attempts: Parents/Guardians who reported suicide attempt(s) by their youth within 6 months of…
FY17 FY18 FY19 FY20 FY21
100%
Employment Status: Parents/Guardians who reported their youth's employment at…
FY17 FY18
4% 10%
- 0% 0% 0% 0%
- 0% 0% 10% 0%
- 0% 33% 10% 0%
General Health: Parents/Guardians who reported their youth's general health as good, very good, or excellent at…
FY17
September 2021 | 217 v

Targeted Services for Justice-Involved Youth
MRT
State Average
Discharge
Federally Required
MRT
State Average
Admission
Discharge
Federally Required
MRT Trainings
Advanced MRT Trainings
- 0% 0% 0% 0%
Public Safety Information for MRT
- 0% 33% 10% 0%
Public safety information includes history of arrest. A reduction in this area may indicate how youth are able to
positively contribute to their families and communities.
History of Arrest: Parents/Guardians who reported arrest(s) of their youth within 30 days of…
FY17 FY18 FY19 FY20 FY21
- 24% 14% 9% 10%
FY19 FY20 FY21
Homelessness: Parents/Guardians who reported their youth's homelessness at…
1
FY17 FY18
Curriculum Fidelity for MRT
MRT Curriculum Trainings
Correctional Counseling, Inc. (CCI) provides both MRT trainings and advanced MRT trainings for continued
skill development.
MRT Training FY17 FY18 FY19 FY20 FY21
1 2 2 1 1
1 12 2
September 2021 | 218 v

Appendix A: Stakeholder Survey
State FY17 FY18 FY19 FY20 FY21
Not Familiar - 17 0 0 0
Somewhat Familiar - 48 14 10 16
Familiar - 177 93 60 123
Very Familiar - 141 324 300 393
Total Responses - 383 431 370 532
State FY17 FY18 FY19 FY20 FY21
Disagree - 13 18 13 16
Undecided - 25 14 17 29
Agree - 330 387 334 466
Total Responses - 368 419 364 511
State FY17 FY18 FY19 FY20 FY21
Disagree - 20 22 10 28
Undecided - 56 46 43 71
Agree - 291 350 306 415
Total Responses - 367 418 359 514
State FY17 FY18 FY19 FY20 FY21
Disagree - 25 29 17 23
Undecided - 40 33 23 37
Agree - 302 355 318 452
Total Responses - 367 417 358 512
State FY17 FY18 FY19 FY20 FY21
Disagree - 25 27 22 40
Undecided - 40 57 34 61
Agree - 302 329 298 407
Total Responses - 367 413 354 508
State FY17 FY18 FY19 FY20 FY21
Disagree - 9 11 6 9
Undecided - 23 14 15 21
Agree - 338 391 339 486
Total Responses - 370 416 360 516
Positive Outcomes
Location of Services
Group Times
Staff Respectfulness
Client Support
Appendix A : Stakeholder Survey Summary
State Information Printed September 2021
Survey Responses
Familiarity of Services
September 2021 | 219 vv

Appendix A: Stakeholder Survey
State FY17 FY18 FY19 FY20 FY21
Disagree - 18 19 6 20
Undecided - 36 39 29 61
Agree - 314 355 315 427
Total Responses - 368 413 350 508
State FY17 FY18 FY19 FY20 FY21
Disagree - 16 16 8 16
Undecided - 33 34 21 51
Agree - 314 357 319 439
Total Responses - 363 407 348 506
State FY17 FY18 FY19 FY20 FY21
Disagree - 24 24 9 27
Undecided - 34 30 21 37
Agree - 313 358 325 449
Total Responses - 371 412 355 513
State FY17 FY18 FY19 FY20 FY21
Disagree - 26 34 27 46
Undecided - 51 42 39 58
Agree - 279 323 279 392
Total Responses - 356 399 345 496
State FY17 FY18 FY19 FY20 FY21
Disagree - 14 13 7 6
Undecided - 66 55 43 97
Agree - 272 321 288 384
Total Responses - 352 389 338 487
State FY17 FY18 FY19 FY20 FY21
Disagree - 14 23 7 24
Undecided - 43 28 32 41
Agree - 313 364 322 449
Total Responses - 370 415 361 514
Agency Responsivity
Staff Communication
Utilization of Evidence-Based or Emerging/Promising Practices
Quality of Services
Trained Staff
Staff Competencies
September 2021 | 220 vv

APPENDIX B: ADULT SUD TREATMENT SERVICES
Clients Served*
Age FY17 FY18 FY19 FY20 FY21
18 and Below 818 566 665 819 559
19 to 64 5,900 8,303 10,585 10,757 10,518
65 and above 64 93 111 117 112
Clients Served Total 6,782 8,962 11,361 11,693 11,189
State Population*
Age FY17 FY18 FY19 FY20 FY21
18 and Below 215,498 214,808 217,912 216,741 217,233
19 to 64 511,483 513,102 520,520 515,756 516,927
65 and above 138,473 141,756 143,804 152,161 152,507
State Population 865,454 869,666 882,236 884,658 886,667
Clients Served*
Race FY17 FY18 FY19 FY20 FY21
White 3,798 4,862 6,100 6,079 5,595
Black or African American 271 366 422 468 448
American Indian and Alaska Native 2,509 2,845 3,705 4,093 3,692
Asian 20 35 45 54 45
Native Hawaiian and Other Pacific Islander 14 16 39 19 17
Two or More Races 7 588 721 702 559
Other 163 250 329 278 833
Clients Served Total 6,782 8,962 11,361 11,693 11,189
State Population*
Race FY17 FY18 FY19 FY20 FY21
White 737,366 738,346 749,018 748,421 750,120
Black or African American 17,309 18,263 18,527 20,347 20,393
American Indian and Alaska Native 78,756 78,270 79,401 79,619 79,800
Asian 12,981 13,045 13,234 13,270 13,300
Native Hawaiian and Other Pacific Islander 865 870 882 885 887
Two or More Races 19,905 20,872 21,174 22,116 22,167
Other - - - - -State Population 865,454 869,666 882,236 884,658 886,667
* Demographic information includes both adult and youth individuals.
Appendix B: Adult SUD Treatment Services
State Information
June-May
September 2021 | 221 vv

APPENDIX B: ADULT SUD TREATMENT SERVICES
Discharge Reasons
State Average FY17 FY18 FY19 FY20 FY21
5,234 5,597 6,869 8,033 8,606
1,098 1,223 1,176 1,250 1,439
474 362 428 403 391
299 246 352 391 337
256 213 265 234 277
273 285 370 400 395
Total 7,634 7,926 9,460 10,711 11,445
National Average FY17 FY18 FY19 FY20 FY21
629,869 621,777 562,602 599,042 473,746
380,634 419,959 362,563 826,106 628,615
95,228 96,865 93,722 91,774 67,634
215,860 228,146 321,271 371,370 319,763
28,153 29,358 26,270 23,938 13,992
53,242 60,084 70,797 103,547 85,989
Total 1,402,986 1,456,189 1,437,225 2,015,777 1,589,739
State Primary SUD Diagnosis FY17 FY18 FY19 FY20 FY21
3,389 3,137 3,234 4,232 3,654
50% 51% 56% 59% 58%
559 743 577 604 508
8% 12% 10% 8% 8%
1,175 1,227 1,420 1,921 1,898
17% 20% 25% 27% 30%
253 209 225 276 210
4% 3% 4% 4% 3%
132 221 234 248 93
2% 4% 4% 3% 1%
Total 6,730 6,139 5,786 7,228 6,273
State FY17 FY18 FY19 FY20 FY21
Number who agree or strongly agree 462 310 1,092 1,362 1,027
Total clients 494 328 1,155 1,443 1,087
State Average 94% 95% 95% 94% 94%
Primary Diagnostic Information for SUD Treatment Services
Transferred to Another Facility or Program
Incarcerated
Other
Substance Use Disorder Treatment Discharge Reasons for SUD Treatment Services
Treatment Completed
Left Against Professional Advice
Terminated by Facility
Number/Percent of clients with a Primary Cannabis
Use Disorder
Number/Percent of clients with a Primary
Amphetamine Use Disorder
Number/Percent of clients with a Primary Opioid
Use Disorder
Number/Percent of clients with Other Primary Use
Disorder
Impact of SUD Treatment Services
General Satisfaction with Services
Transferred to Another Facility or Program
Incarcerated
Other
Treatment Completed
Left Against Professional Advice
Terminated by Facility
Number/Percent of clients with a Primary Alcohol
Use Disorder
September 2021 | 222 vv

APPENDIX B: ADULT SUD TREATMENT SERVICES
State FY17 FY18 FY19 FY20 FY21
Number who agree or strongly agree 422 395 1,049 1,320 1,010
Total clients 467 428 1,136 1,416 1,079
State Average 90% 92% 92% 93% 94%
State FY17 FY18 FY19 FY20 FY21
Number who agree or strongly agree 439 404 1,082 1,351 1,021
Total clients 474 431 1,148 1,428 1,077
State Average 93% 94% 94% 95% 95%
State FY17 FY18 FY19 FY20 FY21
Number who agree or strongly agree 420 385 1,032 1,290 988
Total clients 468 425 1,139 1,414 1,069
State Average 90% 91% 91% 91% 92%
State FY17 FY18 FY19 FY20 FY21
Number who agree or strongly agree 436 385 1,079 1,344 1,014
Total clients 478 425 1,157 1,440 1,090
State Average 91% 91% 93% 93% 93%
State Admission FY17 FY18 FY19 FY20 FY21
Number who agree or strongly agree 1,357 1,047 2,400 3,357 2,867
Total clients 1,857 1,409 3,224 4,507 3,846
Admission State Average 73% 74% 74% 74% 75%
State Discharge
Number who agree or strongly agree 414 382 1,015 1,285 977
Total clients 487 444 1,174 1,463 1,100
Discharge State Average 85% 86% 86% 88% 89%
State Admission FY17 FY18 FY19 FY20 FY21
Number who agree or strongly agree 1,319 1,014 2,342 3,216 2,741
Total clients 1,859 1,388 3,244 4,511 3,869
Admission State Average 71% 73% 72% 71% 71%
State Discharge
Number who agree or strongly agree 443 411 1,083 1,362 1,035
Total clients 486 443 1,172 1,463 1,099
Discharge State Average 91% 93% 92% 93% 94%
Functioning
Access to Services
Quality and Appropriateness of Services
Outcome of Services
Participation in Treatment Planning
Social Connectedness
September 2021 | 223 vv

APPENDIX B: ADULT SUD TREATMENT SERVICES
State Admission FY17 FY18 FY19 FY20 FY21
Number of clients who reported nights/times - 134 276 350 325
Total clients - 1,377 3,105 4,342 3,752
Admission State Average - 10% 9% 8% 9%
State Discharge
Number of clients who reported nights/times - 35 59 69 48
Total clients - 429 1,146 1,410 1,074
Discharge State Average - 8% 5% 5% 4%
State Admission FY17 FY18 FY19 FY20 FY21
Number of clients who reported nights/times - 172 356 525 422
Total clients - 1,411 3,202 4,456 3,813
Admission State Average - 12% 11% 12% 11%
State Discharge
Number of clients who reported nights/times - 39 75 87 614
Total clients - 432 1,166 1,410 3,790
Discharge State Average - 9% 6% 6% 16%
State Admission FY17 FY18 FY19 FY20 FY21
Number of clients who reported nights/times - 118 292 419 334
Total clients - 1,386 3,122 4,364 3,769
Admission State Average - 9% 9% 10% 9%
State Discharge
Number of clients who reported nights/times - 28 66 103 83
Total clients - 426 1,148 1,415 1,074
Discharge State Average - 7% 6% 7% 8%
State Admission FY17 FY18 FY19 FY20 FY21
Number of clients who reported nights/times - 238 584 832 614
Total clients - 1,397 3,176 4,427 3,790
Admission State Average - 17% 18% 19% 16%
State Discharge
Number of clients who reported nights/times - 68 106 160 150
Total clients - 434 1,150 1,425 1,080
Discharge State Average - 16% 9% 11% 14%
Illness, Injury, or Surgery
Hospital Admissions for Mental Health Care
Detoxification Services
Emergency Department
Utilization of High Cost Services for SUD Treatment Services
September 2021 | 224 vv

APPENDIX B: ADULT SUD TREATMENT SERVICES
State Admission FY17 FY18 FY19 FY20 FY21
Number of clients who reported nights/times - 232 436 595 551
Total clients - 1,387 2,742 3,618 3,672
Admission State Average - 17% 16% 16% 15%
State Discharge
Number of clients who reported nights/times - 140 201 223 391
Total clients - 426 931 1,072 1,076
Discharge State Average - 33% 22% 21% 36%
State Admission FY17 FY18 FY19 FY20 FY21
Number of clients who reported nights/times - 681 1,304 1,804 1,367
Total clients - 1,325 3,016 4,264 3,752
Admission State Average - 51% 43% 42% 36%
State Discharge
Number of clients who reported nights/times - 154 258 253 66
Total clients - 422 1,118 1,351 927
Discharge State Average - 36% 23% 19% 7%
State Admission FY17 FY18 FY19 FY20 FY21
Number of clients who reported nights/times 1,640 3,000 3,532 4,175 3,286
Total clients 1,972 3,735 4,414 5,249 4,186
Admission State Average 83% 80% 80% 80% 78%
State Discharge
Number of clients who reported nights/times 461 892 1,218 1,512 1,046
Total clients 507 979 1,353 1,638 1,162
Discharge State Average 91% 91% 90% 92% 90%
State Admission FY17 FY18 FY19 FY20 FY21
Number of clients who reported nights/times - 175 359 508 395
Total clients - 1,422 3,197 4,482 3,825
Admission State Average - 12% 11% 11% 10%
State Discharge
Number of clients who reported nights/times - 38 59 74 47
Total clients - 440 1,156 1,434 1,083
Discharge State Average - 9% 5% 5% 4%
General Health
Suicide Attempts
Correctional Facility
Quality of Life Information for SUD Treatment Services
Inpatient Substance Use Disorder Treatment Services
September 2021 | 225 vv

APPENDIX B: ADULT SUD TREATMENT SERVICES
State Admission FY17 FY18 FY19 FY20 FY21
Number of clients who are employed 1,625 1,633 1,719 1,857 1,590
Total clients 3,556 4,887 5,065 5,666 5,217
Admission Agency Average 46% 33% 34% 33% 30%
State Discharge
Number of clients who are employed 1,959 2,133 2,333 2,549 2,330
Total clients 3,556 4,887 5,065 5,666 5,217
Discharge Agency Average 55% 44% 46% 45% 45%
National Average at Admission
Number of clients who are employed 363,459 401,255 383,391 384,086 276,308
Total clients 1,461,182 1,703,496 1,610,102 2,024,530 1,495,359
Admission State Average 25% 24% 24% 19% 18%
National Average at Discharge
Number of clients who are employed 354,520 373,412 349,789 386,752 286,929
Total clients 1,432,468 1,512,923 1,471,440 2,015,777 1,589,739
Discharge State Average 25% 25% 23% 19% 18%
State Admission FY17 FY18 FY19 FY20 FY21
Number of clients who are homeless 103 294 244 370 379
Total clients 3,479 4,343 4,538 5,111 4,789
Admission Agency Average 3% 7% 5% 7% 8%
State Discharge
Number of clients who are homeless 143 417 551 715 659
Total clients 3,479 4,343 4,538 5,121 4,816
Discharge Agency Average 4% 10% 12% 14% 14%
National Average at Admission
Number of clients who are homeless 225,984 248,695 249,944 251,546 203,222
Total clients 1,461,182 1,703,496 1,610,102 2,024,530 1,495,359
Admission State Average 15% 15% 16% 12% 14%
National Average at Discharge
Number of clients who are homeless 149,883 154,662 151,170 172,634 149,907
Total clients 1,432,468 1,512,923 1,471,440 2,015,777 1,589,739
Discharge State Average 10% 10% 10% 9% 9%
State Admission FY17 FY18 FY19 FY20 FY21
Number of clients who reported nights/times 444 797 982 1,208 836
Total clients 1,968 3,708 4,387 5,226 3,920
Admission State Average 23% 21% 22% 23% 21%
State Discharge
Number of clients who reported nights/times 51 60 67 110 79
Total clients 506 982 1,354 1,638 1,109
Discharge State Average 10% 6% 5% 7% 7%
Employment Status
Homelessness
Missing School/Work
September 2021 | 226 vv

APPENDIX B: ADULT SUD TREATMENT SERVICES
State Admission FY17 FY18 FY19 FY20 FY21
Number of clients who reported nights/times 360 737 498 575 453
Total clients 918 1,964 1,289 1,528 1,166
Admission State Average 39% 38% 39% 38% 39%
State Discharge
Number of clients who reported nights/times 924 1,839 1,311 1,554 1,164
Total clients 942 1,870 1,333 1,584 1,188
Discharge State Average 98% 98% 98% 98% 98%
State Admission FY17 FY18 FY19 FY20 FY21
Number of clients who reported nights/times 5,341 1,817 2,868 3,298 2,432
Total clients 7,838 3,674 4,392 5,239 3,847
Admission State Average 68% 49% 65% 63% 63%
State Discharge
Number of clients who reported nights/times 1,728 769 1,181 1,435 1,091
Total clients 1,993 972 1,350 1,637 1,230
Discharge State Average 87% 79% 87% 88% 89%
State Admission FY17 FY18 FY19 FY20 FY21
Number of clients who reported nights/times 1,001 1,706 1,860 2,325 1,893
Total clients 1,946 3,736 4,449 5,277 3,947
Admission State Average 51% 46% 42% 44% 48%
State Discharge
Number of clients who reported nights/times 412 796 1,097 1,367 949
Total clients 498 982 1,362 1,655 1,112
Discharge State Average 83% 81% 81% 83% 85%
Motivation to Not Use Substances
Engagement in Treatment Services
Ability to Control Use
September 2021 | 227 vv

APPENDIX B: ADULT SUD TREATMENT SERVICES
State Admission FY17 FY18 FY19 FY20 FY21
Number of clients who were arrested 426 1,359 675 702 533
Total clients 3,074 7,689 4,542 5,125 4,846
Admission Agency Average 14% 18% 15% 14% 11%
State Discharge
Number of clients who were arrested 451 819 490 445 360
Total clients 3,074 7,689 4,542 5,125 4,804
Discharge Agency Average 15% 11% 11% 9% 7%
National Average at Admission
Number of clients who were arrested 318,740 357,460 261,501 716,998 472,390
Total clients 1,710,947 1,877,958 1,610,102 2,024,530 1,495,359
Admission State Average 19% 19% 16% 35% 32%
National Average at Discharge
Number of clients who were arrested 393,747 412,540 354,895 744,092 556,520
Total clients 1,630,087 1,757,042 1,471,440 2,015,777 1,589,739
Discharge State Average 24% 23% 24% 37% 35%
State Admission FY17 FY18 FY19 FY20 FY21
Number of clients who reported nights/times 574 1,126 1,354 1,676 1,137
Total clients 1,974 3,699 4,399 5,234 3,936
Admission State Average 29% 30% 31% 32% 29%
State Discharge
Number of clients who reported nights/times 60 82 109 138 86
Total clients 508 971 1,355 1,642 1,109
Discharge State Average 12% 8% 8% 8% 8%
Public Safety Information for SUD Treatment Services
History of Arrest
Trouble as a Result of Substance Use
September 2021 | 228 vv

APPENDIX B: ADULT SUD TREATMENT SERVICES
Discharge Reasons
State Average FY17 FY18 FY19 FY20 FY21
1,273 1,424 1,454 1,614 1,425
849 948 888 957 885
208 235 298 284 238
186 147 154 164 156
203 170 181 144 137
231 260 349 375 320
Total 2,940 3,184 3,324 3,538 3,161
State FY17 FY18 FY19 FY20 FY21
Number who agree or strongly agree 251 197 689 741 511
Total clients 266 210 721 770 531
State Average 94% 94% 96% 96% 96%
State FY17 FY18 FY19 FY20 FY21
Number who agree or strongly agree 239 254 663 719 506
Total clients 264 271 713 756 529
State Average 91% 94% 93% 95% 96%
State FY17 FY18 FY19 FY20 FY21
Number who agree or strongly agree 246 259 684 726 502
Total clients 264 274 719 757 526
State Average 93% 95% 95% 96% 95%
State FY17 FY18 FY19 FY20 FY21
Number who agree or strongly agree 238 249 654 699 495
Total clients 263 271 715 750 525
State Average 90% 92% 91% 93% 94%
State FY17 FY18 FY19 FY20 FY21
Number who agree or strongly agree 245 173 677 717 507
Total clients 266 184 722 763 535
State Average 92% 94% 94% 94% 95%
Impact of Outpatient Treatment Services
Terminated by Facility
Treatment Completed
Left Against Professional Advice
Substance Use Disorder Treatment ServicesDischarge Reasons for Outpatient Treatment Services
General Satisfaction with Services
Access to Services
Quality and Appropriateness of Services
Outcome of Services
Participation in Treatment Planning
Transferred to Another Facility or Program
Incarcerated
Other
September 2021 | 229 vv

APPENDIX B: ADULT SUD TREATMENT SERVICES
State Admission FY17 FY18 FY19 FY20 FY21
Number who agree or strongly agree 996 821 1,747 2,229 1,863
Total clients 1,312 1,077 2,251 2,844 2,352
Admission State Average 76% 76% 78% 78% 79%
State Discharge
Number who agree or strongly agree 238 252 653 703 491
Total clients 274 283 737 778 533
Discharge State Average 87% 89% 89% 90% 92%
State Admission FY17 FY18 FY19 FY20 FY21
Number who agree or strongly agree 980 813 1,725 2,188 1,837
Total clients 1,315 1,077 2,266 2,860 2,367
Admission State Average 75% 75% 76% 77% 78%
State Discharge
Number who agree or strongly agree 251 264 680 732 504
Total clients 273 284 734 778 532
Discharge State Average 92% 93% 93% 94% 95%
State Admission FY17 FY18 FY19 FY20 FY21
Number of clients who reported nights/times - 95 184 185 165
Total clients - 1,050 2,173 2,778 2,316
Admission State Average - 9% 8% 7% 7%
State Discharge
Number of clients who reported nights/times - 21 28 27 11
Total clients - 276 721 756 526
Discharge State Average - 8% 4% 4% 2%
State Admission FY17 FY18 FY19 FY20 FY21
Number of clients who reported nights/times - 105 202 234 182
Total clients - 1,072 2,237 2,840 2,350
Admission State Average - 10% 9% 8% 8%
State Discharge
Number of clients who reported nights/times - 11 20 22 12
Total clients - 274 731 769 533
Discharge State Average - 4% 3% 3% 2%
Illness, Injury, or Surgery
Emergency Department
Social Connectedness
Functioning
Utilization of High Cost Services for Outpatient Treatment Services
September 2021 | 230 vv

APPENDIX B: ADULT SUD TREATMENT SERVICES
State Admission FY17 FY18 FY19 FY20 FY21
Number of clients who reported nights/times - 68 161 187 127
Total clients - 1,058 2,186 2,789 2,324
Admission State Average - 6% 7% 7% 5%
State Discharge
Number of clients who reported nights/times - 11 18 19 10
Total clients - 274 722 758 525
Discharge State Average - 4% 2% 3% 2%
State Admission FY17 FY18 FY19 FY20 FY21
Number of clients who reported nights/times - 142 265 318 263
Total clients - 1,069 2,215 2,821 2,341
Admission State Average - 13% 12% 11% 11%
State Discharge
Number of clients who reported nights/times - 22 30 24 11
Total clients - 277 721 760 527
Discharge State Average - 8% 4% 3% 2%
State Admission FY17 FY18 FY19 FY20 FY21
Number of clients who reported nights/times - 126 236 295 153
Total clients - 1,059 2,189 2,789 2,228
Admission State Average - 12% 11% 11% 7%
State Discharge
Number of clients who reported nights/times - 23 48 49 29
Total clients - 275 700 755 527
Discharge State Average - 8% 7% 6% 6%
State Admission FY17 FY18 FY19 FY20 FY21
Number of clients who reported nights/times - 501 877 1,020 756
Total clients - 1,010 2,105 2,710 2,306
Admission State Average - 50% 42% 38% 33%
State Discharge
Number of clients who reported nights/times - 90 149 123 29
Total clients - 269 689 720 461
Discharge State Average - 33% 22% 17% 6%
Inpatient Substance Use Disorder Treatment Services
Correctional Facility
Hospital Admissions for Mental Health Care
Detoxification Services
September 2021 | 231 vv

APPENDIX B: ADULT SUD TREATMENT SERVICES
State Admission FY17 FY18 FY19 FY20 FY21
Number of clients who reported nights/times 1204 2303 2553 2719 1958
Total clients 1401 2763 3067 3290 2396
Admission State Average 86% 83% 83% 83% 82%
State Discharge
Number of clients who reported nights/times 256 530 715 777 487
Total clients 282 568 788 839 535
Discharge State Average 91% 93% 91% 93% 91%
State Admission FY17 FY18 FY19 FY20 FY21
Number of clients who reported nights/times - 99 194 211 154
Total clients - 1079 2234 2849 2353
Admission State Average - 9% 9% 7% 7%
State Discharge
Number of clients who reported nights/times - 10 23 20 11
Total clients - 281 722 760 527
Discharge State Average - 4% 3% 3% 2%
State Admission FY17 FY18 FY19 FY20 FY21
Number of clients who are employed 1463 1461 1546 1632 1354
Total clients 3221 3502 3615 3719 3265
Admission State Average 45% 42% 43% 44% 41%
State Discharge
Number of clients who are employed 1797 1855 1933 2036 1828
Total clients 3221 3502 3615 3719 3265
Discharge State Average 56% 53% 53% 55% 56%
State Admission FY17 FY18 FY19 FY20 FY21
Number of clients who are homeless 78 117 115 128 137
Total clients 3101 3187 3323 3405 3073
Admission State Average 3% 4% 3% 4% 4%
State Discharge
Number of clients who are homeless 104 193 237 290 230
Total clients 3101 3187 3323 3405 3073
Discharge State Average 3% 6% 7% 9% 7%
Quality of Life Informtion for Outpatient Treatment Services
General Health
Suicide Attempts
Employment Status
Homelessness
September 2021 | 232 vv

APPENDIX B: ADULT SUD TREATMENT SERVICES
State Admission FY17 FY18 FY19 FY20 FY21
Number of clients who reported nights/times 249 511 544 548 362
Total clients 1,401 2,751 3,043 3,266 2,395
Admission State Average 18% 19% 18% 17% 15%
State Discharge
Number of clients who reported nights/times 19 21 28 34 14
Total clients 281 573 790 841 538
Discharge State Average 7% 4% 4% 4% 3%
Before Program FY17 FY18 FY19 FY20 FY21
Number of clients who reported nights/times 241 485 323 342 270
Total clients 508 1,138 749 777 586
Before Program State Average 47% 43% 43% 44% 46%
End of Program
Number of clients who reported nights/times 507 1,059 766 799 584
Total clients 519 1,079 780 807 595
End of Program State Average 98% 98% 98% 99% 98%
State Admission FY17 FY18 FY19 FY20 FY21
Number of clients who reported nights/times 3,906 1,476 2,130 2,305 1,699
Total clients 5,595 2,709 3,045 3,275 2,368
Admission State Average 70% 54% 70% 70% 72%
State Discharge
Number of clients who reported nights/times 974 464 708 767 567
Total clients 1,109 563 789 842 621
Discharge State Average 88% 82% 90% 91% 91%
State Admission FY17 FY18 FY19 FY20 FY21
Number of clients who reported nights/times 723 1,332 1,434 1,600 1,356
Total clients 1,378 2,763 3,093 3,308 2,411
Admission State Average 52% 48% 46% 48% 56%
State Discharge
Number of clients who reported nights/times 238 472 669 742 472
Total clients 277 569 795 852 540
Discharge State Average 86% 83% 84% 87% 87%
Ability to Control Use
Motivation to Not Use Substances
Engagement in Treatment Services
Missing School/Work
September 2021 | 233 vv

APPENDIX B: ADULT SUD TREATMENT SERVICES
State Admission FY17 FY18 FY19 FY20 FY21
Number of clients who were arrested 175 537 510 463 323
Total clients 1,813 3,235 3,326 3,406 3,074
Admission State Average 10% 17% 15% 14% 11%
State Discharge
Number of clients who were arrested 306 407 410 356 276
Total clients 1,813 3,235 3,326 3,406 3,065
Discharge State Average 17% 13% 12% 10% 9%
State Admission FY17 FY18 FY19 FY20 FY21
Number of clients who reported nights/times 353 753 832 841 567
Total clients 1,404 2,757 3,051 3,273 2,409
Admission State Average 25% 27% 27% 26% 24%
State Discharge
Number of clients who reported nights/times 29 30 42 38 19
Total clients 282 573 792 844 537
Discharge State Average 10% 5% 5% 5% 4%
Public Safety Informtion for Outpatient Services
History of Arrest
Trouble as a Result of Substance Use
September 2021 | 234 vv

APPENDIX B: ADULT SUD TREATMENT SERVICES
Discharge Reasons
State Average FY17 FY18 FY19 FY20 FY21
89 96 94 90 71
18 11 11 10 8
19 18 10 14 7
0 1 0 0 2
0 1 0 0 0
1 1 0 2 0
Total 127 128 115 116 88
State FY17 FY18 FY19 FY20 FY21
Number who agree or strongly agree 71 30 89 107 65
Total clients 72 30 89 110 66
State Average 99% 100% 100% 97% 98%
State FY17 FY18 FY19 FY20 FY21
Number who agree or strongly agree 67 40 84 101 61
Total clients 70 41 86 106 63
State Average 96% 98% 98% 95% 97%
State FY17 FY18 FY19 FY20 FY21
Number who agree or strongly agree 70 39 85 105 63
Total clients 72 40 87 108 64
State Average 97% 98% 98% 97% 98%
State FY17 FY18 FY19 FY20 FY21
Number who agree or strongly agree 64 35 79 95 58
Total clients 70 39 85 106 63
State Average 91% 90% 93% 90% 92%
State FY17 FY18 FY19 FY20 FY21
Number who agree or strongly agree 70 26 86 106 65
Total clients 73 27 89 110 66
State Average 96% 96% 97% 96% 98%
General Satisfaction with Services
Substance Use Disorder Treatment Services
Impact of Day Treatment Services
Quality and Appropriateness of Services
Outcome of Services
Participation in Treatment Planning
Treatment Completed
Left Against Professional Advice
Transferred to Another Facility or Program
Incarcerated
Access to Services
Other
Terminated by Facility
Discharge Reasons for Day Treatment Services
September 2021 | 235 vv

APPENDIX B: ADULT SUD TREATMENT SERVICES
State Admission FY17 FY18 FY19 FY20 FY21
Number who agree or strongly agree 66 38 63 78 50
Total clients 107 53 92 121 78
Admission State Average 62% 72% 68% 64% 64%
State Discharge
Number who agree or strongly agree 56 34 74 89 54
Total clients 72 41 88 109 66
Discharge State Average 78% 83% 84% 82% 82%
State Admission FY17 FY18 FY19 FY20 FY21
Number who agree or strongly agree 64 37 60 72 49
Total clients 108 54 94 122 79
Admission State Average 59% 69% 64% 59% 62%
State Discharge
Number who agree or strongly agree 68 39 82 104 63
Total clients 73 41 89 109 66
Discharge State Average 93% 95% 92% 95% 95%
State Admission FY17 FY18 FY19 FY20 FY21
Number of clients who reported nights/times - 0 6 7 5
Total clients - 7 88 120 76
Admission State Average - 0% 7% 6% 7%
State Discharge
Number of clients who reported nights/times - 4 6 5 3
Total clients - 41 87 105 63
Discharge State Average - 10% 7% 5% 5%
State Admission FY17 FY18 FY19 FY20 FY21
Number of clients who reported nights/times - 12 14 23 12
Total clients - 56 93 118 78
Admission State Average - 21% 15% 19% 15%
State Discharge
Number of clients who reported nights/times - 7 4 6 3
Total clients - 41 86 110 66
Discharge State Average - 17% 5% 5% 5%
Social Connectedness
Functioning
Emergency Department
Utilization of High Cost Services for Day Treatment Services
Illness, Injury, or Surgery
September 2021 | 236 vv

APPENDIX B: ADULT SUD TREATMENT SERVICES
State Admission FY17 FY18 FY19 FY20 FY21
Number of clients who reported nights/times - 6 10 17 7
Total clients - 55 88 119 77
Admission State Average - 11% 11% 14% 9%
State Discharge
Number of clients who reported nights/times - 1 8 6 2
Total clients - 41 87 104 64
Discharge State Average - 2% 9% 6% 3%
State Admission FY17 FY18 FY19 FY20 FY21
Number of clients who reported nights/times - 19 27 26 22
Total clients - 56 92 122 76
Admission State Average - 34% 29% 21% 29%
State Discharge
Number of clients who reported nights/times - 10 14 16 11
Total clients - 41 87 108 65
Discharge State Average - 24% 16% 15% 17%
State Admission FY17 FY18 FY19 FY20 FY21
Number of clients who reported nights/times - 32 56 79 52
Total clients - 55 91 121 77
Admission State Average - 58% 62% 65% 68%
State Discharge
Number of clients who reported nights/times - 34 73 77 51
Total clients - 41 88 105 64
Discharge State Average - 83% 83% 73% 80%
State Admission FY17 FY18 FY19 FY20 FY21
Number of clients who reported nights/times - 28 50 59 31
Total clients - 39 94 119 79
Admission State Average - 72% 53% 50% 39%
State Discharge
Number of clients who reported nights/times - 19 21 19 6
Total clients - 39 88 110 64
Discharge State Average - 49% 24% 17% 9%
Detoxification Services
Inpatient Substance Use Disorder Treatment Services
Correctional Facility
Hospital Admissions for Mental Health Care
September 2021 | 237 vv

APPENDIX B: ADULT SUD TREATMENT SERVICES
State Admission FY17 FY18 FY19 FY20 FY21
Number of clients who reported nights/times 83 118 100 128 10
Total clients 109 162 146 173 12
Admission State Average 76% 73% 68% 74% 83%
State Discharge
Number of clients who reported nights/times 66 114 111 127 12
Total clients 72 129 126 135 12
Discharge State Average 92% 88% 88% 94% 100%
State Admission FY17 FY18 FY19 FY20 FY21
Number of clients who reported nights/times - 6 13 17 6
Total clients - 54 95 123 79
Admission State Average - 11% 14% 14% 8%
State Discharge
Number of clients who reported nights/times - 6 9 5 3
Total clients - 41 86 108 66
Discharge State Average - 15% 10% 5% 5%
State Admission FY17 FY18 FY19 FY20 FY21
Number of clients who are employed 35 33 36 26 27
Total clients 127 128 115 116 88
Admission State Average 28% 26% 31% 22% 31%
State Discharge
Number of clients who are employed 39 31 30 28 24
Total clients 127 128 115 116 88
Discharge State Average 31% 24% 26% 24% 27%
State Admission FY17 FY18 FY19 FY20 FY21
Number of clients who are homeless 16 10 7 9 6
Total clients 128 209 115 116 88
Admission State Average 13% 5% 6% 8% 7%
State Discharge
Number of clients who are homeless 7 5 10 4 6
Total clients 128 209 115 116 88
Discharge State Average 5% 2% 9% 3% 7%
Homelessness
Quality of Life Informantion for Day Treatment Services
General Health
Suicide Attempts
Employment Status
September 2021 | 238 vv

APPENDIX B: ADULT SUD TREATMENT SERVICES
State Admission FY17 FY18 FY19 FY20 FY21
Number of clients who reported nights/times 47 49 56 75 22
Total clients 108 160 146 173 79
Admission State Average 44% 31% 38% 43% 28%
State Discharge
Number of clients who reported nights/times 10 12 13 16 11
Total clients 73 129 127 135 66
Discharge State Average 14% 9% 10% 12% 17%
Before Program FY17 FY18 FY19 FY20 FY21
Number of clients who reported nights/times 41 71 38 41 15
Total clients 137 258 122 134 65
Before Program State Average 30% 28% 31% 31% 23%
End of Program
Number of clients who reported nights/times 139 248 121 132 66
Total clients 139 250 123 134 66
End of Program State Average 100% 99% 98% 99% 100%
State Admission FY17 FY18 FY19 FY20 FY21
Number of clients who reported nights/times 222 49 78 73 41
Total clients 436 161 145 173 81
Admission State Average 51% 30% 54% 42% 51%
State Discharge
Number of clients who reported nights/times 263 107 108 115 64
Total clients 292 129 126 135 71
Discharge State Average 90% 83% 86% 85% 90%
State Admission FY17 FY18 FY19 FY20 FY21
Number of clients who reported nights/times 54 75 76 91 59
Total clients 109 155 146 173 79
Admission State Average 50% 48% 52% 53% 75%
State Discharge
Number of clients who reported nights/times 70 111 111 124 64
Total clients 73 124 127 135 66
Discharge State Average 96% 90% 87% 92% 97%
Missing School/Work
Ability to Control Use
Motivation to Not Use Substances
Engagement in Treatment Services
September 2021 | 239 vv

APPENDIX B: ADULT SUD TREATMENT SERVICES
State Admission FY17 FY18 FY19 FY20 FY21
Number of clients who were arrested 18 24 30 29 20
Total clients 127 129 115 116 88
Admission State Average 14% 19% 26% 25% 23%
State Discharge
Number of clients who were arrested 1 8 7 6 3
Total clients 127 129 115 116 88
Discharge State Average 1% 6% 6% 5% 3%
State Admission FY17 FY18 FY19 FY20 FY21
Number of clients who reported nights/times 52 70 78 90 31
Total clients 109 162 146 173 79
Admission State Average 48% 43% 53% 52% 39%
State Discharge
Number of clients who reported nights/times 8 18 27 20 7
Total clients 73 129 127 135 66
Discharge State Average 11% 14% 21% 15% 11%
Trouble as a Result of Substance Use
Public Safety Information for Day Treatment Services
History of Arrest
September 2021 | 240 vv

APPENDIX B: ADULT SUD TREATMENT SERVICES
Discharge Reasons
State Average FY17 FY18 FY19 FY20 FY21
184 198 299 306 286
113 118 242 246 282
136 73 172 130 140
27 45 21 26 39
22 17 39 42 41
23 12 24 30 28
Total 505 463 797 780 816
State FY17 FY18 FY19 FY20 FY21
Number who agree or strongly agree 48 23 105 114 73
Total clients 55 25 121 138 81
State Average 87% 92% 87% 83% 90%
State FY17 FY18 FY19 FY20 FY21
Number who agree or strongly agree 30 29 104 119 76
Total clients 38 33 119 137 82
State Average 79% 88% 87% 87% 93%
State FY17 FY18 FY19 FY20 FY21
Number who agree or strongly agree 32 28 105 120 75
Total clients 38 32 119 137 80
State Average 84% 88% 88% 88% 94%
State FY17 FY18 FY19 FY20 FY21
Number who agree or strongly agree 33 30 107 119 76
Total clients 38 33 121 137 80
State Average 87% 91% 88% 87% 95%
State FY17 FY18 FY19 FY20 FY21
Number who agree or strongly agree 31 20 108 121 75
Total clients 39 22 121 138 81
State Average 79% 91% 89% 88% 93%
Impact of Low-Intensity Residental Treatment Services
General Satisfaction with Services
Access to Services
Quality and Appropriateness of Services
Discharge Reasons Low-Intensity Residential Treatment Services
Treatment Completed
Left Against Professional Advice
Terminated by Facility
Transferred to Another Facility or Program
Incarcerated
Outcome of Services
Participation in Treatment Planning
Other
Substance Use Disorder Treatment Services
September 2021 | 241 vv

APPENDIX B: ADULT SUD TREATMENT SERVICES
State Admission FY17 FY18 FY19 FY20 FY21
Number who agree or strongly agree 198 108 272 330 284
Total clients 288 144 393 485 390
Admission State Average 69% 75% 69% 68% 73%
State Discharge
Number who agree or strongly agree 35 29 101 119 74
Total clients 40 33 121 139 83
Discharge State Average 88% 88% 83% 86% 89%
State Admission FY17 FY18 FY19 FY20 FY21
Number who agree or strongly agree 199 105 280 353 290
Total clients 289 147 396 489 394
Admission State Average 69% 71% 71% 72% 74%
State Discharge
Number who agree or strongly agree 35 30 111 124 79
Total clients 39 33 121 139 82
Discharge State Average 90% 91% 92% 89% 96%
State Admission FY17 FY18 FY19 FY20 FY21
Number of clients who reported nights/times - 14 25 34 20
Total clients - 136 368 447 373
Admission State Average - 10% 7% 8% 5%
State Discharge
Number of clients who reported nights/times - 0 2 4 4
Total clients - 30 118 137 83
Discharge State Average - 0% 2% 3% 5%
State Admission FY17 FY18 FY19 FY20 FY21
Number of clients who reported nights/times - 18 38 47 34
Total clients - 140 382 472 384
Admission State Average - 13% 10% 10% 9%
State Discharge
Number of clients who reported nights/times - 2 3 2 2
Total clients - 30 120 137 83
Discharge State Average - 7% 3% 1% 2%
Emergency Department
Illness, Injury, or Surgery
Social Connectedness
Functioning
Utilization of High Cost Services for Low-Intensity Residential Treatment Services
September 2021 | 242 vv

APPENDIX B: ADULT SUD TREATMENT SERVICES
State Admission FY17 FY18 FY19 FY20 FY21
Number of clients who reported nights/times - 17 41 57 39
Total clients - 136 373 458 375
Admission State Average - 13% 11% 12% 10%
State Discharge
Number of clients who reported nights/times - 1 3 6 2
Total clients - 29 118 137 81
Discharge State Average - 3% 3% 4% 2%
State Admission FY17 FY18 FY19 FY20 FY21
Number of clients who reported nights/times - 37 74 86 47
Total clients - 137 376 464 376
Admission State Average - 27% 20% 19% 13%
State Discharge
Number of clients who reported nights/times - 6 4 3 2
Total clients - 31 120 138 83
Discharge State Average - 19% 3% 2% 2%
State Admission FY17 FY18 FY19 FY20 FY21
Number of clients who reported nights/times - 47 118 154 100
Total clients - 138 370 452 376
Admission State Average - 34% 32% 34% 27%
State Discharge
Number of clients who reported nights/times - 21 70 75 32
Total clients - 24 114 134 81
Discharge State Average - 88% 61% 56% 40%
State Admission FY17 FY18 FY19 FY20 FY21
Number of clients who reported nights/times - 81 169 226 156
Total clients - 129 351 440 367
Admission State Average - 63% 48% 51% 43%
State Discharge
Number of clients who reported nights/times - 7 4 4 1
Total clients - 33 120 137 81
Discharge State Average - 21% 3% 3% 1%
Detoxification Services
Inpatient Substance Use Disorder Treatment Services
Correctional Facility
Hospital Admissions for Mental Health Care
September 2021 | 243 vv

APPENDIX B: ADULT SUD TREATMENT SERVICES
State Admission FY17 FY18 FY19 FY20 FY21
Number of clients who reported nights/times 249 355 444 502 342
Total clients 305 455 551 605 401
Admission State Average 82% 78% 81% 83% 85%
State Discharge
Number of clients who reported nights/times 40 65 133 152 78
Total clients 44 73 143 162 85
Discharge State Average 91% 89% 93% 94% 92%
State Admission FY17 FY18 FY19 FY20 FY21
Number of clients who reported nights/times - 29 58 74 53
Total clients - 145 380 476 379
Admission State Average - 20% 15% 16% 14%
State Discharge
Number of clients who reported nights/times - 2 2 3 1
Total clients - 33 122 140 81
Discharge State Average - 6% 2% 2% 1%
State Admission FY17 FY18 FY19 FY20 FY21
Number of clients who are employed 398 50 38 43 34
Total clients 523 463 478 538 457
Admission State Average 76% 11% 8% 8% 7%
State Discharge
Number of clients who are employed 248 172 237 246 197
Total clients 523 463 478 538 457
Discharge State Average 47% 37% 50% 46% 43%
State Admission FY17 FY18 FY19 FY20 FY21
Number of clients who are homeless 96 113 72 89 64
Total clients 520 463 478 538 457
Admission State Average 18% 24% 15% 17% 14%
State Discharge
Number of clients who are homeless 167 146 203 211 189
Total clients 520 463 478 538 457
Discharge State Average 32% 32% 42% 39% 41%
Quality of Life Information for Low-Intensity Residential Treatment Services
General Health
Suicide Attempts
Employment Status
Homelessness
September 2021 | 244 vv

APPENDIX B: ADULT SUD TREATMENT SERVICES
State Admission FY17 FY18 FY19 FY20 FY21
Number of clients who reported nights/times 84 107 130 136 72
Total clients 304 440 550 609 402
Admission State Average 28% 24% 24% 22% 18%
State Discharge
Number of clients who reported nights/times 6 5 3 5 3
Total clients 44 71 143 161 84
Discharge State Average 14% 7% 2% 3% 4%
Before Program FY17 FY18 FY19 FY20 FY21
Number of clients who reported nights/times 30 55 49 56 31
Total clients 75 142 129 143 84
Before Program State Average 40% 39% 38% 39% 37%
End of Program
Number of clients who reported nights/times 79 134 129 152 92
Total clients 81 134 131 154 92
End of Program State Average 98% 100% 98% 99% 100%
State Admission FY17 FY18 FY19 FY20 FY21
Number of clients who reported nights/times 731 190 349 380 262
Total clients 1,203 442 554 609 387
Admission State Average 61% 43% 63% 62% 68%
State Discharge
Number of clients who reported nights/times 142 57 128 141 90
Total clients 160 69 143 158 96
Discharge State Average 89% 83% 90% 89% 94%
State Admission FY17 FY18 FY19 FY20 FY21
Number of clients who reported nights/times 163 165 156 195 158
Total clients 303 448 560 615 405
Admission State Average 54% 37% 28% 32% 39%
State Discharge
Number of clients who reported nights/times 28 52 105 120 64
Total clients 41 71 143 163 85
Discharge State Average 68% 73% 73% 74% 75%
Missing School/Work
Ability to Control Use
Motivation to Not Use Substances
Engagement in Treatment Services
September 2021 | 245 vv

APPENDIX B: ADULT SUD TREATMENT SERVICES
State Admission FY17 FY18 FY19 FY20 FY21
Number of clients who were arrested 65 88 61 77 57
Total clients 506 470 478 538 486
Admission State Average 13% 19% 13% 14% 12%
State Discharge
Number of clients who were arrested 51 55 52 43 36
Total clients 506 470 478 538 457
Discharge State Average 10% 12% 11% 8% 8%
State Admission FY17 FY18 FY19 FY20 FY21
Number of clients who reported nights/times 99 132 155 170 86
Total clients 304 442 552 609 402
Admission State Average 33% 30% 28% 28% 21%
State Discharge
Number of clients who reported nights/times 4 5 7 8 4
Total clients 44 71 143 161 85
Discharge State Average 9% 7% 5% 5% 5%
Public Safety Information for Low-Intensity Residential Treatment Services
History of Arrest
Trouble as a Result of Substance Use
September 2021 | 246 vv

APPENDIX B: ADULT SUD TREATMENT SERVICES
Discharge Reasons
State Average FY17 FY18 FY19 FY20 FY21
284 343 381 502 645
70 83 82 110 157
14 23 10 26 43
7 13 11 14 24
3 3 4 2 8
1 4 7 8 12
Total 379 469 495 662 889
State FY17 FY18 FY19 FY20 FY21
Number who agree or strongly agree 83 57 179 320 302
Total clients 89 59 189 338 330
State Average 93% 97% 95% 95% 92%
State FY17 FY18 FY19 FY20 FY21
Number who agree or strongly agree 77 68 167 303 294
Total clients 85 77 183 331 324
State Average 91% 88% 91% 92% 91%
State FY17 FY18 FY19 FY20 FY21
Number who agree or strongly agree 83 74 177 320 305
Total clients 89 79 189 340 327
State Average 93% 94% 94% 94% 93%
State FY17 FY18 FY19 FY20 FY21
Number who agree or strongly agree 76 68 161 296 284
Total clients 86 77 183 335 320
State Average 88% 88% 88% 88% 89%
State FY17 FY18 FY19 FY20 FY21
Number who agree or strongly agree 81 49 176 320 292
Total clients 89 53 190 342 328
State Average 91% 92% 93% 94% 89%
Impact of Inpatient Treatment Services
General Satisfaction with Services
Access to Services
Quality and Appropriateness of Services
Outcome of Services
Participation in Treatment Planning
Left Against Professional Advice
Substance Use Disorder Treatment ServicesDischarge Reasons for Inpatient Treatment Services
Treatment Completed
Terminated by Facility
Transferred to Another Facility or Program
Incarcerated
Other
September 2021 | 247 vv

APPENDIX B: ADULT SUD TREATMENT SERVICES
State Admission FY17 FY18 FY19 FY20 FY21
Number who agree or strongly agree 73 68 246 510 479
Total clients 117 116 386 777 764
Admission State Average 62% 59% 64% 66% 63%
State Discharge
Number who agree or strongly agree 75 63 156 292 282
Total clients 91 81 193 350 336
Discharge State Average 82% 78% 81% 83% 84%
State Admission FY17 FY18 FY19 FY20 FY21
Number who agree or strongly agree 52 48 206 407 396
Total clients 116 91 387 758 768
Admission State Average 45% 53% 53% 54% 52%
State Discharge
Number who agree or strongly agree 81 75 178 318 311
Total clients 91 80 193 350 337
Discharge State Average 89% 94% 92% 91% 92%
State Admission FY17 FY18 FY19 FY20 FY21
Number of clients who reported nights/times - 17 50 107 118
Total clients - 112 385 743 738
Admission State Average - 15% 13% 14% 16%
State Discharge
Number of clients who reported nights/times - 9 21 32 29
Total clients - 76 186 331 320
Discharge State Average - 12% 11% 10% 9%
State Admission FY17 FY18 FY19 FY20 FY21
Number of clients who reported nights/times - 28 90 193 176
Total clients - 114 390 761 746
Admission State Average - 25% 23% 25% 24%
State Discharge
Number of clients who reported nights/times - 19 46 56 35
Total clients - 81 194 343 328
Discharge State Average - 23% 24% 16% 11%
Functioning
Utilization of High Cost Services for Inpatient Treatment Services
Illness, Injury, or Surgery
Emergency Department
Social Connectedness
September 2021 | 248 vv

APPENDIX B: ADULT SUD TREATMENT SERVICES
State Admission FY17 FY18 FY19 FY20 FY21
Number of clients who reported nights/times - 19 72 141 144
Total clients - 111 385 744 744
Admission State Average - 17% 19% 19% 19%
State Discharge
Number of clients who reported nights/times - 15 35 71 68
Total clients - 76 187 334 322
Discharge State Average - 20% 19% 21% 21%
State Admission FY17 FY18 FY19 FY20 FY21
Number of clients who reported nights/times - 31 201 363 257
Total clients - 110 393 756 750
Admission State Average - 28% 51% 48% 34%
State Discharge
Number of clients who reported nights/times - 30 58 112 122
Total clients - 79 187 334 323
Discharge State Average - 38% 31% 34% 38%
State Admission FY17 FY18 FY19 FY20 FY21
Number of clients who reported nights/times - 50 153 325 285
Total clients - 110 383 750 752
Admission State Average - 45% 40% 43% 38%
State Discharge
Number of clients who reported nights/times - 35 78 103 28
Total clients - 75 186 301 239
Discharge State Average - 47% 42% 34% 12%
Detoxification Services
Correctional Facility
Hospital Admissions for Mental Health Care
September 2021 | 249 vv

APPENDIX B: ADULT SUD TREATMENT SERVICES
State Admission FY17 FY18 FY19 FY20 FY21
Number of clients who reported nights/times 76 186 344 594 479
Total clients 121 310 535 889 781
Admission State Average 63% 60% 64% 67% 61%
State Discharge
Number of clients who reported nights/times 88 166 223 374 295
Total clients 96 190 256 412 339
Discharge State Average 92% 87% 87% 91% 87%
State Admission FY17 FY18 FY19 FY20 FY21
Number of clients who reported nights/times - 32 70 156 157
Total clients - 116 387 764 757
Admission State Average - 28% 18% 20% 21%
State Discharge
Number of clients who reported nights/times - 19 25 46 31
Total clients - 79 191 341 327
Discharge State Average - 24% 13% 13% 9%
State Admission FY17 FY18 FY19 FY20 FY21
Number of clients who are employed 164 83 89 135 146
Total clients 382 744 742 985 1,097
Admission State Average 43% 11% 12% 14% 13%
State Discharge
Number of clients who are employed 248 68 84 122 131
Total clients 382 744 742 985 1,097
Discharge State Average 65% 9% 11% 12% 12%
State Admission FY17 FY18 FY19 FY20 FY21
Number of clients who are homeless 23 74 38 104 115
Total clients 370 556 507 755 889
Admission State Average 6% 13% 7% 14% 13%
State Discharge
Number of clients who are homeless 59 73 54 100 143
Total clients 370 556 507 755 889
Discharge State Average 16% 13% 11% 13% 16%
Quality of Life Information for Inpatient Treatment Services
General Health
Suicide Attempts
Employment Status
Homelessness
September 2021 | 250 vv

APPENDIX B: ADULT SUD TREATMENT SERVICES
State Admission FY17 FY18 FY19 FY20 FY21
Number of clients who reported nights/times 56 121 222 371 318
Total clients 119 308 534 886 779
Admission State Average 47% 39% 42% 42% 41%
State Discharge
Number of clients who reported nights/times 16 21 23 54 47
Total clients 95 186 254 412 339
Discharge State Average 17% 11% 9% 13% 14%
Before Program FY17 FY18 FY19 FY20 FY21
Number of clients who reported nights/times 39 110 78 116 112
Total clients 172 380 253 392 350
Before Program State Average 23% 29% 31% 30% 32%
End of Program
Number of clients who reported nights/times 175 354 259 391 343
Total clients 177 361 263 404 353
End of Program State Average 99% 98% 98% 97% 97%
State Admission FY17 FY18 FY19 FY20 FY21
Number of clients who reported nights/times 228 77 244 377 305
Total clients 460 309 535 890 773
Admission State Average 50% 25% 46% 42% 39%
State Discharge
Number of clients who reported nights/times 327 123 201 333 294
Total clients 380 188 253 412 355
Discharge State Average 86% 65% 79% 81% 83%
State Admission FY17 FY18 FY19 FY20 FY21
Number of clients who reported nights/times 29 99 144 302 199
Total clients 120 310 535 887 784
Admission State Average 24% 32% 27% 34% 25%
State Discharge
Number of clients who reported nights/times 66 139 182 307 284
Total clients 94 190 257 414 339
Discharge State Average 70% 73% 71% 74% 84%
Missing School/Work
Ability to Control Use
Motivation to Not Use Substances
Engagement in Treatment Services
September 2021 | 251 vv

APPENDIX B: ADULT SUD TREATMENT SERVICES
State Admission FY17 FY18 FY19 FY20 FY21
Number of clients who were arrested 50 43 56 86 104
Total clients 396 465 509 757 889
Admission State Average 13% 9% 11% 11% 12%
State Discharge
Number of clients who were arrested 10 9 9 10 10
Total clients 396 465 509 757 889
Discharge State Average 3% 2% 2% 1% 1%
State Admission FY17 FY18 FY19 FY20 FY21
Number of clients who reported nights/times 61 158 265 471 380
Total clients 121 309 536 889 781
Admission State Average 50% 51% 49% 53% 49%
State Discharge
Number of clients who reported nights/times 19 28 33 68 52
Total clients 96 188 254 413 339
Discharge State Average 20% 15% 13% 16% 15%
Public Safety Information for Inpatient Treatment Services
History of Arrest
Trouble as a Result of Substance Use
September 2021 | 252 vv

APPENDIX B: ADULT SUD TREATMENT SERVICES
Discharge Reasons
State Average FY17 FY18 FY19 FY20 FY21
- 28 38 107 121
- 26 62 113 108
- 4 13 14 23
- 2 2 51 33
- 5 3 13 14
- 3 3 10 6
Total - 68 121 308 305
State FY17 FY18 FY19 FY20 FY21
Number who agree or strongly agree 12 3 30 80 76
Total clients 13 4 35 87 79
State Average 92% 75% 86% 92% 96%
State FY17 FY18 FY19 FY20 FY21
Number who agree or strongly agree 11 4 31 78 73
Total clients 13 6 35 86 81
State Average 85% 67% 89% 91% 90%
State FY17 FY18 FY19 FY20 FY21
Number who agree or strongly agree 12 4 31 80 76
Total clients 13 6 34 86 80
State Average 92% 67% 91% 93% 95%
State FY17 FY18 FY19 FY20 FY21
Number who agree or strongly agree 12 3 31 81 75
Total clients 13 5 35 86 81
State Average 92% 60% 89% 94% 93%
State FY17 FY18 FY19 FY20 FY21
Number who agree or strongly agree 13 3 32 80 75
Total clients 13 3 35 87 80
State Average 100% 100% 91% 92% 94%
Treatment Completed
Left Against Professional Advice
Terminated by Facility
Transferred to Another Facility or Program
Incarcerated
Other
General Satisfaction with Services
Substance Use Disorder Treatment ServicesDischarge Reasons for Intensive Meth Treatment Services
Impact of Intensive Meth Treatment Services
Access to Services
Quality and Appropriateness of Services
Outcome of Services
Participation in Treatment Planning
September 2021 | 253 vv

APPENDIX B: ADULT SUD TREATMENT SERVICES
State Admission
Number who agree or strongly agree 26 12 72 210 191
Total clients 36 19 102 280 262
Admission State Average 72% 63% 71% 75% 73%
State Discharge
Number who agree or strongly agree 12 4 31 82 76
Total clients 13 6 35 87 82
Discharge State Average 92% 67% 89% 94% 93%
State Admission FY17 FY18 FY19 FY20 FY21
Number who agree or strongly agree 26 11 71 196 169
Total clients 35 19 101 282 261
Admission State Average 74% 58% 70% 70% 65%
State Discharge
Number who agree or strongly agree 12 3 32 84 78
Total clients 13 5 35 87 82
Discharge State Average 92% 60% 91% 97% 95%
State Admission FY17 FY18 FY19 FY20 FY21
Number of clients who reported nights/times - 1 11 17 17
Total clients - 16 91 254 249
Admission State Average - 6% 12% 7% 7%
State Discharge
Number of clients who reported nights/times - 1 2 1 1
Total clients - 6 34 81 82
Discharge State Average - 17% 6% 1% 1%
State Admission FY17 FY18 FY19 FY20 FY21
Number of clients who reported nights/times - 5 12 28 18
Total clients - 19 100 265 255
Admission State Average - 26% 12% 11% 7%
State Discharge
Number of clients who reported nights/times - 0 2 1 1
Total clients - 6 35 51 49
Discharge State Average - 0% 6% 2% 2%
Functioning
Utilization of High Cost Services for Intensive Meth Treatment Services
Social Connectedness
Illness, Injury, or Surgery
Emergency Department
September 2021 | 254 vv

APPENDIX B: ADULT SUD TREATMENT SERVICES
State Admission FY17 FY18 FY19 FY20 FY21
Number of clients who reported nights/times - 4 8 17 17
Total clients - 17 90 254 249
Admission State Average - 24% 9% 7% 7%
State Discharge
Number of clients who reported nights/times - 0 2 1 1
Total clients - 6 34 82 82
Discharge State Average - 0% 6% 1% 1%
State Admission FY17 FY18 FY19 FY20 FY21
Number of clients who reported nights/times - 5 17 39 25
Total clients - 17 94 264 247
Admission State Average - 29% 18% 15% 10%
State Discharge
Number of clients who reported nights/times - 0 0 5 4
Total clients - 6 35 85 82
Discharge State Average - 0% 0% 6% 5%
State Admission FY17 FY18 FY19 FY20 FY21
Number of clients who reported nights/times - 14 55 174 139
Total clients - 18 83 245 248
Admission State Average - 78% 66% 71% 56%
State Discharge
Number of clients who reported nights/times - 3 6 4 2
Total clients - 6 35 83 82
Discharge State Average - 50% 17% 5% 2%
State Admission FY17 FY18 FY19 FY20 FY21
Number of clients who reported nights/times 28 46 91 232 497
Total clients 36 56 115 292 596
Admission State Average 78% 82% 79% 79% 83%
State Discharge
Number of clients who reported nights/times 11 21 36 82 174
Total clients 13 23 40 90 191
Discharge State Average 85% 91% 90% 91% 91%
Detoxification Services
Correctional Facility
Quality of Life Information for Intensive Meth Treatment Services
General Health
Hospital Admissions for Mental Health Care
September 2021 | 255 vv

APPENDIX B: ADULT SUD TREATMENT SERVICES
State Admission FY17 FY18 FY19 FY20 FY21
Number of clients who reported nights/times - 5 24 50 25
Total clients - 18 101 270 257
Admission State Average - 28% 24% 19% 10%
State Discharge
Number of clients who reported nights/times - 1 0 0 1
Total clients - 6 35 85 82
Discharge State Average - 17% 0% 0% 1%
State Admission FY17 FY18 FY19 FY20 FY21
Number of clients who are employed - 21 10 21 29
Total clients - 86 115 308 310
Admission State Average - 24% 9% 7% 9%
State Discharge
Number of clients who are employed - 38 49 117 150
Total clients - 71 115 308 310
Discharge State Average - 54% 43% 38% 48%
State Admission FY17 FY18 FY19 FY20 FY21
Number of clients who are homeless - 17 12 40 57
Total clients - 86 115 297 282
Admission State Average - 20% 10% 13% 20%
State Discharge
Number of clients who are homeless - 18 47 110 91
Total clients - 61 115 307 309
Discharge State Average - 30% 41% 36% 29%
State Admission FY17 FY18 FY19 FY20 FY21
Number of clients who reported nights/times 8 9 30 78 62
Total clients 36 46 114 292 265
Admission State Average 22% 20% 26% 27% 23%
State Discharge
Number of clients who reported nights/times 0 1 0 1 4
Total clients 13 23 40 89 82
Discharge State Average 0% 4% 0% 1% 5%
Suicide Attempts
Employment Status
Homelessness
Missing School/Work
September 2021 | 256 vv

APPENDIX B: ADULT SUD TREATMENT SERVICES
Before Program FY17 FY18 FY19 FY20 FY21
Number of clients who reported nights/times 9 16 10 20 25
Total clients 26 46 36 82 81
Before Program State Average 35% 35% 28% 24% 31%
End of Program
Number of clients who reported nights/times 24 44 36 80 79
Total clients 26 46 36 85 82
End of Program State Average 92% 96% 100% 94% 96%
State Admission FY17 FY18 FY19 FY20 FY21
Number of clients who reported nights/times 107 24 67 163 125
Total clients 132 53 113 292 238
Admission State Average 81% 45% 59% 56% 53%
State Discharge
Number of clients who reported nights/times 42 17 36 79 76
Total clients 52 23 39 90 87
Discharge State Average 81% 74% 92% 88% 87%
State Admission FY17 FY18 FY19 FY20 FY21
Number of clients who reported nights/times 32 31 50 137 121
Total clients 36 53 115 294 268
Admission State Average 89% 58% 43% 47% 45%
State Discharge
Number of clients who reported nights/times 12 18 30 74 65
Total clients 13 23 40 91 82
Discharge State Average 92% 78% 75% 81% 79%
Engagement in Treatment Services
Ability to Control Use
Motivation to Not Use Substances
September 2021 | 257 vv

APPENDIX B: ADULT SUD TREATMENT SERVICES
State Admission FY17 FY18 FY19 FY20 FY21
Number of clients who were arrested - 10 18 47 29
Total clients - 85 114 308 309
Admission State Average - 12% 16% 15% 9%
State Discharge
Number of clients who were arrested - 7 12 30 35
Total clients - 62 114 308 305
Discharge State Average - 11% 11% 10% 11%
State Admission FY17 FY18 FY19 FY20 FY21
Number of clients who reported nights/times 9 12 24 104 73
Total clients 36 47 114 290 265
Admission State Average 25% 26% 21% 36% 28%
State Discharge
Number of clients who reported nights/times 0 1 0 4 4
Total clients 13 23 39 89 82
Discharge State Average 0% 4% 0% 4% 5%
State FY17 FY18 FY19 FY20 FY21
Matrix Training - - 1 2 3
Matrix key Supervisor Training - - 1 2 2
FY17 FY18 FY19 FY20 FY21
State QA Average - - 16.5/20 17/20 -
Performance Measures for IMT Treatment Services
IMT Trainings
IMT QA Reviews
Public Safety Information for Intensive Meth Treatment Services
History of Arrest
Trouble as a Result of Substance Use
September 2021 | 258 vv

APPENDIX B: ADULT SUD TREATMENT SERVICES
Discharge Reasons
State Average FY17 FY18 FY19 FY20 FY21
41 38 40 69 49
24 34 36 53 62
10 7 7 8 16
4 1 3 6 0
1 3 4 1 2
0 0 1 0 1
Total 80 83 91 137 130
State FY17 FY18 FY19 FY20 FY21
Number who agree or strongly agree 15 4 24 41 17
Total clients 15 4 24 43 20
State Average 100% 100% 100% 95% 85%
State FY17 FY18 FY19 FY20 FY21
Number who agree or strongly agree 15 5 24 41 17
Total clients 15 5 24 42 20
State Average 100% 100% 100% 98% 85%
State FY17 FY18 FY19 FY20 FY21
Number who agree or strongly agree 15 5 24 41 18
Total clients 15 5 24 43 19
State Average 100% 100% 100% 95% 95%
State FY17 FY18 FY19 FY20 FY21
Number who agree or strongly agree 15 5 21 40 19
Total clients 15 5 24 43 20
State Average 100% 100% 88% 93% 95%
State FY17 FY18 FY19 FY20 FY21
Number who agree or strongly agree 15 3 24 42 18
Total clients 15 3 24 43 20
State Average 100% 100% 100% 98% 90%
Outcome of Services
Participation in Treatment Planning
Impact of Pregnant Women and Women with Dependant Children Program
General Satisfaction with Services
Access to Services
Quality and Appropriateness of Services
Substance Use Disorder Treatment ServicesDischarge Reasons Pregnant Women and Women with Dependant Children Program
Treatment Completed
Left Against Professional Advice
Terminated by Facility
Transferred to Another Facility or Program
Incarcerated
Other
September 2021 | 259 vv

APPENDIX B: ADULT SUD TREATMENT SERVICES
State Admission FY17 FY18 FY19 FY20 FY21
Number who agree or strongly agree 38 15 22 84 96
Total clients 61 23 33 118 137
Admission State Average 62% 65% 67% 71% 70%
State Discharge
Number who agree or strongly agree 15 5 22 41 19
Total clients 15 5 24 43 20
Discharge State Average 100% 100% 92% 95% 95%
State Admission FY17 FY18 FY19 FY20 FY21
Number who agree or strongly agree 30 28 30 105 118
Total clients 60 43 66 177 181
Admission State Average 50% 65% 45% 59% 65%
State Discharge
Number who agree or strongly agree 15 5 24 41 20
Total clients 15 5 24 43 20
Discharge State Average 100% 100% 100% 95% 100%
State Admission FY17 FY18 FY19 FY20 FY21
Number of clients who reported nights/times - 1 2 11 11
Total clients - 35 80 178 179
Admission State Average - 3% 3% 6% 6%
State Discharge
Number of clients who reported nights/times - 0 0 0 2
Total clients - 5 24 43 20
Discharge State Average - 0% 0% 0% 10%
State Admission FY17 FY18 FY19 FY20 FY21
Number of clients who reported nights/times - 1 5 17 10
Total clients - 35 79 177 178
Admission State Average - 3% 6% 10% 6%
State Discharge
Number of clients who reported nights/times - 0 0 0 0
Total clients - 5 24 43 20
Discharge State Average - 0% 0% 0% 0%
Social Connectedness
Functioning
Utilization of High Cost Services for Pregnant Women and Women with Dependant Children Program
Illness, Injury, or Surgery
Emergency Department
September 2021 | 260 vv

APPENDIX B: ADULT SUD TREATMENT SERVICES
State Admission FY17 FY18 FY19 FY20 FY21
Number of clients who reported nights/times - 0 1 7 5
Total clients - 35 80 177 179
Admission State Average - 0% 1% 4% 3%
State Discharge
Number of clients who reported nights/times - 0 1 1 4
Total clients - 5 24 43 20
Discharge State Average - 0% 4% 2% 20%
State Admission FY17 FY18 FY19 FY20 FY21
Number of clients who reported nights/times - 5 12 29 22
Total clients - 34 80 177 179
Admission State Average - 15% 15% 16% 12%
State Discharge
Number of clients who reported nights/times - 0 0 0 0
Total clients - 5 24 43 20
Discharge State Average - 0% 0% 0% 0%
State Admission FY17 FY18 FY19 FY20 FY21
Number of clients who reported nights/times - 3 5 20 8
Total clients - 12 33 66 76
Admission State Average - 25% 15% 30% 11%
State Discharge
Number of clients who reported nights/times - 3 17 29 11
Total clients - 3 18 31 11
Discharge State Average - 100% 94% 94% 100%
State Admission FY17 FY18 FY19 FY20 FY21
Number of clients who reported nights/times - 8 17 53 52
Total clients - 34 80 177 179
Admission State Average - 24% 21% 30% 29%
State Discharge
Number of clients who reported nights/times - 0 0 0 0
Total clients - 5 24 43 20
Discharge State Average - 0% 0% 0% 0%
Inpatient Substance Use Disorder Treatment Services
Correctional Facility
Hospital Admissions for Mental Health Care
Detoxification Services
September 2021 | 261 vv

APPENDIX B: ADULT SUD TREATMENT SERVICES
State Admission FY17 FY18 FY19 FY20 FY21
Number of clients who reported nights/times 39 80 90 150 131
Total clients 64 118 135 219 181
Admission State Average 61% 68% 67% 68% 72%
State Discharge
Number of clients who reported nights/times 21 22 32 47 18
Total clients 21 23 33 50 21
Discharge State Average 100% 96% 97% 94% 86%
State Admission FY17 FY18 FY19 FY20 FY21
Number of clients who reported nights/times - 15 27 43 45
Total clients - 35 79 178 178
Admission State Average - 43% 34% 24% 25%
State Discharge
Number of clients who reported nights/times - 0 0 0 0
Total clients - 32 24 43 20
Discharge State Average - 0% 0% 0% 0%
State Admission FY17 FY18 FY19 FY20 FY21
Number of clients who are employed 65 4 8 15 4
Total clients 81 135 132 162 129
Admission State Average 80% 3% 6% 9% 3%
State Discharge
Number of clients who are employed 57 24 26 54 38
Total clients 81 135 132 162 128
Discharge State Average 70% 18% 20% 33% 30%
State Admission FY17 FY18 FY19 FY20 FY21
Number of clients who are homeless 19 21 20 29 36
Total clients 80 84 91 137 122
Admission State Average 24% 25% 22% 21% 30%
State Discharge
Number of clients who are homeless 25 19 31 38 39
Total clients 80 84 91 137 122
Discharge State Average 31% 23% 34% 28% 32%
Quality of Life Information for Pregnant Women and Women with Dependant Children Program
General Health
Suicide Attempts
Employment Status
Homelessness
September 2021 | 262 vv

APPENDIX B: ADULT SUD TREATMENT SERVICES
State Admission FY17 FY18 FY19 FY20 FY21
Number of clients who reported nights/times 30 37 46 63 36
Total clients 64 115 135 219 180
Admission State Average 47% 32% 34% 29% 20%
State Discharge
Number of clients who reported nights/times 0 0 0 0 0
Total clients 16 19 31 50 20
Discharge State Average 0% 0% 0% 0% 0%
Before Program FY17 FY18 FY19 FY20 FY21
Number of clients who reported nights/times 12 5 7 13 6
Total clients 32 38 30 50 20
Before Program State Average 38% 13% 23% 26% 30%
End of Program
Number of clients who reported nights/times 32 38 30 50 20
Total clients 32 38 30 50 20
End of Program State Average 100% 100% 100% 100% 100%
State Admission FY17 FY18 FY19 FY20 FY21
Number of clients who reported nights/times 142 38 75 122 101
Total clients 256 114 135 219 181
Admission State Average 55% 33% 56% 56% 56%
State Discharge
Number of clients who reported nights/times 64 16 30 46 20
Total clients 64 19 31 50 20
Discharge State Average 100% 84% 97% 92% 100%
State Admission FY17 FY18 FY19 FY20 FY21
Number of clients who reported nights/times 12 20 14 68 87
Total clients 64 114 135 219 181
Admission State Average 19% 18% 10% 31% 48%
State Discharge
Number of clients who reported nights/times 16 19 28 45 17
Total clients 16 19 31 50 20
Discharge State Average 100% 100% 90% 90% 85%
Motivation to Not Use Substances
Engagement in Treatment Services
Missing School/Work
Ability to Control Use
September 2021 | 263 vv

APPENDIX B: ADULT SUD TREATMENT SERVICES
State Admission FY17 FY18 FY19 FY20 FY21
Number of clients who were arrested 23 19 23 31 25
Total clients 80 84 91 137 121
Admission State Average 29% 23% 25% 23% 21%
State Discharge
Number of clients who were arrested 5 7 7 6 4
Total clients 80 84 91 137 121
Discharge State Average 6% 8% 8% 4% 3%
State Admission FY17 FY18 FY19 FY20 FY21
Number of clients who reported nights/times 23 40 51 79 50
Total clients 64 115 135 219 181
Admission State Average 36% 35% 38% 36% 28%
State Discharge
Number of clients who reported nights/times 0 0 1 0 0
Total clients 16 19 31 50 20
Discharge State Average 0% 0% 3% 0% 0%
Public Safety Information for Pregnant Women and Women with Dependant Children Program
History of Arrest
Trouble as a Result of Substance Use
September 2021 | 264 vv

APPENDIX C: YOUTH SUD TREATMENT SERVICE
Clients Served*
Age FY17 FY18 FY19 FY20 FY21
18 and Below - 566 665 819 559
19 to 64 - 8,303 10,585 10,757 10,518
65 and above - 93 111 117 112
Clients Served Total - 8,962 11,361 11,693 11,189
State Population*
Age FY17 FY18 FY19 FY20 FY21
18 and Below - 214,808 217,912 216,741 217,233
19 to 64 - 513,102 520,520 515,756 516,927
65 and above - 141,756 143,804 152,161 152,507
State Population - 869,666 882,236 884,658 886,667
Clients Served*
Race FY17 FY18 FY19 FY20 FY21
White - 4,862 6,100 6,079 5,595
Black or African American - 366 422 468 448
American Indian and Alaska Native - 2,845 3,705 4,093 3,692
Asian - 35 45 54 45
Native Hawaiian and Other Pacific Islander - 16 39 19 17
Two or More Races - 588 721 702 559
Other - 250 329 278 833
Clients Served Total - 8,962 11,361 11,693 11,189
State Population*
Race FY17 FY18 FY19 FY20 FY21
White - 738,346 749,018 748,421 750,120
Black or African American - 18,263 18,527 20,347 20,393
American Indian and Alaska Native - 78,270 79,401 79,619 79,800
Asian - 13,045 13,234 13,270 13,300
Native Hawaiian and Other Pacific Islander - 870 882 885 887
Two or More Races - 20,872 21,174 22,116 22,167
Other - - - -State Population - 869,666 882,236 884,658 886,667
* Demographic information includes both adult and youth individuals.
Appendix C: Youth SUD Treatment Services
State Information
June-May
September 2021 | 265

APPENDIX C: YOUTH SUD TREATMENT SERVICE
Discharge Reasons
State Average FY17 FY18 FY19 FY20 FY21
- 277 295 320 328
- 132 102 89 81
- 59 41 56 40
- 30 45 41 21
- 12 6 6 5
- 31 40 29 29
Total - 541 529 541 504
State Primary SUD Diagnosis FY17 FY18 FY19 FY20 FY21
131 200 121 152 110
26% 36% 29% 33% 28%
315 319 262 271 203
63% 58% 63% 59% 52%
30 19 19 35 51
6% 3% 5% 8% 13%
3 7 6 1 1
1% 1% 1% 0% 0%
12 11 11 11 12
2% 2% 3% 2% 3%
Total 504 548 414 461 390
State FY17 FY18 FY19 FY20 FY21
Number who agree or strongly agree - 54 139 200 107
Total clients - 61 147 216 116
State Average - 89% 95% 93% 92%
State FY17 FY18 FY19 FY20 FY21
Number who agree or strongly agree - 48 117 171 89
Total clients - 60 145 202 101
State Average - 80% 81% 85% 88%
State FY17 FY18 FY19 FY20 FY21
Number who agree or strongly agree - 54 129 182 92
Total clients - 61 146 206 103
State Average - 89% 88% 88% 89%
Cultural Sensitivity
Outcome of Services
Youth Substance Use Disorder Treatment ServicesDischarge Reasons for SUD Treatment Services
Treatment Completed
Left Against Professional Advice
Terminated by Facility
Access to Services
Transferred to Another Facility or Program
Incarcerated
Other
Number/Percent of clients with a Primary Alcohol Use
Disorder
Number/Percent of clients with a Primary Cannabis
Use Disorder
Number/Percent of clients with a Primary
Amphetamine Use Disorder
Number/Percent of clients with a Primary Opioid Use
Disorder
Number/Percent of clients with a Primary Other
Substance Use Disorder
Impact of SUD Treatment Services
General Satisfaction with Services
September 2021 | 266

APPENDIX C: YOUTH SUD TREATMENT SERVICE
State FY17 FY18 FY19 FY20 FY21
Number who agree or strongly agree - 50 123 172 86
Total clients - 61 146 208 102
State Average - 82% 84% 83% 84%
State FY17 FY18 FY19 FY20 FY21
Number who agree or strongly agree - 56 135 182 95
Total clients - 62 148 206 103
State Average - 90% 91% 88% 92%
State Admission FY17 FY18 FY19 FY20 FY21
Number who agree or strongly agree - 155 284 372 233
Total clients - 196 338 455 289
Admission State Average - 79% 84% 82% 81%
State Discharge
Number who agree or strongly agree - 54 141 193 92
Total clients - 62 148 210 103
Discharge State Average - 87% 95% 92% 89%
State Admission FY17 FY18 FY19 FY20 FY21
Number who agree or strongly agree - 733 227 330 193
Total clients - 1,151 337 483 289
Admission State Average - 64% 67% 68% 67%
State Discharge
Number who agree or strongly agree - 296 123 172 85
Total clients - 363 146 208 102
Discharge State Average - 82% 84% 83% 83%
Participation in Treatment Planning
Social Connectedness
Functioning
September 2021 | 267

APPENDIX C: YOUTH SUD TREATMENT SERVICE
State Admission FY17 FY18 FY19 FY20 FY21
Number of responses greater than 1 - 102 205 298 231
Total clients - 151 295 430 307
Admission State Average - 68% 69% 69% 75%
State Discharge
Number of responses greater than 1 - 44 85 121 65
Total clients - 61 126 177 95
Discharge State Average - 72% 67% 68% 68%
State Admission FY17 FY18 FY19 FY20 FY21
Number of responses greater than 1 - 96 179 261 181
Total clients - 151 295 430 307
Admission State Average - 64% 61% 61% 59%
State Discharge
Number of responses greater than 1 - 36 64 102 50
Total clients - 61 126 177 95
Discharge State Average - 59% 51% 58% 53%
State Admission FY17 FY18 FY19 FY20 FY21
Number of responses greater than 1 - 87 149 218 155
Total clients - 151 295 430 307
Admission State Average - 58% 51% 51% 50%
State Discharge
Number of responses greater than 1 - 6 22 27 13
Total clients - 61 126 177 103
Discharge State Average - 10% 17% 15% 13%
State Admission FY17 FY18 FY19 FY20 FY21
Number of responses greater than 1 - 62 118 163 119
Total clients - 151 295 430 307
Admission State Average - 41% 40% 38% 39%
State Discharge
Number of responses greater than 1 - 13 15 23 12
Total clients - 61 126 178 95
Discharge State Average - 21% 12% 13% 13%
GAIN Short Screener (Gain-SS) Scoring
Internalizing Disorder Screener
Externalizing Disorder Screener
Substance Disorder Screener
Crime/Violence Screener
September 2021 | 268

APPENDIX C: YOUTH SUD TREATMENT SERVICE
State Admission FY17 FY18 FY19 FY20 FY21
Number of clients who reported nights/times - 22 26 32 24
Total clients - 175 313 472 302
Admission State Average - 13% 8% 7% 8%
State Discharge
Number of clients who reported nights/times - 6 13 10 4
Total clients - 52 139 192 111
Discharge State Average - 12% 9% 5% 4%
State Admission FY17 FY18 FY19 FY20 FY21
Number of clients who reported nights/times - 36 61 83 63
Total clients - 182 317 483 305
Admission State Average - 20% 19% 17% 21%
State Discharge
Number of clients who reported nights/times - 14 30 23 9
Total clients - 53 137 188 112
Discharge State Average - 26% 22% 12% 8%
State Admission FY17 FY18 FY19 FY20 FY21
Number of clients who reported nights/times - 33 51 72 50
Total clients - 182 314 473 297
Admission State Average - 18% 16% 15% 17%
State Discharge
Number of clients who reported nights/times - 15 21 24 9
Total clients - 55 137 193 109
Discharge State Average - 27% 15% 12% 8%
State Admission FY17 FY18 FY19 FY20 FY21
Number of clients who reported nights/times - 45 18 21 40
Total clients - 181 171 227 294
Admission State Average - 25% 11% 9% 14%
State Discharge
Number of clients who reported nights/times - 37 3 0 69
Total clients - 53 40 64 110
Discharge State Average - 70% 8% 0% 63%
Hospital Admissions for Mental Health Care
Inpatient Substance Use Disorder Treatment Services
Utilization of High Cost Services for SUD Treatment Services
Illness, Injury, or Surgery
Emergency Department
September 2021 | 269

APPENDIX C: YOUTH SUD TREATMENT SERVICE
State Admission FY17 FY18 FY19 FY20 FY21
Number of clients who reported nights/times - 85 127 190 113
Total clients - 183 310 485 314
Admission State Average - 46% 41% 39% 36%
State Discharge
Number of clients who reported nights/times - 33 42 39 8
Total clients - 55 137 199 119
Discharge State Average - 60% 31% 20% 7%
State Admission FY17 FY18 FY19 FY20 FY21
Number of clients who reported nights/times - 166 287 419 286
Total clients - 200 341 491 342
Admission State Average - 83% 84% 85% 84%
State Discharge
Number of clients who reported nights/times - 65 144 204 106
Total clients - 71 151 210 116
Discharge State Average - 92% 95% 97% 91%
State Admission FY17 FY18 FY19 FY20 FY21
Number of clients who reported nights/times - 49 77 120 140
Total clients - 196 329 495 409
Admission State Average - 25% 23% 24% 34%
State Discharge
Number of clients who reported nights/times - 20 46 47 18
Total clients - 58 145 206 194
Discharge State Average - 34% 32% 23% 9%
State Admission FY17 FY18 FY19 FY20 FY21
Number of clients who are employed - 1,633 1,719 1,857 1,590
Total clients - 4,887 5,065 5,666 5,217
Admission State Average - 33% 34% 33% 30%
State Discharge
Number of clients who are employed - 2,133 2,333 2,549 2,330
Total clients - 4,887 5,065 5,666 5,217
Discharge State Average - 44% 46% 45% 45%
Correctional Facility
Quality of Life Information for SUD Treatment Services
General Health
Suicide Attempts
Employment Status
September 2021 | 270

APPENDIX C: YOUTH SUD TREATMENT SERVICE
State Admission FY17 FY18 FY19 FY20 FY21
Number of clients who are homeless - 1 2 4 5
Total clients - 541 529 541 409
Admission State Average - 0% 0% 1% 1%
State Discharge
Number of clients who are homeless - 3 3 0 1
Total clients - 541 529 541 409
Discharge State Average - 1% 1% 0% 0%
State Admission FY17 FY18 FY19 FY20 FY21
Number of clients who reported nights/times - 67 108 173 104
Total clients - 204 347 492 344
Admission State Average - 33% 31% 35% 30%
State Discharge
Number of clients who reported nights/times - 14 26 37 16
Total clients - 74 151 210 145
Discharge State Average - 19% 17% 18% 11%
Before Program FY17 FY18 FY19 FY20 FY21
Number of clients who reported nights/times - 29 42 52 41
Total clients - 137 153 206 120
Before Program State Average - 21% 27% 25% 34%
End of Program
Number of clients who reported nights/times - 127 138 185 113
Total clients - 141 150 202 121
End of Program State Average - 90% 92% 92% 93%
State Admission FY17 FY18 FY19 FY20 FY21
Number of clients who reported nights/times - 61 181 230 152
Total clients - 202 347 424 295
Admission State Average - 30% 52% 54% 52%
State Discharge
Number of clients who reported nights/times - 31 105 125 79
Total clients - 72 152 173 113
Discharge State Average - 43% 69% 72% 70%
Homelessness
Missing School/Work
Ability to Control Use
Motivation to Not Use Substances
September 2021 | 271

APPENDIX C: YOUTH SUD TREATMENT SERVICE
State Admission FY17 FY18 FY19 FY20 FY21
Number of clients who reported nights/times - 71 126 158 106
Total clients - 204 347 493 345
Admission State Average - 35% 36% 32% 31%
State Discharge
Number of clients who reported nights/times - 47 102 118 65
Total clients - 74 150 212 124
Discharge State Average - 64% 68% 56% 52%
State Admission FY17 FY18 FY19 FY20 FY21
Number of clients who were arrested - 159 133 134 104
Total clients - 543 529 541 400
Admission State Average - 29% 25% 25% 26%
State Discharge
Number of clients who were arrested - 55 43 57 54
Total clients - 543 529 541 400
Discharge State Average - 10% 8% 11% 14%
State Admission FY17 FY18 FY19 FY20 FY21
Number of clients who reported nights/times - 108 182 265 172
Total clients - 204 346 492 344
Admission State Average - 53% 53% 54% 50%
State Discharge
Number of clients who reported nights/times - 17 31 42 19
Total clients - 74 151 209 136
Discharge State Average - 23% 21% 20% 14%
Engagement in Treatment Services
Public Safety Information for SUD Treatment Services
History of Arrest
Trouble as a Result of Substance Use
September 2021 | 272

APPENDIX C: YOUTH SUD TREATMENT SERVICE
State FY17 FY18 FY19 FY20 FY21
Number who agree or strongly agree - 34 64 91 44
Total clients - 38 69 98 49
State Average - 89% 93% 93% 90%
State FY17 FY18 FY19 FY20 FY21
Number who agree or strongly agree - 31 58 86 43
Total clients - 35 67 98 50
State Average - 89% 87% 88% 86%
State FY17 FY18 FY19 FY20 FY21
Number who agree or strongly agree - 33 65 89 43
Total clients - 35 69 94 49
State Average - 94% 94% 95% 88%
State FY17 FY18 FY19 FY20 FY21
Number who agree or strongly agree - 24 53 80 39
Total clients - 30 69 96 49
State Average - 80% 77% 83% 80%
State FY17 FY18 FY19 FY20 FY21
Number who agree or strongly agree - 25 54 75 40
Total clients - 33 68 91 49
State Average - 76% 79% 82% 82%
State Admission FY17 FY18 FY19 FY20 FY21
Number who agree or strongly agree - 78 132 248 132
Total clients - 92 155 313 193
Admission State Average - 85% 85% 79% 68%
State Discharge
Number who agree or strongly agree - 35 59 95 42
Total clients - 38 63 100 51
Discharge State Average - 92% 94% 95% 82%
Impact of SUD Treatment Services
Participation in Treatment Planning
Social Connectedness
Outcome of Services
Cultural Sensitivity
Access to Services
General Satisfaction with Services
September 2021 | 273

APPENDIX C: YOUTH SUD TREATMENT SERVICE
State Admission FY17 FY18 FY19 FY20 FY21
Number who agree or strongly agree - 281 88 183 99
Total clients - 453 151 312 192
Admission State Average - 62% 58% 59% 52%
State Discharge
Number who agree or strongly agree - 136 52 78 39
Total clients - 174 68 96 49
Discharge State Average - 78% 76% 81% 80%
State Admission FY17 FY18 FY19 FY20 FY21
Number of clients who reported nights/times - 13 13 26 20
Total clients - 92 150 295 212
Admission State Average - 14% 9% 9% 9%
State Discharge
Number of clients who reported nights/times - 3 6 5 0
Total clients - 31 62 83 53
Discharge State Average - 10% 10% 6% 0%
State Admission FY17 FY18 FY19 FY20 FY21
Number of clients who reported nights/times - 25 44 71 65
Total clients - 89 150 301 221
Admission State Average - 28% 29% 24% 29%
State Discharge
Number of clients who reported nights/times - 7 19 21 4
Total clients - 34 65 92 55
Discharge State Average - 21% 29% 23% 7%
State Admission FY17 FY18 FY19 FY20 FY21
Number of clients who reported nights/times - 19 33 59 48
Total clients - 91 149 293 212
Admission State Average - 21% 22% 20% 23%
State Discharge
Number of clients who reported nights/times - 10 17 12 3
Total clients - 32 63 84 53
Discharge State Average - 31% 27% 14% 6%
Functioning
Utilization of High Cost Services for SUD Treatment Services
Illness, Injury, or Surgery
Emergency Department
Hospital Admissions for Mental Health Care
September 2021 | 274

APPENDIX C: YOUTH SUD TREATMENT SERVICE
State Admission FY17 FY18 FY19 FY20 FY21
Number of clients who reported nights/times - 31 15 18 26
Total clients - 90 67 107 211
Admission State Average - 34% 22% 17% 12%
State Discharge
Number of clients who reported nights/times - 27 3 3 35
Total clients - 35 9 24 55
Discharge State Average - 77% 33% 13% 64%
State Admission FY17 FY18 FY19 FY20 FY21
Number of clients who reported nights/times - 53 65 122 84
Total clients - 91 148 292 227
Admission State Average - 58% 44% 42% 37%
State Discharge
Number of clients who reported nights/times - 17 24 13 3
Total clients - 35 64 90 53
Discharge State Average - 49% 38% 14% 6%
State Admission FY17 FY18 FY19 FY20 FY21
Number of clients who reported nights/times - 80 137 260 207
Total clients - 94 157 292 239
Admission State Average - 85% 87% 89% 87%
State Discharge
Number of clients who reported nights/times - 41 65 93 53
Total clients - 42 70 96 60
Discharge State Average - 98% 93% 97% 88%
State Admission FY17 FY18 FY19 FY20 FY21
Number of clients who reported nights/times - 24 38 62 95
Total clients - 86 141 283 275
Admission State Average - 28% 27% 22% 35%
State Discharge
Number of clients who reported nights/times - 11 18 12 5
Total clients - 35 64 86 54
Discharge State Average - 31% 28% 14% 9%
Suicide Attempts
General Health
Correctional Facility
Quality of Life Information for SUD Treatment Services
Inpatient Substance Use Disorder Treatment Services
September 2021 | 275

APPENDIX C: YOUTH SUD TREATMENT SERVICE
State Admission FY17 FY18 FY19 FY20 FY21
Number of clients who reported nights/times - 58 76 167 114
Total clients - 95 157 295 199
Admission State Average - 61% 48% 57% 57%
State Discharge
Number of clients who reported nights/times - 6 12 17 9
Total clients - 42 69 95 50
Discharge State Average - 14% 17% 18% 18%
Before Program FY17 FY18 FY19 FY20 FY21
Number of clients who reported nights/times - 5 7 14 11
Total clients - 79 70 93 57
Before Program State Average - 6% 10% 15% 19%
End of Program
Number of clients who reported nights/times - 60 53 80 51
Total clients - 76 69 92 56
End of Program State Average - 79% 77% 87% 91%
State Admission FY17 FY18 FY19 FY20 FY21
Number of clients who reported nights/times - 12 45 69 73
Total clients - 92 162 291 230
Admission State Average - 13% 28% 24% 32%
State Discharge
Number of clients who reported nights/times - 17 36 51 30
Total clients - 42 72 95 59
Discharge State Average - 40% 50% 54% 51%
State Admission FY17 FY18 FY19 FY20 FY21
Number of clients who reported nights/times - 45 90 131 100
Total clients - 94 162 296 242
Admission State Average - 48% 56% 44% 41%
State Discharge
Number of clients who reported nights/times - 29 36 53 34
Total clients - 42 72 96 60
Discharge State Average - 69% 50% 55% 57%
Missing School/Work
Ability to Control Use
Motivation to Not Use Substances
Engagement in Treatment Services
September 2021 | 276

APPENDIX C: YOUTH SUD TREATMENT SERVICE
State Admission FY17 FY18 FY19 FY20 FY21
Number of clients who reported nights/times - 60 94 213 131
Total clients - 96 157 293 199
Admission State Average - 63% 60% 73% 66%
State Discharge
Number of clients who reported nights/times - 6 10 14 9
Total clients - 43 70 96 50
Discharge State Average - 14% 14% 15% 18%
Public Safety Information for SUD Treatment Services
Trouble as a Result of Substance Use
September 2021 | 277

APPENDIX C: YOUTH SUD TREATMENT SERVICE
Discharge Reasons
State Average FY17 FY18 FY19 FY20 FY21
- 116 132 102 96
- 73 61 47 50
- 26 29 27 14
- 16 34 27 9
- 6 5 5 4
- 24 33 25 19
Total - 261 294 233 192
State FY17 FY18 FY19 FY20 FY21
Number who agree or strongly agree - 3 37 61 29
Total clients - 4 40 66 31
State Average - 75% 93% 92% 94%
State FY17 FY18 FY19 FY20 FY21
Number who agree or strongly agree - 3 35 51 17
Total clients - 4 40 58 18
State Average - 75% 88% 88% 94%
State FY17 FY18 FY19 FY20 FY21
Number who agree or strongly agree - 4 35 53 17
Total clients - 4 39 59 18
State Average - 100% 90% 90% 94%
State FY17 FY18 FY19 FY20 FY21
Number who agree or strongly agree - 2 34 50 15
Total clients - 4 39 60 18
State Average - 50% 87% 83% 83%
State FY17 FY18 FY19 FY20 FY21
Number who agree or strongly agree - 3 35 50 16
Total clients - 4 40 57 18
State Average - 75% 88% 88% 89%
Transferred to Another Facility or Program
Incarcerated
Other
Outcome of Services
Participation in Treatment Planning
General Satisfaction with Services
Access to Services
Cultural Sensitivity
Left Against Professional Advice
Terminated by Facility
Impact of Outpatient Treatment Services
Discharge Reasons for Outpatient Treatment Services
Treatment Completed
September 2021 | 278

APPENDIX C: YOUTH SUD TREATMENT SERVICE
State Admission FY17 FY18 FY19 FY20 FY21
Number who agree or strongly agree - 78 150 173 100
Total clients - 102 179 213 123
Admission State Average - 76% 84% 81% 81%
State Discharge
Number who agree or strongly agree - 2 38 54 15
Total clients - 4 40 60 18
Discharge State Average - 50% 95% 90% 83%
State Admission FY17 FY18 FY19 FY20 FY21
Number who agree or strongly agree - 402 133 156 85
Total clients - 612 179 214 122
Admission State Average - 66% 74% 73% 70%
State Discharge
Number who agree or strongly agree - 13 34 50 15
Total clients - 24 39 60 18
Discharge State Average - 54% 87% 83% 83%
State Admission FY17 FY18 FY19 FY20 FY21
Number of responses greater than 1 - 37 83 96 91
Total clients - 62 135 156 134
Admission State Average - 60% 61% 62% 68%
State Discharge -
Number of responses greater than 1 - 1 8 12 5
Total clients - 3 18 29 12
Discharge State Average - 33% 44% 41% 42%
State Admission FY17 FY18 FY19 FY20 FY21
Number of responses greater than 1 - 32 70 85 76
Total clients - 62 135 156 134
Admission State Average - 52% 52% 54% 57%
State Discharge
Number of responses greater than 1 - 1 5 10 5
Total clients - 2 18 29 12
Discharge State Average - 50% 28% 34% 42%
Externalizing Disorder Screener
Internalizing Disorder Screener
Social Connectedness
Functioning
GAIN Short Screener (Gain-SS) Scoring
September 2021 | 279

APPENDIX C: YOUTH SUD TREATMENT SERVICE
State Admission FY17 FY18 FY19 FY20 FY21
Number of responses greater than 1 - 26 41 53 43
Total clients - 62 135 156 134
Admission State Average - 42% 30% 34% 32%
State Discharge
Number of responses greater than 1 - 0 0 1 1
Total clients - 3 18 29 20
Discharge State Average - 0% 0% 3% 5%
State Admission FY17 FY18 FY19 FY20 FY21
Number of responses greater than 1 - 19 33 31 43
Total clients - 62 135 156 134
Admission State Average - 31% 24% 20% 32%
State Discharge
Number of responses greater than 1 - 0 1 3 2
Total clients - 3 18 30 12
Discharge State Average - 0% 6% 10% 17%
State Admission FY17 FY18 FY19 FY20 FY21
Number of clients who reported nights/times - 22 9 8 9
Total clients - 175 168 227 151
Admission State Average - 13% 5% 4% 6%
State Discharge
Number of clients who reported nights/times - 6 0 0 2
Total clients - 52 40 63 32
Discharge State Average - 12% 0% 0% 6%
State Admission FY17 FY18 FY19 FY20 FY21
Number of clients who reported nights/times - 36 24 28 12
Total clients - 182 173 231 155
Admission State Average - 20% 14% 12% 8%
State Discharge
Number of clients who reported nights/times - 14 2 0 1
Total clients - 53 39 62 32
Discharge State Average - 26% 5% 0% 3%
Illness, Injury, or Surgery
Emergency Department
Substance Disorder Screener
Utilization of High Cost Services for Outpatient Treatment Services
Crime/Violence Screener
September 2021 | 280

APPENDIX C: YOUTH SUD TREATMENT SERVICE
State Admission FY17 FY18 FY19 FY20 FY21
Number of clients who reported nights/times - 33 17 21 13
Total clients - 182 170 228 151
Admission State Average - 18% 10% 9% 9%
State Discharge
Number of clients who reported nights/times - 15 1 1 0
Total clients - 55 39 65 32
Discharge State Average - 27% 3% 2% 0%
State Admission FY17 FY18 FY19 FY20 FY21
Number of clients who reported nights/times - 45 18 21 16
Total clients - 181 171 227 150
Admission State Average - 25% 11% 9% 11%
State Discharge
Number of clients who reported nights/times - 37 3 0 1
Total clients - 53 40 64 32
Discharge State Average - 70% 8% 0% 3%
State Admission FY17 FY18 FY19 FY20 FY21
Number of clients who reported nights/times - 85 52 56 37
Total clients - 183 170 236 158
Admission State Average - 46% 31% 24% 23%
State Discharge
Number of clients who reported nights/times - 33 1 0 1
Total clients - 55 38 63 36
Discharge State Average - 60% 3% 0% 3%
State Admission FY17 FY18 FY19 FY20 FY21
Number of clients who reported nights/times - 84 154 190 149
Total clients - 105 181 217 170
Admission State Average - 80% 85% 88% 88%
State Discharge
Number of clients who reported nights/times - 6 41 59 31
Total clients - 9 43 60 32
Discharge State Average - 67% 95% 98% 97%
State Admission FY17 FY18 FY19 FY20 FY21
Number of clients who reported nights/times - 49 32 48 35
Total clients - 196 176 235 160
Admission State Average - 25% 18% 20% 22%
State Discharge
Number of clients who reported nights/times - 20 3 3 2
General Health
Suicide Attempts
Inpatient Substance Use Disorder Treatment Services
Correctional Facility
Quality of Life Information for Outpatient Treatment Services
Hospital Admissions for Mental Health Care
September 2021 | 281

APPENDIX C: YOUTH SUD TREATMENT SERVICE
Total clients - 58 40 65 49
Discharge State Average - 34% 8% 5% 4%
State Admission FY17 FY18 FY19 FY20 FY21
Number of clients who are employed - 1457 1546 1,632 1,354
Total clients - 3492 3615 3,719 3,265
Admission State Average - 42% 43% 44% 41%
State Discharge
Number of clients who are employed - 1849 1933 2,036 1,828
Total clients - 3492 3615 3,719 3,265
Discharge State Average - 53% 53% 55% 56%
State Admission FY17 FY18 FY19 FY20 FY21
Number of clients who are homeless - 0 1 0 1
Total clients - 261 294 313 201
Admission State Average - 0% 0% 0% 0%
State Discharge
Number of clients who are homeless - 0 0 0 0
Total clients - 261 294 313 201
Discharge State Average - 0% 0% 0% 0%
State Admission FY17 FY18 FY19 FY20 FY21
Number of clients who reported nights/times - 21 35 42 28
Total clients - 109 185 217 171
Admission State Average - 19% 19% 19% 16%
State Discharge
Number of clients who reported nights/times - 2 2 0 0
Total clients - 11 42 60 60
Discharge State Average - 18% 5% 0% 0%
Before Program FY17 FY18 FY19 FY20 FY21
Number of clients who reported nights/times - 7 23 25 18
Total clients - 16 45 59 32
Before Program State Average - 44% 51% 42% 56%
End of Program
Number of clients who reported nights/times - 14 42 57 28
Total clients - 16 45 59 32
End of Program State Average - 88% 93% 97% 88%
State Admission FY17 FY18 FY19 FY20 FY21
Number of clients who reported nights/times - 38 113 133 100
Total clients - 109 185 218 160
Admission State Average - 35% 61% 61% 63%
Missing School/Work
Ability to Control Use
Employment Status
Homelessness
Motivation to Not Use Substances
September 2021 | 282

APPENDIX C: YOUTH SUD TREATMENT SERVICE
State Discharge
Number of clients who reported nights/times - 6 34 51 29
Total clients - 11 43 60 42
Discharge State Average - 55% 79% 85% 69%
State Admission FY17 FY18 FY19 FY20 FY21
Number of clients who reported nights/times - 46 72 95 87
Total clients - 109 185 218 172
Admission State Average - 42% 39% 44% 51%
State Discharge
Number of clients who reported nights/times - 5 31 48 23
Total clients - 11 41 60 39
Discharge State Average - 45% 76% 80% 59%
State Admission FY17 FY18 FY19 FY20 FY21
Number of clients who were arrested - 47 50 58 33
Total clients - 262 294 313 192
Admission State Average - 18% 17% 19% 17%
State Discharge
Number of clients who were arrested - 30 28 34 28
Total clients - 262 294 313 192
Discharge State Average - 11% 10% 11% 15%
State Admission FY17 FY18 FY19 FY20 FY21
Number of clients who reported nights/times - 46 74 90 58
Total clients - 109 184 217 171
Admission State Average - 42% 40% 41% 34%
State Discharge
Number of clients who reported nights/times - 2 7 10 1
Total clients - 11 42 60 51
Discharge State Average - 18% 17% 17% 2%
Engagement in Treatment Services
Public Safety Information for Outpatient Treatment Services
History of Arrest
Trouble as a Result of Substance Use
September 2021 | 283

APPENDIX C: YOUTH SUD TREATMENT SERVICE
State FY17 FY18 FY19 FY20 FY21
Number who agree or strongly agree - 1 7 24 4
Total clients - 1 7 25 4
State Average - 100% 100% 96% 100%
State FY17 FY18 FY19 FY20 FY21
Number who agree or strongly agree - 1 9 24 3
Total clients - 1 9 24 4
State Average - 100% 100% 100% 75%
State FY17 FY18 FY19 FY20 FY21
Number who agree or strongly agree - 1 9 21 4
Total clients - 1 9 21 4
State Average - 100% 100% 100% 100%
State FY17 FY18 FY19 FY20 FY21
Number who agree or strongly agree - 1 8 21 3
Total clients - 1 9 23 4
State Average - 100% 89% 91% 75%
State FY17 FY18 FY19 FY20 FY21
Number who agree or strongly agree - 1 8 17 4
Total clients - 1 9 20 5
State Average - 100% 89% 85% 80%
State Admission FY17 FY18 FY19 FY20 FY21
Number who agree or strongly agree - 25 59 96 54
Total clients - 30 68 113 63
Admission State Average - 83% 87% 85% 86%
State Discharge
Number who agree or strongly agree - 1 9 24 3
Total clients - 1 9 24 4
Discharge State Average - 100% 100% 100% 75%
Outcome of Services
Participation in Treatment Planning
Social Connectedness
Impact of Outpatient Treatment Services
General Satisfaction with Services
Access to Services
Cultural Sensitivity
September 2021 | 284

APPENDIX C: YOUTH SUD TREATMENT SERVICE
State Admission FY17 FY18 FY19 FY20 FY21
Number who agree or strongly agree - 95 42 76 37
Total clients - 150 67 112 63
Admission State Average - 63% 63% 68% 59%
State Discharge
Number who agree or strongly agree - 5 8 20 3
Total clients - 5 9 23 4
Discharge State Average - 100% 89% 87% 75%
State Admission FY17 FY18 FY19 FY20 FY21
Number of clients who reported nights/times - 3 6 7 8
Total clients - 30 65 105 99
Admission State Average - 10% 9% 7% 8%
State Discharge
Number of clients who reported nights/times - 0 0 0 0
Total clients - 1 9 24 13
Discharge State Average - 0% 0% 0% 0%
State Admission FY17 FY18 FY19 FY20 FY21
Number of clients who reported nights/times - 5 15 17 13
Total clients - 29 67 107 100
Admission State Average - 17% 22% 16% 13%
State Discharge
Number of clients who reported nights/times - 1 1 1 0
Total clients - 1 9 23 13
Discharge State Average - 100% 11% 4% 0%
State Admission FY17 FY18 FY19 FY20 FY21
Number of clients who reported nights/times - 2 13 21 14
Total clients - 29 66 107 99
Admission State Average - 7% 20% 20% 14%
State Discharge
Number of clients who reported nights/times - 0 1 1 0
Total clients - 1 8 24 13
Discharge State Average - 0% 13% 4% 0%
Functioning
Utilization of High Cost Services for Outpatient Treatment Services
Illness, Injury, or Surgery
Emergency Department
Hospital Admissions for Mental Health Care
September 2021 | 285

APPENDIX C: YOUTH SUD TREATMENT SERVICE
State Admission FY17 FY18 FY19 FY20 FY21
Number of clients who reported nights/times - 4 15 18 13
Total clients - 29 67 107 98
Admission State Average - 14% 22% 17% 13%
State Discharge
Number of clients who reported nights/times - 1 3 3 0
Total clients - 1 9 24 13
Discharge State Average - 100% 33% 13% 0%
State Admission FY17 FY18 FY19 FY20 FY21
Number of clients who reported nights/times - 11 20 20 20
Total clients - 29 67 105 106
Admission State Average - 38% 30% 19% 19%
State Discharge
Number of clients who reported nights/times - 0 1 1 0
Total clients - 1 8 24 13
Discharge State Average - 0% 13% 4% 0%
State Admission FY17 FY18 FY19 FY20 FY21
Number of clients who reported nights/times - 25 64 82 99
Total clients - 29 72 91 107
Admission State Average - 86% 89% 90% 93%
State Discharge
Number of clients who reported nights/times - 1 9 19 10
Total clients - 1 9 20 13
Discharge State Average - 100% 100% 95% 77%
State Admission FY17 FY18 FY19 FY20 FY21
Number of clients who reported nights/times - 5 16 21 10
Total clients - 24 60 102 93
Admission State Average - 21% 27% 21% 11%
State Discharge
Number of clients who reported nights/times - 0 0 0 1
Total clients - 1 7 23 13
Discharge State Average - 0% 0% 0% 8%
Correctional Facility
Quality of Life Information for Outpatient Treatment Services
General Health
Suicide Attempts
Inpatient Substance Use Disorder Treatment Services
September 2021 | 286

APPENDIX C: YOUTH SUD TREATMENT SERVICE
State Admission FY17 FY18 FY19 FY20 FY21
Number of clients who reported nights/times - 7 15 22 34
Total clients - 30 70 91 68
Admission State Average - 23% 21% 24% 50%
State Discharge
Number of clients who reported nights/times - 2 1 3 0
Total clients - 3 9 20 4
Discharge State Average - 67% 11% 15% 0%
State Admission FY17 FY18 FY19 FY20 FY21
Number of clients who reported nights/times - 0 0 7 4
Total clients - 2 6 20 11
Admission State Average - 0% 0% 35% 36%
State Discharge
Number of clients who reported nights/times - 2 6 19 10
Total clients - 2 7 20 11
Discharge State Average - 100% 86% 95% 91%
State Admission FY17 FY18 FY19 FY20 FY21
Number of clients who reported nights/times - 4 28 28 44
Total clients - 27 73 89 103
Admission State Average - 15% 38% 31% 43%
State Discharge
Number of clients who reported nights/times - 0 6 14 9
Total clients - 1 9 20 11
Discharge State Average - 0% 67% 70% 82%
State Admission FY17 FY18 FY19 FY20 FY21
Number of clients who reported nights/times - 10 38 50 57
Total clients - 29 72 91 105
Admission State Average - 34% 53% 55% 54%
State Discharge
Number of clients who reported nights/times - 1 7 17 12
Total clients - 1 9 20 13
Discharge State Average - 100% 78% 85% 92%
Engagement in Treatment Services
Missing School/Work
Ability to Control Use
Motivation to Not Use Substances
September 2021 | 287

APPENDIX C: YOUTH SUD TREATMENT SERVICE
State Admission FY17 FY18 FY19 FY20 FY21
Number of clients who reported nights/times - 11 27 47 26
Total clients - 31 70 91 68
Admission State Average - 35% 39% 52% 38%
State Discharge
Number of clients who reported nights/times - 1 1 3 0
Total clients - 3 9 20 4
Discharge State Average - 33% 11% 15% 0%
Public Safety Information for Outpatient Treatment ServicesTrouble as a Result of Substance Use
September 2021 | 288

APPENDIX C: YOUTH SUD TREATMENT SERVICE
Discharge Reasons
State Average FY17 FY18 FY19 FY20 FY21
- 161 163 153 149
- 59 41 34 26
- 33 12 24 20
- 14 11 13 7
- 6 1 0 0
- 7 6 3 6
Total - 280 234 227 208
State FY17 FY18 FY19 FY20 FY21
Number who agree or strongly agree - 51 102 139 78
Total clients - 57 107 150 85
State Average - 89% 95% 93% 92%
State FY17 FY18 FY19 FY20 FY21
Number who agree or strongly agree - 45 82 120 72
Total clients - 56 105 144 83
State Average - 80% 78% 83% 87%
State FY17 FY18 FY19 FY20 FY21
Number who agree or strongly agree - 50 94 129 75
Total clients - 57 107 147 85
State Average - 88% 88% 88% 88%
State FY17 FY18 FY19 FY20 FY21
Number who agree or strongly agree - 48 89 122 71
Total clients - 57 107 148 84
State Average - 84% 83% 82% 85%
State FY17 FY18 FY19 FY20 FY21
Number who agree or strongly agree - 53 100 132 79
Total clients - 58 108 149 85
State Average - 91% 93% 89% 93%
Cultural Sensitivity
Discharge Reasons for PRTF Treatment Services
Impact of PRTF Treatment Services
Treatment Completed
Left Against Professional Advice
Terminated by Facility
Transferred to Another Facility or Program
Incarcerated
Other
Outcome of Services
Participation in Treatment Planning
General Satisfaction with Services
Access to Services
September 2021 | 289

APPENDIX C: YOUTH SUD TREATMENT SERVICE
State Admission FY17 FY18 FY19 FY20 FY21
Number who agree or strongly agree - 77 134 199 133
Total clients - 94 159 242 166
Admission State Average - 82% 84% 82% 80%
State Discharge
Number who agree or strongly agree - 52 103 139 77
Total clients - 58 108 150 85
Discharge State Average - 90% 95% 93% 91%
State Admission FY17 FY18 FY19 FY20 FY21
Number who agree or strongly agree - 331 94 174 108
Total clients - 539 158 269 167
Admission State Average - 61% 59% 65% 65%
State Discharge
Number who agree or strongly agree - 283 89 122 70
Total clients - 339 107 148 84
Discharge State Average - 83% 83% 82% 83%
State Admission FY17 FY18 FY19 FY20 FY21
Number of responses greater than 1 - 65 122 202 140
Total clients - 89 160 274 173
Admission State Average - 73% 76% 74% 81%
State Discharge
Number of responses greater than 1 - 43 77 109 60
Total clients - 58 108 148 83
Discharge State Average - 74% 71% 74% 72%
State Admission FY17 FY18 FY19 FY20 FY21
Number of responses greater than 1 - 64 109 176 105
Total clients - 89 160 274 173
Admission State Average - 72% 68% 64% 61%
State Discharge
Number of responses greater than 1 - 36 59 92 45
Total clients - 58 108 148 83
Discharge State Average - 62% 55% 62% 54%
Functioning
GAIN Short Screener (Gain-SS) Scoring
Social Connectedness
Externalizing Disorder Screener
Internalizing Disorder Screener
September 2021 | 290

APPENDIX C: YOUTH SUD TREATMENT SERVICE
State Admission FY17 FY18 FY19 FY20 FY21
Number of responses greater than 1 - 61 108 165 112
Total clients - 89 160 274 173
Admission State Average - 69% 68% 60% 65%
State Discharge
Number of responses greater than 1 - 6 22 26 12
Total clients - 58 108 148 83
Discharge State Average - 10% 20% 18% 14%
State Admission FY17 FY18 FY19 FY20 FY21
Number of responses greater than 1 - 43 85 132 76
Total clients - 89 160 274 173
Admission State Average - 48% 53% 48% 44%
State Discharge
Number of responses greater than 1 - 13 14 20 10
Total clients - 58 108 148 83
Discharge State Average - 22% 13% 14% 12%
State Admission FY17 FY18 FY19 FY20 FY21
Number of clients who reported nights/times - 11 17 24 15
Total clients - 80 145 245 151
Admission State Average - 14% 12% 10% 10%
State Discharge
Number of clients who reported nights/times - 6 13 10 2
Total clients - 47 99 129 79
Discharge State Average - 13% 13% 8% 3%
State Admission FY17 FY18 FY19 FY20 FY21
Number of clients who reported nights/times - 22 37 55 51
Total clients - 78 144 252 150
Admission State Average - 28% 26% 22% 34%
State Discharge
Number of clients who reported nights/times - 13 28 23 8
Total clients - 48 98 126 80
Discharge State Average - 27% 29% 18% 10%
Emergency Department
Substance Disorder Screener
Crime/Violence Screener
Utilization of High Cost Services for PRTF Treatment Services
Illness, Injury, or Surgery
September 2021 | 291

APPENDIX C: YOUTH SUD TREATMENT SERVICE
State Admission FY17 FY18 FY19 FY20 FY21
Number of clients who reported nights/times - 21 34 51 37
Total clients - 80 144 245 146
Admission State Average - 26% 24% 21% 25%
State Discharge
Number of clients who reported nights/times - 15 20 23 9
Total clients - 50 98 128 77
Discharge State Average - 30% 20% 18% 12%
State Admission FY17 FY18 FY19 FY20 FY21
Number of clients who reported nights/times - 52 75 134 76
Total clients - 83 140 249 156
Admission State Average - 63% 54% 54% 49%
State Discharge
Number of clients who reported nights/times - 32 41 39 7
Total clients - 50 99 136 83
Discharge State Average - 64% 41% 29% 8%
State Admission FY17 FY18 FY19 FY20 FY21
Number of clients who reported nights/times - 82 133 229 137
Total clients - 95 160 274 172
Admission State Average - 86% 83% 84% 80%
State Discharge
Number of clients who reported nights/times - 59 103 145 75
Total clients - 62 108 150 84
Discharge State Average - 95% 95% 97% 89%
State Admission FY17 FY18 FY19 FY20 FY21
Number of clients who reported nights/times - 28 45 72 105
Total clients - 88 153 260 249
Admission State Average - 32% 29% 28% 42%
State Discharge
Number of clients who reported nights/times - 20 43 44 16
Total clients - 54 105 141 145
Discharge State Average - 37% 41% 31% 11%
Quality of Life Information for PRTF Treatment Services
General Health
Suicide Attempts
Correctional Facility
Hospital Admissions for Mental Health Care
September 2021 | 292

APPENDIX C: YOUTH SUD TREATMENT SERVICE
State Admission FY17 FY18 FY19 FY20 FY21
Number of clients who are employed - 83 89 135 146
Total clients - 744 742 985 1,097
Admission State Average - 11% 12% 14% 13%
State Discharge
Number of clients who are employed - 68 84 122 131
Total clients - 744 742 985 1,097
Discharge State Average - 9% 11% 12% 12%
State Admission FY17 FY18 FY19 FY20 FY21
Number of clients who are homeless - 1 1 4 4
Total clients - 281 235 228 208
Admission State Average - 0% 0% 2% 2%
State Discharge
Number of clients who are homeless - 3 3 0 1
Total clients - 281 235 228 208
Discharge State Average - 1% 1% 0% 0%
State Admission FY17 FY18 FY19 FY20 FY21
Number of clients who reported nights/times - 46 73 131 76
Total clients - 95 162 275 173
Admission State Average - 48% 45% 48% 44%
State Discharge
Number of clients who reported nights/times - 12 24 37 16
Total clients - 63 109 150 85
Discharge State Average - 19% 22% 25% 19%
State Admission FY17 FY18 FY19 FY20 FY21
Number of clients who reported nights/times - 22 19 27 23
Total clients - 121 108 147 88
Admission State Average - 18% 18% 18% 26%
State Discharge
Number of clients who reported nights/times - 113 96 128 85
Total clients - 125 105 143 89
Discharge State Average - 90% 91% 90% 96%
State Admission FY17 FY18 FY19 FY20 FY21
Number of clients who reported nights/times - 24 68 97 52
Total clients - 94 162 206 135
Admission State Average - 26% 42% 47% 39%
State Discharge
Number of clients who reported nights/times - 26 71 74 50
Motivation to Not Use Substances
Missing School/Work
Ability to Control Use
Homelessness
Employment Status
September 2021 | 293

APPENDIX C: YOUTH SUD TREATMENT SERVICE
Total clients - 62 109 113 71
Discharge State Average - 42% 65% 65% 70%
State Admission FY17 FY18 FY19 FY20 FY21
Number of clients who reported nights/times - 25 54 63 19
Total clients - 95 162 275 173
Admission State Average - 26% 33% 23% 11%
State Discharge
Number of clients who reported nights/times - 42 71 70 42
Total clients - 63 109 152 85
Discharge State Average - 67% 65% 46% 49%
State Admission FY17 FY18 FY19 FY20 FY21
Number of clients who were arrested - 112 83 76 71
Total clients - 281 235 228 208
Admission State Average - 40% 35% 33% 34%
State Discharge
Number of clients who were arrested - 25 15 23 26
Total clients - 281 235 228 208
Discharge State Average - 9% 6% 10% 13%
State Admission FY17 FY18 FY19 FY20 FY21
Number of clients who reported nights/times - 62 108 175 114
Total clients - 95 162 275 173
Admission State Average - 65% 67% 64% 66%
State Discharge
Number of clients who reported nights/times - 15 24 32 18
Total clients - 63 109 149 85
Discharge State Average - 24% 22% 21% 21%
Trouble as a Result of Substance Use
History of Arrest
Engagement in Treatment Services
Public Safety Information for PRTF Treatment Services
September 2021 | 294

APPENDIX C: YOUTH SUD TREATMENT SERVICE
Number who agree or strongly agree - 33 57 67 40
Total clients - 37 62 73 45
State Average - 89% 92% 92% 89%
State FY17 FY18 FY19 FY20 FY21
Number who agree or strongly agree - 30 49 62 40
Total clients - 34 58 74 46
State Average - 88% 84% 84% 87%
State FY17 FY18 FY19 FY20 FY21
Number who agree or strongly agree - 32 56 68 39
Total clients - 34 60 73 45
State Average - 94% 93% 93% 87%
State FY17 FY18 FY19 FY20 FY21
Number who agree or strongly agree - 23 45 59 36
Total clients - 29 60 73 45
State Average - 79% 75% 81% 80%
State FY17 FY18 FY19 FY20 FY21
Number who agree or strongly agree - 24 46 58 36
Total clients - 32 59 71 44
State Average - 75% 78% 82% 82%
State Admission FY17 FY18 FY19 FY20 FY21
Number who agree or strongly agree - 53 73 152 78
Total clients - 62 87 200 130
Admission State Average - 85% 84% 76% 60%
State Discharge
Number who agree or strongly agree - 34 50 71 39
Total clients - 37 54 76 47
Discharge State Average - 92% 93% 93% 83%
Impact of PRTF Treatment Services
General Satisfaction with Services
Social Connectedness
Participation in Treatment Planning
Outcome of Services
Cultural Sensitivity
Access to Services
September 2021 | 295

APPENDIX C: YOUTH SUD TREATMENT SERVICE
State Admission FY17 FY18 FY19 FY20 FY21
Number who agree or strongly agree - 186 46 107 62
Total clients - 303 84 200 129
Admission State Average - 61% 55% 54% 48%
State Discharge
Number who agree or strongly agree - 131 44 58 36
Total clients - 169 59 73 45
Discharge State Average - 78% 75% 79% 80%
State Admission FY17 FY18 FY19 FY20 FY21
Number of clients who reported nights/times - 10 7 19 12
Total clients - 62 85 190 113
Admission State Average - 16% 8% 10% 11%
State Discharge
Number of clients who reported nights/times - 3 6 5 0
Total clients - 30 53 59 40
Discharge State Average - 10% 11% 8% 0%
State Admission FY17 FY18 FY19 FY20 FY21
Number of clients who reported nights/times - 20 29 54 52
Total clients - 60 83 194 121
Admission State Average - 33% 35% 28% 43%
State Discharge
Number of clients who reported nights/times - 6 18 20 4
Total clients - 33 56 69 42
Discharge State Average - 18% 32% 29% 10%
State Admission FY17 FY18 FY19 FY20 FY21
Number of clients who reported nights/times - 17 20 38 34
Total clients - 62 83 186 113
Admission State Average - 27% 24% 20% 30%
State Discharge
Number of clients who reported nights/times - 10 16 11 3
Total clients - 31 55 60 40
Discharge State Average - 32% 29% 18% 8%
Emergency Department
Hospital Admissions for Mental Health Care
Utilization of High Cost Services for PRTF Treatment Services
Illness, Injury, or Surgery
Functioning
September 2021 | 296

APPENDIX C: YOUTH SUD TREATMENT SERVICE
State Admission FY17 FY18 FY19 FY20 FY21
Number of clients who reported nights/times - 42 45 102 64
Total clients - 62 81 187 121
Admission State Average - 68% 56% 55% 53%
State Discharge
Number of clients who reported nights/times - 17 23 12 3
Total clients - 34 56 66 40
Discharge State Average - 50% 41% 18% 8%
State Admission FY17 FY18 FY19 FY20 FY21
Number of clients who reported nights/times - 55 73 178 108
Total clients - 65 85 201 132
Admission State Average - 85% 86% 89% 82%
State Discharge
Number of clients who reported nights/times - 40 56 74 43
Total clients - 41 61 76 47
Discharge State Average - 98% 92% 97% 91%
State Admission FY17 FY18 FY19 FY20 FY21
Number of clients who reported nights/times - 19 22 41 85
Total clients - 62 81 181 182
Admission State Average - 31% 27% 23% 47%
State Discharge
Number of clients who reported nights/times - 11 18 12 4
Total clients - 34 57 63 41
Discharge State Average - 32% 32% 19% 10%
State Admission FY17 FY18 FY19 FY20 FY21
Number of clients who reported nights/times - 51 61 145 80
Total clients - 65 87 204 131
Admission State Average - 78% 70% 71% 61%
State Discharge
Number of clients who reported nights/times - 4 11 14 9
Total clients - 39 60 75 46
Discharge State Average - 10% 18% 19% 20%
Missing School/Work
Suicide Attempts
Quality of Life Information for PRTF Treatment Services
General Health
Correctional Facility
September 2021 | 297

APPENDIX C: YOUTH SUD TREATMENT SERVICE
State Admission FY17 FY18 FY19 FY20 FY21
Number of clients who reported nights/times - 5 7 7 7
Total clients - 77 64 73 46
Admission State Average - 6% 11% 10% 15%
State Discharge
Number of clients who reported nights/times - 58 47 61 41
Total clients - 74 62 72 45
Discharge State Average - 78% 76% 85% 91%
State Admission FY17 FY18 FY19 FY20 FY21
Number of clients who reported nights/times - 8 17 41 29
Total clients - 65 89 202 127
Admission State Average - 12% 19% 20% 23%
State Discharge
Number of clients who reported nights/times - 17 30 37 21
Total clients - 41 63 75 48
Discharge State Average - 41% 48% 49% 44%
State Admission FY17 FY18 FY19 FY20 FY21
Number of clients who reported nights/times - 35 52 81 43
Total clients - 65 87 205 137
Admission State Average - 54% 60% 40% 31%
State Discharge
Number of clients who reported nights/times - 28 46 36 22
Total clients - 41 62 76 47
Discharge State Average - 68% 74% 47% 47%
State Admission FY17 FY18 FY19 FY20 FY21
Number of clients who reported nights/times - 49 67 166 105
Total clients - 65 87 202 131
Admission State Average - 75% 77% 82% 80%
State Discharge
Number of clients who reported nights/times - 5 9 11 9
Total clients - 40 61 76 46
Discharge State Average - 13% 15% 14% 20%
Trouble as a Result of Substance Use
Public Safety Information for PRTF Treatment Services
Engagement in Treatment Services
Motivation to Not Use Substances
Ability to Control Use
September 2021 | 298

APPENDIX D: ADULT MENTAL HEALTH TREATMENT SERVICES
Clients Served*
Age FY17 FY18 FY19 FY20 FY21
18 and Below 5,291 5,887 5,732 5,950 5,516
19 to 64 10,317 10,555 10,568 10,377 10,145
65 and above 1,174 1,249 1,612 1,215 1,201
Clients Served Total 16,782 17,691 17,912 17,542 16,862
State Population*
Age FY17 FY18 FY19 FY20 FY21
18 and Below 215,498 214,808 217,912 216,741 217,233
19 to 64 511,483 513,102 520,520 515,756 516,927
65 and above 138,473 141,756 143,804 152,161 152,507
State Population 865,454 869,666 882,236 884,658 886,667
Clients Served*
Race FY17 FY18 FY19 FY20 FY21
White 12,151 12,514 12,718 12,612 12,198
Black or African American 497 516 537 550 539
American Indian and Alaska Native 2,677 2,969 3,045 2,916 2,888
Asian 111 128 125 123 116
Native Hawaiian and Other Pacific Islander 26 28 18 23 24
Two or More Races 756 935 1,074 683 530
Other 564 601 395 635 567
Clients Served Total 16,782 17,691 17,912 17,542 16,862
State Population*
Race FY17 FY18 FY19 FY20 FY21
White 737,366 738,346 749,018 748,422 750,120
Black or African American 17,309 18,263 18,527 20,347 20,393
American Indian and Alaska Native 78,756 78,270 79,401 79,619 79,800
Asian 12,981 13,045 13,234 13,270 13,300
Native Hawaiian and Other Pacific Islander 865 870 882 885 887
Two or More Races 19,905 20,872 21,174 22,116 22,167
Other - - - - -
State Population 865,454 869,666 882,236 884,659 886,667
* Demographic information includes both adult and youth individuals.
Appendix D: Adult Mental Health Treatment Services
State Information
June-May
September 2021 | 299

APPENDIX D: ADULT MENTAL HEALTH TREATMENT SERVICES
State Mental Health Disorders FY17 FY18 FY19 FY20 FY21
3,284 3,671 3,651 3,512 3,379
38% 40% 38% 37% 36%
751 800 810 732 713
9% 9% 8% 8% 8%
2,293 2,263 2,728 2,793 2,864
26% 25% 28% 30% 31%
1,371 1,408 1,389 1,342 1,345
16% 15% 14% 14% 14%
1,003 1,038 1,070 1,036 1,029
12% 11% 11% 11% 11%
Total 8,702 9,180 9,648 9,415 9,330
State FY17 FY18 FY19 FY20 FY21
Number who agree or strongly agree 2,939 1,558 2,701 2,835 1,045
Total clients 3,102 1,617 2,789 2,943 1,075
Agency Average 95% 96% 97% 96% 97%
National FY17 FY18 FY19 FY20 FY21
Number who agree or strongly agree 120,311 100,000 167,347 167,242 76,307
Total clients 136,253 110,132 185,735 186,863 84,692
State Average 88% 91% 90% 89% 90%
State FY17 FY18 FY19 FY20 FY21
Number who agree or strongly agree 2,917 2,042 2,659 2,783 1,022
Total clients 3,107 2,131 2,759 2,906 1,065
Agency Average 94% 96% 96% 96% 96%
National FY17 FY18 FY19 FY20 FY21
Number who agree or strongly agree 116,633 98,238 164,375 162,197 75,291
Total clients 136,253 110,132 185,735 186,863 84,692
State Average 86% 89% 88% 87% 89%
Number/Percent of Clients with Schizophrenia
Spectrum Disorder (Includes Schizoaffective Disorder)
Agency Mental Health Diagnosis
Number/Percent of Clients with Depressive Disorders
Number/Percent of Clients with Anxiety, Stress, and
Trauma Disorders (Includes Post Traumatic Stress
Disorder)
Number/Percent of Clients with Other Disorders
(Including Personality Disorders, etc.)
Number/Percent of Clients with Bipolar Disorders
Impact of CARE and IMPACT Services
General Satisfaction with Services
Access to Services
Treatment Program Outcomes for CARE and IMPACT Services
September 2021 | 300

APPENDIX D: ADULT MENTAL HEALTH TREATMENT SERVICES
State FY17 FY18 FY19 FY20 FY21
Number who agree or strongly agree 2,808 1,728 2,581 2,695 989
Total clients 3,002 2,073 2,686 2,829 1,028
Agency Average 94% 83% 96% 95% 96%
National
Number who agree or strongly agree 120,175 100,110 166,233 167,242 76,900
Total clients 136,253 110,132 185,735 186,863 84,692
State Average 88% 91% 90% 89% 91%
State FY17 FY18 FY19 FY20 FY21
Number who agree or strongly agree 2,072 1,493 1,909 2,027 719
Total clients 2,819 1,949 2,476 2,689 984
Agency Average 74% 77% 77% 75% 73%
National
Number who agree or strongly agree 93,333 91,189 149,331 140,894 67,415
Total clients 136,253 110,132 185,735 186,863 84,692
State Average 68% 83% 80% 75% 80%
State FY17 FY18 FY19 FY20 FY21
Number who agree or strongly agree 2,890 1,372 2,682 2,795 1,033
Total clients 3,096 1,439 2,793 2,937 1,075
Agency Average 93% 95% 96% 95% 96%
National
Number who agree or strongly agree 111,139 96,255 160,104 158,086 73,597
Total clients 136,253 110,132 185,735 186,863 84,692
State Average 81.6% 87% 86% 85% 87%
State Admission FY17 FY18 FY19 FY20 FY21
Number who agree or strongly agree 365 901 1,248 1,365 1,417
Total clients 600 1,478 1,861 2,217 2,326
Admission Average 61% 61% 67% 62% 61%
State First 6 month update
Number who agree or strongly agree 1,745 2,467 2,606 2,748 1,400
Total clients 2,275 3,260 3,358 3,696 1,925
First 6 month update Average 77% 76% 78% 74% 73%
State Most Recent update
Number who agree or strongly agree 692 1,745 2,217 2,316 809
Total clients 869 2,171 2,751 2,951 1,079
Most Recent Average 80% 80% 81% 78% 75%
National Average
Number who agree or strongly agree 101,372 86,784 142,273 141,642 67,076
Total clients 136,253 110,132 185,735 186,863 84,692
Quality and Appropriateness of Services
Outcome of Services
Participation in Treatment Planning
Social Connectedness
September 2021 | 301

APPENDIX D: ADULT MENTAL HEALTH TREATMENT SERVICES
National Average 74.4% 78.8% 76.6% 76% 79%
State Admission FY17 FY18 FY19 FY20 FY21
Number who agree or strongly agree 307 709 1,109 1,186 1,229
Total clients 578 1,466 1,899 2,209 2,320
Admission Average 53% 48% 58% 54% 53%
State First 6 month update
Number who agree or strongly agree 1,685 2,028 2,516 2,669 1,365
Total clients 2,269 3,256 3,392 3,696 1,928
First 6 month update Average 74% 62% 74% 72% 71%
State Most Recent update
Number who agree or strongly agree 659 1,422 2,131 2,237 782
Total clients 867 2,170 2,782 2,952 1,082
Most Recent Average 76% 66% 77% 76% 72%
National Average
Number who agree or strongly agree 100,555 86,454 142,273 142,015 68,092
Total clients 136,253 110,132 185,735 186,863 84,692
National Average 73.8% 78.5% 76.6% 76% 80%
State Admission FY17 FY18 FY19 FY20 FY21
Number of clients who reported nights/times 73 153 249 272 262
Total clients 738 1,451 2,043 2,201 2,303
Admission Average 10% 11% 12% 12% 11%
State First 6 month update
Number of clients who reported nights/times 26 317 325 324 151
Total clients 261 3,278 3,473 3,682 1,912
First 6 month update Average 10% 10% 9% 9% 8%
State Most Recent update
Number of clients who reported nights/times 209 189 261 210 69
Total clients 2,234 2,197 2,820 2,942 1,082
Most Recent Average 9% 9% 9% 7% 6%
State Admission FY17 FY18 FY19 FY20 FY21
Number of clients who reported nights/times 206 348 475 503 549
Total clients 740 1,457 2,053 2,223 2,334
Admission Average 28% 24% 23% 23% 24%
State First 6 month update
Number of clients who reported nights/times 37 305 343 385 228
Total clients 262 3,311 3,514 3,729 1,930
First 6 month update Average 14% 9% 10% 10% 12%
State Most Recent update
Functioning
Utilization of High Cost Treatment Services for CARE and IMPACT Services
Illness, Injury, or Surgery
Emergency Department
September 2021 | 302

APPENDIX D: ADULT MENTAL HEALTH TREATMENT SERVICES
Number of clients who reported nights/times 192 129 189 207 58
Total clients 2,252 2,206 2,844 2,967 1,085
Most Recent Average 9% 6% 7% 7% 5%
September 2021 | 303

APPENDIX D: ADULT MENTAL HEALTH TREATMENT SERVICES
State Admission FY17 FY18 FY19 FY20 FY21
Number of clients who reported nights/times 210 368 524 540 540
Total clients 736 1,455 2,047 2,206 2,309
Admission Average 29% 25% 26% 24% 23%
State First 6 month update
Number of clients who reported nights/times 51 268 318 356 224
Total clients 260 3,278 3,484 3,698 1,923
First 6 month update Average 20% 8% 9% 10% 12%
State Most Recent update
Number of clients who reported nights/times 166 120 187 183 56
Total clients 2,230 2,197 2,830 2,952 1,083
Most Recent Average 7% 5% 7% 6% 5%
State Admission FY17 FY18 FY19 FY20 FY21
Number of clients who reported nights/times 42 72 111 136 162
Total clients 745 1,466 2,055 2,222 2,332
Admission Average 6% 5% 5% 6% 7%
State First 6 month update
Number of clients who reported nights/times 15 59 68 79 68
Total clients 262 3,309 3,633 3,716 1,927
First 6 month update Average 6% 2% 2% 2% 4%
State Most Recent update
Number of clients who reported nights/times 45 24 33 48 15
Total clients 2,244 2,203 2,838 2,959 1,086
Most Recent Average 2% 1% 1% 2% 1%
State Admission
Number of clients who reported nights/times 47 90 146 179 178
Total clients 740 1,551 2,049 2,213 2,326
Admission Average 6% 6% 7% 8% 8%
State First 6 month update
Number of clients who reported nights/times 12 55 71 80 67
Total clients 261 3,349 3,492 3,699 1,918
First 6 month update Average 5% 2% 2% 2% 3%
State Most Recent update
Number of clients who reported nights/times 38 24 32 39 16
Total clients 2,242 2,224 2,829 2,955 1,085
Most Recent Average 2% 1% 1% 1% 1%
Hospital Admissions for Mental Health Care
Detoxification Services
Inpatient Substance Use Disorder Treatment Services
September 2021 | 304

APPENDIX D: ADULT MENTAL HEALTH TREATMENT SERVICES
State Admission
Number of clients who reported nights/times 235 307 452 490 505
Total clients 740 1,462 2,059 2,226 2,345
Admission Average 32% 21% 22% 22% 22%
State First 6 month update
Number of clients who reported nights/times 48 204 237 265 183
Total clients 261 3,315 3,526 3,729 1,934
First 6 month update Average 18% 6% 7% 7% 9%
State Most Recent update
Number of clients who reported nights/times 211 101 120 120 51
Total clients 2,251 2,211 2,845 2,960 1,082
Most Recent Average 9% 5% 4% 4% 5%
State Admission
Number of clients 347 835 1,204 1,312 1,364
Total clients 624 1,493 2,146 2,348 2,391
Admission Average 56% 56% 56% 56% 57%
State First 6 month update
Number of clients 149 1,983 2,100 2,261 1,172
Total clients 231 3,347 3,599 3,825 1,944
First 6 month update Average 65% 59% 58% 59% 60%
State Most Recent update
Number of clients 1,290 1,309 1,677 1,752 638
Total clients 2,146 2,217 2,883 3,017 1,089
Most Recent Average 60% 59% 58% 58% 59%
State Admission
Number of clients 121 218 312 374 407
Total clients 745 1,458 2,061 2,238 2,363
Admission Average 16% 15% 15% 17% 17%
State First 6 month update
Number of clients 29 176 202 229 153
Total clients 258 3,302 3,506 3,730 1,938
First 6 month update Average 11% 5% 6% 6% 8%
State Most Recent update
Number of clients 62 54 93 110 42
Total clients 2,250 2,206 2,846 2,963 1,086
Most Recent Average 3% 2% 3% 4% 4%
Correctional Facility
Quality of Life Information for CARE and IMPACT Services
General Health
Suicide Attempts
September 2021 | 305

APPENDIX D: ADULT MENTAL HEALTH TREATMENT SERVICES
State Admission
Number of clients who are employed 3,995 3,612 3,602 3,652 3,536
Total clients 11,138 11,306 11,150 11,037 10,874
Admission Average 36% 32% 32% 33% 33%
State First 6 month update
Number of clients who are employed 78 965 994 1,101 688
Total clients 230 3,370 3,629 3,861 1,954
First 6 month update Average 34% 29% 27% 29% 35%
State Most Recent update
Number of clients who are employed 562 538 701 772 369
Total clients 2,151 2,226 2,896 3,032 1,091
Most Recent Average 26% 24% 24% 25% 34%
National Average
Number of clients who are employed 205,435 146,157 168,322 165,840 183,368
Total clients 838,510 699,316 758,207 764,240 776,983
National Average 25% 21% 22% 22% 24%
State Admission
Number of clients who reported being homeless 422 394 407 404 365
Total clients 10,664 10,654 10,473 10,345 10,140
Admission Average 4% 4% 4% 4% 4%
State First 6 month update
Number of clients who reported being homeless 5 55 66 72 49
Total clients 231 3,380 3,616 3,849 1,950
First 6 month update Average 2% 2% 2% 2% 3%
State Most Recent update
Number of clients who reported being homeless 36 28 37 40 18
Total clients 2,154 2,224 2,886 3,027 1,090
Most Recent Average 2% 1% 1% 1% 2%
National Average
Number of clients who reported being homeless 185,220 204,448 212,934 216,194 208,974
Total clients 4,777,881 5,336,962 5,459,870 5,298,040 5,257,156
National Average 4% 4% 4% 4% 4%
Homelessness
Employment Status
September 2021 | 306

APPENDIX D: ADULT MENTAL HEALTH TREATMENT SERVICES
State Admission FY17 FY18 FY19 FY20 FY21
Number of clients who were arrested 167 137 183 231 255
Total clients 722 1,461 2,116 2,298 2,334
Admission Average 23% 9% 9% 10% 11%
State First 6 month update
Number of clients who were arrested 34 115 130 130 76
Total clients 252 3,278 3,550 3,780 1,881
First 6 month update Average 13% 4% 4% 3% 4%
State Most Recent update
Number of clients who were arrested 153 48 68 73 27
Total clients 2,235 2,199 2,867 2,998 1,045
Most Recent Average 7% 2% 2% 2% 3%
National Average
Number of clients who were arrested 188,000 220,083 218,395 36,939 N/A*
Total clients 4,700,000 5,502,082 5,459,870 1,195,050 N/A*
National Average 4% 4% 4% 3% N/A*
* This data was not released by SAMHSA by the time this report was compiled.
Public Safety Information for CARE and IMPACT Information
History of Arrest
September 2021 | 307

APPENDIX D: ADULT MENTAL HEALTH TREATMENT SERVICES
State FY17 FY18 FY19 FY20 FY21
Number who agree or strongly agree 2,741 2,144 2,545 2,648 1,007
Total clients 2,884 2,260 2,625 2,746 1,031
State Average 95% 95% 97% 96% 98%
State FY17 FY18 FY19 FY20 FY21
Number who agree or strongly agree 2,717 1,908 2,499 2,599 982
Total clients 2,891 1,991 2,592 2,708 1,021
State Average 94% 96% 96% 96% 96%
State FY17 FY18 FY19 FY20 FY21
Number who agree or strongly agree 2,612 1,614 2,424 2,514 950
Total clients 2,789 1,934 2,522 2,636 984
State Average 94% 83% 96% 95% 97%
State FY17 FY18 FY19 FY20 FY21
Number who agree or strongly agree 1,914 1,389 1,786 1,878 691
Total clients 2,621 1,822 2,331 2,510 944
State Average 73% 76% 77% 75% 73%
State FY17 FY18 FY19 FY20 FY21
Number who agree or strongly agree 2,698 1,285 2,526 2,616 993
Total clients 2,878 1,344 2,628 2,741 1,031
State Average 94% 96% 96% 95% 96%
State Admission
Number who agree or strongly agree 357 875 1,207 1,300 1,365
Total clients 589 1,442 1,808 2,129 2,258
Admission State Average 61% 61% 67% 61% 60%
State First 6 month update
Number who agree or strongly agree 1,615 2,293 2,421 2,544 1,335
Total clients 2,118 3,051 3,137 3,437 1,843
First 6 month update State Average 76% 75% 77% 74% 72%
State Most Recent update
Number who agree or strongly agree 639 1,625 2,074 2,149 773
Total clients 807 2,029 2,587 2,751 1,035
Most Recent State Average 79% 80% 80% 78% 75%
Social Connectedness
Impact of CARE Services
General Satisfaction with Services
Access to Services
Quality and Appropriateness of Services
Outcome of Services
Participation in Treatment Planning
September 2021 | 308

APPENDIX D: ADULT MENTAL HEALTH TREATMENT SERVICES
State Admission
Number who agree or strongly agree 298 685 1,068 1,120 1,177
Total clients 567 1,430 1,844 2,120 2,251
Admission State Average 53% 48% 58% 53% 52%
State First 6 month update
Number who agree or strongly agree 1,557 1,886 2,336 2,466 1,300
Total clients 2,112 3,047 3,168 3,437 1,848
First 6 month update State Average 74% 62% 74% 72% 70%
State Most Recent update
Number who agree or strongly agree 609 1,323 1,994 2,069 746
Total clients 804 2,028 2,618 2,755 1,038
Most Recent State Average 76% 65% 76% 75% 72%
State Admission
Number of clients who reported nights/times 72 150 247 266 255
Total clients 712 1,414 1,987 2,111 2,234
Admission State Average 10% 11% 12% 13% 11%
State First 6 month update
Number of clients who reported nights/times 25 300 303 298 145
Total clients 245 3,070 3,249 3,433 1,833
First 6 month update State Average 10% 10% 9% 9% 8%
State Most Recent update
Number of clients who reported nights/times 197 181 244 199 67
Total clients 2,082 2,051 2,648 2,745 1,038
Most Recent State Average 9% 9% 9% 7% 6%
State Admission FY17 FY18 FY19 FY20 FY21
Number of clients who reported nights/times 199 337 462 485 530
Total clients 714 1,422 1,998 2,136 2,269
Admission State Average 28% 24% 23% 23% 23%
State First 6 month update
Number of clients who reported nights/times 34 264 299 332 213
Total clients 246 3,100 3,284 3,471 1,850
First 6 month update State Average 14% 9% 9% 10% 12%
State Most Recent update
Number of clients who reported nights/times 170 112 163 180 54
Total clients 2,099 2,059 2,670 2,766 1,042
Most Recent State Average 8% 5% 6% 7% 5%
Functioning
Utilization of High Cost Services for CARE Services
Illness, Injury, or Surgery
Emergency Department
September 2021 | 309

APPENDIX D: ADULT MENTAL HEALTH TREATMENT SERVICES
State Admission FY17 FY18 FY19 FY20 FY21
Number of clients who reported nights/times 200 354 500 508 510
Total clients 712 1,422 1,995 2,119 2,244
Admission State Average 28% 25% 25% 24% 23%
State First 6 month update
Number of clients who reported nights/times 49 229 273 308 211
Total clients 244 3,075 3,263 3,448 1,845
First 6 month update State Average 20% 7% 8% 9% 11%
State Most Recent update
Number of clients who reported nights/times 140 104 155 163 51
Total clients 2,803 2,050 2,658 2,755 1,040
Most Recent State Average 5% 5% 6% 6% 5%
State Admission FY17 FY18 FY19 FY20 FY21
Number of clients who reported nights/times 41 69 108 131 157
Total clients 719 1,429 1,996 2,130 2,262
Admission State Average 6% 5% 5% 6% 7%
State First 6 month update
Number of clients who reported nights/times 15 55 61 69 64
Total clients 246 3,096 3,402 3,460 1,848
First 6 month update State Average 6% 2% 2% 2% 3%
State Most Recent update
Number of clients who reported nights/times 45 24 31 43 14
Total clients 2,091 2,056 2,665 2,757 1,042
Most Recent State Average 2% 1% 1% 2% 1%
State Admission FY17 FY18 FY19 FY20 FY21
Number of clients who reported nights/times 45 85 140 171 170
Total clients 714 1,510 1,992 2,123 2,258
Admission State Average 6% 6% 7% 8% 8%
State First 6 month update
Number of clients who reported nights/times 11 51 66 70 61
Total clients 245 3,135 3,265 3,446 1,839
First 6 month update State Average 4% 2% 2% 2% 3%
State Most Recent update
Number of clients who reported nights/times 35 21 32 34 16
Total clients 2,090 2,074 2,657 2,754 1,041
Most Recent State Average 2% 1% 1% 1% 2%
Hospital Admissions for Mental Health Care
Detoxification Services
Inpatient Substance Use Disorder Treatment Services
September 2021 | 310

APPENDIX D: ADULT MENTAL HEALTH TREATMENT SERVICES
State Admission FY17 FY18 FY19 FY20 FY21
Number of clients who reported nights/times 232 298 433 464 485
Total clients 715 1,426 2,000 2,133 2,274
Admission State Average 32% 21% 22% 22% 21%
State First 6 month update
Number of clients who reported nights/times 43 194 224 244 166
Total clients 245 3,104 3,296 3,472 1,855
First 6 month update State Average 18% 6% 7% 7% 9%
State Most Recent update
Number of clients who reported nights/times 205 94 114 109 46
Total clients 2,097 2,064 2,673 2,760 1,040
Most Recent State Average 10% 5% 4% 4% 4%
State Admission FY17 FY18 FY19 FY20 FY21
Number of clients 339 795 1,161 1,250 1,315
Total clients 613 1,440 2,084 2,250 2,320
Admission State Average 55% 55% 56% 56% 57%
State First 6 month update
Number of clients 142 1,822 1,939 2,077 1,113
Total clients 222 3,119 3,354 3,547 1,861
First 6 month update State Average 64% 58% 58% 59% 60%
State Most Recent update
Number of clients 1,182 1,207 1,557 1,610 609
Total clients 1,993 2,066 2,705 2,810 1,045
Most Recent State Average 59% 58% 58% 57% 58%
State Admission FY17 FY18 FY19 FY20 FY21
Number of clients 116 215 305 364 398
Total clients 718 1,423 2,002 2,146 2,292
Admission State Average 16% 15% 15% 17% 17%
State First 6 month update
Number of clients 29 158 180 202 143
Total clients 242 3,088 3,274 3,466 1,856
First 6 month update State Average 12% 5% 5% 6% 8%
State Most Recent update
Number of clients 55 49 85 102 39
Total clients 2,095 2,059 2,673 2,763 1,042
Most Recent State Average 3% 2% 3% 4% 4%
Correctional Facility
Quality of Life Information for CARE Services
General Health
Suicide Attempts
September 2021 | 311

APPENDIX D: ADULT MENTAL HEALTH TREATMENT SERVICES
State Admission FY17 FY18 FY19 FY20 FY21
Number of clients who are employed
Total clients
Admission State Average
State First 6 month update
Number of clients who are employed 76 918 954 1,055 673
Total clients 221 3,140 3,381 3,579 1,871
First 6 month update State Average 34% 29% 28% 29% 36%
State Most Recent update
Number of clients who are employed 531 507 678 741 357
Total clients 1,997 2,074 2,716 2,820 1,047
Most Recent State Average 27% 24% 25% 26% 34%
State Admission FY17 FY18 FY19 FY20 FY21
Number of clients who are homeless
Total clients
Admission State Average
State First 6 month update
Number of clients who are homeless 4 52 62 67 46
Total clients 222 3,150 3,369 3,570 1,868
First 6 month update State Average 2% 2% 2% 2% 2%
State Most Recent update
Number of clients who are homeless 33 26 31 36 17
Total clients 2,000 2,072 2,708 2,818 1,046
Most Recent State Average 2% 1% 1% 1% 2%
State Admission FY17 FY18 FY19 FY20 FY21
Number of clients who were arrested 163 132 174 217 245
Total clients 710 1,426 2,056 2,203 2,267
Admission State Average 23% 9% 8% 10% 11%
State First 6 month update
Number of clients who were arrested 32 2 121 115 75
Total clients 241 59 3,315 3,511 1,850
First 6 month update State Average 13% 3% 4% 3% 4%
State Most Recent update
Number of clients who were arrested 143 0 60 66 27
Total clients 2,078 0 2,691 2,790 1,037
Most Recent State Average 7% 0% 2% 2% 3%
Not reported by level of care
Not reported by level of care
Homelessness
Public Safety Information for CARE Services
History of Arrest
Not reported by level of care
Not reported by level of care
Not reported by level of care
Not reported by level of care
Employment Status
September 2021 | 312

APPENDIX D: ADULT MENTAL HEALTH TREATMENT SERVICES
State FY17 FY18 FY19 FY20 FY21
Number who agree or strongly agree 198 98 156 187 38
Total clients 218 106 164 197 44
State Average 91% 92% 95% 95% 86%
State FY17 FY18 FY19 FY20 FY21
Number who agree or strongly agree 200 134 160 184 40
Total clients 216 140 167 198 44
State Average 93% 96% 96% 93% 91%
State FY17 FY18 FY19 FY20 FY21
Number who agree or strongly agree 196 114 157 181 39
Total clients 213 139 164 193 44
State Average 92% 82% 96% 94% 89%
State FY17 FY18 FY19 FY20 FY21
Number who agree or strongly agree 158 104 123 149 28
Total clients 198 127 145 179 40
State Average 80% 82% 85% 83% 70%
State FY17 FY18 FY19 FY20 FY21
Number who agree or strongly agree 192 87 156 179 40
Total clients 218 95 165 196 44
State Average 88% 92% 95% 91% 91%
State Admission
Number who agree or strongly agree 8 26 41 65 52
Total clients 11 36 53 88 68
Admission State Average 73% 72% 77% 74% 76%
State First 6 month update
Number who agree or strongly agree 130 174 185 204 65
Total clients 157 209 221 259 82
First 6 month update State Average 83% 83% 84% 79% 79%
State Most Recent update
Number who agree or strongly agree 53 120 143 167 36
Total clients 62 142 164 200 44
Most Recent State Average 85% 85% 87% 84% 82%
Impact of IMPACT Services
General Satisfaction with Services
Access to Services
Quality and Appropriateness of Services
Outcome of Services
Participation in Treatment Planning
Social Connectedness
September 2021 | 313

APPENDIX D: ADULT MENTAL HEALTH TREATMENT SERVICES
State Admission
Number who agree or strongly agree 9 24 41 66 52
Total clients 11 36 55 89 69
Admission State Average 82% 67% 75% 74% 75%
State First 6 month update
Number who agree or strongly agree 128 142 180 203 65
Total clients 157 209 224 259 80
First 6 month update State Average 82% 68% 80% 78% 81%
State Most Recent update
Number who agree or strongly agree 50 99 137 168 36
Total clients 63 142 164 197 44
Most Recent State Average 79% 70% 84% 85% 82%
State Admission
Number of clients who reported nights/times 1 3 2 6 7
Total clients 26 37 56 90 69
Admission State Average 4% 8% 4% 7% 10%
State First 6 month update
Number of clients who reported nights/times 1 17 22 26 6
Total clients 16 208 224 249 79
First 6 month update State Average 6% 8% 10% 10% 8%
State Most Recent update
Number of clients who reported nights/times 12 8 17 11 2
Total clients 152 146 172 197 44
Most Recent State Average 8% 5% 10% 6% 5%
State Admission
Number of clients who reported nights/times 7 11 13 18 19
Total clients 26 35 55 87 65
Admission State Average 27% 31% 24% 21% 29%
State First 6 month update
Number of clients who reported nights/times 3 41 44 53 15
Total clients 16 211 230 258 80
First 6 month update State Average 19% 19% 19% 21% 19%
State Most Recent update
Number of clients who reported nights/times 22 17 26 27 4
Total clients 153 147 174 201 43
Most Recent State Average 14% 12% 15% 13% 9%
Functioning
Utilization of High Cost Services for IMPACT Services
Illness, Injury, or Surgery
Emergency Department
September 2021 | 314

APPENDIX D: ADULT MENTAL HEALTH TREATMENT SERVICES
State Admission
Number of clients who reported nights/times 10 14 24 32 30
Total clients 24 33 52 87 65
Admission State Average 42% 42% 46% 37% 46%
State First 6 month update
Number of clients who reported nights/times 2 39 45 48 13
Total clients 16 203 221 250 78
First 6 month update State Average 13% 19% 20% 19% 17%
State Most Recent update
Number of clients who reported nights/times 26 16 32 20 5
Total clients 147 147 172 197 43
Most Recent State Average 18% 11% 19% 10% 12%
State Admission
Number of clients who reported nights/times 1 3 3 5 5
Total clients 26 37 59 92 70
Admission State Average 4% 8% 5% 5% 7%
State First 6 month update
Number of clients who reported nights/times 0 4 7 10 4
Total clients 16 213 231 256 79
First 6 month update State Average 0% 2% 3% 4% 5%
State Most Recent update
Number of clients who reported nights/times 0 0 2 5 1
Total clients 153 147 173 202 44
Most Recent State Average 0% 0% 1% 2% 2%
State Admission
Number of clients who reported nights/times 2 5 6 8 8
Total clients 26 41 57 90 68
Admission State Average 8% 12% 11% 9% 12%
State First 6 month update
Number of clients who reported nights/times 1 4 5 10 6
Total clients 16 214 227 253 79
First 6 month update State Average 6% 2% 2% 4% 8%
State Most Recent update
Number of clients who reported nights/times 3 3 0 5 0
Total clients 152 150 172 201 44
Most Recent State Average 2% 2% 0% 2% 0%
Detoxification Services
Inpatient Substance Use Disorder Treatment Services
Hospital Admissions for Mental Health Care
September 2021 | 315

APPENDIX D: ADULT MENTAL HEALTH TREATMENT SERVICES
State Admission FY17 FY18 FY19 FY20 FY21
Number of clients who reported nights/times 3 9 19 26 20
Total clients 25 36 59 93 71
Admission State Average 12% 25% 32% 28% 28%
State First 6 month update
Number of clients who reported nights/times 5 10 13 21 17
Total clients 16 211 230 257 79
First 6 month update State Average 31% 5% 6% 8% 22%
State Most Recent update
Number of clients who reported nights/times 6 7 6 11 5
Total clients 154 147 172 200 42
Most Recent State Average 4% 5% 3% 6% 12%
State Admission FY17 FY18 FY19 FY20 FY21
Number of clients 8 25 43 62 49
Total clients 11 36 62 98 71
Admission State Average 73% 69% 69% 63% 69%
State First 6 month update
Number of clients 7 149 161 184 59
Total clients 9 214 245 278 83
First 6 month update State Average 78% 70% 66% 66% 71%
State Most Recent update
Number of clients who reported nights/times 108 98 120 142 29
Total clients 153 146 178 207 44
Most Recent State Average 71% 67% 67% 69% 66%
State Admission FY17 FY18 FY19 FY20 FY21
Number of clients 5 3 7 10 9
Total clients 27 35 59 92 71
Admission State Average 19% 9% 12% 11% 13%
State First 6 month update
Number of clients 0 18 22 27 10
Total clients 16 214 232 264 82
First 6 month update State Average 0% 8% 9% 10% 12%
State Most Recent update
Number of clients 7 5 8 8 3
Total clients 155 147 173 200 44
Most Recent State Average 5% 3% 5% 4% 7%
Correctional Facility
Quality of Life Information for IMPACT Services
General Health
Suicide Attempts
September 2021 | 316

APPENDIX D: ADULT MENTAL HEALTH TREATMENT SERVICES
State Admission FY17 FY18 FY19 FY20 FY21
Number of clients who are employed
Total clients
Admission State Average
State First 6 month update
Number of clients who are employed 2 38 40 46 15
Total clients 9 216 248 282 83
First 6 month update State Average 22% 18% 16% 16% 18%
State Most Recent update
Number of clients who are employed 31 27 23 31 12
Total clients 154 147 180 212 44
Most Recent State Average 20% 18% 13% 15% 27%
State Admission FY17 FY18 FY19 FY20 FY21
Number of clients who are homeless
Total clients
Admission State Average
State First 6 month update
Number of clients who are homeless 1 3 4 5 3
Total clients 9 216 247 279 82
First 6 month update State Average 11% 1% 2% 2% 4%
State Most Recent update
Number of clients who are homeless 3 2 6 4 1
Total clients 154 147 178 209 44
Most Recent State Average 2% 1% 3% 2% 2%
State Admission FY17 FY18 FY19 FY20 FY21
Number of clients who were arrested 4 5 9 14 10
Total clients 12 35 60 95 67
Admission State Average 33% 14% 15% 15% 15%
State First 6 month update
Number of clients who were arrested 2 8 9 15 1
Total clients 11 205 235 269 31
First 6 month update State Average 18% 4% 4% 6% 3%
State Most Recent update
Number of clients who were arrested 10 2 8 7 0
Total clients 157 146 176 208 8
Most Recent State Average 6% 1% 5% 3% 0%
Public Safety Information IMPACT Services
History of Arrest
Employment Status
Not reported by level of care
Not reported by level of care
Homelessness
Not reported by level of care
Not reported by level of care
Not reported by level of care
Not reported by level of care
September 2021 | 317

APPENDIX E: YOUTH MH TREATMENT SERVICES
Agency Clients Served*
Age FY17 FY18 FY19 FY20 FY21
18 and Below - 5,887 5,732 5,950 5,403
19 to 64 - 10,555 10,568 10,377 9,93865 and above - 1,249 1,612 1,215 1,177
Clients Served Total - 17,691 17,912 17,542 16,518
State Population*
Age FY17 FY18 FY19 FY20 FY21
18 and Below - 214,808 217,912 216,741 217,233
19 to 64 - 513,102 520,520 515,756 516,927
65 and above - 141,756 143,804 152,161 152,507
State Population - 869,666 882,236 884,658 886,667
Agency Clients Served*
Race FY17 FY18 FY19 FY20 FY21
White - 12,514 12,718 12,612 11,949
Black or African American - 516 537 550 528
American Indian and Alaska Native - 2,969 3,045 2,916 2,829
Asian - 128 125 123 114
Native Hawaiian and Other Pacific Islander - 28 18 23 24
Two or More Races - 935 1,074 683 519
Other - 601 395 635 555
Clients Served Total - 17,691 17,912 17,542 16,518
State Population*
Race FY17 FY18 FY19 FY20 FY21
White - 738,346 749,018 748,422 750,120
Black or African American - 18,263 18,527 20,347 20,393
American Indian and Alaska Native - 78,270 79,401 79,619 79,800
Asian - 13,045 13,234 13,270 13,300
Native Hawaiian and Other Pacific Islander - 870 882 885 887
Two or More Races - 20,872 21,174 22,116 22,167
Other - - - -State Population - 869,666 882,236 884,659 886,667
* Demographic information includes both adult and youth individuals.
Appendix E: Youth MH Treatment Services
June-May
State Information
September 2021 | 318

APPENDIX E: YOUTH MH TREATMENT SERVICES
State Mental Health Disorders FY17 FY18 FY19 FY20 FY21
617 791 831 784 765
11% 12% 13% 12% 13%
32 34 30 24 24
1% 1% 0% 0% 0%
3,156 3,655 3,822 3,935 3,881
57% 57% 59% 62% 64%
14 16 18 13 18
0% 0% 0% 0% 0%
25 21 17 17 18
0% 0% 0% 0% 0%
950 999 964 918 808
17% 16% 15% 14% 13%
598 685 652 569 467
11% 11% 10% 9% 8%
159 166 136 93 72
3% 3% 2% 1% 1%
Total 5551 6367 6470 6353 6053
State FY17 FY18 FY19 FY20 FY21
Number who agree or strongly agree - 156 347 419 295
Total clients - 170 380 459 325
State Average - 92% 91% 91% 91%
National
Number who agree or strongly agree - 39,045 67,209 97,061 37,651
Total clients - 44,269 77,341 109,922 42,210
National Average - 88% 87% 88% 89%
State FY17 FY18 FY19 FY20 FY21
Number who agree or strongly agree - 127 358 437 306
Total clients - 133 388 459 322
State Average - 95% 92% 95% 95%
National
Number who agree or strongly agree - 38,691 65,895 95,742 37,651
Total clients - 44,269 77,341 109,922 42,210
National Average - 87% 85% 87% 89%
Impact of CYF Treatment Services
Access to Services
General Satisfaction with Services
Number/Percent of youth with ADHD Disorders
Agency Mental Health Diagnosis
Number/Percent of Youth with Depressive Disorders
Number/Percent of youth with Other Disorders (Including
Personality Disorders etc.)
Number/Percent of youth with Anxiety, Trauma, and
Stress Disorders (Includes Post-Traumatic Stress Disorder)
Number/Percent of youth with Developmental Disorders
(Includes Asperger's Syndrome Disorders)
Number/Percent of youth with Schizophrenia Spectrum
Disorder ( Includes Schizoaffective Disorder)
Number/Percent of youth with Bipolar Disorders
Number/Percent of youth with Conduct and Impulse-
Control Disorders (Includes ODD)
September 2021 | 319

APPENDIX E: YOUTH MH TREATMENT SERVICES
State FY17 FY18 FY19 FY20 FY21
Number who agree or strongly agree - 154 361 425 298
Total clients - 162 377 445 312
State Average - 95% 96% 96% 96%
National
Number who agree or strongly agree - 41,303 71,850 103,106 39,931
Total clients - 44,269 77,341 109,922 42,210
National Average - 93% 93% 94% 95%
State FY17 FY18 FY19 FY20 FY21
Number who agree or strongly agree - 129 293 358 233
Total clients - 169 383 459 324
State Average - 76% 77% 78% 72%
National
Number who agree or strongly agree - 32,361 55,918 79,033 31,489
Total clients - 44,269 77,341 109,922 42,210
National Average - 73% 72.3% 72% 75%
State FY17 FY18 FY19 FY20 FY21
Number who agree or strongly agree - 154 348 406 288
Total clients - 169 380 459 325
State Average - 91% 92% 88% 89%
National
Number who agree or strongly agree - 39,222 67,364 97,342 37,736
Total clients - 44,269 77,341 109,992 42,210
National Average - 89% 87.1% 88% 89%
Cultural Sensitivity
Participation in Treatment Planning
Outcome of Services
September 2021 | 320

APPENDIX E: YOUTH MH TREATMENT SERVICES
State Admission FY17 FY18 FY19 FY20 FY21
Number who agree or strongly agree - 396 849 1,152 1,132
Total clients - 609 1,055 1,462 1,446
Admission State Average - 65% 80% 79% 78%
State First 6 month update
Number who agree or strongly agree - 455 630 766 762
Total clients - 600 725 890 874
First 6 month update State Average - 76% 87% 86% 87%
State Most Recent update
Number who agree or strongly agree - 131 347 416 286
Total clients - 167 388 462 327
Most Recent State Average - 78% 89% 90% 87%
National Average
Number who agree or strongly agree - 38,603 66,745 96,352 37,314
Total clients - 44,269 77,341 109,992 42,210
National Average - 87% 86% 88% 88%
State Admission FY17 FY18 FY19 FY20 FY21
Number who agree or strongly agree - 342 611 872 868
Total clients - 615 1,024 1,449 1,436
Admission State Average - 56% 60% 60% 60%
State First 6 month update
Number who agree or strongly agree - 421 511 623 612
Total clients - 607 708 883 869
First 6 month update State Average - 69% 72% 71% 70%
State Most Recent update
Number who agree or strongly agree - 129 293 359 235
Total clients - 169 384 460 324
Most Recent State Average - 76% 76% 78% 73%
National Average
Number who agree or strongly agree - 33,157 56,459 79,635 31,784
Total clients - 44,269 77,341 109,992 42,210
National Average - 75% 73.0% 72% 75%
Social Connectedness
Functioning
September 2021 | 321

APPENDIX E: YOUTH MH TREATMENT SERVICES
State Admission FY17 FY18 FY19 FY20 FY21
Number who agree or strongly agree - 386 818 1,131 1,118
Total clients - 503 1,024 1,414 1,392
Admission State Average - 77% 80% 80% 80%
State First 6 month update
Number who agree or strongly agree - 358 484 581 556
Total clients - 503 673 838 798
First 6 month update State Average - 71% 72% 69% 70%
State Most Recent update
Number who agree or strongly agree - 104 260 292 215
Total clients - 162 390 470 309
Most Recent State Average - 64% 67% 62% 70%
State Admission FY17 FY18 FY19 FY20 FY21
Number who agree or strongly agree - 359 729 1,015 1,013
Total clients - 502 1,017 1,413 1,392
Admission State Average - 72% 72% 72% 73%
State First 6 month update
Number who agree or strongly agree - 307 412 525 529
Total clients - 503 674 838 798
First 6 month update State Average - 61% 61% 63% 66%
State Most Recent update
Number who agree or strongly agree - 96 225 269 180
Total clients - 162 390 469 308
Most Recent State Average - 59% 58% 57% 58%
State Admission FY17 FY18 FY19 FY20 FY21
Number who agree or strongly agree - 62 127 174 149
Total clients - 499 1,015 1,411 1,390
Admission State Average - 12% 13% 12% 11%
State First 6 month update
Number who agree or strongly agree - 34 49 51 52
Total clients - 503 674 838 798
First 6 month update State Average - 7% 7% 6% 7%
State Most Recent update
Number who agree or strongly agree - 12 37 59 29
Total clients - 162 390 469 306
Most Recent State Average - 7% 9% 13% 9%
Externalizing Disorder Screener
Substance Disorder Screener
GAIN Short Screener (Gain-SS) Scoring
Internalizing Disorder Screener
September 2021 | 322

APPENDIX E: YOUTH MH TREATMENT SERVICES
State Admission FY17 FY18 FY19 FY20 FY21
Number who agree or strongly agree - 118 292 365 341
Total clients - 500 1,016 1,411 1,390
Admission State Average - 24% 29% 26% 25%
State First 6 month update
Number who agree or strongly agree - 79 135 164 152
Total clients - 502 673 838 797
First 6 month update State Average - 16% 20% 20% 19%
State Most Recent update
Number who agree or strongly agree - 31 65 78 54
Total clients - 162 390 469 306
Most Recent State Average - 19% 17% 17% 18%
State Admission FY17 FY18 FY19 FY20 FY21
Number of clients who reported nights/times - 39 71 100 75
Total clients - 153 1,046 1,435 1,423
Admission State Average - 25% 7% 7% 5%
State First 6 month update
Number of clients who reported nights/times - 21 33 34 34
Total clients - 80 708 868 866
First 6 month update State Average - 26% 5% 4% 4%
State Most Recent update
Number of clients who reported nights/times - 0 8 13 8
Total clients - 0 395 463 326
Most Recent State Average - 0% 2% 3% 2%
State Admission FY17 FY18 FY19 FY20 FY21
Number of clients who reported nights/times - 88 167 211 208
Total clients - 554 1,047 1,442 1,432
Admission State Average - 16% 16% 15% 15%
State First 6 month update
Number of clients who reported nights/times - 41 62 78 67
Total clients - 565 709 876 872
First 6 month update State Average - 7% 9% 9% 8%
State Most Recent update
Number of clients who reported nights/times - 0 37 28 18
Total clients - 159 393 464 325
Most Recent State Average - 0% 9% 6% 6%
Crime/Violence Screener
Utilization of High Cost Services for CYF Treatment Services
Illness, Injury, or Surgery
Emergency Department
September 2021 | 323

APPENDIX E: YOUTH MH TREATMENT SERVICES
State Admission FY17 FY18 FY19 FY20 FY21
Number of clients who reported nights/times - 81 149 165 191
Total clients - 548 1,047 1,439 1,432
Admission State Average - 15% 14% 11% 13%
State First 6 month update
Number of clients who reported nights/times - 42 63 63 53
Total clients - 566 707 867 866
First 6 month update State Average - 7% 9% 7% 6%
State Most Recent update
Number of clients who reported nights/times - 0 28 24 17
Total clients - 0 395 464 324
Most Recent State Average - 0% 7% 5% 5%
State Admission FY17 FY18 FY19 FY20 FY21
Number of clients who reported nights/times - 19 30 35 37
Total clients - 555 1,051 1,439 1,432
Admission State Average - 3% 3% 2% 3%
State First 6 month update
Number of clients who reported nights/times - 3 6 6 8
Total clients - 565 709 870 868
First 6 month update State Average - 1% 1% 1% 1%
State Most Recent update
Number of clients who reported nights/times - 0 3 4 4
Total clients - 196 397 463 325
Most Recent State Average - 0% 1% 1% 1%
State Admission FY17 FY18 FY19 FY20 FY21
Number of clients who reported nights/times - 43 84 93 90
Total clients - 140 1,065 1,456 1,449
Admission State Average - 31% 8% 6% 6%
State First 6 month update
Number of clients who reported nights/times - 15 19 28 32
Total clients - 37 710 875 871
First 6 month update State Average - 41% 3% 3% 4%
State Most Recent update
Number of clients who reported nights/times - 0 11 21 6
Total clients - 1 394 464 326
Most Recent State Average - 0% 3% 5% 2%
Correctional Facility
Inpatient Substance Use Disorder Treatment Services
Hospital Admissions for Mental Health Care
September 2021 | 324

APPENDIX E: YOUTH MH TREATMENT SERVICES
State Admission FY17 FY18 FY19 FY20 FY21
Number of clients who reported nights/times - 542 919 1,222 1,153
Total clients - 642 1,110 1,499 1,460
Admission State Average - 84% 83% 82% 79%
State First 6 month update
Number of clients who reported nights/times - 522 652 806 785
Total clients - 618 752 913 879
First 6 month update State Average - 84% 87% 88% 89%
State Most Recent update
Number of clients who reported nights/times - 153 356 423 286
Total clients - 171 401 476 329
Most Recent State Average - 89% 89% 89% 87%
State Admission FY17 FY18 FY19 FY20 FY21
Number of clients who reported nights/times - 114 226 283 286
Total clients - 556 1,058 1,447 1,436
Admission State Average - 21% 21% 20% 20%
State First 6 month update
Number of clients who reported nights/times - 59 82 90 93
Total clients - 565 706 870 867
First 6 month update State Average - 10% 12% 10% 11%
State Most Recent update
Number of clients who reported nights/times - 0 37 35 30
Total clients - 159 393 465 325
Most Recent State Average - 0% 9% 8% 9%
Suicide Attempts
Quality of Life Information for CYF Treatment Services
General Health
September 2021 | 325

APPENDIX E: YOUTH MH TREATMENT SERVICES
State Admission FY17 FY18 FY19 FY20 FY21
Number of clients who are employed
Total clients
Admission State Average
State First 6 month update
Number of clients who are employed - 110 103 114 114
Total clients - 610 754 917 881
First 6 month update State Average - 18% 14% 12% 13%
State Most Recent update
Number of clients who are employed - 33 72 76 53
Total clients - 171 402 476 330
Most Recent State Average - 19% 18% 16% 16%
State Admission FY17 FY18 FY19 FY20 FY21
Number of clients who are homeless - 0 4 1 0
Total clients - 6,063 6,213 6,110 5,682
Admission State Average - 0% 0% 0% 0%
State First 6 month update
Number of clients who are homeless - 0 1 0 0
Total clients - 621 753 912 876
First 6 month update State Average - 0% 0% 0% 0%
State Most Recent update
Number of clients who are homeless - 0 1 1 0
Total clients - 169 400 475 330
Most Recent State Average - 0% 0% 0% 0%
Not reported by level of care
Not reported by level of care
Employment Status
Homelessness
Not reported by level of care
September 2021 | 326

APPENDIX E: YOUTH MH TREATMENT SERVICES
State Admission FY17 FY18 FY19 FY20 FY21
Number of clients who were arrested - 1 49 68 59
Total clients - 30 1,094 1,488 1,454
Admission State Average - 3% 4% 5% 4%
State First 6 month update
Number of clients who were arrested - 0 15 21 15
Total clients - 4 748 912 871
First 6 month update State Average - 0% 2% 2% 2%
State Most Recent update
Number of clients who were arrested - 0 12 11 4
Total clients - 0 399 476 326
Most Recent State Average - 0% 3% 2% 1%
National Average
Number of clients who were arrested - 220,083 60,556 6,188 N/A*
Total clients - 5,502,082 2,018,517 454,838 N/A*
National Average - 4% 3% 1% N/A*
* This data was not released by SAMHSA by the time this report was compiled.
History of Arrest
Public Safety Information for CYF Treatment Services
September 2021 | 327

APPENDIX E: YOUTH MH TREATMENT SERVICES
State FY17 FY18 FY19 FY20 FY21
Number who agree or strongly agree - 217 676 791 525
Total clients - 224 700 832 548
State Average - 97% 97% 95% 96%
National
Number who agree or strongly agree - 39,045 67,209 97,122 37,651
Total clients - 44,269 77,341 109,992 42,210
National Average - 88% 87% 88% 89%
State FY17 FY18 FY19 FY20 FY21
Number who agree or strongly agree - 221 695 816 536
Total clients - 225 707 833 549
State Average - 98% 98% 98% 98%
National
Number who agree or strongly agree - 38,691 65,895 95,803 37,651
Total clients - 44,269 77,341 109,992 42,210
National Average - 87% 85% 87% 89%
State FY17 FY18 FY19 FY20 FY21
Number who agree or strongly agree - 177 685 801 516
Total clients - 198 691 810 524
State Average - 90% 99% 99% 98%
National
Number who agree or strongly agree - 41,303 71,850 103,172 39,931
Total clients - 44,269 77,341 109,992 42,210
National Average - 93% 93% 94% 95%
State FY17 FY18 FY19 FY20 FY21
Number who agree or strongly agree - 151 526 629 406
Total clients - 213 696 833 548
State Average - 71% 76% 76% 74%
National
Number who agree or strongly agree - 32,361 55,918 79,084 31,489
Total clients - 44,269 77,341 109,992 42,210
National Average - 73% 72% 72% 75%
Impact of CYF Treatment Services
General Satisfaction with Services
Access to Services
Outcome of Services
Cultural Sensitivity
September 2021 | 328

APPENDIX E: YOUTH MH TREATMENT SERVICES
State FY17 FY18 FY19 FY20 FY21
Number who agree or strongly agree - 214 675 798 518
Total clients - 221 696 828 541
State Average - 97% 97% 96% 96%
National
Number who agree or strongly agree - 39,222 67,364 97,342 37,736
Total clients - 44,269 77,341 109,992 42,210
National Average - 89% 87% 88% 89%
State Admission FY17 FY18 FY19 FY20 FY21
Number who agree or strongly agree - 784 1,861 2,566 2,586
Total clients - 908 2,131 2,973 2,970
Admission State Average - 86% 87% 86% 87%
State First 6 month update
Number who agree or strongly agree - 907 1,125 1,303 1,402
Total clients - 973 1,198 1,404 1,501
First 6 month update State Average - 93% 94% 93% 93%
State Most Recent update
Number who agree or strongly agree - 0 668 789 514
Total clients - 211 706 835 550
Most Recent State Average - 0% 95% 94% 93%
National Average
Number who agree or strongly agree - 38,603 66,745 96,352 37,314
Total clients - 44,269 77,341 109,992 42,210
National Average - 87% 86% 88% 88%
State Admission FY17 FY18 FY19 FY20 FY21
Number who agree or strongly agree - 571 984 1,816 1,873
Total clients - 881 1,681 2,913 2,923
Admission State Average - 65% 59% 62% 64%
State First 6 month update
Number who agree or strongly agree - 726 852 997 1,087
Total clients - 971 1,170 1,391 1,489
First 6 month update State Average - 75% 73% 72% 73%
State Most Recent update
Number who agree or strongly agree - 161 522 625 403
Total clients - 211 698 833 547
Most Recent State Average - 76% 75% 75% 74%
Functioning
Social Connectedness
Participation in Treatment Planning
September 2021 | 329

APPENDIX E: YOUTH MH TREATMENT SERVICES
National Average
Number who agree or strongly agree - 33,157 56,459 79,634 31,784
Total clients - 44,269 77,341 109,992 42,210
National Average - 75% 73% 72% 75%
September 2021 | 330

APPENDIX E: YOUTH MH TREATMENT SERVICES
State Admission FY17 FY18 FY19 FY20 FY21
Number of clients who reported nights/times - 40 79 115 105
Total clients - 914 2,169 2,975 2,993
Admission State Average - 4% 4% 4% 4%
State First 6 month update
Number of clients who reported nights/times - 18 20 36 35
Total clients - 968 1,207 1,399 1,493
First 6 month update State Average - 2% 2% 3% 2%
State Most Recent update
Number of clients who reported nights/times - 5 9 17 5
Total clients - 223 701 831 550
Most Recent State Average - 2% 1% 2% 1%
State Admission FY17 FY18 FY19 FY20 FY21
Number of clients who reported nights/times - 84 181 238 245
Total clients - 918 2,176 2,995 3,007
Admission State Average - 9% 8% 8% 8%
State First 6 month update
Number of clients who reported nights/times - 46 61 70 55
Total clients - 978 1,218 1,406 1,504
First 6 month update State Average - 5% 5% 5% 4%
State Most Recent update
Number of clients who reported nights/times - 3 32 38 16
Total clients - 221 707 836 553
Most Recent State Average - 1% 5% 5% 3%
State Admission FY17 FY18 FY19 FY20 FY21
Number of clients who reported nights/times - 94 187 213 246
Total clients - 917 2,173 2,980 3,003
Admission State Average - 10% 9% 7% 8%
State First 6 month update
Number of clients who reported nights/times - 32 45 55 55
Total clients - 970 1,209 1,403 1,495
First 6 month update State Average - 3% 4% 4% 4%
State Most Recent update
Number of clients who reported nights/times - 6 25 29 16
Total clients - 223 704 832 550
Most Recent State Average - 3% 4% 3% 3%
Emergency Department
Utilization of High Cost Services for CYF Treatment Services
Illness, Injury, or Surgery
Hospital Admissions for Mental Health Care
September 2021 | 331

APPENDIX E: YOUTH MH TREATMENT SERVICES
State Admission FY17 FY18 FY19 FY20 FY21
Number of clients who reported nights/times - 18 26 44 46
Total clients - 916 2,171 2,981 3,001
Admission State Average - 2% 1% 1% 2%
State First 6 month update
Number of clients who reported nights/times - 6 6 7 5
Total clients - 969 1,208 1,399 1,493
First 6 month update State Average - 1% 0% 1% 0%
State Most Recent update
Number of clients who reported nights/times - 1 3 4 5
Total clients - 222 703 831 549
Most Recent State Average - 0% 0% 0% 1%
State Admission FY17 FY18 FY19 FY20 FY21
Number of clients who reported nights/times - 38 75 99 76
Total clients - 922 2,185 2,998 3,012
Admission State Average - 4% 3% 3% 3%
State First 6 month update
Number of clients who reported nights/times - 14 19 28 25
Total clients - 975 1,214 1,402 1,498
First 6 month update State Average - 1% 2% 2% 2%
State Most Recent update
Number of clients who reported nights/times - 1 18 26 9
Total clients - 223 706 835 553
Most Recent State Average - 0% 3% 3% 2%
State Admission FY17 FY18 FY19 FY20 FY21
Number of clients who reported nights/times - 879 2,060 2,826 2,803
Total clients - 928 2,183 3,021 3,005
Admission State Average - 95% 94% 94% 93%
State First 6 month update
Number of clients who reported nights/times - 934 1,172 1,352 1,430
Total clients - 984 1,226 1,426 1,505
First 6 month update State Average - 95% 96% 95% 95%
State Most Recent update
Number of clients who reported nights/times - 216 684 807 196
Total clients - 225 707 846 201
Most Recent State Average - 96% 97% 95% 98%
Quality of Life Information for CYF Treatment Services
General Health
Inpatient Substance Use Disorder Treatment Services
Correctional Facility
September 2021 | 332

APPENDIX E: YOUTH MH TREATMENT SERVICES
State Admission FY17 FY18 FY19 FY20 FY21
Number of clients who reported nights/times - 68 152 180 193
Total clients - 952 2,149 2,957 2,962
Admission State Average - 7% 7% 6% 7%
State First 6 month update
Number of clients who reported nights/times - 34 49 52 52
Total clients - 961 1,207 1,395 1,489
First 6 month update State Average - 4% 4% 4% 3%
State Most Recent update
Number of clients who reported nights/times - 4 22 28 10
Total clients - 222 699 833 553
Most Recent State Average - 2% 3% 3% 2%
State Admission FY17 FY18 FY19 FY20 FY21
Number of clients who are employed
Total clients
Admission State Average
State First 6 month update
Number of clients who are employed - 63 70 79 81
Total clients - 1,103 1,231 1,433 1,515
First 6 month update State Average - 6% 6% 6% 5%
State Most Recent update
Number of clients who are employed - 15 53 49 29
Total clients - 266 713 849 554
Most Recent State Average - 6% 7% 6% 5%
Not reported by level of care
Not reported by level of care
Not reported by level of care
Suicide Attempts
Employment Status
September 2021 | 333

APPENDIX E: YOUTH MH TREATMENT SERVICES
State Admission FY17 FY18 FY19 FY20 FY21
Number of clients who are homeless - 0 0 1 1
Total clients - 6,063 6,213 6,110 5,834
Admission State Average - 0% 0% 0% 0%
State First 6 month update
Number of clients who are homeless - 2 1 3 0
Total clients - 985 1,228 1,432 1,510
First 6 month update State Average - 0% 0% 0% 0%
State Most Recent update
Number of clients who are homeless - 0 1 0 0
Total clients - 224 711 849 553
Most Recent State Average - 0% 0% 0% 0%
State Admission FY17 FY18 FY19 FY20 FY21
Number of clients who were arrested - 16 45 68 62
Total clients - 927 2,187 1,488 3,018
Admission State Average - 2% 2% 5% 2%
State First 6 month update
Number of clients who were arrested - 6 11 19 18
Total clients - 976 1,225 1,419 1,492
First 6 month update State Average - 1% 1% 1% 1%
State Most Recent update
Number of clients who were arrested - 3 18 18 4
Total clients - 223 707 846 199
Most Recent State Average - 1% 3% 2% 2%
National Average
Number of clients who were arrested - 220,083 60,556 6,188 N/A*
Total clients - 5,502,082 2,018,517 454,838 N/A*
National Average - 4% 3% 1% N/A*
* This data was not released by SAMHSA by the time this report was compiled.
History of Arrest
Homelessness
Public Safety Information for CYF Treatment Services
September 2021 | 334

APPENDIX F: TARGETED SERVICES FOR JUSTICE-INVOLVED ADULTS
State Population
Age FY17 FY18 FY19 FY20 FY21
18 and Below - - - - 6
19 to 64 - 2,780 2,674 2,152 3,111
65 and above - 14 8 8 8
State Population - 2,794 2,682 2,160 3,125
State Population
Race FY17 FY18 FY19 FY20 FY21
White 1,650 1,575 1,522 1,156 1,768
Black or African American 115 138 137 109 141
American Indian and Alaska Native 767 993 950 821 982
Asian 7 3 5 12 15
Native Hawaiian and Other Pacific Islander 10 9 9 5 5
Two or More Races 176 0 0 0 177
Other 64 76 79 57 76State Population 2,789 2,794 2,702 2,160 3,125
CBISA Discharge Reasons
State Average FY17 FY18 FY19 FY20 FY21
718 989 1,085 1,031 804
217 326 311 400 442
182 177 188 265 249
75 129 130 102 75
234 324 229 198 133
110 130 179 199 122
Total 1,536 2,075 2,122 2,195 1,825
CBISA Telehealth Discharge Reasons
State Average FY17 FY18 FY19 FY20 FY21
21 34 59 66 47
4 7 3 17 10
4 9 20 50 25
3 4 7 8 9
2 5 9 5 2
3 0 0 0 1
Total 37 59 98 146 94
Appendix F: Targeted Services for Justice-Involved Adults
State Information
June to May
Left Against Professional Advice
Treatment Completed
Treatment Completed
Left Against Professional Advice
Terminated by Facility
Incarcerated
Other
Terminated by Facility
Discharge Reasons for CBISA
Incarcerated
Transferred to Another Facility or Program
Transferred to Another Facility or Program
Other
September 2021 | 335

APPENDIX F: TARGETED SERVICES FOR JUSTICE-INVOLVED ADULTS
State Primary SUD Diagnosis FY17 FY18 FY19 FY20 FY21
- 794 776 792 955
- 35% 35% 35% 38%
- 423 399 350 335
- 19% 18% 16% 13%
- 890 867 950 1045
- 39% 39% 43% 41%
- 109 117 86 80
- 5% 5% 4% 3%
- 40 36 70 85
- 2% 2% 3% 3%
Total - 2256 2195 2233 2529
State FY17 FY18 FY19 FY20 FY21
Number who agree or strongly agree 287 171 586 617 406
Total clients 308 180 626 646 428
State Average 93% 95% 94% 96% 95%
State FY17 FY18 FY19 FY20 FY21
Number who agree or strongly agree 284 232 574 600 407
Total clients 305 237 624 641 429
State Average 93% 98% 92% 94% 95%
State FY17 FY18 FY19 FY20 FY21
Number who agree or strongly agree 285 226 570 609 408
Total clients 304 237 607 638 428
State Average 94% 95% 94% 95% 95%
State FY17 FY18 FY19 FY20 FY21
Number who agree or strongly agree 285 229 591 608 396
Total clients 307 240 628 645 425
State Average 93% 95% 94% 94% 93%
State FY17 FY18 FY19 FY20 FY21
Number who agree or strongly agree 264 218 585 611 404
Total clients 303 236 624 642 426
State Average 87% 92% 94% 95% 95%
Number/Percent of clients with a Primary Cannabis Use
Disorder
Number/Percent of clients with a Primary Amphetamine
Use Disorder
Number/Percent of clients with a Primary Opioid Use
Disorder
Number/Percent of clients with a Primary Other Use
Disorder
Participation in Treatment Planning
Outcome of Services
Quality and Appropriateness of Services
Access to Services
General Satisfaction with Services
Impact of CBISA
Primary Diagnostic Information for CBISA
Number/Percent of clients with a Primary Alcohol Use
Disorder
September 2021 | 336

APPENDIX F: TARGETED SERVICES FOR JUSTICE-INVOLVED ADULTS
State Admission FY17 FY18 FY19 FY20 FY21
Number who agree or strongly agree - 588 1,354 2,043 1,544
Total clients - 725 1,648 2,473 1,845
Admission State Average - 81% 82% 83% 84%
State Discharge
Number who agree or strongly agree 285 228 577 602 398
Total clients 316 244 636 657 435
Discharge State Average 90% 93% 91% 92% 91%
State Admission FY17 FY18 FY19 FY20 FY21
Number who agree or strongly agree - 607 1,398 2,088 1,564
Total clients - 726 1,657 2,490 1,852
Admission State Average - 84% 84% 84% 84%
State Discharge
Number who agree or strongly agree 295 233 605 623 407
Total clients 316 244 634 656 435
Discharge State Average 93% 95% 95% 95% 94%
State Admission FY17 FY18 FY19 FY20 FY21
Number of clients who reported nights/times - 47 65 103 67
Total clients - 705 1,608 2,411 1,824
Admission State Average - 7% 4% 4% 4%
State Discharge
Number of clients who reported nights/times - 11 30 21 6
Total clients - 243 628 648 434
Discharge State Average - 5% 5% 3% 1%
State Admission FY17 FY18 FY19 FY20 FY21
Number of clients who reported nights/times - 40 77 108 54
Total clients - 719 1,639 2,448 1,845
Admission State Average - 6% 5% 4% 3%
State Discharge
Number of clients who reported nights/times - 7 22 16 6
Total clients - 243 635 654 430
Discharge State Average - 3% 3% 2% 1%
Emergency Department
Illness, Injury, or Surgery
Functioning
Social Connectedness
Utilization of High Cost Services for CBISA
September 2021 | 337

APPENDIX F: TARGETED SERVICES FOR JUSTICE-INVOLVED ADULTS
State Admission FY17 FY18 FY19 FY20 FY21
Number of clients who reported nights/times - 33 63 78 53
Total clients - 707 1,616 2,417 1,827
Admission State Average - 5% 4% 3% 3%
State Discharge
Number of clients who reported nights/times - 4 5 7 2
Total clients - 244 627 649 84
Discharge State Average - 2% 1% 1% 2%
State Admission FY17 FY18 FY19 FY20 FY21
Number of clients who reported nights/times - 34 86 114 76
Total clients - 718 1,626 2,432 1,839
Admission State Average - 5% 5% 5% 4%
State Discharge
Number of clients who reported nights/times - 6 13 10 2
Total clients - 244 636 653 434
Discharge State Average - 2% 2% 2% 0%
State Admission FY17 FY18 FY19 FY20 FY21
Number of clients who reported nights/times - 55 115 153 96
Total clients - 742 1,609 2,407 1,827
Admission State Average - 7% 7% 6% 5%
State Discharge
Number of clients who reported nights/times - 5 10 6 7
Total clients - 243 626 647 433
Discharge State Average - 2% 2% 1% 2%
State Admission FY17 FY18 FY19 FY20 FY21
Number of clients who reported nights/times - 360 803 1,152 862
Total clients - 521 1,438 2,227 1,757
Admission State Average - 69% 56% 52% 49%
State Discharge
Number of clients who reported nights/times - 49 92 63 14
Total clients - 236 620 628 395
Discharge State Average - 21% 15% 10% 4%
Detoxification Services
Correctional Facility
Inpatient Substance Use Disorder Treatment Services
Hospital Admissions for Mental Health Care
September 2021 | 338

APPENDIX F: TARGETED SERVICES FOR JUSTICE-INVOLVED ADULTS
State Admission FY17 FY18 FY19 FY20 FY21
Number of clients who reported nights/times - 1,992 2,232 2,593 1,679
Total clients - 2,244 2,475 2,925 1,874
Admission State Average - 89% 90% 89% 90%
State Discharge
Number of clients who reported nights/times - 466 649 676 406
Total clients - 515 699 729 435
Discharge State Average - 90% 93% 93% 93%
State Admission FY17 FY18 FY19 FY20 FY21
Number of clients who reported nights/times - 49 116 189 104
Total clients - 719 1,639 2,470 1,847
Admission State Average - 7% 7% 8% 6%
State Discharge
Number of clients who reported nights/times - 38 15 13 3
Total clients - 440 632 651 430
Discharge State Average - 9% 2% 2% 1%
State Admission FY17 FY18 FY19 FY20 FY21
Number of clients who are employed 589 1,020 1,010 995 692
Total clients 1,245 2,118 2,114 2,217 1,882
Admission State Average 47% 48% 48% 45% 37%
State Discharge
Number of clients who are employed 710 1,365 1,421 1,351 1,152
Total clients 1,245 2,118 2,114 2,217 1,882
Discharge State Average 57% 64% 67% 61% 61%
State 6 Months Post-Treatment
Number of clients who are employed 90 172 143 103 57
Total clients 104 201 168 110 66
6 Months Post-Treatment State Average 87% 86% 85% 94% 86%
State Admission FY17 FY18 FY19 FY20 FY21
Number of clients who are homeless - 41 33 37 32
Total clients - 2,119 2,110 2,214 1,882
Admission State Average - 2% 2% 2% 2%
State Discharge
Number of clients who are homeless - 104 109 117 155
Total clients - 2,119 2,110 2,214 1,882
Discharge State Average - 5% 5% 5% 8%
Quality of Life Information for CBISA
Homelessness
Employment Status
Suicide Attempts
General Health
September 2021 | 339

APPENDIX F: TARGETED SERVICES FOR JUSTICE-INVOLVED ADULTS
State Admission FY17 FY18 FY19 FY20 FY21
Number of clients who reported nights/times - 261 256 335 175
Total clients - 2,239 2,325 2,807 1,830
Admission State Average - 12% 11% 12% 10%
State Discharge
Number of clients who reported nights/times - 16 15 16 11
Total clients - 518 666 699 427
Discharge State Average - 3% 2% 2% 3%
State Admission FY17 FY18 FY19 FY20 FY21
Number of clients who reported nights/times 871 520 396 364 227
Total clients 1,751 1,040 694 690 418
Admission State Average 50% 50% 57% 53% 54%
State Discharge
Number of clients who reported nights/times 1,746 999 704 694 421
Total clients 1,778 1,010 715 706 430
Discharge State Average 98% 99% 98% 98% 98%
State 6 Months Post-Treatment
Number of clients who reported nights/times 206 177 158 86 66
Total clients 216 203 168 89 68
6 Months Post-Treatment State Average 95% 87% 94% 97% 97%
State Admission FY17 FY18 FY19 FY20 FY21
Number of clients who reported nights/times - 1,488 1,921 2,248 1,186
Total clients - 2,219 2,478 2,905 1,538
Admission State Average - 67% 78% 77% 77%
State Discharge
Number of clients who reported nights/times - 437 636 670 404
Total clients - 514 707 726 435
Discharge State Average - 85% 90% 92% 93%
State 6 Months Post Treatment
Number of clients who reported nights/times - 139 140 84 63
Total clients - 202 161 89 68
6 Months Post Treatment State Average - 69% 87% 94% 93%
State Admission FY17 FY18 FY19 FY20 FY21
Number of clients who reported nights/times - 1,240 1,484 1,565 1,093
Total clients - 2,245 2,482 2,941 1,891
Admission State Average - 55% 60% 53% 58%
State Discharge
Number of clients who reported nights/times - 464 647 648 388
Total clients - 520 706 735 438
Engagement in Treatment Services
Motivation to Not Use Substances
Ability to Control Use
Missing School/Work
September 2021 | 340

APPENDIX F: TARGETED SERVICES FOR JUSTICE-INVOLVED ADULTS
Discharge State Average - 89% 92% 88% 89%
September 2021 | 341

APPENDIX F: TARGETED SERVICES FOR JUSTICE-INVOLVED ADULTS
State Admission FY17 FY18 FY19 FY20 FY21
Number of clients who were arrested 464 153 189 215 134
Total clients 898 2,118 2,116 2,217 1,882
Admission State Average 52% 7% 9% 10% 7%
State Discharge
Number of clients who were arrested - 502 430 389 190
Total clients - 2,118 2,116 2,217 1,882
Discharge State Average - 24% 20% 18% 10%
State Admission FY17 FY18 FY19 FY20 FY21
Number of clients who were arrested - 384 371 506 272
Total clients - 2,238 2,324 2,809 1,833
Admission State Average - 17% 16% 18% 15%
State Discharge
Number of clients who were arrested - 22 30 29 20
Total clients - 519 668 700 427
Discharge State Average - 4% 4% 4% 5%
State Average FY17 FY18 FY19 FY20 FY21
CBISA Trainings 3 3 3 2 3
Trouble as a Result of Substance Use
History of Arrest
Public Safety Information for CBISA
Curriculum Fidelity for CBISA
CBISA Curriculum Trainings
September 2021 | 342

APPENDIX F: TARGETED SERVICES FOR JUSTICE-INVOLVED ADULTS
MRT Discharge Reasons
State Average FY17 FY18 FY19 FY20 FY21
277 350 487 411 323
73 87 85 108 99
145 159 121 218 179
32 53 46 54 22
95 151 96 39 33
35 86 87 116 51
Total 657 886 922 946 707
MRT Telehealth Discharge Reasons
State Average FY17 FY18 FY19 FY20 FY21
6 9 37 15 20
2 7 2 6 4
1 5 20 18 12
2 6 0 3 1
0 0 2 3 1
1 1 0 0 1
Total 12 28 61 45 39
State FY17 FY18 FY19 FY20 FY21
Number who agree or strongly agree 109 74 273 334 153
Total clients 124 77 293 348 172
State Average 88% 96% 93% 96% 89%
State FY17 FY18 FY19 FY20 FY21
Number who agree or strongly agree 113 97 273 322 155
Total clients 127 105 293 348 171
State Average 89% 92% 93% 93% 91%
State FY17 FY18 FY19 FY20 FY21
Number who agree or strongly agree 109 96 270 324 155
Total clients 124 103 291 345 170
State Average 88% 93% 93% 94% 91%
State FY17 FY18 FY19 FY20 FY21
Number who agree or strongly agree 110 97 273 328 156
Total clients 123 103 293 350 170
State Average 89% 94% 93% 94% 92%
Incarcerated
Other
Impact of MRT
General Satisfaction with Services
Outcome of Services
Moral Reconation Therapy (MRT)
Discharge Reasons for MRT
Treatment Completed
Left Against Professional Advice
Terminated by Facility
Transferred to Another Facility or Program
Access to Services
Quality and Appropriateness of Services
Treatment Completed
Left Against Professional Advice
Terminated by Facility
Transferred to Another Facility or Program
Incarcerated
Other
September 2021 | 343

APPENDIX F: TARGETED SERVICES FOR JUSTICE-INVOLVED ADULTS
State FY17 FY18 FY19 FY20 FY21
Number who agree or strongly agree 105 65 271 326 152
Total clients 121 69 294 350 168
State Average 87% 94% 92% 93% 90%
State Admission FY17 FY18 FY19 FY20 FY21
Number who agree or strongly agree - 289 613 895 447
Total clients - 348 744 1,075 531
Admission State Average - 83% 82% 83% 84%
State Discharge
Number who agree or strongly agree 118 96 276 324 157
Total clients 131 105 301 354 176
Discharge State Average 90% 91% 92% 92% 89%
State Admission FY17 FY18 FY19 FY20 FY21
Number who agree or strongly agree - 287 612 905 451
Total clients - 350 746 1,076 532
Admission State Average - 82% 82% 84% 85%
State Discharge
Number who agree or strongly agree 120 101 281 337 165
Total clients 131 105 299 355 175
Discharge State Average 92% 96% 94% 95% 94%
State Average FY17 FY18 FY19 FY20 FY21
Pre-Test 20.2 16.7 16.4 16.6 16.7
Total Number of Responses 531 819 838 834 383
Post-Test 18.5 15.8 15.3 15.2 14.8
Total Number of Responses 171 284 341 314 140
State Average FY17 FY18 FY19 FY20 FY21
Pre-Test 17.9 18.2 17.8 17.9 18.0
Total Number of Responses 531 819 838 834 383
Post-Test 16.1 16.5 16.1 16.1 15.9
Total Number of Responses 171 284 341 314 140
Entitlement
Participation in Treatment Planning
Social Connectedness
Functioning
Justification
TCU Criminal Thinking Sub-Scales from Pre-Test to Post-Test
September 2021 | 344

APPENDIX F: TARGETED SERVICES FOR JUSTICE-INVOLVED ADULTS
State Average FY17 FY18 FY19 FY20 FY21
Pre-Test 18.4 21.9 21.5 21.5 21.1
Total Number of Responses 531 819 838 834 383
Post-Test 16.6 20.0 19.6 19.3 19.0
Total Number of Responses 171 284 341 314 140
State Average FY17 FY18 FY19 FY20 FY21
Pre-Test 21.6 24.5 24.5 24.3 24.8
Total Number of Responses 531 819 383 834 383
Post-Test 19.9 23.5 23.2 23.0 24.4
Total Number of Responses 171 284 341 314 140
State Average FY17 FY18 FY19 FY20 FY21
Pre-Test 23.9 23.7 23.3 23.5 24.1
Total Number of Responses 531 819 838 834 383
Post-Test 23.1 21.7 22.0 21.1 21.7
Total Number of Responses 171 284 341 314 140
State Average FY17 FY18 FY19 FY20 FY21
Pre-Test 23.3 19.1 19.1 19.1 19.2
Total Number of Responses 531 819 838 834 383
Post-Test 21.4 17.2 17.3 16.7 16.8
Total Number of Responses 171 284 341 314 140
State Admission FY17 FY18 FY19 FY20 FY21
Number of clients who reported nights/times - 29 40 38 22
Total clients - 336 736 1,058 528
Admission State Average - 9% 5% 4% 4%
State Discharge
Number of clients who reported nights/times - 6 12 17 6
Total clients - 105 299 350 172
Discharge State Average - 6% 4% 5% 3%
State Admission FY17 FY18 FY19 FY20 FY21
Number of clients who reported nights/times - 19 31 51 19
Total clients - 345 746 1,075 526
Admission State Average - 6% 4% 5% 4%
State Discharge
Number of clients who reported nights/times - 6 11 16 5
Emergency Department
Criminal Rationalization
Illness, Injury, or Surgery
Power Orientation
Cold Heartedness
Personal Irresponsibility
Utilization of High Cost Services for MRT
September 2021 | 345

APPENDIX F: TARGETED SERVICES FOR JUSTICE-INVOLVED ADULTS
Total clients - 104 300 347 173
Discharge State Average - 6% 4% 5% 3%
State Admission FY17 FY18 FY19 FY20 FY21
Number of clients who reported nights/times - 12 23 26 12
Total clients - 338 738 1,060 526
Admission State Average - 4% 3% 2% 2%
State Discharge
Number of clients who reported nights/times - 7 6 4 4
Total clients - 69 302 350 172
Discharge State Average - 10% 2% 1% 2%
State Admission FY17 FY18 FY19 FY20 FY21
Number of clients who reported nights/times - 27 34 48 17
Total clients - 339 743 1,068 527
Admission State Average - 8% 5% 4% 3%
State Discharge
Number of clients who reported nights/times - 4 6 4 2
Total clients - 105 303 350 172
Discharge State Average - 4% 2% 1% 1%
State Admission FY17 FY18 FY19 FY20 FY21
Number of clients who reported nights/times - 22 35 63 14
Total clients - 337 735 1,056 525
Admission State Average - 7% 5% 6% 3%
State Discharge
Number of clients who reported nights/times - 2 3 2 1
Total clients - 105 302 349 172
Discharge State Average - 2% 1% 1% 1%
State Admission FY17 FY18 FY19 FY20 FY21
Number of clients who reported nights/times - 208 332 475 172
Total clients - 295 674 1,016 519
Admission State Average - 71% 49% 47% 33%
State Discharge
Number of clients who reported nights/times - 25 44 48 12
Total clients - 102 389 340 171
Discharge State Average - 25% 11% 14% 7%
Detoxification Services
Hospital Admissions for Mental Health Care
Inpatient Substance Use Disorder Treatment Services
Correctional Facility
September 2021 | 346

APPENDIX F: TARGETED SERVICES FOR JUSTICE-INVOLVED ADULTS
State Admission FY17 FY18 FY19 FY20 FY21
Number of clients who reported nights/times - 877 984 1,092 458
Total clients - 1,032 1,160 1,274 535
Admission State Average - 85% 85% 86% 86%
State Discharge
Number of clients who reported nights/times - 232 321 349 162
Total clients - 277 348 386 176
Discharge State Average - 84% 92% 90% 92%
State Admission FY17 FY18 FY19 FY20 FY21
Number of clients who reported nights/times - 34 57 82 36
Total clients - 342 744 1,075 527
Admission State Average - 10% 8% 8% 7%
State Discharge
Number of clients who reported nights/times - 3 6 12 2
Total clients - 105 302 350 173
Discharge State Average - 3% 2% 3% 1%
State Admission FY17 FY18 FY19 FY20 FY21
Number of clients who are employed - 134 566 551 290
Total clients - 281 900 981 572
Admission State Average - 48% 63% 56% 51%
State Discharge
Number of clients who are employed - 165 643 655 395
Total clients - 281 900 981 572
Discharge State Average - 59% 71% 67% 69%
State Admission FY17 FY18 FY19 FY20 FY21
Number of clients who are homeless - 17 13 23 16
Total clients - 992 893 981 658
Admission State Average - 2% 1% 2% 2%
State Discharge
Number of clients who are homeless - 25 16 25 30
Total clients - 992 893 981 658
Discharge State Average - 3% 2% 3% 5%
Quality of Life Information for MRT
Homelessness
Employment Status
Suicide Attempts
General Health
September 2021 | 347

APPENDIX F: TARGETED SERVICES FOR JUSTICE-INVOLVED ADULTS
State Admission FY17 FY18 FY19 FY20 FY21
Number of clients who reported nights/times - 109 106 118 39
Total clients - 1,026 1,015 1,158 488
Admission State Average - 11% 10% 10% 8%
State Discharge
Number of clients who reported nights/times - 9 7 10 3
Total clients - 277 310 358 165
Discharge State Average - 3% 2% 3% 2%
State Admission FY17 FY18 FY19 FY20 FY21
Number of clients who reported nights/times - 278 204 187 99
Total clients - 558 338 356 164
Admission State Average - 50% 60% 53% 60%
State Discharge
Number of clients who reported nights/times - 541 342 376 171
Total clients - 543 345 381 174
Discharge State Average - 100% 99% 99% 98%
State Admission FY17 FY18 FY19 FY20 FY21
Number of clients who reported nights/times - 721 913 992 314
Total clients - 1,024 1,170 1,269 371
Admission State Average - 70% 78% 78% 85%
State Discharge
Number of clients who reported nights/times - 249 330 362 171
Total clients - 275 350 387 179
Discharge State Average - 91% 94% 94% 96%
State Admission FY17 FY18 FY19 FY20 FY21
Number of clients who reported nights/times - 595 574 599 327
Total clients - 1,030 1,164 1,280 538
Admission State Average - 58% 49% 47% 61%
State Discharge
Number of clients who reported nights/times - 245 314 345 153
Total clients - 276 350 390 176
Discharge State Average - 89% 90% 88% 87%
Engagement in Treatment Services
Motivation to Not Use Substances
Ability to Control Use
Missing School/Work
September 2021 | 348

APPENDIX F: TARGETED SERVICES FOR JUSTICE-INVOLVED ADULTS
State Admission FY17 FY18 FY19 FY20 FY21
Number of clients who were arrested - 101 107 111 27
Total clients - 940 893 995 572
Admission State Average - 11% 12% 11% 5%
State Discharge
Number of clients who were arrested - 221 154 103 53
Total clients - 940 893 995 572
Discharge State Average - 24% 17% 10% 9%
State Admission FY17 FY18 FY19 FY20 FY21
Number of clients who reported nights/times - 183 186 207 66
Total clients - 1,030 1,019 1,162 488
Admission State Average - 18% 18% 18% 14%
State Discharge
Number of clients who reported nights/times - 14 16 16 6
Total clients - 277 312 358 165
Discharge State Average - 5% 5% 4% 4%
State Average FY17 FY18 FY19 FY20 FY21
MRT Training 1 2 2 1 2
Advanced MRT Trainings 1 2 2 1 1
State Average FY17 FY18 FY19 FY20 FY21
State Average Score 79% 91% 90% 88% -
QA Reviews for the MRT Curriculum
Trouble as a Result of Substance Use
History of Arrest
Public Safety Information for MRT
Curriculum Fidelity for MRT
MRT Curriculum Trainings
September 2021 | 349

APPENDIX F: TARGETED SERVICES FOR JUSTICE-INVOLVED ADULTS
9
September 2021 | 350

APPENDIX G: TARGETED SERVICES FOR JUSTICE-INVOLVED YOUTH
Clients Served
Services FY17 FY18 FY19 FY20 FY21
FFT 755 714 655 480 433
ART 29 118 93 94 58
ART Telehealth - - 10 12 19
MRT 75 248 259 295 263
MRT Telehealth - 13 28 29 44
Adolescent EBP - - - 65 88
Adolescent EBP Telehealth - - - 19 5
Clients Served Total 859 1,080 1,007 869 754
State Population
Referrals FY17 FY18 FY19 FY20 FY21
UJS 382 423 549 466 276
DOC 132 127 158 141 141
Other 471 550 415 374 430
Total Referrals Received 985 1,100 1,122 981 847
Clients Served
Race FY17 FY18 FY19 FY20 FY21
White 550 637 624 543 529
Black or African American 44 73 79 54 56
American Indian and Alaska Native 185 274 221 218 137
Asian 4 8 6 8 4
Native Hawaiian and Other Pacific Islander 0 4 2 1 1
Two or More Races 41 42 36 14 7
Other 35 42 39 31 20Clients Served Total 859 1,080 1,007 869 754
Completion Rates:
State FY17 FY18 FY19 FY20 FY21
Number of clients who completed 346 353 308 199 196
Total clients 552 522 435 341 319
State Average 63% 68% 71% 58% 61%
Program Outcome Tools:
State Average FY17 FY18 FY19 FY20 FY21
353 308 199 196
93% 344 302 192 192
93% 338 289 191 187
76% 286 254 161 164
Completion Outcomes - Total Completers
Living at Home
In School/Working
No New Violations
Appendix G: Targeted Services for Justice Involved-Youth
State Information
June - May
Demographic Information
Discharge Reasons for FFT
September 2021 | 351

APPENDIX G: TARGETED SERVICES FOR JUSTICE-INVOLVED YOUTH
Therapist Outcome Measure (TOM) -Completed Services
State Average FY17 FY18 FY19 FY20 FY21
General Change
226 318 272 176 188
Number of therapists with TOM-Completed 246 344 302 192 208
Communication Skills
229 311 272 177 191
Number of therapists with TOM-Completed 246 344 302 192 208
Adolescent Behavior
221 299 254 164 169
Number of therapists with TOM-Completed 246 344 302 192 208
Parenting Skills
221 312 268 172 177
Number of therapists with TOM-Completed 246 344 302 192 208
Supervision Levels
208 295 260 163 154
Number of therapists with TOM-Completed 246 344 302 192 208
Levels of Conflict
224 310 266 170 181
Number of therapists with TOM-Completed 246 344 302 192 208
Number of therapists who reported a 3 or greater
Number of therapists who reported a 3 or greater
Number of therapists who reported a 3 or greater
Number of therapists who reported a 3 or greater
Number of therapists who reported a 3 or greater
Number of therapists who reported a 3 or greater
September 2021 | 352

APPENDIX G: TARGETED SERVICES FOR JUSTICE-INVOLVED YOUTH
Therapist Outcome Measure (TOM) -Attempted Services
State Average FY17 FY18 FY19 FY20 FY21
General Change
76 37 43 34 32
Number of therapists with TOM-Completed 219 219 220 209 181
75 38 42 28 31
Number of therapists with TOM-Completed 219 219 220 209 181
59 36 36 28 25
Number of therapists with TOM-Completed 219 219 220 209 181
68 36 41 25 27
Number of therapists with TOM-Completed 219 219 220 209 181
59 35 36 24 25
Number of therapists with TOM-Completed 219 219 220 209 181
76 38 46 34 27
Number of therapists with TOM-Completed 219 219 220 209 181
State FY17 FY18 FY19 FY20 FY21
Number who agree or strongly agree - 60 118 79 32
Total clients - 71 131 92 38
State Average - 85% 90% 86% 84%
State FY17 FY18 FY19 FY20 FY21
Number who agree or strongly agree - 59 115 78 36
Total clients - 72 129 92 38
State Average - 82% 89% 85% 95%
State FY17 FY18 FY19 FY20 FY21
Number who agree or strongly agree - 67 119 80 34
Total clients - 71 127 90 37
State Average - 94% 94% 89% 92%
State FY17 FY18 FY19 FY20 FY21
Number who agree or strongly agree - 56 107 72 31
Total clients - 71 128 93 38
State Average - 79% 84% 77% 82%
Supervision Levels
Number of therapists who reported a 3 or greater
Number of therapists who reported a 3 or greater
General Satisfaction with Services
Access to Services
Cultural Sensitivity
Outcome of Services
Number of therapists who reported a 3 or greater
Adolescent Behavior
Number of therapists who reported a 3 or greater
Communication Skills
Levels of Conflict
Number of therapists who reported a 3 or greater
Impact of FFT
Parenting Skills
Number of therapists who reported a 3 or greater
September 2021 | 353

APPENDIX G: TARGETED SERVICES FOR JUSTICE-INVOLVED YOUTH
State FY17 FY18 FY19 FY20 FY21
Number who agree or strongly agree - 56 109 70 30
Total clients - 70 131 91 38
State Average - 80% 83% 77% 79%
State Admission FY17 FY18 FY19 FY20 FY21
Number who agree or strongly agree - 123 276 196 142
Total clients - 157 324 247 183
Admission State Average - 78% 85% 79% 78%
State Discharge
Number who agree or strongly agree - 64 116 79 34
Total clients - 72 129 94 38
Discharge State Average - 89% 90% 84% 89%
State Admission FY17 FY18 FY19 FY20 FY21
Number who agree or strongly agree - 98 221 162 118
Total clients - 156 319 245 182
Admission State Average - 63% 69% 66% 65%
State Discharge
Number who agree or strongly agree - 56 107 72 31
Total clients - 70 128 93 38
Discharge State Average - 80% 84% 77% 82%
State Admission FY17 FY18 FY19 FY20 FY21
Number of responses greater than 1 - 77 223 163 122
Total clients - 110 336 250 165
Admission State Average - 70% 66% 65% 74%
State Discharge
Number of responses greater than 1 - 33 67 50 17
Total clients - 60 137 96 30
Discharge State Average - 55% 49% 52% 57%
State Admission FY17 FY18 FY19 FY20 FY21
Number of responses greater than 1 - 66 207 164 117
Total clients - 110 336 250 165
Admission State Average - 60% 62% 66% 71%
State Discharge
Number of responses greater than 1 - 29 69 56 16
Total clients - 60 137 96 30
Discharge State Average - 48% 50% 58% 53%
GAIN Short Screener (Gain-SS) Scoring
Participation in Treatment Planning
Social Connectedness
Functioning
Internalizing Disorder Screener
Externalizing Disorder Screener
September 2021 | 354

APPENDIX G: TARGETED SERVICES FOR JUSTICE-INVOLVED YOUTH
State Admission FY17 FY18 FY19 FY20 FY21
Number of responses greater than 1 - 13 46 40 30
Total clients - 110 336 250 165
Admission State Average - 12% 14% 16% 18%
State Discharge
Number of responses greater than 1 - 5 7 11 1
Total clients - 60 137 96 30
Discharge State Average - 8% 5% 11% 3%
State Admission FY17 FY18 FY19 FY20 FY21
Number of responses greater than 1 - 24 83 80 47
Total clients - 110 336 250 165
Admission State Average - 22% 25% 32% 28%
State Discharge
Number of responses greater than 1 - 6 28 18 7
Total clients - 60 137 96 30
Discharge State Average - 10% 20% 19% 23%
Client Outcome Measure- Adolescent:
State Average FY17 FY18 FY19 FY20 FY21
General Change
266 305 252 169 147
Number of clients with COM-Adolescent 309 337 299 189 174
Communication Skills
255 300 237 163 147
Number of clients with COM-Adolescent 309 337 299 189 174
Adolescent Behavior
266 291 248 166 144
Number of clients with COM-Adolescent 309 337 299 189 174
Parenting Skills
248 289 236 165 140
Number of clients with COM-Adolescent 309 337 299 189 174
Supervision Levels
247 272 238 160 129
Number of clients with COM-Adolescent 309 337 299 189 174
Levels of Conflict
261 288 242 161 146
Number of clients with COM-Adolescent 309 337 299 189 174
Number of clients who reported a 3 or greater
Number of clients who reported a 3 or greater
Substance Disorder Screener
Crime/Violence Screener
Number of clients who reported a 3 or greater
Number of clients who reported a 3 or greater
Number of clients who reported a 3 or greater
Number of clients who reported a 3 or greater
September 2021 | 355

APPENDIX G: TARGETED SERVICES FOR JUSTICE-INVOLVED YOUTH
State Admission FY17 FY18 FY19 FY20 FY21
Number of clients who reported nights/times - 9 28 21 14
Total clients - 126 332 241 173
Admission State Average - 7% 8% 9% 8%
State Discharge
Number of clients who reported nights/times - 6 7 1 0
Total clients - 70 130 92 38
Discharge State Average - 9% 5% 1% 0%
State Admission FY17 FY18 FY19 FY20 FY21
Number of clients who reported nights/times - 13 56 47 39
Total clients - 127 329 244 182
Admission State Average - 10% 17% 19% 21%
State Discharge
Number of clients who reported nights/times - 7 15 10 2
Total clients - 69 128 93 38
Discharge State Average - 10% 12% 11% 5%
State Admission FY17 FY18 FY19 FY20 FY21
Number of clients who reported nights/times - 16 49 42 37
Total clients - 126 329 243 178
Admission State Average - 13% 15% 17% 21%
State Discharge
Number of clients who reported nights/times - 6 9 10 3
Total clients - 69 129 92 38
Discharge State Average - 9% 7% 11% 8%
State Admission FY17 FY18 FY19 FY20 FY21
Number of clients who reported nights/times - 10 25 12 12
Total clients - 128 331 242 175
Admission State Average - 8% 8% 5% 7%
State Discharge
Number of clients who reported nights/times - 3 7 2 1
Total clients - 71 130 93 38
Discharge State Average - 4% 5% 2% 3%
Illness, Injury, or Surgery
Inpatient Substance Use Disorder Treatment Services
Emergency Department
Hospital Admissions for Mental Health Care
Utilization of High Cost Treatment Services for FFT
September 2021 | 356

APPENDIX G: TARGETED SERVICES FOR JUSTICE-INVOLVED YOUTH
State Admission FY17 FY18 FY19 FY20 FY21
Number of clients who reported nights/times - 32 85 63 41
Total clients - 129 329 246 182
Admission State Average - 25% 26% 26% 23%
State Discharge
Number of clients who reported nights/times - 9 28 15 1
Total clients - 70 129 91 38
Discharge State Average - 13% 22% 16% 3%
State Admission FY17 FY18 FY19 FY20 FY21
Number of clients who reported nights/times - 141 306 233 156
Total clients - 158 352 262 184
Admission State Average - 89% 87% 89% 85%
State Discharge
Number of clients who reported nights/times - 72 139 93 32
Total clients - 73 143 101 37
Discharge State Average - 99% 97% 92% 86%
State Admission FY17 FY18 FY19 FY20 FY21
Number of clients who reported nights/times - 25 72 54 42
Total clients - 131 329 241 183
Admission State Average - 19% 22% 22% 23%
State Discharge
Number of clients who reported nights/times - 11 14 14 4
Total clients - 70 131 93 37
Discharge State Average - 16% 11% 15% 11%
State Discharge
Number of clients who are employed - 26 32 18 6
Total clients - 73 143 101 38
Discharge State Average - 36% 22% 18% 16%
Correctional Facility
Quality of Life Information for FFT
Employment Status
General Health
Suicide Attempts
September 2021 | 357

APPENDIX G: TARGETED SERVICES FOR JUSTICE-INVOLVED YOUTH
State Discharge
Number of clients who are homeless - 0 1 0 0
Total clients - 73 143 100 38
Discharge State Average - 0% 1% 0% 0%
State Admission FY17 FY18 FY19 FY20 FY21
Number of clients who were arrested - 21 54 28 23
Total clients - 155 337 262 183
Admission State Average - 14% 16% 11% 13%
State Discharge
Number of clients who were arrested - 4 7 8 3
Total clients - 72 136 98 38
Discharge State Average - 6% 5% 8% 8%
State FY17 FY18 FY19 FY20 FY21
Number of clients who did not complete FFT 17 10 6 12 1
Total clients 552 619 538 439 395
State Average 3% 2% 1% 3% 0%
History of Arrest
Legal Violations that Resulted in Youth Not Completing FFT:
Homelessness
Public Safety Information for FFT
September 2021 | 358

APPENDIX G: TARGETED SERVICES FOR JUSTICE-INVOLVED YOUTH
State FY17 FY18 FY19 FY20 FY21
Number who agree or strongly agree - 63 723 527 220
Total clients - 69 798 577 239
State Average - 91% 91% 91% 92%
State FY17 FY18 FY19 FY20 FY21
Number who agree or strongly agree - 68 258 185 78
Total clients - 69 263 193 80
State Average - 99% 98% 96% 98%
State FY17 FY18 FY19 FY20 FY21
Number who agree or strongly agree - 69 503 370 154
Total clients - 69 507 378 154
State Average - 100% 99% 98% 100%
State FY17 FY18 FY19 FY20 FY21
Number who agree or strongly agree - 55 712 530 226
Total clients - 69 903 673 286
State Average - 80% 79% 79% 79%
State FY17 FY18 FY19 FY20 FY21
Number who agree or strongly agree - 63 349 257 107
Total clients - 66 377 282 117
State Average - 95% 93% 91% 91%
State Admission FY17 FY18 FY19 FY20 FY21
Number who agree or strongly agree - 100 1,124 917 644
Total clients - 117 1,312 1,068 742
Admission State Average - 85% 86% 86% 87%
State Discharge
Number who agree or strongly agree - 67 489 346 153
Total clients - 70 524 387 164
Discharge State Average - 96% 93% 89% 93%
General Satisfaction with Services
Impact of FFT
Outcome of Services
Participation in Treatment Planning
Social Connectedness
Access to Services
Cultural Sensitivity
September 2021 | 359

APPENDIX G: TARGETED SERVICES FOR JUSTICE-INVOLVED YOUTH
State Admission FY17 FY18 FY19 FY20 FY21
Number who agree or strongly agree - 68 1,090 938 607
Total clients - 117 1,851 1,559 1,078
Admission State Average - 58% 59% 60% 56%
State Discharge
Number who agree or strongly agree - 56 608 452 195
Total clients - 70 773 576 245
Discharge State Average - 80% 79% 78% 80%
Client Outcome Measure-Parent: (COM-P)
State Average FY17 FY18 FY19 FY20 FY21
General Change
366 404 331 220 191
Number of parents with COM-Parent (COM-P) 416 435 380 238 221
Communication Skills
368 400 329 218 180
Number of parents with COM-Parent (COM-P) 416 435 380 238 221
Adolescent Behavior
333 364 306 205 171
Number of parents with COM-Parent (COM-P) 416 435 380 238 221
Parenting Skills
364 399 341 217 194
Number of parents with COM-Parent (COM-P) 416 435 380 238 221
Supervision Levels
339 383 322 204 177
Number of parents with COM-Parent (COM-P) 416 435 380 238 221
Levels of Conflict
357 381 320 206 182
Number of parents with COM-Parent (COM-P) 416 435 380 238 221
State Admission FY17 FY18 FY19 FY20 FY21
Number of clients who reported nights/times - 8 18 15 12
Total clients - 114 335 260 182
Admission State Average - 7% 5% 6% 7%
State Discharge
Number of clients who reported nights/times - 3 2 3 1
Total clients - 69 133 96 41
Discharge State Average - 4% 2% 3% 2%
Functioning
Utilization of High Cost Services for FFT
Illness, Injury, or Surgery
Number of parents who reported a 3 or greater
Number of parents who reported a 3 or greater
Number of parents who reported a 3 or greater
Number of parents who reported a 3 or greater
Number of parents who reported a 3 or greater
Number of parents who reported a 3 or greater
September 2021 | 360

APPENDIX G: TARGETED SERVICES FOR JUSTICE-INVOLVED YOUTH
State Admission FY17 FY18 FY19 FY20 FY21
Number of clients who reported nights/times - 16 62 55 37
Total clients - 116 342 269 187
Admission State Average - 14% 18% 20% 20%
State Discharge
Number of clients who reported nights/times - 5 11 8 4
Total clients - 69 132 95 41
Discharge State Average - 7% 8% 8% 10%
State Admission FY17 FY18 FY19 FY20 FY21
Number of clients who reported nights/times - 24 66 52 36
Total clients - 115 339 266 183
Admission State Average - 21% 19% 20% 20%
State Discharge
Number of clients who reported nights/times - 6 13 10 4
Total clients - 68 131 95 41
Discharge State Average - 9% 10% 11% 10%
State Admission FY17 FY18 FY19 FY20 FY21
Number of clients who reported nights/times - 10 20 17 10
Total clients - 116 339 263 183
Admission State Average - 9% 6% 6% 5%
State Discharge
Number of clients who reported nights/times - 1 2 2 1
Total clients - 69 132 96 40
Discharge State Average - 1% 2% 2% 3%
State Admission FY17 FY18 FY19 FY20 FY21
Number of clients who reported nights/times - 30 71 57 32
Total clients - 114 339 264 183
Admission State Average - 26% 21% 22% 17%
State Discharge
Number of clients who reported nights/times - 4 24 11 3
Total clients - 69 133 97 41
Discharge State Average - 6% 18% 11% 7%
Inpatient Substance Use Disorder Treatment Services
Emergency Department
Hospital Admissions for Mental Health Care
Correctional Facility
September 2021 | 361

APPENDIX G: TARGETED SERVICES FOR JUSTICE-INVOLVED YOUTH
State Admission FY17 FY18 FY19 FY20 FY21
Number of clients who reported nights/times - 106 313 267 164
Total clients - 117 350 283 188
Admission State Average - 91% 89% 94% 87%
State Discharge
Number of clients who reported nights/times - 66 134 100 38
Total clients - 70 141 105 41
Discharge State Average - 94% 95% 95% 93%
State Admission FY17 FY18 FY19 FY20 FY21
Number of clients who reported nights/times - 11 51 40 26
Total clients - 95 326 257 179
Admission State Average - 12% 16% 16% 15%
State Discharge
Number of clients who reported nights/times - 4 8 6 4
Total clients - 69 129 92 41
Discharge State Average - 6% 6% 7% 10%
State Discharge
Number of clients who are employed - 22 32 16 5
Total clients - 76 141 105 41
Discharge State Average - 29% 23% 15% 12%
State Discharge
Number of clients who are homeless - 0 1 0 0
Total clients - 70 141 105 41
Discharge State Average - 0% 1% 0% 0%
Quality of Life Information for FFT
Employment Status
Homelessness
Suicide Attempts
General Health
September 2021 | 362

APPENDIX G: TARGETED SERVICES FOR JUSTICE-INVOLVED YOUTH
State Admission FY17 FY18 FY19 FY20 FY21
Number of clients who were arrested - 14 53 33 26
Total clients - 117 348 282 187
Admission State Average - 12% 15% 12% 14%
State Discharge
Number of clients who were arrested - 2 7 8 1
Total clients - 70 140 97 41
Discharge State Average - 3% 5% 8% 2%
State Referral to First Contact FY17 FY18 FY19 FY20 FY21
Completed Cases 4.94 2.55 2.85 2.46 2.24
Non-Completed Cases 3.88 2.19 2.09 2.64 2.07
State Referral to First Session FY17 FY18 FY19 FY20 FY21
Completed Cases 14.40 13.36 13.48 11.90 15.14
Non-Completed Cases 17.84 16.25 16.27 15.67 12.94
FY17 FY18 FY19 FY20 FY21
FFT Initial Training 18 2 2 3 1
Number of Clinicians Trained 69 9 16 17 0
Treatment Pacing:
Public Safety Information for FFTHistory of Arrest
Curriculum Fidelity for FFT
FFT Trainings
September 2021 | 363

APPENDIX G: TARGETED SERVICES FOR JUSTICE-INVOLVED YOUTH
Completion Rates:
State FY17 FY18 FY19 FY20 FY21
Number of clients who completed - 65 46 39 11
Total clients - 87 60 61 21
State Average - 75% 77% 64% 52%
State FY17 FY18 FY19 FY20 FY21
Number who agree or strongly agree - 15 20 11 3
Total clients - 17 21 12 3
State Average - 88% 95% 92% 100%
State FY17 FY18 FY19 FY20 FY21
Number who agree or strongly agree - 17 17 11 3
Total clients - 17 20 11 3
State Average - 100% 85% 100% 100%
State FY17 FY18 FY19 FY20 FY21
Number who agree or strongly agree - 15 21 12 2
Total clients - 16 21 12 3
State Average - 92% 100% 100% 67%
State FY17 FY18 FY19 FY20 FY21
Number who agree or strongly agree - 15 19 11 2
Total clients - 16 21 12 3
State Average - 94% 90% 92% 67%
State FY17 FY18 FY19 FY20 FY21
Number who agree or strongly agree - 13 17 10 2
Total clients - 15 19 12 3
State Average - 87% 89% 83% 67%
State Admission FY17 FY18 FY19 FY20 FY21
Number who agree or strongly agree - 25 42 39 21
Total clients - 33 48 51 25
Admission State Average - 77% 88% 76% 84%
State Discharge
Number who agree or strongly agree - 16 20 12 3
Total clients - 17 21 12 3
Discharge Reasons for ART
Impact of ART
General Satisfaction with Services
Access to Services
Cultural Sensitivity
Outcome of Services
Participation in Treatment Planning
Social Connectedness
September 2021 | 364

APPENDIX G: TARGETED SERVICES FOR JUSTICE-INVOLVED YOUTH
Discharge State Average - 94% 95% 100% 100%
State Admission FY17 FY18 FY19 FY20 FY21
Number who agree or strongly agree - 20 36 35 17
Total clients - 32 48 50 24
Admission State Average - 63% 75% 70% 71%
State Discharge
Number who agree or strongly agree - 15 19 11 2
Total clients - 16 21 12 3
Discharge State Average - 94% 90% 92% 67%
State Admission FY17 FY18 FY19 FY20 FY21
Number of responses greater than 1 - 17 30 32 14
Total clients - 30 54 55 21
Admission State Average - 57% 56% 58% 67%
State Discharge
Number of responses greater than 1 - 9 16 9 1
Total clients - 12 25 15 3
Discharge State Average - 75% 64% 60% 33%
State Admission FY17 FY18 FY19 FY20 FY21
Number of responses greater than 1 - 15 29 27 15
Total clients - 30 54 55 21
Admission State Average - 50% 54% 49% 71%
State Discharge
Number of responses greater than 1 - 9 13 7 0
Total clients - 12 25 15 3
Discharge State Average - 75% 52% 47% 0%
State Admission FY17 FY18 FY19 FY20 FY21
Number of responses greater than 1 - 1 2 7 1
Total clients - 30 54 55 21
Admission State Average - 3% 4% 13% 5%
State Discharge
Number of responses greater than 1 - 1 1 2 0
Total clients - 12 25 15 3
Discharge State Average - 8% 4% 0% 0%
Substance Disorder Screener
Functioning
GAIN Short Screener (Gain-SS) Scoring
Internalizing Disorder Screener
Externalizing Disorder Screener
September 2021 | 365

APPENDIX G: TARGETED SERVICES FOR JUSTICE-INVOLVED YOUTH
State Admission FY17 FY18 FY19 FY20 FY21
Number of responses greater than 1 - 8 17 13 10
Total clients - 30 54 55 21
Admission State Average - 27% 31% 24% 48%
State Discharge
Number of responses greater than 1 - 3 4 3 0
Total clients - 12 25 15 3
Discharge State Average - 25% 16% 20% 0%
State Admission FY17 FY18 FY19 FY20 FY21
Number of clients who reported nights/times - 2 4 2 0
Total clients - 29 47 49 25
Admission State Average - 7% 9% 4% 0%
State Discharge
Number of clients who reported nights/times - 1 2 1 0
Total clients - 17 21 12 3
Discharge State Average - 6% 10% 8% 0%
State Admission FY17 FY18 FY19 FY20 FY21
Number of clients who reported nights/times - 3 4 8 6
Total clients - 30 48 49 24
Admission State Average - 10% 8% 16% 25%
State Discharge
Number of clients who reported nights/times - 3 7 1 0
Total clients - 17 22 12 3
Discharge State Average - 18% 32% 8% 0%
State Admission FY17 FY18 FY19 FY20 FY21
Number of clients who reported nights/times - 2 6 3 4
Total clients - 29 46 48 25
Admission State Average - 7% 13% 6% 16%
State Discharge
Number of clients who reported nights/times - 0 2 0 0
Total clients - 17 22 12 3
Discharge State Average - 0% 9% 0% 0%
Crime/Violence Screener
Utilization of High Cost Services for ART
Illness, Injury, or Surgery:
Emergency Department
Hospital Admissions for Mental Health Care
September 2021 | 366

APPENDIX G: TARGETED SERVICES FOR JUSTICE-INVOLVED YOUTH
State Admission FY17 FY18 FY19 FY20 FY21
Number of clients who reported nights/times - 1 4 5 0
Total clients - 29 46 50 25
Admission State Average - 3% 9% 10% 0%
State Discharge
Number of clients who reported nights/times - 0 1 1 0
Total clients - 17 22 12 3
Discharge State Average - 0% 5% 8% 0%
State Admission FY17 FY18 FY19 FY20 FY21
Number of clients who reported nights/times - 5 19 11 6
Total clients - 29 49 46 24
Admission State Average - 17% 39% 24% 25%
State Discharge
Number of clients who reported nights/times - 1 9 1 1
Total clients - 17 20 11 3
Discharge State Average - 6% 45% 9% 33%
State Admission FY17 FY18 FY19 FY20 FY21
Number of clients who reported nights/times - 27 51 53 21
Total clients - 32 56 58 24
Admission State Average - 84% 91% 91% 88%
State Discharge
Number of clients who reported nights/times - 16 25 16 3
Total clients - 17 25 16 3
Discharge State Average - 94% 100% 100% 100%
State Admission FY17 FY18 FY19 FY20 FY21
Number of clients who reported nights/times - 6 10 7 4
Total clients - 31 51 48 24
Admission State Average - 19% 20% 15% 17%
State Discharge
Number of clients who reported nights/times - 0 6 0 0
Total clients - 17 21 12 3
Discharge State Average - 0% 29% 0% 0%
Quality of Life Information for ART
General Health
Inpatient Substance Use Disorder Treatment Services
Correctional Facility
Suicide Attempts
September 2021 | 367

APPENDIX G: TARGETED SERVICES FOR JUSTICE-INVOLVED YOUTH
State Discharge
Number of clients who are employed - 7 7 2 0
Total clients - 17 25 16 3
Discharge State Average - 41% 28% 13% 0%
State Discharge
Number of clients who are homeless - 0 0 0 0
Total clients - 17 25 16 3
Discharge State Average - 0% 0% 0% 0%
State Admission FY17 FY18 FY19 FY20 FY21
Number of clients who were arrested - 1 5 4 1
Total clients - 30 51 57 24
Admission State Average - 3% 10% 7% 4%
State Discharge
Number of clients who were arrested - 1 2 1 0
Total clients - 17 23 15 3
Discharge State Average - 6% 9% 7% 0%
Employment Status
Homelessness
Public Safety Information for ART
History of Arrest
September 2021 | 368

APPENDIX G: TARGETED SERVICES FOR JUSTICE-INVOLVED YOUTH
State Average FY17 FY18 FY19 FY20 FY21
Clients who indicated a decrease in behavior - 33 33 18 15
Clients who indicated an increase in behavior - 19 14 12 8
Clients who indicated no change in behavior - 3 2 3 1
Percent Improved - 63% 70% 60% 65%
State Average FY17 FY18 FY19 FY20 FY21
Clients who indicated a decrease in behavior - 30 23 19 10
Clients who indicated an increase in behavior - 20 20 10 13
Clients who indicated no change in behavior - 5 6 4 1
Percent Improved - 60% 53% 66% 43%
State Average FY17 FY18 FY19 FY20 FY21
Clients who indicated a decrease in behavior - 34 26 19 13
Clients who indicated an increase in behavior - 16 20 11 9
Clients who indicated no change in behavior - 5 3 3 2
Percent Improved - 68% 57% 63% 59%
State Average FY17 FY18 FY19 FY20 FY21
Clients who indicated a decrease in behavior - 33 24 21 11
Clients who indicated an increase in behavior - 18 18 8 10
Clients who indicated no change in behavior - 4 7 4 3
Percent Improved - 65% 57% 72% 52%
State Average FY17 FY18 FY19 FY20 FY21
Clients who indicated a decrease in behavior - 28 25 18 12
Clients who indicated an increase in behavior - 19 15 14 12
Clients who indicated no change in behavior - 8 9 1 0
Percent Improved - 60% 63% 56% 50%
State Average FY17 FY18 FY19 FY20 FY21
Clients who indicated a decrease in behavior - 34 32 25 13
Clients who indicated an increase in behavior - 21 16 8 11
Clients who indicated no change in behavior - 0 1 0 0
Percent Improved - 62% 67% 76% 54%
AQ Sub-Scales for ART
Indirect Aggression
Physical Aggression
Verbal Aggression
Anger
Hostility
Overall AQ Change
September 2021 | 369

APPENDIX G: TARGETED SERVICES FOR JUSTICE-INVOLVED YOUTH
State Average FY17 FY18 FY19 FY20 FY21
Clients who indicated a decrease in behavior - 30 14 21 14
Clients who indicated an increase in behavior - 10 16 5 4
Clients who indicated no change in behavior - 0 1 2 0
Percent Improved - 75% 47% 81% 78%
State Average FY17 FY18 FY19 FY20 FY21
Clients who indicated a decrease in behavior - 31 13 21 13
Clients who indicated an increase in behavior - 7 15 8 5
Clients who indicated no change in behavior - 3 3 0 0
Percent Improved - 82% 46% 72% 72%
State Average FY17 FY18 FY19 FY20 FY21
Clients who indicated a decrease in behavior - 32 18 23 12
Clients who indicated an increase in behavior - 10 13 7 5
Clients who indicated no change in behavior - 1 0 0 1
Percent Improved - 76% 58% 77% 71%
HIT Sub-Scales for ART
Overall
Overt
Covert
September 2021 | 370

APPENDIX G: TARGETED SERVICES FOR JUSTICE-INVOLVED YOUTH
State FY17 FY18 FY19 FY20 FY21
Number who agree or strongly agree - 2 50 30 18
Total clients - 2 54 30 18
State Average - 100% 93% 100% 100%
State FY17 FY18 FY19 FY20 FY21
Number who agree or strongly agree - 2 14 10 4
Total clients - 2 15 10 6
State Average - 100% 93% 100% 67%
State FY17 FY18 FY19 FY20 FY21
Number who agree or strongly agree - 2 35 20 12
Total clients - 2 35 20 12
State Average - 100% 100% 100% 100%
State FY17 FY18 FY19 FY20 FY21
Number who agree or strongly agree - 2 52 33 19
Total clients - 2 62 35 21
State Average - 93% 84% 94% 90%
State FY17 FY18 FY19 FY20 FY21
Number who agree or strongly agree - 2 24 14 6
Total clients - 2 25 15 9
State Average - 100% 96% 93% 67%
State Admission FY17 FY18 FY19 FY20 FY21
Number who agree or strongly agree - 23 137 149 73
Total clients - 23 156 172 83
Admission State Average - 100% 88% 87% 88%
State Discharge
Number who agree or strongly agree - 2 33 20 12
Total clients - 2 35 20 12
Discharge State Average - 100% 94% 100% 100%
Access to Services
Cultural Sensitivity
Outcome of Services
Participation in Treatment Planning
Social Connectedness
Impact of ART
General Satisfaction with Services
September 2021 | 371

APPENDIX G: TARGETED SERVICES FOR JUSTICE-INVOLVED YOUTH
State Admission FY17 FY18 FY19 FY20 FY21
Number who agree or strongly agree - 15 152 157 75
Total clients - 25 264 260 120
Admission State Average - 61% 58% 60% 63%
State Discharge
Number who agree or strongly agree - 2 52 28 16
Total clients - 2 62 30 18
Discharge State Average - 92% 84% 93% 89%
State Admission FY17 FY18 FY19 FY20 FY21
Number of clients who reported nights/times - 1 2 2 1
Total clients - 24 40 43 22
Admission State Average - 4% 5% 5% 5%
State Discharge
Number of clients who reported nights/times - 0 1 0 0
Total clients - 2 9 5 3
Discharge State Average - 0% 11% 0% 0%
State Admission FY17 FY18 FY19 FY20 FY21
Number of clients who reported nights/times - 2 7 5 5
Total clients - 24 40 44 22
Admission State Average - 8% 18% 11% 23%
State Discharge
Number of clients who reported nights/times - 0 1 0 0
Total clients - 2 9 5 3
Discharge State Average - 0% 11% 0% 0%
State Admission FY17 FY18 FY19 FY20 FY21
Number of clients who reported nights/times - 3 4 3 2
Total clients - 24 40 43 22
Admission State Average - 13% 10% 7% 9%
State Discharge
Number of clients who reported nights/times - 0 0 0 0
Total clients - 2 9 5 3
Discharge State Average - 0% 0% 0% 0%
Functioning
Utilization of High Cost Services for ART
Illness, Injury, or Surgery
Emergency Department
Hospital Admissions for Mental Health Care
September 2021 | 372

APPENDIX G: TARGETED SERVICES FOR JUSTICE-INVOLVED YOUTH
State Admission FY17 FY18 FY19 FY20 FY21
Number of clients who reported nights/times - 3 5 2 0
Total clients - 25 40 43 22
Admission State Average - 12% 13% 5% 0%
State Discharge
Number of clients who reported nights/times - 0 0 0 0
Total clients - 2 9 5 3
Discharge State Average - 0% 0% 0% 0%
State Admission FY17 FY18 FY19 FY20 FY21
Number of clients who reported nights/times - 5 17 14 4
Total clients - 24 39 42 22
Admission State Average - 21% 44% 33% 18%
State Discharge
Number of clients who reported nights/times - 0 2 1 0
Total clients - 2 9 5 3
Discharge State Average - 0% 22% 20% 0%
State Admission FY17 FY18 FY19 FY20 FY21
Number of clients who reported nights/times - 22 43 49 20
Total clients - 24 44 50 23
Admission State Average - 92% 98% 98% 87%
State Discharge
Number of clients who reported nights/times - 2 10 4 3
Total clients - 2 10 5 3
Discharge State Average - 100% 100% 80% 100%
State Admission FY17 FY18 FY19 FY20 FY21
Number of clients who reported nights/times - 6 6 3 2
Total clients - 25 40 41 21
Admission State Average - 24% 15% 7% 10%
State Discharge
Number of clients who reported nights/times - 0 2 0 0
Total clients - 2 9 5 3
Discharge State Average - 0% 22% 0% 0%
General Health
Suicide Attempts
Inpatient Substance Use Disorder Treatment Services
Correctional Facility
Quality of Life Information for ART
September 2021 | 373

APPENDIX G: TARGETED SERVICES FOR JUSTICE-INVOLVED YOUTH
State Discharge
Number of clients who are employed - 0 1 0 0
Total clients - 3 10 5 3
Discharge State Average - 0% 10% 0% 0%
State Discharge
Number of clients who are homeless - 0 0 0 0
Total clients - 2 10 5 3
Discharge State Average - 0% 0% 0% 0%
State Admission FY17 FY18 FY19 FY20 FY21
Number of clients who were arrested - 4 10 7 2
Total clients - 25 45 50 23
Admission State Average - 16% 22% 14% 9%
State Discharge
Number of clients who were arrested - 0 1 0 0
Total clients - 2 9 5 3
Discharge State Average - 0% 11% 0% 0%
FY17 FY18 FY19 FY20 FY21
ART Trainings 1 2 2 2 1
Employment Status
Homelessness
Public Safety Information for ART
History of Arrest
Curriculum Fidelity for ART
ART Trainings
September 2021 | 374

APPENDIX G: TARGETED SERVICES FOR JUSTICE-INVOLVED YOUTH
Completion Rates:
State FY17 FY18 FY19 FY20 FY21
Number of clients who completed - 62 64 58 36
Total clients - 132 122 142 80
State Average - 47% 52% 41% 45%
State FY17 FY18 FY19 FY20 FY21
Number who agree or strongly agree - 5 17 11 3
Total clients - 5 18 12 4
State Average - 100% 94% 92% 75%
State FY17 FY18 FY19 FY20 FY21
Number who agree or strongly agree - 5 16 12 4
Total clients - 5 18 12 4
State Average - 100% 89% 100% 100%
State FY17 FY18 FY19 FY20 FY21
Number who agree or strongly agree - 5 16 12 4
Total clients - 5 18 12 4
State Average - 100% 89% 100% 100%
State FY17 FY18 FY19 FY20 FY21
Number who agree or strongly agree - 6 17 9 4
Total clients - 6 18 12 4
State Average - 100% 94% 75% 100%
State FY17 FY18 FY19 FY20 FY21
Number who agree or strongly agree - 5 16 9 3
Total clients - 5 18 12 4
State Average - 100% 89% 75% 75%
State Admission FY17 FY18 FY19 FY20 FY21
Number who agree or strongly agree - 23 61 58 47
Total clients - 31 68 65 54
Admission State Average - 74% 90% 89% 87%
State Discharge
Number who agree or strongly agree - 6 17 12 4
Total clients - 6 18 12 4
Outcome of Services
Participation in Treatment Planning
Social Connectedness
Discharge Reasons for MRT
Impact of MRT
General Satisfaction with Services
Access to Services
Cultural Sensitivity
September 2021 | 375

APPENDIX G: TARGETED SERVICES FOR JUSTICE-INVOLVED YOUTH
Discharge State Average - 100% 94% 100% 100%
September 2021 | 376

APPENDIX G: TARGETED SERVICES FOR JUSTICE-INVOLVED YOUTH
State Admission FY17 FY18 FY19 FY20 FY21
Number who agree or strongly agree - 19 53 48 42
Total clients - 30 67 63 53
Admission State Average - 63% 79% 76% 79%
State Discharge
Number who agree or strongly agree - 6 17 10 4
Total clients - 6 18 12 4
Discharge State Average - 100% 94% 83% 100%
State Admission FY17 FY18 FY19 FY20 FY21
Number of responses greater than 1 - 15 40 39 33
Total clients - 27 72 63 50
Admission State Average - 56% 56% 62% 66%
State Discharge
Number of responses greater than 1 - 1 9 7 2
Total clients - 5 18 14 3
Discharge State Average - 20% 50% 50% 67%
State Admission FY17 FY18 FY19 FY20 FY21
Number of responses greater than 1 - 16 41 43 34
Total clients - 27 72 63 50
Admission State Average - 59% 57% 68% 68%
State Discharge
Number of responses greater than 1 - 1 6 6 2
Total clients - 5 18 14 3
Discharge State Average - 20% 33% 43% 67%
State Admission FY17 FY18 FY19 FY20 FY21
Number of responses greater than 1 - 10 17 12 10
Total clients - 27 72 63 50
Admission State Average - 37% 24% 19% 20%
State Discharge
Number of responses greater than 1 - 2 0 1 1
Total clients - 5 18 14 3
Discharge State Average - 40% 0% 7% 33%
Functioning
GAIN Short Screener (Gain-SS) Scoring
Internalizing Disorder Screener
Externalizing Disorder Screener
Substance Disorder Screener
September 2021 | 377

APPENDIX G: TARGETED SERVICES FOR JUSTICE-INVOLVED YOUTH
State Admission FY17 FY18 FY19 FY20 FY21
Number of responses greater than 1 - 11 17 23 12
Total clients - 27 72 63 50
Admission State Average - 41% 24% 37% 24%
State Discharge
Number of responses greater than 1 - 0 3 2 1
Total clients - 5 18 14 3
Discharge State Average - 0% 17% 14% 33%
State Admission FY17 FY18 FY19 FY20 FY21
Number of clients who reported nights/times - 0 4 4 2
Total clients - 26 74 65 55
Admission State Average - 0% 5% 6% 4%
State Discharge
Number of clients who reported nights/times - 1 4 1 0
Total clients - 6 19 12 4
Discharge State Average - 17% 21% 8% 0%
State Admission FY17 FY18 FY19 FY20 FY21
Number of clients who reported nights/times - 4 11 8 5
Total clients - 26 71 62 53
Admission State Average - 15% 15% 13% 9%
State Discharge
Number of clients who reported nights/times - 0 1 1 2
Total clients - 6 20 12 4
Discharge State Average - 0% 5% 8% 50%
State Admission FY17 FY18 FY19 FY20 FY21
Number of clients who reported nights/times - 1 6 5 3
Total clients - 26 74 65 55
Admission State Average - 4% 8% 8% 5%
State Discharge
Number of clients who reported nights/times - 0 2 0 1
Total clients - 5 19 12 4
Discharge State Average - 0% 11% 0% 25%
Crime/Violence Screener
Utilization of High Cost Services for MRT
Illness, Injury, or Surgery
Emergency Department
Hospital Admissions for Mental Health Care
September 2021 | 378

APPENDIX G: TARGETED SERVICES FOR JUSTICE-INVOLVED YOUTH
State Admission FY17 FY18 FY19 FY20 FY21
Number of clients who reported nights/times - 5 9 3 5
Total clients - 36 74 64 54
Admission State Average - 14% 12% 5% 9%
State Discharge
Number of clients who reported nights/times - 0 0 0 0
Total clients - 5 19 12 4
Discharge State Average - 0% 0% 0% 0%
State Admission FY17 FY18 FY19 FY20 FY21
Number of clients who reported nights/times - 15 22 23 12
Total clients - 28 73 62 53
Admission State Average - 54% 30% 37% 23%
State Discharge
Number of clients who reported nights/times - 3 3 1 2
Total clients - 6 19 11 4
Discharge State Average - 50% 16% 9% 50%
State Admission FY17 FY18 FY19 FY20 FY21
Number of clients who reported nights/times - 30 70 66 48
Total clients - 32 75 72 54
Admission State Average - 94% 93% 92% 89%
State Discharge
Number of clients who reported nights/times - 6 20 15 4
Total clients - 6 20 15 4
Discharge State Average - 100% 100% 100% 100%
State Admission FY17 FY18 FY19 FY20 FY21
Number of clients who reported nights/times - 3 10 7 5
Total clients - 28 74 65 54
Admission State Average - 11% 14% 11% 9%
State Discharge
Number of clients who reported nights/times - 1 2 0 1
Total clients - 6 19 12 4
Discharge State Average - 17% 11% 0% 25%
Inpatient Substance Use Disorder Treatment Services
Correctional Facility
Quality of Life Information for MRT
General Health
Suicide Attempts
September 2021 | 379

APPENDIX G: TARGETED SERVICES FOR JUSTICE-INVOLVED YOUTH
State Discharge
Number of clients who are employed - 4 7 5 2
Total clients - 6 20 15 4
Discharge State Average - 67% 35% 33% 50%
State Discharge
Number of clients who are homeless - 0 0 0 0
Total clients - 6 20 15 4
Discharge State Average - 0% 0% 0% 0%
State Admission FY17 FY18 FY19 FY20 FY21
Number of clients who were arrested - 9 12 12 7
Total clients - 29 75 70 53
Admission State Average - 31% 16% 17% 13%
State Discharge
Number of clients who were arrested - 0 2 0 0
Total clients - 7 20 14 4
Discharge State Average - 0% 10% 0% 0%
State Average FY17 FY18 FY19 FY20 FY21
Clients who indicated a decrease in behavior - 29 23 28 28
Clients who indicated an increase in behavior - 10 8 17 4
Clients who indicated no change in behavior - 0 0 0 0
Percent Improved - 74% 74% 62% 88%
State Average FY17 FY18 FY19 FY20 FY21
Clients who indicated a decrease in behavior - 27 23 29 27
Clients who indicated an increase in behavior - 12 6 15 4
Clients who indicated no change in behavior - 0 3 1 1
Percent Improved - 69% 79% 66% 87%
Overt
Homelessness
Employment Status
Public Safety Information for MRT
History of Arrest
HIT Sub-Scales for MRT
Overall
September 2021 | 380

APPENDIX G: TARGETED SERVICES FOR JUSTICE-INVOLVED YOUTH
State Average FY17 FY18 FY19 FY20 FY21
Clients who indicated a decrease in behavior - 29 22 25 26
Clients who indicated an increase in behavior - 10 9 18 5
Clients who indicated no change in behavior - 1 0 2 1
Percent Improved - 74% 71% 58% 84%
Covert
September 2021 | 381

APPENDIX G: TARGETED SERVICES FOR JUSTICE-INVOLVED YOUTH
State FY17 FY18 FY19 FY20 FY21
Number who agree or strongly agree - 2 15 52 18
Total clients - 2 18 60 18
State Average - 100% 83% 87% 100%
State FY17 FY18 FY19 FY20 FY21
Number who agree or strongly agree - 2 6 20 6
Total clients - 2 6 20 6
State Average - 100% 100% 100% 100%
State FY17 FY18 FY19 FY20 FY21
Number who agree or strongly agree - 2 10 36 11
Total clients - 2 10 39 11
State Average - 100% 100% 92% 100%
State FY17 FY18 FY19 FY20 FY21
Number who agree or strongly agree - 1 11 47 19
Total clients - 2 20 70 20
State Average - 50% 55% 67% 95%
State FY17 FY18 FY19 FY20 FY21
Number who agree or strongly agree - 2 6 19 4
Total clients - 2 6 27 9
State Average - 100% 100% 70% 44%
State Admission FY17 FY18 FY19 FY20 FY21
Number who agree or strongly agree - 15 176 183 155
Total clients - 17 195 204 194
Admission State Average - 88% 90% 90% 80%
State Discharge
Number who agree or strongly agree - 2 12 40 12
Total clients - 2 12 40 12
Discharge State Average - 100% 100% 100% 100%
Outcome of Services
Participation in Treatment Planning
Social Connectedness
Impact of MRT
General Satisfaction with Services
Access to Services
Cultural Sensitivity
September 2021 | 382

APPENDIX G: TARGETED SERVICES FOR JUSTICE-INVOLVED YOUTH
State Admission FY17 FY18 FY19 FY20 FY21
Number who agree or strongly agree - 11 177 187 189
Total clients - 17 257 301 276
Admission State Average - 65% 69% 62% 68%
State Discharge
Number who agree or strongly agree - 1 9 41 19
Total clients - 2 17 60 20
Discharge State Average - 50% 53% 68% 95%
State Admission FY17 FY18 FY19 FY20 FY21
Number of clients who reported nights/times - 0 3 4 3
Total clients - 17 48 49 46
Admission State Average - 0% 6% 8% 7%
State Discharge
Number of clients who reported nights/times - 0 0 0 0
Total clients - 2 3 10 3
Discharge State Average - 0% 0% 0% 0%
State Admission FY17 FY18 FY19 FY20 FY21
Number of clients who reported nights/times - 1 4 5 5
Total clients - 17 48 51 49
Admission State Average - 6% 8% 10% 10%
State Discharge
Number of clients who reported nights/times - 0 0 1 0
Total clients - 2 3 10 3
Discharge State Average - 0% 0% 10% 0%
State Admission FY17 FY18 FY19 FY20 FY21
Number of clients who reported nights/times - 1 2 5 2
Total clients - 17 48 49 47
Admission State Average - 6% 4% 10% 4%
State Discharge
Number of clients who reported nights/times - 0 0 0 0
Total clients - 2 3 5 3
Discharge State Average - 0% 0% 0% 0%
Functioning
Utilization of High Cost Services for MRT
Illness, Injury, or Surgery
Emergency Department
Hospital Admissions for Mental Health Care
September 2021 | 383

APPENDIX G: TARGETED SERVICES FOR JUSTICE-INVOLVED YOUTH
State Admission FY17 FY18 FY19 FY20 FY21
Number of clients who reported nights/times - 5 4 2 5
Total clients - 17 49 49 49
Admission State Average - 29% 8% 4% 10%
State Discharge
Number of clients who reported nights/times - 0 1 0 0
Total clients - 2 3 10 3
Discharge State Average - 0% 33% 0% 0%
State Admission FY17 FY18 FY19 FY20 FY21
Number of clients who reported nights/times - 9 14 12 14
Total clients - 17 48 49 49
Admission State Average - 53% 29% 24% 29%
State Discharge
Number of clients who reported nights/times - 0 1 1 0
Total clients - 2 3 10 3
Discharge State Average - 0% 33% 10% 0%
State Admission FY17 FY18 FY19 FY20 FY21
Number of clients who reported nights/times - 17 49 52 47
Total clients - 17 50 55 49
Admission State Average - 100% 98% 95% 96%
State Discharge
Number of clients who reported nights/times - 1 2 9 3
Total clients - 1 2 9 3
Discharge State Average - 100% 100% 100% 100%
State Admission FY17 FY18 FY19 FY20 FY21
Number of clients who reported nights/times - 1 3 5 1
Total clients - 9 45 48 48
Admission State Average - 11% 7% 10% 2%
State Discharge
Number of clients who reported nights/times - 0 0 1 0
Total clients - 2 3 10 3
Discharge State Average - 0% 0% 10% 0%
Inpatient Substance Use Disorder Treatment Services
Correctional Facility
Quality of Life Information for MRT
General Health
Suicide Attempts
September 2021 | 384

APPENDIX G: TARGETED SERVICES FOR JUSTICE-INVOLVED YOUTH
State Discharge
Number of clients who are employed - 0 0 4 1
Total clients - 3 3 10 3
Discharge State Average - 0% 0% 40% 33%
State Discharge
Number of clients who are homeless - 0 0 0 0
Total clients - 2 3 10 3
Discharge State Average - 0% 0% 0% 0%
State Admission FY17 FY18 FY19 FY20 FY21
Number of clients who were arrested - 4 7 5 5
Total clients - 17 49 55 49
Admission State Average - 24% 14% 9% 10%
State Discharge
Number of clients who were arrested - 0 1 1 0
Total clients - 2 3 10 3
Discharge State Average - 0% 33% 10% 0%
FY17 FY18 FY19 FY20 FY21
MRT Training 1 2 2 1 1
Advanced MRT Trainings 1 2 2 1 1
History of Arrest
Employment Status
Homelessness
Public Safety Information for MRT
Curriculum Fidelity for MRT
MRT Trainings
September 2021 | 385

[Page intentionally left blank]