Embed Size (px)
Citation preview

ANNUAL REPORT FOR MONITORING OF SUSPENDED
SEDIMENT CONCENTRATIONS AND TURBIDITY DURING
THE 2019 WATER YEAR IN MCCLOUD CREEK, HUMBOLDT COUNTY, CALIFORNIA
Pursuant to: Monitoring and Reporting Program (MRP)
Order No. R1-2012-0088
Submitted: November 1, 2019
Prepared By:
Green Diamond Resource Company Korbel, California

Green Diamond Resource Company WDR, Order No. R1-2012-0088 2018 Annual Report
Page 2 of 21
1.0 Introduction
Elk River is listed as an impaired water body under Section 303(d) of the Federal Clean Water Act (USEPA, 1999) due to high instream sediment loads and associated adverse impacts to the beneficial uses of water. To address the Elk River sediment impairment, the North Coast Regional Water Quality Control Board (NCRWQCB) adopted Watershed Waste Discharge Requirements (WWDRs), Order No. R1-2006-0042. In addition to this order the NCRWQCB developed a Total Maximum Daily Load (TMDL) for sediment in Elk River. In May 2016 the Regional Water Board adopted the Action Plan for the Upper Elk River Sediment TMDL as an amendment to the Water Quality Control Plan for the North Coast. The TMDL Action Plan was approved by the State Water Resources Control Board in August 2017, the Office of Administrative Law in March 2018, and the US Environmental Protection Agency in April 2018. Monitoring and Reporting Program (MRP), Order No. R1-2008-092, describes the monitoring and reporting efforts Green Diamond Resource Company (GDRCo) has been conducting since 2006, as part of the South Fork (SF) Elk River WWDRs. In October 2012, new property wide WDRs (Order No. R1-2012-0087) and an associated MRP (Order No. R1-2012-0088) superseded the SF Elk River WWDRs and incorporated its substantive conditions and monitoring program.
As part of the MRP (Order No. R1-2012-0088), GDRCo has agreed to conduct a water-quality trend monitoring study in McCloud Creek, a tributary of SF Elk River. Using Turbidity Threshold Sampling (TTS), GDRCo measured stage, water velocity, turbidity and suspended sediment concentration in McCloud Creek during the 2019 water year (WY). This report covers the period from October 1, 2018 through July 1, 2019, during which TTS monitoring occurred. 2.0 Data Collection and Analysis Activities
Data collection and analysis have been conducted as outlined in the MRP (Order No. R1-2012-0088), Standard Operating Procedures, and the Turbidity Threshold Sampling Quality Assurance Project Plan for McCloud Creek. See this document for further details on the monitoring parameters, protocols, and frequencies.
2.1 Station Installation and/or Adjustments
Equipment was installed at the McCloud Creek TTS station for the 2019 WY on September 18, 2018. The surface hydrology was inadequate for monitoring at that time and subsequent dry channel and low flow conditions prohibited monitoring until November 23rd. The station remained powered on monitoring an isolated pool until September 23rd when flows rose to a monitoring stage. A subsequent dry period

Green Diamond Resource Company WDR, Order No. R1-2012-0088 2018 Annual Report
Page 3 of 21
occurred after the initial rains and the station returned to an isolated pool from November 25th to November 26th when rains again returned flows to the stream where suitable flow conditions continued throughout the water year. 2.2 Continuous Measurement Stations
The TTS station was established in McCloud Creek on BLM property, approximately 400 feet upstream from the confluence with SF Elk River (Figure 1). The watershed area above the McCloud TTS monitoring site is approximately 1,482 acres. The specifications for the construction and operation of the TTS station are based on procedures developed by the United States Forest Service Redwood Science Laboratory (Lewis and Eads 2008). The station automatically records stage height and turbidity at 10-minute intervals and collects and stores automated grab samples of creek water, which are transported to the lab and analyzed to quantify turbidity and suspended sediment concentration. Table 1 displays all of the parameters and frequency of measurements collected at the McCloud Creek TTS station.
Figure 1. Location of the McCloud Creek TTS station.

Green Diamond Resource Company WDR, Order No. R1-2012-0088 2018 Annual Report
Page 4 of 21
2.2.1 Field Visits – Summary of Logs
A total of 29 field visits (frequency ≈ 4 per month) were conducted during the 2019 WY. Visits were conducted to exchange bottles and batteries, download data, take flow measurements, or perform other storm related and maintenance activities. A summary of the activities conducted during the 2019 WY is provided below (Table 2). 2.2.2 Site Observations
A summary of site observations were compiled for the 2019 WY (Table 3). These site visit observations included notable items, unrelated to the station status but related to the site conditions. Observations for this WY included hydrologic conditions. Table 1. McCloud Creek TTS station, parameters and specifications.
Parameter Units Sampling Method Sampling Frequency
Turbidity FNU DTS-12 (turbidimeter, in situ measurement)
Continuous (10 minute interval)
Turbidity NTRU Manual ISCO sample Weekly1
Suspended sediment
mg/L Manual ISCO sample Weekly1
Suspended sediment
mg/L Automated ISCO sample.
Turbidity threshold sampling
Discharge cfs Direct measurement Weekly1 and as needed for stage-discharge relationship
Stage feet Druck (pressure transducer, in situ measurement)
Continuous (10 minute interval)
Stage feet Stage plate Weekly1 and when present for stream flow measurements
1 This frequency varies at times due to high flows during storm events, which restrict access to the McCloud Creek TTS station and low flow conditions where velocity is below minimum required for flow-meters.

Green Diamond Resource Company WDR, Order No. R1-2012-0088 2018 Annual Report
Page 5 of 21
Table 2. Summary of field activities at the McCloud Creek TTS station during the 2019 WY. *Type: MO = Monitoring (data dumps, flow measurements, and grab samples), MA = Maintenance (sensor cleanings and site adjustments), SI=Site installation, CO = Construction.
Date Type* Comments
9/17/2018 CO/SI Monitoring equipment installed and tested, station offline.
11/20/2018 MO Site online.
11/26/2018 MO/MA Discharge not measured, DTS adjusted, ISCO calibrated.
11/30/2018 MO Discharge measured.
12/7/2018 MO Discharge measured.
12/13/2018 MO Discharge measured. Sent new program.
12/19/2018 MO/MA Discharge measured. DTS adjusted.
12/27/2018 MO Discharge measured.
1/10/2019 MO/MA Discharge measured, DTS adjusted, rotated ISCO pump tubing.
1/18/2019 MO/MA Discharge measured. Installed intake tube filter.
1/23/2019 MO Discharge measured.
2/5/2019 MO/MA Discharge measured.
2/11/2019 MO/MA Discharge measured. DTS adjusted.
2/18/2019 MO Discharge measured.
3/4/2019 MO/MA Discharge not measured, DTS adjusted, ISCO calibrated, Druck reattached.
3/13/2019 MO/MA Discharge measured. DTS adjusted.
3/22/2019 MO Discharge measured. DTS adjusted.
3/29/2019 MO Discharge measured.
4/4/2019 MO Discharge measured.
4/10/2019 MO Discharge measured.
4/19/2019 MO/MA Discharge not measured, DTS adjusted.
4/25/2019 MO/MA Discharge measured. DTS adjusted.
4/29/2019 MO/CO Discharge not measured. Stair construction and trail reroute.
5/10/2019 MO Discharge measured.
5/13/2019 MO Discharge not measured.
5/24/2019 MO Discharge not measured.
5/30/2019 MO/MA Discharge measured. DTS adjusted.
6/4/2019 MO Discharge measured.
6/14/2019 MO Discharge not measured.
6/19/2019 MO Discharge not measured.
6/27/2019 MO Discharge not measured. 7/12/2019 SD Site offline.
Green Diamond Resource Company WDR, Order No. R1-2012-0088 2018 Annual Report
Page 6 of 21
Table 3. Summary of site observations collected at the McCloud Creek TTS station during the 2019 WY.
Comment Type Date Comment
Observation 09/17/18 Monitoring equipment installed and tested, station offline.
Observation 11/20/18 Station online.
Observation 12/12/18 Powered down datalogger to rewire ISCO and DTS communication cables according to new universal specs. Sent new program to datalogger with updated turbidity sampling thresholds.
Observation 03/04/19 Channel has been scoured by high flows. Stage plate may have been hit and bent.
Observation 03/22/19 Discharge measured approximately (30') upstream of monitoring unit at tailcrest of next pool upstream. Channel has changed since high flow events.
Observation 07/12/19 Site dismantle. Site offline at 10:58.
2.2.3 Download Data Summary The data logger at the TTS station was downloaded to a field PC at least weekly when the station was online. The files were then transferred to the GDRCo server and compiled into a proprietary SQL database. Editing and analysis were performed using this database, Aquatic Informatics’ AQUARIUS Time-Series©, and Microsoft Excel. The output data file for this report is labeled as “Appendix_A _MC2_All_Data_2019WY.xlsx” and was submitted with this annual report in accordance with the NCRWQCB 2014 electronic document submission guidelines. 2.2.3.1 Stage-Discharge Relationship
During the 2019 WY, GDRCo personnel collected 21 water velocity measurements using two types of current meters: the Price Pygmy and Price AA flow meters. AA meters were used for depths > 1.0 ft and Pygmy meters were chosen for depths < 1.0 ft. Using Aquatic Informatics’ Rating Development Tool (Aquarius, 2016), coincidental stages were taken with discharge measurements and plotted to create a rating curve for the 2019 WY (Figure 2).

Green Diamond Resource Company WDR, Order No. R1-2012-0088 2018 Annual Report
Page 7 of 21
Figure 2. Discharge-stage relationship used for the 2019 water year. Derived discharge values above the maximum measured discharge at 2.2 ft for the 2019 WY were extrapolated using the Flow Transference Method (FTM) with discharge data from the South Fork Elk River provided by Humboldt Redwood Company. Measuring a high water discharge has been limited by technician’s ability to cross the SF Elk River; which is unsafe at higher flows. Previous extrapolations of the rating curve simply extended the known curve to the maximum recorded stage value to produce a derived discharge. That extrapolation method yielded unusually high discharge values in excess of 1000 cfs which would begin to exceed discharge measurements from the Humboldt Redwood Company South Fork Elk River gaging station. The FTM yields a more realistic discharge value that is consistent with what would be expected of a watershed the size of McCloud Creek. These data should be used and viewed with caution without additional empirical support. However, they do provide a more realistic idea of flows in McCloud Creek. 2.2.3.2 Continuous Discharge
Continuous discharge for the 2019 WY (Figure 3) was derived using the rating curve and the continuous time series stage data in Aquarius. The estimated peak discharge for McCloud Creek during the 2019 WY occurred on February 27th and was ≈ 188 cfs (stage = 4.93 ft). Due to the safety limitations involved in wading across SF Elk River during storm events, discharge measurements at the McCloud TTS site were not taken at stages > 2.12 ft (≈ 48 cfs) during the 2019 WY. Despite this limitation, 96.7% of the stage measurements recorded during the 2019 WY was within the range of measured discharges. Considering the strong relationship between stage and discharge, interpolated discharges below ≈ 50 cfs have high confidence. The extrapolated discharge values that exceed the range of empirical

Green Diamond Resource Company WDR, Order No. R1-2012-0088 2018 Annual Report
Page 8 of 21
values have a high uncertainty given the lack of discharge measurements for stages greater than 2.12 ft. A general rule of thumb is to not estimate over two times the max measured discharge stage value as it becomes exceedingly difficult to account for when channel controls take effect. For this reason the Flow Transference Method was used in an attempt to better predict high end discharges.
Figure 3. Continuous estimated discharge at the McCloud Creek TTS station during the 2019 WY. The reach was dry from 10/19 – 11/23. 2.2.3.3 Turbidity
Turbidity was measured simultaneously using two methodologies at the McCloud Creek TTS station during the 2019 WY. A DTS-12 turbidity sensor (Forest Technology Systems, LTD., Victoria, B.C., Canada) was used to measure water turbidity (Formazin Nephelometric Units [FNU]) in the field. Coincident water samples were collected using an ISCO 3700C water sampler (Teledyne ISCO, Lincoln, Nebraska) during each field visit and automatically based on established turbidity thresholds.

Green Diamond Resource Company WDR, Order No. R1-2012-0088 2018 Annual Report
Page 9 of 21
During the 2019 WY, 218 water samples were collected for measuring turbidity. Most water samples (96%) were collected by automated turbidity threshold sampling (n = 217) and the remainder were collected manually during site visits (n = 10). Water samples were brought to the laboratory and a Hach 2100N turbidimeter (Hach Company, Loveland, Colorado) was used to measure turbidity (Nephelometric Turbidity-Ratio Units [NTRU]). A relationship between the lab and field turbidity measurements was analyzed to develop a regression equation (Figure 4). A nonlinear relationship between turbidity readings from these two sensors was expected (Lewis et al. 2007) and a second-order polynomial relationship was found to be the best fit for the data collected during the 2019 WY. This regression equation was then applied to lab sample turbidities to assist in reconstructing missing field turbidity, smoothing erratic values, or verifying turbidity spikes.
Figure 4. Relationships between coincident field turbidity measurements (FNU) and lab turbidity measurements (NTRU) collected at the McCloud Creek TTS station during the 2019 WY. 2.2.3.4 Continuous Turbidity
A DTS-12 sensor was used to measure continuous turbidity (FNU) at 10-minute intervals throughout the 2019 WY (Figure 5). Where turbidity values were missing or erroneous due to equipment failure or measurable range exceedance, values were estimated using the stage-based regressions, values derived from ISCO samples (when possible), or
y = -0.0002x2 + 1.2342x + 5.9989R² = 0.996
0
200
400
600
800
1000
1200
1400
1600
1800
0 500 1000 1500 2000 2500 3000
Fiel
d T
urb
idit
y (F
NU
)
Lab Turbdity (NTRU)
Field vs Lab Turbidity
Series1
Poly. (Series1)

Green Diamond Resource Company WDR, Order No. R1-2012-0088 2018 Annual Report
Page 10 of 21
interpolated using adjacent valid data. The type of estimates used for missing or erroneous data was noted and can be found in the electronic data file (Appendix A).
Figure 5. Continuous Time-Series of turbidity collected by the instream DTS at McCloud Creek TTS site during the 2019 WY. 2.2.3.5 Grab Sample Data Summary
A total of 227 water samples were collected (10 manual and 217 automated) during the 2019 WY. Manual grab samples were only taken if the station turbidity read >30 FNU. These were collected using the ISCO sampler with a manual override, and were primarily used as laboratory quality control samples. The collection times for manual and automated (i.e., turbidity threshold) grab samples were compiled and overlaid on the continuous turbidity estimate for the 2019 WY (Figure 6).

Green Diamond Resource Company WDR, Order No. R1-2012-0088 2018 Annual Report
Page 11 of 21
Figure 6. Continuous estimated turbidity and timing of turbidity threshold ISCO samples at the McCloud Creek TTS station during the 2019 WY.
2.2.3.6 Suspended Sediment Concentrations
The relationship between suspended sediment concentration (SSC, in mg/L) of the ISCO samples and the turbidity (FNU) from DTS-12 for the 2019 WY was established as a power curve (Figure 7). The initial assessment of this relationship is relatively simplistic and a better fit of these data may be possible through an assessment of additional relationships and variables. The relationship between SSC and turbidity can change over the course of the year either between or within storm events (Lewis 1996). In order to establish stronger relationships we analyzed individual storm events and, if possible, between rising and falling limbs of the storms. These relationships were broken into 11 different ratings, plotted in log-log space, and had a power regression applied. These equations can then be used to derive a continuous SSC dataset based on FNU (Figure 8). An analysis of these data is recommended to estimate the most accurate annual sediment load.
0
200
400
600
800
1000
1200
1400
1600
1800
2000
10/1/18 11/20/18 1/9/19 2/28/19 4/19/19 6/8/19
Turb
dit
y (F
NU
)
Date
Turbidity Time-Series with ISCO sample times plotted
Turbidity Time-Series (FNU)
ISCO Lab Samples

Green Diamond Resource Company WDR, Order No. R1-2012-0088 2018 Annual Report
Page 12 of 21
Figure 7. Relationship between turbidity and SSC for the McCloud Creek TTS station during the entire 2019 WY. This graph is an overview of the entire year. Final SSC was estimated based on relationships between SSC and FNU on a storm by storm basis.
y = 0.1755x1.4136
R² = 0.9384
1
10
100
1000
10000
10 100 1000 10000
SSC
FNU
FNU vs SSC
Series1
Power (Series1)

Green Diamond Resource Company WDR, Order No. R1-2012-0088 2018 Annual Report
Page 13 of 21
Figure 8. Derived Suspended Sediment Concentration (SSC) based on the 11 relationships identified for the 2019 WY.
3.0 Summary of Field Problems Encountered and Resolutions
A summary of problems encountered and resolutions were compiled for the 2019 WY (Table 4). Typical problems encountered included but were not limited to: site access limitations, Druck offset adjustments, stage plate adjustments, missed ISCO samples, overfilled ISCO samples, and equipment damage, repair, or maintenance.

Comment Type Start Date Comment Resolution Resolution Date
Problem 11/20/18 Upon arrival to site datalogger reads "Next bottle = 50", ISCO was off. 48 missed samples.
ISCO was left off last site visit. Turned ISCO on and took 1 manual sample and made it ISCO sample #49 in TTS.NET
11/26/18
Problem 11/26/18 DTS observed to be out of the water upon arrival to site.
Placed DTS back in stream at standard 6/10 depth.
11/26/18
Problem 11/30/18 Around 100 mL water observed in ISCO base. High volumes observed in ISCO slots 9-13 of DD #3.
11/30/18
Problem 12/01/18 ~ 100mL of water observed in ISCO base. Low volumes observed in ISCO slots 1-2 of DD #4.
McCloud has had this issue for at least 2 water years. Starting to suspect a bad distributor arm. Lengthened pump tubing exiting arm and less water is being lost to the base.
12/07/08
Problem 12/19/18 Empty sample observed in ISCO slot 13 and high samples in slots 7-12 of DD #6.
Changed data exception type to "NULL" in TTS.NET for bottle 13. Tightened distributer arm nut.
12/19/18
Problem 12/19/18 Around 150 mL water observed in ISCO base
12/19/18
Problem 12/19/18 DTS is sitting too low in the water column.
Raised DTS so that sensor is at standard 6/10 depth.
12/19/18
Problem 12/27/17 Empty sample observed in ISCO slots 5-10 of DD #7.
Changed data exception type to "NULL" in TTS.NET for bottles 5-10. DTS was probably propped out of the water by debris.
12/27/17
Problem 01/10/19
ISCO pump tubing requires rotation.
Rotated ISCO pump tubing and reset pump tubing counter. Tested with additional manual sample and obtained OK sample volume.
01/10/19
Problem 01/10/19 DTS is sitting too low in the water column.
Raised DTS so that sensor is at standard 6/10 depth.
01/10/19
Problem 01/18/19 Stage plate difficult to read in fast flows. Observed stage plate measurement is an approximation (+/- 0.02'). Will monitor future stage plate measurements and edit if necessary.
01/18/19
Problem 01/23/19 High volumes observed in samples 6-10 of DD #10.
Calibrated sample volume in ISCO settings. Tested with additional manual sample and obtained OK sample volume without changing observed volume.
Problem 02/11/19 DTS is sitting too low in the water column.
Raised DTS so that sensor is at standard 6/10 depth.
02/11/19

Green Diamond Resource Company WDR, Order No. R1-2012-0088 2018 Annual Report
Page 15 of 21
Problem 02/11/19
Stage plate difficult to read in fast flows.
Observed stage plate measurement is an approximation (+/- 0.02). Will monitor future stage plate measurements and edit if necessary.
02/11/19
Problem 02/11/19 Organic debris observed to be built up around DTS housing upon arrival to the site. Sensor optics were obscured causing erratic turbidity data.
Removed debris that had been built up around DTS housing.
02/11/19
Problem 02/11/19 Around 150 mL water observed in ISCO base
02/11/19
Problem 02/11/19 Empty samples observed in ISCO slots 16-21 of DD #12.
Battery died due to cold weather. Issued generic BID#'s 9998-9993 and changed data exception type to "NULL" in TTS.NET.
02/11/19
Problem 02/18/19 Organic debris observed to be built up around DTS housing upon arrival to the site.
Removed leaf debris that had been built up around DTS housing.
02/18/19
Problem 02/18/19 E-stage does not match observed stage measurement, is off by + 0.04'.
Recalculated stage offset so that e-stage matches observed stage measurement.
02/18/19
Problem 02/18/19
Slight amount of water (approximately 50 mL) observed in ISCO base.
If applicable: "OK sample volumes observed in ISCO slots 1-12 and in manual Grab and Controls samples of DD #13. Checked tube in ISCO distributor arm and length was appropriate. Will monitor and adjust ISCO settings if necessary."
02/18/19
Problem 02/27/19 Druck broke free of t-post and was floating in the creek.
Attached Druck to t-post and recalculated offset.
03/04/19
Problem 02/27/19 Upon arrival to site datalogger reads "Next bottle = 99", ISCO reads "Next bottle = 25".
DTS broke free of backstay and was bobbing in and out of water. Unable to reach site due to high flows. Advanced data dump count and reset ISCO so that both datalogger and ISCO read "Next Bottle = 1."
03/04/19

Green Diamond Resource Company WDR, Order No. R1-2012-0088 2018 Annual Report
Page 16 of 21
Problem 03/04/19 ISCO suction line is clogged. Managed to break up clog and get ISCO back in working order. Not sure how it clogged, sediment? Recalibrated ISCO.
03/04/19
Problem 03/13/19 Organic debris observed to be built up around DTS boom upon arrival to the site.
Removed leaf debris that had been built up around DTS boom.
03/13/19
Problem 03/13/19 DTS is sitting too high in the water column.
Lowered DTS so that sensor is at standard 6/10 depth.
03/13/19
Problem 03/13/19 E-stage does not match observed stage measurement, is off by -0.405'.
Recalculated stage offset so that e-stage matches observed stage measurement.
03/13/19
Problem 03/22/19 DTS is sitting too high in the water column.
Lowered DTS so that sensor is at standard 6/10 depth.
03/22/19
Problem 04/19/19 DTS is sitting too high in the water column.
Lowered DTS so that sensor is at standard 6/10 depth.
04/19/19
Problem 04/19/19 Moved log that used to be stairs out of the channel.
04/19/19
Problem 04/25/19 DTS is sitting too high in the water column.
Lowered DTS so that sensor is at standard 6/10 depth.
04/25/19
Problem 05/24/19 DTS is sitting too low in the water column.
High DTS so that sensor is at standard 6/10 depth.
05/24/19
Problem 05/30/19 DTS is sitting too high in the water column.
Lowered DTS so that sensor is at standard 6/10 depth.
05/30/19
Problem 05/30/19 E-stage does not match observed stage measurement, is off by +0.02.
Will monitor and re-calculate stage offset if necessary.
05/30/19
Table 4. Summary of field problems encountered and resolutions at the McCloud Creek TTS station during the 2019 WY.

4.0 Quality Assurance Summary
Special training is required for all GDRCo staff involved in the implementation of this project. During the 2019 WY, 6 individuals participated in some part of the implementation of field and lab standard operating procedures. All personnel were trained prior to performing assigned work tasks and responsibilities. The Lead Watershed Technician was appointed by the Project Supervisor to perform the training and certification of the watershed staff during the 2019 WY (Table 5). Training was performed on all aspects of field work including: cleaning and adjusting equipment, downloading of data, exchanging ISCO samples, and taking discharge measurements. Training in the laboratory included: preparing filters, taking turbidity measurements, filtering and weighing of suspended sediment, and recording data. Data management training included: data entry, QA/QC, and updating files. The chain-of-custody for all phases of project implementation was tracked. Table 5. Summary of initial training dates for certifications completed by GDRCo staff involved in field and lab activities during the 2019 WY. Employees have annual refresher training before the beginning of each water year.
Personnel Role Lab Certification
Field Methods Certification
Data Management Certification
Matt House Project Supervisor 12/15/11 11/02/11 12/15/11
Pat Righter Technical Leader 12/15/11 11/02/11 12/15/11
Jonathan O’Connell Lead Watershed Technician
04/01/16 04/01/16 04/01/16
Megan Falk Watershed Technician
1/29/18 1/29/18 1/29/18
Sean Studer Watershed Technician
1/10/17 1/10/17 1/10/17
Michael Zontos Lab Assistant 10/01/15 N/A N/A
Among the turbidity samples collected and measured, no outliers were identified and excluded from the FNU-NTRU regression analysis. Outliers are identified empirically by graphing lab vs turbidity values. Generally there is a tight relationship (R^2 > 95%) between the two measurements so errors and outliers tend to stand out. In order to evaluate the consistency of laboratory processing for turbidity and SSC, GDRCo performed a QA/QC test using paired grab and control water samples collected during site visits. Controls were taken at every site visit in case field turbidity needed to be verified. Grabs were taken in addition to controls if field turbidity was reading ≥ 30 FNU. Grabs are taken back to be immediately processed in the lab while controls are stored in a refrigerator until the end of the water year. Hydrochloric acid is added to each control sample that is placed in the refrigerator to help preserve it for later processing. At the end of the water year a subsample of grabs and paired controls are processed for turbidity and SSC to assess lab repeatability. Due to low flows for the
Green Diamond Resource Company WDR, Order No. R1-2012-0088 2018 Annual Report
Page 18 of 21
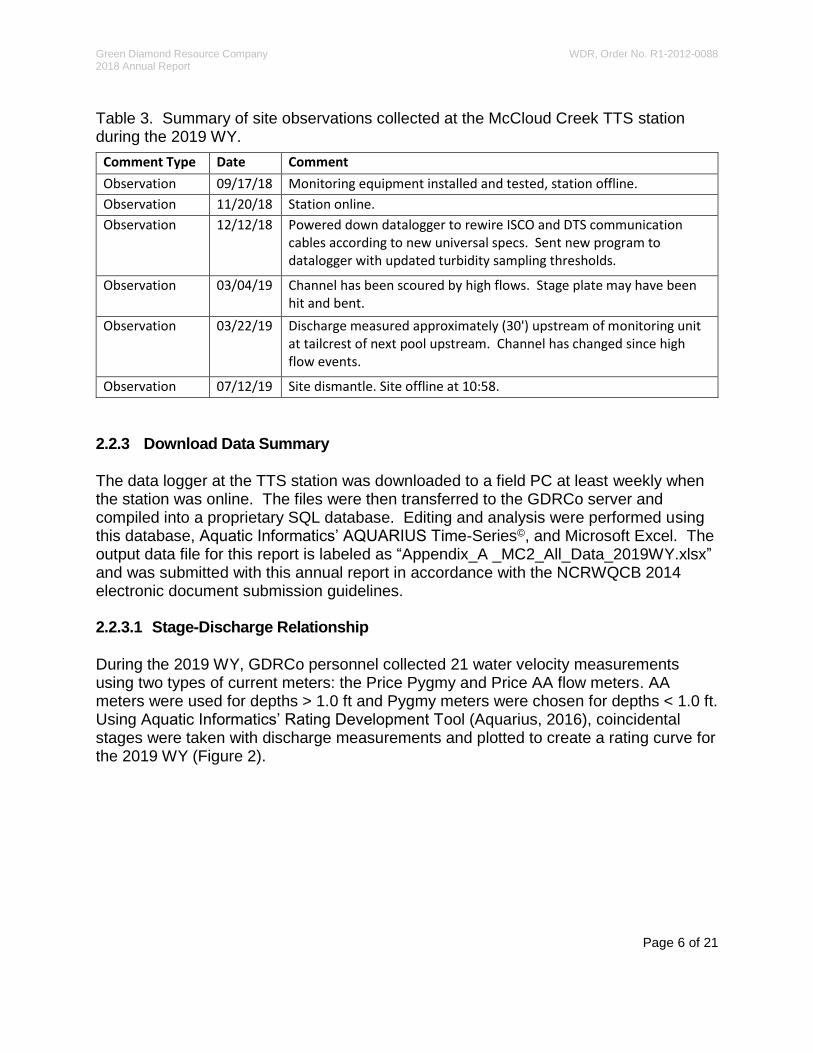
2019 WY, 3 grab and control samples were processed for McCloud. These samples were collected during routine site visits, using the ISCO pump sampler. The relationships between the paired grab and control samples for turbidity and SSC were established (Figures 9 and 10, respectively) using data from 12 TTS sites including McCloud. The relationships for both turbidity and SSC among the remaining samples were linear and strong; indicating that the separate laboratory processes produced nearly identical values between paired water samples. One outlier was identified at another site where the Grab SSC was higher than the Control SSC. It was concluded that the DTS was moved in between samples which would affect the SSC. Further training will insure that the DTS is not moved between samples to ensure comparable samples are taken from the water column.
Figure 9. Relationship between turbidity (NTRU) of paired control and grab samples collected across 12 sites during the 2019 WY.
y = 0.9965x - 0.3645R² = 0.9971
0
100
200
300
400
500
600
700
800
900
0 200 400 600 800 1,000
Co
ntr
ol N
TRU
Grab NTRU
Control vs Grab Turbidity
Control vs Grab
MC2
Linear (Control vs Grab)

Green Diamond Resource Company WDR, Order No. R1-2012-0088 2018 Annual Report
Page 19 of 21
Figure 10 Relationship between suspended sediment concentration (SSC) of paired control and grab samples collected across 12 sites during the 2019 WY. All equipment was maintained and calibrated within the frequency defined in Section B6 of the Turbidity Threshold Sampling QAPP submitted by GDRCo. The DTS-12 sensors were calibrated by FTS August 22, 2018 prior to deployment. The Hach 2100N was calibrated every 3 months with Formazin StableCal® standards and weekly during the monitoring season using Gelex Secondary standards and receives yearly calibration and maintenance from HACH. The Druck pressure transducer was calibrated by the GDRCo watershed staff on August 8, 2018 to ensure proper operation prior to deployment. Finally, current meters used during the monitoring season received calibrations at least weekly. At times there can be complications regarding the DTS-12 turbidity sensor, resulting in missing, or “noisy”, data. When this happened, the “cleaning” of the data was applied conservatively. In the case of missing data, values were generated using the methods described in Section 2.2.3.4 and are noted in the electronic data file (Appendix A). Two different approaches were used to address “noisy” turbidity data where there was no association with fluctuations in stage. If the turbidity recordings prompted an ISCO sample that verified there was no increase in SSC, that turbidity value was interpolated from adjacent values. If there was no associated ISCO sample, which can happen when the turbidity increases didn’t cross set thresholds, the value was left and no “cleaning” took place.
y = 0.9892x - 8.9481R² = 0.9852
0
200
400
600
800
1,000
1,200
1,400
0 200 400 600 800 1,000 1,200 1,400
Co
ntr
ol m
g/L
Grab mg/L
Control vs Grab SSC Outlier Removed
Contro vs Grab SSC OutliersRemoved
Outlier
MC2
Linear (Contro vs Grab SSCOutliers Removed)

Green Diamond Resource Company WDR, Order No. R1-2012-0088 2018 Annual Report
Page 20 of 21
5.0 Other Problems Encountered
During larger storm events, it is often unsafe to cross SF Elk River, preventing access to the McCloud Creek TTS site. In WY 2019, two site visits were missed due to unsafe conditions. This can affect data quality with respect to discharge, turbidity, and SSC. The inability to obtain discharge measurements at higher stages is a limitation when estimating discharges above the measured values. Given that the channel geometry at the monitoring site is substantially different above the range of empirical discharge measurements, we assume that the actual relationship is likely different than that predicted here for discharges above this range. Water sample data can also be affected when GDRCo staff cannot access the site to exchange ISCO bottles, because it leads to missed water samples during prolonged storm events. No samples were missed in 2019 for this reason. These events are usually associated with higher sediment loads, and calculation of discharge and sediment load require extrapolation from relationships established at low to medium flow conditions, resulting in low confidence in the higher sediment load estimates. This will be an ongoing challenge throughout the duration of the monitoring project. We have seen from our data that the relationship between field turbidity (FNU) and the coincident laboratory suspended sediment concentration (SSC) changes over time. In 2016, Green Diamond purchased Aquatic Informatics’ Aquarius Time-Series software to better analyze this relationship, as well as for other data-management goals. Using this software, we identified 11 different turbidity-SSC relationships. Applying these regression equations to the FNU data set we can then derive a continuous data-set of SSC (Figure 8). The single, simplified relationship provided in this report, Figure 7, should be used with caution if deriving a sediment load.

Green Diamond Resource Company WDR, Order No. R1-2012-0088 2018 Annual Report
Page 21 of 21
Literature Cited Lewis, J. 1996. Turbidity-controlled suspended sediment sampling for runoff-event load estimation. Water Resources Research, 32(7), Pp. 2299-2310. Lewis, J., R. Eads, and R. Klein 2007. Comparisons of Turbidity Data Collected with Different Instruments, Report on a Cooperative Agreement Between the California Department of Forestry and Fire Protection and USDA Forest Service--Pacific Southwest Research Station (PSW Agreement # 06-CO-11272133-041); July 6, 2007, P 27.
Lewis, J. and R. Eads 2008. Implementation guide for turbidity threshold sampling: principles, procedures, and analysis. Gen. Tech. Rep. PSW-GTR-212. Arcata, CA: U.S. Department of Agriculture, Forest Service, Pacific Southwest Research Station.
McCuen, R.H. and Synder, W.M. 1986. Hydrologic Modeling: Statistical Methods and Applications. Prentice Hall,
Englewood Cliffs, NJ, pp 83-93.
United States Environmental Protection Agency 1999. 1998 California 303(d) list of TMDL priority schedule.
303(d) Impaired Water Bodies/ 303(d) list. Retrieved October 26, 2012,
from:http://www.waterboards.ca.gov/rwqcb4/water_issues/programs/303d_list.shtml.
Manning, R. (1891). "On the flow of water in open channels and pipes". Transactions of the Institution of Civil
Engineers of Ireland. 20: 161–207.
AQUARIUS Time-Series version 3.10.331. Vancouver, British Columbia: Aquatic Informatics Inc., 2016.
Appendix A
Electronic copy (file name = Appendix_A_MC2_All_Data_WY2019.xlsx) of data collected at the McCloud TTS site during the 2019 WY. This file was submitted as an email attachment to the NCRQCB in accordance with the 2014 electronic document
submission guidelines.


![[Scott Mccloud] Making Comics Storytelling Secret(BookFi.org)](https://img.pdfslide.net/doc/110x75/55cf9bce550346d033a770fa/scott-mccloud-making-comics-storytelling-secretbookfiorg.jpg)


![[2000] Reiventando os Quadrinhos - Scott McCloud](https://img.pdfslide.net/doc/110x75/568c4c961a28ab4916a0bd0c/2000-reiventando-os-quadrinhos-scott-mccloud.jpg)


![[book] SCOTT McCLOUD - reinventando os quadrinhos.pdf](https://img.pdfslide.net/doc/110x75/577c7d061a28abe0549d0f46/book-scott-mccloud-reinventando-os-quadrinhospdf.jpg)

![[2006] Desenhando Quadrinhos - Scott McCloud](https://img.pdfslide.net/doc/110x75/568bd5431a28ab203497cf7d/2006-desenhando-quadrinhos-scott-mccloud.jpg)