Embed Size (px)
Citation preview
ANNUAL REPORTFOR THE YEAR ENDED 31 DECEMBER 2017
Births, Marriages and Deaths
GOVERNMENT OF BERMUDAMinistr y of Home Affairs
Registry General
GOVERNMENT OF BERMUDAMinistr y of Home Affairs
Registry General
ANNUAL REPORTFOR THE YEAR ENDED 31 DECEMBER 2017
Births, Marriages and Deaths
ii
SCHEDULE OF TABLES AND FIGURES ........................................................................................... iii
COMMENTS FROM THE REGISTRAR GENERAL ............................................................................. iv
GENERAL INFORMATION ............................................................................................................... 1Births ............................................................................................................................................ 1Deaths .......................................................................................................................................... 1Marriages ..................................................................................................................................... 1
POPULATION .................................................................................................................................. 3Resident Population.................................................................................................................... 3
BIRTHS ............................................................................................................................................ 4Distribution of Live Births by Sex and Natal Status – 2013 to 2017 ..................................... 4Distribution of Live Births by Parish ......................................................................................... 4Multiple Births ............................................................................................................................. 5Distribution of Live Births by Age of Mother .......................................................................... 6Distribution of Live Births by Nationality ................................................................................. 8Additional Vital Events ............................................................................................................... 8
MARRIAGES ...................................................................................................................................10Statistics Relating to Marriages – 2013 to 2017 .................................................................... 10Distribution of Marriages by Religion/Denomination ........................................................... 11Marriage Venues ....................................................................................................................... 11Persons Marrying by Age Group of Partners ........................................................................ 12Distribution of Marriages by Residential Status of Partners ................................................ 13Same-Sex Marriages ................................................................................................................. 14Marriage Venues ....................................................................................................................... 14Distribution of Persons Marrying by Age Group of Partners ............................................... 15Distribution of Same-Sex Marriages by Residential Status of Partners ............................... 16Maritime Marriages .................................................................................................................. 16
DEATHS .........................................................................................................................................17Death Statistics Including Stillbirths – 2013 to 2017 ............................................................. 17Distribution of Deaths by Age and Sex – 2013 to 2017 ....................................................... 17Distribution of Deaths by Age and Sex – 2017 ...................................................................... 19Distribution of Deaths by Age and Parish of Residence of the Deceased .......................... 20Infant Mortality Rates .............................................................................................................. 21Deaths of Non-Residents – 2017 ............................................................................................. 21Coroners’ Cases ........................................................................................................................ 21
APPENDIX .................................................................................................................................... 22Table A – Births, Marriages, Deaths and Population Estimates – 2013 to 2017 ................. 22Figure A – Births, Marriages and Deaths – 2013 to 2017 ..................................................... 22
CONTENTS
iii
Table 1.0 Summary Statistics ............................................................................................................. 2
Figure 1.0 Population Estimates – 2013 to 2017 ............................................................................... 3
Table 2.0 Distribution of Live Births by Sex and Natal Status – 2013 to 2017 ............................. 4
Table 2.1 Distribution of Live Births by Sex, Natal Status and Parish – 2017 ............................... 5
Table 2.2 Distribution of Multiple Births by Sex – 2013 to 2017 ................................................... 5
Figure 2.0 Distribution of Live Births by Age of Mother and Natal Status – 2017 ........................ 6
Table 2.3 Distribution of Live Births by Age of Mother of Children Born In Wedlock – 2013 to 2017 ....................................................................................... 7
Table 2.3 Distribution of Live Births by Age of Mother of Children Born Out of Wedlock – 2013 to 2017 ............................................................................... 7
Table 2.3 Distribution of All Live Births by Age of Mother – 2013 to 2017 .................................. 7
Table 2.4 Distribution of Live Births by Nationality ......................................................................... 9
Table 3.0 Distribution of Marriages by Type of Ceremony – 2013 to 2017 ................................ 10
Table 3.1 Distribution of Marriages by Religion/Denomination – 2013 to 2017......................... 11
Table 3.2 Distribution of Marriages by Parish and Venue – 2017 ................................................ 12
Table 3.3 Distribution of Persons Marrying by Sex and Age Group of Partners – 2016 and 2017 ....................................................................... 13
Table 3.4 Distribution of Marriages by Residential Status – 2013 to 2017 ................................. 14
Table 3.5 Distribution of Same-Sex Marriages by Type of Ceremony – 2017 ............................ 14
Table 3.6 Distribution of Marriages by Parish and Venue - 2017 ................................................ 15
Table 3.7 Distribution of Persons Marrying by Sex and Age of Partner .................................... 16
Table 3.8 Distribution of Same-Sex Marriages by Residential Status .......................................... 16
Table 4.0 Distribution of Deaths by Sex and Stillbirths – 2013 to 2017 ...................................... 17
Table 4.1 Distribution of Deaths by Age and Sex – 2013 to 2017 ............................................... 18
Table 4.2 Distribution of Deaths by Age and Sex – 2017 ............................................................. 19
Table 4.3 Distribution of Deaths by Age and Parish of Residence of the Deceased – 2017 ........................................................................................................ 20
Table 4.4 Infant Mortality – 2017 .................................................................................................... 21
Table 4.5 Deaths of Non-Residents – 2013 to 2017 ...................................................................... 21
Table A Births, Marriages, Deaths and Population Estimates – 2013 to 2017 ......................... 22
Figure A Births, Marriages and Deaths – 2013 to 2017 ............................................................... 22
SCHEDULE OF TABLES AND FIGURES
iv
I have the pleasure of presenting the Annual Report for the year ended December 31, 2017 which has been diligently prepared in accordance with Section 19 of the Registration (Births and Deaths) Act 1949. In full recognition of the role of the Registrar General in the compilation of vital statistical information and the important role that it plays in planning for the provision of services in areas such as education, health and tourism to name a few, I have taken the necessary steps to ensure that the highest quality is maintained in the recording, collating and presenting of the data to be included in the Annual Report.
This Annual Report is concerned and focuses principally on vital statistics in respect of the resident population of Bermuda. The Annual Report seeks to provide an illustrative statistical digest of vital events such as live births, deaths, foetal deaths (stillbirths), marriages, adoptions and re-registrations of births.
In the preparation of this report, I have relied on information received from the Records Office of the King Edward VII Memorial Hospital relating to births; from the local funeral directors and medical practitioners in relation to deaths and from local marriage officers and Masters of Bermuda registered ships in relation to local and maritime marriages respectively. The occurrence of sudden deaths is reported to the Registrar General by the Coroners’ Office and Officers of the Magistrates’ Court are responsible for informing the Registrar General of adoptions that take place on the Island.
The population estimates for the year ended December 31, 2017 are based on the 2016 Census figures. The excess number of live births over deaths for each year since then has been added to the base figures to compute the population statistics. No consideration has been given to the effect of emigration or immigration on the population.
I am grateful and acknowledge the expertise and commitments demonstrated by my staff in the provision of vital registration services to local and overseas residents in 2017 and hereby submit my Annual Report for the year ended December 31, 2017.
Aubrey PennymanRegistrar General
COMMENTS FROM THE REGISTRAR GENERAL
1
BirthsThe Registrar General is notified by the King Edward VII Memorial Hospital Medical Records Department of the births of children born there on a weekly basis. When a child is born at a location other than the hospital, notification is made by the person or persons who attended the birth.
For the year ended 31st December, 2017 the total number of live births recorded in respect of residents was 576; a decrease of 15 or 2.5% from the 591 births recorded in 2016.
The live birth rate marginally increased from 9.1 births per 1,000 in 2016 to 9.2 births per 1,000 in 2017.
The number of births that occurred out of wedlock in 2017 decreased by 5.6% from the number of out of wedlock births for the previous year. The out of wedlock distribution of births occurring during the five-year period 2013 to 2017 ranged from a high of 45.6% in 2015 to a low of 38.9% in 2014.
DeathsThe Registrar General receives notices of deaths occurring on the Island and within Bermuda’s territorial waters from local funeral directors. The notices of deaths are sent to the Registrar General by the Coroners’ Office in cases where inquests have been held into the causes of deaths.
A total of 494 deaths were recorded for the year ended 31st December, 2017. This figure consists of 481 deaths of residents and 13 deaths of non-residents. The number of stillbirths recorded for 2017 was zero.
A death rate of 7.5 per thousand of the population for 2017 was identical to the rate recorded in 2016.
MarriagesThe Registrar General received information pertaining to marriages celebrated on the Island from local marriage officers. Information in respect of marriages that take place on the high seas aboard Bermuda registered ships is provided by the Masters of these ships.
There were 440 marriages performed in Bermuda for the year ended 31st December, 2017, a 2.3% decrease from the 450 marriages recorded in 2016. Out of the 440 marriages, 234 or 53.2 % of the marriages took place between parties who were both non-residents; 164 or 37.3% of the marriages between parties who were both residents and 42 or 9.5% of the marriages between a resident party and a non-resident party. There was a 3.5% decrease in maritime marriages recorded in 2017 when comparing 452 marriages to 468 maritime marriages recorded in 2016.
Table 1.0 contains a summary of the statistics of births, deaths and population estimates as of 31st December, 2017.
GENERAL INFORMATION
2
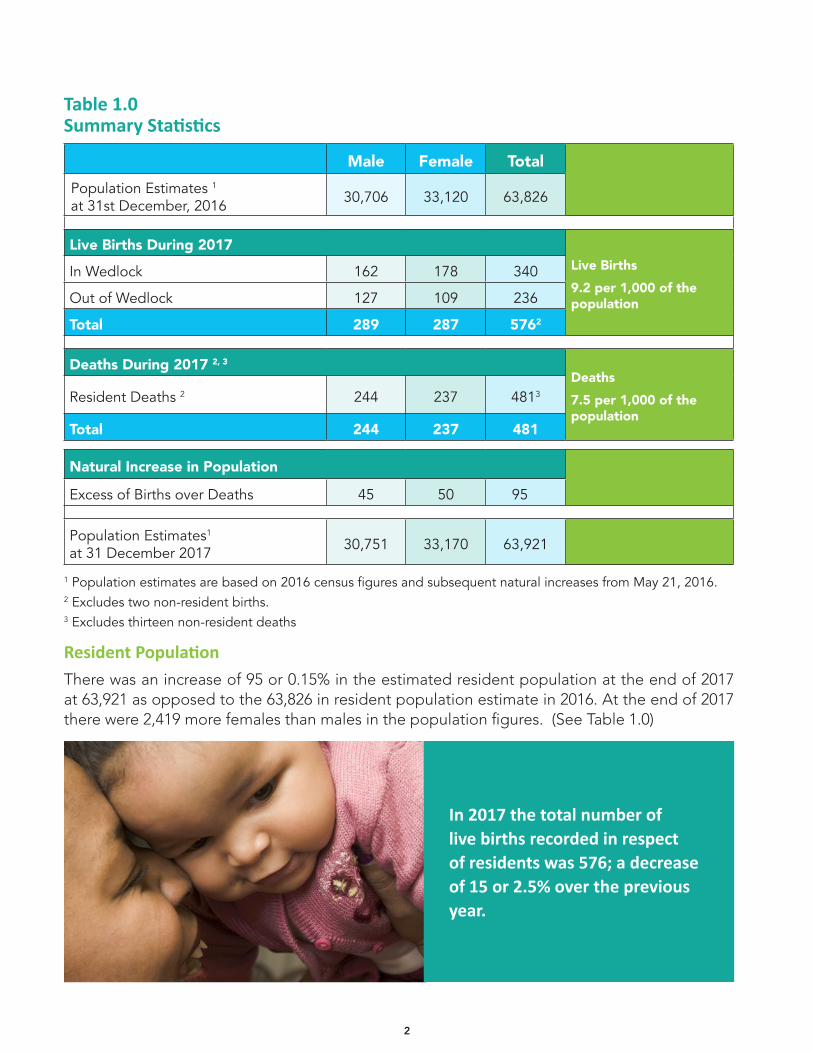
Table 1.0 Summary Statistics
Male Female TotalPopulation Estimates 1 at 31st December, 2016 30,706 33,120 63,826
Live Births During 2017Live Births9.2 per 1,000 of the population
In Wedlock 162 178 340
Out of Wedlock 127 109 236
Total 289 287 5762
Deaths During 2017 2, 3
Deaths7.5 per 1,000 of the population
Resident Deaths 2 244 237 4813
Total 244 237 481
Natural Increase in Population
Excess of Births over Deaths 45 50 95
Population Estimates1
at 31 December 2017 30,751 33,170 63,921
1 Population estimates are based on 2016 census figures and subsequent natural increases from May 21, 2016.2 Excludes two non-resident births.3 Excludes thirteen non-resident deaths
Resident PopulationThere was an increase of 95 or 0.15% in the estimated resident population at the end of 2017 at 63,921 as opposed to the 63,826 in resident population estimate in 2016. At the end of 2017 there were 2,419 more females than males in the population figures. (See Table 1.0)
In 2017 the total number of live births recorded in respect of residents was 576; a decrease of 15 or 2.5% over the previous year.
3
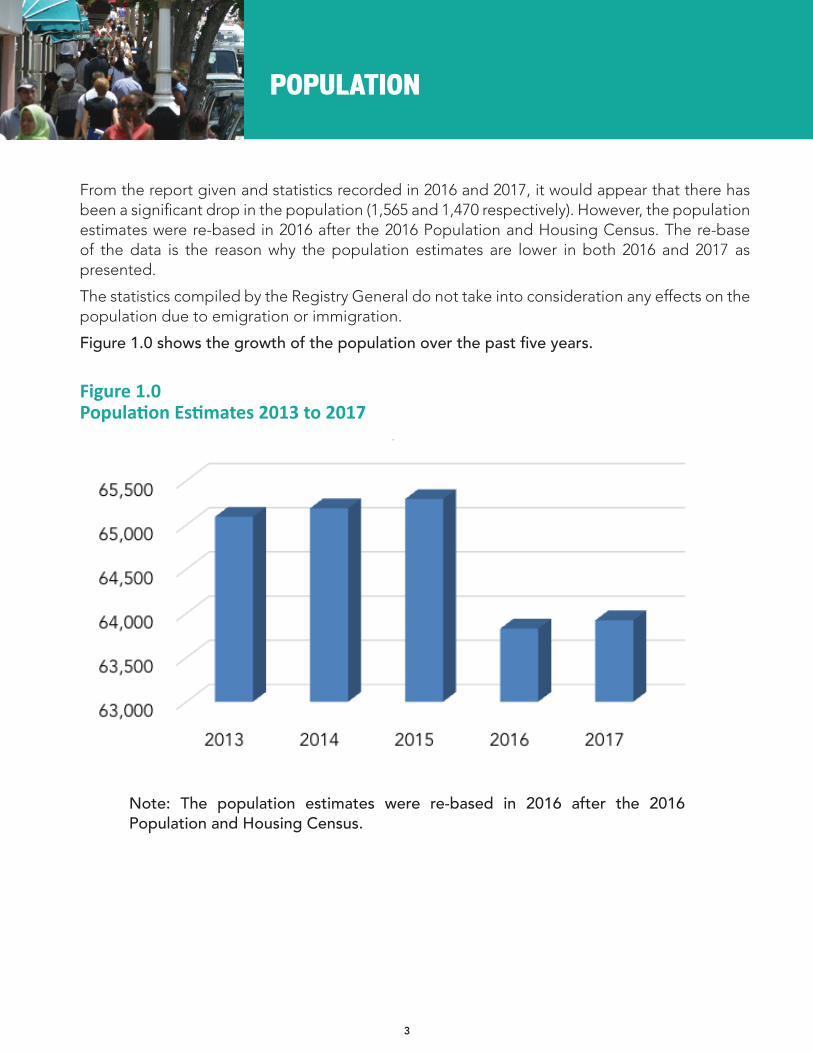
From the report given and statistics recorded in 2016 and 2017, it would appear that there has been a significant drop in the population (1,565 and 1,470 respectively). However, the population estimates were re-based in 2016 after the 2016 Population and Housing Census. The re-base of the data is the reason why the population estimates are lower in both 2016 and 2017 as presented.
The statistics compiled by the Registry General do not take into consideration any effects on the population due to emigration or immigration.
Figure 1.0 shows the growth of the population over the past five years.
Figure 1.0 Population Estimates 2013 to 2017
POPULATION
Note: The population estimates were re-based in 2016 after the 2016 Population and Housing Census.
4
Distribution of Live Births by Sex and Natal Status – 2013 to 2017In 2017 the total number of live births of 576 births reflects a decrease of 15 or 2.5% over the previous year. The live births in respect of residents recorded in 2016 were 591. Out of the total number of live births recorded in 2017, 289 were male and 287 were female. In 2016, 303 male and 288 female live births were recorded.
There were three babies born at the parent’s homes in St. George’s, Smith’s, and Southampton parishes. This is a decrease of 8 from the eleven babies born at home in 2016.
The total number of births for the year 2017 born out of wedlock was 236, a decrease of 14 from the previous year. A cumulative total of 2,975 live births were recorded for the five-year period from 2013 to 2017. The overall percentage of live births occurring out of wedlock was 41.0% over the same five-year period.
Table 2.0 shows the distribution of births by sex and natal status for the years 2013 to 2017.
Table 2.0 Distribution of Live Births by Sex and Natal Status – 2013 to 2017
In Wedlock Out of Wedlock Live Births % Out ofWedlockYear Male Female Total Male Female Total Male Female Total
2013 187 188 375 136 140 276 323 328 651 42.4
2014 177 174 351 112 111 223 289 285 574 38.9
2015 164 153 317 131 135 266 295 288 583 45.6
2016 168 173 341 135 115 250 303 288 591 42.3
2017 162 178 340 127 109 236 289 287 576 40.1
Total 858 866 1,724 641 610 1,251 1,499 1,476 2,975 42.1
Distribution of Live Births by ParishThe majority of babies are born at the King Edward VII Memorial Hospital in Paget parish. However, for the purpose of this Report, the statistics shown in Table 2.1 below, relate to the parishes of residence of the mothers of the new-borns at the time of birth and not to the parishes where the babies were actually born. The highest number of births by parish out of an island-wide total of 576 was recorded among the residents of Warwick parish who were responsible for 105 or 18.2% followed by the residents of Pembroke parish who were responsible for 95 or 16.5% of the total number of births recorded.
BIRTHS
5
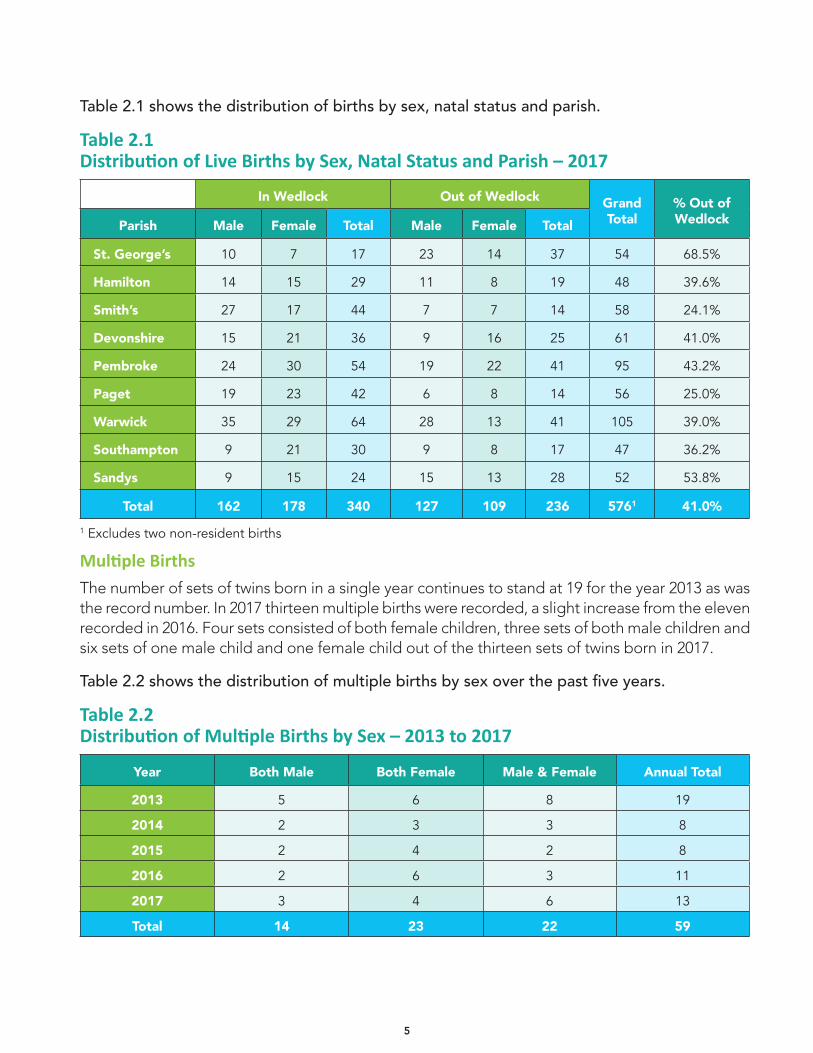
Table 2.1 shows the distribution of births by sex, natal status and parish.
Table 2.1 Distribution of Live Births by Sex, Natal Status and Parish – 2017
In Wedlock Out of Wedlock GrandTotal
% Out ofWedlockParish Male Female Total Male Female Total
St. George’s 10 7 17 23 14 37 54 68.5%
Hamilton 14 15 29 11 8 19 48 39.6%
Smith’s 27 17 44 7 7 14 58 24.1%
Devonshire 15 21 36 9 16 25 61 41.0%
Pembroke 24 30 54 19 22 41 95 43.2%
Paget 19 23 42 6 8 14 56 25.0%
Warwick 35 29 64 28 13 41 105 39.0%
Southampton 9 21 30 9 8 17 47 36.2%
Sandys 9 15 24 15 13 28 52 53.8%
Total 162 178 340 127 109 236 5761 41.0%1 Excludes two non-resident births
Multiple BirthsThe number of sets of twins born in a single year continues to stand at 19 for the year 2013 as was the record number. In 2017 thirteen multiple births were recorded, a slight increase from the eleven recorded in 2016. Four sets consisted of both female children, three sets of both male children and six sets of one male child and one female child out of the thirteen sets of twins born in 2017.
Table 2.2 shows the distribution of multiple births by sex over the past five years.
Table 2.2 Distribution of Multiple Births by Sex – 2013 to 2017
Year Both Male Both Female Male & Female Annual Total
2013 5 6 8 19
2014 2 3 3 8
2015 2 4 2 8
2016 2 6 3 11
2017 3 4 6 13
Total 14 23 22 59
6
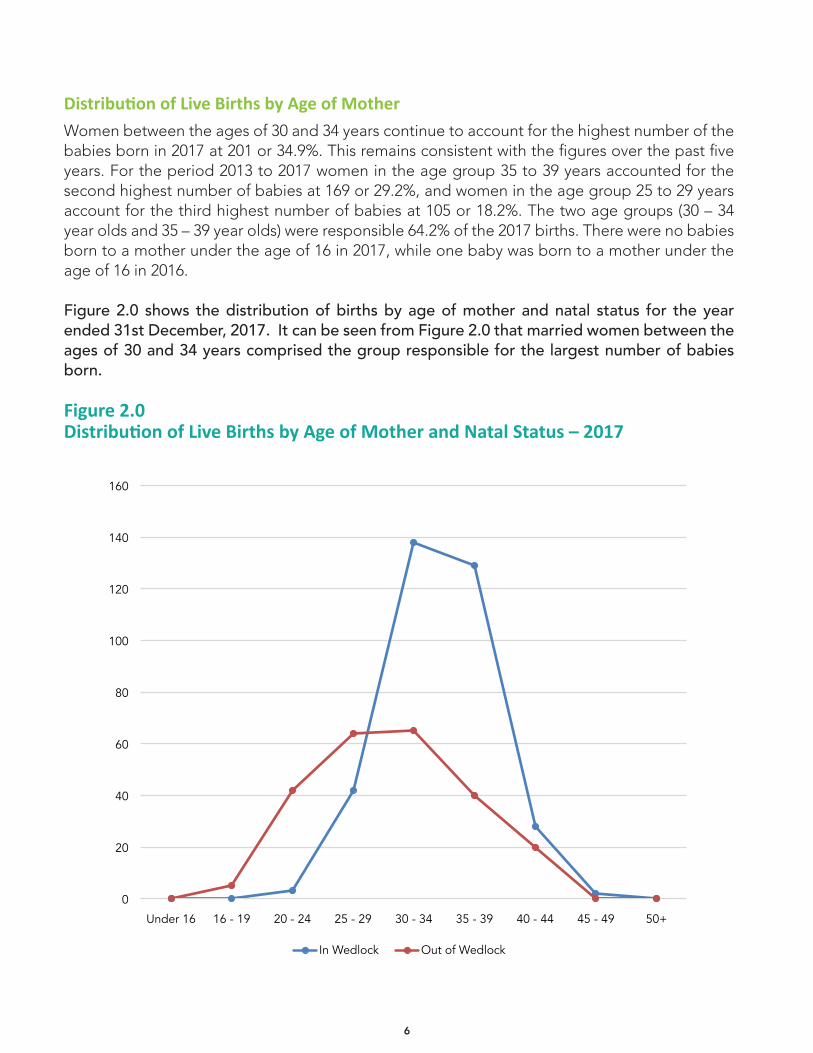
Distribution of Live Births by Age of MotherWomen between the ages of 30 and 34 years continue to account for the highest number of the babies born in 2017 at 201 or 34.9%. This remains consistent with the figures over the past five years. For the period 2013 to 2017 women in the age group 35 to 39 years accounted for the second highest number of babies at 169 or 29.2%, and women in the age group 25 to 29 years account for the third highest number of babies at 105 or 18.2%. The two age groups (30 – 34 year olds and 35 – 39 year olds) were responsible 64.2% of the 2017 births. There were no babies born to a mother under the age of 16 in 2017, while one baby was born to a mother under the age of 16 in 2016.
Figure 2.0 shows the distribution of births by age of mother and natal status for the year ended 31st December, 2017. It can be seen from Figure 2.0 that married women between the ages of 30 and 34 years comprised the group responsible for the largest number of babies born.
Figure 2.0 Distribution of Live Births by Age of Mother and Natal Status – 2017
0
20
40
60
80
100
120
140
160
Under 16 16 - 19 20 - 24 25 - 29 30 - 34 35 - 39 40 - 44 45 - 49 50+
Distribution of Live Births by Age of Mother and Natal Status - 2017
In Wedlock Out of Wedlock
7
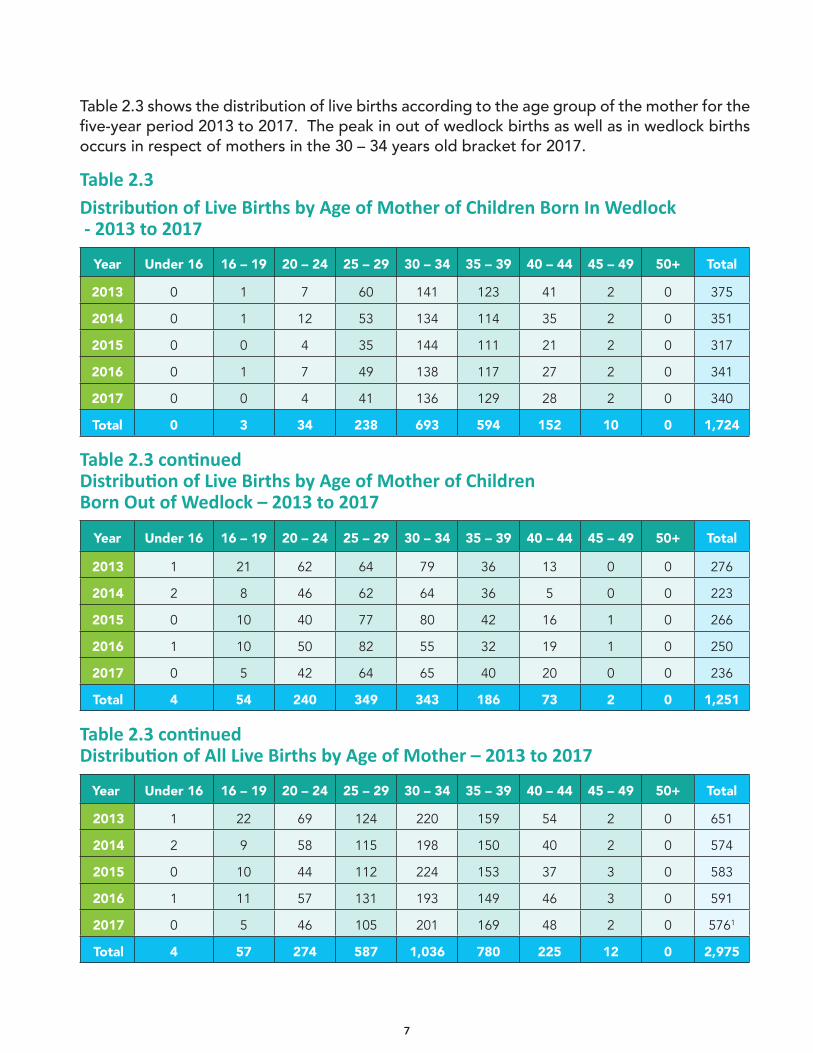
Table 2.3 shows the distribution of live births according to the age group of the mother for the five-year period 2013 to 2017. The peak in out of wedlock births as well as in wedlock births occurs in respect of mothers in the 30 – 34 years old bracket for 2017.
Table 2.3Distribution of Live Births by Age of Mother of Children Born In Wedlock - 2013 to 2017
Year Under 16 16 – 19 20 – 24 25 – 29 30 – 34 35 – 39 40 – 44 45 – 49 50+ Total
2013 0 1 7 60 141 123 41 2 0 375
2014 0 1 12 53 134 114 35 2 0 351
2015 0 0 4 35 144 111 21 2 0 317
2016 0 1 7 49 138 117 27 2 0 341
2017 0 0 4 41 136 129 28 2 0 340
Total 0 3 34 238 693 594 152 10 0 1,724
Table 2.3 continued Distribution of Live Births by Age of Mother of ChildrenBorn Out of Wedlock – 2013 to 2017
Year Under 16 16 – 19 20 – 24 25 – 29 30 – 34 35 – 39 40 – 44 45 – 49 50+ Total
2013 1 21 62 64 79 36 13 0 0 276
2014 2 8 46 62 64 36 5 0 0 223
2015 0 10 40 77 80 42 16 1 0 266
2016 1 10 50 82 55 32 19 1 0 250
2017 0 5 42 64 65 40 20 0 0 236
Total 4 54 240 349 343 186 73 2 0 1,251
Table 2.3 continued Distribution of All Live Births by Age of Mother – 2013 to 2017
Year Under 16 16 – 19 20 – 24 25 – 29 30 – 34 35 – 39 40 – 44 45 – 49 50+ Total
2013 1 22 69 124 220 159 54 2 0 651
2014 2 9 58 115 198 150 40 2 0 574
2015 0 10 44 112 224 153 37 3 0 583
2016 1 11 57 131 193 149 46 3 0 591
2017 0 5 46 105 201 169 48 2 0 5761
Total 4 57 274 587 1,036 780 225 12 0 2,975
8
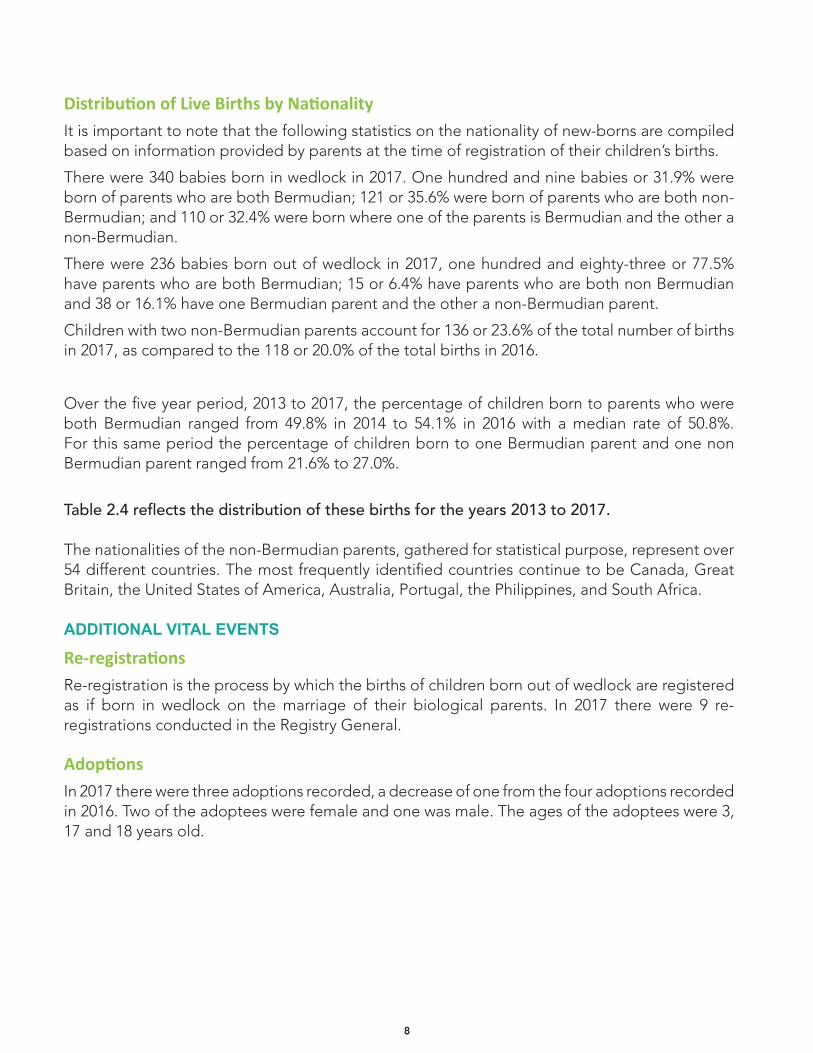
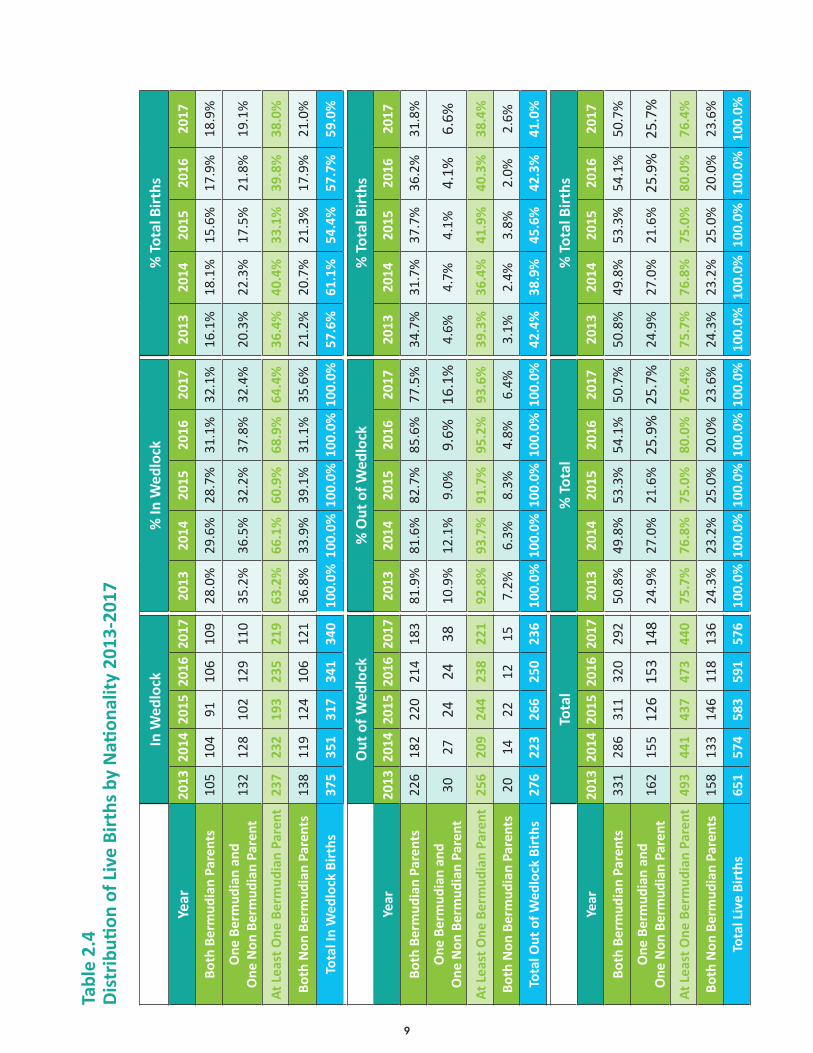
Distribution of Live Births by NationalityIt is important to note that the following statistics on the nationality of new-borns are compiled based on information provided by parents at the time of registration of their children’s births.
There were 340 babies born in wedlock in 2017. One hundred and nine babies or 31.9% were born of parents who are both Bermudian; 121 or 35.6% were born of parents who are both non- Bermudian; and 110 or 32.4% were born where one of the parents is Bermudian and the other a non-Bermudian.
There were 236 babies born out of wedlock in 2017, one hundred and eighty-three or 77.5% have parents who are both Bermudian; 15 or 6.4% have parents who are both non Bermudian and 38 or 16.1% have one Bermudian parent and the other a non-Bermudian parent.
Children with two non-Bermudian parents account for 136 or 23.6% of the total number of births in 2017, as compared to the 118 or 20.0% of the total births in 2016.
Over the five year period, 2013 to 2017, the percentage of children born to parents who were both Bermudian ranged from 49.8% in 2014 to 54.1% in 2016 with a median rate of 50.8%. For this same period the percentage of children born to one Bermudian parent and one non Bermudian parent ranged from 21.6% to 27.0%.
Table 2.4 reflects the distribution of these births for the years 2013 to 2017.
The nationalities of the non-Bermudian parents, gathered for statistical purpose, represent over 54 different countries. The most frequently identified countries continue to be Canada, Great Britain, the United States of America, Australia, Portugal, the Philippines, and South Africa.
ADDITIONAL VITAL EVENTS
Re-registrationsRe-registration is the process by which the births of children born out of wedlock are registered as if born in wedlock on the marriage of their biological parents. In 2017 there were 9 re-registrations conducted in the Registry General.
AdoptionsIn 2017 there were three adoptions recorded, a decrease of one from the four adoptions recorded in 2016. Two of the adoptees were female and one was male. The ages of the adoptees were 3, 17 and 18 years old.
9
In W
edlo
ck%
In W
edlo
ck%
Tot
al B
irth
s
Year
2013
2014
2015
2016
2017
2013
2014
2015
2016
2017
2013
2014
2015
2016
2017
Both
Ber
mud
ian
Pare
nts
105
104
9110
610
928
.0%
29.6
%28
.7%
31.1
%32
.1%
16.1
%18
.1%
15.6
%17
.9%
18.9
%
One
Ber
mud
ian
and
One
Non
Ber
mud
ian
Pare
nt13
212
810
212
911
035
.2%
36.5
%32
.2%
37.8
%32
.4%
20.3
%22
.3%
17.5
%21
.8%
19.1
%
At
Leas
t One
Ber
mud
ian
Pare
nt23
723
219
323
521
963
.2%
66.1
%60
.9%
68.9
%64
.4%
36.4
%40
.4%
33.1
%39
.8%
38.0
%
Both
Non
Ber
mud
ian
Pare
nts
138
119
124
106
121
36.8
%33
.9%
39.1
%31
.1%
35.6
%21
.2%
20.7
%21
.3%
17.9
%21
.0%
Tota
l In
Wed
lock
Bir
ths
375
351
317
341
340
100.
0%10
0.0%
100.
0%10
0.0%
100.
0%57
.6%
61.1
%54
.4%
57.7
%59
.0%
Out
of W
edlo
ck%
Out
of W
edlo
ck%
Tot
al B
irth
s
Year
2013
2014
2015
2016
2017
2013
2014
2015
2016
2017
2013
2014
2015
2016
2017
Both
Ber
mud
ian
Pare
nts
226
182
220
214
183
81.9
%81
.6%
82.7
%85
.6%
77.5
%34
.7%
31.7
%37
.7%
36.2
%31
.8%
One
Ber
mud
ian
and
O
ne N
on B
erm
udia
n Pa
rent
3027
2424
3810
.9%
12.1
%9.
0%9.
6%16
.1%
4.6%
4.7%
4.1%
4.1%
6.6%
At
Leas
t One
Ber
mud
ian
Pare
nt25
620
924
423
822
192
.8%
93.7
%91
.7%
95.2
%93
.6%
39.3
%36
.4%
41.9
%40
.3%
38.4
%
Both
Non
Ber
mud
ian
Pare
nts
2014
2212
157.
2%6.
3%8.
3%4.
8%6.
4%3.
1%2.
4%3.
8%2.
0%2.
6%
Tota
l Out
of W
edlo
ck B
irth
s27
622
326
625
023
610
0.0%
100.
0%10
0.0%
100.
0%10
0.0%
42.4
%38
.9%
45.6
%42
.3%
41.0
%
Tota
l%
Tot
al%
Tot
al B
irth
s
Year
2013
2014
2015
2016
2017
2013
2014
2015
2016
2017
2013
2014
2015
2016
2017
Both
Ber
mud
ian
Pare
nts
331
286
311
320
292
50.8
%49
.8%
53.3
%54
.1%
50.7
%50
.8%
49.8
%53
.3%
54.1
%50
.7%
One
Ber
mud
ian
and
O
ne N
on B
erm
udia
n Pa
rent
162
155
126
153
148
24.9
%27
.0%
21.6
%25
.9%
25.7
%24
.9%
27.0
%21
.6%
25.9
%25
.7%
At
Leas
t One
Ber
mud
ian
Pare
nt49
344
143
747
344
075
.7%
76.8
%75
.0%
80.0
%76
.4%
75.7
%76
.8%
75.0
%80
.0%
76.4
%
Both
Non
Ber
mud
ian
Pare
nts
158
133
146
118
136
24.3
%23
.2%
25.0
%20
.0%
23.6
%24
.3%
23.2
%25
.0%
20.0
%23
.6%
Tota
l Liv
e Bi
rths
651
574
583
591
576
100.
0%10
0.0%
100.
0%10
0.0%
100.
0%10
0.0%
100.
0%10
0.0%
100.
0%10
0.0%
Tabl
e 2.
4 D
istr
ibuti
on o
f Liv
e Bi
rths
by
Nati
onal
ity
2013
-201
7
10
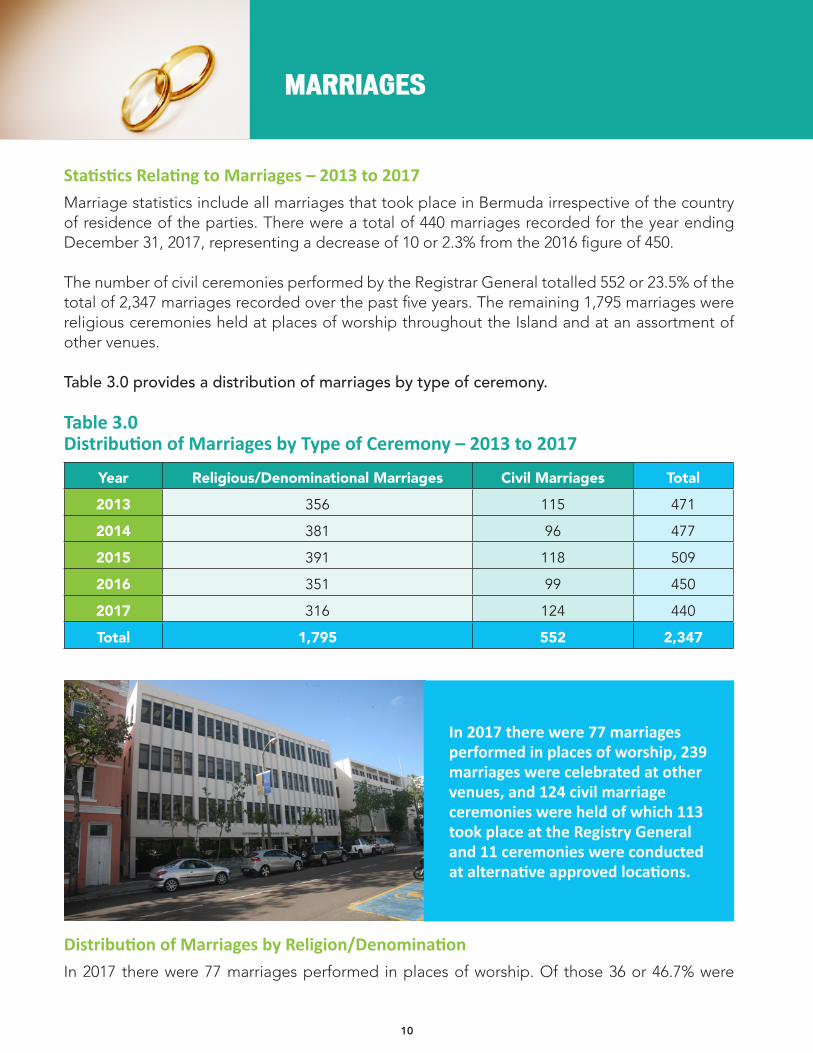
Statistics Relating to Marriages – 2013 to 2017Marriage statistics include all marriages that took place in Bermuda irrespective of the country of residence of the parties. There were a total of 440 marriages recorded for the year ending December 31, 2017, representing a decrease of 10 or 2.3% from the 2016 figure of 450.
The number of civil ceremonies performed by the Registrar General totalled 552 or 23.5% of the total of 2,347 marriages recorded over the past five years. The remaining 1,795 marriages were religious ceremonies held at places of worship throughout the Island and at an assortment of other venues.
Table 3.0 provides a distribution of marriages by type of ceremony.
Table 3.0 Distribution of Marriages by Type of Ceremony – 2013 to 2017
Year Religious/Denominational Marriages Civil Marriages Total
2013 356 115 471
2014 381 96 477
2015 391 118 509
2016 351 99 450
2017 316 124 440
Total 1,795 552 2,347
In 2017 there were 77 marriages performed in places of worship, 239 marriages were celebrated at other venues, and 124 civil marriage ceremonies were held of which 113 took place at the Registry General and 11 ceremonies were conducted at alternative approved locations.
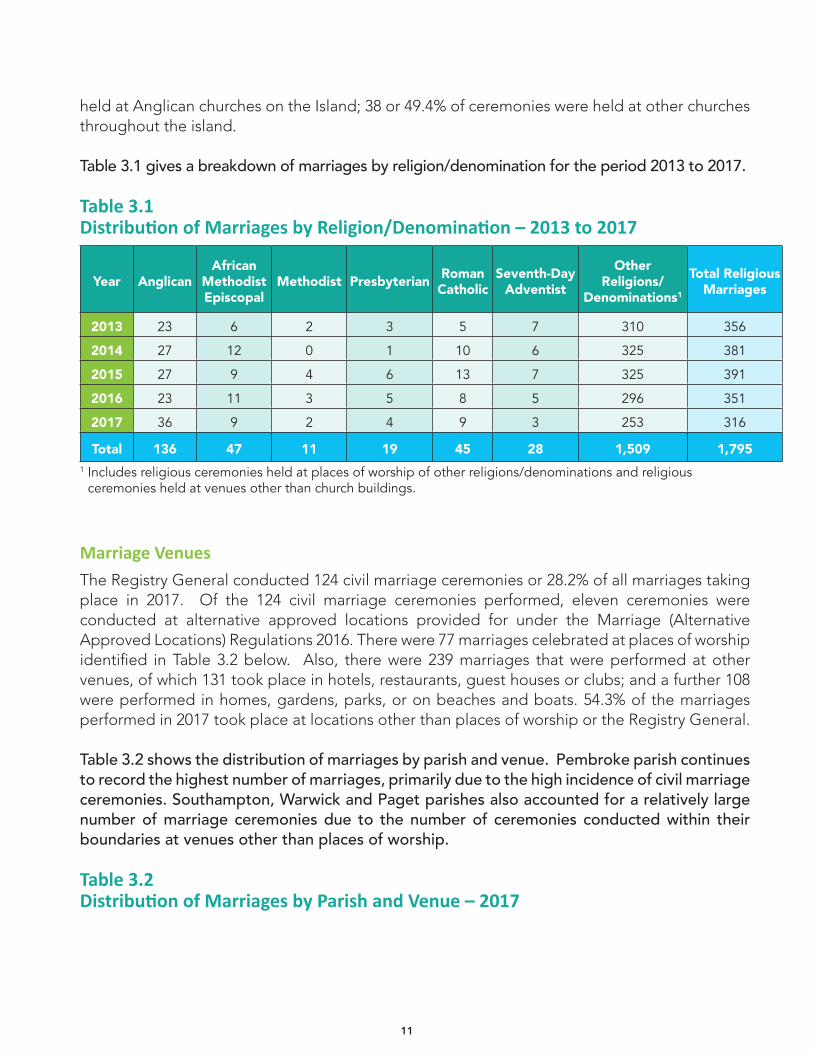
Distribution of Marriages by Religion/DenominationIn 2017 there were 77 marriages performed in places of worship. Of those 36 or 46.7% were
MARRIAGES
11
held at Anglican churches on the Island; 38 or 49.4% of ceremonies were held at other churches throughout the island.
Table 3.1 gives a breakdown of marriages by religion/denomination for the period 2013 to 2017.
Table 3.1 Distribution of Marriages by Religion/Denomination – 2013 to 2017
Year Anglican African
Methodist Episcopal
Methodist Presbyterian Roman Catholic
Seventh-Day Adventist
Other Religions/
Denominations1
Total Religious Marriages
2013 23 6 2 3 5 7 310 356
2014 27 12 0 1 10 6 325 381
2015 27 9 4 6 13 7 325 391
2016 23 11 3 5 8 5 296 351
2017 36 9 2 4 9 3 253 316
Total 136 47 11 19 45 28 1,509 1,7951 Includes religious ceremonies held at places of worship of other religions/denominations and religious
ceremonies held at venues other than church buildings.
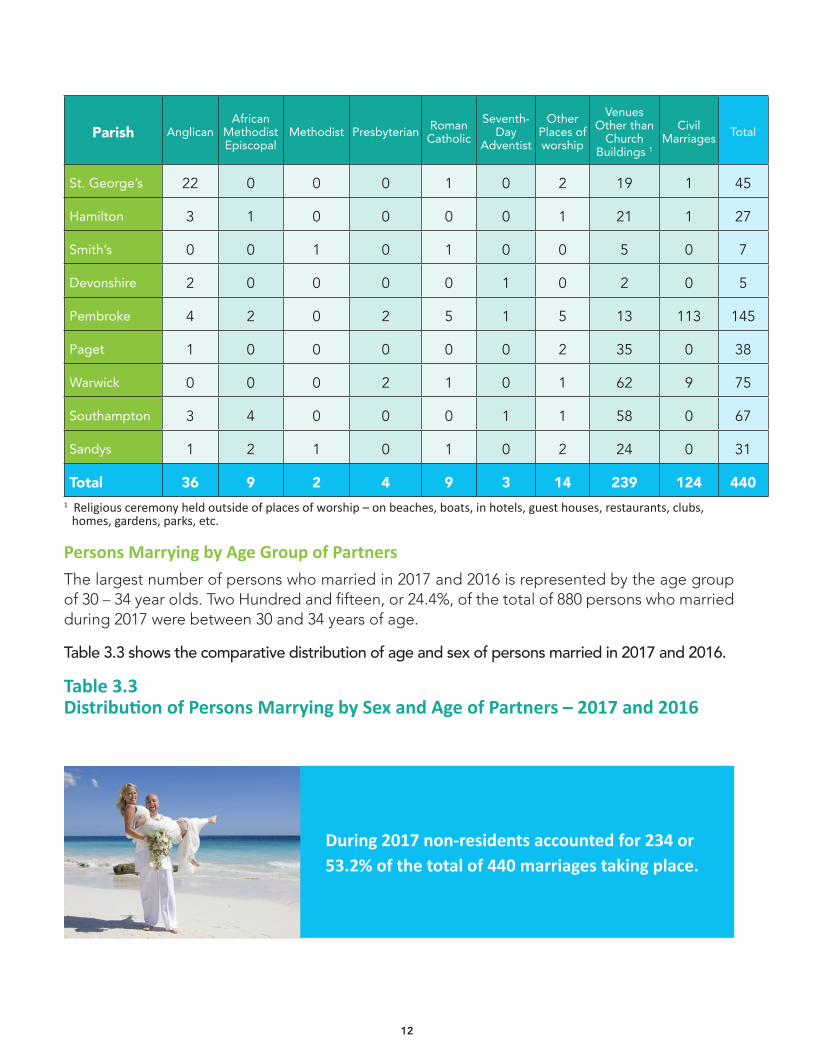
Marriage VenuesThe Registry General conducted 124 civil marriage ceremonies or 28.2% of all marriages taking place in 2017. Of the 124 civil marriage ceremonies performed, eleven ceremonies were conducted at alternative approved locations provided for under the Marriage (Alternative Approved Locations) Regulations 2016. There were 77 marriages celebrated at places of worship identified in Table 3.2 below. Also, there were 239 marriages that were performed at other venues, of which 131 took place in hotels, restaurants, guest houses or clubs; and a further 108 were performed in homes, gardens, parks, or on beaches and boats. 54.3% of the marriages performed in 2017 took place at locations other than places of worship or the Registry General.
Table 3.2 shows the distribution of marriages by parish and venue. Pembroke parish continues to record the highest number of marriages, primarily due to the high incidence of civil marriage ceremonies. Southampton, Warwick and Paget parishes also accounted for a relatively large number of marriage ceremonies due to the number of ceremonies conducted within their boundaries at venues other than places of worship.
Table 3.2 Distribution of Marriages by Parish and Venue – 2017
12
Parish Anglican African
Methodist Episcopal
Methodist Presbyterian Roman Catholic
Seventh-Day
Adventist
Other Places of worship
Venues Other than
Church Buildings 1
Civil Marriages Total
St. George’s 22 0 0 0 1 0 2 19 1 45
Hamilton 3 1 0 0 0 0 1 21 1 27
Smith’s 0 0 1 0 1 0 0 5 0 7
Devonshire 2 0 0 0 0 1 0 2 0 5
Pembroke 4 2 0 2 5 1 5 13 113 145
Paget 1 0 0 0 0 0 2 35 0 38
Warwick 0 0 0 2 1 0 1 62 9 75
Southampton 3 4 0 0 0 1 1 58 0 67
Sandys 1 2 1 0 1 0 2 24 0 31
Total 36 9 2 4 9 3 14 239 124 4401 Religious ceremony held outside of places of worship – on beaches, boats, in hotels, guest houses, restaurants, clubs,
homes, gardens, parks, etc.
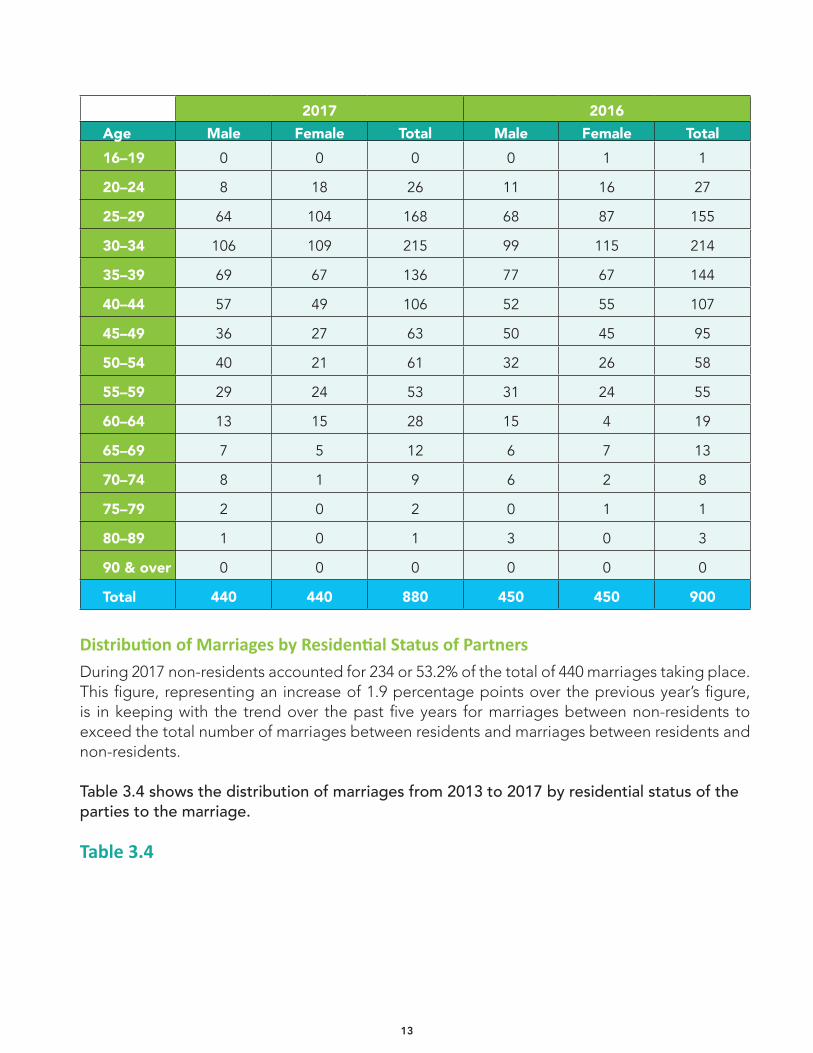
Persons Marrying by Age Group of PartnersThe largest number of persons who married in 2017 and 2016 is represented by the age group of 30 – 34 year olds. Two Hundred and fifteen, or 24.4%, of the total of 880 persons who married during 2017 were between 30 and 34 years of age.
Table 3.3 shows the comparative distribution of age and sex of persons married in 2017 and 2016.
Table 3.3 Distribution of Persons Marrying by Sex and Age of Partners – 2017 and 2016
During 2017 non-residents accounted for 234 or 53.2% of the total of 440 marriages taking place.
13
2017 2016Age Male Female Total Male Female Total16–19 0 0 0 0 1 1
20–24 8 18 26 11 16 27
25–29 64 104 168 68 87 155
30–34 106 109 215 99 115 214
35–39 69 67 136 77 67 144
40–44 57 49 106 52 55 107
45–49 36 27 63 50 45 95
50–54 40 21 61 32 26 58
55–59 29 24 53 31 24 55
60–64 13 15 28 15 4 19
65–69 7 5 12 6 7 13
70–74 8 1 9 6 2 8
75–79 2 0 2 0 1 1
80–89 1 0 1 3 0 3
90 & over 0 0 0 0 0 0
Total 440 440 880 450 450 900
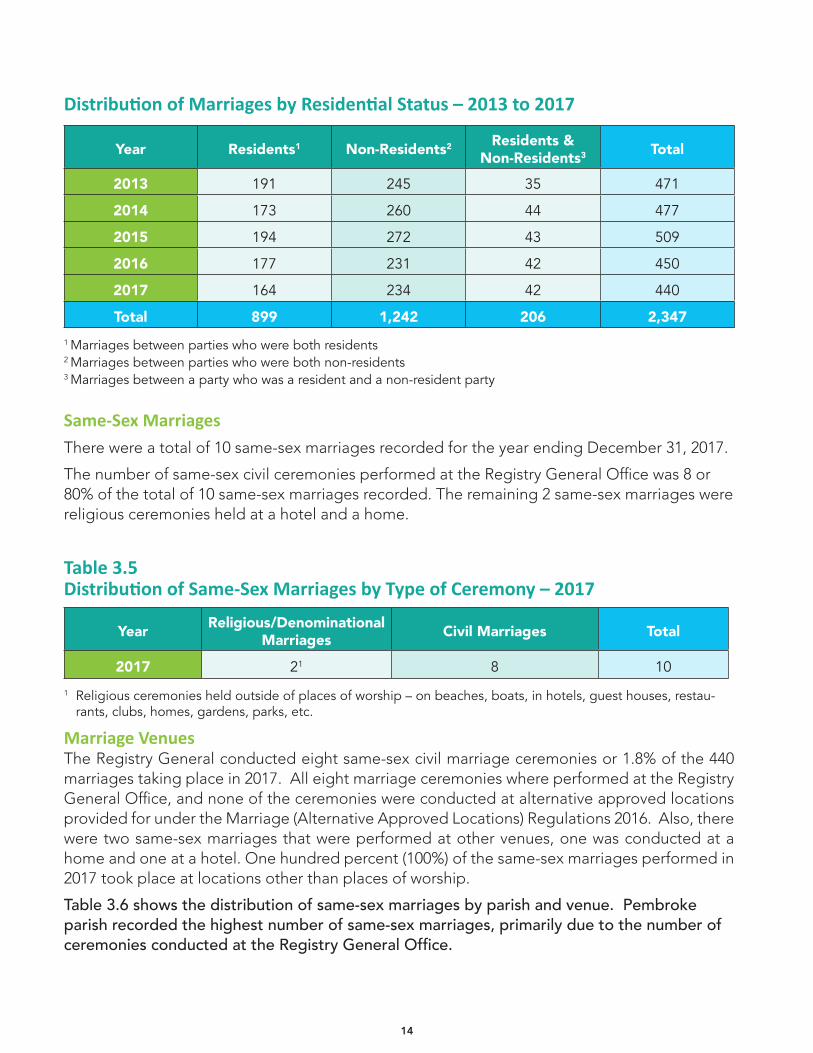
Distribution of Marriages by Residential Status of PartnersDuring 2017 non-residents accounted for 234 or 53.2% of the total of 440 marriages taking place. This figure, representing an increase of 1.9 percentage points over the previous year’s figure, is in keeping with the trend over the past five years for marriages between non-residents to exceed the total number of marriages between residents and marriages between residents and non-residents.
Table 3.4 shows the distribution of marriages from 2013 to 2017 by residential status of the parties to the marriage.
Table 3.4
14
Distribution of Marriages by Residential Status – 2013 to 2017
Year Residents1 Non-Residents2 Residents &Non-Residents3 Total
2013 191 245 35 471
2014 173 260 44 477
2015 194 272 43 509
2016 177 231 42 450
2017 164 234 42 440
Total 899 1,242 206 2,3471 Marriages between parties who were both residents2 Marriages between parties who were both non-residents3 Marriages between a party who was a resident and a non-resident party
Same-Sex MarriagesThere were a total of 10 same-sex marriages recorded for the year ending December 31, 2017.
The number of same-sex civil ceremonies performed at the Registry General Office was 8 or 80% of the total of 10 same-sex marriages recorded. The remaining 2 same-sex marriages were religious ceremonies held at a hotel and a home.
Table 3.5 Distribution of Same-Sex Marriages by Type of Ceremony – 2017
Year Religious/Denominational Marriages Civil Marriages Total
2017 21 8 10
1 Religious ceremonies held outside of places of worship – on beaches, boats, in hotels, guest houses, restau-rants, clubs, homes, gardens, parks, etc.
Marriage VenuesThe Registry General conducted eight same-sex civil marriage ceremonies or 1.8% of the 440 marriages taking place in 2017. All eight marriage ceremonies where performed at the Registry General Office, and none of the ceremonies were conducted at alternative approved locations provided for under the Marriage (Alternative Approved Locations) Regulations 2016. Also, there were two same-sex marriages that were performed at other venues, one was conducted at a home and one at a hotel. One hundred percent (100%) of the same-sex marriages performed in 2017 took place at locations other than places of worship.
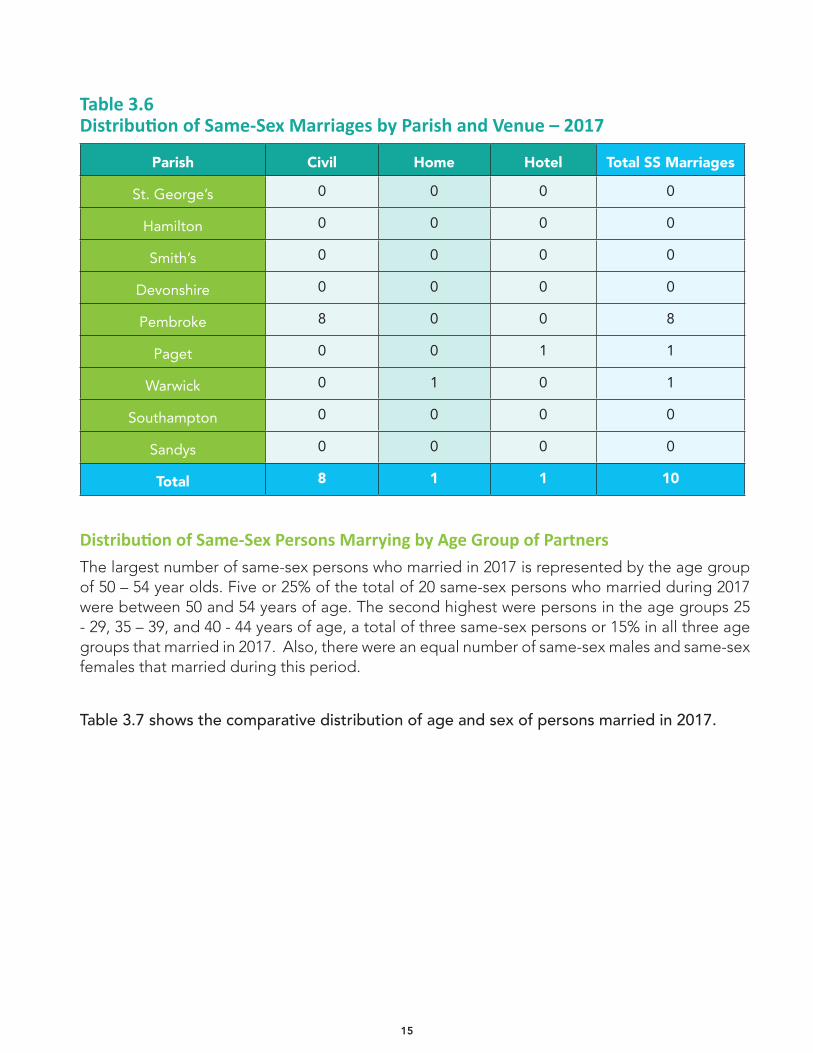
Table 3.6 shows the distribution of same-sex marriages by parish and venue. Pembroke parish recorded the highest number of same-sex marriages, primarily due to the number of ceremonies conducted at the Registry General Office.
15
Table 3.6 Distribution of Same-Sex Marriages by Parish and Venue – 2017
Parish Civil Home Hotel Total SS Marriages
St. George’s 0 0 0 0
Hamilton 0 0 0 0
Smith’s 0 0 0 0
Devonshire 0 0 0 0
Pembroke 8 0 0 8
Paget 0 0 1 1
Warwick 0 1 0 1
Southampton 0 0 0 0
Sandys 0 0 0 0
Total 8 1 1 10
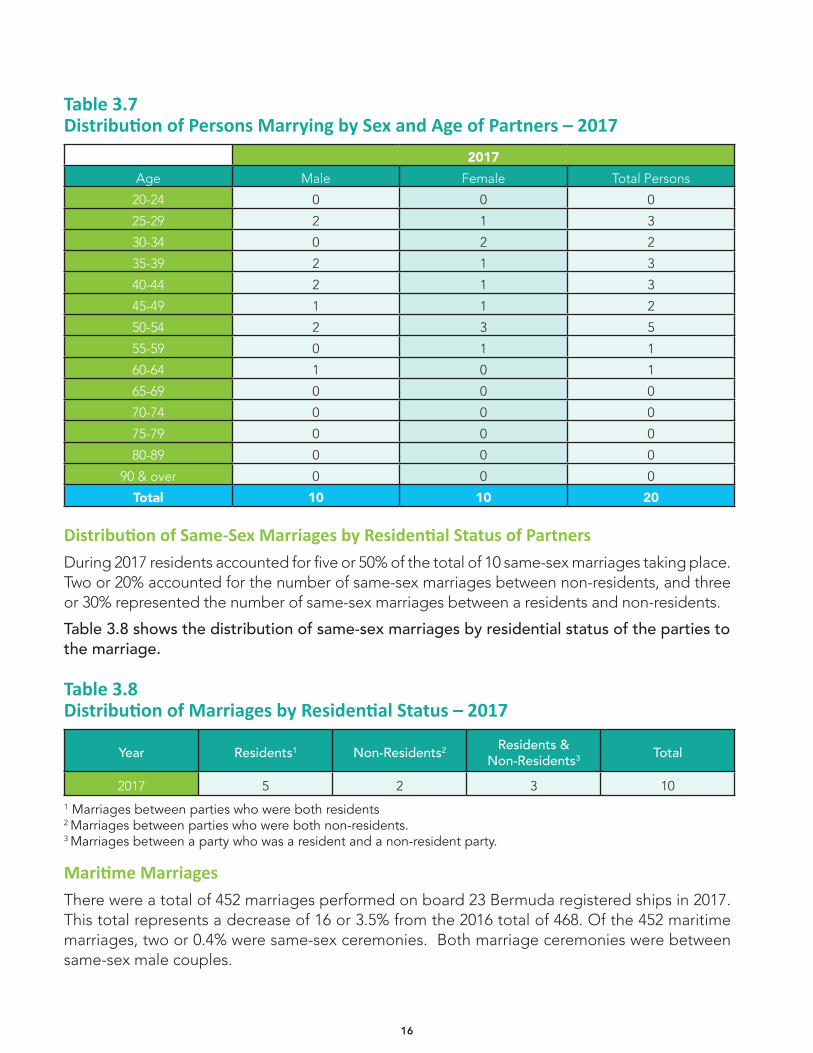
Distribution of Same-Sex Persons Marrying by Age Group of PartnersThe largest number of same-sex persons who married in 2017 is represented by the age group of 50 – 54 year olds. Five or 25% of the total of 20 same-sex persons who married during 2017 were between 50 and 54 years of age. The second highest were persons in the age groups 25 - 29, 35 – 39, and 40 - 44 years of age, a total of three same-sex persons or 15% in all three age groups that married in 2017. Also, there were an equal number of same-sex males and same-sex females that married during this period.
Table 3.7 shows the comparative distribution of age and sex of persons married in 2017.
16
Table 3.7 Distribution of Persons Marrying by Sex and Age of Partners – 2017
2017Age Male Female Total Persons
20-24 0 0 0
25-29 2 1 3
30-34 0 2 2
35-39 2 1 3
40-44 2 1 3
45-49 1 1 2
50-54 2 3 5
55-59 0 1 1
60-64 1 0 1
65-69 0 0 0
70-74 0 0 0
75-79 0 0 0
80-89 0 0 0
90 & over 0 0 0
Total 10 10 20
Distribution of Same-Sex Marriages by Residential Status of PartnersDuring 2017 residents accounted for five or 50% of the total of 10 same-sex marriages taking place. Two or 20% accounted for the number of same-sex marriages between non-residents, and three or 30% represented the number of same-sex marriages between a residents and non-residents.
Table 3.8 shows the distribution of same-sex marriages by residential status of the parties to the marriage.
Table 3.8 Distribution of Marriages by Residential Status – 2017
Year Residents1 Non-Residents2 Residents &Non-Residents3 Total
2017 5 2 3 10 1 Marriages between parties who were both residents2 Marriages between parties who were both non-residents.3 Marriages between a party who was a resident and a non-resident party.
Maritime MarriagesThere were a total of 452 marriages performed on board 23 Bermuda registered ships in 2017. This total represents a decrease of 16 or 3.5% from the 2016 total of 468. Of the 452 maritime marriages, two or 0.4% were same-sex ceremonies. Both marriage ceremonies were between same-sex male couples.
17
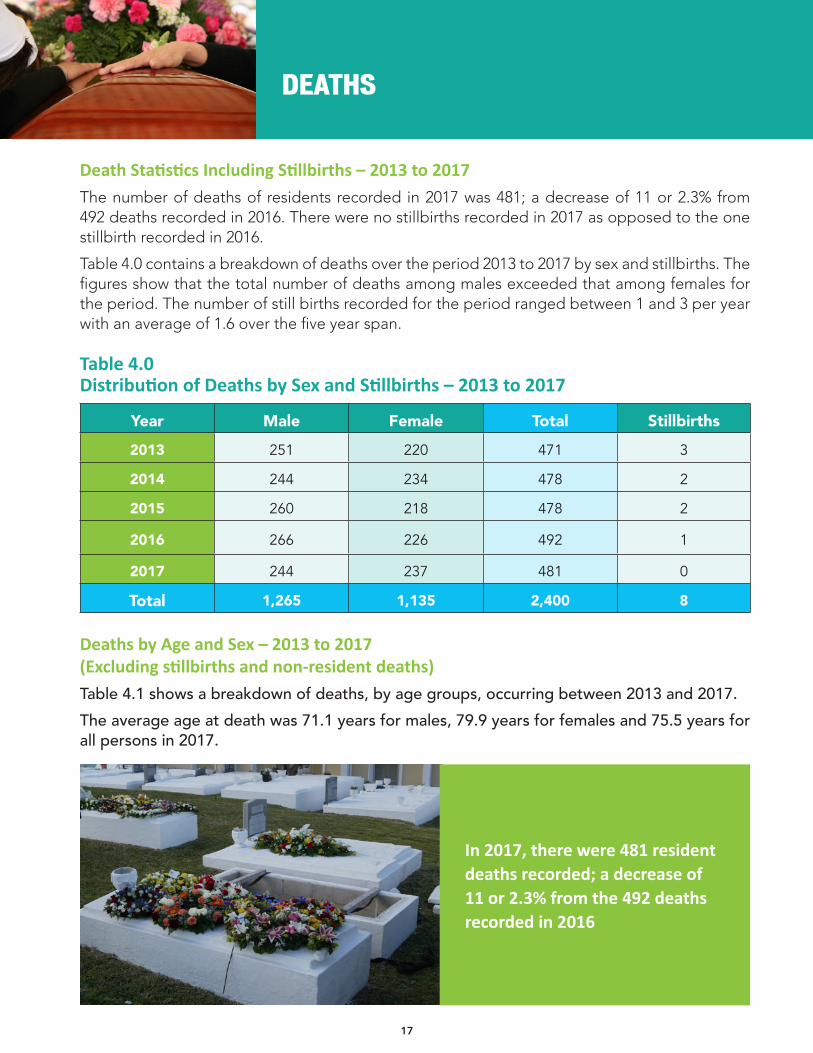
Death Statistics Including Stillbirths – 2013 to 2017The number of deaths of residents recorded in 2017 was 481; a decrease of 11 or 2.3% from 492 deaths recorded in 2016. There were no stillbirths recorded in 2017 as opposed to the one stillbirth recorded in 2016.
Table 4.0 contains a breakdown of deaths over the period 2013 to 2017 by sex and stillbirths. The figures show that the total number of deaths among males exceeded that among females for the period. The number of still births recorded for the period ranged between 1 and 3 per year with an average of 1.6 over the five year span.
Table 4.0 Distribution of Deaths by Sex and Stillbirths – 2013 to 2017
Year Male Female Total Stillbirths
2013 251 220 471 3
2014 244 234 478 2
2015 260 218 478 2
2016 266 226 492 1
2017 244 237 481 0
Total 1,265 1,135 2,400 8
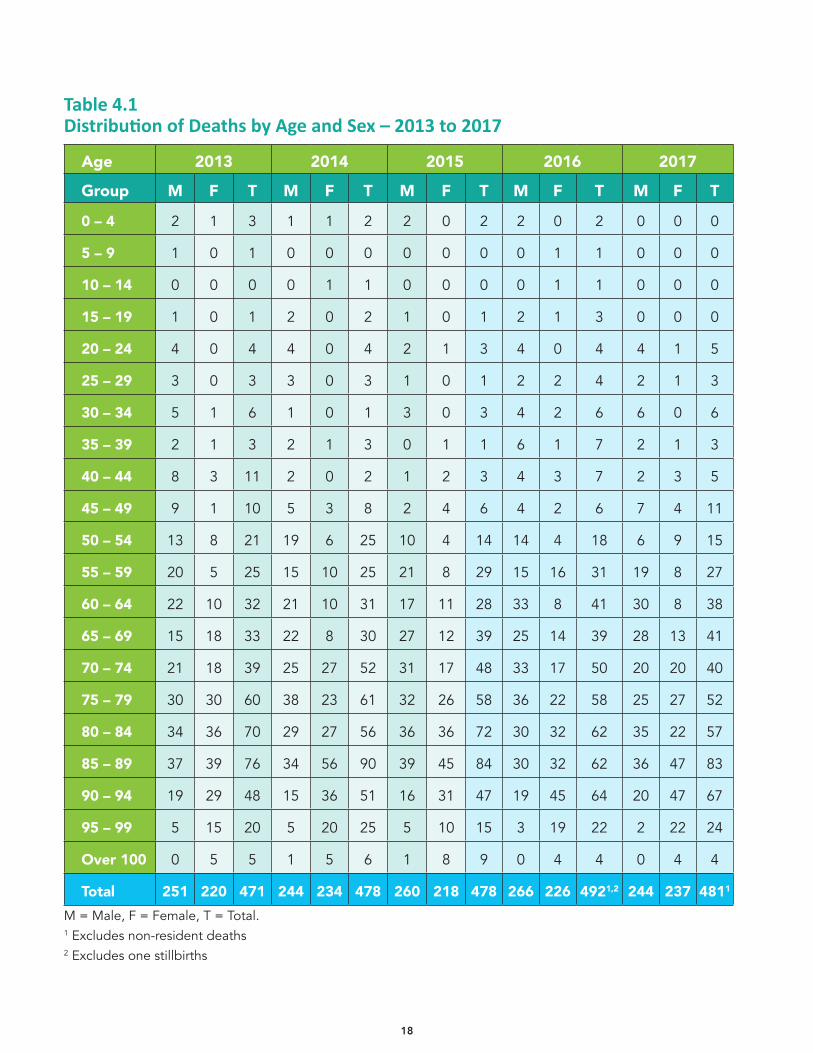
Deaths by Age and Sex – 2013 to 2017 (Excluding stillbirths and non-resident deaths)Table 4.1 shows a breakdown of deaths, by age groups, occurring between 2013 and 2017. The average age at death was 71.1 years for males, 79.9 years for females and 75.5 years for all persons in 2017.
DEATHS
In 2017, there were 481 resident deaths recorded; a decrease of 11 or 2.3% from the 492 deaths recorded in 2016
18
Table 4.1 Distribution of Deaths by Age and Sex – 2013 to 2017
Age 2013 2014 2015 2016 2017
Group M F T M F T M F T M F T M F T
0 – 4 2 1 3 1 1 2 2 0 2 2 0 2 0 0 0
5 – 9 1 0 1 0 0 0 0 0 0 0 1 1 0 0 0
10 – 14 0 0 0 0 1 1 0 0 0 0 1 1 0 0 0
15 – 19 1 0 1 2 0 2 1 0 1 2 1 3 0 0 0
20 – 24 4 0 4 4 0 4 2 1 3 4 0 4 4 1 5
25 – 29 3 0 3 3 0 3 1 0 1 2 2 4 2 1 3
30 – 34 5 1 6 1 0 1 3 0 3 4 2 6 6 0 6
35 – 39 2 1 3 2 1 3 0 1 1 6 1 7 2 1 3
40 – 44 8 3 11 2 0 2 1 2 3 4 3 7 2 3 5
45 – 49 9 1 10 5 3 8 2 4 6 4 2 6 7 4 11
50 – 54 13 8 21 19 6 25 10 4 14 14 4 18 6 9 15
55 – 59 20 5 25 15 10 25 21 8 29 15 16 31 19 8 27
60 – 64 22 10 32 21 10 31 17 11 28 33 8 41 30 8 38
65 – 69 15 18 33 22 8 30 27 12 39 25 14 39 28 13 41
70 – 74 21 18 39 25 27 52 31 17 48 33 17 50 20 20 40
75 – 79 30 30 60 38 23 61 32 26 58 36 22 58 25 27 52
80 – 84 34 36 70 29 27 56 36 36 72 30 32 62 35 22 57
85 – 89 37 39 76 34 56 90 39 45 84 30 32 62 36 47 83
90 – 94 19 29 48 15 36 51 16 31 47 19 45 64 20 47 67
95 – 99 5 15 20 5 20 25 5 10 15 3 19 22 2 22 24
Over 100 0 5 5 1 5 6 1 8 9 0 4 4 0 4 4
Total 251 220 471 244 234 478 260 218 478 266 226 4921,2 244 237 4811
M = Male, F = Female, T = Total.1 Excludes non-resident deaths2 Excludes one stillbirths
19
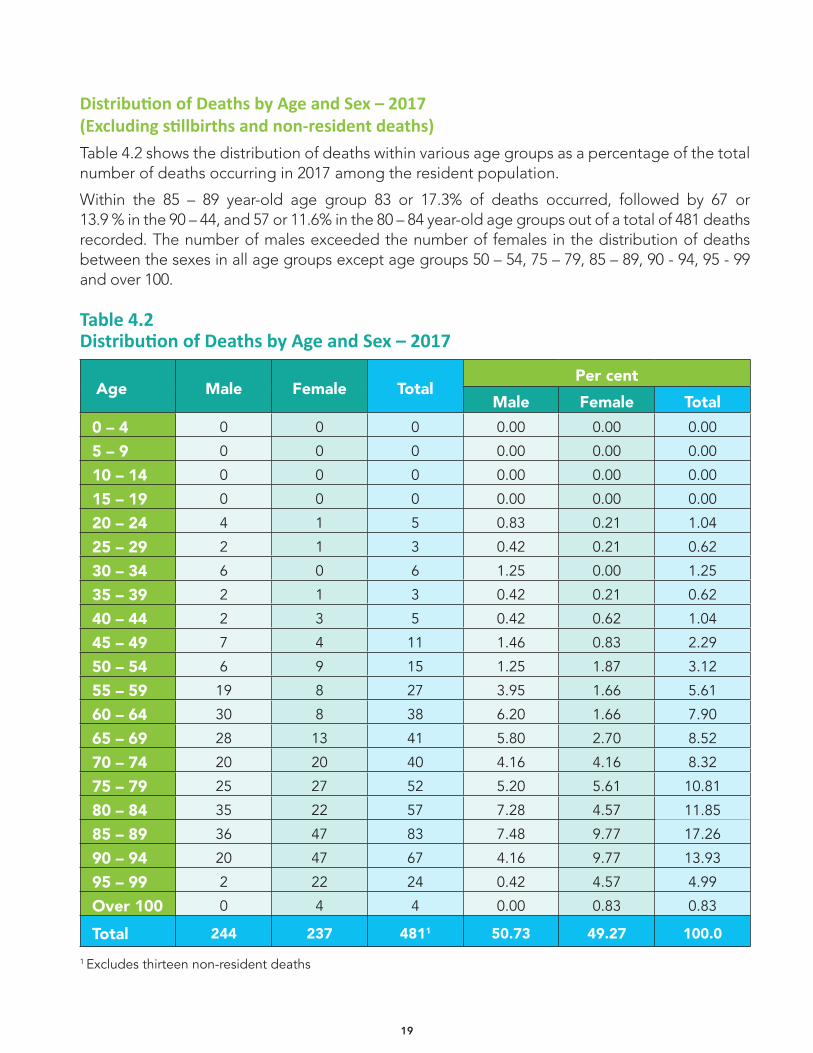
Distribution of Deaths by Age and Sex – 2017 (Excluding stillbirths and non-resident deaths)Table 4.2 shows the distribution of deaths within various age groups as a percentage of the total number of deaths occurring in 2017 among the resident population.
Within the 85 – 89 year-old age group 83 or 17.3% of deaths occurred, followed by 67 or 13.9 % in the 90 – 44, and 57 or 11.6% in the 80 – 84 year-old age groups out of a total of 481 deaths recorded. The number of males exceeded the number of females in the distribution of deaths between the sexes in all age groups except age groups 50 – 54, 75 – 79, 85 – 89, 90 - 94, 95 - 99 and over 100.
Table 4.2 Distribution of Deaths by Age and Sex – 2017
Age Male Female TotalPer cent
Male Female Total0 – 4 0 0 0 0.00 0.00 0.00
5 – 9 0 0 0 0.00 0.00 0.00
10 – 14 0 0 0 0.00 0.00 0.00
15 – 19 0 0 0 0.00 0.00 0.00
20 – 24 4 1 5 0.83 0.21 1.04
25 – 29 2 1 3 0.42 0.21 0.62
30 – 34 6 0 6 1.25 0.00 1.25
35 – 39 2 1 3 0.42 0.21 0.62
40 – 44 2 3 5 0.42 0.62 1.04
45 – 49 7 4 11 1.46 0.83 2.29
50 – 54 6 9 15 1.25 1.87 3.12
55 – 59 19 8 27 3.95 1.66 5.61
60 – 64 30 8 38 6.20 1.66 7.90
65 – 69 28 13 41 5.80 2.70 8.52
70 – 74 20 20 40 4.16 4.16 8.32
75 – 79 25 27 52 5.20 5.61 10.81
80 – 84 35 22 57 7.28 4.57 11.85
85 – 89 36 47 83 7.48 9.77 17.26
90 – 94 20 47 67 4.16 9.77 13.93
95 – 99 2 22 24 0.42 4.57 4.99
Over 100 0 4 4 0.00 0.83 0.83
Total 244 237 4811 50.73 49.27 100.01 Excludes thirteen non-resident deaths
20
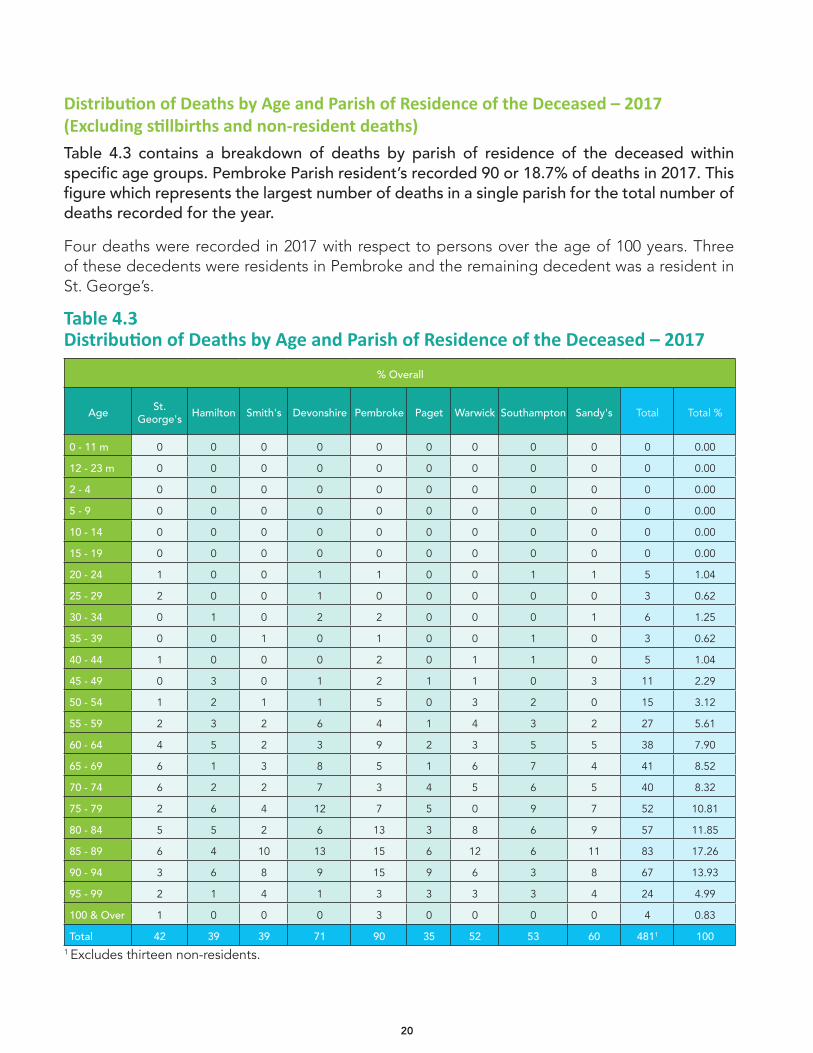
Distribution of Deaths by Age and Parish of Residence of the Deceased – 2017 (Excluding stillbirths and non-resident deaths)Table 4.3 contains a breakdown of deaths by parish of residence of the deceased within specific age groups. Pembroke Parish resident’s recorded 90 or 18.7% of deaths in 2017. This figure which represents the largest number of deaths in a single parish for the total number of deaths recorded for the year.
Four deaths were recorded in 2017 with respect to persons over the age of 100 years. Three of these decedents were residents in Pembroke and the remaining decedent was a resident in St. George’s.
Table 4.3 Distribution of Deaths by Age and Parish of Residence of the Deceased – 2017
% Overall
Age St. George's Hamilton Smith's Devonshire Pembroke Paget Warwick Southampton Sandy's Total Total %
0 - 11 m 0 0 0 0 0 0 0 0 0 0 0.00
12 - 23 m 0 0 0 0 0 0 0 0 0 0 0.00
2 - 4 0 0 0 0 0 0 0 0 0 0 0.00
5 - 9 0 0 0 0 0 0 0 0 0 0 0.00
10 - 14 0 0 0 0 0 0 0 0 0 0 0.00
15 - 19 0 0 0 0 0 0 0 0 0 0 0.00
20 - 24 1 0 0 1 1 0 0 1 1 5 1.04
25 - 29 2 0 0 1 0 0 0 0 0 3 0.62
30 - 34 0 1 0 2 2 0 0 0 1 6 1.25
35 - 39 0 0 1 0 1 0 0 1 0 3 0.62
40 - 44 1 0 0 0 2 0 1 1 0 5 1.04
45 - 49 0 3 0 1 2 1 1 0 3 11 2.29
50 - 54 1 2 1 1 5 0 3 2 0 15 3.12
55 - 59 2 3 2 6 4 1 4 3 2 27 5.61
60 - 64 4 5 2 3 9 2 3 5 5 38 7.90
65 - 69 6 1 3 8 5 1 6 7 4 41 8.52
70 - 74 6 2 2 7 3 4 5 6 5 40 8.32
75 - 79 2 6 4 12 7 5 0 9 7 52 10.81
80 - 84 5 5 2 6 13 3 8 6 9 57 11.85
85 - 89 6 4 10 13 15 6 12 6 11 83 17.26
90 - 94 3 6 8 9 15 9 6 3 8 67 13.93
95 - 99 2 1 4 1 3 3 3 3 4 24 4.99
100 & Over 1 0 0 0 3 0 0 0 0 4 0.83
Total 42 39 39 71 90 35 52 53 60 4811 1001 Excludes thirteen non-residents.
21
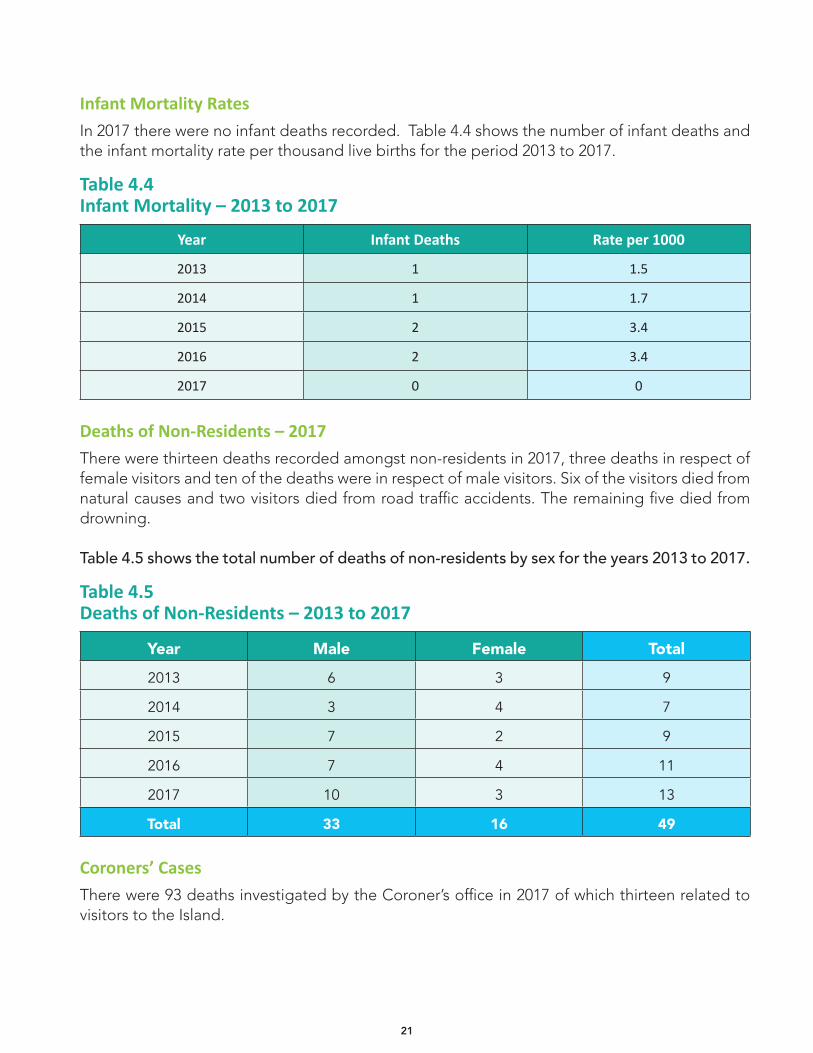
Infant Mortality RatesIn 2017 there were no infant deaths recorded. Table 4.4 shows the number of infant deaths and the infant mortality rate per thousand live births for the period 2013 to 2017.
Table 4.4 Infant Mortality – 2013 to 2017
Year Infant Deaths Rate per 1000
2013 1 1.5
2014 1 1.7
2015 2 3.4
2016 2 3.4
2017 0 0
Deaths of Non-Residents – 2017There were thirteen deaths recorded amongst non-residents in 2017, three deaths in respect of female visitors and ten of the deaths were in respect of male visitors. Six of the visitors died from natural causes and two visitors died from road traffic accidents. The remaining five died from drowning.
Table 4.5 shows the total number of deaths of non-residents by sex for the years 2013 to 2017.
Table 4.5 Deaths of Non-Residents – 2013 to 2017
Year Male Female Total
2013 6 3 9
2014 3 4 7
2015 7 2 9
2016 7 4 11
2017 10 3 13
Total 33 16 49
Coroners’ CasesThere were 93 deaths investigated by the Coroner’s office in 2017 of which thirteen related to visitors to the Island.
22
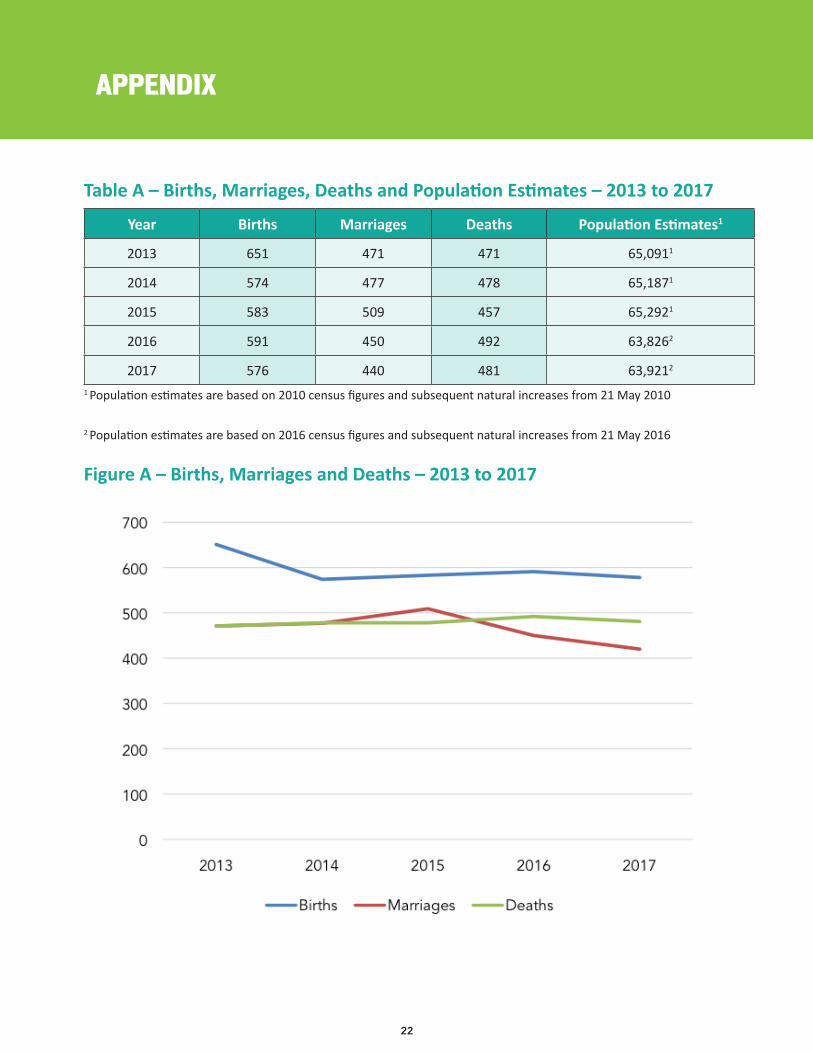
Table A – Births, Marriages, Deaths and Population Estimates – 2013 to 2017
Year Births Marriages Deaths Population Estimates1
2013 651 471 471 65,0911
2014 574 477 478 65,1871
2015 583 509 457 65,2921
2016 591 450 492 63,8262
2017 576 440 481 63,9212
1 Population estimates are based on 2010 census figures and subsequent natural increases from 21 May 2010
2 Population estimates are based on 2016 census figures and subsequent natural increases from 21 May 2016
Figure A – Births, Marriages and Deaths – 2013 to 2017
APPENDIX

24
Design and pre-press production: Department of Communications
Printed in Bermuda by Bermuda Blueprinting. ~ July 2018