Embed Size (px)
Citation preview
Annual Report2019-20
Government of IndiaMinistry of Statistics and Programme ImplementationSardar Patel Bhawan, Sansad Marg, New Delhi-110001
http://www.mospi.gov.in

TABLE OF CONTENTS
Sl. No. Chapters Page No.
I Introduction 1-4
II Developments & Highlights 5-10
III National Statistical Commission (NSC) 11
IV National Statistics Office 12-58
V Statistical Services 59-61
VI Indian Statistical Institute 62-71
VII Infrastructure and Project Monitoring 72-90
VIII Members of Parliament Local Area Development Scheme 91-97
IX Progressive Use of Official Language Hindi 98-99
X Other Activities 100-103
Annexures
IA Organisation Chart of Ministry of Statistics & Programme Implementation
104
IB Organisation Chart of National Statistical Commission 105
IC Abbreviations used 106
II Allocation of Business to the Ministry of Statistics & Programme Implementation
107-108
IIIA Statement of Budget Estimate (SBE) -2019-20 109
IIIB Total Plan Gross Budgetary Support (GBS) for 2018-19 (BE and RE) for North-Eastern Region
110
IIIC Total Plan Gross Budgetary Support (GBS) for 2019-20 (BE and RE) for North-Eastern Region
111
IV Infrastructure Sector Performance (April 2019 to September 2019) 112
V Month wise List of Projects completed in 2019-20 113-132
VI List of publications being brought out by various Divisions of CSO/NSSO
133-135
VII Position of Action Taken Note (ATN) For the Year 2018-19 136

1
CHAPTER – I
INTRODUCTION
1.1 The Ministry of Statistics and Programme Implementation (MoSPI) came into existence as an independent Ministry on 15th October 1999 after the merger of the Department of Statistics and the Department of Programme Implementation. The Ministry has two wings, viz. Statistics Wing, called National Statistical Office (NSO) and Programme Implementation (PI) Wing. The Programme Implementation Wing has two Divisions, namely, (i) Infrastructure and Project Monitoring and (ii) Member of Parliament Local Area Development Scheme. Besides these two wings, there is a National Statistical Commission (NSC) created through a Resolution of Government of India (MoSPI) and one autonomous institute viz. Indian Statistical Institute (ISI) declared as an institute of national importance by an Act of Parliament. The organisation chart of the Ministry is at Annexure–IA to IB. Abbreviations used in this report are at Annexure –IC.
1.2 The Ministry of Statistics and Programme Implementation attaches considerable importance to coverage and quality aspects of statistics released in the country. The statistics released are based on administrative sources, surveys and censuses conducted by the Central and State Governments and non-official sources and studies. The surveys conducted by the Ministry are based on scientific sampling methods and are supervised by the National Statistical Commission. Data is collected through dedicated field staff who are regularly trained in the concepts and definitions of the items and the scope of the survey. In line with the emphasis on the quality of statistics released by the Ministry, the methodological issues concerning the compilation of national accounts are overseen by an Advisory Committee on National Accounts, industrial statistics by a Standing Committee on Industrial Statistics and price and cost of living indices by a Technical Advisory Committee on Price Indices. The Ministry compiles data sets based on current data, after applying standard statistical techniques and extensive scrutiny and supervision.
1.3 India is a subscriber to the International Monetary Fund’s (IMF) Special Data Dissemination Standards (SDDS) and is currently fulfilling the Standards. The Ministry maintains an ‘Advance Release Calendar’ for its data categories covered under the SDDS, which is disseminated on the Ministry’s website as well as on the Dissemination Standards Bulletin Board (DSBB) of the IMF. The Ministry releases the data sets covered under the Real Sector of SDDS through press notes and its web-site simultaneously. The Ministry is entrusted with the statistical tracking of Millennium Development Goals in India. The Ministry organises technical meetings
2
on a regular basis on various topics to assess the data-gaps in the system and the quality of statistics currently released. The NSO staff participates in meetings and seminars organised by international and regional organizations, such as, the United Nations Economic and Social Commission for Asia and the Pacific (UNESCAP), on statistical compilations and international practices. India has a strong system of official statistics and is among the leading countries in the area of official statistics. The Ministry’s officials have been associated with international agencies on the development of methodologies, particularly in the areas of national accounts, informal sector statistics, large-scale sample surveys, conduct of censuses, service sector statistics, non-observed economy, social sector statistics, environmental statistics and classifications. The contribution of the Ministry’s officials in international meetings on these subjects has been highly appreciated.
1.4 Statistics Day: In recognition of the notable contributions made by (Late) Professor Prasanta Chandra Mahalanobis in the field of economic planning and statistical development, the Government of India has designated 29th June every year, coinciding with his birth anniversary, as the Statistics Day in the category of Special Day to be celebrated at the national level. The objective of this Day is to create public awareness, among the people specially the younger generation for drawing inspirations from Prof. Mahalanobis about the role of statistics in socio-economic planning and policy formulation.
1.5 The 13th Statistics Day was celebrated on 29th June 2019, all over India by the Ministry of Statistics and Programme Implementation, State Governments, Office of NSSO spread throughout the country, Indian Statistical Institute (ISI), Universities/Departments, etc. by organizing Seminars, Conferences, Debates, Quiz Programmes, Lecture Series, Essay Competitions, etc. The main function was organized by the Ministry of Statistics & Programme Implementation on 29th June 2019 at Vigyan Bhawan, New Delhi.
Conference of Central and State Statistical Organizations (COCSSO):
1.6 As a part of the mechanism set up by the Government for coordinating the activities in the field of statistics in different States/UTs and Central Ministries/Departments, the Ministry organizes Conference of Central and State Statistical Organizations (COCSSO) every year. This is a major forum for discussing important statistical issues by the Central and State statistical agencies with the objective of putting in coordinated efforts for availability of reliable and timely statistics to planners and policy makers for informed decision making and good governance.
1.7 NSO is mandated with the following responsibilities:
(i) acts as the nodal agency for planned development of the statistical system in the country, lays down and maintains norms and standards in
3
the field of statistics involving concepts and definitions, methodology of data collection, processing of data and dissemination of results;
(ii) coordinates the statistical work in respect of the Ministries/Departments of the Government of India and State Statistical Bureaus (SSBs), advises the Ministries/Departments of the Government of India on statistical methodology and on statistical analysis of data;
(iii) prepares national accounts as well as publishes annual estimates of national product, government and private consumption expenditure, capital formation, savings, estimates of capital stock and consumption of fixed capital, as also the state level gross capital formation of supra-regional sectors and prepares comparable estimates of State Domestic Product (SDP) at current prices;
(iv) maintains liaison with international statistical organisations, such as, the United Nations Statistical Division (UNSD), the Economic and Social Commission for Asia and the Pacific (ESCAP), the Statistical Institute for Asia and the Pacific (SIAP), the International Monetary Fund (IMF), the Asian Development Bank (ADB), the Food and Agriculture Organisation (FAO), the International Labour Organisation (ILO), etc;
(v) compiles and releases the Index of Industrial Production (IIP) every month in the form of ‘quick estimates’, conducts the Annual Survey of Industries (ASI), and provides statistical information to assess and evaluate the changes in the growth, composition and structure of the organised manufacturing sector;
(vi) organises and conducts periodic all-India Economic Censuses and follow-up enterprise surveys, provides an in-house facility to process the data collected through various socio-economic surveys and follow-up enterprise surveys of Economic Censuses;
(vii) conducts large scale all-India sample surveys for creating the database needed for studying the impact of specific problems for the benefit of different population groups in diverse socio-economic areas, such as employment, consumer expenditure, housing conditions and environment, literacy levels, health, nutrition, family welfare, etc;
(viii) examines the survey reports from the technical angle and evaluates the sampling design including survey feasibility studies in respect of surveys conducted by NSSO and other Central Ministries and Departments;
(ix) disseminates statistical information on various social, environmental and multi-domain statistics through a number of publications for the use of
4
Government, Semi-Government, Private data users/ agencies as well as to the agencies of the United Nations agencies like the UNSD, ESCAP, ILO and other international agencies; and
(x) releases grants-in-aid to registered Non-Governmental Organisations (NGO) and Research Institutions of repute for undertaking special studies or surveys, printing of statistical reports, and financing seminars, workshops and conferences relating to different subject areas of official statistics.
1.8 The Programme Implementation Wing of the Ministry has the following responsibilities:-
(i) monitoring the performance of the country’s eleven key infrastructure sectors, viz., Power, Coal, Steel, Railways, Telecommunications, Ports, Fertilizers, Cement, Petroleum & Natural Gas, Roads and Civil Aviation;
(ii) monitoring of all Central Sector Projects costing `150 crore and above; and
(iii) monitoring implementation of Member of Parliament Local Area Development Scheme (MPLADS).
1.9 The Administration Division of the Ministry functions as the Cadre Controlling Authority of offices of Indian Statistical Service (ISS) and Subordinate Statistical Service (SSS) cadres including matters relating to their training, career progression and manpower planning.
1.10 This Ministry also acts as the nodal Ministry for the Indian Statistical Institute (ISI) and ensures its functioning in accordance with the provisions of the Indian Statistical Institute Act, 1959 (57 of 1959).
1.11 The Allocation of Business to the Ministry of Statistics and Programme Implementation is placed at Annexure-II. A website (http://www.mospi.gov.in) of the Ministry has been designed, created and is being maintained by Data Informatics and Innovation Division of NSO of the Ministry. A large number of reports of the Ministry are available on the website for access/use of various stakeholders. System of on-line registration has also been introduced for downloading/viewing the reports.
1.12 The total budget allocation of the Ministry for the year 2019-20 is `5231.06 crore (Scheme and Non- Scheme), out of which `3960.00 crore is for MPLADS, `4488.83 crore for Scheme (including MPLADS) and `742.23 crore is for Non- Scheme. The requirements and priorities of its attached and subordinate offices were kept in view while making budgetary allocations to them by this Ministry.
5
CHAPTER – II
DEVELOPMENT AND HIGHLIGHTS
Highlights of achievements of the Ministry for year 2019-20 (till 30th November 2019) are as follows:2.1 National Account Division (NAD)
• The National Accounts Division (NAD) of the NSO is responsible for preparation of national accounts. The NAD annually brings out a publication titled “National Accounts Statistics”.
• NAD releases annual and quarterly estimates of Gross Domestic Product (GDP) as per pre-specified schedule given in Advance Release Calendar.
• NAD released Back-Series of National Accounts base 2011-12.• During 2019-20 (till November 2019) fifteen publications/data releases and
reports were published by NAD including eight monthly “Payroll Reporting in India”.
2.2 Price Statistics Division (PSD)
• Consumer Price Index (Rural, Urban, and Combined): NSO started compiling Consumer Price Index (CPI) with Base Year (2010=100) for all India and States/UTs with effect from January 2011. The Base Year of the CPI has been revised from 2010=100 to 2012=100, incorporating many methodological improvements in consonance with the international practices. During the period from November 2018 to November 2019 (Provisional), the all India year on year inflation rate based on CPI (General) for the combined sector (i.e. current month over same month of last year) was reported highest at 5.54% in November 2019 and the lowest at 1.97% in January 2019.
• International Comparison Programme (ICP): India has been participating in International Comparison Programme since 1970. Current ICP round, ICP-2017, was started in April 2017 for which price collection was carried out by National Sample Survey Office (NSSO) for Household sector and by PSD for Machinery & Equipment and Construction sector. These prices were submitted to Asian Development Bank (ADB) for inter-country validation for compilation of Purchasing Power Parity (PPP) under ICP 2017. This indicator helps in comparing the GDP of different countries/economies across the world.
6
2.3 Economic Statistics Division (ESD)
• Index of industrial Production: The Index of Industrial Production (IIP) which is a unit free number based on data of fixed items from a fixed panel of factories that reflects short term changes in the manufacturing sector was released on a monthly basis with a time lag of 6 weeks.
• During the year, all India IIP with base year (2011-12=100) was released every month on due date. In addition to regular release of all India IIP, to facilitate the release of IIP at State level, a training workshop on state level IIP was held in collaboration with Government of Maharashtra in November 2019. Further, a Review meeting on State level IIP with states who are yet to compile and release IIP of their respective states was held in November 2019 at Pune, Maharashtra.
• The all India IIP data (sectoral and use-based category) with metadata and details of its methodology are made available on the website (http://www.mospi.gov.in/iip-2011-12-series) for public access.
• Seventh Economic Census: The Seventh Economic Census is being conducted during the year 2019-20 on an IT based platform for the first time. In this regard, CSC, e-Governance Services India Ltd, a Special Purpose Vehicle (SPV) under Ministry of Electronics and Information Technology (MeITy), Government of India, has been engaged as the implementing agency.
2.4 Social Statistics Division (SSD)
• Important Developments during 2019-20: MoSPI, after a series of consultations with concerned Ministries/Departments, State Governments and other stakeholders have developed a National Indicator Framework (NIF) on Sustainable Development Goals (SDGs) consisting of 306 national indicators with identified data sources and periodicity.
In compliance to the Government’s approval, a High Level Steering Committee (HLSC) under the chairmanship of Chief Statistician of India (CSI) and Secretary, MoSPI with members from NITI Aayog, Ministry of Home Affairs, Ministry of Health and Family Welfare, Ministry of Environment, Forest and Climate Change, Ministry of Finance and Ministry of Statistics and Programme Implementation, to periodically review and refine the National Indicator Framework was constituted. The constitution of HLSC got notified and published in the Gazette of India on 4th January 2019. Two meetings of HLSC on 20th June 2019 and 7th November 2019 respectively have been convened so far. The recommendations of the HLSC during its first meeting were suitably incorporated in the National Indicator Framework and based
7
on this, SDG NIF Baseline Report 2015-16 was released on 29th June 2019. The modifications/ refinements/ deletions in the National Indicator Framework, as recommended by HLSC during its second meeting would be incorporated in the first progress report on SDG NIF.
MoSPI has constituted six Sectoral Committees on SDGs mainly to collaborate with Research Institutions and International Agencies to evolve methodology for Tier III global indicators examination of Tier I and Tier II global indicators in Indian context and for identification of data gaps in monitoring of global and national indicator framework.
The states at sub-national level have the primary responsibility for implementing the SDGs at lower administrative level. Their data requirement in terms of disaggregation is quite different. Their infrastructure and resource availability also vary much across the states, therefore, to track the progress made in this regard and to monitor the progress of SDGs implementation, the states are also developing their own State Indicator Frameworks (SIF). MoSPI is assisting the states in development of their own SIFs. MoSPI has prepared and circulated a guideline on development of SIF. The Ministry is also organizing workshops for state Officials on SIF. The Conference of Central and State Statistical Organisations (COCSSO), held during 11th-12th November 2019 in Kolkata on the theme on SDGs, was used to assist the States in preparation of their draft SIF.
In order to create awareness on SDG, MoSPI has developed documentary film on SDGs in Hindi and the process of getting it dubbed in other regional languages is underway. MoSPI is likely to launching a new Multiple Indicator Survey (MIS) during January-December 2020 as a part of 78th Round of National Sample Survey (NSS), which will be repeated every three years, to cater to data requirement of number of SDG national as well as global indicators.
• Publications brought out by the Social Statistics Division during 2019-20: One of the activities of the Ministry of Statistics and Programme Implementation is to disseminate statistical information on social, environment and multi-domain statistics. The list of releases made by the Division during 2019 is as follows:
¾ The Sustainable Development Goals National Indicator Framework Baseline Report 2015-16 was released on the occasion of National Statistics Day (29th June 2019). This Report is based on the national indicators and will act as a reference point to measure the progress made on various
8
developmental aspects in subsequent years. Baseline Report contains four main segments-Data Snapshot, Chapters, Metadata and Data Tables. The report is available on the website of Ministry.
¾ Two other publications, namely ‘Handbook on National Indicator Framework (NIF)’ and ‘Data Snapshot on SDG National Indicator Framework Baseline Report 2015-16’ were also released on 29th June 2019.
¾ The SDGs Dashboard was rolled out on 29th June 2019 and is hosted on the Ministry website. The SDGs Dashboard, developed by MoSPI in collaboration with UN Resident Coordinator (UNRC) Office, is a unified data repository on SDGs Indicators as per the National Indicator Framework. It can be accessed at the link, http://www.sdgindia2030.mospi.gov.in/.
¾ The annual publication on environment statistics, ‘EnviStats India 2019; Vol. I: Environment Statistics’ was released in March 2019. The publication is based on FDES-2013 prescribed by UNSD for compilation of environment statistics. The tables of the publication are classified under six chapters, each of them focusing on one of the following six fundamental components of FDES 2013:
(i) Environmental Conditions and Quality(ii) Environmental Resources and their Uses(iii) Residuals(iv) Extreme Events and Disasters(v) Human Settlements and Environmental Health(vi) Environment Protection, Management and Engagement.
¾¾ The annual publication on environment accounts, “EnviStats India 2019 Vol.II: Environment Accounts” was released in September 2019. The publication is based on the System of Environmental Economic Accounting (SEEA). Adding to asset accounts of land, water, forests and minerals presented in last year’s publication, this issue focuses on assessment of quality of soil and water as also valuation of the ecosystem services provided by cropland and nature-based tourism.
¾¾ The Annual publication “Women and Men in India 2018” was released in March 2019. The publication provides Gender disaggregated data on various socio-economic aspects including health, education, participation in economy, decision making, social obstacles on women empowerment etc and envisages to provide the vital inputs to policy makers for evolving
9
appropriate interventions to minimize the gaps.
¾¾ Publication “SAARC Social Charter – India Country Report 2018” was released in March 2019. The SAARC Social Charter reiterates the vision of the SAARC countries of improving the quality of life of their citizens by addressing social sector development and accords the highest priority to poverty alleviation, health, education, human resource development, status of women, rights and well-being of children, population stabilization, and drug addiction, rehabilitation and reintegration. The “SAARC Social Charter – India Country Report 2018” is the seventh country report which maps various programmes/schemes of Government of India targeted towards achieving the objectives of the SAARC Social Charter in the country.
¾¾ Publication “Food and Nutrition Security Analysis, India, 2019” was released in June 2019. The publication is an attempt by the Ministry of Statistics & Programme Implementation and WFP to highlight the prevailing conditions of food availability, accessibility and utilization in India and present it in a simple way in order to facilitate easy understanding and actions/steps that need to be taken.
2.5 National Sample Surveys
• The nationwide Labour Force Survey, namely, ‘Periodic Labour Force Survey’ (PLFS) was launched from 1st April 2017. The main objective of the PLFS is to measure quarterly changes of various indicators of the labour market in urban areas as well as to generate the annual estimates of different labour force indicators both in rural and urban areas. The Annual Report on PLFS (July 2017 – June 2018) and Quarterly Bulletin for the quarter October – December 2018 were released on 31st May 2019. Quarterly Bulletin for PLFS for the quarter January – March 2019 was also released on 23rd November 2019.
• The key indicators and unit level data of NSS 75th round (July 2017-June 2018) corresponding to Household Social Consumption on Health and Education have been released on 23rd November 2019.
• The reports and unit level data of NSS 76th round of NSS (July-December 2018) devoted to the subjects of (i) Persons with Disabilities and (ii) Drinking Water, Sanitation, Hygiene & Housing Condition, have been released on 23rd
November 2019.
• Time Use Survey (TUS), which is intended to collect data on time dispositions of household members, was conducted for the first time during the period January to December 2019. The primary objective of TUS is to measure
10
participation of men, women and other groups of persons in paid and unpaid activities. About 10,000 FSUs will be surveyed for the TUS at all India level. This will also provide information on time spent on learning, socializing, leisure activities, self-care activities, etc. by the household members.
• Annual Survey of Unincorporated Sector Enterprises (ASUSE) has been launched on 1st October 2019, initially for six months, which is devoted exclusively to an integrated survey on economic and operational characteristics of unincorporated non-agricultural enterprise in manufacturing, trade and other services sector to supplement the corporate sector data. Based on its result and experience of initial six months survey, a full-fledged survey will be launched from April 2020.
• The 78th Round of NSS (January – December 2020) is devoted to the subjects of (i) Domestic Tourism Expenditure and (ii) Multiple Indicator Survey. Multiple Indicators Survey (MIS) is being conducted for the first time by NSSO for providing estimates relating to some important indicators of Sustainable Development Goals (SDG) 2030. For the first time in NSS, a Questionnaire format will be used for collection of data in NSS 78th round instead of the conventional Schedule format used in NSS. The Collection of data for the central sample will be done through Computer Assisted Personal Interviewing (CAPI) method. The survey commenced from 1st January 2020.
• The provisional results of ASI 2017-18 were released in e-media in the month of September 2019.
2.6 Members of Parliament Local Area Development (MPLAD) Scheme.
• `52,904.75 crore has been released since inception of the Scheme.
• Expenditure of `50,604.12 crore has been incurred since inception of the Scheme
• The percentage of expenditure over release is 95.65 as on 30th November 2019 since inception of the Scheme.
• In 2019-20, against the allocated fund of `3950 crore, an expenditure of `1607.05 crore has been incurred (including brought forward unspent amounts of previous years).
11
CHAPTER – III
NATIONAL STATISTICAL COMMISSION (NSC)
3.1 The Government of India through a Resolution dated 1st June 2005 decided to set up the National Statistical Commission (NSC). The setting up of the NSC followed the decision of the Cabinet to accept a recommendation of the Rangarajan Commission, which reviewed the Indian Statistical System in 2001. The NSC was initially constituted on 12th July 2006 and it has been functioning since then. The NSC has a part-time Chairperson and four part-time Members, each having specialization and experience in specified statistical fields. Besides, Chief Executive Officer of the NITI Aayog is the ex-officio member of the NSC. The maximum tenure of a part-time Chairperson/Member is three years. The Chief Statistician of India is the Secretary to the NSC. He is also the Secretary to the Government of India in the Ministry of Statistics & Programme Implementation.
3.2 The names of the part-time Chairperson and part-time Members of the NSC with effect from the 15th July 2019 during the period under report are as follows:
I. Prof. Bimal Kumar Roy, Chairperson II. Dr. Kiran Pandya, MemberIII. Shri Pulak Ghosh, MemberIV. Dr. Gurucharan Manna, Member
3.3 The functions of the NSC are laid down in the Government of India Resolution dated 5th November 2019. The Resolution provides for submission of Annual Report on its activities by the NSC for each financial year and its laying in both the Houses of the Parliament or concerned State Legislatures, as the case may be, along with memorandum of action taken on the recommendations contained therein. Hence, the reports of the Commission would be laid before both the Houses of the Parliament, separately.
12
CHAPTER – IV
NATIONAL STATISTICS OFFICE
4.1 The National Statistics Office coordinates the statistical activities in the country and evolves statistical standards. NSO brings out important economic indicators such as Gross Domestic Product (GDP), Index of Industrial Product (IIP), Consumer Price Index (CPI) and other official statistics to support Government decision making and framing of appropriate socio-economic polices/programmes. The NSO also has a vast network of field offices spread across the length and breadth of the country for conducting nationwide large scale socio-economic surveys on a regular basis for providing insight into various facets of economy and society at large. Being the nodal agency in the country for official Statistics, the NSO coordinate statistical activities amongst Ministries/Departments of the Government of India as well as with the State/UT Governments.
National Accounts Division
4.2 The National Accounts Division (NAD) of the NSO is responsible for preparation of National Accounts, which include the estimates of Gross Domestic Product (GDP), National Income, Government/Private Final Consumption Expenditure, Capital Formation and Savings along with details of transactions of institutional sectors. The NAD annually brings out a publication titled “National Accounts Statistics”, containing these statistics. The NAD is also responsible for preparation and release of Supply-Use Tables (SUT) and Input-Output Transaction Tables (IOTT) from time to time. NAD maintains liaison with international organizations on statistical matters.
4.3 The NAD provides technical guidance and support to the State/ UT Directorates of Economics & Statistics (DESs) on compilation of estimates of State Income and related aggregates, including estimates of State Domestic Product. State level estimates of Gross Value Added (GVA) and Gross Fixed Capital Formation (GFCF) in respect of supra-regional sectors namely Railways, Communication, Services related to broadcasting, Financial Services and Central Government Administration are furnished by the NAD for the purpose.
4.4 In order to ensure comparability between the National and State level estimates, the NAD compiles comparable estimates of Gross and Net State Domestic Product (GSDP/NSDP) by economic activity and Per Capita Income estimates, in consultation with the DESs.
4.5 In compliance with the Special Data Dissemination Standards of the International Monetary Fund (IMF) and as per its own policy, the NAD releases
13
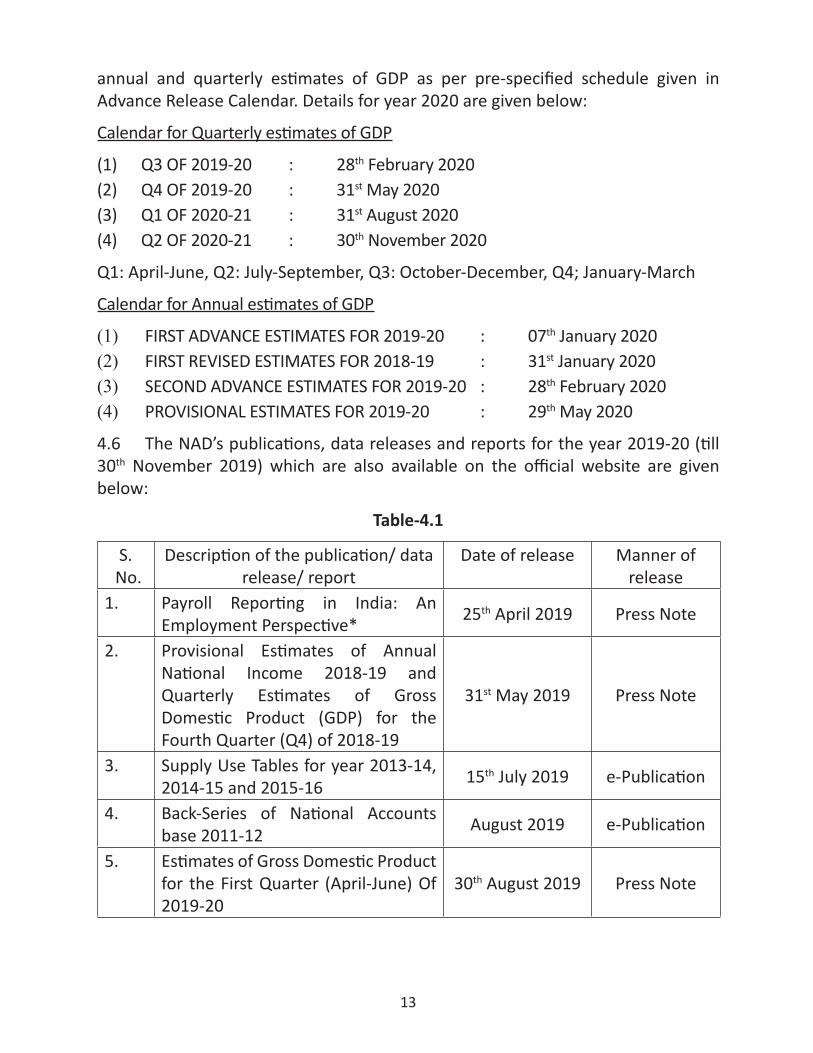
annual and quarterly estimates of GDP as per pre-specified schedule given in Advance Release Calendar. Details for year 2020 are given below:
Calendar for Quarterly estimates of GDP
(1) Q3 OF 2019-20 : 28th February 2020(2) Q4 OF 2019-20 : 31st May 2020(3) Q1 OF 2020-21 : 31st August 2020(4) Q2 OF 2020-21 : 30th November 2020
Q1: April-June, Q2: July-September, Q3: October-December, Q4; January-March
Calendar for Annual estimates of GDP
(1) FIRST ADVANCE ESTIMATES FOR 2019-20 : 07th January 2020(2) FIRST REVISED ESTIMATES FOR 2018-19 : 31st January 2020(3) SECOND ADVANCE ESTIMATES FOR 2019-20 : 28th February 2020(4) PROVISIONAL ESTIMATES FOR 2019-20 : 29th May 2020
4.6 The NAD’s publications, data releases and reports for the year 2019-20 (till 30th November 2019) which are also available on the official website are given below:
Table-4.1
S. No.
Description of the publication/ data release/ report
Date of release Manner of release
1. Payroll Reporting in India: An Employment Perspective* 25th April 2019 Press Note
2. Provisional Estimates of Annual National Income 2018-19 and Quarterly Estimates of Gross Domestic Product (GDP) for the Fourth Quarter (Q4) of 2018-19
31st May 2019 Press Note
3. Supply Use Tables for year 2013-14, 2014-15 and 2015-16 15th July 2019 e-Publication
4. Back-Series of National Accounts base 2011-12 August 2019 e-Publication
5. Estimates of Gross Domestic Product for the First Quarter (April-June) Of 2019-20
30th August 2019 Press Note
14
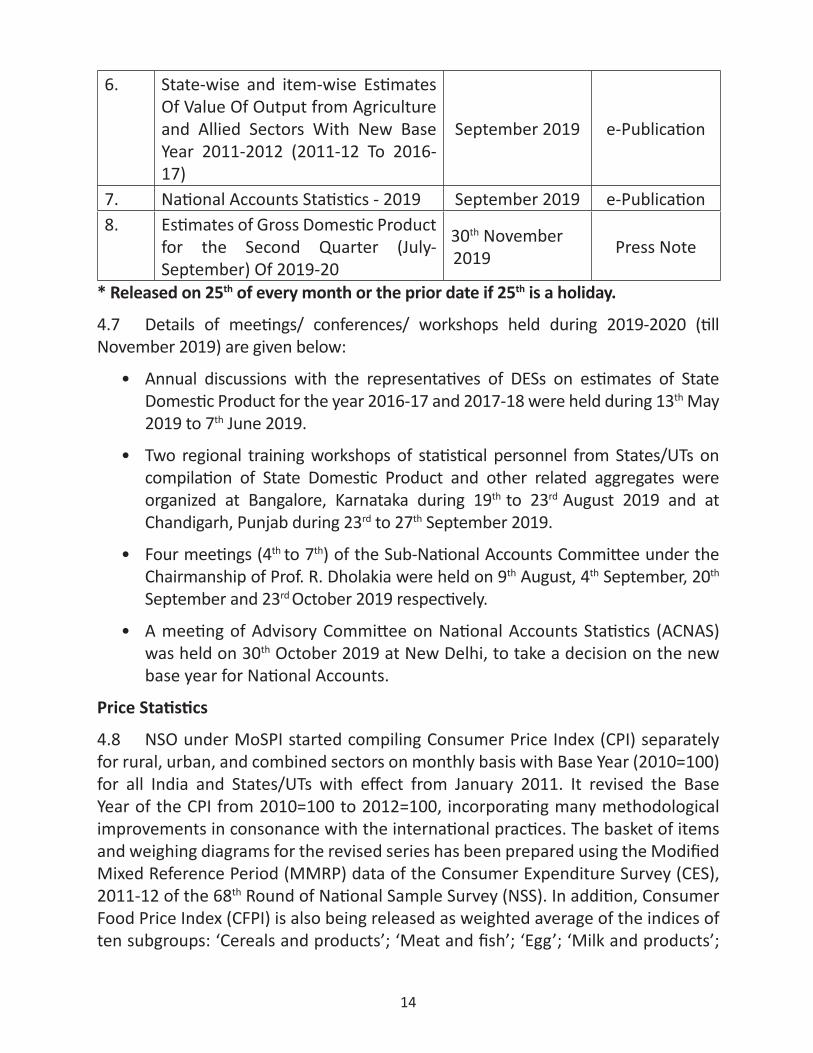
6. State-wise and item-wise Estimates Of Value Of Output from Agriculture and Allied Sectors With New Base Year 2011-2012 (2011-12 To 2016-17)
September 2019 e-Publication
7. National Accounts Statistics - 2019 September 2019 e-Publication8. Estimates of Gross Domestic Product
for the Second Quarter (July-September) Of 2019-20
30th November 2019 Press Note
* Released on 25th of every month or the prior date if 25th is a holiday.
4.7 Details of meetings/ conferences/ workshops held during 2019-2020 (till November 2019) are given below:
• Annual discussions with the representatives of DESs on estimates of State Domestic Product for the year 2016-17 and 2017-18 were held during 13th May 2019 to 7th June 2019.
• Two regional training workshops of statistical personnel from States/UTs on compilation of State Domestic Product and other related aggregates were organized at Bangalore, Karnataka during 19th to 23rd August 2019 and at Chandigarh, Punjab during 23rd to 27th September 2019.
• Four meetings (4th to 7th) of the Sub-National Accounts Committee under the Chairmanship of Prof. R. Dholakia were held on 9th August, 4th September, 20th September and 23rd October 2019 respectively.
• A meeting of Advisory Committee on National Accounts Statistics (ACNAS) was held on 30th October 2019 at New Delhi, to take a decision on the new base year for National Accounts.
Price Statistics
4.8 NSO under MoSPI started compiling Consumer Price Index (CPI) separately for rural, urban, and combined sectors on monthly basis with Base Year (2010=100) for all India and States/UTs with effect from January 2011. It revised the Base Year of the CPI from 2010=100 to 2012=100, incorporating many methodological improvements in consonance with the international practices. The basket of items and weighing diagrams for the revised series has been prepared using the Modified Mixed Reference Period (MMRP) data of the Consumer Expenditure Survey (CES), 2011-12 of the 68th Round of National Sample Survey (NSS). In addition, Consumer Food Price Index (CFPI) is also being released as weighted average of the indices of ten subgroups: ‘Cereals and products’; ‘Meat and fish’; ‘Egg’; ‘Milk and products’;
15
‘Oils and fats’; ‘Fruits’; ‘Vegetables’; ‘Pulses and products’; ‘Sugar and Page 2 of 6 confectionery’; and ‘Spices’. It does not include ‘Non-alcoholic beverages’ and ‘Prepared meals, snacks, sweets etc.’
Trend in CPI based inflation
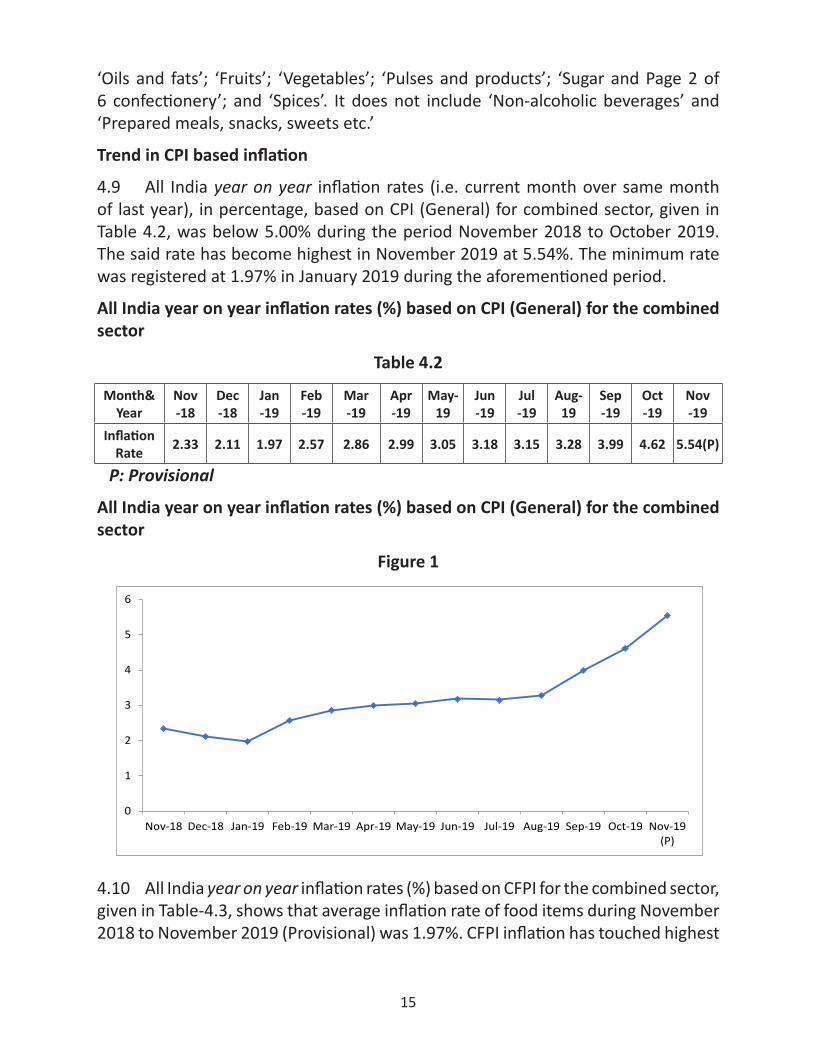
4.9 All India year on year inflation rates (i.e. current month over same month of last year), in percentage, based on CPI (General) for combined sector, given in Table 4.2, was below 5.00% during the period November 2018 to October 2019. The said rate has become highest in November 2019 at 5.54%. The minimum rate was registered at 1.97% in January 2019 during the aforementioned period.
All India year on year inflation rates (%) based on CPI (General) for the combined sector
Table 4.2
Month& Year
Nov-18
Dec-18
Jan-19
Feb-19
Mar-19
Apr-19
May-19
Jun-19
Jul-19
Aug-19
Sep-19
Oct -19
Nov -19
Inflation Rate 2.33 2.11 1.97 2.57 2.86 2.99 3.05 3.18 3.15 3.28 3.99 4.62 5.54(P)
P: Provisional
All India year on year inflation rates (%) based on CPI (General) for the combined sector
Figure 1
0
1
2
3
4
5
6
Nov-18 Dec-18 Jan-19 Feb-19 Mar-19 Apr-19 May-19 Jun-19 Jul-19 Aug-19 Sep-19 Oct-19 Nov-19(P)
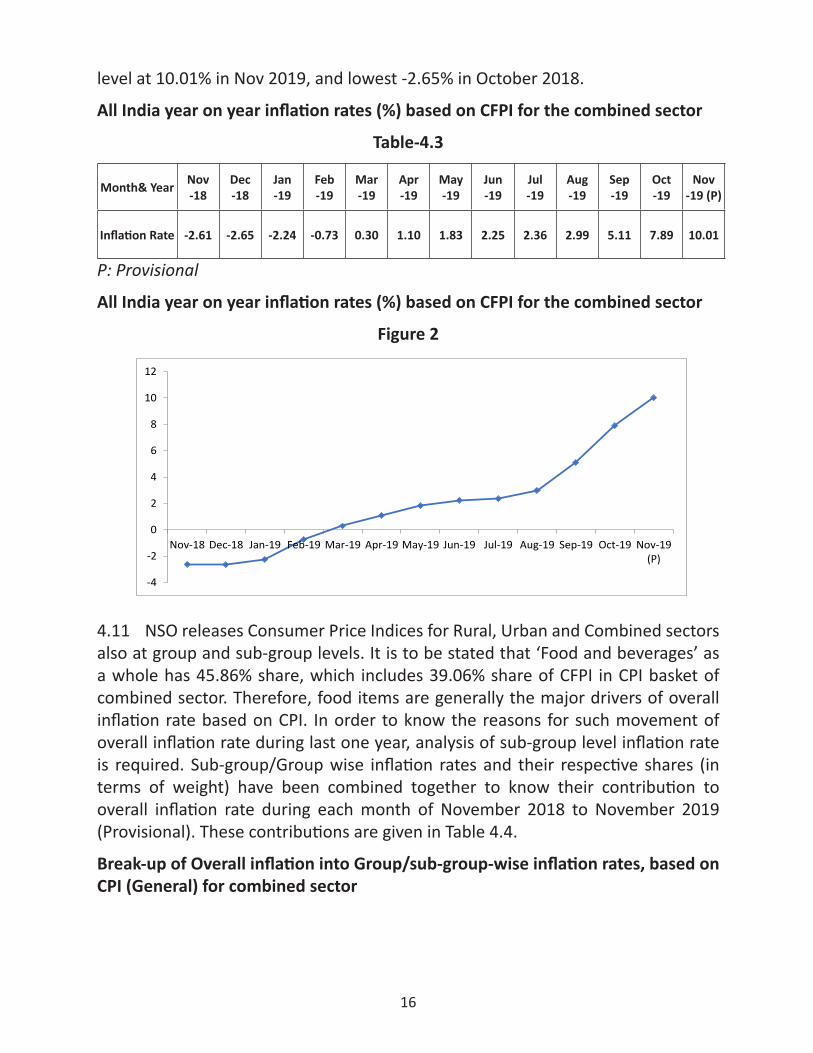
4.10 All India year on year inflation rates (%) based on CFPI for the combined sector, given in Table-4.3, shows that average inflation rate of food items during November 2018 to November 2019 (Provisional) was 1.97%. CFPI inflation has touched highest
16
level at 10.01% in Nov 2019, and lowest -2.65% in October 2018.
All India year on year inflation rates (%) based on CFPI for the combined sector
Table-4.3
Month& Year Nov -18
Dec-18
Jan -19
Feb -19
Mar -19
Apr -19
May -19
Jun-19
Jul-19
Aug -19
Sep-19
Oct -19
Nov-19 (P)
Inflation Rate -2.61 -2.65 -2.24 -0.73 0.30 1.10 1.83 2.25 2.36 2.99 5.11 7.89 10.01
P: Provisional
All India year on year inflation rates (%) based on CFPI for the combined sector
Figure 2
-4
-2
0
2
4
6
8
10
12
Nov-18 Dec-18 Jan-19 Feb-19 Mar-19 Apr-19 May-19 Jun-19 Jul-19 Aug-19 Sep-19 Oct-19 Nov-19(P)
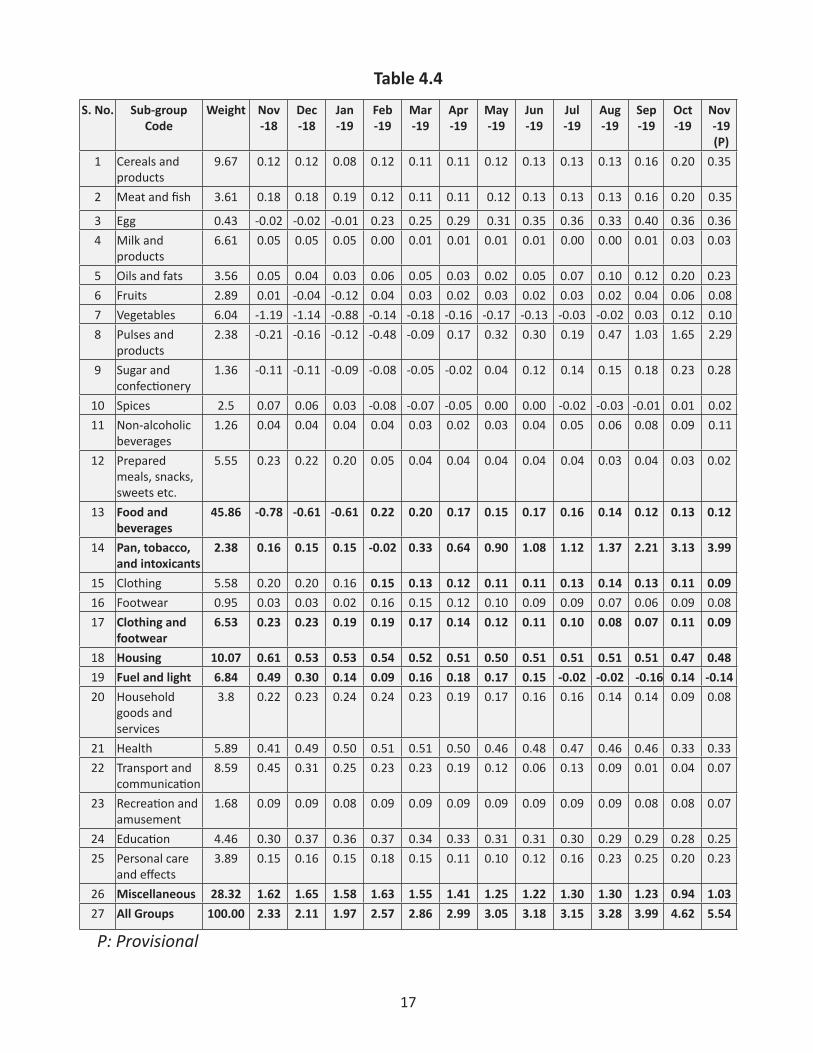
4.11 NSO releases Consumer Price Indices for Rural, Urban and Combined sectors also at group and sub-group levels. It is to be stated that ‘Food and beverages’ as a whole has 45.86% share, which includes 39.06% share of CFPI in CPI basket of combined sector. Therefore, food items are generally the major drivers of overall inflation rate based on CPI. In order to know the reasons for such movement of overall inflation rate during last one year, analysis of sub-group level inflation rate is required. Sub-group/Group wise inflation rates and their respective shares (in terms of weight) have been combined together to know their contribution to overall inflation rate during each month of November 2018 to November 2019 (Provisional). These contributions are given in Table 4.4.
Break-up of Overall inflation into Group/sub-group-wise inflation rates, based on CPI (General) for combined sector
17
Table 4.4
S. No. Sub-group Code
Weight Nov -18
Dec -18
Jan -19
Feb -19
Mar -19
Apr -19
May -19
Jun-19
Jul-19
Aug -19
Sep -19
Oct -19
Nov -19 (P)
1 Cereals and products
9.67 0.12 0.12 0.08 0.12 0.11 0.11 0.12 0.13 0.13 0.13 0.16 0.20 0.35
2 Meat and fish 3.61 0.18 0.18 0.19 0.12 0.11 0.11 0.12 0.13 0.13 0.13 0.16 0.20 0.35
3 Egg 0.43 -0.02 -0.02 -0.01 0.23 0.25 0.29 0.31 0.35 0.36 0.33 0.40 0.36 0.364 Milk and
products6.61 0.05 0.05 0.05 0.00 0.01 0.01 0.01 0.01 0.00 0.00 0.01 0.03 0.03
5 Oils and fats 3.56 0.05 0.04 0.03 0.06 0.05 0.03 0.02 0.05 0.07 0.10 0.12 0.20 0.236 Fruits 2.89 0.01 -0.04 -0.12 0.04 0.03 0.02 0.03 0.02 0.03 0.02 0.04 0.06 0.087 Vegetables 6.04 -1.19 -1.14 -0.88 -0.14 -0.18 -0.16 -0.17 -0.13 -0.03 -0.02 0.03 0.12 0.108 Pulses and
products2.38 -0.21 -0.16 -0.12 -0.48 -0.09 0.17 0.32 0.30 0.19 0.47 1.03 1.65 2.29
9 Sugar and confectionery
1.36 -0.11 -0.11 -0.09 -0.08 -0.05 -0.02 0.04 0.12 0.14 0.15 0.18 0.23 0.28
10 Spices 2.5 0.07 0.06 0.03 -0.08 -0.07 -0.05 0.00 0.00 -0.02 -0.03 -0.01 0.01 0.0211 Non-alcoholic
beverages1.26 0.04 0.04 0.04 0.04 0.03 0.02 0.03 0.04 0.05 0.06 0.08 0.09 0.11
12 Prepared meals, snacks, sweets etc.
5.55 0.23 0.22 0.20 0.05 0.04 0.04 0.04 0.04 0.04 0.03 0.04 0.03 0.02
13 Food and beverages
45.86 -0.78 -0.61 -0.61 0.22 0.20 0.17 0.15 0.17 0.16 0.14 0.12 0.13 0.12
14 Pan, tobacco, and intoxicants
2.38 0.16 0.15 0.15 -0.02 0.33 0.64 0.90 1.08 1.12 1.37 2.21 3.13 3.99
15 Clothing 5.58 0.20 0.20 0.16 0.15 0.13 0.12 0.11 0.11 0.13 0.14 0.13 0.11 0.0916 Footwear 0.95 0.03 0.03 0.02 0.16 0.15 0.12 0.10 0.09 0.09 0.07 0.06 0.09 0.0817 Clothing and
footwear6.53 0.23 0.23 0.19 0.19 0.17 0.14 0.12 0.11 0.10 0.08 0.07 0.11 0.09
18 Housing 10.07 0.61 0.53 0.53 0.54 0.52 0.51 0.50 0.51 0.51 0.51 0.51 0.47 0.4819 Fuel and light 6.84 0.49 0.30 0.14 0.09 0.16 0.18 0.17 0.15 -0.02 -0.02 -0.16 0.14 -0.1420 Household
goods and services
3.8 0.22 0.23 0.24 0.24 0.23 0.19 0.17 0.16 0.16 0.14 0.14 0.09 0.08
21 Health 5.89 0.41 0.49 0.50 0.51 0.51 0.50 0.46 0.48 0.47 0.46 0.46 0.33 0.3322 Transport and
communication8.59 0.45 0.31 0.25 0.23 0.23 0.19 0.12 0.06 0.13 0.09 0.01 0.04 0.07
23 Recreation and amusement
1.68 0.09 0.09 0.08 0.09 0.09 0.09 0.09 0.09 0.09 0.09 0.08 0.08 0.07
24 Education 4.46 0.30 0.37 0.36 0.37 0.34 0.33 0.31 0.31 0.30 0.29 0.29 0.28 0.2525 Personal care
and effects3.89 0.15 0.16 0.15 0.18 0.15 0.11 0.10 0.12 0.16 0.23 0.25 0.20 0.23
26 Miscellaneous 28.32 1.62 1.65 1.58 1.63 1.55 1.41 1.25 1.22 1.30 1.30 1.23 0.94 1.0327 All Groups 100.00 2.33 2.11 1.97 2.57 2.86 2.99 3.05 3.18 3.15 3.28 3.99 4.62 5.54
P: Provisional
18
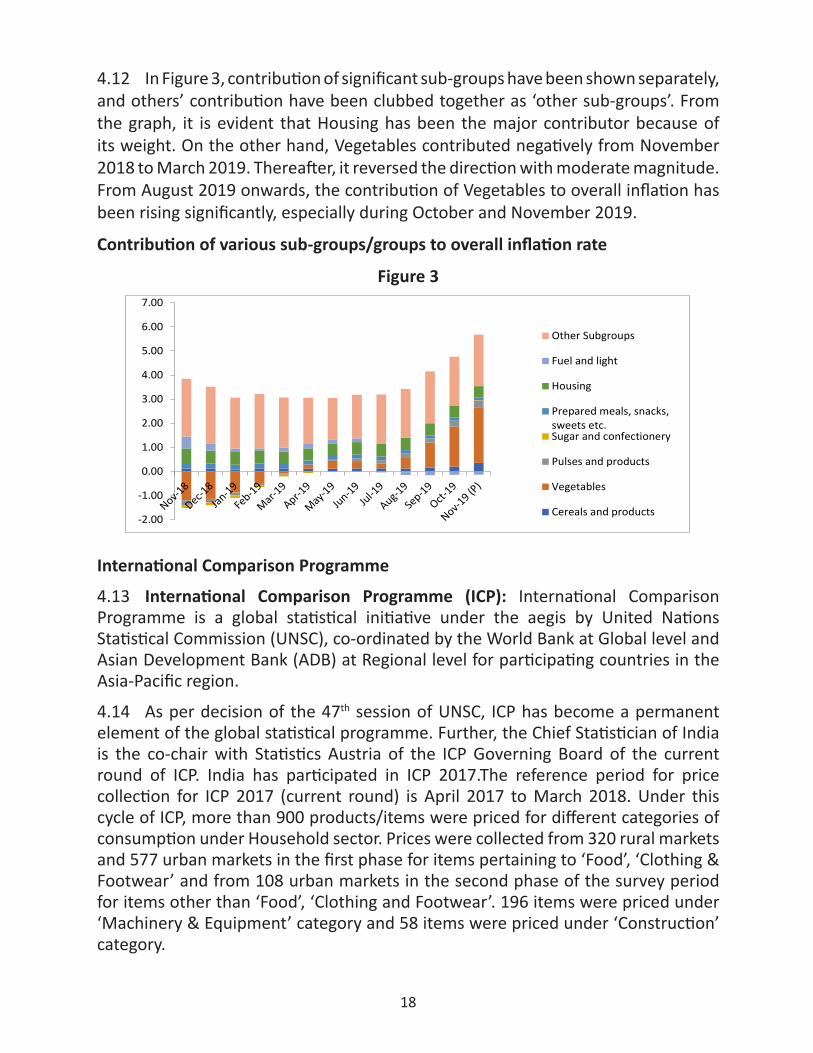
4.12 In Figure 3, contribution of significant sub-groups have been shown separately, and others’ contribution have been clubbed together as ‘other sub-groups’. From the graph, it is evident that Housing has been the major contributor because of its weight. On the other hand, Vegetables contributed negatively from November 2018 to March 2019. Thereafter, it reversed the direction with moderate magnitude. From August 2019 onwards, the contribution of Vegetables to overall inflation has been rising significantly, especially during October and November 2019.
Contribution of various sub-groups/groups to overall inflation rate
Figure 3
-2.00
-1.00
0.00
1.00
2.00
3.00
4.00
5.00
6.00
7.00
Other Subgroups
Fuel and light
Housing
Prepared meals, snacks,sweets etc.Sugar and confectionery
Pulses and products
Vegetables
Cereals and products
International Comparison Programme
4.13 International Comparison Programme (ICP): International Comparison Programme is a global statistical initiative under the aegis by United Nations Statistical Commission (UNSC), co-ordinated by the World Bank at Global level and Asian Development Bank (ADB) at Regional level for participating countries in the Asia-Pacific region.
4.14 As per decision of the 47th session of UNSC, ICP has become a permanent element of the global statistical programme. Further, the Chief Statistician of India is the co-chair with Statistics Austria of the ICP Governing Board of the current round of ICP. India has participated in ICP 2017.The reference period for price collection for ICP 2017 (current round) is April 2017 to March 2018. Under this cycle of ICP, more than 900 products/items were priced for different categories of consumption under Household sector. Prices were collected from 320 rural markets and 577 urban markets in the first phase for items pertaining to ‘Food’, ‘Clothing & Footwear’ and from 108 urban markets in the second phase of the survey period for items other than ‘Food’, ‘Clothing and Footwear’. 196 items were priced under ‘Machinery & Equipment’ category and 58 items were priced under ‘Construction’ category.
19
Index of Industrial Production (IIP)
4.15 NSO compiles the Index of Industrial Production (IIP) using secondary data received from 14 source agencies in various Ministries/ Departments or their attached/subordinate offices.
4.16 IIP is released every month in the form of Quick Estimates with a time-lag of 6 weeks as per the Special Data Dissemination Standard (SDDS) norms of IMF. Apart from breakup of the index for mining, manufacturing and electricity sectors, the estimates are also simultaneously being released as per Use- based classification viz., Primary Goods, Capital Goods, Intermediate Goods, Infrastructure/Construction goods, Consumer durables and Consumer non- durables. These estimates are revised subsequently on receipt of updated production data from the 14 source agencies. The major source of data for IIP is, however, the Department for Promotion of Industries and Internal Trade (DPIIT) that supplies data for 322 out of 407 item groups with a weight of 47.54% in overall IIP.
4.17 The press releases, data (sectoral and use-based category) metadata, and details of methodology of all India IIP with base year 2011-12 are made available in the website (http://www.mospi.gov.in/iip-2011-12-series) for public access.
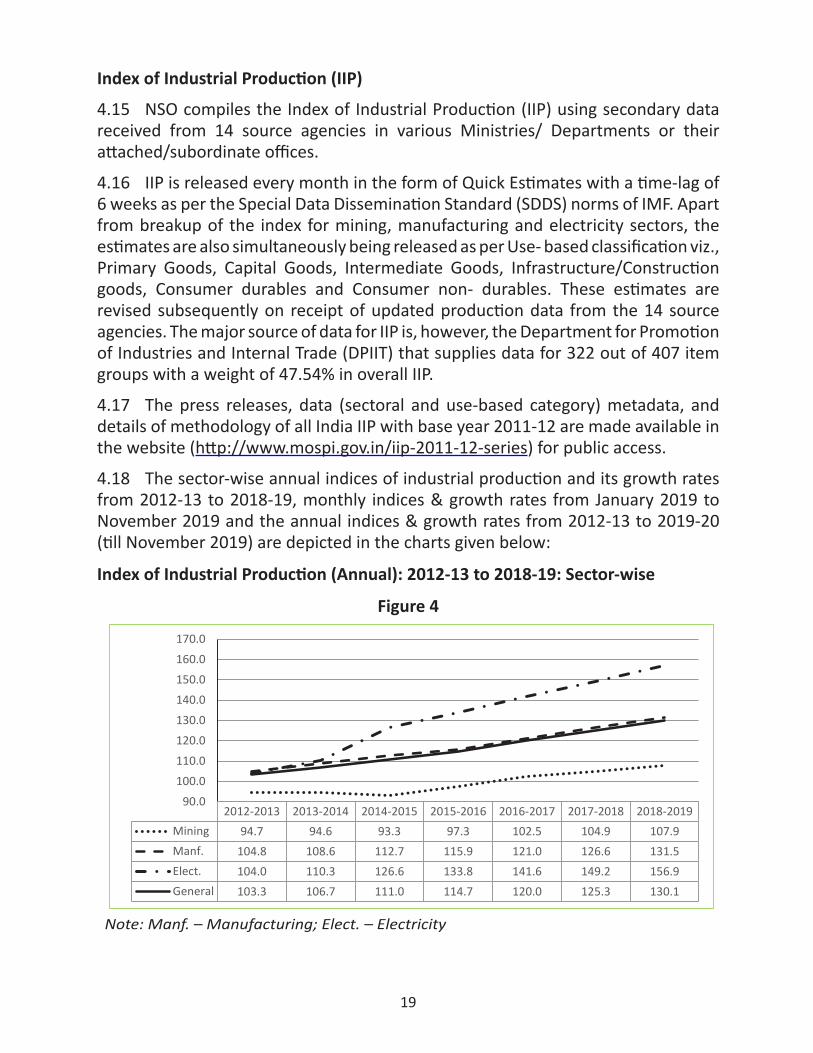
4.18 The sector-wise annual indices of industrial production and its growth rates from 2012-13 to 2018-19, monthly indices & growth rates from January 2019 to November 2019 and the annual indices & growth rates from 2012-13 to 2019-20 (till November 2019) are depicted in the charts given below:
Index of Industrial Production (Annual): 2012-13 to 2018-19: Sector-wise
Figure 4
2012-2013 2013-2014 2014-2015 2015-2016 2016-2017 2017-2018 2018-2019Mining 94.7 94.6 93.3 97.3 102.5 104.9 107.9Manf. 104.8 108.6 112.7 115.9 121.0 126.6 131.5Elect. 104.0 110.3 126.6 133.8 141.6 149.2 156.9General 103.3 106.7 111.0 114.7 120.0 125.3 130.1
90.0100.0110.0120.0130.0140.0150.0160.0170.0
Note: Manf. – Manufacturing; Elect. – Electricity
20
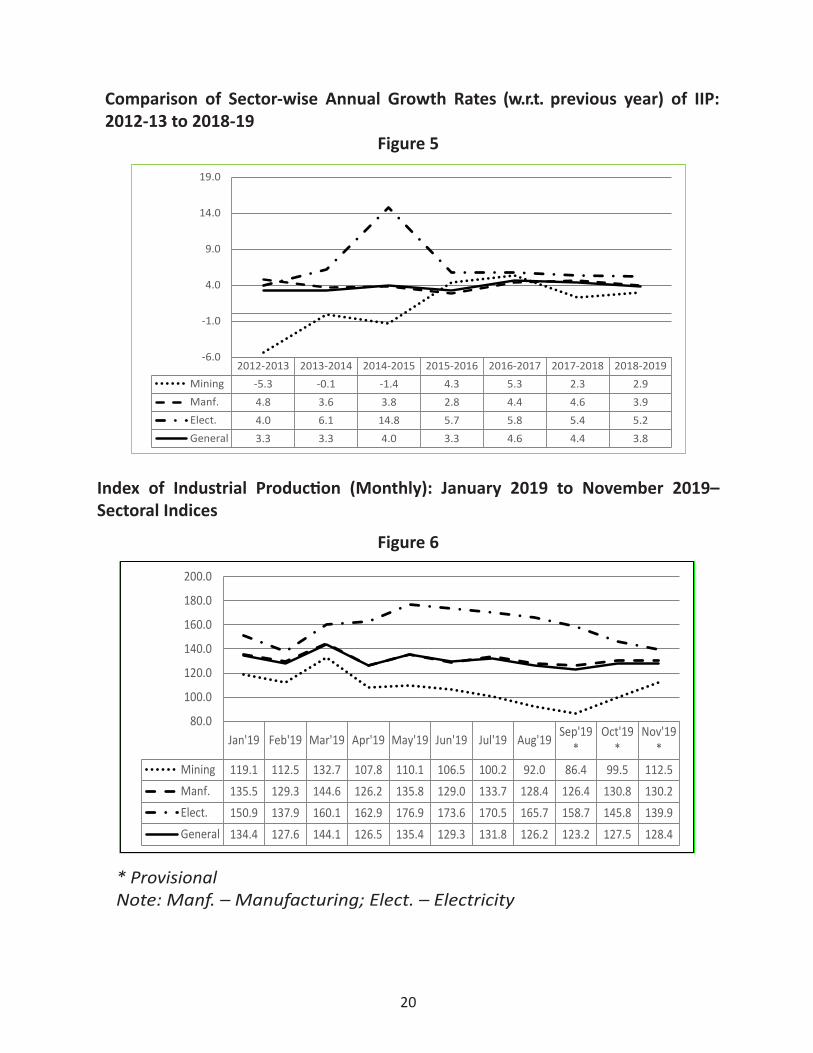
Comparison of Sector-wise Annual Growth Rates (w.r.t. previous year) of IIP: 2012-13 to 2018-19
Figure 5
2012-2013 2013-2014 2014-2015 2015-2016 2016-2017 2017-2018 2018-2019Mining -5.3 -0.1 -1.4 4.3 5.3 2.3 2.9Manf. 4.8 3.6 3.8 2.8 4.4 4.6 3.9Elect. 4.0 6.1 14.8 5.7 5.8 5.4 5.2General 3.3 3.3 4.0 3.3 4.6 4.4 3.8
-6.0
-1.0
4.0
9.0
14.0
19.0
Index of Industrial Production (Monthly): January 2019 to November 2019– Sectoral Indices
Figure 6
Jan'19 Feb'19 Mar'19 Apr'19 May'19 Jun'19 Jul'19 Aug'19 Sep'19*
Oct'19*
Nov'19*
Mining 119.1 112.5 132.7 107.8 110.1 106.5 100.2 92.0 86.4 99.5 112.5Manf. 135.5 129.3 144.6 126.2 135.8 129.0 133.7 128.4 126.4 130.8 130.2Elect. 150.9 137.9 160.1 162.9 176.9 173.6 170.5 165.7 158.7 145.8 139.9General 134.4 127.6 144.1 126.5 135.4 129.3 131.8 126.2 123.2 127.5 128.4
80.0
100.0
120.0
140.0
160.0
180.0
200.0
* ProvisionalNote: Manf. – Manufacturing; Elect. – Electricity
21
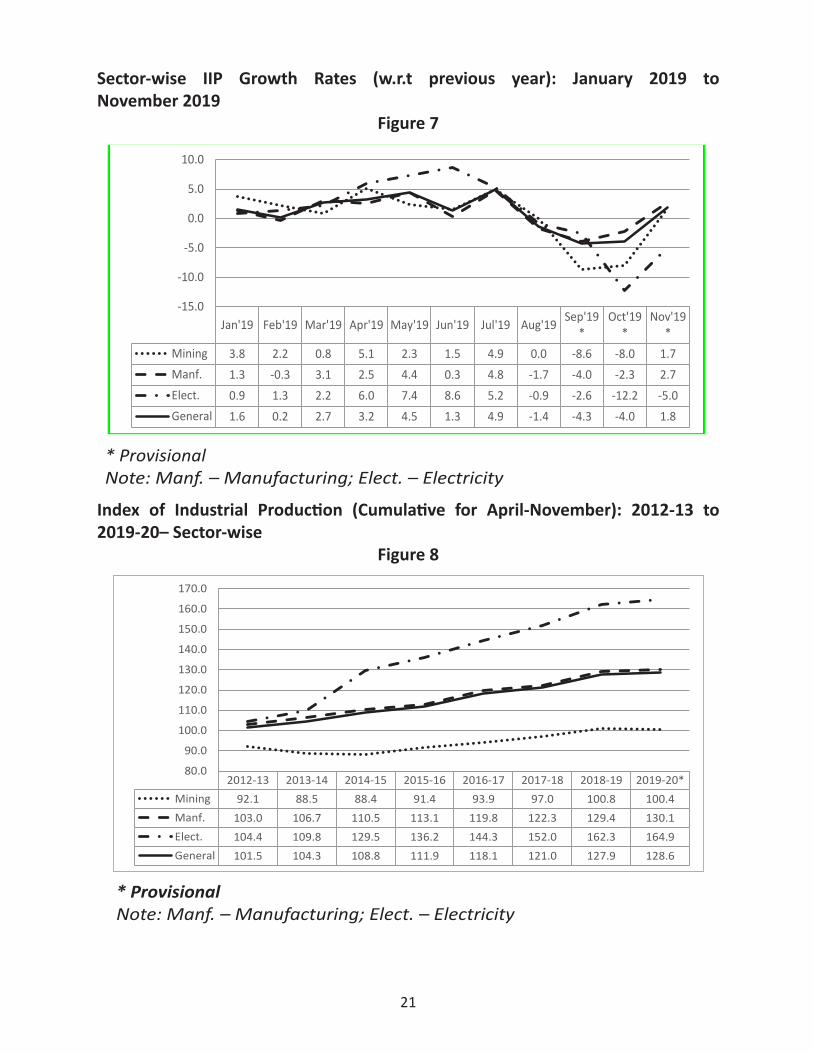
Sector-wise IIP Growth Rates (w.r.t previous year): January 2019 to November 2019
Figure 7
Jan'19 Feb'19 Mar'19 Apr'19 May'19 Jun'19 Jul'19 Aug'19 Sep'19*
Oct'19*
Nov'19*
Mining 3.8 2.2 0.8 5.1 2.3 1.5 4.9 0.0 -8.6 -8.0 1.7Manf. 1.3 -0.3 3.1 2.5 4.4 0.3 4.8 -1.7 -4.0 -2.3 2.7Elect. 0.9 1.3 2.2 6.0 7.4 8.6 5.2 -0.9 -2.6 -12.2 -5.0General 1.6 0.2 2.7 3.2 4.5 1.3 4.9 -1.4 -4.3 -4.0 1.8
-15.0
-10.0
-5.0
0.0
5.0
10.0
* ProvisionalNote: Manf. – Manufacturing; Elect. – Electricity
Index of Industrial Production (Cumulative for April-November): 2012-13 to 2019-20– Sector-wise
Figure 8
2012-13 2013-14 2014-15 2015-16 2016-17 2017-18 2018-19 2019-20*Mining 92.1 88.5 88.4 91.4 93.9 97.0 100.8 100.4Manf. 103.0 106.7 110.5 113.1 119.8 122.3 129.4 130.1Elect. 104.4 109.8 129.5 136.2 144.3 152.0 162.3 164.9General 101.5 104.3 108.8 111.9 118.1 121.0 127.9 128.6
80.0
90.0
100.0
110.0
120.0
130.0
140.0
150.0
160.0
170.0
* ProvisionalNote: Manf. – Manufacturing; Elect. – Electricity
22
State Level Index of Industrial Production
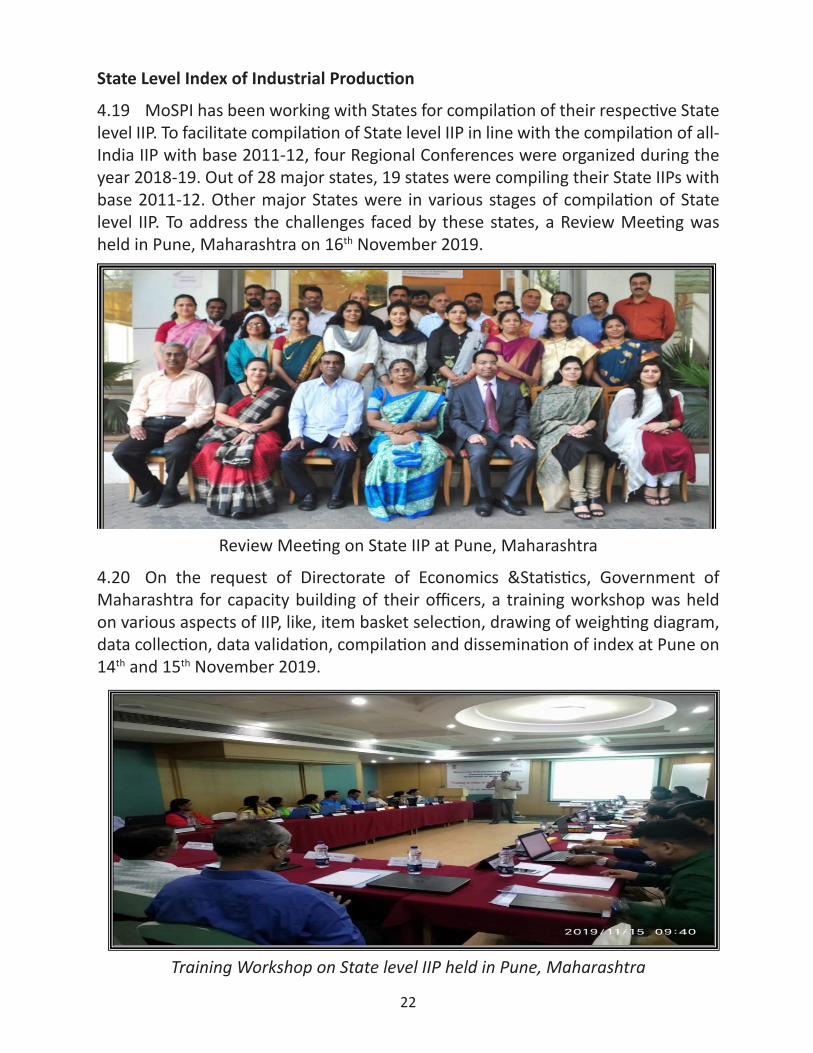
4.19 MoSPI has been working with States for compilation of their respective State level IIP. To facilitate compilation of State level IIP in line with the compilation of all-India IIP with base 2011-12, four Regional Conferences were organized during the year 2018-19. Out of 28 major states, 19 states were compiling their State IIPs with base 2011-12. Other major States were in various stages of compilation of State level IIP. To address the challenges faced by these states, a Review Meeting was held in Pune, Maharashtra on 16th November 2019.
Review Meeting on State IIP at Pune, Maharashtra
4.20 On the request of Directorate of Economics &Statistics, Government of Maharashtra for capacity building of their officers, a training workshop was held on various aspects of IIP, like, item basket selection, drawing of weighting diagram, data collection, data validation, compilation and dissemination of index at Pune on 14th and 15th November 2019.
Training Workshop on State level IIP held in Pune, Maharashtra
23
Energy Statistics
4.21 The publication titled Energy Statistics is annually brought out by NSO and the “Energy Statistics 2019” (26th Edition) is the latest in the series. It is an integrated and updated database of reserves, installed capacity, production, consumption, import, export and wholesale prices of different sources viz. coal, crude petroleum, natural gas and electricity. Energy Balance and Sankey Diagram (Energy Flow Diagram) further aims to enhance its utility. This publication caters to the needs of the Planners, Policy-makers and Researchers by making available the energy data at single place.
Seventh Economic Census
4.22 The 7th Economic Census (EC) is being conducted by the ESD, CSO in 2019 under Capacity Development Scheme. MoSPI has engaged CSC e-Governance Services India Limited, a Special Purpose Vehicle (SPV) incorporated by Ministry of Electronics and Information Technology, Government of India, as the implementing agency for the conduct of 7th EC.
As on 31st December 2019, field work under 7th EC have been started in 28 States/ UTs and will be launched shortly in remaining States/ UTs. The data is being collected on Mobile App through door to door survey of each household and commercial establishment across country under the provisions of Collection of Statistics Act, 2008.Collection of data and supervision is being done by enumerators and supervisors engaged and trained by CSC SPV. The coverage, process check and data quality supervision is being done on sample basis by 2nd level supervisors of the State/UT Government and NSO (FOD), MoSPI. 4.82 Crore EC Houses have been surveyed till 31st December 2019.
Social Statistics
4.23 The Social Statistics Division of the National Statistical Office, MoSPI, is responsible for coordinating development of social, environment and multi-domain statistics. The ambit of social statistics covers population, human development including health and education, employment, social justice and time use, while that of multi-domain statistics includes poverty, gender, persons with disabilities, disability, indicators related to Millennium Development Goals, Sustainable Development Goals (SDGs), SAARC Development Goals and SAARC Social Charter.
4.24 The Division releases annual and adhoc publications on environment and the multi-domain statistics cited above. With the diverse spread of topics to be covered under each of the subjects for these publications, the Division collates and compiles information sourced from national surveys, censuses, administrative data, economic statistics, remote sensing agencies and environmental monitoring
24
systems. These data sets are then combined in standard frameworks prescribed for these statistics, thus providing time-series, comparable across time and space.
4.25 The Division represents the NSO in several expert/technical groups and committees formed in the various Ministries and Departments both at the Centre and State levels and plays a key role in not just ensuring Coordination among the different statistical agencies within the country so as to achieve consistency and efficiency in the statistical system but also emphasizing on the use of standardized concepts, classifications and methods to promote the consistency and efficiency of statistical systems at all levels.
4.26 Besides this, the Division monitors the implementation of Twenty Point Programme (TPP) by collaborating with the Central Ministries and State Governments. Annual and quarterly reports of progress made in the implementation of schemes which are a part of the Twenty Point Programme are released by the Division.
4.27 The statistics data series of the BRICS Countries, released in the form of an annual Joint Statistical Publication, are the result of annual joint efforts of the National Statistical Offices of Brazil, Russia, India, China and South Africa since 2010, which help to disseminate several social and economic data statistics about these countries. The Social Statistics Division is responsible for statistical coordination for India in respect of the BRICS related activities.
4.28 The specific activities undertaken by the Division during 2019-20 are outlined in the following paragraphs.
Monitoring the progress towards Sustainable Development Goals (SDGs)
4.29 On 25th September 2015, the Heads of State and Government and High Representatives meeting at United Nations Headquarters in New York adopted the resolution titled Transforming Our World: the 2030 Agenda for Sustainable Development, which inter-alia, comprised of a set of global Sustainable Development Goals (SDGs) highlighting the focus areas necessary to achieve sustainable development. At the heart of the 2030 Agenda are five critical dimensions - people, prosperity, planet, partnership and peace, each of which are addressed in the Agenda by using the universally applicable SDGs and targets covering the three aspects of sustainable development viz., Economic, Social and Environmental.
4.30 Subsequently, the Inter-Agency and Expert Group on Sustainable Development Goal Indicators (IAEG-SDGs) finalized a list of Global indicators of SDGs, which was adopted by the UN General Assembly on 6th July 2017. The Global Indicator Framework consists of 232 unique indicators. India represented by MoSPI has been an active participant in the IAEG-SDG and other efforts by the UN Statistical Commission aimed at concretizing the indicator framework for global monitoring of SDGs.
25
4.31 In order to help monitor India’s progress towards achieving the SDGs, MoSPI has developed a National Indicator Framework (NIF) keeping in view the national concerns, vision and objectives. The NIF has been developed based on a national consultation process involving Ministries/Departments of the Government, State Governments, UN agencies and other stakeholders. The NIF, consisting of 306 indicators, was uploaded on the Ministry’s website https://mospi.gov.in in November 2018. Later, on the occasion of National Statistics Day, celebrated on 29th June 2019, the SDG-NIF Baseline Report 2015-16 was released as a reference point to measure the progress made on various developmental aspects in subsequent years. Further, a SDG India Dashboard on National Indicator Framework, developed in collaboration with the office of UN Resident Coordinator (UNRC), India and a web page on SDGs have also been placed in public domain.
4.32 During the year 2019-20, two meetings of the High Level Steering Committee (HLSC), were held on 20th June 2019 and 7th December 2019 under the chairmanship of Chief Statistician of India and Secretary, Ministry of Statistics and Programme Implementation (MoSPI) with representatives from NITI Aayog, Ministry of Home Affairs, Ministry of Health and Family Welfare, Ministry of Environment, Forest and Climate Change, Ministry of Finance and Ministry of Statistics and Programme Implementation, to review and refine the National Indicator Framework. The recommendations of HLSC in these meetings would be incorporated in the first progress report on SDG NIF.
4.33 MoSPI is in the process of launching a new Multiple Indicator Survey (MIS) from January 2020 as a part of 78th Round of National Sample Survey (NSS) to bridge data gaps on national as well as global SDG indicators.
4.34 Active collaboration with all the stakeholders including custodian agencies, nodal ministries at the centre, research institutions, state governments and the public, is pivotal to the statistical monitoring of the progress made by the country in respect of the goals and targets specified under SDGs. In this regard, several efforts have been made by the Division, which include:
• A Memorandum of Understanding (MoU) was signed between MoSPI and United Nations Resident Coordinator (UNRC) on 15th March 2018 with the overall purpose of working closely with the UN custodian agencies to collaborate on evolving monitorable indicators, use of new and advanced technologies for monitoring and supporting the capacity-building activities of the Ministry.
• Six Sectoral Committees have been formed on (i) Poverty & Hunger, (ii) Health & Gender, (iii) Education, Employment & Labour, (iv) Environment & Climate
26
Change, (v) Good Governance and (vi) Big Data, Artificial Intelligence, with members drawn from the nodal ministries, custodian agencies and research institutions. Regular meetings of these sectoral Committees, as also focussed Inter-Ministerial meetings are being convened in which Global as well as National Indicators on SDGs are being discussed in detail so as to improve the reporting on these indicators.
• Any statement on the SDGs at the national level is incomplete without the associated commentary on the status prevailing in the States. The Division is, therefore, providing adequate technical support to the States, in development of comprehensive and inclusive SDG Monitoring Framework. The Division has developed and circulated Guidelines for development of State Indicator Framework (SIF) to facilitate and assist States/UTs for development of a State Level Monitoring Framework to track the progress on the SDGs in respective State/UTs. Further, in the annual Conference of Central and State Statistical Organisations (COCSSO) conducted by MoSPI during 11th-12th November 2019 at Kolkata, panel discussions and break-out sessions were organised around the theme of “Sustainable Development Goals” which was attended by the officers of Central Ministries/Department, all the State/UTs and International Agencies. By the end of the conference, several collaborations had materialised between the State Governments and international organisation, and almost all of the States had prepared an indicator framework for gauging the path towards the SDGs.
• Many of the targets specified require active participation of the people, for which awareness building is critical. The Division is addressing this aspect through release of short documentaries and thematic films on SDGs, as also through media interactions. MoSPI has already developed documentary film on SDGs in Hindi and is on the process of getting it dubbed in other regional languages. To further publicize the goals and targets, MoSPI declared SDGs as the theme for National Statistics Day for the year 2019, which is celebrated on 29th June every year in memory of late Prof. P. C. Mahalanobis. Efforts are being taken to introduce the concepts of sustainable development appropriately in school curriculum.
Monitoring the Environment
4.35 The activities of the Social Statistics Division in respect of official statistics on environment in India can be classified into two major domains - Environment Statistics & Environment Accounts. Some of the activities taken up by the Division in this context during 2019-20 are highlighted in the following paragraphs.
27
Environment Statistics
4.36 Continuing its effort to collate and release statistical information on all the aspects of environment, the Division has released the next issue of the publication “EnviStats India 2019; Vol.I: Environment Statistics” in March 2019. The publication is based on FDES-2013 prescribed by UNSD for compilation of environment statistics and provides information on the six fundamental components prescribed in the Framework on Development of Environment Statistics (FDES 2013) namely (i) Environmental Conditions and Quality; (ii) Environmental Resources and their use; (iii) Residuals; (iv) Extreme Events and Disasters; (v) Human Settlements and Environmental Health; and (vi) Environment Protection, Management and Engagement. The online version of the publication provides a larger time-series information for the convenience of users.
Environment Accounts
4.37 Environmental accounts help incorporate the value of natural capital into the national accounting framework alongside other forms of capital. Integrated environmental-economic accounts can help in understanding the relationship between environment and the economy, thereby enabling sustainable use of natural capital. The Division has released the 2019 issue of the annual Publication on environment accounts, “EnviStats India 2019 Vol.II: Environment Accounts” in September 2019. The publication focuses on assessment of quality of soil and water as also valuation of the ecosystem services provided by cropland and nature-based tourism.
4.38 Apart from these publications, in order to mainstream natural capital accounts in policy-making, the Division is coordinating the project on “Natural Capital Accounting and Valuation of Ecosystem Services”. This EU-funded project is under implementation as a partnership project between United Nations Statistics Division (UNSD), the United Nations Environment and the Secretariat of the Convention of Biological Diversity and has helped the Division in the compilation of natural capital accounts, which have resulted in the two publications on environment accounts. With a view to improve the policy mainstreaming of the natural capital accounts as also the methods used for compilation of the accounts, the Division has also actively participated in various meetings conducted by UNSD and UNEP, which has helped in not just chalking a strategy for the natural capital accounting in India but also draw attention of the international communities to the challenges faced by developing countries like India in the implementation of environment accounting.
Assessing the status of multi-domain statistics
4.39 The National Statistical Office has an important role in the context of multi-
28
domain statistics like gender, poverty, food security and the like. In these subjects, there are several agencies at play, each of which gives a ‘stovepipe’ view of the subject. Similar to the case of monitoring the progress towards SDGs, here also the NSO has to play the critical role of setting up collaborations across the different agencies of the government, so that the efforts of each of these agencies could be accumulated to efficiently produce timely statistics that reflect the different aspects of these economically and socially relevant phenomena in the country. One of the roles that the NSO assumes is also that of an aggregator of information of these multi-domain statistics, so that the users have all the necessary information in one place. The function of this consolidated dataset is not just to provide basic information for decision making, evaluations and assessments at all levels, notably by governments, but also to serve as important elements for accountability of public bodies based on achievements. In this regard, the Social Statistics Division, on behalf of NSO, produces annual publications on gender as also on the social sector development in the SAARC countries. In addition, adhoc publications are also released, which are usually the outcome of certain user demands.
4.40 India is a member in the Inter-Agency and Expert Group on Gender Statistics and other International forum on Gender Statistics. MoSPI participates in Conferences/Forums on Gender Statistics to understand its development in international scenario and to put forth the India’s view point.
4.41 The Ministry of Statistics and Programme Implementation is the designated nodal Ministry for statistical coordination and statistical monitoring of implementation of the SAARC Social Charter in the country. The SAARC Development Goals and SAARC Social Charter measures the extent of achievements of the Government policies for poverty alleviation, enhancement of income levels, providing better healthcare facilities, raising the literacy levels and thereby raising the standards of living of its citizens. The publications on SAARC Development Goals and SAARC Social Charter, published alternate years, provide the statistical tool to quantify the success in achieving the objectives of social and economic development that are in conformity with the principal goals of SAARC.
4.42 The Division also has the crucial role of developing capacities across the different agencies so as to improve the robustness and coverage of the existing indicator-set in respect of these statistical domains. Some of the activities taken up by the Division during 2019-20 in dissemination of multi-domain statistics and capacity-development are outlined in the following paragraphs:
• The Annual publication entitled “Women and Men in India 2018” was published in March 2019. The publication provides Gender disaggregated data on various socio-economic aspects including health, education, participation
29
in economy, decision making, social obstacles on women empowerment etc.
• Publication entitled “SAARC Social Charter” was published in March, 2019. The SAARC Social Charter, which was signed by the SAARC Heads of States at the 12th Summit in Islamabad on 4th January 2004, reiterates the vision of the SAARC countries of improving the quality of life of their citizens by addressing social sector development. SAARC Social Charter has accorded highest priority to poverty alleviation, health, education, human resource development, status of women, rights and well-being of children, population stabilization, and drug addiction, rehabilitation and reintegration.
• Publication entitled “Food and Nutrition Security Analysis, India, 2019” was published in June, 2019. The publication is an attempt by the Ministry of Statistics & Programme Implementation and WFP to highlight the prevailing conditions of food availability, accessibility and utilization in India and present it in a simple way in order to facilitate easy understanding and actions/steps that need to be taken.
• A National Workshop on Gender Statistics was organized by MoSPI in association with UN Women on 16th September 2019 in New Delhi, to identify the data gaps in gender related indicators across the different SDGs, not restricted to SDG5, to explore the possible ways of addressing the gaps including those on gender-sensitive issues like violence against women and girl child etc.
Human Resource Development
4.43 National Statistical Systems Training Academy (NSSTA) located at Greater Noida along with the Training Unit located at Pushpa Bhawan, Madangir Road, New Delhi functions as the Training Division of the Central Statistics Office (Social Statistics).
4.44 NSSTA, earlier known as the National Academy of Statistical Administration (NASA), came into existence on 13th February 2009, as a premier Institute primarily fostering human resource development in official statistics at national and state level. The Academy is actively engaged in building capacities in the area of Official Statistics and related disciplines at the National / Sub- National as also at the international level, particularly amongst developing & SAARC countries. The Academy confronted with the challenge of keeping the statistical workforce abreast with and updated on the dynamics of the socio-economic environment and technological and methodological advances, has been continuously striving not only to develop updated course material, revise course curriculum etc; but also to implement effective delivery mechanisms by focusing on pedagogy, all
30
encompassed in its focused training strategy directed at both newly inducted as well as in-service statistical personnel of Central and State/ UT Governments. The main aims and objectives of the Academy are as under:
• To create a pool of trained manpower in theoretical and applied statistics to effectively manage both the current and emerging challenges of data collection, collation, analysis and dissemination for better formulation of policies and plans for the country;
• To train statistical as well as non-statistical manpower in undertaking monitoring and evaluation of large scale programmes/ projects, through specialized short/ medium term training programmes; and
• To create a pool of trainers and develop training material via course-ware in consultation and collaboration with academicians, researchers and professionals from universities, external professional institutions and UN/ bilateral agencies.
4.45 The training strategy adopted entails conducting both induction and refresher training programmes at the NSSTA and outsourcing some trainings to several other identified reputed and specialized institutions. The programmes cater to the need based training of the statistical personnel working in the Central Government, namely, the Indian Statistical Service (ISS) officers, Sub-ordinate Statistical Service (SSS) officers of the Central Government, Statistical Officers from State/UT Governments and Public Sector Undertakings, in the identified subject areas.
4.46 The NSSTA also regularly provides technical support in terms of capacity development of the statistical personnel of the friendly and neighbouring Asian and African countries. As a result, request based training programmes are regularly conducted and organized at NSSTA.
4.47 The NSSTA has also been making efforts to sensitize the potential human resources through awareness programmes in official statistics, both at its campus and at various universities. These programmes also include training of faculty and students from various Universities at NSSTA as well as organizing awareness programmes at selected Universities by the officers of the Academy and NSO. NSSTA organizes this activity every year, as it has been found very useful by the community of users of official statistics.
Amenities:
4.48 The NSSTA is equipped with the modern state-of-the art facilities for training and board and lodging for trainees. The complex of the Academy comprises three well organized building blocks, namely, the Academic and Administrative Block,
31
Hostel Block and the Residential Block, surrounded by well-maintained landscapes. The facilities available in the Academic and Administrative Blocks also include a Conference Hall with a seating capacity of around 60 persons; a centrally air conditioned Auditorium, namely, the ‘Mahalanobis Auditorium’, with a seating capacity for around 160 persons; five Lecture/Training /Seminar Halls, fitted with latest computerized teaching aids; a library, namely the Sukhatme Library; IT teaching computer laboratory equipped with adequate infrastructure to conduct training for about 30 trainees at a time and lodging facilities for 100 trainees. The recreational facilities available in the campus include those for indoor games like Billiards, Table Tennis etc. and outdoor games like Volleyball and Badminton.
4.49 In order to keep pace with the emerging new technologies, especially in the domain of Information and Communication Technology (ICT), the NSSTA has taken various steps towards office automation. For this, a significant IT infrastructure in terms of servers such as blade server, database server, exchange server etc., along with requisite software has been put in place within the premises of the Academy, in order to make available all the necessary IT facilities not only to the NSSTA officials but also to the trainees.
Training Programme Approval Committee (TPAC)
4.50 In order to look after and guide NSSTA on various training programmes, a High Level Committee namely, “Training Programme Approval Committee” (TPAC) has been constituted with senior officers of the Government of India and a few subject experts from reputed Institutes as members. The Committee assesses and approves the need-based training calendar on an annual basis besides reviewing the syllabi, duration and training methodology for all the modules. Most of the courses are conducted at NSSTA while some of the specialized courses are outsourced to reputed institutes/ organizations in Delhi or outside, with proven credentials. Subjects covered in the various programmes conducted by NSSTA mainly include those in the areas of Official Statistical Systems, Theoretical & Applied Statistics, large scale Sample Surveys, SNA 1993 & 2008, Data Management Techniques, Information Technology, Management, Financial Management, Micro and Macro Economics, Econometrics etc.
Regular Training Scheduled at NSSTA
4.51 The training programmes conducted or organized by NSSTA are as follows:
• Two year Induction Training for the officers of the Indian Statistical Service (ISS);
• Induction and Integrated Training Programmes for the Subordinate Statistical Service (SSS) officers, including Training of Trainers (TOT’s) for these courses;
32
• Refresher Training Courses/Seminars/Workshops for the in-service ISS Officers and senior officers of Central Ministries/Departments, State/UT-Directorates of Economics & Statistics & other Line Departments;
• Request- Based Refresher Training Programmes for officers from Central/ State/ UTs;
• Exposure programme on Official Statistical System to the M. Stat Students from the Indian Statistical Institute (ISI), Kolkata and other centres;
• Awareness programmes in official statistics for students and faculty members of universities; and
• Internship Programmes for post graduate students in Statistics of Indian Universities.
4.52 For the purpose of specialized training, NSSTA collaborates with various reputed/specialized Institutes of Managements viz. IIMs; IIRS, Dehradun; ASCI, Hyderabad; Labour Bureau, Shimla; IIPA, Delhi; IIPS; Mumbai; ISTM Delhi; Delhi School of Economics Delhi; IASRI, Delhi; ISEC, Bangalore etc.
4.53 Training of State Statistical Personnel: Regular as also demand based Training Programmes are conducted from time to time for State Governments /UTs in certain specified subjects and areas of their interest. Besides, tailor-made training courses, based on specific requests received from the States and UTs, are also conducted at the NSSTA.
4.54 International Training Programmes:
(i) NSSTA in collaboration with International Statistical Education Centre (ISEC), Kolkata, conducts a 4 Weeks’ Training on “Official Statistics & Related Methodology” as part of the total 10 month duration course for the international participants, conducted by ISI, Kolkata;
(ii) Short term i.e. one-two week training programmes and study visits for the statistical personnel/ participants from SAARC countries of Asia and Pacific region, African and other countries are conducted at the request of Statistical Institute for Asia and the Pacific (SIAP), United Nations Economic and Social Commission for Asia and the Pacific (UNESCAP), Food and Agriculture Organization (FAO), World Bank or the National Statistical Offices (NSOs) of the countries; and
(iii) International Conferences, Seminars and Workshops on emerging areas of Official Statistics.
33
4.55 Research and Development (R&D) at NSSTA
MoU has been signed between NSSTA, MoSPI and IIT-Madras for collaboration on (a) Capacity Building (b) Committee Participation and (c) R & D of Technologies to further improve the quality of Official Statistics.
Incubation Cell has been established at NSSTA, Greater Noida. This Cell will work intandem with different Divisions of this ministry as well as other Ministries and also institutions having expertise in the field of emerging technologies like AI, Big data etc. for promoting research & development of technologies and methodologies in order to make further improvement in the quality of Official Statistics.
4.56 Nomination for Foreign Training Programmes/Meetings/Workshops /Seminars etc.
The Screening Committee of this Ministry under the chairmanship of the Chief Statistician and Secretary (S&PI) of India is constituted to consider nominations for participation in international meetings, conferences, seminars, workshops and trainings.
22 Officers of this Ministry have attended 19 International Meetings/Conferences/Seminars and 27 Officers of this Ministry have participated in 18 International Workshops/Training Programmes/Courses during the year. (From 1st April 2019 to November 2019).
Data Informatics and Innovation Division (DIID)
4.57 Data Informatics and Innovation Division is equipped with latest computer systems and servers. The Data Center of the Ministry is operational round the clock i.e. 365x24x7 to facilitate the data requirements of the national and international users. DIID is being headed by an Additional Director General level officer.
The Division is also harnessing the benefits of cloud computing through GOI Cloud Services wherein several web applications of the Ministry such as Consumer Price Index (CPI), International Household Survey Network (IHSN), Computer-assisted personal interviewing (CAPI), etc. have been hosted for better utilization of the infrastructure and speed.
Main Projects of the DIID:
Data Preparation, Processing and Dissemination
4.58 As per the “National policy on dissemination of statistical data, DIID has been disseminating online and free of cost large volume of data/reports/publications generated through various National Sample Surveys, Annual Survey of Industries, Economic Censuses, Periodic Labour Force Survey and Index of Industrial
34
Production Survey conducted by the Ministry. Under the dissemination policy, the validated, anonymized unit- level data are being disseminated online to the users in International Standard Format (IHSN) which can be exported into different formats like SPSS, STATA, ASCII, etc.
• 6232 users were activated online to download unit level data of ASI, NSS, EC, PLFS, IIP from the website, after registration.
• Meta Study of ASI (2016-17) and Periodic Labour Force Survey (2017-18) was developed using ‘IHSN Microdata Management ToolKit’ software.
Statistical Data and Metadata exchange (SDMX)
4.59 Quarterly estimates of GDP at current and constant prices, 2011-12 for the years 2011-2019 (up to Quarter1) has been converted into SDMX and launched on the website of MoSPI.
Cloud Computing
4.60 Benefits of cloud computing through NIC Cloud Services are being harnessed and currently around 18 web applications of the Ministry including Ministry’s Website, Online Stationery Management, MPLADS, CPI Mobile Application, Sustainable Development Goals(SDGs), 7th Economic Census, Event Management System, Direct Benefit Transfer(DBT), Consumer Price Index (CPI), International Household Survey Network (IHSN), Computer-Assisted Personal Interviewing (CAPI) conducting PLFS Survey, Voorburg etc. have been hosted. This minimizes the cost of infrastructure & manpower and ensures better security.
Consumer Price Index
4.61 DIID processes the price data received from Rural and Urban sectors and compiles the CPI for the release of CPI by CSO. Computer Centre has developed the CPI Archival Web Portal Software for easy retrieval of CPI data. After press release, following indices are uploaded on CPI Web Portal to show the time series indices, visualization, inflation rates, press releases, weights and same can be downloaded in different formats as follows:
• State/All India/Group-Subgroup Indices• All India Item Index• Annual Inflation Rates• All India Item Inflation Rates• Press Release• Cross Tabulation Reports
35
IT activities pertaining to various divisions of the ministry that have been developed
4.62 Economic Statistics Division: (i) Development of IIP Web Portal (ii) GIS applications for Economic Census data. Training Division: Grant-in-Aid and Essay writing modules in process.
Web Site of the Ministry
4.63 DIID is the Nodal Agency to develop, update and maintain the website of the Ministry (http://www.mospi.gov.in). It is an integrated platform for all the divisions of the ministry having all the statistical publications/reports, metadata, external links to CPI & IIP, SDGs and Key Performance Indicators (KPIs).
NIIP (National Integrated Information Platform)
4.64 The Ministry has envisaged NIIP Project to be developed based on a conceptual framework on Data Acquisition, Data Management, optimum use of Information Technology in integrating and harmonizing the available data sets in various key sectors through single window system. The challenges are likely to be faced in generating, compiling, analysing, maintaining and disseminating quality data, both micro and macro (aggregate) level, for the user community.
4.65 With this background, NIIP Project has been conceptualized with a need to take an overall view, highlighting the importance of linkage between various data sources, integrating the data sources using Information Technology (IT) tools and offering a generally consistent approach to bring out timely, reliable, credible and user-friendly data sets through a single window system and should be able to transform and disseminate all its data sets to a portable data format in a standard, unified and harmonized manner. Broadly, NIIP operations would include:
• Data collection• Functional focus• Information dissemination
NIIP technical and financial evaluation process is over.
Training Activities
4.66 The Division provides faculty services to NSSTA for conducting IT courses for officers/ officials of States/UTs and Central Government Departments. This Division is also providing internship to the students sponsored by various Universities/ Institutions for developing IT related projects. Four interns have successfully completed internship programme during 2018-19 in the scheme for the ‘Internship for Post Graduate/ Researchers Scholars’ of the Ministry using NSS data of different rounds for study and Analysis with Analytical R Software. Following IT Lectures/
36
Workshops were held in DIID on new emerging technologies:
• A Two days GIS workshop during 27th -28th May 2019 at India Habitat Centre, Lodi Road organized for the Officers/Officials of MoSPI.
• A Three days GIS workshop during June 2019 by ESRI India was organized in Computer Centre to appraise the Dashboard developed (pilot basis) by ESRI India using Sixth EC & Seventh EC data (sample).
• Organized workshop during October 2019 for developing statistical stacks for the Officers of MoSPI.
The above training programs were very informative.
Data Centre
4.67 The servers of the Data Center are operating on 24x7x365 basis and troubleshooting of Network setup, Desktops and Printers were made as per users’ requirement. The Division has also procured hardware and software for upgrading and maintaining the Data Center. The IT equipments are being upgraded to meet the current requirements of Ministry.
Progressive use of official language Hindi
4.68 In accordance with the Official Language policy of the Union, concerted efforts are being made for promotion of progressive use of Hindi as Official Language. Official Language Implementation Committee under the chairmanship of Additional Director General, DIID reviews the progress of Hindi and compliance of Official Language Act and rules there under. In each quarter, the meeting of this committee was organized successfully. Hindi Pakhwara was observed in the Centre in September 2019. During this period competitions were organized and certificates and cash prizes for `23,500/- were given to the participants. Incentive scheme for original work in Hindi continued this year also. Cash prizes were awarded to seven officials. Prize distribution ceremony was organised on 9th October 2019 during Hindi Pakhwara Samapan Samaroh in DIID.
Coordination and Publication (CAP) Division
4.69 The Coordination and Publication (CAP) Division is mainly responsible for coordinating the statistical activities of various Divisions of the Ministry of Statistics and Programme Implementation and maintaining a liaison with the Central Government Ministries/Departments and also with State Governments and other Statistical Agencies including international bodies on statistical matters. The CAP Division coordinates with other Divisions for Plan Coordination, preparation of the Annual Action Plan and Outcome Budget of the Ministry. The Division is
37
also entrusted with the responsibility of administering the Sub-Scheme “Support for Statistical Strengthening (SSS)”, Coordination work of implementation of the Collection of Statistics Act, 2008 and follow-up of National Statistical Commission (NSC) recommendations. The major activities undertaken by the division during 2019 (up to 15th December 2019) are indicated in the following paragraphs.
Statistics Day
4.70 The 13th Statistics Day, 2019 was celebrated on 29th June, 2019, all over India. The theme selected for the 13th Statistics Day was “Sustainable Development Goals (SDGs)” keeping in view India’s commitment towards achieving these goals. The main function was organized by the Ministry of Statistics & Programme Implementation on 29th June 2019 at Vigyan Bhawan, New Delhi. Hon’ble Union Minister of State (Independent Charge) of Ministry of Statistics and Program Implementation and Ministry of Planning, Rao Inderjit Singh inaugurated the event. Dr. Bibek Debroy, Chairman, Prime Minister’s Economic Advisory Council and President, Indian Statistical Institute, Shri Pravin Srivastava, Chief Statistician of India-cum-Secretary, Ministry of Statistics and Program Implementation along with senior officers of Central/ State Governments and other stakeholders were also present on the occasion. The winner of Prof. C.R. Rao Award 2019, Dr. Subhra Sankar Dhar, Associate Professor, IIT, Kanpur was felicitated during the program for his notable contribution in the field of Statistics. The winners of ‘On the Spot Essay Writing Competition’ for Post Graduate Students on the subject relevant to Statistics organized at All India level were also felicitated. During the event, a short documentary film on SDGs was also exhibited reflecting country’s commitment towards integrating social, economic and environmental dimensions for holistic development.
Conference of Central and State Statistical Organizations (COCSSO)
4.71 In order to enhance coordination amongst different States/UTs and Central Ministries/Departments for the activities in the field of statistics, the Ministry organizes Conference of Central and State Statistical Organizations (COCSSO) every year. This forum is used for discussing important statistical issues by the Central and State statistical agencies with an objective to ensure the availability of reliable and timely statistics to planners and policy makers for informed decision making and good governance.
4.72 The 27th Conference of Central and State Statistical Organizations (COCSSO) was held during 11th-12th November 2019 at Biswa Bangla Convention Centre, Kolkata, West Bengal. The theme of the 27th COCSSO was “Sustainable Development Goals (SDGs)”. The Conference was inaugurated by Dr. Bimal Kumar Roy, Chairman,
38
National Statistical Commission. Representatives from Central Government Ministries, State Governments, international agencies, academic institutions, corporate sector, community organizations and other stakeholders participated in the conference.
Memorandum of Understanding with National Council of Applied Economic Research
4.73 The Ministry of Statistics and Programme Implementation (MoSPI), Government of India and National Council of Applied Economic Research (NCAER) have signed a Memorandum of Understanding (MoU) to use new data technologies, knowledge generation and knowledge sharing, and capacity building in the field of Official Statistics. The MoU was signed in New Delhi on 29th January 2019 in the presence of Shri Pravin Srivastava, Secretary, MoSPI cum Chief Statistician of India, Shri Jyotirmoy Poddar, Director General, Central Statistics Office, Shri Shekhar Shah, Director General, NCAER and other senior officers of both the organizations. The MoU would lead to strengthening and better monitoring of data quality and timeliness of various statistical products and services generated by the Ministry including, Gross Domestic Product (GDP), Economic Census, Price Statistics, Index of Industrial Production (IIP), and Annual Survey of Industries (ASI), etc.
Smart India Hackathon (SIH) 2019
4.74 The Ministry has participated in Smart India Hackathon (SIH) 2019 during 1st-2nd March 2019 at Guwahati for identifying technological innovations in Official Statistics. The following problem statements were considered for SIH 2019:
• Automation of statistical information compilation process
• Preparation of Gross Value Added (GVA) and storing in database
• Preparation of Dashboard for National Accounts
• Crowd sourcing of the works for Members of Parliament
• Information Management System
Guidelines for Statistical Data Dissemination (GSDD) (in accordance with NDSAP, 2012)
4.75 The Guidelines on Statistical Data Dissemination has been notified on 1st April 2019, to define shareable and non-shareable statistical data generated by MoSPI and other statistical agencies, specify the terms and conditions for its dissemination and pricing within the overall framework laid down in NDSAP 2012. The objective of these guidelines is to make available national Statistics to the widest possible community, and where appropriate, with a choice of format, to facilitate users in
39
getting access to statistical data and reports. Now, all sharable data of the Ministry is made available to public free of cost.
Guidelines for the use of “NSO” logo indicating its moto of “Data for Development”
4.76 The National Statistical Office (NSO) under Ministry of Statistics & Programme Implementation (MoSPI), Government of India unveiled its Logo, and thereafter, issued the guidelines for the use of “NSO” logo on 15th July 2019. The colour wheel in the Logo made from 17 differently-coloured arcs promotes awareness about the 17 Sustainable Development Goals. This Logo and other related proprietary materials are valuable assets of MoSPI. By using “NSO” Logo, in whole or in part, the user is acknowledging that NSO under MoSPI is the sole owner of the trademark and promising that user will not interfere with NSO’s rights and will not harm, misuse, or bring into disrepute the NSO Logo. These guidelines have been issued to facilitate the use of the “NSO” Logo by various Government/ Semi- Government/ Private Authorities.
Code of Professional Ethics for Members of Committees
4.77 The Ministry has notified a Code of Professional Ethics for Members of the various Committees constituted by MoSPI or by the Organizations, Institutions and bodies etc., funded by it on 19th July 2019. It has been notified to define and to set out certain standards of conduct for the members of the Committees in order to protect the confidentiality of the data/information acquired by them by virtue of their membership in such Committees.
Vision 2019-24 of the Ministry
4.78 The Ministry has prepared its Vision document 2019-2024 to Strengthen India’s National Statistical System and to provide real-time inputs for policy and stronger dissemination practices for public. It imbibes integrated statistics approach with following broad themes on wide-ranging reforms of statistical products and processes to be implemented in order to realize the vision:
• Strengthening statistical infrastructure for real-time monitoring of the economy.
• Integrating data and registries, existing in silos in various Ministries, into the National Statistical System through an Integrated Information Portal by developing data sharing protocols and use of technology.
• Strengthening the monitoring of large infrastructure projects.
Amendment in the Collection of Statistics (CoS) Act, 20084.79 Ministry of Statistics and Programme Implementation provided inputs for amendment in the CoS Act, 2008 for omission of the proviso in sub section 2 of
40
Section 1 of the Act which was related to applicability of the Act in relation to the then State of Jammu & Kashmir. This amendment was enforced through the Jammu and Kashmir Reorganization (Adaptation of Central Laws) Order, 2019. This was necessitated consequent to Jammu & Kashmir Reorganization Act-2019 and repeal of the Jammu and Kashmir Collection of Statistics Act, 2010. Now, the CoS Act extends to whole of India.
Proposal for Amendment to the Indian Statistical Institute (ISI) Act, 1959
4.80 In order to broaden the purview of the existing provisions of the ISI Act, 1959, the Ministry considered a proposal to amend the section 4 of the Act and put it in the public domain on 26th November 2019 for comments/ views of the citizens/ stake-holders. The proposed amendment is to keep pace with the changing educational landscape in the globalized scenario and to enable ISI to grant degree in various multi disciplinary subjects including natural/ social sciences.
Social Media Cell for the Ministry
4.81 The Ministry has set up a Social Media Cell by engaging an agency to disseminate the activities of the Ministry and to increase its public outreach. With the setting up of the media cell, the Ministry’s presence in the Social Media has started getting traction and the work is being widely acknowledged by the stakeholders.
Stakeholder Consultation on Skill Sets for Survey Specialists/Enumerators
4.82 A consultation workshop was organized by the Ministry of Statistics and Programme Implementation (MoSPI) at New Delhi on 1st November 2019 with various stakeholders for evolving a framework to develop and nurture the sector for skilled survey enumerators and specialists, including for data quality under the skilling ecosystem so as to address the needs of organizations to have a pool of qualified and skilled persons that can undertake surveys professionally and who can be hired by agencies and manpower consultants. The consultation was chaired by Shri Pravin Srivastava, Chief Statistician of India-cum-Secretary, MoSPI. Dr. K. P. Krishnan, Secretary, Ministry of Skill Development and Entrepreneurship (MSDE) addressed the stakeholders on skill development initiatives of MSDE and demand driven employment opportunities for survey enumerators/specialists in the market for being deployed in household, establishments and consumer based surveys. Representatives of National Council of Applied Economic Research (NCAER), National Skill Development Council (NSDC), International Institute of Population Sciences (IIPS), RBI, Tata Trusts, etc. welcomed this unique initiative by MoSPI towards improving the skilling ecosystem for undertaking surveys professionally. Several agencies involved with survey work, including research & training institutes, international agencies, Government Ministries/ Departments, and consultancy firms, participated actively in the event and gave useful suggestions.
41
Workshop on development of Statistical Stack:
4.83 Data produced by the Ministry is consumed by statisticians, academia, research agencies and industry to make informed decisions, public policy formulation and measuring the progress and impact of current portfolio of schemes presently being implemented in the country. Hence, there is an increasing demand on the Ministry’s systems and operations to produce relevant and quality data/statistics which has in turn put pressure on the Ministry to optimize their resources and promote further use of technology in the field of data collection, programme monitoring and statistical analysis in an integrated approach and data sharing platform.
4.84 For that to happen, there is a need to have a paradigm shift from the ‘department-centric’ view of service/ data delivery to a more ‘stakeholder-centric and user-driven’ approach. In an effort to work in this direction in a more nuanced way, Ministry conducted a two days workshop at Bangalore during 29th – 30th October 2019, wherein the challenges of the present system and the ways to overcome them through a shared vision were deliberated in detail. All the members in the workshop were divided in teams and they were asked to outline their dreams/ visions for the Ministry which was discussed. 3 of them namely (i) A billion usage in 5 years, (ii) Facilitating exchange of information amongst Government agencies to reduce redundancy in data collection and ensure collaboration and (iii) Industry/sector-specific customizable insights (customizable dashboard) were finalized for further discussion. For each of these, a use case was developed which included detailing of associated missions, programs, potential solutions, existing assets, foreseeable gaps and guiding principles.
Public Investment Board (PIB) memo for procurement of building for the Ministry
4.85 The Ministry finalized a PIB memo for procurement of a building at Nauroji Nagar, New Delhi being constructed by NBCC. This is intended at having its own integrated office space for increased efficiency and synergy among various verticals of the Ministry for realizing the Vision of the Ministry in a more nuanced way. The PIB meeting to appraise the proposal was held on 11th December 2019.
National Programme for improving quality of Statistical Products
4.86 The Ministry has initiated the National Programme for improving quality of Statistical Products aimed at strengthening and modernizing the Indian official statistics system with technical/ financial assistance of World Bank. The project has already posed to World Bank by Department of Economic Affairs for assistance. A number of stake-holders consultations have been organized for the project. A broad activity matrix for the project has already been finalized in consultation with various divisions of the Ministry and World Bank team. The Statistical Strengthening Project
42
Unit of the Ministry has been entrusted with the task of undertaking the pre-project activities and taking the project forward in a mission mode approach.
50th Meeting of the United Nations Statistical Commission
4.87 India was represented in the 50th Meeting of the United Nations Statistical Commission held during 5th-8th March 2019 in New York, USA by a delegation lead by Shri Pravin Srivastava, Secretary, MoSPI & Chief Statistician of India. Secretary, MoSPI in his written intervention appreciated UNSD and Inter Agency and Expert Group for Sustainable Development Goals (IAEG-SDG) Indicators, for their efforts in working on proxy indicators and additional indicators for 2020 comprehensive review. He stated that during the 49th UNSC Session, India had expressed its concern on pilot surveys and estimates being used for country report without consulting or involving the concerned National Statistical Offices (NSOs). He thanked the Commission and UNSD that India’s concern was considered and appropriately incorporated it in the Guidelines and Best Practices on Data Flows and Global Data Reporting for Sustainable Development Goals. He drew the attention to the fact that in 49th Session, India had requested the IAEG-SDGs and the Custodian Agencies to expedite development of methodology and standards in respect of Tier-III indicators in a time bound manner so that countries can initiate work to align their statistical data systems for producing corresponding indicators. He pointed out that there must be meticulous examination of methodology before adoption of the same as countries are having different statistical set-ups.
Adding further, he pointed out that custodian agencies are not providing adequate time to the Member States to go through the lengthy methodology documents for large number of indicators. Therefore, the voting through Webex meeting may be reconsidered after giving adequate time. Final decision of reclassification of indicators should be decided at physical meetings of IAEG-SDGs only. While supporting the plan for 2020 comprehensive review, India pointed out that due care is to be taken to ensure that both proxy indicators and additional indicators remain relevant to the target and have a clear methodology and standards; and it should further satisfy the criteria of Tier-I indicators.
4.88 Regarding agenda item on Finance Statistics, the comments of Reserve Bank of India was communicated by Secretary, MoSPI & CSI and India supported the proposal regarding transferring the responsibilities of the task force related to conceptual and methodological issues on the compilation of external debt statistics to the IMF committee on Balance of Payments statistics. India also supported the proposal relating to public debt statistics to be transferred to the Inter-Secretariat Working Group on National Accounts and the IMF Government Finance Statistics Advisory Committee. It was pointed out that such transfer would not only be
43
helpful in streamlining the stock-flows conceptual issues but would also provide an opportunity to the compilers to get a comprehensive understanding on this important aspect of external finance statistics. Since Reserve Bank of India (India’s Central Bank) is compiling debt statistics they may be associated with the inter-agency working group on debt statistics as India’s country experience in this regard may provide good insights for the capacity building programme.
4.89 India also made intervention on the agenda regarding Common Open Standards for the Exchange and Sharing of Data and Metadata. It was stated that the work being carried out by the Statistical Data and Metadata Exchange Statistical Working Group and Statistical Data and Metadata Exchange Technical Standards Working Group are of immediate relevance to the Reserve Bank of India (India’s Central Bank) since they are in the process of upgrading its data warehouse. Data/metadata structure definitions (DSD) prescribed by these groups in respect of select macro-economic variables categories will reduce efforts at the RBI end, and they may also guide in preparing DSDs for other macro-economic variables. It was suggested that these Working Groups may consider extending the DSDs under SDMX framework in such a way that the information on maximum number of parameters prescribed under IMF’s Data Quality Assessment Framework and UN’s National Quality Assurance Framework (NQAF) are factored.
4.90 Besides the main event, the side events on following subjects were also attended by the Indian Delegation:
• ‘Orientation Session for New Commission Participants’. • Statistics meet Health: • Data and Statistics for Evidence-Based Voluntary National Reviews• High Level Forum on Official Statistics Financing for Data and Statistics• StaTact, a fast-tracking solution to data gaps• Meeting of Bureau and members of the Committee on Statistics in Asia and
the Pacific• Natural Capital Accounting (NCA) - Connecting the Pillars of Sustainability• The Role of National Statistical Agencies in Implementing Digital Agenda • Preparation and Skilling for Official Statistics Careers• Annual consultation of Inter-Secretariat Working Group on Household
Surveys (ISWGHS)• Innovations in Gender Data• The role of Statistical Institutes in Digitalisation Strategies of Governments• Advancing Open Data and Interoperability for SDG Reporting• Making disability visible in statistics
44
• Communication Initiatives to raise statistical awareness• Global Network of Institutions for Statistical Training (GIST) Annual Meeting • Meeting of International Statistical Institute - Committee on Agricultural
Statistics.
4.91 In addition, the Secretary, MoSPI & Chief Statistician of India had one to one meetings with the following:
• Meeting with Officers of WHO to explore ways of expediting WHO’s involvement with Health Indicators for the SDG in India.
• Meeting with UNFPA for further collaboration on SDGs in India for demographic indicators.
• Meeting with Mr Ziyadullaev, Deputy Chairman, State Committee of the Republic of Uzbekistan on Statistics and Mr Bakhtiyor Ibragimov, Ambassador, Permanent Representative of Uzbekistan to the United Nations for furthering the Memorandum of Understanding between the Governments of India and Uzbekistan for technical cooperation in the field of statistical capacity building. This meeting was facilitated by Asian Development Bank.
• Meeting with a delegation from Federal Competitiveness and Statistics Authority, UAE led by H.E. Abdulla Nasser Lootah, Director General for improvement in collection of data from industries and households. They are looking forward to working closely with India on statistical matters. This meeting was facilitated by the Counsellor, Permanent Mission of India to the UN.
Support for Statistical Strengthening Project (SSSP)
4.92 ‘The Support for Statistical Strengthening’ (SSS) is an ongoing scheme aiming to improve the statistical capacity and operations of State Statistical Systems for collecting, compiling and disseminating reliable official statistics. It has an initial total allocation of `650.43 crores. When the final approval of CCEA for continuation of the scheme till March 2020 was received in September 2018, an amount of only `264 crores was received for the 3 year period from 2017 – 2018 to 2019 – 2020. As till the end of financial year 2016-17 (i.e. 31st March 2017), an amount of `260.46 crores had already been released, the overall allocation of the Scheme was thus reduced from `650.43 crores to `524.46 crores.
4.93 The Scheme is presently a Central Sector Sub-Scheme with 100% funding from the Centre, under the umbrella scheme of Capacity Development. It has been implemented/is being implemented in 20 States and proposed to be extended to remaining willing States/UTs.
45
4.94 In the States, implementation of the Scheme has resulted in improvements in the compilation of core indicators, creation of data bases for policy planning in States and sub-States levels, and improved capacity building. The thrust of the Scheme is now on achieving tangible statistical outcomes/products, thereby improving the States Statistical Systems and taking them to the next level of development.
4.95 Some Major Activities/Highlights in 2019-20
• The Revised Operational Guidelines of under Support for Statistical Strengthening (SSS) Scheme were issued on 30th May 2019.
• Achievement Booklet of achievements made under Support for Statistical Strengthening Scheme (upto June 2019) was prepared and placed on the Ministry’s website.
• A meeting of High Level Steering Committee of the Support for Statistical Strengthening Scheme was conducted on 26th September 2019 under the chairmanship of CSI cum Secretary, MoSPI wherein State Programmes of the States of Chhatisgarh, Nagaland and Tripura under the scheme were discussed and approved.
• MoU with the State of Nagaland has been signed under Support for Statistical Strengthening (SSS) Scheme on 9th December 2019.
National Sample Surveys
4.96 NSO is responsible for conduct of large scale sample surveys in diverse fields on All India basis. Primary data is collected regularly through nation-wide household surveys on various Socio-Economic subjects, Annual Survey of Industries (ASI) under the Collection of Statistics Act and Enterprise Surveys as a follow up of the Economic Census. Besides these surveys, NSS collects data on rural and urban prices and plays a significant role in the improvement of crop statistics through supervision of area enumeration and crop estimation surveys of the state agencies. It also maintains a frame of urban area units for drawing samples for Socio-Economic Surveys in urban areas.
4.97 The conduct of National Sample Surveys, process of data and bringing out results of NSS are undertaken by the following Divisions:-
• The Survey Design and Research Division (SDRD), located at Kolkata, is responsible for technical planning of surveys, formulation of sample design, designing of enquiry schedules, formulation of concepts and definitions, drawing of tabulation plan, analysis and presentation of results and preparation of survey reports.
46
• The Field Operations Division (FOD) with its headquarters at Delhi/Faridabad and a network of 6 Zonal Offices, 53 Regional Offices and 116 Sub-Regional Offices spread throughout the country, is responsible for the collection of primary data for the surveys undertaken by MoSPI.
• The Data Quality and Assurance Division (DQAD) has its headquarters at Kolkata. It has six Data Processing Centers at Ahmedabad, Bangalore, Kolkata, Delhi, Giridih and Nagpur. It is responsible for sample selection, software development and processing & tabulation of the data collected through surveys. It also assists the States in providing IT solutions for their data processing related activities as also through periodic training/workshop and other interactive methods. Industrial Statistics (IS) Wing also works under this Division. The main function of IS Wing is finalising sample design, data validation and preparing results of the Annual Survey of Industries (ASI) which is one of source of Industrial Statistics in India. The ASI data is collected and maintained through dedicated ASI Web Portal which leads to data accuracy and time saving. The portal helps to collect ASI data in a timely, transparent and reliable manner in a secured environment without any physical movement of the schedules.
• The Survey Coordination Division (SCD) headquartered at Delhi coordinates all the activities of different Divisions. Besides, SCD is also responsible for organising National Seminars to discuss the survey results of various surveys conducted by the NSO. It also publishes the technical journal of NSO, namely ‘Sarvekshana’ which includes research papers on various socio-economic surveys of NSO.
Working Groups for recent rounds of NSS
4.98 Fourth Working Group Meeting of NSS 75th round (July 2017 - June 2018) on (i) Household Consumer Expenditure and (ii) Household Social Consumption on Health and Education was held at Hyderabad on 19th June 2019 to discuss the survey data for the subjects covered during the period.
4.99 Fifth meeting of the Working Group of NSS 76th round (July-December 2018) was held on 27th May 2019 at Kolkata to discuss the survey data of NSS 76th round.
4.100 The Working Group of NSS 77th round (January - December 2019) in its 4th meeting held on 1st August 2019 at New Delhi discussed the Tabulation Plan and Estimation Procedure for survey on (i) ‘Land and Livestock holdings of the households and situation assessment of agricultural households’ and (ii) ‘Debt and investment’.
4.101 The Working Group of NSS 78th round (January–December 2020) under the Chairmanship of Dr. G. C. Manna held five meetings on 2nd May 2019, 2nd August
47
2019, 9th September 2019, 10th October 2019 and 13th January 2020 to decide on the content and structure of the survey instruments of (i) Survey on Domestic Tourism Expenditure and (ii) Multiple Indicators Survey (MIS).
Standing Committee on Economic Statistics
4.102 Standing Committee on Economic Statistics has been constituted to deliberate upon issues relating to statistics and survey data on economic aspects in place of subject specific Committees. The committee has been constituted under chairmanship of Dr. Pronab Sen, Program Director, India Team Researcher, International Growth Centre, New Delhi on 6th December 2019. Consequently, Standing Committee on Labour Force Statistics (SCLFS), Standing Committee on Services Sector (SCSS), Standing Committee on Industrial Statistics (SCIS) and Standing Committee on Services Sector and Unincorporated Sector Enterprises (SCSSUSE) have been subsumed in the Standing Committee on Economic Statistics.
4.103 This Standing Committee comprising of professional experts is expected to bring the necessary expertise needed for planning various surveys and also for other related areas. The first meeting of SCES was held on 7th January 2020 at New Delhi to finalize results of ASI 2017-18 and formed focused Sub-Committees to oversee all the activities of Surveys like ASI, ASUSE, ASSSE, PLFS, IIP, ISP, Time Use Survey (TUS), Economic Census, etc.
Activities related to various other NSS Rounds of surveys in the Ministry
Socio-Economic Survey
4.104 NSS 74th round (July 2016 - June 2017) was devoted to ‘Survey of Services Sector’. It was a list frame based enterprise survey on the Services sector. The total number of central sample allocation in this survey from a combined frame of Ministry of Corporate Affairs (MCA), Economic Census (EC) and Business Registers (BR) was 63,659 enterprises. A technical report entitled ‘Technical Report on Services Sector Enterprises in India’ was released in April 2019.
4.105 NSS 75th round (July 2017 - June 2018) was devoted to survey on (i) Household Consumer Expenditure and (ii) Household Social Consumption on Health and Education. The key indicators and unit level data corresponding to Household Social Consumption on Health and Education have been released.
4.106 The NSS 76th round of NSS (July-December 2018) was devoted to the subjects of (i) Persons with Disabilities and (ii) Drinking Water, Sanitation, Hygiene & Housing Condition. The reports and unit level data of this round have been released.
4.107 The 77th round of NSS (January - December 2019) is devoted to the subjects of (i) ‘Land and Livestock holdings of the households and situation assessment of
48
agricultural households’ and (ii) ‘Debt and Investment’. The survey was launched on 1st January 2019. Preparation of Tabulation plan and Estimation procedure for NSS 77th round has been finalised. Data is being collected through digital mode. The data validation job of this round is in progress.
4.108 The 78th Round of NSS (January – December 2020) is devoted to the subjects of (i) Domestic Tourism Expenditure and (ii) Multiple Indicator Survey. The All India Workshop of Trainers (AIWOT) for the NSS 78th Round was held at Ahmedabad during 15th - 16th October 2019. The survey has been launched on 1st January 2020. The data of the survey on Domestic Tourism Expenditure will be used for the preparation of the Tourism Satellite Account (TSA) of the Country and States by the Ministry of Tourism. Information collected in this survey on different aspects like purpose of the trip, mode of transport and accommodation used during the trip, final destination within the country, use of various tourism specific products and services for the trip, etc. will constitute a valuable source of input for further policy research and for formulation of sector specific policies and programmes for creation and development of infrastructure, tour packages, etc. Multiple Indicators Survey (MIS) is being conducted for the first time by NSO for developing some important indicators of Sustainable Development Goals (SDG) 2030.
4.109 For the first time in NSS, a Questionnaire format will be used for collection of data in NSS 78th round in place of conventional Schedule format hitherto used in NSS. The Collection of data for the central sample will be done through CAPI method. However, provision has been made to continue with the conventional schedule format in respect of the States/ UTs which are not able to adopt CAPI for collection of data in the Questionnaire format.
Annual Survey of Unincorporated Sector Enterprises (ASUSE) (October 2019 –March 2020)
4.110 ASUSE is devoted to ‘Unincorporated Non-agricultural Establishments’. This survey has been launched on 1st October 2019, initially for six months, which is devoted exclusively to an integrated survey on economic and operational characteristics of unincorporated non-agricultural enterprise in manufacturing, trade and other services sector to supplement the corporate sector data. Based on its result and experience of initial six months survey, a full-fledged survey will be launched from April 2020.
State Assistance for Socio-Economic Surveys
4.111 States also participate in NSS surveys. DQAD provides all kind of technical guidance to the states by supplying data processing instruments (including sample list, software for data entry, validation and tabulation) and thus provide help in
49
processing the state sample data and also in pooling of central and state sample data.
4.112 A Pooling Workshop on central and state sample data of NSS 73rd round for the officials of Directorate of Economics and Statistics was organised by DQAD. In the workshops, theoretical and hands on training was imparted. Specialized need-based training for states, is also arranged by DQAD as and when requested by the State DES.
National Seminar on the results of NSS 72nd and 73rd Rounds
4.113 National Seminar, based on the results of NSS 72nd and NSS 73rd round, was held at Indian Institute of Management (IIM), Indore during 30th -31st August 2019. During the seminar, a total of 16 technical papers including divisional papers on the above rounds were presented. NSS 72nd round (July 2014 - June 2015) was dedicated to the subject on ‘Domestic Tourism Expenditure’ & ‘Household Expenditure on Services and Durable Goods’’ and NSS 73rd round (July 2015-June 2016) was devoted to the subject ‘Unincorporated Non-Agricultural Enterprises in Manufacturing, Trade and Other Services (excluding construction).
Agricultural Statistics
4.114 Field Operations Division of MoSPI is associated in Improvement of Crop Statistics Scheme (ICS) and helps State Govt in identifying deficiencies in their system of collection of area data and yield rate estimates of various crops. Under ICS, sample check on the area enumeration work done by State primary workers and sample supervision of crop cutting experiment conducted by State worker for estimating yield rate is conducted with a view to identify deficiencies in the system. The status report on ICS work is presented to State governments. Under the scheme, sample check on the primary field work relating to area enumeration in approximately 5000 villages in an agriculture season and supervision of about 16000 crop cutting experiments in each agricultural year are undertaken by the Field Operations Division (FOD). The States are also participating in this programme of sample check on equal matching basis. The data collected through the supervision of crop cutting experiments at harvest stage are also utilized to compute estimates of yield rate of specified crops under the ICS scheme.
Urban Frame Survey (UFS)
4.115 Urban Frame Survey (UFS) is regularly conducted by Field Operations Division of MoSPI for formation and updation of UFS blocks for providing frame for selection of first stage sampling units in urban sector for use in various Socio-Economic Surveys of NSO.
50
4.116 A decision was taken to undertake Urban Frame Survey (UFS) 2017-22 phase work on digital platform using Mobile and Web-portal based applications. The technology for the same has been developed by National Remote Sensing Centre (NRSC), Hyderabad. The web application includes functionality for uploading the final boundary polygons drawn on QGIS software. Field officials have been given training in use of Mobile application for capturing attribute data, use of QGIS software for finalizing the boundaries and use of web portal for editing and submitting the attribute data. The process is in the stage of evaluation and development.
Periodic Labour Force Survey (PLFS)
4.117 The nationwide Periodic Labour Force Survey (PLFS) was launched from April 2017. The objective of PLFS is primarily two fold (i) to measure the labour force indicators in the short time interval of three months for the urban areas only in the Current Weekly Status (CWS) and (ii) to generate estimates of all important labour force parameters in both usual status (ps+ss) and CWS annually for both rural and urban areas.
4.118 The data collection for PLFS in the field is being done through Computer Assisted Personnel Interviewing (CAPI) Solution. The CAPI Solutions was developed by NSO with technical assistance from World Bank for use in data collection for PLFS by using hand held IT Devices in place of paper schedules.
4.119 The Annual Report of PLFS for 2017-18 and Quarterly Bulletin for the quarter October – December 2018 were released on 31st May 2019. Quarterly Bulletin of PLFS for the quarter January – March 2019 has also been released on 23rd November 2019.
Time Use Survey
4.120 NSS is conducting Time Use Survey during the period January 2019 to December 2019 for the first time. The primary objective of Time Use Survey (TUS) is to measure participation of men, women and other groups of persons in paid and unpaid activities. The survey will be an important source of information on the time spent in unpaid care giving activities, unpaid volunteer work, unpaid domestic service producing activities of the household members. This will also provide information on time spent on learning, socializing, leisure activities, self-care activities, etc. by the household members.
Annual Survey of Industries (ASI)
4.120 The Annual Survey of Industries (ASI) is the principal source of industrial statistics in India. It provides statistical information to assess and evaluate, objectively and realistically, the changes in the growth, composition and structure of
51
the organized manufacturing sector comprising activities related to manufacturing processes, repair services, generation, transmission, etc. of electricity, gas and water supply and cold storage. The survey is statutory in nature under the Collection of Statistics Act, 2008 (as amended in 2017) and the rules framed there under.
4.121 The ASI extends to the entire country. The survey covers all factories registered under sections 2m (i) and 2m (ii) of the Factories Act, 1948. The survey also covers bidi and cigar manufacturing establishments registered under the Bidi and Cigar Workers (Conditions of Employment) Act, 1966. All the electricity undertakings engaged in the generation, transmission and distribution of electricity registered with the Central Electricity Authority (CEA) were covered under ASI up to 1997-98 irrespective of their employment size. Certain services and activities like cold storage, water supply, repair of motor vehicles other consumer durables like watches, etc. are covered under the survey. Defence establishments, oil storage and distribution depots, restaurants, hotels, café and computer services and the technical training institutes are excluded from the purview of this survey. The electricity undertakings registered with the CEA are not being covered under ASI w.e.f. 1998-99. However, captive units not registered with CEA continue to be covered under ASI.
4.122 In addition to the above, now the coverage of ASI has been extended beyond the purview of the section 2m (i) and 2m (ii) of the Factories Act, 1948 and the Bidi & Cigar Workers (Conditions of Employment) Act, 1966 as recommended by the Sub-Group on Sampling Design of ASI. For this purpose, Business Register of Enterprises (BRE) prepared by the respective states and Directory of Establishments based on Sixth Economic Census would be used by Industrial Statistics Wing (IS Wing).
4.123 To start with the implementation of the augmented frame, units with 100 or more employees not registered under Section 2m(i) and 2m(ii) of the Factories Act, 1948 but included in the BRE of the respective states would be included in ASI frame. For this, BRE of Andhra Pradesh (AP) was included in the frame of Andhra Pradesh for ASI 2014-15, BRE of Manipur, Chattisgarh, Himachal Pradesh, Punjab, Uttar Pradesh, Tamil Nadu and Rajasthan were included in the frame of respective states for ASI 2015-16, and BRE of Gujarat, Karnataka, Kerala, Rajasthan, Telangana, and Uttar Pradesh were included in the frame of respective states for ASI 2017-18 after verification of such units by FOD. This is a significant departure from past practices and it is an improvement in coverage of registered manufacturing sector.
4.124 The data collected through ASI relates to capital, employment and emoluments, consumption of fuel and lubricants, raw materials and other input/output, value added, labour turnover and other characteristics of factories/industrial establishments. Fieldwork for central sample is carried out by the Field Operations Division. The IS Wing processes the data and publishes the results.
52
State Participation in ASI
4.125 The State Directorates of Economics and Statistics (DESs) have been given necessary technical assistance and training for the purposes of participation in ASI. The participating States along with other desiring States have been provided with state sample list to take part in ASI survey work. IS Wing of DPD has provided all the survey and data processing instruments [sample list, schedule, instruction manual, data entry package (e-schedule), validation rules, validation software, pooling methodology, etc.] to the states. Central sample unit level data for respective states were also shared with the State DESs so as to enable them to generate district/micro level estimates, if necessary, by augmenting samples.
4.126 Over the last few decades, there has been a spurt in the growth of the number of registered factories and consequently in the number of units from which data are to be collected and analyzed annually. The sample sizes in ASI were kept as 70,943;73,841 and 76,977 units during ASI 2015-16; ASI 2016-17 and ASI 2017-18 respectively. In ASI 2018-19, 78,138 units comprising of 54,492 census units and 23,646 sample units have been selected for the survey. The field work of ASI 2018-19 is in progress. All the schedules from ASI 2012-13 onwards have been canvassed through ASI web-portal.
4.127 Final results of ASI 2016-17 (Volume I and Summary Results for Factory Sector) have been released in ASI web-portal within six months from the closure of the survey. Provisional results of ASI 2017-18 have been released within three months from the completion of the field work. Since ASI 2009-10, Vol-I results and Vol- II are freely available to users in electronic media and can be downloaded from Ministry’s website (www.mospi.gov.in).
Glimpses of the ASI Results
4.128 The final results of ASI 2016-17 (Volume I and Summary Results for Factory Sector) were released in March, 2019. The provisional results of ASI 2017-18 have been released in e-media in the month of September 2019. ASI 2017-18 covered the entire country. The field work for ASI 2017-18 was carried out during the period from November 2018 to June 2019 throughout the country with reference period coinciding with the fiscal year 2017-18.
4.129 Some of the highlights of provisional results of ASI 2017-18 are given below:
• During 2017-18, estimated number of factories was 2,37,684• Nearly 156 lakh persons were engaged by these factories.• All the factories together had an invested capital of worth `44,68,466 crores.• Total net value added by the factories was `12,38,129 crores.
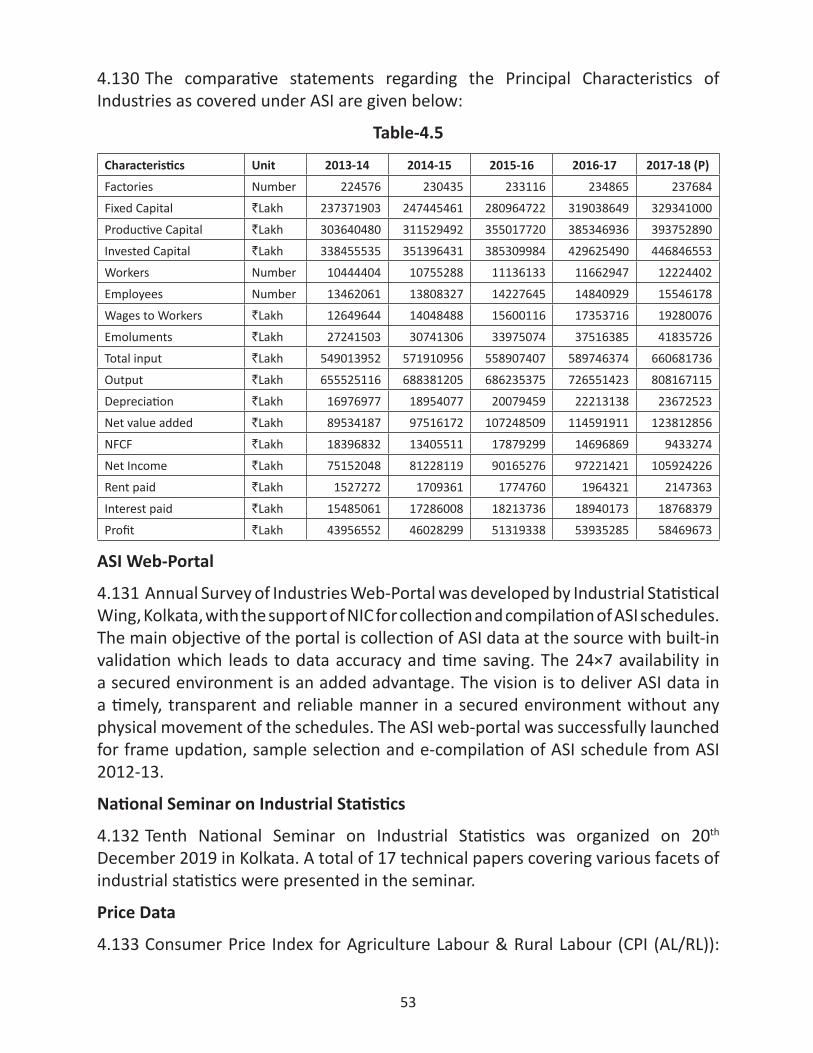
53
4.130 The comparative statements regarding the Principal Characteristics of Industries as covered under ASI are given below:
Table-4.5
Characteristics Unit 2013-14 2014-15 2015-16 2016-17 2017-18 (P)
Factories Number 224576 230435 233116 234865 237684
Fixed Capital `Lakh 237371903 247445461 280964722 319038649 329341000
Productive Capital `Lakh 303640480 311529492 355017720 385346936 393752890
Invested Capital `Lakh 338455535 351396431 385309984 429625490 446846553
Workers Number 10444404 10755288 11136133 11662947 12224402
Employees Number 13462061 13808327 14227645 14840929 15546178
Wages to Workers `Lakh 12649644 14048488 15600116 17353716 19280076
Emoluments `Lakh 27241503 30741306 33975074 37516385 41835726
Total input `Lakh 549013952 571910956 558907407 589746374 660681736
Output `Lakh 655525116 688381205 686235375 726551423 808167115
Depreciation `Lakh 16976977 18954077 20079459 22213138 23672523
Net value added `Lakh 89534187 97516172 107248509 114591911 123812856
NFCF `Lakh 18396832 13405511 17879299 14696869 9433274
Net Income `Lakh 75152048 81228119 90165276 97221421 105924226
Rent paid `Lakh 1527272 1709361 1774760 1964321 2147363
Interest paid `Lakh 15485061 17286008 18213736 18940173 18768379
Profit `Lakh 43956552 46028299 51319338 53935285 58469673
ASI Web-Portal
4.131 Annual Survey of Industries Web-Portal was developed by Industrial Statistical Wing, Kolkata, with the support of NIC for collection and compilation of ASI schedules. The main objective of the portal is collection of ASI data at the source with built-in validation which leads to data accuracy and time saving. The 24×7 availability in a secured environment is an added advantage. The vision is to deliver ASI data in a timely, transparent and reliable manner in a secured environment without any physical movement of the schedules. The ASI web-portal was successfully launched for frame updation, sample selection and e-compilation of ASI schedule from ASI 2012-13.
National Seminar on Industrial Statistics
4.132 Tenth National Seminar on Industrial Statistics was organized on 20th December 2019 in Kolkata. A total of 17 technical papers covering various facets of industrial statistics were presented in the seminar.
Price Data
4.133 Consumer Price Index for Agriculture Labour & Rural Labour (CPI (AL/RL)):
54
Field Operations Division collects regular monthly rural retail price data for the compilation of consumer price index (CPI) for Agricultural and Rural Labourers. Along with the price data, the daily wage rates of 12 major agricultural and 13 major non-agricultural occupations are also being collected in the Schedule-3.01 (R). Data on daily wage rates of important agricultural operations are reported by the State Governments on monthly basis. The Labour Bureau under Ministry of Labour and Employment compiles and publishes the index figures of CPI (AL/RL). The current base year for RPC is 1986=100. Data for RPC is collected every month from 603 villages located across 26 States/UTs.
4.134 The RPC bulletin called the ‘Prices and Wages in Rural India’ which is published by Data Quality and Assurance Division (DQAD) of NSS for each quarter, provides price data only at national level in respect of 260 commodities and wage data at national and state level for twenty five major states till finalization of new series. The RPC bulletin till the quarter April-June 2019 has been published.
4.135 The market survey work for Base Year revision of CPI (AL/RL) is currently underway to construct the new series with base year 2019-20=100. The base year price collection from 787 villages, throughout the country will continue till finalisation of new series.
4.136 Consumer Price Index (Urban): Consumer Price Indices (CPI) for Urban Areas measure the changes over time in general level of retail prices of goods and services for the purpose of consumption relevant to the entire urban population in the country that households acquire. The price collection of CPI (U) started from May 2008 by Field Operations Division (FOD) of NSS on behalf of Price Statistics Division (PSD) of Central Statistics Office (CSO). The current base year for CPI (U) is 2012=100. Price data collection is done for 1078 quotations per month from 310 towns across the country. Collection/transmission of monthly retail prices in the urban prices portal of CPI (U) is being done regularly by the FOD.
4.137 Consumer Price Index (Rural): FOD of MoSPI has been entrusted with the work of CPI (Rural) from September 2018 after the handover of task from the Department of Posts (DoP). The base year of CPI (Rural) is same as that of CPI (Urban), i.e., 2012=100. Price data collection is being carried out from the markets located in 1181 villages across the country. Collection / transmission of monthly retail prices in the rural prices portal of CPI (R) is being done regularly by the field offices of FOD.
4.138 The market survey work for Base Year revision of CPI (Urban) and CPI (Rural) is currently underway to construct the new series with base year 2019=100. The base year price collection for 1148 quotations under CPI (U) and 1209 villages
55
under CPI (R) spread throughout the country will continue monthly up to December 2019. Thereafter regular price collection will start under the new series. Also, the collection of retail prices under the existing base year 2012=100 will continue to be collected till stabilization of new series.
4.139 FOD also helps Department for Promotion of Industry and Internal Trade (DPIIT) in timely collection of monthly wholesale price data for identified units spread over the country. Data collection/transmission activities for 6765 quotations on monthly basis covering 5648 manufacturing units/factories from organized sector is being facilitated by FOD. The current base year for WPI is 2011-12=100. The Office of the Economic Adviser is responsible for compiling and releasing monthly data of WPI.
Plan Scheme
4.140 NSS is responsible for implementing one of the sub components of Ministry’s Plan Scheme ‘Capacity Development’, namely, ‘Strengthening of Survey Capabilities of NSSO’. Under this component, a total sum of `935.16 lakh as Grant-in-Aid has been released to the North Eastern States of Arunachal Pradesh, Mizoram, Manipur, Tripura and Sikkim for NSS surveys during the period April - November 2019-20.
4.141 Under ‘Strengthening of Data Processing Capabilities of NSSO’, apart from building of infrastructure, technology up-gradation and human resources development, two Plan Centres, namely, DP Centre, Bangalore and DP Centre, Ahmadabad were established during the 10th Plan. These two DP Centres have contributed significantly in achieving timeliness of data processing and release of results and their continuation during 12th five year plan enabled NSSO to achieve the target of release of its results within one year of conduct of survey.
4.142 Purchase of land/construction of accommodation for field offices: The infrastructure in the field offices of the FOD is being regularly developed and strengthened. A ready built office accommodation for RO Dibrugarh has been acquired and office has started functioning from new premises. Further, in the current FY 2019-20, the financial and administrative approval from MOSPI has been conveyed towards the proposal of purchase of land for construction of office building in RO Jalandhar & SRO Nanded.
4.143 Strengthening of Training facilities: FOD organizes regular in-service training module for its staff through its Zonal Training Centres (ZTCs) and AS Wing, Faridabad. During 2019-20, a total number of 1254 officers/officials were trained on various technical schemes like Socio-Economic Survey, ASI/ASI Web Portal, Agriculture Statistics, UFS etc, besides training on general administrative matters and Right to Information Act (as on 30th October 2019). Besides, regular training is also provided
56
to field staff on conduct of surveys before start of each round.
Summer Internship Scheme 2019-20 for Research/Post Graduate students was conducted during June-August, 2019. About 130 Interns participated in the internship on various schemes at various Regional Offices including Hqrs at New Delhi and various DESs.
4.144 Publicity: The following measures have been taken up in 2019-20 for creating a brand name for NSO and for increasing co-operation from respondents with a view to improving the quality of data:
i. Appeal seeking co-operation from people in the data collection work of 77th Round NSS has been released in the National and Regional Newspapers across the country on 18th August 2019 with a total budget of `36.00 lakh. Another general newspaper appeal giving the glimpse of NSO and its activities is planned to be released in the month of December 2019.
ii. Two video spots of 40 seconds duration each was shown on:
• Lok Sabha TV Channel during Winter Session of Parliament i.e. from 18th November 2019 to 13th December 2019 with the budget of `35.00 lakh.
• Various channels of Doordarshan viz DD National, DD News, DD Kisan and DD Regional Kendras from 23rd November 2019 to 4th January 2020 with the budget of `265.00 lakh.
• 1005 Digital Cinema Halls throughout the Country with the budget of `160.00 lakh from 6th December 2019 to 3rd February 2020.
iii. Apart from the above publicity measures/ procurement of publicity material viz wall clocks worth `45.00 lakh are under process which would be installed at prominent public places in District Hqrs. such as Bus Stands, Panchayat Office, Municipality Office, other prominent places in sample villages and blocks and will also be distributed among the individuals who provide outstanding help to the field officials in data collection.
iv. Apart from wall clocks, process is also under way for procuring jute bags worth `90.00 lakh for distributing it among the households that provide valuable data spending their valuable time.
Sarvekshana
4.145 The 107th issue of NSO journal ‘Sarvekshana’ has been published in October 2019. The journal carried three research papers on various aspects of official Statistics.
57
4.146 A rigorous process of review of papers by the Editorial Advisory Board (EAB) and approval by EAB is followed for admitting papers for publication. Various issues of ‘Sarvekshana’ are available on the website of the Ministry.
Use of Modern Technology/New Initiatives
4.147 Digitization of Socio-Economic Survey has been taken up from the 77th Round NSS which started from 1st January 2019. Data in the field is being captured using tablets through web browse module developed by ISI. While improving the quality of field data through in-built checks, it reduces the time lag in transmission of data also.
4.148 The field work of on-going UFS phase (2017-2022) is being undertaken in digitized format through mobile/web applications developed by National Remote Sensing Centre (NRSC), Hyderabad. Boundaries of blocks/wards/Investigator units/towns are being drawn on satellite imagery obtained from ‘Bhuvan’ portal using Quantum Geographic Information System (QGIS) software. Various attributes of structures are captured through the mobile application and embedded on satellite imagery. The digitized mode envisages saving of the UFS maps along with associated attributes on Bhuvan portal for ultimate use as sampling frame for conduct of Socio-Economic Surveys. The new process is in the stage of development.
4.149 At present, FOD has made transition from the system of paper-based schedule to e-schedule for data transmission of data on Sample Checks on Crop Cutting Experiments (CCEs) (Sch. AS 2.0). To start with, in-house data entry software has been developed for AS 2.0 with technical expertise available with FOD that was made available to all Regional offices/ State Governments during 2018-19. AS Hqrs. officials also imparted training to State Government officials of Uttar Pradesh, Uttarakhand, Haryana, Kerala and Maharashtra on e-schedule AS 2.0.
Computer Assisted General Survey Instruments (CAGSI) of NSS
4.150 A General Survey Solution, GSS for all NSS surveys is in the making in DQAD. It has the potential to change the sample survey ecosystem of the country. The solution which has an acronym as CAGSI (Computer Assisted General Survey Instruments) will not only have the scope of Real- time Data Validation, but also will be supported with the scope of capturing the Lat-Long along with the Time stamp and Audit trail for the entire survey period in the form of para data. The intricately designed and well-articulated CAGSI will address the essential data quality issues which are imminent for large scale sample survey data. To begin with, CAGSI will
58
cover the following.
(i) Periodic Labour Force Survey (PLFS), (ii) Annual Survey of Unincorporated Non-Agricultural Sector Enterprises
(ASUSE),(iii) Annual Surveys of Services Sector Enterprises (ASSSE),(iv) NSS 78th round, (v) Other future NSS surveys.
A developing agency (DA) / System Integrator (SI) is already on board with DQAD and they are to develop, maintain and stabilise the system in due course of time.
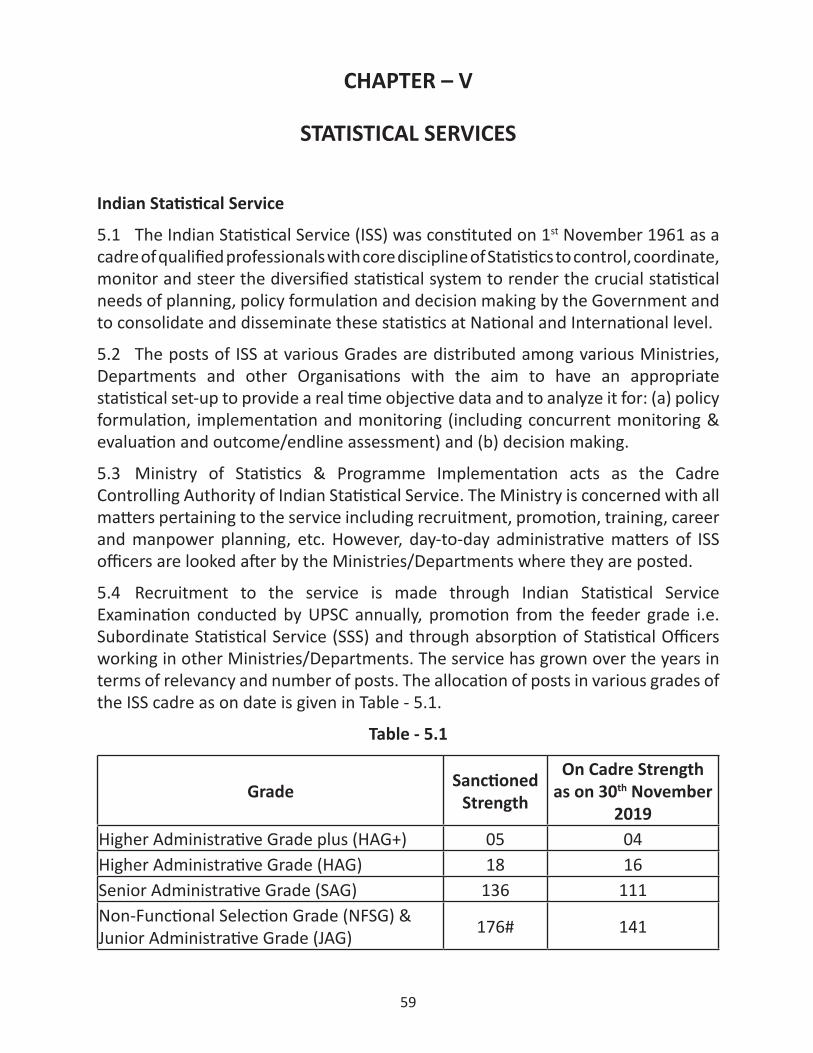
59
CHAPTER – V
STATISTICAL SERVICES
Indian Statistical Service
5.1 The Indian Statistical Service (ISS) was constituted on 1st November 1961 as a cadre of qualified professionals with core discipline of Statistics to control, coordinate, monitor and steer the diversified statistical system to render the crucial statistical needs of planning, policy formulation and decision making by the Government and to consolidate and disseminate these statistics at National and International level.
5.2 The posts of ISS at various Grades are distributed among various Ministries, Departments and other Organisations with the aim to have an appropriate statistical set-up to provide a real time objective data and to analyze it for: (a) policy formulation, implementation and monitoring (including concurrent monitoring & evaluation and outcome/endline assessment) and (b) decision making.
5.3 Ministry of Statistics & Programme Implementation acts as the Cadre Controlling Authority of Indian Statistical Service. The Ministry is concerned with all matters pertaining to the service including recruitment, promotion, training, career and manpower planning, etc. However, day-to-day administrative matters of ISS officers are looked after by the Ministries/Departments where they are posted.
5.4 Recruitment to the service is made through Indian Statistical Service Examination conducted by UPSC annually, promotion from the feeder grade i.e. Subordinate Statistical Service (SSS) and through absorption of Statistical Officers working in other Ministries/Departments. The service has grown over the years in terms of relevancy and number of posts. The allocation of posts in various grades of the ISS cadre as on date is given in Table - 5.1.
Table - 5.1
Grade Sanctioned Strength
On Cadre Strengthas on 30th November
2019Higher Administrative Grade plus (HAG+) 05 04Higher Administrative Grade (HAG) 18 16Senior Administrative Grade (SAG) 136 111Non-Functional Selection Grade (NFSG) &Junior Administrative Grade (JAG) 176# 141
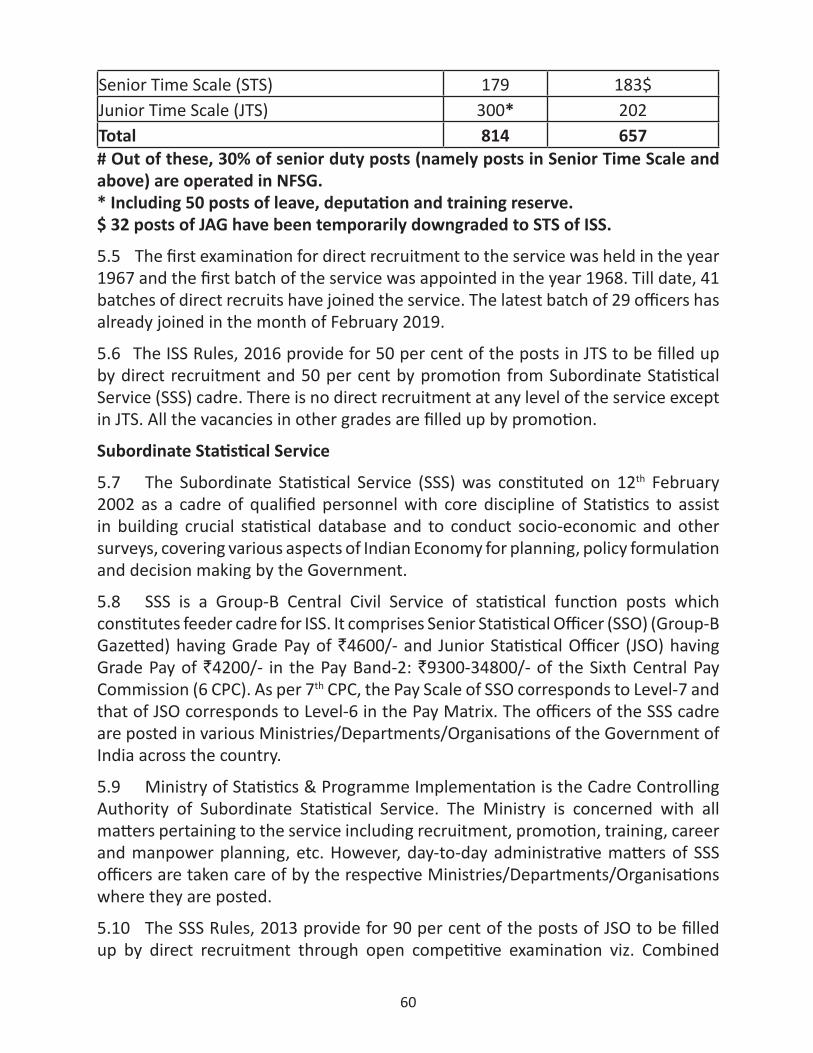
60
Senior Time Scale (STS) 179 183$Junior Time Scale (JTS) 300* 202Total 814 657# Out of these, 30% of senior duty posts (namely posts in Senior Time Scale and above) are operated in NFSG.* Including 50 posts of leave, deputation and training reserve.$ 32 posts of JAG have been temporarily downgraded to STS of ISS.
5.5 The first examination for direct recruitment to the service was held in the year 1967 and the first batch of the service was appointed in the year 1968. Till date, 41 batches of direct recruits have joined the service. The latest batch of 29 officers has already joined in the month of February 2019.
5.6 The ISS Rules, 2016 provide for 50 per cent of the posts in JTS to be filled up by direct recruitment and 50 per cent by promotion from Subordinate Statistical Service (SSS) cadre. There is no direct recruitment at any level of the service except in JTS. All the vacancies in other grades are filled up by promotion.
Subordinate Statistical Service
5.7 The Subordinate Statistical Service (SSS) was constituted on 12th February 2002 as a cadre of qualified personnel with core discipline of Statistics to assist in building crucial statistical database and to conduct socio-economic and other surveys, covering various aspects of Indian Economy for planning, policy formulation and decision making by the Government.
5.8 SSS is a Group-B Central Civil Service of statistical function posts which constitutes feeder cadre for ISS. It comprises Senior Statistical Officer (SSO) (Group-B Gazetted) having Grade Pay of `4600/- and Junior Statistical Officer (JSO) having Grade Pay of `4200/- in the Pay Band-2: `9300-34800/- of the Sixth Central Pay Commission (6 CPC). As per 7th CPC, the Pay Scale of SSO corresponds to Level-7 and that of JSO corresponds to Level-6 in the Pay Matrix. The officers of the SSS cadre are posted in various Ministries/Departments/Organisations of the Government of India across the country.
5.9 Ministry of Statistics & Programme Implementation is the Cadre Controlling Authority of Subordinate Statistical Service. The Ministry is concerned with all matters pertaining to the service including recruitment, promotion, training, career and manpower planning, etc. However, day-to-day administrative matters of SSS officers are taken care of by the respective Ministries/Departments/Organisations where they are posted.
5.10 The SSS Rules, 2013 provide for 90 per cent of the posts of JSO to be filled up by direct recruitment through open competitive examination viz. Combined
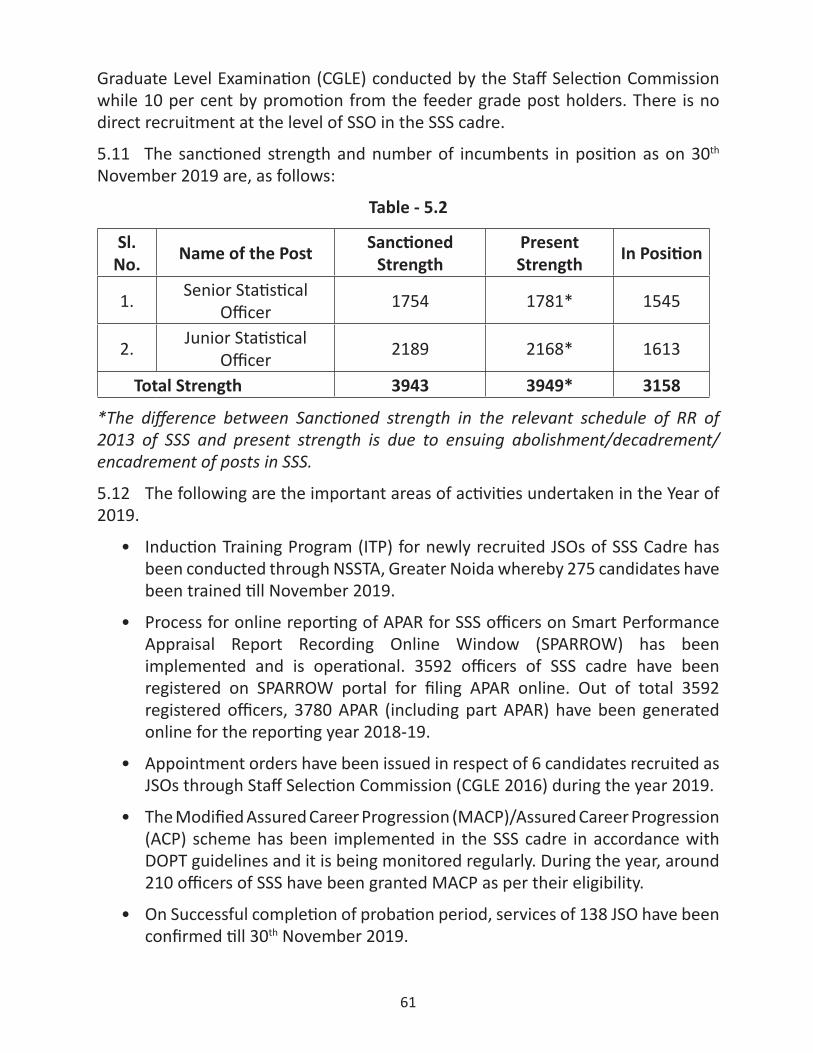
61
Graduate Level Examination (CGLE) conducted by the Staff Selection Commission while 10 per cent by promotion from the feeder grade post holders. There is no direct recruitment at the level of SSO in the SSS cadre.
5.11 The sanctioned strength and number of incumbents in position as on 30th November 2019 are, as follows:
Table - 5.2
Sl. No. Name of the Post Sanctioned
StrengthPresent Strength In Position
1. Senior Statistical Officer 1754 1781* 1545
2. Junior Statistical Officer 2189 2168* 1613
Total Strength 3943 3949* 3158
*The difference between Sanctioned strength in the relevant schedule of RR of 2013 of SSS and present strength is due to ensuing abolishment/decadrement/encadrement of posts in SSS.
5.12 The following are the important areas of activities undertaken in the Year of 2019.
• Induction Training Program (ITP) for newly recruited JSOs of SSS Cadre has been conducted through NSSTA, Greater Noida whereby 275 candidates have been trained till November 2019.
• Process for online reporting of APAR for SSS officers on Smart Performance Appraisal Report Recording Online Window (SPARROW) has been implemented and is operational. 3592 officers of SSS cadre have been registered on SPARROW portal for filing APAR online. Out of total 3592 registered officers, 3780 APAR (including part APAR) have been generated online for the reporting year 2018-19.
• Appointment orders have been issued in respect of 6 candidates recruited as JSOs through Staff Selection Commission (CGLE 2016) during the year 2019.
• The Modified Assured Career Progression (MACP)/Assured Career Progression (ACP) scheme has been implemented in the SSS cadre in accordance with DOPT guidelines and it is being monitored regularly. During the year, around 210 officers of SSS have been granted MACP as per their eligibility.
• On Successful completion of probation period, services of 138 JSO have been confirmed till 30th November 2019.
62
CHAPTER – VI
INDIAN STATISTICAL INSTITUTE
6.1 In the early thirties, realizing the necessity for advancement of theoretical and applied statistics in India, the Indian Statistical Institute came into being following the pioneering initiative and efforts of Professor P.C. Mahalanobis. The Indian Statistical Institute was registered on 28th April 1932 as a nonprofit distributing learned society under the West Bengal Societies Registration Act, XXI of 1860. From the beginning, the Institute started showing its excellence in its own way. As the Institute expanded its research, teaching, training and project activities, it started earning national/international recognitions. The outstanding contributions made by the Institute in theoretical and applied statistical work culminated in the recognition of the Institute as an “Institution of National Importance” by an Act of the Parliament, known as “Indian Statistical Institute Act No. 57 of 1959”, which conferred on the Institute the right to hold examinations and award degrees/diplomas in Statistics. Significantly, Pandit Jawaharlal Nehru, the then Prime Minister of India, himself piloted the bill in the Parliament in 1959. As a result, degree courses leading to Bachelor of Statistics (B. Stat.) and Master of Statistics (M. Stat.) and Post Graduate Diplomas in Statistical Quality Control & Operations Research (SQC & OR) and Computer Science were started from June 1960. The Institute was also empowered to award the Ph.D./ D.Sc. Degree from the same year.
6.2 Subsequently, Master of Technology (M. Tech) courses in Computer Science (CS) and in Quality, Reliability & Operations Research (QROR) were also introduced. Scope was further enlarged as the Institute was empowered to award degrees/diplomas not only in Statistics but also in Mathematics, Quantitative Economics, Computer Science and such other subjects related to Statistics by virtue of “Indian Statistical Institute (Amendment) Act, 1995, No. 38 of 1995” by the Parliament, which gave greater encouragement to research activities not only in Statistics/Mathematics but also in various branches of Computer and Communication Sciences, Natural and Social Sciences, Physics and Earth Sciences, Biological Sciences, Statistical Quality Control & Operations Research, Library and Information Sciences in a broader way. Over the years, the Institute has been playing a key role in the development of statistical theory and methods by promoting research and practical applications in different areas of natural and social sciences.
6.3 “Sankhya – The Indian Journal of Statistics”, being published by the Institute since 1933, is still considered as one of the leading statistical journals of the world. Pioneering research activities were carried out in many areas of statistical theory,
63
especially in the core areas of multivariate analysis, sample surveys and design of experiments. Such activities were strengthened and new directions were opened up by Professor C.R. Rao and many others who joined the Institute in nineteen forties and the tradition continues. Research in economics was greatly stimulated when the then Prime Minister of India, Pandit Jawaharlal Nehru entrusted the preparation of the draft Second Five-Year-Plan of the country to Professor Mahalanobis and the Institute in the year 1954. The “Draft” submitted by the Institute under the leadership of Professor Mahalanobis with the planning models have since been regarded as major contributions to economic planning in India.
6.4 In the field of Computer Science, the Institute has a rich tradition. In 1953, a small analog computer was designed and built in the Institute. In 1956, the Institute acquired a HEC-2M machine from the U.K., which was the first digital computer in India. In early sixties, the Institute, in collaboration with the Jadavpur University, undertook the design, development and fabrication of a fully transistorized digital computer, called ISIJU-1, which was commissioned in 1966 by Shri M.C. Chagla, the then Minister of Education, Government of India. High quality research, publication and development in the different branches of computer sciences had been carried out by the internationally acclaimed computer scientists of the Institute over the last six decades and their concerted efforts have placed the Institute in the forefront in national and international scenario.
6.5 The ISI also played a pioneering role in starting the Statistical Quality Control (SQC) movement in India by organizing a visit of Professor W.A. Shewhart, the father of SQC, to India in November 1947 and later by inviting other experts like Dr. W.E. Deming, Dr. Ellis R. Ott, Dr. H.C. Tippet and Genichi Taguchi for the same purpose. SQC promotional work of the Institute then gradually spread all over the industrial centres in India under a comprehensive programme covering education and training, applied research and consultancy services. The Institute also became a permanent member of “Quality Council” of India.
6.6 From the early days, the Institute has been interacting with many internationally reputed scientists in different disciplines from the world over. Some of these scientists have worked in the Institute for several months or even longer. Sir Ronald A. Fisher, a pioneer of modern statistics, was a regular visitor and lent considerable support to the Institute. Professor J.B.S. Haldane, a genecist of international repute, was a member of the faculty for several years beginning from 1956. The celebrated mathematician, Norbert Wiener visited the Institute twice in 1954 and again in 1955-56. The other academic personalities whose longer visits influenced the development of the Institute include the Statisticians like Harold Hotelling, Frank Yates, Herman Wold, Edwin Harper (Jr.) and H. Cramer; the Mathematicians
64
like A.N. Kolmogorov, Yu, V. Linnik, J.L. Doob and there after Vaughan F.R. Jones; Statistical Quality Control experts like Walter Shewhart and G. Taguchi; Economists like Simon Kuznets, Paul A. Baran, Joan Robinson, Jan Tinbergen, Nicholas Kaldor, R.M. Goodwin, David Cox, Ruth Glass and J.K. Galbraith and more recently Amartya K. Sen, Robert Aumann, Lotfi A. Zadeh, Joseph E. Stieglitz, James A. Mirrlees, Eric Stark Maskin, Ei-ichi Negishi, Ada Yonath, David Jonathan Gross; Geologist like Pamela Robinson; Biochemists like N.W. Pirie and Linguists like D. Kostic. All along the Institute has tried to live up to Ronald Fisher’s dictum that Statistics is a “Key Technology” in view of its intimate relevance to all scientific endeavours, which involve experimentation, measurement and inference from sample to aggregate.
TEACHING AND TRAINING DIVISION
6.7 During the academic session 2019-2020, a total of 15952 candidates applied for admission and were called for written selection tests for various programmes offered by the Institute, viz., B. Stat. (Hons.), B. Math. (Hons.), M. Stat., M. Math., Master of Science (M.S.) in Quantitative Economics, Master of Science (M.S.) in Quality Management Science, Master of Science (M.S.) in Library and Information Science, M. Tech. in Computer Science, M. Tech. in Cryptology and Security, M. Tech. in Quality, Reliability and Operations Research, Post Graduate Diploma in Statistical Methods and Analytics, Post Graduate Diploma in Computer Applications, Research Fellowships in Statistics, Mathematics, Quantitative Economics, Computer Science, Quality, Reliability and Operations Research, Physics and Applied Mathematics, Geology, Biological Science and Library and Information Science. Admission tests were conducted at 36 different centres. A total of 10425 candidates finally appeared for admission tests and a total of 1032 candidates qualified in the written tests and were called for interviews. Based on performance in the written tests, interview and the academic records, 348 candidates were offered admission to various courses during the academic session under review. Post Graduate Diploma in Business Analytics (PGDBA) is a two year full time diploma programme jointly offered by ISI, IIT Kharagpur and IIM Calcutta. The number of seats in PGDBA programme is 63. 6225 candidates had applied for PGDBA admission 2019-20. Out of 6225 candidates, 4086 candidates had appeared for the written test. 757 candidates were shortlisted for personal interview and total 62 students had enrolled in the programme. The annual examinations for all the regular courses during 2018-2019 academic session were held during May 2019. The 2019-20 academic session commenced from July 2019. Fifty-fourth Annual Convocation of the Institute is to be held in the first week of January 2020.
6.8 Till 22nd November 2019, 115 trainees in Mathematics, Statistics, Engineering and Technology from various Universities/Institutions received four weeks/six
65
weeks/two months/three months/four months and six months Project training in different Units of the Institute, viz., Advanced Computing and Micro Electronics Unit (ACMU), Agriculture and Ecological Research Unit (AERU), Applied Statistics Unit (ASU), Computer Vision Pattern Recognition Unit (CVPRU), Electronics & Communication Sciences Unit (ECSU), Human Genetics Unit (HGU), Machine Intelligence Unit (MIU), Psychology Research Unit (PRU), Statistics and Mathematics Unit (SMU) and SQC & OR Unit under the guidance of different faculty members of the Institute.
INTERNATIONAL STATISTICAL EDUCATION CENTRE (ISEC)
6.9 The International Statistical Education Centre (ISEC) was founded in 1950 at the initiative of Professor P.C. Mahalanobis. The Centre opened at Kolkata through an agreement between the International Statistical Institute and the Indian Statistical Institute (ISI). At present, the Centre is run by the Indian Statistical Institute under the auspices of the Government of India. The Centre functions under a joint Board of Directors. In its history of more than 60 years, Prof. P.C. Mahalanobis was the Chairman of the Board of Directors since the inception of the Centre in 1950 until his death in 1972. Subsequently, Professor C.R. Rao had been the Chairman of the Board till 2015. Currently, Prof. S.P. Mukherjee is the Chairman of the Board. The Centre aims to provide training in theoretical and applied statistics at various levels to selected participants from countries of the Middle East, the South and the South-East Asia, the Far-East and the Commonwealth countries of Africa. The primary training programme is a 10-month regular course in Statistics leading to a Statistical Training Diploma. In addition, tailor made special courses on different topics of varying duration are also organized as per requests. The commencement date of the 73rd Term of the ISEC Regular Course (2019-2020) was 1st August 2019. This year 15 trainees attended from 9 different countries, namely Afghanistan, Bhutan, Burundi, Fiji, Mongolia, Niger, Sudan, Tanzania, Uzbekistan. All the trainees are being supported by fellowships under the ITEC/SCAAP of the Government of India. They will be awarded the Statistical Training Diploma in the Convocation, tentatively scheduled on 30th May 2020. Till now, more than 1682 trainees from about 84 countries have received the Statistical Training Diploma from ISEC.
RESEARCH WORK
6.10 The research, development and consultancy activities of the Institute were grouped in the following Academic Divisions:
• Theoretical Statistics and Mathematics; Applied Statistics; Computer and Communication Sciences; Physics and Earth Sciences; Biological Sciences; Social Sciences and Statistical Quality Control & Operations Research.
66
• In addition to above Library, Documentation & Information Sciences Division and Computer & Statistical Services Centre provide services to the Institute.
• There are two national facilities centres i.e. Centre for Soft Computing Research: A National Facility and R.C. Bose Centre for Cryptology and Security. The “Centre for Soft Computing Research: A National Facility” is functioning in the Institute with its outstanding contribution and achievements in the area of soft computing and machine intelligence. R.C. Bose Centre for Cryptology and Security provides facility for teaching, training and research in Cryptology and Cyber Security to the nation.
EXTERNALLY FUNDED PROJECTS
6.11 Apart from theoretical and experimental plan research, the Institute also undertook a variety of about 179 externally funded projects from different Government and non-Government organizations organizations like Government and Non-Government both domestic & overseas.
SEMINARS, WORKSHOPS, CONFERENCES, SYMPOSIUMS ETC. ORGANISED
6.12 During the year, the Institute organized several seminars, workshops, conferences, symposiums with the participation of leading academicians/scientist from India and abroad. A few of them are highlighted below:
• Foundation Course on “Business Analytics using R (BA-07)”, Statistical Quality Control and Operations Research Unit, Bangalore, 8th-10th & 24th-26th May 2019.
• Seminar on “A Formal Approach to Intervention-based Data Analysis”, Applied Statistics Unit, Chennai and Bangalore, held at Chennai Mathematical Institute, 27th May 2019.
• 6th Summer School on “Computer Vision, Graphics and Image Processing”, Electronics and Communication Sciences Unit, Kolkata, 30th May – 12th July 2019.
• Workshop on “Summer Internship in Cryptology”, Cryptology and Security Research Unit, Kolkata, May-July 2019.
• Orientation Program on “IEEE Xplore (IEL Online) Digital Library: Delivering Research better than ever”, Library, Documentation and Information Sciences Division, Kolkata, 28th June 2019.
• Training Programme on “Survey Methodology and Data Analytics (for Probationers of Indian Statistical Service-41st Batch, NSSTA, MOS&PI, Govt. of India)”, Sampling and Official Statistics Unit, Kolkata, 24th June- 16th August 2019.
67
• Workshop on “In-Plant Training Program of Basic Statistics and Capability Analysis using Minitab”, Statistical Quality Control and Operations Research Unit, Mumbai, June-August, 2019.
• Workshop on “Data Analytics”, Statistical Quality Control and Operations Research Unit, Kolkata, in collaboration with BKC College, 9th-15th July 2019.
• 3rd Symposium on “Annual Research”, Agricultural and Ecological Research Unit, Giridih, 16th July 2019.
• Seminar on “Psychological Tool Construction and R-Software”, Psychology Research Unit, Kolkata held on IMHANS Medical College, Kozhikode, Kerala, 9th -10th August 2019.
• Workshop on “Machine Learning and Big Data Analytics: Application to Remote Sensing”, Machine Intelligence Unit, Kolkata held at Sikkim University, Gangtok, 19th -20th August 2019.
• Workshop on “Statistical methods for behavioral sciences with R-software”, Agricultural and Ecological Research Unit, Kolkata held at Assam Agricultural University, Jorhat, Assam, 19th -20th September 2019.
• Seminar on “Provable Security of Symmetric- Key Cryptographic Schemes”, Applied Statistics Unit, Kolkata, 1st October 2019.
• Workshop on “8th Delhi Macroeconomics”, Economics and Planning Unit, Delhi, 17th -18th October 2019.
• Foundation Course on “Business Analytics using R”, Statistical Quality Control and Operations Research Unit, Hyderabad, 31st October–2nd November (Phase I) & 14th -16th November 2019 (Phase II).
• International Workshop on “Advanced Machine Learning Techniques for Climate Informatics”, Center for Soft Computing Research, Kolkata, 4th-6th November 2019.
• Outreach Program on “Astro-scope for Young Stars: A space Odyssey”, Library Unit in collaboration with Physics and Applied Mathematics Unit, Kolkata, 11th November 2019.
• International Workshop on “Machine Learning and its Applications to Pattern Recognition”, Computer Vision and Pattern Recognition Unit, Kolkata, 14th-15th November 2019.
• Conference on “7th India Biodiversity Meet 2019”, Agricultural and Ecological Research Unit, Kolkata, 19th – 21st November 2019.
• Workshop on “Machine Learning and Mathematical Morphology for Spatial Data Analysis”, Systems Science and Informatics Unit, Bangalore, held at Dr. Ambedkar Institute of Technology, Bangalore, 21st-22nd November 2019.
68
• Training Programme on “Official Statistics (for the Officials of the Directorate of Economics and Statistics, Government of Assam)”, 25th -29th November 2019.
• Certification Program on “Six Sigma Green Belt (GB-53)”, Statistical Quality Control and Operations Research Unit, Bangalore will be held on 2nd-7th December 2019.
• North-East Workshop-cum-Training Program on “Statistical Data Analysis using SPSS, R and Julia”, Sampling and Official Statistics Unit, Kolkata will be held at Gauhati University, 3rd -7th December 2019.
• 4th Conference and workshop on “Statistical methods in finance” Applied Statistics Unit, Chennai will be held at Chennai Mathematical Institute on 16th-18th December 2019.
• 5th Research Workshop and Conference on “Statistical methods in finance”, Applied Statistics Unit, Bangalore will be held at Chennai Mathematical Institute on 16th -21st December 2019.
• Conference on “Economic Growth and Development”, Economics and Planning Unit, Delhi will be held on 18th -20th December 2019
PUBLICATION
6.13 The internationally renowned journal Sankhyā, an official publication of the Indian Statistical Institute, was founded by Professor P.C. Mahalanobis in 1932 and began publication under his editorship. It is devoted to original research articles in Probability, Mathematical Statistics and Applied Statistics. Reviews and discussion articles on current research activity in the above areas are also published. A rigorous peer review process is followed for all articles submitted to Sankhyā for publication. Many seminal articles in Probability, Theoretical Statistics and Applied Statistics have appeared in Sankhyā. The journal is published in two separate series – Series A and Series B. Series A with two issues per year, one in February and the other in August, covers Probability and Theoretical Statistics, while Series B with two issues per year, one in May and the other in November, covers Applied and Interdisciplinary Statistics. Beginning 2010, the Institute has been collaborating with Springer for printing and marketing the international edition of Sankhyā, in both prints and electronic editions. The editorial system is now electronic, that is, the entire process starting from submission of articles to editorial processing ending in final editorial decision for articles is now done online. The free access to the articles of every editions of Sankhyā is available through the Sankhyā website (sankhya.isical.ac.in).
69
SCIENTIFIC PAPERS AND PUBLICATION
6.14 During the year, about four hundred and forty seven scientific papers were published in different national and international journals.
SCIENTIFIC ASSIGNMENTS ABROAD
6.15 Seventy-nine scientists of the Institute visited a number of foreign countries either on invitation or under cultural exchange programme to attend international seminars and conferences. Most of them presented scientific papers and delivered lectures in those seminars and conferences. Countries visited by ISI faculty members were Australia, Bangladesh, Canada, China, Colombia, Czech Republic, Denmark, Egypt, France, Germany, Hong Kong, Indonesia, Italy, Ireland, Israel, Japan, Madagascar, Morocco, Nepal, New Zealand, Peru, Poland, Portugal, Qatar, Romania, Russia, Scotland, Singapore, South Korea, Slovakia, South Africa, Switzerland, Sweden, Spain, Sri Lanka, Taiwan, Turkey, Uruguay, UK, USA, Vietnam.
VISITING SCIENTISTS
6.16 Two hundred and twenty scientists from Brazil, Bangladesh, China, Canada, Denmark, France, Hong Kong, Iran, Japan, Malaysia, New Zealand, Poland, Scotland, Singapore, Slovakia, Spain, Sri Lanka, Switzerland, Sweden, UAE, UK, USA, Vietnam and also within India visited the Institute to attend various Workshops, Conferences, Seminars etc. and also to participate in collaborative research, teaching and other scientific activities of the Institute.
RECOGNITION TO ISI SCIENTISTS
6.17 In appreciation and recognition to the high standard of research and scientific excellence maintained by the researchers of the Institute, several faculty members received laurels in the forms of awards, fellowship from organizations of national and international importance like Institute of Electrical and Electronics Engineers (IEEE), Indian National Science Academy (INSA), National Academy of Sciences, India (NASI), etc. Several faculty members served as visiting scientist, honorary professor, visiting professor, research advisor in various universities in US and Europe; International Indian Statistical Association; Indian National Science Academy; National Council of Educational Research (NCERT) etc. Besides, many faculty members were invited by national and international Institutes/bodies to act as chairman, members, chief editor, editor, reviewer in their several committees/editorial boards etc. Among those, some of the most notable recognitions earned by the faculty members are indicated below: -
• Dr. Neena Gupta has been awarded Shanti Swarup Bhatnagar Prize in Mathematical Sciences, 2019.
70
• Dr. Kiranmoy Das has been awarded Social Choice and Welfare Prize by Indian Academy of Sciences, Bangalore for Contribution to Theoretical and Applied Statistics.
• Dr. Rituparna Sen has been awarded Young Statistical Scientist Award in Applications category from International Indian Statistical Association and selected the Member of Council, International Society for Business and Industrial Statistics.
• Dr. Abhik Ghosh has been awarded Young Scientist Platinum Jubilee Award by National Academy of Sciences, India (NASI) in the field of Earth Science, Mathematics and Physics.
• Prof. Ashish Ghosh has been awarded IEEE-GRSS Regional Leader Award by Institute of Electrical and Electronics Engineers (IEEE) and has been selected Fellow to The National Academy of Sciences, India (NASI).
• Prof. Madhura Swaminathan has been appointed Member of Council of Advisers of World Food Prize, August 2019 for work on issues of food security, agriculture and rural development for over 25 years by Ban-Ki Moon Award for Women’s Empowerment, Asia Initiatives, New York.
• Prof. Dilip Saha has been selected Council Member (2019-21) at Geological Society of India for Professional and Academic standing.
• Prof. Ashish Ghosh has been awarded the Regional Leader Award by Institute of Electrical and Electronics Engineers (IEEE) GRSS Remote Sensing Society and selected Fellow of The National Academy of Sciences, India (NASI).
• Prof. Ritabrata Munshi has been elected Fellow of Indian National Science Academy.
• Dr. Parthanil Roy has been selected Member Committee for Conferences on Stochastic Processes for the period of 2018-2021.
• Prof. Siva Athreya has been selected the Chair of Program Committee for IMS/BPS World Conference in Probability 2020.
• Prof. Pabitra Banik has been appointed as Research Advisor of Nan Yang Academy of Science, Singapore.
• Prof. Kumar Sankar Ray has been appointed as Research Advisor of Nan Yang Academy of Science, Singapore.
• Prof. Nikhil R. Pal has been selected President (2018-2019) of Institute of Electrical and Electronics Engineers (IEEE) Computational Intelligence Society
71
and has been selected Associate Editor of IEEE Transactions on Cybernetics, IEEE.
• Prof. Sushmita Mitra has been selected Institute of Electrical and Electronics Engineers (IEEE) CIS Distinguished Lecturer.
• Dr. Debdulal Dutta Roy has been selected as Resource Person in evaluation of Psychological Test by National Council of Educational Research (NCERT), New Delhi.
• Dr. Niladri Sekhar Dash has been appointed Project Proposal Reviewer of National Science Foundation, USA for Language Digitization and Documentation and also selected Visiting Research Fellow of Centre for Literacy and Multilingualism (CeLM), University of Reading, UK for Bilingual Aphasic Language Data Analysis.
• Dr. Ashis Kr. Chakraborty has been invited as Guest Editor for the OPSEARCH, December 2019.
72
CHAPTER – VII
INFRASTRUCTURE AND PROJECT MONITORING
7.1 The Infrastructure & Project Monitoring Division (IPMD) monitors the implementation status of Central Sector Infrastructure Projects costing more than `150 crore and above taken up by the respective Ministries/ Departments and their Central Public Sector Enterprises (CPSEs) in 16 infrastructure sectors. Successful Implementation of various projects and schemes constitutes the most significant conditions for development. Effective coordination judiciously matched with regular monitoring becomes an important element in ensuring their successful completion with improved efficiency at a greater speed and at a lesser cost.
Objectives of Project Monitoring
• To enhance effectiveness of project implementation;• To facilitate information flow for effective decision making;• To resolve outstanding implementation issues;• To bring about system improvement; and• To promote best management practices.
System of Monitoring:
7.2 The IPMD monitors the implementation of the Central Sector Projects above `150 crore through the mechanism of Online Computerized Monitoring System (OCMS).
• OCMS is an Oracle based Government-to-Government (G2G) application software with front end D2K;
• It provides linkages to Cabinet Secretariat, PMO, NITI Aayog and all Administrative Ministries to view the projects reports and query results;
• It enables the various project executing agencies to enter and view project progress data through a web-based interface on a periodic basis;
• The data submission process undergoes three-level authentication and authorization;
• Any number of milestones can be created and maintained in OCMS;• Project agencies can select the reasons of delays from certain pre-structured
reasons or/additionally project agencies can write the new reasons of delay or their experience;
73
• The data submitted for a period is then analysed and published thereby providing a detailed overview of the latest status of the all ongoing Central Sector Infrastructure Projects;
• Any type of file (picture, map, excel sheets, pdf, PERT/CPM charts, etc.) can be uploaded on OCMS;
• It also provides the monitoring of MoU targets/parameters;• It also provides a communication channel between Administrative Ministry
and the Project Implementing Agencies; • Most of the Ministries like Power, Coal, Telecom, Petroleum, etc. have
adopted the OCMS; • The physical performances are measured in terms of milestones;• The constant persuasion of the IPMD has resulted in improved reporting and
now majority of the Public Sector Enterprises are reporting on-line. However, data pertaining to milestones and the reasons for time and cost overruns are still not being reported to the fullest extent.
7.3 The IPMD has been making improvements in the OCMS as per the feedback received from the PSUs and also ironing out their difficulties through OCMS training and clarifications during interactions. The focus is now more on persuading the PSUs to forward the information online.
7.4 Facilitator in better implementation of Projects
One of the important contributions of the IPMD has been bringing in systemic improvements from time to time to facilitate better implementation of projects.
The IPMD has been instrumental/facilitator in flagging/bringing out the projects lagging behind the schedule or facing cost overruns in the periodical review meetings of the projects by the concerned Administrative Ministries. This enables the Administrative Ministries in identifying the constraints for each project and take corrective measures for removal of such bottlenecks.
7.5 PROJECT IMPLEMENTATION STATUS DURING 2019-20
As on 1st October 2019, 1635 projects with an anticipated cost of ̀ 23,41,784.84 crore were on the monitor of the Ministry. For the purpose of monitoring, the projects have been grouped into two categories, viz (I) Mega projects, each costing `1000 crore and above and (II) Major projects, costing ̀ 150 crore and above but less than `1,000 crore. The sectoral break up of on-going 1635 Central Sector Projects are shown in the adjacent pi-chart:-
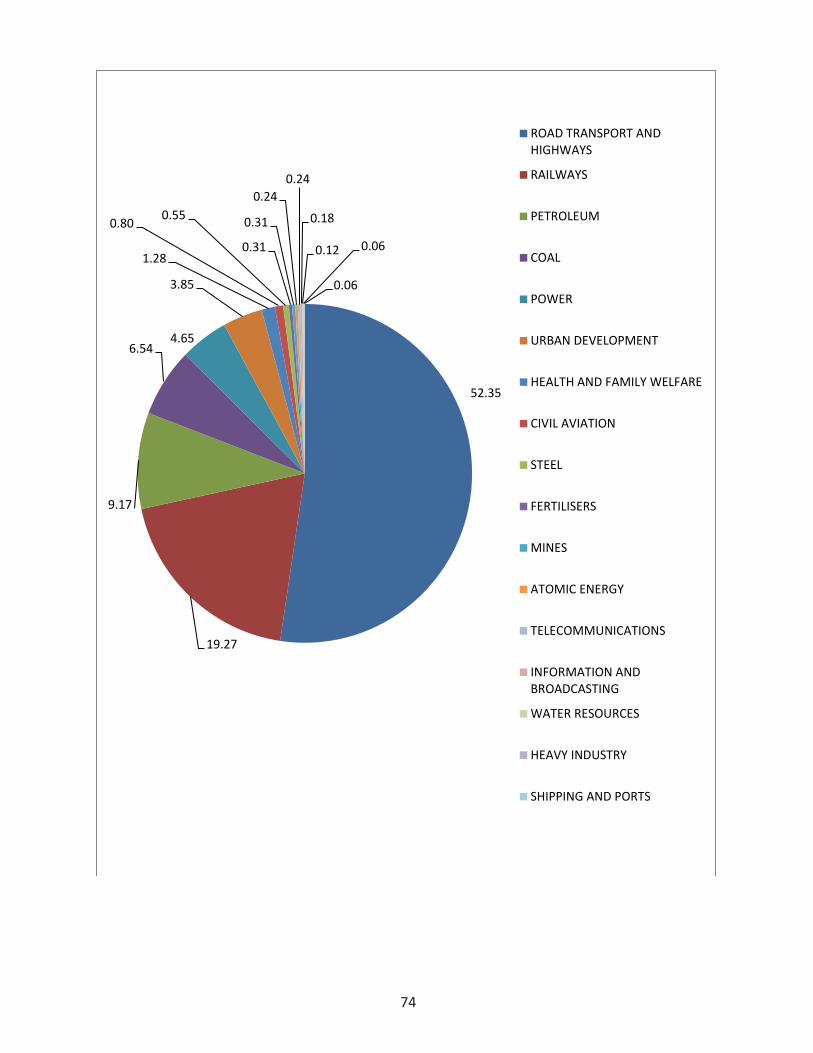
74
52.35
19.27
9.17
6.544.65
3.85
1.28
0.80 0.55
0.31
0.31
0.240.24
0.18
0.12 0.06
0.06
ROAD TRANSPORT ANDHIGHWAYS
RAILWAYS
PETROLEUM
COAL
POWER
URBAN DEVELOPMENT
HEALTH AND FAMILY WELFARE
CIVIL AVIATION
STEEL
FERTILISERS
MINES
ATOMIC ENERGY
TELECOMMUNICATIONS
INFORMATION ANDBROADCASTING
WATER RESOURCES
HEAVY INDUSTRY
SHIPPING AND PORTS
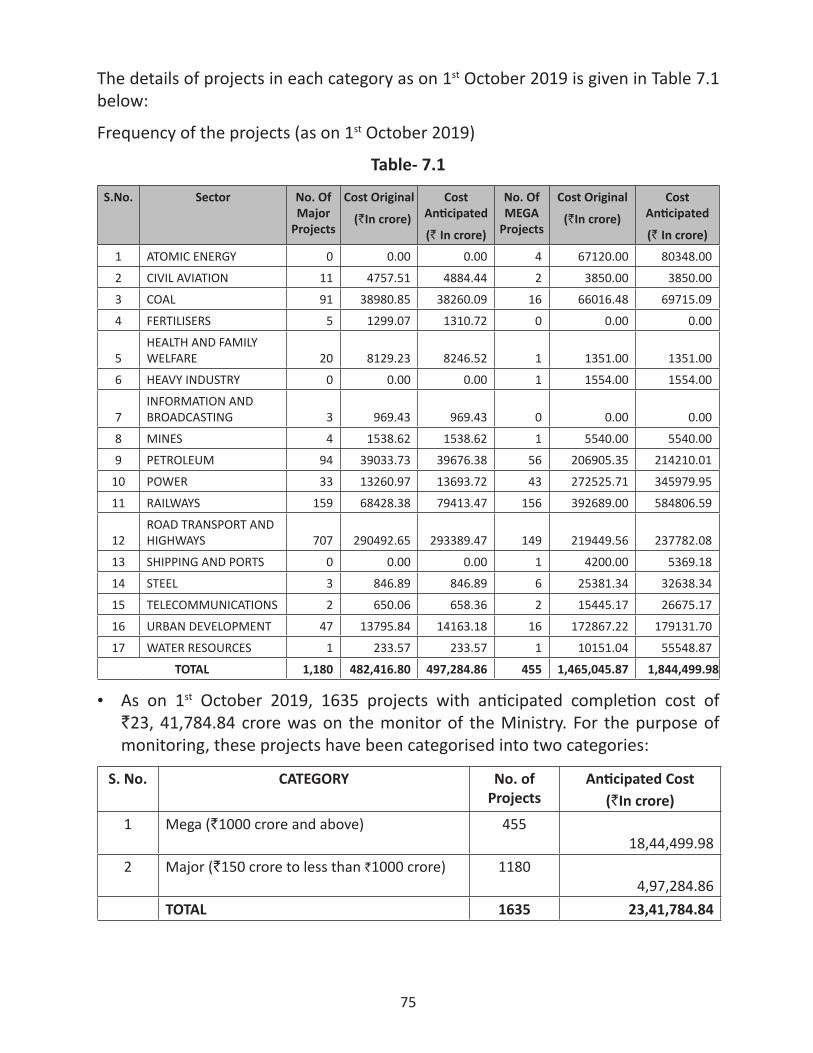
75
The details of projects in each category as on 1st October 2019 is given in Table 7.1 below:
Frequency of the projects (as on 1st October 2019)
Table- 7.1
S.No. Sector No. Of Major
Projects
Cost Original
(`In crore)
Cost Anticipated
(`In crore)
No. Of MEGA
Projects
Cost Original
(`In crore)
Cost Anticipated
(`In crore)
1 ATOMIC ENERGY 0 0.00 0.00 4 67120.00 80348.00
2 CIVIL AVIATION 11 4757.51 4884.44 2 3850.00 3850.00
3 COAL 91 38980.85 38260.09 16 66016.48 69715.09
4 FERTILISERS 5 1299.07 1310.72 0 0.00 0.00
5HEALTH AND FAMILY WELFARE 20 8129.23 8246.52 1 1351.00 1351.00
6 HEAVY INDUSTRY 0 0.00 0.00 1 1554.00 1554.00
7INFORMATION AND BROADCASTING 3 969.43 969.43 0 0.00 0.00
8 MINES 4 1538.62 1538.62 1 5540.00 5540.00
9 PETROLEUM 94 39033.73 39676.38 56 206905.35 214210.01
10 POWER 33 13260.97 13693.72 43 272525.71 345979.95
11 RAILWAYS 159 68428.38 79413.47 156 392689.00 584806.59
12ROAD TRANSPORT AND HIGHWAYS 707 290492.65 293389.47 149 219449.56 237782.08
13 SHIPPING AND PORTS 0 0.00 0.00 1 4200.00 5369.18
14 STEEL 3 846.89 846.89 6 25381.34 32638.34
15 TELECOMMUNICATIONS 2 650.06 658.36 2 15445.17 26675.17
16 URBAN DEVELOPMENT 47 13795.84 14163.18 16 172867.22 179131.70
17 WATER RESOURCES 1 233.57 233.57 1 10151.04 55548.87
TOTAL 1,180 482,416.80 497,284.86 455 1,465,045.87 1,844,499.98
• As on 1st October 2019, 1635 projects with anticipated completion cost of `23, 41,784.84 crore was on the monitor of the Ministry. For the purpose of monitoring, these projects have been categorised into two categories:
S. No. CATEGORY No. of Projects
Anticipated Cost(`In crore)
1 Mega (`1000 crore and above) 45518,44,499.98
2 Major (`150 crore to less than `1000 crore) 11804,97,284.86
TOTAL 1635 23,41,784.84
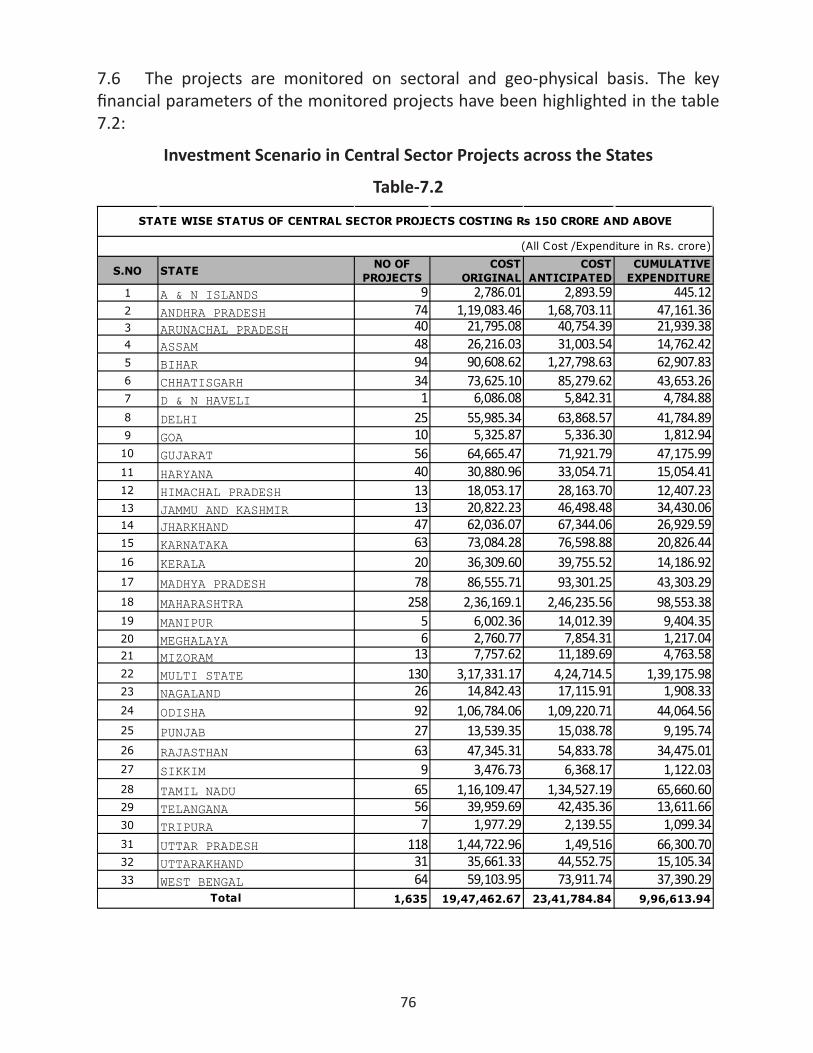
76
7.6 The projects are monitored on sectoral and geo-physical basis. The key financial parameters of the monitored projects have been highlighted in the table 7.2:
Investment Scenario in Central Sector Projects across the States
Table-7.2
S.NO STATE NO OF PROJECTS
COST ORIGINAL
COST ANTICIPATED
CUMULATIVE EXPENDITURE
1 A & N ISLANDS 9 2,786.01 2,893.59 445.122 ANDHRA PRADESH 74 1,19,083.46 1,68,703.11 47,161.363 ARUNACHAL PRADESH 40 21,795.08 40,754.39 21,939.384 ASSAM 48 26,216.03 31,003.54 14,762.425 BIHAR 94 90,608.62 1,27,798.63 62,907.836 CHHATISGARH 34 73,625.10 85,279.62 43,653.267 D & N HAVELI 1 6,086.08 5,842.31 4,784.888 DELHI 25 55,985.34 63,868.57 41,784.899 GOA 10 5,325.87 5,336.30 1,812.94
10 GUJARAT 56 64,665.47 71,921.79 47,175.9911 HARYANA 40 30,880.96 33,054.71 15,054.4112 HIMACHAL PRADESH 13 18,053.17 28,163.70 12,407.2313 JAMMU AND KASHMIR 13 20,822.23 46,498.48 34,430.0614 JHARKHAND 47 62,036.07 67,344.06 26,929.5915 KARNATAKA 63 73,084.28 76,598.88 20,826.4416 KERALA 20 36,309.60 39,755.52 14,186.9217 MADHYA PRADESH 78 86,555.71 93,301.25 43,303.2918 MAHARASHTRA 258 2,36,169.1 2,46,235.56 98,553.3819 MANIPUR 5 6,002.36 14,012.39 9,404.3520 MEGHALAYA 6 2,760.77 7,854.31 1,217.0421 MIZORAM 13 7,757.62 11,189.69 4,763.5822 MULTI STATE 130 3,17,331.17 4,24,714.5 1,39,175.9823 NAGALAND 26 14,842.43 17,115.91 1,908.3324 ODISHA 92 1,06,784.06 1,09,220.71 44,064.5625 PUNJAB 27 13,539.35 15,038.78 9,195.7426 RAJASTHAN 63 47,345.31 54,833.78 34,475.0127 SIKKIM 9 3,476.73 6,368.17 1,122.0328 TAMIL NADU 65 1,16,109.47 1,34,527.19 65,660.6029 TELANGANA 56 39,959.69 42,435.36 13,611.6630 TRIPURA 7 1,977.29 2,139.55 1,099.3431 UTTAR PRADESH 118 1,44,722.96 1,49,516 66,300.7032 UTTARAKHAND 31 35,661.33 44,552.75 15,105.3433 WEST BENGAL 64 59,103.95 73,911.74 37,390.29
1,635 19,47,462.67 23,41,784.84 9,96,613.94Total
STATE WISE STATUS OF CENTRAL SECTOR PROJECTS COSTING Rs 150 CRORE AND ABOVE
(All Cost /Expenditure in Rs. crore)

77
7.6 The projects are monitored on sectoral and geo-physical basis. The key financial parameters of the monitored projects have been highlighted in the table 7.2:
Investment Scenario in Central Sector Projects across the States
Table-7.2
S.NO STATE NO OF PROJECTS
COST ORIGINAL
COST ANTICIPATED
CUMULATIVE EXPENDITURE
1 A & N ISLANDS 9 2,786.01 2,893.59 445.122 ANDHRA PRADESH 74 1,19,083.46 1,68,703.11 47,161.363 ARUNACHAL PRADESH 40 21,795.08 40,754.39 21,939.384 ASSAM 48 26,216.03 31,003.54 14,762.425 BIHAR 94 90,608.62 1,27,798.63 62,907.836 CHHATISGARH 34 73,625.10 85,279.62 43,653.267 D & N HAVELI 1 6,086.08 5,842.31 4,784.888 DELHI 25 55,985.34 63,868.57 41,784.899 GOA 10 5,325.87 5,336.30 1,812.94
10 GUJARAT 56 64,665.47 71,921.79 47,175.9911 HARYANA 40 30,880.96 33,054.71 15,054.4112 HIMACHAL PRADESH 13 18,053.17 28,163.70 12,407.2313 JAMMU AND KASHMIR 13 20,822.23 46,498.48 34,430.0614 JHARKHAND 47 62,036.07 67,344.06 26,929.5915 KARNATAKA 63 73,084.28 76,598.88 20,826.4416 KERALA 20 36,309.60 39,755.52 14,186.9217 MADHYA PRADESH 78 86,555.71 93,301.25 43,303.2918 MAHARASHTRA 258 2,36,169.1 2,46,235.56 98,553.3819 MANIPUR 5 6,002.36 14,012.39 9,404.3520 MEGHALAYA 6 2,760.77 7,854.31 1,217.0421 MIZORAM 13 7,757.62 11,189.69 4,763.5822 MULTI STATE 130 3,17,331.17 4,24,714.5 1,39,175.9823 NAGALAND 26 14,842.43 17,115.91 1,908.3324 ODISHA 92 1,06,784.06 1,09,220.71 44,064.5625 PUNJAB 27 13,539.35 15,038.78 9,195.7426 RAJASTHAN 63 47,345.31 54,833.78 34,475.0127 SIKKIM 9 3,476.73 6,368.17 1,122.0328 TAMIL NADU 65 1,16,109.47 1,34,527.19 65,660.6029 TELANGANA 56 39,959.69 42,435.36 13,611.6630 TRIPURA 7 1,977.29 2,139.55 1,099.3431 UTTAR PRADESH 118 1,44,722.96 1,49,516 66,300.7032 UTTARAKHAND 31 35,661.33 44,552.75 15,105.3433 WEST BENGAL 64 59,103.95 73,911.74 37,390.29
1,635 19,47,462.67 23,41,784.84 9,96,613.94Total
STATE WISE STATUS OF CENTRAL SECTOR PROJECTS COSTING Rs 150 CRORE AND ABOVE
(All Cost /Expenditure in Rs. crore)
Project completed during 2019-20
7.7 There were 153 projects reported completion during the year 2019-20 (up to 1st October 2019). List of completed projects is given at Annexure-V.
7.8 Sector-wise analysis of the time overrun of projects under implementation on OCMS (excluding completed projects) is indicated in Table-7.3
Table-7.3
Extent of time overrun in projects with respect to original schedule `150 Crore and above (All Cost/ Expenditure in `crore)
Projects with time overruns$
S. No.
Sector No. ofProjects
OriginalCost
AnticipatedCost
Costoverrun
(%)
No. Original Cost
AnticipatedCost
Range of T.O.R
(in months)
1 ATOMIC ENERGY 4 67,120.00 80,348.00 19.71 4 67,120.00 80,348.00 36 - 133
2 CIVIL AVIATION 13 8,607.51 8,734.44 1.47 5 3,573.83 3,700.62 6 - 21
3 COAL 107 1,04,997.33 1,07,975.18 2.84 37 18,538.74 20,501.47 12 - 144
4 FERTILISERS 5 1,299.07 1,310.72 0.90 1 197.79 209.44 34 - 34
5 INFORMATION AND BROADCASTING
3 969.43 969.43 0.00 1 204.32 204.32 9 - 9
6 MINES 5 7,078.62 7,078.62 0.00 0 0.00 0.00 -
7 STEEL 9 26,228.23 33,485.23 27.67 8 25,964.87 33,221.87 12 - 62
8 PETROLEUM 150 2,45,939.08 2,53,886.39 3.23 52 1,13,827.55 1,18,174.58 1 - 110
9 POWER 76 2,85,786.68 3,59,673.67 25.85 49 1,75,240.00 2,34,057.76 5 - 147
10 HEAVY INDUSTRY 1 1,554.00 1,554.00 0.00 0 0.00 0.00 -
11 HEALTH AND FAMILY WELFARE
21 9,480.23 9,597.52 1.24 10 4,400.02 4,499.80 2 - 83
12 RAILWAYS 315 4,61,117.38 6,64,220.06 44.05 146 1,80,706.42 2,65,634.96 1 - 324
13 ROAD TRANSPORT AND HIGHWAYS
856 5,09,942.21 5,31,171.55 4.16 225 1,39,959.97 1,47,056.07 1 - 149
14 SHIPPING AND PORTS 1 4,200.00 5,369.18 27.84 0 0.00 0.00 -
15 TELECOMMUNICATIONS 4 16,095.23 27,333.53 69.82 2 13,565.80 24,904.10 14 - 58
16 URBAN DEVELOPMENT 63 1,86,663.06 1,93,294.88 3.55 24 92,109.92 93,661.70 2 - 89
17 WATER RESOURCES 2 10,384.61 55,782.44 437.16 1 10,151.04 55,548.87 15 - 15
Total 1635 19,47,462.67 23,41,784.84 20.25 565 8,45,560.27 10,81,723.56
7.9 Reasons for Time Overrun
(1) Issues with Union Ministries
(i) Environment, Forest and Wildlife Clearances;(ii) Eco Sensitive Zone Clearance;(iii) Tree Cutting Permission;
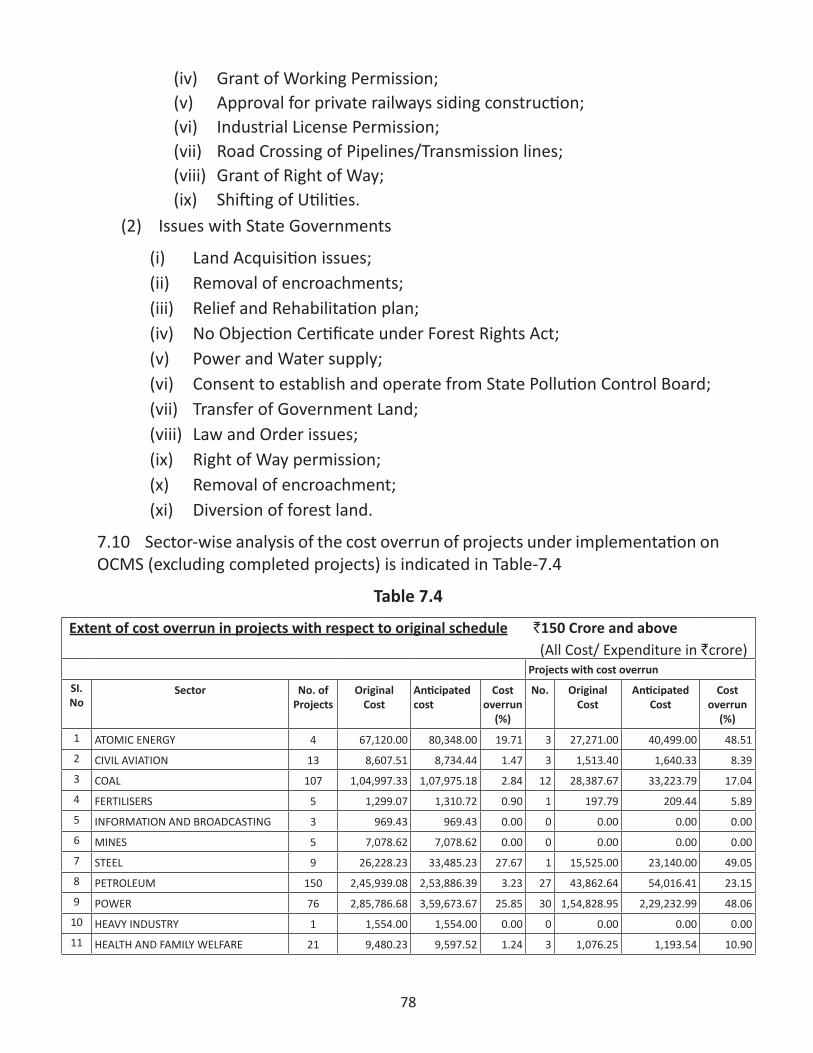
78
(iv) Grant of Working Permission;(v) Approval for private railways siding construction;(vi) Industrial License Permission;(vii) Road Crossing of Pipelines/Transmission lines;(viii) Grant of Right of Way;(ix) Shifting of Utilities.
(2) Issues with State Governments
(i) Land Acquisition issues;(ii) Removal of encroachments;(iii) Relief and Rehabilitation plan;(iv) No Objection Certificate under Forest Rights Act;(v) Power and Water supply;(vi) Consent to establish and operate from State Pollution Control Board;(vii) Transfer of Government Land;(viii) Law and Order issues;(ix) Right of Way permission;(x) Removal of encroachment;(xi) Diversion of forest land.
7.10 Sector-wise analysis of the cost overrun of projects under implementation on OCMS (excluding completed projects) is indicated in Table-7.4
Table 7.4
Extent of cost overrun in projects with respect to original schedule `150 Crore and above (All Cost/ Expenditure in `crore)
Projects with cost overrunSI. No
Sector No. ofProjects
OriginalCost
Anticipated cost
Costoverrun
(%)
No. Original Cost
AnticipatedCost
Cost overrun
(%)
1 ATOMIC ENERGY 4 67,120.00 80,348.00 19.71 3 27,271.00 40,499.00 48.512 CIVIL AVIATION 13 8,607.51 8,734.44 1.47 3 1,513.40 1,640.33 8.393 COAL 107 1,04,997.33 1,07,975.18 2.84 12 28,387.67 33,223.79 17.044 FERTILISERS 5 1,299.07 1,310.72 0.90 1 197.79 209.44 5.895 INFORMATION AND BROADCASTING 3 969.43 969.43 0.00 0 0.00 0.00 0.006 MINES 5 7,078.62 7,078.62 0.00 0 0.00 0.00 0.007 STEEL 9 26,228.23 33,485.23 27.67 1 15,525.00 23,140.00 49.058 PETROLEUM 150 2,45,939.08 2,53,886.39 3.23 27 43,862.64 54,016.41 23.159 POWER 76 2,85,786.68 3,59,673.67 25.85 30 1,54,828.95 2,29,232.99 48.06
10 HEAVY INDUSTRY 1 1,554.00 1,554.00 0.00 0 0.00 0.00 0.0011 HEALTH AND FAMILY WELFARE 21 9,480.23 9,597.52 1.24 3 1,076.25 1,193.54 10.90
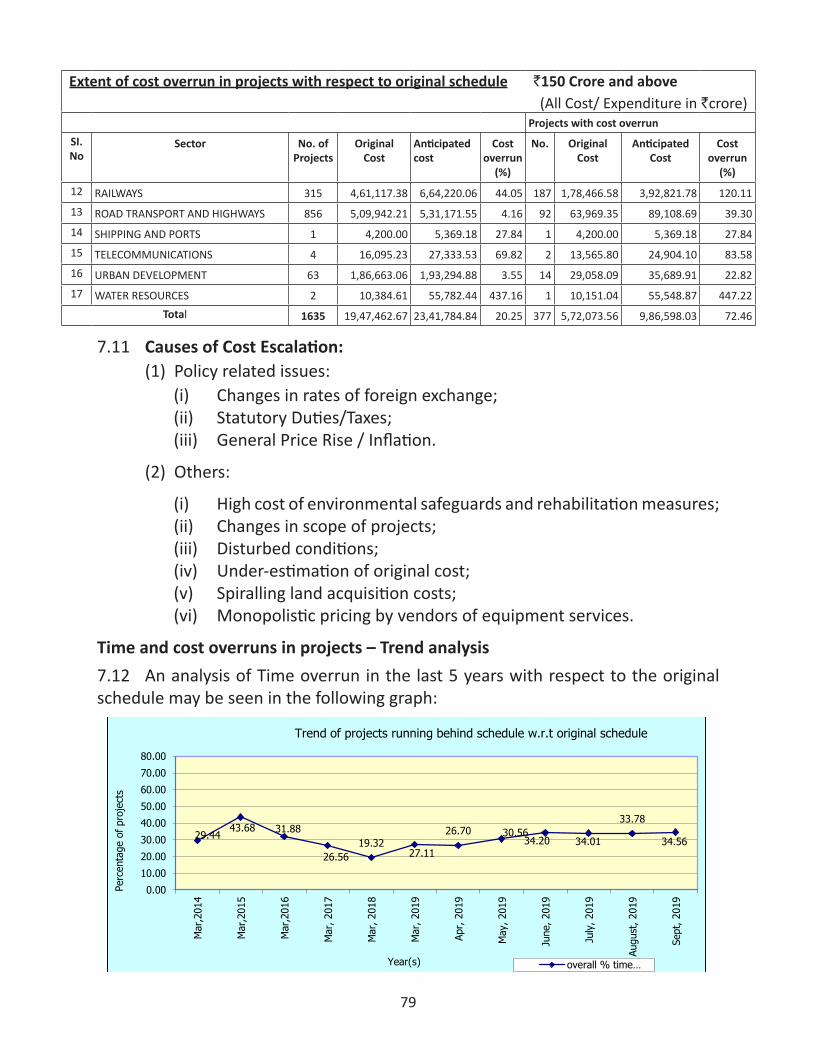
79
Extent of cost overrun in projects with respect to original schedule `150 Crore and above (All Cost/ Expenditure in `crore)
Projects with cost overrunSI. No
Sector No. ofProjects
OriginalCost
Anticipated cost
Costoverrun
(%)
No. Original Cost
AnticipatedCost
Cost overrun
(%)
12 RAILWAYS 315 4,61,117.38 6,64,220.06 44.05 187 1,78,466.58 3,92,821.78 120.1113 ROAD TRANSPORT AND HIGHWAYS 856 5,09,942.21 5,31,171.55 4.16 92 63,969.35 89,108.69 39.3014 SHIPPING AND PORTS 1 4,200.00 5,369.18 27.84 1 4,200.00 5,369.18 27.8415 TELECOMMUNICATIONS 4 16,095.23 27,333.53 69.82 2 13,565.80 24,904.10 83.5816 URBAN DEVELOPMENT 63 1,86,663.06 1,93,294.88 3.55 14 29,058.09 35,689.91 22.8217 WATER RESOURCES 2 10,384.61 55,782.44 437.16 1 10,151.04 55,548.87 447.22
Total 1635 19,47,462.67 23,41,784.84 20.25 377 5,72,073.56 9,86,598.03 72.46
7.11 Causes of Cost Escalation:(1) Policy related issues:
(i) Changes in rates of foreign exchange;(ii) Statutory Duties/Taxes;(iii) General Price Rise / Inflation.
(2) Others:
(i) High cost of environmental safeguards and rehabilitation measures;(ii) Changes in scope of projects;(iii) Disturbed conditions;(iv) Under-estimation of original cost;(v) Spiralling land acquisition costs;(vi) Monopolistic pricing by vendors of equipment services.
Time and cost overruns in projects – Trend analysis7.12 An analysis of Time overrun in the last 5 years with respect to the original schedule may be seen in the following graph:
29.4443.68 31.88
26.5619.32
27.11
26.70 30.5634.20 34.01
33.78
34.56
0.00
10.00
20.00
30.00
40.00
50.00
60.00
70.00
80.00
Mar
,201
4
Mar
,201
5
Mar
,201
6
Mar
, 201
7
Mar
, 201
8
Mar
, 201
9
Apr,
201
9
May
, 201
9
June
, 201
9
July
, 201
9
Augu
st, 2
019
Sept
, 201
9
Perc
enta
ge o
f pr
ojec
ts
Year(s)
Trend of projects running behind schedule w.r.t original schedule
overall % time…
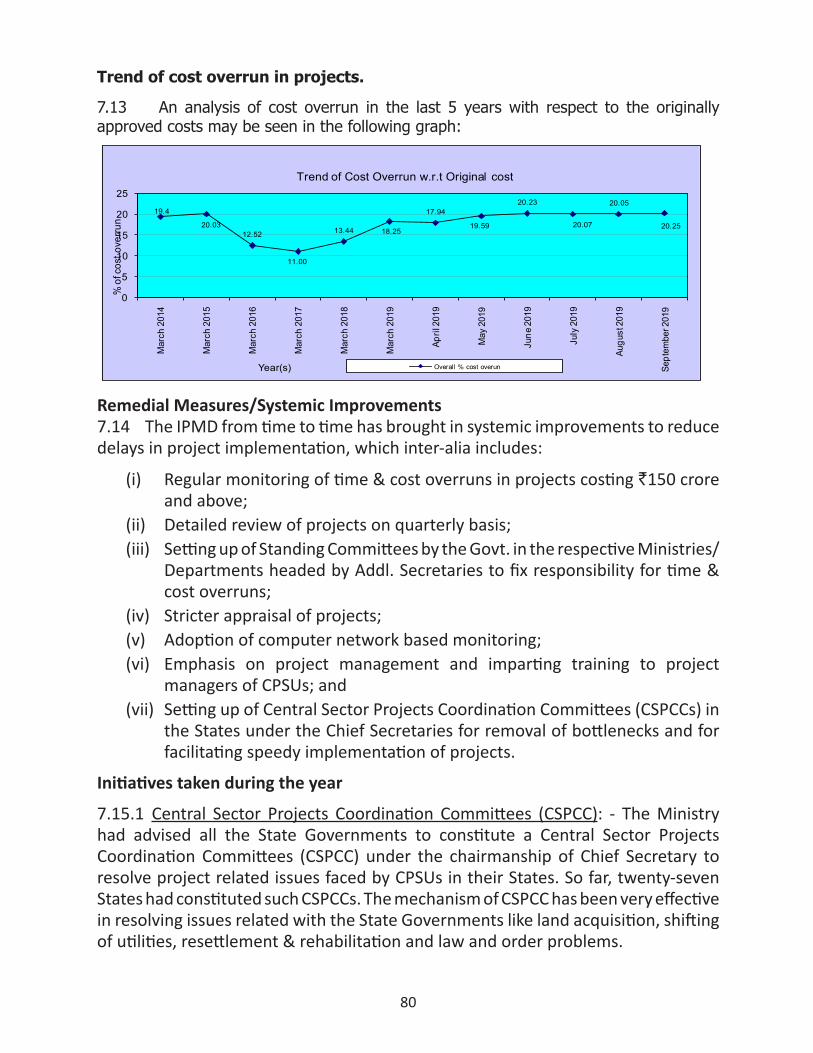
80
Trend of cost overrun in projects.
7.13 An analysis of cost overrun in the last 5 years with respect to the originally approved costs may be seen in the following graph:
19.4
20.0312.52
11.00
13.44 18.25
17.94
19.59
20.23
20.07
20.05
20.25
0
5
10
15
20
25
Mar
ch 2
014
Mar
ch 2
015
Mar
ch 2
016
Mar
ch 2
017
Mar
ch 2
018
Mar
ch 2
019
April
201
9
May
201
9
June
201
9
July
201
9
Augu
st 2
019
Sept
embe
r 201
9
% o
f cos
t ove
rrun
Year(s)
Trend of Cost Overrun w.r.t Original cost
Overall % cost overun
Remedial Measures/Systemic Improvements7.14 The IPMD from time to time has brought in systemic improvements to reduce delays in project implementation, which inter-alia includes:
(i) Regular monitoring of time & cost overruns in projects costing `150 crore and above;
(ii) Detailed review of projects on quarterly basis;(iii) Setting up of Standing Committees by the Govt. in the respective Ministries/
Departments headed by Addl. Secretaries to fix responsibility for time & cost overruns;
(iv) Stricter appraisal of projects;(v) Adoption of computer network based monitoring;(vi) Emphasis on project management and imparting training to project
managers of CPSUs; and(vii) Setting up of Central Sector Projects Coordination Committees (CSPCCs) in
the States under the Chief Secretaries for removal of bottlenecks and for facilitating speedy implementation of projects.
Initiatives taken during the year
7.15.1 Central Sector Projects Coordination Committees (CSPCC): - The Ministry had advised all the State Governments to constitute a Central Sector Projects Coordination Committees (CSPCC) under the chairmanship of Chief Secretary to resolve project related issues faced by CPSUs in their States. So far, twenty-seven States had constituted such CSPCCs. The mechanism of CSPCC has been very effective in resolving issues related with the State Governments like land acquisition, shifting of utilities, resettlement & rehabilitation and law and order problems.
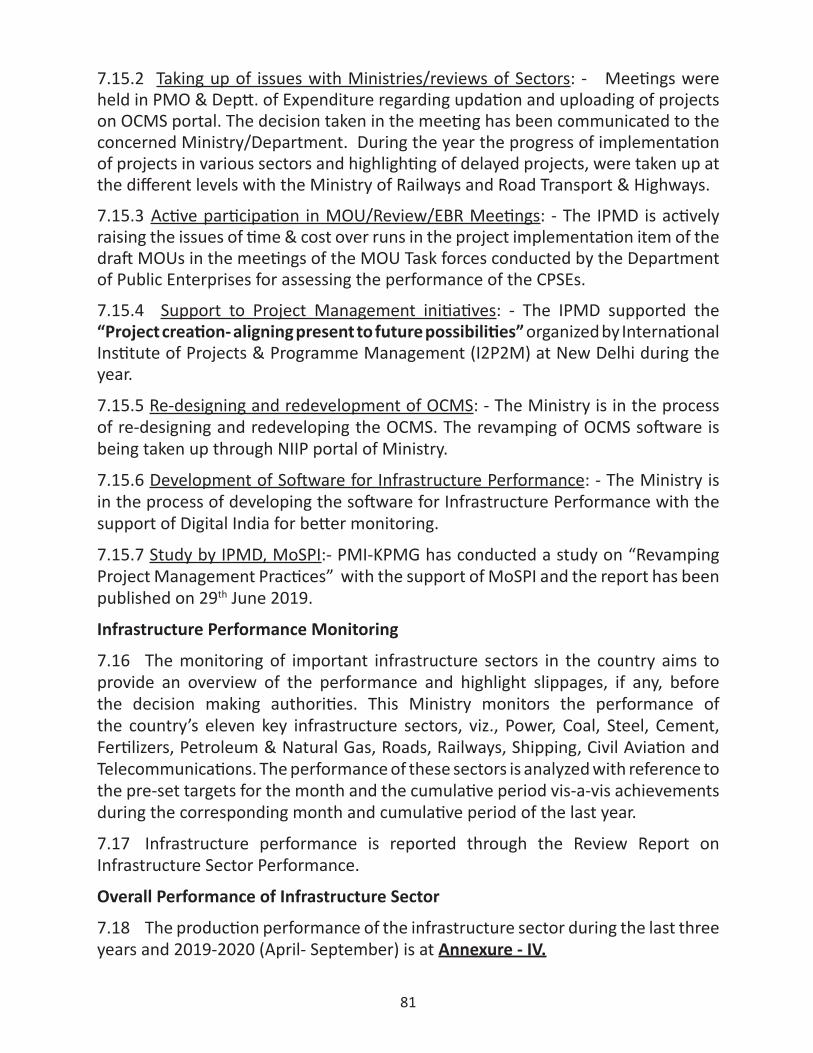
81
7.15.2 Taking up of issues with Ministries/reviews of Sectors: - Meetings were held in PMO & Deptt. of Expenditure regarding updation and uploading of projects on OCMS portal. The decision taken in the meeting has been communicated to the concerned Ministry/Department. During the year the progress of implementation of projects in various sectors and highlighting of delayed projects, were taken up at the different levels with the Ministry of Railways and Road Transport & Highways.
7.15.3 Active participation in MOU/Review/EBR Meetings: - The IPMD is actively raising the issues of time & cost over runs in the project implementation item of the draft MOUs in the meetings of the MOU Task forces conducted by the Department of Public Enterprises for assessing the performance of the CPSEs.
7.15.4 Support to Project Management initiatives: - The IPMD supported the “Project creation- aligning present to future possibilities” organized by International Institute of Projects & Programme Management (I2P2M) at New Delhi during the year.
7.15.5 Re-designing and redevelopment of OCMS: - The Ministry is in the process of re-designing and redeveloping the OCMS. The revamping of OCMS software is being taken up through NIIP portal of Ministry.
7.15.6 Development of Software for Infrastructure Performance: - The Ministry is in the process of developing the software for Infrastructure Performance with the support of Digital India for better monitoring.
7.15.7 Study by IPMD, MoSPI:- PMI-KPMG has conducted a study on “Revamping Project Management Practices” with the support of MoSPI and the report has been published on 29th June 2019.
Infrastructure Performance Monitoring
7.16 The monitoring of important infrastructure sectors in the country aims to provide an overview of the performance and highlight slippages, if any, before the decision making authorities. This Ministry monitors the performance of the country’s eleven key infrastructure sectors, viz., Power, Coal, Steel, Cement, Fertilizers, Petroleum & Natural Gas, Roads, Railways, Shipping, Civil Aviation and Telecommunications. The performance of these sectors is analyzed with reference to the pre-set targets for the month and the cumulative period vis-a-vis achievements during the corresponding month and cumulative period of the last year.
7.17 Infrastructure performance is reported through the Review Report on Infrastructure Sector Performance.
Overall Performance of Infrastructure Sector
7.18 The production performance of the infrastructure sector during the last three years and 2019-2020 (April- September) is at Annexure - IV.
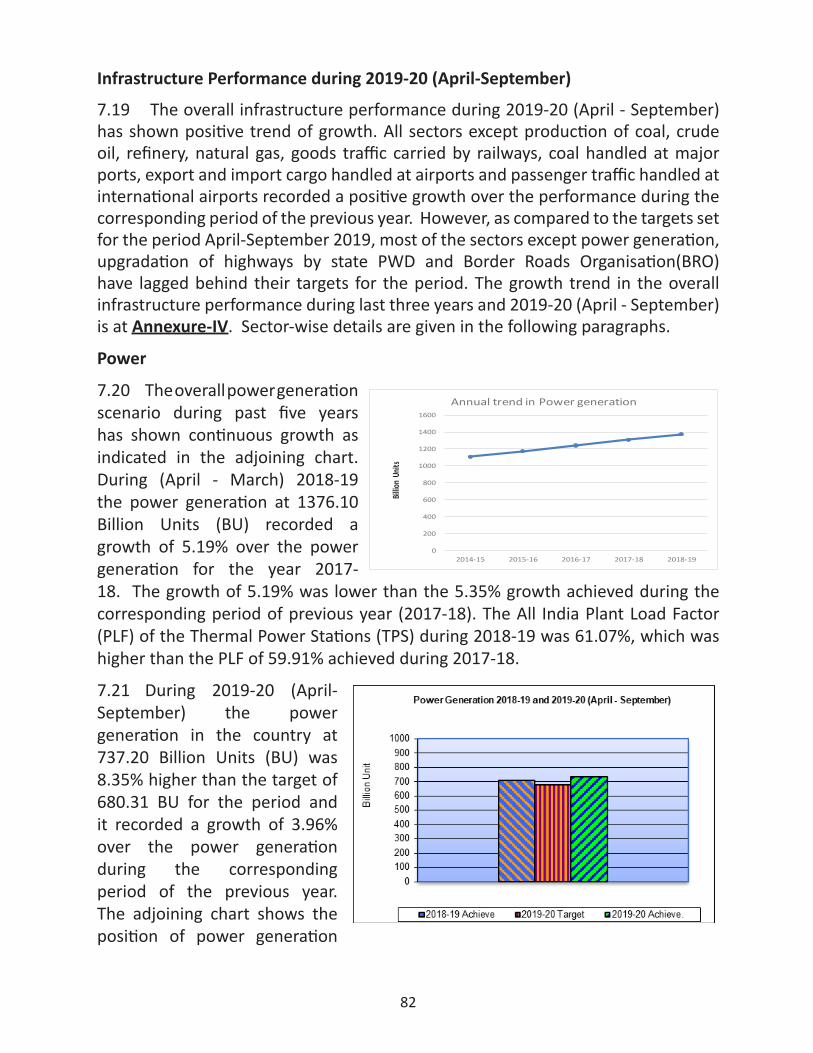
82
Infrastructure Performance during 2019-20 (April-September)
7.19 The overall infrastructure performance during 2019-20 (April - September) has shown positive trend of growth. All sectors except production of coal, crude oil, refinery, natural gas, goods traffic carried by railways, coal handled at major ports, export and import cargo handled at airports and passenger traffic handled at international airports recorded a positive growth over the performance during the corresponding period of the previous year. However, as compared to the targets set for the period April-September 2019, most of the sectors except power generation, upgradation of highways by state PWD and Border Roads Organisation(BRO) have lagged behind their targets for the period. The growth trend in the overall infrastructure performance during last three years and 2019-20 (April - September) is at Annexure-IV. Sector-wise details are given in the following paragraphs.
Power
7.20 The overall power generation scenario during past five years has shown continuous growth as indicated in the adjoining chart. During (April - March) 2018-19 the power generation at 1376.10 Billion Units (BU) recorded a growth of 5.19% over the power generation for the year 2017-18. The growth of 5.19% was lower than the 5.35% growth achieved during the corresponding period of previous year (2017-18). The All India Plant Load Factor (PLF) of the Thermal Power Stations (TPS) during 2018-19 was 61.07%, which was higher than the PLF of 59.91% achieved during 2017-18.
7.21 During 2019-20 (April-September) the power generation in the country at 737.20 Billion Units (BU) was 8.35% higher than the target of 680.31 BU for the period and it recorded a growth of 3.96% over the power generation during the corresponding period of the previous year. The adjoining chart shows the position of power generation
0
200
400
600
800
1000
1200
1400
1600
2014-15 2015-16 2016-17 2017-18 2018-19
Billio
n Un
itsAnnual trend in Power generation
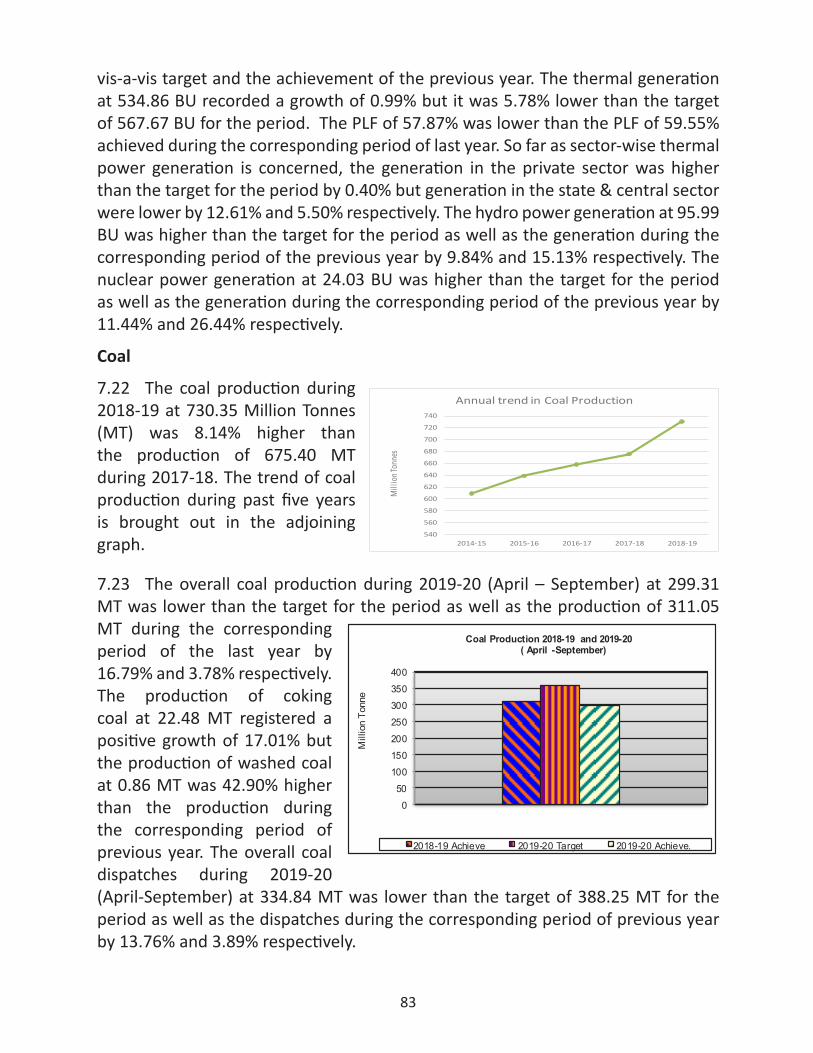
83
vis-a-vis target and the achievement of the previous year. The thermal generation at 534.86 BU recorded a growth of 0.99% but it was 5.78% lower than the target of 567.67 BU for the period. The PLF of 57.87% was lower than the PLF of 59.55% achieved during the corresponding period of last year. So far as sector-wise thermal power generation is concerned, the generation in the private sector was higher than the target for the period by 0.40% but generation in the state & central sector were lower by 12.61% and 5.50% respectively. The hydro power generation at 95.99 BU was higher than the target for the period as well as the generation during the corresponding period of the previous year by 9.84% and 15.13% respectively. The nuclear power generation at 24.03 BU was higher than the target for the period as well as the generation during the corresponding period of the previous year by 11.44% and 26.44% respectively.
Coal
7.22 The coal production during 2018-19 at 730.35 Million Tonnes (MT) was 8.14% higher than the production of 675.40 MT during 2017-18. The trend of coal production during past five years is brought out in the adjoining graph.
7.23 The overall coal production during 2019-20 (April – September) at 299.31 MT was lower than the target for the period as well as the production of 311.05 MT during the corresponding period of the last year by 16.79% and 3.78% respectively. The production of coking coal at 22.48 MT registered a positive growth of 17.01% but the production of washed coal at 0.86 MT was 42.90% higher than the production during the corresponding period of previous year. The overall coal dispatches during 2019-20 (April-September) at 334.84 MT was lower than the target of 388.25 MT for the period as well as the dispatches during the corresponding period of previous year by 13.76% and 3.89% respectively.
540
560
580
600
620
640
660
680
700
720
740
2014-15 2015-16 2016-17 2017-18 2018-19
Mill
ion T
onne
sAnnual trend in Coal Production
050
100150200250300350400
Mill
ion
Tonn
e
Coal Production 2018-19 and 2019-20( April -September)
2018-19 Achieve 2019-20 Target 2019-20 Achieve.
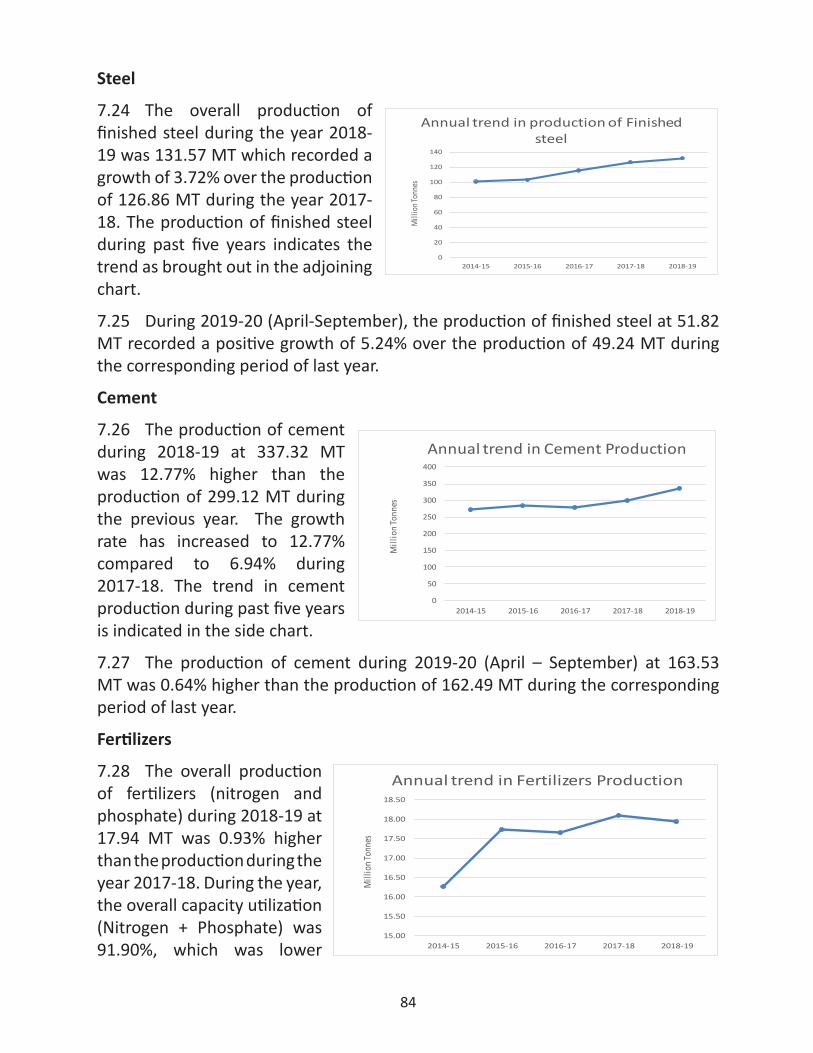
84
Steel
7.24 The overall production of finished steel during the year 2018-19 was 131.57 MT which recorded a growth of 3.72% over the production of 126.86 MT during the year 2017-18. The production of finished steel during past five years indicates the trend as brought out in the adjoining chart.
7.25 During 2019-20 (April-September), the production of finished steel at 51.82 MT recorded a positive growth of 5.24% over the production of 49.24 MT during the corresponding period of last year.
Cement
7.26 The production of cement during 2018-19 at 337.32 MT was 12.77% higher than the production of 299.12 MT during the previous year. The growth rate has increased to 12.77% compared to 6.94% during 2017-18. The trend in cement production during past five years is indicated in the side chart.
7.27 The production of cement during 2019-20 (April – September) at 163.53 MT was 0.64% higher than the production of 162.49 MT during the corresponding period of last year.
Fertilizers
7.28 The overall production of fertilizers (nitrogen and phosphate) during 2018-19 at 17.94 MT was 0.93% higher than the production during the year 2017-18. During the year, the overall capacity utilization (Nitrogen + Phosphate) was 91.90%, which was lower
0
50
100
150
200
250
300
350
400
2014-15 2015-16 2016-17 2017-18 2018-19
Mill
ion T
onne
s
Annual trend in Cement Production
15.00
15.50
16.00
16.50
17.00
17.50
18.00
18.50
2014-15 2015-16 2016-17 2017-18 2018-19
Mill
ion T
onne
s
Annual trend in Fertilizers Production
0
20
40
60
80
100
120
140
2014-15 2015-16 2016-17 2017-18 2018-19
Mill
ion T
onne
s
Annual trend in production of Finished steel
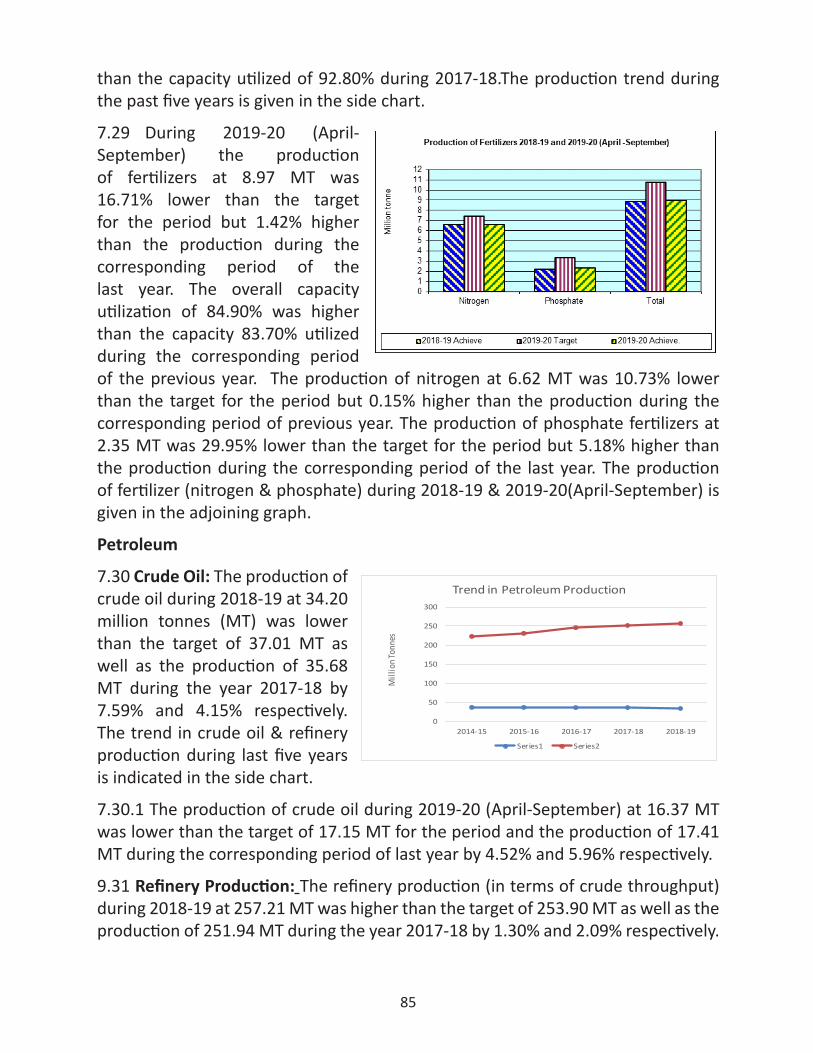
85
than the capacity utilized of 92.80% during 2017-18.The production trend during the past five years is given in the side chart.
7.29 During 2019-20 (April-September) the production of fertilizers at 8.97 MT was 16.71% lower than the target for the period but 1.42% higher than the production during the corresponding period of the last year. The overall capacity utilization of 84.90% was higher than the capacity 83.70% utilized during the corresponding period of the previous year. The production of nitrogen at 6.62 MT was 10.73% lower than the target for the period but 0.15% higher than the production during the corresponding period of previous year. The production of phosphate fertilizers at 2.35 MT was 29.95% lower than the target for the period but 5.18% higher than the production during the corresponding period of the last year. The production of fertilizer (nitrogen & phosphate) during 2018-19 & 2019-20(April-September) is given in the adjoining graph.
Petroleum
7.30 Crude Oil: The production of crude oil during 2018-19 at 34.20 million tonnes (MT) was lower than the target of 37.01 MT as well as the production of 35.68 MT during the year 2017-18 by 7.59% and 4.15% respectively. The trend in crude oil & refinery production during last five years is indicated in the side chart.
7.30.1 The production of crude oil during 2019-20 (April-September) at 16.37 MT was lower than the target of 17.15 MT for the period and the production of 17.41 MT during the corresponding period of last year by 4.52% and 5.96% respectively.
9.31 Refinery Production: The refinery production (in terms of crude throughput) during 2018-19 at 257.21 MT was higher than the target of 253.90 MT as well as the production of 251.94 MT during the year 2017-18 by 1.30% and 2.09% respectively.
0
50
100
150
200
250
300
2014-15 2015-16 2016-17 2017-18 2018-19
Mill
ion T
onne
s
Trend in Petroleum Production
Series1 Series2
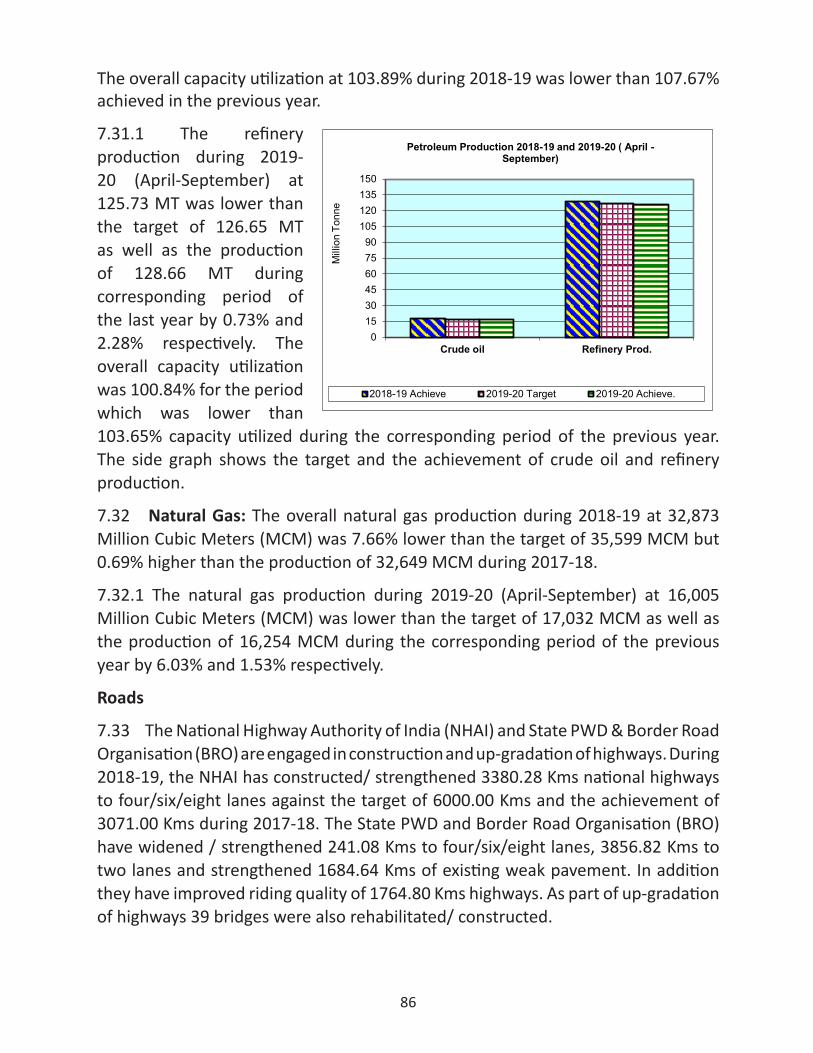
86
The overall capacity utilization at 103.89% during 2018-19 was lower than 107.67% achieved in the previous year.
7.31.1 The refinery production during 2019-20 (April-September) at 125.73 MT was lower than the target of 126.65 MT as well as the production of 128.66 MT during corresponding period of the last year by 0.73% and 2.28% respectively. The overall capacity utilization was 100.84% for the period which was lower than 103.65% capacity utilized during the corresponding period of the previous year. The side graph shows the target and the achievement of crude oil and refinery production.
7.32 Natural Gas: The overall natural gas production during 2018-19 at 32,873 Million Cubic Meters (MCM) was 7.66% lower than the target of 35,599 MCM but 0.69% higher than the production of 32,649 MCM during 2017-18.
7.32.1 The natural gas production during 2019-20 (April-September) at 16,005 Million Cubic Meters (MCM) was lower than the target of 17,032 MCM as well as the production of 16,254 MCM during the corresponding period of the previous year by 6.03% and 1.53% respectively.
Roads
7.33 The National Highway Authority of India (NHAI) and State PWD & Border Road Organisation (BRO) are engaged in construction and up-gradation of highways. During 2018-19, the NHAI has constructed/ strengthened 3380.28 Kms national highways to four/six/eight lanes against the target of 6000.00 Kms and the achievement of 3071.00 Kms during 2017-18. The State PWD and Border Road Organisation (BRO) have widened / strengthened 241.08 Kms to four/six/eight lanes, 3856.82 Kms to two lanes and strengthened 1684.64 Kms of existing weak pavement. In addition they have improved riding quality of 1764.80 Kms highways. As part of up-gradation of highways 39 bridges were also rehabilitated/ constructed.
0153045607590
105120135150
Crude oil Refinery Prod.M
illio
n To
nne
Petroleum Production 2018-19 and 2019-20 ( April -September)
2018-19 Achieve 2019-20 Target 2019-20 Achieve.
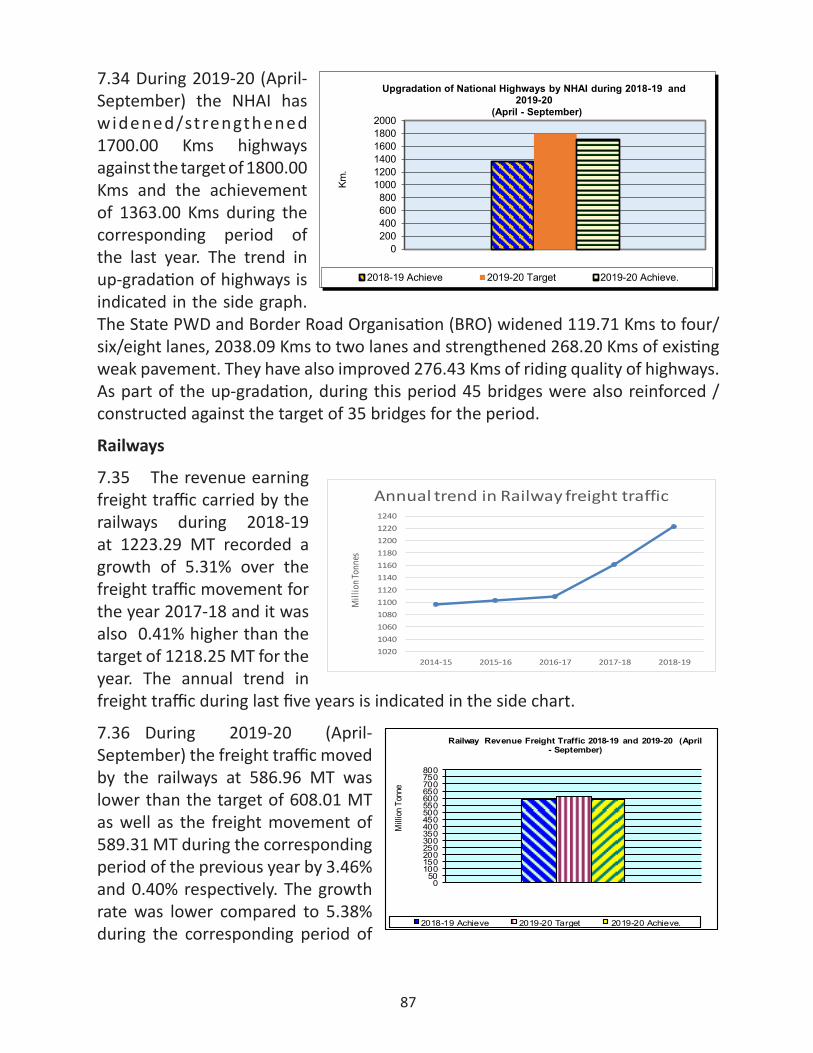
87
7.34 During 2019-20 (April-September) the NHAI has widened/strengthened 1700.00 Kms highways against the target of 1800.00 Kms and the achievement of 1363.00 Kms during the corresponding period of the last year. The trend in up-gradation of highways is indicated in the side graph. The State PWD and Border Road Organisation (BRO) widened 119.71 Kms to four/six/eight lanes, 2038.09 Kms to two lanes and strengthened 268.20 Kms of existing weak pavement. They have also improved 276.43 Kms of riding quality of highways. As part of the up-gradation, during this period 45 bridges were also reinforced /constructed against the target of 35 bridges for the period.
Railways
7.35 The revenue earning freight traffic carried by the railways during 2018-19 at 1223.29 MT recorded a growth of 5.31% over the freight traffic movement for the year 2017-18 and it was also 0.41% higher than the target of 1218.25 MT for the year. The annual trend in freight traffic during last five years is indicated in the side chart.
7.36 During 2019-20 (April-September) the freight traffic moved by the railways at 586.96 MT was lower than the target of 608.01 MT as well as the freight movement of 589.31 MT during the corresponding period of the previous year by 3.46% and 0.40% respectively. The growth rate was lower compared to 5.38% during the corresponding period of
102010401060108011001120114011601180120012201240
2014-15 2015-16 2016-17 2017-18 2018-19
Mill
ion T
onne
s
Annual trend in Railway freight traffic
050
100150200250300350400450500550600650700750800
Milli
on T
onne
Railway Revenue Freight Traffic 2018-19 and 2019-20 (April - September)
2018-19 Achieve 2019-20 Target 2019-20 Achieve.
0200400600800
100012001400160018002000
Km.
Upgradation of National Highways by NHAI during 2018-19 and 2019-20
(April - September)
2018-19 Achieve 2019-20 Target 2019-20 Achieve.
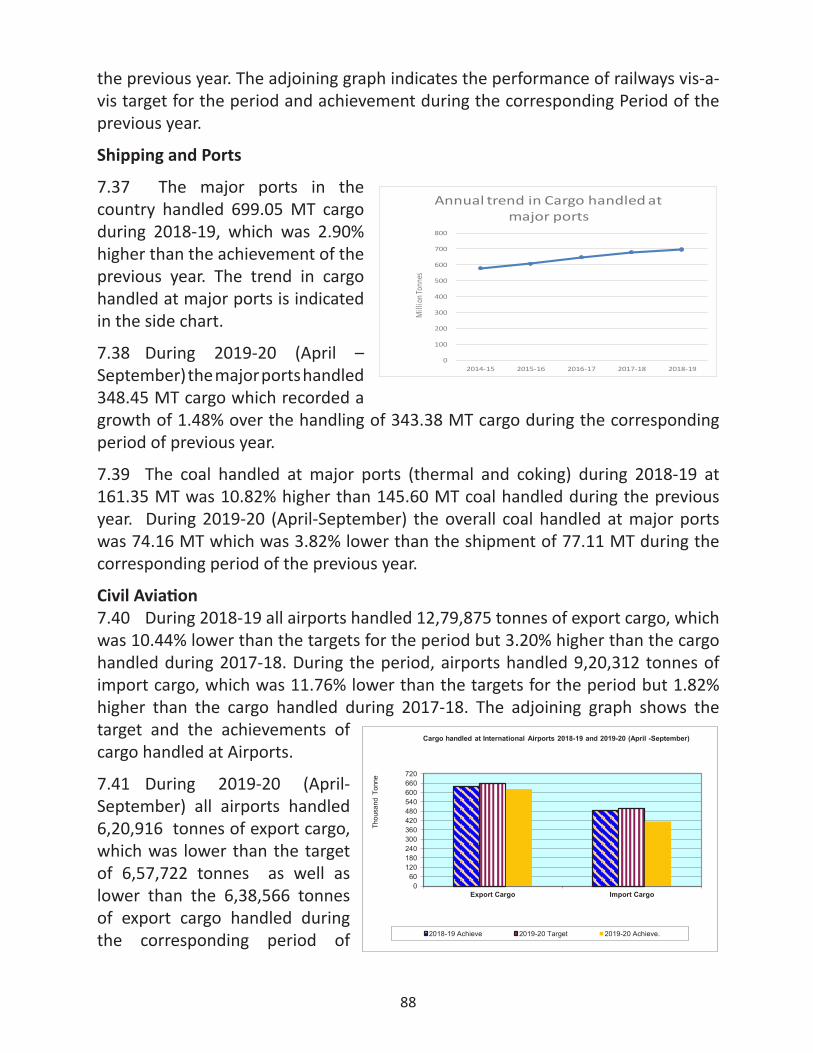
88
the previous year. The adjoining graph indicates the performance of railways vis-a-vis target for the period and achievement during the corresponding Period of the previous year.
Shipping and Ports
7.37 The major ports in the country handled 699.05 MT cargo during 2018-19, which was 2.90% higher than the achievement of the previous year. The trend in cargo handled at major ports is indicated in the side chart.
7.38 During 2019-20 (April – September) the major ports handled 348.45 MT cargo which recorded a growth of 1.48% over the handling of 343.38 MT cargo during the corresponding period of previous year.
7.39 The coal handled at major ports (thermal and coking) during 2018-19 at 161.35 MT was 10.82% higher than 145.60 MT coal handled during the previous year. During 2019-20 (April-September) the overall coal handled at major ports was 74.16 MT which was 3.82% lower than the shipment of 77.11 MT during the corresponding period of the previous year.
Civil Aviation7.40 During 2018-19 all airports handled 12,79,875 tonnes of export cargo, which was 10.44% lower than the targets for the period but 3.20% higher than the cargo handled during 2017-18. During the period, airports handled 9,20,312 tonnes of import cargo, which was 11.76% lower than the targets for the period but 1.82% higher than the cargo handled during 2017-18. The adjoining graph shows the target and the achievements of cargo handled at Airports.
7.41 During 2019-20 (April-September) all airports handled 6,20,916 tonnes of export cargo, which was lower than the target of 6,57,722 tonnes as well as lower than the 6,38,566 tonnes of export cargo handled during the corresponding period of
060
120180240300360420480540600660720
Export Cargo Import Cargo
Thou
sand
Ton
ne
Cargo handled at International Airports 2018-19 and 2019-20 (April -September)
2018-19 Achieve 2019-20 Target 2019-20 Achieve.
0
100
200
300
400
500
600
700
800
2014-15 2015-16 2016-17 2017-18 2018-19
Mill
ion T
onne
s
Annual trend in Cargo handled at major ports
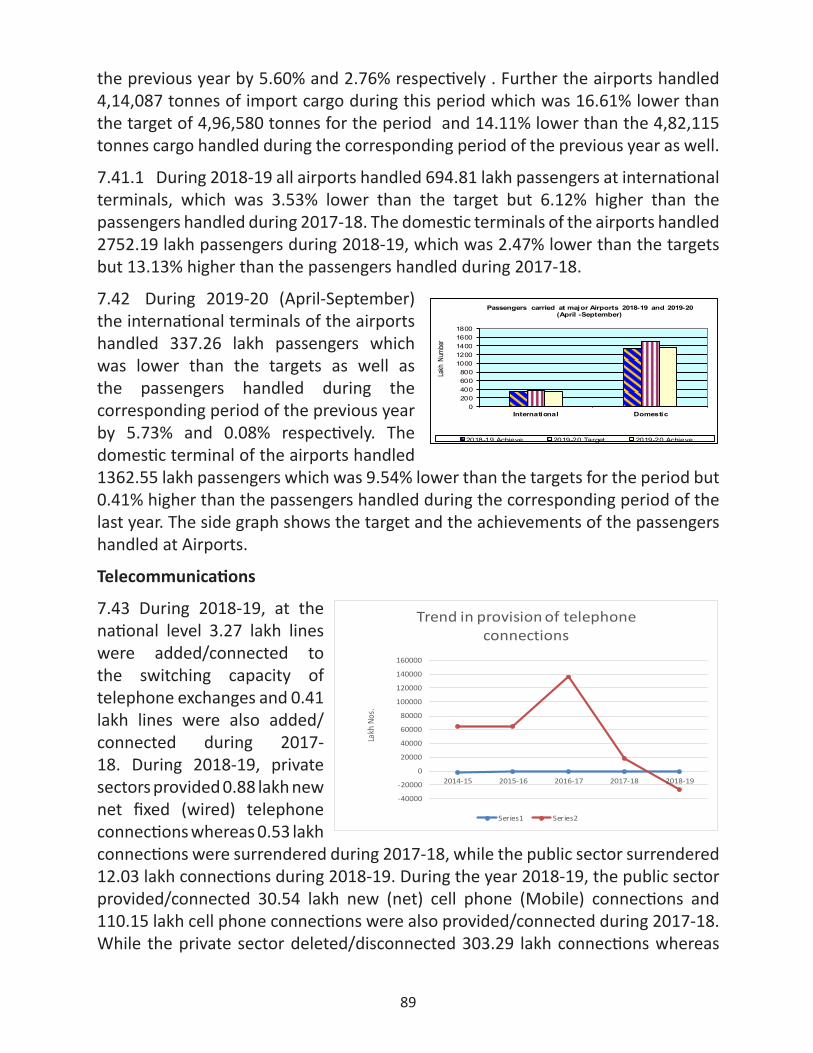
89
the previous year by 5.60% and 2.76% respectively . Further the airports handled 4,14,087 tonnes of import cargo during this period which was 16.61% lower than the target of 4,96,580 tonnes for the period and 14.11% lower than the 4,82,115 tonnes cargo handled during the corresponding period of the previous year as well.
7.41.1 During 2018-19 all airports handled 694.81 lakh passengers at international terminals, which was 3.53% lower than the target but 6.12% higher than the passengers handled during 2017-18. The domestic terminals of the airports handled 2752.19 lakh passengers during 2018-19, which was 2.47% lower than the targets but 13.13% higher than the passengers handled during 2017-18.
7.42 During 2019-20 (April-September) the international terminals of the airports handled 337.26 lakh passengers which was lower than the targets as well as the passengers handled during the corresponding period of the previous year by 5.73% and 0.08% respectively. The domestic terminal of the airports handled 1362.55 lakh passengers which was 9.54% lower than the targets for the period but 0.41% higher than the passengers handled during the corresponding period of the last year. The side graph shows the target and the achievements of the passengers handled at Airports.
Telecommunications
7.43 During 2018-19, at the national level 3.27 lakh lines were added/connected to the switching capacity of telephone exchanges and 0.41 lakh lines were also added/connected during 2017-18. During 2018-19, private sectors provided 0.88 lakh new net fixed (wired) telephone connections whereas 0.53 lakh connections were surrendered during 2017-18, while the public sector surrendered 12.03 lakh connections during 2018-19. During the year 2018-19, the public sector provided/connected 30.54 lakh new (net) cell phone (Mobile) connections and 110.15 lakh cell phone connections were also provided/connected during 2017-18. While the private sector deleted/disconnected 303.29 lakh connections whereas
-40000
-20000
0
20000
40000
60000
80000
100000
120000
140000
160000
2014-15 2015-16 2016-17 2017-18 2018-19
Lakh
Nos
.
Trend in provision of telephone connections
Series1 Series2
0200400600800
10001200140016001800
International Domestic
Lakh
Num
ber
Passengers carried at major Airports 2018-19 and 2019-20 (April -September)
2018-19 Achieve 2019-20 Target 2019-20 Achieve.
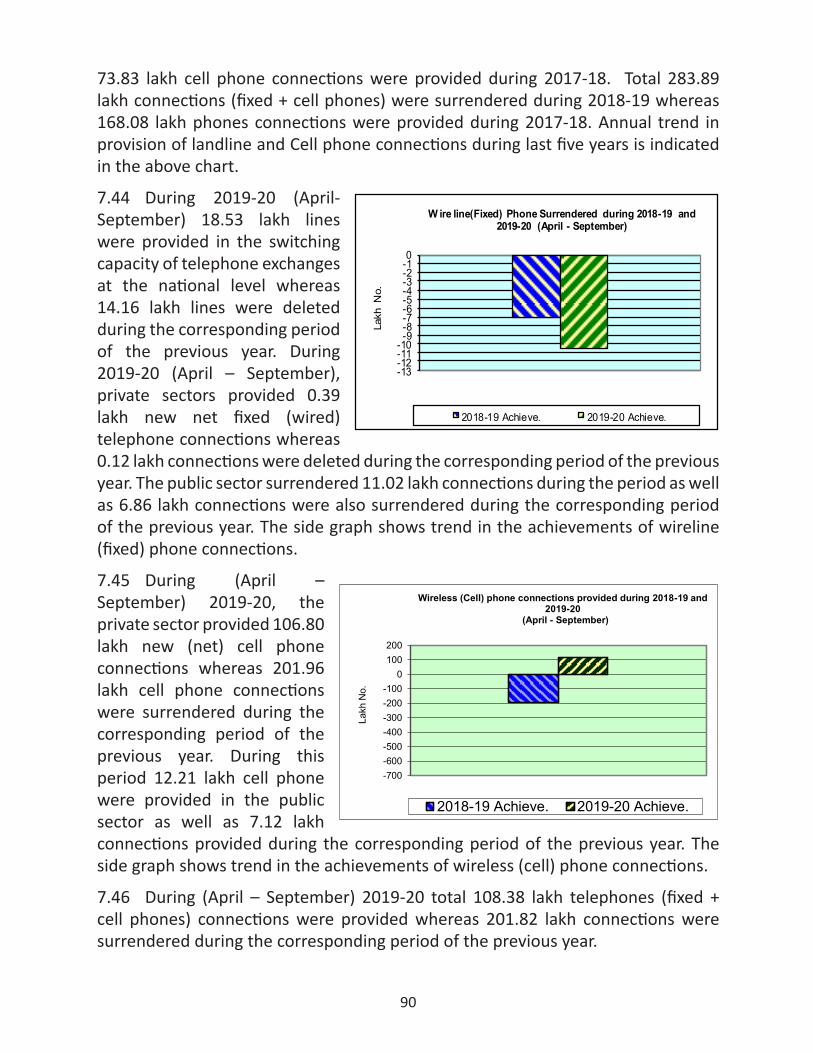
90
73.83 lakh cell phone connections were provided during 2017-18. Total 283.89 lakh connections (fixed + cell phones) were surrendered during 2018-19 whereas 168.08 lakh phones connections were provided during 2017-18. Annual trend in provision of landline and Cell phone connections during last five years is indicated in the above chart.
7.44 During 2019-20 (April-September) 18.53 lakh lines were provided in the switching capacity of telephone exchanges at the national level whereas 14.16 lakh lines were deleted during the corresponding period of the previous year. During 2019-20 (April – September), private sectors provided 0.39 lakh new net fixed (wired) telephone connections whereas 0.12 lakh connections were deleted during the corresponding period of the previous year. The public sector surrendered 11.02 lakh connections during the period as well as 6.86 lakh connections were also surrendered during the corresponding period of the previous year. The side graph shows trend in the achievements of wireline (fixed) phone connections.
7.45 During (April – September) 2019-20, the private sector provided 106.80 lakh new (net) cell phone connections whereas 201.96 lakh cell phone connections were surrendered during the corresponding period of the previous year. During this period 12.21 lakh cell phone were provided in the public sector as well as 7.12 lakh connections provided during the corresponding period of the previous year. The side graph shows trend in the achievements of wireless (cell) phone connections.
7.46 During (April – September) 2019-20 total 108.38 lakh telephones (fixed + cell phones) connections were provided whereas 201.82 lakh connections were surrendered during the corresponding period of the previous year.
-700-600-500-400-300-200-100
0100200
Lakh
No.
Wireless (Cell) phone connections provided during 2018-19 and 2019-20
(April - September)
2018-19 Achieve. 2019-20 Achieve.
-13-12-11-10-9-8-7-6-5-4-3-2-10
Lakh
No.
W ire line(Fixed) Phone Surrendered during 2018-19 and 2019-20 (April - September)
2018-19 Achieve. 2019-20 Achieve.
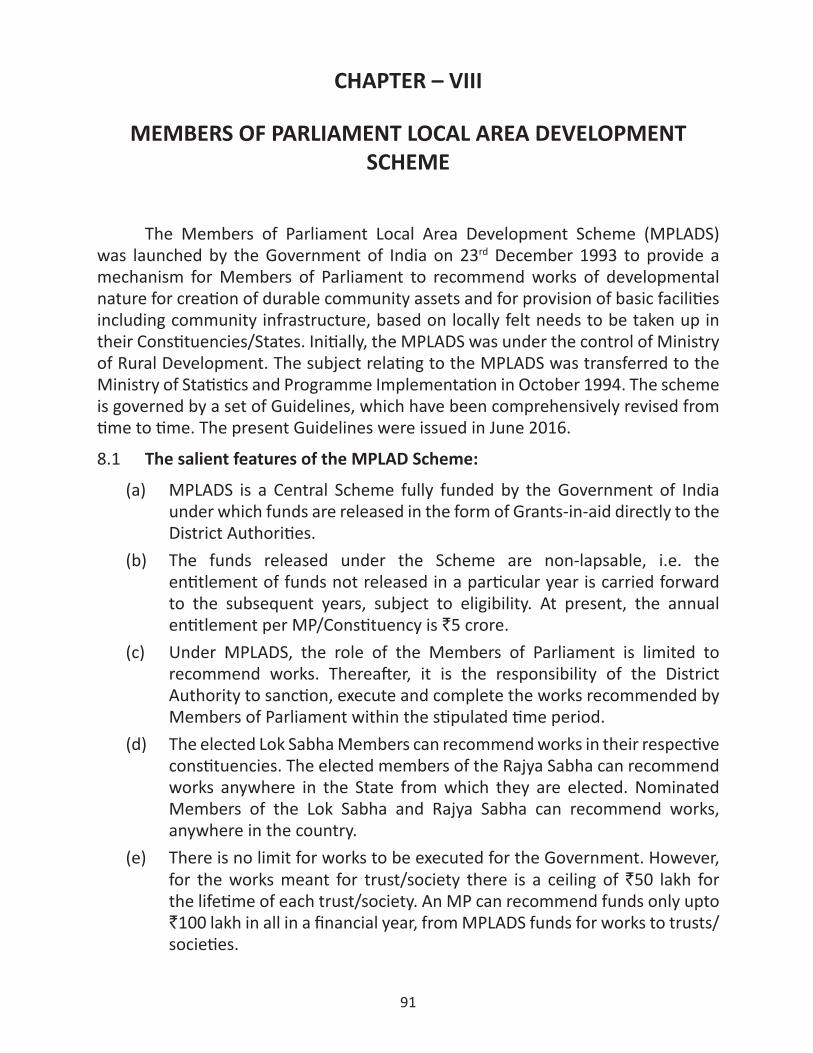
91
CHAPTER – VIII
MEMBERS OF PARLIAMENT LOCAL AREA DEVELOPMENTSCHEME
The Members of Parliament Local Area Development Scheme (MPLADS) was launched by the Government of India on 23rd December 1993 to provide a mechanism for Members of Parliament to recommend works of developmental nature for creation of durable community assets and for provision of basic facilities including community infrastructure, based on locally felt needs to be taken up in their Constituencies/States. Initially, the MPLADS was under the control of Ministry of Rural Development. The subject relating to the MPLADS was transferred to the Ministry of Statistics and Programme Implementation in October 1994. The scheme is governed by a set of Guidelines, which have been comprehensively revised from time to time. The present Guidelines were issued in June 2016.
8.1 The salient features of the MPLAD Scheme:
(a) MPLADS is a Central Scheme fully funded by the Government of India under which funds are released in the form of Grants-in-aid directly to the District Authorities.
(b) The funds released under the Scheme are non-lapsable, i.e. the entitlement of funds not released in a particular year is carried forward to the subsequent years, subject to eligibility. At present, the annual entitlement per MP/Constituency is `5 crore.
(c) Under MPLADS, the role of the Members of Parliament is limited to recommend works. Thereafter, it is the responsibility of the District Authority to sanction, execute and complete the works recommended by Members of Parliament within the stipulated time period.
(d) The elected Lok Sabha Members can recommend works in their respective constituencies. The elected members of the Rajya Sabha can recommend works anywhere in the State from which they are elected. Nominated Members of the Lok Sabha and Rajya Sabha can recommend works, anywhere in the country.
(e) There is no limit for works to be executed for the Government. However, for the works meant for trust/society there is a ceiling of `50 lakh for the lifetime of each trust/society. An MP can recommend funds only upto `100 lakh in all in a financial year, from MPLADS funds for works to trusts/societies.
92
(f) MPLADS works can be implemented in areas affected by natural calamities like flood, cyclone, hailstorm, avalanche, cloudburst, pest attack, landslides, tornado, earthquake, drought, tsunami, fire and biological, chemical, radiological hazards, etc. MPs from the non-affected areas of the State/UT can also recommend permissible works upto a maximum of `25 lakh per annum in the affected area(s) in that State/UT.
(g) In the event of ‘Calamity of severe nature’ (which is decided and declared by the Government of India) in any part of the country, an MP can recommend works up to a maximum of `1 crore for the affected district. The funds in this regard will be released by the Nodal District Authority of the MP concerned to the District Authority of the affected district to execute permissible works.
(h) In order to accord special attention to the development of areas inhabited by Scheduled Castes (SCs) and Scheduled Tribes (STs), 15% of MPLADS funds are to be utilized for areas inhabited by SC population and 7.5% for areas inhabited by ST population.
(i) If an elected Member of Parliament finds the need, to contribute MPLADS funds, to a place outside that State/UT or outside the constituency within the State or both, the MP can recommend eligible works, under these Guidelines upto a maximum of `25 lakh in a financial year. Such a gesture on the part of an MP will promote national unity, harmony, and fraternity among the people, at the grass roots level.
(j) The MP may recommend maximum of `20 lakh per year for giving assistance to Differently Abled Citizens for purchase of tri-cycles (including motorized tri-cycles), battery operated motorized wheel chair and artificial limbs; and aids for visually and hearing impaired.
(k) MPs may recommend their MPLADS funds to aided educational institutions which are receiving financial assistance from state government and are recognized by a State/UT/Central Board of Secondary Education in case of schools and by State/Central University in case of colleges and are not charging commercial fee from students. Such aided educational institutions are eligible for receiving MPLADS funds for all permissible items under the Guidelines with no ceiling. Both aided and un-aided educational institutions which are recognized by a Board of Secondary Education/University and are run by trusts/societies are eligible for receiving MPLADS funds for all permissible items under the Guidelines; the particular trust/society which runs the concerned educational institution will be governed by the maximum ceiling i.e. `50 lakh imposed on trusts/societies under the Guidelines.
93
(l) Energy efficient Community Gobar Gas plants, Crematoria and structures on burial/ cremation grounds and Non-conventional energy systems/devices for Community use are inter alia included in of the Guidelines.
(m) MPs may recommend MPLADS Funds for augmentation of funds for Scheme such as ‘Swachh Bharat Abhiyan’ which provides for construction of individual toilets, subject to provisions of the Guidelines on MPLADS.
(n) MPs may recommend MPLADS Funds for the installation of Wi-Fi system in educational institution, village and selected location.
(o) Funds released by the Government of India are deposited by the District Administrations in Nationalized Banks (including IDBI Banks)/Regional Rural Banks (Gramin Banks) which are on Core Banking Platform with the Nationalized Bank as their sponsor, for each MP for the purpose of MPLAD Scheme.
(p) The roles of Central Government, State Government, District Authorities and Implementing Agencies have been clearly defined in the Guidelines on MPLADS for implementation of MPLAD Scheme.
8.2 Impact
Since inception, the Scheme has benefited the local community by meeting various developmental needs such as drinking water facility, education, electricity, health and family welfare, irrigation, non-conventional energy, community centers, public libraries, bus stands/stops, roads, pathways and bridges, sports, etc. These works are sanctioned, executed and monitored as per the provisions of the MPLADS Guidelines.
8.3 Scheme Performance
8.3.1 Physical Performance (As on 30th November 2019)
As compiled from reports received from the Districts, since inception of the scheme:-
•¾ 23,78,884 works have been recommended since inception of the Scheme.•¾ 21,10,710 works have been sanctioned since inception of the Scheme.•¾ 18,92,298 works have been completed since inception of the Scheme. •¾ The percentage of works completed over sanctioned is 89.65 since inception
of the Scheme.•¾ In the current financial year 31,428 works have been recommended, 33,559
works have been sanctioned (including works recommended during previous years) and 42,070 works have been completed (including works sanctioned during previous years).
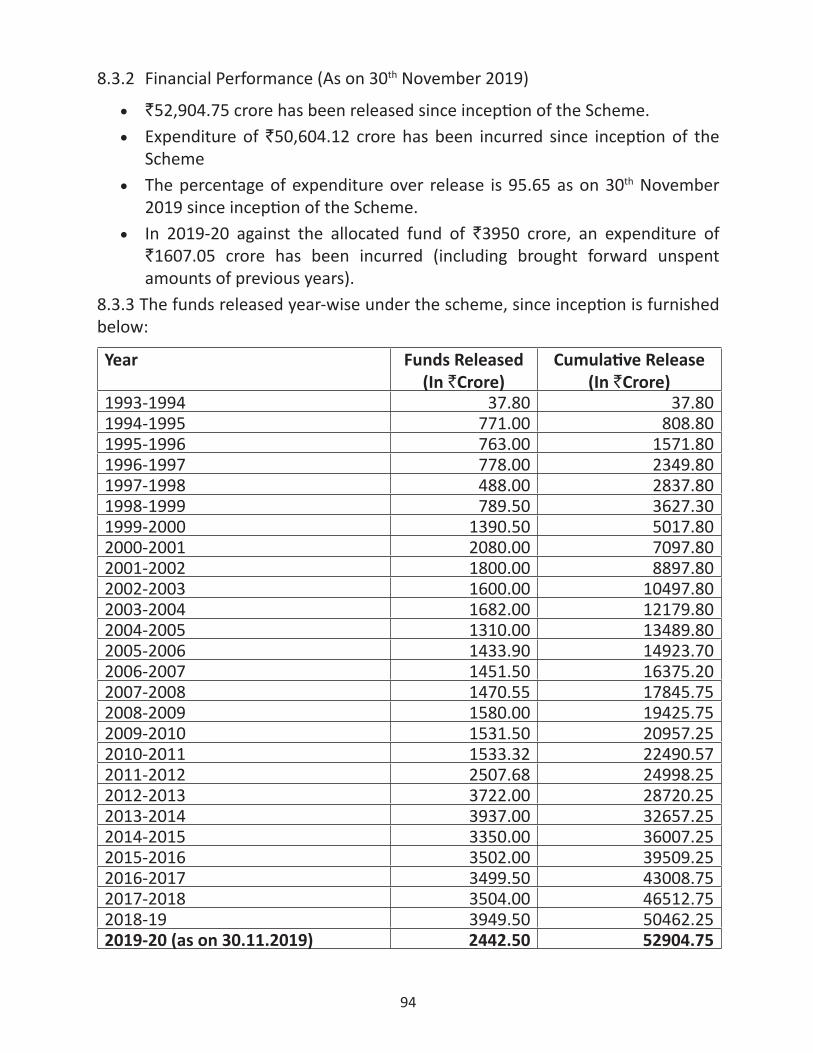
94
8.3.2 Financial Performance (As on 30th November 2019)
•¾ `52,904.75 crore has been released since inception of the Scheme.•¾ Expenditure of `50,604.12 crore has been incurred since inception of the
Scheme•¾ The percentage of expenditure over release is 95.65 as on 30th November
2019 since inception of the Scheme.•¾ In 2019-20 against the allocated fund of `3950 crore, an expenditure of
`1607.05 crore has been incurred (including brought forward unspent amounts of previous years).
8.3.3 The funds released year-wise under the scheme, since inception is furnished below:
Year Funds Released (In `Crore)
Cumulative Release (In `Crore)
1993-1994 37.80 37.801994-1995 771.00 808.801995-1996 763.00 1571.801996-1997 778.00 2349.801997-1998 488.00 2837.801998-1999 789.50 3627.301999-2000 1390.50 5017.802000-2001 2080.00 7097.802001-2002 1800.00 8897.802002-2003 1600.00 10497.802003-2004 1682.00 12179.802004-2005 1310.00 13489.802005-2006 1433.90 14923.702006-2007 1451.50 16375.202007-2008 1470.55 17845.752008-2009 1580.00 19425.752009-2010 1531.50 20957.252010-2011 1533.32 22490.572011-2012 2507.68 24998.252012-2013 3722.00 28720.252013-2014 3937.00 32657.252014-2015 3350.00 36007.252015-2016 3502.00 39509.252016-2017 3499.50 43008.752017-2018 3504.00 46512.752018-19 3949.50 50462.252019-20 (as on 30.11.2019) 2442.50 52904.75
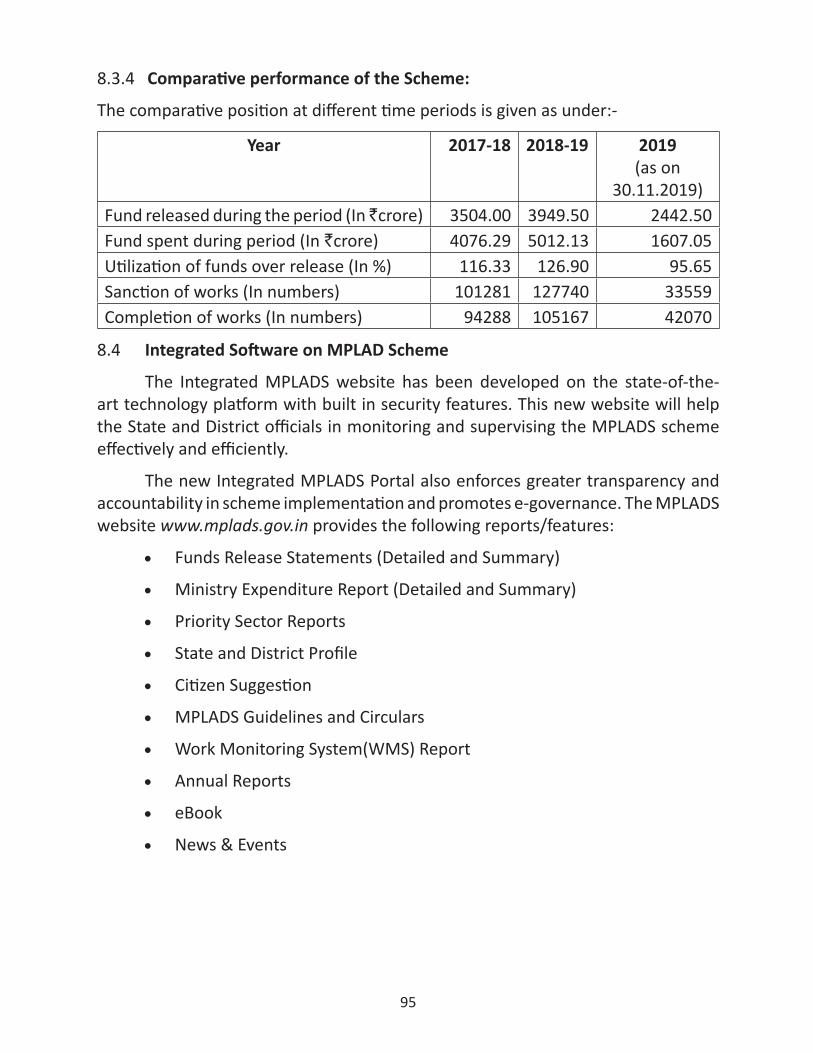
95
8.3.4 Comparative performance of the Scheme:
The comparative position at different time periods is given as under:-
Year 2017-18 2018-19 2019 (as on
30.11.2019)Fund released during the period (In ̀ crore) 3504.00 3949.50 2442.50Fund spent during period (In `crore) 4076.29 5012.13 1607.05Utilization of funds over release (In %) 116.33 126.90 95.65Sanction of works (In numbers) 101281 127740 33559Completion of works (In numbers) 94288 105167 42070
8.4 Integrated Software on MPLAD Scheme
The Integrated MPLADS website has been developed on the state-of-the-art technology platform with built in security features. This new website will help the State and District officials in monitoring and supervising the MPLADS scheme effectively and efficiently.
The new Integrated MPLADS Portal also enforces greater transparency and accountability in scheme implementation and promotes e-governance. The MPLADS website www.mplads.gov.in provides the following reports/features:
•¾ Funds Release Statements (Detailed and Summary)
•¾ Ministry Expenditure Report (Detailed and Summary)
•¾ Priority Sector Reports
•¾ State and District Profile
•¾ Citizen Suggestion
•¾ MPLADS Guidelines and Circulars
•¾ Work Monitoring System(WMS) Report
•¾ Annual Reports
•¾ eBook
•¾ News & Events
96
New Integrated MPLADS Portal has following salient features:
• The Intergovernmental G2G solution ensures Micro / Macro (Works, Release and Expenditure) level reporting and monitoring for timely utilization of funds at Districts and Ministry including automatic incorporation of Member details from Lok Sabha and Rajya Sabha portal.
• The Citizen centric C2G solution provides transformation of public suggestions to on-line recommendations from Members of Parliament. It also provides messaging/blog, offline communication between Members and District Authorities.
• A single point of reference for all stakeholders – Members of Parliament, Districts, States, Ministry and Public.
• Captures the total available balances in Nodal Districts and Implementing Districts, thus resulting in timely monitoring of funds lying unutilized in the districts.
• Provides necessary alerts/ intimation through e-mails on all important milestones of any project such as project sanction, fund release, etc.
97
Through this portal, workflow system at Districts (Nodal Authorities) is established and integrated with the Government of India Release System. On regular updation on real time basis, the Sanction Order and MPR can be generated automatically. Further, on-line availability of MPR has facilitated timely release of funds subject to availability of other requisite eligible document(s).
8.5 Monitoring
• Implementation of MPLADS has improved due to intensive reviews and visits made by senior officers in the States.
• Annual Review Meetings with the Secretaries of State Nodal Departments are being regularly held to monitor release of funds and to take stock of the implementation of the scheme in the States/UTs.
• Technical assistance is also being provided to States/UTs to conduct training programmes for State/District officials to facilitate better implementation of the scheme. Ministry is providing training to the States/UTs for operationalising the newly developed integrated MPLADS website.
The physical monitoring by the external agencies has helped in bringing systemic changes for improved implementation of the Scheme. The overall improvement in the implementation of MPLAD Scheme is attributed to the synergy attained by the cooperation of different stakeholders and operational experience gained over years, community participation and close monitoring.
98
CHAPTER – IX
PROGRESSIVE USE OF OFFICIAL LANGUAGE/HINDI
9.1 In accordance with the Official Language Policy of the Union and in pursuance of the Annual Programme issued by the Department of Official Language, the Ministry of Statistics & Programme Implementation has been making continuous and concerted efforts for propagation and promotion of Hindi as official language in the Ministry and in its attached & subordinate offices. Official Language Section of the Ministry is responsible for monitoring and overseeing the implementation of various statutory provisions and policies as laid down in the Official Languages Act, 1963 and the Official Language Rules, 1976. As per information received from the Administration Division of the Ministry, as on 30.11.2019, all officers/employees are either proficient in Hindi or having its working knowledge. All the 07 Stenographers are trained in Hindi Shorthand/Typing.
Official Language Implementation Committee
9.2 An Official Language Implementation Committee under the Chairmanship of Joint Secretary (Admn.) undertakes quarterly review of the progressive use of Hindi as well as compliance of provisions of the Official Languages Act, 1963 & Official Languages Rules, 1976 in the Ministry and in its attached/subordinate offices. During the period under report, the meetings of the Committee were organized at regular intervals. Quarterly and Annual Reports regarding progressive use of Official Language in the Ministry are forwarded to the Department of Official Language, Ministry of Home Affairs regularly.
Inspections
9.3 The officers of the Ministry conduct inspections of the attached/subordinate offices of the Ministry time and again to assess the position of progressive use of Hindi and give necessary instructions on the lapses found therein.
Inspections of following attached/subordinate offices of the Ministry have been carried out this year:
(i) National Statistics Office, FOD, Udaipur
(ii) National Statistics Office, FOD, Ajmer
(iii) National Statistics Office, FOD, Bhubaneswar
99
Awards and Incentives
9.4 As in the previous years, the incentive scheme for original noting/drafting in Hindi continued during this year also. In the month of September 2019, Hindi Month/Pakhwara was observed in the Ministry and in its attached and subordinate offices. In the Ministry, the period from 16th -30th September 2019 was observed as “Hindi Pakhwara”. This Pakhwara was marked with greater participation with a number of officers and officials in various competitions organized by Hindi Section of the Ministry. After evaluating the performances in these competitions, a total of 37 winner participants of the ministry were awarded cash prizes in different categories.
In order to promote use of Hindi in the ministry, different Hindi competitions were organized for Data Entry Operators as well as Daily Wages Employees this year also and 18 deserving participants were awarded cash prizes.
Hindi Training and Workshops
9.5 All the Stenographers/A.S.Os in the Ministry are trained in Hindi stenography/typing. Recently 3 officers from Official Language of the Ministry have been nominated for Hindi typing training programme.
Publication of In-House Journal “Paridrishya”
9.6 During the year under report, articles, self-composed poems, etc. in Hindi have been invited from the officers/employees of the Ministry and its subordinate offices vide a circular for the 10th issue of the Ministry’s home magazine “Paridrishya”.
100
CHAPTER X
OTHER ACTIVITIES
10.1 The Vigilance Section in the Ministry, with the Joint Secretary & Chief Vigilance Officer as the Divisional head, deals with the following work:
• Vigilance cases i.e., cases of corruption, malpractices and lack of integrity in respect of Group ‘A’, ‘B’ and ‘C’ officers;
• Processing/issuing of vigilance clearance in respect of officers of various grades for various purposes;
• Implementation of Central Civil Service (Classification, Control and Appeal) Rules, 1964;
• Furnishing of monthly report of vigilance cases to the Department of Personnel & Training on Probity Portal.
10.2 Vigilance Section also handles the following activities:-
• Reviewing and streamlining of procedures, which appear to afford scope for corruption or misconduct and for initiating other measures for the prevention, detection of corruption and other malpractices and punishment to the corrupt in the Ministry as well as its attached and subordinate offices;
• Preparation of list of Officers of ‘Doubtful Integrity’ (ODI)/Agreed list and their postings to non-sensitive areas;
• Appointment of Vigilance Officers in the attached/subordinate offices.
10.3 The complaints received from individuals and organisations like CBI/CVC/PMO/Cabinet Secretariat/UPSC etc. are examined on the basis of the factual report obtained from the concerned Administrative Divisions, Attached and Subordinate Offices. The preliminary inquiries are made to look into the merit of the complaint and if the complaints have any substance then a regular departmental action is initiated.
10.4 During the year 2018-19 (April 2019-November 2019), 19 new complaints were received and examined for appropriate action. During the aforesaid period 15 disciplinary proceedings were also processed in the Vigilance Section of the Ministry which are at various stages of investigation/examination.
10.5 During the period (April 2019-November 2019), no Major or Minor Penalty Charge Sheets was issued.
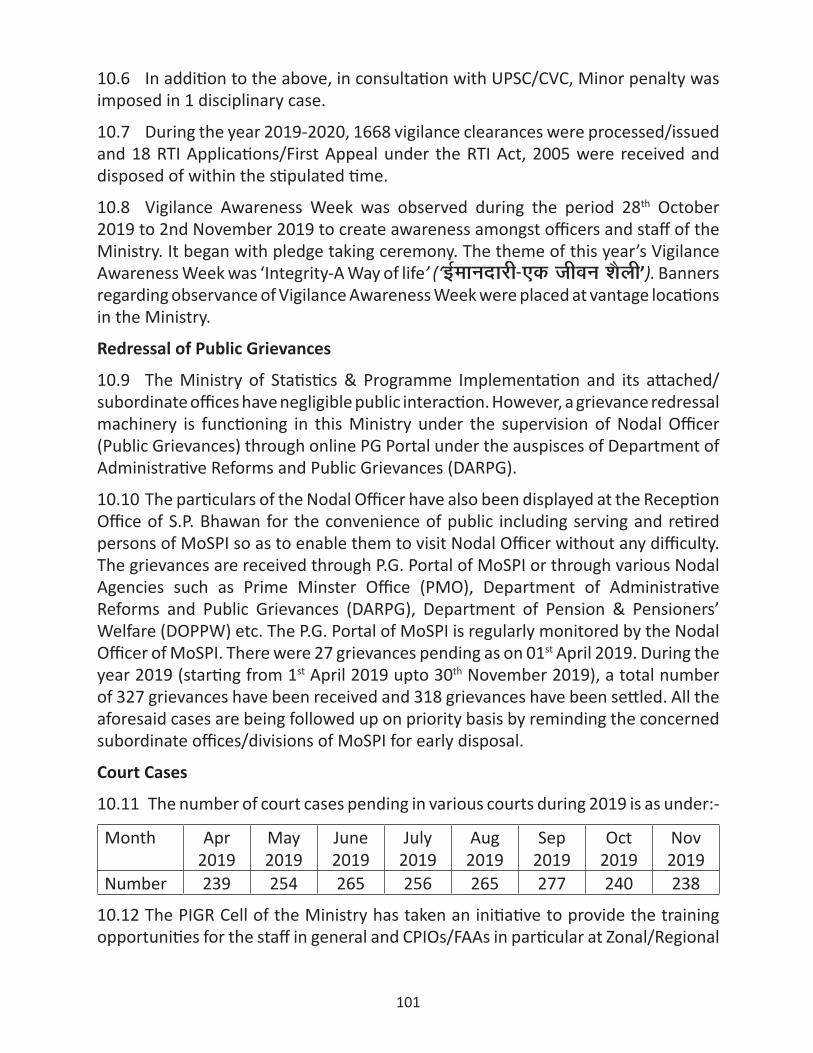
101
10.6 In addition to the above, in consultation with UPSC/CVC, Minor penalty was imposed in 1 disciplinary case.
10.7 During the year 2019-2020, 1668 vigilance clearances were processed/issued and 18 RTI Applications/First Appeal under the RTI Act, 2005 were received and disposed of within the stipulated time.
10.8 Vigilance Awareness Week was observed during the period 28th October 2019 to 2nd November 2019 to create awareness amongst officers and staff of the Ministry. It began with pledge taking ceremony. The theme of this year’s Vigilance Awareness Week was ‘Integrity-A Way of life’ (‘bZekunkjh&,d thou ’kSyh’). Banners regarding observance of Vigilance Awareness Week were placed at vantage locations in the Ministry.
Redressal of Public Grievances
10.9 The Ministry of Statistics & Programme Implementation and its attached/subordinate offices have negligible public interaction. However, a grievance redressal machinery is functioning in this Ministry under the supervision of Nodal Officer (Public Grievances) through online PG Portal under the auspisces of Department of Administrative Reforms and Public Grievances (DARPG).
10.10 The particulars of the Nodal Officer have also been displayed at the Reception Office of S.P. Bhawan for the convenience of public including serving and retired persons of MoSPI so as to enable them to visit Nodal Officer without any difficulty. The grievances are received through P.G. Portal of MoSPI or through various Nodal Agencies such as Prime Minster Office (PMO), Department of Administrative Reforms and Public Grievances (DARPG), Department of Pension & Pensioners’ Welfare (DOPPW) etc. The P.G. Portal of MoSPI is regularly monitored by the Nodal Officer of MoSPI. There were 27 grievances pending as on 01st April 2019. During the year 2019 (starting from 1st April 2019 upto 30th November 2019), a total number of 327 grievances have been received and 318 grievances have been settled. All the aforesaid cases are being followed up on priority basis by reminding the concerned subordinate offices/divisions of MoSPI for early disposal.
Court Cases
10.11 The number of court cases pending in various courts during 2019 is as under:-
Month Apr2019
May2019
June2019
July2019
Aug2019
Sep2019
Oct2019
Nov2019
Number 239 254 265 256 265 277 240 238
10.12 The PIGR Cell of the Ministry has taken an initiative to provide the training opportunities for the staff in general and CPIOs/FAAs in particular at Zonal/Regional
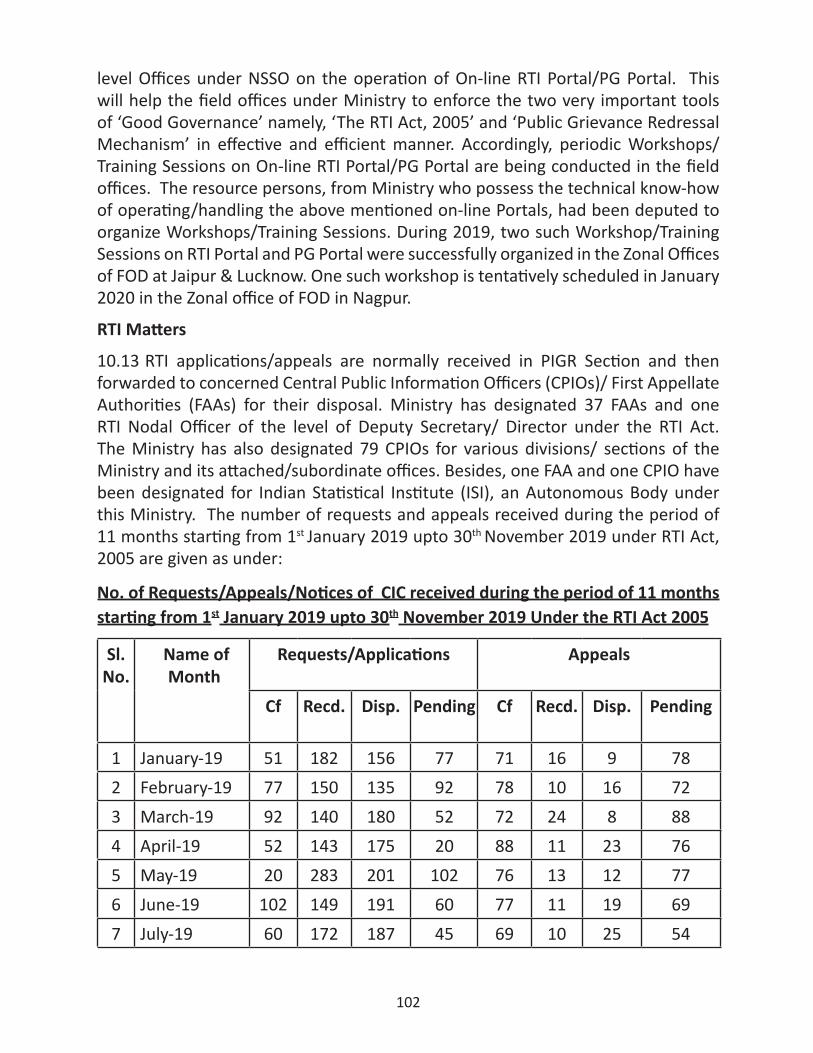
102
level Offices under NSSO on the operation of On-line RTI Portal/PG Portal. This will help the field offices under Ministry to enforce the two very important tools of ‘Good Governance’ namely, ‘The RTI Act, 2005’ and ‘Public Grievance Redressal Mechanism’ in effective and efficient manner. Accordingly, periodic Workshops/Training Sessions on On-line RTI Portal/PG Portal are being conducted in the field offices. The resource persons, from Ministry who possess the technical know-how of operating/handling the above mentioned on-line Portals, had been deputed to organize Workshops/Training Sessions. During 2019, two such Workshop/Training Sessions on RTI Portal and PG Portal were successfully organized in the Zonal Offices of FOD at Jaipur & Lucknow. One such workshop is tentatively scheduled in January 2020 in the Zonal office of FOD in Nagpur.
RTI Matters
10.13 RTI applications/appeals are normally received in PIGR Section and then forwarded to concerned Central Public Information Officers (CPIOs)/ First Appellate Authorities (FAAs) for their disposal. Ministry has designated 37 FAAs and one RTI Nodal Officer of the level of Deputy Secretary/ Director under the RTI Act. The Ministry has also designated 79 CPIOs for various divisions/ sections of the Ministry and its attached/subordinate offices. Besides, one FAA and one CPIO have been designated for Indian Statistical Institute (ISI), an Autonomous Body under this Ministry. The number of requests and appeals received during the period of 11 months starting from 1st January 2019 upto 30th November 2019 under RTI Act, 2005 are given as under:
No. of Requests/Appeals/Notices of CIC received during the period of 11 months starting from 1st January 2019 upto 30th November 2019 Under the RTI Act 2005
Sl. No.
Name of Month
Requests/Applications Appeals
Cf Recd. Disp. Pending Cf Recd. Disp. Pending
1 January-19 51 182 156 77 71 16 9 782 February-19 77 150 135 92 78 10 16 723 March-19 92 140 180 52 72 24 8 884 April-19 52 143 175 20 88 11 23 765 May-19 20 283 201 102 76 13 12 776 June-19 102 149 191 60 77 11 19 697 July-19 60 172 187 45 69 10 25 54
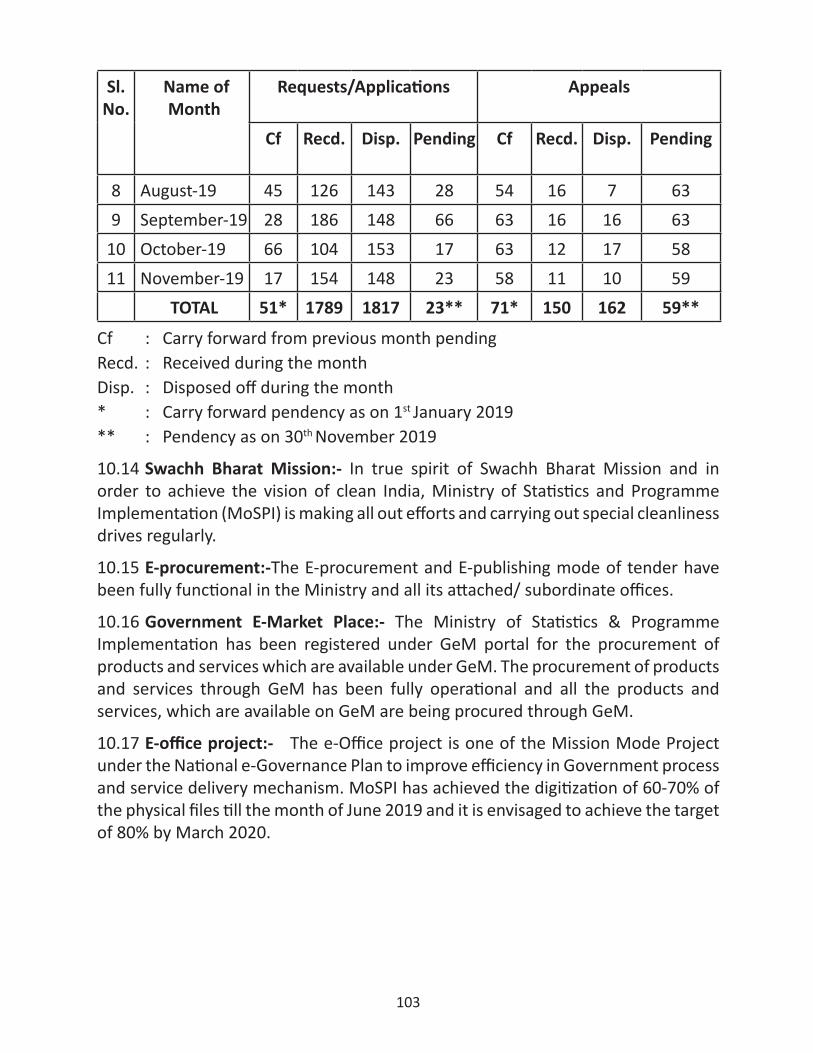
103
Sl. No.
Name of Month
Requests/Applications Appeals
Cf Recd. Disp. Pending Cf Recd. Disp. Pending
8 August-19 45 126 143 28 54 16 7 639 September-19 28 186 148 66 63 16 16 63
10 October-19 66 104 153 17 63 12 17 5811 November-19 17 154 148 23 58 11 10 59
TOTAL 51* 1789 1817 23** 71* 150 162 59**
Cf : Carry forward from previous month pendingRecd. : Received during the monthDisp. : Disposed off during the month* : Carry forward pendency as on 1st January 2019** : Pendency as on 30th November 2019
10.14 Swachh Bharat Mission:- In true spirit of Swachh Bharat Mission and in order to achieve the vision of clean India, Ministry of Statistics and Programme Implementation (MoSPI) is making all out efforts and carrying out special cleanliness drives regularly.
10.15 E-procurement:-The E-procurement and E-publishing mode of tender have been fully functional in the Ministry and all its attached/ subordinate offices.
10.16 Government E-Market Place:- The Ministry of Statistics & Programme Implementation has been registered under GeM portal for the procurement of products and services which are available under GeM. The procurement of products and services through GeM has been fully operational and all the products and services, which are available on GeM are being procured through GeM.
10.17 E-office project:- The e-Office project is one of the Mission Mode Project under the National e-Governance Plan to improve efficiency in Government process and service delivery mechanism. MoSPI has achieved the digitization of 60-70% of the physical files till the month of June 2019 and it is envisaged to achieve the target of 80% by March 2020.
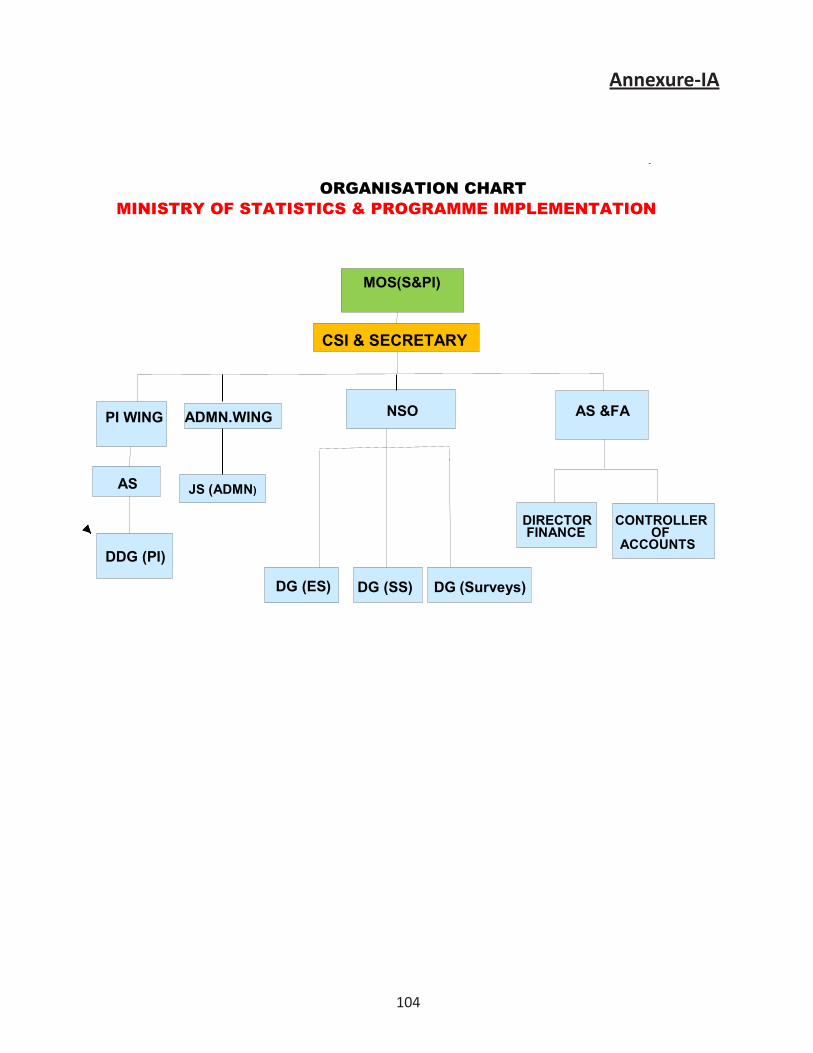
104
Annexure-IA
DDG (PI)
NSO
MINISTRY OF STATISTICS & PROGRAMME IMPLEMENTATION ORGANISATION CHART
CSI & SECRETARY
AS
CONTROLLER
OF
ACCOUNTS
AS &FA
DIRECTOR
FINANCE
DG (Surveys)
DG (ES)
PI WING
JS (ADMN)
ADMN.WING
-
DG (SS)
MOS(S&PI)
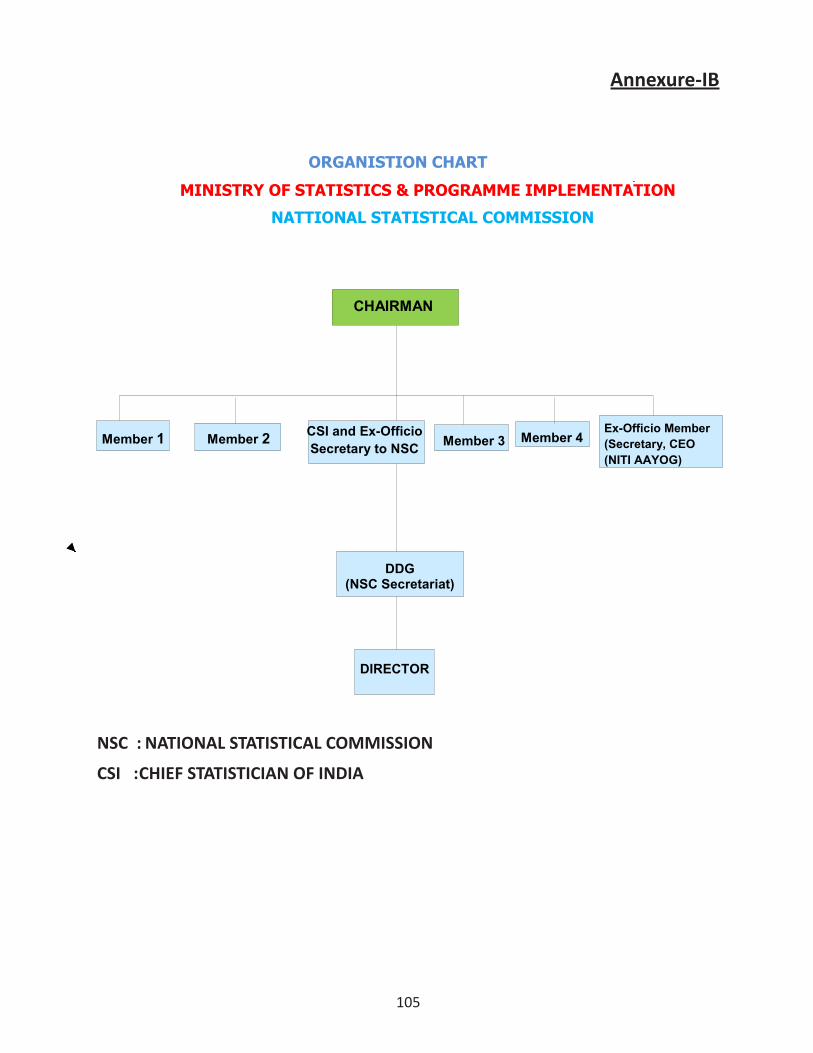
105
Annexure-IB
CHAIRMAN
Member 1
DIRECTOR
DDG (NSC Secretariat)
Member 3
-
Member 4
Member 2
CSI and Ex-Officio Secretary to NSC
Ex-Officio Member (Secretary, CEO (NITI AAYOG)
MINISTRY OF STATISTICS & PROGRAMME IMPLEMENTATION
NATTIONAL STATISTICAL COMMISSION
ORGANISTION CHART
NSC : NATIONAL STATISTICAL COMMISSION
CSI : CHIEF STATISTICIAN OF INDIA
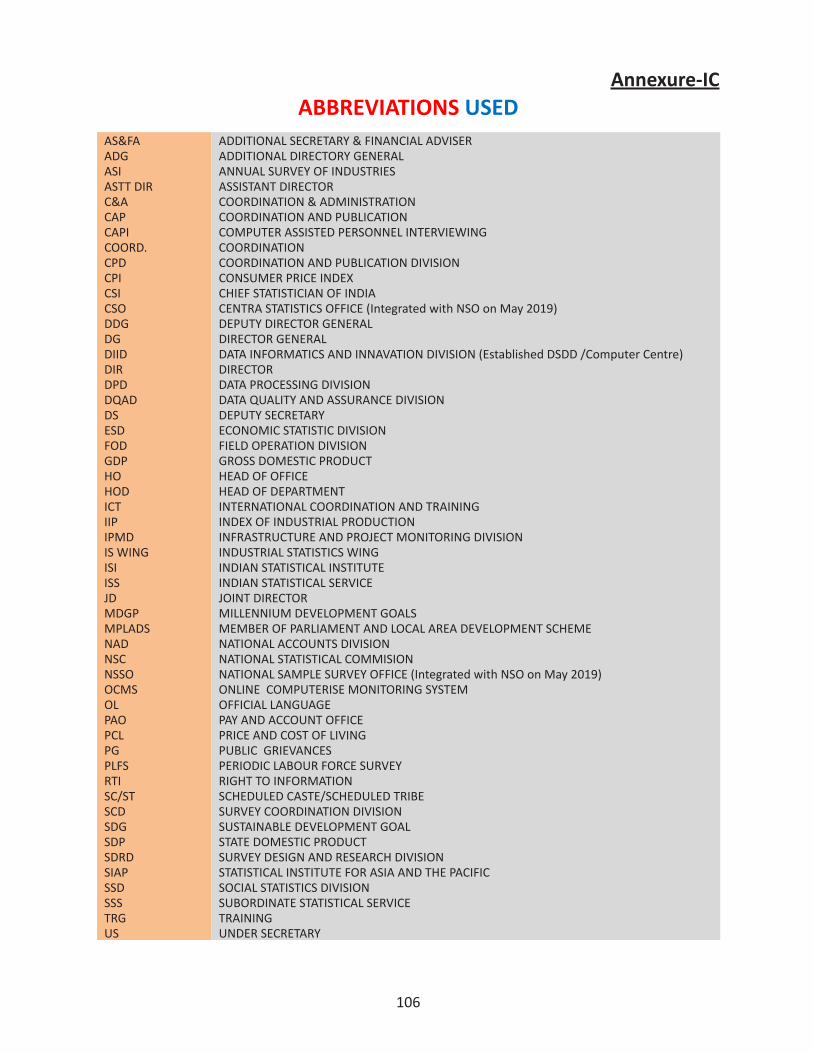
106
Annexure-ICABBREVIATIONS USED
AS&FA ADDITIONAL SECRETARY & FINANCIAL ADVISERADG ADDITIONAL DIRECTORY GENERALASI ANNUAL SURVEY OF INDUSTRIESASTT DIR ASSISTANT DIRECTORC&A COORDINATION & ADMINISTRATIONCAP COORDINATION AND PUBLICATION CAPI COMPUTER ASSISTED PERSONNEL INTERVIEWINGCOORD. COORDINATIONCPD COORDINATION AND PUBLICATION DIVISIONCPI CONSUMER PRICE INDEXCSI CHIEF STATISTICIAN OF INDIACSO CENTRA STATISTICS OFFICE (Integrated with NSO on May 2019)DDG DEPUTY DIRECTOR GENERALDG DIRECTOR GENERALDIID DATA INFORMATICS AND INNAVATION DIVISION (Established DSDD /Computer Centre)DIR DIRECTORDPD DATA PROCESSING DIVISIONDQAD DATA QUALITY AND ASSURANCE DIVISIONDS DEPUTY SECRETARYESD ECONOMIC STATISTIC DIVISIONFOD FIELD OPERATION DIVISIONGDP GROSS DOMESTIC PRODUCTHO HEAD OF OFFICEHOD HEAD OF DEPARTMENTICT INTERNATIONAL COORDINATION AND TRAININGIIP INDEX OF INDUSTRIAL PRODUCTIONIPMD INFRASTRUCTURE AND PROJECT MONITORING DIVISIONIS WING INDUSTRIAL STATISTICS WINGISI INDIAN STATISTICAL INSTITUTEISS INDIAN STATISTICAL SERVICEJD JOINT DIRECTORMDGP MILLENNIUM DEVELOPMENT GOALSMPLADS MEMBER OF PARLIAMENT AND LOCAL AREA DEVELOPMENT SCHEMENAD NATIONAL ACCOUNTS DIVISIONNSC NATIONAL STATISTICAL COMMISIONNSSO NATIONAL SAMPLE SURVEY OFFICE (Integrated with NSO on May 2019)OCMS ONLINE COMPUTERISE MONITORING SYSTEMOL OFFICIAL LANGUAGEPAO PAY AND ACCOUNT OFFICEPCL PRICE AND COST OF LIVINGPG PUBLIC GRIEVANCESPLFS PERIODIC LABOUR FORCE SURVEYRTI RIGHT TO INFORMATIONSC/ST SCHEDULED CASTE/SCHEDULED TRIBESCD SURVEY COORDINATION DIVISIONSDG SUSTAINABLE DEVELOPMENT GOALSDP STATE DOMESTIC PRODUCTSDRD SURVEY DESIGN AND RESEARCH DIVISIONSIAP STATISTICAL INSTITUTE FOR ASIA AND THE PACIFICSSD SOCIAL STATISTICS DIVISIONSSS SUBORDINATE STATISTICAL SERVICETRG TRAININGUS UNDER SECRETARY
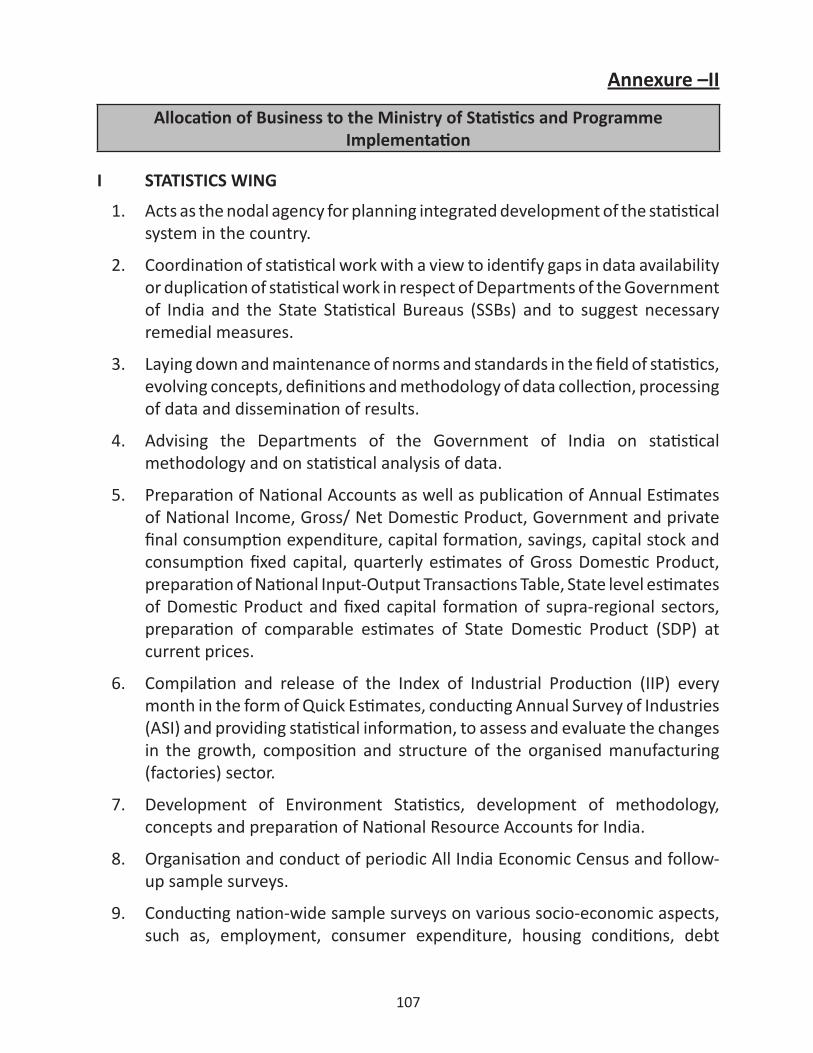
107
Annexure –II
Allocation of Business to the Ministry of Statistics and Programme Implementation
I STATISTICS WING
1. Acts as the nodal agency for planning integrated development of the statistical system in the country.
2. Coordination of statistical work with a view to identify gaps in data availability or duplication of statistical work in respect of Departments of the Government of India and the State Statistical Bureaus (SSBs) and to suggest necessary remedial measures.
3. Laying down and maintenance of norms and standards in the field of statistics, evolving concepts, definitions and methodology of data collection, processing of data and dissemination of results.
4. Advising the Departments of the Government of India on statistical methodology and on statistical analysis of data.
5. Preparation of National Accounts as well as publication of Annual Estimates of National Income, Gross/ Net Domestic Product, Government and private final consumption expenditure, capital formation, savings, capital stock and consumption fixed capital, quarterly estimates of Gross Domestic Product, preparation of National Input-Output Transactions Table, State level estimates of Domestic Product and fixed capital formation of supra-regional sectors, preparation of comparable estimates of State Domestic Product (SDP) at current prices.
6. Compilation and release of the Index of Industrial Production (IIP) every month in the form of Quick Estimates, conducting Annual Survey of Industries (ASI) and providing statistical information, to assess and evaluate the changes in the growth, composition and structure of the organised manufacturing (factories) sector.
7. Development of Environment Statistics, development of methodology, concepts and preparation of National Resource Accounts for India.
8. Organisation and conduct of periodic All India Economic Census and follow-up sample surveys.
9. Conducting nation-wide sample surveys on various socio-economic aspects, such as, employment, consumer expenditure, housing conditions, debt
108
and investment, land and livestock holdings, literacy, education, health, family welfare, un-organised manufacturing and services etc, to provide the database needed for development, research, policy formulation and economic planning.
10. Conducting quality checks and auditing of statistical surveys and data sets through technical scrutiny and sample checks and generate correction factors and alternative estimates, if required.
11. Undertaking the processing of survey data collected through various socio-economic surveys and follow up surveys of Economic Census and Annual Survey of Industries by the National Sample Survey Office and the Central Statistical Office.
12. Dissemination of statistical information through a number of regular or adhoc publications to Government, semi-Government or private data users/agencies and dissemination of data, on request, to United Nations Agencies like United Nations Statistics Division, Economic and Social Commission for Asia and the Pacific, International Labour Organisation and other relevant international agencies.
13. Giving grants-in-aid to registered non-governmental organisations and research institutions of repute for undertaking special studies or surveys, printing of statistical reports and finance seminars, workshops or conferences relating to different subject areas of official statistics.
14. Functioning as the Cadre Controlling Authority and dealing with all aspects of managing the Indian Statistical Service including all matters pertaining to training, career planning and manpower planning.
15. The Indian Statistical Institute and ensuring its functioning in accordance with the provisions of the Indian Statistical Institute Act, 1959 (57 of 1959).
16. Compilation and release of monthly Consumer Price Index Numbers for Urban Non-Manual Employees.
17. Undertaking methodological studies and pilot surveys for evolving better sampling techniques and estimation procedures including small area estimates.
18. Monitoring of Twenty Point Programme.
19. Monitoring of projects of `150 crores and above.
20. Monitoring of the performance of Infrastructure Sectors
21. Member of Parliament Local Area Development Scheme (MPLADS).
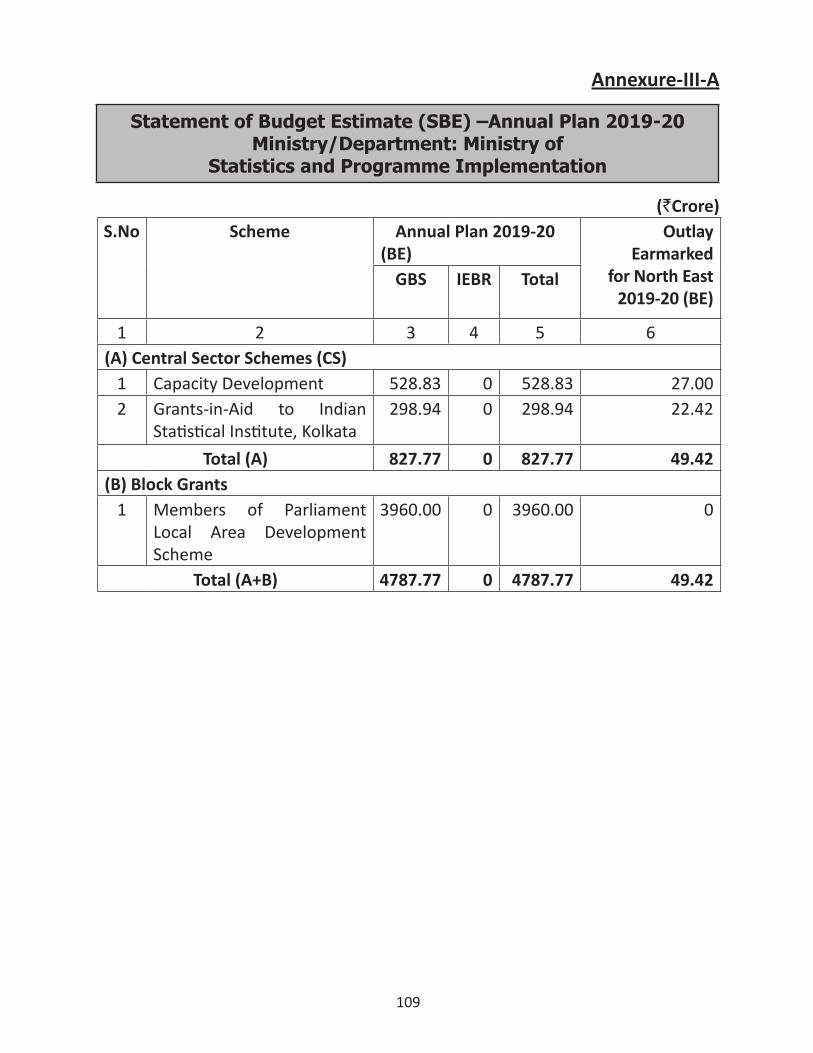
109
Annexure-III-A
Statement of Budget Estimate (SBE) –Annual Plan 2019-20Ministry/Department: Ministry of
Statistics and Programme Implementation
(`Crore)S.No Scheme Annual Plan 2019-20
(BE)Outlay
Earmarked for North East
2019-20 (BE)GBS IEBR Total
1 2 3 4 5 6(A) Central Sector Schemes (CS)
1 Capacity Development 528.83 0 528.83 27.002 Grants-in-Aid to Indian
Statistical Institute, Kolkata298.94 0 298.94 22.42
Total (A) 827.77 0 827.77 49.42(B) Block Grants
1 Members of Parliament Local Area Development Scheme
3960.00 0 3960.00 0
Total (A+B) 4787.77 0 4787.77 49.42
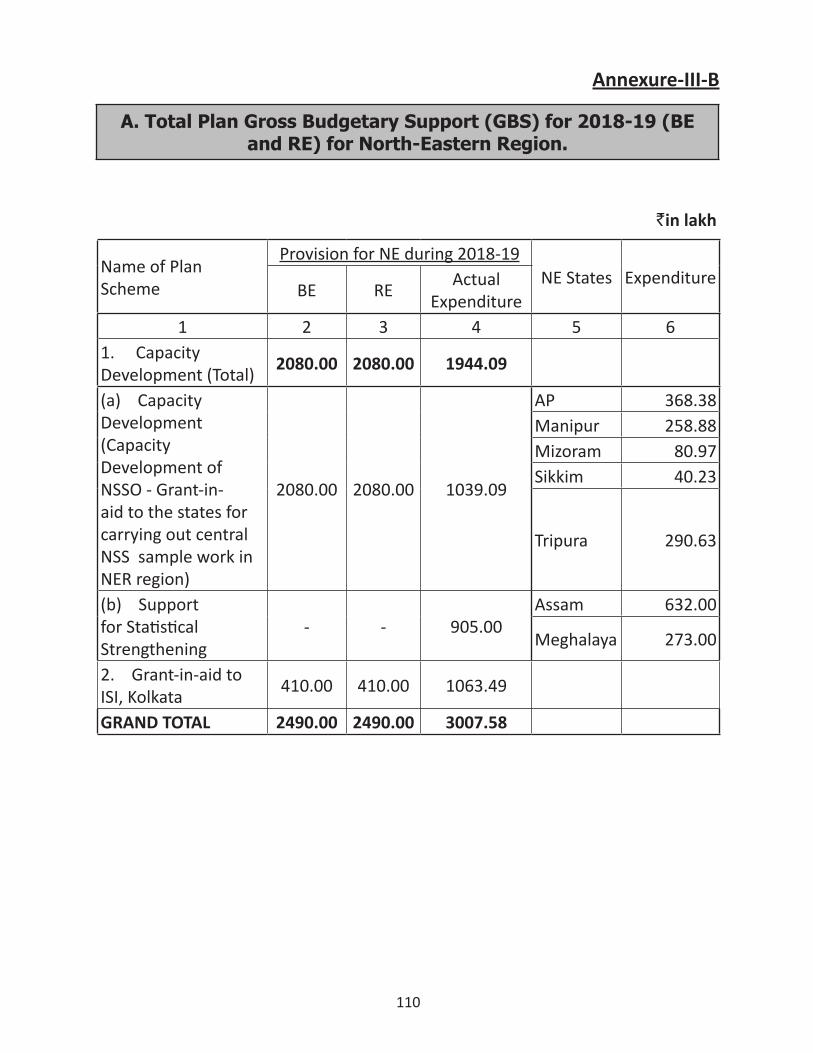
110
Annexure-III-B
A. Total Plan Gross Budgetary Support (GBS) for 2018-19 (BE and RE) for North-Eastern Region.
`in lakh
Name of Plan Scheme
Provision for NE during 2018-19NE States Expenditure
BE RE Actual Expenditure
1 2 3 4 5 61. Capacity Development (Total) 2080.00 2080.00 1944.09 (a) Capacity Development (Capacity Development of NSSO - Grant-in-aid to the states for carrying out central NSS sample work in NER region)
2080.00 2080.00 1039.09
AP 368.38Manipur 258.88Mizoram 80.97Sikkim 40.23
Tripura 290.63
(b) Support for Statistical Strengthening
- - 905.00Assam 632.00
Meghalaya 273.00
2. Grant-in-aid to ISI, Kolkata 410.00 410.00 1063.49 GRAND TOTAL 2490.00 2490.00 3007.58
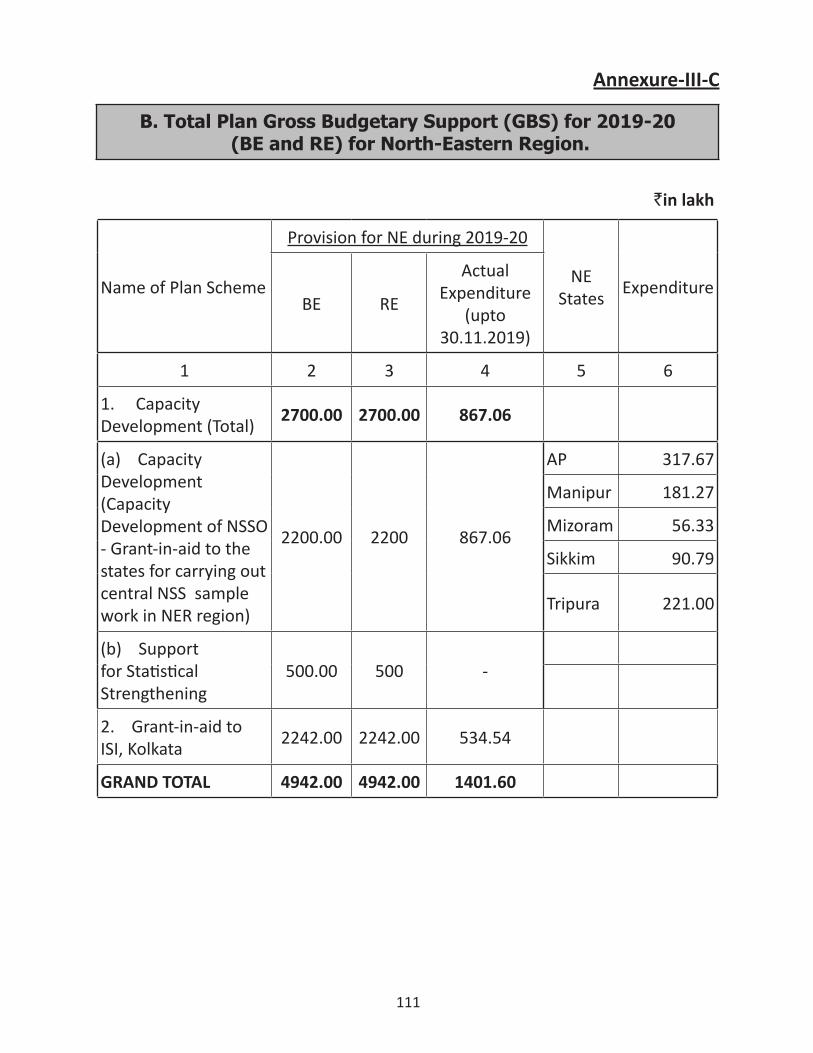
111
Annexure-III-C
B. Total Plan Gross Budgetary Support (GBS) for 2019-20 (BE and RE) for North-Eastern Region.
`in lakh
Name of Plan Scheme
Provision for NE during 2019-20
NE States Expenditure
BE RE
Actual Expenditure
(upto 30.11.2019)
1 2 3 4 5 6
1. Capacity Development (Total) 2700.00 2700.00 867.06
(a) Capacity Development (Capacity Development of NSSO - Grant-in-aid to the states for carrying out central NSS sample work in NER region)
2200.00 2200 867.06
AP 317.67
Manipur 181.27
Mizoram 56.33
Sikkim 90.79
Tripura 221.00
(b) Support for Statistical Strengthening
500.00 500 -
2. Grant-in-aid to ISI, Kolkata 2242.00 2242.00 534.54
GRAND TOTAL 4942.00 4942.00 1401.60
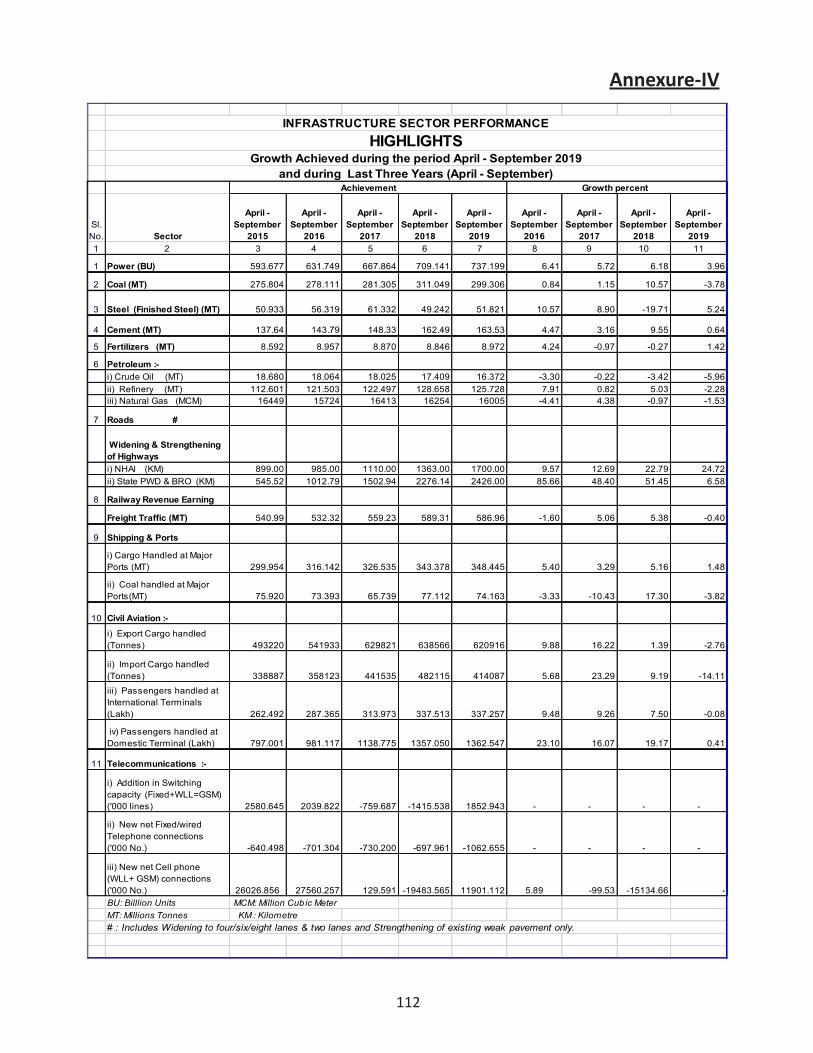
112
Annexure-IV
Sl.No. Sector
April - September
2015
April - September
2016
April - September
2017
April - September
2018
April - September
2019
April - September
2016
April -September
2017
April -September
2018
April - September
20191 2 3 4 5 6 7 8 9 10 11
1 Power (BU) 593.677 631.749 667.864 709.141 737.199 6.41 5.72 6.18 3.96
2 Coal (MT) 275.804 278.111 281.305 311.049 299.306 0.84 1.15 10.57 -3.78
3 Steel (Finished Steel) (MT) 50.933 56.319 61.332 49.242 51.821 10.57 8.90 -19.71 5.24
4 Cement (MT) 137.64 143.79 148.33 162.49 163.53 4.47 3.16 9.55 0.64
5 Fertilizers (MT) 8.592 8.957 8.870 8.846 8.972 4.24 -0.97 -0.27 1.42
6 Petroleum :-i) Crude Oil (MT) 18.680 18.064 18.025 17.409 16.372 -3.30 -0.22 -3.42 -5.96ii) Refinery (MT) 112.601 121.503 122.497 128.658 125.728 7.91 0.82 5.03 -2.28iii) Natural Gas (MCM) 16449 15724 16413 16254 16005 -4.41 4.38 -0.97 -1.53
7 Roads #
Widening & Strengthening of Highways i) NHAI (KM) 899.00 985.00 1110.00 1363.00 1700.00 9.57 12.69 22.79 24.72ii) State PWD & BRO (KM) 545.52 1012.79 1502.94 2276.14 2426.00 85.66 48.40 51.45 6.58
8 Railway Revenue Earning
Freight Traffic (MT) 540.99 532.32 559.23 589.31 586.96 -1.60 5.06 5.38 -0.40
9 Shipping & Ports
i) Cargo Handled at Major Ports (MT) 299.954 316.142 326.535 343.378 348.445 5.40 3.29 5.16 1.48
ii) Coal handled at Major Ports(MT) 75.920 73.393 65.739 77.112 74.163 -3.33 -10.43 17.30 -3.82
10 Civil Aviation :-
i) Export Cargo handled (Tonnes) 493220 541933 629821 638566 620916 9.88 16.22 1.39 -2.76
ii) Import Cargo handled (Tonnes) 338887 358123 441535 482115 414087 5.68 23.29 9.19 -14.11iii) Passengers handled at International Terminals (Lakh) 262.492 287.365 313.973 337.513 337.257 9.48 9.26 7.50 -0.08
iv) Passengers handled at Domestic Terminal (Lakh) 797.001 981.117 1138.775 1357.050 1362.547 23.10 16.07 19.17 0.41
11 Telecommunications :-
i) Addition in Switching capacity (Fixed+WLL=GSM) ('000 lines) 2580.645 2039.822 -759.687 -1415.538 1852.943 - - - -
ii) New net Fixed/wired Telephone connections ('000 No.) -640.498 -701.304 -730.200 -697.961 -1062.655 - - - -
iii) New net Cell phone (WLL+ GSM) connections ('000 No.) 26026.856 27560.257 129.591 -19483.565 11901.112 5.89 -99.53 -15134.66 -BU: Billlion UnitsMT: Millions Tonnes KM : Kilometre# : Includes Widening to four/six/eight lanes & two lanes and Strengthening of existing weak pavement only.
MCM: Million Cubic Meter
INFRASTRUCTURE SECTOR PERFORMANCE
and during Last Three Years (April - September)Achievement Growth percent
HIGHLIGHTSGrowth Achieved during the period April - September 2019
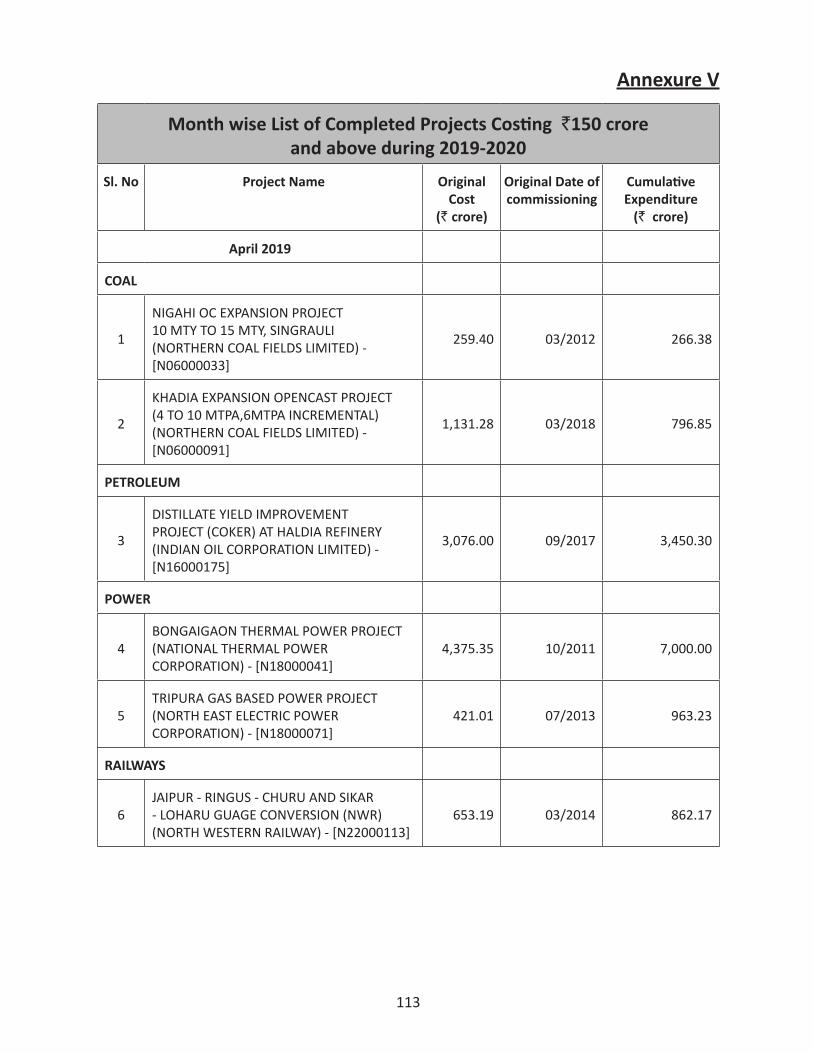
113
Annexure V
Month wise List of Completed Projects Costing `150 crore and above during 2019-2020
Sl. No Project Name Original Cost
(`crore)
Original Date of commissioning
Cumulative Expenditure
(` crore)
April 2019
COAL
1
NIGAHI OC EXPANSION PROJECT 10 MTY TO 15 MTY, SINGRAULI (NORTHERN COAL FIELDS LIMITED) - [N06000033]
259.40 03/2012 266.38
2
KHADIA EXPANSION OPENCAST PROJECT (4 TO 10 MTPA,6MTPA INCREMENTAL) (NORTHERN COAL FIELDS LIMITED) - [N06000091]
1,131.28 03/2018 796.85
PETROLEUM
3
DISTILLATE YIELD IMPROVEMENT PROJECT (COKER) AT HALDIA REFINERY (INDIAN OIL CORPORATION LIMITED) - [N16000175]
3,076.00 09/2017 3,450.30
POWER
4BONGAIGAON THERMAL POWER PROJECT (NATIONAL THERMAL POWER CORPORATION) - [N18000041]
4,375.35 10/2011 7,000.00
5TRIPURA GAS BASED POWER PROJECT (NORTH EAST ELECTRIC POWER CORPORATION) - [N18000071]
421.01 07/2013 963.23
RAILWAYS
6JAIPUR - RINGUS - CHURU AND SIKAR - LOHARU GUAGE CONVERSION (NWR) (NORTH WESTERN RAILWAY) - [N22000113]
653.19 03/2014 862.17
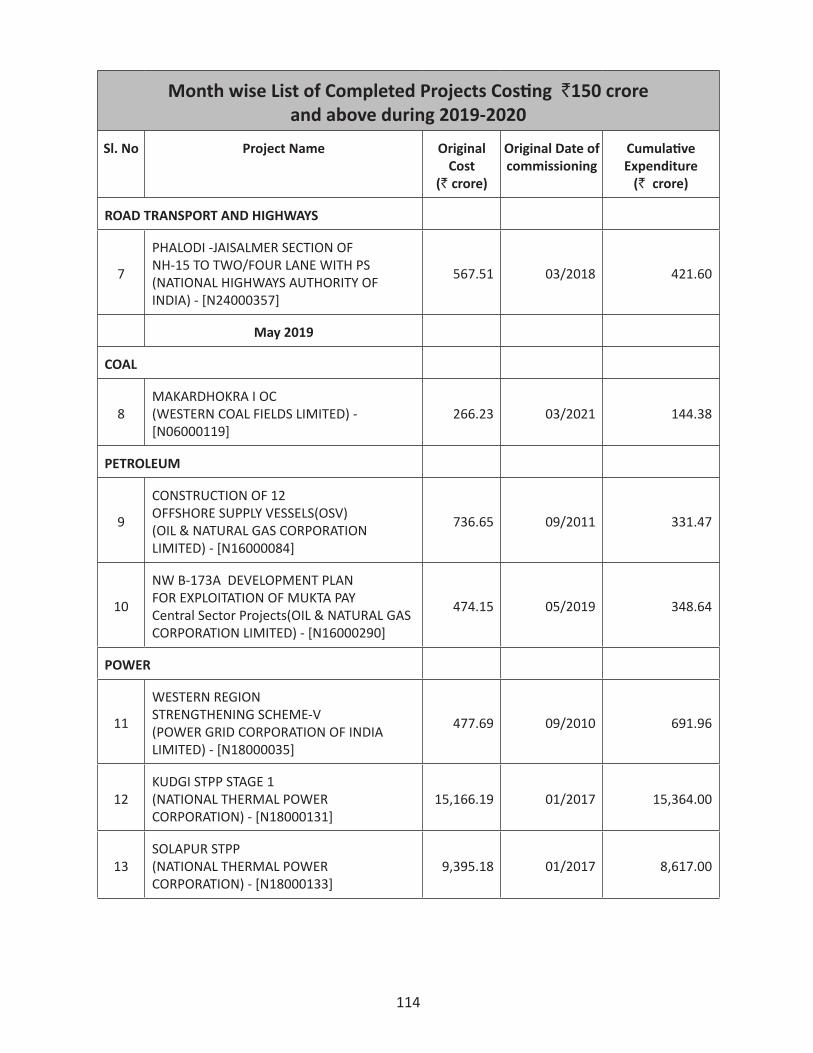
114
Month wise List of Completed Projects Costing `150 crore and above during 2019-2020
Sl. No Project Name Original Cost
(`crore)
Original Date of commissioning
Cumulative Expenditure
(` crore)
ROAD TRANSPORT AND HIGHWAYS
7
PHALODI -JAISALMER SECTION OF NH-15 TO TWO/FOUR LANE WITH PS (NATIONAL HIGHWAYS AUTHORITY OF INDIA) - [N24000357]
567.51 03/2018 421.60
May 2019
COAL
8MAKARDHOKRA I OC (WESTERN COAL FIELDS LIMITED) - [N06000119]
266.23 03/2021 144.38
PETROLEUM
9
CONSTRUCTION OF 12 OFFSHORE SUPPLY VESSELS(OSV) (OIL & NATURAL GAS CORPORATION LIMITED) - [N16000084]
736.65 09/2011 331.47
10
NW B-173A DEVELOPMENT PLAN FOR EXPLOITATION OF MUKTA PAY Central Sector Projects(OIL & NATURAL GAS CORPORATION LIMITED) - [N16000290]
474.15 05/2019 348.64
POWER
11
WESTERN REGION STRENGTHENING SCHEME-V (POWER GRID CORPORATION OF INDIA LIMITED) - [N18000035]
477.69 09/2010 691.96
12KUDGI STPP STAGE 1 (NATIONAL THERMAL POWER CORPORATION) - [N18000131]
15,166.19 01/2017 15,364.00
13SOLAPUR STPP (NATIONAL THERMAL POWER CORPORATION) - [N18000133]
9,395.18 01/2017 8,617.00
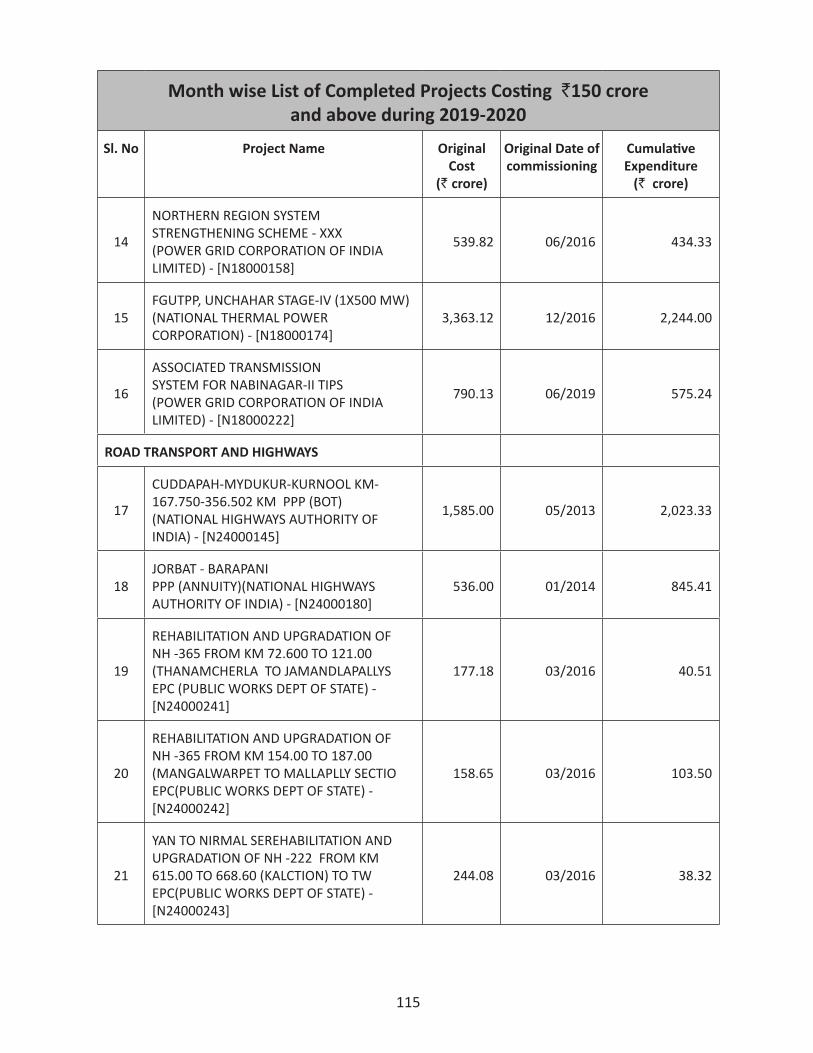
115
Month wise List of Completed Projects Costing `150 crore and above during 2019-2020
Sl. No Project Name Original Cost
(`crore)
Original Date of commissioning
Cumulative Expenditure
(` crore)
14
NORTHERN REGION SYSTEM STRENGTHENING SCHEME - XXX (POWER GRID CORPORATION OF INDIA LIMITED) - [N18000158]
539.82 06/2016 434.33
15FGUTPP, UNCHAHAR STAGE-IV (1X500 MW) (NATIONAL THERMAL POWER CORPORATION) - [N18000174]
3,363.12 12/2016 2,244.00
16
ASSOCIATED TRANSMISSION SYSTEM FOR NABINAGAR-II TIPS (POWER GRID CORPORATION OF INDIA LIMITED) - [N18000222]
790.13 06/2019 575.24
ROAD TRANSPORT AND HIGHWAYS
17
CUDDAPAH-MYDUKUR-KURNOOL KM-167.750-356.502 KM PPP (BOT)(NATIONAL HIGHWAYS AUTHORITY OF INDIA) - [N24000145]
1,585.00 05/2013 2,023.33
18JORBAT - BARAPANI PPP (ANNUITY)(NATIONAL HIGHWAYS AUTHORITY OF INDIA) - [N24000180]
536.00 01/2014 845.41
19
REHABILITATION AND UPGRADATION OF NH -365 FROM KM 72.600 TO 121.00 (THANAMCHERLA TO JAMANDLAPALLYS EPC (PUBLIC WORKS DEPT OF STATE) - [N24000241]
177.18 03/2016 40.51
20
REHABILITATION AND UPGRADATION OF NH -365 FROM KM 154.00 TO 187.00 (MANGALWARPET TO MALLAPLLY SECTIO EPC(PUBLIC WORKS DEPT OF STATE) - [N24000242]
158.65 03/2016 103.50
21
YAN TO NIRMAL SEREHABILITATION AND UPGRADATION OF NH -222 FROM KM 615.00 TO 668.60 (KALCTION) TO TW EPC(PUBLIC WORKS DEPT OF STATE) - [N24000243]
244.08 03/2016 38.32
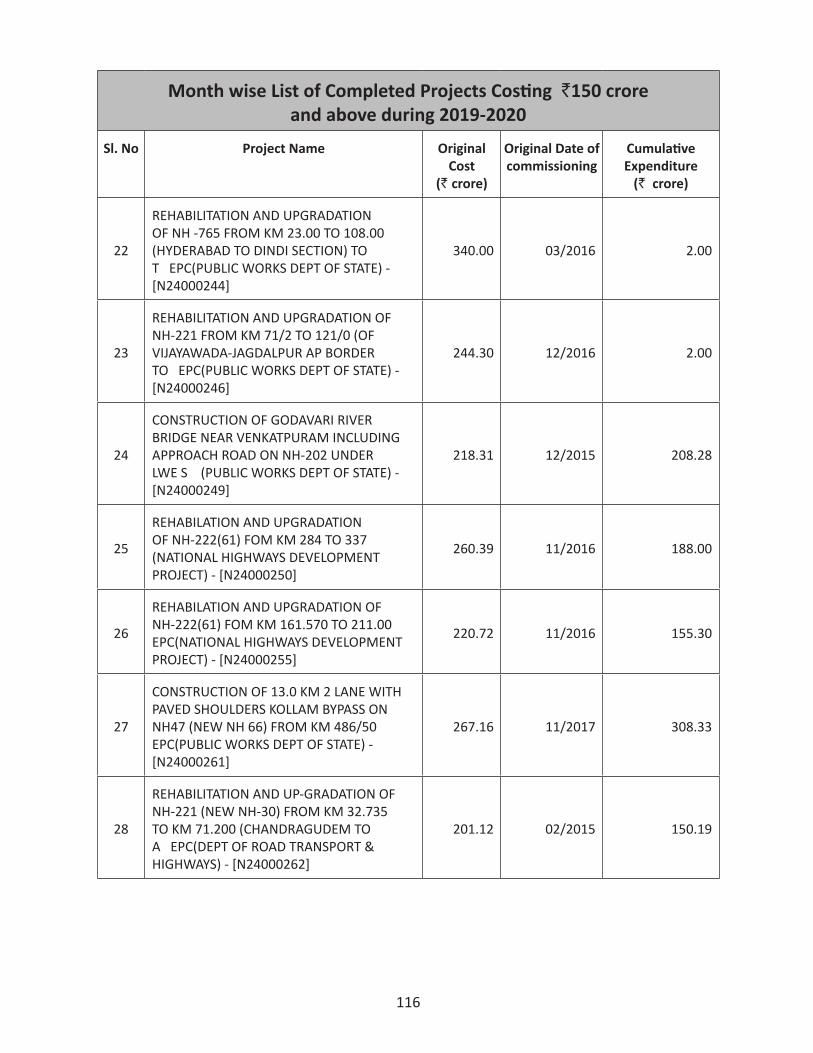
116
Month wise List of Completed Projects Costing `150 crore and above during 2019-2020
Sl. No Project Name Original Cost
(`crore)
Original Date of commissioning
Cumulative Expenditure
(` crore)
22
REHABILITATION AND UPGRADATION OF NH -765 FROM KM 23.00 TO 108.00 (HYDERABAD TO DINDI SECTION) TO T EPC(PUBLIC WORKS DEPT OF STATE) - [N24000244]
340.00 03/2016 2.00
23
REHABILITATION AND UPGRADATION OF NH-221 FROM KM 71/2 TO 121/0 (OF VIJAYAWADA-JAGDALPUR AP BORDER TO EPC(PUBLIC WORKS DEPT OF STATE) - [N24000246]
244.30 12/2016 2.00
24
CONSTRUCTION OF GODAVARI RIVER BRIDGE NEAR VENKATPURAM INCLUDING APPROACH ROAD ON NH-202 UNDER LWE S (PUBLIC WORKS DEPT OF STATE) - [N24000249]
218.31 12/2015 208.28
25
REHABILATION AND UPGRADATION OF NH-222(61) FOM KM 284 TO 337 (NATIONAL HIGHWAYS DEVELOPMENT PROJECT) - [N24000250]
260.39 11/2016 188.00
26
REHABILATION AND UPGRADATION OF NH-222(61) FOM KM 161.570 TO 211.00 EPC(NATIONAL HIGHWAYS DEVELOPMENT PROJECT) - [N24000255]
220.72 11/2016 155.30
27
CONSTRUCTION OF 13.0 KM 2 LANE WITH PAVED SHOULDERS KOLLAM BYPASS ON NH47 (NEW NH 66) FROM KM 486/50 EPC(PUBLIC WORKS DEPT OF STATE) - [N24000261]
267.16 11/2017 308.33
28
REHABILITATION AND UP-GRADATION OF NH-221 (NEW NH-30) FROM KM 32.735 TO KM 71.200 (CHANDRAGUDEM TO A EPC(DEPT OF ROAD TRANSPORT & HIGHWAYS) - [N24000262]
201.12 02/2015 150.19
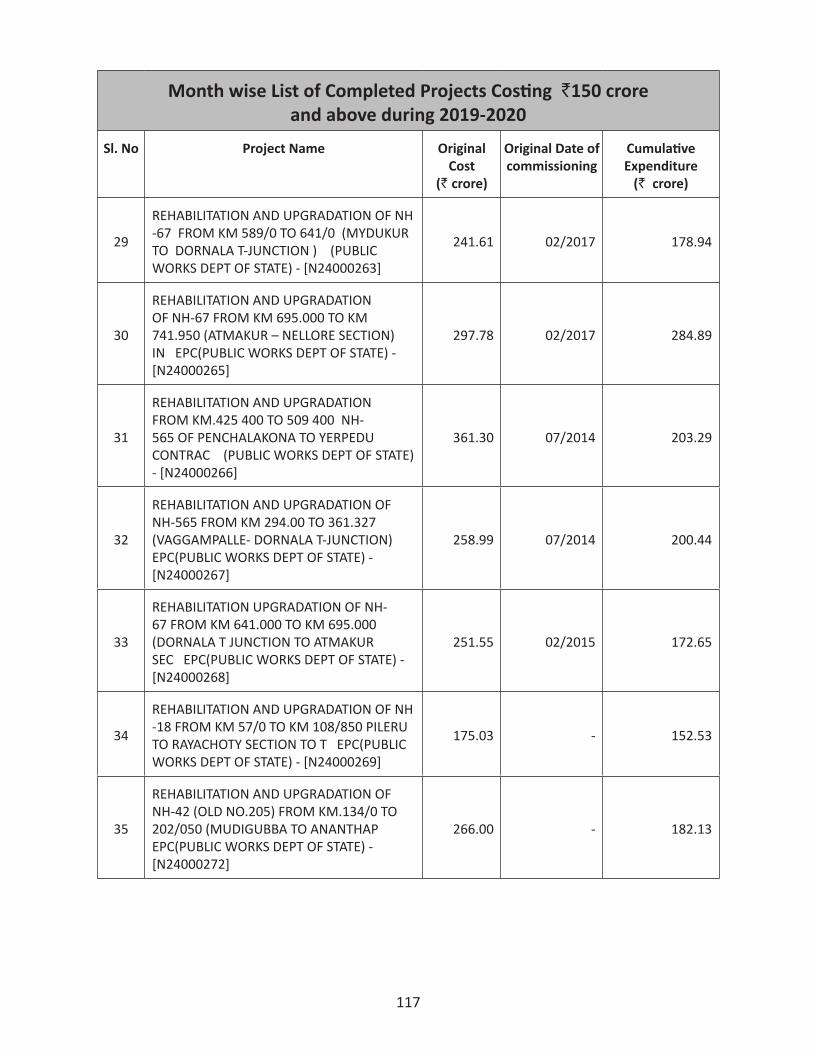
117
Month wise List of Completed Projects Costing `150 crore and above during 2019-2020
Sl. No Project Name Original Cost
(`crore)
Original Date of commissioning
Cumulative Expenditure
(` crore)
29
REHABILITATION AND UPGRADATION OF NH -67 FROM KM 589/0 TO 641/0 (MYDUKUR TO DORNALA T-JUNCTION ) (PUBLIC WORKS DEPT OF STATE) - [N24000263]
241.61 02/2017 178.94
30
REHABILITATION AND UPGRADATION OF NH-67 FROM KM 695.000 TO KM 741.950 (ATMAKUR – NELLORE SECTION) IN EPC(PUBLIC WORKS DEPT OF STATE) - [N24000265]
297.78 02/2017 284.89
31
REHABILITATION AND UPGRADATION FROM KM.425 400 TO 509 400 NH-565 OF PENCHALAKONA TO YERPEDU CONTRAC (PUBLIC WORKS DEPT OF STATE) - [N24000266]
361.30 07/2014 203.29
32
REHABILITATION AND UPGRADATION OF NH-565 FROM KM 294.00 TO 361.327 (VAGGAMPALLE- DORNALA T-JUNCTION) EPC(PUBLIC WORKS DEPT OF STATE) - [N24000267]
258.99 07/2014 200.44
33
REHABILITATION UPGRADATION OF NH-67 FROM KM 641.000 TO KM 695.000 (DORNALA T JUNCTION TO ATMAKUR SEC EPC(PUBLIC WORKS DEPT OF STATE) - [N24000268]
251.55 02/2015 172.65
34
REHABILITATION AND UPGRADATION OF NH -18 FROM KM 57/0 TO KM 108/850 PILERU TO RAYACHOTY SECTION TO T EPC(PUBLIC WORKS DEPT OF STATE) - [N24000269]
175.03 - 152.53
35
REHABILITATION AND UPGRADATION OF NH-42 (OLD NO.205) FROM KM.134/0 TO 202/050 (MUDIGUBBA TO ANANTHAP EPC(PUBLIC WORKS DEPT OF STATE) - [N24000272]
266.00 - 182.13
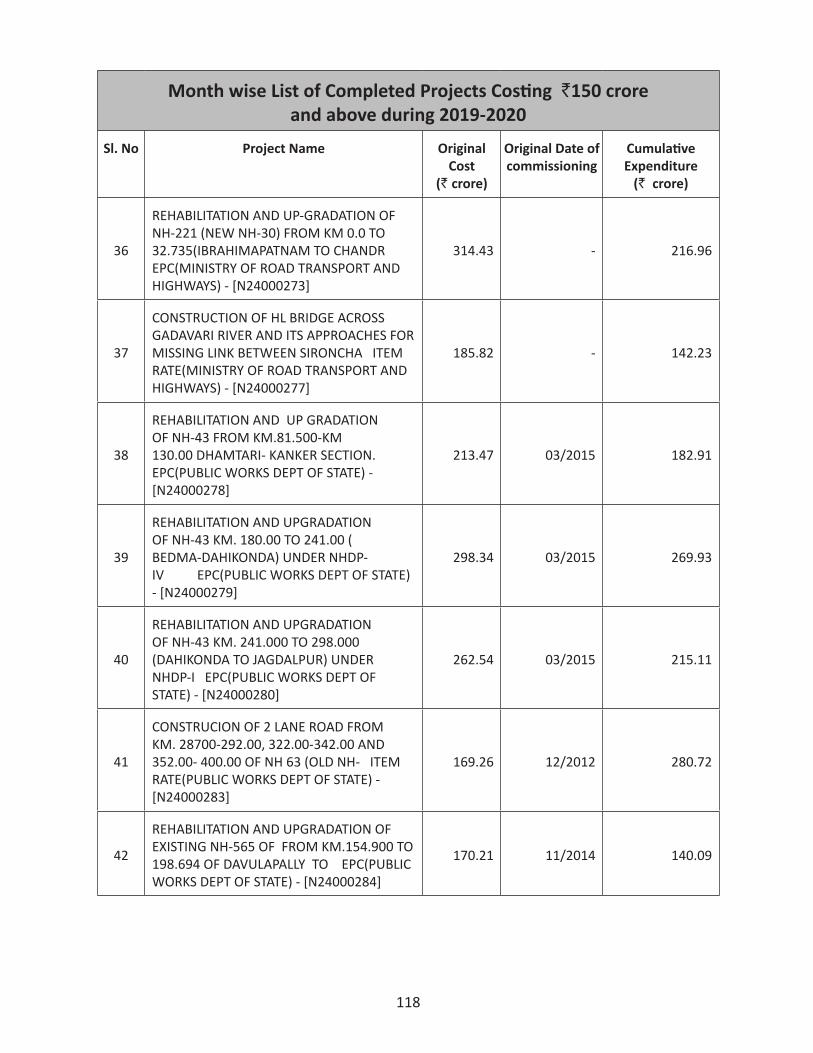
118
Month wise List of Completed Projects Costing `150 crore and above during 2019-2020
Sl. No Project Name Original Cost
(`crore)
Original Date of commissioning
Cumulative Expenditure
(` crore)
36
REHABILITATION AND UP-GRADATION OF NH-221 (NEW NH-30) FROM KM 0.0 TO 32.735(IBRAHIMAPATNAM TO CHANDR EPC(MINISTRY OF ROAD TRANSPORT AND HIGHWAYS) - [N24000273]
314.43 - 216.96
37
CONSTRUCTION OF HL BRIDGE ACROSS GADAVARI RIVER AND ITS APPROACHES FOR MISSING LINK BETWEEN SIRONCHA ITEM RATE(MINISTRY OF ROAD TRANSPORT AND HIGHWAYS) - [N24000277]
185.82 - 142.23
38
REHABILITATION AND UP GRADATION OF NH-43 FROM KM.81.500-KM 130.00 DHAMTARI- KANKER SECTION. EPC(PUBLIC WORKS DEPT OF STATE) - [N24000278]
213.47 03/2015 182.91
39
REHABILITATION AND UPGRADATION OF NH-43 KM. 180.00 TO 241.00 ( BEDMA-DAHIKONDA) UNDER NHDP-IV EPC(PUBLIC WORKS DEPT OF STATE) - [N24000279]
298.34 03/2015 269.93
40
REHABILITATION AND UPGRADATION OF NH-43 KM. 241.000 TO 298.000 (DAHIKONDA TO JAGDALPUR) UNDER NHDP-I EPC(PUBLIC WORKS DEPT OF STATE) - [N24000280]
262.54 03/2015 215.11
41
CONSTRUCION OF 2 LANE ROAD FROM KM. 28700-292.00, 322.00-342.00 AND 352.00- 400.00 OF NH 63 (OLD NH- ITEM RATE(PUBLIC WORKS DEPT OF STATE) - [N24000283]
169.26 12/2012 280.72
42
REHABILITATION AND UPGRADATION OF EXISTING NH-565 OF FROM KM.154.900 TO 198.694 OF DAVULAPALLY TO EPC(PUBLIC WORKS DEPT OF STATE) - [N24000284]
170.21 11/2014 140.09
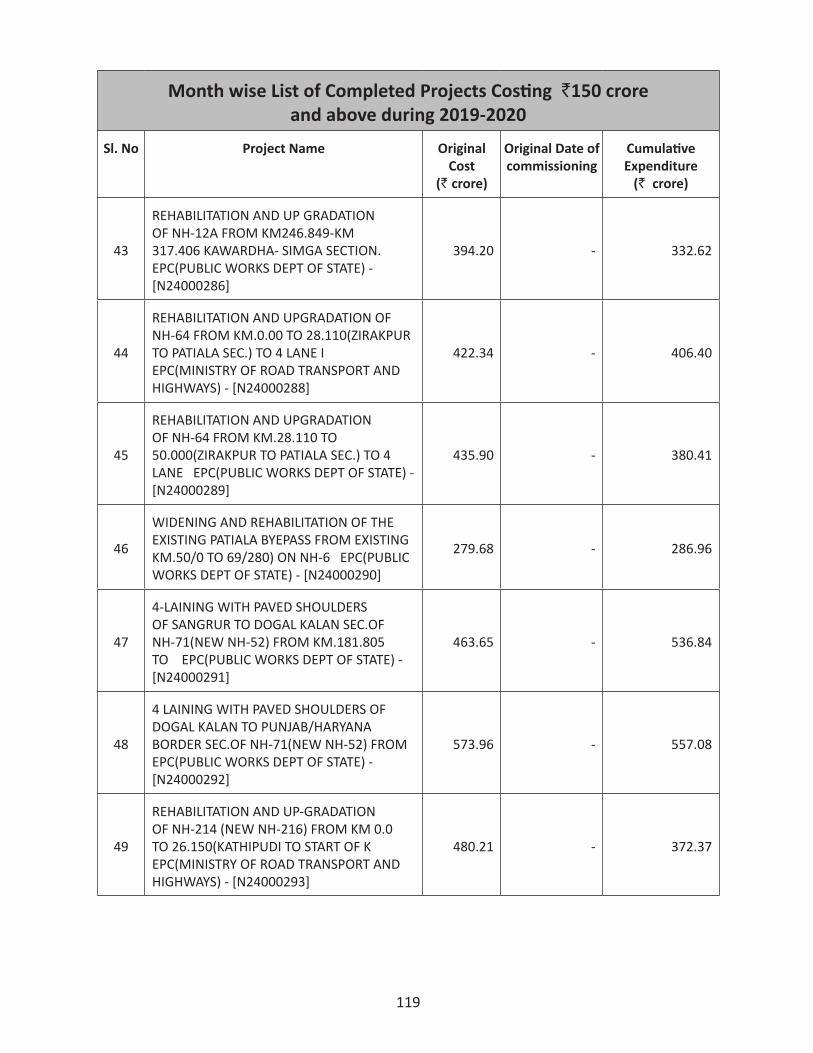
119
Month wise List of Completed Projects Costing `150 crore and above during 2019-2020
Sl. No Project Name Original Cost
(`crore)
Original Date of commissioning
Cumulative Expenditure
(` crore)
43
REHABILITATION AND UP GRADATION OF NH-12A FROM KM246.849-KM 317.406 KAWARDHA- SIMGA SECTION. EPC(PUBLIC WORKS DEPT OF STATE) - [N24000286]
394.20 - 332.62
44
REHABILITATION AND UPGRADATION OF NH-64 FROM KM.0.00 TO 28.110(ZIRAKPUR TO PATIALA SEC.) TO 4 LANE I EPC(MINISTRY OF ROAD TRANSPORT AND HIGHWAYS) - [N24000288]
422.34 - 406.40
45
REHABILITATION AND UPGRADATION OF NH-64 FROM KM.28.110 TO 50.000(ZIRAKPUR TO PATIALA SEC.) TO 4 LANE EPC(PUBLIC WORKS DEPT OF STATE) - [N24000289]
435.90 - 380.41
46
WIDENING AND REHABILITATION OF THE EXISTING PATIALA BYEPASS FROM EXISTING KM.50/0 TO 69/280) ON NH-6 EPC(PUBLIC WORKS DEPT OF STATE) - [N24000290]
279.68 - 286.96
47
4-LAINING WITH PAVED SHOULDERS OF SANGRUR TO DOGAL KALAN SEC.OF NH-71(NEW NH-52) FROM KM.181.805 TO EPC(PUBLIC WORKS DEPT OF STATE) - [N24000291]
463.65 - 536.84
48
4 LAINING WITH PAVED SHOULDERS OF DOGAL KALAN TO PUNJAB/HARYANA BORDER SEC.OF NH-71(NEW NH-52) FROM EPC(PUBLIC WORKS DEPT OF STATE) - [N24000292]
573.96 - 557.08
49
REHABILITATION AND UP-GRADATION OF NH-214 (NEW NH-216) FROM KM 0.0 TO 26.150(KATHIPUDI TO START OF K EPC(MINISTRY OF ROAD TRANSPORT AND HIGHWAYS) - [N24000293]
480.21 - 372.37
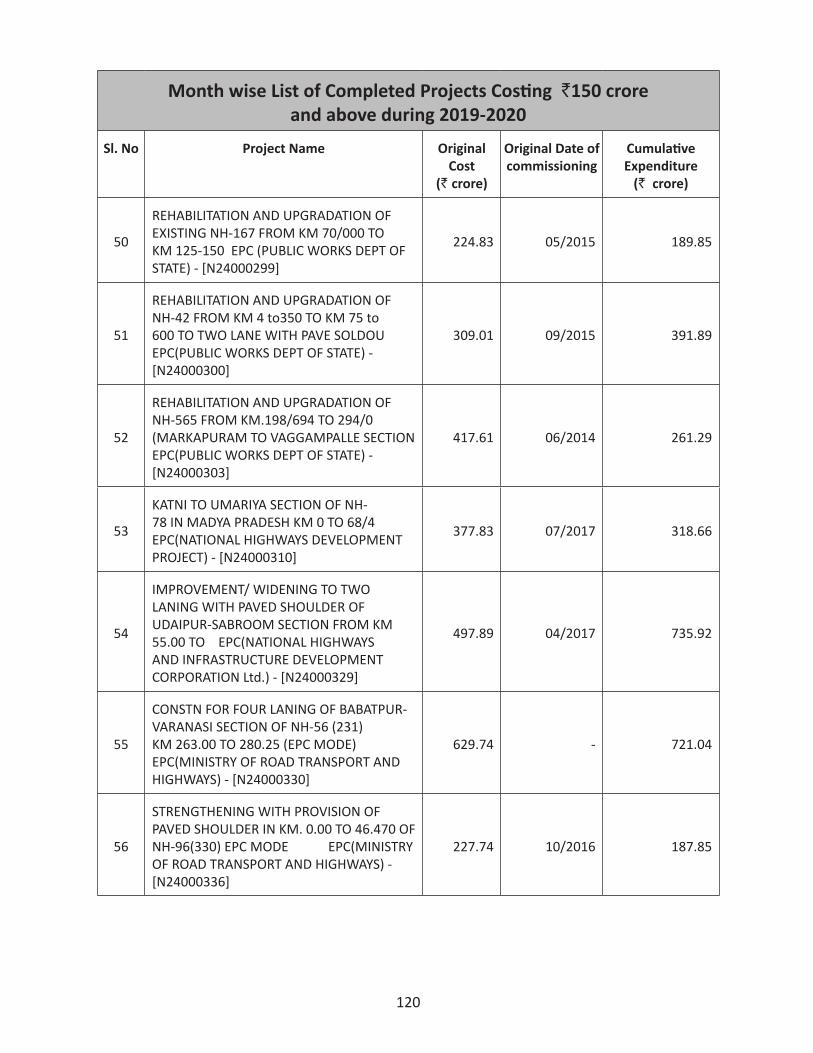
120
Month wise List of Completed Projects Costing `150 crore and above during 2019-2020
Sl. No Project Name Original Cost
(`crore)
Original Date of commissioning
Cumulative Expenditure
(` crore)
50
REHABILITATION AND UPGRADATION OF EXISTING NH-167 FROM KM 70/000 TO KM 125-150 EPC (PUBLIC WORKS DEPT OF STATE) - [N24000299]
224.83 05/2015 189.85
51
REHABILITATION AND UPGRADATION OF NH-42 FROM KM 4 to350 TO KM 75 to 600 TO TWO LANE WITH PAVE SOLDOU EPC(PUBLIC WORKS DEPT OF STATE) - [N24000300]
309.01 09/2015 391.89
52
REHABILITATION AND UPGRADATION OF NH-565 FROM KM.198/694 TO 294/0 (MARKAPURAM TO VAGGAMPALLE SECTION EPC(PUBLIC WORKS DEPT OF STATE) - [N24000303]
417.61 06/2014 261.29
53
KATNI TO UMARIYA SECTION OF NH-78 IN MADYA PRADESH KM 0 TO 68/4 EPC(NATIONAL HIGHWAYS DEVELOPMENT PROJECT) - [N24000310]
377.83 07/2017 318.66
54
IMPROVEMENT/ WIDENING TO TWO LANING WITH PAVED SHOULDER OF UDAIPUR-SABROOM SECTION FROM KM 55.00 TO EPC(NATIONAL HIGHWAYS AND INFRASTRUCTURE DEVELOPMENT CORPORATION Ltd.) - [N24000329]
497.89 04/2017 735.92
55
CONSTN FOR FOUR LANING OF BABATPUR-VARANASI SECTION OF NH-56 (231) KM 263.00 TO 280.25 (EPC MODE) EPC(MINISTRY OF ROAD TRANSPORT AND HIGHWAYS) - [N24000330]
629.74 - 721.04
56
STRENGTHENING WITH PROVISION OF PAVED SHOULDER IN KM. 0.00 TO 46.470 OF NH-96(330) EPC MODE EPC(MINISTRY OF ROAD TRANSPORT AND HIGHWAYS) - [N24000336]
227.74 10/2016 187.85
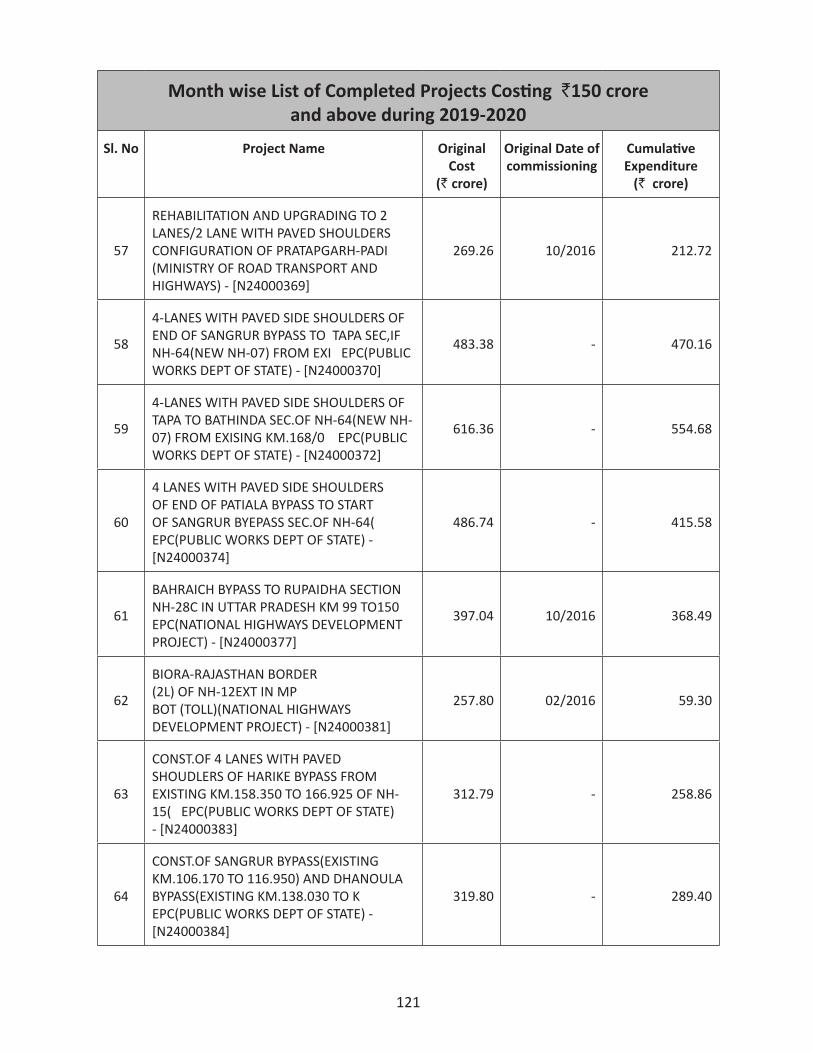
121
Month wise List of Completed Projects Costing `150 crore and above during 2019-2020
Sl. No Project Name Original Cost
(`crore)
Original Date of commissioning
Cumulative Expenditure
(` crore)
57
REHABILITATION AND UPGRADING TO 2 LANES/2 LANE WITH PAVED SHOULDERS CONFIGURATION OF PRATAPGARH-PADI (MINISTRY OF ROAD TRANSPORT AND HIGHWAYS) - [N24000369]
269.26 10/2016 212.72
58
4-LANES WITH PAVED SIDE SHOULDERS OF END OF SANGRUR BYPASS TO TAPA SEC,IF NH-64(NEW NH-07) FROM EXI EPC(PUBLIC WORKS DEPT OF STATE) - [N24000370]
483.38 - 470.16
59
4-LANES WITH PAVED SIDE SHOULDERS OF TAPA TO BATHINDA SEC.OF NH-64(NEW NH-07) FROM EXISING KM.168/0 EPC(PUBLIC WORKS DEPT OF STATE) - [N24000372]
616.36 - 554.68
60
4 LANES WITH PAVED SIDE SHOULDERS OF END OF PATIALA BYPASS TO START OF SANGRUR BYEPASS SEC.OF NH-64( EPC(PUBLIC WORKS DEPT OF STATE) - [N24000374]
486.74 - 415.58
61
BAHRAICH BYPASS TO RUPAIDHA SECTION NH-28C IN UTTAR PRADESH KM 99 TO150 EPC(NATIONAL HIGHWAYS DEVELOPMENT PROJECT) - [N24000377]
397.04 10/2016 368.49
62
BIORA-RAJASTHAN BORDER (2L) OF NH-12EXT IN MP BOT (TOLL)(NATIONAL HIGHWAYS DEVELOPMENT PROJECT) - [N24000381]
257.80 02/2016 59.30
63
CONST.OF 4 LANES WITH PAVED SHOUDLERS OF HARIKE BYPASS FROM EXISTING KM.158.350 TO 166.925 OF NH-15( EPC(PUBLIC WORKS DEPT OF STATE) - [N24000383]
312.79 - 258.86
64
CONST.OF SANGRUR BYPASS(EXISTING KM.106.170 TO 116.950) AND DHANOULA BYPASS(EXISTING KM.138.030 TO K EPC(PUBLIC WORKS DEPT OF STATE) - [N24000384]
319.80 - 289.40
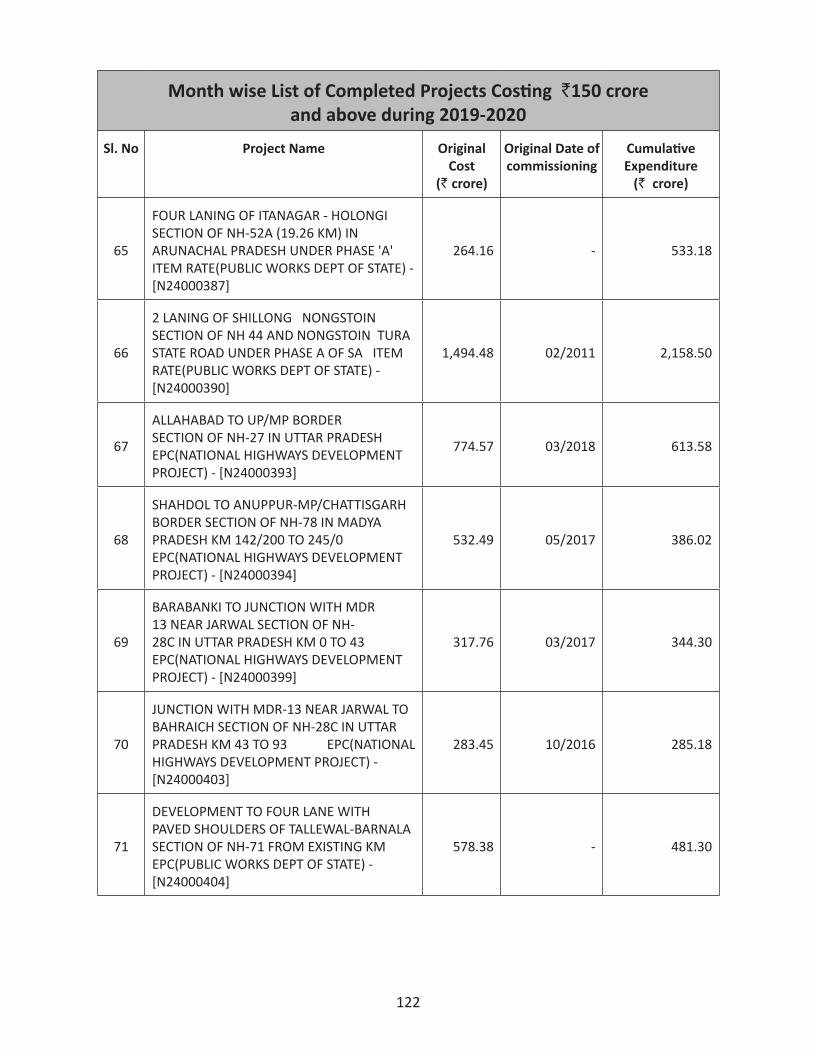
122
Month wise List of Completed Projects Costing `150 crore and above during 2019-2020
Sl. No Project Name Original Cost
(`crore)
Original Date of commissioning
Cumulative Expenditure
(` crore)
65
FOUR LANING OF ITANAGAR - HOLONGI SECTION OF NH-52A (19.26 KM) IN ARUNACHAL PRADESH UNDER PHASE 'A' ITEM RATE(PUBLIC WORKS DEPT OF STATE) - [N24000387]
264.16 - 533.18
66
2 LANING OF SHILLONG NONGSTOIN SECTION OF NH 44 AND NONGSTOIN TURA STATE ROAD UNDER PHASE A OF SA ITEM RATE(PUBLIC WORKS DEPT OF STATE) - [N24000390]
1,494.48 02/2011 2,158.50
67
ALLAHABAD TO UP/MP BORDER SECTION OF NH-27 IN UTTAR PRADESH EPC(NATIONAL HIGHWAYS DEVELOPMENT PROJECT) - [N24000393]
774.57 03/2018 613.58
68
SHAHDOL TO ANUPPUR-MP/CHATTISGARH BORDER SECTION OF NH-78 IN MADYA PRADESH KM 142/200 TO 245/0 EPC(NATIONAL HIGHWAYS DEVELOPMENT PROJECT) - [N24000394]
532.49 05/2017 386.02
69
BARABANKI TO JUNCTION WITH MDR 13 NEAR JARWAL SECTION OF NH-28C IN UTTAR PRADESH KM 0 TO 43 EPC(NATIONAL HIGHWAYS DEVELOPMENT PROJECT) - [N24000399]
317.76 03/2017 344.30
70
JUNCTION WITH MDR-13 NEAR JARWAL TO BAHRAICH SECTION OF NH-28C IN UTTAR PRADESH KM 43 TO 93 EPC(NATIONAL HIGHWAYS DEVELOPMENT PROJECT) - [N24000403]
283.45 10/2016 285.18
71
DEVELOPMENT TO FOUR LANE WITH PAVED SHOULDERS OF TALLEWAL-BARNALA SECTION OF NH-71 FROM EXISTING KM EPC(PUBLIC WORKS DEPT OF STATE) - [N24000404]
578.38 - 481.30
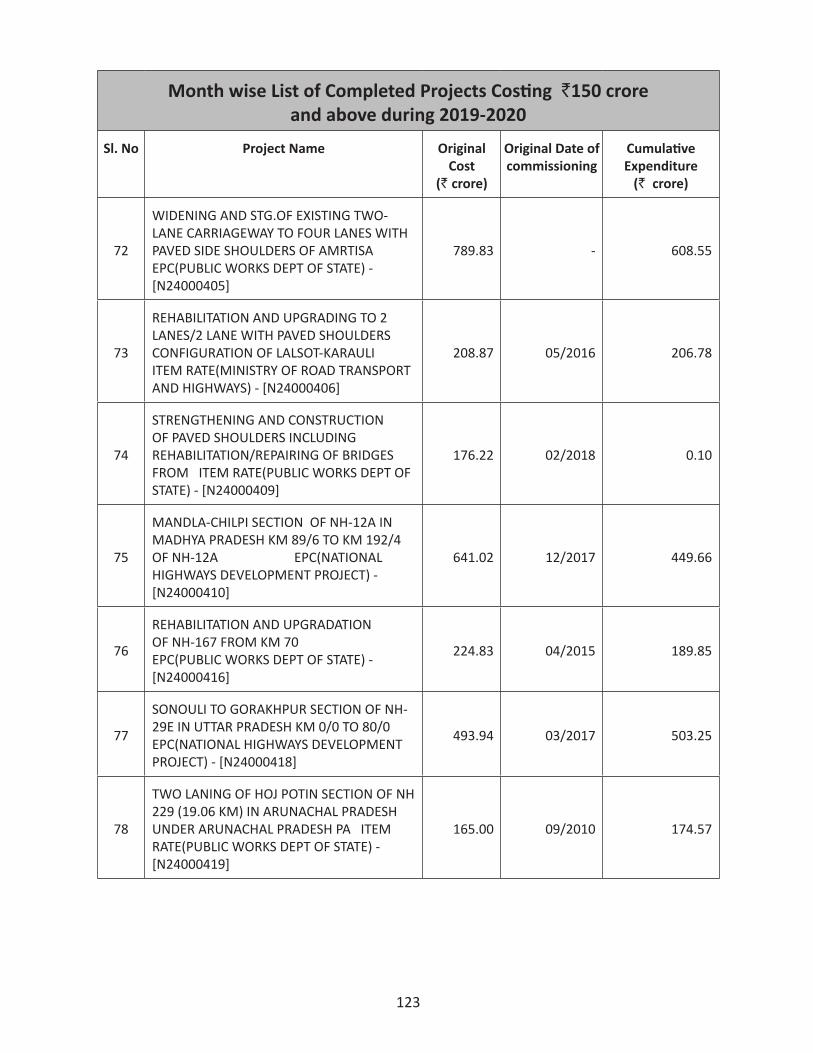
123
Month wise List of Completed Projects Costing `150 crore and above during 2019-2020
Sl. No Project Name Original Cost
(`crore)
Original Date of commissioning
Cumulative Expenditure
(` crore)
72
WIDENING AND STG.OF EXISTING TWO-LANE CARRIAGEWAY TO FOUR LANES WITH PAVED SIDE SHOULDERS OF AMRTISA EPC(PUBLIC WORKS DEPT OF STATE) - [N24000405]
789.83 - 608.55
73
REHABILITATION AND UPGRADING TO 2 LANES/2 LANE WITH PAVED SHOULDERS CONFIGURATION OF LALSOT-KARAULI ITEM RATE(MINISTRY OF ROAD TRANSPORT AND HIGHWAYS) - [N24000406]
208.87 05/2016 206.78
74
STRENGTHENING AND CONSTRUCTION OF PAVED SHOULDERS INCLUDING REHABILITATION/REPAIRING OF BRIDGES FROM ITEM RATE(PUBLIC WORKS DEPT OF STATE) - [N24000409]
176.22 02/2018 0.10
75
MANDLA-CHILPI SECTION OF NH-12A IN MADHYA PRADESH KM 89/6 TO KM 192/4 OF NH-12A EPC(NATIONAL HIGHWAYS DEVELOPMENT PROJECT) - [N24000410]
641.02 12/2017 449.66
76
REHABILITATION AND UPGRADATION OF NH-167 FROM KM 70 EPC(PUBLIC WORKS DEPT OF STATE) - [N24000416]
224.83 04/2015 189.85
77
SONOULI TO GORAKHPUR SECTION OF NH-29E IN UTTAR PRADESH KM 0/0 TO 80/0 EPC(NATIONAL HIGHWAYS DEVELOPMENT PROJECT) - [N24000418]
493.94 03/2017 503.25
78
TWO LANING OF HOJ POTIN SECTION OF NH 229 (19.06 KM) IN ARUNACHAL PRADESH UNDER ARUNACHAL PRADESH PA ITEM RATE(PUBLIC WORKS DEPT OF STATE) - [N24000419]
165.00 09/2010 174.57
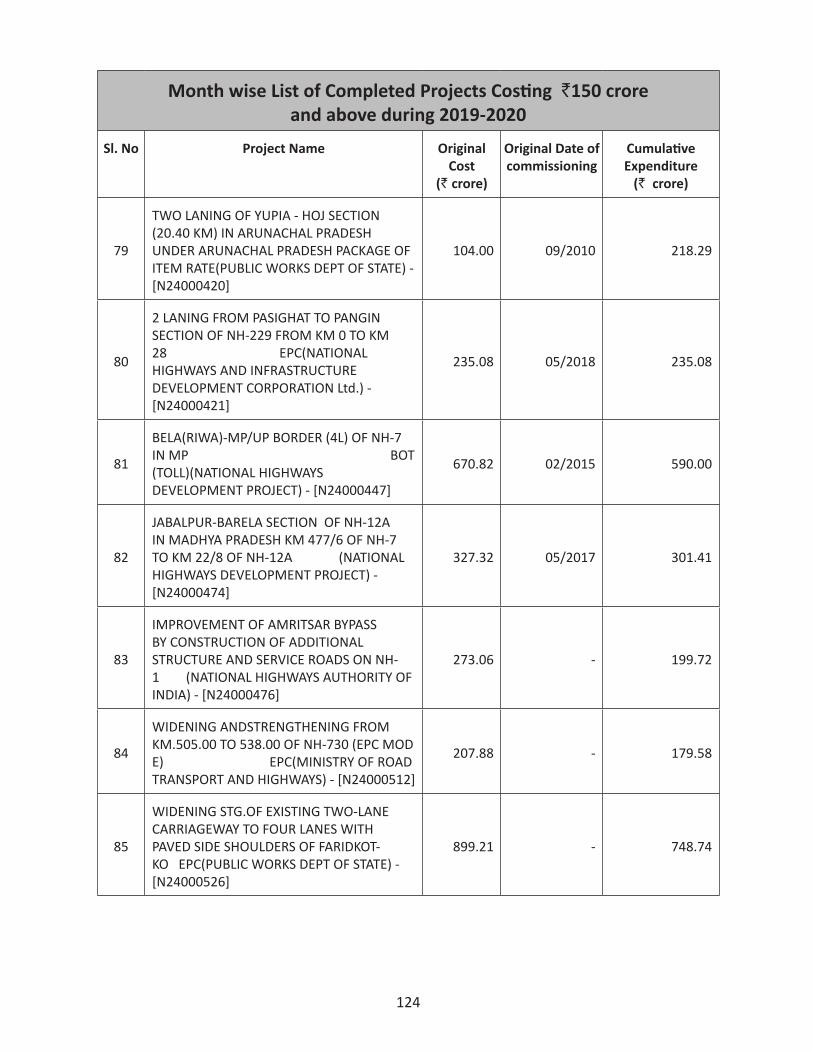
124
Month wise List of Completed Projects Costing `150 crore and above during 2019-2020
Sl. No Project Name Original Cost
(`crore)
Original Date of commissioning
Cumulative Expenditure
(` crore)
79
TWO LANING OF YUPIA - HOJ SECTION (20.40 KM) IN ARUNACHAL PRADESH UNDER ARUNACHAL PRADESH PACKAGE OF ITEM RATE(PUBLIC WORKS DEPT OF STATE) - [N24000420]
104.00 09/2010 218.29
80
2 LANING FROM PASIGHAT TO PANGIN SECTION OF NH-229 FROM KM 0 TO KM 28 EPC(NATIONAL HIGHWAYS AND INFRASTRUCTURE DEVELOPMENT CORPORATION Ltd.) - [N24000421]
235.08 05/2018 235.08
81
BELA(RIWA)-MP/UP BORDER (4L) OF NH-7 IN MP BOT (TOLL)(NATIONAL HIGHWAYS DEVELOPMENT PROJECT) - [N24000447]
670.82 02/2015 590.00
82
JABALPUR-BARELA SECTION OF NH-12A IN MADHYA PRADESH KM 477/6 OF NH-7 TO KM 22/8 OF NH-12A (NATIONAL HIGHWAYS DEVELOPMENT PROJECT) - [N24000474]
327.32 05/2017 301.41
83
IMPROVEMENT OF AMRITSAR BYPASS BY CONSTRUCTION OF ADDITIONAL STRUCTURE AND SERVICE ROADS ON NH-1 (NATIONAL HIGHWAYS AUTHORITY OF INDIA) - [N24000476]
273.06 - 199.72
84
WIDENING ANDSTRENGTHENING FROM KM.505.00 TO 538.00 OF NH-730 (EPC MODE) EPC(MINISTRY OF ROAD TRANSPORT AND HIGHWAYS) - [N24000512]
207.88 - 179.58
85
WIDENING STG.OF EXISTING TWO-LANE CARRIAGEWAY TO FOUR LANES WITH PAVED SIDE SHOULDERS OF FARIDKOT-KO EPC(PUBLIC WORKS DEPT OF STATE) - [N24000526]
899.21 - 748.74
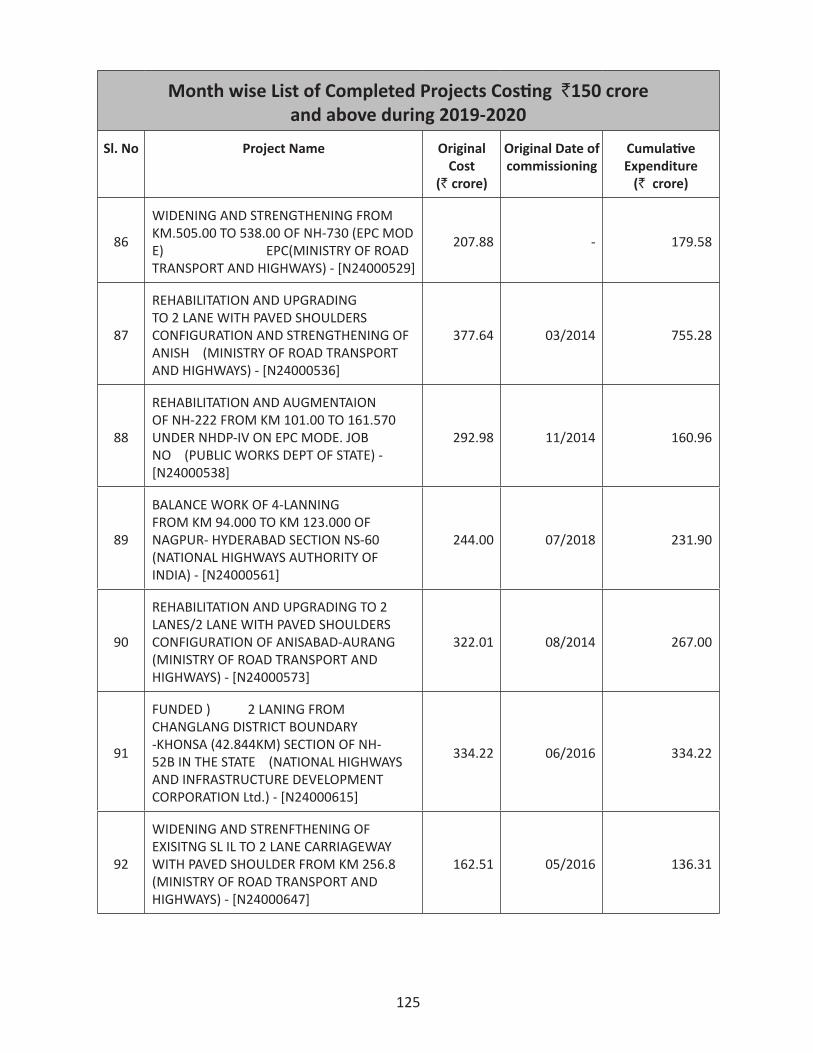
125
Month wise List of Completed Projects Costing `150 crore and above during 2019-2020
Sl. No Project Name Original Cost
(`crore)
Original Date of commissioning
Cumulative Expenditure
(` crore)
86
WIDENING AND STRENGTHENING FROM KM.505.00 TO 538.00 OF NH-730 (EPC MODE) EPC(MINISTRY OF ROAD TRANSPORT AND HIGHWAYS) - [N24000529]
207.88 - 179.58
87
REHABILITATION AND UPGRADING TO 2 LANE WITH PAVED SHOULDERS CONFIGURATION AND STRENGTHENING OF ANISH (MINISTRY OF ROAD TRANSPORT AND HIGHWAYS) - [N24000536]
377.64 03/2014 755.28
88
REHABILITATION AND AUGMENTAION OF NH-222 FROM KM 101.00 TO 161.570 UNDER NHDP-IV ON EPC MODE. JOB NO (PUBLIC WORKS DEPT OF STATE) - [N24000538]
292.98 11/2014 160.96
89
BALANCE WORK OF 4-LANNING FROM KM 94.000 TO KM 123.000 OF NAGPUR- HYDERABAD SECTION NS-60 (NATIONAL HIGHWAYS AUTHORITY OF INDIA) - [N24000561]
244.00 07/2018 231.90
90
REHABILITATION AND UPGRADING TO 2 LANES/2 LANE WITH PAVED SHOULDERS CONFIGURATION OF ANISABAD-AURANG (MINISTRY OF ROAD TRANSPORT AND HIGHWAYS) - [N24000573]
322.01 08/2014 267.00
91
FUNDED ) 2 LANING FROM CHANGLANG DISTRICT BOUNDARY -KHONSA (42.844KM) SECTION OF NH-52B IN THE STATE (NATIONAL HIGHWAYS AND INFRASTRUCTURE DEVELOPMENT CORPORATION Ltd.) - [N24000615]
334.22 06/2016 334.22
92
WIDENING AND STRENFTHENING OF EXISITNG SL IL TO 2 LANE CARRIAGEWAY WITH PAVED SHOULDER FROM KM 256.8 (MINISTRY OF ROAD TRANSPORT AND HIGHWAYS) - [N24000647]
162.51 05/2016 136.31
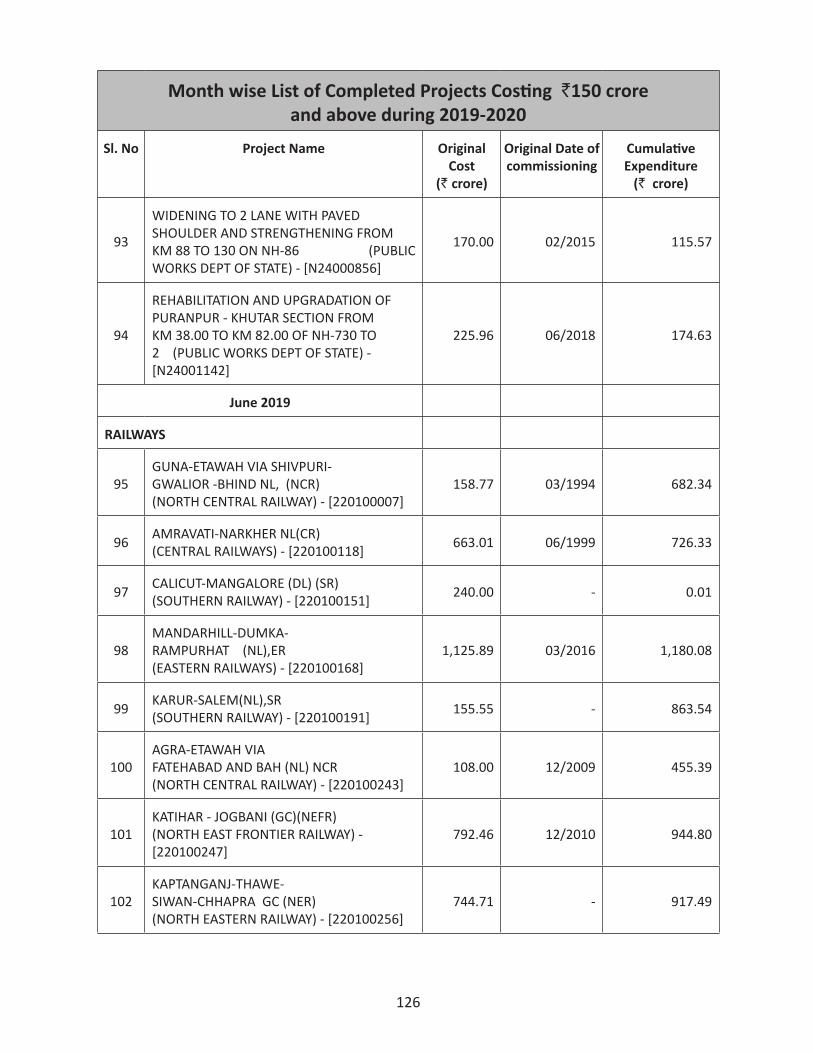
126
Month wise List of Completed Projects Costing `150 crore and above during 2019-2020
Sl. No Project Name Original Cost
(`crore)
Original Date of commissioning
Cumulative Expenditure
(` crore)
93
WIDENING TO 2 LANE WITH PAVED SHOULDER AND STRENGTHENING FROM KM 88 TO 130 ON NH-86 (PUBLIC WORKS DEPT OF STATE) - [N24000856]
170.00 02/2015 115.57
94
REHABILITATION AND UPGRADATION OF PURANPUR - KHUTAR SECTION FROM KM 38.00 TO KM 82.00 OF NH-730 TO 2 (PUBLIC WORKS DEPT OF STATE) - [N24001142]
225.96 06/2018 174.63
June 2019
RAILWAYS
95GUNA-ETAWAH VIA SHIVPURI-GWALIOR -BHIND NL, (NCR) (NORTH CENTRAL RAILWAY) - [220100007]
158.77 03/1994 682.34
96 AMRAVATI-NARKHER NL(CR) (CENTRAL RAILWAYS) - [220100118] 663.01 06/1999 726.33
97 CALICUT-MANGALORE (DL) (SR) (SOUTHERN RAILWAY) - [220100151] 240.00 - 0.01
98MANDARHILL-DUMKA-RAMPURHAT (NL),ER (EASTERN RAILWAYS) - [220100168]
1,125.89 03/2016 1,180.08
99 KARUR-SALEM(NL),SR (SOUTHERN RAILWAY) - [220100191] 155.55 - 863.54
100AGRA-ETAWAH VIA FATEHABAD AND BAH (NL) NCR (NORTH CENTRAL RAILWAY) - [220100243]
108.00 12/2009 455.39
101KATIHAR - JOGBANI (GC)(NEFR) (NORTH EAST FRONTIER RAILWAY) - [220100247]
792.46 12/2010 944.80
102KAPTANGANJ-THAWE-SIWAN-CHHAPRA GC (NER) (NORTH EASTERN RAILWAY) - [220100256]
744.71 - 917.49
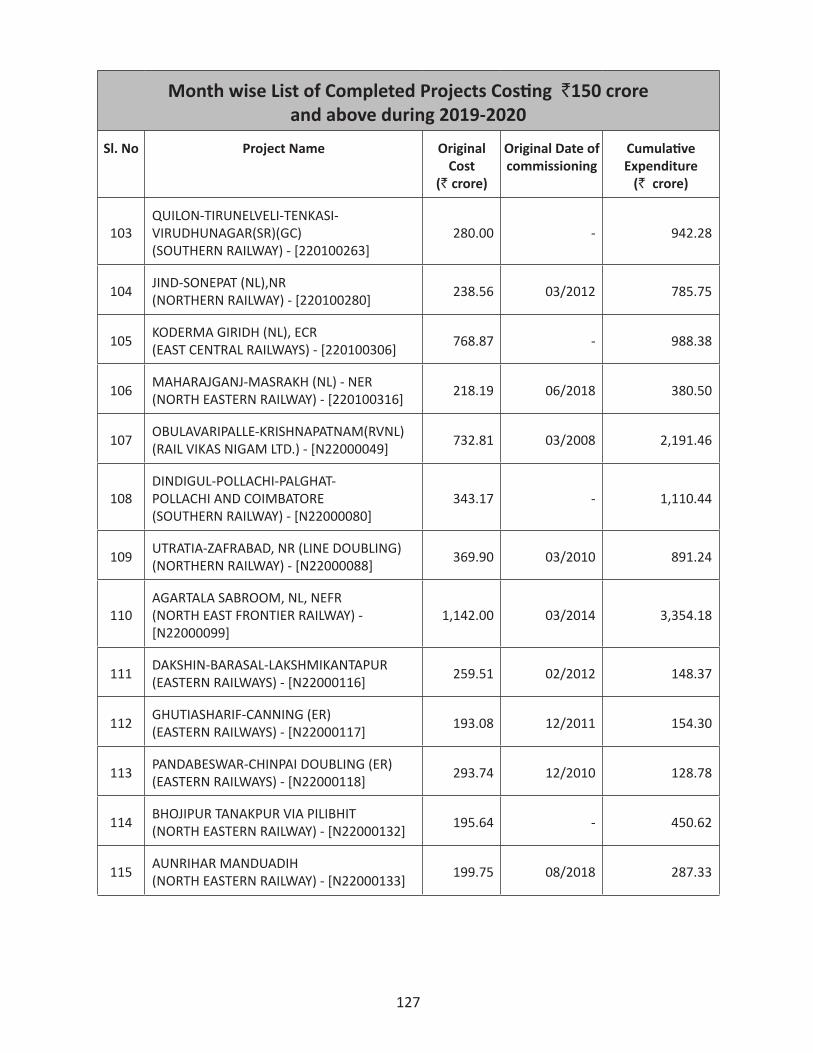
127
Month wise List of Completed Projects Costing `150 crore and above during 2019-2020
Sl. No Project Name Original Cost
(`crore)
Original Date of commissioning
Cumulative Expenditure
(` crore)
103QUILON-TIRUNELVELI-TENKASI-VIRUDHUNAGAR(SR)(GC) (SOUTHERN RAILWAY) - [220100263]
280.00 - 942.28
104 JIND-SONEPAT (NL),NR (NORTHERN RAILWAY) - [220100280] 238.56 03/2012 785.75
105 KODERMA GIRIDH (NL), ECR (EAST CENTRAL RAILWAYS) - [220100306] 768.87 - 988.38
106 MAHARAJGANJ-MASRAKH (NL) - NER (NORTH EASTERN RAILWAY) - [220100316] 218.19 06/2018 380.50
107 OBULAVARIPALLE-KRISHNAPATNAM(RVNL) (RAIL VIKAS NIGAM LTD.) - [N22000049] 732.81 03/2008 2,191.46
108DINDIGUL-POLLACHI-PALGHAT-POLLACHI AND COIMBATORE (SOUTHERN RAILWAY) - [N22000080]
343.17 - 1,110.44
109 UTRATIA-ZAFRABAD, NR (LINE DOUBLING) (NORTHERN RAILWAY) - [N22000088] 369.90 03/2010 891.24
110AGARTALA SABROOM, NL, NEFR (NORTH EAST FRONTIER RAILWAY) - [N22000099]
1,142.00 03/2014 3,354.18
111 DAKSHIN-BARASAL-LAKSHMIKANTAPUR (EASTERN RAILWAYS) - [N22000116] 259.51 02/2012 148.37
112 GHUTIASHARIF-CANNING (ER) (EASTERN RAILWAYS) - [N22000117] 193.08 12/2011 154.30
113 PANDABESWAR-CHINPAI DOUBLING (ER) (EASTERN RAILWAYS) - [N22000118] 293.74 12/2010 128.78
114 BHOJIPUR TANAKPUR VIA PILIBHIT (NORTH EASTERN RAILWAY) - [N22000132] 195.64 - 450.62
115 AUNRIHAR MANDUADIH (NORTH EASTERN RAILWAY) - [N22000133] 199.75 08/2018 287.33
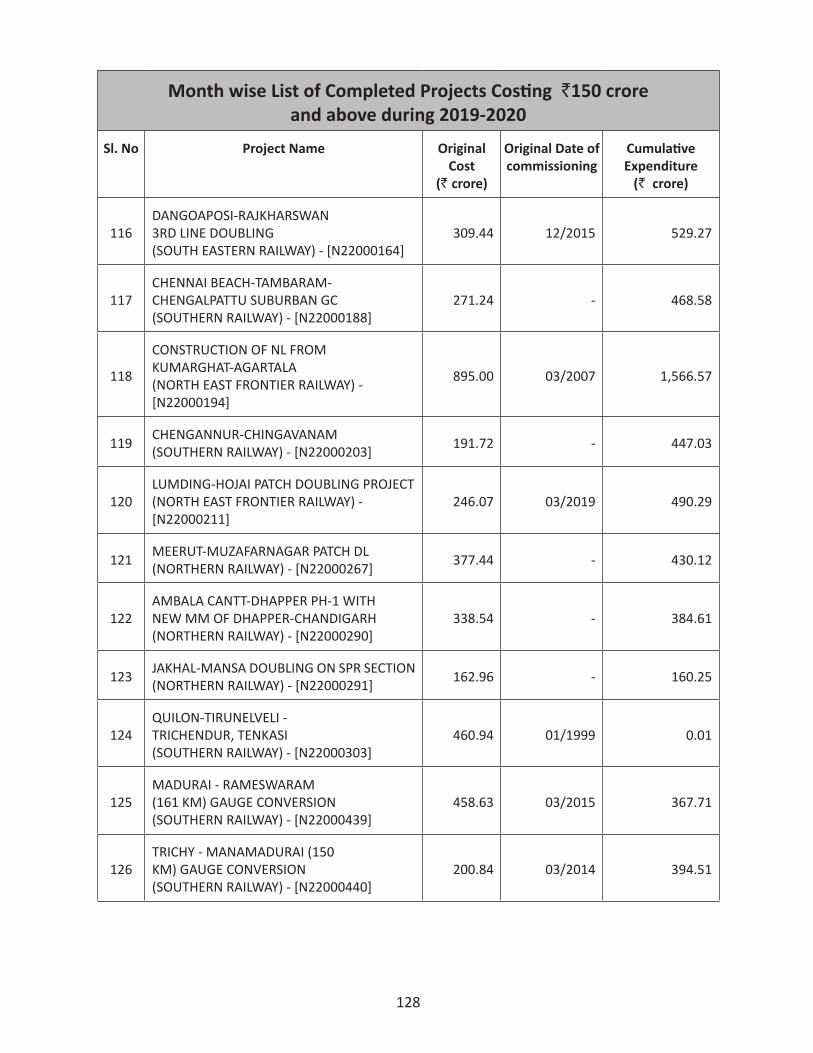
128
Month wise List of Completed Projects Costing `150 crore and above during 2019-2020
Sl. No Project Name Original Cost
(`crore)
Original Date of commissioning
Cumulative Expenditure
(` crore)
116DANGOAPOSI-RAJKHARSWAN 3RD LINE DOUBLING (SOUTH EASTERN RAILWAY) - [N22000164]
309.44 12/2015 529.27
117CHENNAI BEACH-TAMBARAM-CHENGALPATTU SUBURBAN GC (SOUTHERN RAILWAY) - [N22000188]
271.24 - 468.58
118
CONSTRUCTION OF NL FROM KUMARGHAT-AGARTALA (NORTH EAST FRONTIER RAILWAY) - [N22000194]
895.00 03/2007 1,566.57
119 CHENGANNUR-CHINGAVANAM (SOUTHERN RAILWAY) - [N22000203] 191.72 - 447.03
120LUMDING-HOJAI PATCH DOUBLING PROJECT (NORTH EAST FRONTIER RAILWAY) - [N22000211]
246.07 03/2019 490.29
121 MEERUT-MUZAFARNAGAR PATCH DL (NORTHERN RAILWAY) - [N22000267] 377.44 - 430.12
122AMBALA CANTT-DHAPPER PH-1 WITH NEW MM OF DHAPPER-CHANDIGARH (NORTHERN RAILWAY) - [N22000290]
338.54 - 384.61
123 JAKHAL-MANSA DOUBLING ON SPR SECTION (NORTHERN RAILWAY) - [N22000291] 162.96 - 160.25
124QUILON-TIRUNELVELI - TRICHENDUR, TENKASI (SOUTHERN RAILWAY) - [N22000303]
460.94 01/1999 0.01
125MADURAI - RAMESWARAM (161 KM) GAUGE CONVERSION (SOUTHERN RAILWAY) - [N22000439]
458.63 03/2015 367.71
126TRICHY - MANAMADURAI (150 KM) GAUGE CONVERSION (SOUTHERN RAILWAY) - [N22000440]
200.84 03/2014 394.51
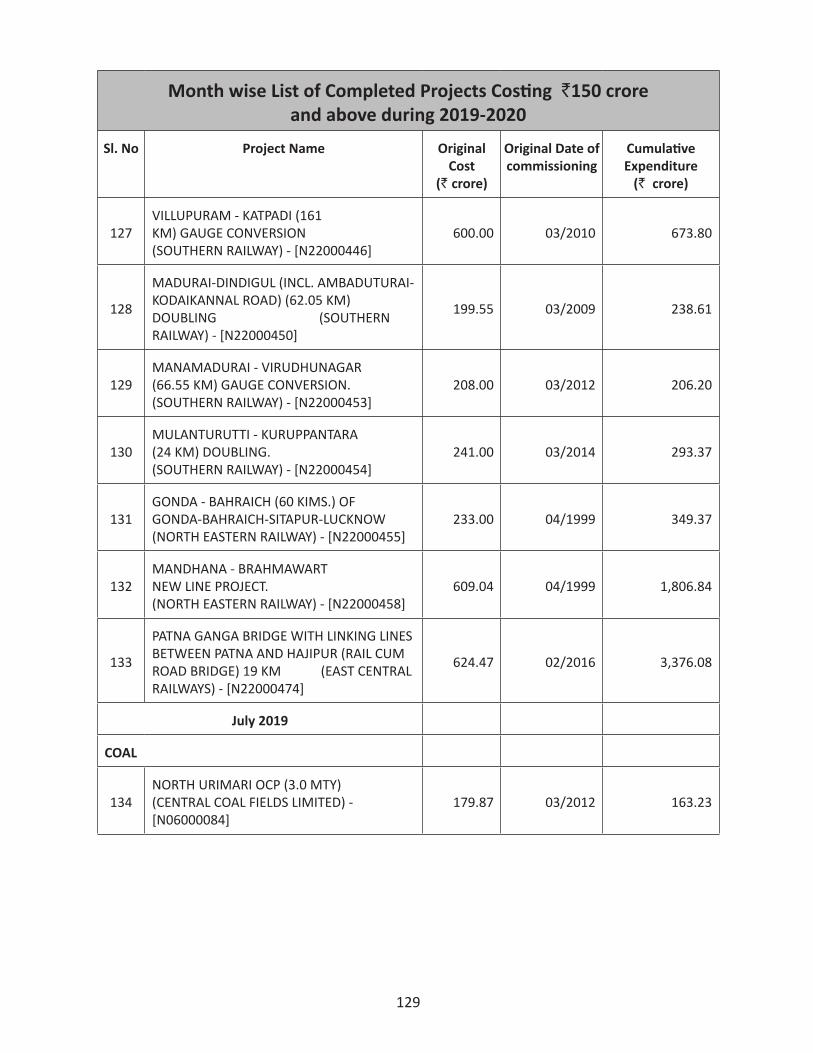
129
Month wise List of Completed Projects Costing `150 crore and above during 2019-2020
Sl. No Project Name Original Cost
(`crore)
Original Date of commissioning
Cumulative Expenditure
(` crore)
127VILLUPURAM - KATPADI (161 KM) GAUGE CONVERSION (SOUTHERN RAILWAY) - [N22000446]
600.00 03/2010 673.80
128
MADURAI-DINDIGUL (INCL. AMBADUTURAI-KODAIKANNAL ROAD) (62.05 KM) DOUBLING (SOUTHERN RAILWAY) - [N22000450]
199.55 03/2009 238.61
129MANAMADURAI - VIRUDHUNAGAR (66.55 KM) GAUGE CONVERSION. (SOUTHERN RAILWAY) - [N22000453]
208.00 03/2012 206.20
130MULANTURUTTI - KURUPPANTARA (24 KM) DOUBLING. (SOUTHERN RAILWAY) - [N22000454]
241.00 03/2014 293.37
131GONDA - BAHRAICH (60 KIMS.) OF GONDA-BAHRAICH-SITAPUR-LUCKNOW (NORTH EASTERN RAILWAY) - [N22000455]
233.00 04/1999 349.37
132MANDHANA - BRAHMAWART NEW LINE PROJECT. (NORTH EASTERN RAILWAY) - [N22000458]
609.04 04/1999 1,806.84
133
PATNA GANGA BRIDGE WITH LINKING LINES BETWEEN PATNA AND HAJIPUR (RAIL CUM ROAD BRIDGE) 19 KM (EAST CENTRAL RAILWAYS) - [N22000474]
624.47 02/2016 3,376.08
July 2019
COAL
134NORTH URIMARI OCP (3.0 MTY) (CENTRAL COAL FIELDS LIMITED) - [N06000084]
179.87 03/2012 163.23
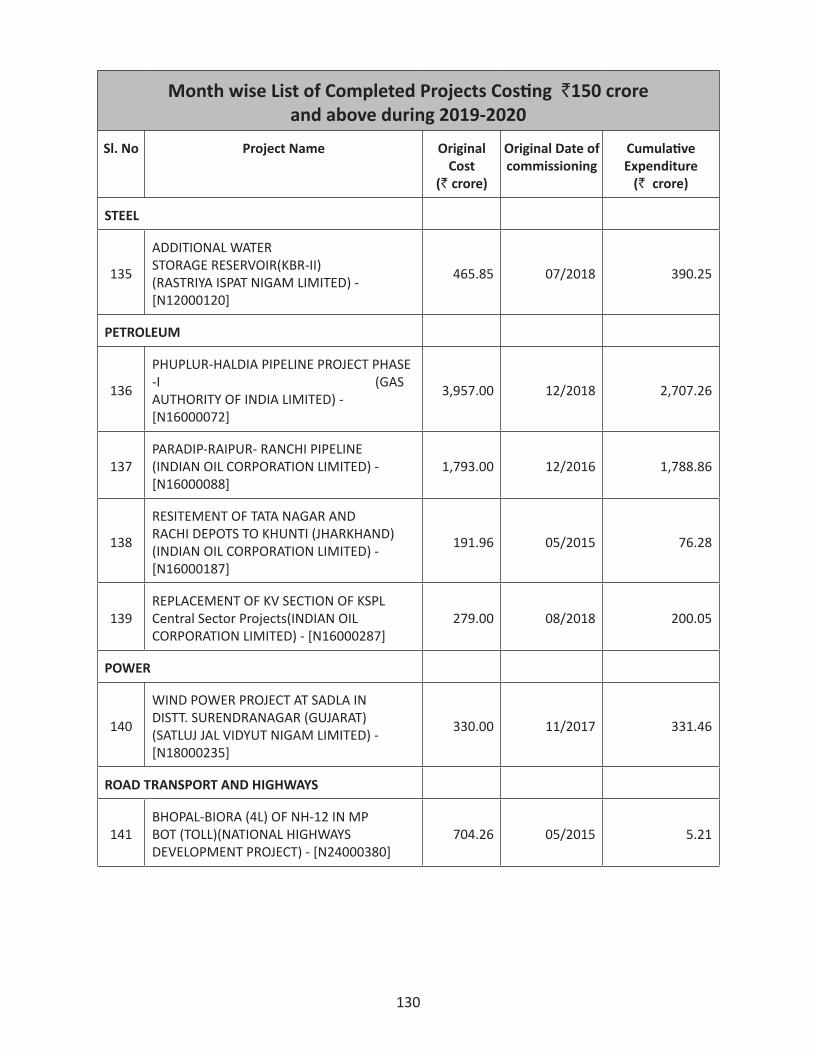
130
Month wise List of Completed Projects Costing `150 crore and above during 2019-2020
Sl. No Project Name Original Cost
(`crore)
Original Date of commissioning
Cumulative Expenditure
(` crore)
STEEL
135
ADDITIONAL WATER STORAGE RESERVOIR(KBR-II) (RASTRIYA ISPAT NIGAM LIMITED) - [N12000120]
465.85 07/2018 390.25
PETROLEUM
136
PHUPLUR-HALDIA PIPELINE PROJECT PHASE-I (GAS AUTHORITY OF INDIA LIMITED) - [N16000072]
3,957.00 12/2018 2,707.26
137PARADIP-RAIPUR- RANCHI PIPELINE (INDIAN OIL CORPORATION LIMITED) - [N16000088]
1,793.00 12/2016 1,788.86
138
RESITEMENT OF TATA NAGAR AND RACHI DEPOTS TO KHUNTI (JHARKHAND) (INDIAN OIL CORPORATION LIMITED) - [N16000187]
191.96 05/2015 76.28
139REPLACEMENT OF KV SECTION OF KSPL Central Sector Projects(INDIAN OIL CORPORATION LIMITED) - [N16000287]
279.00 08/2018 200.05
POWER
140
WIND POWER PROJECT AT SADLA IN DISTT. SURENDRANAGAR (GUJARAT) (SATLUJ JAL VIDYUT NIGAM LIMITED) - [N18000235]
330.00 11/2017 331.46
ROAD TRANSPORT AND HIGHWAYS
141BHOPAL-BIORA (4L) OF NH-12 IN MP BOT (TOLL)(NATIONAL HIGHWAYS DEVELOPMENT PROJECT) - [N24000380]
704.26 05/2015 5.21
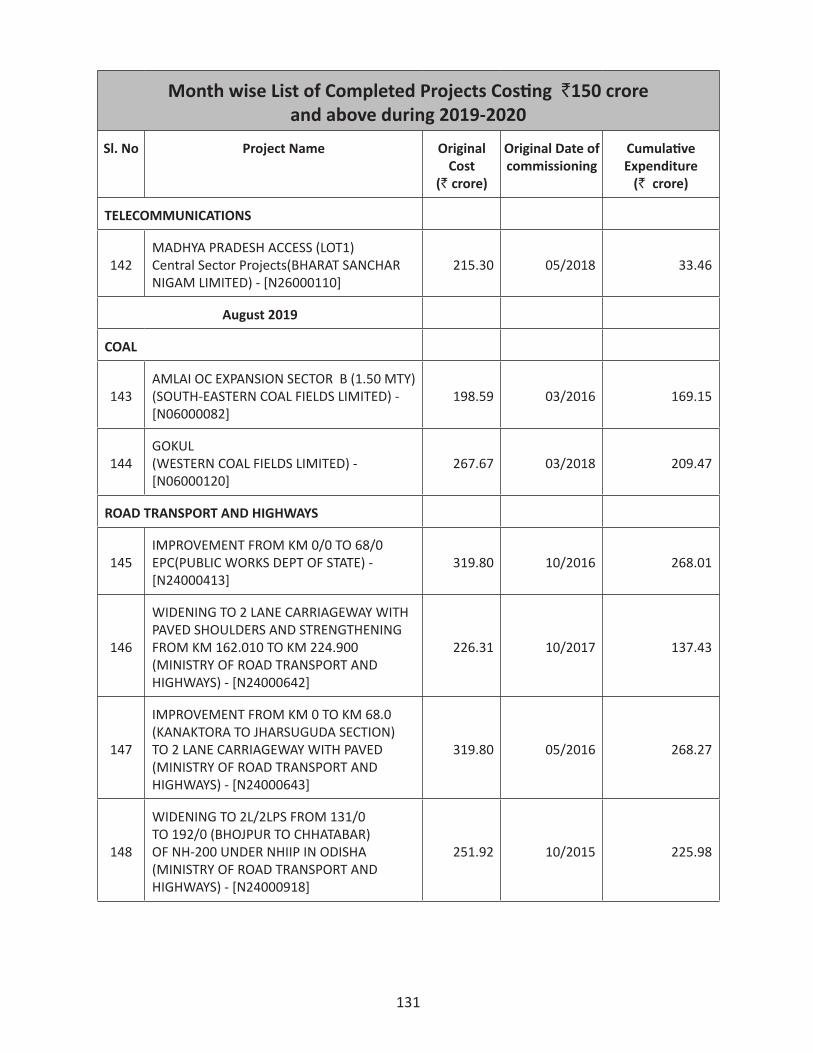
131
Month wise List of Completed Projects Costing `150 crore and above during 2019-2020
Sl. No Project Name Original Cost
(`crore)
Original Date of commissioning
Cumulative Expenditure
(` crore)
TELECOMMUNICATIONS
142MADHYA PRADESH ACCESS (LOT1) Central Sector Projects(BHARAT SANCHAR NIGAM LIMITED) - [N26000110]
215.30 05/2018 33.46
August 2019
COAL
143AMLAI OC EXPANSION SECTOR B (1.50 MTY) (SOUTH-EASTERN COAL FIELDS LIMITED) - [N06000082]
198.59 03/2016 169.15
144GOKUL (WESTERN COAL FIELDS LIMITED) - [N06000120]
267.67 03/2018 209.47
ROAD TRANSPORT AND HIGHWAYS
145IMPROVEMENT FROM KM 0/0 TO 68/0 EPC(PUBLIC WORKS DEPT OF STATE) - [N24000413]
319.80 10/2016 268.01
146
WIDENING TO 2 LANE CARRIAGEWAY WITH PAVED SHOULDERS AND STRENGTHENING FROM KM 162.010 TO KM 224.900 (MINISTRY OF ROAD TRANSPORT AND HIGHWAYS) - [N24000642]
226.31 10/2017 137.43
147
IMPROVEMENT FROM KM 0 TO KM 68.0 (KANAKTORA TO JHARSUGUDA SECTION) TO 2 LANE CARRIAGEWAY WITH PAVED (MINISTRY OF ROAD TRANSPORT AND HIGHWAYS) - [N24000643]
319.80 05/2016 268.27
148
WIDENING TO 2L/2LPS FROM 131/0 TO 192/0 (BHOJPUR TO CHHATABAR) OF NH-200 UNDER NHIIP IN ODISHA (MINISTRY OF ROAD TRANSPORT AND HIGHWAYS) - [N24000918]
251.92 10/2015 225.98
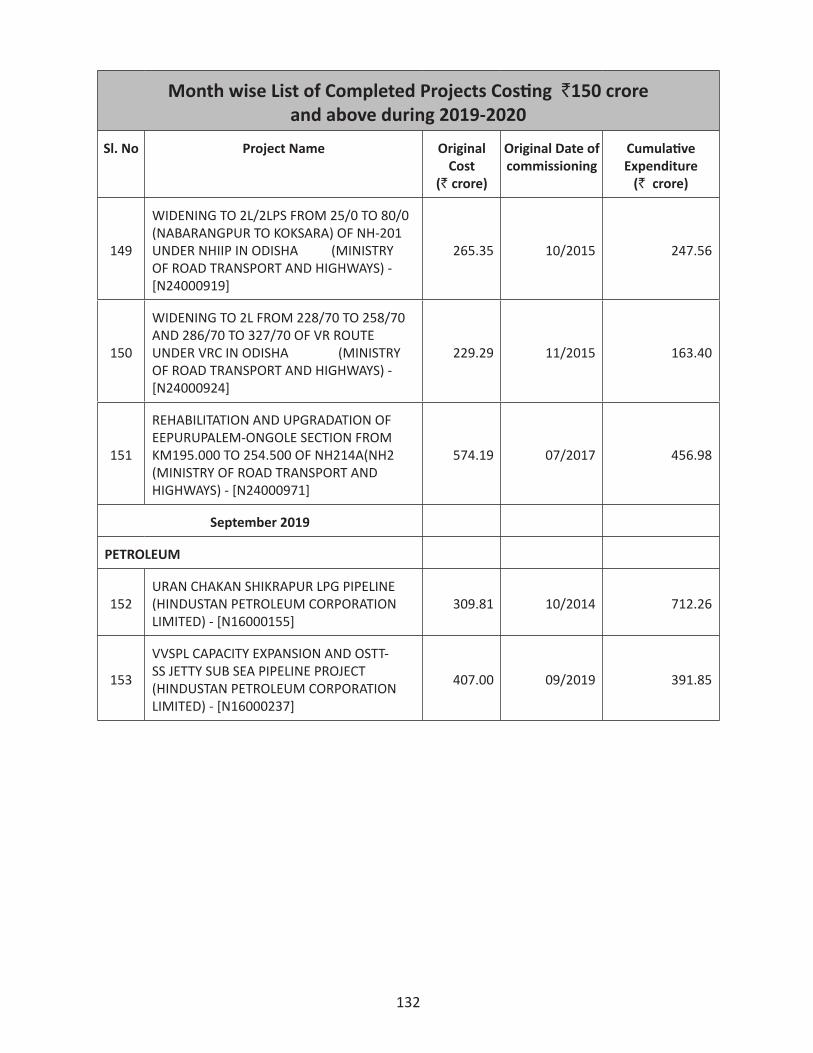
132
Month wise List of Completed Projects Costing `150 crore and above during 2019-2020
Sl. No Project Name Original Cost
(`crore)
Original Date of commissioning
Cumulative Expenditure
(` crore)
149
WIDENING TO 2L/2LPS FROM 25/0 TO 80/0 (NABARANGPUR TO KOKSARA) OF NH-201 UNDER NHIIP IN ODISHA (MINISTRY OF ROAD TRANSPORT AND HIGHWAYS) - [N24000919]
265.35 10/2015 247.56
150
WIDENING TO 2L FROM 228/70 TO 258/70 AND 286/70 TO 327/70 OF VR ROUTE UNDER VRC IN ODISHA (MINISTRY OF ROAD TRANSPORT AND HIGHWAYS) - [N24000924]
229.29 11/2015 163.40
151
REHABILITATION AND UPGRADATION OF EEPURUPALEM-ONGOLE SECTION FROM KM195.000 TO 254.500 OF NH214A(NH2 (MINISTRY OF ROAD TRANSPORT AND HIGHWAYS) - [N24000971]
574.19 07/2017 456.98
September 2019
PETROLEUM
152URAN CHAKAN SHIKRAPUR LPG PIPELINE (HINDUSTAN PETROLEUM CORPORATION LIMITED) - [N16000155]
309.81 10/2014 712.26
153
VVSPL CAPACITY EXPANSION AND OSTT-SS JETTY SUB SEA PIPELINE PROJECT (HINDUSTAN PETROLEUM CORPORATION LIMITED) - [N16000237]
407.00 09/2019 391.85
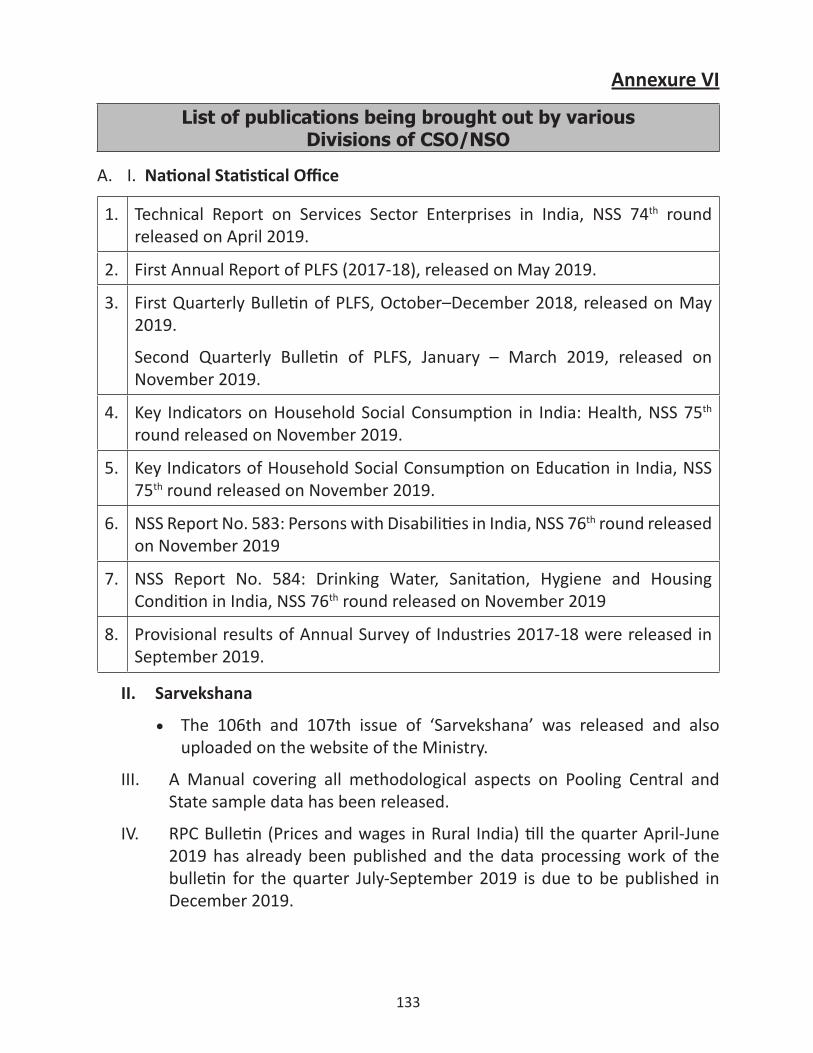
133
Annexure VI
List of publications being brought out by various Divisions of CSO/NSO
A. I. National Statistical Office
1. Technical Report on Services Sector Enterprises in India, NSS 74th round released on April 2019.
2. First Annual Report of PLFS (2017-18), released on May 2019.
3. First Quarterly Bulletin of PLFS, October–December 2018, released on May 2019.
Second Quarterly Bulletin of PLFS, January – March 2019, released on November 2019.
4. Key Indicators on Household Social Consumption in India: Health, NSS 75th round released on November 2019.
5. Key Indicators of Household Social Consumption on Education in India, NSS 75th round released on November 2019.
6. NSS Report No. 583: Persons with Disabilities in India, NSS 76th round released on November 2019
7. NSS Report No. 584: Drinking Water, Sanitation, Hygiene and Housing Condition in India, NSS 76th round released on November 2019
8. Provisional results of Annual Survey of Industries 2017-18 were released in September 2019.
II. Sarvekshana
•¾ The 106th and 107th issue of ‘Sarvekshana’ was released and also uploaded on the website of the Ministry.
III. A Manual covering all methodological aspects on Pooling Central and State sample data has been released.
IV. RPC Bulletin (Prices and wages in Rural India) till the quarter April-June 2019 has already been published and the data processing work of the bulletin for the quarter July-September 2019 is due to be published in December 2019.
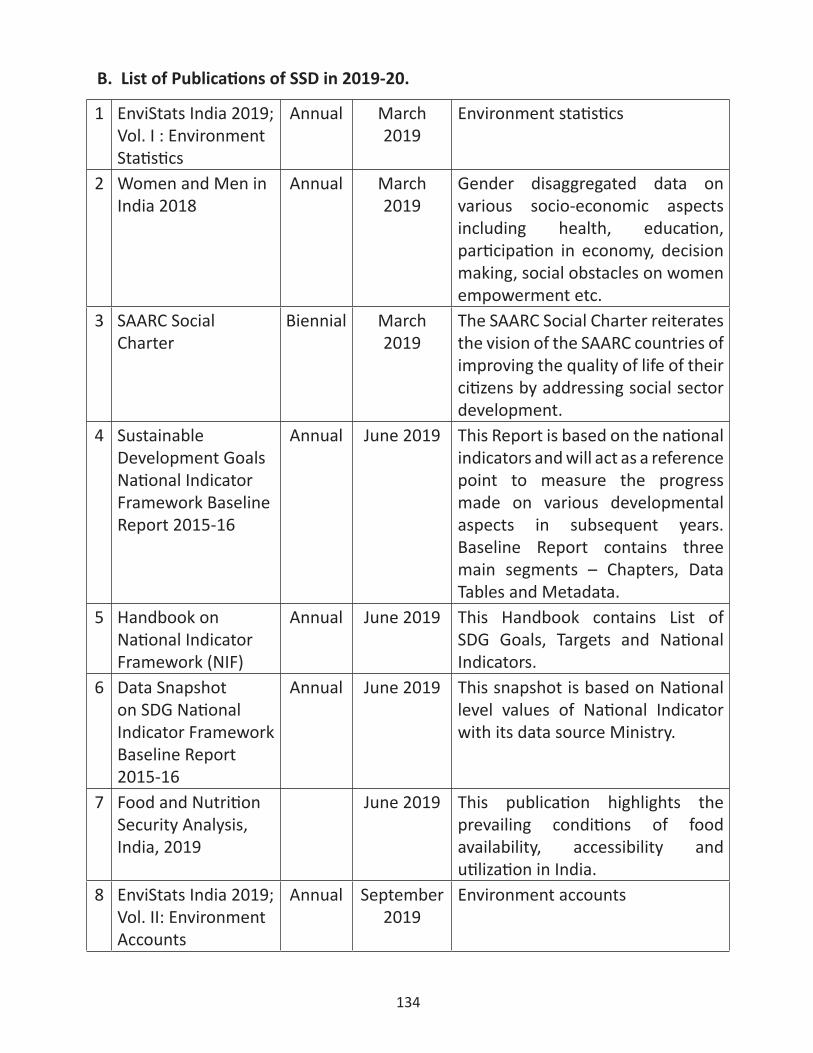
134
B. List of Publications of SSD in 2019-20.
1 EnviStats India 2019; Vol. I : Environment Statistics
Annual March 2019
Environment statistics
2 Women and Men in India 2018
Annual March 2019
Gender disaggregated data on various socio-economic aspects including health, education, participation in economy, decision making, social obstacles on women empowerment etc.
3 SAARC Social Charter
Biennial March 2019
The SAARC Social Charter reiterates the vision of the SAARC countries of improving the quality of life of their citizens by addressing social sector development.
4 Sustainable Development Goals National Indicator Framework Baseline Report 2015-16
Annual June 2019 This Report is based on the national indicators and will act as a reference point to measure the progress made on various developmental aspects in subsequent years. Baseline Report contains three main segments – Chapters, Data Tables and Metadata.
5 Handbook on National Indicator Framework (NIF)
Annual June 2019 This Handbook contains List of SDG Goals, Targets and National Indicators.
6 Data Snapshot on SDG National Indicator Framework Baseline Report 2015-16
Annual June 2019 This snapshot is based on National level values of National Indicator with its data source Ministry.
7 Food and Nutrition Security Analysis, India, 2019
June 2019 This publication highlights the prevailing conditions of food availability, accessibility and utilization in India.
8 EnviStats India 2019; Vol. II: Environment Accounts
Annual September 2019
Environment accounts
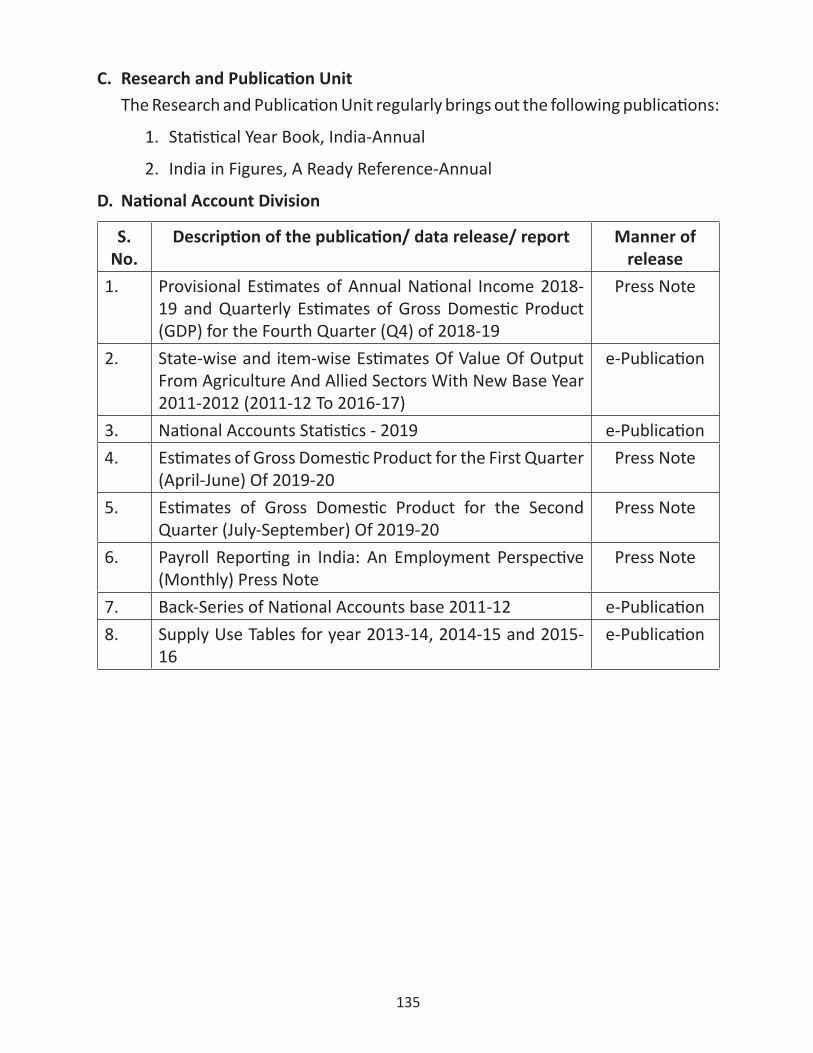
135
C. Research and Publication Unit The Research and Publication Unit regularly brings out the following publications:
1. Statistical Year Book, India-Annual
2. India in Figures, A Ready Reference-Annual
D. National Account Division
S. No.
Description of the publication/ data release/ report Manner of release
1. Provisional Estimates of Annual National Income 2018-19 and Quarterly Estimates of Gross Domestic Product (GDP) for the Fourth Quarter (Q4) of 2018-19
Press Note
2. State-wise and item-wise Estimates Of Value Of Output From Agriculture And Allied Sectors With New Base Year 2011-2012 (2011-12 To 2016-17)
e-Publication
3. National Accounts Statistics - 2019 e-Publication4. Estimates of Gross Domestic Product for the First Quarter
(April-June) Of 2019-20Press Note
5. Estimates of Gross Domestic Product for the Second Quarter (July-September) Of 2019-20
Press Note
6. Payroll Reporting in India: An Employment Perspective (Monthly) Press Note
Press Note
7. Back-Series of National Accounts base 2011-12 e-Publication8. Supply Use Tables for year 2013-14, 2014-15 and 2015-
16e-Publication
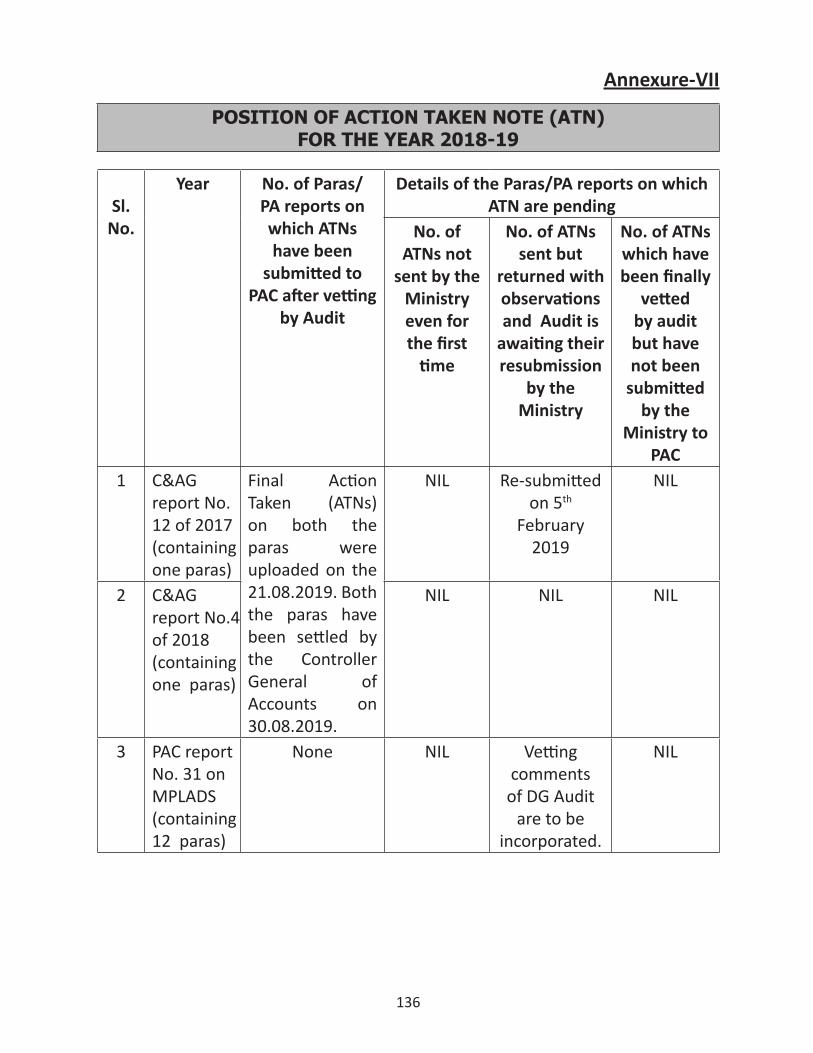
136
Annexure-VII
POSITION OF ACTION TAKEN NOTE (ATN) FOR THE YEAR 2018-19
Sl.No.
Year No. of Paras/PA reports on which ATNs have been
submitted to PAC after vetting
by Audit
Details of the Paras/PA reports on which ATN are pending
No. of ATNs not
sent by the Ministry even for the first
time
No. of ATNs sent but
returned with observations and Audit is
awaiting their resubmission
by the Ministry
No. of ATNs which have been finally
vetted by audit but have not been
submitted by the
Ministry to PAC
1 C&AG report No. 12 of 2017(containing one paras)
Final Action Taken (ATNs) on both the paras were uploaded on the 21.08.2019. Both the paras have been settled by the Controller General of Accounts on 30.08.2019.
NIL Re-submitted on 5th
February 2019
NIL
2 C&AG report No.4 of 2018 (containing one paras)
NIL NIL NIL
3 PAC report No. 31 on MPLADS (containing 12 paras)
None NIL Vetting comments of DG Audit
are to be incorporated.
NIL