Embed Size (px)
Citation preview

Solar-Terrestrial Environment Laboratory
Nagoya University
Annual Report 2008-2009

The 2008-2009 Annual Report was published in January 2010 by the Solar-Terrestrial Environment Laboratory of Nagoya University. Copies of this report are available from the Director’s office of the Laboratory.
published by
Solar-Terrestrial Environment Laboratory Nagoya University
Furo-cho, Chikusa-ku, Nagoya 464-8601, Japan TEL 81-52-747-6306 FAX 81-52-747-6313
http://www.stelab.nagoya-u.ac.jp/
Toyokawa Branch on the Toyokawa campus of Nagoya University Honohara 3-13, Toyokawa, Aichi 442-8507, Japan
TEL 81-533-89-5206 FAX 81-533-86-0811

i
Foreword This is the Annual Report for the 2008 academic year (April 2008 -March 2009, summarizing the research and educational activities, joint-use projects, and related committee activities at the Solar-Terrestrial Environment Laboratory (STEL). We have continued, as in the previous year, to advance the Climate And Weather of Sun-Earth System (CAWSES) international research project (5-year plan started in 2004) implemented by the Scientific Committee on Solar-Terrestrial Physics (SCOSTEP). We conducted advanced and cutting-edge research as an international and national research center. Our aim is to understand the domain from the Sun to the Earth as a single complex system, with a comprehensive understanding of the mutual variability that occurs within this system in the short and long terms. In 2008, the fourth year of the special fund for education and research “Survey of Energy Transport Process in Geospace,” we started to build advanced instruments to observe the thermosphere and mesosphere. Operations were also begun on the interplanetary scintillation (IPS) phased-array antenna system, called the “Solar Wind Imaging Facility”, millimeter-wave band radiometers for measuring ozone, water vapor, and chlorine monoxide in the middle and upper atmosphere, spectrometers for measuring methane and carbon dioxide, and a meteor radar at Bear Island near the European Incoherent Scatter (EISCAT) radar bases developed over previous academic years. The Geospace Environment Modeling System for Integrated Studies (GEMSIS) is also moving steadily forward. Continuing from the 2007 academic year, we are also supporting collaborative overseas research observations appropriate to STEL’s mission. Because the 2009 academic year is the last for this special fund for education and research, we are emphasizing the need for good research results to gain a special research fund in the next period (2010-2015). We planned and submitted a new proposal, “Research on Space Storm and Atmospheric Variability in the Next Solar-maximum Period,” for the special fund program for education and research in the 2010 budgetary requests. These funds would establish a joint-use research center where interdisciplinary research on space storms and atmospheric variations would be conducted. Research goals include increasing safety and security for future space operations and exploring the variability of the terrestrial environment induced by solar activity. This joint-use research center will be unique in the field of solar terrestrial environment studies in Japan. In 2009, we started a new 6-year program, the “Inter-university Upper atmosphere Global Observation NETwork (IUGONET),” based on the special fund for education and research, in cooperation with the National Institute of Polar Research, Kyoto University, Kyushu University, and Tohoku University. In this program, a ground-based observation network stretching from the north and south poles to the equator will be constructed to explore the upper atmosphere of neutral particles and plasma regions on a global scale. We welcome this type of cooperative program in the solar-terrestrial environment community.

ii
In 2008, cooperating with the Division of Particle and Astrophysical Science in the Graduate School of Science, we started the Global COE (Centers of Excellence) Program, “Quest for Fundamental Principles in the Universe.” Funding was provided by the Japan Society for the Promotion of Science (JSPS) for establishing education and research centers that perform at the apex of global excellence. The aim of this program is the comprehensive understanding of the elementary processes and structures that appear on various scales in space. We therefore plan complementary operations between particle physics, astrophysics, and solar-terrestrial science to build major links from space to Earth. Given STEL’s unique strengths in in-situ observations and simulation research, STEL should be a core member of this cooperative program. National university evaluations were conducted, and significant time was devoted to evaluating the research activities and national joint use of STEL. The evaluations of individual faculty members for the medium-term (2005-2007) were performed by the National Institution of Academic Degrees and University Evaluation (NIAD-UE). The research activity and results of STEL were both evaluated as being “at the expected level.” The joint-use activity of STEL was evaluated as “beyond expectations.” Furthermore, STEL was evaluated for approval as a joint-use research center by the Ministry of Education, Culture, Sports, Science and Technology (MEXT) in spring 2009. As a result, STEL has been approved as a joint-use research center for the next medium term (2010-2015). This year, we conducted research on such diverse topics as solar flare and solar wind; the magnetosphere, ionosphere, and thermosphere; the atmosphere near Earth’s surface layer; planetary magnetospheres; and planets outside our solar system. Using observations, simulations, and modeling techniques, we conducted advanced, energetic research in a wide range of fields. We hope this report helps to provide a full understanding of our activities and the current state of STEL. In closing, Prof. Ryoichi Fujii, who served as a director of STEL for four years (April 2005- March 2009), was inaugurated as a council member and vice-president of Nagoya University. We express many thanks for his excellent achievements as a director of STEL. I am the new director from June 2009. I ask for your indulgence while I am learning the ropes.
October 2009 Y. Matsumi
Director

iii
Table of Contents
Foreword ........................................................................................................... i 1. Progress in Research ............................................................................. 1 Atmospheric Environment Ionospheric and Magnetospheric Environment Heliospheric Environment Integrated Studies 2. Geospace Research Center ............................................................... 33 Projects Observatories
3. Publications and Presentations .......................................................... 45
Published Books and Papers International Conferences 4. Staff ........................................................................................................... 69 Organization Staff List 5. Management System .......................................................................... 75 Committee System Advisory Board 6. Collaborative Research Activities ................................................... 77 Collaborative Research Program Symposia/Workshops Reports from Collaborative Research Committee on STER CAWSES Space Weather Database in Japan 7. International Relations ........................................................................ 81 Academic Exchange International Collaboration Visitors

iv
8. Education ............................................................................................... 86 Graduate Programs Undergraduate Education 9. Research-Related Activities................................................................ 89 Computer/Network 10. Public Service ........................................................................................ 90 Outreach Activities
11. Facilities .................................................................................................... 91 Library Properties

1
1. Progress in Research
ATMOSPHERIC ENVIRONMENT
The chemical composition of the terrestrial atmosphere, which has evolved with life on Earth, is quite different from that of other Solar system planets. In recent years, the exhaustion of minor molecular species by human activity has destroyed the balance of the atmospheric environment, causing global warming, the destruction of the stratospheric ozone layer, and air pollution. In order to understand these phenomena more thoroughly, the Division of Atmospheric Environment is investigating: (1) the time variations and circulation of minor molecular constituents, (2) the fundamental processes of chemical reactions, and (3) the composition of aerosols and their influence on the atmospheric environment. To enhance our laboratory research and remote field observations, we are developing several original instruments and methodologies.
Observational and Laboratory Studies of the Upper and Middle Atmosphere
(1) Millimeter-wave band observations of stratospheric and mesospheric water-vapor isotopes Atmospheric water vapor, one of the richest minor constituents in the terrestrial atmosphere, is closely linked to global warming and ozone depletion via the HOx cycle. Recent research shows stratospheric water vapor has been increasing at a rate of ~1% per year over the last two decades. The mechanism driving this increase is not yet fully understood. Almost all molecular species that undergo thermal excitation in the middle atmosphere have radiative emission lines in millimeter- to submillimeter-wave bands. Our radiometer system in the Atacama highland, Chile (23.0°S, 67.7°W, altitude 4800 m), permits us to observe the emission lines of the stratospheric and mesospheric water-vapor isotopes (H2O at 183.3 GHz and H2
18O at 203.4 GHz). Observational conditions at the site are excellent, as the absence of thick tropospheric water vapor results in high atmospheric transparency. In this radiometer system, the emission lines are fed to a highly sensitive Superconductor-Insulator-Superconductor (SIS) heterodyne mixer. The mixer is cooled by
Left: We installed a 250-GHz band radiometer system in the new system in the Atacama highland, Chile (alt. 4800 m). Right: 250-GHz band NO2 line detected in December 2008.
2
a 4 K closed-cycle mechanical cryocooler. The intermediate frequency (IF) signal down-converted by the mixer is spectrally analyzed by an acousto-optical spectrometer (AOS). In 2008, the H2
18O line was continuously monitored from September to December. (2) Development of a 250-GHz band radiometer for observations of minor constituents influenced by accelerated electrons in the magnetosphere High-energy solar proton flux increases near the solar maximum, and the number of solar proton events (SPEs) also increases at this time. Solar protons accelerated in the Earth’s magnetic field influence the atmospheric environment of the terrestrial northern and southern polar cap regions. A SPE impacts the stratospheric and mesospheric minor constituents, inducing dissociative ionizations and excitations that enhance HOx and NOx species. Recent reports indicate that the ozone in the mesosphere and upper stratosphere of the polar region decreases due to direct photochemical destruction by HOx and NOx enhancement. In order to study the influence of SPEs on the chemical and physical conditions of the Earth’s neutral middle atmosphere, the Division of Atmospheric Environment is promoting ground-based observations of the NOx species at the Atacama highland. In 2008, we developed a 250-GHz band radiometer employing a SIS superconducting heterodyne detector and installed it at our new facility at Atacama. In December, we successfully detected ozone, N2O, and NO2 emission lines. The NO2 line intensity was about 50 mK, consistent with estimations from the radiative transfer model. During a SPE, the line intensity of NO2 is expected to be an order of magnitude greater than this intensity. (3) Development of a millimeter-wave band radiometer for observations of atmospheric minor constituents at Syowa station in Antarctica Atmospheric observations in Antarctica are crucial to understanding the heterogeneous chemical reactions in polar stratospheric clouds and the influence of the midnight Sun and atmospheric convection on the photochemical reaction processes. We, in collaboration with the National Institute of Polar Research, are planning observations of minor constituents of middle atmosphere using a millimeter-wave band radiometer system at Syowa Station in Antarctica. In general, our spectroscopic observations do not need a
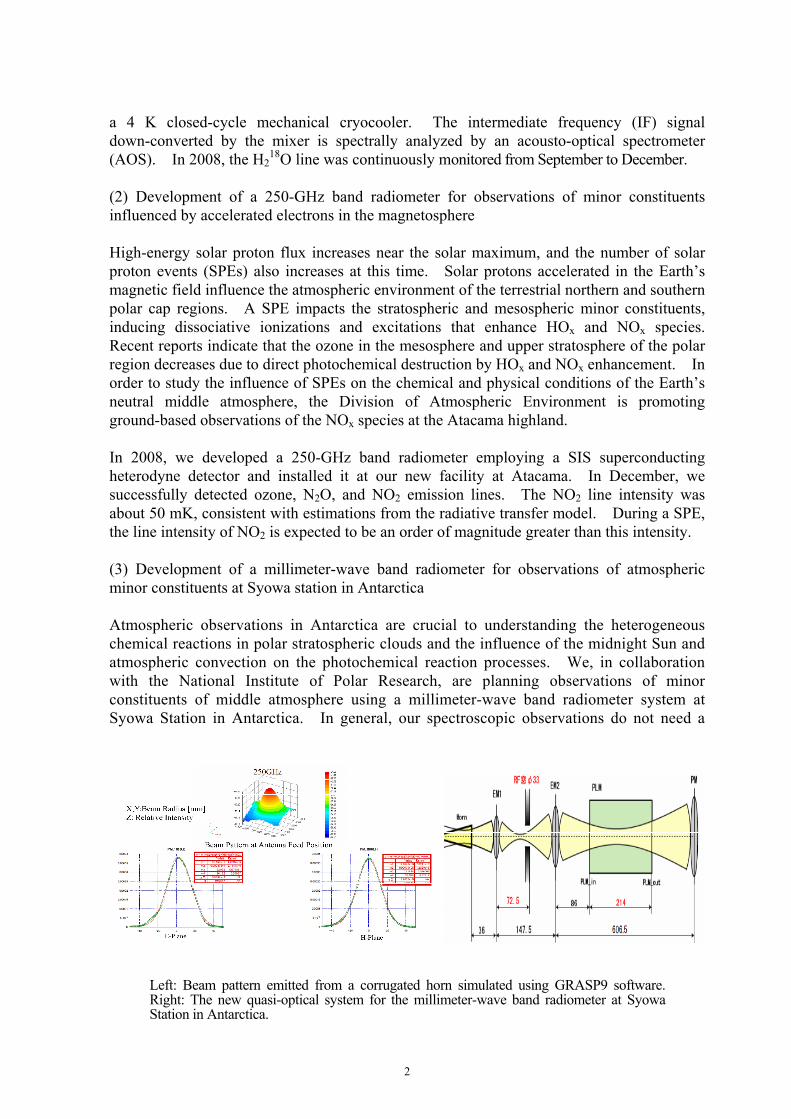
Left: Beam pattern emitted from a corrugated horn simulated using GRASP9 software. Right: The new quasi-optical system for the millimeter-wave band radiometer at Syowa Station in Antarctica.
3
background source like the Sun; thus, we can proceed with long-term, continuous monitoring of minor constituents such as ozone and NOx species in the polar neutral middle atmosphere even during polar night. The station is limited in electrical power, weight, and space. Accordingly, we constructed a portable radiometer system utilizing a newly developed low-consumption compact 4 K GM cryocooler (ULVAC Co.). In 2008, we designed a quasi-optical system using GRASP 9 software and fabricated a horn antenna and new ellipsoidal and parabolic mirrors. The beam propagates symmetrically at the E-plane and H-plane, and the side-lobe components of the beam are well suppressed. This sophisticated beam pattern permits precision observations of the spectral lines of atmospheric species.
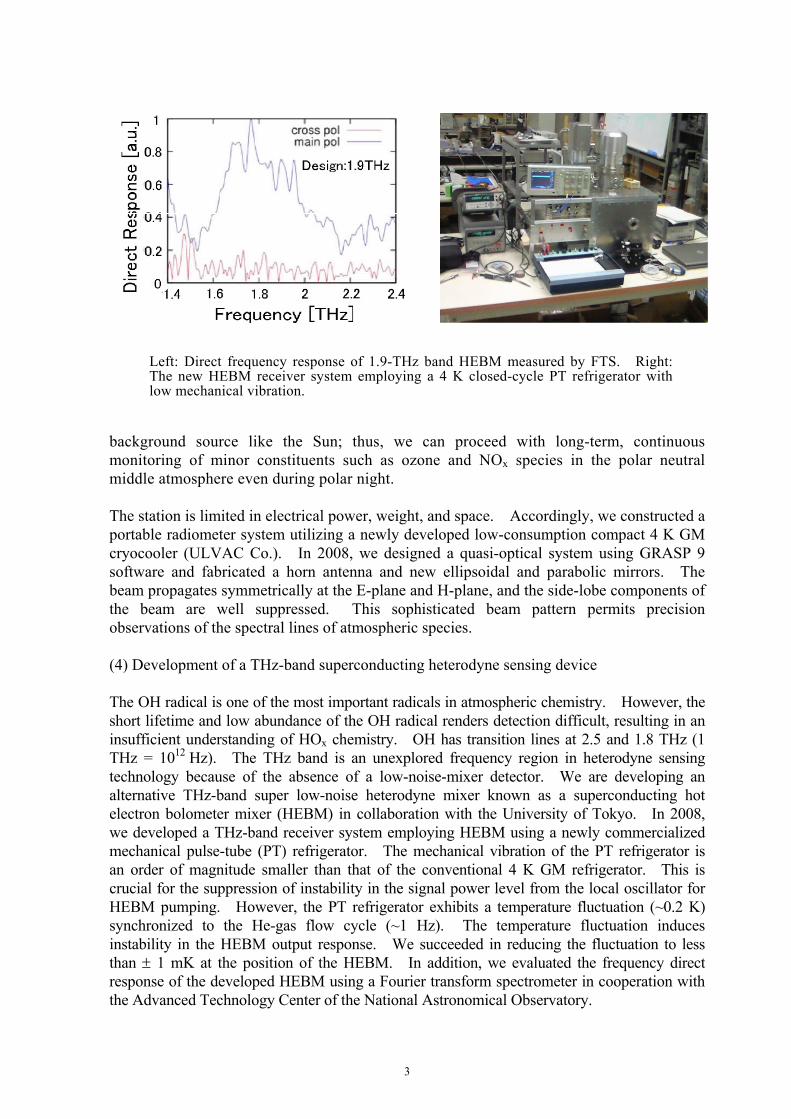
(4) Development of a THz-band superconducting heterodyne sensing device The OH radical is one of the most important radicals in atmospheric chemistry. However, the short lifetime and low abundance of the OH radical renders detection difficult, resulting in an insufficient understanding of HOx chemistry. OH has transition lines at 2.5 and 1.8 THz (1 THz = 1012 Hz). The THz band is an unexplored frequency region in heterodyne sensing technology because of the absence of a low-noise-mixer detector. We are developing an alternative THz-band super low-noise heterodyne mixer known as a superconducting hot electron bolometer mixer (HEBM) in collaboration with the University of Tokyo. In 2008, we developed a THz-band receiver system employing HEBM using a newly commercialized mechanical pulse-tube (PT) refrigerator. The mechanical vibration of the PT refrigerator is an order of magnitude smaller than that of the conventional 4 K GM refrigerator. This is crucial for the suppression of instability in the signal power level from the local oscillator for HEBM pumping. However, the PT refrigerator exhibits a temperature fluctuation (~0.2 K) synchronized to the He-gas flow cycle (~1 Hz). The temperature fluctuation induces instability in the HEBM output response. We succeeded in reducing the fluctuation to less than ± 1 mK at the position of the HEBM. In addition, we evaluated the frequency direct response of the developed HEBM using a Fourier transform spectrometer in cooperation with the Advanced Technology Center of the National Astronomical Observatory.
Left: Direct frequency response of 1.9-THz band HEBM measured by FTS. Right: The new HEBM receiver system employing a 4 K closed-cycle PT refrigerator with low mechanical vibration.

4
(5) Quantum cascade laser for 1 to 3 THz-band heterodyne sensing The heterodyne receiver, crucial for astronomical and atmospheric spectroscopy, is composed of a mixer and a local oscillator source (LO) for a reference frequency. At frequencies of several THz, no heterodyne receiver has been sufficiently developed due to the unavailability of practical solid-state LO sources. We are currently testing the utility of quantum cascade lasers (QCLs) as an LO source in collaboration with the National Institute of Information Communications (NICT) and the University of Tokyo. QCLs can emit intense 1 to 3 THz-band continuous waves, promising a coherent THz-band LO source for heterodyne sensing. We cool the QCL to 40 K in the first cooling stage of our PT cryostat system. In the cryostat vacuum chamber, the intense THz-wave from the QCL, and a faint THz-wave signal from another commercial solid-state source are fed directly to our HEBM detector through several cooling optical mirrors. Then, the beat signal output from the HEBM is compared with a reference signal. Finally, the phase difference is fed back to the QCL’s bias current to stabilize the QCL’s emission frequency. In 2008, we designed and developed the optical propagation components, the QCL current source circuit, and the QCL current cable assemblies cooled in the cryostat system. This project was supported by a research grant from the National Astronomical Observatory.
Observational and Laboratory Studies of the Lower Atmosphere
(1) Comparison of NO2 measurements at Tokyo urban site Nitrogen oxides (NO and NO2) play an important role in tropospheric chemical processes. Fossil fuel combustion is the major source of NOx, which is mainly emitted as NO and subsequently rapidly oxidized to NO2 by ozone or the peroxy radicals HO2 and RO2 (where R is an organic radical). NO2 can be converted back to NO during the daytime by photolysis, producing an oxygen radical, which can subsequently react with molecular oxygen to form ozone. Currently, the most widely used technique for the measurement of ambient NO2 is chemiluminescence using a Mo-catalytic converter (Mo-CL). This involves the reduction of NO2 to NO using a heated molybdenum oxide catalyst, followed by detection of the chemiluminescent reaction of NO with O3. The NO2 concentration can be determined quantitatively by subtracting the NO signal observed prior to exposure of the sample air to the catalyst. The main difficulty with this approach is that many other
0 10 200
10
20
[NO2(CL)] / ppb
[NO
2(LI
F)] /
ppb
0 50 100 150-5
0
5
10
Inte
rfere
nce
[O3] /ppb
Left: Correlation plot of NO2 concentration measured by the LIF, [NO2(LIF)], and the Mo-CL instruments, [NO2(CL)], (○: [O3]>130 ppb, ●: [O3]<130 ppb). Right: Interference between [NO2(LIF)] and [NO2(CL)] vs. [O3].

5
nitrogen-containing species, such as nitric acid (HNO3) and alkyl nitrates, may also be decomposed to yield NO when exposed to the catalyst. We measured NO2 concentrations in central Tokyo during the summers of 2007 and 2008 using a laser-induced fluorescence (LIF) instrument developed in-house and a commercially available Mo-CL detector for comparison. The ambient O3 concentration was also measured with an ultraviolet absorption spectrometry instrument. We developed the LIF instrument for measuring ambient NO2 using a 410-nm GaN diode laser. The NO2 LIF signal is detected by a photomultiplier tube and processed using the photon-counting method. A tight correlation between the NO2 concentrations determined by the LIF and Mo-CL techniques was evident when the O3 concentration was less than 80 ppbv. When the O3 concentration was as high as over 100 ppb (○ in left panel), however, the NO2 concentrations determined by the Mo-CL technique were systematically higher (by 3 – 5 ppbv) than those found by the LIF technique. This systematic discrepancy may be explained by chemical interference from organic and inorganic nitrogen species other than NO2 in the concentration determinations by the Mo-CL technique. (2) Determinations of the thermal decomposition rate constant of dinitrogen pentoxide Nitrogen oxides play an important role in atmospheric photochemistry. The budget for the emissions of NOx and its rate of removal from atmosphere are of substantial current interest. NOx is removed from the atmosphere primarily by conversion to HNO3, which is removed via wet deposition to the surface or rain-out. Two pathways are available to convert NOx to HNO3. One is the daytime reaction of NO2 with OH: NO2 + OH + M → HNO3 + M (1) The other is heterogeneous reaction of dinitrogen pentoxide (N2O5) with water on surfaces to form HNO3: N2O5 + H2O(surface) → 2HNO3 (2) The NO3 radical is formed via the oxidation of NOx by O3: NO + O3 → NO2 + O2 (3) NO2 + O3 → NO3 + O2 (4) Subsequently, NO3 can react with NO2 to form N2O5 reversibly. NO3 + NO2 + M ↔ N2O5 + M (5,-5) Both NO3 and N2O5 are removed relatively quickly during the day because NO3 has a
656 660 664 6680
0.2
0.4
Wavelength (nm)
Loss
rate
(10-6
cm
-1)
O3
NO3
0
1
2
0.0028 0.0032 0.0036-5
-4
-3
-2
-1
0
1
2
1/T (K-1)
log 1
0(k N
2O5+
M, s
-1)
Cantrell at al. (1993)Viggiano et al. (1981)This Work
Left: Absorption spectra of NO3 and O3 recorded by CRDS. Solid lines show the reference spectra. Right: Arrhenius plot of the rate constants for thermal decomposition of N2O5.

6
significant absorption cross-section in the solar actinic wavelength region. The reverse reaction (-5) is temperature-dependent. These facts contribute to a general view that the chemistry of N2O5 is activated mainly in the cold nighttime. Understanding the chemistry of tropospheric nitrogen oxides thus requires investigation into the thermal decomposition rate of N2O5 as a function of temperature. We determined the decomposition rate of N2O5 at 760 Torr as a function of temperature between 314 and 348 K using cavity ring-down spectroscopy (CRDS). In our present study, a CRDS detector was attached to a temperature-regulated reactor to detect NO3 radicals generated through reactions involving NO and O3. The NO3 concentrations in the reactor were measured by the CRDS at 662 nm. Time-dependent model calculations for reactions involving NO and O3 were performed to estimate the NO3 concentrations in the reactor under our experimental conditions. In the calculations, the values of the decomposition rate constant, k-5, were determined so that the observed concentrations of NO3 could be reproduced. As a result, the Arrhenius expression of the thermal decomposition rates, which is incorporated with literature values, was determined to be 1.36×10¹⁵ exp {(-11300 ± 200) / T} s-1 over the 263-348 K temperature range. (3) Laboratory observations of Br(2P1/2) collision removal Chemical processes related to the bromine atom are crucial to both stratospheric and tropospheric chemistry. Bromine compounds such as CH3Br, CH2Br2, CF2ClBr (Halon-1211), and CF3Br (Halon-1301) are emitted into the atmosphere by a variety of natural and anthropogenic sources. Bromine atoms released from these compounds have a significant impact on ozone destruction in the lower stratosphere and also in the troposphere (especially during polar sunrise). Therefore, kinetic studies related to the bromine atom are important. Bromine has two spin-orbit states: Br(2P3/2) (denoted Br) and Br(2P1/2) (denoted Br*), separated in energy by 3685 cm-1, with the Br* being higher in energy. In the present study, a pulsed-laser photolysis/vacuum ultraviolet laser-induced fluorescence spectroscopy (PLP/VUV-LIF) technique for direct detection of Br* at 157.48 nm was developed and applied to kinetic studies to determine the rate coefficients of Br* collision removal at 295 ± 2 K. The VUV laser light, tunable around 157.48 nm, is generated by a two-photon resonance four-wave frequency mixing technique in Xe. The Br* atoms are produced from photo-dissociation of CH3Br at 193 nm. Time-resolved measurements of the Br* LIF allow us to determine the collision removal-rate coefficients. The rate constants for the collision
Left: Cavity-ring down aerosol extinction spectrometer (CRD-AES) developed in the Atmospheric Environment division. Right: Correlation plot for CRD-AES and Neph + PSAP extinction coefficient (○: [O3]>130 ppb, ●: [O3]<130 ppb).

7
removal of Br* by H2, CO2, CF4, CF2H2, H2O, CH3OH, and SF5CF3 were successfully determined, and the results will be useful in examining bromine atom atmospheric chemistry. (4) Ambient aerosol observations using a cavity ring-down aerosol extinction spectrometer Aerosol particles play an important role in atmospheric radiation balance by scattering and absorbing incident light. Therefore, accurate determinations of the optical properties of atmospheric aerosols are essential. Aerosol optical extinction has two components: scattering and absorption. Extinction coefficients of atmospheric aerosol have commonly been determined by measuring scattering coefficients using a nephelometer (Neph), and absorption coefficients have been determined using a particle/soot absorption photometer (PSAP). We have developed a cavity ring-down aerosol extinction spectrometer (CRDS) to measure extinction coefficients. Simultaneous measurements of extinction, scattering, and absorption coefficients of ambient aerosols were performed in central Tokyo during the summers of 2007 and 2008 using the CRDS instrument, a nephelometer, and a PSAP, respectively. Gas-phase ozone concentrations were also measured using a commercial instrument. Extinction coefficients measured with the CRDS were compared with those determined from the sum of scattering and absorption coefficients measured by the nephelometer and the PSAP. The extinction coefficients measured by CRDS were in excellent agreement with those for Neph + PSAP, except for the data on days when high concentrations of ozone (more than 130 ppbv) were observed. On those days, the extinction coefficients for Neph + PSAP were about 10% larger than those for CRDS. A part of the overestimations could be explained by overestimation of absorption coefficient measured by PSAP due to interference of coexisting non-absorbing aerosols such as secondary organic aerosols. (5) Sources of lead-containing aerosol particles observed at Cape Hedo, Okinawa In the spring, aerosol particles emitted from China, including mineral dust “Kosa” and fly-ash are often transported to Japan. These particles contain various metals. Lead (Pb) is one of the heavy metal elements and harmful pollutants contained in aerosol particles. In the present study, using a laser-ionization single-particle aerosol mass spectrometer (LISPA-MS) developed
Typical TOFMS spectra for an ambient particle assigned to one of four categories (A-D).

8
in-house, we observed atmospheric aerosol particles at Cape Hedo, Okinawa, in the spring of 2006. During the observations, positive ion spectra for 85000 particles were acquired, and 8596 of them included the signal for lead. We investigated the chemical composition and transportation of particles containing lead. The lead-containing particles were categorized into four different types: (A) mineral dust particles (containing Al and Fe); (B) particles generated by the burning of fossil fuels (containing Fe); (C) particles resulting from combustion of industrial waste (containing Pb, Fe, and Sn); and (D) particulate emissions from the use of lead-containing gasoline (not containing Al, Fe, and Sn). Backward trajectory analyses showed that particles belonging to types (A)-(C) were typically transported from China, whereas type (D) was typically transported from the Southeast Asia. Our results show that the LISPA-MS is a powerful tool for estimating the origins of particles, especially those containing metals.
Millimeter/Submillimeter-Wave Band Observations of Planetary Atmospheres
Investigating the minor constituents and isotope ratios of planetary atmospheres is useful for understanding the evolutionary processes of the solar system and the habitable zone, the origin of life, and so on. We have promoted long-term monitoring of solar and planetary atmospheres in order to study the influence of solar activities on the atmospheric chemical and physical environments. In November to December of 2008, we observed a 230-GHz band CO (J = 2-1) absorption line from Venus’ atmosphere using Nagoya University’s NANTEN2 4-m radio telescope operating at Pampa La Bola in the Atacama highland (alt. 4800 m). The intensity of the CO line observed in the Orion KL region was utilized for system calibration. Although the apparent diameter of the Venus, 10 to 15 arcsec, was smaller than the beam size of NANTEN2 (90 arcsec), we verified that the change in intensity of the CO absorption lines responded precisely to the change in Venus’ apparent diameter. The continuum emission level of this 230-GHz band CO absorption line was consistent with the temperature of Venus’ atmosphere at an altitude of around 55 km. In March 2008, we also observed the CO (J = 1-0) absorption line in the Martian atmosphere at 115 GHz using the Nobeyama Radio Observatory 45-m telescope. The apparent diameter of Mars (about 5 arcsec) was smaller than the beam size of the 45-m telescope (about 15 arcsec at the 115-GHz band). The CO absorption intensity observed with the 45m-large telescope aperture was seriously affected by pointing errors caused by wind. We found that Mars’ CO absorption lines would be observable with a high enough S/N ratio in calm weather.
Left: 230-GHz band CO absorption lines of Venus’ atmosphere observed with NANTEN2 telescope. Right: Monitoring display of Martian atmosphere 115-GHz band CO absorption line observed with 45-m telescope.

9
IONOSPHERIC AND MAGNETOSPHERIC ENVIRONMENT
The Division of the Ionospheric and Magnetospheric Environment is concerned with the physical processes of energy transfer from the magnetosphere into the ionosphere and the thermosphere, and from the lower atmosphere to the upper atmosphere at various latitudes. Particles and fields in the magnetosphere and high- and low-latitude auroral phenomena are also studied. These research activities are pursued mainly through ground-based observations using radio and optical equipment at widely dispersed stations. Studies using the European incoherent scatter radars have provided new insights into auroral phenomena and the high-latitude lower thermosphere. Optical, radar, and GPS satellite observations have contributed greatly to an increased understanding of the ionosphere, thermosphere, and upper mesosphere.
OMTIs
Optical mesosphere thermosphere imagers (OMTIs) have been under development since 1997. They are designed to study the dynamics of the thermosphere and the mesopause region. The OMTIs consist of two scanning Fabry-Perot interferometers (FPIs), 12 all-sky CCD imagers, three tilting photometers, a spectral airglow temperature imager (SATI), and three airglow temperature photometers. The OMTIs are located at several key points around the world: Shigaraki (34.8°N, 136.1°E), Rikubetsu (43.5°N, 143.8°E), Sata (31.0°N, 130.7°E) and Yonaguni (24.5°N, 123.0°E) in Japan, Darwin (12.4°S, 131.0°E) in Australia, Kototabang (0.2°S, 100.3°E) in Indonesia, Resolute Bay (74.7°N, 265.1°E) and Athabasca (54.7°N, 246.7°E) in Canada, Magadan (60.1°N, 150.7°E) and Paratunka (53.0°N, 158.2°E) in Russia, and Tromsø (69.6°N, 19.2°E) in Norway. These instruments measure nightglow emissions, neutral wind, and neutral temperature at an altitude of 80-300 km. All OMTIs are fully automated. (1) Auroral observations Using 30-Hz sampling all-sky cameras, we conducted an auroral observation campaign at Fort Smith and Gillam, Canada, in February-March 2009 in collaboration with the THEMIS satellite project. Several interesting events related to auroral substorms and pulsating auroras are under examination. Routine observations of aurora and airglow at Resolute Bay and Athabasca, Canada, were continued in 2008. (2) Airglow observations in far eastern Russia Two all-sky airglow imagers and two induction magnetometers were installed at Paratunka (August 2007) and Magadan (November 2008) in Russia, and routine measurements of airglow and geomagnetic pulsations commenced. Medium-scale traveling ionospheric disturbances (MSTIDs), atmospheric gravity waves, and Pc1 geomagnetic pulsations were investigated by comparing these data obtained in far-eastern Russia with data collected at the Japanese stations.

10
(3) Observations of isolated proton auroras at subauroral latitudes We continuously conduct observations of optical auroras and magnetic fields using a filtered all-sky imager and an induction magnetometer (64-Hz sampling), respectively, at Athabasca, Canada (L = 4.5). The station is located in the magnetic footprints of the plasmapause. These instruments have often observed “isolated proton auroras” at latitudes equatorward of the auroral oval simultaneously with Pc1 geomagnetic pulsations associated with He+-band electromagnetic ion cyclotron (EMIC) waves at the magnetic equator. These results show, for the first time, evidence supporting theoretical predictions that EMIC waves scatter the pitch angles of ring-current ions in the vicinity of the plasmapause and cause proton auroras at subauroral latitudes due to proton precipitation.
Ground- and Satellite-Based Observation of Storms and Substorms
(1) THEMIS satellite-ground campaign observations Auroral structures and dynamics are known to change dramatically from the initial brightening until the auroral expansive phase. The 30-Hz sampling all-sky imagers for the THEMIS satellite-ground campaign observations revealed two spatial and temporal parameters in rapidly developing auroras. One was the longitudinal width of the initial brightening region extending from ~30 to 60 km. The other was expanding speeds in brightening areas that were ~20 km s-1 directed either westward or eastward in the first 10 s.
Snap shots of isolated auroras observed simultaneously with Pc1 geomagnetic pulsations. Bright areas in the north (top of images) are the equator boundary of the auroral oval.

11
(2) Study of broadband electrons during geomagnetic storms “Broadband electrons (BBEs)” are one cause of low-latitude auroras during geomagnetic storms. BBEs are remarkable flux enhancements of precipitating electrons over a broad energy range near the equatorward edge of the auroral oval during storms. When the FAST satellite observed the BBEs, the Double Star TC-1 satellite was located on nearly the same magnetic field lines as FAST. Based on the particle and field data from these satellites, we concluded that the BBEs consisted of electrons accelerated or heated at different altitudes between the inner magnetosphere and the ionosphere. Using global auroral images obtained by the Polar and IMAGE satellites during BBE events, we showed that BBEs occur within limited latitudinal (magnetic latitude (MLAT) <10˚) and local time (magnetic local time (MLT) < 2 h) widths and over a short timescale (~10-14 min) after the onset of a storm-time substorm. This BBE study is essential to understanding the magnetosphere-ionosphere coupling processes during storm-time substorms, which are not yet completely understood.
Mid-Latitude Ionospheric Disturbances Observed by GPS Networks
We conducted simultaneous observations of daytime (MSTIDs) over North America, using measurements of the Total Electron Content (TEC) by the US GPS network and ionospheric plasma data from the DEMETER micro-satellite. Sinusoidal variations in plasma density and ion velocity parallel to the geomagnetic field were observed along the satellite orbit. These variations coincided with the MSTIDs revealed on the two-dimensional maps of GPS-TEC. This observational result suggests that the daytime MSTIDs are caused by atmospheric gravity waves. In order to investigate the effects of earthquakes, we analyzed GPS-TEC data following twenty earthquakes of magnitude greater than 6.0 occurring around Japan from January 2000 to October 2007. In four cases, TEC variations were observed approximately 10 minutes after the earthquakes. In all four cases, directivity in TEC variations with respect to the azimuth from the epicenter was seen. This feature suggests that the acoustic waves generated by the earthquake could propagate into the ionosphere and thermosphere.
Observations of the Equatorial Thermosphere/Ionosphere Over Indonesia
Continuous observations of field-aligned irregularities (FAIs) using a VHF Doppler radar with a carrier frequency of 30.8 MHz at Kototabang, Indonesia (0.20°S, 100.3°E; dip latitude 10.4°S) revealed that F-region FAIs appeared frequently in the pre-midnight between March and April and in the post-midnight between May and August. The pre-midnight FAIs, propagating mainly eastward, are unquestionably associated with equatorial plasma bubbles, and the post-midnight FAIs, propagating westward, are similar to mid-latitude FAIs. Since August 2007, 150-km FAI measurements have been performed with the Kyoto University’s Equatorial Atmosphere Radar (EAR) for 5-10 days every month. We found that the occurrence rate of the daytime 150-km FAIs over Kototabang showed a distinct seasonal variation, with a maximum between August and February and a minimum between March and June. Comparison with observations at other locations suggests that the 150-km FAI occurrence could depend strongly on latitude.

12
SuperDARN Hokkaido HF Radar
The SuperDARN Hokkaido HF radar at Rikubetsu, Hokkaido, began continuous operation in December 2006. Because this radar is situated at lower latitude than the preexisting SuperDARN radars, the dynamic coupling processes in the high- to mid-latitude upper atmospheres can be explored. During two years’ operation, we observed a wide variety of interesting phenomena, such as sub-auroral ion drift (SAID)-type westward plasma flows in the dusk region, TIDs, and poleward plasma flows near the cusp region during a large geomagnetic storm. In addition, we found a relationship between SAID-type flows and substorms / ring-current developments, latitudinal dependence of the MSTID characteristics, and a strong electrical coupling between the MSTIDs and Es layers at night. We also found daytime large-scale traveling ionic disturbances (LSTIDs) propagating both equatorward and poleward. Comparisons with GPS-TEC data showed that the ionospheric downward motion was correlated with increasing TEC. This relationship is consistent with the calculation based on models of atmospheric gravity waves propagating through the ionosphere. Furthermore, we confirmed the frequent presence of nightside ionospheric backscatter echoes and started detailed statistical analysis of ionospheric convection in the mid-latitude region, including its seasonal dependence.
Data Archives
The following data archives are available to the public: ・ OMTIs database (http://stdb2.stelab.nagoya-u.ac.jp/omti/): Quick-look plots of OMTIs
data since 1998. ・ GPS-TEC database (http://stdb2.stelab.nagoya-u.ac.jp/GPS/TEC-DAWN/): Quick-look
plots of GPS-TEC over North America since 2002.
(a) Combined 2-D plot of the SuperDARN Hokkaido radar data and GEONET data. (b) Combined Beam 0 Doppler velocity data from the SuperDARN Hokkaido radar and the perturbation component of the TEC values obtained with GEONET, sampled along the red arrow in (a). The data show the presence of LSTIDs propagating both equatorward and poleward through their fields of view.

13
・ GPS scintillation database (http://stdb2.stelab.nagoya-u.ac.jp/QL-S4/): Quick-look plots of GPS scintillation data obtained at Kototabang, Indonesia and Tromsø, Norway.
・ VHF radar database (http://stdb2.stelab.nagoya-u.ac.jp/vhfr/): Quick-look plots of VHF coherent echo data obtained at Kototabang, Indonesia.
・ SuperDARN Hokkaido radar database (http://center.stelab.nagoya-u.ac.jp/hokkaido/): Quick-look plots of SuperDARN HF radar data obtained at Rikubetsu, Japan.
・ STEL magnetometer database (http://stdb2.stelab.nagoya-u.ac.jp/magne/index.html): Quick-look plots of several induction and fluxgate magnetometers operated by STEL.
・ 210-MM magnetic field database (http://stdb2.stelab.nagoya-u.ac.jp/mm210/): Ground-based network observations of the geomagnetic field along the meridians at geomagnetic longitudes 190°, 210°, and 250°. This database was created in collaboration with Kyushu University.
・ STEL ELF/VLF data (http://stdb2.stelab.nagoya-u.ac.jp/vlf/index.html): Data list of analogue VLF/ELF tapes obtained by STEL since 1976.
EISCAT Project Promotion: Synthetic Observations with Collocated Instruments in Northern Scandinavia
The European Incoherent Scatter (EISCAT) Radar Scientific Association is an international organization concentrating on operation of the radar systems for research activities on the terrestrial atmosphere, ionosphere, and magnetosphere. To improve our understanding, we accumulate a variety of instruments in northern Scandinavia. One of the instruments recently installed at the Tromsø site is a Fabry-Perot interferometer (FPI), which began routine observations in January 2009. A sodium lidar will be assembled at Tromsø in February 2010. These new instruments join collaborative observations with the EISCAT radar,
Major instruments participating in the DELTA-2 campaign and their observation parameters and locations.

14
medium-frequency (MF) radar, and meteor radar to conduct complementary and synthetic observations throughout the ionosphere, thermosphere, and mesosphere at high latitudes. One of the advantages of these collaborative observations is that wind and temperature can be measured at high temporal resolutions (timescale of a few minutes). This was difficult for each instrument alone. Simultaneous measurements of wind and temperature will significantly improve our understanding in this field and give us new insights that may lead to scientific breakthroughs. The four-wavelength photometer, the proton imager, the electron auroral camera, and the multi-wavelength all-sky camera are operated automatically at Tromsø in winter. Synthetic observations with these radio and optical instruments allow us to study the energy budget and wind dynamics in the upper atmosphere at high latitudes.
DELTA-2 Campaign: Energetics and Wind Dynamics in the Polar Lower Thermosphere
The Dynamics and Energetics of the Lower Thermosphere in Aurora 2 (DELTA-2) campaign was conducted using the S-310-39 rocket, the EISCAT UHF radar, FPI, and various optical instruments to study the energetics and the wind dynamics in the polar lower thermosphere. The S-310-39 sounding rocket, which carried trimethyl aluminum (TMA) to conduct in-situ measurements of the neutral wind, was launched from the Andøya rocket range at 00:15 UT on January 26, 2009. An auroral breakup occurred about 10 minutes after the rocket launch. The EISCAT UHF radar was operated for 107.5 hours during the campaign under international collaboration with Norway, Sweden, Finland, Germany, France, and Japan. The data taken during the campaign were appropriate for studying many scientific issues, such as the wind dynamics, ionospheric conductivity, and the ionospheric current system. The FPI (557.7 nm) was operated with the rocket observations and provided dramatic wind variations associated with the breakup. The FPI remained in operation after the campaign.
Effects of the Geomagnetic Activity on Lower Thermospheric Wind at High Latitudes
It is well known that the lower thermospheric wind can fluctuate during geomagnetic active periods with larger amplitudes than mean tidal motions. However, further studies are
Distribution of the neutral wind speed in the lower thermosphere (118 km height) based on data of 63 days from the ESR.
15
necessary to completely understand effects of the geomagnetic activity in a more quantitative manner. Statistical analysis of EISCAT Svalbard Radar (ESR) data over about 63 days shows that the occurrence rate of high-speed winds in excess of 500 m s-1 is about 4 % of the total. One of the high-speed events suggests that the pressure gradient due to the Joule energy dissipation accelerates the wind more effectively than do other terms such as ion drag. Results from the EISCAT KST radar also suggest that the pressure gradient is the principal source of vertical motion in the lower thermosphere.
Optical and EISCAT Radar Study of the Proton Aurora
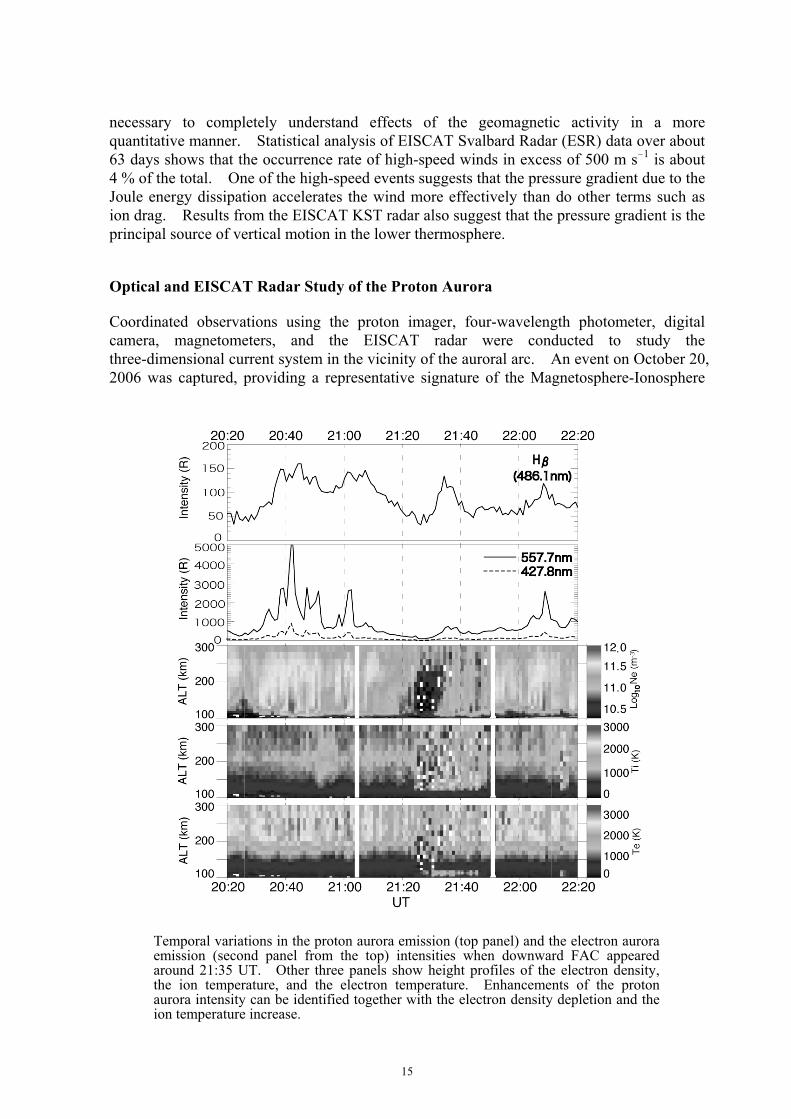
Coordinated observations using the proton imager, four-wavelength photometer, digital camera, magnetometers, and the EISCAT radar were conducted to study the three-dimensional current system in the vicinity of the auroral arc. An event on October 20, 2006 was captured, providing a representative signature of the Magnetosphere-Ionosphere
Temporal variations in the proton aurora emission (top panel) and the electron aurora emission (second panel from the top) intensities when downward FAC appeared around 21:35 UT. Other three panels show height profiles of the electron density, the ion temperature, and the electron temperature. Enhancements of the proton aurora intensity can be identified together with the electron density depletion and the ion temperature increase.

16
coupled system, showing proton auroral emission, ionospheric density depletion, and ionospheric electric-field enhancement poleward of the arc.
S-310-38 Sounding Rocket Observations of Ionospheric Horizontal Structure
Ultraviolet resonant scattering from magnesium ions (Mg+) in the sporadic E (Es) layer at 100 km altitude was observed with the Magnesium Ion Imager on the S-310-38 sounding rocket launched from Uchinoura Space Center on February 6, 2008. Spatial perturbation was found in the relative intensity distribution of the Mg+ resonant scattering. This is the first direct observation of the two-dimensional horizontal structure of Mg+ in the Es layer. Neutral winds at 85-95 km altitude were observed simultaneously with the foil chaff released from the sounding rocket.
Database of EISCAT Radar and STEL Optical Instruments
The analyzed data and quick-look figures are available for download from the following URL: http://www.stelab.nagoya-u.ac.jp/~eiscat/data/EISCAT.html. A number of domestic and oversea researchers access and download these data for their scientific activities. The web page provides physical parameters, such as the electric field and the ionospheric conductivity, together with general ionospheric parameters estimated with the EISCAT radar. The database includes (1) 20-year Tromsø UHF radar data (from 1987 to 2006), (2) 9-year Tromsø VHF radar data (from 1990 to 1998), (3) 7-year ESR data (from 1998 to 2004), (4) 9-year optical data taken with the digital camera, the 4-chanel photometer, and the proton imager (from 2001 to 2009).

17
HELIOSPHERIC ENVIRONMENT
The research goal of the Division of the Heliospheric Environment is to understand the heliosphere within the context of the Earth’s environment. Our primary interest now is in the physical processes of the Sun, interplanetary space, the heliospheric boundary, and other astrophysical phenomena. In addition, we study the paleoenvironment of the heliosphere. We carry out our research using ground-based observations, satellite data, and computer simulations. The major subjects of our ground-based observations are cosmic rays, solar energetic particles, the solar wind, extra-solar planets and dark matter.
IPS Observations
On April 3, 2008, we started interplanetary scintillation (IPS) solar wind measurements using three antennas (excluding the Toyokawa antenna) of the STEL multi-station system. Mechanical parts of the Fuji and Kiso antennas were upgraded in May and June, 2008, respectively, to achieve simultaneous observations with a new Toyokawa antenna. Observation at Fuji was stopped for 2 weeks in late August 2008 due to serious damage in the front-end controller, antenna angle encoder, back-end and communication modules. The solar wind speed data from April 3 to November 27, 2008 and g-value data from April 3 to November 28, 2008 are available online at http://stesun5stelab.nagoya-u.ac.jp/ ips_data-e.html. The Toyokawa antenna started test observations in April 2008 and shifted to routine observations in September 2008.
International Collaboration
We joined the Whole Heliosphere Interval campaign, an international collaboration program for observational studies of the heliosphere during Carrington rotation CR2068 (from March 20 through April 16, 2008). The 3-D features of the solar wind were reconstructed from IPS data in collaboration with the UCSD group. The corotating structure determined from this analysis showed good agreement with in situ measurements. We also attempted to make an extremely long-baseline IPS experiment by connecting between Ooty (India), ESIACT and STEL IPS antennas. Unfortunately, no useful IPS data were obtained from this experiment owing to system failures.
Structure and Dynamics of ICME in the Solar Wind (Project 1)
Cosmic ray modulation network observations provide information on the (large-scale) interplanetary magnetic field, which cannot be obtained from IPS observations. We are collaborating with cosmic ray researchers from three Japanese universities (the Shinshu University, the College of Nagoya Women’s University, and the Osaka City University) to understand the magnetic and plasma properties of coronal mass ejections (CMEs) in the solar wind (a Geospace Research Center project program entitled, “Study of elementary plasma processes in coronal mass ejections”). In 2008, we started a project to increase the area of the Sao Martinho (Brazil) muon detector to improve the duty cycle of the Global Muon Detector Network (GMDN) in collaboration with the Shinshu University group. We successfully identified cosmic ray intensity variations associated with the corotating solar

18
wind structure from analysis of GMDN data taken to date. In addition, we began to collaborate with a research group from the College of Nagoya Women’s University and the Osaka City University, aiming for high-resolution detection of cosmic ray variations associated with CMEs by the GRAPES-3 large-area muon detector at Ooty (India).
Unusual Solar Wind Structure during Sunspot Minimum
More than two decades’ of STEL IPS observations have shown that the 3-D structure of the solar wind changes drastically during the 11-year sunspot cycle. The IPS data taken in the previous sunspot minima showed that the solar wind consisted of fast and slow streams at mid- to high-latitudes and at the equator, respectively, and this bimodal structure was stable over several solar rotation periods. However, STEL IPS observations taken in 2008 indicated that the solar wind structure differed significantly from the abovedescription, despite an extremely low level of solar activity combined with a long-lasting spotless condition. The solar wind in 2008 was composed of fast streams over two poles and at the equator and slow winds between them. In addition, the solar wind structure evolved from one solar rotation to the next. This differs significantly from the typical features observed at minimum. Clear evidence supporting the emergence of the fast solar wind at the equator was obtained from in situ measurements in Earth orbit. Peculiarities of the solar wind are regarded as a manifestation of the solar dynamo activity in cycle 24. The current cycle is characterized by some unusual features (e.g., weak magnetic field strength at the pole and the longest spotless periods in fifty years). Hence, we need to monitor carefully the evolution of the solar wind structure as solar activity progresses.
Solar Wind Acceleration Mechanism Studies
We carried out simultaneous IPS observations using the radio facilities at STEL (327 MHz) and EISCAT (933 MHz) during August and September in 2006. These collaborative observations were made to evaluate errors that IPS measurements might make in estimating solar wind speed under radio strong scattering conditions. Another purpose of the observations was to define the acceleration profile of the solar wind in the near-Sun region.
Latitude variation of the solar wind speed determined from STEL IPS observations in 2008 (for the Carrington rotation 2070).

19
Solar wind velocity structure outside 0.3 AU from the Sun was obtained by tomographic analysis of STEL IPS data. We developed a simulation code to retrieve a cross-correlation function of EISCAT observations which covers a region within 0.3 AU from the Sun. The simulation results were compared to observations to permit iterative modifications to several parameters that control the shape of the cross-correlation function. In this study, we found the following: 1) Cross-correlation functions were successfully reproduced by adjusting only the solar wind velocity structure. This result indicates that parameters such as waves and random velocities which have been commonly used to fit the cross-correlation function in previous studies are not necessary for the period we studied. 2) In high-speed areas on line of sight (③-④, ④-⑤, ⑤-⑥ in left panel), solar wind speeds outside 0.3 AU are 150 km s-1 higher than those within 0.1-0.14 AU. This is evidence of continuous acceleration of fast solar wind outside 0.1 AU from the Sun.
Photospheric Magnetic Field Analysis using Hinode
We studied the numerical and visual differences in magnetic field properties between the polar region and the quiet Sun observed by Hinode/SOT. We found that the
Left panel: Line-of-sight of 3C273 observed in 25-26 September projected on the sphere with a radius of 0.3 AU. Background is tomographic velocity structure obtained by STEL IPS. Right panel: Best fitted cross-correlation function Dotted and dashed lines show observation and simulation, respectively. V1-V6 indicate solar wind speeds on six intervals of line-of-sight in left panel which are used in this fitting procedure.
Probability density function (PDF) of signed magnetic field strength. The solid and dashed lines stand for the South polar region, and the quiet Sun on East limb, excluding the area without horizontal field.

20
kilogauss-strength patches (kG-patches) in the quiet Sun are significantly different from those in the polar region. The size and number of the kG-patches are much larger in the polar region than in the quiet Sun. The magnetic patches are apparently bipolar in the quiet Sun. This is clearly seen in the histogram of signed magnetic field strength (probability density function (PDF)). The PDF for the quiet Sun is symmetric around zero, apparently showing balanced magnetic flux in both polarities. The PDF for the polar region is considerably asymmetric, showing the dominance of unipolarities. The bipolar nature of the quiet Sun and the unipolar nature of the polar region (coronal hole) may explain some of the significant differences between the two regions. In the polar region, numerous open field structures from kG-patches and minority bipolar magnetic fields may be related to the acceleration of the fast solar wind and the occurrence of polar plumes and polar jets.
Solar Neutron Telescope Study of Solar Particle Acceleration Mechanism
One of the main goals of the Cosmic Ray Group in the Heliospheric Environment Division is to study the origin of cosmic rays and the mechanism by which cosmic rays are accelerated to high energies. Cosmic rays are used to probe the heliosphere, where a number of important dynamic processes occur, providing us with information not obtainable from satellites. To study the particle acceleration mechanisms associated with solar flares, neutron measurements are preferable to charged particle (e.g., proton) counts, as the neutron is not deflected by the interplanetary magnetic field (IMF). The precise moment a neutron is emitted can be determined from the neutron energy. We eveloped solar neutron telescopes that measure the energy and direction of neutrons. Seven solar neutron telescopes have been constructed on mountains at various longitudes to detect solar neutrons over an entire day. High altitudes are required because neutrons are attenuated in the atmosphere. A network promoted by STEL to observe solar neutrons has been in operation since the beginning of solar cycle 23, thanks to the support of various groups and institutions. These seven high altitude stations are Norikura, Japan (137°E, 2770 m), Yanbajing, China (91°E, 4300 m), Aragats, Armenia (44°E, 3250 m), Gornergrat, Switzerland (8°E, 3135 m), Chacaltaya, Bolivia (68°W, 5250 m), Sierra Negra, Mexico (97°W, 4600 m), and Mauna Kea, U.S.A. (155°W, 4200 m). The solar neutron telescope located at the Norikura Cosmic
The solar neutron telescope at Sierra Negra in Mexico and collaborators.

21
Ray Laboratory of the Institute for Cosmic Ray Research has an area of 64 m2, making it the largest solar neutron telescope in the world. Neutrons are monitored at every station in the network automatically, barring minor troubles such as electronics damage. Every station is maintained in good condition through the efforts of collaborators. For example, in Armenia, neutron data, together with other kinds of cosmic ray data, are monitored in real-time by the Data Visualization Interface Network, from which detailed studies of cosmic ray variations are available. In Mexico, solar cell arrays and a windmill were arranged to produce electric power for the solar neutron telescope in case of main power failure. These improvements were realized in fiscal 2008. STEL has broached the idea of adding a more sensitive detector (the Super Solar Neutron Telescope) on an appropriate high mountain. This idea will be explored in fiscal 2009. The first sunspot observed in January 2008 provided evidence that solar cycle 24 had begun. Although solar activity has remained low since the beginning of solar cycle 24, it is expected to peak in 2012. We expect to accumulate more solar neutron events in the next fiscal years. This work was performed in collaboration with Konan University, Nihon University, Chubu University, Shinshu University, the Tokyo Institute of Technology, Yamanashi Gakuin University, the National Astronomical Observatory of Japan, Ehime University, RIKEN, the Institute for Cosmic Ray Research (ICRR) at the University of Tokyo, and many institutions around the world.
Astrophysical Neutrinos and Cosmic Ray Acceleration
Neutrinos are decay products of charged pions produced from cosmic ray–matter interactions. Cosmic neutrinos constitute a good probe of high-energy proton acceleration in the universe. Additionally, neutrinos can probe thermofusion processes and annihilation of neutralino dark matter in the Sun. The Super-Kamiokande (SK) is a 50-kt water Cherenkov detector located in the Kamioka mine 1000 m underground. We updated and calibrated the SK data acquisition electronics. In the new system, the signal from the photomultiplier tubes can be recorded without any dead time. We thus expect an improvement in total performance. We continued the analysis of up-going muon events from the direction of the Sun, as well as the event search from the terrestrial and galactic center directions. From these searches, we set upper limits on the neutrino flux produced from the annihilation of weakly interacting massive particles thought to be trapped in the gravitational potential of the various celestial objects. The theoretical interpretations of these limits are under consideration. This is a collaborative research project with ICRR University of Tokyo.
Cosmic Ray Interaction-Focused Accelerator Experiment
High-energy cosmic rays interacting with atmospheric molecules generate child particles resulting in particle clusters called “air showers.” By measuring air showers, high-energy cosmic rays have been studied by some large international collaborations. However, the

22
compilation of observational results is affected by uncertainties in the interaction model. Therefore, we constructed an experiment, called the LHCf, whose results will reduce the interaction model uncertainties. The experiment uses the Large Hadron Collider (LHC) accelerator, where the most energetic particles are artificially generated. LHC was constructed at Conseil Européen pour la Recherche Nucléaire (CERN) in Switzerland. It is a 14-TeV proton collider, corresponding to 1017 eV in the laboratory. LHCf is planned for the beginning of LHC’s commissioning, when the LHC luminosity is low. The LHC succeeded in circulating proton beams on 10 September 2008. Two days later, when a stable beam condition was established, LHCf successfully detected particles generated in the collisions between the beam particle and the residual gas in the beam pipe. Soon after that, a serious accident at the LHC postponed operation for one year. We have proceeded with a detailed study of the background, analysis of pi-zero meson events, and operation at lower energies based on Monte Carlo simulations. During January 10-11, 2009, 20 collaborators, including five from abroad, met in the Nagoya University and discussed the plan for the coming years. LHCf will take first science data once the LHC restarts late in 2009. The LHCf experiment is conducted in collaboration with the Shibaura Institute of Technology, Waseda University, Kanagawa University, Konan University, and institutions in the U.S.A., France, Italy, Switzerland, and Spain.
Wide Field Telescope Exoplanet Search
When a dark object passes across the line of sight between a star and an observer, the light of the star is amplified by the gravitational field of the dark object. Under these circumstances, the dark object behaves like a lens. Accordingly, this technique is referred to as the gravitational microlensing method. The gravitational microlensing method is a very effective tool for searching for the Galactic dark matter candidates, such as massive compact halo objects (MACHOs) and extra-solar planets. The probability of finding MACHOs and exoplanets through gravitational microlensing is very low, and only one such detection is expected to occur per year per tens of millions of stellar observations.
The signal detected with the LHCf front counter. Solid histogram shows the charge distribution of the signal synchronized with the proton beam while the dotted histogram indicates the one out of timing (background).

23
To detect gravitational microlensing events effectively, it is most advantageous to observe a dense region of stars, such as the Large Magellanic Cloud, the Small Magellanic Cloud, or the Galactic Bulge, using a large-area CCD camera and a wide-field telescope. We installed a 1.8-m telescope and a large CCD camera with a very wide field of view (2.2 square degrees) in New Zealand, and began observations in May 2005. Soon thereafter, we detected a planet of about 5.5 Earth masses (OGLE-2005-BLG-390Lb). In 2008, we detected ~600 microlensing events and issued alerts to follow-up groups in real-time. We discovered the planetary system with the smallest host star, MOA-2007-BLG-192L. This host star appears to be a late M-dwarf or brown-dwarf. This may be the first discovery of a planet around a brown dwarf. It is very important for understanding exoplanet formation scenarios. Members of the research team came from the School of Science of Nagoya University, Konan University, the Tokyo Metropolitan College of Astronautical Engineering, the Nagano College of Engineering in Japan, the Carter National Observatory, the University of Auckland, Massey University, the University of Canterbury, Victoria University in New Zealand, and University of Notre Dam in U.S.A.
Radiocarbon Measurements for Research of Past Solar Activity
The intensity of the galactic cosmic rays entering the terrestrial atmosphere is affected by solar activity. Radiocarbon (14C) is produced in the upper atmosphere by nuclear reactions initiated by cosmic rays. The radiocarbon becomes carbon dioxide, which circulates throughout the atmosphere with a portion being transported into the biosphere. By measuring the concentration of 14C in biological samples, such as tree rings, one can trace variations in cosmic ray intensity, and consequently, variations in solar activity during the years when 14C was absorbed by the sample.
Light curve of MOA-2007-BLG-192, the smallest host star system.

24
We previously measured the concentration of 14C in tree-ring samples from periods corresponding to grand solar minima, when the solar activity was very weak for several decades to a hundred years. We found that the solar activity varied periodically even during the Maunder Minimum (1645-1715 AD), when sunspots almost disappeared. We found that the cycle lengths of the periodicity (Schwabe and Hale cycles) during the Maunder Minimum were 14 and 28 years, corresponding to the present cycle lengths of 11 and 22 years, and that the polarity of the solar magnetic field reversed alternately every solar cycle during the grand solar minima. In contrast, the cycle lengths in the Spoerer minimum (1416-1534 AD) were 11 and 22 years, as at present. In 2008, we measured the 14C concentration during the 4th century BC grand solar minimum to clarify the difference of cyclicity in grand solar minima. The sample tree was a buried 300-year-old camphor tree from Kushima, Miyazaki in southern Japan. For all tree rings, the single-year samples were pretreated chemically to obtain cellulose, which was then converted to graphite to conduct measurements of radiocarbon concentrations. Measurements of 14C concentration were done by accelerator mass spectrometers (AMS) at Nagoya University and at the University of Tokyo Measurement accuracies were 0.3 to 0.35%. Preliminary results reveal that the period of the Schawabe cycle in the 4th century BC might have been about 14 years, not 11 years, as in the Maunder Minimum. Detailed analysis is in progress. It is expected that a more general mechanism of long-term variation in solar activity will be clarified by establishing the characteristics of periodicity change in various grand minima. This research was performed in collaboration with the Center for Chronological Research, Nagoya University and the Micro Analysis Laboratory, Tandem accelerator (MALT) of the University of Tokyo.
Verification of the Cosmic Ray-Induced Cloud Formation Hypothesis
Observational data show a correlation between solar activity and global climate. The effect of solar ultraviolet radiation is, in general, considered to be the main mechanism for this effect. However, a hypothesis was submitted that atmospheric ions are created by secondary cosmic rays, which are produced by primary galactic cosmic ray particles entering the Earth’s atmosphere, and that these control cloud formation in the lower troposphere. We began a preliminary experiment in order to test this hypothesis. In 2008, we constructed a simple prototype chamber with a flow of natural or synthetic air and investigated whether ion production and aerosol particle formation can be measured by changing the quantity of air constituents and substituting the radiation dose for cosmic rays. We confirmed that these measurements could be performed using an ion detector and a condensed particle counter. A full-scale experiment is being prepared. This research was performed in collaboration with Japan Agency for Marine-Earth Science and Technology (JAMSTEC).

25
INTEGRATED STUDIES
The Integrated Studies Division aims at tracing the flow of energy from the solar surface into the Earth’s upper atmosphere and its transformation on the way. The primary method of this research is to analyze data obtained from various points in the solar terrestrial environment. Data studies are complemented by computer simulations and modeling to help understanding of a number of phenomena in the coupled Sun-Earth system, such as solar flares, CMEs, interplanetary disturbances, boundary processes, plasma convection, magnetic storms, substorms, and aurorae. The study of “space weather” has evolved over the past decade for identifying and predicting space environment variations. We started the research program GEMSIS (Geospace Environment Modeling System for Integrated Study) in 2007 to build a geospace model that matches ground-based and satellite observations. Research activities are carried out by three subgroups: GEMSIS-Sun, -Magnetosphere and -Ionosphere, each focusing on fundamental issues in individual research field. ・GEMSIS-S: To understand the acceleration and transportation processes of high-energy
particles in solar flares, we developed a new numerical code based on the drift-kinetic Vlasov equation. It calculates the time-evolution of the particle distribution function with actual coronal parameters.
・GEMSIS-M: We developed a new global ring-current model (GEMSIS-RC) and radiation belt code (GEMSIS-RB) and conducted related observations, such as the oxygen supply to storm time ring current, acceleration and loss processes of radiation belt electrons by plasma waves. A new PC cluster system has been installed for development of these simulations.
・GEMSIS-I: We compiled data from satellites and ground observatories and constructed deductive and inductive methods for a sophisticated numerical model of the storm-time ionospheric electric potential.
GEMSIS-Sun
(1) Drift-kinetic modeling of particle acceleration and transport in solar flares To understand particle acceleration and transport mechanisms in solar flares, we developed a new numerical code using the drift-kinetic Vlasov equation. Our code describes the temporal evolution of the particle distribution function with actual coronal parameters. Numerical results can be compared directly with observations. Using this code, we investigated particle acceleration by convective electric fields generated through the flare. We found that the particles experienced two different mechanisms: Fermi acceleration in open magnetic field lines and drift acceleration in closed field lines. (2) Multiwavelength observation of electron acceleration in the 2006 December 13 flare We performed a multiwavelength observation of a solar flare occurring on December 1, with Hinode, RHESSI, and the Nobeyama Radioheliograph (NoRH) to study the electron acceleration sites and mechanisms. A photospheric vector magnetogram obtained from the Solar Optical Telescope on board Hinode and a hard X-ray (HXR) image taken with RHESSI revealed that the HXR sources were located at the region where horizontal
26
magnetic fields changed direction, i.e., magnetic separatrix. Microwave images taken with NoRH suggest that the accelerated electrons were distributed parallel rather than perpendicular to magnetic field lines. We conclude that these observations are evidence of electron acceleration due to curvature drift near the magnetic separatrix. (3) Trans-equatorial loop system formation process Large-scale magnetic loop systems connecting two active regions located in the northern and southern hemispheres, the trans-equatorial loop system (TLS), have been observed frequently with Soft X-Ray Telescope (SXT) on board Yohkoh. However, its formation process has not been fully understood. In this study, we analyzed a TLS that appeared at the west solar limb around May 27-30, 1998. This TLS exhibited soft X-ray brightness just after the eruption of pre-existing large-scale loop system that was not clearly seen in soft X-rays. In this case, the formation process could be the same as that of the cusp-type solar flares, i.e. magnetic reconnection above the loop system. However, a new question arises: how was the pre-existing large-scale loop system formed? Both of the two active regions connected by this TLS were located in the low-latitude boundary regions of the polar coronal holes. The interaction between the active region and the coronal hole played an essential role in forming the pre-existing large-scale loop system. (4) Magnetic helicity conservation-based estimates of magnetic field structures Solar flares often cause CMEs, and some CMEs cause geomagnetic storms. A magnetic cloud (MC) is the magnetic component of a CME. The magnetic structure of an MC is an enigma in solar physics and geophysics because of the limited in-situ observations of the solar wind. In this study, we compared magnetic helicities between MCs and solar active regions (ARs) and obtained helical field lengths in the MCs from the magnetic helicity conservation law. These helical lengths were found to be 0.1-1 AU, which is shorter than the 2.5 AU assumed for helical length in previous studies. Previous studies reported that magnetic helicities of MCs are larger by 10-100 times than are those of ARs based on the assumption that the axial length in the MC is longer than or equal to 2 AU. A new picture of the cylindrical MC model could be drawn from our helical lengths. In this new picture, helical structure localizes in a part of an MC. (5) Hinode flare catalogue We created a catalogue of the 155 solar flares observed with Hinode from October 2006 to April 2009. It contains the following information on the flares: date/time, location, GOES X-ray class, H-alpha importance, number of images taken with Hinode/XRT, and white light emission.
GEMSIS-Magnetosphere
(1) GEMSIS-ring current model To advance understanding of geomagnetic storms that cause significant influence on the geospace environment, we developed a new numerical algorithm for modeling the dynamics of ring-current particles in the Earth’s inner magnetosphere. It is believed that the dynamics of ring-current particles are critically important for the evolution of geomagnetic storms.

27
However, no standard numerical method has been developed involving self-consistent coupling between the ring-current particles and electromagnetic fields. We proposed a new closed set of equations that describes the self-consistent time development of both particles and fields. A drift-kinetic equation including the effects of time-dependent fields describes the transport of ring-current particles. The equation is coupled with the Maxwell equations in a self-consistent way through the current produced by the particles. A numerical code was developed to solve the nonlinear coupled equations. The code successfully captured the propagation of fast magnetosonic waves in a dipole magnetosphere. The upper figure shows the temporal development of field quantities at the equator: initially, dense plasma is located at around R = 5, causing pressure imbalance. This imbalance causes magnetosonic waves to be emitted from the dense region and to propagate in the magnetosphere. (2) GEMSIS-RB Observational results reported that geomagnetic storms can change the fluxes of relativistic electrons. Reeves et al. (2003) suggested that the effect of geomagnetic storms on radiation belt fluxes rests on a complicated balance between flux enhancement and loss. Several processes associated with loss and acceleration occur simultaneously. Therefore, it is difficult to identify causes of acceleration and loss. We developed the GEMSIS-RB code, a drift-approximated relativistic test particle simulation code, to investigate the behavior of relativistic electrons in the
Time development of radial velocity component (left), and latitudinal magnetic field component (right). Compressible magnetosonic waves are initially emitted at around R = 5 and then propagates in the magnetosphere. The magnetic pressure is decreased at R = 5, which compensates the initial pressure imbalance.
Result of GEMSIS-RB simulation. Initial distribution (left) and after 24 hours (right). Some of electrons trapped at high-latitude of dayside magnetosphere due to the drift shell bifurcation.

28
geomagnetic field. The GEMSIS-RB code showed that the drift loss process through the magnetopause is important for permanent loss of relativistic electrons. Further, we found that drift shell bifurcation (bifurcation of the drift shell close to the dayside magnetopause) creates a relatively stable drift path for about 90° pitch angle electrons; that is, such electrons are not easily lost from the geomagnetic field. This result suggests that previous test particle simulations in the 2-D equatorial plane may overestimate relativistic electron losses. (3) Evidence of MeV electron precipitation by electro-magnetic ion cyclotron waves It is well known that whistler mode waves cause the pitch angle scattering of radiation belt electrons. However, theoretical studies suggested that electro-magnetic ion cyclotron waves (EMIC) can resonate with electrons when electron energy becomes relativistic, and strong precipitation can result. Our unique set of ground (Athabasca, Canada) and satellite observations shows coincident precipitation of ions with energies of tens of keV and of relativistic electrons into an isolated proton aurora. The coincident precipitation was produced by wave-particle interactions with He+-band EMIC waves near the plasmapause. The estimation of pitch angle diffusion coefficients supports the conclusion that the observed EMIC waves caused coincident precipitation of both ions and relativistic electrons. This study clarifies for the first time that ions with energies of tens of keV affect the evolution of relativistic electrons in the radiation belts via cyclotron resonance with EMIC waves in geospace, an effect that was first theoretically predicted in the early 1970s. (4) Discrete auroral arc movement and structure Observations from the small satellite REIMEI were used to further investigate the processes that drive the movement and structuring of discrete auroral arcs. This included the development of a new multi-scale technique for analyzing movies of the aurora based on the wavelet transform and of a new 3-D two-fluid magnetohydrodynamic (MHD) code for the aurora. A survey of REIMEI auroral imagery recorded from November 2005 to February 2008 defined a range of scales and velocities and morphologies including curls, folds, kinking and counter-streaming features suitable for comparison with simulation results. Through this approach, we were able to account for the formation of curls and folds and to define the conditions under which each occurs through the action of the Kelvin-Helmholtz instability. The simulation results showed that this process, in combination with the operation of what we believe are tearing and interchange instabilities, leads to energy transport across scales providing a characteristic k-7/3 power law, as observed in magnetic field observations above aurorae from the FAST satellite.
GEMSIS-Ionosphere
(1) Electric field and ring-current evolution during magnetic storms One of the goals of the GEMSIS-I subgroup is to examine and model the electric field structure of the ionosphere during substorms and magnetic storms. We improved the original map potential technique using SuperDARN (SD) data to develop a new modeling method for the ionospheric electric potential. Our newly developed method enables us to model instantaneous shapes of the potential pattern through the mid-latitude region by interpolating SD observations with a combination of the empirical potential model developed by Weimer
29
(2001) and an additional theoretical model function expressing subauroral polarization stream (SAPS)-like potentials. In addition to the modeling, observations were made for the storm-time convection electric field in the inner to outer magnetosphere on the night side using THEMIS data. This study provided observational evidence that convection electric fields of different properties coexist and occupy spatially adjacent regions with sharp boundaries during a storm main phase. In the course of these studies, we continued to expand the data analysis environment developed since last year by incorporating the DMSP, NOAA, additional ISTP data, and the geomagnetic field data/indices into the database. After investigating the differential flux of the protons measured by Polar/MICS, we found that the storm-time behavior of the proton flux depends on kinetic energy. The low-energy flux (<100 keV) increased during the storm development phase and decreased during the storm recovery phase. High-energy flux (>100 keV) does not increase significantly during the storm development phase, but does apparently increase during the storm recovery phase. The latter behavior cannot be explained by adiabatic changes. (2) 2-D Ionospheric global potential solver development We created a 2-D ionospheric global potential solver, which refers to and examines multiple datasets, as one task of the GEMSIS project. In the code, we calculated a global distribution of electrical potential by approximating the ionosphere as a spherical surface and solving the current continuity equation. We took some parameters, such as electron density, from the MSIS-E90 and the IRI-2000 reference atmosphere models to obtain the input Pedersen and Hall conductivities. We used a flexible multigrid method as a Poisson solver, along with an extension to the 3-D coding. The latitudinal grid resolution was about 1°, and the longitudinal resolution was about 3°. Using field-aligned current data obtained from the Weimer-2005 reference model as inputs, we validated our results using Weimer’s potential data as a benchmark test of our code. We found good agreement for four cases of the solar wind magnetic field. Although some problems remain, such as a pole boundary and high equatorial conductivity, the code performs well, encouraging applications to satellite data analysis. (3) Quasi-periodic DP2 geomagnetic fluctuations The convection electric field penetrates to the equatorial ionosphere with no significant shielding during DP2 fluctuation events. Periods range from 30 to 60 min (Nishida, 1968), and the penetration continues during the storm main phase over several hours (Huang et al., 2005). Shielding becomes effective during the storm recovery phase, causing the counter-electrojet (CEJ) (Kikuchi et al., 2008). We analyzed an equatorial DP2 fluctuation event using magnetometer data, SuperDARN convection maps and a CRCM ring-current simulation and found that the DP2 fluctuation was a result of alternating contributions by the convection and overshielding electric fields associated with the Region-1 and -2 field-aligned currents, respectively. (4) Geomagnetic field variations produced by 3-D current system during SCs The sudden compression (SC) of the magnetosphere associated with an abrupt increase in solar wind dynamic pressure leads to enhancements in magnetospheric convection in the inner magnetosphere and the development of field-aligned currents (FACs) resembling

30
Region-1 FACs and the resultant ionospheric currents. In order to clarify magnetic latitude and local time profiles of geomagnetic field variations from subauroral latitudes to the equator, we performed a statistical analysis of SC amplitude using long-term observational data obtained from eight stations. As a result, the SC amplitude profiles in the subauroral and middle latitudes showed magnetic field variations produced by DP 2-type currents in the daytime sector. The effects of the DP 2-type currents expanded at least to the low latitude (magnetic latitude: 16.54°). However, the SC amplitude in this region indicated that the DL part of SC produced by magnetopause current was much more dominant. On the daytime equator, the SC amplitude was considerably enhanced by an intensification of the Pedersen current, driven by the penetration of the convection electric field due to the Cowling effect. Also of interest is that SC amplitude in the nighttime sector tended to be enhanced from the mid-latitude to the equator, and its peak value increased with increasing magnetic latitude. This result suggests that the magnetic field variations produced by the FACs during the main impulse phase of SCs expanded to the equator. (5) Auroral observations at Fort Smith during THEMIS major conjunctions on March 1, 2008 We took white-light all-sky videos (sampling rate: 30 Hz) of auroras at Fort Smith (67 MLAT, 23 MLT at 0720 UT), Canada when the THEMIS satellites were aligned on the premidnight plane on March 1, 2008. A variety of auroras were observed on these nights. Below, we concentrate on a pseudo-breakup at 0647 UT on March 1. On March 1, 2008, an auroral arc, moving equatorward, disappeared around 0640 UT in the south. Six minutes later, faint patches were first recognized around 0646:28 UT near the latitude where the previous arc dimmed in the south sky. Co-located with the patches, a weak arc showed up and gradually intensified, and a pseudo-breakup occurred there at 0647:27 UT, presumably inside the field of view of the camera. The pseudo-breakup dimmed around 0648 UT. At the same time, other patches showed up and were followed by some breakups. Corresponding THEMIS satellite observations included a southward turning in the magnetic field with a slow but spiky tailward flow (~100 km s-1) observed by THEMIS-B (GSM-X, Y, Z = -20, 4, -2 Re) at 0645 UT, 2 minutes before the pseudo-breakup. Following were slow earthward flows at 0646 UT in THEMIS-E (200km s-1, -11, 4, -2 Re) and in THEMIS-D (50 km/s, -11, 3, -2 Re). A sharp dipolarization of 10 nT was also observed at 0646 UT in THEMIS-A (-7, 5, -2 Re). THEMIS-C (-16, 4, -3 Re) did not observe flows, but observed a peak in total pressure at 0646 UT. A comparison of these timings suggests that this particular pseudo-breakup was caused by a reconnection inside 20 Re ~ 2 minutes before the pseudo-breakup.
International Collaboration using GEDAS
As one of the Geospace Environmental Data Analysis System (GEDAS) project, we have provided space weather maps using the real-time Kamide-Richmond-Matsushita (KRM) method through the web in collaboration with NOAA/NGDC and the University of Michigan. We set up a new computer as a Space Physics Interactive Data Resource (SPIDR) mirror site (http://spidr.ngdc.noaa.gov/spidr/), which will open to the public in 2009. SPIDR collects a wide variety of geosciences data, including geomagnetic field data, which can be used as input data for space weather maps.

31
Geospace Simulation
(1) Development of a CIP-based global MHD simulation model of the magnetosphere We have a newly developed global MHD simulation model of the magnetosphere based on the constrained interpolation profile (CIP) algorithm. The model is designed to capture turbulent structures as well as shock formation in front of the magnetosphere. It enables us to discuss solar wind transport by Kelvin-Helmholtz instabilities across the magnetopause and the magnetic turbulence in the plasma sheet. In this fiscal year, we analyzed some numerical tests, particularly the boundary conditions at the planetary surface with low-resolution simulations (grid size = 0.25~0.5 Re). As a result, we successfully reproduced the fundamental processes for a solar wind condition with northward IMF, such as the bow-shock formation and the high-latitude magnetic reconnection. (2) Plasma instabilities and turbulence excitation in Earth’s magnetospheric boundary layers Understanding anomalous transport is an important problem in plasma physics. Plasma momentum and energy are often transported from the solar wind into the Earth’s magnetosphere at very high efficiencies through boundary layers where physical quantities change sharply. In particular, the magnetopause and plasma sheet are known as typical boundary layers that generate large-amplitude fluctuations in association with anomalous transport. Therefore, we studied plasma instabilities and their nonlinear evolution in the boundary layers of the Earth’s magnetosphere using a high-resolution, 3-D global MHD simulation of interactions between the solar wind and Earth’s magnetosphere. For southward IMF, filamentary and streamer structure formed in the plasma sheet due to patchy and intermittent reconnection. Moreover, a vortex train appeared at the dayside magnetopause. For northward IMF, the Kelvin-Helmholtz instability excitation generated a wavy train or vortex train rolled up in the low-latitude boundary layer. Thus, vortex formation by Kelvin-Helmholtz instability could be presented first from the global MHD simulation with stabilization effects of finite length parallel to magnetic field lines. The relationship between the vortex train and high-latitude reconnection was also studied. (3) Vlasov simulation of magnetic reconnection A new Vlasov simulation code was developed for studies of cross-scale coupling in the plasma universe. The new Vlasov code uses a conservative, non-oscillatory, and positivity preserving scheme that can automatically satisfy the continuity equation for charge. The Geospace Environment Modeling magnetic reconnection challenge problem was adopted as a benchmark test of the new code. Our Vlasov simulation results are in good agreement with previous particle-in-cell simulation results, even with low spatial resolution.
Planetary Magnetosphere Simulations
(1) Dependence of Kronian magnetosphere and polar ionosphere on solar wind dynamic pressure and IMF direction Saturn rotates rapidly, as does Jupiter; however, Saturn possess a magnetic field strength comparable to that of the Earth. Thus, Saturn is often said to have a mixture of the

32
characteristics of Jupiter and Earth. In a recent simulation study, we found that vortices and turbulent convection are always present in the Kronian magnetosphere for all IMF orientations. This results from the interaction between the solar wind, corotation, and magnetospheric convection. However, the configurations of the energy flux and FACs in the polar region are functions of IMF direction. In particular, the simulation results indicate that the vorticity causes intense FACs that are strongest near dawn. This suggests that the Kronian magnetosphere can be quite different from the Jovian and terrestrial magnetospheres. We examined the effects of solar wind dynamic pressure and the IMF By component on Saturn’s magnetosphere. We found that for northward IMF, high dynamic pressures do little to change Kronian convection, whereas for no IMF or southward IMF, convection patterns changed with dynamic pressure. The magnitudes of the energy flux and FACs are enhanced, but the distributions remain unchanged. When including the IMF By component, the configurations of the magnetosphere and polar ionosphere are a mixture of those for no IMF and those for northward IMF. (2) MHD simulation of the magnetosphere of a hot Jupiter Recently, more than three hundred extra-solar giant planets have been discovered by observations. Their characteristics are interesting to space science. Many aspects of the electromagnetic circumstances are, of course, unknown for extra-solar giant planets. One interesting feature is the location of the giant planets quite close to their central stars. Therefore, we studied the interactions of the solar wind with an extra-solar giant planet using a 3-D MHD simulation in which Jupiter was assumed to be very close to the Sun (10 solar radii from the Sun). In such a situation, a magnetospheric configuration with Alfven wings is formed because the Alfven number is less than unity for normal conditions of the solar wind and IMF. We examined magnetospheric configurations and the dynamics of a hot Jupiter with changing IMF. Magnetic reconnection was also considered, and dependence on IMF orientation and reconnection rate and polar phenomena was demonstrated. (3) MHD simulation code development and application to Mercury’s magnetosphere In this study, we developed a new MHD simulation code for Mercury’s magnetosphere that automatically satisfied the solenoidal condition for the magnetic field (B) i.e., divB = 0. The solenoidal condition of the magnetic field is required in the test particle simulation because a non-solenoidal magnetic field causes artificial particle acceleration or deceleration. We used the vector potential (A) instead of the magnetic field itself in the MHD equation. To solve the advection term, we adopted a rational-CIP algorithm in the simulation code. The non-advection terms were solved by the 4th-order Runge-Kutta method for time and the 4th-order central difference for space in a regular grid system. Code assessments were carried out to evaluate the properties of the developed code. A remarkable feature of the new code is the description of Alfven wave propagation with less numerical dispersion. After assessing the code, we applied the code to a global simulation of Mercury’s magnetosphere. Fundamental structures of the magnetosphere were successfully reproduced.