Embed Size (px)
Citation preview

Annual Report on Form 20-FFor the Year Ended December 31, 2011


Commission file number: 1-3330
UNITED STATESSECURITIES AND EXCHANGE COMMISSION
WASHINGTON, D.C. 20549
FORM 20-FANNUAL REPORT
PURSUANT TO SECTION 13 OR 15(d) OFTHE SECURITIES EXCHANGE ACT OF 1934
For the fiscal year ended December 31, 2011
PT Indosat Tbk(Exact name of Registrant as specified in its charter)
REPUBLIC OF INDONESIA(Jurisdiction of incorporation or organization)
Indosat BuildingJalan Medan Merdeka Barat No. 21
Jakarta 10110—Indonesia(62-21) 30442615
(Address and telephone number of principal executive offices)
Name: Nicholas SwierzyTelephone: +62-21-30442615Email: [email protected]: +62-21-30003757Address: Jalan Medan Merdeka Barat No. 21
Jakarta 10110Indonesia
Securities registered pursuant to Section 12(b) of the Act.
Title of each ClassName of each exchange
on which registered
American Depositary Shares, each representing 50 Series B shares, par value Rp100 per share . . . . . . . . . . . . . . . . . . . . . . . . New York Stock ExchangeSeries B shares, par value Rp100 per share . . . . . . . . . . . . . . . . . . . . . . . . . . . . . . . . . . . . . . . . . . . . . . . . . . . . . . . . . . . . . . . . New York Stock Exchange*
Securities registered or to be registered pursuant to Section 12(g) of the Act.None
Securities for which there is a reporting obligation pursuant to Section 15(d) of the Act.None
Indicate the number of outstanding shares of each of the issuer’s classes of capital or common stock as of the close of the period covered by the annualreport.
Series A shares, par value Rp100 per share . . . . . . . . . . . . . . . . . . . . . . . . . . . . . . . . . . . . . . . . . . . . . . . . . . . . . . . . . . . . 1Series B shares, par value Rp100 per share . . . . . . . . . . . . . . . . . . . . . . . . . . . . . . . . . . . . . . . . . . . . . . . . . . . . . . . . . . . . 5,433,933,499
Indicate by check mark if the registrant is a well-known seasoned issuer, as defined in Rule 405 of the Securities Act.Yes È No ‘
If this report is annual or transition report, indicate by check mark if the registrant is not required to file reports pursuant to Section 13 or 15(d) of theSecurities Exchange Act of the Securities Exchange Act of 1934.
Yes ‘ No ÈIndicate by check mark whether the registrant: (1) has filed all reports required to be filed by Section 13 or 15(d) of the Securities Exchange Act of 1934
during the preceding 12 months (or for such shorter period that the registrant was required to file such reports), and (2) has been subject to such filingrequirements for the past 90 days.
Yes È No ‘Indicate by check mark whether the registrant has submitted electronically and posted on its corporate Web site, if any, every Interactive Data File
required to be submitted and posted pursuant to Rule 405 of Regulation S-T (§232.405 of this chapter) during the preceding 12 months (or for such shorterperiod that the registrant was required to submit and post such files).
Yes ‘ No ‘Indicate by check mark whether the registrant is a large accelerated filer, an accelerated filer, or a non-accelerated filer. See definition of “accelerated
filer and large accelerated filer” in Rule 12b-2 of the Exchange Act.Large accelerated filer È Accelerated filer ‘ Non-accelerated filer ‘
Indicate by check mark which basis of accounting the registrant has used to prepare the financial statements included in this filing:U.S. GAAP ‘ International Financial Reporting Standards as issued by the International Accounting Standards Board È Other ‘If “Other” has been checked in response to the previous question, indicate by check mark which financial statement item the registrant has elected to
follow.Item 17 ‘ Item 18 ‘
If this is an annual report, indicate by check mark whether the registrant is a shell company (as defined in Rule 12b-2 of the Exchange Act).Yes ‘ No È
* The Series B shares were registered in connection with the registration of the American Depositary Shares and are not listed for trading on the New YorkStock Exchange.

[THIS PAGE INTENTIONALLY LEFT BLANK]

TABLE OF CONTENTS
Page
CERTAIN DEFINITIONS, CONVENTIONS AND GENERAL INFORMATION . . . . . . . . . . . . . . . . . . . . iiFORWARD-LOOKING STATEMENTS . . . . . . . . . . . . . . . . . . . . . . . . . . . . . . . . . . . . . . . . . . . . . . . . . . . . iiGLOSSARY . . . . . . . . . . . . . . . . . . . . . . . . . . . . . . . . . . . . . . . . . . . . . . . . . . . . . . . . . . . . . . . . . . . . . . . . . . . iii
PART IItem 1: IDENTITY OF DIRECTORS, SENIOR MANAGEMENT AND ADVISERS . . . . . . . . . 1Item 2: OFFER STATISTICS AND EXPECTED TIMETABLE . . . . . . . . . . . . . . . . . . . . . . . . . . 1Item 3: KEY INFORMATION . . . . . . . . . . . . . . . . . . . . . . . . . . . . . . . . . . . . . . . . . . . . . . . . . . . . . 1Item 4: INFORMATION ON THE COMPANY . . . . . . . . . . . . . . . . . . . . . . . . . . . . . . . . . . . . . . . 27Item 5: OPERATING AND FINANCIAL REVIEW AND PROSPECTS . . . . . . . . . . . . . . . . . . . 65Item 6: DIRECTORS, SENIOR MANAGEMENT AND EMPLOYEES . . . . . . . . . . . . . . . . . . . . 101Item 7: MAJOR SHAREHOLDERS AND RELATED PARTY TRANSACTIONS . . . . . . . . . . . 110Item 8: FINANCIAL INFORMATION . . . . . . . . . . . . . . . . . . . . . . . . . . . . . . . . . . . . . . . . . . . . . . 112Item 9: THE OFFER AND LISTING . . . . . . . . . . . . . . . . . . . . . . . . . . . . . . . . . . . . . . . . . . . . . . . . 116Item 10: ADDITIONAL INFORMATION . . . . . . . . . . . . . . . . . . . . . . . . . . . . . . . . . . . . . . . . . . . . . 119Item 11: QUANTITATIVE AND QUALITATIVE DISCLOSURES ABOUT MARKET RISK . . . 133Item 12: DESCRIPTION OF SECURITIES OTHER THAN EQUITY SECURITIES . . . . . . . . . . . 137
PART IIItem 13: DEFAULTS, DIVIDEND ARREARAGES AND DELINQUENCIES . . . . . . . . . . . . . . . 139Item 14: MATERIAL MODIFICATIONS TO THE RIGHTS OF SECURITY HOLDERS AND
USE OF PROCEEDS . . . . . . . . . . . . . . . . . . . . . . . . . . . . . . . . . . . . . . . . . . . . . . . . . . . . 139Item 15: CONTROLS AND PROCEDURES . . . . . . . . . . . . . . . . . . . . . . . . . . . . . . . . . . . . . . . . . . . 139Item 16A: AUDIT COMMITTEE FINANCIAL EXPERT . . . . . . . . . . . . . . . . . . . . . . . . . . . . . . . . . . 140Item 16B: CODE OF ETHICS . . . . . . . . . . . . . . . . . . . . . . . . . . . . . . . . . . . . . . . . . . . . . . . . . . . . . . . 140Item 16C: PRINCIPAL ACCOUNTANT FEES AND SERVICES . . . . . . . . . . . . . . . . . . . . . . . . . . . 140Item 16D: EXEMPTIONS FROM THE LISTING STANDARDS FOR AUDIT COMMITTEES . . . 141Item 16E: PURCHASES OF EQUITY SECURITIES BY THE ISSUER AND AFFILIATED
PURCHASERS . . . . . . . . . . . . . . . . . . . . . . . . . . . . . . . . . . . . . . . . . . . . . . . . . . . . . . . . . 141Item 16F: CHANGE IN REGISTRANT’S CERTIFYING ACCOUNTANT . . . . . . . . . . . . . . . . . . . 141Item 16G: CORPORATE GOVERNANCE . . . . . . . . . . . . . . . . . . . . . . . . . . . . . . . . . . . . . . . . . . . . . 142
PART IIIItem 17: FINANCIAL STATEMENTS . . . . . . . . . . . . . . . . . . . . . . . . . . . . . . . . . . . . . . . . . . . . . . . 144Item 18: FINANCIAL STATEMENTS . . . . . . . . . . . . . . . . . . . . . . . . . . . . . . . . . . . . . . . . . . . . . . . 144Item 19: EXHIBITS . . . . . . . . . . . . . . . . . . . . . . . . . . . . . . . . . . . . . . . . . . . . . . . . . . . . . . . . . . . . . . 144
i

CERTAIN DEFINITIONS, CONVENTIONS AND GENERAL INFORMATION
Unless the context otherwise requires, references in this Form 20-F to the “Company,” “Indosat,” “we,”“us,” and “our” are to PT Indosat Tbk and its consolidated subsidiaries. All references to “Indonesia” arereferences to the Republic of Indonesia. All references to the “Government” herein are references to theGovernment of the Republic of Indonesia. References to “United States” or “U.S.” are to the United States ofAmerica. References to “United Kingdom” are to the United Kingdom of Great Britain and Northern Ireland.References to “Indonesian rupiah” or “Rp” are to the lawful currency of Indonesia and references to “U.S.dollars” or “US$” are to the lawful currency of the United States. Certain figures (including percentages) havebeen rounded for convenience, and therefore indicated and actual sums, quotients, percentages and ratios maydiffer.
Our consolidated financial statements as of January 1, 2010 and December 31, 2010 and 2011, and for theyears ended December 31, 2009, 2010 and 2011 included in this annual report have been prepared in accordancewith International Financial Reporting Standards (“IFRS”) as issued by the International Accounting StandardsBoard (“IASB”). Solely for the convenience of the reader, certain Indonesian rupiah amounts have beentranslated into U.S. dollars at specified rates. Unless otherwise indicated, U.S. dollar equivalent information foramounts in Indonesian rupiah is translated at the Indonesian Central Bank Rate for December 31, 2011, whichwas Rp9,068 to US$1.00. The exchange rate of Indonesian rupiah for U.S. dollars on April 25, 2012 wasRp9,194 to US$1.00. The Federal Reserve Bank of New York does not certify for customs purposes a noonbuying rate for cable transfers in Indonesian rupiah. No representation is made that the Indonesian rupiah or U.S.dollar amounts shown herein could have been or could be converted into U.S. dollars or Indonesian rupiah, as thecase may be, at any particular rate or at all. See “Item 3: Key Information—Exchange Rate Information” forfurther information regarding rates of exchange between Indonesian rupiah and U.S. dollars.
FORWARD-LOOKING STATEMENTS
This Form 20-F contains “forward-looking statements,” as defined in Section 27A of the Securities Act,Section 21E of the U.S. Securities Exchange Act of 1934, as amended, or the Exchange Act, and within themeaning of the Private Securities Litigation Reform Act of 1995, including statements regarding our expectationsand projections for our future operating performance and business prospects. The words “believe,” “expect,”“anticipate,” “estimate,” “project,” and similar words identify forward-looking statements. In addition, allstatements other than statements of historical facts included in this Form 20-F are forward-looking statements.Although we believe that the expectations reflected in the forward-looking statements herein are reasonable, wecan give no assurance that such expectations will prove to be correct. These forward-looking statements aresubject to a number of risks and uncertainties, including changes in the economic, social and politicalenvironments in Indonesia. This Form 20-F discloses, under “Item 3: Key Information—Risk Factors” andelsewhere, important factors that could cause actual results to differ materially from our expectations.
ii

GLOSSARY
The explanations of technical terms set forth below are intended to assist you to understand such terms, butare not intended to be technical definitions.
“2G” second generation of wireless telephone technology that includesGSM, Interim Standard-95 (IS-95) and personnel digital cellular(PDC) technology
“3G” third generation of mobile telecommunications standards, includingWideband Code Division Multiple Access/Universal MobileTelecommunication System (WCDMA/UMTS)
“ADS” American Depository Share, a security that represents an ownershipinterest in the shares of a foreign private issuer. Each of our ADSsrepresents 50 shares of our common stock.
“analog” a signal, whether voice, video or data, which is transmitted in similar,or analogous, signals; commonly used to describe telephonetransmission and/or switching services that are not digital
“ARPM” the average monthly revenue per minute (in Indonesian rupiah),computed by dividing revenues from monthly recurring prepaid andpostpaid cellular services, excluding non-recurring revenues such asactivation fees and special auctions of telephone numbers, for therelevant period, by the total minutes (billed and unbilled) of outgoingcall usage of prepaid and postpaid cellular subscribers for such period
“ARPU” Average Revenue Per User, an evaluation statistic for a networkoperator’s subscriber base. ARPU is computed by dividing monthlyrecurring prepaid and postpaid cellular services revenues (usagecharges, value-added services, interconnection revenues and monthlysubscription charges), excluding non-recurring revenues such asactivation fees and special auctions of telephone numbers, for therelevant period by the average number of prepaid and postpaidcellular subscribers. The average number of prepaid and postpaidcellular subscribers is the sum of the total number of active cellularsubscribers at the beginning and end of each month divided by two.We define an “active cellular subscriber” as a cellular subscriber who:(i) in the case of a postpaid cellular subscriber, has no outstandingbalance remaining due more than 120 days after the last statementdate; or (ii) in the case of a prepaid cellular subscriber, recharges theSIM card within a 33-day “grace period” immediately following theSIM card’s expiry date by adding certain minimum amounts to theSIM card. Due to changes in the method used to calculate the numberof our prepaid cellular subscribers, our ARPU set forth in this annualreport are not comparable between certain periods. See “Item 3: KeyInformation—Risk Factors—Risks Relating to Our Cellular ServicesBusiness—Our subscriber related operating data may not becomparable between periods”
iii
“ATM” Asynchronous Transfer Mode, the standard packet-switching protocolfor transmitting and receiving data via cell relay (uniform 53-bytecells), wherein information for multiple service types, such as voice,video or data is conveyed in small, fixed-size cells
“attenuation” gradual loss in intensity of radio frequency signals by absorption andscattering
“backbone” the highest level in hierarchical network and designed to carry theheaviest traffic. Backbones are either switched (using ATM, framerelay or both) or routed (using only routers and no switches). Thetransmission links between nodes or switching facilities consist ofmicrowave, submarine cable, satellite, optical fiber or othertransmission technology
“bandwidth” the capacity of a communication link
“base station controller” the controlling equipment in a 2G network that coordinates theoperation of multiple BTSs
“BTS” Base Transceiver Station, a mobile phone base station comprised ofradio transmitter and receiver units used for transmitting andreceiving voice and data to and from mobile phones in a particularcell area
“CDMA” Code Division Multiple Access, a transmission technology whereeach transmission is sent over multiple frequencies and a unique codeis assigned to each data or voice transmission, allowing multiple usersto share the same frequency spectrum
“cellular backhaul” the transmission lines that connect base station controllers, BTSs andmobile switching centers
“churn rate” the subscriber disconnections for a given period, determined bydividing the sum of voluntary and involuntary deactivations duringthe period by the average number of cellular subscribers for the sameperiod. The average number of cellular subscribers is the sum of thetotal number of active cellular subscribers at the beginning and end ofeach month divided by two
“dBW” decibel referencing one watt
“digital” a method of storing, processing and transmitting information throughthe use of distinct electronic or optical pulses that represent the binarydigits 0 and 1. Digital transmission and switching technologiesemploy a sequence of these pulses to represent information asopposed to the continuously variable analog signal. Compared toanalog networks, digital networks allow for greater capacity, lowerinterference, protection against eavesdropping and automatic errorcorrection
“DLD” Domestic Long-Distance, long-distance telecommunications serviceswithin a country
iv
“EDGE” Enhanced Data GSM Environment, a faster version of the globalsystem for GSM wireless service designed to deliver data at rates ofup to 384 Kbps, thereby enabling the delivery of multimedia andother broadband applications to mobile users
“fiber optic cable” a transmission medium constructed from extremely pure andconsistent glass through which digital signals are transmitted aspulses of light. Fiber optic cables offer greater transmission capacityand lower signal distortion than traditional copper cables
“Fixed telecommunication” also referred to as “fixed voice service” and includes IDD, DLD andfixed local service. This service also includes fixed wireless accessservice
“frame relay” a form of packet switching protocol which breaks data stream into smalldata packets called “frames,” equipped with more sophisticated errordetection and correction checking, compared to traditional forms of packetswitching (also referred to as “frame net” in our audited consolidatedfinancial statements included elsewhere in this annual report)
“fixed wireless access” or “FWA” fixed wireless access service, a limited mobility service that links toan area code
“GSM” Global System for Mobile Communications, a digital cellulartelecommunications system standardized by the EuropeanTelecommunications Standards Institute based on digital transmissionand cellular network architecture with roaming in use throughoutEurope, Japan and in various other countries
“GPRS” General Packet Radio Service, a standard for cellular communicationswhich supports a wide range of bandwidths and is particularly suitedfor sending and receiving data, including e-mail and other highbandwidth applications
“HSDPA” High Speed Downlink Packet Access, a packet-based data service orprotocol in the 3G (WCDMA/UMTS) standard which providesdownlink transmission data at speeds of up to 14.4 Mbps
“HSPA+” High Speed Packet Access +, a packet-based data service or protocolin the 3G (WCDMA/UMTS) standard which provides higherdownlink and uplink transmission data speeds by enhancing higherorder modulation and utilizing multiple-input and multiple-output(MIMO) and multicarrier technologies, reaching downlink speed ofup to 42Mbps and uplink speed of up to 11.6Mbps
“IDD” International Direct Dialing, a telecommunications service that allowsa user to make international long-distance calls without using anoperator
“interconnection” practice of allowing a competing telecommunications operator toconnect its network to the network or network elements of othertelecommunications operators to enable the termination of trafficoriginated by customers of the competing telecommunicationsoperator’s network to the customers of the other telecommunicationsoperator’s network
v

“IPLC” an international private line circuit
“IP VPN” Internet Protocol Virtual Private Network, a packet-based IP routingservice that provides economic data transaction facilities betweencustomer locations while maintaining the level of privacy, reliabilityand service quality dictated by rapidly evolving businesses. IP VPNservice provides flexible any-to-any connectivity using InternetProtocol and allows businesses to communicate privately with branchoffices, to exchange corporate network traffic, and to establishcommunication with trusted external partners at low-wide areanetworking costs
“ISP” Internet Service Provider, a company that provides access to theInternet by providing the interface to the Internet backbone
“Kbps” kilobits per second, a measure of digital transmission speed
“LAN” Local Area Network, a short-distance network designed to connectcomputers within a localized environment to enable the sharing ofdata and other communication
“Mbps” megabits per second, a measure of digital transmission speed
“media gateway” a translation unit between telecommunications networks usingdifferent standards, such as PSTN, next generation networks andradio access networks
“MIDI” Fixed data services, which include multimedia, data communicationsand Internet services
“Minutes of Usage” the minutes of usage per cellular subscriber, computed by dividing thetotal minutes of outgoing call usage of prepaid and postpaid cellularsubscribers for each month by the average number of prepaid andpostpaid cellular subscribers. The average number of prepaid andpostpaid cellular subscribers is the sum of the total number of activecellular subscribers at the beginning and end of each month divided bytwo. We define an “active cellular subscriber” as a cellular subscriberwho: (i) in the case of a postpaid cellular subscriber, has no outstandingbalance remaining due more than 120 days after the last statement date;or (ii) in the case of a prepaid cellular subscriber, recharges the SIMcard within a 33 day “grace period” immediately following the SIMcard’s expiry date by adding certain minimum amounts to the SIMcard. Due to changes in the method used to calculate the number of ourprepaid cellular subscribers, our minutes of usage per cellularsubscriber set forth in this annual report are not comparable betweencertain periods. See “Item 3: Key Information—Risk Factors—RisksRelating to Our Cellular Services Business—Our subscriber-relatedoperating data may not be comparable between periods”
“MMS” Multimedia Messaging Services, a cellular telecommunicationssystem that allows SMS messages to include graphics, audio or videocomponents
vi

“MPLS” Multi-Protocol Label Switching, a data packet forwarding technologywith improved forwarding speed of routers using labels to make data-forwarding decisions that increase the efficiency of data traffic flowthrough a traffic management pattern that classifies data based on itsapplication
“network infrastructure” the fixed infrastructure equipment consisting of fiber optic cables,copper cables, transmission equipment, multiplexing equipment,switches, radio transceivers, antennas, management informationsystems and other equipment that receives, transmits and processessignals to and from subscriber equipment and/or between wirelessnetworks and fixed networks
“Node B” a BTS for a 3G network
“PSTN” Public Switched Telephone Network, a fixed telephone networkoperated and maintained by PT Telekomunikasi Indonesia Tbk
“RIO” Reference Interconnect Offer, a regulatory term that refers to thedocument that covers technical, operational, economical and otheraspects of interconnection access by one telecommunications networkoperator in favor of other telecommunications operators
“roaming” the cellular telecommunications feature that permits subscribers ofone network to use their mobile handsets and telephone numberswhen in a region with cellular network coverage provided by anotherprovider
“SIM” or “SIM card” Subscriber Identity Module, the “smart” card designed to be insertedinto a mobile handset containing all subscriber-related data such asphone numbers, service details and memory for storing messages
“SMS” Short Message Service, a means to send or receive alphanumericmessages to or from mobile handsets
“VoIP” Voice over Internet Protocol, a means of sending voice informationusing Internet protocol. The voice information is transmitted indiscrete packets in digital form rather than the traditional circuit-committed protocols of the PSTN, thereby avoiding the tolls chargedby conventional long-distance service providers
“VSAT” Very Small Aperture Terminal, a relatively small satellite dish,typically 1.5 to 3.8 meters in diameter, placed at users’ premises andused for two-way data communications through satellite
“WAP” Wireless Application Protocol, an open and global standard oftechnology platform that enables mobile users to access and interactwith mobile information services such as e-mail, websites, financialinformation, online banking information, entertainment(infotainment), games and micro-payments
“x.25” a widely used data packet-switching standard that has been partiallyreplaced by frame relay services
vii

[THIS PAGE INTENTIONALLY LEFT BLANK]

PART I
Item 1: IDENTITY OF DIRECTORS, SENIOR MANAGEMENT AND ADVISERS
Not applicable.
Item 2: OFFER STATISTICS AND EXPECTED TIMETABLE
Not applicable.
Item 3: KEY INFORMATION
Selected Financial and Other Data
The following tables present our selected consolidated financial information and operating statistics as ofthe dates and for each of the periods indicated. The selected financial information as of and for the years endedDecember 31, 2008, 2009, 2010 and 2011 presented below is based upon our audited consolidated financialstatements prepared in conformity with IFRS as issued by IASB. The selected financial information as of and forthe years ended December 31, 2008, 2009, 2010 and 2011 should be read in conjunction with, and is qualified inits entirety by reference to, our audited consolidated financial statements, including the notes thereto, and theother information included elsewhere in this annual report. The selected financial information as of and for theyear ended December 31, 2007 is based upon our audited consolidated financial statements prepared inconformity with generally accepted accounting principles in Indonesia (“Indonesian GAAP”), with areconciliation to U.S. GAAP. The selected financial information as of and for the year ended December 31, 2007should be read in conjunction with, and is qualified in its entirety by reference to, our audited consolidatedfinancial statements, including the notes thereto, and the other information included elsewhere in our previousannual reports filed with the U.S. SEC on May 8, 2008. Therefore, financial information for 2008, 2009, 2010and 2011 are not comparable with financial information for 2007 and are presented separately. The auditedconsolidated financial statements as of and for the years ended December 31, 2007, 2008 and 2009 have beenaudited by Purwantono, Sarwoko & Sandjaja and the audited consolidated financial statements as of and for theyears ended December 31, 2010 and 2011 have been audited by Purwantono, Suherman & Surja, the Indonesianmember firm of Ernst & Young Global.
1

As of December 31,
2008Rp
2009Rp
2010Rp
2011Rp
2011US$(1)
(Rp in billions and US$ in millions, except fornumber of outstanding shares)
Financial Position Data:IFRS:Assets
Cash and cash equivalents . . . . . . . 5,737.9 2,836.0 2,075.3 2,224.2 245.3Other current assets (other than
cash and cashequivalents)—net . . . . . . . . . . . 3,953.9 4,302.9 4,083.6 4,360.3 480.8
Due from related parties—net . . . . 42.5 7.2 8.4 10.7 1.2Deferred tax assets—net . . . . . . . . 70.7 88.0 95.0 114.1 12.6Long-term investments . . . . . . . . . 3.4 3.2 2.7 2.7 0.3Property and equipment—net . . . . 38,333.6 44,358.1 43,489.4 43,385.4 4,784.5Goodwill and other intangible
assets—net . . . . . . . . . . . . . . . . . 2,060.7 2,042.8 2,063.2 2,056.0 226.7Other non-current assets . . . . . . . . 1,659.7 1,796.8 1,608.1 1,607.0 177.2
Total assets . . . . . . . . . . . . . . 51,862.4 55,435.0 53,425.7 53,760.4 5,928.6
LiabilitiesCurrent liabilities . . . . . . . . . . . . . . 10,719.7 13,067.3 11,909.9 11,965.5 1,319.5Due to related parties . . . . . . . . . . . 14.7 13.8 22.1 15.5 1.7Deferred tax liabilities—net . . . . . 1,348.7 1,651.8 1,951.3 2,163.3 238.6Loans payable (net of current
maturities) . . . . . . . . . . . . . . . . . 10,812.2 12,715.5 7,666.8 6,425.8 708.6Bonds payable (net of current
maturities) . . . . . . . . . . . . . . . . . 10,315.6 8,472.2 12,114.1 12,138.4 1,338.6Other non-current liabilities . . . . . 871.9 939.5 1,059.5 1,596.6 176.1
Total liabilities . . . . . . . . . . . 34,082.8 36,860.1 34,723.7 34,305.1 3,783.1
Net assets (total assets—totalliabilities) . . . . . . . . . . . . . . . . . . . . . . 17,779.6 18,574.9 18,702.0 19,455.3 2,145.5
Capital stock . . . . . . . . . . . . . . . . . . . . . 543.4 543.4 543.4 543.4 59.9Stockholders’ equity . . . . . . . . . . . . . . . 17,493.4 18,247.2 18,317.6 19,003.5 2,095.7Total liabilities and stockholders’
equity . . . . . . . . . . . . . . . . . . . . . . . . . 51,576.2 55,107.3 53,041.3 53,308.6 5,878.8Number of outstanding shares . . . . . . . . 5,433,933,500 5,433,933,500 5,433,933,500 5,433,933,500
2

For the years ended December 31,
2008Rp
2009Rp
2010Rp
2011Rp
2011US$(1)
(Rp in billions and US$ in millions, except pershare and per ADS data)
Comprehensive Income Data:IFRS:
Operating revenues:Cellular . . . . . . . . . . . . . . 14,460.8 14,331.3 15,867.1 16,561.0 1,826.4MIDI . . . . . . . . . . . . . . . . 2,733.4 2,712.6 2,488.1 2,578.4 284.3Fixed
telecommunication . . . 2,021.8 1,803.0 1,293.2 1,250.0 137.8
Total operatingrevenues . . . . . . . 19,216.0 18,846.9 19,648.4 20,389.4 2,248.5
Total operating expenses . . . . 14,487.7 15,650.7 16,159.3 17,289.3 1,906.6Operating income . . . . . . . . . . 4,728.3 3,196.2 3,489.1 3,100.1 341. 9Other income (expense):
Interest income . . . . . . . . 460.1 139.0 143.4 100.7 11.1Gain (loss) on foreign
exchange—net . . . . . . (885.7) 1,656.4 492.4 36.7 4.0Gain (loss) on change in
fair value ofderivatives—net . . . . . 136.6 (486.9) (448.8) 57.9 6.4
Financing cost . . . . . . . . (1,858.3) (1,873.0) (2,271.6) (1,925.4) (212.3)Other expense—net . . . . (25.6) (87.5) (79.2) 52.0 5.7
Total otherexpense—net . . . (2,172.9) (652.0) (2,163.8) (1,678.1) (185.1)
Income tax expense—net . . . . (485.3) (783.9) (422.3) (315.6) (34.8)Profit for the year . . . . . . . . . . 2,070.0 1,760.2 902.9 1,106.4 122.0
Attributable to owners ofthe Company . . . . . . . 2,043.8 1,703.9 824.6 1,009.1 111.3
Attributable tonon-controllinginterests . . . . . . . . . . . . 26.2 56.3 78.2 97.3 10.7
Weighted average number ofshares outstanding . . . . . . . 5,433,933,500 5,433,933,500 5,433,933,500 5,433,933,500 5,433,933,500
Basic and diluted earnings pershare attributable to ownersof the Company (in fullamounts)(2) . . . . . . . . . . . . . 376.1 313.6 151.8 185.7 0.02
Dividends declared per share(in full amounts)(2) . . . . . . . 172.85 137.86 59.55 — —
Dividends declared per share(in full amounts) (inUS$)(2)(4) . . . . . . . . . . . . . . . 0.02 0.015 0.007 — —
Dividends declared per ADS(in full amounts) (inUS$)(2)(3)(4) . . . . . . . . . . . . . 0.96 0.77 0.33 — —
3

As of and for the years ended December 31,
2008Rp
2009Rp
2010Rp
2011Rp
2011US$(1)
(Rp in billions and US$ in millions, except fornumber of outstanding shares, EBITDA
margin and financial ratios)
IFRS:Cash Flow Statement Data
Net cash provided by (used in):Operating activities . . . . . . . . . . . . . . . . . 6,513.3 4,106.1 6,848.6 7,320.1 807.2Investing activities . . . . . . . . . . . . . . . . . . (10,286.9) (10,670.7) (5,970.7) (6,037.9) (665.8)Financing activities . . . . . . . . . . . . . . . . . 1,458.5 3,724.7 (1,629.7) (1,135.4) (125.2)
Net Foreign Exchange differences from cashand cash equivalent . . . . . . . . . . . . . . . . . . . — (54.9) (9.7) 2.2 0.2
Other Financial Data (unaudited)EBITDA(5) . . . . . . . . . . . . . . . . . . . . . . . . . . . . 9,293.6 8,767.8 9,652.0 9,596.0 1,058.2EBITDA margin(6) . . . . . . . . . . . . . . . . . . . . . . 48.4% 46.5% 49.1% 47.1% 47.1%
Other Financial DataCapital expenditures(7) . . . . . . . . . . . . . . . . . . . 12,341.9 11,584.5 5,515.0 6,911.6 762.2
Financial Ratios (unaudited)Total Debt to EBITDA(8) . . . . . . . . . . . . . . . . . 2.38 2.94 2.53 2.47 —Net Debt to EBITDA(9) . . . . . . . . . . . . . . . . . . 1.76 2.62 2.31 2.24 —EBITDA to Interest Expense . . . . . . . . . . . . . . 5.23 4.85 4.64 5.64 —
4

As of December 31, 2007
(Rp in billions except fornumber of
outstanding shares)
Balance Sheet Data:Indonesian GAAP:Assets
Cash and cash equivalents . . . . . . . . . . . . . . . . . . . . . . . . . . . . . . . . . . . . . . . . . . . 8,053.0Other current assets (other than cash and cash equivalents) . . . . . . . . . . . . . . . . . 2,773.1Due from related parties—net . . . . . . . . . . . . . . . . . . . . . . . . . . . . . . . . . . . . . . . . 56.5Deferred tax assets—net . . . . . . . . . . . . . . . . . . . . . . . . . . . . . . . . . . . . . . . . . . . . 87.1Long-term investments . . . . . . . . . . . . . . . . . . . . . . . . . . . . . . . . . . . . . . . . . . . . . 3.0Property and equipment—net . . . . . . . . . . . . . . . . . . . . . . . . . . . . . . . . . . . . . . . . 30,572.8Goodwill and other intangible assets—net . . . . . . . . . . . . . . . . . . . . . . . . . . . . . . 2,087.2Other non-current assets . . . . . . . . . . . . . . . . . . . . . . . . . . . . . . . . . . . . . . . . . . . . 1,672.4
Total assets . . . . . . . . . . . . . . . . . . . . . . . . . . . . . . . . . . . . . . . . . . . . . . . . . . 45,305.1
LiabilitiesCurrent liabilities . . . . . . . . . . . . . . . . . . . . . . . . . . . . . . . . . . . . . . . . . . . . . . . . . . 11,658.6Due to related parties . . . . . . . . . . . . . . . . . . . . . . . . . . . . . . . . . . . . . . . . . . . . . . . 64.9Deferred tax liabilities—net . . . . . . . . . . . . . . . . . . . . . . . . . . . . . . . . . . . . . . . . . 1,482.2Loans payable (net of current portion) . . . . . . . . . . . . . . . . . . . . . . . . . . . . . . . . . 4,249.0Bonds payable (net of current portion) . . . . . . . . . . . . . . . . . . . . . . . . . . . . . . . . . 10,088.7Other non-current liabilities . . . . . . . . . . . . . . . . . . . . . . . . . . . . . . . . . . . . . . . . . 919.6
Total liabilities . . . . . . . . . . . . . . . . . . . . . . . . . . . . . . . . . . . . . . . . . . . . . . . . 28,463.0
Net assets (total assets—total liabilities) . . . . . . . . . . . . . . . . . . . . . . . . . . . . . . . . . . . . 16,842.1Minority interest . . . . . . . . . . . . . . . . . . . . . . . . . . . . . . . . . . . . . . . . . . . . . . . . . . . . . . 297.4Stockholders’ equity . . . . . . . . . . . . . . . . . . . . . . . . . . . . . . . . . . . . . . . . . . . . . . . . . . . 16,544.7Total liabilities and stockholders’ equity . . . . . . . . . . . . . . . . . . . . . . . . . . . . . . . . . . . 45,305.1Number of outstanding shares . . . . . . . . . . . . . . . . . . . . . . . . . . . . . . . . . . . . . . . . . . . . 5,433,933,500U.S. GAAP:(10)
Total assets . . . . . . . . . . . . . . . . . . . . . . . . . . . . . . . . . . . . . . . . . . . . . . . . . . 48,840.1Total stockholders’ equity . . . . . . . . . . . . . . . . . . . . . . . . . . . . . . . . . . . . . . . 18,260.6
5

For the year endedDecember 31, 2007
(Rp in billions exceptper share and per ADS data)
Income Statement Data:Indonesian GAAP:
Operating revenues:Cellular(11)(17) . . . . . . . . . . . . . . . . . . . . . . . . . . . . . . . . . . . . . . . . . . . . . . . . . . 12,924.8MIDI . . . . . . . . . . . . . . . . . . . . . . . . . . . . . . . . . . . . . . . . . . . . . . . . . . . . . . . . 2,168.6Fixed telecommunication(17) . . . . . . . . . . . . . . . . . . . . . . . . . . . . . . . . . . . . . . 1,780.4
Total operating revenues . . . . . . . . . . . . . . . . . . . . . . . . . . . . . . . . . . . . . 16,873.8
Total operating expenses(11) . . . . . . . . . . . . . . . . . . . . . . . . . . . . . . . . . . . . . . . . . . . 12,354.2Operating income . . . . . . . . . . . . . . . . . . . . . . . . . . . . . . . . . . . . . . . . . . . . . . . . . . . 4,519.6Other income (expense):
Interest income . . . . . . . . . . . . . . . . . . . . . . . . . . . . . . . . . . . . . . . . . . . . . . . . . 232.4Gain (loss) on foreign exchange—net . . . . . . . . . . . . . . . . . . . . . . . . . . . . . . . (155.3)Gain (loss) on change in fair value of derivatives—net . . . . . . . . . . . . . . . . . 68.0Amortization of goodwill . . . . . . . . . . . . . . . . . . . . . . . . . . . . . . . . . . . . . . . . . (226.5)Financing cost . . . . . . . . . . . . . . . . . . . . . . . . . . . . . . . . . . . . . . . . . . . . . . . . . (1,428.6)Other expense—net . . . . . . . . . . . . . . . . . . . . . . . . . . . . . . . . . . . . . . . . . . . . . (80.0)
Total other expense—net . . . . . . . . . . . . . . . . . . . . . . . . . . . . . . . . . . . . . (1,590.0)
Equity in net income of associated companies . . . . . . . . . . . . . . . . . . . . . . . . . . . . —Minority interest in net income of subsidiaries . . . . . . . . . . . . . . . . . . . . . . . . . . . . (28.1)Income tax expense—net . . . . . . . . . . . . . . . . . . . . . . . . . . . . . . . . . . . . . . . . . . . . . (859.5)Net income . . . . . . . . . . . . . . . . . . . . . . . . . . . . . . . . . . . . . . . . . . . . . . . . . . . . . . . . 2,042.0Weighted average number of shares outstanding . . . . . . . . . . . . . . . . . . . . . . . . . . 5,433,933,500Operating income from operations per share . . . . . . . . . . . . . . . . . . . . . . . . . . . . . . 831.7Diluted earnings per share . . . . . . . . . . . . . . . . . . . . . . . . . . . . . . . . . . . . . . . . . . . . 375.8Basic earnings per share(2) . . . . . . . . . . . . . . . . . . . . . . . . . . . . . . . . . . . . . . . . . . . . 375.8Dividends declared per share(2) . . . . . . . . . . . . . . . . . . . . . . . . . . . . . . . . . . . . . . . . 187.90Dividends declared per share (in US$)(2)(4) . . . . . . . . . . . . . . . . . . . . . . . . . . . . . . . 0.017Dividends declared per ADS (in US$)(2)(3)(4) . . . . . . . . . . . . . . . . . . . . . . . . . . . . . . 0.86
U.S. GAAP:(10)
Net income . . . . . . . . . . . . . . . . . . . . . . . . . . . . . . . . . . . . . . . . . . . . . . . . . . . . . . . . 2,475.8Basic earnings per share(2) . . . . . . . . . . . . . . . . . . . . . . . . . . . . . . . . . . . . . . . . . . . . 455.6Basic earnings per ADS(2)(3) . . . . . . . . . . . . . . . . . . . . . . . . . . . . . . . . . . . . . . . . . . . 22,781.0Diluted earnings per share . . . . . . . . . . . . . . . . . . . . . . . . . . . . . . . . . . . . . . . . . . . . 455.6Diluted earnings per ADS . . . . . . . . . . . . . . . . . . . . . . . . . . . . . . . . . . . . . . . . . . . . 22,781.0
6

As of and for the year endedDecember 31, 2007
(Rp in billions except fornumber of outstanding shares,
EBITDA margin andfinancial ratios)
Indonesian GAAP:Cash Flow Statement Data
Net cash provided by (used in):Operating activities . . . . . . . . . . . . . . . . . . . . . . . . . . . . . . . . . . . . . . . . . . . . 8,273.9Investing activities . . . . . . . . . . . . . . . . . . . . . . . . . . . . . . . . . . . . . . . . . . . . . (7,290.4)Financing activities . . . . . . . . . . . . . . . . . . . . . . . . . . . . . . . . . . . . . . . . . . . . 4,237.0
Other Financial Data (unaudited)EBITDA(12) . . . . . . . . . . . . . . . . . . . . . . . . . . . . . . . . . . . . . . . . . . . . . . . . . . . . . . 8,682.8EBITDA margin(13) . . . . . . . . . . . . . . . . . . . . . . . . . . . . . . . . . . . . . . . . . . . . . . . . 51.4%
Other Financial DataCapital expenditures(14) . . . . . . . . . . . . . . . . . . . . . . . . . . . . . . . . . . . . . . . . . . . . . 9,726.4
Financial Ratios (unaudited)Total Debt to EBITDA(15) . . . . . . . . . . . . . . . . . . . . . . . . . . . . . . . . . . . . . . . . . . . 1.94xNet Debt to EBITDA(16) . . . . . . . . . . . . . . . . . . . . . . . . . . . . . . . . . . . . . . . . . . . . . 1.01xEBITDA to Interest Expense . . . . . . . . . . . . . . . . . . . . . . . . . . . . . . . . . . . . . . . . . 6.22x
Footnotes to Selected Financial Information and Other Data:
(1) Translated into U.S. dollars based on a conversion rate of Rp9,068 = US$1.00, the Indonesian Central BankRate on December 31, 2011. See “—Exchange Rate Information” below.
(2) Basic earnings per share/ADS, and dividends declared per share/ADS are reported in whole Indonesianrupiah and U.S. dollars. Basic earnings per share/ADS and dividends declared per share/ADS for all periodspresented have been computed based upon the weighted average number of shares outstanding, afterconsidering the effect of the stock option where applicable.
(3) The basic earnings and dividends declared per ADS data is calculated on the basis that each ADS representsfifty shares of common stock and does not make allowance for withholding tax to which the holders of theADSs will be subject.
(4) Calculated using the Indonesian Central Bank Rate on each dividend payment date.
7
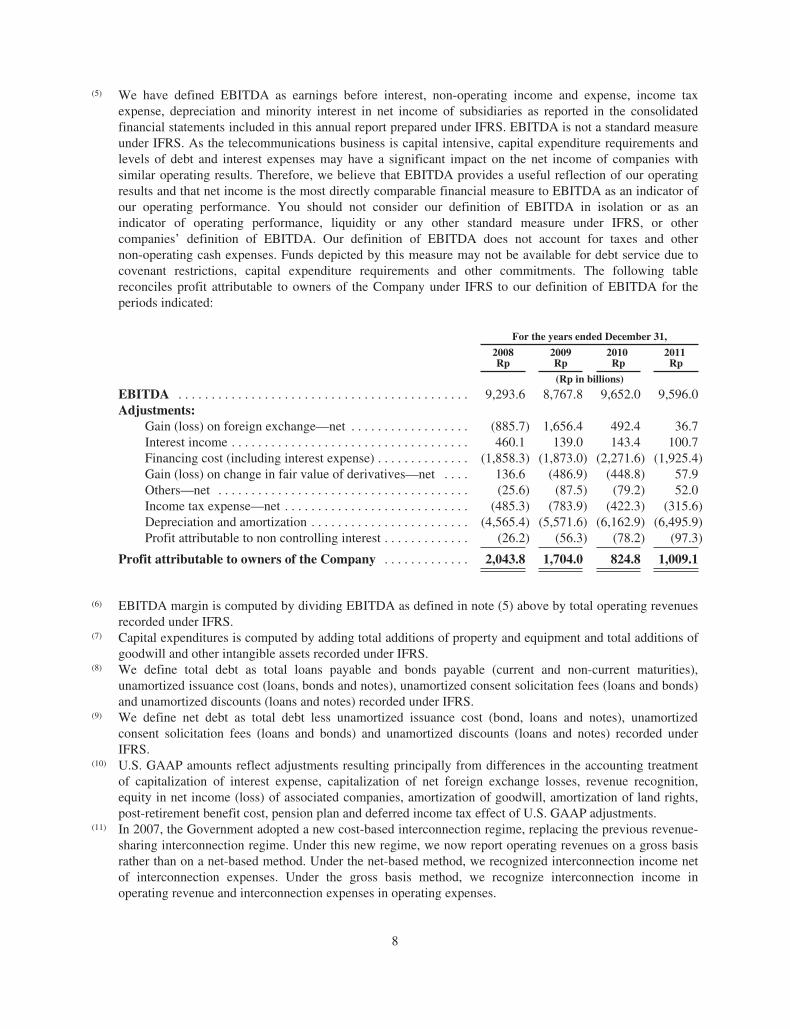
(5) We have defined EBITDA as earnings before interest, non-operating income and expense, income taxexpense, depreciation and minority interest in net income of subsidiaries as reported in the consolidatedfinancial statements included in this annual report prepared under IFRS. EBITDA is not a standard measureunder IFRS. As the telecommunications business is capital intensive, capital expenditure requirements andlevels of debt and interest expenses may have a significant impact on the net income of companies withsimilar operating results. Therefore, we believe that EBITDA provides a useful reflection of our operatingresults and that net income is the most directly comparable financial measure to EBITDA as an indicator ofour operating performance. You should not consider our definition of EBITDA in isolation or as anindicator of operating performance, liquidity or any other standard measure under IFRS, or othercompanies’ definition of EBITDA. Our definition of EBITDA does not account for taxes and othernon-operating cash expenses. Funds depicted by this measure may not be available for debt service due tocovenant restrictions, capital expenditure requirements and other commitments. The following tablereconciles profit attributable to owners of the Company under IFRS to our definition of EBITDA for theperiods indicated:
For the years ended December 31,
2008Rp
2009Rp
2010Rp
2011Rp
(Rp in billions)
EBITDA . . . . . . . . . . . . . . . . . . . . . . . . . . . . . . . . . . . . . . . . . . . . 9,293.6 8,767.8 9,652.0 9,596.0Adjustments:
Gain (loss) on foreign exchange—net . . . . . . . . . . . . . . . . . . (885.7) 1,656.4 492.4 36.7Interest income . . . . . . . . . . . . . . . . . . . . . . . . . . . . . . . . . . . . 460.1 139.0 143.4 100.7Financing cost (including interest expense) . . . . . . . . . . . . . . (1,858.3) (1,873.0) (2,271.6) (1,925.4)Gain (loss) on change in fair value of derivatives—net . . . . 136.6 (486.9) (448.8) 57.9Others—net . . . . . . . . . . . . . . . . . . . . . . . . . . . . . . . . . . . . . . (25.6) (87.5) (79.2) 52.0Income tax expense—net . . . . . . . . . . . . . . . . . . . . . . . . . . . . (485.3) (783.9) (422.3) (315.6)Depreciation and amortization . . . . . . . . . . . . . . . . . . . . . . . . (4,565.4) (5,571.6) (6,162.9) (6,495.9)Profit attributable to non controlling interest . . . . . . . . . . . . . (26.2) (56.3) (78.2) (97.3)
Profit attributable to owners of the Company . . . . . . . . . . . . . 2,043.8 1,704.0 824.8 1,009.1
(6) EBITDA margin is computed by dividing EBITDA as defined in note (5) above by total operating revenuesrecorded under IFRS.
(7) Capital expenditures is computed by adding total additions of property and equipment and total additions ofgoodwill and other intangible assets recorded under IFRS.
(8) We define total debt as total loans payable and bonds payable (current and non-current maturities),unamortized issuance cost (loans, bonds and notes), unamortized consent solicitation fees (loans and bonds)and unamortized discounts (loans and notes) recorded under IFRS.
(9) We define net debt as total debt less unamortized issuance cost (bond, loans and notes), unamortizedconsent solicitation fees (loans and bonds) and unamortized discounts (loans and notes) recorded underIFRS.
(10) U.S. GAAP amounts reflect adjustments resulting principally from differences in the accounting treatmentof capitalization of interest expense, capitalization of net foreign exchange losses, revenue recognition,equity in net income (loss) of associated companies, amortization of goodwill, amortization of land rights,post-retirement benefit cost, pension plan and deferred income tax effect of U.S. GAAP adjustments.
(11) In 2007, the Government adopted a new cost-based interconnection regime, replacing the previous revenue-sharing interconnection regime. Under this new regime, we now report operating revenues on a gross basisrather than on a net-based method. Under the net-based method, we recognized interconnection income netof interconnection expenses. Under the gross basis method, we recognize interconnection income inoperating revenue and interconnection expenses in operating expenses.
8

(12) We have defined EBITDA as earnings before financing cost (including interest expense), interestincome, income tax expense (net), depreciation and amortization expense, amortization of goodwill, loss onforeign exchange (net), loss on change in fair value of derivatives (net), other non-operating expenses (net),and minority interest in net income of subsidiaries as reported in the consolidated financial statementsincluded in this report prepared under Indonesian GAAP. EBITDA is not a standard measure under eitherIndonesian GAAP or U.S. GAAP. As the telecommunications business is capital intensive, capitalexpenditure requirements and levels of debt and interest expenses may have a significant impact on the netincome of companies with similar operating results. Therefore, we believe that EBITDA provides a usefulreflection of our operating results and that net income is the most directly comparable financial measure toEBITDA as an indicator of our operating performance. You should not consider our definition of EBITDAin isolation or as an indicator of operating performance, liquidity or any other standard measure under eitherIndonesian GAAP or U.S. GAAP or other companies’ definition of EBITDA. Funds depicted by thismeasure may not be available for debt service due to covenant restrictions, capital expenditure requirementsand other commitments. The definition of EBITDA under certain agreements related to our indebtednessmay differ from the definition we use here. The following table reconciles our net income under IndonesianGAAP to our definition of EBITDA for the periods indicated:
For the yearended December 31,
2007
(Rp in billions)
EBITDA . . . . . . . . . . . . . . . . . . . . . . . . . . . . . . . . . . . . . . . . . . . . . . . . . . . . . . . . . . . . . . . 8,682.8Adjustments:
Other income (expense):Interest income . . . . . . . . . . . . . . . . . . . . . . . . . . . . . . . . . . . . . . . . . . . . . . . . . . 232.4Gain (loss) on foreign exchange—net . . . . . . . . . . . . . . . . . . . . . . . . . . . . . . . . . (155.3)Gain (loss) on change in fair value of derivatives—net . . . . . . . . . . . . . . . . . . . 68.0Amortization of goodwill . . . . . . . . . . . . . . . . . . . . . . . . . . . . . . . . . . . . . . . . . . (226.5)Financing cost . . . . . . . . . . . . . . . . . . . . . . . . . . . . . . . . . . . . . . . . . . . . . . . . . . . (1,428.6)Others income (expense)—net . . . . . . . . . . . . . . . . . . . . . . . . . . . . . . . . . . . . . . (80.0)
Equity in net income of associated companies . . . . . . . . . . . . . . . . . . . . . . . . . . . . . . —Minority interest in net income of subsidiaries . . . . . . . . . . . . . . . . . . . . . . . . . . . . . . (28.1)Income tax expense—net . . . . . . . . . . . . . . . . . . . . . . . . . . . . . . . . . . . . . . . . . . . . . . . (859.5)Depreciation and amortization . . . . . . . . . . . . . . . . . . . . . . . . . . . . . . . . . . . . . . . . . . . (4,163.2)
Net income . . . . . . . . . . . . . . . . . . . . . . . . . . . . . . . . . . . . . . . . . . . . . . . . . . . . . . . . . . . . . 2,042.0
(13) EBITDA margin is computed by dividing EBITDA as defined in note (12) above by total operatingrevenues recorded under Indonesian GAAP.
(14) Capital expenditures is computed by adding total additions of property and equipment and total additions ofgoodwill and other intangible assets recorded under Indonesian GAAP.
(15) We define total debt as total loans payable and bonds payable (current and non-current maturities),unamortized issuance cost (loans, bonds and notes), unamortized consent solicitation fees (loans and bonds)and unamortized discounts (loans and notes) recorded under Indonesian GAAP.
(16) We define net debt as total debt less unamortized issuance cost (bond, loans and notes), unamortizedconsent solicitation fees (loans and bonds) and unamortized discounts (loans and notes) recorded underIFRS.
(17) Cellular revenue arising from airtime and roaming calls are recognized based on the duration of successfulcalls made through the Company’s cellular network, which up to December 31, 2007, had been presented ona net basis. To improve the comparability of the consolidated financial statements, the Company madeaccounts reclassification in the consolidated financial statements for the year ended December 31, 2007.
9

Exchange Rate Information
Exchange Rates of Indonesian RupiahPer U.S. Dollar
Period end Average(1)(2) Low High
Period2007 . . . . . . . . . . . . . . . . . . . . . . . . . . . . . . . . . . . . . . . . . . . . . . . . . . . . . . . . . . . . . . . . . . . . . . 9,419 9,137 9,479 8,6722008 . . . . . . . . . . . . . . . . . . . . . . . . . . . . . . . . . . . . . . . . . . . . . . . . . . . . . . . . . . . . . . . . . . . . . . 10,950 9,761 12,400 9,0512009 . . . . . . . . . . . . . . . . . . . . . . . . . . . . . . . . . . . . . . . . . . . . . . . . . . . . . . . . . . . . . . . . . . . . . . 9,400 10,398 12,065 9,2932010 . . . . . . . . . . . . . . . . . . . . . . . . . . . . . . . . . . . . . . . . . . . . . . . . . . . . . . . . . . . . . . . . . . . . . . 8,991 9,085 9,413 8,8882011 . . . . . . . . . . . . . . . . . . . . . . . . . . . . . . . . . . . . . . . . . . . . . . . . . . . . . . . . . . . . . . . . . . . . . . 9,068 8,779 9,185 8,460
October . . . . . . . . . . . . . . . . . . . . . . . . . . . . . . . . . . . . . . . . . . . . . . . . . . . . . . . . . . . . . . . . 8,835 8,895 8,968 8,828November . . . . . . . . . . . . . . . . . . . . . . . . . . . . . . . . . . . . . . . . . . . . . . . . . . . . . . . . . . . . . . 9,170 9,015 9,185 8,893December . . . . . . . . . . . . . . . . . . . . . . . . . . . . . . . . . . . . . . . . . . . . . . . . . . . . . . . . . . . . . . 9,068 9,088 9,165 9,015
2012January . . . . . . . . . . . . . . . . . . . . . . . . . . . . . . . . . . . . . . . . . . . . . . . . . . . . . . . . . . . . . . . . 9,000 9,109 9,210 8,955February . . . . . . . . . . . . . . . . . . . . . . . . . . . . . . . . . . . . . . . . . . . . . . . . . . . . . . . . . . . . . . . 9,085 9,026 9,158 8,892March . . . . . . . . . . . . . . . . . . . . . . . . . . . . . . . . . . . . . . . . . . . . . . . . . . . . . . . . . . . . . . . . . 9,180 9,165 9,193 9,098April (through April 23, 2012) . . . . . . . . . . . . . . . . . . . . . . . . . . . . . . . . . . . . . . . . . . . . . . 9,184 9,170 9,184 9,145
Source: Bank Indonesia(1) The annual average exchange rates are calculated as averages of the exchange rate on the last day of each
month during the year.(2) The monthly average exchange rates are calculated as averages of each daily closing exchange rate.
Bank Indonesia is the sole issuer of Indonesian rupiah and is responsible for maintaining its stability. Since1970, Indonesia has implemented three exchange rate systems: (i) a fixed rate system between 1970 and 1978;(ii) a managed floating exchange rate system between 1978 and 1997; and (iii) a free-floating exchange ratesystem since August 14, 1997. Under the floating exchange rate system, Bank Indonesia maintained stability ofthe Indonesian rupiah through a trading band policy, pursuant to which Bank Indonesia would enter the foreigncurrency market and buy or sell Indonesian rupiah, as required, when trading in the Indonesian rupiah exceededbid and offer prices announced by Bank Indonesia on a daily basis. On August 14, 1997, Bank Indonesiaterminated the trading band policy and permitted the exchange rate for the Indonesian rupiah to float without anannounced level at which it would intervene, which resulted in a substantial decrease in the value of theIndonesian rupiah relative to the U.S. dollar. Under the current system, the exchange rate of the Indonesianrupiah is determined by the market, reflecting the interaction of supply and demand in the market. However,Bank Indonesia may take measures to maintain a stable exchange rate. The prevailing exchange rate wasRp9,400 = US$1.00 as of December 31, 2009, Rp8,991 = US$1.00 as of December 31, 2010 and Rp9,068 =US$1.00 as of December 31, 2011, respectively. On April 25, 2012, the exchange rate was Rp9,194 perU.S. dollar. The Federal Reserve Bank of New York does not certify for customs purposes a noon buying rate forcable transfers in Indonesian rupiah.
The Indonesian rupiah has been and in general is freely convertible or transferable. Bank Indonesia hasintroduced regulations to restrict the movement of Indonesian rupiah from banks within Indonesia to offshore bankswithout underlying trade or investment reasons, thereby limiting offshore trading to existing sources of liquidity. Inaddition, Bank Indonesia has the authority to request information and data concerning the foreign exchangeactivities of all people and legal entities that are domiciled, or plan to reside, in Indonesia for at least one year.
Foreign Exchange
Foreign exchange controls were abolished in 1971, and Indonesia now maintains a liberal foreign exchangesystem that permits the free flow of foreign exchange. Capital transactions, including remittances of capital,profits, dividends and interests, are free from exchange controls. A number of regulations, however, have animpact on the exchange system. Bank Indonesia recently introduced regulations to restrict the movement ofIndonesian rupiah from banks within Indonesia to offshore banks without underlying trade or investment reasons,thereby limiting offshore trading to existing sources of liquidity. In addition, Bank Indonesia has the authority torequest information and data concerning the foreign exchange activities of all people and legal entities that aredomiciled in Indonesia or plan to domicile in Indonesia for at least one year.
10
RISK FACTORS
Risks Relating to Indonesia
We are incorporated in Indonesia and substantially all of our operations, assets and customers are located inIndonesia. As a result, future political, economic, legal and social conditions in Indonesia, as well as certainactions and policies which the Government may, or may not, take or adopt may have a material adverse effect onour business, financial condition, results of operations and prospects.
Domestic, regional or global economic changes may adversely affect our business
The economic crisis which affected Southeast Asia, including Indonesia, from mid-1997 was characterizedin Indonesia by, among other things, currency depreciation, negative economic growth, high interest rates, socialunrest and extraordinary political events. These conditions had a material adverse effect on Indonesianbusinesses, including a material adverse effect on the quality and growth of our subscriber base and serviceofferings, which depend on the health of the overall Indonesian economy. In addition, the economic crisisresulted in the failure of many Indonesian companies to meet their debt obligations. Many Indonesian companieshave not fully recovered from the economic crisis, and many such companies are still in the process ofrestructuring their debt obligations or are engaged in disputes arising from defaults under their debt obligations.
Beginning in 2008, the global financial crisis which was triggered in part by the subprime mortgage crisis inthe United States, caused failures of large U.S. financial institutions and rapidly evolved into a global creditcrisis. U.S. bank failures were followed by failures in a number of European banks and declines in various stockindexes, as well as large reductions in the market value of equities and commodities worldwide, including inIndonesia. In addition, since 2010, the European sovereign debt crisis, has created concerns about the ability of anumber of European countries, including Greece, Ireland, Italy, Portugal and Spain, to continue to service theirsovereign debt obligations. These conditions may result in worsening economic conditions in Europe andglobally. The world economic downturn has adversely affected the economic performance of Indonesia, resultingin declining economic growth, slowing household consumption and weakening investment due to loss of externaldemand and increased uncertainty in the world economy. These conditions have had and may continue to have anegative impact on Indonesian businesses and consumers, which may result in reduced demand fortelecommunication services.
Volatility in oil prices and potential food shortages may also cause an economic slowdown in manycountries, including Indonesia. An economic downturn in Indonesia could also lead to additional defaults byIndonesian borrowers and could have a material adverse effect on our business, financial condition and results ofoperations and prospects. The Government continues to have a large fiscal deficit and a high level of sovereigndebt. Its foreign currency reserves are modest and the banking sector is weak and suffers from relatively highlevels of non-performing loans. The current high inflation rate in Indonesia may also result in less disposableincome available to consumers to spend or cause consumer purchasing power to decrease, which may reduceconsumer demand for telecommunication services, including our services.
A loss of investor confidence in the financial systems of emerging and other markets, or other factors,including the deterioration of the global economic situation, may cause increased volatility in the Indonesianfinancial markets and a slowdown in economic growth or negative economic growth in Indonesia. Any suchincreased volatility or slowdown or negative growth could have a material adverse effect on our business,financial condition and results of operations and prospects.
Political and social instability may adversely affect us
Since 1998, Indonesia has experienced a process of democratic change, resulting in political and socialevents that have highlighted the unpredictable nature of Indonesia’s changing political landscape. These events
11
have resulted in political instability as well as general social and civil unrest on certain occasions in the past fewyears. As a relatively new democratic country, Indonesia continues to face various socio-political issues and has,from time to time, experienced political instability and social and civil unrest.
Since 2000, thousands of Indonesians have participated in demonstrations in Jakarta and other Indonesiancities both for and against former President Wahid, former President Megawati, and current PresidentYudhoyono, as well as in response to specific issues, including fuel subsidy reductions, privatization of stateassets, anti-corruption measures, the bailout of PT Bank Century in 2008, decentralization and provincialautonomy and the American-led military campaigns in Afghanistan and Iraq.
In June 2001, demonstrations and strikes affected at least 19 cities after the Government mandated a 30.0%increase in fuel prices. Similar demonstrations in response to fuel subsidy reductions occurred in 2003, 2005 and2008. Although these demonstrations were generally peaceful, some turned violent. During the first quarter of2012, the Government proposed fuel subsidy reductions that would result in up to a 33% increase in fuel prices.We cannot assure you that this proposal or any future fuel subsidy reductions will not lead to further political andsocial instability. Regional political instability and clashes between religious and ethnic groups remainproblematic. Separatist movements and clashes between religious and ethnic groups have resulted in social andcivil unrest in parts of Indonesia. In the provinces of Aceh and Papua (formerly Irian Jaya), there have beenclashes between supporters of those separatist movements and the Indonesian military, although there has beenlittle conflict in Aceh since a memorandum of understanding was signed in August 2005. In recent years,political instability in Maluku and Poso, a district in the province of Central Sulawesi, has intensified and clashesbetween religious groups in these regions have resulted in thousands of casualties and displaced persons. Inrecent years, the Government has made limited progress in negotiations with these troubled regions, except in theProvince of Aceh where peaceful local elections were recently held which resulted in former separatists winningthe election and becoming the governors of the Province.
In 2004 and in 2009, elections were held in Indonesia to elect the President, Vice-President andrepresentatives in the Parliament. Although the 2004 and 2009 elections were conducted peacefully, politicalcampaigns in Indonesia may bring a degree of political and social uncertainty to Indonesia. Increased politicalactivity can be expected in Indonesia, in part due to the upcoming presidential election in 2014.
Political and related social developments in Indonesia have been unpredictable in the past, and we cannotassure you that social and civil disturbances will not occur in the future and on a wider scale, or that any suchdisturbances will not, directly or indirectly, have a material adverse effect on our business, financial condition,results of operations and prospects.
Indonesia is located in an earthquake zone and is subject to significant geological risks which could lead tosocial unrest and economic loss
Many parts of Indonesia are vulnerable to natural disasters such as earthquakes, tsunamis, floods, volcaniceruptions as well as droughts, power outages or other events beyond our control. In recent years, several naturaldisasters have occurred in Indonesia (in addition to the Asian tsunami in 2004), including volcanic eruptions ofMount Lokon in North Sulawesi in 2011, Mount Merapi in southern Java near Yogyakarta, and Mount Bromo inEast Java in 2010, tsunamis in Mentawai in West Sumatera in 2010 and in Pangandaran in West Java in 2006, anearthquake off the coast of Sumatra in January 2012, separate earthquakes in Papua, West Java, Sulawesi andSumatra in 2009, an earthquake in Jogyakarta in Central Java in 2006, and a hot mud eruption and subsequentflooding in East Java in 2006. Indonesia also experienced significant flooding in Wasior district, West Papua in2010, in Jakarta in 2009 and 2007 and in Solo in Central Java in 2008.
As a result of these natural disasters, the Government has had to spend significant amounts on emergencyaid and resettlement efforts. Most of these costs have been underwritten by foreign governments andinternational aid agencies. We cannot assure you that such aid will continue to be forthcoming, or that it will be
12

delivered to recipients on a timely basis. If the Government is unable to timely deliver foreign aid to affectedcommunities, political and social unrest could result. While the Government has implemented various measuresto mitigate the losses caused by natural disasters, such as establishing a national board for disaster mitigation andinstalling tsunami early warning systems, recovery and relief efforts are likely to continue to impose a strain onthe Government’s finances, and may affect its ability to meet its obligations on its sovereign debt. Any suchfailure on the part of the Government, or declaration by it of a moratorium on its sovereign debt, could trigger anevent of default under numerous private-sector borrowings including those of our Company, thereby materiallyand adversely affecting our business.
We cannot assure you that our insurance coverage will be sufficient to protect us from potential lossesresulting from such natural disasters and other events beyond our control. In addition, we cannot assure you thatthe premium payable for these insurance policies upon renewal will not increase substantially, which maymaterially and adversely affect our financial condition and results of operations. We also cannot assure you thatfuture geological or meteorological occurrences will not have more of an impact on the Indonesian economy. Asignificant earthquake, other geological disturbance or weather-related natural disaster in any of Indonesia’smore populated cities and financial centers could severely disrupt the Indonesian economy and undermineinvestor confidence, thereby materially and adversely affecting our business, financial condition, results ofoperations and prospects.
Terrorist activities in Indonesia could destabilize the country, thereby adversely affecting our business,financial condition, results of operations and prospects
Several bombing incidents have taken place in Indonesia, most significantly in October 2002 in Bali, aregion of Indonesia previously considered safe from the unrest affecting other parts of the country. Otherbombing incidents, although on a lesser scale, have also been committed in Indonesia on a number of occasionsover the past few years, including at shopping centers and places of worship. In April 2003, a bomb explodedoutside the main United Nations building in Jakarta and in front of the domestic terminal at Soekarno HattaInternational Airport. In August 2003, a bomb exploded at the JW Marriott Hotel in Jakarta, and in September2004, a bomb exploded in front of the Australian embassy in Jakarta. In May 2005, bomb blasts in CentralSulawesi killed at least 21 people and injured at least 60 people. In October 2005, bomb blasts in Bali killed atleast 23 people and injured at least 101 others. Indonesian, Australian and U.S. government officials haveindicated that these bombings may be linked to an international terrorist organization. Demonstrations have takenplace in Indonesia in response to plans for and subsequent to U.S., British and Australian military action in Iraq.In January 2007, sectarian terrorists conducted bombings in Poso. In July 2009, bomb blasts in the JW Marriottand Ritz Carlton hotels in Jakarta killed six people and injured at least 50 people. Further terrorist acts may occurin the future and may be directed at foreigners in Indonesia. Violent acts arising from, and leading to, instabilityand unrest could destabilize Indonesia and the Government and have had, and may continue to have, a materialadverse effect on investment and confidence in, and the performance of, the Indonesian economy, and may havea material adverse effect on our business, financial condition, results of operations and prospects.
Our operations may be adversely affected by an outbreak of Severe Acute Respiratory Syndrome (“SARS”),avian influenza, Influenza A (H1N1) virus or other epidemics
In 2003, certain countries in Asia including, Indonesia, the China, Vietnam, Thailand and Cambodia,experienced an outbreak of SARS, a highly contagious form of atypical pneumonia, which seriously interruptedthe economic activities in, and the demand for goods plummeted in, the affected regions.
During the last four years, large parts of Asia experienced unprecedented outbreaks of avian influenza. Asof December 15, 2011, the World Health Organization (“WHO”) had confirmed a total of 336 fatalities in a totalnumber of 573 cases reported to the WHO, which only reports laboratory confirmed cases of avian influenza. Ofthese, the Indonesian Ministry of Health reported to the WHO 152 fatalities in a total number of 184 cases ofavian influenza in Indonesia. In addition, the WHO announced in June 2006 that human-to-human transmission
13

of avian influenza had been confirmed in Sumatra, Indonesia. According to the United Nations Food andAgricultural Organization, avian influenza virus is entrenched in 31 of Indonesia’s 33 provinces and efforts tocontain avian influenza are failing in Indonesia, increasing the possibility that the virus may mutate into adeadlier form. No fully effective avian influenza vaccines have been developed and an effective vaccine may notbe discovered in time to protect against a potential avian influenza pandemic.
In April 2009, there was an outbreak of the Influenza A (H1N1) virus, which originated in Mexico but hassince spread globally, including confirmed reports in Hong Kong, Indonesia, Japan, Malaysia, Singapore andelsewhere in Asia. The Influenza A (H1N1) virus is believed to be highly contagious and may not be easilycontained.
An outbreak of SARS, avian influenza, Influenza A (H1N1) virus or a similar epidemic, or the measurestaken by the governments of affected countries, including Indonesia, against such an outbreak, could severelydisrupt the Indonesian and other economies and undermine investor confidence, thereby materially and adverselyaffecting our financial condition or results of operations.
Labor activism and unrest may adversely affect our business
The liberalization of regulations permitting the formation of labor unions, combined with weak economicconditions, has resulted, and will likely continue to result, in labor unrest and activism in Indonesia. In 2000, theGovernment issued a labor regulation allowing employees to form unions without employer intervention. InMarch 2003, the Government enacted a manpower law, Law No. 13/2003 (the “Labor Law”), which, amongother things, increased the amount of required severance, service and compensation payments to terminatedemployees, and required employers with 50 or more employees to establish bipartite forums with theparticipation of employers and employees. To negotiate a collective labor agreement with such a company, alabor union’s membership must consist of more than 50.0% of the company’s employees. In response to achallenge to its validity, the Indonesian Constitutional Court declared the Labor Law to be mostly valid, exceptfor certain provisions relating to, among others, (i) the right of an employer to terminate its employee whocommitted a serious mistake; (ii) the imprisonment of, or imposition of a monetary penalty on, an employee whoinstigates or participates in an illegal labor strike or persuades other employees to participate in a labor strike;(iii) the requirement to allow outsourcing or subcontracting arrangements with a temporary employment contractthat does not stipulate for the transfer of undertakings protection of employment provision; and (iv) therequirement that a labor union obtain the presentation of at least 50.0% of employees (for a company that hasmore than one labor union) to be eligible to conduct negotiations with an employer. The Government proposed toamend the Labor Law in a manner which, in the view of labor activists, would result in reduced pension benefits,the increased use of outsourced employees and prohibitions on unions to conduct strikes. The proposal has beensuspended and the new Government regulation addressing lay-offs of workers has not yet become effective.
Labor unrest and activism could disrupt our operations and could adversely affect the financial condition ofIndonesian companies in general and the value of the Indonesian rupiah relative to other currencies, which couldhave a material adverse effect on our business, financial condition, results of operations and prospects.
Depreciation in the value of the Indonesian rupiah may adversely affect our business, financial condition,results of operations and prospects
One of the most important immediate causes of the economic crisis which began in Indonesia in mid-1997was the depreciation and volatility of the value of the Indonesian rupiah, as measured against other currencies,such as the U.S. dollar. Although the Indonesian rupiah has appreciated considerably from its low point ofapproximately Rp17,000 per U.S. dollar in 1998, it may experience volatility again in the future. During theperiod between January 1, 2009 through December 31, 2011, the Indonesian rupiah/U.S. dollar exchange rateranged from a low of Rp12,065 per U.S. dollar to a high of Rp8,460 per U.S. dollar. We cannot assure you thatfuture depreciation or volatility of the Indonesian rupiah against other currencies, including the U.S. dollar, will
14

not occur. To the extent the Indonesian rupiah depreciates further from the exchange rates at December 31, 2011,our obligations under our accounts payable, procurements payable and our foreign currency-denominated loanspayable and bonds payable would increase in Indonesian rupiah terms. Such depreciation of the Indonesia rupiahwould result in additional losses on foreign exchange translation and significantly impact our other income andnet income.
In addition, while the Indonesian rupiah has generally been freely convertible and transferable (except thatIndonesian banks may not transfer Indonesian rupiah to persons outside of Indonesia who lack a bona fide tradeor investment purpose), from time to time, Bank Indonesia has intervened in the currency exchange markets infurtherance of its policies, either by selling Indonesian rupiah or by using its foreign currency reserves topurchase Indonesian rupiah. We cannot assure you that the current floating exchange rate policy of BankIndonesia will not be modified or that the Government will take additional action to stabilize, maintain orincrease the value of the Indonesian rupiah, or that any of these actions, if taken, will be successful. Modificationof the current floating exchange rate policy could result in significantly higher domestic interest rates, liquidityshortages, capital or exchange controls or the withholding of additional financial assistance by multinationallenders. This could result in a reduction of economic activity, an economic recession, loan defaults or decliningusage of our subscribers, and as a result, we may also face difficulties in funding our capital expenditures and inimplementing our business strategy. Any of the foregoing consequences could have a material adverse effect onour business, financial condition, results of operations and prospects.
Downgrades of credit ratings of the Government or Indonesian companies could adversely affect our business
Beginning in 1997, certain recognized statistical rating organizations, including Moody’s, Standard &Poor’s, and Fitch, downgraded Indonesia’s sovereign rating and the credit ratings of various credit instruments ofthe Government and a large number of Indonesian banks and other companies. As of April 23, 2012, Indonesia’ssovereign foreign currency long-term debt was rated “Baa3” by Moody’s, upgraded from “Ba1” on January 18,2012, “BB+” by Standard & Poor’s, upgraded from “BB” on April 8, 2011, and “BBB-” by Fitch, upgraded from“BB+” on December 14, 2011. These ratings reflect an assessment of the Government’s overall financialcapacity to pay its obligations and its ability or willingness to meet its financial commitments as they becomedue.
Even though the recent trend in Indonesian sovereign ratings has been positive, we cannot assure you thatMoody’s, Standard & Poor’s, Fitch or any other statistical rating organization will not downgrade the creditratings of Indonesia or Indonesian companies, including us. Any such downgrade could have an adverse impacton liquidity in the Indonesian financial markets, the ability of the Government and Indonesian companies,including us, to raise additional financing and the interest rates and other commercial terms at which suchadditional financing is available. Interest rates on our floating rate Indonesian rupiah-denominated debt wouldalso likely increase. Such events could have material adverse effects on our business, financial condition, resultsof operations and prospects.
We are subject to corporate disclosure and reporting requirements that differ from those in other countries
As we are a public company listed in the Indonesia Stock Exchange and New York Stock Exchange, we aresubject to corporate governance and reporting requirements in Indonesia and the United States that differ, insignificant respects, from those applicable to companies in certain other countries. The amount of informationmade publicly available by issuers in Indonesia may be less than that made publicly available by comparablecompanies in certain more developed countries, and certain statistical and financial information of a typetypically published by companies in certain more developed countries may not be available. As a result, investorsmay not have access to the same level and type of disclosure as that available in other countries, and comparisonswith other companies in other countries may not be possible in all respects.
15

We are incorporated in Indonesia, and it may not be possible for investors to effect service of process, orenforce judgments, on us within the United States, or to enforce judgments of a foreign court against us inIndonesia
We are a limited liability company incorporated in Indonesia, operating within the framework of Indonesianlaws relating to foreign capital invested companies, and all of our significant assets are located in Indonesia. Inaddition, several of our Commissioners and substantially all of our Directors reside in Indonesia and a substantialportion of the assets of such persons is located outside the United States. As a result, it may be difficult forinvestors to effect service of process, or enforce judgments, on us or such persons within the United States, or toenforce against us or such persons in the United States, judgments obtained in U.S. courts.
We have been advised by our Indonesian legal advisor that judgments of U.S. courts, including judgmentspredicated upon the civil liability provisions of the U.S. federal securities laws or the securities laws of any statewithin the United States, are not enforceable in Indonesian courts, although such judgments could be admissibleas non-conclusive evidence in a proceeding on the underlying claim in an Indonesian court. There is doubt as towhether Indonesian courts will enter judgments in original actions brought in Indonesian courts predicated solelyupon the civil liability provisions of the U.S. federal securities laws or the securities laws of any state within theUnited States. As a result, the claimant would be required to pursue claims against us or such persons inIndonesian courts.
Risks Relating to Our Business
We operate in a legal and regulatory environment that is undergoing significant reforms. These reforms mayresult in increased competition, which may result in reduced margins and operating revenues, among otherthings, all of which may have a material adverse effect on us
The regulatory reform of the Indonesian telecommunications sector, which was initiated by the Governmentin 1999, has to a certain extent resulted in the liberalization of the telecommunications industry, includingfacilitation of new market entrants and changes to the competitive structure of the telecommunications industry.However, in recent years, the volume and complexity of regulatory changes has created an environment ofconsiderable regulatory uncertainty. In addition, as the reform of the Indonesian telecommunications sectorcontinues, competitors, potentially with greater resources than us, may enter the Indonesian telecommunicationssector and compete with us in providing telecommunications services.
For example, since January 2007, the Government, through the Ministry of Communication and InformationTechnology (“MOCIT”), has been responsible for setting tariffs for interconnection services. See “Item 3: KeyInformation—Risk Factors—Risks Relating to Our Business—We depend on interconnection agreementsrelating to the use of our competitors’ cellular and fixed-line telephone networks.” The MOCIT setsinterconnection tariffs for dominant service providers on a “cost” basis, based on RIOs submitted by thedominant service providers. In contrast, telecommunications operators which are not designated as dominantoperators may simply notify the MOCIT regarding their tariffs and may implement such tariffs for its customerswithout MOCIT approval. The disparity in the treatment of dominant and non-dominant telecommunicationsoperators may create opportunities for new entrants in the telecommunications industry, providing them withincreased flexibility to establish lower tariffs and offer lower pricing terms to their customers. In addition, thetariffs in our RIOs have been decreasing in the past few years, and we expect this downward trend to continue.Any decrease in the amount of interconnection costs might reduce our revenue and also our costs for inter-operator traffic.
In addition, on December 12, 2011, the Government, through the Indonesian TelecommunicationRegulatory Authority (“ITRA”) issued letter No.262/BRTI/XII/2011 under which SMS fees will change from a“sender-keeps all” scheme to a cost-based scheme, effective June 1, 2012. Under the cost-based scheme, we willrecord revenues from interconnection fees payable by other operators whenever one of our subscribers receivesan SMS from a subscriber on another network. If one of our subscribers sends an SMS to a recipient on another
16

network, we will record revenues for the SMS charge payable by our subscriber and will record expenses forinterconnection charges payable to the operator of the other network. We cannot assure you that we will be ableto fully recoup all interconnection charges we may be required to pay, and as a result, we could experience adecrease in our operating revenues from cellular services.
In the future, the Government may announce or implement other regulatory changes, such as changes ininterconnection or tariff policies, which may adversely affect our business or our existing licenses. We cannotassure you that we will be able to compete successfully with other domestic and foreign telecommunicationsoperators or that regulatory changes, amendments or interpretations of current or future laws and regulationspromulgated by the Government will not have a material adverse effect on our business, financial condition,results of operations and prospects.
We may be unable to fund the capital expenditures needed for us to remain competitive in thetelecommunications industry in Indonesia
The delivery of telecommunications services is capital intensive. In order to be competitive, we mustcontinually expand, modernize and update our telecommunications infrastructure technology, which involvessubstantial capital investment. For the years ended December 31, 2009, 2010 and 2011, our actual consolidatedcapital expenditures totaled Rp11,584.5 billion, Rp5,515.0 billion and Rp6,911.6 billion (US$762.2 million),respectively. During 2012, we intend to allocate Rp6,722.1 billion (US$741.3 million) for new capitalexpenditures, which, taken together with estimated actual capital expenditures expended for 2012 for capitalexpenditure commitments in prior periods, will result in approximately Rp7,638.9 billion (US$842.4 million)total actual capital expenditures for 2012. Our ability to fund capital expenditures in the future will depend onour future operating performance, which is subject to prevailing economic conditions, levels of interest rates andfinancial, business and other factors, many of which are beyond our control, and upon our ability to obtainadditional external financing. We cannot assure you that additional financing will be available to us oncommercially acceptable terms, or at all. In addition, we can only incur additional financing in compliance withthe terms of our debt agreements. Accordingly, we cannot assure you that we will have sufficient capitalresources to improve or expand our telecommunications infrastructure technology or update our other technologyto the extent necessary to remain competitive in the Indonesian telecommunications market. Our failure to do socould have a material adverse effect on our business, financial condition, results of operations and prospects.
We depend on interconnection agreements relating to the use of our competitors’ cellular and fixed-linetelephone networks
We are dependent on interconnection agreements relating to the use of our competitors’ cellular and fixed-line telephone networks and associated infrastructure for the successful operation of our business. If any disputesinvolving such interconnection arrangements arise, whether due to a failure by a counterparty to perform itscontractual obligations or for any other reason, the delivery of one or more of our services may be delayed,interrupted or stopped, the quality of our services may be lowered, our subscriber churn rates may increase or ourinterconnection rates may increase. Any disputes involving our current interconnection agreements, as well asour failure to enter into or renew interconnection agreements, could have a material adverse effect on ourbusiness, financial condition, results of operations and prospects.
We may become subject to limitations on foreign ownership in the telecommunication services business
Presidential Regulation No. 36 of 2010 (the “Presidential Regulation”) sets out the industries and businessfields in which foreign investment is prohibited, restricted or subject to the fulfillment of certain conditions asstipulated by the applicable Governmental authorities (the “Negative List”). The telecommunication industry isone of the industries set out in the Negative List, and foreign investment in the Indonesian telecommunicationindustry is accordingly subject to applicable restrictions and conditions. The Negative List is implemented by theCapital Investment Coordinating Board (“BKPM”). Restrictions applicable to the telecommunication industry are
17
dependent upon the type of telecommunication business undertaken. Different limitation thresholds areapplicable depending upon whether the business pertains to telecommunication networks or services. Thelimitation on foreign holdings in companies engaging in the telecommunication network business ranges from49.0%—65.0%, and the limitation on foreign shareholdings in Indonesian companies engaged in the provision ofmultimedia services (including data communication such as broadband wireless services), from 49.0%—95.0%.Pursuant to Article 8 of the Presidential Regulation, the restrictions set forth therein shall not apply toinvestments that have been approved prior to the effectiveness of the Presidential Regulation pursuant toinvestment approval issued by BKPM unless such restrictions are more favorable to the investments. ThePresidential Regulation does not change the limitation of foreign shareholding in our business.
On June 22, 2008, Qatar Telecom (Qtel) Q.S.C. (“Qtel”), through its subsidiary, Qatar South East AsiaHolding S.P.C. purchased all of the issued and outstanding shares of capital stock of each of IndonesiaCommunications Limited (“ICLM”), and Indonesia Communications Pte. Ltd. (“ICLS”) from Asia MobileHoldings Pte. Ltd. (“AMH”), a company incorporated in Singapore. Following this acquisition, a change ofcontrol occurred in the Company, requiring Qtel to conduct a mandatory tender offer. In connection with thetender offer, on December 23, 2008, the Capital Market and Financial Institution Supervisory Agency of theMinistry of Finance of the Republic of Indonesia (“Bapepam-LK”) issued a letter (i) noting that it had received aletter from BKPM dated December 19, 2008, pursuant to which BKPM confirmed that the maximum amount offoreign capital ownership in the Company shall be 65.0%, and that the Company may still conduct its cellularnetwork operation and local fixed network business and (ii) permitting Qtel to conduct the tender offer.Following the issuance of such letter, Qtel conducted a mandatory tender offer to acquire up to 1,314,466,775Series B Shares, representing approximately 24.19% of our total issued and outstanding Series B Shares(including Series B Shares represented by ADSs).
As we are a publicly listed company, we believe that the Negative List restrictions do not apply to us. If therelevant regulatory authorities were to apply the Negative List to us, notwithstanding our status as a publiclylisted company, our controlling and/or other foreign shareholders may be required to reduce their shareholding inus, which could create downward pressure on the trading price for our shares. This could have a material adverseeffect on our business, financial condition, results of operations and prospects. We may also be required toseparate our business entity into two sectors, mobile or cellular network and fixed network, in order to complywith the relevant regulation. Separating our business into two sectors may involve divesting either our fixednetwork or mobile or cellular network operation businesses to a subsidiary or a third party, which couldmaterially alter our operations and result in a reduction of our total operating revenue. In addition, if the relevantregulatory authorities determine that our foreign ownership still exceeds the Negative List restriction, theregulatory authorities may prohibit us from participating in bidding for or obtaining further licenses or additionalspectrum. If this occurs, our business, prospects, financial condition and results of operations would be adverselyaffected.
A failure in the continuing operations of our network, certain key systems, gateways to our network or thenetworks of other network operators could adversely affect our business, financial condition, results ofoperations and prospects
We depend to a significant degree on the uninterrupted operation of our network to provide our services. Forexample, we depend on access to the PSTN for termination and origination of cellular telephone calls to and fromfixed-line telephones, and a significant portion of our cellular and international long-distance call traffic is routedthrough the PSTN. The limited interconnection facilities of the PSTN available to us have adversely affected ourbusiness in the past and may adversely affect our business in the future.
Because of interconnection capacity constraints, our cellular subscribers have at times experienced blockedcalls. We cannot assure you that these interconnection facilities can be increased or maintained at current levels.
18

We also depend on certain technologically sophisticated management information systems and othersystems, such as our customer billing system, to enable us to conduct our operations. In addition, we rely to acertain extent on interconnection to the networks of other telecommunications operators to carry calls from oursubscribers to the subscribers of fixed-line operators and other cellular operators, both within Indonesia andoverseas. Our network, including our information systems, information technology and infrastructure and thenetworks of other operators with whom our subscribers interconnect, are vulnerable to damage or interruptions inoperation from a variety of sources including earthquake, fire, flood, power loss, equipment failure, networksoftware flaws, transmission cable disruption or similar events. For example, our telecommunications control andinformation technology back-up facilities are highly concentrated within our headquarters and our principaloperating and tape back-up storage facilities are located at two sites in Jakarta. Any failure that results in aninterruption of our operations or of the provision of any service, whether from operational disruption, naturaldisaster or otherwise, could damage our ability to attract and retain subscribers, cause significant subscriberdissatisfaction and adversely affect our business, financial condition, results of operations and prospects.
Our failure to react to rapid technological changes could adversely affect our business
The telecommunications industry is characterized by rapid and significant changes in technology. We mayface increasing competition due to technologies currently under development or which may be developed in thefuture. Future development or application of new or alternative technologies, services or standards could requiresignificant changes to our business model, the development of new products, the provision of additional servicesand substantial new investments by us. For example, the development of fixed-mobile convergence technology,which allows a call that originates on a cellular handset to bypass a cellular network and instead be carried over afixed-line telephone network, could adversely affect our business. New products and services may be expensiveto develop and may result in the introduction of additional competitors into the marketplace. We cannotaccurately predict how emerging and future technological changes will affect our operations or thecompetitiveness of our services. We cannot assure you that our technologies will not become obsolete, or besubjected to competition from new technologies in the future, or that we will be able to acquire new technologiesnecessary to compete in changed circumstances on commercially acceptable terms. Our failure to react to rapidtechnological changes could adversely affect our business, financial condition, results of operations andprospects.
Breaches of network or information technology security could have an adverse effect on our business.
Cyber attacks or other breaches of network or information technology (IT) security may cause equipmentfailures or disrupt our operations. Such failures or disruptions, even for a limited period of time, may result insignificant expenses and/or loss of market share to other communications providers. In particular, bothunsuccessful and successful cyber attacks on companies have increased in frequency, scope and potential harm inrecent years. The costs associated with a major cyber attack on us could include expenses associated withincentives offered to existing customers and business partners to retain their business, increased expenditures oncyber security measures, lost revenues from business interruption, litigation and damage to our reputation.
Further, certain of our businesses, including infrastructure and cloud services to business customers, couldbe negatively affected if our ability to protect our own networks is called into question as a result of a cyberattack. In addition, if we are unable to provide adequate security to protect our valuable information such asfinancial data, sensitive information about the Company and intellectual property, or if we are unable to protectthe privacy of customer and employee confidential data against breaches of network or IT security, it could resultin damage to our reputation, which could adversely impact customer and investor confidence. Any of theseoccurrences could result in a material adverse effect on our results of operations and financial condition.
19
The Government is the majority shareholder of our major competitors, Telkom and Telkomsel. TheGovernment may give priority to Telkom’s or Telkomsel’s businesses over ours
As of December 31, 2011, the Government had a 14.29% equity stake in us, including the Series A share,which has special voting rights and veto rights over certain strategic matters under our Articles of Association,including decisions on dissolution, liquidation and bankruptcy, and also permits the Government to nominate oneDirector to our Board of Directors and one Commissioner to our Board of Commissioners.
As of September 30, 2011, the Government also had a 52.85% equity stake in Telkom, which is ourforemost competitor in fixed IDD telecommunications services. As of the same date, Telkom owns a 65.0%interest in Telkomsel, one of our two main competitors in the provision of cellular services. The percentage ofthe Government’s ownership interest in Telkom is significantly greater than its ownership interest in us. Wecannot assure you that significant Government policies and plans will support our business or that theGovernment will treat us equally with Telkom and Telkomsel when implementing future decisions, or whenexercising regulatory power over the Indonesian telecommunications industry. If the Government were to givepriority to Telkom’s or Telkomsel’s business over ours, our business, financial condition, and results ofoperations and prospects could be materially and adversely affected.
Our controlling shareholders’ interests may differ from those of our other shareholders
As of December 31, 2011, Qatar Telecom (Qtel Asia) Pte. Ltd. (“Qtel Asia”), owned approximately 65.0%of our issued and outstanding share capital. Qtel Asia is currently wholly owned and controlled by Qtel, which ismajority-owned by the State of Qatar and its affiliated entities. Qtel Asia and its controlling shareholder have theability to exercise a controlling influence over our business and may cause us to take actions that are not in, ormay conflict with, our or our other shareholders’ best interests, including matters relating to our management andpolicies. Although nominees of Qtel Asia hold positions on our Board of Commissioners and Board of Directors,we cannot assure you that our controlling shareholder will elect directors and commissioners or influence ourbusiness in a way that benefits our other shareholders.
We rely on key management personnel, and our business may be adversely affected by any inability to recruit,train, retain and motivate our key employees
We believe that our current management team contributes significant experience and expertise to themanagement of our business. The continued success of our business and our ability to execute our businessstrategies in the future will depend in large part on the efforts of our key personnel. There is a shortage of skilledpersonnel in the telecommunications industry in Indonesia and this shortage is likely to continue. As a result,competition for certain specialist personnel is intense. In addition, as new market entrants begin or expandoperations in Indonesia, certain of our key employees may leave their current positions. Our inability to recruit,train, retain and motivate key employees could have a material adverse effect on our business, financialcondition, results of operations and prospects.
If we are found liable for price fixing by the Indonesian Anti-Monopoly Committee and for class actionallegations, we may be subject to substantial liability which could lead to a decrease in our revenue and affectour business, reputation and profitability
On November 1, 2007, the Indonesian Supervising Committee for Business Competition (the “KPPU”)issued a decision regarding a preliminary investigation involving us and eight other telecommunicationcompanies based on allegations of price-fixing for SMS services and breach of Article 5 of the Anti-monopolyLaw (“Law No. 5 / 1999”). On June 18, 2008, the KPPU determined that PT Telekomunikasi Indonesia Tbk(“Telkom”), PT Telekomunikasi Selular (“Telkomsel”), PT XL Axiata Tbk. (“XL”), PT Bakrie Telecom Tbk(“Bakrie Telecom”), PT Mobile-8 Telecom Tbk (“Mobile-8,” and subsequent to March 2011, “Smartfren”) andPT Smart Telecom (“Smart Telecom”) had jointly breached Article 5 of the Anti-monopoly Law. Mobile-8appealed this ruling to the Central Jakarta District Court, where Telkomsel, XL, Telkom, Indosat, PT Hutchison
20

CP Telecommunication (“Hutchison”), Bakrie Telecom, Smart Telecom, PT Natrindo Telepon Selular(“Natrindo”) were summoned to appear as co-defendants in the hearing, while Telkomsel appealed this ruling tothe South Jakarta District Court. Although the KPPU decided in our favor with respect to the allegations of price-fixing of SMS, we cannot assure you that the District Court will affirm the KPPU decision. In 2011, the SupremeCourt issued a ruling appointing the Central Jakarta District Court jurisdiction to examine the objections filed inthe appeal of the KPPU decision. The District Court will consider objections against the KPPU decision based ona re-examination of the KPPU decision and case files submitted by KPPU. If the District Court issues a verdictagainst us, we could be subjected to the payment of a fine, the amount of which will be subject to the discretionof the District Court, which could have an adverse effect on our business, reputation and profitability.
In addition, a series of class action lawsuits were filed against us and Telkomsel during 2007 and 2008,which alleged we engaged in price fixing violations. These lawsuits have all been either withdrawn by theplaintiffs or the relevant courts have ruled that such cases were unacceptable, meaning the courts, without rulingon the merits of the case, found that the plaintiffs did not have proper legal standing, there were formal defects inthe lawsuit or the allegations were too vague. However, we cannot assure you that other subscribers will not filesimilar cases in the future, which may subject us to legal damages or other liabilities which could have anadverse effect on our business, reputation and profitability.
We are exposed to interest rate risk
Our debt includes bank borrowings to finance our operations. Where appropriate, we seek to minimize ourinterest rate risk exposure by entering into interest rate swap contracts to swap floating interest rates for fixedinterest rates over the duration of certain of our borrowings. However, our hedging policy may not adequatelycover our exposure to interest rate fluctuations and this may result in a large interest expense and an adverseeffect on our business, financial condition and results of operations.
We are exposed to counter-party risk
We may enter into various transactions from time to time which will expose us to the credit of our counter-parties and their ability to satisfy the terms of contracts with us. For example, we may enter into swaparrangements, which expose us to the risk that counter-parties may default on their obligations to perform underthe relevant contract. In the event a counter-party, including a financial institution, is declared bankrupt orbecomes insolvent, this may result in delays in obtaining funds or us having to liquidate our position, potentiallyleading to losses.
We may not be able to successfully manage our foreign currency exchange risk
Changes in exchange rates have affected and may continue to affect our financial condition and results ofoperations. Most of our debt obligations are denominated in Indonesian rupiah and a majority of our capitalexpenditures are denominated in U.S. dollars. A substantial portion of our revenues are denominated inIndonesian rupiah, but a portion of our operating revenues are U.S. dollar-denominated or U.S. dollar-linked. Wemay also incur additional long-term indebtedness in currencies other than the Indonesian rupiah, including theU.S. dollar, to finance further capital expenditures.
We currently hedge a portion of our foreign currency exposure principally because our annual U.S. dollar-denominated operating revenues are less than the sum of our U.S. dollar-denominated operating obligations, suchas our U.S. dollar-denominated expenses and our U.S. dollar-denominated principal and interest payments. In2005, in an effort to manage our foreign currency exposure and lower our overall funding costs, we entered intoseveral foreign currency swap contracts with three separate international financial institutions. From 2006 to2009, we also entered into several foreign currency swap contracts with six international financial institutions inan effort to reduce our foreign currency risk exposure. For these contracts, we pay either an upfront or fixed ratepremium. In 2011, we entered into a number of foreign currency forward contracts with nine financial
21

institutions to reduce our foreign currency exchange risk exposure. We cannot assure you that we will be able tomanage our exchange rate risk successfully in the future or that our business, financial condition or results ofoperations will not be adversely affected by our exposure to exchange rate risk. See “Item 11: Quantitative andQualitative Disclosures about Market Risk.”
Risks Relating to our Cellular Services Business
Competition from industry incumbents and new market entrants may adversely affect our cellular servicesbusiness
The Indonesian cellular services business is highly competitive. Competition among cellular serviceproviders in Indonesia is based on various factors, including pricing, network quality and coverage, the range ofservices, features offered and customer service. Our cellular services business competes primarily againstTelkomsel and XL. Several other smaller GSM and CDMA operators also provide cellular services in Indonesia,including Hutchison, PT Axis Telekom Indonesia and PT Smartfren Telecom Tbk. In addition to current cellularservice providers, the MOCIT may license additional cellular service providers in the future, and such newentrants may compete with us.
We expect competition in the cellular services business to further intensify. New and existing cellularservice providers may offer more attractive product and service packages or new technologies or the convergenceof various telecommunication services, resulting in higher churn rates, lower ARPU or a reduction of, or slowergrowth in, our cellular subscriber base. In recent years, the continuing competition from industry incumbents andnew market entrants in the cellular services market has led to aggressive pricing campaigns by cellular serviceproviders. The decrease in prices for cellular usage also led to an increase in the number of subscribers and innetwork traffic, resulting in increased network congestion among operators, which has required us to incuradditional capital expenditures to continue to expand our network.
The competitive landscape in the cellular services business may also be affected by industry consolidation.In March 2010, Smart Telecom and Mobile-8 announced that they entered into a strategic alliance, pursuant towhich Mobile-8 (now, “Smartfren”) acquired a significant number of shares in Smart Telecom and bothcompanies agreed to use the “Smartfren” logo and brand. Other cellular service providers may form strategicalliances or otherwise consolidate in the future.
Competition from providers of new technology, together with new entrants, incumbents, almost saturatedmarket and consolidated providers could adversely affect our competitive position, cellular services business,financial condition, results of operations and prospects.
Cellular network congestion and limited spectrum availability could limit our cellular subscriber growth andcause reductions in our cellular service quality
We expect to continue to offer promotional plans to attract subscribers and increase usage of our network byour cellular subscribers. We also expect to continue to promote our data services, including our BlackBerry™and wireless broadband services. As a result, we may experience increased network congestion, which may affectour network performance and damage our reputation with our subscribers. In addition, higher cellular usage indense urban areas may require us to use radio frequency engineering techniques, including a combination ofmacro, micro and indoor cellular designs, to maintain cellular network quality despite radio frequencyinterference and tighter radio frequency re-use patterns. However, if our cellular subscriber base or usage of ourvoice and data services should grow significantly in high-density areas, we cannot assure you that these effortswill be sufficient to maintain and improve service quality. To support such additional demands on our network,we may be required to make significant capital expenditures to improve our network coverage. Such additionalcapital expenditures, together with the possible degradation of our cellular services, could adversely affect ourcompetitive position, business, financial condition, results of operations and prospects.
22
Despite expending significant financial resources to increase our cellular subscriber base, the number of ourcellular subscribers may increase without a corresponding increase in our operating revenues
We have expended significant financial resources to develop and expand our cellular network and add to ourcellular subscriber base. However, the uncertain economic situation in Indonesia and increasing prices of primarygoods may decrease our cellular subscribers’ purchasing power. Moreover, a continued decline in effective tariffsfor voice usage resulting from “free-talk” campaigns and recent tariff discount promotions, increasing SMSusage, the Government mandated deregistration of users from premium SMS services in 2011, and greatercellular penetration in the lower-income segment of the market has led to a decrease in ARPU in 2011. Ourcellular subscribers (including wireless broadband subscribers) increased from approximately 33.0 million as ofDecember 31, 2009 to approximately 44.3 million as of December 31, 2010, to approximately 51.7 million as ofDecember 31, 2011. For the years ended December 31, 2009, 2010 and 2011, our ARPU was Rp37,664,Rp34,712 and Rp28,381, respectively. While we intend to continue to expend significant financial resources toexpand our cellular subscriber base and expand our cellular network to support the requirements of such anexpanded cellular subscriber base, we cannot assure you that such expenditures will be accompanied by acorresponding increase in our ARPU or operating revenues. Accordingly, our subscriber acquisition costs and thecapital expenditures required to expand our network capacity could increase without a corresponding increase inour revenue or profitability, which would materially and adversely affect our business, financial condition,results of operations and prospects.
The Government suspension of premium SMS services could adversely affect the revenues from our cellularservices business and result in sanctions against us
We have derived significant revenue from premium SMS services in previous years. These services includethe delivery of music and ringtones, smartphone wallpapers and other graphics, voting in contests and polls andcontent including horoscopes, Qur’an quotes and news alerts. In 2011, the ITRA asked telecommunicationscompanies to deactivate premium SMS services and give users a notice of the deactivations with the option toresubscribe. These companies were also asked to cease promoting premium SMS services, provide summaries ofpremium SMS service charges for users, return amounts charged to user accounts for premium SMS services,and report weekly to ITRA regarding such actions. The ITRA based its action on complaints from consumers thatthey were charged for services for which they were not aware they had or inadvertently subscribed and fromwhich they had substantial difficulty unsubscribing. Other consumers complained that charges were unclear anddifficult to monitor, particularly consumers of prepaid services. The ITRA has clarified that it does not intend toprohibit premium SMS services but to effectively reset such services and give consumers the option to deregisterfrom them. The MOCIT has expressed support for the ITRA’s action.
The disruption to our premium SMS services due to the ITRA’s action has resulted in a substantial reductionof our revenues from these services. Similar action by the ITRA or the MOCIT in the future may likewise reduceor restrict the growth of our revenues from these services or other related or new products. The ITRA or theMOCIT may also take more aggressive action that may lead to disruptions in the delivery of our products or finesor other administrative sanctions. Any of these factors may materially and adversely affect our results ofoperations and financial condition.
We experience a high churn rate
We experience a high churn rate, as is common for Indonesian telecommunication operators providingprepaid cellular services. We believe that our high churn rate is due to the fact that many of our prepaidsubscribers own multiple SIM cards from various cellular providers, allowing them to choose the cheapestpackage available. Our high churn rates may result in loss of revenue, which could have a material adverse effecton our business, financial condition, results of operations and prospects. At the end of the third quarter of 2010,we launched a retention and loyalty program called “Senyum Setia Indosat” which gives benefits to ourcustomers who extend their subscription. We believe that this program contributed to the decrease of our churnrate to 13.3% in 2010, compared to 15.1% in 2009. In 2011, our churn rate increased to 14.3%, primarily due tocompetitive pressures, in particular, aggressive promotional programs launched by other operators in 2011.
23
We depend on the availability of telecommunications towers
We are highly dependent on our and others’ telecommunications tower infrastructure to provide GSM, fixedwireless access and 3G network and mobile cellular telecommunications services, as we typically installtransmitter and transceiver antennas and other BTS supporting facilities on such towers. The availability andinstallation of such telecommunication towers require licenses from the relevant central and regional authorities.Recently, a number of regional authorities have implemented regulations which limit the number and location oftelecommunication towers and established requirements for operators to share in the utilization oftelecommunications towers. In addition, on March 17, 2008, the MOCIT issued a regulation on the sharing oftelecommunications towers. See “Item 4: Information on the Company—Regulation of the IndonesianTelecommunications Industry—Tower Sharing Obligation.” Under the regulation, the construction oftelecommunications towers requires permits from the relevant governmental institution, while the localgovernment determines the placement and location at which telecommunications towers can be constructed.Moreover, a joint regulation promulgated on March 30, 2009 by the Minister of Home Affairs, the Minister ofPublic Works, the MOCIT and the Head of the Indonesia Investment Coordinating Board requires a towerconstruction permit for every tower built and used for telecommunications services, which would demonstratecompliance with certain technical specifications. If a tower owner fails to obtain such a permit, the appropriateregional authorities will be entitled to impose penalties on the tower owner. Moreover, a telecommunicationsprovider which owns telecommunication towers or tower owner is obligated to allow other telecommunicationoperators to utilize its telecommunication towers (other than the towers used for its main network), without anydiscrimination.
Such regulatory requirements may require us to adjust our telecommunications tower construction andleasing plans, relocate our existing telecommunications towers, allow other operators access to ourtelecommunications towers and perform other measures which may result in the increase of telecommunicationstower construction costs, delays in the construction process and potential service disruption for our subscribers. Ifwe cannot fulfill the regulatory requirements for telecommunications towers or meet our own network capacityneeds for telecommunications towers, we may face difficulties in developing and providing cellular GSM, fixedwireless access and 3G telecommunications services. Our dependency on our own or others’ telecommunicationstower infrastructure, combined with the burden of sharing our telecommunications towers in certain instances,may also adversely affect our competitive advantage relative to other operators. Any of these events could resultin a material adverse effect on our network capacity, the performance and quality of our networks and services,our reputation, business, results of operations and prospects.
Our ability to maintain and expand our cellular network or conduct our business may be affected bydisruptions of supplies and services from our principal suppliers
We rely upon a few principal vendors to supply a substantial portion of the equipment we require tomaintain and expand our cellular network, including our microwave backbone, and upon other vendors inrelation to other supplies necessary to conduct our business. We depend on equipment and other supplies andservices from such vendors to maintain and replace key components of our cellular network and to operate ourbusiness. If we are unable to obtain adequate supplies or services in a timely manner or on commerciallyacceptable terms, or if there are significant increases in the cost of such supplies or services, our ability tomaintain and to expand our cellular network and our business, financial condition, results of operations andprospects may be adversely affected.
We depend on our licenses to provide cellular services, and our licenses could be cancelled if we fail to complywith their terms and conditions
We rely on licenses issued by the MOCIT for the provision of our cellular services as well as for theutilization of our allocated spectrum frequencies. The MOCIT, with due regard to prevailing laws andregulations, may amend the terms of our licenses at its discretion. Any breach of the terms and conditions of ourlicenses or failure to comply with applicable regulations could result in our licenses being cancelled. Any
24

revocation or unfavorable amendment of the terms of our licenses, or any failure to renew them on comparableterms, could have a material adverse effect on our business, financial condition, results of operations andprospects.
Our subscriber-related operating data may not be comparable between periods
We define an “active cellular subscriber” as a cellular subscriber who, in the case of a prepaid cellularsubscriber, recharges their SIM card within a 33-day “grace period” immediately following the SIM card’sexpiry date by adding a minimum amount to the SIM card.
We have from time to time decreased the grace period applicable to our calculation of prepaid cellularsubscribers in order to more accurately reflect those subscribers whom were most likely to recharge their SIMcards. Increasing or decreasing the grace period affects the calculation of our number of subscribers, Minutes ofUsage per subscriber and ARPU.
As a result of the foregoing, our number of subscribers, Minutes of Usage per subscriber and ARPU maynot reflect the actual number of subscribers and are not comparable between periods. Accordingly, you shouldnot place undue reliance on the accuracy of this data or comparison of this data from period to period.
A significant increase in frequency fees could adversely affect our business, financial condition and results ofoperations
Starting on December 15, 2010, the government changed the basis of computing frequency fees to a newformula based on the bandwidth of allocated spectrum occupied by operators. Previously, we were required topay frequency fees for 800 MHz, 900 MHz and 1800 Mhz bands based on the number of radio stations. In 2011,2010 and 2009, we paid frequency fees amounting to Rp1.8 trillion (US$202.8 million), Rp1.6 trillion and Rp1.3trillion, respectively. As the largest holder of spectrum in Indonesia, we expect to continue to pay a large amountof frequency fees going forward. Future increases in frequency fees are expected to mainly be based on increasesin the consumer price index and the population of Indonesia. As a result, changes in macroeconomic conditionsin Indonesia could result in increases in frequency fees which, if significant, could adversely affect our business,financial condition and results of operations.
Allegations of health risks from the electromagnetic fields generated by BTSs and cellular handsets, and thelawsuits and publicity relating to them, regardless of merit, could adversely affect our operations
There has been public speculation about possible health risks to individuals from exposure toelectromagnetic fields from BTSs and from the use of cellular handsets. We cannot assure you that future studiesof these health risks will not suggest a link between electromagnetic fields and adverse health effects which maysubject us to legal action from individuals alleging personal injuries or otherwise adversely affect our business.
Risks Relating to Our Fixed Data (“MIDI”) Services Business
Our MIDI services are facing increasing competition, and we may experience declining margins from suchservices as such competition intensifies
Our MIDI services are facing increased competition from new and established operators, which may havewider customer bases and greater financial resources than us, such as Telkom, with its regional internationalreach and developed domestic infrastructure. In addition, operators such as XL, First Media, PT IndonesiaComnet Plus (“Icon+”) and PT NAP Info Lintas Nusa (“Matrix Cable System”), some of which have allianceswith foreign telecommunications operators, compete with us in this business segment.
Our satellite business also faces increasing competition as new and more powerful satellites are launched byour competitors and as companies acquire exclusive licenses to provide broadcast services in Indonesia. Our
25

Palapa-C2 and Palapa-D satellite transponder capacity agreements generally involve terms of between one andfive years, and we estimate the remaining useful life of such satellites to be approximately two and eight years,respectively. As additional satellites become operational and our transponder leases expire or are terminated andprice competition intensifies, our transponder lessees may utilize other satellites, thereby adversely affecting ouroperating margins and operating revenues from such services.
Our satellites have limited operational life and may be damaged or destroyed during in-orbit operation. Theloss or reduced performance of our satellites, whether caused by equipment failure or its license beingrevoked, may adversely affect our financial condition, results of operations and ability to provide certainservices
Our Palapa-C2 and Palapa-D satellites have a limited operational life, currently estimated to end in March2014 and April 2020, respectively. A number of factors affect the operational lives of satellites, including thequality of their construction, the durability of their systems, subsystems and component parts, on-board fuelreserves, accuracy of their launch into orbit, exposure to micrometeorite storms, or other natural events in space,collision with orbital debris, or the manner in which the satellite is monitored and operated. We currently usesatellite transponder capacity on our satellites in connection with many aspects of our business, including directleasing of such capacity and routing for our international long-distance and cellular services. We note, that based onthe factors identified above, our Palapa-C2 satellite could fail prior to 2014 and our Palapa-D satellite could failprior to 2020, and in-orbit repairs would not be feasible with the exception of repairs that may be addressed throughground-based software or operational fixes. Moreover, International Telecommunication Union (“ITU”) regulationsspecify that a designated satellite slot has been allocated for Indonesia, and the Government has the right todetermine which party is licensed to use such slot. While we currently hold a license to use the designated satelliteslot, in the event our Palapa-D satellite experiences technical problems or failure, the Government may determinethat we have failed to optimize the existing slot under our license, which may result in the Government withdrawingour license and granting it to one of our competitors. We cannot assure you that we will be able to maintain use ofthe designated satellite slot in a manner deemed satisfactory by the Government.
We maintain in-orbit insurance on our Palapa-C2 and Palapa-D satellites on terms and conditions consistentwith industry practice. As of December 31, 2011, we had an insurance policy with a total coverage limit ofUS$132.8 million for total and partial loss of our Palapa-C2 and Palapa D satellites. If damage or failure rendersour satellites unfit for use, we may elect to cease our satellite operations or lease transponder capacity from athird-party provider rather than acquiring a new satellite. The termination of our satellite business could increaseoperating expenses associated with our provision of other telecommunications services and could adverselyaffect our business, financial condition and results of operations.
Risks Relating to Our Fixed Telecommunications Services Business
The entry of additional Indonesian telecommunications operators as providers of international long-distanceservices could adversely affect our fixed telecommunications services operating margins, market share andresults of operations
Telkom, a well-established Indonesian telecommunications incumbent with significant political andfinancial resources, obtained a license to provide international long-distance services and launched itscommercial service in 2004. As a result of Telkom’s entry into the international long-distance market, we lostmarket share and experienced other adverse effects relating to our fixed telecommunications services business.By the end of 2006, Telkom had acquired significant market share for IDD services. In addition, in 2009, theGovernment issued Bakrie Telecom an international long-distance license in an effort to encourage greatercompetition in the international long-distance services market. The operations of incumbents and the entrance ofnew operators into the international long-distance market, including the VoIP services provided by suchoperators, continue to pose a significant competitive threat to us. We cannot assure you that such adverse effectswill not continue or that such increased competition will not continue to erode our market share or adverselyaffect our fixed telecommunications services operating margins and results of operations.
26
We face risks related to the opening of new long distance access codes
In an attempt to liberalize DLD services, the Government has issued regulations requiring each provider ofDLD services to implement a three-digit access code to be dialed by customers making DLD calls. In 2005, theMOCIT announced that three-digit access codes for DLD calls will be implemented gradually within five yearsand that it would assign us the “011” DLD access code for five major cities, including Jakarta, and allow us toprogressively extend it to all other area codes within five years. Telkom was assigned “017” as its DLD accesscode. In December 2007, the Government issued new regulations opening DLD access codes in the first city inBalikpapan in April 2008. Following the implementation, Balikpapan residents are able to choose from options“0”, “011” or “017” in connecting their long distance calls.
In April 2008, we and Telkom agreed to open DLD access from our respective subscribers in Balikpapan.Whether the opening of the DLD access code will be implemented in other cities will be based on a study by theIndonesian Telecommunication Regulatory Board. The implementation of any new DLD access codes canpotentially increase competition by offering our subscribers more options for DLD services. In addition, theopening of new DLD access codes is expected to result in increased competition and less cooperation amongindustry incumbents, which may result in reduced margins and operating revenue, among other things, all ofwhich may have a material adverse effect on us. We cannot assure you that our access codes will remain intact orbe successful in increasing our revenues from DLD services.
Item 4: INFORMATION ON THE COMPANY
History and Development of the Company
PT Indosat Tbk was established on November 10, 1967 as a foreign investment company to provideinternational telecommunications services in Indonesia and began commercial operations in September 1969 tobuild, transfer and operate an International Telecommunications Satellite Organization (“Intelsat”) earth stationin Indonesia to access Intelsat’s Indian Ocean Region satellites for a period of 20 years. In 2001, as part of theGovernment’s initiative to restructure the telecommunications industry, we entered into an agreement withTelkom to eliminate our respective cross-shareholdings in several operating subsidiaries, including:
• our acquisition of Telkom’s 22.5% ownership interest in Satelindo (at the time the second largestcellular operator in Indonesia);
• Telkom’s acquisition of our 35.0% ownership interest in Telkomsel; and
• our acquisition of Telkom’s 37.2% ownership interest in Lintasarta and the purchase of Lintasarta’sconvertible bonds held by Telkom.
Subsequent to the agreement with Telkom, we completed the acquisition of the remaining minority interestsin Satelindo in June 2002. Since entering the Indonesian cellular market through our acquisition of Satelindo andestablishment of IM3 and the subsequent integration of such companies in 2003, cellular services have becomethe largest contributor to our operating revenues.
In August 2002, we entered the domestic fixed line telecommunications sector by obtaining a license toprovide local fixed network services in the Jakarta and Surabaya areas.
In 2002, the Government divested 517.5 million shares, representing approximately 50.0% of ouroutstanding Series B shares at the time, in two stages. In May 2002, the Government sold 8.1% of ouroutstanding shares through an accelerated global tender. In December 2002, the Government divested 41.9% ofour outstanding Series B shares to a former subsidiary of STT Communications Ltd. (“STT”).
In June 2008, Qtel acquired STT’s interest in us, triggering a mandatory tender offer by Qtel to acquire up to1,314,466,775 Series B Shares, representing approximately 24.19% of our total issued and outstanding Series BShares, at a purchase price of the U.S. dollar equivalent of Rp369,400 per ADS and Rp7,388 per Series B Share.
27
Qtel is a publicly held corporation which is majority-owned by the State of Qatar and its affiliated entities. Qtel isorganized under the laws of the State of Qatar with shares listed on the Doha Securities Market, as well as theAbu Dhabi Securities Market, and Global Depository Receipts traded on the London Stock Exchange.
As of December 31, 2011, the Government owned 14.29% of our outstanding shares, including 1 Series Ashare, Qtel Asia owned approximately 65.00% of our outstanding Series B shares and SKAGEN AS ownedapproximately 5.62% of our outstanding Series B shares. Qtel Asia is owned by Qtel. The remaining 15.09% ofour outstanding Series B shares was owned by public shareholders as of December 31, 2011. See “Item 6:Directors, Senior Management and Employees—Share Ownership.”
For a description of our principal capital expenditures since January 1, 2009 and principal capitalexpenditures currently in progress, including the amount invested and method of financing, see“Item 5. Operating and Financial Review and Prospects—Liquidity and Capital Resources—CapitalExpenditures.”
Our registered office is located at Indosat Building, Jalan Medan Merdeka Barat, No. 21, Jakarta 10110,Republic of Indonesia, and our telephone number is +62-21-30442615. Our corporate website may be accessedthrough the URL http://www.indosat.com. The information found on our corporate website does not, however,form part of this annual report and is not incorporated by reference herein. Our agent for service of process in theUnited States with respect to our ADSs is Bank of New York Mellon, Depository Receipt Division, 101 BarclayStreet, New York, New York 10286, U.S.A.
Business Overview
We are a fully integrated Indonesian telecommunications network and service provider and we offer a fullcomplement of national and international telecommunications services in Indonesia. We are the second-largestcellular operator, as measured by number of cellular subscribers, and a leading provider of international long-distance services in Indonesia. We also provide MIDI services for domestic and regional corporate and wholesalecustomers as well as domestic retail customers. For the years ended December 31, 2009, 2010 and 2011, ouroperating revenues totaled Rp18,846.9 billion, Rp19,648.4 billion and Rp20,389.4 billion (US$2,248.5 million),respectively.
Our principal products and services include:
• Cellular services. We provide GSM 900 and 1800 and 3G cellular services to approximately51.7 million cellular subscribers (including wireless broadband subscribers) throughout Indonesia, asof December 31, 2011. We also commenced providing wireless broadband services using our 3Gplatform in 2006 and, as of December 31, 2011, had approximately 532.0 thousand subscribers.
• MIDI services. We provide broadband and narrowband MIDI services consisting of Internet servicesand data communication services, such as International and Domestic Leased Circuit, Frame Relayservices, and MPLS-based services. We also offer satellite-based services such as Transponder leasingand VSAT services and Value Added Services, such as Disaster Recovery Center and Data Centerservices. We provide these services directly and through our subsidiaries, Lintasarta and IM2. We offerthis suite of products and services primarily to our valued corporate and wholesale customers in anattempt to be their information and telecommunication solution provider.
• Fixed telecommunications (voice) services. We are one of the leading providers of international long-distance services in Indonesia, as measured by aggregate incoming and outgoing call minutes for 2011.To complement our cellular services and to enhance our access to domestic and international long-distance customers, we also provide fixed wireless access services using CDMA 2000 1x technology.We have also provided DLD services since 2003 and local fixed telephony services since 2002.
Our business does not experience significant seasonality.
28
Our principal shareholders are Qtel Asia, with an ownership interest of approximately 65.00% of ourcommon stock, and the Government, through the Ministry of State-Owned Enterprises, with an ownershipinterest of 14.29% of our common stock, including the one Series A share and SKAGEN AS, with an ownershipof interest of approximately 5.62% of our common stock, in each case as of December 31, 2011. Qtel Asia iswholly owned by Qtel.
As a fully integrated Indonesian telecommunications network and service provider, we offer our customers afull complement of national and international telecommunications services in Indonesia, including cellularservices and international long-distance services. As of December 31, 2011, our postpaid cellular subscriberscould roam internationally in 177 countries. In addition, for our international long-distance services, we maintaindirect connections with 64 foreign telecommunications operators in 40 countries.
As part of the global coverage we offer to our customers, we offer international calling services to Iran andto Cuba, Sudan, and Syria. There are roaming arrangements between Indosat and each of Mobile Company ofIran (“MCI”), C Com, Syriatel Mobile Telecom SA (“Syriatel”) and Sudanese Mobile Telephone Co.(“Mobitel”) for Iran, Cuba, Syria and Sudan, respectively. We consider the business between Indosat andTelecommunications Company of Iran (“TCI”), MCI, C Com, Syriatel and Mobitel, as well as business in Iran,Cuba, Syria and Sudan, as being insignificant relative to our size.
As of and for the years endedDecember 31,
2009 2010 2011
(unaudited)
Operating Data:Cellular:(1)
Number of cellular subscribers (excluding wireless broadband):Prepaid (in millions) . . . . . . . . . . . . . . . . . . . . . . . . . . . . . . . . . . . . . . . . . . . . 31.2 43.2 50.5Postpaid (Matrix) (in millions) . . . . . . . . . . . . . . . . . . . . . . . . . . . . . . . . . . . . 1.1 0.6 0.7Total cellular subscribers (in millions) . . . . . . . . . . . . . . . . . . . . . . . . . . . . . 32.3 43.8 51.2
Number of wireless broadband subscribers:(2)
Prepaid (in thousands) . . . . . . . . . . . . . . . . . . . . . . . . . . . . . . . . . . . . . . . . . . 610.5 448.1 466.7Postpaid (in thousands) . . . . . . . . . . . . . . . . . . . . . . . . . . . . . . . . . . . . . . . . . 110.7 88.6 65.4Total wireless broadband subscribers (in thousands) . . . . . . . . . . . . . . . . . . . 721.2 536.7 532.1
Total cellular subscribers (in millions): . . . . . . . . . . . . . . . . . . . . . . . . . . . . . . . . . 33.0 44.3 51.7ARPU (Rp)(3) . . . . . . . . . . . . . . . . . . . . . . . . . . . . . . . . . . . . . . . . . . . . . . . . . . . . . 37,664 34,712 28,381Minutes of Usage(4) . . . . . . . . . . . . . . . . . . . . . . . . . . . . . . . . . . . . . . . . . . . . . . . . 102 113 95ARPM (Rp)(5) . . . . . . . . . . . . . . . . . . . . . . . . . . . . . . . . . . . . . . . . . . . . . . . . . . . . . 220 163 157Number of base transceiver stations(6) . . . . . . . . . . . . . . . . . . . . . . . . . . . . . . . . . . 16,353 18,108 19,253Number of base station controllers(6) . . . . . . . . . . . . . . . . . . . . . . . . . . . . . . . . . . . 315 330 353Number of mobile switching centers(6) . . . . . . . . . . . . . . . . . . . . . . . . . . . . . . . . . 95 87 75
MIDI:International High Speed Leased Circuit (’000s) . . . . . . . . . . . . . . . . . . . . . . . . . . 80 218 366Domestic High Speed Leased Circuit (’000s) . . . . . . . . . . . . . . . . . . . . . . . . . . . . 171 251 296
Fixed telecommunications:Incoming traffic (in millions of minutes) . . . . . . . . . . . . . . . . . . . . . . . . . . . . . . . . 1,559 1,679 1,842Outgoing traffic (in millions of minutes) . . . . . . . . . . . . . . . . . . . . . . . . . . . . . . . . 502 463 445Incoming/outgoing call ratio . . . . . . . . . . . . . . . . . . . . . . . . . . . . . . . . . . . . . . . . . 3.1 3.6 4.1
(1) Due to changes in the method used to calculate the number of our prepaid cellular subscribers, our numberof cellular subscribers, minutes of usage per cellular subscriber and ARPU set forth in this report are notcomparable between certain periods. See “Item 3: Key Information—Risk Factors—Risks Relating to OurCellular Services Business—Our subscriber-related operating data may not be comparable betweenperiods.”
29

(2) The number of wireless broadband subscribers only includes those who exclusively subscribe to ourwireless broadband services, and does not include those who use our “broadband on demand” services.
(3) The average monthly revenue (in Indonesian rupiah) per cellular subscriber, or ARPU, is computed bydividing monthly recurring prepaid and postpaid cellular services revenues (usage charges, value-addedservices, interconnection revenues and monthly subscription charges), excluding non-recurring revenuessuch as activation fees and special auctions of telephone numbers recorded under Indonesian GAAP, for therelevant period by the average number of prepaid and postpaid cellular subscribers. The average number ofprepaid and postpaid cellular subscribers is the sum of the total number of active cellular subscribers at thebeginning and end of each month divided by two. Due to changes in the method used to calculate thenumber of our prepaid cellular subscribers, our ARPU set forth in this report are not comparable betweencertain periods. See “Item 3: Key Information—Risk Factors—Risks Relating to Our Cellular ServicesBusiness—Our subscriber-related operating data may not be comparable between periods.”
(4) The Minutes of Usage per cellular subscriber is computed by dividing the total minutes of outgoing callusage of prepaid and postpaid cellular subscribers for each month by the average number of prepaid andpostpaid cellular subscribers. The average number of prepaid and postpaid cellular subscribers is the sum ofthe total number of active cellular subscribers at the beginning and end of each month divided by two. Dueto changes in the method used to calculate the number of our prepaid cellular subscribers, our minutes ofusage per cellular subscriber set forth in this report are not comparable between certain periods. See “Item 3:Key Information—Risk Factors—Risks Relating to Our Cellular Services Business—Our subscriber-relatedoperating data may not be comparable between periods.”
(5) ARPM (in Indonesian rupiah) is computed by dividing the monthly recurring revenues from prepaid andpostpaid cellular services (usage charges, value-added services, interconnection revenues and monthlysubscription charges), excluding non-recurring revenues such as activation fees and special auctions oftelephone numbers recorded under Indonesian GAAP, for the relevant period, by the total minutes ofoutgoing call usage of prepaid and postpaid cellular subscribers for such period.
(6) Prior to the first quarter of 2010, newly-built or newly-acquired base station sites, base station controllers ormobile switching centers which were not yet in operation were included in the number of base transceiverstations, base station controllers or mobile switching centers reported by the Company (the “PriorComputation”). Beginning in the first quarter of 2010, as disclosed herein, the Company included newly-built or newly-acquired base transceiver stations, base station controllers or mobile switching centers in itsvarious reports only when such base transceiver stations, base station controllers or mobile switchingcenters were actually put in operation. Under the Prior Computation, the Company would have reported thatit owned 16,804, 18,704 and 19,783 base transceiver stations, 315, 331 and 345 base station controllers and96, 92 and 93 mobile switching centers for the years ended December 31, 2009, 2010 and 2011,respectively.
(7) As reported in our Form 6-K filed on July 22, 2010, we issued a restatement of our cellular subscriber baseas at March 31, 2010 from 39.1 million to 37.7 million. This discrepancy arose during the compilation ofdata from multiple reporting systems. The same issue resulted in an over-reporting of subscribers in thesecond and third quarters of 2009. Accordingly, the total number of subscribers of 33.0 million and ARPUof Rp37,664 for 2009 reported above reflect the restated figures, compared with the total number ofsubscribers of 33.1 million and ARPU of Rp37,330 previously reported.
The following table sets forth the breakdown of our operating revenues for each of the periods indicated andthe percentage contribution of each of our services to our operating revenues:
For the years ended December 31,
2009 2010 2011
Rp % Rp % Rp %
(Rp in billions, except percentages)Cellular services . . . . . . . . . . . . . . . . . . . . . . . . . . . . . . . 14,331.3 76.0 15,867.1 80.8 16,561.0 81.3MIDI services . . . . . . . . . . . . . . . . . . . . . . . . . . . . . . . . . 2,712.6 14.4 2,488.1 12.7 2,578.4 12.6Fixed telecommunications . . . . . . . . . . . . . . . . . . . . . . . 1,803.0 9.6 1,293.2 6.5 1,250.0 6.1
Total operating revenues . . . . . . . . . . . . . . . . . . . 18,846.9 100.0 19,648.4 100.0 20,389.4 100.0
30
Cellular Services
Cellular services contributed revenues of Rp16,561.0 billion (US$1,826.4 million) for the year endedDecember 31, 2011, representing 81.3% of our total consolidated operating revenues in 2011. We are the second-largest cellular provider in Indonesia, as measured by the number of cellular subscribers, with 51.7 millionsubscribers (including wireless broadband subscribers) as of December 31, 2011. For 2011, we had an estimatedsubscriber market share of 25.2% of the total GSM market share held by the three major GSM operators, whichfigure is based on our estimates based on available market data. Our cellular network currently provides networkcoverage in all major cities and population centers across Indonesia. We provide our cellular services using GSM900 and GSM 1800 technology and, for our 3G platform, IMT-2000 technology. We are also one of the leadingproviders of prepaid and postpaid wireless broadband services in Indonesia. As of December 31, 2011, we hadapproximately 532.0 thousand prepaid and postpaid wireless broadband subscribers.
Services
Our principal cellular services are the provision of voice and data services, which we sell through postpaidand prepaid plans. Our prepaid and postpaid subscribers are able to make and receive “on-net” voice calls to andfrom other Indosat subscribers (including our Matrix, Mentari, Indosat Mobile and IM3 subscribers) on ourtelecommunication network, as well as “off-net” voice calls to and from subscribers of other telecommunicationoperators on their fixed and cellular telecommunication networks.
We offer prepaid cellular service plans under the “IM3,” “Mentari,” and “Indosat Mobile” brand names. Wehave differentiated our three prepaid brands based on market segments. Such differentiation allows us to targetthe usage and spending patterns of different consumer segments through our promotional plans. Our IM3 brand ismarketed toward the younger generation, with very attractive voice, SMS and data packages. Our Mentari brandis marketed towards a more mature market, with voice services being promoted at competitive prices. OurIndosat Mobile brand is marketed towards high-end professional and corporate users, offering integratedpackages comprising voice, SMS and data services and providing subscribers with greater control in managingtheir mobile expenses. We continue to develop our IM3, Mentari and Indosat Mobile brands, offer promotionsand engage in advertising tailored for those specific market segments. We offer postpaid plans, designed forhigh-end professional and corporate users, under “Matrix” and “Indosat Mobile Postpaid” brand names. Matrix isa basic service package with a postpaid payment plan that provides the ability to register with numerous othersupplementary plans, value-added services and corporate-based services. We offer various Matrix packages withdifferent features and benefits to suit the needs of our subscribers. Our Indosat Mobile Postpaid brand offerscompetitively priced integrated packages consisting of voice, SMS and data services.
Prepaid and postpaid subscribers have access to local, DLD and international direct long-distance dialing. Inaddition, we offer a variety of value-added services, functions and features to our subscribers. Such services,functions and features, which, in certain cases, are free of charge, can be purchased individually, or bundledaccording to the package selected, include:
• SMS: allows subscribers to send short text messages to other cellular users’ mobile phone displayscreens;
• MMS: allows subscribers of GSM service to send pictures, text and sound/voice in a single packetmessage;
• Voice SMS: allows subscribers to send audible messages;
• Ring-back tone: allows subscribers to choose their favorite song as the ringtone that is heard by callersfor incoming calls;
• GPRS: provides mobile data communications with GSM-based technology, including mobile Internet,data transfer and push e-mail (BlackBerry™ services);
31
• Mobile data and broadband services: allows subscribers to browse and download sports, news,horoscope, movies, music and finance content to their mobile handsets, connect to a computer asmodem, send and receive using GPRS and 3G network for broadband quality;
• Facsimile services: allows subscribers to send and receive faxes;
• BlackBerry™ services: allows subscribers to register and use a full suite of BlackBerry™ services,including email, chat, browsing, GPS, and many other BlackBerry™ based applications;
• Voicemail: enables callers to leave voice messages that can be retrieved by subscribers;
• Caller identification: displays the incoming call number on a subscriber’s mobile phone display screen;
• Call holding: allows subscribers to place an incoming or outgoing call on hold while making orreceiving other calls;
• Call waiting: signals subscribers that they have an incoming call while the line is engaged. Uponhearing such a signal, subscribers can answer the second call and place the original call on hold;
• Call forwarding: enables subscribers to forward incoming calls to other cellular or fixed-line numbers;
• Detailed billing: provides subscribers with detailed billing statements indicating the duration and costof calls made to and from a particular mobile phone;
• Direct debit payment: provides a payment option that automatically deducts billed amounts from thesubscriber’s bank account or credit card;
• Recharge via SMS and automated teller machines: enables subscribers to recharge their prepaid airtimeplans via SMS and automated teller machines automatically deducting billed amounts from thesubscriber’s bank account; and
• International roaming: allows prepaid and postpaid subscribers to send/receive SMS, voice and data(GPRS/3G) services while roaming on foreign cellular networks.
Facsimile services, detailed billing and direct debit payments are only available to postpaid subscribers.Since 2009, postpaid subscribers have been able to request delivery of printed billing statements or billingstatements by e-mail, which minimizes the number of unreceived bills. We offer certain services free of charge,including caller identification, call holding, call waiting and call forwarding, while others, such as SMS, mobiledata, broadband, BlackBerry™, facsimile services and detailed billing, carry additional fees.
We offer a VoIP Service, under the brand name “FlatCall 01016,” aimed at our most price-sensitivecustomers. This service is only available to our cellular, fixed wireless and fixed line subscribers. The “FlatCall01016” service offers discounted tariff rates for certain top destination countries.
We provide our SMS service to prepaid and postpaid cellular subscribers. Usage levels have increased froman average of approximately 228.9 million text messages (excluding value-added service SMSs, such as SMSsrelated to promotions by content providers and advertisers) per day in 2009 to a daily average of approximately703.6 million text messages (excluding value-added service SMSs) in 2011. In 2009, 2010 and 2011, SMS usagefees represented a substantial portion of our operating revenues from value-added cellular services and features.However, we have recently seen an increase in revenues from mobile data services. We expect SMS to continueto contribute a substantial portion of revenues from value-added cellular services and features, but anticipate acontinuing increase in revenues from GPRS, BlackBerry™ and other mobile data services in the future.
We have entered into interconnection agreements with other Indonesian telecommunications operators toallow our cellular networks to interconnect with the PSTN operated by Telkom, our international gateways andthe networks of each of the other Indonesian cellular and fixed wireless access operators, thereby allowing ourcellular subscribers to communicate with customers of other telecommunications service providers.
32

We offer international roaming services to our cellular subscribers to enable them to make and receive callsand to send and receive SMS text messages and use data services (on GPRS or 3G) when outside Indonesia. Wehave entered into roaming agreements with operators of GSM cellular networks in Africa, Europe, North andSouth America and Asia. As of December 31, 2011, our postpaid cellular subscribers could roam internationallyon 451 networks, owned by 340 operators in 177 countries, and our prepaid cellular subscribers could roaminternationally on 55 networks, owned by 55 operators in 39 countries.
On December 12, 2006, we became a member of the largest international telecommunications operatoralliance in Asia, CONEXUS, which was formed to increase each member’s competitive value in providinginternational telecommunication services in its respective country and across the Asia-Pacific region. To supportcurrent roaming services through GSM, GPRS and wideband code division multiple access (“W-CDMA”), themembers of the alliance are cooperating to provide roaming with HSDPA technology. This alliance has expandedservice coverage to more than 320 million customers in ten countries, including Indonesia. Within theCONEXUS and DIGI (Malaysia) networks, our postpaid subscribers can enjoy a special flat data/internet/BlackBerry™ usage rate of Rp 25,000 per day of unlimited data usage.
Mobile Data Services
We launched our portfolio of mobile data services in 2000. Mobile data services can be accessed through,among others, SMS, direct dial-up connection to a WAP server or wireless broadband, where subscribers canaccess a variety of information, including movie listings, stock quotes, exchange rates, sports and business newsand astrological predictions, and recharge their prepaid SMS cards. In addition, subscribers can send and receivee-mail and conduct mobile banking services with several leading banks through their mobile handsets.
We provide GPRS service with EDGE technology in most large cities in Java, Bali, Sumatra, Kalimantan,Sulawesi and Papua. We were the first telecommunications provider to launch the BlackBerry™ service inIndonesia. In cooperation with Research-In-Motion (“RIM”), we introduced BlackBerry™ Enterprise Service toour Postpaid/Matrix corporate customers in December 2004 and BlackBerry™ services for personal Postpaid/Matrix users in March 2005. In June 2008, to differentiate ourselves from other BlackBerry™ service operators,we launched I-GPS and I-Stock applications which allow our BlackBerry™ customers to access a navigationsystem and real-time stock prices. In January 2009, we launched a BlackBerry™ service subscription via ourprepaid brands, Mentari and IM3. In October 2011, we increased the link capacity to RIM to 2 x 3 GBPs,providing our BlackBerry™ subscribers with faster access. This increase means that we have the largest linkcapacity to RIM in Indonesia. We have approximately 1.4 million BlackBerry™ subscribers as of December 31,2011. In November 2011 we launched BlackBerry App World Billing Carrier, the first Blackberry App WorldBilling Carrier in Asia. Indonesia is one of the largest growth markets in Southeast Asia for BlackBerry™devices.
On February 8, 2006, the Government conducted an open bidding process for 3G spectrum licenses and,following satisfactory completion of the bidding process, we were awarded one 3G spectrum license for 5 MHzof paired spectrum. In the same bidding, Telkomsel and XL were also awarded 3G spectrum licenses. In 2007,we began offering an enhanced 3G (“3.5G”) broadband service using HSDPA technology, a mobile wirelesstelecommunication service with enhanced 3G technology. In August 2009, we were granted additional spectrumunder our existing license, which will allow us to double our network capacity to serve our broadbandsubscribers. In 2009, we started to deploy the new 3.5G network using HSPA+ technology, with downlink speedsof up to 42Mbps and uplink speeds up of to 5.6Mbps, and we began offering such services in 2010.
As part of our strategy of consolidating all of our consumer brands under the “Indosat” brand to improvebrand communication to the market, we have re-branded our mobile broadband services. Starting in the secondquarter of 2011, we began marketing our mobile broadband services, as well as our internet broadband service,under the “Indosat Internet” brand name as an additional feature offered to our cellular subscribers. Through ourIndosat Internet brand we offer both prepaid and postpaid packages, with our prepaid packages available in daily,weekly and monthly unlimited data plans.
33

Subscribers and Marketing
We segment the Indonesian population by location, disposable income and other factors we believe indicatethe desire and ability of individuals and corporations to purchase our products and services. We then target areasthat are generally more prosperous as these areas tend to yield a higher density of potential cellular subscribers.Through this approach, we have achieved a diversified cellular subscriber base spread throughout Indonesia’smajor population centers. We implemented this strategy to adapt to competition from new entrants and pricingpressures in major urban areas.
Our prepaid subscriber base has grown significantly over the past three years relative to our postpaidsubscriber base. As of December 31, 2009, we had 1.1 million postpaid (Matrix) and 31.2 million prepaidcellular subscribers. As of December 31, 2010, we had 0.6 million postpaid (Matrix) and 43.2 million prepaidcellular subscribers. As of December 31, 2011, we had 0.7 million postpaid (Matrix) and 50.6 million prepaidcellular subscribers. We conduct nationwide marketing and promotional activities in an attempt to retain ourexisting valued cellular subscribers and to acquire new cellular subscribers. We believe Indonesian cellularsubscribers tend to favor the convenience, ease of activation, avoidance of fixed commitments and lack of creditchecks associated with prepaid cellular plans. Accordingly, we have focused on this particular subscriber base inour marketing efforts.
The following table presents certain information regarding our cellular subscriber base, ARPU, Minutes ofUsage and ARPM as of the dates indicated:
As of or for the years endedDecember 31,
2009(7) 2010 2011
Number of cellular subscribers (excluding wireless broadband)(1)(2) :Prepaid (in millions) . . . . . . . . . . . . . . . . . . . . . . . . . . . . . . . . . . . . . . . . . . . . . . . . 31.2 43.2 50.5Postpaid (Matrix) (in millions) . . . . . . . . . . . . . . . . . . . . . . . . . . . . . . . . . . . . . . . . 1.1 0.6 0.7Total cellular subscribers (in millions) . . . . . . . . . . . . . . . . . . . . . . . . . . . . . . . . . 32.3 43.8 51.2
Number of wireless broadband subscribers(3) :Prepaid (in thousands) . . . . . . . . . . . . . . . . . . . . . . . . . . . . . . . . . . . . . . . . . . . . . . 610.5 448.1 466.7Postpaid (in thousands) . . . . . . . . . . . . . . . . . . . . . . . . . . . . . . . . . . . . . . . . . . . . . 110.7 88.6 65.4Total wireless broadband subscribers (in thousands . . . . . . . . . . . . . . . . . . . . . . . 721.2 536.7 532.1
Total cellular subscribers (in millions): . . . . . . . . . . . . . . . . . . . . . . . . . . . . . . . . . . . . . 33.0 44.3 51.7ARPU (Rp)(4) . . . . . . . . . . . . . . . . . . . . . . . . . . . . . . . . . . . . . . . . . . . . . . . . . . . . . . . . . 37,664 34,712 28,381Minutes of Usage(5) . . . . . . . . . . . . . . . . . . . . . . . . . . . . . . . . . . . . . . . . . . . . . . . . . . . . 102 113 95ARPM (Rp)(6) . . . . . . . . . . . . . . . . . . . . . . . . . . . . . . . . . . . . . . . . . . . . . . . . . . . . . . . . . 220 163 157
(1) Due to changes in the method used to calculate the number of our prepaid cellular subscribers, our numberof cellular subscribers, minutes of usage per cellular subscriber and ARPU set forth in this are notcomparable between certain periods. See “ Item 3: Key Information—Risk Factors—Risks Relating to OurCellular Services Business—Our subscriber-related operating data may not be comparable betweenperiods.”
(2) Cellular subscribers means total registered and active cellular subscribers at the end of the relevant period.Due to changes in the method used to calculate the number of our prepaid cellular subscribers, our numberof cellular subscribers, minutes of usage per cellular subscriber and ARPU set forth in this annual report arenot comparable between certain periods. See “Item 3: Key Information—Risk Factors—Risks Relating toOur Cellular Services Business—Our subscriber-related operating data may not be comparable betweenperiods.”
(3) The number of wireless broadband subscribers only includes those who exclusively subscribe to ourwireless broadband services, and does not include those who use our “broadband on demand” services.
(4) The average monthly revenue (in Indonesian rupiah) per cellular subscriber, or ARPU, is computed bydividing monthly recurring prepaid and postpaid cellular services revenues (usage charges, value-added
34

services, interconnection revenues and monthly subscription charges), excluding non-recurring revenuessuch as activation fees and special auctions of telephone numbers recorded under Indonesian GAAP, for therelevant period by the average number of prepaid and postpaid cellular subscribers. The average number ofprepaid and postpaid cellular subscribers is the sum of the total number of active cellular subscribers at thebeginning and end of each month divided by two. Due to changes in the method used to calculate thenumber of our prepaid cellular subscribers, our ARPU set forth in this annual report are not comparablebetween certain periods. See “Item 3: Key Information—Risk Factors—Risks Relating to Our CellularServices Business—Our subscriber-related operating data may not be comparable between periods.”
(5) The Minutes of Usage per cellular subscriber is computed by dividing the total minutes of outgoing callusage of prepaid and postpaid cellular subscribers for each month by the average number of prepaid andpostpaid cellular subscribers. The average number of prepaid and postpaid cellular subscribers is the sum ofthe total number of active cellular subscribers at the beginning and end of each month divided by two. Dueto changes in the method used to calculate the number of our prepaid cellular subscribers, our minutes ofusage per cellular subscriber set forth in this annual report are not comparable between certain periods. See“Item 3: Key Information—Risk Factors—Risks Relating to Our Cellular Services Business—Oursubscriber-related operating data may not be comparable between periods.”
(6) ARPM (in Indonesian rupiah) is computed by dividing revenues from monthly recurring prepaid andpostpaid cellular services, excluding non-recurring revenues such as activation fees and special auctions oftelephone numbers recorded under Indonesian GAAP, for the relevant period, by the total minutes (billedand unbilled) of outgoing call usage of prepaid and postpaid cellular subscribers for such period.
(7) As reported in our Form 6-K filed on July 22, 2010, we issued a restatement of our cellular subscriber baseas at March 31, 2010 from 39.1 million to 37.7 million. This discrepancy arose during the compilation ofdata from multiple reporting systems. The same issue resulted in an over-reporting of subscribers in thesecond and third quarters of 2009. Accordingly, the total number of subscribers of 33.0 million and ARPUof Rp37,664 for 2009 reported above reflect the restated figures, compared with the total number ofsubscribers of 33.1 million and ARPU of Rp37,330 previously reported.
As of December 31, 2011, we had approximately 51.7 million subscribers, including approximately532.0 thousand subscribers to our wireless broadband services.
To consolidate our marketing channels for cellular services, we have opened integrated walk-in centers,under the names “Galeri Indosat,” which we operate, and “Griya Indosat,” which are operated by our exclusivedistributors. These walk-in centers function as sales outlets and provide potential and existing cellular subscriberswith customer service and product information. We also have a dedicated team of employees who coordinatesales and services to Indonesian corporations.
To supplement our direct marketing channels, we maintain a network of approximately 54 independentdealers, to whom we offer various incentives for the promotion and sale of our services. These independentregional and multi-regional dealers have their own distribution networks throughout Indonesia and promote ourcellular services, primarily to individuals. These dealers include major distributors of mobile handsets andtypically have their own retail networks, direct sales forces and sub-dealers in Indonesia. These outlets serve asadditional branch outlets for us and offer a broad range of services, including product and service information,customer service and bill payment processing. Existing and new cellular subscribers can activate and register andpay for all of our prepaid cellular services at these outlets. We continue to maintain our relationships with ourdealers in an attempt to generate higher sales volume through better product placement, an integrated dealernetwork and enhanced dealer loyalty.
Tariff Structure and Pricing
The MOCIT establishes a tariff formula that determines the ceiling tariffs, or maximum amounts thatoperators may charge for prepaid and postpaid cellular services. Cellular service providers are permitted to offerpromotional programs that offer lower prices than the ceiling tariffs. We currently price our prepaid cellular
35

services under a variety of ongoing promotional programs to provide incentives to attract new subscribers,stimulate demand and improve our competitive position. We may charge different rates for prepaid and postpaidcellular services, depending on various factors that apply to a particular type of service. For instance, the billingexpenses we incur to serve our postpaid subscribers are typically higher and accordingly, our rates for postpaidcellular services tend to be higher than those for prepaid cellular services.
The Indonesian cellular telecommunications market uses a “calling party pays” system, which requires theoriginators of telephone calls to pay for calls. If one of our subscribers makes a call to another network, we incurinterconnection charges. Currently, the tariff for SMS including SMS and value-added SMS) is based on a“sender-keeps-all” scheme, under which we earn revenues whenever one of our cellular subscribers sends anSMS, but not when a customer of another telecommunications operator sends an SMS to one of our cellularsubscribers. On December 12, 2011, the Government, through the ITRA, issued letter No.262/BRTI/XII/2011,under which tariffs for SMS will change from a “sender-keeps all” scheme to a cost-based scheme, effectiveJune 1, 2012. Under the cost-based scheme, we will record revenues from interconnection fees payable by otheroperators whenever one of our cellular subscribers receives an SMS from a subscriber on another network. If oneof our subscribers sends an SMS to a recipient on another network (an “off-network SMS”), we will recordrevenues for the SMS charge payable by our subscriber and we will record expenses from interconnectioncharges payable to the operator of the other network. For our GPRS service, we charge cellular subscribers Rp1per kilobyte of data downloaded for the first 300k and Rp0.5/kB up to Rp2/kB (excluding tax) thereafter,depending on the time of download (i.e. off peak versus peak times). We receive roaming settlements fromforeign telecommunications operators when their cellular subscribers roam on our network. For our wirelessbroadband services, we offer various pricing packages depending on the payment method (i.e. prepaid orpostpaid), transmission speed and monthly quotas.
Activation Fees and Monthly Charges. Activation fees represent the initial connection fees charged to newprepaid subscribers when subscribing to a cellular network. Monthly charges are fixed amounts charged topostpaid subscribers, particularly Corporate BlackBerry™ Enterprise Service users that require newBlackBerry™ software. Since 1998, we have not charged our postpaid subscribers an activation fee. In 2011, weoffered several programs for postpaid subscribers, including the “Indosat Mobile” package plan which givessubscribers the choice of daily, weekly or monthly usage plans of Rp2,000, Rp12,000 and Rp50,000,respectively, under which the subscriber pays for all calls and data usage at applicable rates, the “IM3 Nonstop”package offers free SMS, voice and data after certain usage levels are met and full track music download throughIndosat backstage.
Usage charges. There are three types of calls: local, domestic long distance, and international calls. Callsare charged on different charging blocks, from per second up to per minute blocks, depending on the packageplan chosen by the subscriber. Calls may terminate on any of the cellular, fixed or satellite networks. For on-netcalls, our subscribers are charged favorable rates because of our ability to offer bundled products, such as cellularand international long-distance services. For off-net calls, the usage charges of subscribers are greater because ofinterconnection, domestic long-distance, and international long-distance charges.
Value-added Services. Prior to 2008, tariffs for value-added services were not regulated by the Government.Since April 2008, the MOCIT has been responsible for setting the tariff formula for SMS. As with voice services,we offer promotional discounts for SMS and mobile data services for both postpaid and prepaid subscribers.
Interconnection
The charges for postpaid subscription services consist of monthly subscription and interconnection-basedusage charges. Charges for prepaid subscription services likewise include interconnection-based usage charges.The interconnection-based usage charges for both prepaid and postpaid cellular services are calculated byconsidering three interconnection costs: originating, transit and terminating costs.
36

Since January 2007, the MOCIT has set a tariff formula for interconnection services. The MOCIT sets thistariff formula on a “cost” basis, based on RIOs submitted by dominant service providers in Indonesia. TheMOCIT approved the RIOs we submitted in 2007 and 2008, which have not been adjusted for 2009 and 2010. In2011, we were not considered a dominant service provider in 2011 and as such our RIOs were not subject toapproval from the ITRA.
On December 31, 2010, ITRA issued letter No. 227/BRTI/XII/2010 which set a new set of interconnectiontariffs. The new interconnection tariffs took effect on January 1, 2011 and have been reflected by an adjustmentto our RIOs for 2011. We will apply the charges in our RIOs to the interconnection agreements we have withother operators. The charges under our RIOs have been decreasing in the past few years, and we expect thedownward trend to continue.
We currently interconnect with fixed line and cellular networks operated by all network operators atnumerous locations throughout Indonesia. To minimize our interconnection expenses, we utilize our ownbackbone transmission facilities whenever possible and in compliance with applicable regulations. For example,routing a long-distance call from a customer in Surabaya to a destination customer in Jakarta through our fiberoptic or microwave transmission lines allows us to avoid the use of another operator’s network, thereby loweringour interconnection expenses associated with routing our intra-network usage.
Activation, Billing and Collection
Prepaid cellular subscribers can purchase starter packs from our sales and distribution points or through ourvarious independent dealers. To activate service, a new prepaid cellular subscriber must register with us byfollowing the instructions using the interactive menu. Potential postpaid subscribers can apply for our cellularservices at our sales and distribution points or through our independent dealers. Many of our independent dealers,however, can only receive new applications for postpaid cellular services, which are then forwarded to us forprocessing. A potential subscriber for our postpaid service is required to provide proof that such subscriber meetsour minimum credit requirements. If a potential subscriber does not meet our postpaid requirements, our salesrepresentative recommends our prepaid services. Once approved, postpaid service SIM cards are activated within24 hours.
We bill our postpaid subscribers on a monthly basis through our centralized billing division. In the case ofprepaid subscribers, the wireless billing system automatically reduces the value of each prepaid subscriber’saccount as originating, transit and terminating charges are assessed. Our postpaid subscribers have a variety ofpayment options in paying their monthly bills. Payments may be made by cash and major credit cards throughIndosat galleries, bank tellers or post office branches. In addition, subscribers can also make payment viaautomatic debit through banks or participating credit card companies, bank transfers, automated teller machines,Electronic Data Capture, mobile banking, Internet banking, and phone banking. Payments are due 20 days afterthe account statement date. Twenty-seven days after the statement date, we remind subscribers who have not paidtheir balance and block their ability to make outgoing calls. We block a subscriber’s ability to make or receivecalls 40 days after the statement date if he or she still has not paid his or her balance. We suspend the service foraccounts that are more than 50 days past due and remove such subscriber’s data from our network andpermanently disconnect the number and SIM card after 120 days from the statement date.
We have taken a number of steps to prevent subscriber fraud and to minimize losses. We deliver prepaidvouchers to our independent dealers only on a cash-on-delivery basis and we do not collect payments for ourservices from cellular subscribers through our independent dealers. In addition, depending on usage levels, wemay require refundable deposits from subscribers. We also review accounts of our high-usage subscribers atregular intervals to ensure that the deposit levels continue to be adequate.
37

Competition
The cellular services business in Indonesia has become increasingly competitive during recent years.Competition in the cellular communications industry is based principally on network coverage, technical quality,price, the availability of data services and special features, and quality and responsiveness of customer service.Based on our internal estimates, the three major providers of wireless services in Indonesia, Telkomsel (which ismajority-owned by Telkom), us and XL (which is indirectly majority-owned by Axiata Group Bhd. of Malaysia),accounted for almost 75% of the 2011 wireless subscriber base in Indonesia.
We also compete with other fixed wireless access service providers. In May 2003, Telkom introducedTelkomFlexi, a CDMA 2000-1X service in the Jakarta area. Currently, Telkom offers this service nationwide.Telkom offers this service as a fixed wireless access service, but the service has expanded mobility and value-added features similar to cellular services. After receiving requests from industry associations, the MOCIT issueda decree stating that the service area of the fixed wireless access networks must be limited to an area equal to onearea code of the local fixed network service. Fixed wireless access service operators are therefore prohibitedfrom extending their roaming services to other area codes, but CDMA operators still have the ability to achievesimilar results by giving subscribers a new number when they move to other cities. In addition to Telkom, BakrieTelecom and Smartfren have each been granted nationwide fixed wireless access service licenses, allowing themto offer their services nationwide, further intensifying competition.
From time to time, Indonesian telecommunications operators conduct aggressive subscriber acquisitionprograms with the goal of increasing individual market share. By offering discounts, bonuses and special rates,operators attempt to differentiate their services from those of other operators, primarily based on price. Thiscompetition has caused tariffs to decline and, as a result, we believe cellular subscriber ARPU has continued todecline for most Indonesian telecommunications operators.
We believe competition for 3G services will be intense as telecommunications operators continue to deploytheir networks in major population centers. Currently, there are five telecommunications operators holding 3Glicenses: Telkomsel, Hutchison, Natrindo, XL and us. We commenced providing wireless broadband servicesusing our 3.SG platform in 2009 and, as of December 31, 2011, we offered 3.SG services in 152 citiesnationwide.
Our main competitors for wireless broadband services are Telkomsel, with its “Flash” service, and XL withits “XL Unlimited”, both of which use 3.5G W-CDMA technology. Other operators, such as Smartfren alsoprovide wireless broadband service using EVDO-CDMA technology.
We believe barriers to entry in the Indonesian cellular and fixed wireless access services industry arecurrently comparatively high due to the limited availability of frequency spectrum, a capital intensive operatingenvironment, difficulties in acquiring tower sites for network expansion and the established market presence ofthe three incumbents, us, Telkomsel and XL. Nevertheless, we are anticipating continued intense competitionwithin the Indonesian cellular and fixed wireless access services industry generally. In response to this, we intendto dedicate a substantial portion of our future capital expenditures to our cellular business in an effort to increasenetwork capacity and service quality and to provide various value-added services.
MIDI Services
The products and services that we offer in this business segment include high-speed point-to-pointinternational and domestic leased line with broadband and narrowband capacity, a high-performance packet-switching service, MPLS-based services, satellite transponder leasing, Internet services and value added servicessuch as disaster recovery and data center services. Recognizing the significant growth potential of data and othernetwork services, including Internet-based services, and their increasing importance to our overall businessstrategy, we have placed considerable emphasis on this business segment. The growing emphasis on reliable datatransmission and interconnectivity by our corporate customers, especially those with multiple branches or
38

locations, presents an excellent opportunity for us. MIDI services represented Rp2,578.4 billion (US$284.3million), or 12.6% of our total consolidated operating revenues for the year ended December 31, 2011.
For the years endedDecember 31,
2009 2010 2011
MIDI:International High Speed Leased Circuit (’000s) . . . . . . . . . . . . . . . . . . . . . . 80 218 366Domestic High Speed Leased Circuit (’000s) . . . . . . . . . . . . . . . . . . . . . . . . 171 251 296
Services
World Link, Direct Link and Domestic Link. World Link is an IPLC that provides international connectionof high-speed digital data circuits on a point-to-point basis via submarine and terrestrial cables and offers linespeeds from 64 Kbps and multiples thereof up to 2 Mbps for narrowband or 45 Mbps and above for broadband.Direct Link is a leased line service through satellite / VSAT connections which provides high-speed digital datacircuits on point-to-multipoint basis and offers line speeds from 64 Kbps and multiples thereof up to 2 Mbps fornarrowband. Domestic Link is a domestic private leased circuits service that provides high-speed digital datacircuits on a point-to-point basis and offers line speeds from 64 Kbps and multiples thereof up to 2 Mbps fornarrowband or 45 Mbps and above for broadband. Most of our broadband World Link customers aretelecommunications providers who require dedicated broadband international data links, and our narrowbandWorld Link customers consist primarily of corporate users who subscribe to our World Link service for theirown internal use. Direct Link is used for international connections and other leased line users located in areasthat are not covered by terrestrial domestic networks. Our broadband Domestic Link customers in the domesticmarket include telecommunications providers that need dedicated domestic broadband data links, and ournarrowband Domestic Link customers mostly are corporate users who use the service for their own internal use.We recorded operating revenues of Rp294.9 billion (US$32.5 million), from World Link, Direct Link andDomestic Link operations, representing 11.4% of our consolidated MIDI services operating revenues for the yearended December 31, 2011.
IP VPN. We provide both international and domestic IP VPN services through Indosat, Lintasarta, and IM2,which provide customers with multi-point connectivity for data communication through our robust IP networkcloud. These services support flexibility, scalability, and accommodate complex distributed computingapplications, while maintaining the quality of service, security, and reliability close to that of private leasedcircuit. As of December 31, 2011, Indosat’s, Lintasarta’s, and IM2 domestic IP VPN services were available inapproximately 100 cities in Indonesia, and Indosat’s international IP VPN services have a strong presence inSouth East Asia, with coverage extensions to North Asia, Europe, Japan, and the United States, in cooperationwith several global service providers such as AT&T, C&W, BT, and NTT. We recorded operating revenue ofRp695.9 billion (US$76.7 million) from IP VPN operations, representing 27.0% of our consolidated MIDIservices operating revenues for the year ended December 31, 2011.
MPLS and Metro Ethernet. MPLS and Metro Ethernet are domestic and international leased line servicesprovided through our robust Internet Protocol network cloud. MPLS is a technology platform that has an abilityto provide various classes of services on an Internet Protocol network, resulting in a flexible, scalable, reliableand secure data communication link, both for point-to-point or multipoint domestic inter-city and internationalconnections. Our MPLS-based services consist of Premium Ethernet Point to Point, Premium Ethernet MultiPoint, and IP VPN, and offer line speeds from 64 Kbps and multiples thereof up to 2 Mbps for narrowband or45 Mbps and 155 Mbps for broadband. Metro Ethernet provides high-speed domestic inner-city bandwidthconnections with line port speeds of 10 Mbps, 100 Mbps and 1 Gbps and an Ethernet base with an incrementalguaranteed bandwidth of 1 Mbps. We recorded operating revenue of Rp89.9 billion (US$9.9 million) fromMPLS and Metro Ethernet services, representing 3.5% of our consolidated MIDI services operating revenue forthe year ended December 31, 2011.
39

Frame Relay and ATM. We provide both international and domestic Frame Relay and ATM services, ahigh-speed leased packet switch technology, primarily through Indosat and Lintasarta, supplying customers withmultilateral connectivity, reliable LAN interconnections and the power to support complex distributed computingapplications. We recorded operating revenue of Rp123.2 billion (US$13.6 million) from Frame Relay and ATMservices, representing 4.8% of our consolidated MIDI services operating revenue fro the year endedDecember 31, 2011.
We offer our various data connectivity services—World Link, Direct Link, Domestic Link, IP VPN, MPLSand Metro Ethernet, Frame Relay and ATM—to our various corporate customers, including multinationalcorporations, that are tailored to fit their specific information and telecommunications requirements, pricingparameters, speed requirements and security concerns.
Satellite Services. We lease transponder capacity on our Palapa-D satellite, which is positioned in an orbitalslot located over the Asia-Pacific region, to broadcasters and telecommunications operators. Indonesia has a largetelevision market in which a number of privately-owned domestic broadcasters and international programmerscompete with the state-owned broadcaster and many of these domestic and international broadcasters leasecapacity on our satellite. We have entered into lease arrangements governing transponders on our Palapa-Dsatellite that vary in duration but generally terminate within two to five years of the effective date of the lease.Transponder leases may be terminated for breach of the lease agreement and most of the leases provide that thelessee may terminate the lease with notice (generally six to 12 months) subject to the payment by the lessee of atermination fee equal to a percentage of the lease payments that would have been due had the lease not beenterminated. Apart from our own use, we also lease transponder capacity on our Palapa-C2 satellite, with amaximum lease term of one year, to other telecommunications operators.
We also provide a variety of other satellite derivative services, including occasional use for TV services(including Indosat TV link, “Satellite News Gathering” and transportable uplink station services), privatenetwork services, Internet access and multimedia and video conferencing. We expect demand for satelliteservices to continue to grow, mainly driven by accelerating growth of satellite derivative services. Pressure onpricing is expected to ease as a consequence of improved demand. Satellite services represented Rp150.9 billion(US$16.6 million) or 5.9% of our MIDI services operating revenues for the year ended December 31, 2011.
Internet Services. We provide international IP transit services for ISPs via Jakabare and SMW3 cablesystems and domestic IP transit via our MPLS backbone. Dedicated internet access services for end users andcorporate customers are delivered by Indosat, IM2 and Lintasarta. As part of our strategy to expand our Internetbusiness, we leverage our infrastructure assets through connections to Tier-1 upstream providers, such as AT&T,PCCW Global, STIX and Tata and establishing bilateral peering with major service providers in the region anddominant content providers, such as Google and Microsoft. The total capacity of our international backbone is160 Gbps, part of which is allocated to support our Internet services, and it is upgradable to up to 640 Gbps. Inanticipation of increased competition in the Internet business, we have formulated a strategy to expand ourbusiness by developing Internet protocol backbone processes in potential growth areas, deploying public hotspotservices and improving our business processes. In addition, in December 2011 Indosat launched its cloudcomputing business pursuant to a joint venture with PT Dimension Data Indonesia.
Lintasarta offers its Internet subscribers “IdOLA” and “LintasartaNet” service for corporate subscribers.With IdOLA and LintasartaNet, subscribers can access information from many content providers in Indonesiaand worldwide. Corporations may use LintasartaNet for Internet promotions, software and computer allocations,co-operative ventures or domestic and international trade transactions. We derived Rp165.0 billion (US$18.2million) or 6.4% of our consolidated MIDI services operating revenues from Internet services for the year endedDecember 31, 2011. In 2011, Lintasarta launched “Lintasarta Cloud” services, a cloud computing servicedesigned to accommodate customers’ IT outsourcing needs.
Internet services represented Rp375.7 billion (US$41.4 million) or 14.6% of our MIDI services operatingrevenues for the year ended December 31, 2011.
40
VSAT Net/IP and VSAT Link. Lintasarta’s VSAT Net/IP and VSAT Link services are satellite-based datanetworking systems. VSAT Net/IP connects and controls data traffic among remote locations, allowing for quickdevelopment of data for network customers with low-to-medium traffic in such sectors as financial services,transportation, trading and distribution. VSAT Link provides point-to-point digital transmission for remotelocations by businesses with medium-to-heavy traffic such as those in the manufacturing, mining and financialservices industries.
Disaster Recovery Center (DRC) and Data Center. We provide DRC and Data Center services throughIndosat and Lintasarta. We offer co-location, rack, cage, power, and other supporting facilities as value addedservices to corporate customers. We also provide backbone or domestic leased line services from our DRC orData Center locations to customer headquarters, as part of our total telecommunications solutions.
Customers and Marketing
Our customers for MIDI services are primarily corporate clients and small-to medium-size enterprises(“SME”), although we also have wholesale and retail customers for certain services, such as our Internetservices. Our marketing activities for MIDI services include exhibitions, participation in events, grouppresentations, seminars, direct mail, partner promotions, customer retention programs and advertisements inpublications and printed media. Also, though our Indosat Corporate Solutions Micro site, we provide corporatecustomers with convenient access to information about Indosat Corporate Solutions products and services andincrease brand awareness of these services. Each business unit seeks to maintain existing customer relationshipsthrough activities such as user forums, training seminars, courtesy visits and informal gatherings. In addition,during 2011, Indosat acted as the official telecommunications provider for a number of national and internationalevents held in Indonesia, including the Southeast Asian Games XXVI, held in Jakarta and Palembang, the 19th
ASEAN Summit, held in Bali, and United States President Barack Obama’s 2011 visit to Indonesia.
Lintasarta is focused on expanding its market share in segments outside of its core competencies of bankingand finance, in light of the anticipated consolidation and restructuring of those industries in Indonesia. Lintasartais expanding the existing geographic coverage of its products and services to address the increasing demand fortelecommunications infrastructure in outlying regions as a result of Indonesian political developments, includingincreased regional autonomy.
We support our subscribers through local area staff, a 24-hour help desk and integrated real-time networkmanagement. In April 2000, Lintasarta achieved ISO 9002 certification for its frame relay, digital data networkand VSAT services. In January 2002, we obtained ISO 9001 certification for our frame relay, digital datanetwork and VSAT services, evidencing our commitment to customer satisfaction and continuous service qualityimprovement. As a result of these activities, Frontier and Marketing Magazine awarded us the “Top BrandAward” in the ISP category for the years 2005 through 2010 and the “Best Contact Center Award” for 2007,2008 and 2009. As appreciation of our commitment to operational excellence, in June 2010, Cable and Wirelessawarded Indosat as “Best Partner” in the Maintain and Achieve Operational Excellent in Asia category in theCable and Wireless Global partner Gathering in Singapore.
Tariff Structure and Pricing
Customers of our various MIDI services are charged based on the type of product and service provided, thecapacity leased, their industry sector, geographic location and the length of service contracts with us (whichgenerally range from one to three years). Service charges generally include the following components: initialinstallation; monthly service charges (based on location and access speed); transactional charges (based on thevolume, duration and/or distance traveled for network traffic); and other charges for services such as consultancyand project management.
41

Satellite transponder lease rates to international lessees are negotiated individually with customers anddepend on the supply and demand for services in the areas covered by our Palapa-C2 and Palapa-D satellites. Ouroffshore leases average US$0.92 million per annum for a full transponder. Almost all offshore lease paymentsare payable quarterly in advance in U.S. dollars and other widely used currencies.
Competition
Data communications service providers in Indonesia compete principally on the basis of price, range ofservices provided and customer service quality. During the last few years, competition among datacommunications service providers has intensified principally due to the issuance of new licenses resulting fromthe deregulation of the Indonesian telecommunications industry. We expect competition to continue to intensify.We believe that our major competitors are Citra Sari Makmur, Tangara Mitracom, Satkomindo and Primacomwith respect to our VSAT services, Telkom, XL, Icon+, and Citra Sari Makmur, with respect to our domesticleased line services, and Telkom, XL, and to a lesser extent, Matrix Cable System, PT Mora TelematikaIndonesia (“Moratel”) and Icon+, with respect to our international leased line services. Telkom enjoys dominancein the MIDI business sector, we believe due in part to its extensive last mile coverage, whereas we areparticularly strong in serving the financial, oil and gas, and mining industry segments.
ISPs in Indonesia compete on the basis of network quality, price and network coverage. With respect toInternet-related value-added services, we compete against Telkom and other existing ISPs, such as First Media,Biznet, CBN, Berca and Indonet. We also face significant competition from any new ISPs whose licenses areapproved by the MOCIT.
As corporate markets demand greater speed at affordable prices, many bandwidth suppliers have begunmaking significant investments toward building superior infrastructure using new technology, such as “DenseWavelength Division Multiplexing,” or DWDM technology. DWDM technology offers more bandwidth capacityand better quality of service with better cost efficiency. This market demand is also leading to the expansion ofEthernet-based services, which offer simplicity of service, affordable prices and wide bandwidth.
The bandwidth industry has been facing recent challenges from the emergence of new operators and theexpansion of existing operators, such as Moratel and Matrix Cable System, which set up international cableslinking Indonesia and Singapore in 2008. In December 2011, XL and Moratel completed deploying their Batam-Dumai-Malaka Cable System.
Companies in the satellite business compete principally on the basis of coverage, transponder power,product offerings and cost. Generally, the cost of service depends upon the combination of power and coverage.In recent years, competition within the satellite business in the Asia-Pacific region has been intense. Our satelliteoperations have primarily consisted of leasing transponders to broadcasters and telecommunications operators ofVSAT, cellular and IDD services and ISPs. We face competition from foreign and domestic service providers ineach of these areas. In leasing our transponders on the Palapa-D satellite, we compete most closely in Indonesiawith Telkom and PT Pasifik Satelit Nusantara (“Pasifik Satelit Nusantara”). Pasifik Satelit Nusantara also ownstransponders on the Mabuhay Philippines Satellite. Telkom currently operates its own satellites (Telkom-1 andTelkom-2) and earth stations primarily to provide backbone transmission links for its network. Telkom alsoleases satellite transponder capacity and provides earth station satellite uplinking and downlinking service todomestic and international users. Other private satellites serving the broadcast market within the coverage area ofthe Palapa satellites include AsiaSat-4, AsiaSat-3S, Apstar-2R, Apstar-5, Apstar-6, Chinasat 10/Sinosat 5,Chinasat 6B, ThaiCom4, ThaiCom5, Measat-3, Measat-3a, Intelsat 7, Intelsat 8, Intelsat 10 and Intelsat 12.. APTSatellite, which operates the Apstar satellites, China Satellite Communication Co. Ltd which operates Chinasatsatellites, ThaiCom Public Company Ltd, which operates the ThaiCom satellites, Measat Sdn. Bhd, whichoperates the Measat satellites and Intelsat S.A., which operates the Intelsat Satellites, also compete directly withus in the Asian regional market. Moreover, with the increasing popularity of Direct-To-Home television(“DTH”), our satellite business will face increasing competition as new and more powerful regional satellites are
42

launched. DTH is the reception of satellite programs with a personal dish in an individual home. Nationalbroadcasters are seeking DTH licenses to provide nationwide broadcast services in Indonesia. DTH televisionwill enable broadcasters to distribute their program content without utilizing our telecommunication networksupport. In addition, because of the growing popularity of DTH, we face the possible loss of customers becauseDTH uses a satellite platform that we do not provide.
Fixed Telecommunications Services
Our fixed telecommunication services include international and domestic long distance as well as fixedwireless access services. For the year ended December 31, 2011, we recorded operating revenues of Rp1,250.0billion (US$137.8 million) from our fixed telecommunications services, representing 6.1% of our totalconsolidated operating revenues. Except with respect to payments from our cellular, fixed wireless and fixed linesubscribers, we do not receive any payments directly from the end users of our international long-distanceservices. For the year ended December 31, 2011, 10.3% of our fixed telecommunications services operatingrevenues were derived from amounts received or receivable from Telkom and other domestic operators in respectof outgoing calls, 64.4% was derived from net settlements with foreign telecommunications operators in respectof incoming calls and the remaining 25.3% was derived from fixed wireless access services, direct billing forspecific services, such as from calling card and fixed-line subscribers for the same period.
Services
International Long-Distance Services. We provide a variety of international voice telecommunicationsservices and both international switched and non-switched telecommunications services. Switched servicesrequire interconnection with either the PSTN or another mobile cellular operator’s facilities; non-switchedservices can be completed through our transmission facilities without the need for interconnection.
Within our international long-distance services, we offer a premium IDD service through our “001” and“008 access code. Our premium IDD service can be accessed by any operator in Indonesia. We also offer adiscount VoIP service under the brand name “FlatCall 01016,” which offers discounted tariff rates for certain topdestination countries, and is only available to our subscribers. In 2011, approximately 22% of our outgoinginternational long-distance call minutes (including calls placed through “Flatcall 01016”) originated from theEastern Java area, followed by 18% originating from Western Java, and 14% originating from the greater Jakartaarea. Our outgoing international long-distance calls are routed through three of our six international gateways.From these gateways, international long-distance services are transferred via submarine cable based onpredetermined routing plans developed in collaboration with foreign telecommunications operators. The foreigncarriers receiving calls through the international gateways are responsible for terminating the calls to theirrecipients. Similarly, international long-distance calls received at our gateways are switched from the gateway totheir destinations domestically through Telkom’s local network, our cellular network, our fixed local network orone of the other cellular operators with which we maintain interconnection arrangements. In 2010, we beganoffering international interconnection services to foreign operators whereby we route call traffic that bothoriginates and terminates overseas through our international gateways. This traffic accounted for 2.6% and 7.5%of our incoming paid minutes for 2010 and 2011, respectively. For the year ended December 31, 2011, ourrevenues from international long-distance services amounted to Rp934.0 billion (US$103.0 million).
43
The following table sets forth certain operating data for our international direct dialing services for theperiods indicated:
For the years ended December 31,
2009 2010 2011
minutes % change minutes % change minutes % change
(in millions, except percentages)
Incoming paid minutes(1) . . . . . . . . . . . . . . . . . . . . 1,558.5 -1.5 1,678.7 10.6 1,841.7 9.7Outgoing paid minutes . . . . . . . . . . . . . . . . . . . . . . 502.0 5.9 463.0 -7.8 445.3 -3.8Incoming and outgoing paid minutes(1) . . . . . . . . . 2,060.5 0.2 2,141.7 3.9 2,287.0 6.8Ratio of incoming to outgoing traffic . . . . . . . . . . 3.1 — 3.6 — 4.1 —
(1) For 2010 and 2011, we have included traffic that we provide international interconnection services for asincoming international traffic; prior to 2010, we excluded this traffic from the calculation of incominginternational traffic. This traffic accounted for 45.2 and 149.3 incoming paid minutes in 2010 and 2011,respectively.
During 2009, 2010 and 2011, our international outgoing calls measured by paid minutes increased by 5.9%,decreased by 7.8% and decreased by 3.8%, respectively, while our international incoming calls measured by paidminutes decreased by 1.5% in 2009, increased by 10.6% in 2010 and increased by 9.7% in 2011. Combinedoutgoing and incoming calls, also measured by paid minutes, increased by 0.2%, 3.9% and 6.8% during 2009,2010 and 2011, respectively. We believe our growth in 2011 relative to prior years was primarily due to ouraggressive business strategy of emphasizing volume-based sales. We believe that increased competition fromTelkom and VoIP operators, some of which are unlicensed, will continue to affect our business in the future.
Fixed Wireless Access Services. We launched our fixed wireless access services in 2004 to expand our fixedtelecommunications business segment and to complement our cellular services. Using CDMA 20001x technology, our fixed wireless access services offer a cost-effective alternative to our cellular services tosubscribers who have limited mobility requirements. As of December 31, 2011, our fixed wireless access service,“StarOne,” had a total subscriber base of 228,884 subscribers with 53,105 postpaid subscribers and 175,779prepaid subscribers. For the year ended December 31, 2011, revenues from fixed wireless access services totaledRp192.8 billion (US$21.3 million). On December 12, 2006, the Government granted us a license for twochannels of nationwide fixed wireless access in the 800 MHz frequency. This license replaced our previous1900 MHz fixed wireless access license and by the end of 2007, we migrated our CDMA frequency from1900 MHz to the new 800 MHz frequency in the greater Jakarta area. Our Store One services were available in82 cities as of December 31, 2011.
Local and Domestic Long Distance Services. We launched local and domestic long distance service fromIndosat access points such as “StarOne” and “INDOSAT phone” in October 2005. We currently have local anddomestic long-distance coverage of 152 major cities in Indonesia.
Customers and Marketing
The principal customers of our fixed telecommunications services are corporate clients, our own cellular,fixed telecommunications and fixed wireless access customers, and the customers of other telecommunicationsoperators.
We employ a specialized sales force, including a sales group, which focuses on our 500 largest customers,including hotels, large corporate customers, government offices and embassies. We have also implemented acustomer loyalty program, which provides incentives to regular users. In addition, we seek to broaden ourcustomer base by conducting joint promotions with other international telecommunications companies topromote our services. We strive to deliver high-quality services that maximize customer satisfaction.
44
We have undertaken a variety of marketing initiatives to improve our services to fixed telecommunicationscustomers. Our marketing strategy focuses on expanding our market share while retaining our customers throughbundling initiatives; and establishing volume commitments for incoming traffic from foreign telecommunicationsoperators. We have traditionally maintained a nationwide advertising campaign, using television, newspapers,magazines, websites and radio to increase brand awareness among business and retail customers. We alsomaintain regional sales offices in eight locations throughout Indonesia.
We maintain a proprietary database of customer information, which allows us to analyze consumerpreferences and usage patterns and to develop tailored marketing and products. We conduct our own marketresearch and also engage consultants to perform broader research on customer behavior and needs.
Tariff Structure, Universal Service Obligations and Pricing
Rates. Prior to 2008, the MOCIT set tariffs for fixed telecommunications services, which were based on thedivision of all destinations into six zones. On April 30, 2008, the MOCIT established a tariff formula for basicservices on fixed networks and required operators to calculate prices using a cost-based formula, which are thensubmitted to the Government for approval. However, our international long-distance rates have not changed, andso we intend to continue applying international long-distance rates based on the previous regulations which basetariffs on six zones for call destinations.
The provision of international long-distance services between two countries is normally established betweentelecommunications carriers on a bilateral basis. We typically apply a market termination rate-based pricingsystem, pursuant to which we agree on asymmetric rates for incoming and outgoing calls. We maintain directconnections with 56 foreign telecommunications operators in 30 countries. Our agreements with these carriers setthe terms of payment by us to the foreign telecommunications operators for use of their facilities in connectinginternational long-distance services billed in Indonesia and by the foreign telecommunications operators to us foruse of our facilities (and the local Indonesian networks) in connecting international long-distance services billedabroad. The practice among telecommunications carriers is for charges due in respect of the use of overseasnetworks to be recorded, collected and forwarded by the telecommunications carrier from the country in whichthe call is billed. Based on the rates negotiated with each foreign telecommunications operator, we makepayments to carriers for outgoing traffic billed in Indonesia, and we receive payments from such carriers forinbound traffic billed outside of Indonesia. Settlements among carriers are normally made quarterly on anet-based method. Our largest correspondent carriers are those located in Malaysia, Singapore, Taiwan, theMiddle East and Hong Kong.
VoIP service providers may determine their own collection charges, and each service provider mustnegotiate with the applicable network provider for interconnection charges. We have entered into an agreementfor Telkom to be our network provider for VoIP interconnection.
Interconnection with Domestic Networks. Although we provide international gateways for outgoing callsfrom and incoming calls to Indonesia, all international long-distance services, except for international transitservices, must terminate on one of the domestic fixed or cellular networks. The MOCIT sets interconnectiontariffs for international long-distance services which traverse the domestic fixed-line and fixed wireless accessnetworks. We have separate interconnection agreements, which reflect these tariffs, with those operators thatinterconnect directly with our international gateways.
Universal Service Obligations. The Government imposes a Universal Service Obligation (“USO”) tariff,which from 2005 through 2009 was 0.75% of annual gross revenues less interconnection expenses paid to othertelecommunication carriers and bad debts. In January 2009, the Government increased USO tariffs from 0.75%of annual gross revenue to 1.25% of annual gross revenue (after deducting interconnection charges and baddebts).
45
Customer Billing and Interconnection Charges
Domestic operators maintain control over the billing and collection process for international long-distanceservices, which are initiated on the domestic networks. Domestic operators retain the appropriate interconnectioncharges owed to them from the amounts collected and remit the balance (without interest) in Indonesian rupiah tous within not less than 25 days of collection from the customer in Indonesia. The collection cycle for most of thedomestic operators is approximately 30 days. We are responsible for generating and delivering such billinginformation to the domestic operators, through a module known as the System Online Clearing Interconnectionservice, every twelfth day of the month, which is then billed by the domestic operators approximately five daysafter receipt from us, resulting in a collection cycle of approximately 50 to 80 days. For purposes of financialreporting, we recognize revenues on a monthly basis based upon our own traffic records. We bill our domesticcellular operators in the middle of the following month and require payment by the end of the month.Accordingly, the normal collection cycle with respect to domestic cellular operators is approximately 20 to60 days.
We remit the appropriate interconnection charge to the relevant operator for incoming calls terminating onthe domestic networks. We generally remit such charges in 20 to 60 days by netting the receivables for outgoingcalls. The settlements from foreign telecommunications operators are typically paid in U.S. dollars, which aredeposited in Indonesia, and amounts representing interconnection payments payable by us to the domesticnetwork operators are remitted in Indonesian rupiah.
Customer usage of fixed wireless access and domestic long-distance services is calculated starting from thebeginning of the month until the end of the month. Customer billing is generated at the beginning of thefollowing month and completed by the fifth day of that month. Billing statements are generally received bycustomers no later than the tenth of the month and payments are due by the twentieth of the month. For fixedwireless access service, we block the subscribers’ ability to make calls when they have not paid their balance dueby the twenty-second day of the month. We block a customer’s ability to make or receive calls 40 days after thestatement date if he or she still has not paid his or her balance. We permanently disconnect service and cancelaccounts for customers whose bills are more than 60 days past due from the first day of the generated bill. Fordomestic long-distance services, by the end of the month, we block customers from making calls if they have notpaid their balance. For customers who have not paid their balance due by the end of the second month, we blockthe customers’ ability to make or receive calls. We permanently disconnect service and cancel accounts forcustomers whose bills are 90 days past due from the first day of the generated bill.
Competition
We are no longer the only authorized provider of traditional IDD (i.e., non-VoIP) call services in Indonesia.The MOCIT has granted operational licenses to provide IDD services to Telkom, which includes the right to usethe IDD access code “007” to enter the international long-distance market, and Bakrie Telecom. The Governmentmay also issue new licenses for IDD services to other telecommunications operators, which will increasecompetition. In addition, Telkom no longer operates a monopoly for DLD services. The traditional IDD markethas become even more competitive with the increased usage of VoIP technology. Our VoIP business hasincreased significantly from 442.4 million minutes, 411.7 million minutes and 396.1 million minutes in 2009,2010 and 2011, respectively.
In April 2008, we and Telkom agreed to open DLD access from our respective customers in Balikpapan,pursuant to which Telkom’s fixed network customers can dial “011” to access our DLD network while our localfixed network customers can dial “017” to access Telkom’s network. In addition, in 2008, Bakrietel was issued alicense as a new DLD operator. The opening of DLD access among competitors and the commencement ofoperations of new DLD operators is expected to increase competition by providing customers with more optionsfor DLD services.
46

We also compete with other fixed wireless access service providers. In May 2003, Telkom introducedTelkomFlexi, a CDMA 2000-1X service in the Jakarta area. Currently, Telkom offers this service nationwide.Telkom offers this service as a fixed wireless access service, but the service has expanded mobility and value-added features similar to cellular services. After receiving requests from industry associations, the MOCIT issueda decree stating that the service area of the fixed wireless access networks must be limited to an area equal to onearea code of the local fixed network service. Fixed wireless access service operators are therefore prohibitedfrom extending their roaming services to other area codes, but CDMA operators still have the ability to achievesimilar results by giving subscribers a new number when they move to other cities. Telkom, Bakrie Telecom andSmartfren have each been granted nationwide fixed wireless access services licenses, allowing them to offer theirservices nationwide, further intensifying competition.
Facilities and Infrastructure
The discussion below relates to our cellular network, fixed telecommunications network (including IDDnetwork), and other communications facilities and infrastructure, including that of our significant operatingsubsidiaries.
Cellular Network
The principal components of our cellular network are:
• base transceiver/Node B stations: consisting of a transmitter and receiver and serving as a bridgebetween mobile users in one cell and the mobile switching center via base station controllers and radionetwork controllers;
• base station controllers/radio network controller: devices that connect to and control the base stationwithin each cell site;
• mobile switching centers: centers that control the base station controllers and the routing of telephonecalls; and
• transmission lines: lines that link the mobile switching centers, base station controllers, base stationsand the PSTN.
Our cellular network currently operates using 10 MHz x 2 uplink and downlink of radio frequencybandwidth in the GSM 900 spectrum, 20 MHz x 2 uplink and downlink of frequency bandwidth in the DCS1800 spectrum and 10 MHz x 2 uplink and downlink in the IMT-2000 spectrum. The following table sets forthselected information regarding the composition of our cellular network as of the dates indicated:
As of December 31,
2009 2010 2011
Base transceiver stations . . . . . . . . . . . . . . . . . . . . . . . . . . . . . . . . . . . . . . . . . . . . . . 14,385 15,216 15,816Node B Stations (3G BTS) . . . . . . . . . . . . . . . . . . . . . . . . . . . . . . . . . . . . . . . . . . . . 1,968 2,892 3,437Total BTS (including 2G and 3G) . . . . . . . . . . . . . . . . . . . . . . . . . . . . . . . . . . . . . . 16,353 18,108 19,253Base station controllers . . . . . . . . . . . . . . . . . . . . . . . . . . . . . . . . . . . . . . . . . . . . . . . 315 330 302Mobile switching centers . . . . . . . . . . . . . . . . . . . . . . . . . . . . . . . . . . . . . . . . . . . . . 95 87 75Radio network controllers . . . . . . . . . . . . . . . . . . . . . . . . . . . . . . . . . . . . . . . . . . . . . 20 34 51Media gateways . . . . . . . . . . . . . . . . . . . . . . . . . . . . . . . . . . . . . . . . . . . . . . . . . . . . 73 79 79
We purchase our cellular telecommunications equipment primarily from European and Chinese suppliers.Our network is an integrated system employing switching equipment, cell site equipment and a transmissionnetwork of point-to-point microwave radio. Most of our cell sites and radio base stations are located in or onbuildings or on vacant lots, which we own, or for which leases have been individually negotiated by us for termstypically varying from five to 20 years.
47
As a result of operating three legacy networks using equipment from numerous suppliers, our capitalexpenditures have historically been higher than would be the case if we were operating a single network usingfewer suppliers. Commencing in 2009, as part of our functional management strategy, we began to rationalizeour capital expenditure and procurement planning through our newly-established investment committee. Wehave focused our procurement on fewer suppliers and have adopted a framework agreement approach with suchsuppliers, which we believe has significantly increased the efficiency of our capital expenditure program.
On February 7, 2012, we signed transaction documents with PT Tower Bersama Infrastructure Tbk.(“TBIG”) and its subsidiary PT Solusi Menara Indonesia (together, “Tower Bersama”) for the sale and leasebackof 2,500 towers, approximately 25% of our existing tower assets, for a total potential consideration of US$519.0million, comprising upfront consideration of US$406.0 million worth of cash and newly issued TBIG shares anda maximum potential deferred payment of US$113.0 million (the “Tower Sale Transaction”).
Under the terms of the Tower Sale Transaction, we will lease the towers sold for a minimum period of 10years at fixed rates that are in line with current market rates. By transferring ownership of the towers, we believewe will enjoy significant ongoing maintenance capital expenditure and operational expenditure savings. Inaddition, we have concluded preferential terms with Tower Bersama in line with its anchor tenant position thatimply meaningful additional value to us in the form of realized savings over the term of the lease. Cash proceedsfrom the transaction will be applied towards repayment of outstanding debt, on-going capital investment andgeneral corporate purposes. Completion of the Tower Sale Transaction is subject to various approvals includingthose of certain of our bondholders and lenders and Tower Bersama’s shareholders.
The Tower Sale Transaction forms part of our strategy to monetize or increase productivity of non-coreassets and we are continuing to consider various options in connection with the operation, ownership and use ofour other tower assets to optimize the value of such assets.
Fixed Telecommunications Network
We have built a fixed telecommunications network consisting of six international gateways served bysatellite circuits, submarine cables and microwave transmission. By the end of 2010, we offered fixed wirelessaccess services across 82 cities in Indonesia.
International Gateways. For our international long-distance business, we operate through six gateways, fourgateways in Jakarta, and two gateways in Surabaya, which provide all of the connections for our services to ourinternational long-distance network. The gateway-switching equipment was purchased from LucentTechnologies, Inc. (which has since merged with Alcatel) and Siemens.
As of December 31, 2011, we had available international bandwidth capacity of 2,500 Mbps for voice and22,400 Mbps for data transmission. All of our destinations are digitally connected. The bandwidth available to usis significantly higher than the utilized capacity to allow for anticipated growth in traffic. It is our policy tomaintain average utilization at less than 80.0% of capacity to allow for increased usage during peak hours.
Each international gateway is linked to the other international gateways, which permits multiple routingoptions for each call and provides the system with backup capability in case of equipment failure orovercrowding at any gateway. We have placed interconnection equipment at the facilities of Telkom and certainother cellular operators to connect our international long-distance network to the domestic telecommunicationsnetwork.
International transmission of voice and data between international gateways occurs across either satellitecircuits or submarine cables. Satellite circuits are unaffected by distance and offer broadcast services makingthem flexible with regard to call destinations. Submarine cables, especially fiber optic digital cables, can offerless expensive high-quality services. However, cable costs increase with distance and destinations are fixed.
48

Satellite circuits can be degraded by atmospheric conditions, while submarine cables can suffer damage fromhuman or natural causes. In general, we use submarine cables with cable-to-cable backup for medium-distancelinks in Asia and satellite links backup for longer-distance transmission. We use microwave and fiber optic linksfor connections between gateways and earth stations, as well as for the Batam gateway, which has microwavelinks to Singapore. It is our policy to maintain 100% redundancy for all of our international long-distance links(which may require routing through a third country) in an effort to provide high-quality services to ourcustomers.
Submarine Cables. We have ownership interests in and access to capacity in submarine cablesinterconnecting the Asia-Pacific region, North Africa and Europe, as well as those linking the Asia-Pacific regionwith North America. The table below sets forth the geographic coverage and allocated capacity of our cablenetwork as of December 31, 2011:
Submarine Cable Network Geographic Coverage Capacity
(in Mbps)
APCN-2 China, Japan, Malaysia, Philippines, Singapore, Hong Kong South Koreaand Taiwan
310.00
SEA-ME-WE 3 Australia, Austria, Belgium, Brunei, Canada, China, Egypt, France,Germany, Greece, Hong Kong, India, Iran, Italy, Japan, Macau, Malaysia,Myanmar, Netherlands, Oman, Pakistan, Portugal, Saudi Arabia, Qatar,Singapore, South Korea, Spain, Sri Lanka, Taiwan, Thailand, Turkey,United Arab Emirates, United States and United Kingdom
107,673.60
China-US China, Taiwan, South Korea and United States 1.414.00
Asia America Gateway Singapore, Malaysia, Thailand, Vietnam, Brunei, Hong Kong, thePhilippines, and United States
2,790.00
Jakabare Java—Singapore 80,000.00
Jakabare Java—Kalimantan 80,000.00
Jakabare Kalimantan—Batam 80,000.00
Jakabare Batam—Singapore 80,000.00
Jakasusi Java—Kalimantan 80,000.00
Jakasusi Kalimantan—Sulawesi 40,000.00
Jasutra Java, Sumatera 120,000.00
Jakarta—Surabaya Java 50,000.00
Total . . . . . . . . . . . . . . . . . . . . . . . . . . . . . . . . . . . . . . . . . . . . . . . . . . . . . . . . . . . . . . . . . . . . . . . . . . . 722,187.60
To support the operations of our gateway in Surabaya, we have operated the Jakarta-Surabaya submarinefiber optic cable link since January 1997. This link enhances network reliability and improves the quality of ourservices in the Surabaya region.
We, along with the Telecommunications Company of Iran (“TCI”), are among more than 80 companies thathave an ownership interest in, and access to capacity in the SEA-ME-WE 3 submarine cable. Our ownershipinterest in the SEA-ME-WE 3 submarine cable stands at approximately 3.4% while TCI’s ownership intereststands at approximately 0.3%. The SEA-ME-WE 3 submarine cable does not have any landing point in Iran. Theconnection to Iran is through the UAE-Iran submarine cable system that lands at Fujairah Cable Landing Station(UAE).
49
Other Communication Facilities
Our Palapa-C2 and Palapa-D satellite communication systems and fiber optic links to major commercialcenters as well as remote areas of Indonesia are used in the provision of our MIDI services and for cellularbackhaul.
Satellite Communication System. Communications satellites are of varying use, depending on features suchas their footprint, or coverage areas, transponder power (typically stated in dBW), and transponder bandwidth.Transponder bandwidth, expressed in terms of megahertz, varies between C-band and Ku-band transponders.C-band is used worldwide as a standard for satellite communications to transmit signals with minimumatmospheric interference. They can provide very broad coverage over most of the Asian continent, making themvery popular for applications such as television broadcasting and VSAT applications. Ku-band transpondersoperate at a frequency of approximately 11-14 gigahertz. While Ku-band frequencies are more prone to moistureand rain attenuation than C-band frequencies, they are more suitable for IP VSAT applications involving verysmall antenna applications. Ku-band is generally used for the same purposes as C-band, as well as for satellitenews-gathering (truck-mounted antennas) and some VSAT applications. Ku-band is especially prevalent in areaswith dense ground-based microwave systems. To compensate for loss of signal strength caused by moisture andrain attenuation, Ku-band transponders are generally of higher-power than C-band transponders and theirfootprints are smaller.
On August 31, 2009, we launched a new satellite, Palapa-D, to replace Palapa-C2 at orbital slot 113E, whichsignificantly increased our transponder capacity and provided wider satellite coverage. The increased transpondercapacity our Palapa-D satellite provided allowed us to meet both our own satellite transponder requirements aswell as those of customers who lease transponder capacity from us. As of December 31, 2011, approximately73.6% of Palapa-D’s standard C-band transponder capacity, 41.2% of its Ext. C transponder capacity and 85.6%of its Ku-Band transponder capacity were being leased to third parties. As of December 31, 2011, we were using9.1% of Palapa-D’s Standard C-Band transponder and 54.5% of Palapa-D’s Extended C-Band capacity to meetour own bandwidth requirements and the remaining 17.3% Standard C-Band transponder capacity, 4.3%Extended C-Band capacity and 14.4% Ku-Band transponder capacity was available for lease.
After a successful traffic transfer from Palapa-C2 to Palapa-D in early November 2009, Palapa-C2 moved tothe orbital slot at 150.5E.L. and will operate in inclined orbit carrying our cellular backhaul until approximatelyMarch 2014 . As of December 31, 2011, we were using 57.85% of our Palapa-C2 Standard C-Band transpondercapacity to meet our own bandwidth requirements, we were leasing 12.5% of our capacity to third parties and theremaining 29.7% or our capacity was available for lease.
The Palapa-D satellite has eleven 36-megahertz extended C-band transponders, twenty-four 36-megahertzstandard C-band transponders, and five 36-megahertz Ku-band transponders wholly owned by us. The maximumpower on each of the C-band and Ku-band transponders is 43 and 53 dBW, respectively. The Palapa-D satelliteprovides C-band coverage to substantially all of Asia with a footprint stretching from the Arabian Peninsula toJapan and China to New Zealand, including central and eastern parts of Australia. Its dBW levels range from abeam edge of 32 dBW to a beam center of 43 dBW. With this power, the Palapa-D satellite has the capability toprovide uplink and downlink services from any location within the satellite footprint. The five Ku-bandtransponders provide coverage over Indonesia and some of ASEAN Countries with peak transponder power of53 dBW.
The Palapa-C2 satellite has six 36-megahertz extended C-band transponders owned by Pasifik SatelitNusantara, and twenty-four 36-megahertz Standard C-band transponders and four 72-megahertz Ku-bandtransponders owned by us. The maximum power on each of the C-band transponders is 40 dBW. Since the newlocation of Palapa-C2 is close to another satellite with the same Ku-band frequency plan, we, consistent with therules and regulations of the International Telecommunication Union and our license, do not operate Ku-bandtransponders to avoid harmful interference from the other satellite. The Palapa-C2 satellite provides C-bandcoverage to substantially all of Asia, with a footprint stretching from Central Asia to Japan and southern China to
50

New Zealand, including parts of Australia. Its dBW levels range from a beam edge of 32 dBW to a beam centerof 40 dBW. With this power, the Palapa-C2 satellite has the capacity to provide uplink and downlink servicesfrom any location within the satellite footprint.
Fiber Optic and Microwave Terrestrial Links. Our optical fiber backbone based on DWDM technologyconnects all provincial cities in Sumatera, Java, Kalimantan, and part of Sulawesi. The optical fiber backboneconveys cellular traffic within and between the cities at 40-60 gigabits per second and facilitates our progressivegrowth of Internet broadband through 3.5 HSDPA and fixed broadband wireless access. Due to capacity andtechnology considerations, the existing microwave terrestrial system has been shifted to cover remote spur routeareas. As of December 31, 2011, we had fiber optic and microwave terrestrial links to most major cities inSumatra, Java, Kalimantan and Sulawesi. These links are primarily used to deliver Internet and other MIDIservices to our corporate customers.
In December 2010, we entered into a purchase order with Alcatel Lucent Submarine Networks to upgradethe capacity of existing JAKASUSI submarine cable system, which required us to spend approximatelyUS$ 2.6 million in capital expenditure. The upgraded system increased inter-island capacity from/to BanyuUrip—Katesung (120 Gbps) and Takesung—Aeng Batu Batu (90 Gbps). The upgraded system was ready forservice in July 2011.
In December 2010, we entered into a purchase order with IFactor Sdn Bhd, Malaysia to construct theJAVALI submarine cable system, a new submarine cable system which links Java (East Java) island and Baliisland and provide high capacity bandwidth, and which involved a total project cost of US$10.8 million. TheJAVALI submarine cable system is wholly-owned by us and is designed with 24 optical fiber cores (unrepeatedsystem). The system is initially equipped with 50 gigabits per second capacity with its ultimate capacity at160 gigabits per second capacity per fiber pairs. The construction of this new cable system was completed inDecember 2011.
IP/MPLS Backbone and Metro Ethernet Network. As of December 31, 2011, we had completed our MetroEthernet Network deployment project in more than 520 points of presence in Indonesia with fiber opticconnectivity. Through this network, we provide virtual leased lines offering point-to-point Ethernet access,virtual private LAN service offering multipoint-to-multipoint Ethernet access and virtual private routed networksoffering locally linked IP VPN and Internet. We also use our Metro Ethernet Network for backhauling our 2Gand 3G cellular traffic. Dual redundant routers for IP-MPLS backbone have also been deployed in 40 cities andare connected through our fiber optic backbone. A Metro Ethernet network has also been deployed in 44 majorIndonesian cities to provide broadband access to the corporate market in high-rise buildings and cellularbackhaul for 3.5 HSDPA service. Internet access, broadcasting service and data center connectivity are amongthe services used by our customers.
As the technology moves towards “all IP” and the demand of IP-based services is increasing due to itsadvantages over legacy networks, we aim to deploy a future network to allow IP-based services to be widelyavailable in the region. In 2008, we completed construction of a Disaster Recovery Center (“DRC”) in Jatiluhurfor corporate customers to allow them to have a data back-up center to secure and protect their businessinformation and in 2011 we upgraded this DRC to include “meet-me-room” facilities. Also, in 2011 wecompleted construction of a data center in Jakarta to provide the basic infrastructure for our cloud computingservice.
51

Organizational Structure
The following chart illustrates our simplified corporate structure as of December 31, 2011, including ourdirect and indirect equity ownership in major subsidiaries, together with the jurisdiction of incorporation ororganization of each entity. A complete list of our significant subsidiaries and investments in associatedcompanies, and our ownership percentage of each entity, as of December 31, 2011 is contained in Note 1b to ourconsolidated financial statements included elsewhere in this annual report.
72.36% 99.85% 100.00% 72.54%
55.00%
70.00%
99.98%
100.00%
100.00% 100.00% 100.00%
PT Indosat Tbk (Indonesia)
PT Aplikanusa Lintasarta
(Indonesia)
PT Indosat Mega Media
(Indonesia)
Indosat Singapore Pte Ltd
(Singapore)
PT Starone Mitra Telekomunikasi
(Indonesia)
PT Artajasa Pembayaran Elektronis (Indonesia)
PT Lintas Media Danawa
(Indonesia)
Indosat International Finance Company B.V.
(Netherlands)
Indosat Finance Company B.V. (Netherlands)
Indosat Palapa Company B.V. (Netherlands)
Indosat Mentari Company B.V. (Netherlands)
PT Interactive Vision Media
(Indonesia)
PT Aplikanusa Lintasarta was established in 1988. Pursuant to its articles of association, Lintasarta engagesin the business of providing system data telecommunication and information technology services and networkapplication services, which include providing physical infrastructure and software application and consultationservices in data communication and information system for banking, finance and other industries.
PT Indosat Mega Media (“IM2”) was established in 1996 to engage in the business of providing Internet andtelevision services.
PT Starone Mitra Telekomunikasi (“SMT”) was established in 2006 to provide telecommunication servicesand develop telecommunication infrastructure, including multimedia.
PT Artajasa Pembayaran Elektronis (“Artajasa”) was established in 2000 to provide general trade andapplication services to industries, particularly the banking industry, information technology consultation services,and telecommunication services.
PT Lintas Media Danawa was established on July 28, 2008 to provide information and communicationservices, such as data center services, e-learning and distant learning for public education services, and contentservices based on Internet Protocol (e.g., IPTV, internet game and internet payment gateway).
PT Interactive Vision Media (“IVM”) was established on April 21, 2009 to engage in the Pay TV business.IM2 made the initial capital injection to IVM in March 2011 amounting to Rp4.99 billion.
52
Insurance
As of December 31, 2011, we carried insurance on our property and equipment (except submarine cablesand land rights), including business interruption insurance. During 2011, we did not have any insurance againstconsequential losses associated with the insured property. We generally do not experience difficulty renewingour insurance policies, and we believe that our insurance is reasonable and consistent with industry standards.
We maintain in-orbit insurance on the Palapa-C2 and Palapa-D satellites on terms and conditions consistentwith industry practice. As of December 31, 2011, we had an insurance policy coverage with a total coverage limitof US$153.0 million, for total and partial loss of our Palapa-C2 and Palapa-D satellite.
Intellectual Property
We have registered trademarks and copyrights for our corporate name, logo and certain services with theMinistry of Law and Human Rights of Indonesia (formerly the Ministry of Justice and Human Rights ofIndonesia). We believe that our trademarks are important to our success. We have never had to defend any of ourtrademarks, but we would vigorously do so if necessary.
Properties
Except for ownership rights granted to individuals in Indonesia, the title to land rests with the IndonesianState under the Basic Agrarian Law No. 5/1960. Land use is accomplished through land rights whereby theholder of the land right enjoys the full use of the land for a stated period of time, subject to renewal andextensions. In most instances, the land rights are freely tradable and may be pledged as security under loanagreements. Our most important properties are located in Jakarta (approximately 12,050 sq.m. used forinternational gateways and head office), Ancol (approximately 11,809 sq.m. used as a cable station and switchingcenter), Tanjung Pakis, Karawang (approximately 1,850 sq.m. used as a cable station), Daan Mogot(approximately 134,925 sq.m. used as a satellite earth station complex), Jatiluhur (approximately 135,800 sq.m.used as a satellite earth station complex), Medan (approximately 9,780 sq.m. used for international gateways),Pantai Cermin (approximately 48,567 sq.m. used as an earth station and a cable station), Batam Sekupang(approximately 19,989 sq.m. used for international gateways and an earth station), Tanjung Bemban(approximately 3,500 sq.m. used as a cable station), Surabaya (approximately 10,565 sq.m. used as a regionaloffice) and Banyu Urip-Gresik (approximately 130,234 sq.m. used as an earth station, for international gatewaysand as a cable station), Takisung—Banjarmasin (approximately 12,533 sq.m. used as a cable station), Aeng Batu-batu-Makasar (approximately 2,000 sq.m. used as a cable station) and Sei Kakap Pontianak (approximately 5,394sq.m. used as a cable station). Except for our property in Daan Mogot, which we lease from Telkom, we holdregistered land rights to some of our properties, the initial periods of which are for approximately 30 years. Weexpect that our land rights will be renewed at nominal costs for the foreseeable future. None of our properties aremortgaged or otherwise encumbered.
Principal Registered Offices
Headquarters: Jl. Medan Merdeka Barat No. 21Jakarta 10110, IndonesiaTel: (62-21) 3044 2615Fax: (62-21) 3000 3754, 3000 3757
Jabotabek & West Java Region Office Jl. Medan Merdeka Selatan No. 17Jakarta 10110, IndonesiaTel: (62-21) 3000 7001Fax: (62-21) 3000 5702
53

Jakarta Area Office Jl. Medan Merdeka Selatan No. 17Jakarta 10110, IndonesiaTel: (62-21) 3000 7001Fax: (62-21) 3000 5702
Bogor Tangerang Bekasi Area Office Jl. Veteran No. 40Bekasi selatan 17141, IndonesiaTel: (62-21) 3017 7075, 3017 7076Fax: (62-21) 3000 0811
West Java Area Office Jl. Asia Afrika No. 141-147Bandung 40112, IndonesiaTel: (62-22) 3000 0900Fax: (62-22)3000 5702
Sumatera Region Office Komplek Nagoya Gateway Blok E No. 1Jl. Raden Patah - BaloiBatam , IndonesiaTel: (62-778) 6000 815Fax: (62-778) 6000 855
Northern Sumatera Area Office Jl. Perintis Kemerdekaan No. 39Medan 20236, IndonesiaTel: (62-61) 4567 001Fax: (62-61) 4531 031
Southern Sumatera Area Office J1. Angkatan 45 No. 222Palembang 30137, IndonesiaTel: (62-711) 605 9999Fax: (62-711) 605 9966, 605 9977
Central Java, East Java & Bali Nusra Region Office Jl. Kayoon No. 72Surabaya 60271, IndonesiaTel: (62-31) 6000 6001Fax: (62-31) 5456 001, 5464 392
Central Java Area Office Jl. Pandanaran No. 131Semarang 50243, IndonesiaTel: (62-24) 3300 2000Fax: (62-24) 3300 1001
East Java Area Office Jl. Kayoon No. 72Surabaya 60271, IndonesiaTel: (62-31) 6000 6001Fax: (62-31) 5456 001, 5464 392
Bali Nusra Area Office Jl. Raya Bay Pass Ngurah Rai No. 88Kuta Bali 80361, Bali, IndonesiaTel: (62-361) 300 5000Fax: (62-361) 300 5005
Kalimantan & Sulampapua Region Office Jl. MT Haryono No. 69Balikpapan 76114, IndonesiaTel: (62-542) 741 001, 3030 001Fax: (62-542) 7514 001, 7206 750
54

Kalimantan Area Office Jl. MT Haryono No. 69Balikpapan 76114, IndonesiaTel: (62-542) 741 001, 3030 001Fax: (62-542) 7514 001, 7206 750
Sulampapua Area Office Jl. Slamet Riyadi No. 4Makassar 90111, IndonesiaTel: (62-411) 326 808Fax: (62-411) 326 828
Indonesian Telecommunications Industry
Background
Since 1961, telecommunications services in Indonesia have been provided by a succession of state-ownedcompanies. As in other developing economies, the expansion and modernization of telecommunicationsinfrastructure is instrumental to Indonesia’s general economic development. In addition, Indonesia’s largepopulation and economic growth have led to increased demand for telecommunications services.
Indonesia had an estimated population of approximately 237.64 million people as of 2010, ranking it thefourth most-populated country in the world based on International Monetary Fund (“IMF”) estimates.Indonesia’s gross domestic product, or GDP, has grown significantly from US$285.9 billion in 2005 toUS$706.7 billion in 2010 in current U.S. dollars according to the IMF, which represents a growth rate of 19.85%.This growth rate compares favorably against the approximately 12.58% and approximately 11.51% GDP growthexperienced by Thailand and Malaysia, respectively, estimated by the IMF, during the same period.
The Government, through the MOCIT, has extensive regulatory authority and supervisory control over thetelecommunications sector. While the Government has historically maintained a monopoly overtelecommunications services in Indonesia, recent reforms, the majority of which came into effect onSeptember 8, 2000, have attempted to create a regulatory framework to promote competition and accelerateinfrastructure investment in telecommunications facilities.
In Indonesia, fixed-line services are mostly provided by Telkom, a majority state-owned company, whichowns and operates the country’s primary PSTN and fixed wireless access points. Before the implementation ofthe new interconnection regime, telecommunications operators interconnected with Telkom’s network to accessall fixed-line and cellular users. Telkom’s local fixed-line monopoly ceased on August 1, 2002, and we havesince commenced our build-out of a separate fixed-line network. According to the new interconnection regime,telecommunications operators may enter into bilateral agreements which enable them to interconnect directlywith other telecommunications operators.
55

Although cellular penetration is relatively low compared to its regional peers, based on InternationalTelecommunications Union estimates, Indonesia’s cellular penetration rates have increased from approximately41.39% in 2007 to approximately 92.58% in 2010, a compound annual growth rate of 30.78%. Indonesia’s GDPgrowth profile and relatively low penetration rates suggest the potential for increased cellular customer demandin Indonesia. Moreover, in 2010, the number of fixed lines, including fixed wireless access, was approximately38 million, representing a fixed-line penetration of 15.97 %, among the lowest in the region and a result ofstagnant fixed-line growth under previous regulatory systems. The table below summarizes certain informationregarding Indonesian and regional cellular and fixed-line penetration in 2010:
For the year ended December 31, 2010
Population(1)Fixed-line
penetration(2)Cellular
penetration(2)(3)GDP
per capita
(millions) (US$)(1)
Hong Kong . . . . . . . . . . . . . . . . . . . . . . . . . . . . . . . . . . . . . . 7.12 61.24% 139.68% 31,514Singapore . . . . . . . . . . . . . . . . . . . . . . . . . . . . . . . . . . . . . . . . 5.17 38.65% 142.97% 43,117South Korea . . . . . . . . . . . . . . . . . . . . . . . . . . . . . . . . . . . . . . 48.88 58.40% 103.87% 20,756Malaysia . . . . . . . . . . . . . . . . . . . . . . . . . . . . . . . . . . . . . . . . 28.25 16.19% 119.85% 8,423Thailand . . . . . . . . . . . . . . . . . . . . . . . . . . . . . . . . . . . . . . . . . 63.88 10.84% 112.13% 4,992Philippines . . . . . . . . . . . . . . . . . . . . . . . . . . . . . . . . . . . . . . . 94.01 7.22% 84.98% 2,123China . . . . . . . . . . . . . . . . . . . . . . . . . . . . . . . . . . . . . . . . . . . 1,341.41 21.95% 64.04% 4,382India . . . . . . . . . . . . . . . . . . . . . . . . . . . . . . . . . . . . . . . . . . . . 1,190.52 2.95% 63.18% 1,371Indonesia . . . . . . . . . . . . . . . . . . . . . . . . . . . . . . . . . . . . . . . . 237.64 15.97% 92.58% 2,974
(1) Source: IMF World Economic Outlook Databases.(2) International Telecommunications Union (ITU) World Telecommunication / ICT Indicators Database.(3) Cellular penetration is the number of cellular subscribers as a percentage of the population.
Cellular Services Market
The telecommunications industry in Indonesia has experienced significant growth in cellulartelecommunications services in recent years. Based on International Telecommunications Union estimates, thetotal number of cellular subscribers in Indonesia increased from approximately 93.39 million as ofDecember 31, 2008 to approximately 220 million as of December 31, 2010, representing an increase in cellularpenetration from approximately 41.39% to approximately 92.58%.
The following table contains information relating to the cellular telecommunications industry in Indonesiaas of and for the periods indicated:
As of December 31,
2007 2008 2009 2010
CompoundAnnual GrowthRate 2007 –2010
(in millions, except percentages)
Indonesian population(1) . . . . . . . . . . . . . . . . . . . . . . . . . . . 225.64 228.52 231.37 237.64 1.74%Cellular subscribers(2) . . . . . . . . . . . . . . . . . . . . . . . . . . . . 93.39 140.58 159.25 220.00 33.06%Cellular penetration(2) (3) . . . . . . . . . . . . . . . . . . . . . . . . . . . 41.39% 61.52% 68.83% 92.58% 30.78%
(1) Source: IMF World Economic Outlook Database.(2) Source: ITU World Telecommunication / ITU Indicatory Database.(3) Cellular penetration is the number of cellular subscribers as a percentage of the Indonesian population.
The wireless market in Indonesia is currently dominated by three major GSM operators: Telkomsel, us andXL. Starting in 2002, the Government issued new cellular licenses for using CDMA technology to Mobile-8 andfixed wireless access services licenses using CDMA technology to Telkom, Indosat, and Bakrie Telecom. As of
56

December 31, 2011, these nationwide GSM operators collectively held an approximately 87% share of theIndonesian wireless market based upon our estimates and the public statements of such companies. As ofDecember 31, 2011, Telkomsel was the largest national licensed cellular services provider in Indonesia, withapproximately 107.0 million cellular subscribers and approximately a 52.2% share of the total GSM market shareheld by the three major GSM operators. We were the second largest cellular provider with approximately51.7 million cellular subscribers and approximately 25.2% share of the total GSM market share held by the threemajor GSM operators as of the same date. XL, the third-largest provider, had approximately 46.4 million cellularsubscribers and an approximately 22.6% share of the total GSM market share held by the three major GSMoperators as of the same date. Fixed wireless access service is dominated by Telkom under their Flexi brand andBakrie Telecom under their Esia brand with 14.2 million subscribers and 14.6 million subscribers, respectively,as of the same date. There are other players in Indonesian wireless market, such as HCPT, NTS, Smartfren andSTI. Our fixed wireless access is 0.2 million subscribers under the brand StarOne. In part, wireless subscribergrowth in Indonesia has been driven by the “calling party pays” system, the launch of prepaid service, as well asthe introduction of SMS. The calling party pays system requires the originators of telephone calls to pay for calls.Based on international experience, countries that implement a calling party pays system typically experiencehigher wireless penetration rates because wireless subscribers are more likely to give out their telephone numbersand keep their handsets switched on.
Since its introduction in 1998, prepaid service has been popular in Indonesia, as in other Asian countries,because it permits customers to register for wireless service without undergoing a credit review. Prepaid servicealso gives customers more control over monthly expenditures. SMS has proven to be popular in Indonesia,particularly on the prepaid platform, as it provides a convenient and cost-efficient alternative to voice and e-mailcommunications. Competition in the Indonesian wireless services industry is based primarily on service quality,pricing, availability of data services and value-added features such as voice mail and text messaging.
International Long-Distance Market
International long-distance providers in Indonesia generate revenues from both inbound and outboundinternational long-distance traffic. The three international long-distance service providers are Telkom, whichoffers its “007” service, Bakrietel with its “009” IDD access code and us with our “001” and “008” access codes.Outgoing tariffs are based on rates set by the MOCIT while incoming tariffs are settled at the applicableaccounting rates. Outgoing traffic is generated by fixed-line and mobile subscribers and delivered to the threeinternational service providers directly through international gateways or indirectly through Telkom’s PSTN.Incoming international traffic is received at international gateways and either routed directly to its intendeddestination from the gateways or indirectly through Telkom’s PSTN network through which it is ultimatelyswitched to its intended destination.
In Indonesia, as in many emerging market countries, inbound communications traffic has exceededoutbound traffic as more developed countries generate a disproportionate amount of international long-distancetraffic.
Historically, inter-operator traffic has been settled based on a concept of accounting rates which provide acommon method of compensating the originating and terminating carrier. In general, international long-distancecarriers negotiate per minute accounting rates on a route-by-route basis with a single rate used by all carriers onthat route. During 2003, we began to replace the accounting rate system with a market termination rate-basedpricing system with several of our largest foreign telecommunications counterparts, pursuant to which we agreedon asymmetric rates for incoming and outgoing calls. Under the market termination rate-based system, we areable to reduce the rates we pay for outgoing calls to most international destinations by a greater amount than thereduction in prices for calls from such destinations to Indonesia. While this pricing has reduced the prices wereceive for incoming calls, we believe that, overall, it will improve our margins on international long-distanceservices, in particular for outgoing calls.
57

Competition from VoIP providers offering services, including budget calls such as “01017” provided byTelkom and “FlatCall 01016” provided by us, and prepaid calling cards has adversely affected and is expected tocontinue to adversely impact revenues from traditional international long-distance calling services.
As the data communications infrastructure expands in Indonesia, demand for VoIP services may increase.VoIP uses data communications connections to transfer voice traffic over the Internet, which usually providessubstantial cost savings to subscribers.
Although the Government has implemented a licensing system to limit the number of VoIP operators inIndonesia, the Government does not presently control the rates charged to end users of VoIP services. However,the Government has indicated that it intends to regulate such rates in the future, and it is expected that suchregulations would limit VoIP tariffs to amounts that represent a maximum discount of approximately 40.0% fromthe then-current PSTN tariffs.
Data Communications Market
Historically, data services in Indonesia primarily consisted of narrow bandwidth leased line services, x.25service, digital data network service and integrated service digital network service. Digital data network servicesare digital leased line services for data transmission. Integrated service digital network is a protocol which offershigh capacity dial-in access for public networks. This protocol allows simultaneous handling of digitized voiceand data traffic on the same digital links via integrated switches across the public network. x.25 is an openstandard packet switching protocol that allows low- to medium-speed terminals to have either dial-in orpermanent access to a network from a user’s premises and operate on a network. Charges for these services havebeen declining in recent years.
The rise of the Internet and the wider adoption of multimedia applications are expected to increase demandfor sophisticated broadband data services. Operators in Indonesia are deploying advanced broadband networks toprovide high-end data services such as frame relay, asynchronous transfer mode and Internet protocol service. Inparticular, virtual private network services, utilizing ATM and Internet protocol technologies, may capture alarger portion of the market share as they provide a reliable and cost-effective alternative to private networks thatrely on dedicated leased lines.
Satellite Services Market
In recent years, competition in the Asia-Pacific satellite market has been intense. Companies in this businesscompete primarily on coverage power, product offerings and price. On September 6, 2005 throughMD No.13/2005, the Government issued regulations requiring all telecommunications operators using satellitesin connection with the provision of telecommunications services to possess both earth station and space stationoperating licenses. These operating licenses will be granted only to telecommunications operators with a landingright and on the condition that the radio frequency spectrum used does not cause harmful interference to existingoperators. Foreign satellites are allowed to operate in Indonesia if Indonesian telecommunications operators havereciprocal operating rights in such satellite’s country of origin.
Industry Trends
We believe that the trends driving the telecommunications industry in Indonesia include:
Wireless Services
• Continued growth in wireless telecommunications. We expect that the wireless telecommunicationsindustry and demand for wireless telecommunications services will continue to grow at a steady rate ofaround 9% as Indonesia develops and modernizes. A significant amount of this growth will still comefrom the “traditional core” markets.
58

• In addition to the growth in core markets, there are sizable emerging segments of strong growth,primarily in consumer broadband and mobile towers.
• It took a century to connect one billion places with phone lines but less than 30 years to connect fivebillion people with mobiles, and it is expected that up to 90 billion objects will be connected in the next20 years or less. This is an easy way to compare the penetration between wireless and wireline.
• Significant growth in wireless penetration rates in regions outside Java. The relatively low wirelesspenetration rates in regions outside Java offer growth potential for wireless services providers inIndonesia as the population residing outside Java becomes more affluent.
• Growing use of value-added services. The growth in usage for value-added services such as SMS,content, and Internet access is expected to increase in coming years, thereby helping to stabilize thedecrease in usage rates and ARPU for voice services.
• Today, there are multiple mobile operators and many companies are aggressively pushing forsubscribers and traffic to quickly gain scale and earn market share. We expect consolidation tocontinue, especially beyond the three large players (Telkomsel, Indosat, XL). One of the major threatsto the market is further price deterioration. Service offering and innovation will become the majordriver in the competition.
International Long-Distance Services
• Increased competition in international long-distance services. We expect further governmentalderegulation and service quality improvements for VoIP services to increase competition forinternational long-distance services.
• Moderate growth in call volumes. We believe continued domestic economic growth and increase incellular voice usage will stimulate incremental volume growth for international long-distance services.In addition, the growth of VoIP services is also expected to increase demand for international long-distance services.
MIDI Services
• Increasing demand for advanced data communication services. We believe increasing Internet usageand the broadening market for multimedia applications will boost demand for sophisticated datacommunication services.
• Intensified competition in the ISP market. As a result of market liberalization and the continuedissuance of new licenses, we anticipate competition in the ISP market will increase. We believecompetition will be based primarily on price, quality of service and network coverage.
• Increasing demand for broadband services for both fixed and wireless. We believe the expectedincrease in customer preference and demand for high-speed Internet access will stimulate growth ofdomestic broadband service.
Regulation of the Indonesian Telecommunications Industry
The Government of the Republic of Indonesia, through the MOCIT, exercises both policy making andregulatory authority and is responsible for the implementation of policies that govern the telecommunicationsindustry in Indonesia. The legal framework for the telecommunications industry is based on specific laws as wellas government, ministerial and directorate general regulations that are promulgated from time to time. Prior toMarch 1998, the Ministry of Tourism, Post and Telecommunications regulated the telecommunications industryin Indonesia. Following the 1999 general elections and a change of government in 2001, the Ministry ofCommunication assumed responsibility for regulating the telecommunications industry. In February 2005, theauthority to regulate the telecommunications industry was transferred from the Ministry of Communication to theMOCIT.
59
Through the MOCIT, the Government regulates telecommunications network operations and the provisionof telecommunications services. In addition, the MOCIT regulates the radio frequency spectrum allocation for alltelecommunications operators, each of whom must be licensed by the DGPT in order to utilize the radiofrequency spectrum. In addition to radio frequency spectrum fees, the Government requires alltelecommunications operators to pay a concession license fee equal to 0.5% of gross revenues, lessinterconnection expenses and provisions for bad debt, for each fiscal year, payable in equal quarterlyinstallments.
The Government’s telecommunications reform policy is set out in its “Blueprint of the IndonesianGovernment’s Policy on Telecommunications” dated September 17, 1999. The policies, as stated in the blueprint,are to:
• increase the telecommunications sector’s performance;
• liberalize the telecommunications sector with a competitive structure by removing monopolisticcontrols;
• increase transparency and predictability of the regulatory framework;
• create opportunities for national telecommunications operators to form strategic alliances with foreignpartners; and
• create business opportunities for small-and medium-size enterprises and facilitate new jobopportunities.
The recent regulatory reforms of the Indonesian telecommunications sector have their foundation in theTelecommunications Law.
The Telecommunications Law
The Telecommunications Law became effective on September 8, 2000 and provides key guidelines forindustry reforms, including industry liberalization, facilitation of new entrants and enhanced competition. TheGovernment implements such guidelines through Government regulations, ministerial decrees or regulations andother directives by Government bodies. The Telecommunications Law grants the Government, through theMinistry of Communication, the power to make policies, and to regulate, supervise and control thetelecommunications industry. Until 2005, the Ministry of Communication, the former regulatory body of thetelecommunications industry, had authority over the telecommunications sector in Indonesia and could issueregulations, policies and licenses, and formulate tariffs.
Government Regulation No. 52/2000 on Telecommunications Operations (the “TelecommunicationsOperations Regulation”) and Government Regulation No. 53/2000 on Radio Frequency Spectrum and SatelliteOrbits, were the initial implementing regulations of the Telecommunications Law. The Ministry ofCommunication also promulgated various decrees, including (i) Ministry of Communication DecreeNo. KM 20 Year 2001, which was revoked by MOCIT Decree No. 01/PER/M.KOMINFO/01/2010 onTelecommunications Network Operation (the “Telecommunications Network Regulation”), (ii) Ministry ofCommunication Decree No. KM 21 Year 2001, which was amended by MOCIT Decree No. 31/PER/M.KOMINFO/09/2008 on Telecommunications Services Operation (the “Telecommunications ServicesRegulation”), and (iii) Ministry of Communication Decree No. KM 31 TAHUN 2003, which was revoked byMOCIT Decree No. 36/PER/M.KOMINFO/2008 and most recently amended by MOCIT Decree No. 01/PER/M.KOMINFO/02/2011 on the Establishment of an Indonesian Telecommunications Regulatory Body (the“Telecommunications Regulatory Body Regulation”).
Under MOCIT Regulation No. 17/PER/M.KOMINFO/11/2010 on Organization and Administration of theMinistry of Communications and Information, the duties and responsibilities of the DGPT were divided andassigned to the Directorate General of Post and Informatics Management and the Directorate General of Post andInformatics Resources and Facilities.
60

On July 11, 2003, the Ministry of Communication promulgated the Telecommunications Regulatory BodyRegulation, pursuant to which it delegated its authority to regulate, supervise and control the Indonesiantelecommunications sector to the ITRA, while maintaining the authority to formulate policies for the industry.The ITRA, consists of nine members, including a chairman position held by the Directorate General of Post andInformatics Management and a vice chairman position held by the Directorate General of Post and InformaticsResources and Facilities. Members of the Telecommunications Regulatory Committee are appointed by theMOCIT. All members of the Telecommunications Regulatory Committee must: (i) be Indonesian citizens;(ii) have professional expertise in telecommunications, information technology, economics, law or any socialscience; (iii) not have any interests in any of the telecommunications operators; and (iv) not serve as a director,commissioner or employee of any of the telecommunications operators.
Ministry of Communications Decree No. KM 67 of 2003 governs the relationship between the Ministry ofCommunications (and subsequently, MOCIT) and the ITRA. As part of its regulatory function, the ITRA isauthorized to (i) carry out licensing for telecommunications networks and services in accordance with theMOCIT’s policies and (ii) propose to the MOCIT operational performance, service quality, interconnectioncharges and equipment standards for telecommunications networks and services. The ITRA is authorized tomonitor and required to report to the MOCIT on (i) the implementation of such operation performance standards;(ii) competition among network and service operators; and (iii) compliance with the standards of utilization oftelecommunication equipment. As part of its controlling function, the ITRA is also required to report to theMOCIT regarding (i) progress of any dispute resolution among network and service operators; (ii) the control ofthe use of telecommunications equipment and (iii) the implementation of service quality standards.
Classification of Telecommunications Providers
The Telecommunications Law classifies telecommunications providers into (i) network operators,(ii) services providers and (iii) special providers. Network operators are further classified as (i) fixedtelecommunications network operators and (ii) mobile telecommunications network operators. Under theTelecommunications Law, licenses are required for each category of telecommunications operators. Atelecommunications network operator is licensed to own and/or operate a telecommunications network. Bycontrast, a telecommunications service provider license allows a service provider to provide services, but doesnot require such provider to own a network. Special telecommunications licenses are required for providers ofprivate telecommunications services or for purposes relating to broadcasting and national security interests. TheTelecommunications Network Regulation provides that telecommunications network operating licenses must beissued by the MOCIT. The Telecommunications Services Regulation differentiates the basic telephony serviceoperating license to be issued by the MOCIT from the other value-added telephony and some multimedia serviceoperating licenses issued by the DGPT.
Termination of Exclusivity Rights
In 1995, Telkom was granted a monopoly to provide local fixed-line telecommunications services untilDecember 31, 2010, and DLD services until December 31, 2005. Indosat and Satelindo (which has subsequentlymerged with Indosat) were granted a duopoly for provision of basic international telecommunications servicesuntil 2004.
As a consequence of the Telecommunications Law and MOCIT Decree No. 21 (2001), the Governmentterminated the exclusive rights of Telkom and the duopoly rights of Indosat and Satelindo. The Governmentinstead adopted a duopoly policy with Telkom and us competing as full network and service providers.
The market for provision of IDD services was liberalized in August 2003 with the termination of Indosat’sand Satelindo’s exclusive rights. We began operating fixed line services in 2002 and fixed wireless access andDLD services in 2003 after receiving our DLD services license. Telkom subsequently received an IDD serviceslicense and began offering IDD services under the international access code “007” in 2004 in direct competitionwith us.
61
In an attempt to liberalize DLD services, the Government issued regulations requiring each provider of DLDservices to implement a three-digit access code to be dialed by customers making DLD calls. On April 1, 2005,the MOCIT announced that three-digit access codes for DLD calls will be implemented gradually within fiveyears of such date and that it would assign us the “011” DLD access code for five major cities, including Jakarta,and allow us to progressively expand to all other area codes within five years. Telkom was assigned “017” as itsDLD access code. On December 3, 2007, MOCIT promulgated regulation No. 43/P/M.KOMINFO/12/2007,amended subsequently, which delayed the implementation of the DLD access code until April 3, 2008 and alsoset forth a schedule on implementing “01X” long distance access. In January 2007, the Government implementednew interconnection regulations and a five-digit access code system for VoIP services. In April 2008, theseaccess codes were implemented in Balikpapan. Balikpapan residents are able to choose from options “0”,“01016” or “01017” to connect their long distance calls. Whether the DLD access code will be implemented inother cities will be based on a study by the Indonesian Telecommunication Regulatory Board of Indosat andTelkom’s fixed phone service customers.
Tariff for Fixed and Cellular Services
The MOCIT is responsible for setting and adjusting tariff formulas. In 2006, the MOCIT promulgated anumber of ministerial decrees/regulations, such as (i) No. 8/Per/M.Kominfo/02/2006 on cost-basedinterconnection, (ii) No. 2/ PER/M.KOMINFO/1/2006, No. 4/Per/M.Kominfo/1/2006, No. 7/PER/M.Kominfo/2/2006, and No. 19/PER/M.Kominfo/3/2006 on 3G Service Provision, (iii) No. 5/Per/M.Kominfo/1/2006 onTelecommunication Kiosk, (iv) No. 09/PER/M.Kominfo/02/2006, which was replaced by No. 15/Per/M.Kominfo/4/2008 on Fixed Telecommunications Tariff, (v) No. 11/Per/M.Kominfo/02/2006 on LawfulInterception, (vi) No. 12 Per/M.Kominfo/02/2006, which was replaced by MOCIT Regulation No. 09/PER/M.Kominfo/09/2008 on Cellular Tariffs, and (vii) MOCIT Decision No. 102/ Kep/M.Kominfo/10/2006 onIndosat 2G and 3G Cellular Network License, as amended by MOCIT Decision No. 252/Kep/M.Kominfo/07/2011, MOCIT Decree No. 181/2006 on Migration of fixed wireless access Network to 800MHz AllocatedFrequency and MOCIT Decree No. 09/Per/M.Kominfo/06/2010. In 2007, the MOCIT promulgated newministerial decrees, including No. 162/2007 on the 800 MHz radio frequency channel allocation for operatingFWA-CDMA and cellular networks (amendment of MOCIT decree No. 181/2006), MOCIT RegulationNo. 05/PER/M.Kominfo/2/2007 on Guidance For Tariff Implementation on USO Contributions, No. 03/PER/M.KOMINFO/1/2007 on Leased Circuits, No. 11/Per/M.Kominfo/4/2007 (now No. 38/2007) on theimplementation of infrastructure development using USO funds and MOCIT Regulation No. 43/P/M.Kominfo/12/2007 on changes to all four FTPs (Fundamental Technical Plans)—2000, which delayed the date ofimplementation of the long distance access code in Balikpapan to April 3, 2008. In April 2008, the MOCITpromulgated ministerial regulation No. 9/PER/M.Kominfo/04/2008 on tariff determination for cellular services,which determines the type and structure of cellular retail tariffs based on a formula, and No. 15/Per/M.Kominfo/04/2008 on tariff determination for basic telephony services through fixed networks. The tariff covers basictelephony, roaming and multimedia services. The tariff for basic telephony services includes activation fees,monthly fees, usage fees and value-added service fees. Ceiling tariffs for retail cellular services differ betweenoperators due to the use of different calculation methods. Based on the new regulation, the tariff value of basictelephony services through fixed networks and SMS as an additional facility must be calculated by the operatorusing a cost-based formula with the calculation results stated as ceiling tariffs. The Government is expected tochange the fixed telecommunications tariff formulations in the near future. The Government regulates the tariffformulations for Leased Circuit businesses through MOCIT Regulation No. 03/PER/M.Kominfo/1/2007.
Consumer Protection
Under the Telecommunications Law, each operator must meet certain service levels. In the event of lossescaused by a telecommunication operator’s fault or negligence, the aggrieved party may file claims for damagesagainst the telecommunications operator.
62
MOCIT Regulations on service level standards can be found in: (i) MOCIT Regulation No. 11/Per/M.Kominfo/09/2008 dated April 21, 2008 on the Service Level for Basic Telephony Service in Local FixedNetwork, (ii) MOCIT Regulation No. 12/Per/M.Kominfo/09/2008 dated April 21, 2008 on the Service Level forBasic Telephony Service in the Cellular Mobile Network, and (iii) MOCIT Regulation No. 13/Per/M.Kominfo/4/2008 on the Service Level for Basic Telephony Service in Fixed Networks with Limited Mobility.
Public Telephone
Based on MOCIT Regulation No. 01/PER/M.KOMINFO/01/2010 on Telecommunication NetworkOperation, we have an obligation to provide public telephone lines consisting of 3.0% of the installed networkcapacity for fixed telecommunications networks that we build.
Universal Service Obligations
Under the Telecommunications Law, all telecommunications network and service operators are bound byUniversal Service Obligations (“USO”), which require participation by all operators in the provision oftelecommunications facilities and infrastructure in MOCIT USO-designated areas. The USO is a measureintended to provide telecommunication access and/or services to areas that previously lacked access or service.
Through Government Regulation No. 28/2005 and MOCIT Regulation No. 15 PER/M.KOMINFO/9/2005,the Government announced regulations establishing the mechanism for USO payments and changing the USOtariff from Rp750 for each successful international outgoing or incoming call to 0.75% of an amount equal togross revenues less interconnection expenses paid to other telecommunication carriers and bad debts. ByGovernment Regulation No. 7/2009, the Government increased this USO tariff from 0.75% to 1.25%.
In March 2004, the MOCIT promulgated Decree No. KM 34 year 2004, which included specifications forUSO implementation program zones, technical requirements, operation, financing and monitoring (“KM34/2004”). KM 34/2004 has been replaced with MOCIT Regulation No. 11/Per/M.Kominfo/4/2007, which, inturn, has been amended by MOCIT Regulation No. 38/Per/M.Kominfo/09/2007, which regulates the procedurefor utilizing USO funds to develop network and telecommunication services in areas with no telecommunicationnetwork. In 2008, the Government promulgated MOCIT Regulation No. 32/Per/M.Kominfo/10/2008 (asamended by MOCIT Regulation No. 03/Per/M.Kominfo/02/2010), which replaced MOCIT RegulationNo. 11/Per/M.Kominfo/4/2007. According to this decree, a telecommunication network provider which has wontender to provide telecommunication services in areas with no telecommunication network (a “USO Zone”) willuse the funds collected through the USO tariff to provide telecommunication access and services, includingtelephony service, SMS and internet access. While providing such telecommunication service in USO Zones, atelecommunications provider has the right to: (i) use technology, (ii) enter into interconnection arrangement withother telecommunication providers, and (iii) use a frequency spectrum of 2.390-2.400 MHz.
Interconnection Arrangements
In accordance with the express prohibitions in the Telecommunications Law on activities that may createmonopolistic practices and unfair business competition, the Telecommunications Law requires network providersto allow users on one network to access users or services on other networks by paying fees agreed upon by eachnetwork operator. The Telecommunications Operations Regulation provides that interconnection chargesbetween two or more network operators shall be transparent, mutually agreed on and fair.
On February 8, 2006, through MOCIT Regulation No. 8/PER/M.KOMINFO/02/2006, the Governmentissued new interconnection provisions setting out a cost-based interconnection regime, which replaced theprevious revenue-sharing interconnection regime. As required under this regulation, the Government set aformula as guidance for calculating the interconnection cost for every operator. The results of the calculation areevaluated and used by the Government as a reference point.
63
Operators must include the result of the government’s formula in all RIO proposals, together with theproposals for call scenarios, traffic routing, point of interconnection, procedure for requesting and providinginterconnection, and other matters. RIO proposals must also disclose the type of interconnection services andtariffs charged for each service offered. Interconnection access providers must implement a queuing system on aFirst-in-First-Serve basis. Additionally, the interconnection mechanism must also be transparent and without anydiscrimination.
Dominant IDD telecommunications operators and non-dominant operators submitted RIOs in September2006. The RIOs of dominant operators were approved by the Government in October 2006 and theimplementation of the new regime began in January 2007 through bilateral agreements among operators. Basedon current regulations, RIOs can be amended every year. On April 11, 2008, the Government approved RIOproposals from dominant operators to replace the previous RIOs.
The Government’s National Fundamental Technical Plan sets out technical requirements for routing plans,numbering, and technical aspects for interconnection of the networks of telecommunications operators, whichallows all network operators to interconnect directly without rather than through the PSTN.
Fee Regime
Under the Telecommunications Law, in conjunction with other regulations, each telecommunicationsoperator is required to pay the Government a license concession fee, a frequency fee and a satellite orbit fee, asapplicable. The concession license fee for each telecommunications operator is approximately 0.5% of grossrevenues, consisting of revenues from leasing of networks, interconnection charges, activation of new customers,usage charges, roaming charges and SIM card charges. In addition to these fees, the Government requires alltelecommunications operators to pay a USO tariff equal to 1.25% of gross revenues less interconnectionexpenses and provisions for bad debt for each fiscal year, payable in equal quarterly installments. The frequencyfee for CDMA 800 MHz, GSM 900 MHz, DCS 1800 MHz and 3G 2100 MHz is based on its bandwidthallocated frequency. In addition, certain users must pre-pay a one-time satellite orbital connection fee while theirsatellites are in operation.
Prepaid Cellular Subscriber Registration
On October 28, 2005, the Government began requiring telecommunications operators to register prepaidcellular subscribers. The regulations specified that such registration process must be completed no later thanApril 28, 2006, which deadline was later extended to September 28, 2006. We instituted procedures in order tocomplete the required registration at the initial point of sale and finalized the mandatory registrations by thedeadline through the cancellation of 1.3 million unregistered accounts. As stated in MOCIT Regulation No. 23//M.KOMINFO/10/2005 on Registration of Telecommunication Service Customers, all operators have an ongoingduty to register their new prepaid cellular subscribers.
Satellite Regulation
The international satellite industry is highly regulated. In addition to domestic licensing and regulation inIndonesia, both the in-orbit placement and operation of our satellites are subject to registration with the RadioRegulation Bureau. Following the World Radiocommunication Conference, which took place from October 22,2007 to November 16, 2007, some of Indonesia’s satellite characteristics at orbital slots 113E.L. and 150.5E.L. havebeen reinstated by the International Telecommunication Union. To facilitate utilization of the 150.5E.L. orbital slot,the DGPT promulgated Decree No. 79/DIRJEN/2009 on March 12, 2009, which created a working group consistingof the DGPT, Telkom and us. In conjunction, on March 16, 2009, the MOCIT issued Letter No. 110/M. Kominfo/03/2009 agreeing to work with us and Telkom to facilitate prompt utilization of the orbital slot.
On December 17, 2011, the MOCIT issued Letter No. 460/M.KOMINFO/12/2011 approving the utilizationof the Indonesian satellite filings for the 150.5E.L. Orbital Slot by Indosat as a closed fixed network provider.
64

Frequency of Fixed Wireless Access-CDMA
Through MOCIT Decree No. 181/2006, as amended, the Government reallocated 800 MHz frequency tofixed wireless access operators as part of a frequency clearance for 3G services (IMT-2000) to Bakrie Telecom,Telkom, Mobile-8, and us. We had previously been granted 5 MHz in uplink and downlink in the followingfrequencies: uplink frequency 1880-1885 MHz and downlink 1960-1965 MHz in Jakarta, Banten and West Javaand uplink and downlink frequency 830-835 MHz and downlink 875-880 MHz in other parts of Indonesia.According to the new regulation, we have been granted 2x1.23 MHz in frequency (uplink 842.055-844.515 MHzand downlink 887.055-889.515 MHz) nationwide. The migration of the frequency was successfully implementedas of December 31, 2007.
Tower Sharing Obligation
On March 17, 2008, the MOCIT issued MOCIT Regulation No. 02/Per/M. Kominfo/3/2008 on theGuidelines on Construction and Utilization of Sharing Telecommunication Towers (“Tower Decree”). Under theTower Decree, the construction of telecommunications towers requires permits from the relevant governmentalinstitution, while the local government determines the placement and location at which telecommunicationstowers can be constructed. In addition, telecommunications providers that own telecommunication towers andtower owners are obligated to allow other telecommunication operators to utilize their telecommunication towers(other than the tower used for its main network), without any discrimination.
Moreover, on March 30, 2009 the Minister of Home Affairs, the Minister of Public Works, the MOCIT andthe Head of the Indonesia Investment Coordinating Board promulgated the Joint Regulation No. 19/Per/M. Kominfo/03/2009 on the Guidelines on Construction and Utilization of Sharing Telecommunication Towers.(the “Joint Regulation”) requires a tower construction permit for every tower built and used fortelecommunications services demonstrating compliance with certain technical specifications. However, throughthe enactment of this Joint Regulation, the Tower Decree prevails as long as any provision contemplated thereinis not contrary with the provisions regulated under the Joint Regulation.
Other than the Joint Regulation and the Tower Decree, several regional authorities have implementedregulations limiting the number and location of telecommunication towers and require operators to share in theutilization of telecommunications towers.
On September 9, 2009, parliament passed Act No. 28 Year 2009 regarding local and regional taxes whichtook effect on January 1, 2010 and which imposes a new kind of tax that may add regulatory costs to theoperation of our towers. The new tax is limited to a maximum of 2% of the tax object’s selling value, whichrefers to the resale value of the tower determined by the relevant tax authorities. The implementation of the newtax will be largely influenced by regional government policies.
Item 5: OPERATING AND FINANCIAL REVIEW AND PROSPECTS
The following discussion should be read in conjunction with our audited consolidated financial statementsand the related notes thereto as of December 31, 2009, 2010 and 2011. The audited consolidated financialstatements have been prepared in accordance with IFRS. Certain amounts (including percentage amounts) havebeen rounded for convenience. This discussion contains forward-looking statements that reflect our currentviews with respect to future events and our future financial performance. These statements involve risks anduncertainties, and our actual results may differ materially from those anticipated in these forward-lookingstatements as a result of particular factors such as those set forth under “Forward-Looking Statements” andItem 3. “Key Information—Risk Factors” and elsewhere in this report.
A. OPERATING RESULTS
We are a fully integrated Indonesian telecommunications network and service provider and provide a fullcomplement of national and international telecommunications services in Indonesia. As of December 31, 2011,
65

we were the second-largest cellular operator in Indonesia in terms of number of cellular subscribers based onavailable market data. We provide MIDI services to Indonesian and regional corporate and retail customers aswell as international long-distance services in Indonesia.
Factors Affecting our Results of Operations and Financial Condition
Our results of operations and financial condition have been affected and will continue to be affected by anumber of factors, including the following:
Cellular Subscriber Base and Usage Patterns
Our number of cellular subscribers and their usage of our cellular services directly affects our cellularoperating revenues as well as our operating expenses, including interconnection expenses and depreciation andamortization expenses. In order to meet increasing demand for our services, we may be required to expand ourcellular network coverage and capacity, which requires additional capital expenditures. Increases in our capitalexpenditures affects our cash flows, interest expense and depreciation expense.
We are the second-largest cellular provider in Indonesia, as measured by the number of cellular subscribers,with 51.7 million subscribers (including wireless broadband subscribers) as of December 31, 2011.
In 2009, we implemented a strategy to minimize lower-value “calling card” type subscribers, whom webelieved were short-term subscribers and were not likely to recharge their SIM cards. We believe this strategycontributed significantly to the decline in our subscriber base of 9.7% in 2009, while our cellular operatingrevenue decreased by only 0.9% during such period. Our total subscribers increased by approximately 34.3%,from 33.0 million in 2009 to 44.3 million in 2010 and approximately 16.8% to 51.7 million in 2011.
Competition
We face intense competition in all of our business segments. Among other things, such competition affectsthe tariffs we are able to charge for our services, demand for and usage of our services and our operating marginsand results of operations.
The cellular services business in Indonesia has become increasingly competitive, as demonstrated by theaggressive subscriber acquisition programs of Indonesian cellular operators in recent years. Competition in thecellular communications industry has historically been based on network coverage, technical quality, price, theavailability of data services and special features, and the quality and responsiveness of customer service.Commencing in 2007, competition became more focused on pricing as many operators, including ourselves,began to offer significant promotional discounts to attract subscribers, which we believe to have resulted in highcustomer churn rates. The high Indonesian customer churn rate can be attributed to the high price sensitivity ofsubscribers, especially prepaid users and the low switching costs for postpaid subscribers, due to limitedcontractual lock-ins. Beginning in late 2009, we believe that the market focus on pricing as the key determinantin customers’ product selection has declined and that subscribers are again focused on the historical drivers ofnetwork coverage, technical quality, price, the availability of data services and special features.
Based on our internal estimates, the three major providers of wireless services in Indonesia, Telkomsel, usand XL, accounted for almost 73.9% of the wireless subscriber base in Indonesia in 2011. We compete withTelkomsel and XL primarily on the basis of network coverage, quality or service and price. We believe that thesize of our subscriber base provides us with a significant competitive advantage over the smaller cellularproviders, since we have a larger base of “on net” subscribers and we are able to provide more attractive pricingfor on net calls, since we do not pay any interconnection charges to third parties.
66

Competition in our MIDI services has also continued to increase. During the last few years, competitionamong data communications service providers has intensified principally due to the issuance of new licensesafter the deregulation of the Indonesian telecommunications industry. In addition, our satellite operations, whichprimarily consist of leasing transponders to broadcasters and telecommunications operators of VSAT, cellularand IDD services and ISPs, face competition from foreign and domestic service providers serving the samecustomer base.
We are no longer the only authorized provider of traditional IDD (i.e., non-VoIP) call services in Indonesia.The Government may issue more licenses for IDD services to other telecommunications operators, which willincrease competition in our fixed telecommunications operations.
We expect competition in our three business segments to continue to be intense. Competition has had, and isexpected to have, an impact on our results of operations and financial condition.
Tariff and Pricing Levels
Under existing regulations, the MOCIT establishes a tariff formula that determines the maximum amountsthat operators may charge for cellular and fixed telecommunications services. However, the MOCIT allowscellular and fixed telecommunications operators, including us, to offer promotional packages that offer priceslower than the ceiling tariff determined by MOCIT in accordance with the tariff formula. We currently price ourcellular services under a variety of ongoing promotional programs intended to attract new subscribers, stimulatedemand and improve our competitive position. Any changes in our pricing structure, either as a result ofGovernment tariff policies or in response to competition, could affect our revenues, operating results andfinancial condition.
For example, on December 12, 2011, the Government, through the ITRA, issued letter No.262/BRTI/XII/2011, under which tariffs for SMS will change from a “sender-keeps all” scheme to a cost-based scheme,effective June 1, 2012. Currently, the tariff for SMS (including SMS and value-added SMS) is based on a“sender-keeps-all” scheme, under which we earn revenues whenever one of our cellular subscribers sends anSMS, but not when a customer of another telecommunications operator sends an SMS to one of our cellularsubscribers. Under the cost-based scheme, we will record revenues from interconnection fees payable by otheroperators whenever one of our cellular subscribers receives an SMS from a subscriber on another network. If oneof our subscribers sends an SMS to a recipient on another network (an “off-network SMS”), we will recordrevenues for the SMS charge payable by our subscriber and we will record expenses for interconnection chargespayable to the operator of the other network.
We expect to recoup any interconnection charges we incur when one of our subscribers sends anoff-network SMS through charging higher fees to such subscribers for sending off-network SMSs, whilemaintaining our current pricing practices with respect to SMSs that terminate on our network. We anticipate thatthe increase in off-network SMS fees we charge our subscribers may cause a shift in SMS traffic fromoff-network traffic to on-network traffic, which in turn will reduce the amount of interconnection charges we willincur. We cannot assure you that we will be able to fully recoup all interconnection charges we may be requiredto pay, or that the revenue recorded from interconnection fees we receive from other operators will fully offsetthe any interconnection charges we may be required to pay, and as a result, we could experience a decrease in ouroperating revenues from cellular services.
The Indonesian Economy
We believe that the growth in the Indonesian telecommunications industry has been driven in part by recentgrowth of the Indonesian economy, and that demand for such services should continue, as the Indonesianeconomy continues to develop and modernize. Our performance and the quality and growth of our customer baseand service offerings are necessarily dependent on the health of the overall Indonesian economy.
67

Tower Sale Transaction
On February 7, 2012, we signed transaction documents with Tower Bersama for the sale and leaseback of2,500 towers, approximately 25% of our existing tower assets, for a total potential consideration of US$518.5million, comprising upfront consideration of US$406.0 million worth of cash and newly issued TBIG shares anda maximum potential deferred payment of US$112.5 million. Under the terms of the Tower Sale Transaction, wewill lease space on the towers sold for a minimum period of 10 years at fixed rates that are in line with currentmarket rates for anchor tenants. Subject to various approvals, we expect to close this transaction during 2012.
We expect that the Tower Sale Transaction, if completed, will have a material impact on our financialposition and results of operations. While we are still evaluating the accounting related to the transaction, weanticipate we will record a significant gain on the sale as “other income.” Depending on the results of ouraccounting analysis, the sale of the towers may reduce our fixed asset base by an amount up to the carryingamount of the towers, which was equal to Rp1,527.8 billion (US$168.5 million) as of December 31, 2011. Adecrease in our fixed asset base will in turn reduce our operating expenses as a result of the correspondingdecrease in depreciation and amortization expenses. However, we expect this decrease in operating expenses tobe partially offset by the increase in lease expense associated with the leaseback of the transferred tower assetsand an increase in tax expense as a result of the gain resulting from the sale. Completion of the Tower SaleTransaction is subject to various approvals including those of certain of our bondholders and lenders and TowerBersama’s shareholders.
Capital Expenditures
The delivery of telecommunications services is capital intensive. In order to be competitive, we mustcontinually expand, modernize and update our technology, which involves substantial capital investment. Inorder to address the demand associated with the substantial increase in subscribers and in network usage during2009 through 2011, we had to substantially increase our capital expenditures, in particular to expand the capacityof our network. For the years ended December 31, 2009, 2010 and 2011, our actual consolidated capitalexpenditures totaled Rp11,584.5 billion, Rp5,515.0 billion and Rp6,092.6 billion (US$671.9 million),respectively. During 2012, we intend to allocate approximately Rp6,722.1 billion (US$741.3 million) for newcapital expenditures, which, taken together with estimated actual capital expenditures expended for 2012 forcapital expenditure commitments in prior periods, will result in approximately Rp7,638.9 billion (US$842.4million) total actual capital expenditures for 2012, which we intend to use for the development of fixed assets inour cellular, fixed data and fixed telecommunications business lines. In addition, we expect that the Tower SaleTransaction, if completed, will result in significant ongoing maintenance capital expenditure savings associatedwith the tower assets to be transferred. See “—Capital Expenditures.”
Historically, we have funded our capital expenditures through internal resources and cash flow fromoperations, as well as debt financings through bank loans and the capital markets. We expect to continue tofinance our capital expenditures through such sources. In addition, if completed, we expect to apply a portion ofthe cash proceeds from the Tower Sale Transaction towards funding our capital expenditures. Completion of theTower Sale Transaction is subject to various approvals including those of certain of our bondholders and lendersand Tower Bersama’s shareholders. We face liquidity risk if certain events occur, including but not limited to,slower than expected growth in the Indonesian economy, downgrading of our debt ratings or deterioration of ourfinancial performance or financial ratios. If we cannot raise the amounts needed to support our planned capitalexpenditures for 2012, we may be unable to improve or expand our cellular telecommunications infrastructure orupdate our other technology to the extent necessary to remain competitive in the Indonesian telecommunicationsmarket, which would affect our financial condition, results of operations and prospects.
In addition, unexpected changes in technology, demand for increased network capacity from our subscribersand responses to the operations and product innovation of our competitors may require us to increase our capitalexpenditures, which could affect our revenues, operating results and financial condition.
68

Foreign Exchange Volatility
The Indonesian rupiah has appreciated considerably over the last decade from its low point of approximatelyRp17,000 per U.S. dollar during the Asian financial crisis. During the period between January 1, 2009 throughDecember 31, 2011, the Indonesian rupiah/U.S. dollar exchange rate ranged from a low of Rp12,400 perU.S. dollar to a high of Rp8,888 per U.S. dollar, and, during the year 2011, the Indonesian rupiah/U.S. dollarexchange rate ranged from a low of Rp9,185 per U.S. dollar to a high of Rp8,460 per U.S. dollar. The prevailingBank Indonesia exchange rate was Rp9,068 U.S. dollar on December 31, 2011. While a substantial portion of ouroperating revenues is denominated in Indonesian rupiah, a portion of our operating revenues is U.S. dollar-denominated. In addition, a substantial portion of our borrowings, capital expenditures and operating expenses,including interest payments on our Guaranteed Notes due 2020 and ING/DBS Syndicated Loan Facility, aredenominated in currencies other than Indonesian rupiah, principally the U.S. dollar. As of December 31, 2011,50.5% of our borrowings were denominated in Indonesian rupiah, with the balance in U.S. dollars.A depreciation in the value of the Indonesian rupiah against the U.S. dollar affects our financial condition andresults of operations because, among other things, the Indonesia rupiah value of expenses payable in U.S. dollarswill increase by the same factor, thereby requiring us to convert more Indonesian rupiah to pay our U.S. dollarobligations. Conversely, an appreciation in the value of the Indonesian rupiah against the U.S. dollar affects ourfinancial condition and results of operations because, among other things, it causes a decrease in revenue fromforeign carriers for inbound international calls, roaming by foreign carriers’ subscribers in Indonesia andoperating revenues from our MIDI services and satellite operations. For the year ended December 31, 2009, werecorded a gain on foreign exchange-net of Rp1,656.4 billion; for the year ended December 31, 2010, werecorded a gain on foreign exchange-net of Rp492.4 billion for the year ended December 31, 2011, we recorded again on foreign exchange-net of Rp36.7 billion (US$4.0 million).
In addition, certain of our monetary assets and liabilities are subject to foreign currency exposure. Thesemonetary assets primarily consist of cash, cash equivalents and accounts receivable from foreigntelecommunications carriers, as well as our foreign currency-denominated accounts receivable. Our monetaryliabilities subject to foreign currency exposure consist of procurements payable, loans payable and bonds payablewhich were incurred for capital expenditure-related liabilities. The level of our net monetary assets is influencedby the extent to which incoming calls exceed outgoing calls in our IDD business and our foreign currencydenominated source of revenues. In an effort to manage our foreign currency exposure and lower our overallfunding costs, we have entered into several foreign currency swap and forward contracts. We cannot assure youthat we will be able to manage our exchange rate risk successfully in the future or that we will not continue to beadversely affected by our exposure to exchange rate risk. Our exposure to foreign exchange fluctuations,particularly as against the U.S. dollar, may increase if we incur additional U.S. dollar-denominated debt tofinance our capital expenditure plans.
In February and March 2009, we obtained consents to amendments to certain of our debt instruments andagreements in order to provide additional flexibility in our debt to equity, debt to EBITDA and EBITDA tointerest payment ratio maintenance covenants. While we believe that such amendments will provide us withsufficient cushion in the event of volatility in the Indonesian rupiah / U.S. dollar exchange rates, we cannotassure you that further and more intense volatility than that experienced in the past 12 months will not occur,which could cause us to breach our financial covenants. See “—Principal Indebtedness.”
69
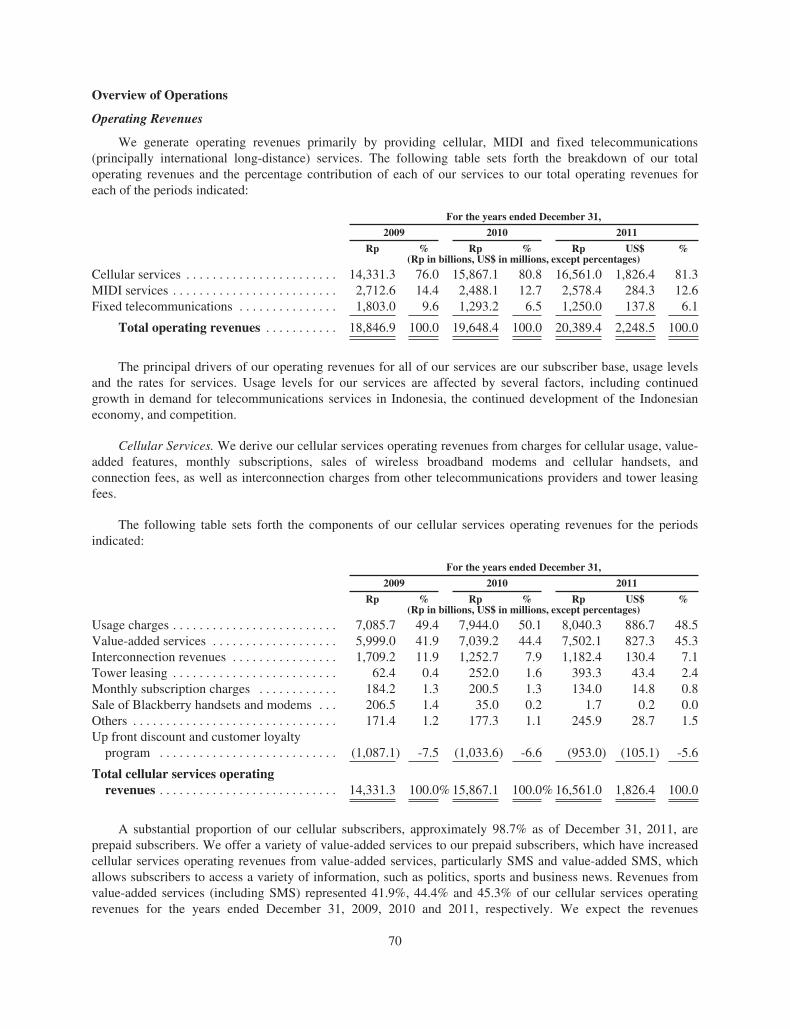
Overview of Operations
Operating Revenues
We generate operating revenues primarily by providing cellular, MIDI and fixed telecommunications(principally international long-distance) services. The following table sets forth the breakdown of our totaloperating revenues and the percentage contribution of each of our services to our total operating revenues foreach of the periods indicated:
For the years ended December 31,
2009 2010 2011
Rp % Rp % Rp US$ %(Rp in billions, US$ in millions, except percentages)
Cellular services . . . . . . . . . . . . . . . . . . . . . . . 14,331.3 76.0 15,867.1 80.8 16,561.0 1,826.4 81.3MIDI services . . . . . . . . . . . . . . . . . . . . . . . . . 2,712.6 14.4 2,488.1 12.7 2,578.4 284.3 12.6Fixed telecommunications . . . . . . . . . . . . . . . 1,803.0 9.6 1,293.2 6.5 1,250.0 137.8 6.1
Total operating revenues . . . . . . . . . . . 18,846.9 100.0 19,648.4 100.0 20,389.4 2,248.5 100.0
The principal drivers of our operating revenues for all of our services are our subscriber base, usage levelsand the rates for services. Usage levels for our services are affected by several factors, including continuedgrowth in demand for telecommunications services in Indonesia, the continued development of the Indonesianeconomy, and competition.
Cellular Services. We derive our cellular services operating revenues from charges for cellular usage, value-added features, monthly subscriptions, sales of wireless broadband modems and cellular handsets, andconnection fees, as well as interconnection charges from other telecommunications providers and tower leasingfees.
The following table sets forth the components of our cellular services operating revenues for the periodsindicated:
For the years ended December 31,
2009 2010 2011
Rp % Rp % Rp US$ %(Rp in billions, US$ in millions, except percentages)
Usage charges . . . . . . . . . . . . . . . . . . . . . . . . . 7,085.7 49.4 7,944.0 50.1 8,040.3 886.7 48.5Value-added services . . . . . . . . . . . . . . . . . . . 5,999.0 41.9 7,039.2 44.4 7,502.1 827.3 45.3Interconnection revenues . . . . . . . . . . . . . . . . 1,709.2 11.9 1,252.7 7.9 1,182.4 130.4 7.1Tower leasing . . . . . . . . . . . . . . . . . . . . . . . . . 62.4 0.4 252.0 1.6 393.3 43.4 2.4Monthly subscription charges . . . . . . . . . . . . 184.2 1.3 200.5 1.3 134.0 14.8 0.8Sale of Blackberry handsets and modems . . . 206.5 1.4 35.0 0.2 1.7 0.2 0.0Others . . . . . . . . . . . . . . . . . . . . . . . . . . . . . . . 171.4 1.2 177.3 1.1 245.9 28.7 1.5Up front discount and customer loyalty
program . . . . . . . . . . . . . . . . . . . . . . . . . . . (1,087.1) -7.5 (1,033.6) -6.6 (953.0) (105.1) -5.6
Total cellular services operatingrevenues . . . . . . . . . . . . . . . . . . . . . . . . . . . 14,331.3 100.0% 15,867.1 100.0% 16,561.0 1,826.4 100.0
A substantial proportion of our cellular subscribers, approximately 98.7% as of December 31, 2011, areprepaid subscribers. We offer a variety of value-added services to our prepaid subscribers, which have increasedcellular services operating revenues from value-added services, particularly SMS and value-added SMS, whichallows subscribers to access a variety of information, such as politics, sports and business news. Revenues fromvalue-added services (including SMS) represented 41.9%, 44.4% and 45.3% of our cellular services operatingrevenues for the years ended December 31, 2009, 2010 and 2011, respectively. We expect the revenues
70
derived from SMS and other value-added services to continue to increase, which we believe will be primarilydriven by our wireless broadband services, the popularity of social networking sites and the development of otherpopular online content.
We recognize cellular revenues as follows:
• cellular revenues arising from airtime and roaming calls are recognized based on the duration ofsuccessful calls made through our cellular network;
• for post-paid subscribers, monthly service fees are recognized as the service is rendered;
• for prepaid subscribers, the activation component of starter package sales is deferred and recognized asrevenue over the expected average period of the customer relationship. Sales of initial/reload vouchersare recorded as deferred revenue and recognized as revenue upon usage of the airtime or uponexpiration of the airtime;
• sales of wireless broadband modems and cellular handsets are recognized upon delivery to thecustomers;
• revenues from wireless broadband data communications are recognized based on the duration of usageor fixed monthly charges depending on the arrangement with the customers;
• cellular revenues are presented on a net basis, after compensation to value added service providers;
• revenues from network interconnection with other domestic and international telecommunicationscarriers are recognized monthly on the basis of the actual recorded traffic for the month.
MIDI Services. Our MIDI services operating revenues consist primarily of revenues from (i) Internetservices provided by us, Indosat Mega Media (“IM2”) and PT Aplikanusa Lintasarta (“Lintasarta”), (ii) IP VPNservices, high-speed leased lines and frame relay services provided by us and Lintasarta, (iii) digital data networkservices provided by Lintasarta, (iv) satellite services, and (v) World link and Direct link.
We deferred installation service revenues for Internet services, frame net, World link and Direct lineservices, upon the completion of the installation or connection of equipment, and recognized as revenue over theexpected customer relationship. We recognize revenues from monthly service fees and other MIDI services asthe services are rendered. Revenues from usage charges for Internet services are recognized monthly based on theduration of Internet usage or based on the fixed amount of charges depending on the arrangement with thecustomers. We record satellite revenues on a straight-line basis over the lease period for the transponder.Monthly rent for satellite transponder capacity is based primarily on leased capacity.
A substantial portion of our MIDI services operating revenues is denominated in U.S. dollars and is thusaffected by fluctuations in the Indonesian rupiah/U.S. dollar exchange rate. Our MIDI services operatingrevenues have also been affected recently by a number of other factors, including competition from domestic andinternational providers, declining tariffs and a migration from legacy services to IP-based services. We expectsuch trends to continue but believe that the effects on our operating revenues will be offset by increased volumeof services leased by our corporate customers and increased demand for our customized services.
Fixed Telecommunications Services. Fixed telecommunications services include international long-distance,fixed wireless access services, and fixed line services. International long-distance services, which are comprisedof our “001” and “008” IDD services, “Flatcall 01016” as well as operator-assisted and value-added services,represented 74.7% of our operating revenues from fixed telecommunications services for the year endedDecember 31, 2011, and fixed wireless access and fixed line services represented the balance.
International Long-distance Services. Our international long-distance services operating revenues have twoprimary sources, incoming call revenues and outgoing call revenues. We have negotiated volume commitmentsand accounting rates with foreign telecommunications operators or have implemented a market termination rate-
71

based pricing system, and receive net settlement payments from such carriers. Net settlement payments andaccounting rates are generally denominated and paid in currencies other than the Indonesian rupiah, principallythe U.S. dollar; accordingly, incoming call revenues are affected by fluctuations in exchange rates between theIndonesian rupiah and other currencies.
Fixed Wireless Access Services. As of December 31, 2011, we had 228,884 fixed wireless accesssubscribers in 82 cities in Indonesia. By the end of 2010, we expanded our fixed wireless access services toseveral additional cities in order to create capacity for approximately four million fixed wireless accesssubscribers. As a result, we expect fixed wireless services to become a more important source of fixedtelecommunications services operating revenues in future periods.
Fixed wireless access revenues arising from usage charges are recognized based on the duration ofsuccessful calls made through our fixed network. For postpaid subscribers, monthly service fees are recognizedas the service is provided. For prepaid subscribers, the activation component of starter package sales is deferredand recognized as revenue over the estimated life of the customer relationship. Sale of initial or reload vouchersis recorded as unearned income and recognized as income upon usage of the airtime or upon expiration of theairtime.
Fixed Line Services. We currently have local and domestic long-distance coverage of 152 major cities inIndonesia. Revenues from fixed line installations are recognized as revenue over the estimated life of customerrelationship. Revenues from usage charges are recognized based on the duration of successful calls made throughour fixed network.
Operating Expenses
Our principal operating expenses include cost of services, depreciation and amortization, personnelexpenses, marketing expenses and general and administration expenses.
Certain of our expenses are denominated in U.S. dollars or currencies other than the Indonesian rupiah. Suchexpenses may include those for international interconnection settlements, certain maintenance agreements andconsultancy fees.
Costs of Services. Costs of services expenses include radio frequency fee, interconnection expenses,maintenance, utilities, rents, Blackberry access fee, leased circuits, the cost of SIM cards and pulse reloadvouchers, USO, installation and concession fee.
Depreciation and Amortization. We use the straight-line depreciation method for our property, facilities andequipment over their estimated useful lives. A significant portion of our depreciation expenses relate to ourcellular services assets. As we continue to expand and enhance the coverage, capacity and quality of ournetworks, we expect expenses for depreciation to increase. However, we expect that the Tower Sale Transaction,if completed, will result in significant operational expenditure savings in the form of a reduction of depreciationand amortization expenses as a result of the disposal of part of our fixed asset base. We anticipate these savingswill be partially offset by an increase in lease expense associated with the leaseback of the tower assets to betransferred in the Tower Sale Transaction.
Marketing. Marketing expenses primarily include exhibition, promotion and advertisement expensesassociated with our marketing programs.
Personnel. Personnel expense primarily include severance benefit under the voluntary separation scheme,salaries, incentives and other employee benefits, employee income tax, bonuses, medical expense, outsourcingand pension.
General and Administration. General and administration expenses primarily include rent, professional fees,utilities, transportation, provision for impairment of receivables and office.
72

Other Income (Expense)
The major components of our other income (expense) are interest income, gain (loss) on foreign exchange—net, financing cost and gain (loss) on change in the fair value of derivatives—net. Foreign exchange gain or losshas typically been affected by the amount of non-Indonesian rupiah-denominated debt outstanding, accountsreceivable from overseas international carriers and non-Indonesian rupiah-denominated cash and cashequivalents. We currently hedge a portion of our ING/DBS Syndicated Loan Facility. See “Item 11: Quantitativeand Qualitative Disclosure About Market Risk.” Financing cost Includes interest on loans, bank charges and losson redemption of our Guaranteed Notes due 2010 and 2012.
Taxation
Current tax expense is provided based on the estimated taxable income for the period. Deferred tax assetsand liabilities are recognized for temporary differences between the financial and the tax bases of assets andliabilities at each reporting date. Future tax benefits, such as the carryover of unused tax losses, are alsorecognized to the extent that realization of such benefits is probable. The tax effects for the period are allocatedto current operations, except for the tax effects from transactions which are directly charged or credited tostockholders’ equity.
Deferred tax assets and liabilities are measured at the tax rates that are expected to apply in the period whenthe asset is realized or the liability is settled, based on tax rates (and tax laws) that have been enacted orsubstantively enacted at the balance sheet date. Changes in the carrying amount of deferred tax assets andliabilities due to a change in tax rates are credited or charged to current period operations, except to the extentthat they relate to items previously charged or credited to stockholders’ equity.
For each of the consolidated entities, the tax effects of temporary differences and tax loss carryover, whichindividually are either assets or liabilities, are shown at the applicable net amounts.
Net Income
Our net income for the years ended December 31, 2009, 2010 and 2011 is not necessarily commensurate toour operating revenues and operating income during such periods, in part due to large fluctuations in severalnon-operating items, which have impacted our net income over such periods. Such non-operating items include,among others, fluctuations in income tax deferred, gain or loss on foreign exchange net, and gain or loss onchange in the fair value of derivatives net. We expect this trend to continue, in part as a result of the anticipatedimpact of the Tower Sale Transaction, pursuant to which we expect to record a significant gain in other income,if completed.
73
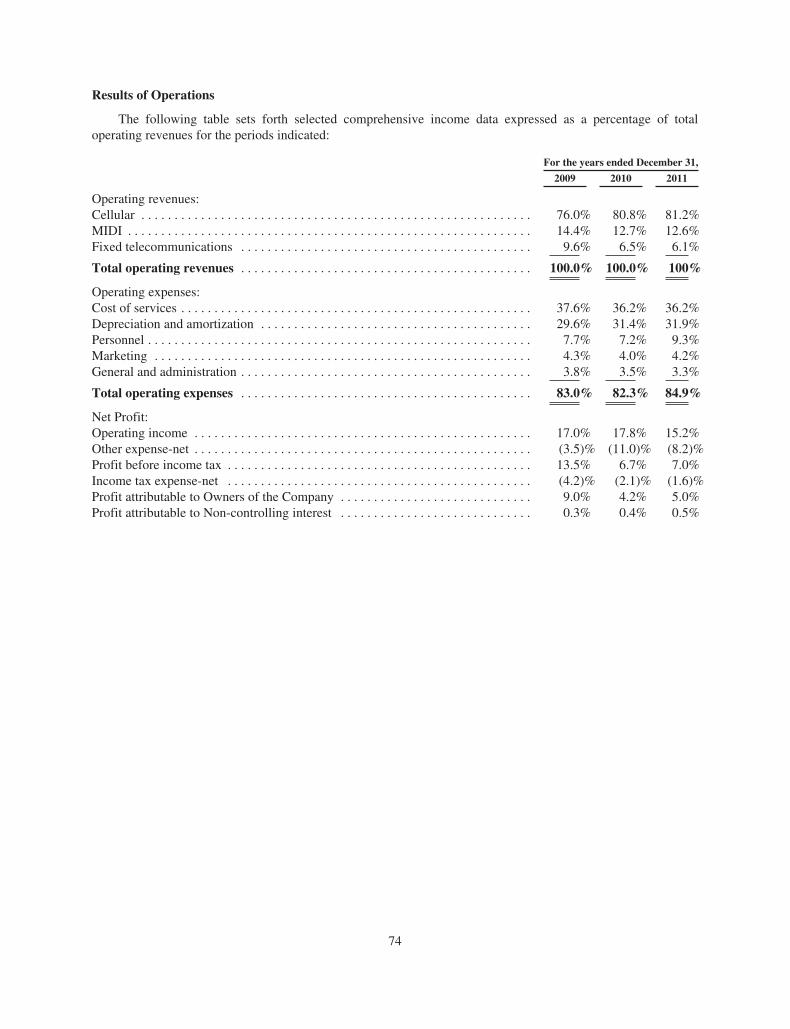
Results of Operations
The following table sets forth selected comprehensive income data expressed as a percentage of totaloperating revenues for the periods indicated:
For the years ended December 31,
2009 2010 2011
Operating revenues:Cellular . . . . . . . . . . . . . . . . . . . . . . . . . . . . . . . . . . . . . . . . . . . . . . . . . . . . . . . . . . . 76.0% 80.8% 81.2%MIDI . . . . . . . . . . . . . . . . . . . . . . . . . . . . . . . . . . . . . . . . . . . . . . . . . . . . . . . . . . . . . 14.4% 12.7% 12.6%Fixed telecommunications . . . . . . . . . . . . . . . . . . . . . . . . . . . . . . . . . . . . . . . . . . . . 9.6% 6.5% 6.1%
Total operating revenues . . . . . . . . . . . . . . . . . . . . . . . . . . . . . . . . . . . . . . . . . . . . 100.0% 100.0% 100%
Operating expenses:Cost of services . . . . . . . . . . . . . . . . . . . . . . . . . . . . . . . . . . . . . . . . . . . . . . . . . . . . . 37.6% 36.2% 36.2%Depreciation and amortization . . . . . . . . . . . . . . . . . . . . . . . . . . . . . . . . . . . . . . . . . 29.6% 31.4% 31.9%Personnel . . . . . . . . . . . . . . . . . . . . . . . . . . . . . . . . . . . . . . . . . . . . . . . . . . . . . . . . . . 7.7% 7.2% 9.3%Marketing . . . . . . . . . . . . . . . . . . . . . . . . . . . . . . . . . . . . . . . . . . . . . . . . . . . . . . . . . 4.3% 4.0% 4.2%General and administration . . . . . . . . . . . . . . . . . . . . . . . . . . . . . . . . . . . . . . . . . . . . 3.8% 3.5% 3.3%
Total operating expenses . . . . . . . . . . . . . . . . . . . . . . . . . . . . . . . . . . . . . . . . . . . . 83.0% 82.3% 84.9%
Net Profit:Operating income . . . . . . . . . . . . . . . . . . . . . . . . . . . . . . . . . . . . . . . . . . . . . . . . . . . 17.0% 17.8% 15.2%Other expense-net . . . . . . . . . . . . . . . . . . . . . . . . . . . . . . . . . . . . . . . . . . . . . . . . . . . (3.5)% (11.0)% (8.2)%Profit before income tax . . . . . . . . . . . . . . . . . . . . . . . . . . . . . . . . . . . . . . . . . . . . . . 13.5% 6.7% 7.0%Income tax expense-net . . . . . . . . . . . . . . . . . . . . . . . . . . . . . . . . . . . . . . . . . . . . . . (4.2)% (2.1)% (1.6)%Profit attributable to Owners of the Company . . . . . . . . . . . . . . . . . . . . . . . . . . . . . 9.0% 4.2% 5.0%Profit attributable to Non-controlling interest . . . . . . . . . . . . . . . . . . . . . . . . . . . . . 0.3% 0.4% 0.5%
74
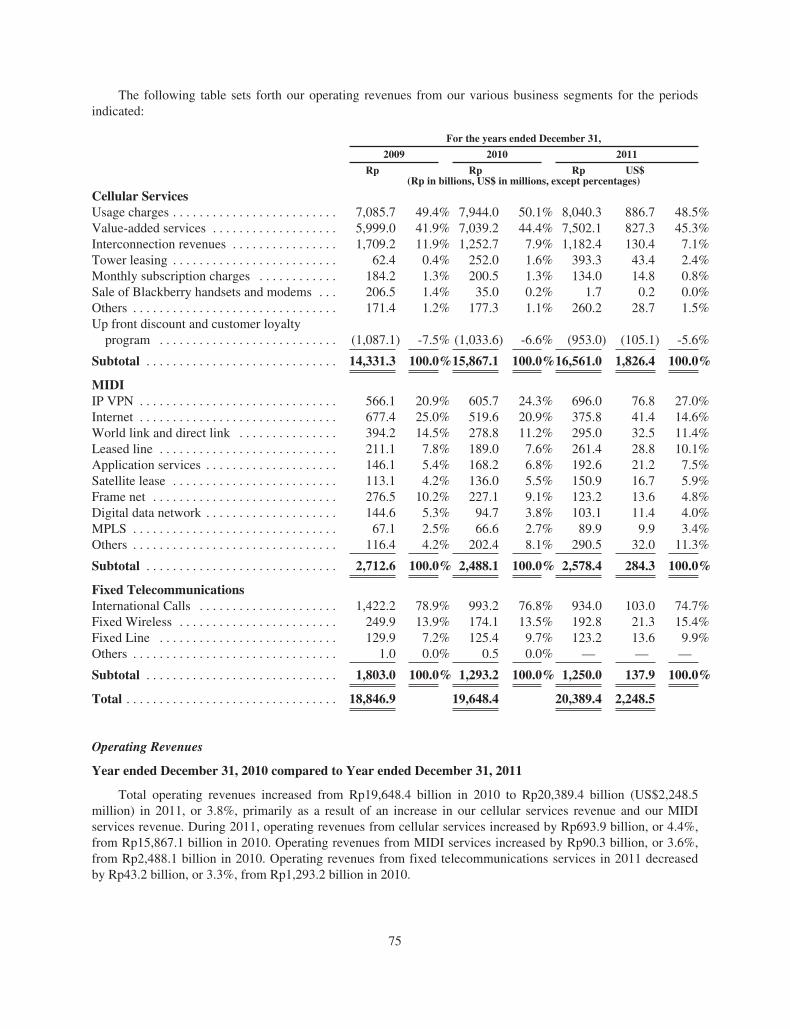
The following table sets forth our operating revenues from our various business segments for the periodsindicated:
For the years ended December 31,
2009 2010 2011
Rp Rp Rp US$(Rp in billions, US$ in millions, except percentages)
Cellular ServicesUsage charges . . . . . . . . . . . . . . . . . . . . . . . . . 7,085.7 49.4% 7,944.0 50.1% 8,040.3 886.7 48.5%Value-added services . . . . . . . . . . . . . . . . . . . 5,999.0 41.9% 7,039.2 44.4% 7,502.1 827.3 45.3%Interconnection revenues . . . . . . . . . . . . . . . . 1,709.2 11.9% 1,252.7 7.9% 1,182.4 130.4 7.1%Tower leasing . . . . . . . . . . . . . . . . . . . . . . . . . 62.4 0.4% 252.0 1.6% 393.3 43.4 2.4%Monthly subscription charges . . . . . . . . . . . . 184.2 1.3% 200.5 1.3% 134.0 14.8 0.8%Sale of Blackberry handsets and modems . . . 206.5 1.4% 35.0 0.2% 1.7 0.2 0.0%Others . . . . . . . . . . . . . . . . . . . . . . . . . . . . . . . 171.4 1.2% 177.3 1.1% 260.2 28.7 1.5%Up front discount and customer loyalty
program . . . . . . . . . . . . . . . . . . . . . . . . . . . (1,087.1) -7.5% (1,033.6) -6.6% (953.0) (105.1) -5.6%
Subtotal . . . . . . . . . . . . . . . . . . . . . . . . . . . . . 14,331.3 100.0%15,867.1 100.0%16,561.0 1,826.4 100.0%
MIDIIP VPN . . . . . . . . . . . . . . . . . . . . . . . . . . . . . . 566.1 20.9% 605.7 24.3% 696.0 76.8 27.0%Internet . . . . . . . . . . . . . . . . . . . . . . . . . . . . . . 677.4 25.0% 519.6 20.9% 375.8 41.4 14.6%World link and direct link . . . . . . . . . . . . . . . 394.2 14.5% 278.8 11.2% 295.0 32.5 11.4%Leased line . . . . . . . . . . . . . . . . . . . . . . . . . . . 211.1 7.8% 189.0 7.6% 261.4 28.8 10.1%Application services . . . . . . . . . . . . . . . . . . . . 146.1 5.4% 168.2 6.8% 192.6 21.2 7.5%Satellite lease . . . . . . . . . . . . . . . . . . . . . . . . . 113.1 4.2% 136.0 5.5% 150.9 16.7 5.9%Frame net . . . . . . . . . . . . . . . . . . . . . . . . . . . . 276.5 10.2% 227.1 9.1% 123.2 13.6 4.8%Digital data network . . . . . . . . . . . . . . . . . . . . 144.6 5.3% 94.7 3.8% 103.1 11.4 4.0%MPLS . . . . . . . . . . . . . . . . . . . . . . . . . . . . . . . 67.1 2.5% 66.6 2.7% 89.9 9.9 3.4%Others . . . . . . . . . . . . . . . . . . . . . . . . . . . . . . . 116.4 4.2% 202.4 8.1% 290.5 32.0 11.3%
Subtotal . . . . . . . . . . . . . . . . . . . . . . . . . . . . . 2,712.6 100.0% 2,488.1 100.0% 2,578.4 284.3 100.0%
Fixed TelecommunicationsInternational Calls . . . . . . . . . . . . . . . . . . . . . 1,422.2 78.9% 993.2 76.8% 934.0 103.0 74.7%Fixed Wireless . . . . . . . . . . . . . . . . . . . . . . . . 249.9 13.9% 174.1 13.5% 192.8 21.3 15.4%Fixed Line . . . . . . . . . . . . . . . . . . . . . . . . . . . 129.9 7.2% 125.4 9.7% 123.2 13.6 9.9%Others . . . . . . . . . . . . . . . . . . . . . . . . . . . . . . . 1.0 0.0% 0.5 0.0% — — —
Subtotal . . . . . . . . . . . . . . . . . . . . . . . . . . . . . 1,803.0 100.0% 1,293.2 100.0% 1,250.0 137.9 100.0%
Total . . . . . . . . . . . . . . . . . . . . . . . . . . . . . . . . 18,846.9 19,648.4 20,389.4 2,248.5
Operating Revenues
Year ended December 31, 2010 compared to Year ended December 31, 2011
Total operating revenues increased from Rp19,648.4 billion in 2010 to Rp20,389.4 billion (US$2,248.5million) in 2011, or 3.8%, primarily as a result of an increase in our cellular services revenue and our MIDIservices revenue. During 2011, operating revenues from cellular services increased by Rp693.9 billion, or 4.4%,from Rp15,867.1 billion in 2010. Operating revenues from MIDI services increased by Rp90.3 billion, or 3.6%,from Rp2,488.1 billion in 2010. Operating revenues from fixed telecommunications services in 2011 decreasedby Rp43.2 billion, or 3.3%, from Rp1,293.2 billion in 2010.
75
Cellular Services. In 2011, we recorded cellular services operating revenues of Rp16,561.0 billion(US$1,826.4 million), an increase of 4.4% from Rp15,867.1 billion in 2010. We believe that the increase wasprimarily a result of an increase in the number of subscribers and in the revenue from tower leasing. Operatingrevenues from cellular services represented 81.2% of our total operating revenues for 2011, which is higher thanthe percentage for 2010.
Usage charges increased by Rp96.3 billion, or 1.2%, from 2010, and represented 48.5% of our total cellularservices operating revenues. This increase in usage was primarily due to an increase in the total Minutes ofUsage by our subscribers.
In 2011, cellular services operating revenues generated by value-added services increased by Rp462.9billion, or 6.6%, compared to 2010. The contribution of value-added services to cellular services operatingrevenues increased by 0.9% from 44.4% in 2010 to 45.3% in 2011. The increase in operating revenues fromvalue-added services, as well as the increase in the contribution of revenues from value-added services to ouroverall cellular operating revenues, was driven by an increase in SMS usage.
MIDI Services. In 2011, operating revenues from MIDI services increased by Rp90.3 billion fromRp2,488.1 billion in 2010 to Rp2,578.4 billion (US$284.3 million) in 2011. IP VPN operating revenues representthe largest component of MIDI services operating revenue. IP VPN operating revenues increased by Rp90.3billion from Rp605.7 billion in 2010 to Rp696.0 billion in 2011. The increase in MIDI services operatingrevenues, including those from international and domestic leased line services, was primarily due to increase inusage by consumers despite a decline in prices of our services as a result of competitive pressure.
Fixed Telecommunications Services. There was a decrease in fixed telecommunications services operatingrevenues from Rp1,293.2 billion in 2010 to Rp1,250.0 billion (US$137.8 million) in 2011. Operating revenuesfrom international calls and fixed wireless access services represented 74.7% and 15.4%, respectively, of fixedtelecommunications services operating revenues in 2011. The remaining 9.9% of fixed telecommunicationsservices operating revenues in 2011 was generated by fixed line. Revenues from international calls decreasedfrom Rp993.2 billion in 2010 to Rp934.0 billion (US$103.0 million) in 2011 due to a decrease in outgoing IDDtraffic from Indosat and non-Indosat subscribers. The total volume of international calls from our “001” and“008” gateways increased by 11.4% from 2,186.9 million minutes in 2010 to 2,437.0 million minutes in 2011.Total incoming traffic increased by 15.5% from 1,723.9 million minutes in 2010 to 1,991.7 million minutes in2011, primarily due to volume commitments from foreign telecommunications operators. Outgoing trafficdecreased by 3.8% from 463.0 million minutes in 2010 to 445.3 million minutes in 2011 due to the decrease involume commitments from foreign telecommunications operators.
Operating Expenses
Operating expenses increased by Rp1,130 billion, or 7.0%, from Rp16,159.3 billion in 2010 to Rp17,289.3billion (US$1,906.6 million) in 2011, primarily due to increases in personnel expenses, cost of services expenses,depreciation and amortization expenses and marketing expenses. This increase was offset in part by a decrease inadministration and general expenses.
Personnel expenses increased by Rp480.7 billion, or 34.1%, from Rp1,411.2 billion in 2010 to Rp1,891.9billion (US$208.6 million) in 2011, primarily due to an increase in compensation expense related to theseverance packages provided to participants in the VSS program, which was launched in January 2011 andcompleted in June 2011 for the company and in December 2011 for Lintasarta.
Cost of services expenses increased by Rp269.6 billion, or 3.8%, from Rp7,113.4 billion in 2010 toRp7,383.0 billion (US$814.2 million) in 2011, primarily as a result of increased Governmental levies onfrequency fees and 3G spectrum fees, increases in BlackBerry license fees, tower rental costs and the cost of SIMcards and pulse reload vouchers.
76

Depreciation and amortization expenses increased by Rp333.0 or 5.4%, from Rp6,162.9 billion in 2010 toRp6,495.9 billion (US$716.4 million) in 2011, primarily as a result of the continued growth of our fixed assetbase. The total cost of our property and equipment increased from Rp78,101.2 billion in 2010 to Rp82,995.6billion (US$9,152.6 million) in 2011.
Marketing expenses increased by Rp76.5 billion, or 9.8%, from Rp779.2 billion in 2010 to Rp855.7 billion(US$94.4 million) in 2011, driven primarily by an increase in advertising and promotional expenses in large partrelated to our “50 Million Customer” campaign, a promotional campaign launched in October 2011 celebratingour attainment of over 50 million customers. .
General and administration expenses decreased by Rp29.9 billion, or 4.3%, from Rp692.6 billion in 2010 toRp662.7 billion (US$73.1 million) in 2011, primarily due to a decrease in provision for the impairment ofreceivables.
Operating Income
As a result of the above factors, operating income decreased by Rp389.0 billion, or 11.2%, from Rp3,489.1billion in 2010 to Rp3,100.1 billion (US$341.9 million) in 2011.
Other Expenses-Net
Other expenses-net decreased by Rp485.8 billion, from Rp2,163.9 billion in 2010 to Rp1,678.1 billion(US$185.1 million) in 2011, primarily due to an increase gain on foreign exchange gains on changes in fair valueof derivatives and a decrease in financing costs.
Gain on foreign exchange-net of Rp492.4 billion in 2010 decreased to Rp36.7 billion (US$4.0 million) in2011. The exchange rate decreased from Rp8,991 : US$1 as of December 31, 2010 to Rp9,068 : US$1 as ofDecember 31, 2011, compared to the decrease from Rp9,400 : US$1 as of December 31, 2009 to Rp8,991 : US$1as of December 31, 2010.
We recorded a gain on change in fair value of derivatives-net of Rp57.9 billion (US$6.4 million),representing an increase of Rp506.7 billion, over a loss on change in fair value of derivatives-net of Rp448.8billion in 2010 due to the depreciation of the Indonesian rupiah against the U.S. dollar.
We recorded a decrease in interest income to Rp100.7 billion (US$11.1 million) in 2011, which representeda decrease of Rp42.7 billion, or 29.8%, from Rp143.4 billion in 2010, due to our lower average cash balance.
We recorded a decrease in financing cost to Rp1,925.4 billion (US$212.3 million) in 2011, whichrepresented a decrease of Rp346.2 billion, or 15.2%, from 2,271.6 billion in 2010 as a result of lower overall.
Others-net increased by Rp131.3 billion, from expense of Rp79.2 billion in 2010 to income of Rp52.0billion (US$5.7 million) in 2011 primarily due to the excess of fair value of asset being leased over net bookvalue of outright sale of assets being leased a decrease in tax expense and related penalties, which was partiallyoffset by a decrease in both submarine cable restoration revenue and dividend revenue on our investment inASEAN Cableship Pte. Ltd.
Income Tax Expense-Net
We recorded income tax expense—net of Rp315.6 billion (US$34.8 million) in 2011 compared to Rp422.3billion in 2010. The decrease in income tax expense-net was primarily due to a decrease in income before taxresulting from a decrease in operating income and gain on foreign exchange.
Profit attributable to Owners of the Company
Our net profit increased by Rp203.5 billion, or 22.5%, from Rp902.9 billion in 2010 to Rp1,106.4 billion(US$122.0 million) in 2011 due to the foregoing factors.
77

Year ended December 31, 2009 compared to Year ended December 31, 2010
Total operating revenues increased from Rp18,846.9 billion in 2009 to Rp19,648.4 billion (US$2,185.3million), or 4.3%, primarily as a result of an increase in our cellular services revenue. During 2010, operatingrevenues from cellular services increased by Rp1,535.8 billion, or 10.7%, from Rp14,331.3 billion in 2009.Operating revenues from MIDI services decreased by Rp224.5 billion, or 8.3%, from Rp2,712.6 billion in 2009.Operating revenues from fixed telecommunications services in 2010 decreased by Rp509.8 billion, or 28.3%,from Rp1,803.0 billion in 2009.
Cellular Services. In 2010, we recorded cellular services operating revenues of Rp15,867.1 billion(US$1,764.8 million), an increase of 10.7% from Rp14,331.3 billion in 2009. We believe that the increase wasprimarily a result of an increase in the number of subscribers. Operating revenues from cellular servicesrepresented 80.8% of our total operating revenues for 2010, which is higher than the percentage for 2009.
Usage charges increased by Rp858.3 billion, or 12.1%, from 2009, and represented 50.1% of our totalcellular services operating revenues. This increase in usage was primarily due to an increase in the minutes ofusage by our subscribers.
In 2010, cellular services operating revenues generated by value-added services increased by Rp1,040.2billion, or 17.3%, compared to 2009. The contribution of value-added services to cellular services operatingrevenues increased by 2.5% from 41.9% in 2009 to 44.4% in 2010. The increase in operating revenues fromvalue-added services, as well as the increase in the contribution of revenues from value-added services to ouroverall cellular operating revenues, was driven by an increase in usage of SMS and wireless broadband.
MIDI Services. In 2010, operating revenues from MIDI services decreased by Rp224.5 billion fromRp2,712.6 billion in 2009 to Rp2,488.1 billion (US$276.7 million) in 2010. IP VPN operating revenues representthe largest component of MIDI services operating revenue. IP VPN operating revenues increased by Rp39.6billion from Rp566.1 billion in 2009 to Rp605.7 billion in 2010. The reduction in MIDI services operatingrevenues, including those from Internet services, as well as international and domestic leased line services, wasprimarily due to increased competition and a decline in prices of our services.
Fixed Telecommunications Services. There was a decrease in fixed telecommunications services operatingrevenues from Rp1,803.0 billion in 2009 to Rp1,293.2 billion (US$143.8 million) in 2010. Operating revenuesfrom international calls and fixed wireless access services represented 76.8% and 13.5%, respectively, of fixedtelecommunications services operating revenues in 2010. The remaining 9.7% of fixed telecommunicationsservices operating revenues in 2010 was generated by fixed line and other services. Revenues from internationalcalls decreased from Rp1,422.2 billion in 2009 to Rp993.2 billion (US$110.5 million) in 2010 due to a decreasein outgoing IDD traffic from Indosat and non-Indosat subscribers. The total volume of international calls fromour “001” and “008” gateways increased by 6.1% from 2,060.5 million minutes in 2009 to 2,186.9 millionminutes in 2010. Total incoming traffic increased by 10.6% from 1,558.5 million minutes in 2009 to1,723.9 million minutes in 2010, primarily due to volume commitments from foreign telecommunicationsoperators. Outgoing traffic decreased by 7.8% from 502.0 million minutes in 2009 to 463.0 million minutes in2010 due to the decrease in volume commitments from foreign telecommunications operations.
Operating Expenses
Operating expenses increased by Rp508.5 billion, or 3.2%, from Rp15,650.7 billion in 2009 to Rp16,159.3billion (US$ 1,797.3 million) in 2010, primarily due to increases in depreciation and amortization expenses andcost of services expenses. This increase was offset in part by decreases in personnel cost, marketing expense andadministration and general expenses in the year.
78
Cost of services expenses increased by Rp25.5 billion, or 0.4%, from Rp7,087.9 billion in 2009 toRp7,113.4 billion (US$791.2 million) in 2010, primarily as a result of increased Government levies on frequencyfees, USO and concession fees. The increase can also be attributed to rental payments for additional BTSs,increases in interconnection cost and increase in maintenance relating to increase in our fixed assets.
Depreciation and amortization expenses increased by 10.6% from Rp5,571.6 billion in 2009 to Rp6,162.9billion (US$685.5 million), primarily as a result of the continued growth of our fixed asset base, including ournew Palapa-D satellite. The total cost of our property and equipment increased from Rp74,818.5 billion in 2009to Rp78,101.2 billion (US$8,686.6 million) in 2010.
Personnel expense decreased by Rp40.4 billion, or 2.8%, from Rp1,451.6 billion in 2009 to Rp1,411.2billion (US$157.0 million) in 2010, primarily due to a decrease in the post-employment benefits, of salarycontinuation before retirement (MPP) benefit and partially offset by the increase in the salaries and bonuses.
Marketing expenses decreased by Rp37.7 billion, or 4.6%, from Rp816.9 billion in 2009 to Rp779.2 billion(US$86.7 million) in 2010, primarily due to a decrease in advertising, promotion and exhibition expenses, in linewith the targeted marketing strategy and efficiency program we have adopted.
General and administration expenses decreased by Rp30.2 billion, or 4.2%, from Rp722.8 billion in 2009 toRp692.6 billion (US$77.0 million) in 2010, primarily due to a decrease in provision for impairment ofreceivables, rental cost, professional fee and office supplies expenses, as we continued to implement ourefficiency program, designed to minimize non operational costs.
Operating Income
As a result of the above factors, operating income increased by Rp292.9 billion, or 9.2%, from Rp3,196.2billion in 2009 to Rp3,489.1 billion (US$388.1 million) in 2010.
Other Expenses-Net
Other expenses-net increased by Rp1,509.9 billion, from Rp654.0 billion in 2009 to Rp2,163.9 billion(US$240.7 million) in 2010, primarily due to a lower gain on foreign exchange, driven by the smallerappreciation of the Indonesian rupiah against the U.S. dollar compared to the previous year. Gain on foreignexchange-net of Rp1,656.4 billion in 2009 decreased to Rp492.4 billion (US$54.8 million) in 2010. Theexchange rate decreased from Rp9,400 : US$1 as of December 31, 2009 to Rp8,991 : US$1 as of December 31,2010, compared to the decrease from Rp10,950 : US$1 as of December 31, 2008 to Rp9,400 : US$1 as ofDecember 31, 2009.
Loss on change in fair value of derivatives-net decreased by Rp38.1 billion from Rp486.9 billion in 2009 toRp448.8 billion (US$49.9 million) in 2010 due to the appreciation of the Indonesian rupiah against the U.S.dollar.
We recorded an increase in interest income to Rp143.4 billion (US$15.9 million) in 2010, which representedan increase of Rp4.4 billion, or 3.2%, over 2009, due to our higher average cash balance.
Others-net decreased by Rp8.2 billion, from Rp87.5 billion in 2009 to Rp79.2 billion (US$8.8 million) in2010 primarily due to an increase in submarine cable restoration revenue and gain on sale of property andequipment.
Income Tax Expense-Net
We recorded income tax expense—net of Rp422.4 billion (US$47.0 million) in 2010 compared to Rp783.9billion in 2009. The decrease in income tax expense-net was primarily due to the lower in income before taxrelated to lower gain on foreign exchange and higher financing cost.
79
Profit attributable to Owners of the Company
Our net profit decreased by Rp857.4 billion, or 48.7%, from Rp1,760.3 billion in 2009 to Rp902.9 billion(US$100.4 million) due to the foregoing factors.
B. LIQUIDITY AND CAPITAL RESOURCES
Our liquidity requirements have historically arisen from the need to finance investments and capitalexpenditures related to the expansion of our telecommunications business. Our telecommunications businessrequires substantial capital expenditures to construct and expand mobile and data network infrastructure and tofund operations, particularly during the network development stage. Although we have substantial existingnetwork infrastructure, we expect to incur additional capital expenditures in order to focus cellular networkdevelopment in areas that we anticipate to be high-growth areas, as well as to enhance the quality and coverageof our existing network.
We believe our current cash and cash equivalents, cash flow from operations and available sources offinancing will be sufficient to meet our anticipated cash needs, including our cash needs for working capital andplanned capital expenditures, for the foreseeable future. In addition, if completed, we expect to apply a portion ofthe cash proceeds from the Tower Sale Transaction towards funding capital expenditures, repayment ofoutstanding debt and general corporate purposes. Nonetheless, if global or Indonesian economic conditionsworsen, competition or product substitution accelerates beyond current expectations or the value of theIndonesian rupiah depreciates significantly against the U.S. dollar, our net cash flow from operating activitiesmay decrease and the amount of required capital expenditures in Indonesian rupiah terms may increase, any ofwhich may negatively impact our liquidity.
Cash Flows
The following table sets forth certain information regarding our historical cash flows:
For the years ended December 31,
2009 2010 2011
Rp Rp Rp US$(Rp in billions, US$ in millions)
Net cash flows:Provided by operating activities . . . . . . . . . . . . . . . . . . . . . . . . . . . 4,106.1 6,848.6 7,320.1 807.2Used in investing activities . . . . . . . . . . . . . . . . . . . . . . . . . . . . . . . (10,670.7) (5,970.7) (6,037.9) (665.8)Provided by (used in) financing activities . . . . . . . . . . . . . . . . . . . 3,724.7 (1,629.7) (1,135.5) (125.2)Net Foreign Exchange differences from cash and cash
equivalent . . . . . . . . . . . . . . . . . . . . . . . . . . . . . . . . . . . . . . . . . . (54.9) (9.7) 2.2 0.2
Net Cash Provided by Operating Activities
Net cash provided by operating activities amounted to Rp4,106.1 billion, Rp6,848.6 billion and Rp7,320.1billion (US$807.2 million) for 2009, 2010 and 2011, respectively. In 2011, net cash provided by operatingactivities increased primarily due to increased receipts from customers.
Net Cash Used in Investing Activities
Net cash used in investing activities amounted to Rp10,670.7 billion, Rp5,970.7 billion and Rp6,037.9billion (US$665.8 million) for 2009, 2010 and 2011, respectively. Net cash used in investing activities for 2009,2010 and 2011 has been driven primarily by acquisitions of property and equipment, totaling Rp10,684.7 billion,Rp6,495.1 billion and Rp6,048.0 billion (US$667.0 million), respectively, as we expanded our network coverageand capacity during those years. The property and equipment purchased consisted primarily of exchange andnetwork assets, subscribers’ apparatus and other equipment and buildings and improvements to building leasedproperty.
80
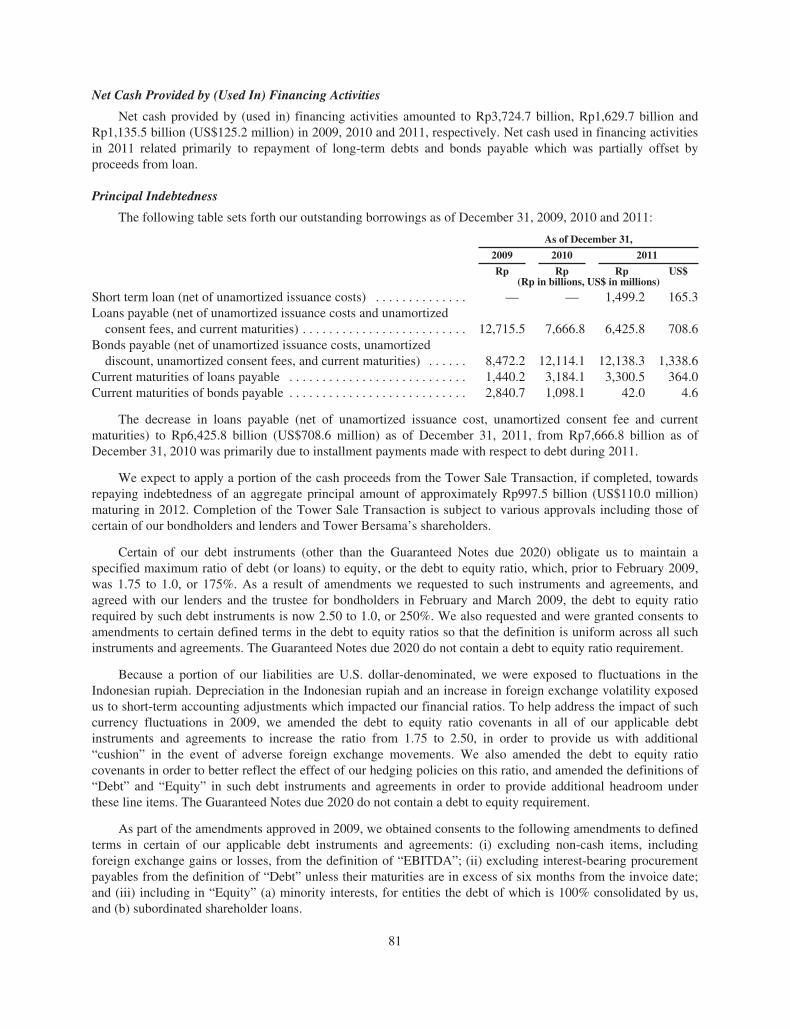
Net Cash Provided by (Used In) Financing Activities
Net cash provided by (used in) financing activities amounted to Rp3,724.7 billion, Rp1,629.7 billion andRp1,135.5 billion (US$125.2 million) in 2009, 2010 and 2011, respectively. Net cash used in financing activitiesin 2011 related primarily to repayment of long-term debts and bonds payable which was partially offset byproceeds from loan.
Principal Indebtedness
The following table sets forth our outstanding borrowings as of December 31, 2009, 2010 and 2011:
As of December 31,
2009 2010 2011
Rp Rp Rp US$(Rp in billions, US$ in millions)
Short term loan (net of unamortized issuance costs) . . . . . . . . . . . . . . — — 1,499.2 165.3Loans payable (net of unamortized issuance costs and unamortized
consent fees, and current maturities) . . . . . . . . . . . . . . . . . . . . . . . . . 12,715.5 7,666.8 6,425.8 708.6Bonds payable (net of unamortized issuance costs, unamortized
discount, unamortized consent fees, and current maturities) . . . . . . 8,472.2 12,114.1 12,138.3 1,338.6Current maturities of loans payable . . . . . . . . . . . . . . . . . . . . . . . . . . . 1,440.2 3,184.1 3,300.5 364.0Current maturities of bonds payable . . . . . . . . . . . . . . . . . . . . . . . . . . . 2,840.7 1,098.1 42.0 4.6
The decrease in loans payable (net of unamortized issuance cost, unamortized consent fee and currentmaturities) to Rp6,425.8 billion (US$708.6 million) as of December 31, 2011, from Rp7,666.8 billion as ofDecember 31, 2010 was primarily due to installment payments made with respect to debt during 2011.
We expect to apply a portion of the cash proceeds from the Tower Sale Transaction, if completed, towardsrepaying indebtedness of an aggregate principal amount of approximately Rp997.5 billion (US$110.0 million)maturing in 2012. Completion of the Tower Sale Transaction is subject to various approvals including those ofcertain of our bondholders and lenders and Tower Bersama’s shareholders.
Certain of our debt instruments (other than the Guaranteed Notes due 2020) obligate us to maintain aspecified maximum ratio of debt (or loans) to equity, or the debt to equity ratio, which, prior to February 2009,was 1.75 to 1.0, or 175%. As a result of amendments we requested to such instruments and agreements, andagreed with our lenders and the trustee for bondholders in February and March 2009, the debt to equity ratiorequired by such debt instruments is now 2.50 to 1.0, or 250%. We also requested and were granted consents toamendments to certain defined terms in the debt to equity ratios so that the definition is uniform across all suchinstruments and agreements. The Guaranteed Notes due 2020 do not contain a debt to equity ratio requirement.
Because a portion of our liabilities are U.S. dollar-denominated, we were exposed to fluctuations in theIndonesian rupiah. Depreciation in the Indonesian rupiah and an increase in foreign exchange volatility exposedus to short-term accounting adjustments which impacted our financial ratios. To help address the impact of suchcurrency fluctuations in 2009, we amended the debt to equity ratio covenants in all of our applicable debtinstruments and agreements to increase the ratio from 1.75 to 2.50, in order to provide us with additional“cushion” in the event of adverse foreign exchange movements. We also amended the debt to equity ratiocovenants in order to better reflect the effect of our hedging policies on this ratio, and amended the definitions of“Debt” and “Equity” in such debt instruments and agreements in order to provide additional headroom underthese line items. The Guaranteed Notes due 2020 do not contain a debt to equity requirement.
As part of the amendments approved in 2009, we obtained consents to the following amendments to definedterms in certain of our applicable debt instruments and agreements: (i) excluding non-cash items, includingforeign exchange gains or losses, from the definition of “EBITDA”; (ii) excluding interest-bearing procurementpayables from the definition of “Debt” unless their maturities are in excess of six months from the invoice date;and (iii) including in “Equity” (a) minority interests, for entities the debt of which is 100% consolidated by us,and (b) subordinated shareholder loans.
81

While we believe that the foregoing amendments provide us with sufficient cushion in the event of volatilityin the U.S. dollar—Indonesian rupiah exchange rates, we cannot assure you that further and more intensevolatility than that experienced in the past 12 months will not occur, which could cause us to breach our financialcovenants.
Set forth below are calculations of our historical financial ratios that are contained in our financial covenantsunder Indonesian GAAP as required by our debt agreements.
As of and for the years ended December 31,
Ratio Required 2009 2010 2011
Rp Rp Rp US$(Rp in billions, US$ in millions, except percentages)
Financial Position and Comprehensive IncomeData:
Short term loan . . . . . . . . . . . . . . . . . . . . . . . . . — — 1,499.2 165.3Current maturities from:
Loans payable . . . . . . . . . . . . . . . . . . . . . . 1,440.2 3,184.1 3,300.5 364.0Bonds payable . . . . . . . . . . . . . . . . . . . . . . 2,840.7 1,098.1 42.0 4.6
Loans payable—net of current maturities:Related party . . . . . . . . . . . . . . . . . . . . . . . 2,192.5 997.0 — —Third parties . . . . . . . . . . . . . . . . . . . . . . . . 10,528.8 6,669.8 6,425.8 708.6
Bonds payable—net of current maturities . . . . . 8,472.2 12,114.1 12,138.4 1,338.6Unamortized issuance cost, consent
solicitation fees and discounts . . . . . . . . 338.5 336.1 266.1 29.3
Total Debt(1) . . . . . . . . . . . . . . . . . . . . 25,812.9 24,399.2 23,672.0 2,610.4
Total Assets . . . . . . . . . . . . . . . . . . . . . . . . . . . . 55,041.5 52,818.2 52,172.3 5,753.5Total Liabilities . . . . . . . . . . . . . . . . . . . . . . . . . 36,753.2 34,581.7 33,356.3 3,678.5
Total Equity(2) . . . . . . . . . . . . . . . . . . 18,288.3 18,236.5 18,816.0 2,075.0Operating Income . . . . . . . . . . . . . . . . . . . . . . . 3,213.0 3,441.4 2,830.1 312.1Depreciation and Amortization . . . . . . . . . . . . . 5,561.4 6,151.9 6,580.8 725.7EBITDA(3) . . . . . . . . . . . . . . . . . . . . . . . . . . . . . 8,774.4 9,593.3 9,410.9 1,037.8Interest Expense(4) . . . . . . . . . . . . . . . . . . . . . . . 1,808.6 2,080.3 1,700.1 187.5
Financial Ratios:Debt to Equity ratio(5) . . . . . . . . . . . . . . . . . . . . <2.50x 1.41x 1.34x 1.26x 1.26xDebt to EBITDA ratio(6) . . . . . . . . . . . . . . . . . . <3.50x 2.94x 2.54x 2.52x 2.52xEBITDA to Interest Expense ratio(7) . . . . . . . . . >3.00x 4.85x 4.61x 5.54x 5.54x
(1) We define total debt as total loans payable and bonds payable (current and non-current maturities),unamortized issuance cost (loans, bonds and notes), unamortized consent solicitation fees (loans and bonds)and unamortized discounts (loans and notes).According to the amended definition, “Debt” means, with respect to any person on any date ofdetermination (without duplication):(a) the principal of and premium (if any) in respect of debt of such person for money borrowed and debt
evidenced by notes, debentures, bonds or other similar instruments for the payment of which suchperson is responsible or liable which in any such case, bears interest or on which interest accrues; and
(b) all obligations of such person in relation to procurement payables constituting accounts payable to suchperson’s suppliers which bear interest or on which interest accrues and payment for such accountspayable is due more than six (6) months after the relevant invoice date, but, in relation to any memberof the Company or its subsidiaries (together the “Group”), or the Group, deducting all indebtednessadvanced by any (direct or indirect) shareholder of the Company to such member of the Group which issubordinated to any indebtedness falling under paragraph (a) or (b) above.
82

(2) We define equity as total stockholders’ equity and minority interest. According to the amended definition,“Equity” means total assets less total liabilities, where total liabilities exclude all indebtedness advanced byany (direct or indirect) shareholder of the Company to any member of the Group which is subordinated toany Debt.
(3) We have defined EBITDA as earnings before interest, amortization of goodwill, non-operating income andexpense, income tax expense, depreciation and minority interest in net income of subsidiaries as reported inthe consolidated financial statements prepared under Indonesian GAAP. EBITDA is not a standard measureunder either Indonesian GAAP or IFRS. As the telecommunications business is capital intensive, capitalexpenditure requirements and levels of debt and interest expenses may have a significant impact on the netincome of companies with similar operating results. Therefore, we believe that EBITDA provides a usefulreflection of our operating results and that net income is the most directly comparable financial measure toEBITDA as an indicator of our operating performance. You should not consider our definition of EBITDAin isolation or as an indicator of operating performance, liquidity or any other standard measure under eitherIndonesian GAAP or IFRS, or other companies’ definition of EBITDA. Our definition of EBITDA does notaccount for taxes and other non-operating cash expenses. Funds depicted by this measure may not beavailable for debt service due to covenant restrictions, capital expenditure requirements and othercommitments. According to the amended definition, “EBITDA” means, for any period, an amount equal tothe sum of operating income (calculated before finance costs, taxes, non-operating income or expenses andextraordinary and exceptional items) plus depreciation and amortization and, in the case of any testing orcalculation of the ratio of aggregate Debt of the Group, to EBITDA of the Group after giving pro formaeffect to any material acquisition or disposal of assets or businesses as if such acquisition or disposal hadoccurred on the first day of such period. The following table reconciles our net income under IndonesianGAAP to our definition of EBITDA for the periods indicated:
For the years ended December 31,
2009 2010 2011
Rp Rp Rp US$(Rp in billions, US$ in millions)
EBITDA under Indonesian GAAP . . . . . . . . . . . . . . . . . . . . . . . . . . . . . . . . . . . . . 8,774.7 9,593.3 9,410.9 1,037.8Adjustments:
Amortization of goodwill . . . . . . . . . . . . . . . . . . . . . . . . . . . . . . . . . . . . . . . . . . (235.4) (226.4) — —Interest income . . . . . . . . . . . . . . . . . . . . . . . . . . . . . . . . . . . . . . . . . . . . . . . . . . 139.0 143.4 81.5 9.0Financing cost (including interest expense) . . . . . . . . . . . . . . . . . . . . . . . . . . . . (1,873.0) (2,271.6) (1,789.7) (197.4)Gain (loss) on change in fair value of derivatives—net . . . . . . . . . . . . . . . . . . (517.7) (418.1) 58.0 6.4Others—net . . . . . . . . . . . . . . . . . . . . . . . . . . . . . . . . . . . . . . . . . . . . . . . . . . . . (121.0) (79.2) (34.7) (3.8)Gain on foreign exchange—net . . . . . . . . . . . . . . . . . . . . . . . . . . . . . . . . . . . . . 1,656.4 492.4 36.7 4.0Income tax expense—net . . . . . . . . . . . . . . . . . . . . . . . . . . . . . . . . . . . . . . . . . . (677.3) (357.8) (249.4) (27.5)Depreciation and amortization . . . . . . . . . . . . . . . . . . . . . . . . . . . . . . . . . . . . . . (5,561.4) (6,151.9) (6,580.8) (725.7)Profit attributable to non controlling interest . . . . . . . . . . . . . . . . . . . . . . . . . . . (56.5) (76.9) (97.5) (10.8)
Profit for the year attributable to owners of the Company under IndonesianGAAP . . . . . . . . . . . . . . . . . . . . . . . . . . . . . . . . . . . . . . . . . . . . . . . . . . . . . . . . . . 1,527.8 647.2 835.0 92.1
The following table reconciles our EBITDA under Indonesian GAAP to IFRS for the periods indicated:
For the years ended December 31,
2009 2010 2011
Rp Rp Rp US$(Rp in billions, US$ in millions)
EBITDA under Indonesian GAAP . . . . . . . . . . . . . . . . . . . . . . . . . . . . . . . . . . . . . . . . 8,774.7 9,593.3 9,410.9 1,037.8Net adjustment to operating lease revenue and expenses . . . . . . . . . . . . . . . . . . . . . . . — — 178.3 19.6Dealer commissions . . . . . . . . . . . . . . . . . . . . . . . . . . . . . . . . . . . . . . . . . . . . . . . . . . . . — 46.9 4.5 0.5Deferred connection fees . . . . . . . . . . . . . . . . . . . . . . . . . . . . . . . . . . . . . . . . . . . . . . . . 22.7 11.8 2.3 0.3EBITDA under IFRS* . . . . . . . . . . . . . . . . . . . . . . . . . . . . . . . . . . . . . . . . . . . . . . . . . . 8,797.4 9,652.0 9,596.0 1,058.2
* See “Item 3: Key Information—Selected Financial and Other Data” for reconciliation of our EBITDA underIFRS to our profit attributable to owners of the Company under IFRS.
83

(4) “Interest Expense” means, for any period, interest expense on Debt.(5) Using IFRS results, Total Debt would be Rp25,807.1 billion, Rp24,399.3 billion and Rp23,672.0 billion
(US$2,610.4 million) as of December 31, 2009, 2010 and 2011, respectively, and Total Stockholders’Equity would be Rp18,574.9 billion, Rp18,702.0 billion and Rp19,455.3 billion (US$2,145.5 million) as ofDecember 31, 2009, 2010 and 2011, respectively, resulting in a Debt to Equity ratio of 139%, 130% and122% as of December 31, 2009, 2010, and 2011, respectively.
(6) Using IFRS results, Total Debt would be Rp25,807.1 billion, Rp24,399.3 billion and Rp23,672.0 billion(US$2,610.4 million) as of December 31, 2009, 2010 and 2011, respectively, and EBITDA would beRp8,797.4 billion, Rp9,652.0 billion and Rp9,596.0 billion for the year ended December 31, 2009, 2010 and2011, respectively, resulting in a Debt to EBITDA ratio of 294%, 253% and 247% as of December 31,2009, 2010 and 2011, respectively.
(7) Using IFRS results, EBITDA would be Rp8,797.4 billion, Rp9,652.0 billion and Rp9,596.0 billion(US$1,058.2 million) for the year ended December 31, 2009, 2010 and 2011, respectively, and InterestExpense would be Rp1,808.6 billion, Rp2,080.3 billion and Rp1,700.1 billion (US$187.5 million) for theyear ended December 31, 2009, 2010 and 2011, respectively, resulting in an EBITDA to Interest Expenseratio of 487%, 464% and 564% as of December 31, 2009, 2010, and 2011 respectively.
From time to time, we may repurchase a portion of our debt securities through open-market transactionsbased on general market conditions.
84
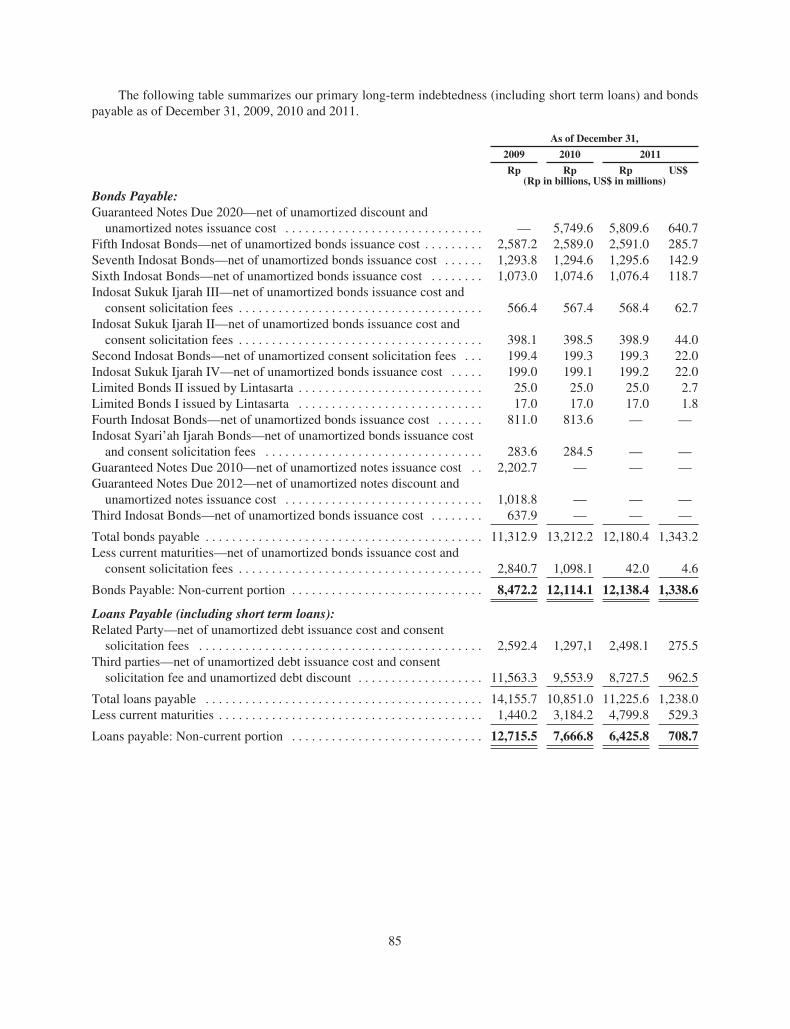
The following table summarizes our primary long-term indebtedness (including short term loans) and bondspayable as of December 31, 2009, 2010 and 2011.
As of December 31,
2009 2010 2011
Rp Rp Rp US$(Rp in billions, US$ in millions)
Bonds Payable:Guaranteed Notes Due 2020—net of unamortized discount and
unamortized notes issuance cost . . . . . . . . . . . . . . . . . . . . . . . . . . . . . . — 5,749.6 5,809.6 640.7Fifth Indosat Bonds—net of unamortized bonds issuance cost . . . . . . . . . 2,587.2 2,589.0 2,591.0 285.7Seventh Indosat Bonds—net of unamortized bonds issuance cost . . . . . . 1,293.8 1,294.6 1,295.6 142.9Sixth Indosat Bonds—net of unamortized bonds issuance cost . . . . . . . . 1,073.0 1,074.6 1,076.4 118.7Indosat Sukuk Ijarah III—net of unamortized bonds issuance cost and
consent solicitation fees . . . . . . . . . . . . . . . . . . . . . . . . . . . . . . . . . . . . . 566.4 567.4 568.4 62.7Indosat Sukuk Ijarah II—net of unamortized bonds issuance cost and
consent solicitation fees . . . . . . . . . . . . . . . . . . . . . . . . . . . . . . . . . . . . . 398.1 398.5 398.9 44.0Second Indosat Bonds—net of unamortized consent solicitation fees . . . 199.4 199.3 199.3 22.0Indosat Sukuk Ijarah IV—net of unamortized bonds issuance cost . . . . . 199.0 199.1 199.2 22.0Limited Bonds II issued by Lintasarta . . . . . . . . . . . . . . . . . . . . . . . . . . . . 25.0 25.0 25.0 2.7Limited Bonds I issued by Lintasarta . . . . . . . . . . . . . . . . . . . . . . . . . . . . 17.0 17.0 17.0 1.8Fourth Indosat Bonds—net of unamortized bonds issuance cost . . . . . . . 811.0 813.6 — —Indosat Syari’ah Ijarah Bonds—net of unamortized bonds issuance cost
and consent solicitation fees . . . . . . . . . . . . . . . . . . . . . . . . . . . . . . . . . 283.6 284.5 — —Guaranteed Notes Due 2010—net of unamortized notes issuance cost . . 2,202.7 — — —Guaranteed Notes Due 2012—net of unamortized notes discount and
unamortized notes issuance cost . . . . . . . . . . . . . . . . . . . . . . . . . . . . . . 1,018.8 — — —Third Indosat Bonds—net of unamortized bonds issuance cost . . . . . . . . 637.9 — — —
Total bonds payable . . . . . . . . . . . . . . . . . . . . . . . . . . . . . . . . . . . . . . . . . . 11,312.9 13,212.2 12,180.4 1,343.2Less current maturities—net of unamortized bonds issuance cost and
consent solicitation fees . . . . . . . . . . . . . . . . . . . . . . . . . . . . . . . . . . . . . 2,840.7 1,098.1 42.0 4.6
Bonds Payable: Non-current portion . . . . . . . . . . . . . . . . . . . . . . . . . . . . . 8,472.2 12,114.1 12,138.4 1,338.6
Loans Payable (including short term loans):Related Party—net of unamortized debt issuance cost and consent
solicitation fees . . . . . . . . . . . . . . . . . . . . . . . . . . . . . . . . . . . . . . . . . . . 2,592.4 1,297,1 2,498.1 275.5Third parties—net of unamortized debt issuance cost and consent
solicitation fee and unamortized debt discount . . . . . . . . . . . . . . . . . . . 11,563.3 9,553.9 8,727.5 962.5
Total loans payable . . . . . . . . . . . . . . . . . . . . . . . . . . . . . . . . . . . . . . . . . . 14,155.7 10,851.0 11,225.6 1,238.0Less current maturities . . . . . . . . . . . . . . . . . . . . . . . . . . . . . . . . . . . . . . . . 1,440.2 3,184.2 4,799.8 529.3
Loans payable: Non-current portion . . . . . . . . . . . . . . . . . . . . . . . . . . . . . 12,715.5 7,666.8 6,425.8 708.7
85

Indosat Bonds
The specific terms of each of our Second Indosat Bonds, Third Indosat Bonds, Fourth Indosat Bonds, FifthIndosat Bonds, Sixth Indosat Bonds and Seventh Indosat Bonds (the “Indosat Bonds”), are discussed below. TheIndosat Bonds are not secured by any specific assets or guaranteed by other parties and rank pari-passu with ourother unsecured debt. We agreed to certain covenants in connection with the issuance of the Indosat Bonds,including but not limited to agreeing to maintain:
• equity capital of at least Rp5,000.0 billion;
• a ratio of total debt to EBITDA of less than 3.5 to 1.00, as reported in each annual consolidatedfinancial report;
• a debt to equity ratio of 2.5 to 1, as reported in each quarterly consolidated financial report; and
• a ratio of EBITDA to interest expense, as reported in each annual consolidated financial report of atleast 3.0 to 1.
On March 24, 2009, we held meetings with holders of our Indonesian rupiah-denominated bonds, includingholders of our Indosat Bonds, and obtained consents to amend the definitions of “Debt” “EBITDA”, to includenew definitions for “Equity” and “Group” and to change the ratio of Debt to Equity from 1.75 to 1 to 2.5 to 1 inthe trustee agreement governing these bonds, pursuant to the terms of the deed of amendment for the Second,Third, Fourth, Fifth and Sixth Indosat Bonds.
Second Indosat Bonds. On November 6, 2002, we issued our Indosat Bonds II (the “Second IndosatBonds”), with fixed and/or floating rates, the only outstanding series of which are the Series B bonds. The SeriesB bonds, with an original face value of Rp200.0 billion, bear interest at a fixed rate of 16.0% per annum and arepayable quarterly for 30 years beginning February 6, 2003. We have the right to redeem the Series B bonds, inwhole but not in part, on each of the 5th, 10th, 15th, 20th and 25th anniversaries of the issuance of the Series Bbonds at a price equal to 101% of the Series B bonds’ nominal value. Holders of the Series B bonds have a putright that allows such holders to demand early repayment from us at a price equal to 100% of the Series B bonds’nominal value at (i) any time, if the rating of such bonds is reduced to “id AA-” or lower or (ii) upon theoccurrence of any of the 15th, 20th and 25th anniversaries of the issuance of the Series B bonds. The Series Bbonds mature on November 6, 2032.
Third Indosat Bonds. On October 22, 2003, we issued our Indosat Bonds III (the “Third Indosat Bonds”). Asof January 1, 2010, the only outstanding series of these bonds were the Series B bonds. The Series B bonds had amaturity date of October 22, 2010, a total face value of Rp640.0 billion, bore interest at a fixed rate of12.875% per annum. Interest on the Third Indosat Bonds was payable on a quarterly basis. On October 22, 2010,we repaid in full the remaining outstanding Third Indosat Bonds.
Fourth Indosat Bonds. On June 21, 2005, we issued our Indosat Bonds IV (the “Fourth Indosat Bonds”).The Fourth Indosat Bonds had a total face value of Rp815.0 billion and matured on June 21, 2011. The FourthIndosat Bonds bear interest at a fixed rate of 12.0% per annum, payable on a quarterly basis. On June 21, 2011,we repaid in full the remaining outstanding Fourth Indosat Bonds.
Fifth Indosat Bonds. On May 29, 2007, we issued our Indosat Bonds V (the “Fifth Indosat Bonds”), in twoseries with a total face value of Rp2,600.0 billion. The Series A bonds, which have a face value of Rp1,230.0billion, will mature on May 29, 2014 and the Series B bonds, which have a face value of Rp1,370.0 billion, willmature on May 29, 2017. The Series A bonds bear interest at a fixed rate of 10.20% per annum and the Series Bbonds bear interest at a fixed rate of 10.65% per annum. After the first anniversary of the issuance of the bonds,we have the right to buy back part or all of the bonds at the market price, either temporarily or for the purpose ofearly settlement.
86

Sixth Indosat Bonds. On April 9, 2008, we issued our Indosat Bonds VI (the “Sixth Indosat Bonds”), in twoseries with a total face value of Rp1,080.0 billion. The Series A bonds, which have a face value of Rp760.0billion, will mature on April 9, 2013 and the Series B bonds, which have a face value of Rp320.0 billion willmature on April 9, 2015. The Series A bonds bear interest at a fixed rate of 10.25% per annum and the Series Bbonds bear fixed interest rate of 10.80% per annum. After the first anniversary of the issuance of the bonds, wehave the right to buy back part or all of the bonds at market price, either temporarily or for the purpose of earlysettlement.
Seventh Indosat Bonds. On December 8, 2009, we issued our Indosat Bonds VII (the “Seventh IndosatBonds”), in two series with a total face value of Rp1,300.0 billion. The Series A bonds, which have a face valueof Rp700.0 billion, will mature on December 8, 2014 and the Series B bonds, which have a face value ofRp600.0 billion, will mature on December 8, 2016. The Series A bonds bear interest at a fixed rate of 11.25% perannum and the Series B bonds bear interest at a fixed rate of 11.75% per annum. After the first anniversary of theissuance of the bonds, we have the right to buy back part or all of the bonds at market price, either temporarily orfor the purpose of early settlement.
Guaranteed Notes due 2010 and Guaranteed Notes 2012
In October 2003, our finance subsidiary, Indosat Finance Company B.V. (“Indosat Finance”), issued theGuaranteed Notes due 2010. The Guaranteed Notes due 2010 have a total face value of US$300.0 million andmature on November 5, 2010. The Guaranteed Notes due 2010 bear interest at a fixed rate of 7.75% per annumpayable in semi-annual installments due on May 5 and November 5 of each year, commencing May 5, 2004. OnJune 22, 2005, our finance subsidiary, Indosat International Finance Company B.V. (“Indosat International”),issued the Guaranteed Notes due 2012. The Guaranteed Notes due 2012 have a total face value of US$250.0million which was issued at 99.3% of their principal amount and mature on June 22, 2012. The Guaranteed Notesdue 2012 bear interest at a fixed rate of 7.125% per annum payable in semi-annual installments due on June 22and December 22 of each year, commencing December 22, 2005.
On May 12, 2010, we, together with Indosat Finance and Indosat International, announced thecommencement by Indosat Finance and Indosat International of cash tender offers to purchase for cash any andall of Indosat Finance’s outstanding Guaranteed Notes due 2010 and Indosat International’s outstandingGuaranteed Notes due 2012. In addition to its offer to purchase the 2010 Notes, Indosat Finance also solicited, asone proposal, consents to certain proposed amendments to the amended and restated indenture, dated as ofJanuary 25, 2006 (the “2010 Indenture”), which would shorten the notice period for optional redemption of theGuaranteed Notes due 2010, and to the release of Indosat International as a guarantor under the 2010 Indenture.
On August 2, 2010, Indosat Finance paid a total of US$174.7 million for the Guaranteed Notes 2010purchased pursuant to the cash tender offer, with a total principal amount of US$167.8 million (for notes whichwere tendered early) and US$0.1 million (for notes tendered after the early tender date) at price equal to102.1875% (for notes which were tendered early) and 101.9375% (for notes tendered after the early tender date),respectively, of the principal amount purchased, plus the accrued and unpaid interest up to settlement date andother additional expenses. On August 10, 2010, Indosat Finance paid a total of US$69.5 million for the purchaseof the remaining portion of the 2010 Notes which were redeemed, with a total principal amount of US$66.9million at a price equal to 101.9375% of principal amount called, plus the accrued and unpaid interest up tosettlement date and other additional expenses.
On August 2, 2010, Indosat International paid a total of US$58.6 million for the 2012 Notes purchasedpursuant to the cash tender offer with a total principal amount of US$55.8 million (for notes which were tenderedearly) and US$0.2 million (for notes tendered after the early tender date) at a price equal to 103.8125% (for noteswhich were tendered early) and 103.5625% (for notes tendered after the early tender date), respectively, of theprincipal amount purchased, plus the accrued and unpaid interest up to settlement date and other additionalexpenses. On September 2, 2010, Indosat International paid a total of US$56.0 million for the purchase of the
87

remaining portion of the 2010 Notes which were redeemed with a total principal amount of US$53.4 million at aprice equal to 103.5625% of principal amount called, plus the accrued and unpaid interest up to settlement dateand other additional expenses.
Guaranteed Notes Due 2020
On July 29, 2010 we, through Indosat Palapa Company B.V. (“Indosat Palapa”) issued our guaranteed Notes2020 with a total face value of US$650.0 million. The notes were issued at 99.478% of their principal amountand mature on July 29, 2020. The notes bear interest at the fixed rate of 7.375% per annum payable in semi-annual installment due on January 29 and July 29 of each year, commencing January 29, 2011. The notes will beredeemable at the option of Indosat Palapa, in while or in part, at any time on or after July 29, 2015 at pricesequal to 103.6875%, 102.4583%, 101.2292% and 100% of the principal amount during the 12-month periodcommencing July 29, 2015, 2016, 2017 and 2018 and thereafter, respectively, plus accrued and unpaid interestand additional amounts, if any. In addition, prior to July 29, 2013, Indosat Palapa may redeem up to a maximumof 35% of the original aggregate principal amount, with the proceeds of one or more public equity offerings of usat a price equal to 107.375% of the principal amount thereof, plus accrued and unpaid interest and additionalamounts, if any. The notes are also redeemable at option of Indosat Palapa or us, in whole but not in part, at anytime, at a price equal to 100% of principal amount thereof, plus any accrued and unpaid interest to (but notincluding) the redemption date any additional amounts, in the event of certain changes effecting withholdingtaxes in Indonesia and the Netherlands. Upon a change in control of Indosat (including sale, transfer, assignment,lease, conveyance or other disposition of all or substantially all of our assets), holders of the notes have the rightto require Indosat Palapa to repurchase all or any part of such holders’ notes at a purchase price equal to 101% ofprincipal amount thereof, plus accrued and unpaid interest and additional amounts, if any, to the purchase date.
The net proceeds, after deducting the underwriting fees and offering expenses, were received on July 29,2010 and used (i) to fund the purchase of the outstanding Guaranteed Notes Due 2010 and Guaranteed Notes due2012 and any consent solicitation relating to, or redemption of, such notes and (ii) to refinance part of our otherexisting indebtedness. The notes are unconditionally and irrevocably guaranteed by Indosat.
Based on the notes indenture, we are required to comply with certain conditions, such as maintaining certainfinancial ratios.
Export Credit Facility
On May 12, 2006, we entered into a term facility agreement with Finnish Export Credit Ltd as the originallender, and The Royal Bank of Scotland, N.V. (formerly known as ABN Amro Bank, N.V.) as the facility agent,for an export credit facility (the “Export Credit Facility”) in the aggregate principal amount of US$38.0 million.The Export Credit Facility tenor is 60 months from the date of the agreement and payments must be made in tenequal installments distributed evenly over the life of the facility. The Export Credit Facility has an interest rate of4.15% per annum, which was calculated with reference to the commercial interest reference rate for U.S. dollars.Once amounts under the Export Credit Facility have been drawn down and repaid, such amounts do not becomeavailable for borrowing on a revolving basis. The Export Credit Facility contains certain financial covenants.During 2009 and 2010, we paid installments on this facility in the amount of US$7.6 million and US$7.6 million,respectively and in May 2011 we repaid the remaining outstanding balance under this facility.
Syari’ah Ijarah Bonds (Sukuk Ijarah)
The specific terms of each of our First Syari’ah Ijarah Bonds, Second Syari’ah Ijarah Bonds, Third Syari’ahIjarah Bonds and Fourth Syari’ah Ijarah Bonds (the “Syari’ah Ijarah Bonds”), are discussed below. The Syari’ahIjarah Bonds are not secured by any specific assets or guaranteed by other parties and rank pari passu with ourother unsecured debt.
88
In connection with the issuance of the Syari’ah Ijarah Bonds, we agreed to maintain certain covenants whichare similar to the covenants contained in our Indosat Bonds. In addition, we are also prohibited from performingactivities which contravene Syari’ah principles. Aside from these prohibitions, there are no material differencesin the covenants between the Syari’ah Ijarah Bonds and the Indosat Bonds. On March 24, 2009, we heldmeetings with holders of our Indonesian rupiah-denominated bonds, including holders of our Syari’ah IjarahBonds, and obtained consents to amend to the definitions of “Debt” and “EBITDA”, to add new definitions for“Equity” and “Group” and to change the ratio of Debt to Equity from 1.75 to 1 to 2.5 to 1 in the trusteeagreement governing these bonds.
First Syari’ah Ijarah Bonds. On June 21, 2005, we issued our Sukuk Ijarah Indosat I (the “First Syari’ahIjarah Bonds”), which contain terms customary for Islamic financing facilities, with Bank Rakyat Indonesiaacting as trustee. The First Syari’ah Ijarah Bonds had a total face value of Rp285.0 billion and matured onJune 21, 2011. Holders of the First Syari’ah Ijarah Bonds received an Ijarah installment fee, payable on aquarterly basis. The total Ijarah installment fee be paid to the holders of the First Syari’ah Ijarah Bonds wasRp34.2 billion per annum. On June 21, 2011, these bonds were paid in full.
Second Syari’ah Ijarah Bonds. On May 29, 2007, we issued our Sukuk Ijarah Indosat II (the “SecondSyari’ah Ijarah Bonds”), which contain terms customary for Islamic financing facilities, with Bank RakyatIndonesia acting as trustee. The Second Syari’ah Ijarah Bonds have a total face value of up to Rp400.0 billionand mature in May 29, 2014. Holders of the Second Syari’ah Ijarah Bonds receive an Ijarah installment fee,payable on a quarterly basis. The total Ijarah installment fee to be paid to the holders of the Second Syari’ahIjarah Bonds is Rp40.8 billion per annum. After the first anniversary of issuance of the Second Syari’ah IjarahBonds, we have the right to buyback part or all of such bonds at the then-prevailing market price.
Third Syari’ah Ijarah Bonds. On April 9, 2008, we issued our Sukuk Ijarah Indosat III (the “Third Syari’ahIjarah Bonds”), which contain terms customary for Islamic financing facilities, with Bank Rakyat Indonesiaacting as trustee. The Third Syari’ah Ijarah Bonds have a total face value of up to Rp570.0 billion and mature inApril 9, 2013. Holders of the Third Syari’ah Ijarah Bonds receive an Ijarah installment fee, payable on aquarterly basis. The total Ijarah installment fee expected to be paid to the holders of the Third Syari’ah IjarahBonds is Rp58.4 billion per annum. After the first anniversary of the issuance of the Third Syari’ah Ijarah Bonds,we have the right to buyback part or all of such bonds at the then-prevailing market price.
Fourth Syari’ah Ijarah Bonds. On December 8, 2009, we issued our Sukuk Ijarah Indosat IV (the “FourthSyari’ah Ijarah Bonds”), which contain terms customary for Islamic financing facilities, with Bank RakyatIndonesia acting as trustee. The Fourth Syari’ah Ijarah Bonds have a total face value of Rp200.0 billion. TheSeries A Syari’ah Ijarah Bonds, which have a face value of Rp28.0 billion, will mature on December 8, 2014 andthe Series B Syari’ah Ijarah Bonds, which have a face value of Rp172.0 billion, will mature on December 8,2016. Holders of the Fourth Syari’ah Ijarah Bonds receive an Ijarah installment fee, payable on a quarterly basis.The total Ijarah installment fee expected to be paid to the holders of the Fourth Syari’ah Ijarah Bonds is Rp3.2billion per annum for the Series A Fourth Syari’ah Ijarah Bonds and Rp20.2 billion per annum for the Series BFourth Syari’ah Ijarah Bonds. After the first anniversary of the issuance of the Fourth Syari’ah Ijarah Bonds, wehave the right to buyback part or all of such bonds at the then-prevailing market price.
Goldman Sachs International Loan Facility
On May 30, 2007, we received from Goldman Sachs International (“GSI”) a loan amounting to Rp434.3billion, which was received in U.S. dollars amounting to US$50.0 million, for the purchase oftelecommunications equipment. The loan will mature on May 30, 2013. The loan bears interest at a fixed annualrate of 8.75%, which is payable quarterly every February 28, May 30, August 30 and November 30, commencingAugust 30, 2007, up to May 30, 2012.
89

The loan agreement provides an option for GSI to convert the loan into a U.S. dollar loan ofUS$50.0 million on May 30, 2012 (the “Conversion Option”). The fair value of the Conversion Option ispresented as part of long-term debt. If GSI exercises such option, starting May 30, 2012, the loan will bearinterest at the fixed annual rate of 6.45% on the principal amount of US$50.0 million. The principal amount inU.S. dollars and interest thereon will be due on May 30, 2013.
We are required to notify GSI regarding of certain events which can result in loan termination, such as(i) certain changes affecting withholding taxes in the United Kingdom or Indonesia, (ii) default under ourGuaranteed Notes due 2012, (iii) default under any notes issued or guaranteed by us where the settlement is inU.S. dollars or default under any notes issued or guaranteed by us where the settlement is in Indonesian rupiah,(iv) redemption, purchase or cancellation of the Guaranteed Notes due 2012 and there being no other U.S. dollarindebtedness outstanding upon such redemption, purchaser or cancellation and (v) a change of control. OnJune 24, 2008, GSI waived its rights to terminate the loan as a result of the change of control triggered by Qtel’sacquisition of a 40.81% interest in our issued and outstanding share capital in June 2008.
Bank Central Asia Loan Facilities
On August 28, 2007, we obtained a five-year Rp1,600.0 billion unsecured credit facility from Bank CentralAsia (“BCA”) for the repayment of our Syndicated Loan Facility II and the purchase of telecommunicationsequipment. The loan bears (i) fixed annual interest rates for the first two years (9.75% on the first year and 10.5%on the second year) and (ii) floating interest rates for the remaining years based on the prevailing annual rate ofthree-month JIBOR plus 1.5% per annum; all interest is payable quarterly. On September 20, 2007, we obtainedan additional credit facility of Rp400.0 billion from BCA. As a result, the aggregate principal amount under ourcredit facility with BCA is Rp2,000.0 billion. The repayment of the loan drawdowns will be made annually, asfollows: (a) 10.0% of the total loan drawdowns in the first and second years after the first drawdown; (b) 15.0%of the total loan drawdowns in the third and fourth years after the first drawdown; and (c) 50.0% of the total loandrawdowns in the fifth year after the first drawdown. On September 27, October 26 and December 27, 2007, wemade the first, second and third loan drawdowns totaling Rp2,000.0 billion. Under the loan agreement, we haveagreed to certain covenants, including maintenance covenants, which are similar to the covenants contained inthe Indosat Bonds. On September 27, 2008, September 25, 2009, September 27, 2010, and September 27, 2011,we paid the first, second, third and fourth semi-annual installment amounting to Rp200.0 billion, Rp200.0 billion,Rp300.0 billion and Rp300.0 billion, respectively.
On September 17, 2008, we entered into a three-year unsecured credit facility agreement with BCAamounting to Rp500.0 billion for the purchase of, and/or the refinancing of debt incurred to purchase,telecommunications equipment. The loan bore interest at 3-month JIBOR plus 2.25% per annum. The repaymentof the loan drawdowns were payable annually, as follows: (a) 20% of the total loan drawdowns in the first year,(b) 30% of the total loan drawdowns in the second year, and (c) 50% of the total loan drawdowns in the thirdyear. On March 16, 2009, we made the loan drawdown amounting to Rp500.0 billion. Voluntary early repayment(in whole or for any part of the loan) was permitted with a penalty of 1% of the prepaid amount. Based on theloan agreement, we were required to comply with certain covenants, such as maintaining certain financial ratios.On March 16, 2010, we paid the first annual installment amounting to Rp100.0 billion. On October 19, 2010, wemade an early repayment of this credit facility, amounting to Rp400.0 billion.
On February 12, 2009, we amended our five-year and three-year BCA credit facility agreements, based onthe consent letter received on February 6, 2009, to change the definitions of “EBITDA”, to insert definitions for“Debt”, “Equity”, and “Group” and to change the ratio of Debt to Equity from 1.75 to 1 to 2.5 to 1 in the loanagreement governing this loan facility. On June 8, 2009, we entered into a five-year unsecured credit facilityagreement with BCA amounting to Rp1,000.0 billion for the procurement of, and/or the refinancing of debtincurred to purchase, telecommunications equipment. The loan Bore interest at 3-month JIBOR plus 4.00% perannum. The repayment of the loan drawdowns were payable annually, as follows: (a) 10% of the total loandrawdowns in the first and second years, (b) 15% of the total loan drawdowns in the third and fourth years, and
90

(c) 50% of the total loan drawdowns in the fifth year. On June 25, 2009, we made the loan drawdown amountingto Rp1,000.0 billion. On June 25, 2010, we paid the first annual installment amounting to Rp100.0 billion.Voluntary early repayment (in whole or for any part of the loan) is permitted, subject to a 1% penalty of theprepaid amount, except for prepayment to refinance this credit facility. Based on the loan agreement, we arerequired to comply with certain covenants, such as maintaining certain financial ratios. On April 28, 2010, wereceived a letter from BCA regarding the change of interest rate from 3-month JIBOR plus 4.00% per annum to3-month JIBOR plus 2.25% per annum, effective on June 25, 2010. On October 19, 2010, we made an earlyrepayment of this credit facility, amounting to Rp900.0 billion.
On February 10, 2011, the Company entered into a credit agreement with BCA for a revolving credit facilitywith a maximum principal amount of Rp1,000.0 billion to fund the Company’s capital expenditures and generalcorporate expenditures. This facility is available from February 10, 2011 to February 10, 2014. On December 1,2011, we entered into an amendment to our credit agreement with BCA to (i) increase the total principal amountavailable under the revolving credit facility to Rp1,500.0 billion, (ii) change the interest rate for drawdowns to1-month JIBOR plus 1.25% per annum, from 1-month JIBOR plus 1.40% per annum, and (iii) to provide that thematurity date of loans made under the revolving credit facility shall be no later than February 10, 2014. Based onthe credit agreement, we are required to comply with certain covenants, such as maintaining certain financialratios. On June 17, 2011, we made our first drawdown of Rp500.0 billion and on July 15, 2011, we repaidRp300.0 billion of the loan. On December 9, 2011, we made a drawdown of the remaining Rp1,300.0 billionavailable under the facility.
Bank Mandiri Loan Facilities
On September 18, 2007, we obtained a five-year unsecured credit facility from Bank Mandiri amounting toRp2,000.0 billion for the purchase of telecommunications equipment. The loan bears interest at (i) fixed annualrates for the first two years (9.75% on the first year and 10.5% on the second year), and (ii) floating rates for theremaining years based on the prevailing annual rate of average three-month JIBOR plus 1.5% per annum; allinterest is payable quarterly. The repayment of the loan drawdowns will be made annually, as follows: (a) 10.0%of the total loan drawdowns in the first and second years after the first drawdown; (b) 15.0% of the total loandrawdowns in the third and fourth years after the first drawdown; and (c) 50.0% of the total loan drawdowns inthe fifth year after the signing date of the agreement. On September 27 and December 27, 2007, we made the firstand second loan drawdowns totaling Rp2,000.0 billion. Based on the loan agreement, we have agreed to certaincovenants, including maintaining certain financial ratios. On September 27, 2008, September 25,2009, September 27, 2010 and September 27, 2011, we paid the first, second, third and fourth annualinstallments, amounting to Rp200.0 billion, Rp200 billion, Rp300 billion and Rp300.0 billion, respectively. OnMarch 23, 2009, we entered into an agreement with Bank Mandiri to amend the definitions of “EBITDA”, toinsert new definitions for “Debt”, “Equity”, and “Group” and to change the ratio of Debt to Equity in the loanagreement governing this loan facility.
On July 28, 2009, we entered into a five-year unsecured credit facility agreement with Mandiri amounting toRp1,000.0 billion for general corporate purposes. The loan bears interest at an average rate of 3-month JIBORplus 4.00% per annum. On July 31, 2009, the Company drew down Rp1,000.0 billion from this credit facility.The repayment of the loan drawdowns are made annually, as follows: (a) 10% of the total loan drawdowns in thefirst and second years from the first drawdown, (b) 15% of the total loan drawdowns in the third and fourth yearsfrom the first drawdown, and (c) 50% of the total loan drawdowns in the fifth year after the signing of theagreement. Voluntary early repayment (in whole or for any part of the loan) is permitted, subject to a 2% penaltyof the prepaid amount. Based on the loan agreement, we were required to comply with certain covenants, such asmaintaining certain financial ratios. On May 20, 2010, we received a letter from Mandiri regarding the change ofinterest rate from average 3-month JIBOR plus 4.00% per annum to average 3-month JIBOR plus 2.25% perannum, effective on May 31, 2010. On July 30, 2010, we paid the first annual installment amounting to Rp100.0billion. On November 15, 2010, we made an early repayment of Rp900.0 billion representing the remainingoutstanding balance of loan drawdowns under this credit facility.
91

On June 21, 2011, we entered into a credit agreement providing for a three-year unsecured revolving creditfacility from Bank Mandiri in a maximum principal amount of Rp1,000.0 billion for working capital, capitalexpenditures and refinancing purposes. On December 5, 2011, we entered into an amendment of the creditagreement with Bank Mandiri to (i) increase the maximum amount available under the loan facility to Rp1,500.0billion and (ii) change the interest rate for drawdowns to 1-month JIBOR plus 1.25% per annum, from 1-monthJIBOR plus 1.40% per annum. This facility is available from June 21, 2011 to June 20, 2014. Each drawdownunder this facility has a term of three months, which may be extended a further three months upon the submissionof a written application for such an extension by Indosat to Bank Mandiri. Based on the credit agreement, we arerequired to comply with certain covenants, such as maintaining certain financial ratios. On August 2, 2011, wemade our first drawdown of Rp300.0 billion and on December 14, 2011, we made a drawdown of the remainingRp1,200.0 billion available under the facility.
Bank DBS Indonesia Loan Facility
On November 1, 2007, we obtained a five-year credit facility from Bank DBS Indonesia for Rp500.0 billionfor the purchase of telecommunications equipment. The loan bears interest at (i) fixed annual rates for the firsttwo years (9.7% on the first year and 10.4% on the second year), and (ii) floating rates for the remaining yearsbased on the prevailing annual interest rate of three-month certificates of Bank Indonesia plus 1.5% per annum;all interest is payable quarterly. The repayment of the loan drawdowns will be made annually, as follows:(a) 10.0% of the total loan drawdowns in the first and second years after the first drawdown; (b) 15.0% of thetotal loan drawdowns in the third and fourth years after the first drawdown; and (c) 50.0% of the total loandrawdowns in the fifth year after the first drawdown. Based on the loan agreement, we have agreed to certaincovenants, including maintaining certain financial ratios. On January 31, 2008, we drew down Rp500.0 billionfrom the facility. On March 25, 2009, we entered into an agreement with Bank DBS Indonesia to insert newdefinitions for “Debt”, “EBITDA”, “Equity”, and “Group” and to change the ratio of Debt to Equity in the loanagreement governing this loan facility. On January 30, 2009, we paid the first annual installment amounting toRp50.0 billion, On March 25, 2009, the Company amended the credit facility agreement based on the consentletter received on February 27, 2009. The amendment included changes in the definition of certain terms and thefinancial ratios required to be maintained. On February 1, 2010, we paid the second annual installmentamounting to Rp50.0 billion. On October 30, 2010, we made an early repayment of this credit facility amountingto Rp400.0 billion.
HSBC Satellite Financing and Loan Facility
On November 27, 2007, we signed two unsecured facility agreements with HSBC France and one unsecuredfacility agreement with The Hongkong and Shanghai Banking Corporation Limited, Jakarta Branch (“HSBCJakarta”) to finance our new telecommunications satellite. These combined export credit and commercialfinancing facilities consist of the following:
• a 12-year term facility agreement amounting to US$157.2 million to finance the payment of 85.0% ofthe French Content under the Palapa-D satellite contract, plus 100% of the COFACE Premium, as suchterms are defined in the facility agreement. The loan bears fixed annual interest at a fixed rate of5.69% per annum, which is payable semi-annually. On March 29, 2010, September 29, 2010,March 29, 2011 and September 29, 2011, we paid the first, second, third and fourth semi-annualinstallments amounting to US$7.9 million each;
• a 12-year term facility agreement amounting to US$44.2 million to finance the payment of 85.0% ofthe amounts payable under the Launch Service Contract (as defined in the term facility agreement) withrespect to our Palapa D Satellite. The loan bears floating interest rate based on U.S. dollars at LIBORplus 0.35% per annum, which is payable semi-annually. On March 29, 2010, September 29, 2010,March 29, 2011 and September 29, 2011, we paid the first, second, third and fourth semi-annualinstallments amounting to US$2.2 million each; and
92

• a nine-year Commercial Facility Agreement amounting to US$27.0 million to finance the constructionand launch of the satellite and the payment of the premium associated with the medium-long termbuyer credit insurance policy issued in connection with the Sinosure Facility. The loan bears floatinginterest rate based on U.S. dollars at LIBOR plus 1.45% per annum, which is payable semi-annually.On March 10, 2008, HSBC Jakarta transferred its rights and obligations under the Commercial FacilityAgreement to PT Bank CIMB Niaga Tbk and Bank of China Limited, Jakarta Branch. OnNovember 27, 2009 we paid the first semi-annual installment amounting to US$1.4 million. OnMay 27, November 29, 2010, May 26, 2011 and November 28, 2011, we paid the second, third, fourthand fifth semi-annual installments, respectively, amounting to US$1.4 million each.
The facilities contain certain financial covenants. On March 18, 2009, we entered into agreements withHSBC France and HSBC Jakarta to amend the definitions of “Debt”, “EBITDA”, and “Equity” and the ratio ofDebt to Equity in our COFACE Term Facility Agreement, Sinosure Term Facility Agreement and CommercialFacility Agreement, as applicable. According to the agreement, we are required to maintain: (i) equity capital inexcess of Rp5,000.0 billion, (ii) a debt to equity ratio not to exceed 2.5:1, (iii) an EBITDA to interest ratio not tobe less than 2.5:1, and (iv) a Debt to EBITDA ratio not to exceed 3.5:1.
In addition, on July 20, 2005, the Company entered into a Corporate Facility Agreement with HSBC, whichhas subsequently been amended several times, to finance our short term working capital needs. The facilityconsists of a combined limit in the amount of US$30.0 million, comprising a revolving loan facility with a limitof US$30.0 million (including revolving loans denominated in rupiah of up to Rp255.0 billion) and an overdraftfacility with a limit of US$2.0 million (including a Rupiah-denominated overdraft facility of up to Rp17.0billion). The expiration date of the facility is April 30, 2012. We have not drawn on this facility as ofDecember 31, 2011.
ING/DBS Syndicated Loan Facility
On June 12, 2008, we entered into a US$450.0 million syndicated loan facility with 13 banks and financialinstitutions, with ING Bank N.V., Singapore Branch and DBS Bank Ltd. serving as arrangers. The amount ofinterest to be paid on the outstanding amount of the loan will be the aggregate of (i) the applicable margin of1.85% per annum for non-Indonesian lenders or 1.90% per annum for lenders resident in Indonesia and(ii) LIBOR. The repayment of the loan drawdowns will be made in semi-annual installments commencingJune 12, 2011. On June 10, 2011 and December 12, 2011 we made our first and second semi-annual repaymentsamounting to US$112.5 million and US$108.0 million, respectively. On February 24, 2009, we entered into anagreement with the majority lenders to amend the definitions of “Debt”, “EBITDA”, and “Equity” and the ratioof Debt to Equity in our ING/DBS Syndicated Loan Facility. Pursuant to the terms of the ING/DBS SyndicatedLoan Facility agreement, as amended by the deed of amendment, we have agreed to certain covenants, includingbut not limited to the following maintenance covenants:
• a ratio of total debt to EBITDA of less than 3.5 to 1;
• a total debt to equity ratio of 2.5 to 1; and
• a ratio of EBITDA to interest expense, as reported as at the end of each financial year and as at the endof each of first three quarters of our financial year, of at least 2.5 to 1.
The repayment of the loan drawdowns will be made semi-annually, as follows: (a) 25% of the total loandrawdowns in the third year after the signing date of the agreement (first repayment date), (b) 24% of the totalloan drawdowns on the sixth month after the first repayment date, (c) 8% each of the total loan drawdowns on the12th and 18th months after the first repayment date, and (d) 35% of the total loan drawdowns on the 24th monthafter the first repayment date.
On September 26 and October 30, 2008, the Company received the first and second drawdowns from thiscredit facility totaling US$450.0 million. As of December 31, 2011, the outstanding balance owed on this facilitytotaled US$229.5 million.
93
AB Svensk Exportkredit (“SEK”) Loan Facility Guaranteed by Export Kredit Namnden (“EKN”)
On August 18, 2009, we obtained credit facilities from SEK, guaranteed by EKN, an export credit agency ofthe Kingdom of Sweden, for the maximum total amount of US$315,000,000 to be used for the purchase ofEricsson telecommunication equipment, with The Hongkong and Shanghai Banking Corporation Limited(“HSBC”), Hong Kong and The Royal Bank of Scotland N.V. (formerly known as ABN AMRO Bank N.V.),Hong Kong Branch as the original lenders and arrangers, while HSBC Bank PLC, London, United Kingdomacted as the facility agent and EKN agent. On September 2, 2009, the original lenders transferred such rights andobligations to SEK, pursuant to the terms of the agreement.
The credit facilities consist of facilities A, B and C with maximum amounts of US$100.0 million, US$155.0million and US$60.0 million, respectively. Facility A bears interest at LIBOR plus 0.25% per annum, togetherwith SEK funding costs and an EKN premium margin. Facility B and Facility C bear interest at 0.05% per annumplus 2.60% per annum plus the EKN Premium Margin. The repayment of each of facilities A, B and C shall bemade in fourteen installments starting six months after May 31, 2009, February 28, 2010 and November 30,2010, respectively. Based on the agreement, we are required to comply with certain covenants, such asmaintaining certain financial ratios, which are substantially the same as the covenants under the ING/DBSSyndicated Loan Facility. In addition, we are required to maintain a minimum consolidated equity of at leastRp5,000.0 billion. As of December 31, 2011, we have drawn US$100.0 million, US$155.0 million and US$60.0million from facilities A, B and C, respectively.
On November 30, 2009, May 27, 2010, November 30, 2010, May 27, 2011 and November 30, 2011, theCompany paid the first, second, third, fourth and fifth semi-annual installments, respectively, for Facility Aamounting to US$7.1 million each. On August 28, 2010, February 28, 2011 and August 25, 2011, the Companypaid the first, second, and third semi-annual installment for Facility B amounting to US$11.1 million each. OnMay 27, 2011 and November 30, 2011, we paid the first and second semi-annual installment for Facility Camounting to US$4.3 million each.
Lintasarta
Lintasarta’s long-term debt comprises of certain investment credit facilities from CIMB Niaga Tbk,formerly PT Bank Niaga Tbk and unsecured limited bonds. As of December 31, 2011, the investment creditfacility from CIMB Niaga totaled Rp22.5 billion, and the outstanding bonds totaled Rp42.0 billion.
Investment Credit Facility V. On July 10, 2007, Lintasarta obtained a credit facility from CIMB Niagaamounting to Rp50.0 billion for the purchase of telecommunications equipment, computers and other supportingfacilities. The loan bears interest at the prevailing annual rate for one-month certificates of Bank Indonesia plus2.25% per annum. We commenced quarterly repayment of the principal on October 10, 2008 in the amount ofRp5.0 billion. On January 10, 2011, this facility was fully repaid.
Investment Credit Facility VI. On February 24, 2009, Lintasarta obtained a credit facility from CIMB Niagaamounting to Rp75.0 billion for the purchase of telecommunications equipment, computers and other supportingfacilities. The loan bears fixed annual interest at a fixed rate of 14.50% per annum (subject to change by CIMBNiaga based on market conditions), which is payable quarterly. The maturity date of the loan is August 24, 2012.The total outstanding principal amount of the loan as of December 31, 2011 was Rp22.5 billion, which isscheduled to be repaid in three installments on February 24, May 24, and August 24, 2012. On February 24,2012, Lintasarta paid the first installment of Rp7.5 billion.
Limited Bonds I. On June 2, 2003, Lintasarta agreed with its stockholders to issue limited bonds tostockholders totaling Rp40.0 billion, including our portion of Rp9.6 billion. Such limited bonds are unsecuredand had an initial maturity date of June 2, 2006. The bonds bear interest at the fixed rate of 16.0% per annum forthe first year and floating interest rates for the following years based on the average three-month time depositrates of PT Bank Mandiri (Persero) Tbk, PT Bank Negara Indonesia (Persero) Tbk, PT Bank Rakyat Indonesia
94

(Persero) Tbk and PT Bank Tabungan Negara (Persero) plus a 3.0% margin, with a maximum rate of 19.0% perannum and a minimum rate of 11.0% per annum. Interest is payable quarterly from September 2, 2003. OnJune 14, 2006, Lintasarta agreed with the holders to extend the maturity date from June 2, 2006 to June 2, 2009and the nominal value of the limited bonds became Rp34.9 billion, including our portion of Rp9.6 billion. OnJune 2, 2009, Lintasarta repaid a portion of the limited bonds amounting to Rp8,303 million. On August 25,2009, the agreement governing the Limited Bonds I was amended to amend the face value of the bonds tobecome Rp26.6 billion, including our portion of Rp9.6 billion, extend the maturity date to June 2, 2012 and toamend the floating interest rate to be based on JIBOR plus 4%, not to exceed 19%, with a minimum floatinginterest rate of 12.75%. On December 28, 2011, Lintasarta repaid a portion of the limited bonds amounting toRp9.6 billion, which is our portion. On February 29, 2012, Lintasarta repaid the remaining Rp17.0 billionoutstanding under these bonds.
Limited Bonds II. On June 14, 2006, Lintasarta entered into an agreement with its stockholders for theformer to issue Limited Bonds II amounting to Rp66.2 billion, including our portion of Rp35.0 billion. Thelimited bonds represent unsecured bonds which were originally set to mature on June 14, 2009 and bore interestat the floating rates determined using the average 3 month rupiah time deposit rates with PT Bank Mandiri(Persero) Tbk, PT Bank Negara Indonesia (Persero) Tbk, PT Bank Rakyat Indonesia (Persero) Tbk and PT BankTabungan Negara (Persero) plus a fixed premium of 3.0%. The maximum limit of the floating rates was19.0% per annum and the minimum limit was 11.0% per annum. The interest is payable on a quarterly basisstarting September 14, 2006. The proceeds of the limited bonds were used for capital expenditure to expandLintasarta’s telecommunications peripherals.
On July 17, 2006, Lintasarta obtained approval from CIMB Niaga on the issuance of the limited bonds.
On June 14, 2009, Lintasarta paid a portion of the Limited Bonds amounting to Rp6.2 billion. Based on theMinutes of the Joint Meeting of Lintasarta’s Boards of Commissioners and Directors held on May 20, 2009, therepresentatives of Lintasarta’s stockholders agreed to extend the maturity date of the remaining Limited Bonds IIof Rp60.0 billion, including our portion of Rp35.0 billion, to June 14, 2012 and to increase the minimum limit ofthe floating interest rates 12.75%. On August 25, 2009, the Limited Bonds II agreement, after being amended toaccommodate the changes in maturity date and minimum limit of floating interest rates, was finalized. OnDecember 28, 2011, Lintasarta repaid Rp35.0 billion of the Limited Bonds amounting to Rp35.0 billion, which isour portion. Subsequently, on February 29, 2012, Lintasarta repaid the remaining Rp25.0 billion outstandingunder the Limited Bonds.
Dividend Practice
Our shareholders determine dividend payouts at the Annual General Meeting of Shareholders pursuant torecommendations from our Board of Directors. At our 2009, 2010 and 2011 Annual General Meetings ofShareholders, our shareholders declared final cash dividends amounting to 50.0% of our net income for each ofthe years ended December 31, 2008, 2009 and 2010, respectively. We intend to continue to recommend payingdividends in such amounts to allow us to meet sound financial governance and investor expectations.
Capital Resources
We believe that our cash flow from operations and drawings from our existing credit facilities will providesufficient financing for our anticipated capital expenditures, anticipated debt repayment and interest obligationsand other operating needs under our current business plan. In addition, if completed, we expect to apply a portionof the cash proceeds from the Tower Sale Transaction towards funding capital expenditures, repayment ofoutstanding debt and general corporate purposes. However, we face liquidity risks if certain events occur,including but not limited to, slower than expected growth in the Indonesian economy, downgrading of our debtratings or deterioration of our financial performance or financial ratios.
95

In the event we cannot finance our planned capital expenditures with internally generated cash flows, wemay seek external sources of funding. Our ability to raise additional debt financing will be subject to certaincovenants in our existing indebtedness. We cannot assure you that we will be able to obtain suitable financingarrangements (including vendor or other third-party financing) for our planned capital expenditures. In the eventthat we are unable to find such additional external funding sources, we may elect to reduce our planned capitalexpenditures. Such reduction in planned capital expenditures may have an adverse effect on our operatingperformance and our financial condition.
Capital Expenditures
Historical Capital Expenditures
From January 1, 2009 through December 31, 2011, we had capital expenditures totaling Rp24,011.2 billion(US$2,647.0 million), which were primarily used to purchase equipment and services from foreign suppliers inconnection with the development of our cellular network. We had capital expenditures of Rp6,911.6 billion(US$762.2 million) during the year ended December 31, 2011, with such investment predominantly focused onoptimizing and enhancing the capacity and quality of our existing cellular, fixed and MIDI network andtelecommunications infrastructure.
Capital Expenditures for 2012
Under our capital expenditure program for our various businesses, our planned capital expenditures are lessthan the amounts spent in 2009 but slightly more than the amounts spent in each of 2010 and 2011. Our capitalexpenditure program currently focuses on optimizing and enhancing the capacity and quality of our existingcellular, fixed and MIDI network and telecommunications infrastructure. For the years ended December 31,2009, 2010 and 2011, our actual consolidated capital expenditures totaled Rp11,584.5 billion, Rp5,515.0 billionand Rp6,911.6 billion (US$762.2 million), respectively. During 2012, we intend to allocate approximatelyRp6,722.1 billion (US$741.3 million) for new capital expenditures, which, taken together with estimated actualcapital expenditures expended for 2012 for capital expenditure commitments in prior periods, will result inapproximately Rp7,638.9 billion (US$842.4 million) total actual capital expenditures for 2012. We intend toallocate our capital expenditures for 2012 as follows:
• Cellular network investment: We plan to apply a large majority of our capital expenditures to financethe continued enhancement and expansion of the capacity and coverage of our cellular network.
• Other investment: We plan to invest the remainder of our capital expenditures budget in non-cellularnetwork areas and continue to provide them with voice, long-distance and MIDI services and makeimprovements to our backbone.
The foregoing amounts represent our budgeted investment plans; actual expenditures on a cash basis willvary depending on several factors, including the method of financing and timing of completion of delivery ofequipment and services purchased. Historically, expenditure on a cash basis trails budgeted expense byapproximately at least 20.0% of our budget. As of December 31, 2011, we had commitments for capitalexpenditures of Rp2,012.1 billion (US$221.9 million), primarily relating to the enhancement and expansion ofthe capacity and coverage of our cellular network.
The foregoing capital expenditure plan is based on our understanding of current market and regulatoryconditions and we may amend our plans in response to changes in such conditions. In particular, depending onthe regulatory framework for other wireless services, we may decide to increase our investment in fixed wirelessaccess networks and services, either through increased capital expenditures, reallocation of our existing plannedexpenditures, through revenue-sharing schemes or a combination of the foregoing. Revenue-sharing schemeswould include partnerships with private investors under which such investors would finance construction of aproject in exchange for revenues from the project, similar to a build-operate-transfer structure.
96

Historically, we have funded our capital expenditures through internal resources and cash flow fromoperations, as well as debt financings through bank loans and the capital markets. We expect to continue tofinance our capital expenditures through such sources. In addition, if completed, we expect to apply a portion ofthe cash proceeds from the Tower Sale Transaction towards funding capital expenditures. Completion of theTower Sale Transaction is subject to various approvals including those of certain of our bondholders and lendersand Tower Bersama’s shareholders. We face liquidity risk if certain events occur, including but not limited to,slower than expected growth in the Indonesian economy, downgrading of our debt ratings or deterioration of ourfinancial performance or financial ratios. If we cannot raise the amounts needed to support our planned capitalexpenditures for 2012, we may be unable to improve or expand our cellular telecommunications infrastructure orupdate our other technology to the extent necessary to remain competitive in the Indonesian telecommunicationsmarket, which would affect our financial condition, results of operations and prospects.
Critical Accounting Policies
Our consolidated financial statements have been prepared in accordance with IFRS. References to IFRSinclude the application of International Financial Reporting Standards, International Accounting Standards(“IAS”), Interpretations of the International Financial Reporting Interpretations Committee (“IFRIC”) and itspredecessor the former Standards Interpretation Committee (“SIC”).
The preparation of these financial statements requires management to make estimates and assumptions thataffect the reported amounts of assets and liabilities as well as the disclosure of contingent assets and liabilities atthe date of the financial statements and the reported amounts of revenues and expenses during the reportingperiod. Management bases its estimates and assumptions on historical experience and other factors that arebelieved to be reasonable under the circumstances. We continually evaluate such estimates and assumptions.Actual results could differ from those estimates under different assumptions or actual conditions. We believethat, of our significant accounting policies, the following may involve a higher degree of judgment orcomplexity.
Goodwill and Other Intangible Assets
The consolidated financial statements and results of operations reflect acquired businesses after thecompletion of the respective acquisition. We account for the acquired businesses using the acquisition method ofaccounting which requires extensive use of accounting estimates and judgments to allocate the purchase price tothe fair market values of the acquiree’s identifiable assets and liabilities at the acquisition date. Any excess in thepurchase price over the estimated fair market values of the net assets acquired is recorded as goodwill in theconsolidated statements of financial position. Thus, the numerous judgments made in estimating the fair marketvalue to be assigned to the acquiree’s assets and liabilities can materially affect our financial performance.
Estimated Useful Lives and Impairment of Property and Equipment
We estimate the useful lives of our property and equipment and intangible assets based on expected assetutilization as anchored on business plans and strategies that also consider expected future technologicaldevelopments and market behavior. The estimation of the useful lives of property and equipment is based on ourcollective assessment of industry practice, internal technical evaluation and experience with similar assets. Theestimated useful lives are reviewed periodically and are updated if expectations differ from previous estimatesdue to physical wear and tear, technical or commercial obsolescence and legal or other limitations on the use ofthe assets. It is possible, however, that future results of operations could be materially affected by changes in theestimates brought about by changes in the factors mentioned above.
The amounts and timing of recorded expenses for any period will be affected by changes in these factorsand circumstances. A reduction in the estimated useful lives of our property and equipment will increase therecorded operating expenses and decrease non-current assets. An extension in the estimated useful lives willdecrease the recorded operating expenses and increase non-current assets.
97

Impairment of non-financial assets
An impairment exists when the carrying value of an asset or cash generating unit exceeds its recoverableamount, which is the higher of its fair value less costs to sell and its value in use. The fair value less costs to sellcalculation is based on available data from binding sales transactions in arm’s length transactions of similarassets or observable market prices less incremental costs for disposing of the asset. The value in use calculationis based on a discounted cash flow model. The cash flows are derived from the budget for the next five years anddo not include restructuring activities that we are not yet committed to or significant future investments that willenhance the asset’s performance of the cash generating unit being tested. The recoverable amount is mostsensitive to the discount rate used for the discounted cash flow model as well as the expected future cash-inflowsand the growth rate used for extrapolation purposes.
Estimation of Pension Cost and Other Employee Benefits
The cost of our defined benefit plan and present value of our pension obligation are determined using theprojected-unit-credit method. Actuarial valuation includes making various assumptions which consist of, amongother things, discount rates, expected rates of return on plan assets, rates of compensation increases and mortalityrates. Actual results that differ from our assumptions are recognized as income or expense when the netcumulative unrecognized actuarial gains and losses at the end of the previous reporting year exceed 10% of thehigher of the present value of the defined benefit obligation and the fair value of plan assets at that date. Due tothe complexity of valuation, the underlying assumptions and their long-term nature, a defined benefit obligationis highly sensitive to changes in assumptions.
While we believe that our assumptions are reasonable and appropriate, significant differences in our actualexperience or significant changes in our assumptions may materially affect the costs and obligations of pensionand other long-term employee benefits. All assumptions are reviewed at each reporting date.
Realizability of Deferred Income Tax Assets
We review the carrying amounts of deferred income tax assets at the end of each reporting period andreduce these to the extent that it is no longer probable that sufficient taxable income will be available to allow allor part of the deferred income tax assets to be utilized. Our assessment on the recognition of deferred income taxassets on deductible temporary differences is based on the level and timing of forecasted taxable income of thesubsequent reporting periods. This forecast is based on our past results and future expectations on revenues andexpenses as well as future tax planning strategies. However, there is no assurance that sufficient taxable incomewill be generated to allow all or part of deferred income tax assets to be utilized.
Estimating Allowance for Impairment Losses on Receivables
If there is objective evidence that an impairment loss has been incurred in trade receivables, we estimate theallowance for impairment losses related to their trade receivables that are specifically identified as doubtful forcollection. The level of allowance is evaluated by management on the basis of factors that affect the collectabilityof the accounts. In these cases, we use judgment based on the best available facts and circumstances, includingbut not limited to, the length of our relationship with the customers and the customers’ credit status based onthird-party credit reports and known market factors, to record specific reserves for customers against amountsdue in order to reduce our receivables to amounts that they expect to collect. These specific reserves arere-evaluated and adjusted as additional information received affect the amounts estimated.
In addition to specific allowance against individually significant receivables, we also assess a collectiveimpairment allowance against credit exposure of our customers which are grouped based on common creditcharacteristic, which, although not specifically identified as requiring a specific allowance, have a greater risk ofdefault than when the receivables were originally granted to customers. This collective allowance is based on
98

historical loss experience using various factors such as historical performance of the customers within thecollective group, deterioration in the markets in which the customers operate, and identified structuralweaknesses or deterioration in the cash flows of customers.
Determination of Fair Values of Financial Assets and Financial Liabilities
We carry certain financial assets and liabilities at fair values, which require extensive use of accountingestimates and judgments for the fair values of financial assets and liabilities. Where the fair value of financialassets and financial liabilities recorded in the statements of financial position cannot be derived from activemarkets, their fair value is determined using valuation techniques including the discounted cash flow model. Theinputs to these models are taken from observable markets where possible, but where this is not feasible, a degreeof judgment is required in establishing fair values. The judgments include considerations of inputs such asliquidity risk, credit risk and volatility. Changes in assumptions about these factors could affect the reported fairvalue of financial instruments. Any change in fair value of these financial assets will directly affect ourconsolidated statements of financial position, statements of comprehensive income and or consolidatedstatements of changes in equity.
Leases
We are a party to various lease agreements either as a lessee or a lessor in respect of certain property andequipment. As provided in IAS 17, “Leases,” a lease is classified as a finance lease if it transfers substantially allthe risks and rewards incidental to ownership and as an operating lease if it does not.
As a lessee, our finance leases are capitalized at the commencement of the lease at the fair value of theleased property or, if lower, at the present value of the minimum lease payments. Finance lease payments areapportioned between finance charges and reduction of the lease liability so as to achieve a constant rate ofinterest on the remaining balance of the liability. Finance charges are recognized in finance costs in theconsolidated statement of comprehensive income. An asset subject to a finance lease is depreciated over itsuseful life. However, if there is no reasonable certainty that we will obtain ownership by the end of the leaseterm, the asset is depreciated over the shorter of its estimated useful life and the lease term. The current portionof obligations under finance leases are presented as part of Other Current Financial Liabilities. In contrast,operating lease payments are recognized as an operating expense in the consolidated statement of comprehensiveincome on a straight-line basis over the lease term.
We have classified a number of our tower leases as finance leases due to the fact that these leases meet atleast one of the eight factors set out in IAS 17 to be considered when determining whether substantially all therisks and rewards incidental to ownership have been transferred. All of our other leases are classified as operatingleases.
As a lessor, our finance leases are presented as a Finance Lease Receivable in an amount equal to the netinvestment in the lease in our statement of financial position. The current portion of Finance Lease Receivable ispresented as part of Other Current Financial Assets—Net. Selling profits or losses are recognized in the periodduring which such sale was made, in accordance with the policy followed by us for outright sales.
We have classified a number of our tower leases as finance leases due to the fact that these leases meet atleast one of the eight factors set out in IAS 17 to be considered when determining whether substantially all therisks and rewards incidental to ownership have been transferred. All of our other leases are classified as operatingleases.
99
The classification of leases under which we are either a lessee or a lessor requires that we make judgmentsand estimates in determining whether substantially all of the risks and rewards incidental to ownership of theleased assets have been transferred. While we believe our classification of certain of our tower leases as financeleases is reasonable and appropriate, we continue to evaluate the most appropriate treatment of these towerleases.
New Accounting Standards and Interpretations to Existing Standards Effective Subsequent toDecember 31, 2011
Please see Note 2—Summary of Significant Accounting Policies to the accompanying consolidatedfinancial statements in Item 19 for a discussion of new accounting standards that will become effectivesubsequent to December 31, 2011 and their anticipated impact on our consolidated financial statements for thecurrent and future periods.
C. RESEARCH AND DEVELOPMENT, PATENTS AND LICENSES, ETC.
For the three years ended December 31, 2009, 2010 and 2011, we did not conduct significant research anddevelopment activities.
D. TREND INFORMATION
Please refer to the introductory discussion to “—Operating and Financial Review and Prospects—OperatingResults” above for a detailed discussion of significant trends impacting our operating results and financialcondition. See also “Item 3: Key Information—Risk Factors” for more information regarding why reportedfinancial information may not necessarily be indicative of future operating results.
In January and December 2011, the Company and Lintasarta, respectively, each introduced anorganizational restructuring which forms part of our transformation program that began in 2009 to increase theour productivity and improve our longer-term operating results. We and Lintasarta each offered specialcompensation packages to employees who meet certain criteria as determined by us and Lintasarta respectively,and who opted to end their employment relationship with the us or Lintasarta, respectively, as part of suchorganizational restructuring under our and Lintasarta’s voluntary separation scheme (“VSS Program”). As ofDecember 31, 2011, there were 994 and 54 employees of the Company and Lintasarta, respectively, whoparticipated in the VSS Program.
E. OFF-BALANCE SHEET ARRANGEMENTS
As of December 31, 2011, we had no off-balance sheet arrangements that were reasonably likely to have acurrent or future effect on our financial condition, changes in financial condition, revenues or expenses, results ofoperations, liquidity, capital expenditures or capital resources that is material to investors.
F. TABULAR DISCLOSURE OF CONTRACTUAL OBLIGATIONS
As of December 31, 2011, we had contractual obligations in the amount of US$1,442.4 million in U.S.dollar denominated contracts and Rp14,668.2 billion in Indonesian rupiah-denominated contracts. The U.S.dollar denominated contractual obligations require payments totaling US$279.8 million in 2012,US$301.3 million from 2013 to 2014 and US$131.2 million from 2015 to 2016 and US$730.1 million from 2017and thereafter. The Indonesian rupiah-denominated contractual obligations require payments totalingRp4,567.9 billion in 2012, Rp5,913.3 billion from 2013 to 2014, Rp1,383.0 billion from 2015 to 2016 and
100

Rp2,804.0 billion from 2017 and thereafter. The table below sets forth information relating to certain of ourcontractual obligations as of December 31, 2011:
Payments due by the periods ending December 31
Total 2012 2013-2014 2015-20162017 andthereafter
Rp US$ Rp US$ Rp US$ Rp US$ Rp US$
(Rp in billions and US$ in millions)
Contractual obligations:Loans payable (including
short term loans)(1) . . . . . 5,456.8 653.8 3,522.5 141.2 1,934.3 301.3 — 131.2 — 80.1Bonds payable(1) . . . . . . . . 6,392.0 650.0 42.0 — 3,688.0 — 1,092.0 — 1,570.0 650.0Obligation under finance
lease . . . . . . . . . . . . . . . . 1,160.4 — 145.4 — 291.0 — 291.0 — 433.0 —Purchase obligations . . . . . 834.5 129.9 834.5 129.9 — — — — — —Other non-current
liabilities(2) . . . . . . . . . . . 824.5 8.7 23.5 8.7 — — — — 801.0 —
Total contractual cashobligations . . . . . . . . . . 14,668.2 1,442.4 4,567.9 279.8 5,913.3 301.3 1,383.0 131.2 2,804.0 730.1
(1) These amounts exclude the related contractual interest obligations and have been calculated under theassumption that the options related to any loans and bonds payable are not exercised.
(2) These amounts exclude committed expenditures with respect to leases entered into in connection with theTower Sale Transaction, which are contingent on the closing of the Tower Sale Transaction.
Item 6: DIRECTORS, SENIOR MANAGEMENT AND EMPLOYEES
Directors and Senior Management
In accordance with Indonesian law, we have a Board of Commissioners and a Board of Directors. The twoboards are separate, and no individual may be a member of both boards.
Board of Commissioners
Our Board of Commissioners consists of ten members, one of whom is designated the PresidentCommissioner. The members of the Board of Commissioners are elected and dismissed by shareholders’resolutions at a general meeting of shareholders, provided that one member of the Board of Commissioners shallbe nominated by the holder of the one Series A share. In accordance with regulations of the Indonesian CapitalMarket and Financial Institution Supervisory Agency, or BAPEPAM-LK, and Indonesia Stock Exchange rules,four commissioners have been designated as Independent Commissioners: George Thia Peng Heok, AlexanderRusli, Soeprapto S.IP and Chris Kanter. On October 14, 2011, Mr. Parikesit Suprapto resigned from the Board ofCommissioners, effective December 13, 2011. As of April 23, 2012, our Board of Commissioners consisted ofnine members as listed below:
Name AgeCommissioner
Since Position
Abdulla Mohammed S.A. Al Thani . . . . . . . . . . . . . . . . . . . . . . 52 2008 President CommissionerDr. Nasser Mohammed Marafih . . . . . . . . . . . . . . . . . . . . . . . . 51 2008 CommissionerRichard Farnsworth Seney . . . . . . . . . . . . . . . . . . . . . . . . . . . . . 57 2009 CommissionerRachmat Gobel . . . . . . . . . . . . . . . . . . . . . . . . . . . . . . . . . . . . . . 49 2008 CommissionerRionald Silaban . . . . . . . . . . . . . . . . . . . . . . . . . . . . . . . . . . . . . 46 2008 CommissionerGeorge Thia Peng Heok . . . . . . . . . . . . . . . . . . . . . . . . . . . . . . . 63 2008 Independent CommissionerAlexander Rusli . . . . . . . . . . . . . . . . . . . . . . . . . . . . . . . . . . . . . 41 2010 Independent CommissionerSoeprapto S.IP . . . . . . . . . . . . . . . . . . . . . . . . . . . . . . . . . . . . . . 65 2005 Independent CommissionerChris Kanter . . . . . . . . . . . . . . . . . . . . . . . . . . . . . . . . . . . . . . . . 60 2010 Independent Commissioner
101
Set forth below is a brief biography of each of our Commissioners.
Sheikh Abdulla Mohammed S.A Al Thani has been the President Commissioner since August 2008. SheikhAbdulla is currently the Chairman of the Board of Directors of Qatar Telecom (Qtel) and the Qtel Group. In hiscapacity as Chairman, Sheikh Abdullah represents a wide range of business skills, experience and knowledge. Hehas helped enhance Qtel’s corporate governance system to ensure Qtel is directed and controlled in line withinternational practices, thereby reinforcing both corporate accountability and the sustained creation ofshareholder wealth. Sheikh Abdulla has previously held several high profile positions in Qatar including theChief of the royal Court (Amiri Diwan), a role he filled from 2000 to 2005. His Excellency enjoys the status of aminister, and he is also a member of the Qatari Planning Council. He graduated as a Pilot in the British Army AirCorps and completed his studies at the Senior Military War College for the Armed Forces in the United States ofAmerica.
Dr. Nasser Mohammed Marafih has been a Commissioner at Indosat since August 2008 and is the Chairmanof the Remuneration and Budget Committee. Dr. Marafih is the Chief Executive Officer (CEO) of the QtelGroup. He began his career at Qatar Telecom (Qtel) in 1992 as an expert advisor from the University of Qatarand was involved in the introduction of the first GSM service in the Middle East in February 1994. Dr. Marafihhas spearheaded Qtel’s global growth in recent years, including Qtel’s acquisition of Wataniya Telecom, itsstrategic deal with AT&T to gain an equity stake in NavLink, Qtel’s strategic partnership with ST Telemedia inSingapore, as well as the company’s purchase of a controlling stake in Indosat. Dr. Nasser sits on the board ofDirectors of the GSM Association, which represents the interests of the worldwide mobile communications.Dr. Marafih holds a Bachelor of Science in Electrical Engineering, a Master of Science and a Ph.D. inCommunication Engineering, all from George Washington University in the United States.
Richard Farnsworth Seney has been a Commissioner since June 2009. Mr. Seney has served as ChiefOperating Officer of Qtel International (QI) from 2007 to 2011, President and Chief Executive Officer of MCTCorp. (including predecessors) from 1992 to 2007, Executive Vice President and General Manager of MCTInvestors, L.P. from 1987 to 2002, and Executive Vice President and Chief Financial Officer of CharismaCommunications Corporation from 1985 to 1987. Mr. Seney received a Bachelor degree in Commerce from theUniversity of Virginia McIntire School of Commerce.
Rachmat Gobel has been a Commissioner since 2008. Currently he is the Chairman of the Gobel Group ofcompanies that has operations in manufacturing, trading, services, integrated logistics management as well asfood and hospitality, including industrial catering. In 1960, Gobel Group entered into a technical assistanceagreement with Panasonic Corporation (formerly Matsushita Electric Industrial Co., Ltd.), one of the world’sleaders in electronics and electrical goods. Since 1970 Gobel Group has been the Indonesian joint venture partnerof Panasonic Mr. Gobel also holds other high level positions) including as a Commissioner of PT Smart Tbk., theVice Chairman of the Board of Advisors of the Indonesian Chamber of Commerce and Industry (KADINIndonesia/Kamar Dagang dan Industri Indonesia), the Vice Chairman of the Employers Association of Indonesia(APINDO/Asosiasi Pengusaha Indonesia), and the Chairman of the Federation of Electronic & TelematicsAssociation (F.GABEL). He has also been appointed as a member of the National Innovation Committee (KEN/Komite Inovasi Nasional) by President Susilo Bambang Yuhoyono. Mr. Gobel graduated with a Bachelor ofScience degree in International Trade from Chuo University, Tokyo in 1987 and was awarded an HonoraryDoctorate Degree from Takushoku University, Tokyo, Japan in 2002. In 2009, he received the prestigious“Distinguished Engineering Award in Manufacturing Technology” in the Field of Manufacturing Technology”(“Perekayasa Utama Kehormatan dalam Bidang Teknologi Manufaktur”) from the Agency for the Assessmentand Application Technology (BPPT/Badan Pengkajian dan Penerapan Teknologi). In 2009, he also received the“BNSP-Competency Award” from the National Agency for Certification of Professions (BNSP/Badan NasionalSertifikasi Profesi), Ministry of Manpower and Transmigration of the Republic of Indonesia. In 2011, hereceived the prestigious “Asian Productivity Organization Regional Award”, for his contributions to improvingproductivity in Indonesia’s industry sector and demonstrating the significant role of private-sector leaders inintroducing sustainable development through Green Productivity and forging strategic partnerships with the rest
102

of Asia and the Pacific, from the Asian Productivity Organization, Tokyo, Japan. Mr. Gobel is also activelyinvolved in numerous social activities, including the Indonesian Red Cross.
Rionald Silaban, has been a Commissioner since June 2008 and was appointed as a member of the RiskManagement Committee in the same year. He currently serves as Senior Advisor to the Minister of Finance and,since 2008, as the Director of the Center for Policy Analysis and Harmonization of the Ministry of Finance inIndonesia. In the past he held several positions including Director of Fiscal Risk Management of the Ministry ofFinance from 2006 to 2008, Senior Advisor at the World Bank in Washington D.C., U.S. from 2004 to 2006,Division Head in Secretariat General of the Ministry of Finance from 2002 to 2004, Head of the AssetsMonitoring Division of the Indonesian Banking Restructuring Agency from 2000 to 2002, Division Head forFinancial Service of the Legal Bureau of the Ministry of Finance from 1998 to 2000, Deputy Director forPrivatization of Directorate General State-Owned Enterprise of the Ministry of Finance from 1997 to 1998, Headof Section of the Legal Bureau of the Ministry of Finance from 1994 to 1997 and Head of Secretariat forPrivatization Committee of Ministry of Finance from 1994 to 1997. Mr. Silaban received a law degree from theUniversity of Indonesia in 1989 and a LL.M. degree from the Georgetown University Law Center, WashingtonD.C. in the United States, in 1993.
George Thia Peng Heok has been an Independent Commissioner since June 2008 and Chairman of the AuditCommittee since July 2008. Mr. Thia currently serves as Director/Consultant in Asiainc Private Limited. In thepast he has held several positions including as Consultant/Director, Strategic Advisory Private Limited from2003 to 2006, Executive Chairman, MediaStream Limited from 1999 to 2003, Director/Consultant, PhoenixCapital Private Limited from 1995 to 1998, Executive Chairman, Asia Matrix Limited from 1993 to 1995,Managing Director, Lum Chang Securities Private Limited from 1991 to 1993, Managing Director, Sun HungKai Securities Private Limited from 1989 to 1991, Managing Director, Merrill Lynch International Bank Limitedfrom 1987 to 1989, Executive Director/Partner, Kay Hian Private Limited from 1985 to 1987 and ManagingDirector, Morgan Grenfell (Asia) Limited from 1975 to 1985. Mr. Thia is a Certified Public Accountant and aFellow Member of both the Chartered Association of Certified Accountants (United Kingdom) and the SingaporeInstitute of Directors.
Alexander Rusli has been an Independent Commissioner since January 2010 and currently serves as memberof our Remuneration Committee. Mr. Rusli is a Managing Director in Northstar Pacific, a Private Equity fundwhich focuses on Indonesian opportunities. Mr. Rusli is also an independent commissioner of PT Krakatau Steel(Persero), the majority state-owned company that is the largest producer of steel products in Indonesia and are ofthe largest steel producers in Southeast Asia. He was formerly Expert Advisor to the Minister for State-OwnedEnterprises, with oversight of 140 State-owned enterprises and more than 500 subsidiaries. Prior to such time, hewas an Expert Advisor to the Minister of Communications and Information Technology, where he was involvedin the formulation of policy and regulation in the Telecommunication, Media and Postal industries. Prior to hisposts in government, Mr. Rusli has also held a position as a Principal Consultant for Pricewaterhouse CoopersManagement Consulting, Indonesia.
Soeprapto S.IP has been an Independent Commissioner and a member of the Audit Committee since June2005. In the past, Mr. Soeprapto has held several positions, including as Assistant Personnel to the Army Chiefof Staff of the Republic of Indonesia from 2000 to 2001, and currently serves as a Commissioner of each of PTPadangbara Sukses Makmur, since 2008, and PT Sawit Kaltim Lestari since 2010. Mr. Soeprapto earned a degreein Political Science from the Terbuka University, Jakarta and participant of the Regular Course (KRA 29) in1996 at the Indonesian National Resiliance Institute (LEMHANAS).
Chris Kanter has been Independent Commissioner since January 2010. Mr. Kanter is an Indonesianbusinessman and business community leader, who is at the forefront of the national economic reform agenda inIndonesia. A trained engineer, he is the Chairman and Founder of Sigma Sembada Group, a major turnkeycontractor, with operations in the transportation and logistics segments as well. In 2011 he was appointed by thePresident of Indonesia to serve as a member of National Economic Council. Mr. Kanter also serves as Chairman
103
of the Board of Founders of the Swiss German University, Vice Chairman of National Board of the EmployersAssociation of Indonesia (APINDO), Chairman of Board of Founders of the Global Entrepreneurship ProgramIndonesia and Vice President Commissioner of PT. Bank BNP Paribas Indonesia. Mr. Kanter also served as amember of the Peoples Consultative Congress (MPR) of the Republic of Indonesia from 1998 to 2002.Mr. Kanter is a graduate of the Faculty of Engineering, Trisakti University, Indonesia.
The term of each of the Commissioners concludes at the close of the fourth annual general meeting ofshareholders after the date of appointment, expiring in 2012 for the current Commissioners. A Commissionermay be removed prior to the expiration of his term of office at a general meeting of the shareholders. TheCommissioners’ business address is Jalan Medan Merdeka Barat 21, Jakarta, 10110, Republic of Indonesia.
Board of Directors
Our Board of Directors is responsible for our overall management and day-to-day operations under thesupervision of the Board of Commissioners. The Board of Directors consists of at least three members, includingone President Director. The members of the Board of Directors are elected and dismissed by shareholders’resolutions at a general meeting of shareholders, provided that one member of the Board of Directors shall benominated by the holder of the one Series A share. As of December 31, 2011, our Board of Directors consisted offive members as listed below:
Name AgeDirector
Since Position
Harry Sasongko Tirtotjondro . . . . . . . . . . . . . . . . 52 2009 President Director & Chief Executive OfficerFadzri Sentosa . . . . . . . . . . . . . . . . . . . . . . . . . . . 48 2007 Director & Chief Wholesale and
Infrastructure OfficerCurt Stefan Carlsson . . . . . . . . . . . . . . . . . . . . . . 40 2011 Director & Chief Financial OfficerHans Christiaan Moritz . . . . . . . . . . . . . . . . . . . . 57 2011 Director & Chief Technology OfficerLaszlo Imre Barta . . . . . . . . . . . . . . . . . . . . . . . . 43 2010 Director & Chief Commercial Officer
Set forth below is a brief biography of each of our Directors:
Harry Sasongko Tirtotjondro was appointed as President Director & Chief Executive Officer in August2009. Mr. Sasongko has previously held the positions of President Director and Chief Executive Officer of GEConsumer Finance from 2005 to 2009, where he was recognized as one of Indonesia’s top 10 best CEOs in 2008by the SWA Magazine & Synovate awards. From 1998 to 2005, he was a member of the Lippo Group, where heserved as Managing Director of Lippo Bank & Matahari Retail. He was formerly the Managing Director of theConsumer Banking of PT Bank Tiara Asia from 1995 to 1998, and was Director at Citibank, N.A. and PTCiticorp Finance in 1998. Mr. Sasongko earned a Bachelor’s degree in Civil Engineering from Bandung Instituteof Technology Indonesia, a Master of Science degree from the Ohio State University in the United States, and isa Chartered Financial Consultant (ChFC), obtained from the Singapore College of Insurance / American Collegein the United States.
Fadzri Sentosa was appointed as a Director in June 2007 and as Director & Chief Wholesale andInfrastructure Officer in June 2009. Currently, Mr. Sentosa is a member of the Board of Commissioners of PTAplikanusa Lintasarta. Mr. Sentosa has previously held various positions with us, including as member of theBoard of Commissioners of PT Indosat Mega Media from 2005 to 2009, Group Head of National Card andChannel Management from 2006 to 2007, Senior Vice President of Commerce, Jabotabek Region from 2005 to2006 and Senior Vice President of Cellular Sales from 2003 to 2004, member of the Board of Directors ofSatelindo in 2003 and a member of the Board of Director of IM3 from 2002 to 2003. Mr. Sentosa received aMaster degree in International Business Management from the University of Technology, Sydney in 2001 and aBachelor degree in Telecommunications Engineering from the Bandung Institute of Technology in 1986.
104
Curt Stefan Carlsson was appointed as Director & Chief Financial Officer in September 2011. Mr. Carlssonhas previously held various positions, including Chief Operations Advisor at wi-tribe Philippines since January2011, he held a transitional advisory role at Telenor Asia from August 2010 to December 2010, Chief FinancialOfficer at DiGi.Com Bhd and at DiGi Telecommunications Sdn Bhd, Selangor, Malaysia from November 2006to July 2010, Chief Financial Officer at Telenor Pakistan Pvt. Ltd (TP) from June 2004 to October 2006, ChiefFinancial Officer at Telenor Mobile Sverige (TMS), Sweden, from August 2001 to May 2004, Chief FinancialOfficer at Mobyson, Norway from May 2000 to July 2001 and an Auditor at PriceWaterhouse Coopers, Sweden,from September 1997 to April 2000, He holds a MSc degree in Business and Economics from the University ofUppsala, Sweden in 1997.
Hans Christiaan Moritz was appointed as Director & Chief Technology Officer in February 2011 andassumed his duties on May 1, 2011. Mr. Moritz has 25 years experience in the Mobile Telecom industry and haspreviously held various positions, including Head Corporate Project Officer at Vodafone India from 2009 to2011, Group Operations Director Africa/Chief Technology Officer at Zain from 2006 to 2009, Chief TechnologyOfficer at Zain Uganda from 2004 to 2006, Chief Operating Officer at KPN Internet, from 2003 to 2004, GeneralManager of the Business Unit Broadband Network at KPN Telecom from 2001 to 2003, Chief Operating Officerat BASE and from 1998 to 2000, Operations Director Asia (based in Indonesia) at KPN Asia from 1994 to 1997.Mr. Moritz received a Master degree in Mathematics in 1986 and various Bachelor degrees, i.e Electronics in1978, Feedback and Control Systems in 1984 and Water Management in 1984.
Laszlo Imre Barta was appointed as Director & Chief Commercial Officer in May 1, 2010. He was formerlythe Deputy Chief Marketing Officer of Grameenphone in Bangladesh. He spent more than four years atGrameenphone in Bangladesh, during which time he developed and led the rollout of the business marketstrategy, established and led the SME department, and served as Sales Director. Prior to being seconded toGrameenphone by the Telenor Group, Mr. Barta was at Pannon GSM in Hungary, where he headed the CorporateClients department. Before Pannon, Mr. Barta was with Ericsson Hungary where he led the sale of handsets andaccessories to local Hungarian mobile operators. He joined Ericsson from Philip Morris, where he started hiscareer in Sales. Mr. Barta received a Postgraduate Award in Management Studies from the Szamalk OpenBusiness School, Budapest in 2004 and has degrees in Accounting and Landscape Architecture & Engineeringfrom Hungarian universities.
The Directors’ terms of appointment end at the close of the fifth annual general meeting after the date oftheir appointment. At a general meeting of shareholders, the shareholders may remove any Director before theexpiration of his term of office. A Director’s term of office will automatically terminate upon bankruptcy, if he isput under custody by court order, upon his resignation or death or in the event that the Director is prohibited bylaw from holding such position. In the event any member of the Board of Directors resigns, a written notice ofsuch resignation must be submitted by the resigning Director to us, for the attention of the Board ofCommissioners and Board of Directors. We are required to convene a general meeting of shareholders to resolvesuch resignation within 60 days after we receive the resignation letter. Within 45 days after a vacancy is createdon the Board of Directors that causes the number of members of the Board of Directors to be less than theminimum required number of Directors as stipulated in our Articles of Association, a general meeting ofshareholders must be convened to fill the vacancy. A member of the Board of Directors may not assume aconcurrent position, which may cause a conflict of interest, directly or indirectly, with our interests. A member ofthe Board of Directors may assume a concurrent position that does not cause a conflict of interest, subject to theapproval of the Board of Commissioners and notification to a general meeting of shareholders. Should thePresident Director want to assume a concurrent position of this type, the approval of a general meeting ofshareholders is also required. The business address of the Board of Directors is Jalan Medan Merdeka Barat 21,Jakarta, 10110, Republic of Indonesia.
None of our Commissioners or Directors has a service contract with us, nor are any such contracts proposedor under consideration. There is no family relationship between or among any of the Commissioners or Directorslisted above.
105
Compensation of Commissioners and Directors
For their services, our Commissioners and Directors are entitled to remuneration, which is determined bythe annual general meeting of shareholders. The net amount of remuneration paid to our Commissioners andDirectors for the year ended December 31, 2011, including basic compensation and short and long-termincentives, was Rp39.4 billion (US$4.3 million).
The remuneration of our Directors is determined by the Board of Commissioners, pursuant to a delegationof authority by the shareholders in a general meeting. In making its determination, the Board of Commissionersmust consider any recommendations provided by our Remuneration Committee and must report thedetermination to our shareholders at the annual general meeting of shareholders. Since 2006, semi-annualincentives were eliminated and we introduced a Restricted Share Unit plan as a long-term incentive forCommissioners and an Economic Profit Sharing Plan for Directors which is divided into cash bonus payment asshort-term incentive and Restricted Share Unit Plan as long-term incentive.
Pension, Retirement and Other Benefits
We and Lintasarta have defined benefit and contribution pension plans that cover substantially all of ourqualified permanent employees. PT Asuransi Jiwasraya, a state-owned life insurance company, manages theplans and the amount of pension benefits to be paid upon retirement is based on the employees’ most recent basicsalary and their number of years of service.
For the year ended December 31, 2011, we, Lintasarta and IM2 incurred a total benefit of Rp48.1 billion forpension, post-retirement benefits (i.e., benefits under Labor Law 13) and post-retirement healthcare for ouremployees. As of December 31, 2011, we and Lintasarta also recognized total prepaid pension costs of Rp105.3billion, while we, Lintasarta and IM2 recognized total accrued liability of post-retirement benefits and post-retirement healthcare of Rp767.7 billion. For more information about our pension plan, including the totalamount set aside to provide pension, retirement or similar benefits, see Note 21 and Note 28 to our auditedconsolidated financial statements.
Board Practices
Our Board of Commissioners acts as our overall supervisory and monitoring body with principal functionsincluding reviewing our development plan, monitoring the performance of our work plan and reviewing andapproving our budget. It is required to perform its duties, authorities and responsibilities in accordance with theprovisions of our Articles of Association and resolutions of the shareholders’ general meeting. Decisions abovecertain monetary thresholds must be referred by our Board of Directors to our Board of Commissioners orshareholders for their review and approval. In carrying out its supervisory activities, the Board of Commissionersrepresents the interests of our Company.
Meetings of our Board of Commissioners must be held at least once every three months, or when deemednecessary by the President Commissioner or upon request of at least one-third of the total members of the Boardof Commissioners. A meeting of the Commissioners may make lawful and binding decisions only if a majority ofthe Commissioners are present or represented. At any meeting each Commissioner is entitled to one vote and, inaddition, may cast one vote for each Commissioner he is representing. A Commissioner may be represented at ameeting of the Commissioners only by another Commissioner appointed pursuant to a power of attorney. Exceptas otherwise provided in our Articles of Association, resolutions of the Board of Commissioners must be adoptedby deliberation and consensus. If no agreement is reached through this method, resolutions must be passed by asimple majority of the Commissioners. In the event of a tie vote, the proposal is deemed rejected unless thematter concerns an individual, in which case the President Commissioner may cast the deciding vote. The Boardof Commissioners may adopt lawful and binding decisions without convening a meeting of the Commissioners ifall of the members of the Board of Commissioners approve and sign the decision.
106

Our Board of Directors is generally responsible for managing our business in accordance with applicablelaws, our Articles of Association and the policies and directives issued by the general meeting of shareholdersand the Board of Commissioners. The President Director alone has the authority to represent and act on behalf ofthe Board of Directors and us. However, if the President Director is absent or unavailable, then one of theDirectors designated by the President Commissioner shall have such authority to represent the Directors.
The Board of Directors must obtain written approval from the Board of Commissioners to: (i) purchaseand/or sell shares of other companies in the capital markets; (ii) enter into, commit to enter into, amend and/orterminate a license agreement or cooperation, joint venture, management and similar agreement with otherenterprises or parties; (iii) purchase, dispose, sell, pledge or encumber all or part of the business, title to or thefixed or other assets of the Company (including any interest therein); (iv) cease to collect and write-off accountsreceivable from the books as well as supplies of goods; (v) bind the Company as guarantor (borg or avalist) or inany other way in which the Company becomes liable to another party’s debt obligation, whether by an agreementto take over another party’s debt, an agreement to grant financing to another party to purchase goods or services,or by the purchase of shares, capital participation, advance payment or loan to pay in full another party’s debt;(vi) accept or grant or commit to grant medium/long-term loans and accept or grant non-operational short-termloans (except for granting loans to a subsidiary and/or employees of the Company which have been approvedpursuant to applicable internal procedures); (vii) conduct the expenditure of capital goods in 1 (one) transactionor an inter-related transaction with a nominal value higher than the permitted value determined by the Board ofCommissioners from time to time; (viii) issue bonds or other securities than can be converted into shares;(ix) propose the issuance of new shares of the Company; (x) provide an indemnity to or otherwise guarantee theobligation of any person; (xi) determine and/or change the Company’s management structure; (xii) make a newbusiness plan or change the business plan; (xiii) change the accounting, financial, or tax practice and system ofthe Company or its subsidiary; (xiv) change the Company’s name; (xv) approve the financial statement providedto the shareholders in the GMS; (xvi) determine the annual budget of the Company and the annual budget of asubsidiary; (xvii) carry out capital participation or dispose capital participation of the Company in otherenterprises that are not carried out through the capital markets; (xviii) establish a subsidiary or approve therelinquishment or the reduction of its interest, whether directly or indirectly, in each of the subsidiaries, or takeover the shares in any company or relinquish any shares in any company; (xix) take any corporate action orinvestments related to any subsidiary of the Company; (xx) use any right of the shareholders in a Company’ssubsidiary, or any other company in which the Company has a share participation; (xxi) approve the payment ofany bonus or similar payment to the Company’s employees or change the remuneration structure of employees;(xxii) undertake a merger, consolidation, acquisition or separation, each as defined under the law No. 40 of 2007on Limited Liability (as amended from time to time); (xxiii) establish or change the Company’s asset liabilitymanagement policy; (xxiv) establish or change standing delegations among members of the Board of Directorsrelating to signing authority limits for expenditures, assets purchases and sales, loans and other commitments;and (xxv) engage in any other material transaction or matters as may be determined by the Board ofCommissioners from time to time having a value of the lower of 5.0% (five percent) or more of total revenue or2.5% (two and half percent) or more of our non-current assets on a consolidated basis as set out in our auditedconsolidated financial statements. The Board of Commissioners shall be obligated to determine thresholds inrespect of the actions referenced to in (i) to (viii), (x) and (xxi) above and shall be entitled to change suchthresholds from time to time. In the event actions are taken within the applicable threshold, then the approvalfrom the Board of Commissioners’ is not required. In granting a written approval for the actions above, the Boardof Commissioners must observe prevailing capital markets regulations.
Meetings of the Board of Directors are convened when called by the President Director, or when requestedby more than one-third of the total members of the Board of Directors. A meeting of the Directors is valid andentitled to adopt binding decisions only if a majority of the Directors are present or represented. A Director maybe represented at a meeting of the Board of Directors only by another Director appointed pursuant to a power ofattorney issued for that particular purpose. At any meeting of the Board of Directors each Director is entitled toone vote and, in addition, one vote for each other Director he is representing. Resolutions of the Board ofDirectors must be adopted by deliberation and consensus. If no agreement is reached by deliberation and
107

consensus, the resolutions must be passed by a majority vote, and, in the event of a tie vote, the PresidentDirector has a deciding vote. The Board of Directors may adopt valid and binding resolutions without conveninga meeting of the Directors if all of the Directors approve and sign the resolutions in writing.
Individual Directors are charged with specific responsibilities. In the event that a vacancy occurs in theBoard of Directors, so long as the position remains vacant, one of the other Directors will be nominated by theBoard of Commissioners to perform the work of the absentee Director. If, for any reason, we cease to have anyDirectors, the Board of Commissioners is to assume the ongoing obligations of the Board of Directors and mustconvene a general meeting of shareholders to elect a new Board of Directors within 45 days.
Our Articles of Association provide that if there is a conflict between our interests and those of a Director,then with the approval of the Board of Commissioners, we shall be represented by another member of the Boardof Directors. If all Directors have a conflict, we shall be represented by the Board of Commissioners or oneCommissioner designated by the President Commissioner. If the entire Board of Commissioners has a conflict,the shareholders may appoint one or more persons to represent us at the general meeting of shareholders.
Audit Committee
In accordance with BAPEPAM-LK, Indonesia Stock Exchange and New York Stock Exchange regulations,we have formed an independent Audit Committee, consisting of five persons and chaired by one of theIndependent Commissioners. The duties of the Audit Committee include providing professional, independentadvice to the Board of Commissioners and identifying matters that require the attention of the Board ofCommissioners, including a review of the following: our financial information (including financial reports andprojections); the independence and objectivity of our public accountant; the adequacy of our public accountant’saudits that all material risks have been considered; the adequacy of our internal controls; our compliance as alisted company with the prevailing capital markets regulations and other regulations related to our business andour internal auditors’ duties. The Audit Committee also examines and reports complaints to the Board ofCommissioners, maintains the confidentiality of documents, data and information relating to us, conducts anaudit of any alleged mistake in the resolutions of a Board of Directors’ meeting or deviations in theimplementation of the resolutions of such meeting and maintains the Audit Committee charter.
On June 5, 2008, George Thia Peng Heok was appointed as Chairman of the Audit Committee. As ofDecember 31, 2011, the members of our Audit Committee were George Thia Peng Heok (Chairman), SoepraptoS.IP, Chris Kanter, Kanaka Puradiredja and Unggul Saut Marupa Tampubolon. BAPEPAM-LK regulationsrequire at least two outside persons to serve as members of the Audit Committee. As of December 31, 2011, twoof the members of our Audit committee, Kanaka Puradiredja and Unggul Saut Marupa Tampubolon, wereindependent outside Commissioners. We have posted the written charter of the Audit Committee on our websiteat www.indosat.com, where it is publicly available.
Such charter is reviewed annually and a revised charter has been approved by our Board of Commissionersand is attached hereto as Exhibit 15.14.
Remuneration Committee
Our Remuneration Committee is responsible for providing recommendations to our Board ofCommissioners regarding remuneration, bonuses and other benefits for members of our Board of Commissionersand Board of Directors as well as employees, including the structure, terms and issuance of stock options. As ofDecember 31, 2011, the members of our Remuneration Committee were Dr. Nasser Mohammed Marafih(Chairman), Alexander Rusli and Soeprapto S.IP. We have posted the written charter of the RemunerationCommittee on our website at www.indosat.com, where it is publicly available.
108

Risk Management Committee
On October 26, 2005, we established a Risk Management Committee, which reports to our Board ofCommissioners. Our Risk Management Committee evaluates potential risks regarding our business and providesrecommendations to our Board of Commissioners regarding our policies regarding risk assessment and riskmanagement, including making recommendations for improvements to our existing procedures as necessary. Asof December 31, 2011, the members of our Risk Management Committee were Rachmat Gobel (Chairman),George Thia Peng Heok, and Rionald Silaban. We have posted the written charter of the Risk ManagementCommittee on our website at www.indosat.com, where it is publicly available.
Budget Committee
Our Budget Committee assists the Board of Commissioners in performing the Board’s supervisory andadvisory duties by reviewing and giving its recommendations to the Board in relation to the Company’s strategicplans, the annual work plan and budget (which includes the capital expenditure plan). As of December 31, 2011,the members of our Budget Committee were Dr. Nasser Marafih (Chairman), George Thia Peng Heok andRichard Farnsworth Seney.
Employees
As of December 31, 2011, on a consolidated basis, we employed 4,461 employees, 3,855 of whom werepermanent employees and 606 of whom were non-permanent employees. As of December 31, 2011, excludingseconded employees, our subsidiaries employed approximately 1,007 permanent employees. As of December 31,2011, our permanent employees included 900 managerial-level employees (employees with the rank of manageror higher) and 1,948 non-managerial employees, compared to 787 managerial-level employees and 3,046non-managerial employees as of December 31, 2010, and 735 managerial and 3,152 non-managerial employeesas of December 31, 2009. Our turnover rate for employees during 2011 was 25.79% per annum, representing anincrease from 2.37% in 2010. This increase was primarily attributable to the implementation of our VSS Programduring the first and second quarters of 2011, in which 994 employees opted to participate and therefore terminatetheir employment relationship with the Company. As a result, as of December 31, 2011, our employees hadworked for us for an average of 12.01 years.
In January and December 2011, the Company and Lintasarta, respectively, each introduced anorganizational restructuring which forms part of our transformation program that began in 2009 to increase theour productivity and improve our longer-term operating results. We and Lintasarta each offered specialcompensation packages to employees who meet certain criteria as determined by us and Lintasarta respectively,and who opted to end their employment relationship with the us or Lintasarta, respectively, as part of suchorganizational restructuring under our and Lintasarta’s voluntary separation scheme (“VSS Program”). As ofDecember 31, 2011, there were 994 and 54 employees of the Company and Lintasarta, respectively, whoparticipated in the VSS Program.
We provide a number of benefits to our employees, including a pension plan, medical benefits, lifeinsurance, income tax allowances and access to a cooperative established by the employees.
On August 25, 1999, our employees established a union called the Serikat Pekerja Indosat, or SPI (Union).On September 15, 2006, our management and SPI signed a collective labor agreement covering general terms ofemployment, including working hours, payroll, employee development and competency, occupational safety andhealth, employees’ welfare, social allowances, employees’ code of conduct and mechanisms for handlingdisputes. This collective labor agreement was renewed on December 31, 2010. We believe we maintain a goodrelationship with the union. As stipulated by Article 7.3 of the collective labor agreement, we conduct meetingswith the union at least once every 3 months.
Some of our employees are entitled to a pension under a defined benefit plan, pursuant to which they receiveboth a lump sum payment and a monthly benefit through an insurance program managed by PT Asuransi
109

Jiwasraya (Persero), a state-owned insurance company. As of December 31, 2011, we insured 1,529 permanentemployees through a fully-funded pension program. In this program, an employee who resigns at 56 years of agewill receive a pension benefit. In addition, we established a defined contribution pension plan for our employeesin May 2001. Following the merger of Satelindo and IM3 into Indosat, we combined the defined contributionplans established for our legacy subsidiaries’ employees with our plan. Under the defined contribution plan,employees contribute 10.0% to 13.33% of their base salaries to the plan. We then make a contribution to the planequivalent to 50% of each employee’s contribution.
Our employees have also established a cooperative, Koperasi Pegawai Indosat (“Kopindosat”). Kopindosatprovides various benefits, such as consumer loans, principally to our employees, and car and equipment rental,principally to us. The management of Kopindosat is elected by our employees every three years at a members’meeting. Kopindosat has a minority stake in some of our affiliates. We have also temporarily seconded several ofour employees to support Kopindosat and its subsidiaries in conducting their business, as well as to provide jobtraining for its employees.
Share Ownership
One of our directors beneficially owns less than one percent of our common stock and his beneficial shareownership in us has been recorded in our special register.
Item 7: MAJOR SHAREHOLDERS AND RELATED PARTY TRANSACTIONS
As of December 31, 2011, our issued and fully paid capital was divided into 1 Series A share and5,433,933,499 Series B shares, each with a par value of Rp100. The Government, through the Ministry of State-Owned Enterprises, owns the 1 Series A share and has special voting rights, and owns 776,624,999 Series Bshares representing 14.29% of our shares. Qtel Asia owns 3,031,528,000 Series B shares and 500,528,600 SeriesB shares underlying our American Depositary Shares, or a total of 3,532,056,600 Series B shares representing65% of our shares. SKAGEN AS owns 128,077,500 Series B shares and 3,548,419 Series B shares underlyingour American Depositary Shares, or a total of 305,498,450 Series B shares representing 5.62% of our shares. Asof December 31, 2011, 42,347,850 of our ordinary shares underlying our American Depositary Shares,(excluding those owned by Qtel Asia and SKAGEN), representing in aggregate approximately 0.78% of ouroutstanding shares, and 777,405,600 Series B shares (excluding those owned by Qtel Asia and SKAGEN)representing 14.30% of our shares were held by the public. Because many of our Series B shares and AmericanDepositary Shares were held by brokers and other institutions on behalf of security holders in street name, webelieve that the number of beneficial holders of our ordinary shares is higher.
The following table sets forth information as of December 31, 2011 regarding (i) persons known to us toown more than 5.0% of our common stock (whether directly or beneficially through American DepositaryShares) and (ii) the total amount of any class of our common stock owned by individual members of the Board ofCommissioners and the Board of Directors:
Title of class NameNumber of
Shares Held
Percentageof Total
OutstandingShares of Class
Series A Government . . . . . . . . . . . . . . . . . . . . . . . . . . . . . . . . . . . . . . . . . . . . 1 100.00%Series B Qtel Asia(1) . . . . . . . . . . . . . . . . . . . . . . . . . . . . . . . . . . . . . . . . . . . . . 3,532,056,600 65.00Series B Government . . . . . . . . . . . . . . . . . . . . . . . . . . . . . . . . . . . . . . . . . . . . 776,624,999 14.29Series B SKAGEN AS . . . . . . . . . . . . . . . . . . . . . . . . . . . . . . . . . . . . . . . . . . . 305,498,450 5.62Series B Fadzri Sentosa . . . . . . . . . . . . . . . . . . . . . . . . . . . . . . . . . . . . . . . . . . * *
* Less than 1.0%(1) Qtel Asia is wholly owned by Qtel.
110

The Government
Prior to our initial public offering in 1994, the Government owned 100% of our outstanding common stock.As of the beginning of 2002, the Government owned 65.0% of our outstanding common stock. By virtue of itscommon stock ownership, the Government had retained control over us and had the power to elect all of ourBoard of Commissioners and our Board of Directors and to determine the outcome of substantially all actionsrequiring the approval of our shareholders. In addition, pension plans, insurance funds and other Indonesianinvestors owned or controlled, directly or indirectly, by the Government, purchased shares of common stock inthe initial public offering.
On May 16, 2002, the Government sold 8.1% of our outstanding common stock through an acceleratedglobal tender, reducing the Government’s shareholding to 56.9%. On December 20, 2002, the Government sold41.9% of our outstanding common stock to ICLM (described below), further reducing the Government’sshareholding to 15.0%. Although Government’s ownership has been reduced, the Government retains asignificant degree of influence over us through the 1 Series A share.
As the holder of the 1 Series A share, the Government has special voting rights. The material rights andrestrictions which are applicable to our common stock are also applicable to the 1 Series A share, except that theGovernment may not transfer the Series A share. In addition, through the Series A share, the Government hasveto rights with respect to: (i) increases in our share capital without pre-emptive rights; (ii) mergers,consolidations, acquisitions and demerger involving us; (iii) dissolution, liquidation and bankruptcy;(iv) amendments to our Articles of Association related to our purposes and objectives and the Series A holder’sveto rights.
ICLM and Qtel Asia
On December 15, 2002, ICLM, which, at the time was a subsidiary of STT, entered into a share purchaseagreement and a shareholders’ agreement with the Government, acting through the Ministry of State-OwnedEnterprises in its capacity as our shareholder. STT is 100% owned by ST Telemedia, which is indirectly ownedby Temasek Holdings (Private) Limited. Pursuant to the share purchase agreement, the Government sold toICLM 434,250,000 Series B Shares representing 41.9% of the total outstanding Series B Shares. Afterconsummation of this sale and purchase, the Government held 155,324,999 Series B Shares, representing 15.0%of the total outstanding Series B Shares. As of May 4, 2006, ICLM owned 2,171,250,000 (39.96%) of our SeriesB shares, the Government owned 1 Series A share and 776,624,999 of our Series B shares (14.29%) and ICLS,an affiliate of ICLM, owned 46,340,000 (0.85%) of our Series B shares.
On January 17, 2007, ICLM notified us regarding the intention of Qtel to make an equity investment ofapproximately 25.0% in AMH which, at the time, was wholly owned by STT, which we understand closed onMarch 1, 2007. Upon the closing of the transaction, STT effectively controlled approximately 75.0% of AMH,which directly owns ICLM and ICLS.
On June 22, 2008, following negotiations with ST Telemedia, Qtel purchased all of the issued andoutstanding shares of capital stock of each of ICLM and ICLS. Pursuant to the share purchase agreement, Qtel,through its subsidiary Qatar South East Asia Holding S.P.C., acquired all of the capital stock of ICLM and ICLSfrom AMH, which is 75.0% indirectly owned by STT and 25.0% indirectly owned by Qtel. Following thisacquisition, pursuant to Indonesian law requirements, Qtel conducted a mandatory tender offer to acquire up to24.19% of our outstanding Series B Shares (including Series B Shares underlying ADSs) and now owns 65.0%of our shares. On June 4, 2009, ICLM sold its 39.96% ownership in Indosat to ICLS and, pursuant thereto, ICLSbecame the legal owner of 3,532,056,600 shares representing 65.0% of our shares. On September 11, 2009, ICLSchanged its name to Qatar Telecom (Qtel Asia) Pte. Ltd. Qtel is 68%-owned by the Qatar government.
Qtel provides significant financial expertise, procurement, legal, operational, network build andmaintenance, marketing, human resources, business development and technical support to us. Qtel has
111

management representation in us and actively participates in business strategy formulation. We intend to takeadvantage of synergies existing and created by membership in the Qtel group of companies, thereby enhancingour position in the Indonesian telecommunications market.
SKAGEN AS
In September 2010, we were informed by SKAGEN AS, a Norwegian investment company with elevenmutual funds under management, that through certain purchases of our ADSs, it owns more than 5% of ourshares. As of December 31, 2011, SKAGEN AS owned approximately 5.62% of our shares.
Related Party Transactions
We are a party to certain agreements and engage in transactions with a number of entities that are related tous, including joint venture companies, cooperatives and foundations, as well as our controlling shareholders, theGovernment and Qtel Asia, and entities that are related to or owned or controlled by the Government and QtelAsia. As of December 31, 2011, the most significant of these transactions include cash and cash equivalents inthe amount of Rp978.0 billion (US$107.8 million) deposited in state-owned banks, operating revenues fromTelkom amounting to Rp541.6 billion (US$59.7 million) and loans payable to Mandiri amounting to Rp2,500.0billion (US$275.7 million). For further information on interest rate in relation to our outstanding loans, see “Item5: Operating and Financial Review and Prospects—Principal Indebtedness.” In addition, we are a party to variousagreements with other state-owned entities such as insurance companies, banks and various suppliers. For adiscussion of some of significant transactions entered into with related parties, see Note 29 of our consolidatedfinancial statements included elsewhere in this annual report.
Item 8: FINANCIAL INFORMATION
Consolidated Financial Statement and Other Financial Information
See “Item 17: Financial Statements” for our audited consolidated financial statements filed as part of thisannual report. No significant changes have occurred since the date of our audited consolidated financialstatements.
Legal Proceedings
From time to time, we are involved in legal proceedings concerning matters arising in connection with theconduct of our business. We are not currently involved in, and have not recently been involved in, any legal orarbitration proceedings that we believe would be likely to have a material effect on our financial condition orresults of operations other than as disclosed in this annual report.
On May 5, 2004, we received the Supreme Court’s verdict No. 1610K/PDT/2003 in favor of PrimerKoperasi Pegawai Kantor Menteri Negara Kebudayaan dan Pariwisata (known as Primkopparseni), regarding adisputed foreign currency exchange transaction. The court’s judgment required us to pay Rp13.7 billion plus6.0% interest per annum from February 16, 1998 until the final settlement date and on December 22, 2004, wesatisfied the judgment through payment of Rp19.3 billion to the Central Jakarta District Court. Furthermore, inJanuary 2005, we filed a motion for reconsideration against the Supreme Court’s verdict. As of April 20, 2011,the Supreme Court has not issued a verdict for the reconsideration.
In order to recover the amount we paid to Primkopparseni, we initiated a new action in the Central JakartaDistrict Court asserting that the Primkopparseni members’ meeting at which the members decided to proceedwith the dispute against us was invalid. On January 19, 2005, the Central Jakarta District Court held that suchmembers’ meeting was unlawful, but did not require Primkopparseni to compensate us, prompting us andPrimkopparseni to file an appeal of that decision with the Jakarta High Court on February 1, 2005. The Jakarta
112

High Court through its decision No. 483 / PDT / 2005 / PT.DKI decided in our favor by ruling that such meetingwas unlawful, but, on the other hand, did not require Primkopparseni to compensate us. We and Primkopparseniappealed to the Supreme Court to ask for compensation for the costs of legal fees and injury to our brand name,but the Supreme Court declined our appeal on August 13, 2008 through its decision No. 229/K/PDT/2008. Sincewe did not take any further legal action with respect to the Supreme Court’s decision, this case is now final andbinding.
On November 1, 2007, the KPPU issued a decision regarding a preliminary investigation involving us andeight other telecommunication companies based on allegations of price-fixing for SMS services and breach ofArticle 5 of the Anti-monopoly Law. On June 18, 2008, the KPPU determined that PT Telkom, Telkomsel, XL,Bakrie Telecom, Mobile-8 and Smart Telecom (as of March 2011, Mobile-8 had changed its name toPT Smartfren Telecom Tbk) had jointly breached Article 5 of the Anti-monopoly Law. Mobile-8 appealed thisruling to the Central Jakarta District Court, where Telkomsel, XL, Telkom, Indosat, Hutchison, Bakrie Telecom,Smart Telecom, Natrindo were summoned to appear as co-defendants in the hearing, while Telkomsel appealedthis ruling to the South Jakarta District Court. Although the KPPU decided in our favor with respect to theallegations of price-fixing of SMS, we cannot assure you that the District Court will affirm the KPPU decision.In 2011, the Supreme Court issued a ruling appointing the Central Jakarta District Court jurisdiction to examinethe objections filed in the appeal of the KPPU decision. The District Court will consider objections against theKPPU decision based on a re-examination of the KPPU decision and case files submitted by KPPU.
On January 18, 2012, we were informed that our subsidiary, PT Indosat Mega Media (“IMM”), was underinvestigation by the Attorney General in connection with IMM’s broadband internet services. IMM has beenaccused of illegally using 3G without paying the appropriate frequency fees, telecommunication operation feesand tender upfront fees. The MOCIT stated in their letter to us No.65/M.Kominfo/02/2012, dated February 24,2012, that neither IMM nor Indosat have breached any laws or prevailing rules. In addition, ITRA publicly statedthat IMM had not breached any laws or prevailing rules. The Attorney General is currently still proceeding withits investigation.
During tax audits and assessments of our tax payments for 2004 and 2005 by the Tax Office for State-Owned Enterprises (the “Tax Office”), on December 4, 2006 and March 27, 2007, respectively, we were notifiedthat our withholding tax for interest paid on intercompany loans for Indosat Finance Company B.V. and IndosatInternational Finance Company B.V. relating to our US$300.0 million principal amount Guaranteed Notes 2010and US$250.0 million principal amount Guaranteed Notes 2012, respectively, should be 20.0%, rather than10.0%. Based on advice from our tax advisors and our understanding of Indonesian law, we believe that ouroriginal calculations of withholding tax are accurate and submitted objection letters to the Tax Office regardingthese assessments. On February 18, 2008 and June 4, 2008, we received Decision Letters from the DirectorateGeneral of Taxation rejecting our objections to our assessed tax payments for 2004 and 2005 in the amount ofRp60,493 million and Rp82,126 million, respectively. On May 14, 2008 and September 2, 2008, the Companysubmitted an appeal letter to the Tax Court concerning the Company’s objection to the correction of the incometax article 26 for fiscal year 2004 and 2005, respectively. On May 25, 2010, the Company received the DecisionLetter from the Tax Court which declined the Company’s objection to the correction of the 2004 and 2005income tax article 26. The Company charged the tax correction to current operations, which was presented as partof “Other Income (Expenses)—Others—Net”.
We are also currently disputing an assessment of tax overpayment for fiscal year 2005 with the Tax Office.On March 27, 2007, we received an assessment letter for tax overpayment, indicating that the DirectorateGeneral of Taxation approved the refund of an overpayment of 2005 corporate income tax amounting toRp135,766 million, which amount is lower than the amount of Rp176,645 million that we recognize. We filed anobjection with the Tax Office on June 22, 2007 and claimed for the difference amounting to Rp40,879 million.On May 27, 2008, we received a Decision Letter from the Directorate General of Taxation which partiallyaccepted our objection, but only for the amount of Rp2,725 million. On August 21, 2008, the Companysubmitted an appeal letter to the Tax Court concerning the Company’s remaining objection on the 2005 corporate
113
income tax. On October 12, 2010, the Company received the Decision Letter from the Tax Court which acceptedthe Company’s objection to the correction of the 2005 corporate income tax amounting to Rp38,155 million,which was offset against the underpayment of the Company’s 2008 and 2009 income tax article 26 based on TaxCollection Letters (“STPs”) received by the Company on September 17, 2010. On February 24, 2011, wereceived a copy of a memorandum for reconsideration request from the Tax Court to the Supreme Court on theTax Court’s Decision Letter dated October 29, 2010, regarding our 2005 corporate income tax. On March 25,2011, the Company submitted a counter memorandum for reconsideration request to the Supreme Court. As ofApril 23, 2012, the Company has not received any decision from the Supreme Court with respect to such request.
On December 24, 2008, we received a Decision Letter from the Directorate General of Taxation whichincreased the overpayment amount by Rp84,650 million in the assessment letter on tax overpayment for fiscalyear 2004, which amount was lower than the amount stated in an earlier Decision Letter received on July 4,2008. On January 21, 2009, we filed suit objecting to the discrepancy in the amount of tax overpayment duringfiscal year 2004. With respect thereto, on November 17, 2009, the Tax Court revoked the Directorate General ofTaxation’s assessment letter No. KEP-539/WPJ.19/BD.05/2008, dated December 24, 2008. On March 17, 2010,the Directorate General of Taxation issued a decision favorable to the Company, informing it that the taxoverpayment for fiscal year 2004 should be Rp126,403 million instead of Rp84,650 million, which would entitlethe Company to get a refund of the difference, amounting to Rp41,753 million. The Company then subsequentlyreceived the payment of such tax refund amounting to Rp41,753 million from Directorate General of Taxation onApril 13, 2010. On March 5, 2012, the Company received a Tax Court’s Decision Letter approving interestcompensation payable to the Company and totaling Rp60,673.5 million on the overpayment of its 2004Corporate Income Tax.
On June 8, 2009, the Company received an assessment letter on tax underpayment (“assessment letter”)from the DGT for Satelindo’s corporate income tax for fiscal year 2002 amounting to Rp105,809 million(including penalties and interest). The Company accepted a part of the correction of the 2002 corporate incometax amounting to Rp2,646 million which was charged to current operations in 2009. Under Indonesian Tax Law,a taxpayer is required to pay the tax underpayment amount as stated in the assessment letter within one monthfrom the date of the assessment letter. The taxpayer can reclaim the tax paid through an objection or appealprocess. On August 28, 2009, the Company submitted an objection letter to the Tax Office regarding theremaining correction on Satelindo’s 2002 corporate income tax. On July 15, 2010, the Company received theDecision Letter No.KEP-357/WPJ.19/BD.05/2010 from the DGT declining the Company’s objection to thecorrection on Satelindo’s corporate income tax for fiscal year 2002. On October 14, 2010, the Companysubmitted an appeal letter to the Tax Court concerning the Company’s objection to the correction on Satelindo’scorporate income tax for fiscal year 2002. As of April 23, 2012, the Company has not received any decision fromthe Tax Court on such appeal.
On June 8, 2009, the Company also received assessment letters from the DGT for Satelindo’s 2002 and2003 income tax article 26 amounting to Rp51,546 million and Rp40,307 million (including penalties andinterests), respectively. On August 27, 2009, the Company submitted an objection letter to the Tax Office for thecorrection of the Satelindo’s 2002 and 2003 income tax article 26. On July 16, 2010, the Company received theDecision Letters No.KEP-367/WPJ.19/BD.05/2010 and KEP-368/WPJ.19/BD.05/2010 from the DGT decliningthe Company’s objection to the correction of the Satelindo’s 2002 and 2003 income tax article 26. OnOctober 12, 2010, the Company submitted appeal letters to the Tax Court concerning the Company’s objection tothe correction of Satelindo’s 2002 and 2003 income tax article 26. As of April 23, 2012, the Company has notreceived any decision from the Tax Court on such appeal.
On September 7, 2009, the Company received the Decision Letter No.KEP-335/WPJ.19/BD.05/2009 fromthe DGT which declined the Company’s objection to the remaining corrections of the 2006 corporate income tax.On December 2, 2009, the Company submitted an appeal letter to the Tax Court regarding the remainingcorrections of the Company’s 2006 corporate income tax. On April 26, 2011, the Company received the TaxCourt’s Decision Letter which accepted the Company’s appeal on the remaining correction of the 2006 corporate
114

income tax. On June 21, 2011, the Company received a tax refund amounting to Rp82.6 billion. On August 22,2011, the Company received a copy of a memorandum for reconsideration request from the Tax Court to theSupreme Court on the Tax Court’s Decision Letter dated April 26, 2011 for the 2006 corporate income tax. OnSeptember 21, 2011, the Company submitted a counter-memorandum for reconsideration request to the SupremeCourt. As of April 23, 2012, the Company has not received any decision from the Supreme Court on suchrequest.
On September 17, 2010, the Company received STPs from the DGT for the underpayment of theCompany’s 2008 and 2009 income tax article 26 totaling Rp80,018 million (including interest). On October 13,2010, the Company submitted cancellation letters to the Tax Office regarding such STPs. Subsequently, onNovember 16, 2010, the Company was required to pay a certain portion of these STPs by using the approved taxrefund claim for on the Company’s corporate Income Tax for fiscal year 2005 amounting to Rp38,155 million.On January 7, 2011, the Company paid the remaining amount of Rp41,863 million. On April 11, 2011, theCompany received a letter from the Tax Office which declined the request for cancellation of such STPs. OnMay 5, 2011, the Company submitted an appeal letter to the Tax Court concerning these STPs. As of April 23,2012, the Company has not yet received any decision from the Tax Court on such appeal.
On April 21, 2011, the Company received an assessment letter from the DGT for the Company’s VAT forthe period from January to December 2009, totaling Rp182.8 billion (including penalties). The Companyaccepted a part of the corrections amounting to Rp4.2 billion, which was charged to current operations. OnJuly 15, 2011, the Company paid the remaining underpayment, amounting to Rp178.6 billion of the VAT for theperiod from January to December 2009. On July 19, 2011, the Company submitted an objection letter to the TaxOffice regarding the remaining correction on the Company’s VAT for such period. As of April 23, 2012, theCompany has not yet received any decision from the Tax Office on such objection letter
On April 21, 2011, the Company received an assessment letter on tax overpayment from the DGT for theCompany’s 2009 corporate income tax amounting to Rp29.3 billion, which amount is lower than the amountrecognized by the Company in its financial statements. The Company accepted a part of the correctionsamounting to Rp0.8 billion, which was charged to current operations. On May 31, 2011, the Company received atax refund of Rp23.7 billion, (net of the amount of the VAT correction for the period from January to December2009 that the Company accepted). On July 20, 2011, the Company submitted an objection letter to the Tax Officeregarding the remaining correction on the Company’s 2009 corporate income tax. As of April 23, 2012, theCompany has not received any decision from the Tax Office on such letter.
We are not involved in any other material cases, including civil, criminal, bankruptcy, state administrationcases or arbitration cases in the Indonesian National Board of Arbitration or labor cases in Industrial RelationCourt which may materially affect our performance.
Dividend Policy
Our shareholders determine dividend payouts in the Annual General Meeting of Shareholders pursuant torecommendations from our Board of Directors. At our 2009, 2010 and 2011 Annual General Meetings ofShareholders, our shareholders declared final cash dividends amounting to 50.0% of our net income for each ofthe years ended December 31, 2008, 2009 and 2010, respectively. We intend to continue paying dividends insuch amount to allow us to meet sound financial governance and investor expectations.
115
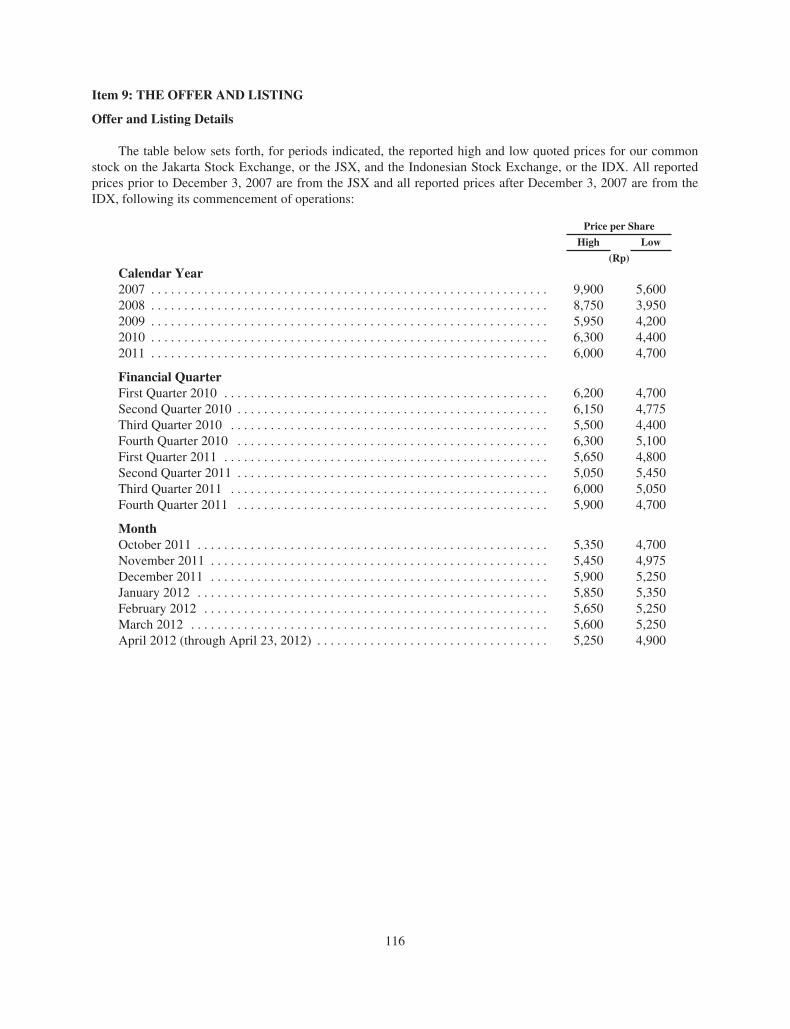
Item 9: THE OFFER AND LISTING
Offer and Listing Details
The table below sets forth, for periods indicated, the reported high and low quoted prices for our commonstock on the Jakarta Stock Exchange, or the JSX, and the Indonesian Stock Exchange, or the IDX. All reportedprices prior to December 3, 2007 are from the JSX and all reported prices after December 3, 2007 are from theIDX, following its commencement of operations:
Price per Share
High Low
(Rp)
Calendar Year2007 . . . . . . . . . . . . . . . . . . . . . . . . . . . . . . . . . . . . . . . . . . . . . . . . . . . . . . . . . . . . 9,900 5,6002008 . . . . . . . . . . . . . . . . . . . . . . . . . . . . . . . . . . . . . . . . . . . . . . . . . . . . . . . . . . . . 8,750 3,9502009 . . . . . . . . . . . . . . . . . . . . . . . . . . . . . . . . . . . . . . . . . . . . . . . . . . . . . . . . . . . . 5,950 4,2002010 . . . . . . . . . . . . . . . . . . . . . . . . . . . . . . . . . . . . . . . . . . . . . . . . . . . . . . . . . . . . 6,300 4,4002011 . . . . . . . . . . . . . . . . . . . . . . . . . . . . . . . . . . . . . . . . . . . . . . . . . . . . . . . . . . . . 6,000 4,700
Financial QuarterFirst Quarter 2010 . . . . . . . . . . . . . . . . . . . . . . . . . . . . . . . . . . . . . . . . . . . . . . . . . 6,200 4,700Second Quarter 2010 . . . . . . . . . . . . . . . . . . . . . . . . . . . . . . . . . . . . . . . . . . . . . . . 6,150 4,775Third Quarter 2010 . . . . . . . . . . . . . . . . . . . . . . . . . . . . . . . . . . . . . . . . . . . . . . . . 5,500 4,400Fourth Quarter 2010 . . . . . . . . . . . . . . . . . . . . . . . . . . . . . . . . . . . . . . . . . . . . . . . 6,300 5,100First Quarter 2011 . . . . . . . . . . . . . . . . . . . . . . . . . . . . . . . . . . . . . . . . . . . . . . . . . 5,650 4,800Second Quarter 2011 . . . . . . . . . . . . . . . . . . . . . . . . . . . . . . . . . . . . . . . . . . . . . . . 5,050 5,450Third Quarter 2011 . . . . . . . . . . . . . . . . . . . . . . . . . . . . . . . . . . . . . . . . . . . . . . . . 6,000 5,050Fourth Quarter 2011 . . . . . . . . . . . . . . . . . . . . . . . . . . . . . . . . . . . . . . . . . . . . . . . 5,900 4,700
MonthOctober 2011 . . . . . . . . . . . . . . . . . . . . . . . . . . . . . . . . . . . . . . . . . . . . . . . . . . . . . 5,350 4,700November 2011 . . . . . . . . . . . . . . . . . . . . . . . . . . . . . . . . . . . . . . . . . . . . . . . . . . . 5,450 4,975December 2011 . . . . . . . . . . . . . . . . . . . . . . . . . . . . . . . . . . . . . . . . . . . . . . . . . . . 5,900 5,250January 2012 . . . . . . . . . . . . . . . . . . . . . . . . . . . . . . . . . . . . . . . . . . . . . . . . . . . . . 5,850 5,350February 2012 . . . . . . . . . . . . . . . . . . . . . . . . . . . . . . . . . . . . . . . . . . . . . . . . . . . . 5,650 5,250March 2012 . . . . . . . . . . . . . . . . . . . . . . . . . . . . . . . . . . . . . . . . . . . . . . . . . . . . . . 5,600 5,250April 2012 (through April 23, 2012) . . . . . . . . . . . . . . . . . . . . . . . . . . . . . . . . . . . 5,250 4,900
116

The table below sets forth, for the periods indicated, the reported high and low quoted prices of the ADSs onthe New York Stock Exchange, or the NYSE.
Price per ADS
High Low
(in US$)
Calendar Year2007 . . . . . . . . . . . . . . . . . . . . . . . . . . . . . . . . . . . . . . . . . . . . . . . . . . . . . . . . . . . 5113⁄16 3013⁄64
2008 . . . . . . . . . . . . . . . . . . . . . . . . . . . . . . . . . . . . . . . . . . . . . . . . . . . . . . . . . . . 471⁄64 162009 . . . . . . . . . . . . . . . . . . . . . . . . . . . . . . . . . . . . . . . . . . . . . . . . . . . . . . . . . . . 3047⁄128 16189⁄256
2010 . . . . . . . . . . . . . . . . . . . . . . . . . . . . . . . . . . . . . . . . . . . . . . . . . . . . . . . . . . . 3537⁄64 247⁄32
2011 . . . . . . . . . . . . . . . . . . . . . . . . . . . . . . . . . . . . . . . . . . . . . . . . . . . . . . . . . . . 347 ⁄16 2563⁄64
Financial QuarterFirst Quarter 2010 . . . . . . . . . . . . . . . . . . . . . . . . . . . . . . . . . . . . . . . . . . . . . . . . 33123⁄128 2597⁄256
Second Quarter 2010 . . . . . . . . . . . . . . . . . . . . . . . . . . . . . . . . . . . . . . . . . . . . . 343 ⁄16 2531⁄32
Third Quarter 2010 . . . . . . . . . . . . . . . . . . . . . . . . . . . . . . . . . . . . . . . . . . . . . . . 3059⁄128 247 ⁄32
Fourth Quarter 2010 . . . . . . . . . . . . . . . . . . . . . . . . . . . . . . . . . . . . . . . . . . . . . . 3537⁄64 281⁄64
First Quarter 2011 . . . . . . . . . . . . . . . . . . . . . . . . . . . . . . . . . . . . . . . . . . . . . . . . 313⁄32 273⁄64
Second Quarter 2011 . . . . . . . . . . . . . . . . . . . . . . . . . . . . . . . . . . . . . . . . . . . . . 3115⁄64 2939⁄64
Third Quarter 2011 . . . . . . . . . . . . . . . . . . . . . . . . . . . . . . . . . . . . . . . . . . . . . . . 347 ⁄16 289⁄16
Fourth Quarter 2011 . . . . . . . . . . . . . . . . . . . . . . . . . . . . . . . . . . . . . . . . . . . . . . 3111 ⁄16 2563⁄64
MonthOctober 2011 . . . . . . . . . . . . . . . . . . . . . . . . . . . . . . . . . . . . . . . . . . . . . . . . . . . . 303⁄32 2563⁄64
November 2011 . . . . . . . . . . . . . . . . . . . . . . . . . . . . . . . . . . . . . . . . . . . . . . . . . . 2957⁄64 2763⁄64
December 2011 . . . . . . . . . . . . . . . . . . . . . . . . . . . . . . . . . . . . . . . . . . . . . . . . . . 3111⁄16 2857⁄64
January 2012 . . . . . . . . . . . . . . . . . . . . . . . . . . . . . . . . . . . . . . . . . . . . . . . . . . . . 3149 ⁄64 2949⁄64
February 2012 . . . . . . . . . . . . . . . . . . . . . . . . . . . . . . . . . . . . . . . . . . . . . . . . . . . 315⁄16 295⁄32
March 2012 . . . . . . . . . . . . . . . . . . . . . . . . . . . . . . . . . . . . . . . . . . . . . . . . . . . . . 3057⁄64 291⁄16
April 2012 (through April 23, 2012) . . . . . . . . . . . . . . . . . . . . . . . . . . . . . . . . . 2825⁄64 2641⁄64
Markets
Our common stock is listed on the IDX. The IDX is the principal non-U.S. trading market for our commonstock. Our ADSs, each representing 50 shares of our common stock, are listed on the NYSE. After the stock split,which became effective on March 10, 2004, each ADS represents 50 Series B shares (as compared to the tenSeries B shares previously represented thereby).
The Indonesian Securities Market
On November 30, 2007, the Jakarta Stock Exchange and the Surabaya Stock Exchange merged to becomethe IDX. The IDX began operation on December 3, 2007 and in 2007, had a market capitalization ofRp2,539,041 billion, in which Rp1,982 billion of it came from equities, Rp79,065 billion and US$105 millioncame from corporate bonds and Rp477 trillion came from the government bonds.
Overview of the IDX
There are currently two daily trading sessions for regular and negotiable markets from Monday to Thursday,9:30 a.m. to 12:00 noon, and 1:30 p.m. to 4:00 p.m. There are two trading sessions for regular and negotiablemarket on Friday, from 9:30 a.m. to 11:30 a.m. and from 2:00 p.m. to 4:00 p.m. There is only one cash markettrading session from Monday to Thursday, 9.30 a.m. to 12.00 noon and Friday, 9.30 a.m. to 11.30 a.m. Tradingon the IDX is based on an order-driven market system. Investors must contact brokerage companies, or IDXmembers, that will execute their orders through the IDX trading system. Trading on the IDX can only be done by
117
IDX members who are registered as members of the Indonesian Clearing and Guarantee Corporation, or KPEI.A brokerage company may also buy and sell securities for its own account. No limitation of share ownership byforeign investors or foreign institutions exists through direct placement or through trading on the IDX, except forbanking institutions, which may only be 99.0% foreign owned.
Trading is divided into three market segments: regular market, negotiable market, and cash market. Theregular market is the mechanism for trading stock in standard lots on a continuous auction market duringexchange hours. With respect to the trading of stock, a round lot consists of 500 shares. The price movements arelimited as follows: (i) if the share price is below Rp200, then the price moves in increments of Rp1 with theaggregate daily price movement limited to Rp10; (ii) if the share price is equal to Rp200 or more, but less thanRp500, then the price moves in increments of Rp5 with the aggregate daily price movement limited to Rp50;(iii) if the share price is equal to Rp500 or more, but less than Rp2,000, then the price moves in increments ofRp10 with the aggregate daily price movement limited to Rp100; (iv) if the share price is equal to Rp2,000 ormore, but less than Rp5,000, then the price moves in increments of Rp25 with the aggregate daily pricemovement limited to Rp250; and (v) if the share price is equal to or exceeds Rp5,000, then the price moves inincrements of Rp50 with the aggregate daily price movement limited to Rp500. Orders are processed bycomputers that carry out matching processes of the outstanding “bids” and “asks” according to price and timepriority. Price priority gives priority to buying orders at a lower price or selling orders at a higher price. If buyingor selling orders are placed at the same price, priority is given to the buying or selling order placed first (timepriority).
Trades in the negotiated market can be completed without using the round lot system and price step rule.IDX members can advertise selling or buying orders through the IDX trading system and amend their order bynegotiating with another member. The ultimate price is based on agreement, but it is recommended to be basedon the stock price on the regular market.
Transactions on the IDX regular market and non-regular market are required to be settled no later than thethird trading day after the transactions. In case of a default by an exchange member on settlement upon the duedate, they are liable to pay 125.0% of the highest price of the same securities or the same trading day.
The IDX board of directors may cancel a transaction if proof exists of fraud, manipulation or the use ofinsider information. The board of directors may also suspend trading if there are indications of bogus transactionsor jacking up of share prices, misleading information, use of insider information, counterfeit securities orsecurities blocked from trading, or other important events.
IDX members may charge fees for their services based on an agreement with their clients. When conductingstock transactions on the IDX, exchange members are required to pay a transaction fee equal to 0.018% of thecumulative transaction value of each transaction plus an additional 0.01% for cash and regular markettransactions guaranteed by KPEI (subject to a minimum transaction fee of Rp20,000,000). The commissions andtransaction fees do not include the 10.0% value-added tax and the 0.1% transaction tax levied on the cumulativevalue of the sales of the shares.
The Indonesian capital markets are generally less liquid than those in countries with more developed capitalmarkets. This illiquidity is especially pronounced for large blocks of securities. Also, prices in the Indonesiancapital markets are typically more volatile than in such other markets. Accordingly, we cannot assure you that aholder of common stock will be able to dispose of common stock at prices or at times at which such holder wouldbe able to do so in more liquid markets or at all. Further, we cannot assure you that a holder of common stockwill be able to dispose of common stock at or above such holder’s purchase price.
118

Trading on the NYSE
The Bank of New York serves as depositary, or the Depositary, with respect to our ADSs, which are tradedon the NYSE. After the stock split, which became effective on March 10, 2004, each ADS represents 50 sharesof our common stock (as compared to the ten Series B shares previously represented thereby). As ofDecember 31, 2011, 14,405,948 ADSs, representing 13.26% of our common stock, were outstanding in theUnited States and there were 49 registered owners of our ADSs.
Item 10: ADDITIONAL INFORMATION
Description of Articles of Association and Capital Stock
As of December 31, 2011, the authorized capital of Indosat is Rp2,000,000,000,000, divided into20,000,000,000 shares consisting of one Series A share and 19,999,999,999 Series B shares, each share of parvalue Rp100. Of the authorized capital, 5,433,933,500 shares were subscribed to and fully paid up in cash,consisting of one Series A share and 5,433,933,499 Series B shares, or with a total nominal value ofRp543,393,350,000 by:
a. the Republic of Indonesia, one Series A share and 776,624,999 Series B shares with a total nominalvalue of Rp77,662,500,000;
b. Qtel Asia, 3,532,056,600 Series B shares with a total value of Rp353,205,660,000; and
c. the Public, 1,125,251,900 Series B shares with a total nominal value of Rp112,525,190,000.
On March 8, 2004, we held an Extraordinary General Meeting of Shareholders which approved the split ofnominal value of Series A share and Series B shares from Rp500 to Rp100 per share, which increased ourauthorized shares to 20,000,000,000 shares and our issued shares to 5,177,500,000 shares. After the stock split,the authorized capital of Indosat is Rp2,000,000,000,000 divided into 20,000,000,000 shares consisting of oneSeries A share and 19,999,999,999 Series B shares, each share of par value Rp100. Of our authorized capital,5,177,500,000 shares were subscribed to and fully paid up in cash, consisting of one Series A share and5,177,499,999 Series B shares, or with a total nominal value of Rp517,750,000,000 by:
a. the Republic of Indonesia, one Series A share and 776,624,999 Series B shares with a total nominalvalue of Rp77,662,499,900;
b. ICLM, 2,171,250,000 Series B shares with a total value of Rp217,125,000,000; and
c. the Public, 2,229,625,000 Series B shares with a total nominal value of Rp222,962,500,000.
The amendment to the Articles of Association of Indosat, necessitated by the stock split, has been reportedto and accepted by the Minister of Justice and Human Rights of Indonesia under number C-05582HT.01.04.TH.2004, dated March 8, 2004. Such amendment has been registered in the Central Jakarta CompanyRegister Office under number 0540 / RUB.09.05 / III / 2004, dated March 9, 2004. On October 20, 2004, theMinistry of Justice and Human Rights of Indonesia changed its name to the Ministry of Law and Human Rightsof Indonesia.
On January 28, 2010, Indosat convened an Extraordinary General Meeting of Shareholders to approve,among others, an amendment to Article 3 of Indosat’s Articles of Association, covering its purposes andobjective. Such amendment was required in compliance with Rule of Bapepam dan LK No. IX.J.1.
Our Articles of Association, or the Articles, state that any transaction involving a conflict of interest asdefined in prevailing capital market regulations should obtain the approval of the independent shareholders in ageneral meeting of shareholders especially convened for such purpose.
119

Each Director receives an annual bonus as well as other incentives in the event we surpass certain financialand operating targets, the amounts of which are determined by our Board of Commissioners and reported at ourannual general meeting of shareholders. Bonuses are budgeted annually and are based on the recommendation ofour Board of Directors, whose recommendation must be approved by our Board of Commissioners prior tosubmission to our shareholders. Each Commissioner is granted a monthly honorarium and certain otherallowances, the amounts of which are determined by our shareholders at our annual general meeting ofshareholders.
Our Board of Directors are responsible for leading and managing us in accordance with our objectives andpurposes as well as to control, preserve and manage our assets. To complete these responsibilities, our Board ofDirectors are authorized to cause us to borrow such sums as required from time to time subject to the limitationsset forth in the Articles. The borrowing powers of our Board of Directors may only be varied through anamendment to the Articles. The Articles do not contain any requirement for the Directors to retire by a specifiedage or to own any or a specified number of our common shares.
Common Stock
The following is a summary of the material rights and restrictions related to the common stock of Indosatbased upon applicable provisions of Indonesian law and provisions of our Articles of Association, which wereamended on January 28, 2010 and approved by the Minister of Law and Human Rights of Indonesia onFebruary 25, 2010. This description does not purport to be complete and is qualified by reference to the Articlesof Association and the laws of Indonesia relating to companies, which may in certain instances differ fromprovisions contained in the Articles of Association.
All of the shares of common stock are registered shares and are issued in the name of the owner of thecommon stock registered in the register of shareholders of Indosat. The Board of Directors keep a register ofshareholders of Indosat, and Indosat must treat the person whose name is entered in such register of shareholdersas the only person entitled to exercise any rights conferred by law with respect to such common stock.
All transfers of common stock must be evidenced by an instrument of transfer signed by or on behalf of thetransferor and by or on behalf of the transferee or based on other letters, which give satisfactory evidence of suchtransfer in the opinion of the Board of Directors. Transfers of common stock take effect only after the transfer isregistered in the register of shareholders. The transferor of any common stock will be treated as the owner ofsuch common stock until the name of the transferee has been entered in the register of shareholders.
The holders of common stock are entitled to pre-emptive rights if Indosat issues common stock, convertiblebonds, warrants or similar securities. Such pre-emptive rights may be transferred or assigned to third partiessubject to the restrictions set forth in the stipulations in the Articles, prevailing capital markets regulations andIndonesian law. Any rights issue shall be first approved by Indosat’s general meeting of shareholders and anannouncement of such a plan shall be made by the Board of Directors in two daily newspapers (one in theEnglish language and one in the Indonesian language). If the holders of common stock do not exercise theirpre-emptive rights within the period fixed by the Board of the Directors in accordance with the relevantregulations, the Board of Directors may issue such common stock, convertible bonds, warrants or similarsecurities to third parties at a price and on terms at least the same as that offered previously to the existingshareholders and as determined by the Board of Directors.
Indosat’s authorized capital stock may be increased or decreased only by a resolution of an extraordinarygeneral meeting of shareholders and an amendment of the Articles. Any such Amendment will be effective onlyafter it receives approval from the Minister of Law and Human Rights of Indonesia.
As an exception to the above provisions, Indosat, with the approval of a general meeting of shareholders atwhich the holder of the Series A share attends and approves the resolution, may issue new shares without
120

conducting a limited public offer to shareholders. This issuance may be done provided that this issue is made fora specified number of shares and such shares are issued within a specified period of time in compliance with theIndonesian capital market regulations or under any exemption Indosat may receive therefrom, and the said sharesmay be sold by Indosat to any person at a price and upon such conditions as may be determined by the Board ofDirectors, provided that the price is not lower than par value. There are no limitations on the rights of foreigninvestors to own our common stock if such stock is acquired through capital markets.
These provisions also apply mutatis mutandis in the event Indosat issues convertible bonds and/or warrantsand/or other similar securities, provided that any new share issued resulting from convertible bonds and/orwarrants and/or other similar securities shall be for a specified number of shares and within a specified period oftime in compliance with the Indonesian capital market regulations or any exemption as Indosat may receivetherefrom.
Series A Share
The material rights and restrictions which are applicable to the common stock are also applicable to the oneSeries A share, except that the Government may not transfer the Series A share and it has veto rights with respectto: (i) amendment to the objective and purposes of the Company; (ii) increase of capital without pre-emptiverights; (iii) merger, consolidation, acquisition and demerger; and (iv) amendment to the provisions regarding therights of “A” share as stipulated in the Articles of Association; and (v) dissolution, bankruptcy and liquidation ofthe Company.
Purpose and Duration
Pursuant to Article 3 of our Articles of Association, as amended on January 28, 2010, in order to complywith the Capital Market and Financial Institution Supervisory Board (Badan Pengawas Pasar Modal danLembaga Keuangan/”Bapepam dan LK”) Rule No. IX.J.1 on guidelines of articles of association of a companywho conduct public offering on equity securities and public companies, Indosat’s purposes, objectives andbusiness activities are as follows:
1. The purposes and objectives of the Company are to provide telecommunications networks,telecommunication services as well as information technology and/or convergence technology services.
2. In order to achieve the abovementioned purposes and objectives, the Company may carry out activitiesincluding the main business as follows:
a. To provide telecommunication networks, telecommunication services as well as informationtechnology and/or convergence technology services, including but not limited to provision ofbasic telephony services, multimedia services, internet telephony services, network access pointservices, internet services, mobile telecommunication networks and fixed telecommunicationnetworks; and
b. To engage in the payment transaction and money transfer service through telecommunicationnetworks as well as information technology and/or convergence technology.
3. In order to achieve the abovementioned purposes and objectives and in order to support the mainbusiness of the Company as mentioned above, the Company can conduct supporting business activities,as follows:
a. To plan, to procure, to modify, to build, to provide, to develop and to operate, to lease, to rent, tomaintain infrastructure/facilities including resources to support the Company business inproviding telecommunication networks, telecommunication services as well as informationtechnology and/or convergence technology services;
121

b. To conduct business and operating activities (including development, marketing and sales oftelecommunication networks, telecommunication services as well as information technology and/or convergence technology services by the Company), including research, customer services,education and courses both domestic and overseas; and
c. To conduct other activities necessary to support and/or related with the provision oftelecommunication networks, telecommunication services as well as information technology and/or convergence technology services including but not limited to electronic transactions andprovision of hardware, software, content as well as telecommunication managed services.
We were established on November 10, 1967 with no time limit on our establishment.
Voting Rights
Each share of common stock entitles the registered holder thereof to one vote at any general meeting ofshareholders of Indosat. Shareholders appoint members of the Board of Directors for a period commencing fromthe date of the general meeting of shareholders that appointed them and ending at the closing of the 5th annualgeneral meeting of shareholders subsequent to the date of their appointment.
An annual general meeting of shareholders must be held, at the latest, on June 30 of each year. At suchannual general meeting, the Directors must (i) report on the affairs and management of Indosat and the results forthe most recent financial year; (ii) submit the audited balance sheet and audited profit and loss statement for suchfinancial year to the meeting for approval; (iii) determine the plan for use of profit and the amount of dividendfor such financial year; (iv) submit a request for the appointment of a public accountant; and (v) submit all othermatters to be addressed at the meeting. In addition, the Board of Commissioners should also report theirsupervisory activities during the proceeding fiscal year as stipulated in the annual report. All materials describedin (i) through (v) will be made available at Indosat for inspection by shareholders from the date of the invitationfor the annual general meeting of shareholders until the date of the annual general meeting of shareholders.Proposals duly submitted by shareholders representing at least 10.0% of Indosat’s subscribed shares may beincluded in the agenda of such meeting, provided that such proposals are received by the Board of Directors atleast 21 days prior to such meeting.
The Board of Directors or the Board of Commissioners may convene an extraordinary general meeting ofshareholders and must convene such a meeting upon receipt of written notice from a shareholder or shareholdersrepresenting at least 10.0% of the subscribed shares of Indosat. Upon receipt of such written notice, within 22days of the date such written notice is accepted, the Board of Directors shall discuss, resolve, and if the Board ofDirectors have resolved to convene such extraordinary meeting of shareholders, the Board of Directors shallannounce notice of the extraordinary meeting of shareholders at the latest 14 days prior to the invitation of theextraordinary meeting of shareholders without counting the announcement date and the invitation date. No laterthan 14 days prior to the extraordinary meeting of shareholders, without counting the invitation date and themeeting date, the Board of Directors shall announce invitation to the extraordinary meeting of shareholders. Ifthe Directors fail to provide notice of such a meeting, the shareholders concerned can re-submit their notice tothe Board of Commissioners. Upon receipt of such notice, within 22 days of the date such notice is accepted, theBoard of Commissioners shall discuss, resolve, and if the Board of Commissioners have resolved to convenesuch extraordinary meeting of shareholders, the Board of Commissioners shall announce notice to theextraordinary meeting of shareholders at the latest 14 days (excluding notification date and invitation date) priorto the invitation of the extraordinary meeting of shareholders. No later than 14 days prior to the extraordinarymeeting of shareholders, without counting the invitation date and the meeting date, the Board of Commissionersshall announce invitation to the extraordinary meeting of shareholders. If the Board of Commissioners fails tomake notice of the extraordinary meeting of shareholders within 22 days as of the receipt of such request, theshareholders concerned may call such meeting at the expense of Indosat after obtaining approval from theChairman of District Court.
122

Announcement of a general meeting is given to shareholders at least 14 days (excluding notification dateand invitation date) prior to the notice for the general meeting by an advertisement in at least two dailynewspapers (one in the Indonesian language and one in the English language), one of which has a widecirculation in Indonesia. Notice must be given by placement of advertisement in at least two daily newspapers,one of which is in the Indonesian language and has a wide circulation in Indonesia and one of which is in theEnglish language at least 14 days before the date of the annual general meeting or extraordinary general meeting,excluding the date of the notice and the date of the meeting.
If all shareholders are present and/or represented, notice requirements may be waived and the generalmeeting of shareholders may adopt binding resolutions.
Generally, the quorum for a general meeting of shareholders requires shareholders representing more than50.0% of the issued shares of common stock to be represented in person or by a power of attorney at suchmeeting.
Shareholders may be represented at a general meeting of shareholders by a person holding a power ofattorney, but no Commissioner, Director or employee of Indosat may act in such capacity. Unless otherwiseprovided in the Articles, and subject to the special voting rights of the Special Share, resolutions in order to beadopted must receive the affirmative vote of the holders of more than 50.0% of the shares of common stockwhich are present and being voted at the meeting (simple majority votes).
Fiscal Year and Accounts
Our fiscal year commences on January 1 and ends on December 31.
No later than 90 days from the closing of the fiscal year, the Board of Directors must submit the balancesheet, profit and loss account and other financial statements audited by a public accountant to the Board ofCommissioners, who must review these statements and report on this review to the general meeting ofshareholders. Copies of such documents must be available at the head office of Indosat from the date of noticefor the annual general meeting of shareholders up to the date of closing of the annual general meeting ofshareholders.
The annual general meeting of shareholders will consider and decide whether or not the balance sheet andprofit and loss account of Indosat is approved. Such approval fully discharges the Board of Directors and theBoard of Commissioners from their responsibilities during the fiscal year concerned to the extent that suchactions are reflected in such balance sheet and profit and loss account.
Utilization of Profit and Dividends
The profit of Indosat, as determined by the annual general meeting of shareholders, after deduction ofcorporate tax, must be used as a reserve fund, for dividends and for other purposes, the percentage of which mustbe determined annually by a general meeting of shareholders.
Dividends are paid in accordance with a resolution adopted at a general meeting of shareholders, upon therecommendation of the Board of Directors, which resolution also determines the time and manner of payment ofthe dividends. All shares of common stock which are fully paid and outstanding at the time a dividend or otherdistribution is declared are entitled to share equally in such dividends or other distribution. Dividends are payableto the persons whose names are entered in the register of shareholders of Indosat, on a business day determinedby the general meeting of shareholders at which the resolution for the distribution of dividends is adopted.
The Board of Directors and the Board of Commissioners may, by resolutions of both, declare interimdividends if the financial condition of Indosat so permits, provided that such interim dividends are offset againstthe dividends to be declared at the subsequent annual general meeting.
123
Dividends unclaimed after five years from the date of which they are payable cease to be payable and are tobe credited to the reserve fund of Indosat. Notices concerning dividends and interim dividends must beannounced in a at least two daily newspapers in the Indonesian language with wide or national circulation inIndonesia, in one daily newspaper in the English language and on the stock exchange where the shares are listed.
If the profit and loss account in one fiscal year shows a loss which cannot be covered by the reserve fundreferred to below, the loss remains recorded as such in the profit and loss account and for the succeeding yearsIndosat is deemed not to have made a profit if the loss recorded as such in the profit and loss account has notbeen fully covered.
To cover future losses, a reserve fund may be created and the amount of the reserve fund will be determinedby a general meeting of shareholders. The reserve fund may be used for capital outlays or other purposes asdetermined at the annual general meeting of shareholders. However, it must only be used for the benefit ofIndosat. Any profits earned from such reserve fund shall be entered in the profit and loss account of Indosat.
Liquidation
In the event that we go into liquidation, the Board of Directors will act as liquidator if required by theprevailing regulations. The balance of any liquidation account which is set up, after payment of all our debts andobligations, will be used to pay all of our shares. If possible, payment on these shares shall be made at a pricewritten on the share certificates. The remaining balance of the liquidation account shall be distributed accordingto resolutions of the general meeting of shareholders.
Amendments to the Articles of Association
Amendments to our Articles of Association may be made only by a resolution of an extraordinary generalmeeting of shareholders attended by at least two-thirds of the shareholders and approved by more than two-thirdsof the shareholders with voting rights, provided that (i) increases in our share capital without pre-emptive rights,(ii) merger, consolidation, acquisition and demerger involving us, (iii) dissolution and liquidation,(iv) amendments to the Articles of Association related to our purposes and objectives and the Series A holder’sveto rights can be affected only if the meeting is attended and the action approved by the holder of the Series Ashare.
A resolution regarding a reduction of the authorized or subscribed capital must be published by the Board ofDirectors in at least two daily newspapers, one of which is in the Indonesian language having a nationalcirculation, and the other in the English language, for the benefit of creditors within the period at the latest ofseven days after the date of the general meeting of shareholders. In case a quorum for the extraordinary generalmeeting is not reached, within ten to twenty-one days from the original extraordinary general meeting a secondmeeting may be held to decide on matters which were not resolved at the first meeting. The second meeting canresult in a valid and binding decision if attended by at least three-fifths of the shareholders and be approved bymore than half of the shareholders with voting rights. Amendments related to a reduction of capital only becomeeffective upon the approval of the Ministry of Law and Human Rights of Indonesia.
Transactions with Affiliates
It is the policy of Indosat not to enter into transaction with affiliates unless the terms thereof are no lessfavorable to Indosat than those which could be obtained by Indosat on an arm’s length basis from an unaffiliatedthird party.
Under BAPEPAM-LK regulations and Article 19 of our Articles of Association, any transaction in whichthere is a conflict of interest (as defined below) must be approved by a majority of the shareholders of commonstock who do not have a conflict of interest in the proposed transaction, unless the conflict existed before Indosat
124

was listed and was fully disclosed in the offering documents. A conflict of interest is defined in BAPEPAM-LKRule No. IX.E.1 to mean the difference between Indosat’s common interests, on the one hand, and the personaleconomic interests of the members of our Board of Commissioners, Board of Directors or our majorityshareholders (a holder of 20.0% or more of our issued shares) of Indosat in one transaction which may imposelosses on us . A conflict of interest also exists under BAPEPAM-LK rules when members of the Board ofCommissioners, Board of Directors or a controlling shareholder of Indosat is involved in a transaction in whichtheir personal interests may be in conflict with the interest of Indosat, unless otherwise excepted byBAPEPAM-LK regulations.
We expect, in light of the substantial presence which enterprises owned or controlled by the Government orQtel Asia or one of their affiliates have in Indonesia, that it may be desirable, in connection with the developmentand growth of our business, for us to enter into joint ventures or other arrangements or transactions with suchenterprise from time to time. Under such circumstances, we may seek to consult BAPEPAM-LK in determiningwhether the proposed joint venture, arrangement or transaction would require a vote of disinterested shareholdersunder the terms of the BAPEPAM-LK rule. If BAPEPAM-LK were of the view that the proposed joint venture,arrangement or transaction would not require a vote of disinterested shareholders under its rule, we wouldproceed without seeking disinterested shareholder approval. If, however, BAPEPAM-LK were to take theposition that the proposal would require a vote of disinterested shareholders under its rule, we would either seekto obtain the requisite disinterested shareholder approval or abandon the proposal.
Material Contracts
On July 30, 2007, we entered into a cooperation agreement with Telkomsel to set up networkinterconnection between our fixed local telecommunications network and Telkomsel’s cellular mobile network.Pursuant to this agreement, we and Telkomsel agreed to enable each party’s customers to make local, long-distance and international calls between our fixed local telecommunications network and Telkomsel’s cellularmobile network. We amended this agreement through the first amendment No. Telkomsel:AMD.2283/LG.05/PD-00/XII/2007—No Indosat: 029/C00-CC0/LG/07 dated December 19, 2007, the secondamendment No. Telkomsel: AMD.339/LG.05/PD-00/III/2008—No. Indosat: 004/C00-CC0/LGL/08 datedMarch 3, 2008, the third amendment No. Telkomsel: 1762/LG.05/PD-00/XI/2010 and No. Indosat: 011/C00-C0AA/LGL/10 dated November 1, 2010, the fourth amendment No. Telkomsel: 459/LG.05/PD-00/IV/2011—No. Indosat: 042/C00-C0H/LGL/11 dated April 7, 2011 and the fifth amendment No. Telkomsel: 741/LG.05/PD-00/VII/2011—No. Indosat: 84/C00-C0HA/LGL/2011 dated July 19, 2011.
On December 18, 2007, we entered into an interconnection agreement with Telkom to set up networkinterconnection between our cellular wireless network and Telkom’s fixed telecommunications network. Underthis agreement, we and Telkom agreed to open prefixes and access codes belonging to the other party, whichenable each party’s customers to make interconnection calls of various types between our cellular wirelessnetwork and Telkom’s fixed telecommunications network. The agreement sets forth the interconnection tariffsfor providing interconnection services based upon a cost-based regime and is valid for two years, but can beextended or terminated based upon mutual agreement of the parties. We amended this agreement as stipulated infirst amendment No. Telkom 47/HK.820/DCI-A1000000/2008—No. Indosat 021/C00-CC0/LGL/2008 datedMarch 31, 2008 and second amendment No. Telkom 123/HK.820/DCI-A1000000/2009—No. Indosat 007/C00-C0A/LGL/2009 dated December 30, 2009, the third amendment as stipulated in the form of mutual officeminutes No. Telkom Tel.024/YN.000/DCI-A1050000/2011—No. Indosat 003/C00-C0H/LGL/2011 datedJanuary 31, 2011, the third amendment No Telkom: Tel.185/HK 820/DCI-A1000000/2011—No. Indosat:032/C00-C0H/LGL/2011 dated July 20, 2011 and the fourth amendment No. Telkom: Tel. 259/HK 820/DCI-A1000000/2011 – No. Indosat: 043/C00-C0H/LGL/2011 dated December 20, 2011.
On December 18, 2007, we entered into an interconnection agreement with Telkom to set up networkinterconnection between our fixed telecommunications network and Telkom’s fixed telecommunicationsnetwork. Under this agreement, we and Telkom agreed to open prefixes and access codes belonging to the other
125

party which enable each party’s customers to make local, long-distance and international calls between our fixedtelecommunications network and Telkom’s fixed telecommunications network. The agreement sets forth theinterconnection tariffs for providing interconnection services based upon a cost-based regime and is valid for twoyears, but can be extended or terminated based upon mutual agreement of the parties. We amended thisagreement through the first amendment No Telkom 48/HK.820/DCI-A1000000/2008—No Indosat 020/C00-CC0/LGL/2008 dated March 31, 2008, the second Amendment No Telkom 125/HK.820/DCI-A1000000/2009—No Indosat 006/C00-COA/LGL/2009 dated December 30, 2009, the third amendment as stipulated in the form ofmutual office minutes No Telkom Tel.025/YN.000/DCI-A1050000/2011—No Indosat 002/C00-C0H/LGL/2011dated January 31, 2011, the third amendment No. Telkom: Tel.186/HK 820/DCI-A1000000/2011 – No. Indosat:033/C00-C0H/LGL/2011 dated July 20, 2011 and the fourth amendment No. Telkom: Tel. 260/HK 820/DCI-A1000000/2011 – No. Indosat: 044/C00-C0H/LGL/2011 dated December 20, 2011.
On December 19, 2007, we entered into a cooperation agreement with Telkomsel to set up networkinterconnection between our cellular mobile network and Telkomsel’s cellular mobile network. Pursuant to thisagreement, we and Telkomsel agreed to enable each party’s customers to make or receive interconnection callsof various types between our cellular mobile network and Telkomsel’s cellular mobile network. The agreement isautomatically renewed every two years but can be unilaterally terminated by either party upon three month’swritten notice. We amended the agreement through the first amendment No Telkomsel: AMD.233/LG.05/PD-00/II/2008 and No. Indosat: 003/C00-CC0/LGL/08 dated February 18, 2008 and through the second amendmentNo. Telkomsel : 1392/LG.05/PD-00/IX/2010 and No. Indosat: 009/C00-C0AA/LGL/10 dated September 7, 2010and through the third amendment No. Telkomsel : 458/LG.05/PD-00/IV/2011 and No. Indosat: 041/C00-C0H/LGL/11 dated April 7, 2011.
On November 25, 2009, we entered into two trustee agreements with PT Bank Rakyat Indonesia (Persero)Tbk, as trustee, in connection with our Seventh Indosat Bonds and our Fourth Syari’ah Ijarah Bonds. TheSeventh Indosat Bonds were issued on December 8, 2009 and have total face value of Rp1,300.0 billion. TheFourth Syari’ah Ijarah Bonds were issued on December 8, 2009 and have a total face value of Rp200.0 billion.For further information on this agreement, see “Item 5: Operating and Financial Review and Prospects—Principal Indebtedness.”
On March 24, 2009, we held meetings with holders of our Series B Second Indosat Bonds, Third IndosatBonds, Fourth Indosat Bonds, Fifth Indosat Bonds, Sixth Indosat Bonds, First Syari’ah Ijarah Bonds, SecondSyari’ah Ijarah Bonds and Third Syari’ah Ijarah Bonds, and obtained consents to, among other things,amendments to the definitions of “Debt,” “EBITDA,” and “Equity” and to change the ratio of Debt to Equityfrom 1.75 to 1 to 2.5 to 1 in the trustee agreements to these bonds. For further information on these amendments,see “Item 5: Operating and Financial Review and Prospects—Principal Indebtedness.”
On July 29, 2010 we, through Indosat Palapa Company B.V. (“Indosat Palapa”) issued guaranteed Notes2020 with a total face value of US$650.0 million. The notes were issued at 99.478% of their principal amountand mature on July 29, 2020. The notes bear interest at the fixed rate of 7.375% per annum payable in semi-annual installment due on January 29 and July 29 of each year, commencing January 29, 2011. For furtherinformation on these notes, see “Item 5: Operating and Financial Review and Prospects—PrincipalIndebtedness.”
On August 28, 2007, we entered into a five-year unsecured credit facility agreement with BCA, amountingto Rp1,600 billion. Furthermore, on September 20, 2007, we obtained an increase in the credit facility byRp400,000. As a result, the credit facility has become Rp2,000,000. On February 10, 2011, we entered into acredit agreement with BCA providing for a three-year unsecured time loan revolving facility amounting to up toRp1,000 billion. This agreement was amended on December 1, 2011 to increase the amount available under thefacility to a maximum of Rp1,500 billion. For further information on these agreements, see “Item 5: Operatingand Financial Review and Prospects—Principal Indebtedness.”
126

On July 28, 2009, we entered into a five-year unsecured credit facility agreement with Bank Mandiriamounting to Rp1,000 billion and on August 18, 2009, we obtained an export credit facility from EKN totalingUS$315.0 million. On June 21, 2011 we entered into a credit agreement with Bank Mandiri providing for a three-year unsecured revolving credit facility amounting to up to Rp1,000 billion. This agreement was amended onDecember 5, 2011 to, among other things, increase the amount available under the facility to a maximum ofRp1,500 billion. For further information on these agreements, see “Item 5: Operating and Financial Review andProspects—Principal Indebtedness.”
Tower Lease Agreements
To comply with the Minister of Communication and Information Regulation No. 02/PER/M.KOMINFO/2008 in conjunction with The Joint Decree of Minister of Communication and Information, Minister of InternalAffairs, Minister of Public Work and Head of Coordination Investment Board concerning Guidelines ForConstruction And Utilization Of Joint Telecommunication Towers, we have entered into tower lease agreementswith several tenants, as follows:
On January 29, 2010 we entered into a tower lease agreement with PT Hutchison CP Telecommunications(“HCPT”), pursuant to which HCPT intends to lease the towers of Indosat at basic service (without civil,mechanical and electrical components). The term of this agreement is 12 years and can be extended for aminimum of six years thereafter, unless HCPT intends to terminate the agreement with prior written noticesubmitted within one month before the end of the agreement. We amended this agreement on August 18, 2011.
On April 15, 2010 we entered into a tower lease agreement with PT Natrindo Telepon Seluler (“NTS”),pursuant to which NTS intends to lease the towers of Indosat at basic service (without civil, mechanical andelectrical components). The term of this agreement is 10 years and can be extended automatically for the sameperiod of the initial term, unless NTS intends to terminate the agreement with prior written notice submittedwithin 90 days before the end of the agreement.
On May 24, 2010 we entered into a tower lease agreement with PT XL Axiata (“XL”), pursuant to whichXL intends to lease towers of Indosat at basic service (without civil, mechanical and electrical components). Theterm of this agreement is 10 years and can be extended for a minimum of five years unless XL intends toterminate the agreement with prior written notice submitted within 120 days before the end of the agreement.
On June 3, 2010 we entered into a tower lease agreement with PT Berca Global Access (“BERCA”),pursuant to which BERCA intends to lease the towers of Indosat at basic service (without civil, mechanical andelectrical components). The term of this agreement is 10 years and can be extended for a minimum of six yearsunless BERCA intends to terminate the agreement with prior written notice submitted within one month beforethe end of the agreement.
On February 4, 2011, we entered into a tower lease agreement with PT Daya Mitra Telekomunikasi(“Mitratel”), pursuant to which Mitratel intends to lease the towers of Indosat at basic service (without civil,mechanical and electrical components) and reserves the right to re-lease it to PT Telekomunikasi Indonesia TbkGroup with full services (including civil, mechanical and electrical components). The term of this agreementshall be 10 years period and can be extended for a minimum of five years based on mutual consent of the parties.
On February 10, 2011, we entered into a memorandum of agreement with PT First Media Tbk (“FM”),pursuant to which FM leased Indosat’s tower with full services (including civil, mechanical and electricalcomponents). The term of this memorandum of agreement is five years and can be extended for a minimum offive years period based on mutual consent of the parties.
A copy, summary and/or translation of the above agreements are filed as Exhibits 4.2 through 4.11, 15.2,15.11, 15.15 through 15.21, 15.26 and 15.28 attached hereto.
127

Exchange Controls
See “Item 3: Key Information—Foreign Exchange” included elsewhere in this annual report.
Taxation
The following summary contains a description of the principal Indonesian and U.S. federal taxconsequences of the purchase, ownership and disposition of ADSs or shares of common stock. This summarydoes not purport to be a competitive description of all of the tax considerations that may be relevant to a decisionto purchase, own or dispose of ADSs or shares of common stock. PROSPECTIVE PURCHASERS SHOULDCONSULT THEIR TAX ADVISORS ABOUT THE INDONESIAN AND U.S. FEDERAL, STATE ANDLOCAL TAX CONSEQUENCES TO THEM OF THE PURCHASE, OWNERSHIP AND DISPOSITION OFADSs OR SHARES OF COMMON STOCK.
Indonesian Taxation
The following is a summary of the principal Indonesian tax consequences of the ownership and dispositionof common stock or ADSs to a non-resident individual or non-resident entity that holds common stock or ADSs(a “Non-Indonesian Holder”). As used in the preceding sentence, a “non-resident individual” is a foreign nationalindividual who is not physically present in Indonesia for 183 days or more during any twelve-month period orpresent for any period with the intent to reside in Indonesia, during which period such non-resident individualreceives income in respect of the ownership or disposition of common stock or ADSs, and a “non-resident entity”is a corporation or a non-corporate body that is established, domiciled or organized under the laws of ajurisdiction other than Indonesia and does not have a fixed place of business or otherwise conducts business orcarries out activities through a permanent establishment in Indonesia during an Indonesian tax year in which suchnon-Indonesian entity receives income in respect of the ownership or disposition of common stock or ADSs. Indetermining the residency of an individual or entity, consideration will be given to the provisions of anyapplicable double taxation treaty to which Indonesia is a party.
Dividends. Dividends declared by us out of retained earnings and distributed to a Non-Indonesian Holder inrespect of common stock or ADSs are subject to Indonesian withholding tax, currently at the rate of 20.0%, onthe amount of the distribution (in the case of cash dividends) or on the shareholders’ proportional share of thevalue of the distribution. A lower rate provided under double taxation treaties may be applicable provided therecipient is the beneficial owner of the dividend and has provided to us (with a copy to the Indonesian Office ofTax Services where we are registered) a certificate of tax domicile issued by the competent authority, or itsdesignee, of the jurisdiction where the Non-Indonesian Holder is domiciled. Indonesia has concluded doubletaxation treaties with over 50 countries, including Australia, Belgium, Canada, France, Germany, Japan,Malaysia, The Netherlands, Singapore, Sweden, Switzerland, the United Kingdom and the United States ofAmerica. Under the U.S.-Indonesia tax treaty, the withholding tax on dividends is generally, in the absence of a20.0% voting interest, reduced to 15.0%.
Capital Gains. The sale or transfer of common stock listed on an Indonesian stock exchange is subject to taxat the rate of 0.1% of the value of the transaction. The broker handling the transaction is obligated to withholdsuch tax. The holding, sale or transfer of founder shares listed on an Indonesian stock exchange may, undercurrent Indonesian tax regulations, be subject to an additional 0.5% final income tax. Subject to the promulgationof implementing regulations (which have not been issued to date), the estimated net income received or accruedfrom the sale of movable assets in Indonesia, which may include common stock not listed on an Indonesian stockexchange or ADSs, by a Non-Indonesian holder (with the exception of the sale of assets under Article 4paragraph (2) of the Indonesian income tax law) may be subject to Indonesian withholding tax at the rate of20.0%. However, this provision in the income tax law is not currently applied in practice. It is expected that, ifand when further implementing regulations are issued in respect to this provision in the income tax law, inpractice this withholding tax will (i) only be applied if common stock not listed on an Indonesian stock exchange
128

is purchased and paid for by an Indonesian resident subject to tax or by a permanent establishment in Indonesiaof a non-resident entity or individual and (ii) not affect the net proceeds from any sale or transfer of ADSsthrough a regular trade on the NYSE by a Non-Indonesian Holder.
In cases where a purchaser or Indonesian broker will be required under Indonesian tax laws to withhold taxon payment of the purchase price for common stock or ADSs, that payment may be exempt from Indonesianwithholding or other Indonesian income tax under applicable double taxation treaties to which Indonesia is aparty (including the U.S.-Indonesia double taxation treaty). However, current Indonesian tax regulations do notprovide specific procedures for removing the purchaser’s or Indonesian broker’s obligation to withhold tax fromthe proceeds of such sale. To take advantage of the double taxation treaty relief, Non-Indonesian Holders mayhave to seek a refund from the Indonesian Tax Office by making a specific application accompanied by aCertificate of Domicile issued by the competent tax authority, or its designee, of the jurisdiction in which theNon-Indonesian Holder is domiciled.
Stamp Duty. Transactions in common stock in Indonesia are subject to stamp duty payable at the rate ofRp6,000 on transactions with a total value of more than Rp1,000,000 and Rp3,000 on transactions with a totalvalue of up to Rp1,000,000.
U.S. Federal Income Taxation
The following discussion addresses the principal U.S. federal income tax consequences to a U.S. Holder (asdefined below), of owning ADSs or shares of our common stock. The description below is based on the InternalRevenue Code of 1986, as amended, or the Code, Treasury Regulations promulgated thereunder, the income taxconvention between the United States and Indonesia and judicial and administrative interpretations thereof, all asin effect on the date hereof and all of which are subject to change, possibly retroactively. The tax treatment of aholder of ADSs or shares of our common stock may vary depending upon the holder’s particular situation.Certain holders (including, but not limited to, insurance companies, tax-exempt organizations, financialinstitutions, persons subject to the alternative minimum tax, broker-dealers, persons that have a “functionalcurrency” other than the U.S. dollar, persons that received ADSs or shares of our common stock as compensationfor services, persons owning, directly or indirectly, 10.0% or more of our voting shares, and persons who holdADSs or shares of our common stock as part of a “hedge,” “straddle” or “conversion transaction” within themeaning of Sections 1221, 1092 and 1258 of the Code and the Treasury Regulations thereunder) may be subjectto special rules not discussed below. Except as discussed below with regard to persons who are not U.S. Holders(as defined below), the following summary is limited to U.S. Holders (as defined below) who will hold ADSs orshares of our common stock as “capital assets”, within the meaning of Section 1221 of the Code. The discussionbelow does not address the effect of any state or local tax law on a holder of ADSs or shares of our commonstock.
As used herein, the term “U.S. Holder” means a holder of ADSs or shares of our common stock that is forU.S. federal income tax purposes (i) a citizen or resident of the United States; (ii) a corporation (including anyentity treated as a corporation for U.S. federal income tax purposes) created or organized in or under the laws ofthe United States, any state thereof or the District of Columbia; (iii) an estate whose income is subject to U.S.taxation regardless of its source; (iv) a trust if a court within the United States is able to exercise primarysupervision over the administration of the trust and one or more United States persons have the authority tocontrol all substantial decisions of the trust; or (v) a holder whose income in respect of the ADSs or shares of ourcommon stock is subject to U.S. federal income tax on a net income basis.
If a partnership or other entity or arrangement treated as a partnership for U.S. federal income tax purposesholds ADSs or shares of our common stock, the tax treatment of a partner will generally depend upon the statusof the partner and the activities of the partnership. A U.S. Holder that is a partner in a partnership holding ADSsor shares of our common stock is urged to consult its own tax advisor.
129

The summary below does not discuss all aspects of U.S. federal income taxation that may be relevant to aparticular holder of ADSs or shares of our common stock in light of the holder’s particular circumstances andincome tax situation. Prospective holders should consult their own tax advisors as to the specific taxconsequences to them of the purchase, ownership and disposition of ADSs or shares of our common stock,including the application and the effect of state, local, foreign and other tax laws and the possible effects ofchanges in United States or other tax laws.
Taxation of Distributions. Subject to the discussion under “Passive Foreign Investment Company Status”below, for U.S. federal income tax purposes, the amount of a distribution with respect to ADSs or shares of ourcommon stock (including any withholding tax deemed to be imposed with respect to such distributions) will betreated as a dividend taxable as ordinary income on the date of receipt by the Depositary or the holder,respectively, to the extent of our current and accumulated earnings and profits, as determined for U.S. federalincome tax purposes. Distributions, if any, in excess of such current and accumulated earnings and profits willfirst constitute a non-taxable return of capital to the extent thereof, and then as a capital gain realized on thedisposition of the ADSs or shares of our common stock. The portion of any distribution treated as a non-taxablereturn of capital will reduce such holder’s adjusted tax basis in such ADSs or shares of our common stock. Suchcapital gain will be long-term if the ADSs or shares of our common stock have been held longer than one year.U.S. Holders will not be eligible for the dividends received deduction otherwise allowable under the Code fordistributions to domestic corporations in respect of distributions on the ADSs or share of our common stock.
For taxable years beginning before January 1, 2013, “qualified dividend income” received by an individualis subject to federal income taxation at rates lower than those applicable to other types of ordinary income. Basedupon our existing and anticipated future operations and current assets, we believe that we are a “qualified foreigncorporation” and that our dividends paid to U.S. Holders who are individuals will be eligible to be treated as“qualified dividend income” provided that applicable holding period requirements with respect to the ADSs orshares of our common stock and other applicable requirements are satisfied by such U.S. Holders. Dividends paidby a foreign corporation that is classified as a passive foreign investment company, or PFIC, are not “qualifieddividend income.” See “—Passive Foreign Investment Company Status” below.
If a distribution is paid in any currency other than U.S. dollars, the amount of the distribution will betranslated into U.S. dollars at the spot rate on the date the distribution is received (which for holders of ADSs,would be the date such dividend is received by the Depositary), regardless of whether the distributions are in factconverted into U.S. dollars on that date. Any gain or loss in respect of such non-U.S. currency arising fromexchange rate fluctuations after that date will be ordinary income or loss.
Taxation of Capital Gains and Losses. Subject to the discussion under “Passive Foreign InvestmentCompany Status” below, a U.S. Holder will generally recognize a taxable gain or loss on the sale, exchange orother disposition of ADSs or shares of our common stock in an amount equal to the difference between theamount realized on the sale, exchange or other disposition and such holder’s adjusted tax basis in such ADSs orshares of our common stock. This will result in a long-term or short-term capital gain or loss, depending onwhether the ADSs or shares of our common stock have been held for more than one year. For non-corporate U.S.Holders, the U.S. income tax rate applicable to the net long-term capital gain recognized for a year upon a sale,exchange or other disposition of ADSs or shares of our common stock is currently 15.0% for taxable yearsbeginning before January 1, 2013. Deposit and withdrawal of shares of our common stock in exchange for ADSsby a U.S. Holder will not result in a realization of gain or loss for U.S. federal income tax purposes.
Passive Foreign Investment Company Status. Special U.S. federal income tax rules apply to a U.S. Holderthat holds an equity interest in a PFIC. In general, a foreign corporation will constitute a PFIC for any taxableyear for United States federal income tax purposes if 75.0% or more of its gross income for such taxable yearconsists of passive income (generally, interest, dividend, rents, royalties and net gain from the disposition ofassets that give rise to such income) or 50.0% or more of its average assets held during such taxable year consistof assets that produce or are held for the production of passive income.
130

Based upon our existing and anticipated future operations and current assets, we believe that we are not, andanticipate that we will not become in the foreseeable future, a PFIC. If we are not operated in the mannercurrently anticipated, however, we may be considered a PFIC for the current or for a subsequent year dependingupon our actual activities. Furthermore, because PFIC status is determined on a year-by-year basis and dependsupon the composition of a company’s income and assets and the market value of its assets from time to time,there can be no assurance that we will not be considered a PFIC for any taxable year.
If we are a PFIC for any taxable year during which a U.S. Holder holds ADSs or shares of our commonstock, such U.S. Holder will be subject to special tax rules with respect to any “excess distribution” received andany gain realized from a sale or other disposition, including a pledge, of ADSs or shares of our common stock.Distributions received in a taxable year that are greater than 125% of the average annual distributions receivedduring the shorter of the three preceding taxable years or such U.S. Holder’s holding period for ADSs or sharesof our common stock will be treated as excess distributions. Under these special tax rules: (a) the excessdistribution or gain will be allocated rateably over such U.S. Holder’s holding period for ADSs or shares of ourcommon stock, (b) the amount allocated to the current taxable year, and any taxable year prior to the first taxableyear in which we were a PFIC, will be treated as ordinary income, and (c) the amount allocated to each other yearwill generate an additional tax that is due for the current taxable year and that is equal to the total, for each suchother year, of (i) the amount allocated to such year multiplied by the highest tax rate in effect for such year and(ii) an amount equal to the interest charge that would have been imposed for underpaying that amount of tax forsuch year.
An election may be available to avoid these adverse tax consequences if certain conditions are met and theU.S. Holder elects to annually mark-to-market the ADSs or shares of common stock. Furthermore, although aPFIC shareholder may mitigate the rules described above by electing to treat a PFIC as a “qualified electingfund” under Section 1295 of the Code, this option is not available to U.S. Holders because we do not intend tocomply with the requirements necessary to permit a U.S. Holder to make this election.
U.S. Holders are advised to consult their tax advisors concerning the U.S. federal income tax consequencesof holding the ADSs or shares of our common stock and of making the mark-to-market election if we areconsidered a PFIC in any taxable year. A U.S. Holder who owns ADSs or shares of our common stock duringany year that we are a PFIC must file with the Internal Revenue Service, or IRS, Form 8621.
Foreign Tax Credit Considerations. For United States federal income tax purposes, U.S. Holders will betreated as having received the amount of any Indonesian tax withheld upon the payment of a dividend and as thenhaving paid over the withheld taxes to Indonesia. As a result of this rule, the amount of dividend included in aU.S. Holder’s gross income may be greater than the amount of cash actually received (or receivable) by theU.S. Holder.
Subject to the limitations and conditions set forth in the Code, U.S. Holders may elect to claim a creditagainst their U.S. federal income tax liability for Indonesian tax withheld from dividends or Indonesian taximposed on capital gains, if any, or, if they do not elect to credit any foreign tax for the taxable year, they maydeduct such tax. For purposes of the foreign tax credit limitation, dividends and capital gains will, depending ona U.S. Holder’s particular circumstances, generally constitute “passive” or “general” income. Furthermore,dividends will generally constitute foreign source income and currency gains and capital gains will generallyconstitute U.S. source income. Capital loss will generally be allocated against U.S. source income. Becausecapital gains will generally constitute U.S. source income, as a result of the U.S. foreign tax credit limitation, anyIndonesian or other foreign tax imposed upon capital gains in respect of ADSs or shares of our common stockmay not be currently creditable unless a U.S. Holder had other foreign source income for the year in theappropriate foreign tax credit limitation basket or an election to treat such gain as foreign source income isavailable. Investors are urged to consult their tax advisors regarding the availability of the foreign tax creditunder their particular circumstances.
131

Non-U.S. Holders. Except for the possible imposition of U.S. backup withholding tax (see “—U.S. BackupWithholding and Information Reporting”), payments of any dividend on an ADS or share of our common stockto a holder who is not a U.S. Holder (a “non-U.S. Holder”) will not be subject to U.S. federal income tax andgain from the sale, redemption or other disposition of an ADS or a shares of our common stock, provided that:
a. the non-U.S. Holder shall not be or have been engaged in a trade or business in the United States;
b. there is no present or former connection between such non-U.S. Holder and the United States,including, without limitation, such non-U.S. Holder’s status as a former citizen thereof or formerresident thereof; and
c. in the case of a gain from the sale, redemption or other disposition of an ADS or shares of our commonstock by an individual, the non-U.S. Holder is not present in the United States for 183 days or more inthe taxable year of the sale or certain other conditions are met.
If dividends, gain or income with respect to an ADS or shares of our common stock of a non-U.S. Holder iseffectively connected with the conduct of such trade or business (or attributable to a permanent establishment inthe United States, in the case of a holder who is a resident of a country which has an income tax treaty with theUnited States), the non-U.S. Holder may be subject to U.S. income taxes on such dividend, gain or income at thestatutory rates provided for U.S. Holders after deduction of deductible expenses allocable to such effectivelyconnected income. In addition, if such a non-U.S. Holder is a foreign corporation, it may be subject to a branchprofits tax currently equal to 30.0% of its effectively connected earnings and profits for the taxable year, asadjusted for certain items, unless a lower rate applies under a United States income tax treaty with the non-U.S.Holder’s country of residence. For this purpose, dividends, gain or income in respect of an ADS or shares of ourcommon stock will be included in earnings and profits subject to the branch profits tax if the dividend, gain orincome is effectively connected with the conduct of the United States trade or business of the non-U.S. Holder.
U.S. Backup Withholding and Information Reporting. Payments made by a U.S. paying agent or other U.S.intermediary broker in respect of ADSs or shares of our common stock may be subject to information reportingto the IRS and to a backup withholding tax. Backup withholding will not apply, however, (i) to a holder whofurnishes a correct taxpayer identification number and makes any other required certification or (ii) to a holderwho is otherwise exempt from backup withholding.
Any amounts withheld under the backup withholding rules from a payment to a holder will be allowed as arefund or a credit against such holder’s U.S. federal income tax, provided that the holder has complied withapplicable reporting obligations.
Information with Respect to Foreign Financial Assets. Under recently enacted legislation, the HiringIncentives to Restore Employment Act (the “HIRE Act”), individuals that (i) are either (a) a U.S. citizen, (b) aresident alien for any part of the year, (c) a nonresident alien that has made an election to be treated as a residentalien for purposes of filing a joint U.S. federal income tax return or (d) a nonresident alien who is a bonafideresident of American Samoa or Puerto Rico and (ii) own “specified foreign financial assets” with an aggregatevalue in excess of US$50,000 on the last day of the taxable year (or with an aggregate value in excess of $75,000at any time during the taxable year), will generally be required to file an information report on IRS Form 8938with respect to such assets with their U.S. federal tax returns. “Specified foreign financial assets” include anyfinancial accounts maintained by foreign financial institutions, as well as any of the following, but only if theyare held for investment and not held in accounts maintained by financial institutions: (i) stocks and securitiesissued by non-United States persons, (ii) financial instruments and contracts that have non-United States issuersor counterparties, and (iii) interests in foreign entities. Holders that are individuals are urged to consult their taxadvisors regarding the application of this legislation to their ownership of ADSs or shares of our common stock.
132

Documents on Display
Any material which is filed as an exhibit to this annual report on Form 20-F with the U.S. Securities andExchange Commission is available for inspection at our offices. See “Item 4: Information on the Company—Principal Registered Offices.”
Item 11: QUANTITATIVE AND QUALITATIVE DISCLOSURES ABOUT MARKET RISK
Quantitative and Qualitative Disclosure about Market Risk
We are exposed to market risks primarily from changes in interest rates, changes in foreign currencyexchange rates, and equity price risk on the value of our long-term investments. To manage our foreign exchangeand interest rate risks, we have entered into interest rate swap contracts, cross currency swap contracts and othertransactions aimed at reducing and/or managing the adverse impact of changes in foreign exchange and interestrates on our operating results and cash flows. We enter into such transactions to minimize risk without engagingin speculative practices. We account for these instruments as transactions not designated as hedges, whereinchanges in the fair value are charged or credited directly as expenses or income for the relevant year. We alsoconvert surplus Indonesian rupiah funds to U.S. dollars on a regular basis in amounts necessary to meet our U.S.dollar expenses.
133

Interest Rate Sensitivity
As of December 31, 2011, most of our outstanding debt was subject to fixed interest rates. In addition, as ofDecember 31, 2011, we held U.S. dollar-denominated and Indonesian rupiah-denominated deposits, which alsohave exposure to interest rate fluctuations. The following table sets forth information regarding our financialinstruments that are sensitive to changes in interest rates. For long-term debt and bonds payable, the table setsforth principal cash flows and related interest rates according to their expected maturity dates. The informationsets forth in the table has been determined based on the following assumptions: (i) variable interest rates in timedeposits denominated in U.S. dollar and Indonesian rupiah are based on the available interest rate in 2011;(ii) interest rates for long-term deposits denominated in Indonesian rupiah are based on one-month Certificate ofBank Indonesia and one or three month JIBOR on December 2011 plus a margin; and (iii) interest rates for long-term debts denominated in U.S. dollars are based on provisions in the various agreements. However, we cannotassure you that such assumptions will be correct for future periods. Such assumptions and the informationdescribed in the table may be influenced by a number of factors, including increases in interest rates in Indonesiaresulting from continued tight liquidity and other monetary and macroeconomic factors affecting Indonesia.
Outstanding Balance asat December 31, 2011 Expected Maturity Date as of December 31
Interest RateForeign
CurrencyRupiah
Equivalent 2012 2013 2014 2015 20162017 and
Thereafter Total
(US$ million) (Rp billion) (Rp billion)AssetsVariable rateTime deposits and
deposits on callRp . . . . . . . . . . . 2.5% –9.75% — 1,592.5 1,592.5 — — — — — 1,592.5US$ . . . . . . . . . . 0.01% – 2.75% 36.0 326.7 326.7 — — — — — 326.7
Total Assets . . . . . . . 36.0 1,919.2 1,919.2 — — — — — 1,919.2
LiabilitiesLoans payable
RpPrincipal . . — 456.8 22.5 434.3 — — — — 456.8Interest . . . . 8.75% -14.5% p.a. — — 39.6 19.0 — — — — 58.6US$Principal . . 299.0 2,711.0 421.1 421.1 421.1 421.1 421.1 605.5 2,711.0Interest . . . . 4.15% p.a. – 5.69%
p.a. — — 127.8 107.5 87.3 67.2 47.1 47.2 484.1Variable rate
RpPrincipal . . — 3,000.0 1,500.0 — 1,500.0 — — — 3,000.0Interest . . . . 1-month
JIBOR + 1.25% — — 158.2 79.1 13.2 — — — 250.5RpPrincipal . . — 2,000.0 2,000.0 — — — — — 2,000.0Interest . . . . 3-month
JIBOR + 1.5% — — 102.0 — — — — — 102.0US$Principal . . 349.4 3,168.6 859.3 1,634.6 206.4 206.4 141.7 120.2 3,168.6Interest . . . . 6-month
LIBOR + 0.35% –2.87% — — 80.3 39.1 17.4 11.6 6.5 6.5 161.4
Bonds payableFixed rate
RpPrincipal . . . . . . 6,350.0 — 1,330.0 2,358.0 320.0 772.0 1,570.0 6,350.0Interest . . . . . . . . 10.2% p.a. – 16.0%
p.a. — 687.7 619.5 468.2 285.9 268.6 584.9 2,914.8US$Principal . . . . . . 650.0 5,894.2 — — — — — 5,894.2 5,894.2Interest . . . . . . . . 7.38% — 434.7 434.7 434.7 434.7 434.7 1,738.8 3,912.3
Variable rateRpPrincipal . . . . . . 42.0 42.0 — — — — — 42.0Interest . . . . . . . . 12.75% p.a. to
19.00% p.a. — 2.7 — — — — — 2.7
Total Liabilities . . . . 1,298.4 23,622.6 6,477.9 5,118.9 5,506.3 1,746.9 2,091.7 10,567.3 31,509.0
Net Cash Flows . . . . (1,262.4) (21,703.4) (4,558.7)(5,118.9)(5,506.3)(1,746.9)(2,091.7) (10,567.3) (29,589.8)
134

In addition, as of December 31, 2011, we held U.S. dollar-denominated and Indonesian rupiah-denominateddeposits, which also have exposure to interest rate fluctuations.
Exchange Rate Sensitivity
Our exposure to exchange rate fluctuations results primarily from U.S. dollar-denominated long-term debtobligations, bonds payable and accounts receivable and payable.
Our accounts payable are primarily foreign currency-denominated net settlement payments to foreigntelecommunications operators, while most of our accounts receivable are Indonesian rupiah-denominatedpayments from domestic operators. During the period from January 1, 2009 through December 31, 2011, theIndonesian rupiah/U.S. dollar exchange rate ranged from a low of Rp12,065 per U.S. dollar to a high of Rp8,460per U.S. dollar, and, during 2011, ranged from a low of Rp9,185 per U.S. dollar to a high of Rp8,460 per U.S.dollar. On December 31, 2011, the prevailing Bank Indonesia exchange rate was Rp9,068 per U.S. dollar. As aresult, we recorded a gain of Rp1,656.4 billion in 2009, a gain of Rp492.4 billion in 2010 and a gain of Rp36.7billion (US$4.0 million) in 2011.
The following table sets forth information about our financial instruments by functional currency andpresents such information in Indonesian rupiah equivalents, which is our reporting currency. The tablesummarizes information on instruments and transactions that are sensitive to foreign exchange rates, includingterm deposits, accounts payable and receivable, and our financial instruments including term deposits, accountreceivable and account payable, and their long term debt. The table presents principal cash flows by expectedmaturity dates.
The information presented in the table has been determined based on the prevailing Bank Indonesiaexchange rate on December 31, 2011 of Rp9,068 per US$1.00. However, we cannot assure you that suchassumption will be correct for future periods. Such assumption and the information described in the table may beinfluenced by a number of factors, including depreciation or appreciation of the Indonesian rupiah in futureperiods.
135

Expected Maturity Date as of December 31,
ForeignCurrency 2012 2013 2014 2015 2016
2017 andThereafter Total
(US$ in millions) (Rp in billion)Assets:Cash and cash equivalents(1)
US$ denominated . . . . . . . 53.4 483.8 — — — — — 483.8Accounts receivable
US$ denominated . . . . . . . 91.2 827.6 — — — — — 827.6Derivative assets
US$ denominated . . . . . . . 17.6 159.4 — — — — — 159.4Other current financial assets
US$ denominated . . . . . . . 0.2 1.7 — — — — — 1.7Other current assets
US$ denominated . . . . . . . 0.0 0.1 — — — — — 0.1Due from related parties
US$ denominated . . . . . . . 0.3 — 2.9 — — — — 2.9Other non-current financial
assetsUS$ denominated . . . . . . . 1.6 — 14.3 — — — — 14.3
Total Assets . . . . . . . . . . . . . . . 164.3 1,472.6 17.2 — — — — 1,489.8
Liabilities:Accounts payable—trade
US$ denominated . . . . . . 13.0 118.0 — — — — — 118.0Procurement payable
US$ denominated . . . . . . 220.8 2,002.1 — — — — — 2,002.1Accrued expenses
US$ denominated . . . . . . 45.2 409.5 — — — — — 409.5Deposits from customers
US$ denominated . . . . . . 1.8 16.7 — — — — — 16.7Derivative liabilities
US$ denominated . . . . . . 15.3 138.2 — — — — — 138.2Other current financial
liabilitiesUS$ denominated . . . . . . 0.0 0.3 0.3
Other current liabilitiesUS$ denominated . . . . . . 6.3 57.4 — — — — — 57.4
Due to related partiesUS$ denominated . . . . . . 0.0 0.1 — — — — 0.1
Loans payable including currentmaturities
US$ denominated . . . . . . 653.9 1,280.4 2,105.2 627.4 627.4 562.7 726.0 5,929.1Bonds payable including current
maturitiesUS$ denominated . . . . . . 650.0 — — — — — 5,894.2 5,894.2
Other non-current liabilitiesUS$ denominated . . . . . . 8.7 79.1 — — — — — 79.1
Total Liabilities . . . . . . . . . . . . 1,615.0 4,101.8 2,105.2 627.4 627.4 562.7 6,620.2 14,644.7
Net Cash Flows . . . . . . . . . . . . . (1,450.7) (2,629.2) (2,088.0) (627.4) (627.4) (562.7) (6,620.2) (13,154.9)
(1) Cash and cash equivalents consist of cash on hand, cash in banks and time deposits.
136

Equity Price Risk
Our long-term investments consist primarily of minority investments in the equity of private Indonesiancompanies and equity of foreign companies. With respect to the Indonesian companies in which we haveinvestments, the financial performance of such companies may be adversely affected by economic conditions inIndonesia.
Foreign Currency Swap Contracts
As of December 31, 2011, we maintained foreign currency swap contracts that we entered into between2005 and 2008. From 2008 to 2009, we settled the remainder of our structured currency forward contracts withthree separate international financial institutions. As of December 31, 2011, we had hedging facilities amountingto US$100.5 million, representing 7.7% of our U.S. dollar-denominated bonds and loans as of December 31,2011.
As of December 31, 2011, we had outstanding foreign currency contracts under which we agreed to payIndonesian rupiah in exchange for the counterparty’s obligation to pay U.S. dollars, based upon agreed spot rates.In the event that the Indonesian rupiah appreciates against the U.S. dollar, we would recognize losses on suchtransactions, which could have a material and adverse effect on our financial condition.
Interest Rate Swap Contracts
As of December 31, 2011, we maintained interest rate swap contracts that we entered into between 2008 to2009 with respect to an aggregate amount of US$478.3 million under which we agreed to make fixed interest ratepayments in exchange for a six-month U.S. dollar LIBOR-linked floating rate plus either 0.35%, 1.45% or1.85% per year in order to hedge the interest rate risks on our HSBC Sinosure and HSBC Commercial satellitefinancing agreements and our ING/DBS Syndicated Loan, respectively.
Item 12: DESCRIPTION OF SECURITIES OTHER THAN EQUITY SECURITIES
Fees and Charges Our American Depositary Shares (ADS) Holders May Have to Pay
The Bank of New York Mellon, the depositary of our ADS program, charges the following to any partydepositing or withdrawing ordinary shares or any party surrendering ADRs or to whom ADRs are issued,whichever applicable, pursuant to the deposit agreement with the depositary: (1) taxes and other governmentalcharges, (2) registration fees as may from time to time be in effect for the registration of transfers of shares,(3) cable, telex and facsimile transmission expenses as are expressly provided in the deposit agreement to be atthe expense of persons depositing shares or owners, (4) expenses incurred by the depositary in the conversion offoreign currency pursuant to the deposit agreement, (5) a fee not in excess of $5.00 per 100 ADSs (or portionthereof) for the execution and delivery of ADSs and the surrender of ADSs and, (6) a fee for the distribution ofproceeds of sales of securities or rights pursuant to the deposit agreement, respectively, in an amount equal to thefee for the issuance of ADSs referred to above which would have been charged as a result of the deposit byowners of shares received in exercise of rights distributed to them pursuant to the deposit agreement,respectively, but which securities or rights are instead sold by the depositary and the net proceeds distributed.Under the deposit agreement, the depositary collects such fees by deducting those fees from the amountsdistributed or by selling a portion of distributable property to pay the fees.
Fees to be made by the Depositary to Us
The depositary has agreed to reimburse certain of our expenses related to our ADS program and incurred byus in connection with the program. The depositary has reimbursed to us, or paid amounts on our behalf to thirdparties, or waived its fees and expenses, in the total amount of US$120,131.44 for the year ended December 31,2011.
137
The table below sets forth the types of expenses that the depositary has agreed to reimburse, and theinvoices relating to the year ended December 31, 2011 that were reimbursed:
Type of Fees Amount
Printing costs . . . . . . . . . . . . . . . . . . . . . . . . . . . . . . . . . . . . . . . $—New York Stock Exchange Listing Fee . . . . . . . . . . . . . . . . . . . $—Costs related to ADS program . . . . . . . . . . . . . . . . . . . . . . . . . . $—Total . . . . . . . . . . . . . . . . . . . . . . . . . . . . . . . . . . . . . . . . . . . . . . $—
The depositary has also agreed to waive fees for standard costs associated with the administration of theADS program and has paid certain expenses directly to third parties on our behalf. The table below sets forththose expenses that the depositary has waived or paid directly to third parties relating to the year endedDecember 31, 2011:
Type of Fees Amount
Mailing, printing and service fees and expenses . . . . . . . . $ —Meeting-related expenses . . . . . . . . . . . . . . . . . . . . . . . . . $ 5,059.14Fees and expenses related to the administration of the
ADS program . . . . . . . . . . . . . . . . . . . . . . . . . . . . . . . . $115,072.30Total . . . . . . . . . . . . . . . . . . . . . . . . . . . . . . . . . . . . . . . . . $120,131.44
138
PART II
Item 13: DEFAULTS, DIVIDEND ARREARAGES AND DELINQUENCIES
Following the Asian financial crisis and the related devaluation of the Indonesian rupiah against the U.S.dollar in late 1997, Satelindo defaulted on its debt obligations in 1998. Satelindo restructured its debt obligationsin 2000. Immediately prior to the restructuring, Satelindo had a total principal amount of indebtedness ofUS$530.5 million, of which US$519.1 million was restructured. As of December 31, 2011, neither we nor oursubsidiaries had a material default relating to our outstanding indebtedness.
Item 14: MATERIAL MODIFICATIONS TO THE RIGHTS OF SECURITY HOLDERS AND USE OFPROCEEDS
None.
Item 15: CONTROLS AND PROCEDURES
Disclosure Controls and Procedures
As of December 31, 2011, or the Evaluation Date, our management, including our President Director andFinance Director, carried out an evaluation of the effectiveness of our disclosure controls and procedures, asdefined in Rules 13a-15(e) and 15d-15(e) under the Exchange Act. Based on that evaluation, we concluded that,as of the Evaluation Date, our disclosure controls and procedures were effective.
Management’s Annual Report on Internal Control Over Financial Reporting
As required by section 404 of the Sarbanes-Oxley Act of 2002, our management is responsible forestablishing and maintaining adequate internal control over financial reporting, as defined in Rule 13a-15(f)under the Exchange Act. Our system of internal control over financial reporting was designed to providereasonable assurance to our management and Audit Committee of the reliability of our financial reporting and thepreparation of published financial statements in accordance with generally accepted accounting principles. OurBoard of Directors conducted an evaluation of the effectiveness of our internal control over financial reporting asof December 31, 2011 based on the framework in Internal Control—Integrated Framework, which is issued bythe Committee of Sponsoring Organizations of the Treadway Commission, or COSO. Internal control overfinancial reporting includes those policies and procedures that (1) pertain to the maintenance of records that, inreasonable detail, accurately and fairly reflect the transactions and dispositions of the assets of the company;(2) provide reasonable assurance that transactions are recorded as necessary to permit the preparation of financialstatements in accordance with generally accepted accounting principles and that receipts and expenditures of thecompany are being made only in accordance with authorizations of our Board of Directors; and (3) providereasonable assurance regarding prevention or timely detection of unauthorized acquisition, use or disposition ofthe company’s assets that could have a material effect on the financial statements. Based on this criteria, ourmanagement concluded that, as of December 31, 2011, our internal control over financial reporting was effective.
All internal control systems, no matter how well designed, have inherent limitations, including thepossibility of human error and the circumvention or overriding of the controls and procedures which may notprevent or detect misstatements. Also, projections of any evaluation of effectiveness to future periods are subjectto the risk that controls may become inadequate because of changes in conditions.
Purwantono, Suherman & Surja, a member firm of Ernst & Young Global Limited, the independentregistered public accounting firm, has audited our consolidated financial statements included in this annual reportand has issued an attestation report on internal control over financial reporting as of December 31, 2011. Thisattestation report is set forth on page 3 of our consolidated financial statements attached hereto.
139

Changes in Internal Control Over Financial Reporting
There were no changes in our internal control over financial reporting during the period covered by thisannual report that have materially affected, or are reasonably likely to materially affect, our internal control overfinancial reporting.
Item 16A: AUDIT COMMITTEE FINANCIAL EXPERT
The Board of Commissioners has determined that each of George Thia Peng Heok and Kanaka Puradiredjaconstitute an “audit committee financial expert,” as defined in Item 16A of Form 20-F, and that such person isalso “independent,” as defined in Rule 10A-3 under the Exchange Act. For more information about George ThiaPeng Heok, see “Item 6. Directors, Senior Management and Employees—Directors and Senior Management—Board of Commissioners.”
Item 16B: CODE OF ETHICS
We have adopted a Code of Ethics that applies to all employees, including our Board of Directors. We haveposted this Code of Ethics on our website at www.indosat.com, where it is publicly available. A copy of ourCode of Ethics was filed as Exhibit 11.1 to our annual report on Form 20-F for the fiscal year endedDecember 31, 2009. We have issued a Guide to the implementation of PT Indosat Tbk’s Code of Ethics onNovember 20, 2010 as a reiteration of the Board of Directors Decree No.002/DIREKSI/2007 on the Code ofEthics.
Item 16C: PRINCIPAL ACCOUNTANT FEES AND SERVICES
The following table contains a summary of the fees paid to Purwantono, Sarwoko & Sandjaja, theIndonesian member firm of Ernst & Young Global, our independent external auditors for the year endedDecember 31, 2009 and the fees paid to Purwantono, Suherman & Surja, the Indonesian member firm of Ernst &Young Global, our independent external auditors for the years ended December 31, 2010 and 2011:
2009 2010 2011
(in US$)
Audit fees(1) . . . . . . . . . . . . . . . . . . . . . . . . . . . . . . . . . . . . . . . . . . . . . . . . . . . 2,330,298 2,287,934 857,724Audit-related fees(2) . . . . . . . . . . . . . . . . . . . . . . . . . . . . . . . . . . . . . . . . . . . . 1,279,708 1,543,584 448,848Tax fees(3) . . . . . . . . . . . . . . . . . . . . . . . . . . . . . . . . . . . . . . . . . . . . . . . . . . . . — — —All other fees(4) . . . . . . . . . . . . . . . . . . . . . . . . . . . . . . . . . . . . . . . . . . . . . . . . — — —
Total Fees . . . . . . . . . . . . . . . . . . . . . . . . . . . . . . . . . . . . . . . . . . . . . . . . . . . . 3,610,006 3,831,518 1,306,572
(1) Audit fees represent fees for professional services provided for the financial audit of our financialstatements and of our subsidiaries, PT Indosat Mega Media, PT Aplikanusa Lintasarta, PT Starone MitraTelekomunikasi and PT Artajasa Pembayaran Elektronis and our internal control audit and attestationservices in compliance with Section 404 of the Sarbanes-Oxley Act of 2002.
(2) Audit-related fees in 2009, 2010 and 2011 primarily consist of fees for performing limited reviews of ourinterim financial information including those of our subsidiaries and for performing services in connectionwith our bond issuances in 2009 and 2010.
(3) Tax fees represent fees for professional services related to tax compliance and tax planning / advisoryconsultation.
(4) All other fees represent professional services provided for services not directly supporting financialstatement audits.
These professional services are covered within the scope of audit services as defined by the Commission’sregulations.
140

In June 2004, the Audit Committee adopted a policy pursuant to which all audit and non-audit services mustbe pre-approved by the Audit Committee. Under no circumstances may our principal external auditors provideservices that are prohibited by the Sarbanes-Oxley Act of 2002 or rules issued thereunder. Non-prohibited audit-related services may be provided to us, subject to such pre-approval process and prohibitions. The pre-approvalpolicy relates to all services provided by our principal external auditor and does not include any pre-set fee limitsthat do not require pre-approval or any de minimis exception.
Item 16D: EXEMPTIONS FROM THE LISTING STANDARDS FOR AUDIT COMMITTEES
In accordance with Indonesian law, we have a two-tier board structure, consisting of a Board ofCommissioners and a Board of Directors. The executive management functions are carried out by our Board ofDirectors, while our Board of Commissioners is principally responsible for supervising and advising our Boardof Directors in the operation and management of the Company.
Under Indonesia Stock Exchange rules, our Audit Committee must consist of at least three members, one ofwhom must be an independent commissioner and concurrently the chairman of the Audit Committee, while theother two members must be external independent parties of whom at least one such party shall have accountingand/or finance expertise. Our Audit Committee is composed of five members and is chaired by one of ourIndependent Commissioners. Members of our Audit Committee are appointed and dismissed by our Board ofCommissioners.
Listing rules adopted pursuant to Rule 10A-3 under the Exchange Act require a foreign private issuer withsecurities listed on the NYSE to have an audit committee comprised of independent directors. The rules becameeffective on July 31, 2005. Under Rule 10A-3(c)(3), foreign private issuers are exempt from such independencerequirements if (i) the home country government or stock exchange requires the company to have an auditcommittee; (ii) the audit committee is separate from the board of directors or has members from both inside andoutside the board of directors; (iii) the audit committee members are not elected by the management and noexecutive officer of the company is a member of the audit committee; (iv) the home country government or stockexchange has requirements for an audit committee independent from the management of the company; and(v) the audit committee is responsible for the appointment, retention and oversight of the work of externalauditors. We rely on the general exemption under Rule 10A-3(c)(3) of the Exchange Act with respect to thecomposition of our Audit Committee as set forth in our Section 303A.11 website disclosure, which is madepublicly available on our website, www.indosat.com.
We believe our reliance on the exemption would not materially or adversely affect the ability of our AuditCommittee to act independently. We also believe the intent of such provisions are meant to ensure that the AuditCommittee is independent from influence by management and would provide a forum separate from managementin which auditors and other interested parties can candidly discuss concerns. The Indonesia Stock Exchange rulesrequire that each member of the Audit Committee be independent. The rules also require that at least two of themembers of the Audit Committee be external independent members, which means that they must be independentof not only the Board of Directors but also the Board of Commissioners and us as a whole. Accordingly, webelieve the standard established by the Indonesia Stock Exchange rules are at least equally effective in ensuringthe ability of our Audit Committee to act independently.
Item 16E: PURCHASES OF EQUITY SECURITIES BY THE ISSUER AND AFFILIATEDPURCHASERS
Not applicable.
Item 16F: CHANGE IN REGISTRANT’S CERTIFYING ACCOUNTANT
There were no changes in or disagreements with our accountants on any matter of accounting principle,practice or financial disclosure during the last two fiscal years.
141
Item 16G: CORPORATE GOVERNANCE
We are incorporated under the laws of the Republic of Indonesia and the principal trading market for ourordinary shares is the IDX. Our ordinary shares are registered with the U.S. Securities and ExchangeCommission and are listed on the NYSE. As such, we are subject to certain corporate governance requirements.
Our home country requirements for corporate governance are embodied primarily in Law No. 40 of 2007 onLimited Liability Companies, Law No. 8 of 1995 on Capital Markets, the Regulations of the Indonesian CapitalMarket and Financial Institution Supervisory Board, or the BAPEPAM-LK Regulations, and the rules issued bythe Indonesian stock exchanges, namely the IDX. In addition to these statutory requirements, our Articles ofAssociation incorporate provisions directing certain corporate governance practices.
However, many of the corporate governance rules contained in the NYSE Listed Company Manual, or theNYSE listing standards, are not required for “foreign private issuers” and we are permitted to follow our homecountry corporate governance practices in lieu of most corporate governance standards contained in the NYSElisting standards. Although we have complied voluntarily with most of the corporate governance rules containedin the NYSE listing standards, there are certain important differences between our corporate governancestandards and those standards applicable to U.S. companies listed on the NYSE which are described below.
Audit Committee
The NYSE listing standards require NYSE-listed companies to maintain an audit committee comprised of atleast three members satisfying the requirements for independence set forth in Section 303A.02. Pursuant toBAPEPAM-LK Regulations, public companies in Indonesia must maintain audit committees comprised of atleast one independent commissioner and two members from outside the company. Our Audit Committee consistsof five members, three of whom are Independent Commissioners and two of whom are independent outsiders, asrequired by BAPEPAM-LK Regulations.
In addition, our Audit Committee’s written charter does not require our Audit Committee to review earningsguidance prior to filing to ensure compliance with the prevailing capital market laws and regulations as requiredunder Section 303A.07(c)(iii)(C), although the written charter does require review of press releases containingfinancial information. Unlike the requirements set forth in the NYSE listing standards, our Audit Committee doesnot have direct responsibility for the appointment, retention and compensation of our external auditor. Our AuditCommittee can only recommend the appointment of the external auditor to the Board of Commissioners, and theBoard of Commissioner’s decision is subject to shareholder approval as required by Indonesian law. A copy ofour Audit Committee’s written charter can be found on our website at www.indosat.com and is attached asExhibit 15.16 to our Form 20-F filed on June 1, 2010.
Composition of Board of Directors; Nominating Committee
The NYSE listing standards require that the board of directors of an NYSE-listed company consist of amajority of independent directors and that a nominating committee be established. We have a dual boardstructure, with a separate Board of Directors and Board of Commissioners, separating the powers of management(exercised by the Board of Directors) from those of supervision (exercised by the Board of Commissioners). Assuch, when the NYSE listing standards apply corporate governance principles to the directors of a NYSE-listedcompany, we evaluate our practices with reference to our Commissioners. As required by BAPEPAM-LKRegulations and IDX rules, our ten-member Board of Commissioners maintains a minimum of at least threeindependent members. Further, we do not have a nominating committee. At meetings of our shareholders, ourshareholders nominate and elect persons to our Board of Commissioners.
Pursuant to the NYSE listing standards, directors of NYSE-listed companies must meet at regularly-scheduled executive sessions without management. Neither the BAPEPAM-LK Regulations nor IDX rulesrequire us to hold such executive sessions where the Board of Commissioners meets without any Directors
142

present. In the past, our Board of Commissioners, which is entirely composed of non-management persons, hasmet in executive session periodically, in addition to the customary presentation of information by our Board ofDirectors to the Board of Commissioners. In early 2005, we instituted procedures by which our Board ofCommissioners started meeting in executive sessions at the end of each regularly-scheduled meeting, whichcurrently occur at least on a quarterly basis.
Compensation Committee
The NYSE listing standards require NYSE-listed companies to maintain a compensation committeecomposed entirely of independent directors with a written charter addressing the committee’s performance andresponsibilities as well as requiring an annual performance evaluation. Our Remuneration Committee currentlyhas three members from our Board of Commissioners and has the responsibilities contained in the NYSE listingstandards. However, only two of the three committee members are independent and its written charter does notprovide for an annual performance evaluation of the Remuneration Committee. A copy of our RemunerationCommittee’s written charter can be found on our website at www.indosat.com.
143

PART III
Item 17: FINANCIAL STATEMENTS
The financial statements listed in Item 19(a) of this annual report, together with the reports of ourindependent auditors thereon, are filed as part of this annual report.
Item 18: FINANCIAL STATEMENTS
Not applicable. See Item 17.
Item 19: EXHIBITS
(a) Index to Consolidated Financial Statements
Report of Independent Registered Public Accounting Firm . . . . . . . . . . . . . . . . . . . . . . . . . . F-2-F-3Consolidated Statements of Financial Position as of January 1, 2008 and December 31,2009, 2010 and 2011 . . . . . . . . . . . . . . . . . . . . . . . . . . . . . . . . . . . . . . . . . . . . . . . . . . . . . . . . F-5-F-7Consolidated Statements of Comprehensive Income for the Years Ended December 31,2009, 2010 and 2011 . . . . . . . . . . . . . . . . . . . . . . . . . . . . . . . . . . . . . . . . . . . . . . . . . . . . . . . . F-8-F-9Consolidated Statements of Changes in Stockholders’ Equity for the Years EndedDecember 31, 2009, 2010 and 2011 . . . . . . . . . . . . . . . . . . . . . . . . . . . . . . . . . . . . . . . . . . . . F-10-F-12Consolidated Statements of Cash Flows for the Years Ended December 31, 2009, 2010and 2011 . . . . . . . . . . . . . . . . . . . . . . . . . . . . . . . . . . . . . . . . . . . . . . . . . . . . . . . . . . . . . . . . . F-13-F-14Notes to Consolidated Financial Statements for the Years ended December 31, 2009, 2010and 2011 . . . . . . . . . . . . . . . . . . . . . . . . . . . . . . . . . . . . . . . . . . . . . . . . . . . . . . . . . . . . . . . . . F-15-F-111
(b) Index to Exhibits
1.1 Notarial Deed No. 118 Relating to the Amendment and Restatement of the Articles of Association, datedJune 11, 2009(2)
1.2 Notarial Deed No. 123, Relating to the Amendment of the Articles of Association, datedJanuary 28, 2010(2)
4.1 Form of Non-Compete Agreement(5)
4.2 Agreement for Network Interconnection for Indosat’s Fixed Local Telecommunication Network andTelkomsel’s Cellular Mobile Network, between Indosat and Telkomsel, dated July 30, 2007 and itsAmendments dated December 19, 2007(3), March 30, 2008(2), November 1, 2010(1), April 7, 2011 andJuly 19, 2011
4.3 Agreement for Network Interconnection for Cellular Mobile Network between Indosat and Telkomsel,between Indosat and Telkomsel, dated December 19, 2007 and its Amendments dated February 18,2008(2), September 7, 2010(1) and April 7, 2011
4.4 Agreement for Network Interconnection for Indosat’s Cellular Mobile Network and Telkom’s Fixed LocalTelecommunication Network, between Indosat and Telkom, dated December 18, 2007 and itsAmendments dated March 31, 2008(2), December 30, 2009(1), January 31, 2011(1), July 20, 2011 andDecember 20, 2011
4.5 Agreement for Network Interconnection for Fixed Telecommunication Network between Indosat andTelkom, dated December 18, 2007 and Amendments dated March 31, 2008(2), December 30, 2009(1),January 31, 2011(1), July 20, 2011 and December 20, 2011
4.6 Tower Lease Agreement between Indosat and PT Hutchison CP Telecommunications datedJanuary 29, 2010(1) and its Amendment dated August 18, 2011
144

4.7 Tower Lease Agreement between Indosat and PT Natrindo Telepon Seluler dated April 15, 2010(1)
4.8 Tower Lease Agreement between Indosat and PT XL Axiata dated May 24, 2010(1)
4.9 Tower Lease Agreement between Indosat and PT Berca Global Access dated June 3, 2010(1)
4.10 Tower Lease Agreement between Indosat and PT Daya Mitra Telekomunikasi dated February 4, 2011(1)
4.11 Memorandum of Agreement between Indosat and PT First Media Tbk dated February 10, 2011(1)
7.1 Operating and Financial Ratios
8.1 List of Our Subsidiaries
11.1 Code of Ethics, dated January 24, 2007(1)
12.1 Certification by the Chief Executive Officer in accordance with Section 302 of the Sarbanes-Oxley Actof 2002
12.2 Certification by the Chief Financial Officer in accordance with Section 302 of the Sarbanes-Oxley Actof 2002
13.1 Certification by the Chief Executive Officer Required by 18 U.S.C. §1350
13.2 Certification by the Chief Financial Officer Required by 18 U.S.C. §1350
15.1 Term Facility Agreement, dated May 12, 2006, among PT Indosat Tbk, as borrower, arranged by ABNAmro Bank N.V., Jakarta Branch, with Finnish Export Credit Ltd, as original lender, and ABN AmroBank N.V., Stockholm Branch, acting as facility agent in connection with a US$38,000,000 export creditfacility(6) and its Amendment on March 20, 2009(3)
15.2 Trustee Agreement for the Fifth Indosat Bonds, dated May 9, 2007(4) and its Amendment on May 4,2009(2)
15.3 Credit Agreement with Goldman Sachs International dated May 30, 2007(4)
15.4 Trustee Agreement for the Second Syari’ah Ijarah Bonds, dated May 9, 2007(4) and its Amendment onMay 4, 2009(2)
15.5 Credit Agreement with Bank Central Asia, dated August 28, 2007(4), its Amendment on October 30,2007(4) and on February 12, 2009(3)
15.6 Credit Agreement with Bank Mandiri, dated September 18, 2007(4) and its Amendment on March 23,2009(3)
15.7 Credit Agreement with Bank DBS Indonesia, dated November 1, 2007(4) and its Amendment onMarch 25, 2009(3)
15.8 Sinosure Term Facility Agreement with HSBC France, dated November 27, 2007(3) and its Amendmenton March 18, 2009(3)
15.9 COFACE Term Facility Agreement with HSBC France, dated November 27, 2007(3) and its Amendmenton March 18, 2009(3)
15.10 Commercial Facility Agreement with the Hongkong Shanghai Corporation Limited, Jakarta Branch,dated November 27, 2007(3) and its Amendment on March 18, 2009(3)
15.11 Trustee Agreement for the Sixth Indosat Bonds, dated March 17, 2008(4) and its Amendment on May 4,2009(2)
15.12 Trustee Agreement for the Third Syari’ah Ijarah Bonds, dated March 17, 2008(4) and its Amendment onMay 4, 2009(2)
15.13 Syndicated Loan Facility with ING/DBS, dated June 12, 2008(3) and its Amendment on February 24,2009(3)
15.14 Revised Audit Committee Charter, dated April 27, 2011(1)
15.15 Credit Agreement with Bank of Central Asia, dated September 17, 2008(3)
145

15.16 Deed of Amendment of Trustee Agreement for the Second Indosat Bonds, dated May 4, 2009(2)
15.17 Deed of Amendment of Trustee Agreement for the Third Indosat Bonds, dated May 4, 2009(2)
15.18 Deed of Amendment of Trustee Agreement for the Fourth Indosat Bonds, dated May 4, 2009(2)
15.19 Deed of Amendment of Trustee Agreement for the Syariah Ijarah Bonds, dated May 4, 2009(2)
15.20 Credit Agreement with Bank Central Asia, dated June 8, 2009(2)
15.21 Credit Agreement with Bank Mandiri, dated July 28, 2009(2)
15.22 EKN Facility Agreement with HSBC Hongkong and ABN Amro Bank Hongkong, dated August 18,2009(2)
15.23 Trustee Agreement for the Seventh Indosat Bonds, dated November 25, 2009(2)
15.24 Trustee Agreement for the Fourth Syari’ah Ijarah Bonds, dated November 25, 2009(2)
15.25 Indenture dated July 29, 2010 covering our Guaranteed Notes 2020(1)
15.26 Time Loan Revolving Credit Facility Agreement with Bank Central Asia, dated February 10, 2011(1) andits Amendment on December 1, 2011
15.27 Credit Agreement with Bank Mandiri, dated June 21, 2011 and its Amendment on December 5, 2011
15.28 Asset Purchase Agreement, dated February 7, 2012, by and among Indosat, PT Tower BersamaInfrastructure Tbk and PT Solusi Menara Indonesia*
* Portions of this exhibit have been redacted pursuant to a request for confidential treatment filed separatelywith the Secretary of the Securities and Exchange Commission pursuant to Rule 24b-2 under the SecuritiesExchange Act of 1934, as amended.
(1) Incorporated by reference to our annual report on Form 20-F for the fiscal year ended December 31, 2010(File No.001-13330) filed with the U.S. Securities and Exchange Commission on May 18, 2011.
(2) Incorporated by reference to our annual report on Form 20-F for the fiscal year ended December 31, 2009(File No.001-13330) filed with the U.S. Securities and Exchange Commission on June 1, 2010.
(3) Incorporated by reference to our annual report on Form 20-F for the fiscal year ended December 31, 2008(File No. 001-13330) filed with the U.S. Securities and Exchange Commission on April 15, 2009.
(4) Incorporated by reference to our annual report on Form 20-F for the fiscal year ended December 31, 2007(File No. 001-13330) filed with the U.S. Securities and Exchange Commission on May 5, 2008.
(5) Incorporated by reference to our annual report on Form 20-F for the fiscal year ended December 31, 2006(File No. 001-13330) filed with the U.S. Securities and Exchange Commission on May 10, 2007.
(6) Incorporated by reference to our annual report on Form 20-F for the fiscal year ended December 31, 2005(File No. 001-13330) filed with the U.S. Securities and Exchange Commission on June 28, 2006.
We have not included as exhibits certain instruments with respect to our long-term debt, the total amount ofdebt authorized under each of which does not exceed 10.0% of our total consolidated assets. We agree to furnisha copy of any such instrument to the Commission upon request.
146

SIGNATURE
The registrant hereby certifies that it meets all of the requirements for filing on Form 20-F and that it hasduly caused and authorized the undersigned to sign this annual report on its behalf.
Date: April 30, 2012
PT INDOSAT TBK
By: /s/ Harry Sasongko TirtotjondroName: Harry Sasongko TirtotjondroTitle: President Director and
Chief Executive Officer

[THIS PAGE INTENTIONALLY LEFT BLANK]

PT INDOSAT Tbk AND SUBSIDIARIES
CONSOLIDATED FINANCIAL STATEMENTSWITH REPORT OF INDEPENDENT
REGISTERED PUBLIC ACCOUNTING FIRMJANUARY 1, 2010 AND DECEMBER 31, 2010 AND 2011
AND YEARS ENDED DECEMBER 31, 2009, 2010 AND 2011
Table of Contents
Page
Report of Independent Registered Public Accounting Firm . . . . . . . . . . . . . . . . . . . . . . . . . . . . . . . . . . . . . . F-2
Consolidated Statements of Financial Position . . . . . . . . . . . . . . . . . . . . . . . . . . . . . . . . . . . . . . . . . . . . . . . . F-4
Consolidated Statements of Comprehensive Income . . . . . . . . . . . . . . . . . . . . . . . . . . . . . . . . . . . . . . . . . . . F-8
Consolidated Statements of Changes in Equity . . . . . . . . . . . . . . . . . . . . . . . . . . . . . . . . . . . . . . . . . . . . . . . . F-10
Consolidated Statements of Cash Flows . . . . . . . . . . . . . . . . . . . . . . . . . . . . . . . . . . . . . . . . . . . . . . . . . . . . . F-13
Notes to Consolidated Financial Statements . . . . . . . . . . . . . . . . . . . . . . . . . . . . . . . . . . . . . . . . . . . . . . . . . . F-15
***************************
F-1
Report of Independent Registered Public Accounting Firm
Report No. RPC-2404/PSS/2012
The Stockholders and Boards of Commissioners and DirectorsPT Indosat Tbk
We have audited the accompanying consolidated statements of financial position of PT Indosat Tbk (“theCompany”) and its subsidiaries as of January 1, 2010 and December 31, 2010 and 2011, and the relatedconsolidated statements of comprehensive income, changes in equity and cash flows for the years endedDecember 31, 2009, 2010 and 2011. These financial statements are the responsibility of the Company’smanagement. Our responsibility is to express an opinion on these financial statements based on our audits.
We conducted our audits in accordance with auditing standards established by the Public CompanyAccounting Oversight Board (United States). Those standards require that we plan and perform the audit toobtain reasonable assurance about whether the financial statements are free of material misstatement. An auditalso includes examining, on a test basis, evidence supporting the amounts and disclosures in the financialstatements, assessing the accounting principles used and significant estimates made by management, as well asevaluating the overall financial statement presentation. We believe that our audits provide a reasonable basis forour opinion.
In our opinion, the consolidated financial statements referred to above present fairly, in all material respects,the consolidated financial position of PT Indosat Tbk and its subsidiaries as of January 1, 2010 and December 31,2010 and 2011, and the consolidated results of their operations and their cash flows for the years endedDecember 31, 2009, 2010 and 2011 in conformity with International Financial Reporting Standards as issued bythe International Accounting Standards Board.
We also have audited, in accordance with the standards of the Public Company Accounting Oversight Board(United States), PT Indosat Tbk and its subsidiaries’ internal control over financial reporting as of December 31,2011, based on criteria established in Internal Control-Integrated Framework issued by the Committee ofSponsoring Organizations of the Treadway Commission and our report dated April 25, 2012 expressed anunqualified opinion thereon.
Purwantono, Suherman & Surja
Jakarta, Indonesia
April 25, 2012
F-2

Report of Independent Registered Public Accounting Firm
Report No. RPC-2405/PSS/2012
The Stockholders and Boards of Commissioners and DirectorsPT Indosat Tbk
We have audited PT Indosat Tbk (“the Company”) and its subsidiaries’ internal control over financialreporting as of December 31, 2011, based on criteria established in Internal Control-Integrated Framework issuedby the Committee of Sponsoring Organizations of the Treadway Commission (the COSO criteria). TheCompany’s management is responsible for maintaining effective internal control over financial reporting, and forits assessment of the effectiveness of internal control over financial reporting included in the accompanyingManagement’s Annual Report on Internal Control over Financial Reporting. Our responsibility is to express anopinion on PT Indosat Tbk and its subsidiaries’ internal control over financial reporting based on our audit.
We conducted our audit in accordance with the standards of the Public Company Accounting OversightBoard (United States). Those standards require that we plan and perform the audit to obtain reasonable assuranceabout whether effective internal control over financial reporting was maintained in all material respects. Ouraudit included obtaining an understanding of internal control over financial reporting, assessing the risk that amaterial weakness exists, testing and evaluating the design and operating effectiveness of internal control basedon the assessed risk, and performing such other procedures as we considered necessary in the circumstances. Webelieve that our audit provides a reasonable basis for our opinion.
A company’s internal control over financial reporting is a process designed to provide reasonable assuranceregarding the reliability of financial reporting and the preparation of financial statements for external purposes inaccordance with generally accepted accounting principles. A company’s internal control over financial reportingincludes those policies and procedures that (1) pertain to the maintenance of records that, in reasonable detail,accurately and fairly reflect the transactions and dispositions of the assets of the company, (2) provide reasonableassurance that transactions are recorded as necessary to permit preparation of financial statements in accordancewith generally accepted accounting principles and that receipts and expenditures of the company are being madeonly in accordance with authorizations of management and directors of the company, and (3) provide reasonableassurance regarding prevention or timely detection of unauthorized acquisition, use, or disposition of thecompany’s assets that could have a material effect on the financial statements.
Because of its inherent limitations, internal control over financial reporting may not prevent or detectmisstatements. Also, projections of any evaluation of effectiveness to future periods are subject to the risk thatcontrols may become inadequate because of changes in conditions or that the degree of compliance with thepolicies or procedures may deteriorate.
In our opinion, PT Indosat Tbk and its subsidiaries maintained, in all material respects, effective internalcontrol over financial reporting as of December 31, 2011, based on the COSO criteria.
We also have audited, in accordance with auditing standards of the Public Company Accounting OversightBoard (United States), the consolidated statements of financial position of PT Indosat Tbk and its subsidiaries asof January 1, 2010 and December 31, 2010 and 2011, and the related consolidated statements of comprehensiveincome, changes in equity and cash flows for the years ended December 31, 2009, 2010 and 2011, and our reportdated April 25, 2012 expressed an unqualified opinion thereon.
Purwantono, Suherman & Surja
Jakarta, Indonesia
April 25, 2012
F-3

PT INDOSAT Tbk AND SUBSIDIARIES
CONSOLIDATED STATEMENTS OF FINANCIAL POSITIONJanuary 1, 2010 and December 31, 2010 and 2011
(Expressed in millions of rupiah, except share data)
Notes January 1, 2010
December 31,
2010 2011
Rp Rp RpASSETSCURRENT ASSETSCash and cash equivalents . . . . . . . . . . . . . . . . . . . . . . . . . . . . . . . . . 2f8,4,20
29,35 2,835,999 2,075,270 2,224,206Accounts receivable . . . . . . . . . . . . . . . . . . . . . . . . . . . . . . . . . . . . . . 2f8,3b,5
Trade—net of allowance for impairment of Rp461,810 as ofJanuary 1, 2010, Rp496,110 as of December 31, 2010 andRp536,651 as of December 31, 2011 . . . . . . . . . . . . . . . . . . . 20,29,35 1,385,125 1,548,426 1,441,069
Others—net of allowance for impairment of Rp16,544 as ofJanuary 1, 2010, Rp15,281 as of December 31, 2010 andRp16,702 as of December 31, 2011 . . . . . . . . . . . . . . . . . . . . 564,859 10,031 5,660
Inventories—net of allowance for obsolescence of Rp10,769 as ofJanuary 1, 2010, Rp13,961 as of December 31, 2010 andRp18,401 as of December 31, 2011 . . . . . . . . . . . . . . . . . . . . . . . . 2f20 112,260 105,885 75,890
Derivative assets . . . . . . . . . . . . . . . . . . . . . . . . . . . . . . . . . . . . . . . . . 2f8,2f1520,32,35 224,004 69,334 159,349
Advances . . . . . . . . . . . . . . . . . . . . . . . . . . . . . . . . . . . . . . . . . . . . . . 33h 35,173 67,273 48,865Taxes receivable . . . . . . . . . . . . . . . . . . . . . . . . . . . . . . . . . . . . . . . . . 6,16 396,581 479,786 514,934Prepaid expenses . . . . . . . . . . . . . . . . . . . . . . . . . . . . . . . . . . . . . . . . . 2f19,2f21,
28,29 1,125,091 1,527,254 1,705,652Other current assets . . . . . . . . . . . . . . . . . . . . . . . . . . . . . . . . . . . . . . 424,623 222,476 379,024Other current financial assets—net . . . . . . . . . . . . . . . . . . . . . . . . . . . 2d,2f8,7,20,29,
33g,35 35,173 53,119 29,833
Total Current Assets . . . . . . . . . . . . . . . . . . . . . . . . . . . . . . . . . . . . . . 7,138,888 6,158,854 6,584,482
The accompanying notes form an integral part of these consolidated financial statements.
F-4
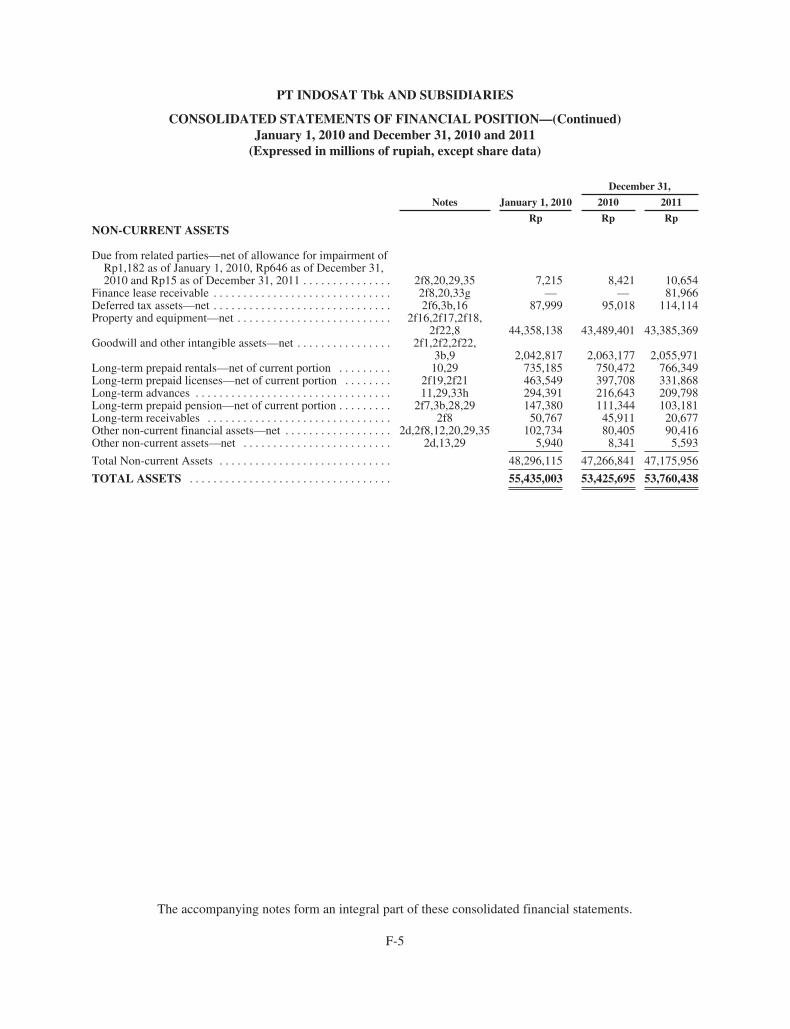
PT INDOSAT Tbk AND SUBSIDIARIES
CONSOLIDATED STATEMENTS OF FINANCIAL POSITION—(Continued)January 1, 2010 and December 31, 2010 and 2011
(Expressed in millions of rupiah, except share data)
Notes January 1, 2010
December 31,
2010 2011
Rp Rp RpNON-CURRENT ASSETS
Due from related parties—net of allowance for impairment ofRp1,182 as of January 1, 2010, Rp646 as of December 31,2010 and Rp15 as of December 31, 2011 . . . . . . . . . . . . . . . 2f8,20,29,35 7,215 8,421 10,654
Finance lease receivable . . . . . . . . . . . . . . . . . . . . . . . . . . . . . . 2f8,20,33g — — 81,966Deferred tax assets—net . . . . . . . . . . . . . . . . . . . . . . . . . . . . . . 2f6,3b,16 87,999 95,018 114,114Property and equipment—net . . . . . . . . . . . . . . . . . . . . . . . . . . 2f16,2f17,2f18,
2f22,8 44,358,138 43,489,401 43,385,369Goodwill and other intangible assets—net . . . . . . . . . . . . . . . . 2f1,2f2,2f22,
3b,9 2,042,817 2,063,177 2,055,971Long-term prepaid rentals—net of current portion . . . . . . . . . 10,29 735,185 750,472 766,349Long-term prepaid licenses—net of current portion . . . . . . . . 2f19,2f21 463,549 397,708 331,868Long-term advances . . . . . . . . . . . . . . . . . . . . . . . . . . . . . . . . . 11,29,33h 294,391 216,643 209,798Long-term prepaid pension—net of current portion . . . . . . . . . 2f7,3b,28,29 147,380 111,344 103,181Long-term receivables . . . . . . . . . . . . . . . . . . . . . . . . . . . . . . . 2f8 50,767 45,911 20,677Other non-current financial assets—net . . . . . . . . . . . . . . . . . . 2d,2f8,12,20,29,35 102,734 80,405 90,416Other non-current assets—net . . . . . . . . . . . . . . . . . . . . . . . . . 2d,13,29 5,940 8,341 5,593
Total Non-current Assets . . . . . . . . . . . . . . . . . . . . . . . . . . . . . 48,296,115 47,266,841 47,175,956
TOTAL ASSETS . . . . . . . . . . . . . . . . . . . . . . . . . . . . . . . . . . 55,435,003 53,425,695 53,760,438
The accompanying notes form an integral part of these consolidated financial statements.
F-5
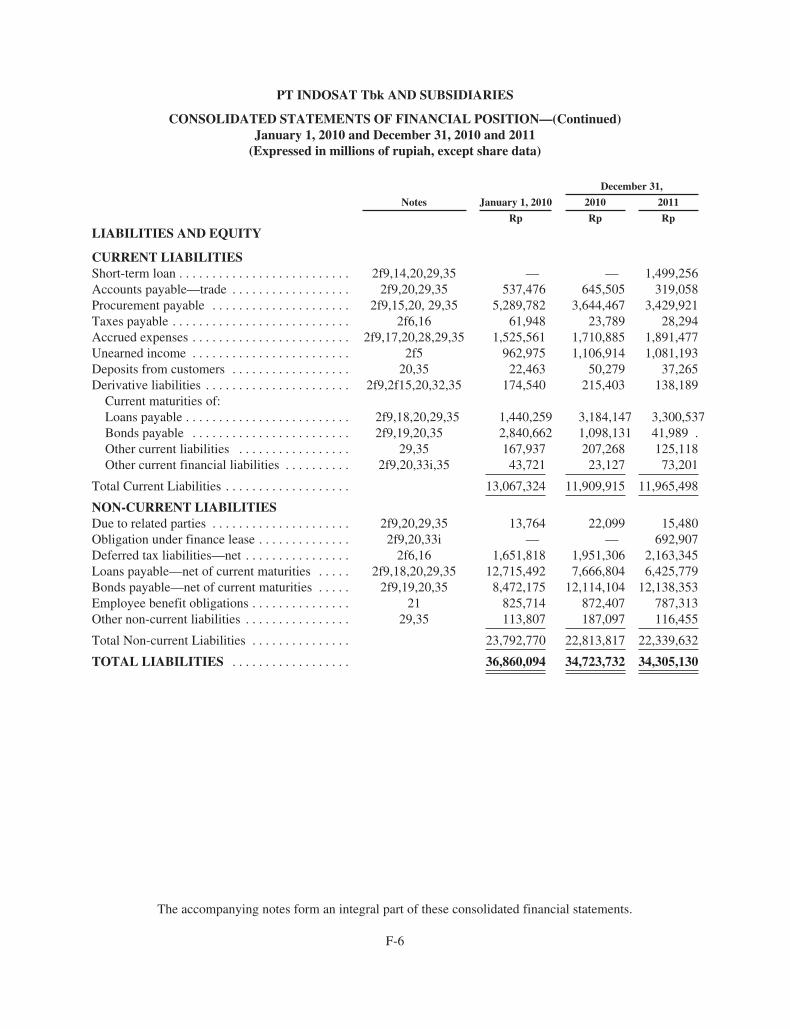
PT INDOSAT Tbk AND SUBSIDIARIES
CONSOLIDATED STATEMENTS OF FINANCIAL POSITION—(Continued)January 1, 2010 and December 31, 2010 and 2011
(Expressed in millions of rupiah, except share data)
Notes January 1, 2010
December 31,
2010 2011
Rp Rp Rp
LIABILITIES AND EQUITY
CURRENT LIABILITIESShort-term loan . . . . . . . . . . . . . . . . . . . . . . . . . . 2f9,14,20,29,35 — — 1,499,256Accounts payable—trade . . . . . . . . . . . . . . . . . . 2f9,20,29,35 537,476 645,505 319,058Procurement payable . . . . . . . . . . . . . . . . . . . . . 2f9,15,20, 29,35 5,289,782 3,644,467 3,429,921Taxes payable . . . . . . . . . . . . . . . . . . . . . . . . . . . 2f6,16 61,948 23,789 28,294Accrued expenses . . . . . . . . . . . . . . . . . . . . . . . . 2f9,17,20,28,29,35 1,525,561 1,710,885 1,891,477Unearned income . . . . . . . . . . . . . . . . . . . . . . . . 2f5 962,975 1,106,914 1,081,193Deposits from customers . . . . . . . . . . . . . . . . . . 20,35 22,463 50,279 37,265Derivative liabilities . . . . . . . . . . . . . . . . . . . . . . 2f9,2f15,20,32,35 174,540 215,403 138,189
Current maturities of:Loans payable . . . . . . . . . . . . . . . . . . . . . . . . . 2f9,18,20,29,35 1,440,259 3,184,147 3,300,537Bonds payable . . . . . . . . . . . . . . . . . . . . . . . . 2f9,19,20,35 2,840,662 1,098,131 41,989 .Other current liabilities . . . . . . . . . . . . . . . . . 29,35 167,937 207,268 125,118Other current financial liabilities . . . . . . . . . . 2f9,20,33i,35 43,721 23,127 73,201
Total Current Liabilities . . . . . . . . . . . . . . . . . . . 13,067,324 11,909,915 11,965,498
NON-CURRENT LIABILITIESDue to related parties . . . . . . . . . . . . . . . . . . . . . 2f9,20,29,35 13,764 22,099 15,480Obligation under finance lease . . . . . . . . . . . . . . 2f9,20,33i — — 692,907Deferred tax liabilities—net . . . . . . . . . . . . . . . . 2f6,16 1,651,818 1,951,306 2,163,345Loans payable—net of current maturities . . . . . 2f9,18,20,29,35 12,715,492 7,666,804 6,425,779Bonds payable—net of current maturities . . . . . 2f9,19,20,35 8,472,175 12,114,104 12,138,353Employee benefit obligations . . . . . . . . . . . . . . . 21 825,714 872,407 787,313Other non-current liabilities . . . . . . . . . . . . . . . . 29,35 113,807 187,097 116,455
Total Non-current Liabilities . . . . . . . . . . . . . . . 23,792,770 22,813,817 22,339,632
TOTAL LIABILITIES . . . . . . . . . . . . . . . . . . 36,860,094 34,723,732 34,305,130
The accompanying notes form an integral part of these consolidated financial statements.
F-6

PT INDOSAT Tbk AND SUBSIDIARIES
CONSOLIDATED STATEMENTS OF FINANCIAL POSITION—(Continued)January 1, 2010 and December 31, 2010 and 2011
(Expressed in millions of rupiah, except share data)
Notes January 1, 2010
December 31,
2010 2011
Rp Rp Rp
EQUITY
EQUITY ATTRIBUTABLE TO OWNERS OF THECOMPANY
Capital stock—Rp100 par value per A share and B shareAuthorized—1 A share and 19,999,999,999 B sharesIssued and fully paid—1 A share and 5,433,933,499B shares . . . . . . . . . . . . . . . . . . . . . . . . . . . . . . . . . . . . . 22 543,393 543,393 543,393
Premium on capital stock . . . . . . . . . . . . . . . . . . . . . . . . . 22 1,546,587 1,546,587 1,546,587Retained earnings
Appropriated . . . . . . . . . . . . . . . . . . . . . . . . . . . . . . . 119,464 134,446 134,446Unappropriated . . . . . . . . . . . . . . . . . . . . . . . . . . . . . 15,631,240 15,691,773 16,377,262
Other components of equity . . . . . . . . . . . . . . . . . . . . . . . 2b,2f3,2f4 406,473 401,377 401,778
Total Equity Attributable to Owners of theCompany . . . . . . . . . . . . . . . . . . . . . . . . . . . . . . . . . . . 18,247,157 18,317,576 19,003,466
Non-controlling Interests . . . . . . . . . . . . . . . . . . . . . . . . . 327,752 384,387 451,842
TOTAL EQUITY . . . . . . . . . . . . . . . . . . . . . . . . . . . . . . 18,574,909 18,701,963 19,455,308
TOTAL LIABILITIES AND EQUITY . . . . . . . . . . . . 55,435,003 53,425,695 53,760,438
The accompanying notes form an integral part of these consolidated financial statements.
F-7
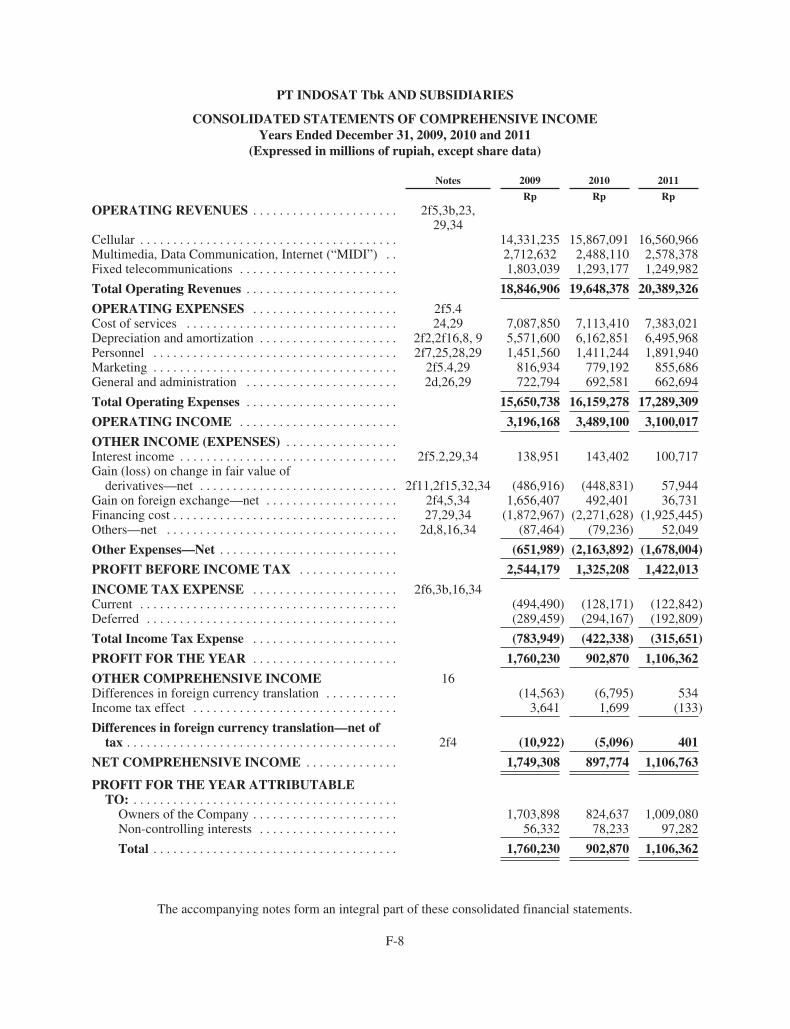
PT INDOSAT Tbk AND SUBSIDIARIES
CONSOLIDATED STATEMENTS OF COMPREHENSIVE INCOMEYears Ended December 31, 2009, 2010 and 2011
(Expressed in millions of rupiah, except share data)
Notes 2009 2010 2011
Rp Rp RpOPERATING REVENUES . . . . . . . . . . . . . . . . . . . . . . 2f5,3b,23,
29,34Cellular . . . . . . . . . . . . . . . . . . . . . . . . . . . . . . . . . . . . . . . 14,331,235 15,867,091 16,560,966Multimedia, Data Communication, Internet (“MIDI”) . . 2,712,632 2,488,110 2,578,378Fixed telecommunications . . . . . . . . . . . . . . . . . . . . . . . . 1,803,039 1,293,177 1,249,982
Total Operating Revenues . . . . . . . . . . . . . . . . . . . . . . . 18,846,906 19,648,378 20,389,326
OPERATING EXPENSES . . . . . . . . . . . . . . . . . . . . . . 2f5.4Cost of services . . . . . . . . . . . . . . . . . . . . . . . . . . . . . . . . 24,29 7,087,850 7,113,410 7,383,021Depreciation and amortization . . . . . . . . . . . . . . . . . . . . . 2f2,2f16,8, 9 5,571,600 6,162,851 6,495,968Personnel . . . . . . . . . . . . . . . . . . . . . . . . . . . . . . . . . . . . . 2f7,25,28,29 1,451,560 1,411,244 1,891,940Marketing . . . . . . . . . . . . . . . . . . . . . . . . . . . . . . . . . . . . . 2f5.4,29 816,934 779,192 855,686General and administration . . . . . . . . . . . . . . . . . . . . . . . 2d,26,29 722,794 692,581 662,694
Total Operating Expenses . . . . . . . . . . . . . . . . . . . . . . . 15,650,738 16,159,278 17,289,309
OPERATING INCOME . . . . . . . . . . . . . . . . . . . . . . . . 3,196,168 3,489,100 3,100,017
OTHER INCOME (EXPENSES) . . . . . . . . . . . . . . . . .Interest income . . . . . . . . . . . . . . . . . . . . . . . . . . . . . . . . . 2f5.2,29,34 138,951 143,402 100,717Gain (loss) on change in fair value of
derivatives—net . . . . . . . . . . . . . . . . . . . . . . . . . . . . . . 2f11,2f15,32,34 (486,916) (448,831) 57,944Gain on foreign exchange—net . . . . . . . . . . . . . . . . . . . . 2f4,5,34 1,656,407 492,401 36,731Financing cost . . . . . . . . . . . . . . . . . . . . . . . . . . . . . . . . . . 27,29,34 (1,872,967) (2,271,628) (1,925,445)Others—net . . . . . . . . . . . . . . . . . . . . . . . . . . . . . . . . . . . 2d,8,16,34 (87,464) (79,236) 52,049
Other Expenses—Net . . . . . . . . . . . . . . . . . . . . . . . . . . . (651,989) (2,163,892) (1,678,004)
PROFIT BEFORE INCOME TAX . . . . . . . . . . . . . . . 2,544,179 1,325,208 1,422,013
INCOME TAX EXPENSE . . . . . . . . . . . . . . . . . . . . . . 2f6,3b,16,34Current . . . . . . . . . . . . . . . . . . . . . . . . . . . . . . . . . . . . . . . (494,490) (128,171) (122,842)Deferred . . . . . . . . . . . . . . . . . . . . . . . . . . . . . . . . . . . . . . (289,459) (294,167) (192,809)
Total Income Tax Expense . . . . . . . . . . . . . . . . . . . . . . (783,949) (422,338) (315,651)
PROFIT FOR THE YEAR . . . . . . . . . . . . . . . . . . . . . . 1,760,230 902,870 1,106,362
OTHER COMPREHENSIVE INCOME 16Differences in foreign currency translation . . . . . . . . . . . (14,563) (6,795) 534Income tax effect . . . . . . . . . . . . . . . . . . . . . . . . . . . . . . . 3,641 1,699 (133)
Differences in foreign currency translation—net oftax . . . . . . . . . . . . . . . . . . . . . . . . . . . . . . . . . . . . . . . . . 2f4 (10,922) (5,096) 401
NET COMPREHENSIVE INCOME . . . . . . . . . . . . . . 1,749,308 897,774 1,106,763
PROFIT FOR THE YEAR ATTRIBUTABLETO: . . . . . . . . . . . . . . . . . . . . . . . . . . . . . . . . . . . . . . . .
Owners of the Company . . . . . . . . . . . . . . . . . . . . . . 1,703,898 824,637 1,009,080Non-controlling interests . . . . . . . . . . . . . . . . . . . . . 56,332 78,233 97,282
Total . . . . . . . . . . . . . . . . . . . . . . . . . . . . . . . . . . . . . 1,760,230 902,870 1,106,362
The accompanying notes form an integral part of these consolidated financial statements.
F-8
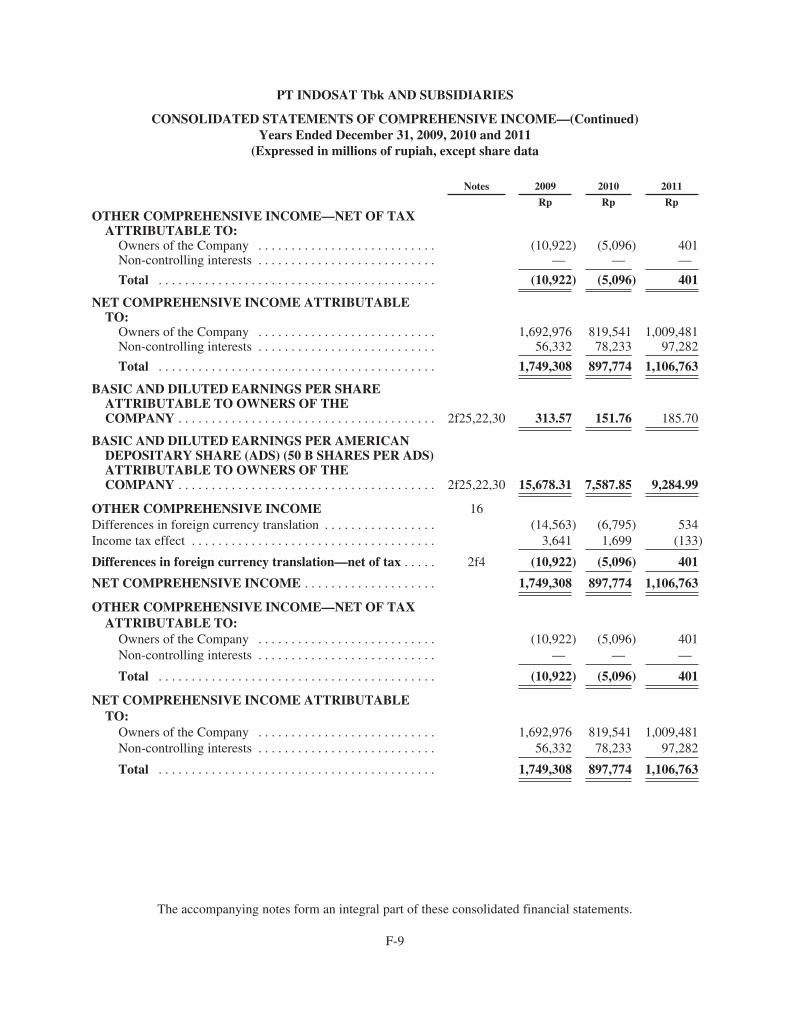
PT INDOSAT Tbk AND SUBSIDIARIES
CONSOLIDATED STATEMENTS OF COMPREHENSIVE INCOME—(Continued)Years Ended December 31, 2009, 2010 and 2011
(Expressed in millions of rupiah, except share data
Notes 2009 2010 2011
Rp Rp RpOTHER COMPREHENSIVE INCOME—NET OF TAX
ATTRIBUTABLE TO:Owners of the Company . . . . . . . . . . . . . . . . . . . . . . . . . . . (10,922) (5,096) 401Non-controlling interests . . . . . . . . . . . . . . . . . . . . . . . . . . . — — —
Total . . . . . . . . . . . . . . . . . . . . . . . . . . . . . . . . . . . . . . . . . . (10,922) (5,096) 401
NET COMPREHENSIVE INCOME ATTRIBUTABLETO:
Owners of the Company . . . . . . . . . . . . . . . . . . . . . . . . . . . 1,692,976 819,541 1,009,481Non-controlling interests . . . . . . . . . . . . . . . . . . . . . . . . . . . 56,332 78,233 97,282
Total . . . . . . . . . . . . . . . . . . . . . . . . . . . . . . . . . . . . . . . . . . 1,749,308 897,774 1,106,763
BASIC AND DILUTED EARNINGS PER SHAREATTRIBUTABLE TO OWNERS OF THECOMPANY . . . . . . . . . . . . . . . . . . . . . . . . . . . . . . . . . . . . . . . 2f25,22,30 313.57 151.76 185.70
BASIC AND DILUTED EARNINGS PER AMERICANDEPOSITARY SHARE (ADS) (50 B SHARES PER ADS)ATTRIBUTABLE TO OWNERS OF THECOMPANY . . . . . . . . . . . . . . . . . . . . . . . . . . . . . . . . . . . . . . . 2f25,22,30 15,678.31 7,587.85 9,284.99
OTHER COMPREHENSIVE INCOME 16Differences in foreign currency translation . . . . . . . . . . . . . . . . . (14,563) (6,795) 534Income tax effect . . . . . . . . . . . . . . . . . . . . . . . . . . . . . . . . . . . . . 3,641 1,699 (133)
Differences in foreign currency translation—net of tax . . . . . 2f4 (10,922) (5,096) 401
NET COMPREHENSIVE INCOME . . . . . . . . . . . . . . . . . . . . 1,749,308 897,774 1,106,763
OTHER COMPREHENSIVE INCOME—NET OF TAXATTRIBUTABLE TO:
Owners of the Company . . . . . . . . . . . . . . . . . . . . . . . . . . . (10,922) (5,096) 401Non-controlling interests . . . . . . . . . . . . . . . . . . . . . . . . . . . — — —
Total . . . . . . . . . . . . . . . . . . . . . . . . . . . . . . . . . . . . . . . . . . (10,922) (5,096) 401
NET COMPREHENSIVE INCOME ATTRIBUTABLETO:
Owners of the Company . . . . . . . . . . . . . . . . . . . . . . . . . . . 1,692,976 819,541 1,009,481Non-controlling interests . . . . . . . . . . . . . . . . . . . . . . . . . . . 56,332 78,233 97,282
Total . . . . . . . . . . . . . . . . . . . . . . . . . . . . . . . . . . . . . . . . . . 1,749,308 897,774 1,106,763
The accompanying notes form an integral part of these consolidated financial statements.
F-9

PT INDOSAT Tbk AND SUBSIDIARIES
CONSOLIDATED STATEMENTS OF CHANGES IN EQUITYYears Ended December 31, 2009, 2010 and 2011
(Expressed in millions of rupiah)
Attributable to the Owners of the Company
Notes
CapitalStock—Issued
andFullyPaid
Premiumon Capital
Stock
Difference inTransactions
of EquityChanges inAssociated
Group/Subsidiaries*
Difference inForeign
CurrencyTranslation**
Retained Earnings
Total
Non-controllingInterests Net EquityDescription Appropriated Unappropriated
Balance as of January 1, 2009 . . . . 543,393 1,546,587 404,104 13,291 100,678 14,885,383 17,493,436 286,248 17,779,684
Profit for the year . . . . . . . . . . . . . . . — — — — — 1,703,898 1,703,898 56,332 1,760,230Other comprehensive income . . . . . . — — — (10,922) — — (10,922) — (10,922)
Net comprehensive income . . . . . . — — — (10,922) — 1,703,898 1,692,976 56,332 1,749,308Resolution during the Annual
Stockholders’ General Meeting onJune 19, 2009 . . . . . . . . . . . . . . . . 31
Declaration of cash dividend . . — — — — — (939,255) (939,255) — (939,255)Appropriation for reserve
fund . . . . . . . . . . . . . . . . . . . . — — — — 18,786 (18,786) — — —Changes in non-controlling
interest . . . . . . . . . . . . . . . . . . . . . — — — — — — — (14,828) (14,828)
Balance as of December 31,2009 . . . . . . . . . . . . . . . . . . . . . . . 543,393 1,546,587 404,104 2,369 119,464 15,631,240 18,247,157 327,752 18,574,909
* This reserve includes difference in foreign currency translation resulting from reduction in tax rates.** This reserve arose from the translation of the financial statements of Indosat Finance B.V. and Indosat International Finance Company B.V. from euro, and Indosat Singapore Pte. Ltd. from
U.S. dollar to rupiah, net of applicable taxes.
The accompanying notes form an integral part of these consolidated financial statements.
F-10

PT INDOSAT Tbk AND SUBSIDIARIES
CONSOLIDATED STATEMENTS OF CHANGES IN EQUITY—(Continued)Years Ended December 31, 2009, 2010 and 2011
(Expressed in millions of rupiah)
Attributable to the Owners of the Company
Description Notes
CapitalStock—Issued
andFullyPaid
Premiumon Capital
Stock
Difference inTransactions
of EquityChanges inAssociatedCompanies/
Subsidiaries*
Difference inForeign
CurrencyTranslation**
Retained Earnings
Total
Non-controllingInterests Net EquityAppropriated Unappropriated
Balance as of January 1, 2010 . . . . . . . . 543,393 1,546,587 404,104 2,369 119,464 15,631,240 18,247,157 327,752 18,574,909
Profit for the year . . . . . . . . . . . . . . . . . . . — — — — — 824,637 824,637 78,233 902,870Other comprehensive income . . . . . . . . . . — — — (5,096) — — (5,096) — (5,096)
Net comprehensive income . . . . . . . . . . — — — (5,096) — 824,637 819,541 78,233 897,774Resolution during the Annual
Stockholders’ General Meeting onJune 22, 2010 . . . . . . . . . . . . . . . . . . . . 31
Declaration of cash dividend . . . . . . — — — — — (749,122) (749,122) — (749,122)Appropriation for reserve fund . . . . . — — — — 14,982 (14,982) — — —
Changes in non-controlling interest . . . . . — — — — — — — (21,598) (21,598)
Balance as of December 31, 2010 . . . . . 543,393 1,546,587 404,104 (2,727) 134,446 15,691,773 18,317,576 384,387 18,701,963
* This reserve includes difference in foreign currency translation resulting from reduction in tax rates.** This reserve arose from the translation of the financial statements of Indosat Finance B.V. and Indosat International Finance Company B.V. from euro, and Indosat Singapore Pte. Ltd. and
Indosat Palapa B.V. from U.S. dollar to rupiah, net of applicable taxes.
The accompanying notes form an integral part of these consolidated financial statements.
F-11
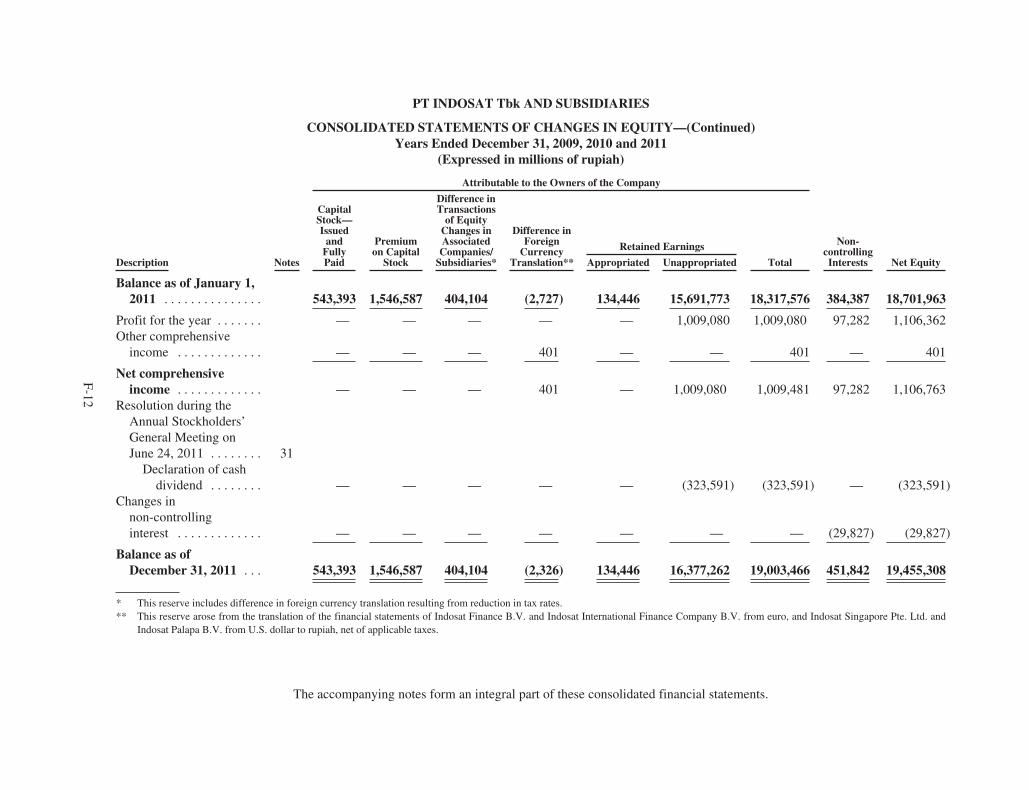
PT INDOSAT Tbk AND SUBSIDIARIES
CONSOLIDATED STATEMENTS OF CHANGES IN EQUITY—(Continued)Years Ended December 31, 2009, 2010 and 2011
(Expressed in millions of rupiah)
Description
Attributable to the Owners of the Company
Notes
CapitalStock—Issued
andFullyPaid
Premiumon Capital
Stock
Difference inTransactions
of EquityChanges inAssociatedCompanies/
Subsidiaries*
Difference inForeign
CurrencyTranslation**
Retained Earnings
Total
Non-controllingInterests Net EquityAppropriated Unappropriated
Balance as of January 1,2011 . . . . . . . . . . . . . . . 543,393 1,546,587 404,104 (2,727) 134,446 15,691,773 18,317,576 384,387 18,701,963
Profit for the year . . . . . . . — — — — — 1,009,080 1,009,080 97,282 1,106,362Other comprehensive
income . . . . . . . . . . . . . — — — 401 — — 401 — 401
Net comprehensiveincome . . . . . . . . . . . . . — — — 401 — 1,009,080 1,009,481 97,282 1,106,763
Resolution during theAnnual Stockholders’General Meeting onJune 24, 2011 . . . . . . . . 31
Declaration of cashdividend . . . . . . . . — — — — — (323,591) (323,591) — (323,591)
Changes innon-controllinginterest . . . . . . . . . . . . . — — — — — — — (29,827) (29,827)
Balance as ofDecember 31, 2011 . . . 543,393 1,546,587 404,104 (2,326) 134,446 16,377,262 19,003,466 451,842 19,455,308
* This reserve includes difference in foreign currency translation resulting from reduction in tax rates.** This reserve arose from the translation of the financial statements of Indosat Finance B.V. and Indosat International Finance Company B.V. from euro, and Indosat Singapore Pte. Ltd. and
Indosat Palapa B.V. from U.S. dollar to rupiah, net of applicable taxes.
The accompanying notes form an integral part of these consolidated financial statements.
F-12

PT INDOSAT Tbk AND SUBSIDIARIES
CONSOLIDATED STATEMENTS OF CASH FLOWSYears Ended December 31, 2009, 2010 and 2011
(Expressed in millions of rupiah)
Notes 2009 2010 2011
Rp Rp RpCASH FLOWS FROM OPERATINGACTIVITIESCash received from:
Customers . . . . . . . . . . . . . . . . . . . . . . . . . . . . . . . . . . 18,415,890 19,678,609 20,620,790Refund of taxes . . . . . . . . . . . . . . . . . . . . . . . . . . . . . . 6 84,650 41,753 141,271Interest income . . . . . . . . . . . . . . . . . . . . . . . . . . . . . . . 146,826 145,067 81,336Settlement from currency forward contracts . . . . . . . . 32c,32h,
32i-j,32k,32aa-ap — — 55,371
Settlement from derivative contracts . . . . . . . . . . . . . . 32c,32h-k — — 20,626Cash paid to/for:
Authorities, other operators, suppliers and others . . . . (10,061,275) (9,051,275) (9,102,182)Employees . . . . . . . . . . . . . . . . . . . . . . . . . . . . . . . . . . (1,359,817) (1,310,556) (2,003,642)Financing cost . . . . . . . . . . . . . . . . . . . . . . . . . . . . . . . (1,730,149) (2,175,997) (1,739,810)Income taxes . . . . . . . . . . . . . . . . . . . . . . . . . . . . . . . . (878,137) (215,874) (563,320)Interest rate swap contracts . . . . . . . . . . . . . . . . . . . . . 32m-z (47,715) (117,231) (119,521)Swap cost from cross currency swap contracts . . . . . . 32a-l (125,748) (121,449) (70,838)Settlement from derivative contract . . . . . . . . . . . . . . . 32b,32g — (24,431) —Long-term prepaid licenses . . . . . . . . . . . . . . . . . . . . . 2f19 (338,408) — —
Net Cash Provided by OperatingActivities 4,106,117 6,848,616 7,320,081
CASH FLOWS FROM INVESTING ACTIVITIESCash dividend received from other long-term
investment . . . . . . . . . . . . . . . . . . . . . . . . . . . . . . . . . . . . 12a 26,774 19,281 13,790Proceeds from sale of property and equipment . . . . . . . . . . 8 2,253 7,741 6,708Acquisitions of property and equipment . . . . . . . . . . . . . . . 8 (10,684,690) (6,495,146) (6,047,958)Acquisition of intangible assets . . . . . . . . . . . . . . . . . . . . . . 9 (15,044) (40,052) (10,452)Proceeds of Palapa D-Satellite insurance claim . . . . . . . . . 8 — 537,657 —Purchase of investment in an associated company . . . . . . . — (194) —
Net Cash Used in Investing Activities (10,670,707) (5,970,713) (6,037,912)
CASH FLOWS FROM FINANCING ACTIVITIESProceeds from long-term loans . . . . . . . . . . . . . . . . . . . . . . 18 3,892,786 1,092,059 2,322,900Proceeds from short-term loan . . . . . . . . . . . . . . . . . . . . . . . 14 — — 1,500,000Repayment of long-term loans . . . . . . . . . . . . . . . . . . . . . . . 18 (632,814) (4,098,277) (3,505,063)Repayment of bonds payable . . . . . . . . . . . . . . . . . . . . . . . . 19 (14,453) (3,720,815) (1,100,000)Cash dividend paid by the Company . . . . . . . . . . . . . . . . . . 31 (939,255) (749,122) (323,591)Cash dividend paid by subsidiaries to non-controlling
interest . . . . . . . . . . . . . . . . . . . . . . . . . . . . . . . . . . . . . . . (9,291) (21,436) (29,692)Proceeds from bonds payable . . . . . . . . . . . . . . . . . . . . . . . 19 1,500,000 5,851,301 —Settlement from derivative contract . . . . . . . . . . . . . . . . . . . 32a — 59,925 —Decrease (increase) in restricted cash and cash
equivalents . . . . . . . . . . . . . . . . . . . . . . . . . . . . . . . . . . . . (18,206) 2,846 —Swap cost from cross currency swap contract . . . . . . . . . . . 32a (54,116) (46,136) —Net Cash Provided by (Used in) Financing Activities
3,724,651 (1,629,655) (1,135,446)
The accompanying notes form an integral part of these consolidated financial statements.
F-13
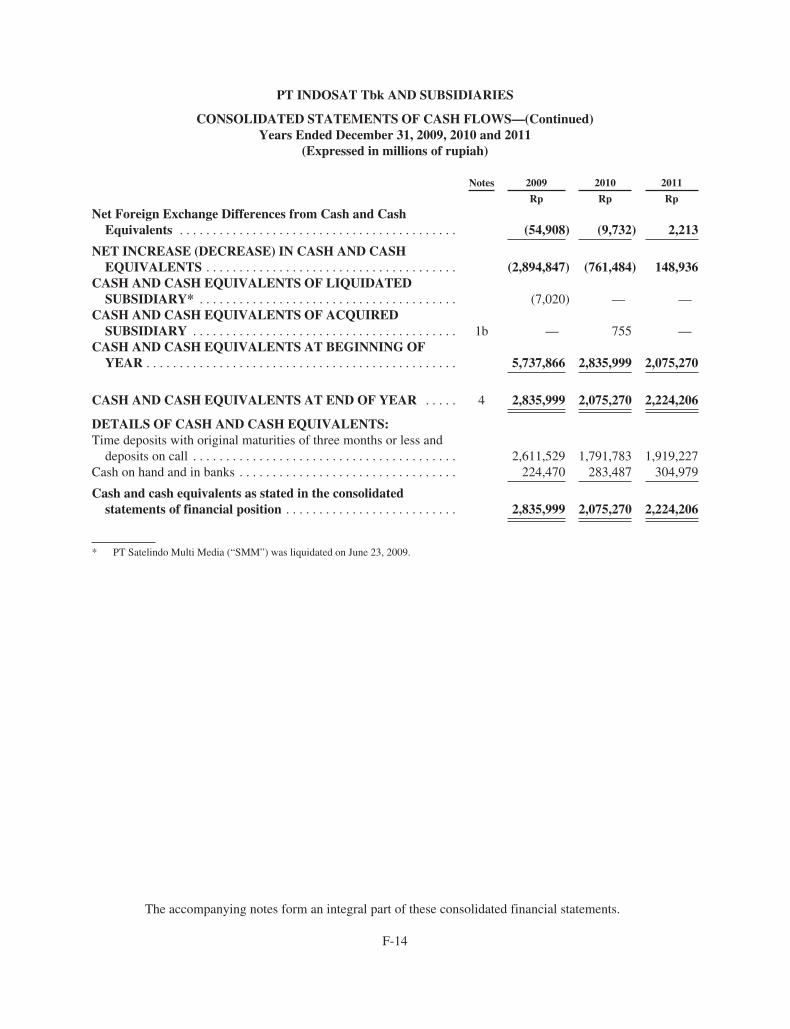
PT INDOSAT Tbk AND SUBSIDIARIES
CONSOLIDATED STATEMENTS OF CASH FLOWS—(Continued)Years Ended December 31, 2009, 2010 and 2011
(Expressed in millions of rupiah)
Notes 2009 2010 2011
Rp Rp Rp
Net Foreign Exchange Differences from Cash and CashEquivalents . . . . . . . . . . . . . . . . . . . . . . . . . . . . . . . . . . . . . . . . . . (54,908) (9,732) 2,213
NET INCREASE (DECREASE) IN CASH AND CASHEQUIVALENTS . . . . . . . . . . . . . . . . . . . . . . . . . . . . . . . . . . . . . . (2,894,847) (761,484) 148,936
CASH AND CASH EQUIVALENTS OF LIQUIDATEDSUBSIDIARY* . . . . . . . . . . . . . . . . . . . . . . . . . . . . . . . . . . . . . . . (7,020) — —
CASH AND CASH EQUIVALENTS OF ACQUIREDSUBSIDIARY . . . . . . . . . . . . . . . . . . . . . . . . . . . . . . . . . . . . . . . . 1b — 755 —
CASH AND CASH EQUIVALENTS AT BEGINNING OFYEAR . . . . . . . . . . . . . . . . . . . . . . . . . . . . . . . . . . . . . . . . . . . . . . . 5,737,866 2,835,999 2,075,270
CASH AND CASH EQUIVALENTS AT END OF YEAR . . . . . 4 2,835,999 2,075,270 2,224,206
DETAILS OF CASH AND CASH EQUIVALENTS:Time deposits with original maturities of three months or less and
deposits on call . . . . . . . . . . . . . . . . . . . . . . . . . . . . . . . . . . . . . . . . 2,611,529 1,791,783 1,919,227Cash on hand and in banks . . . . . . . . . . . . . . . . . . . . . . . . . . . . . . . . . 224,470 283,487 304,979
Cash and cash equivalents as stated in the consolidatedstatements of financial position . . . . . . . . . . . . . . . . . . . . . . . . . . 2,835,999 2,075,270 2,224,206
* PT Satelindo Multi Media (“SMM”) was liquidated on June 23, 2009.
The accompanying notes form an integral part of these consolidated financial statements.
F-14

PT INDOSAT Tbk AND SUBSIDIARIES
NOTES TO CONSOLIDATED FINANCIAL STATEMENTSas of January 1, 2010 and December 31, 2010 and 2011
and for the years ended December 31, 2009, 2010 and 2011(Expressed in millions of rupiah and thousands of U.S. dollar, except share and tariff data)
1. GENERAL
a. Company’s Establishment
PT Indosat Tbk (“the Company”) was established in the Republic of Indonesia on November 10, 1967within the framework of the Indonesian Foreign Investment Law No. 1 of 1967 based on the notarial deedNo. 55 of Mohamad Said Tadjoedin, S.H. The deed of establishment was published in Supplement No. 24 ofState Gazette No. 26 dated March 29, 1968 of the Republic of Indonesia. In 1980, the Company was sold byAmerican Cable and Radio Corporation, an International Telephone & Telegraph subsidiary, to theGovernment of the Republic of Indonesia (“the Government”) and became a State-owned Company (Persero).
On February 7, 2003, the Company received the approval from the Capital Investment CoordinatingBoard (BKPM) in its letter No. 14/V/PMA/2003 for the change of its legal status from a State-ownedCompany (Persero) to a Foreign Capital Investment Company. Subsequently, on March 21, 2003, theCompany received the approval from the Ministry of Justice and Human Rights of the Republic ofIndonesia on the amendment of its Articles of Association to reflect the change of its legal status.
The Company’s Articles of Association has been amended from time to time. The latest amendment wascovered by notarial deed No. 123 dated January 28, 2010 of Aulia Taufani, S.H., (as a substitute notary ofSutjipto, S.H.) as approved in the Stockholders’ Extraordinary General Meeting held on January 28, 2010, inorder to comply with the Indonesian Capital Market and Financial Institutions Supervisory Agency(BAPEPAM-LK) Rule No. IX.J.1 dated May 14, 2008 on the Principles of Articles of Association of LimitedLiability Companies that Conduct Public Offering of Equity Securities and Public Companies and Rule No.IX.E.1 on Affiliate Transactions and Certain Conflict of Interests Transactions. The latest amendment of theCompany’s Articles of Association has been approved by and reported to the Ministry of Law and HumanRights of the Republic of Indonesia based on its letters No. AHU-09555.AH.01.02 Year 2010 datedFebruary 22, 2010 and No. AHU-AH.01.10-04964 dated February 25, 2010. The amendments relate to, amongothers, the changes in the Company’s purposes, objectives and business activities, appointment of actingPresident Director if the incumbent President Director is unavailable and definition of conflict of interests.
The address of the Company’s registered office is at Jl. Medan Merdeka Barat 21 Jakarta and it has 4regional offices located in Jakarta, Surabaya, Batam and Balikpapan.
According to article 3 of its Articles of Association, the Company’s purposes and objectives are toprovide telecommunications networks, telecommunications services as well as information technology and/or convergence technology services by carrying out the following main business activities:
a. To provide telecommunications networks, telecommunications services as well as informationtechnology and/or convergence technology services, including but not limited to providing basictelephony services, multimedia services, internet telephony services for public use,interconnection internet services, internet access services, mobile telecommunications networksand fixed telecommunications networks; and
b. To engage in payment transactions and money transfer services through telecommunicationsnetworks as well as information technology and/or convergence technology.
The Company can provide supporting business activities in order to achieve the purposes andobjectives, and to support its main businesses, as follows:
a. To plan, to procure, to modify, to build, to provide, to develop, to operate, to lease, to rent, and tomaintain infrastructures/facilities including resources to support the Company’s business in
F-15

PT INDOSAT Tbk AND SUBSIDIARIES
NOTES TO CONSOLIDATED FINANCIAL STATEMENTS—(Continued)as of January 1, 2010 and December 31, 2010 and 2011
and for the years ended December 31, 2009, 2010 and 2011(Expressed in millions of rupiah and thousands of U.S. dollar, except share and tariff data)
providing telecommunications networks, telecommunications services as well as informationtechnology and/or convergence technology services;
b. To conduct business and operating activities (including development, marketing and sales oftelecommunications networks, telecommunications services as well as information technologyand/or convergence technology services by the Company), including research, customer services,education and courses (both domestic and overseas); and
c. To conduct other activities necessary to support and/or related to the provision oftelecommunications networks, telecommunications services as well as information technologyand/or convergence technology services including but not limited to electronic transactions andprovision of hardware, software, content as well as telecommunications-managed services.
The consolidated financial statements of the Company and its subsidiaries (collectively referred tohereafter as “the Group”) as of January 1, 2010 and December 31, 2010 and 2011 and for each of the threeyears in the period ended December 31, 2011 were approved and authorized for issue by the Board ofDirectors on April 25, 2012, as reviewed and recommended for approval by the Audit Committee.
b. Structure of the Company’s Subsidiaries
As of January 1, 2010 and December 31, 2010 and 2011, the Company has direct and indirectownership in the following subsidiaries:
Percentage of Ownership (%)
Name of Subsidiary Location Principal Activity
Start ofCommercialOperations
January 1,2010
December 31,2010
December 31,2011
Indosat Palapa Company B.V.(“IPBV”) (2) . . . . . . . . . . . . . . . . Amsterdam Finance 2010 — 100.00 100.00
Indosat Mentari Finance CompanyB.V. (“IMBV”) (2) . . . . . . . . . . . Amsterdam Finance 2010 — 100.00 100.00
Indosat Finance Company B.V.(“IFB”) (3) . . . . . . . . . . . . . . . . . Amsterdam Finance 2003 100.00 100.00 100.00
Indosat International FinanceCompany B.V. (“IIFB”) (4) . . . . Amsterdam Finance 2005 100.00 100.00 100.00
Indosat Singapore Pte. Ltd.(“ISPL”) . . . . . . . . . . . . . . . . . . Singapore Telecommunication 2005 100.00 100.00 100.00
PT Indosat Mega Media(“IMM”) . . . . . . . . . . . . . . . . . . Jakarta Multimedia 2001 99.85 99.85 99.85
PT Interactive Vision Media(“IVM”) (5) . . . . . . . . . . . . . . . . Jakarta Pay TV 2011 — — 99.83
PT Starone Mitra Telekomunikasi(“SMT”) . . . . . . . . . . . . . . . . . . Semarang Telecommunication 2006 72.54 72.54 72.54
PT Aplikanusa Lintasarta(“Lintasarta”) . . . . . . . . . . . . . . Jakarta Data
Communication1989 72.36 72.36 72.36
PT Lintas Media Danawa(“LMD”) (6) . . . . . . . . . . . . . . . . Jakarta Information and
CommunicationServices
2008 — 50.65 50.65
PT Artajasa PembayaranElektronis (“APE”) (6) (Note2b) . . . . . . . . . . . . . . . . . . . . . . . Jakarta Telecommunication 2000 39.80 39.80 39.80
PT Satelindo Multi Media(“SMM”) (1) . . . . . . . . . . . . . . . . Jakarta Telecommunication 1999 99.60 — —
F-16

PT INDOSAT Tbk AND SUBSIDIARIES
NOTES TO CONSOLIDATED FINANCIAL STATEMENTS—(Continued)as of January 1, 2010 and December 31, 2010 and 2011
and for the years ended December 31, 2009, 2010 and 2011(Expressed in millions of rupiah and thousands of U.S. dollar, except share and tariff data)
Total Assets(Before Eliminations)
Name of SubsidiaryJanuary 1,
2010December 31,
2010December 31,
2011
IPBV (2) . . . . . . . . . . . . . . . . . . . . . . . . . . . . . . . . . . . . . . . . — 5,966,764 6,015,894IMBV (2) . . . . . . . . . . . . . . . . . . . . . . . . . . . . . . . . . . . . . . . . — 5,946,885 6,010,359IFB (3) . . . . . . . . . . . . . . . . . . . . . . . . . . . . . . . . . . . . . . . . . . 2,261,226 21,876 20,923IIFB (4) . . . . . . . . . . . . . . . . . . . . . . . . . . . . . . . . . . . . . . . . . 1,044,174 9,635 8,688ISPL . . . . . . . . . . . . . . . . . . . . . . . . . . . . . . . . . . . . . . . . . . . 28,779 54,353 78,264IMM . . . . . . . . . . . . . . . . . . . . . . . . . . . . . . . . . . . . . . . . . . . 738,371 814,652 739,516IVM (5) . . . . . . . . . . . . . . . . . . . . . . . . . . . . . . . . . . . . . . . . . — — 5,198SMT . . . . . . . . . . . . . . . . . . . . . . . . . . . . . . . . . . . . . . . . . . . 139,833 155,297 209,541Lintasarta . . . . . . . . . . . . . . . . . . . . . . . . . . . . . . . . . . . . . . . 1,407,461 1,739,049 1,777,761LMD (6) . . . . . . . . . . . . . . . . . . . . . . . . . . . . . . . . . . . . . . . . . — 2,671 5,199APE (6) . . . . . . . . . . . . . . . . . . . . . . . . . . . . . . . . . . . . . . . . . 179,681 221,297 258,745SMM (1) . . . . . . . . . . . . . . . . . . . . . . . . . . . . . . . . . . . . . . . . — — —
(1) Liquidated on June 23, 2009(2) IPBV and IMBV were incorporated in Amsterdam on April 28, 2010 to engage in treasury activities, to
lend and borrow money, whether in the form of securities or otherwise, to finance enterprises andGroup, to grant security in respect of their obligation or those of their group Group and third parties.
(3) Based on an IFB shareholder’s resolution dated November 6, 2008, IFB decided to refund capitalinjection amounting to EUR99,996. The Company received such refund in February 2009.
(4) Based on an IIFB shareholder’s resolution dated November 6, 2008, IIFB decided to refund capitalinjection amounting to EUR1,124,064. The Company received such refund in February 2009.
(5) IVM, a subsidiary of IMM, was established on April 21, 2009 to engage in Pay TV services. IMMmade capital injections to IVM on March 9 and 30, 2011 totalling Rp4,999. On July 12, 2011, IVM gotthe license to conduct its Pay TV services. However, as of December 31, 2011, IVM has not started itscommercial operations.
(6) Lintasarta has direct 55% and 70% ownership in APE and LMD, respectively.
c. Merger of the Company, Satelindo, Bimagraha and IM3
Based on Merger Deed No. 57 dated November 20, 2003 (“merger date”) of Poerbaningsih AdiWarsito, S.H., the Company, PT Satelit Palapa Indonesia (“Satelindo”), PT Bimagraha Telekomindo(“Bimagraha”) and PT Indosat Multi Media Mobile (“IM3”) agreed to merge, with the Company as thesurviving entity. All assets and liabilities owned by Satelindo, Bimagraha and IM3 were transferred to theCompany on the merger date. These three companies were dissolved by operation of law without the need toundergo the regular liquidation process.
The names “Satelindo” and “IM3” in the following notes refer to these entities before they weremerged with the Company, or as the entities that entered into contractual agreements that were taken overby the Company as a result of the merger.
F-17

PT INDOSAT Tbk AND SUBSIDIARIES
NOTES TO CONSOLIDATED FINANCIAL STATEMENTS—(Continued)as of January 1, 2010 and December 31, 2010 and 2011
and for the years ended December 31, 2009, 2010 and 2011(Expressed in millions of rupiah and thousands of U.S. dollar, except share and tariff data)
2. SUMMARY OF SIGNIFICANT ACCOUNTING POLICIES
The significant accounting policies applied consistently in the preparation of the consolidated financialstatements are as follows:
a. Basis of Consolidated Financial Statements
The consolidated financial statements have been prepared using the historical cost basis of accounting,except for inventories which are stated at the lower of cost or net realizable value and derivative financialinstruments and available for sale financial assets which are stated at fair value.
The consolidated statements of cash flows classify cash receipts and payments into operating, investingand financing activities. The cash flows from operating activities are presented using the direct method.
The consolidated financial statements are presented in Indonesian rupiah, which is the Company’sfunctional and reporting currency.
b. Principles of Consolidation
The consolidated financial statements include the Company’s accounts and those of its subsidiaries(Note 1b).
In accordance with IAS 27 (Revised 2008), the Company prepares and presents the consolidatedfinancial statements for a group of entities under its control.
Control is presumed to exist when the parent owns, directly or indirectly through subsidiaries, morethan half of the voting power of an entity. Control also exists when the parent owns half or less of the votingpower of an entity when there is:
a) power over more than half of the voting rights by virtue of an agreement with other investors;
b) power to govern the financial and operating policies of the entity under a statute or an agreement;
c) power to appoint or remove the majority of the members of the board of directors or equivalentgoverning body and control of the entity is by that board or body; or
d) power to cast the majority of votes at meetings of the board of directors or equivalent governingbody and control of the entity is by that board or body.
The financial statements of the subsidiaries are prepared for the same reporting period as the Company,using consistent accounting policies. All intra-group balances, transactions, unrealized gains and lossesresulting from intra-group transactions and dividends are eliminated in full.
Total comprehensive income within a subsidiary is attributed to the non-controlling interest even if thatresults in a deficit balance.
A change in the ownership interest of a subsidiary, without a loss of control, is accounted for as anequity transaction. If the Group loses control over a subsidiary, it:
• Derecognizes the assets (including goodwill) and liabilities of the subsidiary
• Derecognizes the carrying amount of any non-controlling interest
F-18

PT INDOSAT Tbk AND SUBSIDIARIES
NOTES TO CONSOLIDATED FINANCIAL STATEMENTS—(Continued)as of January 1, 2010 and December 31, 2010 and 2011
and for the years ended December 31, 2009, 2010 and 2011(Expressed in millions of rupiah and thousands of U.S. dollar, except share and tariff data)
• Derecognizes the cumulative translation differences recorded in equity
• Recognizes the fair value of the consideration received
• Recognizes the fair value of any investment retained
• Recognizes any surplus or deficit in profit or loss
• Reclassifies the parent’s share of components previously recognized in other comprehensiveincome to profit or loss or retained earnings, as appropriate.
The consolidated financial statements also include the accounts of APE (Lintasarta’s subsidiary). Theaccounts of APE in 2009, 2010 and 2011 were consolidated because its financial and operating policieswere controlled by Lintasarta.
The accounts of IPBV, IMBV, IFB, IIFB, and ISPL were translated into rupiah amounts at the middlerates of exchange prevailing at balance sheet date for balance sheet accounts and the average rates duringthe year for profit or loss accounts. The resulting differences arising from the translations of the financialstatements of IPBV, IMBV, IFB, IIFB, and ISPL are presented as part of “Other Components of Equity”under the Equity section of the consolidated statements of financial position.
Non-controlling interest in subsidiaries represents the minority stockholders’ proportionate share in theequity (including net income) of the subsidiaries which are not wholly-owned.
c. Statement of Compliance
The consolidated financial statements of the Group have been prepared in accordance with InternationalFinancial Reporting Standards (“IFRS”) as issued by the International Accounting Standards Board (“IASB”).
d. Reclassifications
Certain accounts were reclassified to allow their comparison with 2011 accounts. The following itemsdiscuss the significant reclassifications in the consolidated financial statements:
As of and for the year ended January 1, 2010:
As Previously Reported As Reclassified Amount
Short—term investments—net . . . . . . . . . . . . Other current financial assets—net —Investments in associated companies—net . . . Other non-current assets—net 422Other long—term investments—net . . . . . . . . Other non-current financial assets—net 2,730Other income (expenses)- others—net . . . . . . Operating expenses—general and
administration29,357
As of and for the year ended December 31, 2010:
As Previously Reported As Reclassified Amount
Short—term investments—net . . . . . . . . . . . . Other current financial assets—net —Other income (expenses)—others—net . . . . . Operating expenses—general and
administration32,594
F-19

PT INDOSAT Tbk AND SUBSIDIARIES
NOTES TO CONSOLIDATED FINANCIAL STATEMENTS—(Continued)as of January 1, 2010 and December 31, 2010 and 2011
and for the years ended December 31, 2009, 2010 and 2011(Expressed in millions of rupiah and thousands of U.S. dollar, except share and tariff data)
e. Adoption of New and Revised Accounting Standards
New and amended standards
The accounting policies adopted are consistent with those of the previous financial year, except for thefollowing new and amended IFRS and International Financial Reporting Interpretations CommitteeInterpretations (“IFRIC Interpretations”) for financial statements beginning on or after January 1, 2011:
• IAS 24 Related Party Disclosures (as revised in 2009) effective January 1, 2011
• IAS 32 Financial Instruments: Presentation (amendment) effective February 1, 2010
• IFRIC 14 Prepayments of a Minimum Funding Requirement (amendment) effective January 1,2011
• IFRIC 19 Extinguishing Financial Liabilities with Equity Instruments effective July 1, 2010
• Improvements to IFRSs (May 2010)
The new and amended standards are described below:
IAS 24 Related Party Transactions (Amendment)
The IASB issued an amendment to IAS 24 that clarifies the definitions of a related party. The newdefinitions emphasise a symmetrical view of related party relationships and clarifies the circumstances inwhich persons and key management personnel affect related party relationships of an entity. In addition, theamendment introduces an exemption from the general related party disclosure requirements for transactionswith government and entities that are controlled, jointly controlled or significantly influenced by the samegovernment as the reporting entity. The Group have evaluated the relationship between related parties anddisclosed it according to the revised standard.
IAS 32 Financial Instruments: Presentation (Amendment)
The IASB issued an amendment that alters the definition of a financial liability in IAS 32 to enableentities to classify rights issues and certain options or warrants as equity instruments. The amendment isapplicable if the rights are given pro rata to all of the existing owners of the same class of an entity’snon-derivative equity instruments, to acquire a fixed number of the entity’s own equity instruments for afixed amount in any currency. The amendment has had no effect on the financial position or performance ofthe Group because the Group do not have these types of instruments.
IFRIC 14 Prepayments of a Minimum Funding Requirement (Amendment)
The amendment removes an unintended consequence when an entity is subject to minimum fundingrequirements and makes an early payment of contributions to cover such requirements. The amendmentpermits a prepayment of future service cost by the entity to be recognised as a pension asset. The Grouphave already considered the asset limitation set out in paragraph 58b of IAS 19. The prepayment discussedin IFRIC 14 has no impact to the Group since they do not have any minimum funding requirement.
F-20
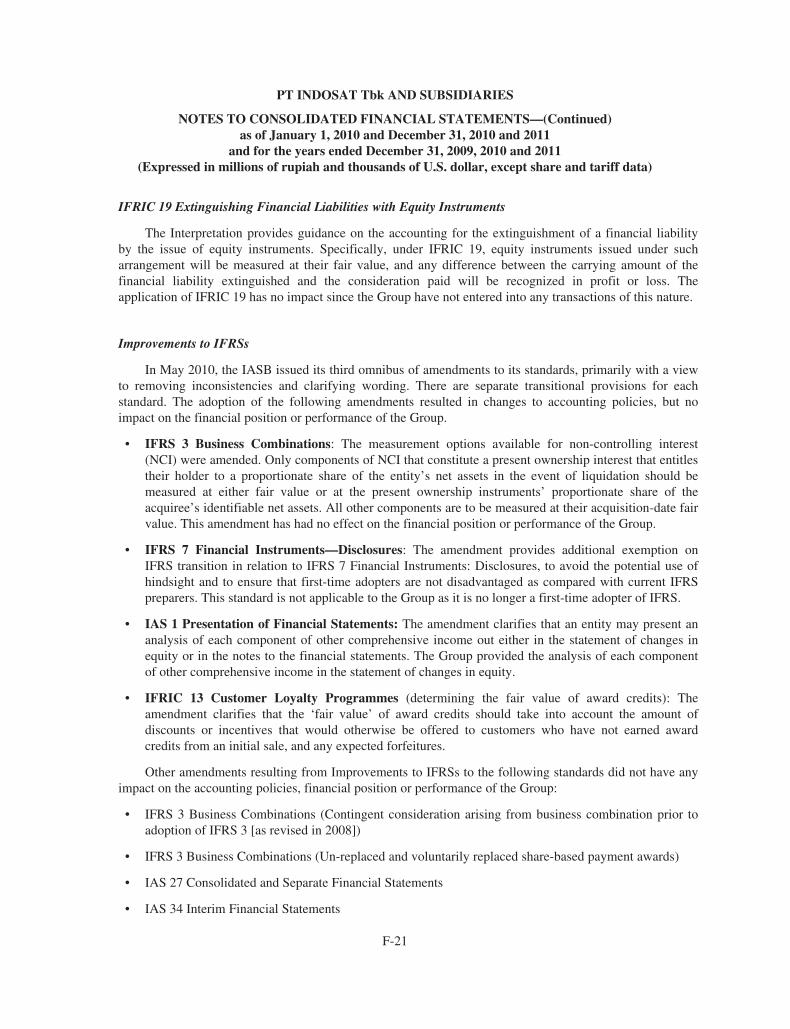
PT INDOSAT Tbk AND SUBSIDIARIES
NOTES TO CONSOLIDATED FINANCIAL STATEMENTS—(Continued)as of January 1, 2010 and December 31, 2010 and 2011
and for the years ended December 31, 2009, 2010 and 2011(Expressed in millions of rupiah and thousands of U.S. dollar, except share and tariff data)
IFRIC 19 Extinguishing Financial Liabilities with Equity Instruments
The Interpretation provides guidance on the accounting for the extinguishment of a financial liabilityby the issue of equity instruments. Specifically, under IFRIC 19, equity instruments issued under sucharrangement will be measured at their fair value, and any difference between the carrying amount of thefinancial liability extinguished and the consideration paid will be recognized in profit or loss. Theapplication of IFRIC 19 has no impact since the Group have not entered into any transactions of this nature.
Improvements to IFRSs
In May 2010, the IASB issued its third omnibus of amendments to its standards, primarily with a viewto removing inconsistencies and clarifying wording. There are separate transitional provisions for eachstandard. The adoption of the following amendments resulted in changes to accounting policies, but noimpact on the financial position or performance of the Group.
• IFRS 3 Business Combinations: The measurement options available for non-controlling interest(NCI) were amended. Only components of NCI that constitute a present ownership interest that entitlestheir holder to a proportionate share of the entity’s net assets in the event of liquidation should bemeasured at either fair value or at the present ownership instruments’ proportionate share of theacquiree’s identifiable net assets. All other components are to be measured at their acquisition-date fairvalue. This amendment has had no effect on the financial position or performance of the Group.
• IFRS 7 Financial Instruments—Disclosures: The amendment provides additional exemption onIFRS transition in relation to IFRS 7 Financial Instruments: Disclosures, to avoid the potential use ofhindsight and to ensure that first-time adopters are not disadvantaged as compared with current IFRSpreparers. This standard is not applicable to the Group as it is no longer a first-time adopter of IFRS.
• IAS 1 Presentation of Financial Statements: The amendment clarifies that an entity may present ananalysis of each component of other comprehensive income out either in the statement of changes inequity or in the notes to the financial statements. The Group provided the analysis of each componentof other comprehensive income in the statement of changes in equity.
• IFRIC 13 Customer Loyalty Programmes (determining the fair value of award credits): Theamendment clarifies that the ‘fair value’ of award credits should take into account the amount ofdiscounts or incentives that would otherwise be offered to customers who have not earned awardcredits from an initial sale, and any expected forfeitures.
Other amendments resulting from Improvements to IFRSs to the following standards did not have anyimpact on the accounting policies, financial position or performance of the Group:
• IFRS 3 Business Combinations (Contingent consideration arising from business combination prior toadoption of IFRS 3 [as revised in 2008])
• IFRS 3 Business Combinations (Un-replaced and voluntarily replaced share-based payment awards)
• IAS 27 Consolidated and Separate Financial Statements
• IAS 34 Interim Financial Statements
F-21

PT INDOSAT Tbk AND SUBSIDIARIES
NOTES TO CONSOLIDATED FINANCIAL STATEMENTS—(Continued)as of January 1, 2010 and December 31, 2010 and 2011
and for the years ended December 31, 2009, 2010 and 2011(Expressed in millions of rupiah and thousands of U.S. dollar, except share and tariff data)
Standards issued but not yet effective
Standards issued but not yet effective up to the date of issuance of the Group financial statements arelisted below. These standards are reasonably expected to be applicable at a future date. The Group intends toadopt these standards when they become effective.
IAS 1 Financial Statement Presentation—Presentation of Items of Other Comprehensive Income (OCI)
The amendments to IAS 1 change the grouping of items presented in OCI. Items that could bereclassified (or ‘recycled’) to profit or loss at a future point in time (for example, upon derecognition orsettlement) would be presented separately from items that will never be reclassified. The amendment affectspresentation only and early adoption of this amendment will not have significant impact to the Group as ithas only one item of OCI which is related to foreign currency translation. The amendment becomeseffective for annual periods beginning on or after July 1, 2012.
IAS 12 Income Taxes—Recovery of Underlying Assets
The amendment clarified the determination of deferred tax on investment property measured at fairvalue. The amendment introduces a rebuttable presumption that deferred tax on investment propertymeasured using the fair value model in IAS 40 should be determined on the basis that its carrying amountwill be recovered through sale. Furthermore, it introduces the requirement that deferred tax onnon-depreciable assets that are measured using the revaluation model in IAS 16 always be measured on asale basis of the asset. The amendment becomes effective for annual periods beginning on or afterJanuary 1, 2012. This amendment will have no impact on the Group after initial application.
IAS 19 Employee Benefits (Amendment)
The IASB has issued numerous amendments to IAS 19. These range from fundamental changes such asremoving the corridor mechanism and the concept of expected returns on plan assets to simple clarificationsand re-wording. The amendments require the recognition of changes in defined benefit obligation and in fairvalue of plan assets when they occur, and hence eliminate the “corridor approach’ permitted under theprevious version of IAS 19 and accelerate the recognition of past service cost. The amendments require allactuarial gains and losses to be recognized immediately through other comprehensive income in order forthe net pension assets or liability recognized in the consolidated statements of financial position to reflectthe full value of the plan deficit or surplus. The amendment becomes effective for annual periods beginningon or after January 1, 2013. The Group has not yet performed a detailed analysis of the impact of theapplication of the amendments and hence has not yet quantified the extent of the impact.
IAS 27 Separate Financial Statements (as revised in 2011)
As a consequence of the new IFRS 10 and IFRS 12, what remains of IAS 27 is limited to accountingfor subsidiaries, jointly controlled entities, and associates in separate financial statements. The amendmentbecomes effective for annual periods beginning on or after January 1, 2013.
F-22
PT INDOSAT Tbk AND SUBSIDIARIES
NOTES TO CONSOLIDATED FINANCIAL STATEMENTS—(Continued)as of January 1, 2010 and December 31, 2010 and 2011
and for the years ended December 31, 2009, 2010 and 2011(Expressed in millions of rupiah and thousands of U.S. dollar, except share and tariff data)
IAS 28 Investments in Associates and Joint Ventures (as revised in 2011)
As a consequence of the new IFRS 11 and IFRS 12, IAS 28 has been renamed IAS 28 Investments inAssociates and Joint Ventures, and describes the application of the equity method to investments in jointventures in addition to associates. Currently the Group does not have any plan to dispose asset that will beapplicable under this standard. The Group intends to adopt this standard when it becomes effective. Theamendment becomes effective for annual periods beginning on or after January 1, 2013.
IAS 32 Financial Instruments (Amended)
This amendment clarifies certain aspects because of the diversity in the application of the requirementson offsetting, focused on four main areas:
• the meaning of ‘currently has a legally enforceable right of set-off’
• the application of simultaneous realization and settlement
• the offsetting of collateral amounts
• the unit of account for applying the offsetting requirements.
The Group will wait until this standard becomes effective. The amendment becomes effective forannual periods beginning on or after July 1, 2014.
IFRS 7 Financial Instruments: Disclosures—Enhanced Derecognition Disclosure Requirements
The amendment requires additional disclosure about financial assets that have been transferred but notderecognized to enable the user of the Group financial statements to understand the relationship with thoseassets that have not been derecognized and their associated liabilities. In addition, the amendment requiresdisclosures about continuing involvement in derecognized assets to enable the user to evaluate the nature of,and risks associated with, the entity’s continuing involvement in those derecognized assets. The amendmentbecomes effective for annual periods beginning on or after July 1, 2011. Early adoption of this amendmentwill not have significant impact to the Group as it does not have transactions involving transfer of financialassets. The Group will wait until this standard becomes effective.
IFRS 9 Financial Instruments: Classification and Measurement
IFRS 9 as issued reflects the first phase of the IASBs work on the replacement of IAS 39 and applies toclassification and measurement of financial assets and financial liabilities as defined in IAS 39. Thestandard is effective for annual periods beginning on or after January 1, 2013. In subsequent phases, theIASB will address hedge accounting and impairment of financial assets. The completion of this project isexpected over the course of 2011 or the first half of 2012. The Group will wait until this standard becomeeffective.
IFRS 10 Consolidated Financial Statements
IFRS 10 replaces the portion of IAS 27 Consolidated and Separate Financial Statements that addressesthe accounting for consolidated financial statements. It also includes the issues raised in SIC-12
F-23
PT INDOSAT Tbk AND SUBSIDIARIES
NOTES TO CONSOLIDATED FINANCIAL STATEMENTS—(Continued)as of January 1, 2010 and December 31, 2010 and 2011
and for the years ended December 31, 2009, 2010 and 2011(Expressed in millions of rupiah and thousands of U.S. dollar, except share and tariff data)
Consolidation—Special Purpose Entities, which will be withdrawn upon the issuance of the standard.IFRS 10 establishes a single control model that applies to all entities including special-purpose entities. Thechanges introduced by IFRS 10 will require management to exercise significant judgement to determinewhich entities are controlled, and therefore, are required to be consolidated by a parent, compared with therequirements that were in IAS 27. The Group intends to adopt this standard when it becomes effective. Thisstandard becomes effective for annual periods beginning on or after January 1, 2013.
IFRS 11 Joint Arrangements
IFRS 11 replaces IAS 31 Interests in Joint Ventures and SIC-13 Jointly-controlledEntities—Non-monetary Contributions by Venturers.
IFRS 11 removes the option to account for jointly controlled entities (JCEs) using proportionateconsolidation. Instead, JCEs that meet the definition of a joint venture must be accounted for using theequity method. The Group will wait until this standard becomes effective. This standard becomes effectivefor annual periods beginning on or after January 1, 2013.
IFRS 12 Disclosure of Involvement with Other Entities
IFRS 12 includes all of the disclosures that were previously in IAS 27 related to consolidated financialstatements, as well as all of the disclosures that were previously included in IAS 31 and IAS 28. Thesedisclosures relate to an entity’s interests in subsidiaries, joint arrangements, associates and structuredentities.
In general, the disclosure requirements in IFRS 12 are more extensive than those in the currentstandards. The Group will wait until this standard becomes effective. This standard becomes effective forannual periods beginning on or after January 1, 2013.
IFRS 13 Fair Value Measurement
IFRS 13 establishes a single source of guidance under IFRS for all fair value measurements anddisclosure about fair value measurements. IFRS 13 does not change when an entity is required to use fairvalue, but rather provides guidance on how to measure fair value under IFRS when fair value is required orpermitted. The standard defines fair value, establishes a framework for measuring fair value, and requiresdisclosures about fair value measurements. The scope of IFRS 13 is broad; it applies to both financialinstrument items and non-financial instrument items for which other IFRSs require or permit fair valuemeasurements and disclosure about fair value measurements, except in specified circumstances. The Groupwill wait until this standard becomes effective. This standard becomes effective for annual periodsbeginning on or after January 1, 2013.
f. Significant Accounting Policies and Practices
f1. Business combinations and goodwill
Business combinations from January 1, 2010
Business combinations are accounted for using the acquisition method. The cost of an acquisition ismeasured as the aggregate of the consideration transferred, measured at acquisition date fair value and the
F-24

PT INDOSAT Tbk AND SUBSIDIARIES
NOTES TO CONSOLIDATED FINANCIAL STATEMENTS—(Continued)as of January 1, 2010 and December 31, 2010 and 2011
and for the years ended December 31, 2009, 2010 and 2011(Expressed in millions of rupiah and thousands of U.S. dollar, except share and tariff data)
amount of any non-controlling interest in the acquiree. For each business combination, the acquirermeasures the non-controlling interest in the acquiree either at fair value or at the proportionate share of theacquiree’s identifiable net assets. Acquisition costs incurred are expensed and included in administrativeexpenses.
When the Group acquires a business, they assess the financial assets and liabilities assumed forappropriate classification and designation in accordance with the contractual terms, economic circumstancesand pertinent conditions as at the acquisition date. This includes the separation of embedded derivatives inhost contracts by the acquiree.
If the business combination is achieved in stages, the acquisition date fair value of the acquirer’spreviously held equity interest in the acquiree is remeasured to fair value at the acquisition date throughprofit or loss.
Any contingent consideration to be transferred by the acquirer will be recognized at fair value at theacquisition date. Subsequent changes to the fair value of the contingent consideration which is deemed to bean asset or liability, will be recognized in accordance with IAS 39 either in profit or loss or as a change toother comprehensive income. If the contingent consideration is classified as equity, it should not beremeasured until it is finally settled within equity. In instances where the contingent consideration does notfall within the scope of IAS 39, it is measured in accordance with the appropriate IFRS.
Goodwill is initially measured at cost being the excess of the aggregate of the consideration transferredand the amount recognized for non-controlling interest over the net identifiable assets acquired andliabilities assumed. If this consideration is lower than the fair value of the net assets of the subsidiaryacquired, the difference is recognized in profit or loss.
After initial recognition, goodwill is measured at cost less any accumulated impairment losses. For thepurpose of impairment testing, goodwill acquired in a business combination is, from the acquisition date,allocated to each of the Group’s cash-generating units that are expected to benefit from the combination,irrespective of whether other assets or liabilities of the acquiree are assigned to those units.
Where goodwill forms part of a cash-generating unit and part of the operation within that unit isdisposed of, the goodwill associated with the operation disposed of is included in the carrying amount of theoperation when determining the gain or loss on disposal of the operation. Goodwill disposed of in thiscircumstance is measured based on the relative values of the operation disposed of and the portion of thecash-generating unit retained.
Business combinations prior to January 1, 2010
In comparison to the above-mentioned requirements, the following differences applied:
Business combinations were accounted for using the purchase method. Transaction costs directlyattributable to the acquisition formed part of the acquisition costs. The non-controlling interest (formerlyknown as minority interest) was measured at the proportionate share of the acquiree’s identifiable net assets.
Business combinations achieved in stages were accounted for as separate steps. Any additionalacquired share of interest did not affect previously recognized goodwill.
F-25

PT INDOSAT Tbk AND SUBSIDIARIES
NOTES TO CONSOLIDATED FINANCIAL STATEMENTS—(Continued)as of January 1, 2010 and December 31, 2010 and 2011
and for the years ended December 31, 2009, 2010 and 2011(Expressed in millions of rupiah and thousands of U.S. dollar, except share and tariff data)
When the Companies acquired a business, embedded derivatives separated from the host contract bythe acquire were not reassessed on acquisition unless the business combination resulted in a change in theterms of the contract that significantly modified the cash flows that otherwise would have been requiredunder the contract.
Contingent consideration was recognized if, and only if, the Companies had a present obligation, theeconomic outflow was more likely than not and a reliable estimate was determinable. Subsequentadjustments to the contingent consideration were recognized as part of goodwill.
f2. Intangible assets
Intangible assets acquired separately are measured on initial recognition at cost. The cost of intangibleassets acquired in a business combination is its fair value as at the date of acquisition. Following initialrecognition, intangible assets are carried at cost less any accumulated amortization and accumulatedimpairment losses, if any.
The useful lives of intangible assets are assessed as either finite or indefinite.
Intangible assets with finite lives are amortized over the useful economic life and assessed forimpairment whenever there is an indication that the intangible asset may be impaired. The amortizationperiod and the amortization method for an intangible asset with a finite useful life is reviewed at least at theend of each reporting period. Changes in the expected useful life or the expected pattern of consumption offuture economic benefits embodied in the asset is accounted for by changing the amortization period ormethod, as appropriate, and are treated as changes in accounting estimates. The amortization expense onintangible assets with finite lives is recognized in the consolidated statements of comprehensive income inthe expense category consistent with the function of the intangible assets.
Intangible assets with indefinite useful lives are not amortized, but are tested for impairment annually,either individually or at the cash-generating unit level. The assessment of indefinite life is reviewed annuallyto determine whether the indefinite life continues to be supportable. If not, the change in useful life fromindefinite to finite is made on a prospective basis.
At the time of acquisition of a subsidiary, any intangible assets recognized are amortized using thestraight-line method based on the estimated useful lives of the assets as follows:
Years
Customer base—Prepaid . . . . . . . . . . . . . . . . . . . . . . . . . . . . . . . . . . . . . . . . 6—Post-paid . . . . . . . . . . . . . . . . . . . . . . . . . . . . . . . . . . . . . . 5
Spectrum license . . . . . . . . . . . . . . . . . . . . . . . . . . . . . . . . . . . . . . 5Brand . . . . . . . . . . . . . . . . . . . . . . . . . . . . . . . . . . . . . . . . . . . . . . . 8Patent . . . . . . . . . . . . . . . . . . . . . . . . . . . . . . . . . . . . . . . . . . . . . . . 10
Internally generated intangible assets, excluding capitalized development costs, are not capitalized andexpenditure is reflected in the consolidated statements of comprehensive income in the year in which theexpenditure is incurred.
F-26

PT INDOSAT Tbk AND SUBSIDIARIES
NOTES TO CONSOLIDATED FINANCIAL STATEMENTS—(Continued)as of January 1, 2010 and December 31, 2010 and 2011
and for the years ended December 31, 2009, 2010 and 2011(Expressed in millions of rupiah and thousands of U.S. dollar, except share and tariff data)
Gains or losses arising from derecognition of an intangible asset are measured as the differencebetween the net disposal proceeds and the carrying amount of the asset and are recognized in theconsolidated statements of comprehensive income when the asset is derecognized.
Computer Software
Software that is not an integral part of the related hardware is amortized using the straight-line methodover 5 years and assessed for impairment whenever there is indication of impairment. The Companyreviews the amortization period and the amortization method for the software at least at each financial yearend. Residual value of software is assumed to be zero.
f3. Investments in associated Companies
The Company’s investment in its associate is accounted for using the equity method. An associate is anentity in which the Company has significant influence.
Under the equity method, the investment in the associate is carried in the consolidated statements offinancial position at cost plus post acquisition changes in the Company’s share of net assets of the associate.Goodwill relating to the associate is included in the carrying amount of the investment and is neitheramortized nor individually tested for impairment.
The consolidated statements of comprehensive income reflect the share of the results of operations ofthe associate. Where there has been a change recognized directly in the equity of the associate, the Companyrecognizes its share of any changes and discloses this, when applicable, in the consolidated statements ofchanges in equity. Unrealized gains and losses resulting from transactions between the Company and theassociate are eliminated to the extent of the interest in the associate.
The share of profit of an associate is shown on the face of the consolidated statements ofcomprehensive income. This is the profit attributable to equity holders of the associate and therefore isprofit after tax and non-controlling interests in the subsidiaries of the associate.
The financial statements of the associate are prepared for the same reporting period as the Company.Where necessary, adjustments are made to bring the accounting policies in line with those of the Company.
After application of the equity method, the Company determines whether it is necessary to recognizean additional impairment loss on the Company’s investment in its associate. The Company determines ateach reporting date whether there is any objective evidence that the investment in the associate is impaired.If this is the case the Company calculates the amount of impairment as the difference between therecoverable amount of the associate and its carrying value and recognizes the amount in the ‘share of profitof an associate’ in the consolidated statements of comprehensive income.
Upon loss of significant influence over the associate, the Company measures and recognizes anyretaining investment at its fair value. Any difference between the carrying amount of the associate upon lossof significant influence and the fair value of the retaining investment and proceeds from disposal isrecognized in profit or loss.
F-27
PT INDOSAT Tbk AND SUBSIDIARIES
NOTES TO CONSOLIDATED FINANCIAL STATEMENTS—(Continued)as of January 1, 2010 and December 31, 2010 and 2011
and for the years ended December 31, 2009, 2010 and 2011(Expressed in millions of rupiah and thousands of U.S. dollar, except share and tariff data)
f4. Foreign currency translation
The consolidated financial statements are presented in rupiah, which is the Company’s functionalcurrency and the Group’s presentation currency. Transactions in foreign currencies are initially recorded atthe functional currency rate prevailing at the date of the transaction. Monetary assets and liabilitiesdenominated in foreign currencies are translated at the functional currency spot rate of exchange prevailingat the end of the reporting period. All differences are taken to the statements of comprehensive income,except for foreign exchange differences that qualify as capitalizable borrowing costs for qualifyingproperties under construction and installation. Non-monetary items that are measured in terms of historicalcost in a foreign currency are translated using the exchange rates as at the dates of the initial transactions.Non-monetary items measured at fair value in a foreign currency are translated using the exchange rates atthe date when the fair value is determined.
The functional currency and presentation currency of IFB and IIFB are in Euro, while IPBV, IMBVand ISP are in U.S. dollar. As at the end of the reporting period, the assets and liabilities of thesesubsidiaries are translated into the presentation currency of the Company at the spot rate which is theexchange rate prevailing at the end of the reporting period and their statement of comprehensive income istranslated at the average rate during the period. The resulting differences arising from the translations of thefinancial statements of IPBV, IMBV, IFB, IIFB and ISP are included in other comprehensive income andpresented as part of “Difference in Foreign Currency Translation” in the consolidated statements of changesin equity.
f5. Revenue recognition and expense recognition
f5.1 Service Revenues
Cellular
Cellular revenues arising from airtime and roaming calls are recognized based on the duration ofsuccessful calls made through the Company’s cellular network.
For post-paid subscribers, monthly service fees are recognized as the service is rendered.
For prepaid subscribers, the activation component of starter package sales is deferred and recognized asrevenue over the expected average period of the customer relationship. Sales of initial/reload vouchers arerecorded as deferred revenue and recognized as revenue upon usage of the airtime or upon expiration of theairtime.
Sales of wireless broadband modems and cellular handsets are recognized upon delivery to thecustomers.
Revenues from wireless broadband data communications are recognized based on the duration of usageor fixed monthly charges depending on the arrangement with the customers.
Cellular revenues are presented on a net basis, after compensation to value added service providers.
Customer Loyalty Program
The Company operates a customer loyalty program called “Poin Plus Plus”, which allows customers toaccumulate points for every reload and payment by the Company’s prepaid and post-paid subscribers,
F-28
PT INDOSAT Tbk AND SUBSIDIARIES
NOTES TO CONSOLIDATED FINANCIAL STATEMENTS—(Continued)as of January 1, 2010 and December 31, 2010 and 2011
and for the years ended December 31, 2009, 2010 and 2011(Expressed in millions of rupiah and thousands of U.S. dollar, except share and tariff data)
respectively. The points can then be redeemed for free telecommunication and non-telecommunicationproducts, subject to a minimum number of points being obtained. Starting July 29, 2011, the “Poin PlusPlus” program has been replaced with the “Indosat Senyum” program. Both programs have similarity innature and scheme to redeem the points, except that, under the new program, the Company no longerincludes the subscription period as a variable item in calculating the points.
Customer loyalty credits are accounted for as a separate component of the sales transaction in whichthey are granted. The consideration received at the time of reload and payment by the Company’s prepaidand post-paid subscribers, respectively, is allocated between the cellular products sold and the points issued,with the consideration allocated to the points equal to their fair value. Fair value of the points issued isdeferred and recognized as revenue when the points are redeemed or when the redemption period expires.
Dealer Commissions
Consideration in the form of sales discount given by the Company to a dealer is recognized as areduction of revenue.
If the Company receives, or will receive, an identifiable benefit in exchange for a consideration givenby the Company to a dealer, and the fair value of such benefit can be reasonably estimated, theconsideration will be recorded as a marketing expense.
Tower Leasing
Revenue from tower leasing classified as operating lease is recognized on the straight-line basis overthe lease term based on the amount stated in the agreement between the Company and the lessee.
MIDI
• Internet
Revenues arising from installation service are deferred and recognized over the expected averageperiod of the customer relationship. Revenues from monthly service fees are recognized as theservices are rendered. Revenues from usage charges are recognized monthly based on the durationof internet usage or based on the fixed amount of charges depending on the arrangement with thecustomers.
• Frame Net, World Link and Direct Link
Revenues arising from installation service are deferred and recognized over the expected averageperiod of the customer relationship. Revenues from monthly service fees are recognized as theservices are rendered.
• Satellite Operating Lease
Revenues are recognized on the straight-line basis over the lease term.
• Other MIDI services
Revenues from other MIDI services are recognized when the services are rendered.
F-29

PT INDOSAT Tbk AND SUBSIDIARIES
NOTES TO CONSOLIDATED FINANCIAL STATEMENTS—(Continued)as of January 1, 2010 and December 31, 2010 and 2011
and for the years ended December 31, 2009, 2010 and 2011(Expressed in millions of rupiah and thousands of U.S. dollar, except share and tariff data)
Fixed Telecommunications
• International Calls
Revenues from outgoing international call traffic are recognized on the basis of the actualrecorded traffic for the year and had been reported on a net basis after allocations to overseasinternational carriers.
• Fixed Wireless
Fixed wireless revenues arising from usage charges are recognized based on the duration ofsuccessful calls made through the Company’s fixed network.
For post-paid subscribers, monthly service fees are recognized as the services are rendered.
For prepaid subscribers, the activation component of starter package sales is deferred andrecognized as revenue over the expected average period life of the customer relationship.
Sale of initial/reload vouchers is recorded as deferred revenue and recognized as income uponusage of the airtime or upon expiration of the airtime.
• Fixed Line
Revenues from fixed line installations are deferred and recognized as revenue over the expectedaverage period of the customer relationship. Revenues from usage charges are recognized basedon the duration of successful calls made through the Company’s fixed network.
Interconnection Revenue
Revenues from network interconnection with other domestic and international telecommunicationscarriers are recognized monthly on the basis of the actual recorded traffic for the month.
f5.2 Interest Income
Interest income is recognized as it accrues on a time proportion basis taking into account the principalamount outstanding and the effective interest rate. Majority of interest income represents interest earnedfrom cash and cash equivalents.
Interest on finance leases and the excess of the minimum lease payment and unguaranteed residualvalue over its cost are credited to unearned lease income and amortized over the term of the lease using theeffective interest method.
f5.3 Dividends
Dividend income is recognized when the Company’s right to receive the payment is established.
f5.4 Expenses
Expenses are recognized when incurred.
F-30

PT INDOSAT Tbk AND SUBSIDIARIES
NOTES TO CONSOLIDATED FINANCIAL STATEMENTS—(Continued)as of January 1, 2010 and December 31, 2010 and 2011
and for the years ended December 31, 2009, 2010 and 2011(Expressed in millions of rupiah and thousands of U.S. dollar, except share and tariff data)
f6. Income tax
Current income tax
Current income tax assets and liabilities for the current year are measured at the amount expected to berecovered from or paid to the taxation authorities. The tax rates and tax laws used to compute the amountare those that are enacted or substantively enacted, at the reporting date in the countries where the Groupoperate and generate taxable income.
Current income tax relating to items recognized directly in equity is recognized in equity and not in theconsolidated statements of comprehensive income. Management periodically evaluates positions taken inthe tax returns with respect to situations in which applicable tax regulations are subject to interpretation andestablishes provisions where appropriate.
Deferred tax
Deferred tax is provided using the balance sheet liability method on all temporary differences at theend of the reporting year between the tax bases of assets and liabilities and their carrying amounts forfinancial reporting purposes.
Deferred tax liabilities are recognized for all taxable temporary differences except: (1) where thedeferred tax liability arises from the initial recognition of goodwill or of an asset or liability in a transactionthat is not a business combination and, at the time of the transaction, affects neither the accounting profit nortaxable profit or loss and (2) in respect of taxable temporary differences associated with investments insubsidiaries and associates, where the timing of the reversal of the temporary differences can be controlledand it is possible that the temporary differences will not reverse in the foreseeable future.
Deferred tax assets are recognized for all deductible temporary differences and carryforward of unusedtax losses, to the extent that it is probable that taxable profit will be available against which the deductibletemporary differences and carryforward of unused tax losses can be utilized except: (1) where the deferredtax asset relating to the deductible temporary difference arises from the initial recognition of an asset orliability in a transaction that is not a business combination and, at the time of the transaction, affects neitherthe accounting profit nor taxable profit or loss and (2) in respect of deductible temporary differencesassociated with investments in subsidiaries and associates, deferred tax assets are recognized only to theextent that it is probable that the temporary differences will reverse in the foreseeable future and taxableprofit will be available against which the temporary differences can be utilized.
The carrying amount of deferred tax assets is reviewed at each reporting date and reduced to the extentthat it is no longer probable that sufficient taxable profit will be available to allow all or part of the deferredtax asset to be utilized. Unrecognized deferred tax assets are reassessed at each reporting date and arerecognized to the extent that it has become probable that future taxable profits will allow the deferred taxasset to be recovered.
Deferred tax assets and liabilities are measured at the tax rates that are expected to apply in the yearwhen the asset is realized or the liability is settled, based on tax rates (and tax laws) that have been enactedor substantively enacted at the reporting date.
Deferred tax relating to items recognized outside profit or loss is recognized outside profit or loss.Deferred tax items are recognized in correlation to the underlying transaction either in other comprehensiveincome or directly in equity.
F-31

PT INDOSAT Tbk AND SUBSIDIARIES
NOTES TO CONSOLIDATED FINANCIAL STATEMENTS—(Continued)as of January 1, 2010 and December 31, 2010 and 2011
and for the years ended December 31, 2009, 2010 and 2011(Expressed in millions of rupiah and thousands of U.S. dollar, except share and tariff data)
Deferred tax assets and deferred tax liabilities are offset, if a legally enforceable right exists to set offcurrent tax assets against current income tax liabilities and the deferred taxes relate to the same taxableentity and the same taxation authority.
Sales tax
Revenues, expenses and assets are recognized net of the amount of sales tax.
The net amount of sales tax recoverable from, or payable to, the taxation authority is included as part ofreceivables or payables in the consolidated statements of financial position.
f7. Pensions and other post-employment benefits
Funded Plans
The Group have defined benefit pension plans which require contributions to be made to separatelyadministered funds. Pension costs under the Group’s defined benefit pension plans are determined byperiodic actuarial calculation using the projected-unit-credit method and applying the assumptions ondiscount rate, expected return on plan assets and annual rate of increase in compensation. Actuarial gains orlosses are recognized as income or expense when the net cumulative unrecognized actuarial gains or lossesfor each individual plan at the end of the previous reporting year exceed 10% of the present value of thedefined benefit obligation or fair value of plan assets, whichever is greater, at that date. These gains orlosses in excess of the 10% corridor are recognized on a straight-line basis over the expected averageremaining working lives of the employees.
The past service costs are recognized as an expense on a straight-line basis over the average perioduntil the benefits become vested. If the benefits have already vested, immediately following the introductionof or changes to a pension plan, past service costs are recognized immediately.
Actuarial gains or losses and past service costs from other long-term employee benefits are recognizedimmediately in the current year’s consolidated statement of income.
The defined benefit asset or liability comprises the present value of the defined benefit obligation(using a discount rate based on government bonds), less past service costs and actuarial gains and losses notyet recognized and less the fair value of plan assets out of which the obligations are to be settled. Plan assetsare assets that are held by qualifying insurance policies. Fair value is based on market price information andin the case of quoted securities, it is the published bid price. The value of any defined benefit assetrecognized is restricted to the sum of any past service costs and actuarial gains and losses not yet recognizedand the present value of any economic benefits available in the form of refunds from the plan or reductionsin the future contributions to the plan.
The Group recognizes gains or losses on the curtailment of a defined benefit plan when the curtailmentoccurs (when there is a commitment to make a material reduction in the number of employees covered by aplan or when there is an amendment of the defined benefit plan terms such that a material element of futureservices to be provided by current employees will no longer qualify for benefits, or will qualify only forreduced benefits). The gain or loss on curtailment comprises any resulting change in the fair value of planassets, change in the present value of defined benefit obligation and any related actuarial gains and lossesand past service cost that had not previously been recognized.
F-32

PT INDOSAT Tbk AND SUBSIDIARIES
NOTES TO CONSOLIDATED FINANCIAL STATEMENTS—(Continued)as of January 1, 2010 and December 31, 2010 and 2011
and for the years ended December 31, 2009, 2010 and 2011(Expressed in millions of rupiah and thousands of U.S. dollar, except share and tariff data)
Unfunded Plans
The Group also provide other post-employment benefits to their employees, such as benefits underLabor Law No.13/2003 (“Labor Law”) and post-retirement healthcare benefits. These benefits are unfunded.The accounting treatment for the unfunded plans is the same as that of the funded plans above.
f8. Financial assets
Initial recognition
Financial assets within the scope of IAS 39 are classified as financial assets at fair value through profitor loss, loans and receivables, held-to-maturity investments, available-for-sale financial assets, or asderivatives designated as hedging instruments in an effective hedge, as appropriate. The Group determinethe classification of their financial assets at initial recognition.
All financial assets are recognized initially at fair value plus transaction costs, except in the case offinancial assets which are recorded at fair value through profit or loss.
Purchases or sales of financial assets that require delivery of assets within a time frame established byregulation or convention in the marketplace (regular way trades) are recognized on the trade date, i.e., thedate that the Group commit to purchase or sell the assets.
The Group’s financial assets include cash and cash equivalents, trade and other accounts receivable,due from related parties, derivative financial instruments, finance lease receivable and other current andnon-current financial assets (quoted and unquoted financial instruments).
Subsequent measurement
The subsequent measurement of financial assets depends on their classification as follows:
• Financial assets at fair value through profit or loss
Financial assets at fair value through profit or loss include financial assets held for trading andfinancial assets designated upon initial recognition at fair value through profit or loss.
Financial assets are classified as held for trading if they are acquired for the purpose of selling orrepurchase in the near term. Derivatives, including separated embedded derivatives, are alsoclassified as held for trading unless they are designated as effective hedging instruments.
Financial assets at fair value through profit and loss are carried in the consolidated statements offinancial position at fair value with changes in fair value recognized in the statements ofcomprehensive income.
Derivatives embedded in host contracts are accounted for as separate derivatives and recorded atfair value if their economic characteristics and risks are not closely related to those of the hostcontracts and the host contracts are not held for trading or designated at fair value thorugh profitor loss. These embedded derivatives are measured at fair value with changes in fair valuerecognized in the consolidated statements of comprehensive income. Reassessment only occurs ifthere is a change in the terms of the contract that significantly modifies the cash flows that wouldotherwise be required.
F-33

PT INDOSAT Tbk AND SUBSIDIARIES
NOTES TO CONSOLIDATED FINANCIAL STATEMENTS—(Continued)as of January 1, 2010 and December 31, 2010 and 2011
and for the years ended December 31, 2009, 2010 and 2011(Expressed in millions of rupiah and thousands of U.S. dollar, except share and tariff data)
• Loans and receivables
Loans and receivables are non-derivative financial assets with fixed or determinable payments thatare not quoted in an active market. After initial measurement, such financial assets aresubsequently measured at amortized cost using the effective interest rate method (EIR), lessimpairment. Amortized cost is calculated by taking into account any discount or premium onacquisition and fees or costs that are an integral part of the EIR. The EIR amortization is includedin the consolidated statements of comprehensive income. The losses arising from impairment arerecognized in the consolidated statements of comprehensive income.
The Group’s cash and cash equivalents, trade and other accounts receivables, due from relatedparties, other current financial assets and other non-current financial assets are included in thiscategory.
Time deposits with original maturities of three months or less at the time of placement anddeposits on call are considered as “Cash Equivalents”.
Cash in banks and time deposits which are pledged as collateral for bank guarantees are notclassified as part of “Cash and Cash Equivalents”. These are presented as part of either “OtherCurrent Financial Assets” or “Other Non-current Financial Assets”.
• Held-to-maturity (HTM) investments
Non-derivative financial assets with fixed or determinable payments and fixed maturities areclassified as HTM when the Group have the positive intention and ability to hold them tomaturity. After initial measurement, HTM investments are measured at amortized cost using theEIR method, less impairment. Amortized cost is calculated by taking into account any discount orpremium on acquisition and fees or costs that are an integral part of the EIR. The EIRamortization is included in the consolidated statements of comprehensive income. The lossesarising from impairment are recognized in the consolidated statements of comprehensive income.
The Group did not have any HTM investments during the years ended December 31, 2009, 2010and 2011.
• Available-for-sale (AFS) financial assets
AFS financial assets are non-derivative financial assets that are designated as available-for-sale orare not classified in any of the three preceding categories. After initial measurement, AFSfinancial assets are measured at fair value with unrealized gains or losses recognized in equityuntil the investment is derecognized, at which time the cumulative gain or loss is recognized ordetermined to be impaired, and is reclassified from equity to comprehensive income. Interestearned on AFS financial investments is reported as intereset income using the EIR method.
The Group have the following investments classified as AFS:
- Investments in shares of stock that do not have readily determinable fair value in which theequity interest is less than 20%, and other long-term investments. These are carried at costless allowance for impairment.
- Investments in equity shares that have readily determinable fair value in which the equity interestis less than 20% and which are classified as available-for-sale, are recorded at fair value.
F-34

PT INDOSAT Tbk AND SUBSIDIARIES
NOTES TO CONSOLIDATED FINANCIAL STATEMENTS—(Continued)as of January 1, 2010 and December 31, 2010 and 2011
and for the years ended December 31, 2009, 2010 and 2011(Expressed in millions of rupiah and thousands of U.S. dollar, except share and tariff data)
f9. Financial liabilities
Initial recognition
Financial liabilities within the scope of IAS 39 are classified as financial liabilities at fair value throughprofit or loss, loans and borrowings, or as derivatives designated as hedging instruments in an effectivehedge, as appropriate. The Group determines the classification of its financial liabilities at initialrecognition.
All financial liabilities are recognized initially at fair value and, in the case of loans and borrowings,inclusive of directly attributable transaction costs.
The Group’s financial liabilities include trade accounts payables, procurement payable, accruedexpenses, loans and bonds payable, due to related parties, obligation under finance lease, derivativefinancial instruments and other current financial liabilities.
Subsequent measurement
The measurement of financial liabilities depends on their classification as follows:
• Financial liabilities at fair value through profit or loss
Financial liabilities at fair value through profit or loss include financial liabilities held for tradingand financial liabilities designated upon initial recognition as at fair value through profit or loss.
Financial liabilities are classified as held for trading if they are acquired for the purpose of sellingor repurchase in the near term. This category includes derivative financial instruments entered intoby the Company that are not designated as hedging instruments in hedge relationships as definedby IAS 39. Separated embedded derivatives are also classified as held for trading unless they aredesignated as effective hedging instruments.
Gains or losses on liabilities held for trading are recognized in the consolidated statements ofcomprehensive income.
• Loans and borrowings
After initial recognition, interest-bearing loans and borrowings are subsequently measured atamortized cost using the EIR method.
Gains and losses are recognized in the consolidated statements of comprehensive income when theliabilities are derecognized, as well as through the EIR amortization process.
Amortized cost is calculated by taking into account any discount or premium on acquisition andfees or costs that are an integral part of the EIR. The EIR amortization is included in finance costsin the statements of comprehensive income.
f10. Offsetting of financial instruments
Financial assets and financial liabilities are offset and the net amount reported in the consolidatedstatements of financial position if, and only if, there is a currently enforceable legal right to offset therecognized amounts and there is an intention to settle on a net basis, or to realize the assets and settle theliabilities simultaneously.
F-35

PT INDOSAT Tbk AND SUBSIDIARIES
NOTES TO CONSOLIDATED FINANCIAL STATEMENTS—(Continued)as of January 1, 2010 and December 31, 2010 and 2011
and for the years ended December 31, 2009, 2010 and 2011(Expressed in millions of rupiah and thousands of U.S. dollar, except share and tariff data)
f11. Fair value of financial instruments
The fair value of financial instruments that are traded in active markets at each reporting date isdetermined by reference to quoted market prices or dealer price quotations (bid price for long positions andask price for short positions), without any deduction for transaction costs. For financial instruments wherethere is no active market, fair value is determined using valuation techniques. Such techniques may includeusing recent arm’s length market transactions, reference to the current fair value of another instrument thatis substantially the same, discounted cash flow analysis or other valuation models.
Credit risk adjustment
The Company adjusts the price in the more advantageous market to reflect any differences incounterparty credit risk between instruments traded in that market and the ones being valued for financialasset positions. In determining the fair value of financial liability positions, the Company’s own credit riskassociated with the instrument is taken into account.
f12. Amortized cost of financial instruments
Amortized cost is computed using the EIR method less any allowance for impairment and principalrepayment or reduction. The calculation takes into account any premium or discount on acquisition andincludes transaction costs and fees that are an integral part of the EIR.
f13. Impairment of financial assets
The Group assess at the end of each reporting period whether there is any objective evidence that afinancial asset or a group of financial assets is impaired. A financial asset or a group of financial assets isdeemed to be impaired if, and only if, there is objective evidence of impairment as a result of one or moreevents that has occurred after the initial recognition of the asset (an incurred ‘loss event’) and that loss eventhas an impact on the estimated future cash flows of the financial asset or the group of financial assets thatcan be reliably estimated. Evidence of impairment may include indications that the debtors or a group ofdebtors are experiencing significant financial difficulty, default or delinquency in interest or principalpayments, the probability that they will enter bankruptcy or other financial reorganisation and whereobservable data indicate that there is a measurable decrease in the estimated future cash flows, such aschanges in arrears or economic conditions that correlate with defaults.
• Financial assets carried at amortized cost
For loans and receivables carried at amortized cost, the Group first assess whether objectiveevidence of impairment exists individually for financial assets that are individually significant, orcollectively for financial assets that are not individually significant. If the Group determine that noobjective evidence of impairment exists for an individually assessed financial asset, whethersignificant or not, they include the asset in a group of financial assets with similar credit riskcharacteristics and collectively assess them for impairment. Assets that are individually assessedfor impairment and for which an impairment loss is, or continues to be, recognized are notincluded in a collective assessment of impairment.
F-36

PT INDOSAT Tbk AND SUBSIDIARIES
NOTES TO CONSOLIDATED FINANCIAL STATEMENTS—(Continued)as of January 1, 2010 and December 31, 2010 and 2011
and for the years ended December 31, 2009, 2010 and 2011(Expressed in millions of rupiah and thousands of U.S. dollar, except share and tariff data)
If there is objective evidence that an impairment loss has occurred, the amount of the loss ismeasured as the difference between the asset’s carrying amount and the present value of estimatedfuture cash flows (excluding future expected credit losses that have not yet been incurred). Thepresent value of the estimated future cash flows is discounted at the financial asset’s original EIR.If a loan has a variable interest rate, the discount rate for measuring impairment loss is the currentEIR.
The carrying amount of the asset is reduced through the use of an allowance account and theamount of the loss is recognized in the consolidated statements of comprehensive income. Interestincome continues to be accrued on the reduced carrying amount based on the rate of interest usedto discount future cash flows for the purpose of measuring impairment loss. Loans andreceivables, together with the associated allowance, are written off when there is no realisticprospect of future recovery and all collateral has been realized or has been transferred to theGroup. If, in a subsequent year, the amount of the estimated impairment loss increases ordecreases because of an event occurring after the impairment was recognized, the previouslyrecognized impairment loss is increased or reduced by adjusting the allowance account. If a futurewrite-off is later recovered, the recovery is recognized in the consolidated statements ofcomprehensive income.
• AFS financial assets
In the case of equity investments classified as an AFS financial asset, objective evidence wouldinclude a significant or prolonged decline in the fair value of the investment below its cost.
Where there is objective evidence of impairment, the cumulative loss—measured as the differencebetween the acquisition cost and the current fair value, less any impairment loss on thatinvestment previously recognized in the consolidated statements of comprehensive income—isremoved from other comprehensive income to the consolidated statements of comprehensiveincome. Impairment losses on equity investments are not reversed through the profit or loss;increases in their fair value after impairment are recognized directly in other comprehensiveincome.
In the case of debt instruments classified as available-for-sale, impairment is assessed based on thesame criteria as financial assets carried at amortized cost. Future interest income is based on the reducedcarrying amount and is accrued based on the rate of interest used to discount future cash flows for thepurpose of measuring impairment loss. Such accrual is recorded as part of “Interest income” account in theconsolidated statements of comprehensive income. If, in a subsequent year, the fair value of a debtinstrument increases and the increase can be objectively related to an event occurring after the impairmentloss was recognized in the consolidated statements of comprehensive income, the impairment loss isreversed through the consolidated statements of comprehensive income.
f14. Derecognition of financial assets and liabilities
Financial assets
A financial asset (or where applicable, a part of a financial asset or part of a group of similar financialassets) is derecognized when: (1) the rights to receive cash flows from the asset have expired; or (2) the
F-37

PT INDOSAT Tbk AND SUBSIDIARIES
NOTES TO CONSOLIDATED FINANCIAL STATEMENTS—(Continued)as of January 1, 2010 and December 31, 2010 and 2011
and for the years ended December 31, 2009, 2010 and 2011(Expressed in millions of rupiah and thousands of U.S. dollar, except share and tariff data)
Group have transferred their rights to receive cash flows from the asset or have assumed an obligation topay the received cash flows in full without material delay to a third party under a “pass-through”arrangement; and either (a) the Group have transferred substantially all the risks and rewards of the asset, or(b) the Group have neither transferred nor retained substantially all the risks and rewards of the asset, buthave transferred control of the asset.
Financial liabilities
A financial liability is derecognized when the obligation under the liability is discharged or cancelledor has expired.
When an existing financial liability is replaced by another from the same lender on substantiallydifferent terms, or the terms of an existing liability are substantially modified, such an exchange ormodification is treated as a derecognition of the original liability and the recognition of a new liability, andthe difference in the respective carrying amounts is recognized in the consolidated statements ofcomprehensive income.
f15. Derivative financial instruments
The Company enters into and engages in cross currency swap, interest rate swap, currency forward andother permitted instruments, if considered necessary, for the purpose of managing its foreign exchange andinterest rate exposures emanating from the Company’s loans and bonds payable in foreign currencies. Thesederivative financial instruments, while providing effective economic hedges of specific interest rate andforeign exchange risks under the Company’s financial risk management objectives and policies, do not meetthe criteria for hedge accounting as provided in IAS 39 and are initially recognized at fair value on the datethe derivative contract is entered into and are subsequently re-measured at fair value. Derivatives are carriedas assets when the fair value is positive and as liabilities when the fair value is negative.
Any gains or losses arising from changes in fair value on derivatives during the year, which are enteredinto as economic hedges that do not qualify for hedge accounting, are taken directly to the consolidatedstatements of comprehensive income.
Derivative assets and liabilities are presented under current assets and liabilities, respectively.Embedded derivative is presented with the host contract on the consolidated statements of financial positionwhich represents an appropriate presentation of overall future cash flows for the instrument taken as awhole.
The net changes in fair value of derivative instruments, swap cost or income, termination cost orincome, and settlement of derivative instruments are credited (charged) to “Gain (Loss) on Change in FairValue of Derivatives—Net”, which is presented under Other Income (Expenses) in the consolidatedstatements of comprehensive income.
f16. Property and equipment
Property and equipment are stated at cost (which includes certain capitalized borrowing costs incurredduring the construction phase), less accumulated depreciation, amortization and impairment in value.Depreciation and amortization of property and equipment is computed using the straight-line method basedon the estimated useful lives of the assets.
F-38
PT INDOSAT Tbk AND SUBSIDIARIES
NOTES TO CONSOLIDATED FINANCIAL STATEMENTS—(Continued)as of January 1, 2010 and December 31, 2010 and 2011
and for the years ended December 31, 2009, 2010 and 2011(Expressed in millions of rupiah and thousands of U.S. dollar, except share and tariff data)
Property and equipment acquired in exchange for a non-monetary asset or for a combination ofmonetary and non-monetary assets are measured at fair values unless:
(i) the exchange transaction lacks commercial substance, or
(ii) the fair value of neither the assets received nor the assets given up can be measured reliably.
The acquired assets are measured this way even if the Group cannot immediately derecognize theassets given up. If the acquired assets cannot be reliably measured at fair value, their value is measured atthe carrying amount of the assets given up.
An item of property and equipment is derecognized upon disposal or when no future economic benefitsare expected from its use or disposal. Any gain or loss arising on derecognition of the asset (calculated asthe difference between the net disposal proceeds and the carrying amount of the asset) is included in theconsolidated statements of comprehensive income when the asset is derecognized.
The estimated useful lives of the assets are as follows:
Years
Landrights . . . . . . . . . . . . . . . . . . . . . . . . . . . . . . . . . . . . . . . . . . . . . . . . . . . . . . . . . . . . 50Exchange and network assets . . . . . . . . . . . . . . . . . . . . . . . . . . . . . . . . . . . . . . . . . . . . . 3 to 15Subscribers’ apparatus and other equipment . . . . . . . . . . . . . . . . . . . . . . . . . . . . . . . . . 3 to 15Buildings and building & leasehold improvements . . . . . . . . . . . . . . . . . . . . . . . . . . . . 20 and 3 to 25
Personnel costs which are directly related to the development, construction and installation of propertyand equipment are capitalized as part of the cost of such assets.
The cost of maintenance and repairs is charged to income as incurred. Significant renewals andbetterments which enhance the asset’s condition on its initial performance, are capitalized. When propertiesare retired or otherwise disposed of, their costs and the related accumulated depreciation are derecognizedfrom the accounts, and any resulting gains or losses are recognized in the consolidated statements ofcomprehensive income for the year.
Properties under construction and installation are stated at cost. This includes cost of construction,equipment, capitalizable borrowing costs and other direct costs. Property under construction is notdepreciated until such time that the relevant asset is completed and available for its intended use.
The residual values, useful lives and methods of depreciation and amortization of property andequipment are reviewed and adjusted prospectively, if appropriate, at each financial year end.
f17. Borrowing costs
Borrowing costs are capitalized if they are directly attributable to the acquisition, construction orproduction of an asset that necessarily takes a substantial period of time to get ready for its intended use arecapitalized as part of the cost of the asset. Capitalization of borrowing costs commences when the activitiesnecessary to prepare the asset for its intended use are in progress and expenditures and borrowing costs arebeing incurred. Borrowing costs include interest charges and other costs incurred in connection with theborrowing of funds, as well as exchange differences arising from foreign currency borrowings used to
F-39

PT INDOSAT Tbk AND SUBSIDIARIES
NOTES TO CONSOLIDATED FINANCIAL STATEMENTS—(Continued)as of January 1, 2010 and December 31, 2010 and 2011
and for the years ended December 31, 2009, 2010 and 2011(Expressed in millions of rupiah and thousands of U.S. dollar, except share and tariff data)
finance these projects, to the extent that they are regarded as an adjustment to interest costs (estimatedquarterly by capping the exchange differences taken as borrowing costs at the amount of borrowing costs onthe functional currency equivalent borrowings).
f18. Decommissioning liabilities
The Group is legally required under various lease agreements to dismantle installations in leased sitesand restore such sites to their original condition at the end of the lease contract term.
The amount of asset retirement obligations is accreted, and such accretion is recognized as interestexpense.
f19. Leases
Group as a lessee
A finance lease that transfers to the Group substantially all the risks and benefits incidental toownership of the leased item, is capitalized at the commencement of the lease at the fair value of the leasedproperty or, if lower, at the present value of the minimum lease payments. Lease payments are apportionedbetween finance charges and reduction of the lease liability so as to achieve a constant rate of interest on theremaining balance of the liability. Finance charges are recognized as part of finance costs in theconsolidated statements of comprehensive income.
A leased asset is depreciated over the useful life of the asset. However, if there is no reasonablecertainty that the Group will obtain ownership by the end of the lease term, the asset is depreciated over theshorter of the estimated useful life of the asset and the lease term.
Current Portion of Obligation under Finance Lease is presented as part of Other Current FinancialLiabilities.
Operating lease payments are recognized as an operating expense in the consolidated statements ofcomprehensive income on a straight-line basis over the lease term.
Group as a lessor
A lease in which the Group does not transfer substantitally all the risks and benefits of the ownership ofan asset is classified as an operating lease. Initial direct costs incurred in negotiating an operating lease areadded to the carrying amount of the leased asset and recognized over the lease term on the same basis asrental income. Contingent rents are recognized as revenue in the period which they are earned.
A lease in which the Group transfers substantially all the risks and benefits of the ownership of an assetis classified as a finance lease. Leased asset is recognized as asset held under a finance lease in theconsolidated statements of financial position and presented as a receivable at an amount equal to the netinvestment in the lease. Selling profit or loss is recognized in the period, in accordance with the policyfollowed by the Group for outright sales. Costs incurred by the Group in connection with negotiating andarranging a lease are recognized as an expense when the selling profit is recognized.
The current portion of Finance Lease Receivables is presented as part of Other Current FinancialAssets—Net.
F-40

PT INDOSAT Tbk AND SUBSIDIARIES
NOTES TO CONSOLIDATED FINANCIAL STATEMENTS—(Continued)as of January 1, 2010 and December 31, 2010 and 2011
and for the years ended December 31, 2009, 2010 and 2011(Expressed in millions of rupiah and thousands of U.S. dollar, except share and tariff data)
f20. Inventories
Inventories, which mainly consist of SIM cards, broadband modems, starter packs, cellular handsetsand pulse reload vouchers are valued at the lower of cost or net realizable value. Cost is determined usingthe weighted-average method. Net realizable value is the estimated selling price in the ordinary course ofbusiness less the estimated costs necessary to make the sale.
f21. Prepaid expenses
Prepaid expenses, which mainly consist of frequency fee, rentals, upfront fee of 3G and BWA licensesand insurance are expensed as the related asset is utilized. The non-current portions of prepaid rentals andupfront fee of 3G and BWA licenses are shown as part of “Long-term Prepaid Rentals—Net of CurrentPortion” and “Long-term Prepaid Licenses—Net of Current Portion”, respectively.
f22. Impairment of non-financial assets
Property and equipment
The Group assess periodically whether there is an indication that an asset may be impaired. If any suchindication exists or when annual impairment testing for an asset is required, the Group estimates the asset’srecoverable amount. An asset’s recoverable amount is the higher of such asset’s or cash-generating unit’sfair value less costs to sell and its value in use and is determined for an individual asset, unless the assetdoes not generate cash inflows that are largely independent from those of other assets or groups of assets.When the carrying amount of an asset or cash-generating unit exceeds its recoverable amount, the asset isconsidered impaired and is written down to its recoverable amount. In assessing the value in use, theestimated future cash flows are discounted to their present value using a pre-tax discount rate that reflectscurrent market assessments of the time value of money and the risks specific to the asset. In determining thefair value less costs to sell, recent market transactions are taken into account, if available. If no suchtransactions can be identified, an appropriate valuation model is used. These calculations are corroboratedby valuation multiples, quoted share prices for publicly traded subsidiaries or other available fair valueindicators. Impairment losses of continuing operations are recognized in the consolidated statements ofcomprehensive income.
For assets, excluding goodwill, an assessment is made periodically as to whether there is any indicationthat previously recognized impairment losses may no longer exist or may have decreased. If such indicationexists, the Group estimates the asset’s or cash-generating unit recoverable amount. A previously recognizedimpairment loss is reversed only if there has been a change in the assumptions used to determine the asset’srecoverable amount since the last impairment loss was recognized. The reversal is limited to so that thecarrying amount of the asset does not exceed its recoverable amount, nor exceed the carrying amount thatwould have been determined, net of depreciation, had no impairment loss been recognized for the asset inprior years. Such reversal is recognized in the consolidated statements of comprehensive income.
F-41
PT INDOSAT Tbk AND SUBSIDIARIES
NOTES TO CONSOLIDATED FINANCIAL STATEMENTS—(Continued)as of January 1, 2010 and December 31, 2010 and 2011
and for the years ended December 31, 2009, 2010 and 2011(Expressed in millions of rupiah and thousands of U.S. dollar, except share and tariff data)
The following assets have specific characteristics for impairment testing:
Goodwill and other intangible assets
Goodwill is tested for impairment periodically and when circumstances indicate that the carrying valuemay be impaired. Impairment is determined for goodwill by assessing the recoverable amount of each cash-generating unit (or group of cash-generating units) to which the goodwill related. When the recoverableamount of the cash-generating unit is less than its carrying amount, an impairment loss is recognized.Impairment losses relating to goodwill cannot be reversed in future periods.
Intangible assets with indefinite useful lives are tested for impairment annually either individually or atthe cash-generating unit level, as appropriate, and when circumstances indicate that the carrying value maybe impaired.
f23. Provisions
Provisions are recognized when the Group have a present obligation (legal or constructive) as a resultof a past event, it is probable that an outflow of resources embodying economic benefits will be required tosettle the obligation, and a reliable estimate can be made of the amount of the obligation. When the Groupexpect some or all of provisions to be reimbursed, for example under an insurance contract, thereimbursement is recognized as a separate asset but only when the reimbursement is virtually certain. Theexpense relating to any provision is presented in the consolidated statements of comprehensive income netof any reimbursement.
f24. Operating segment
An operating segment is a component of entity that engages in business activities from which it mayearn revenues and incur expenses (including revenues and expenses relating to transactions with othercomponents of the same entity), whose operating results are reviewed regularly by the entity’s chiefoperating decision maker (Board of Directors) to make decisions about resources to be allocated to thesegment and assess its performance and for which discrete financial information is available.
f25. Basic and diluted earnings per share / ADS
Basic earnings per share is computed by dividing profit for the year attributable to ordinary owners ofthe Company by the weighted-average number of ordinary shares outstanding during the year (Note 30).
Basic earnings per ADS attributable to owners of the company is computed by multiplying basicearnings per share attributable to owners of the company by 50, which is equal to the number of shares perADS.
Diluted earnings per share is computed by dividing profit for the year attributable to ordinary owners ofthe Company (after adjusting profit or loss effect related to dilutive potential ordinary shares) by theweighted average number of ordinary shares outstanding during the year plus the weighted average numberof ordinary shares that would be issued on conversion of all potentially dilutive ordinary shares.
F-42

PT INDOSAT Tbk AND SUBSIDIARIES
NOTES TO CONSOLIDATED FINANCIAL STATEMENTS—(Continued)as of January 1, 2010 and December 31, 2010 and 2011
and for the years ended December 31, 2009, 2010 and 2011(Expressed in millions of rupiah and thousands of U.S. dollar, except share and tariff data)
3. MANAGEMENT’S USE OF JUDGMENTS, ESTIMATES AND ASSUMPTIONS
The preparation of the Group’s consolidated financial statements requires management to make judgments,estimates and assumptions that affect the reported amounts of revenues, expenses, assets and liabilities, and thedisclosure of contingent liabilities, at the end of the reporting period. However, uncertainty about theseassumptions and estimates could result in outcomes that require a material adjustment to the carrying amount ofthe asset or liability affected in future years.
a. Judgments
In the process of applying the Company’s accounting policies, management has made the followingjudgments, apart from those including estimations and assumptions, which have the most significant effecton the amounts recognized in the consolidated financial statements:
• Determination of functional currency
The functional currencies of the entities under the Company are the currency of the primaryeconomic environment in which each entity operates. It is the currency that mainly influences therevenue and cost of rendering services.
• Leases
The Group has various lease agreements whereas the Group acts as lessor or lessee in respect ofcertain property and equipment. The Group evaluates whether significant risks and rewards ofownership of the leased assets are transferred based on IAS 17, “Leases”, which requires theGroup to make judgments and estimates of transfer of risks and rewards related to the ownershipof the assets.
In 2006, the Company was granted a license to use 2.1 GHz radio frequency spectrum by theMinistry of Communications and Information and Technology (“MOCIT”). The Company wasobliged to, among others, pay upfront fee and annual radio frequency fee for 10 years (Note 33k).The upfront fee is recorded as part of Long-term Prepaid Licenses for the non-current portion andPrepaid Expenses for the current portion, and amortized over the 10-year license term using thestraight-line method.
In 2009, the Company received additional 3G license, and IMM was granted an operating licensefor “Packet Switched” local telecommunications network using 2.3 GHz radio frequency spectrumof Broadband Wireless Access (“BWA”). The Company and IMM were obliged to, among others,pay upfront fee and annual radio frequency fee for 10 years (Note 33k). The upfront fee isrecorded as part of Long-term Prepaid Licenses for the non-current portion and Prepaid Expensesfor the current portion, and amortized over the 10-year license term using the straight-line method.
Management believes, as supported by written confirmation from the DGPT, that the 3G andBWA licenses may be returned at any time without any financial obligation to pay the remainingoutstanding annual radio frequency fees (i.e., the license arrangement does not transfersubstantially all the risks and rewards incidental to ownership). Accordingly, the Company andIMM recognize the prepaid annual radio frequency fee as operating lease expense, amortizedusing the straight-line method over the term of the rights to operate the 3G and BWA licenses.Management evaluates its plan to continue to use the licenses on an annual basis.
F-43

PT INDOSAT Tbk AND SUBSIDIARIES
NOTES TO CONSOLIDATED FINANCIAL STATEMENTS—(Continued)as of January 1, 2010 and December 31, 2010 and 2011
and for the years ended December 31, 2009, 2010 and 2011(Expressed in millions of rupiah and thousands of U.S. dollar, except share and tariff data)
• Impairment of non-financial assets
An impairment exists when the carrying value of an asset or cash-generating unit exceeds itsrecoverable amount, which is the higher of its fair value less costs to sell and its value in use. Thefair value less costs to sell calculation is based on available data from binding sales transactions inarm’s length transactions of similar assets or observable market prices less incremental costs fordisposing of the assets. The value in use calculation is based on a discounted cash flow model.The cash flows are derived from the budget for the next five years and do not include restructuringactivities that the Group is not yet committed to or significant future investments that will enhancethe asset’s performance of the CGU being tested. The recoverable amount is most sensitive to thediscount rate used for the discounted cash flow model as well as the expected future cash-inflowsand the growth rate used for extrapolation purposes.
• Exchange of asset transactions
During 2010 and 2011, the Group entered into several contracts for the exchange of assets forcertain of its existing cellular technical equipment with third party supplier. For the exchange ofassets transactions, the Group evaluates whether the transactions contain commercial substancebased on IAS 16, which requires the Group to make judgments and estimates of the future cashflow and the fair value of the assets received and given up as a result of the transactions.Management consider the exchange of assets transactions to have met the criteria of commercialsubstance, however the fair values of neither the assets received nor the assets given up could bemeasured reliably, hence, their values were measured at the carrying amounts of the assets givenup.
b. Estimates and Assumptions
The key assumptions concerning the future and other key sources of estimation uncertainty at the endof the reporting period that have a significant risk of causing a material adjustment to the carrying amountsof assets and liabilities within the next financial year are discussed below:
• Determination of fair values of financial assets and financial liabilities
Where the fair value of financial assets and financial liabilities recorded in the statements offinancial position cannot be derived from active markets, their fair value is determined usingvaluation techniques including the discounted cash flow model. The inputs to these models aretaken from observable markets where possible, but where this is not feasible, a degree of judgmentis required in establishing fair values. The judgments include considerations of inputs such asliquidity risk, credit risk and volatility. Changes in assumptions about these factors could affectthe reported fair value of financial instruments.
• Estimating useful lives of property and equipment and intangible assets
The Group estimate the useful lives of their property and equipment and intangible assets based onexpected asset utilization as anchored on business plans and strategies that also consider expectedfuture technological developments and market behavior. The estimation of the useful lives ofproperty and equipment is based on the Group’s collective assessment of industry practice,internal technical evaluation and experience with similar assets. The estimated useful lives arereviewed periodically and are updated if expectations differ from previous estimates due to
F-44

PT INDOSAT Tbk AND SUBSIDIARIES
NOTES TO CONSOLIDATED FINANCIAL STATEMENTS—(Continued)as of January 1, 2010 and December 31, 2010 and 2011
and for the years ended December 31, 2009, 2010 and 2011(Expressed in millions of rupiah and thousands of U.S. dollar, except share and tariff data)
physical wear and tear, technical or commercial obsolescence and legal or other limitations on theuse of the assets. It is possible, however, that future results of operations could be materiallyaffected by changes in the estimates brought about by changes in the factors mentioned above.
The amounts and timing of recorded expenses for any year will be affected by changes in thesefactors and circumstances. A reduction in the estimated useful lives of the Group’s property andequipment will increase the recorded operating expenses and decrease non-current assets. Anextension in the estimated useful lives of the Group’s property and equipment will decrease therecorded operating expenses and increase non-current assets.
• Goodwill and intangible assets
The Company accounts for the acquired businesses using the acquisition method which requiresextensive use of accounting estimates and judgments to allocate the purchase price to the fairmarket values of the acquiree’s identifiable assets and liabilities at the acquisition date. Anyexcess in the purchase price over the estimated fair market values of the net assets acquired isrecorded as goodwill in the consolidated statements of financial position. Thus, the numerousjudgments made in estimating the fair market value to be assigned to the acquiree’s assets andliabilities can materially affect the Company’s financial performance.
• Realizability of deferred income tax assets
The Group review the carrying amounts of deferred income tax assets at the end of each reportingdate and reduce these to the extent that it is no longer probable that sufficient taxable income willbe available to allow all or part of the deferred income tax assets to be utilized. The Group’sassessment on the recognition of deferred income tax assets on deductible temporary differencesis based on the level and timing of forecasted taxable income of the subsequent reporting periods.This forecast is based on the Group’s past results and future expectations on revenues andexpenses as well as future tax planning strategies. However, there is no assurance that sufficienttaxable income will be generated to allow all or part of deferred income tax assets to be utilized.
• Estimating allowance for impairment of receivables
If there is an objective evidence that an impairment loss has been incurred in trade receivables, theGroup estimate the allowance for impairment losses related to their trade receivables that arespecifically identified as doubtful for collection. The level of allowance is evaluated bymanagement on the basis of factors that affect the collectibility of the accounts. In these cases, theGroup use judgment based on the best available facts and circumstances, including but not limitedto, the length of the Group’s relationship with the customers and the customers’ credit status basedon third-party credit reports and known market factors, to record specific reserves for customersagainst amounts due in order to reduce the Group’s receivables to amounts that they expect tocollect. These specific reserves are re-evaluated and adjusted as additional information receivedaffect the amounts estimated.
In addition to specific allowance against individually significant receivables, the Group alsoassess a collective impairment allowance against credit exposure of their debtors which aregrouped based on common credit characteristics, which, although not specifically identified asrequiring a specific allowance, have a greater risk of default than when the receivables wereoriginally granted to debtors. This collective allowance is based on historical loss experience
F-45

PT INDOSAT Tbk AND SUBSIDIARIES
NOTES TO CONSOLIDATED FINANCIAL STATEMENTS—(Continued)as of January 1, 2010 and December 31, 2010 and 2011
and for the years ended December 31, 2009, 2010 and 2011(Expressed in millions of rupiah and thousands of U.S. dollar, except share and tariff data)
using various factors such as historical performance of the debtors within the collective group,deterioration in the markets in which the debtors operate, and identified structural weaknesses ordeterioration in the cash flows of debtors.
• Estimation of pension cost and other employee benefits
The cost of defined benefit plan and present value of the pension obligation are determined usingthe projected-unit-credit method. Actuarial valuation includes making various assumptions whichconsist, among other things, discount rates, expected rates of return on plan assets, rates ofcompensation increases and mortality rates. Actual results that differ from the Group’sassumptions are recognized as income or expense when the net cumulative unrecognized actuarialgains and losses at the end of the previous reporting year exceed 10% of the higher of the presentvalue of defined benefit obligation and the fair value of plan assets at that date. Due to complexityof valuation, the underlying assumptions and their long-term nature, a defined benefit obligation ishighly sensitive to changes in assumptions.
While the Group believe that their assumptions are reasonable and appropriate, significantdifferences in the Group’s actual experience or significant changes in their assumptions maymaterially affect the costs and obligations of pension and other long-term employee benefits. Allassumptions are reviewed at each reporting date.
• Decommissioning liabilities
Decommissioning liabilities are recognized in the year in which they are incurred if a reasonableestimate of fair value can be made. The recognition of the obligations requires an estimation of thecost to restore / dismantle on a per location basis and is based on the best estimate of theexpenditure required to settle the obligation at the future restoration/dismantlement date,discounted using a pre-tax rate that reflects the current market assessment of the time value ofmoney and, where appropriate, the risk specific to the liability.
• Revenue recognition
The Company’s revenue recognition policies require the use of estimates and assumptions thatmay affect the reported amounts of revenues and receivables.
The Company’s agreements with domestic and foreign carriers for inbound and outbound trafficsubject to settlements require traffic reconciliations before actual settlement is done, which maynot be the actual volume of traffic as measured by Company. Initial recognition of revenues isbased on observed traffic adjusted by normal experience adjustments, which historically are notmaterial to the consolidated statements of comprehensive income. Differences between theamounts initially recognized and the actual settlements are taken up in the account uponreconciliation. However, there is no assurance that the use of such estimates will not result inmaterial adjustments in future periods.
The Group recognize revenues from installation and activation related fees and the correspondingcosts over the expected average periods of customer relationship for cellular, MIDI and fixedtelecommunication services. The Group estimate the expected average period of customerrelationship based on the most recent churn-rate analysis.
F-46

PT INDOSAT Tbk AND SUBSIDIARIES
NOTES TO CONSOLIDATED FINANCIAL STATEMENTS—(Continued)as of January 1, 2010 and December 31, 2010 and 2011
and for the years ended December 31, 2009, 2010 and 2011(Expressed in millions of rupiah and thousands of U.S. dollar, except share and tariff data)
• Uncertain tax exposure
In certain circumstances, the Group may not be able to determine the exact amount of their currentor future tax liabilities due to ongoing investigations by, or negotiations with, the taxationauthority. Uncertainties exist with respect to the interpretation of complex tax regulations and theamount and timing of future taxable income. In determining the amount to be recognized inrespect of an uncertain tax liability, the Group apply similar considerations as they would use indetermining the amount of a provision to be recognized in accordance with IAS 37 Provisions,Contingent Liabilities and Contingent Assets. The Group make an analysis of all tax positionsrelated to income taxes to determine if a tax liability for unrecognized tax benefit should berecognized.
As of December 31, 2011, the Company is subject to tax audit for tax year 2010.
The Group presents interest and penalties for the underpayment of income tax, if any, in IncomeTax Expense in the consolidated statements of comprehensive income.
4. CASH AND CASH EQUIVALENTS
This account consists of the following:
December 31,
January 1, 2010 2010 2011
Cash on hand (including US$10 on January 1, 2010, US$12 onDecember 31, 2010 and US$13 on December 31, 2011) . . . . . . . . . . . 1,581 1,792 1,580
Cash in banksRelated parties (Note 29) (including US$4,365 on January 1, 2010,
US$4,726 on December 31,2010 and US$3,805 onDecember 31, 2011) . . . . . . . . . . . . . . . . . . . . . . . . . . . . . . . . . . . 91,783 116,107 93,880
Third parties (including US$9,759 on January 1, 2010, US$12,885on December 31, 2010 and US$13,506 on December 31,2011) . . . . . . . . . . . . . . . . . . . . . . . . . . . . . . . . . . . . . . . . . . . . . . . 131,106 165,588 209,519
222,889 281,695 303,399
Time deposits and deposits on callRelated parties (Note 29) (including US$265 on January 1, 2010,
US$81,705 on December 31, 2010 and US$11,115 onDecember 31, 2011) . . . . . . . . . . . . . . . . . . . . . . . . . . . . . . . . . . . 1,976,259 1,499,544 884,080
Third parties (including US$22,725 on January 1, 2010,US$12,454 on December 31, 2010 and US$24,917 onDecember 31, 2011) . . . . . . . . . . . . . . . . . . . . . . . . . . . . . . . . . . . 635,270 292,239 1,035,147
2,611,529 1,791,783 1,919,227
Total . . . . . . . . . . . . . . . . . . . . . . . . . . . . . . . . . . . . . . . . . . . . . . . . . . . . . 2,835,999 2,075,270 2,224,206
F-47

PT INDOSAT Tbk AND SUBSIDIARIES
NOTES TO CONSOLIDATED FINANCIAL STATEMENTS—(Continued)as of January 1, 2010 and December 31, 2010 and 2011
and for the years ended December 31, 2009, 2010 and 2011(Expressed in millions of rupiah and thousands of U.S. dollar, except share and tariff data)
Time deposits and deposits on call denominated in rupiah earned interest at annual rates ranging from2.50% to 14.50% in 2009, from 2.50% to 10.00% in 2010 and from 2.50% to 9.75% in 2011, while thosedenominated in U.S. dollar earned interest at annual rates ranging from 0.001% to 6.00% in 2009, from 0.05% to4.75% in 2010 and from 0.01% to 2.75% in 2011.
The interest rates on deposits on call and time deposits in related parties are comparable to those offered bythird parties.
5. ACCOUNTS RECEIVABLE—TRADE
This account consists of the following:
December 31,
January 1, 2010 2010 2011
Related parties (Note 29)Telkom (including US$75 on January 1, 2010, US$55 on
December 31, 2010 and US$51 on December 31, 2011) . . . . . . . 31,724 56,108 19,977Others (including US$6,322 on January 1, 2010, US$7,764 on
December 31, 2010 and US$8,085 on December 31, 2011) . . . . . 151,726 214,038 284,667
Sub-total . . . . . . . . . . . . . . . . . . . . . . . . . . . . . . . . . . . . . . . . . . . . . . 183,450 270,146 304,644Less allowance for impairment . . . . . . . . . . . . . . . . . . . . . . . . . . . . . 57,538 47,640 47,107
Net . . . . . . . . . . . . . . . . . . . . . . . . . . . . . . . . . . . . . . . . . . . . . . . . . . . 125,912 222,506 257,537
Third partiesLocal companies (including US$15,291 on January 1, 2010,
US$13,956 on December 31, 2010 and US$16,593 onDecember 31, 2011) . . . . . . . . . . . . . . . . . . . . . . . . . . . . . . . . . . . 463,069 628,224 792,857
Overseas international carriers (US$98,042 on January 1, 2010,US$93,755 on December 31, 2010 and US$66,532 onDecember 31, 2011) . . . . . . . . . . . . . . . . . . . . . . . . . . . . . . . . . . . 921,595 842,954 603,309
Post-paid subscribers from:Cellular . . . . . . . . . . . . . . . . . . . . . . . . . . . . . . . . . . . . . . . . . . . 252,008 255,973 254,565Fixed telecommunication . . . . . . . . . . . . . . . . . . . . . . . . . . . . . 26,813 47,239 22,345
Sub-total . . . . . . . . . . . . . . . . . . . . . . . . . . . . . . . . . . . . . . . . . . . . . . 1,663,485 1,774,390 1,673,076Less allowance for impairment . . . . . . . . . . . . . . . . . . . . . . . . . . . . . 404,272 448,470 489,544
Net . . . . . . . . . . . . . . . . . . . . . . . . . . . . . . . . . . . . . . . . . . . . . . . . . . . 1,259,213 1,325,920 1,183,532
Total . . . . . . . . . . . . . . . . . . . . . . . . . . . . . . . . . . . . . . . . . . . . . . . . . . . . . 1,385,125 1,548,426 1,441,069
F-48

PT INDOSAT Tbk AND SUBSIDIARIES
NOTES TO CONSOLIDATED FINANCIAL STATEMENTS—(Continued)as of January 1, 2010 and December 31, 2010 and 2011
and for the years ended December 31, 2009, 2010 and 2011(Expressed in millions of rupiah and thousands of U.S. dollar, except share and tariff data)
The aging schedule of the accounts receivable—trade is as follows:
January 1, 2010 December 31, 2010 December 31, 2011
Number of Months Outstanding AmountPercentage
(%) AmountPercentage
(%) AmountPercentage
(%)
Related parties0 - 6 months . . . . . . . . . . . . . . . . . . . . . . 121,522 66.24 201,256 74.50 196,642 64.557 - 12 months . . . . . . . . . . . . . . . . . . . . . 27,207 14.83 47,973 17.76 35,252 11.5713 - 24 months . . . . . . . . . . . . . . . . . . . . 2,661 1.45 6,913 2.56 64,498 21.17Over 24 months . . . . . . . . . . . . . . . . . . . 32,060 17.48 14,004 5.18 8,252 2.71
Total . . . . . . . . . . . . . . . . . . . . . . . . . . . 183,450 100.00 270,146 100.00 304,644 100.00
Third parties0 - 6 months . . . . . . . . . . . . . . . . . . . . . . 820,082 49.30 787,871 44.40 947,089 56.617 - 12 months . . . . . . . . . . . . . . . . . . . . . 287,533 17.28 279,806 15.77 208,218 12.4413 - 24 months . . . . . . . . . . . . . . . . . . . . 285,407 17.16 308,808 17.40 255,648 15.28Over 24 months . . . . . . . . . . . . . . . . . . . 270,463 16.26 397,905 22.43 262,121 15.67
Total . . . . . . . . . . . . . . . . . . . . . . . . . . . 1,663,485 100.00 1,774,390 100.00 1,673,076 100.00
As of January 1, 2010 and December 31, 2010 and 2011, the Group have no “past due and not impaired”accounts receivable.
The movements in the allowance for impairment on accounts receivable—trade are as follows:
TotalRelatedParties
ThirdParties
January 1, 2010Balance at beginning of year . . . . . . . . . . . . . . . . . . . . . . . . . . . . . . . . . . . . . . . . . . . 496,163 69,444 426,719Provision (Note 26) . . . . . . . . . . . . . . . . . . . . . . . . . . . . . . . . . . . . . . . . . . . . . . . . . . 98,042 6,635 91,407Write-offs . . . . . . . . . . . . . . . . . . . . . . . . . . . . . . . . . . . . . . . . . . . . . . . . . . . . . . . . . (101,586) (9,398) (92,188)Net effect of foreign exchange adjustment . . . . . . . . . . . . . . . . . . . . . . . . . . . . . . . . (29,560) (9,143) (20,417)Deduction due to liquidation of SMM (Note 1b) . . . . . . . . . . . . . . . . . . . . . . . . . . . (1,249) — (1,249)
Balance at end of year . . . . . . . . . . . . . . . . . . . . . . . . . . . . . . . . . . . . . . . . . . . . . . . . 461,810 57,538 404,272
Individual impairment . . . . . . . . . . . . . . . . . . . . . . . . . . . . . . . . . . . . . . . . . . . . . . . . 162,967 52,137 110,830Collective impairment . . . . . . . . . . . . . . . . . . . . . . . . . . . . . . . . . . . . . . . . . . . . . . . . 298,843 5,401 293,442
Total . . . . . . . . . . . . . . . . . . . . . . . . . . . . . . . . . . . . . . . . . . . . . . . . . . . . . . . . . . . . . 461,810 57,538 404,272
Gross amount of receivables, individually impaired, before deducting anyindividually assessed impairment allowance . . . . . . . . . . . . . . . . . . . . . . . . . . . . 790,213 63,391 726,822
F-49
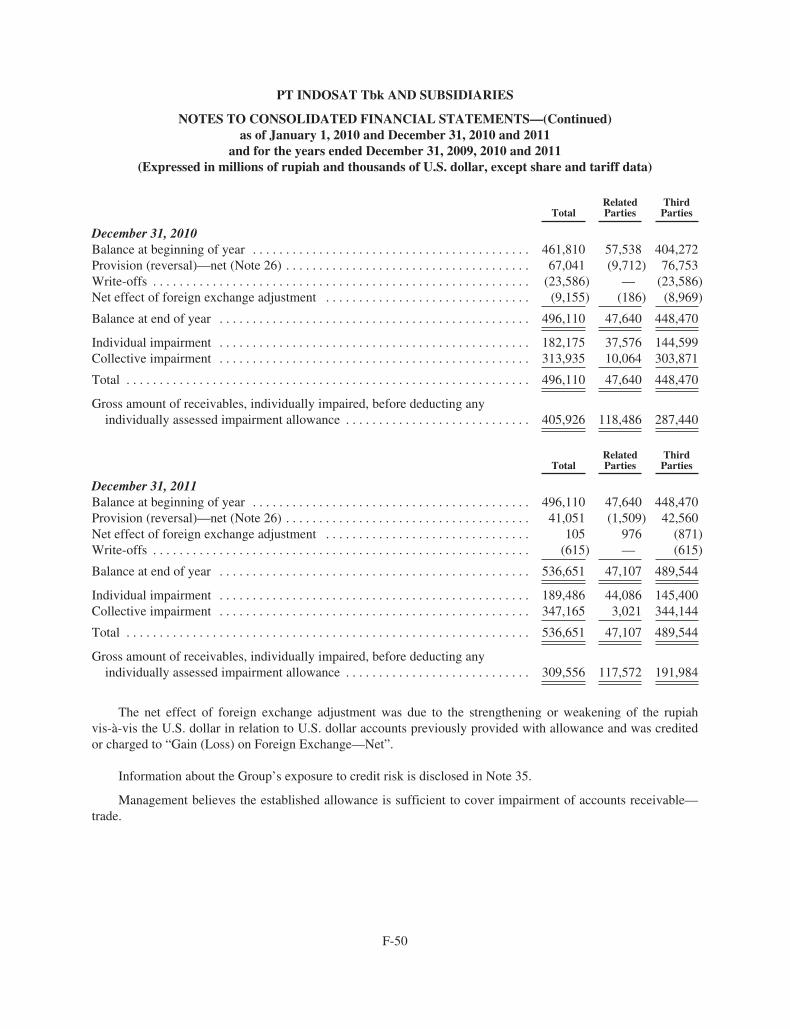
PT INDOSAT Tbk AND SUBSIDIARIES
NOTES TO CONSOLIDATED FINANCIAL STATEMENTS—(Continued)as of January 1, 2010 and December 31, 2010 and 2011
and for the years ended December 31, 2009, 2010 and 2011(Expressed in millions of rupiah and thousands of U.S. dollar, except share and tariff data)
TotalRelatedParties
ThirdParties
December 31, 2010Balance at beginning of year . . . . . . . . . . . . . . . . . . . . . . . . . . . . . . . . . . . . . . . . . . 461,810 57,538 404,272Provision (reversal)—net (Note 26) . . . . . . . . . . . . . . . . . . . . . . . . . . . . . . . . . . . . . 67,041 (9,712) 76,753Write-offs . . . . . . . . . . . . . . . . . . . . . . . . . . . . . . . . . . . . . . . . . . . . . . . . . . . . . . . . . (23,586) — (23,586)Net effect of foreign exchange adjustment . . . . . . . . . . . . . . . . . . . . . . . . . . . . . . . (9,155) (186) (8,969)
Balance at end of year . . . . . . . . . . . . . . . . . . . . . . . . . . . . . . . . . . . . . . . . . . . . . . . 496,110 47,640 448,470
Individual impairment . . . . . . . . . . . . . . . . . . . . . . . . . . . . . . . . . . . . . . . . . . . . . . . 182,175 37,576 144,599Collective impairment . . . . . . . . . . . . . . . . . . . . . . . . . . . . . . . . . . . . . . . . . . . . . . . 313,935 10,064 303,871
Total . . . . . . . . . . . . . . . . . . . . . . . . . . . . . . . . . . . . . . . . . . . . . . . . . . . . . . . . . . . . . 496,110 47,640 448,470
Gross amount of receivables, individually impaired, before deducting anyindividually assessed impairment allowance . . . . . . . . . . . . . . . . . . . . . . . . . . . . 405,926 118,486 287,440
TotalRelatedParties
ThirdParties
December 31, 2011Balance at beginning of year . . . . . . . . . . . . . . . . . . . . . . . . . . . . . . . . . . . . . . . . . . 496,110 47,640 448,470Provision (reversal)—net (Note 26) . . . . . . . . . . . . . . . . . . . . . . . . . . . . . . . . . . . . . 41,051 (1,509) 42,560Net effect of foreign exchange adjustment . . . . . . . . . . . . . . . . . . . . . . . . . . . . . . . 105 976 (871)Write-offs . . . . . . . . . . . . . . . . . . . . . . . . . . . . . . . . . . . . . . . . . . . . . . . . . . . . . . . . . (615) — (615)
Balance at end of year . . . . . . . . . . . . . . . . . . . . . . . . . . . . . . . . . . . . . . . . . . . . . . . 536,651 47,107 489,544
Individual impairment . . . . . . . . . . . . . . . . . . . . . . . . . . . . . . . . . . . . . . . . . . . . . . . 189,486 44,086 145,400Collective impairment . . . . . . . . . . . . . . . . . . . . . . . . . . . . . . . . . . . . . . . . . . . . . . . 347,165 3,021 344,144
Total . . . . . . . . . . . . . . . . . . . . . . . . . . . . . . . . . . . . . . . . . . . . . . . . . . . . . . . . . . . . . 536,651 47,107 489,544
Gross amount of receivables, individually impaired, before deducting anyindividually assessed impairment allowance . . . . . . . . . . . . . . . . . . . . . . . . . . . . 309,556 117,572 191,984
The net effect of foreign exchange adjustment was due to the strengthening or weakening of the rupiahvis-à-vis the U.S. dollar in relation to U.S. dollar accounts previously provided with allowance and was creditedor charged to “Gain (Loss) on Foreign Exchange—Net”.
Information about the Group’s exposure to credit risk is disclosed in Note 35.
Management believes the established allowance is sufficient to cover impairment of accounts receivable—trade.
F-50

PT INDOSAT Tbk AND SUBSIDIARIES
NOTES TO CONSOLIDATED FINANCIAL STATEMENTS—(Continued)as of January 1, 2010 and December 31, 2010 and 2011
and for the years ended December 31, 2009, 2010 and 2011(Expressed in millions of rupiah and thousands of U.S. dollar, except share and tariff data)
6. TAXES RECEIVABLE
This account consists of claims for tax refund as of January 1, 2010 and December 31, 2010 and 2011amounting to Rp396,581, Rp479,786 and Rp514,934, respectively, mainly consisting of the Company’scorporate income tax for fiscal years 2004, 2005, 2006, 2009, 2010 and 2011 and Satelindo’s corporate incometax for fiscal year 2002.
On April 13, 2010, the Company received the tax refund from the Tax Office amounting to Rp41,753 for theremaining tax overpayment of 2004 corporate income tax based on the Tax Court’s Decision Letter datedDecember 4, 2009 on the 2004 corporate income tax.
On July 15, 2010, the Company received Decision Letter No. KEP-357/WPJ.19/BD.05/2010 from theDirectorate General of Taxation (“DGT”) declining the Company’s objection to the correction on Satelindo’scorporate income tax for fiscal year 2002 amounting to Rp105,809 (including penalties and interest). OnOctober 14, 2010, the Company submitted an appeal letter to the Tax Court concerning the Company’s objectionto the correction on Satelindo’s corporate income tax for fiscal year 2002. As of April 25, 2012, the Companyhas not received any decision from the Tax Court on such appeal.
On October 12, 2010, the Company received the Decision Letter from the Tax Court which accepted theCompany’s objection to the correction of the 2005 corporate income tax amounting to Rp38,155, which wasoffset against the underpayment of the Company’s 2008 and 2009 income tax article 26 based on Tax CollectionLetters (“STPs”) received by the Company on September 17, 2010 (Note 16). On February 24, 2011, theCompany received a copy of a Memorandum for Reconsideration Request (Memori Permohonan PeninjauanKembali) from the Tax Court to the Supreme Court on the Tax Court’s Decision Letter dated October 29, 2010for the 2005 corporate income tax. On March 25, 2011, the Company submitted a Counter Memorandum forReconsideration Request to the Supreme Court. As of April 25, 2012, the Company has not received any decisionfrom the Supreme Court on such request.
On April 21, 2011, the Company received the assessment letter on tax overpayment (“SKPLB”) from theDGT for the Company’s 2009 corporate income tax amounting to Rp29,272, which amount is lower than theamount recognized by the Company in its financial statements. The Company accepted a part of the correctionsamounting to Rp835, which was charged to current operations. On May 31, 2011, the Company received the taxrefund of its claim for 2009 corporate income tax amounting to Rp23,695 after being offset with the acceptedamount of tax correction of VAT for the period January—December 2009 (Note 16). On July 20, 2011, theCompany submitted an objection letter to the Tax Office regarding the remaining correction on the Company’s2009 corporate income tax. As of April 25, 2012, the Company has not received any decision from the TaxOffice on such letter.
On April 25, 2011, IMM received SKPLB from the Tax Office for IMM’s 2009 corporate income taxamounting to Rp34,950, which amount is lower than the amount recognized by IMM in its financial statements.IMM charged the unapproved 2009 claim for tax refund amounting to Rp597 to current operations. On the samedate, IMM also received the assessment letters on tax underpayment (“SKPKBs”) for IMM’s 2009 income taxarticles 21 and 23 and VAT totalling Rp4,512 (including penalties and interest). On May 26 2011, IMM receivedthe refund of its claim for 2009 corporate income tax amounting to Rp30,438, after being offset with aboveunderpayment of IMM’s 2009 income tax articles 21 and 23 and VAT.
F-51

PT INDOSAT Tbk AND SUBSIDIARIES
NOTES TO CONSOLIDATED FINANCIAL STATEMENTS—(Continued)as of January 1, 2010 and December 31, 2010 and 2011
and for the years ended December 31, 2009, 2010 and 2011(Expressed in millions of rupiah and thousands of U.S. dollar, except share and tariff data)
On April 26, 2011, the Company received the Tax Court’s Decision Letter which accepted the Company’sappeal on the remaining correction of the 2006 corporate income tax. On June 21, 2011, the Company receivedthe tax refund amounting to Rp82,626. On August 22, 2011, the Company received a copy of a Memorandum forReconsideration Request (Memori Permohonan Peninjauan Kembali) from the Tax Court to the Supreme Courton the Tax Court’s Decision Letter dated April 26, 2011 for the 2006 corporate income tax. On September 21,2011, the Company submitted a Counter-Memorandum for Reconsideration Request to the Supreme Court. As ofApril 25, 2012, the Company has not received any decision from the Supreme Court on such request.
7. OTHER CURRENT FINANCIAL ASSETS – NET
This account consists of the following:
January 1,2010
December 31,
2010 2011
Short-term investment . . . . . . . . . . . . . . . . . . . . . . . . . . . . . . . . . . . . . . . . . . . . . . . . 25,395 25,395 25,395Less allowance for impairment . . . . . . . . . . . . . . . . . . . . . . . . . . . . . . . . . . . . . . . . . 25,395 25,395 25,395
Net . . . . . . . . . . . . . . . . . . . . . . . . . . . . . . . . . . . . . . . . . . . . . . . . . . . . . . . . . . . . . . . — — —Restricted cash and cash equivalents (including US$1,681 on January 1, 2010,
US$1,645 on December 31, 2010 and US$168 on December 31, 2011) . . . . . . . 31,511 48,165 18,830Finance lease receivables . . . . . . . . . . . . . . . . . . . . . . . . . . . . . . . . . . . . . . . . . . . . . . — — 5,043Others (including US$5 on January 1, 2010, US$70 on December 31, 2010 and
US$10 on December 31, 2011) . . . . . . . . . . . . . . . . . . . . . . . . . . . . . . . . . . . . . . . 3,662 4,954 5,960
Total . . . . . . . . . . . . . . . . . . . . . . . . . . . . . . . . . . . . . . . . . . . . . . . . . . . . . . . . . . . . . 35,173 53,119 29,833
F-52

PT INDOSAT Tbk AND SUBSIDIARIES
NOTES TO CONSOLIDATED FINANCIAL STATEMENTS—(Continued)as of January 1, 2010 and December 31, 2010 and 2011
and for the years ended December 31, 2009, 2010 and 2011(Expressed in millions of rupiah and thousands of U.S. dollar, except share and tariff data)
8. PROPERTY AND EQUIPMENT
The details of property and equipment are as follows:
Exchangeand
networkassets
Subscribers’apparatusand otherequipment
Buildings andbuilding &leasehold
improvements Landrights
Propertiesunder
constructionand
installation Total
CostAt January 1, 2009 . . . . . . . . . . . . . . . . . . 36,389,712 3,485,809 9,202,837 473,109 13,926,944 63,478,411Additions . . . . . . . . . . . . . . . . . . . . . . . . . 158,871 56,996 18,922 — 11,334,716* 11,569,505Derecognitions . . . . . . . . . . . . . . . . . . . . . (89,448) (34,507) (14,604) — (84,218) (222,777)Divestment of SMM—a subsidiary . . . . . — (6,617) (70) — — (6,687)Reclassifications . . . . . . . . . . . . . . . . . . . 14,701,390 368,118 2,369,910 31,511 (17,470,929) —
At December 31, 2009 . . . . . . . . . . . . . . . 51,160,525 3,869,799 11,576,995 504,620 7,706,513 74,818,452Additions . . . . . . . . . . . . . . . . . . . . . . . . . 364,134 51,381 4,088 15,977 5,039,357** 5,474,937Derecognitions . . . . . . . . . . . . . . . . . . . . . (2,091,220) (30,657) (70,346) — — (2,192,223)Reclassifications . . . . . . . . . . . . . . . . . . . 7,572,859 412,498 1,278,139 20,490 (9,283,986) —
At December 31, 2010 . . . . . . . . . . . . . . . 57,006,298 4,303,021 12,788,876 541,087 3,461,884 78,101,166Additions . . . . . . . . . . . . . . . . . . . . . . . . . 523,948 37,773 821,482 — 5,517,982*** 6,901,185Derecognitions . . . . . . . . . . . . . . . . . . . . . (1,799,943) (81,053) (125,569) — — (2,006,565)Reclassifications . . . . . . . . . . . . . . . . . . . 5,383,034 394,168 391,714 1,975 (6,170,891) —
At December 31, 2011 . . . . . . . . . . . . . . . 61,113,337 4,653,909 13,876,503 543,062 2,808,975 82,995,786
Accumulated depreciation, amortizationand impairment
Accumulated depreciation, amortizationand impairment at January 1, 2009 . . . 19,175,081 2,520,341 3,388,916 60,460 — 25,144,798
Depreciation and amortization charge forthe year . . . . . . . . . . . . . . . . . . . . . . . . 4,156,188 431,015 857,032 10,210 — 5,454,445
Derecognitions . . . . . . . . . . . . . . . . . . . . . (89,448) (34,359) (9,637) — — (133,444)Divestment of SMM—a subsidiary . . . . . — (5,415) (70) — — (5,485)
Accumulated depreciation, amortizationand impairment at December 31,2009 . . . . . . . . . . . . . . . . . . . . . . . . . . . 23,241,821 2,911,582 4,236,241 70,670 — 30,460,314
Depreciation and amortization charge forthe year . . . . . . . . . . . . . . . . . . . . . . . . 4,784,832 437,982 950,794 10,940 — 6,184,548
Derecognitions . . . . . . . . . . . . . . . . . . . . . (1,932,935) (29,838) (70,324) — — (2,033,097)
Accumulated depreciation, amortizationand impairment at December 31,2010 . . . . . . . . . . . . . . . . . . . . . . . . . . . 26,093,718 3,319,726 5,116,711 81,610 — 34,611,765
Depreciation and amortization charge forthe year . . . . . . . . . . . . . . . . . . . . . . . . 5,103,540 466,208 897,410 11,152 — 6,478,310
Derecognitions . . . . . . . . . . . . . . . . . . . . . (1,283,253) (81,053) (115,352) — — (1,479,658)
Accumulated depreciation, amortizationand impairment at December 31,2011 . . . . . . . . . . . . . . . . . . . . . . . . . . . 29,914,005 3,704,881 5,898,769 92,762 — 39,610,417
* including additional property and equipment purchased from Lintasarta amounting to Rp13,346 (net of intercompany loss of Rp2,092)** including additional property and equipment purchased from Lintasarta amounting to Rp71,423 (net of intercompany loss of Rp11,683)*** including additional property and equipment purchased from Lintasarta amounting to Rp88,371 (net of intercompany loss of Rp27,578)
F-53

PT INDOSAT Tbk AND SUBSIDIARIES
NOTES TO CONSOLIDATED FINANCIAL STATEMENTS—(Continued)as of January 1, 2010 and December 31, 2010 and 2011
and for the years ended December 31, 2009, 2010 and 2011(Expressed in millions of rupiah and thousands of U.S. dollar, except share and tariff data)
Exchangeand network
assets
Subscribers’apparatusand otherequipment
Buildings andbuilding &leasehold
improvements Landrights
Propertiesunder
constructionand
installation Total
Net book valueAt January 1, 2009 . . . . . . . . . . . . . . . . . . 17,214,631 965,468 5,813,921 412,649 13,926,944 38,333,613At December 31, 2009 . . . . . . . . . . . . . . . 27,918,704 958,217 7,340,754 433,950 7,706,513 44,358,138At December 31, 2010 . . . . . . . . . . . . . . . 30,912,580 983,295 7,672,165 459,477 3,461,884 43,489,401At December 31, 2011 . . . . . . . . . . . . . . . 31,199,332 949,028 7,977,734 450,300 2,808,975 43,385,369
Submarine cables (presented as part of exchange and network assets) represent the Company’s proportionateinvestment in submarine cable circuits jointly constructed, operated, maintained and owned with other countries,based on the respective contracts and/or the construction and maintenance agreements.
Depreciation and amortization expense charged to profit or loss amounted to Rp5,454,445, Rp6,184,548 andRp6,478,310 in 2009, 2010 and 2011, respectively.
Management believes that there is no impairment in assets value or recovery of the impairment reserve ascontemplated in IAS 36 for the current year.
On August 31, 2009, the Company launched its Satellite Palapa-D. The Satellite experienced an under-performance of the launch vehicle during the Satellite’s placement to its intended orbital position. Consequently,its orbital lifetime has been reduced. The insurance claim for the partial loss of the Satellite has been made and isrecorded as a reduction of the cost of the Satellite. The Satellite has been in operation since November 2009 aftergoing through the process of testing and arranging its orbital position in September and October 2009. OnJanuary 4 and 19, 2010, the Company collected the Palapa-D Satellite insurance claim amounting to US$58,008(equivalent to Rp537,657) as a loss compensation for the decrease in the Satellite’s useful life from 15 years to10.77 years due to the under-performance of the launch vehicle in the Satellite’s orbital process.
As of December 31, 2011, approximately Rp17,221 of property and equipment are pledged as collateral tocredit facilities obtained by Lintasarta (Notes 18i and 18k).
As of December 31, 2011, the Group insured their respective property and equipment (except submarinecables) for US$215,654 and Rp40,471,593 including insurance on the Company’s satellite amounting toUS$132,800. Management believes that the sum insured is sufficient to cover possible losses arising from fire,explosion, lightning, aircraft damage and other natural disasters.
The details of the Group’s properties under construction and installation as of January 1, 2010 andDecember 31, 2010 and 2011 are as follows:
Percentage ofCompletion Cost Estimated Date of Completion
January 1, 2010Exchange and network assets . . . . . . . . . . . . . . . . . . . 5 - 99 6,819,312 January - September 2010Subscribers’ apparatus and other equipment . . . . . . . 55 - 95 120,609 January - July 2010Buildings and building & leasehold
improvements . . . . . . . . . . . . . . . . . . . . . . . . . . . . . 6 - 75 766,592 January 2010 - December 2011
Total . . . . . . . . . . . . . . . . . . . . . . . . . . . . . . . . . . . . . . 7,706,513
F-54

PT INDOSAT Tbk AND SUBSIDIARIES
NOTES TO CONSOLIDATED FINANCIAL STATEMENTS—(Continued)as of January 1, 2010 and December 31, 2010 and 2011
and for the years ended December 31, 2009, 2010 and 2011(Expressed in millions of rupiah and thousands of U.S. dollar, except share and tariff data)
Percentage ofCompletion Cost Estimated Date of Completion
December 31, 2010Exchange and network assets . . . . . . . . . . . . . . . . . . . . . . . 5 - 99 3,158,581 January - December 2011Subscribers’ apparatus and other equipment . . . . . . . . . . . . 25 - 95 25,853 January - December 2011Buildings and building & leasehold improvements . . . . . . 6 - 95 277,450 January - December 2011
Total . . . . . . . . . . . . . . . . . . . . . . . . . . . . . . . . . . . . . . . . . . 3,461,884
December 31, 2011Exchange and network assets . . . . . . . . . . . . . . . . . . . . . . . 17 - 90 2,574,418 January - June 2012Subscribers’ apparatus and other equipment . . . . . . . . . . . . 40 - 90 93,535 January - June 2012Buildings and building & leasehold improvements . . . . . . 20 - 95 141,022 January - June 2012
Total . . . . . . . . . . . . . . . . . . . . . . . . . . . . . . . . . . . . . . . . . . 2,808,975
Borrowing costs capitalized to properties under construction and installation for the years endedDecember 31, 2009, 2010 and 2011 amounted to Rp181,522, Rp18,698 and Rp2,933, respectively.
For the years ended December 31, 2009, 2010 and 2011, exchanges and sales of certain property andequipment were made as follows:
2009 2010 2011
Exchanges of AssetsKalimantan Project (Note 33f)Carrying amount of assets received . . . . . . . . . . . . . . . . . . . . . . . . . . . . . . . . . — 158,285 400,956Carrying amount of assets given up . . . . . . . . . . . . . . . . . . . . . . . . . . . . . . . . . — (158,285) (400,956)
Sumatra and Java Project (Note 33c)Carrying amount of assets received . . . . . . . . . . . . . . . . . . . . . . . . . . . . . . . . . — — 115,734Carrying amount of assets given up . . . . . . . . . . . . . . . . . . . . . . . . . . . . . . . . . — — (115,734)
Sales of AssetsProceeds . . . . . . . . . . . . . . . . . . . . . . . . . . . . . . . . . . . . . . . . . . . . . . . . . . . . . . 2,253 7,741 6,708Net book value . . . . . . . . . . . . . . . . . . . . . . . . . . . . . . . . . . . . . . . . . . . . . . . . . (5,115) (841) (78)
Outright Sale of Asset Being LeasedFair value of asset being leased . . . . . . . . . . . . . . . . . . . . . . . . . . . . . . . . . . . . — — 94,187Net book value . . . . . . . . . . . . . . . . . . . . . . . . . . . . . . . . . . . . . . . . . . . . . . . . . — — (10,140)
Gain (loss) . . . . . . . . . . . . . . . . . . . . . . . . . . . . . . . . . . . . . . . . . . . . . . . . . . . . (2,862) 6,900 90,677
In the above exchange of assets transaction, the fair value of neither the assets received nor the assets givenup cannot be measured reliably, hence, their values were measured at the carrying amounts of the assets given up.
In accordance with its policy, the Company reviews the estimated useful lives of its fixed assets on anongoing basis. This review indicated that the actual lives of towers which are recorded under Exchange andNetwork Assets are longer than the estimated useful lives used for depreciation purposes in the consolidatedfinancial statements. As a result, effective January 1, 2010, the Company changed its estimates of the useful livesof its towers to better reflect the estimated periods during which these assets will remain in service. The towersthat previously averaged 15years were increased to an average of 25 years. The effect of this change in estimatewas to reduce 2011 depreciation expense by Rp216,893.
The carrying value of equipment held under finance leases at December 31, 2011 was Rp695,426.
F-55

PT INDOSAT Tbk AND SUBSIDIARIES
NOTES TO CONSOLIDATED FINANCIAL STATEMENTS—(Continued)as of January 1, 2010 and December 31, 2010 and 2011
and for the years ended December 31, 2009, 2010 and 2011(Expressed in millions of rupiah and thousands of U.S. dollar, except share and tariff data)
9. GOODWILL AND OTHER INTANGIBLE ASSETS
Goodwill arose from the acquisition of ownership in Bimagraha and Satelindo in 2001 and 2002,respectively, and from the acquisition of additional ownership in Lintasarta in 2005, in SMT in 2008 and LMD in2010, respectively.
The details of the other intangible assets arising from the acquisition of Satelindo in 2002 are as follows:
Amount
Spectrum license . . . . . . . . . . . . . . . . . . . . . . . . . . . . . . . . . . . . . . . . . . . . . . . . . . . . . . . . . . . 222,922Customer base—Post-paid . . . . . . . . . . . . . . . . . . . . . . . . . . . . . . . . . . . . . . . . . . . . . . . . . . . . . . . . . . . . . . . . 154,220—Prepaid . . . . . . . . . . . . . . . . . . . . . . . . . . . . . . . . . . . . . . . . . . . . . . . . . . . . . . . . . . . . . . . . . 73,128Brand . . . . . . . . . . . . . . . . . . . . . . . . . . . . . . . . . . . . . . . . . . . . . . . . . . . . . . . . . . . . . . . . . . . . 147,178
Total . . . . . . . . . . . . . . . . . . . . . . . . . . . . . . . . . . . . . . . . . . . . . . . . . . . . . . . . . . . . . . . . . . . . . 597,448
The changes in the goodwill and other intangible assets account are as follows:
Non-integratedSoftware
OtherIntangible
Assets Goodwill Total
Cost:At January 1, 2009 . . . . . . . . . . . . . . . . . . . . . . . . . . . . . . . . . . 220,533 597,448 2,944,362 3,762,343Additions . . . . . . . . . . . . . . . . . . . . . . . . . . . . . . . . . . . . . . . . . 15,044 — — 15,044
At December 31, 2009 . . . . . . . . . . . . . . . . . . . . . . . . . . . . . . . 235,577 597,448 2,944,362 3,777,387Additions . . . . . . . . . . . . . . . . . . . . . . . . . . . . . . . . . . . . . . . . . 40,052 — — 40,052
At December 31, 2010 . . . . . . . . . . . . . . . . . . . . . . . . . . . . . . . 275,629 597,448 2,944,362 3,817,439Additions . . . . . . . . . . . . . . . . . . . . . . . . . . . . . . . . . . . . . . . . . 10,340 112 — 10,452
At December 31, 2011 . . . . . . . . . . . . . . . . . . . . . . . . . . . . . . . 285,969 597,560 2,944,362 3,827,891
Accumulated Amortization:At January 1, 2009 . . . . . . . . . . . . . . . . . . . . . . . . . . . . . . . . . . 200,818 569,954 930,862 1,701,634Amortization . . . . . . . . . . . . . . . . . . . . . . . . . . . . . . . . . . . . . . . 14,539 18,397 — 32,936
At December 31, 2009 . . . . . . . . . . . . . . . . . . . . . . . . . . . . . . . 215,357 588,351 930,862 1,734,570Amortization . . . . . . . . . . . . . . . . . . . . . . . . . . . . . . . . . . . . . . . 10,595 9,097 — 19,692
At December 31, 2010 . . . . . . . . . . . . . . . . . . . . . . . . . . . . . . . 225,952 597,448 930,862 1,754,262Amortization . . . . . . . . . . . . . . . . . . . . . . . . . . . . . . . . . . . . . . . 17,607 51 — 17,658
At December 31, 2011 . . . . . . . . . . . . . . . . . . . . . . . . . . . . . . . 243,559 597,499 930,862 1,771,920
Net book value:At January 1, 2009 . . . . . . . . . . . . . . . . . . . . . . . . . . . . . . . . . 19,715 27,494 2,013,500 2,060,709
At December 31, 2009 . . . . . . . . . . . . . . . . . . . . . . . . . . . . . . . 20,220 9,097 2,013,500 2,042,817
At December 31, 2010 . . . . . . . . . . . . . . . . . . . . . . . . . . . . . . . 49,677 — 2,013,500 2,063,177
At December 31, 2011 . . . . . . . . . . . . . . . . . . . . . . . . . . . . . . . 42,410 61 2,013,500 2,055,971
F-56

PT INDOSAT Tbk AND SUBSIDIARIES
NOTES TO CONSOLIDATED FINANCIAL STATEMENTS—(Continued)as of January 1, 2010 and December 31, 2010 and 2011
and for the years ended December 31, 2009, 2010 and 2011(Expressed in millions of rupiah and thousands of U.S. dollar, except share and tariff data)
Other intangible assets consist of the following:
Useful lives(years)
January 1, 2010 December 31, 2010 December 31, 2011
Gross
Net
Gross
Net
Gross
NetCarryingAmount
AccumulatedAmortization
CarryingAmount
AccumulatedAmortization
CarryingAmount
AccumulatedAmortization
Customer base:Post-paid . . . . . . . . 5 154,220 154,220 — 154,220 154,220 — 154,220 154,220 —Prepaid . . . . . . . . . 6 73,128 73,128 — 73,128 73,128 — 73,128 73,128 —
Spectrum license . . . . . . 5 222,922 222,922 — 222,922 222,922 — 222,922 222,922 —Brand . . . . . . . . . . . . . . . 8 147,178 138,081 9,097 147,178 147,178 — 147,178 147,178 —Patent . . . . . . . . . . . . . . . 10 — — — — — — 112 51 61
Total . . . . . . . . . . . . . . . 597,448 588,351 9,097 597,448 597,448 — 597,560 597,499 61
Goodwill acquired through business combination has been allocated to the cellular business unit, which isalso considered as one of the Group’s operating segments.
Goodwill is tested for impairment annually (as at December 31) and when circumstances indicate thecarrying value may be impaired. The Company considers the relationship between its market capitalization andits book value, among other factors, when reviewing for indications of impairment. As of December 31, 2011,the market capitalization of the Company was above the book value of its equity. The recoverable amount of thecellular business unit has been determined based on fair values less cost to sell (“FVLCTS”) calculation that usesthe Income Approach (a Discounted Cash Flows Method) and the Market Approach (a Guideline PublicCompany Method).
Key assumptions used in the FVLCTS calculation at December 31, 2011:
Discount rates—The Company has chosen to use weighted average cost of capital (“WACC”) as thediscount rate for the discounted cash flow. The estimated WACC applied in determining the recoverable amountof the cellular business unit is between 11% and 12%.
Compounded Annual Growth Rate (“CAGR”)—The CAGR projection for the 5-year budget period of thecellular business unit revenue based on the market analysts’ forecast is between 3.9% and 5.6%.
Cost to Sell—As the recoverable amount of the cellular business unit is determined using FVLCTS, theestimated cost to sell the business is based on a certain percentage of the equity value. The estimated cost to sellused for this calculation is at approximately 1.5% of the enterprise value.
As a result of the impairment testing, management did not identify an impairment for the cellular businessunit to which goodwill of Rp2,013,500 is allocated.
10. LONG-TERM PREPAID RENTALS—NET OF CURRENT PORTION
This account represents mainly the long-term portion of prepaid rentals on sites and towers.
F-57
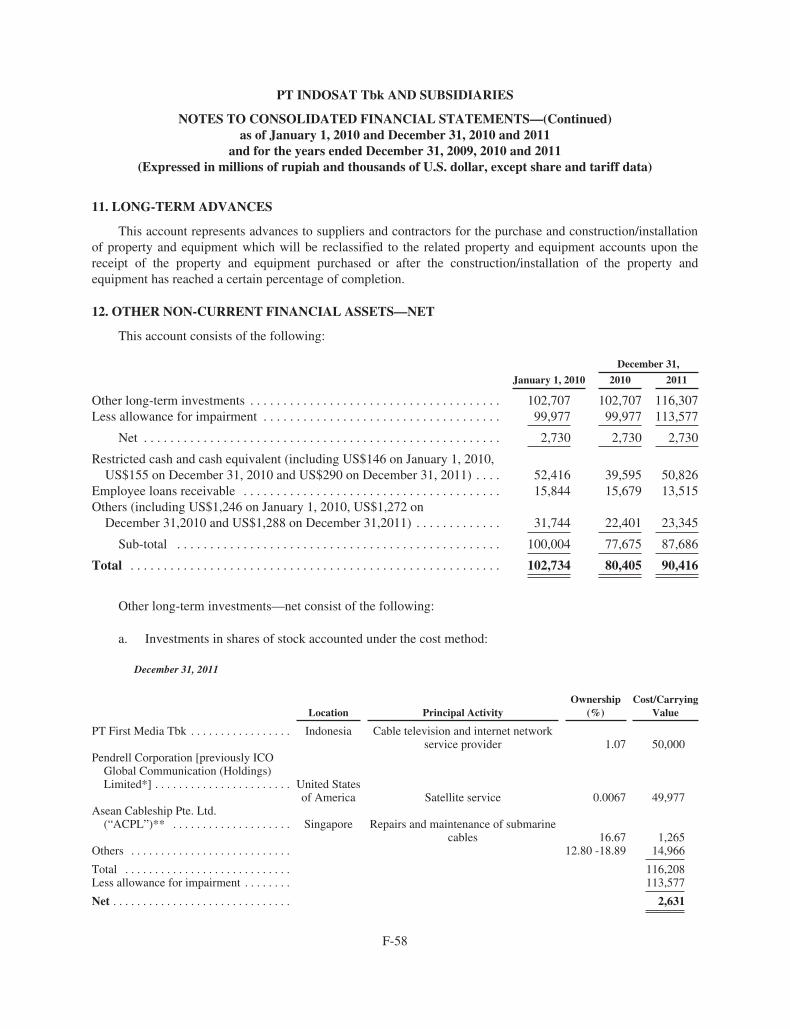
PT INDOSAT Tbk AND SUBSIDIARIES
NOTES TO CONSOLIDATED FINANCIAL STATEMENTS—(Continued)as of January 1, 2010 and December 31, 2010 and 2011
and for the years ended December 31, 2009, 2010 and 2011(Expressed in millions of rupiah and thousands of U.S. dollar, except share and tariff data)
11. LONG-TERM ADVANCES
This account represents advances to suppliers and contractors for the purchase and construction/installationof property and equipment which will be reclassified to the related property and equipment accounts upon thereceipt of the property and equipment purchased or after the construction/installation of the property andequipment has reached a certain percentage of completion.
12. OTHER NON-CURRENT FINANCIAL ASSETS—NET
This account consists of the following:
December 31,
January 1, 2010 2010 2011
Other long-term investments . . . . . . . . . . . . . . . . . . . . . . . . . . . . . . . . . . . . . . 102,707 102,707 116,307Less allowance for impairment . . . . . . . . . . . . . . . . . . . . . . . . . . . . . . . . . . . . 99,977 99,977 113,577
Net . . . . . . . . . . . . . . . . . . . . . . . . . . . . . . . . . . . . . . . . . . . . . . . . . . . . . . 2,730 2,730 2,730
Restricted cash and cash equivalent (including US$146 on January 1, 2010,US$155 on December 31, 2010 and US$290 on December 31, 2011) . . . . 52,416 39,595 50,826
Employee loans receivable . . . . . . . . . . . . . . . . . . . . . . . . . . . . . . . . . . . . . . . 15,844 15,679 13,515Others (including US$1,246 on January 1, 2010, US$1,272 on
December 31,2010 and US$1,288 on December 31,2011) . . . . . . . . . . . . . 31,744 22,401 23,345
Sub-total . . . . . . . . . . . . . . . . . . . . . . . . . . . . . . . . . . . . . . . . . . . . . . . . . 100,004 77,675 87,686
Total . . . . . . . . . . . . . . . . . . . . . . . . . . . . . . . . . . . . . . . . . . . . . . . . . . . . . . . . 102,734 80,405 90,416
Other long-term investments—net consist of the following:
a. Investments in shares of stock accounted under the cost method:
December 31, 2011
Location Principal ActivityOwnership
(%)Cost/Carrying
Value
PT First Media Tbk . . . . . . . . . . . . . . . . . Indonesia Cable television and internet networkservice provider 1.07 50,000
Pendrell Corporation [previously ICOGlobal Communication (Holdings)Limited*] . . . . . . . . . . . . . . . . . . . . . . . United States
of America Satellite service 0.0067 49,977Asean Cableship Pte. Ltd.
(“ACPL”)** . . . . . . . . . . . . . . . . . . . . Singapore Repairs and maintenance of submarinecables 16.67 1,265
Others . . . . . . . . . . . . . . . . . . . . . . . . . . . 12.80 -18.89 14,966
Total . . . . . . . . . . . . . . . . . . . . . . . . . . . . 116,208Less allowance for impairment . . . . . . . . 113,577
Net . . . . . . . . . . . . . . . . . . . . . . . . . . . . . . 2,631
F-58
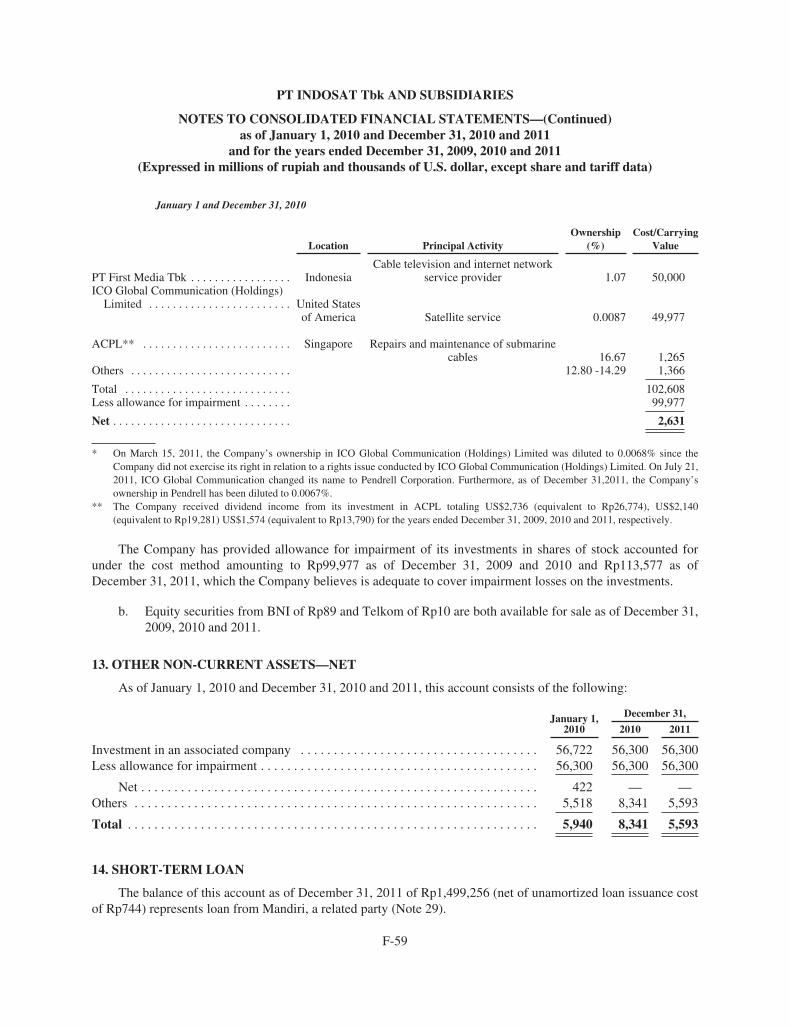
PT INDOSAT Tbk AND SUBSIDIARIES
NOTES TO CONSOLIDATED FINANCIAL STATEMENTS—(Continued)as of January 1, 2010 and December 31, 2010 and 2011
and for the years ended December 31, 2009, 2010 and 2011(Expressed in millions of rupiah and thousands of U.S. dollar, except share and tariff data)
January 1 and December 31, 2010
Location Principal ActivityOwnership
(%)Cost/Carrying
Value
PT First Media Tbk . . . . . . . . . . . . . . . . . IndonesiaCable television and internet network
service provider 1.07 50,000ICO Global Communication (Holdings)
Limited . . . . . . . . . . . . . . . . . . . . . . . . United Statesof America Satellite service 0.0087 49,977
ACPL** . . . . . . . . . . . . . . . . . . . . . . . . . Singapore Repairs and maintenance of submarinecables 16.67 1,265
Others . . . . . . . . . . . . . . . . . . . . . . . . . . . 12.80 -14.29 1,366
Total . . . . . . . . . . . . . . . . . . . . . . . . . . . . 102,608Less allowance for impairment . . . . . . . . 99,977
Net . . . . . . . . . . . . . . . . . . . . . . . . . . . . . . 2,631
* On March 15, 2011, the Company’s ownership in ICO Global Communication (Holdings) Limited was diluted to 0.0068% since theCompany did not exercise its right in relation to a rights issue conducted by ICO Global Communication (Holdings) Limited. On July 21,2011, ICO Global Communication changed its name to Pendrell Corporation. Furthermore, as of December 31,2011, the Company’sownership in Pendrell has been diluted to 0.0067%.
** The Company received dividend income from its investment in ACPL totaling US$2,736 (equivalent to Rp26,774), US$2,140(equivalent to Rp19,281) US$1,574 (equivalent to Rp13,790) for the years ended December 31, 2009, 2010 and 2011, respectively.
The Company has provided allowance for impairment of its investments in shares of stock accounted forunder the cost method amounting to Rp99,977 as of December 31, 2009 and 2010 and Rp113,577 as ofDecember 31, 2011, which the Company believes is adequate to cover impairment losses on the investments.
b. Equity securities from BNI of Rp89 and Telkom of Rp10 are both available for sale as of December 31,2009, 2010 and 2011.
13. OTHER NON-CURRENT ASSETS—NET
As of January 1, 2010 and December 31, 2010 and 2011, this account consists of the following:
January 1,2010
December 31,
2010 2011
Investment in an associated company . . . . . . . . . . . . . . . . . . . . . . . . . . . . . . . . . . . . 56,722 56,300 56,300Less allowance for impairment . . . . . . . . . . . . . . . . . . . . . . . . . . . . . . . . . . . . . . . . . . 56,300 56,300 56,300
Net . . . . . . . . . . . . . . . . . . . . . . . . . . . . . . . . . . . . . . . . . . . . . . . . . . . . . . . . . . . . 422 — —Others . . . . . . . . . . . . . . . . . . . . . . . . . . . . . . . . . . . . . . . . . . . . . . . . . . . . . . . . . . . . . 5,518 8,341 5,593
Total . . . . . . . . . . . . . . . . . . . . . . . . . . . . . . . . . . . . . . . . . . . . . . . . . . . . . . . . . . . . . . 5,940 8,341 5,593
14. SHORT-TERM LOAN
The balance of this account as of December 31, 2011 of Rp1,499,256 (net of unamortized loan issuance costof Rp744) represents loan from Mandiri, a related party (Note 29).
F-59

PT INDOSAT Tbk AND SUBSIDIARIES
NOTES TO CONSOLIDATED FINANCIAL STATEMENTS—(Continued)as of January 1, 2010 and December 31, 2010 and 2011
and for the years ended December 31, 2009, 2010 and 2011(Expressed in millions of rupiah and thousands of U.S. dollar, except share and tariff data)
On June 21, 2011, the Company entered into a Revolving Time Loan Facility agreement with Mandiricovering a maximum amount of Rp1,000,000 to finance the Company’s operational working capital, capitalexpenditure and/or refinancing requirements. This facility is available from June 21, 2011 to June 20, 2014 anddrawdowns bear interest at 1-month Jakarta Inter-Bank Offered Rate (“JIBOR”) plus 1.4% per annum. Eachdrawdown matures 3 months from the drawdown date and can be extended for further 3-month periods bysubmitting a written request for such extension to Mandiri.
On August 2, 2011, the Company made the first drawdown amounting to Rp300,000 from the facility andbased on the latest extension, the maturity date of the loan has been extended to February 2, 2012 based onextension request letter dated October 25, 2011.
Subsequently, on December 5, 2011, the Company entered into an amendment of this agreement to coverthe increase of the facility amount up to Rp1,500,000 and the change of the interest rate to 1-month JIBOR plus1.25% per annum.
On December 14, 2011, the Company drew down Rp1,200,000 from this facility .
Voluntary early repayment is permitted subject to 3 days prior written notice. The Company may earlyrepay the whole or any part of the loan.
Based on the facility agreement, the Company is required to comply with certain covenants such asmaintaining financial ratios. As of December 31, 2011, the Company has complied with all the financial ratiosrequired to be maintained.
The amortization of the loan issuance cost for the year ended December 31, 2011 amounted to Rp1,656(Note 27).
15. PROCUREMENT PAYABLE
This account consists of amounts due for capital and operating expenditures procured from the following:
December 31,
January 1, 2010 2010 2011
Related parties (Note 29) (including US$631 on January 1, 2010,US$404 on December 31, 2010 and US$114 on December 31,2011) . . . . . . . . . . . . . . . . . . . . . . . . . . . . . . . . . . . . . . . . . . . . . . . . . . . 117,284 68,681 36,073
Third parties (including US$309,520 on January 1, 2010, US$246,211on December 2010 and US$220,674 on December 31, 2011) . . . . . . . 5,172,498 3,575,786 3,393,848
Total . . . . . . . . . . . . . . . . . . . . . . . . . . . . . . . . . . . . . . . . . . . . . . . . . . . . . 5,289,782 3,644,467 3,429,921
The billed amount of procurement payable amounted to Rp1,478,057, Rp360,508 and Rp555,065 as ofDecember 31, 2009, 2010 and 2011, respectively. The unbilled amount of procurement payable amounted toRp3,811,725, Rp3,283,959 and Rp2,874,856 as of December 31, 2009, 2010 and 2011, respectively.
F-60

PT INDOSAT Tbk AND SUBSIDIARIES
NOTES TO CONSOLIDATED FINANCIAL STATEMENTS—(Continued)as of January 1, 2010 and December 31, 2010 and 2011
and for the years ended December 31, 2009, 2010 and 2011(Expressed in millions of rupiah and thousands of U.S. dollar, except share and tariff data)
16. TAXES PAYABLE
This account consists of the following:
December 31,
January 1, 2010 2010 2011
Estimated corporate income tax payable, less tax prepayments of Rp439,147in 2009, Rp123,281 in 2010 and Rp106,847 in 2011 . . . . . . . . . . . . . . . . . . . 21,826 4,890 13,330
Income tax article 25 . . . . . . . . . . . . . . . . . . . . . . . . . . . . . . . . . . . . . . . . . . . . . . 40,122 18,899 14,964
Total . . . . . . . . . . . . . . . . . . . . . . . . . . . . . . . . . . . . . . . . . . . . . . . . . . . . . . . . . . 61,948 23,789 28,294
F-61

PT INDOSAT Tbk AND SUBSIDIARIES
NOTES TO CONSOLIDATED FINANCIAL STATEMENTS—(Continued)as of January 1, 2010 and December 31, 2010 and 2011
and for the years ended December 31, 2009, 2010 and 2011(Expressed in millions of rupiah and thousands of U.S. dollar, except share and tariff data)
The computation of the income tax expense for the years ended December 31, 2009, 2010 and 2011 is asfollows:
2009 2010 2011
Estimated taxable income (tax loss) of the Company . . . . . . . . . . . . . . . . . 1,117,916 (1,142,061) (266,924)
Income tax expense—current (at statutory tax rates)Company . . . . . . . . . . . . . . . . . . . . . . . . . . . . . . . . . . . . . . . . . . . . . . . . . 313,016 — —Subsidiaries . . . . . . . . . . . . . . . . . . . . . . . . . . . . . . . . . . . . . . . . . . . . . . . 147,957 128,171 120,177Tax correction from previous year paid during the year . . . . . . . . . . . . . 33,517 — 2,665
Total income tax expense—current . . . . . . . . . . . . . . . . . . . . . . . . . . . . . . . . . 494,490 128,171 122,842
Income tax expense (benefit)—deferred—effect of temporary differences atenacted maximum tax rates (28% or 25% in 2009, 25% in 2010 and2011)
CompanyDepreciation—net . . . . . . . . . . . . . . . . . . . . . . . . . . . . . . . . . . . . . . 228,846 423,027 334,125Amortization of other intangible assets . . . . . . . . . . . . . . . . . . . . . . 58,962 47,642 43,333Equity in net income of investees . . . . . . . . . . . . . . . . . . . . . . . . . . 34,073 42,652 32,812Accrual of employee benefits—net . . . . . . . . . . . . . . . . . . . . . . . . . (27,818) (3,820) 28,919Incomes from leasing transaction . . . . . . . . . . . . . . . . . . . . . . . . . . — — 19,862Net periodic pension cost . . . . . . . . . . . . . . . . . . . . . . . . . . . . . . . . (115) (4,253) 3,847Amortization of 3G licenses . . . . . . . . . . . . . . . . . . . . . . . . . . . . . . 1,722 8,751 3,314Tax loss . . . . . . . . . . . . . . . . . . . . . . . . . . . . . . . . . . . . . . . . . . . . . . — (285,515) (66,731)Loss on sale of property and equipment—net . . . . . . . . . . . . . . . . . 1,036 86,055 (54,348)Write-off of accounts receivable (provision for impairment of
receivables)—net . . . . . . . . . . . . . . . . . . . . . . . . . . . . . . . . . . . . . 15,517 (8,685) (6,877)Charges from leasing transaction . . . . . . . . . . . . . . . . . . . . . . . . . . — — (13,652)Amortization of debt and bonds issuance costs, consent
solicitation fees and discount (Notes 18 and 19) . . . . . . . . . . . . . 548 (2,580) (3,670)Provision for termination, gratuity and compensation benefits of
employees . . . . . . . . . . . . . . . . . . . . . . . . . . . . . . . . . . . . . . . . . . (7,662) (8,217) (232)Others . . . . . . . . . . . . . . . . . . . . . . . . . . . . . . . . . . . . . . . . . . . . . . . . (1,992) 4,402 916
Net . . . . . . . . . . . . . . . . . . . . . . . . . . . . . . . . . . . . . . . . . . . . . . . . . . 303,117 299,459 321,618Deferred income tax benefit—net resulting from reversal of
deferred tax liabilities (DTL) on investment in IMM, ISPL, andIPBV . . . . . . . . . . . . . . . . . . . . . . . . . . . . . . . . . . . . . . . . . . . . . . — — (109,497)
Net . . . . . . . . . . . . . . . . . . . . . . . . . . . . . . . . . . . . . . . . . . . . . . . . . . 303,117 299,459 212,121Subsidiaries
Depreciation—net . . . . . . . . . . . . . . . . . . . . . . . . . . . . . . . . . . . . . . (10,549) (6,073) (15,149)Write-off of accounts receivable (provision for impairment of
receivables)—net . . . . . . . . . . . . . . . . . . . . . . . . . . . . . . . . . . . . . (2,943) 533 (3,601)Accrued expenses . . . . . . . . . . . . . . . . . . . . . . . . . . . . . . . . . . . . . . (506) (948) (3,036)Net periodic pension cost . . . . . . . . . . . . . . . . . . . . . . . . . . . . . . . . 1,524 720 (551)Others . . . . . . . . . . . . . . . . . . . . . . . . . . . . . . . . . . . . . . . . . . . . . . . . (1,184) 476 3,025
Net . . . . . . . . . . . . . . . . . . . . . . . . . . . . . . . . . . . . . . . . . . . . . . . . . . (13,658) (5,292) (19,312)
Net income tax expense—deferred . . . . . . . . . . . . . . . . . . . . . . . . . . . . . . . . . 289,459 294,167 192,809
Income tax expense—net . . . . . . . . . . . . . . . . . . . . . . . . . . . . . . . . . . . . . . . . 783,949 422,338 315,651
F-62

PT INDOSAT Tbk AND SUBSIDIARIES
NOTES TO CONSOLIDATED FINANCIAL STATEMENTS—(Continued)as of January 1, 2010 and December 31, 2010 and 2011
and for the years ended December 31, 2009, 2010 and 2011(Expressed in millions of rupiah and thousands of U.S. dollar, except share and tariff data)
The computation of the estimated income tax payable is as follows:
December 31,
January 1, 2010 2010 2011
Income tax expense—currentCompany . . . . . . . . . . . . . . . . . . . . . . . . . . . . . . . . . . . . . . . . . . . . . . . . . 313,016 — —Subsidiaries . . . . . . . . . . . . . . . . . . . . . . . . . . . . . . . . . . . . . . . . . . . . . . . 147,957 128,171 120,177Tax correction from previous year paid during the year . . . . . . . . . . . . . 33,517 — 2,665
Total income tax expense—current . . . . . . . . . . . . . . . . . . . . . . . . . . . . . . . . . 494,490 128,171 122,842
Less prepayments of income tax of the CompanyArticle 22 . . . . . . . . . . . . . . . . . . . . . . . . . . . . . . . . . . . . . . . . . . . . . . . . . 101,137 52,126 80,935Article 23 . . . . . . . . . . . . . . . . . . . . . . . . . . . . . . . . . . . . . . . . . . . . . . . . . 7,071 6,810 14,275Article 25 . . . . . . . . . . . . . . . . . . . . . . . . . . . . . . . . . . . . . . . . . . . . . . . . . 299,289 28,795 —
Total prepayments of income tax of the Company . . . . . . . . . . . . . . . . . . . . . 407,497 87,731 95,210
Less prepayments of income tax of SubsidiariesArticle 22 . . . . . . . . . . . . . . . . . . . . . . . . . . . . . . . . . . . . . . . . . . . . . . . . . 7,534 1,107 —Article 23 . . . . . . . . . . . . . . . . . . . . . . . . . . . . . . . . . . . . . . . . . . . . . . . . . 3,306 3,696 5,880Article 25 . . . . . . . . . . . . . . . . . . . . . . . . . . . . . . . . . . . . . . . . . . . . . . . . . 151,693 194,309 187,474
Total prepayments of income tax of Subsidiaries . . . . . . . . . . . . . . . . . . . . . . 162,533 199,112 193,354
Total prepayments of income tax . . . . . . . . . . . . . . . . . . . . . . . . . . . . . . . . . . 570,030 286,843 288,564
Estimated income tax payable Subsidiaries . . . . . . . . . . . . . . . . . . . . . . . . . . 21,826 4,890 13,330
Total estimated income tax payable . . . . . . . . . . . . . . . . . . . . . . . . . . . . . . . 21,826 4,890 13,330
December 31,
January 1, 2010 2010 2011
Claim for tax refund (presented as part of “Taxes Receivable”)Company . . . . . . . . . . . . . . . . . . . . . . . . . . . . . . . . . . . . . . . . . . . . . . . . . 94,481 87,731 95,210Subsidiaries . . . . . . . . . . . . . . . . . . . . . . . . . . . . . . . . . . . . . . . . . . . . . . . 36,402 75,831 86,507
Total claim for tax refund . . . . . . . . . . . . . . . . . . . . . . . . . . . . . . . . . . . . . . . 130,883 163,562 181,717
F-63

PT INDOSAT Tbk AND SUBSIDIARIES
NOTES TO CONSOLIDATED FINANCIAL STATEMENTS—(Continued)as of January 1, 2010 and December 31, 2010 and 2011
and for the years ended December 31, 2009, 2010 and 2011(Expressed in millions of rupiah and thousands of U.S. dollar, except share and tariff data)
The reconciliation between the income tax expense calculated by applying the applicable tax rate of 28% in2009, 25% in 2010 and 2011 to the profit before income tax and the income tax expense as shown in theconsolidated statements of comprehensive income for the years ended December 31, 2009, 2010 and 2011 is asfollows:
2009 2010 2011
Profit before income tax 2,544,179 1,325,208 1,422,013
Income tax expense at the applicable tax rate of 28% in 2009, 25% in 2010and 2011 . . . . . . . . . . . . . . . . . . . . . . . . . . . . . . . . . . . . . . . . . . . . . . . . . . . 712,370 331,302 355,503
Company’s equity in Subsidiaries’ income before income tax and reversalof inter-company consolidation eliminations . . . . . . . . . . . . . . . . . . . . . . . 56,265 58,384 42,540
Tax effect on permanent differencesEmployee benefits . . . . . . . . . . . . . . . . . . . . . . . . . . . . . . . . . . . . . . . . . . 15,815 16,180 18,501Donation . . . . . . . . . . . . . . . . . . . . . . . . . . . . . . . . . . . . . . . . . . . . . . . . . 3,577 6,037 9,116Assessment for income taxes and related penalties . . . . . . . . . . . . . . . . 15,497 20,844 3,300Amortization of land rights . . . . . . . . . . . . . . . . . . . . . . . . . . . . . . . . . . . 2,859 2,735 2,788Interest income already subjected to final tax . . . . . . . . . . . . . . . . . . . . . (41,764) (36,200) (21,162)Others . . . . . . . . . . . . . . . . . . . . . . . . . . . . . . . . . . . . . . . . . . . . . . . . . . . (5,918) 11,161 1,983
Tax correction from previous year paid during the year . . . . . . . . . . . . . . . . . 33,517 — 2,665Adjustment due to tax audit and others . . . . . . . . . . . . . . . . . . . . . . . . . . . . . . (8,269) 11,895 9,914Deferred income tax benefit from the reversal of DTL on investment in
IMM, ISPL and IPBV . . . . . . . . . . . . . . . . . . . . . . . . . . . . . . . . . . . . . . . . . — — (109,497)
Income tax expense—net per consolidated statements of comprehensiveincome 783,949 422,338 315,651
The tax effects of significant temporary differences between financial and tax reporting of the Company areas follows:
December 31,
January 1, 2010 2010 2011
Deferred tax assetsTax loss . . . . . . . . . . . . . . . . . . . . . . . . . . . . . . . . . . . . . . . . . . . . . . . . . . — 285,515 352,246Accrual of employee benefits—net . . . . . . . . . . . . . . . . . . . . . . . . . . . . . 223,067 235,104 206,416Allowance for impairment of receivables . . . . . . . . . . . . . . . . . . . . . . . . 109,510 118,195 125,073Allowance for decline in value of investment in associated company
and other long-term investments . . . . . . . . . . . . . . . . . . . . . . . . . . . . . 39,069 39,069 42,469Pension cost . . . . . . . . . . . . . . . . . . . . . . . . . . . . . . . . . . . . . . . . . . . . . . . 17,890 22,143 18,296Charges from leasing transaction . . . . . . . . . . . . . . . . . . . . . . . . . . . . . . — — 13,652Allowance for decline in value of short-term investments . . . . . . . . . . . 6,349 6,349 6,349Others . . . . . . . . . . . . . . . . . . . . . . . . . . . . . . . . . . . . . . . . . . . . . . . . . . . 5,242 4,483 2,146
Total . . . . . . . . . . . . . . . . . . . . . . . . . . . . . . . . . . . . . . . . . . . . . . . . . . . . . 401,127 710,858 766,647
F-64

PT INDOSAT Tbk AND SUBSIDIARIES
NOTES TO CONSOLIDATED FINANCIAL STATEMENTS—(Continued)as of January 1, 2010 and December 31, 2010 and 2011
and for the years ended December 31, 2009, 2010 and 2011(Expressed in millions of rupiah and thousands of U.S. dollar, except share and tariff data)
December 31,
January 1,2010 2010 2011
Deferred tax liabilitiesProperty and equipment . . . . . . . . . . . . . . . . . . . . . . . . . . . . . . . . . . . . . 1,711,076 2,220,158 2,499,935Investments in subsidiaries/associated company—net of amortization
of goodwill and other intangible assets . . . . . . . . . . . . . . . . . . . . . . . . 308,680 398,974 366,606Incomes from leasing transaction . . . . . . . . . . . . . . . . . . . . . . . . . . . . . . — — 19,862Long-term prepaid licenses . . . . . . . . . . . . . . . . . . . . . . . . . . . . . . . . . . . 4,811 13,562 16,876Deferred debt and bonds issuance costs, consent solicitation fees and
discount . . . . . . . . . . . . . . . . . . . . . . . . . . . . . . . . . . . . . . . . . . . . . . . . 13,106 10,527 6,856Difference in transactions of equity changes in associated company . . . 1,460 1,460 1,460Others . . . . . . . . . . . . . . . . . . . . . . . . . . . . . . . . . . . . . . . . . . . . . . . . . . . 9,132 11,075 12,205
Total . . . . . . . . . . . . . . . . . . . . . . . . . . . . . . . . . . . . . . . . . . . . . . . . . . . . 2,048,265 2,655,756 2,923,800
Deferred tax liabilities—net . . . . . . . . . . . . . . . . . . . . . . . . . . . . . . . . . . . . . 1,647,138 1,944,898 2,157,153
The breakdown by entity of the deferred tax assets and liabilities:
January 1, 2010 December 31, 2010 December 31, 2011
DeferredTax
Assets
DeferredTax
Liabilities
DeferredTax
Assets
DeferredTax
Liabilities
DeferredTax
Assets
DeferredTax
Liabilities
Company . . . . . . . . . . . . . . . . . . . . . . . . . . . . — 1,647,138 — 1,944,898 — 2,157,153
SubsidiariesLintasarta . . . . . . . . . . . . . . . . . . . . . . . . 76,475 — 77,755 — 80,396 —IMM . . . . . . . . . . . . . . . . . . . . . . . . . . . . 11,524 — 17,263 — 33,718 —APE . . . . . . . . . . . . . . . . . . . . . . . . . . . . — 3,070 — 4,383 — 5,165ISP . . . . . . . . . . . . . . . . . . . . . . . . . . . . . — 619 — 428 — 1,027SMT . . . . . . . . . . . . . . . . . . . . . . . . . . . . — 991 — 1,597 — —LMD . . . . . . . . . . . . . . . . . . . . . . . . . . . . — — — — — —
Total . . . . . . . . . . . . . . . . . . . . . . . . . . . . . . . 87,999 1,651,818 95,018 1,951,306 114,114 2,163,345
The deferred tax assets of Lintasarta relate mainly to the deferred tax on the temporary difference in therecognition of depreciation of property and equipment.
The significant temporary differences on which deferred tax assets have been computed are not deductiblefor income tax purposes until the accrued employee benefits are paid, the allowance for impairment ofreceivables is realized upon the write-off of the receivables after fulfilling certain requirements under the IncomeTax Law, the allowance for impairment of investments in associated company and other long-term investments isrealized upon sale of the investments and the pension cost is paid.
The significant deferred tax liabilities relate to the differences in the book and tax bases of property andequipment, investments in subsidiaries / associated companies, long-term prepaid licenses, debt and bondsissuance costs, consent solicitation fees and discount.
F-65
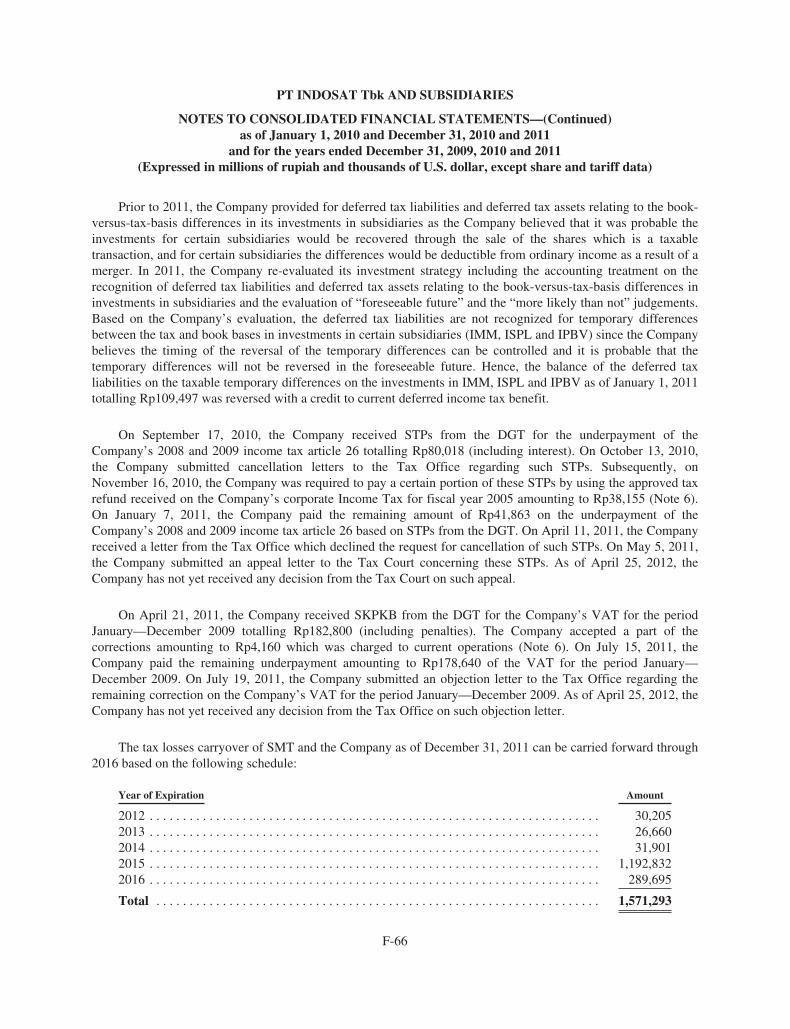
PT INDOSAT Tbk AND SUBSIDIARIES
NOTES TO CONSOLIDATED FINANCIAL STATEMENTS—(Continued)as of January 1, 2010 and December 31, 2010 and 2011
and for the years ended December 31, 2009, 2010 and 2011(Expressed in millions of rupiah and thousands of U.S. dollar, except share and tariff data)
Prior to 2011, the Company provided for deferred tax liabilities and deferred tax assets relating to the book-versus-tax-basis differences in its investments in subsidiaries as the Company believed that it was probable theinvestments for certain subsidiaries would be recovered through the sale of the shares which is a taxabletransaction, and for certain subsidiaries the differences would be deductible from ordinary income as a result of amerger. In 2011, the Company re-evaluated its investment strategy including the accounting treatment on therecognition of deferred tax liabilities and deferred tax assets relating to the book-versus-tax-basis differences ininvestments in subsidiaries and the evaluation of “foreseeable future” and the “more likely than not” judgements.Based on the Company’s evaluation, the deferred tax liabilities are not recognized for temporary differencesbetween the tax and book bases in investments in certain subsidiaries (IMM, ISPL and IPBV) since the Companybelieves the timing of the reversal of the temporary differences can be controlled and it is probable that thetemporary differences will not be reversed in the foreseeable future. Hence, the balance of the deferred taxliabilities on the taxable temporary differences on the investments in IMM, ISPL and IPBV as of January 1, 2011totalling Rp109,497 was reversed with a credit to current deferred income tax benefit.
On September 17, 2010, the Company received STPs from the DGT for the underpayment of theCompany’s 2008 and 2009 income tax article 26 totalling Rp80,018 (including interest). On October 13, 2010,the Company submitted cancellation letters to the Tax Office regarding such STPs. Subsequently, onNovember 16, 2010, the Company was required to pay a certain portion of these STPs by using the approved taxrefund received on the Company’s corporate Income Tax for fiscal year 2005 amounting to Rp38,155 (Note 6).On January 7, 2011, the Company paid the remaining amount of Rp41,863 on the underpayment of theCompany’s 2008 and 2009 income tax article 26 based on STPs from the DGT. On April 11, 2011, the Companyreceived a letter from the Tax Office which declined the request for cancellation of such STPs. On May 5, 2011,the Company submitted an appeal letter to the Tax Court concerning these STPs. As of April 25, 2012, theCompany has not yet received any decision from the Tax Court on such appeal.
On April 21, 2011, the Company received SKPKB from the DGT for the Company’s VAT for the periodJanuary—December 2009 totalling Rp182,800 (including penalties). The Company accepted a part of thecorrections amounting to Rp4,160 which was charged to current operations (Note 6). On July 15, 2011, theCompany paid the remaining underpayment amounting to Rp178,640 of the VAT for the period January—December 2009. On July 19, 2011, the Company submitted an objection letter to the Tax Office regarding theremaining correction on the Company’s VAT for the period January—December 2009. As of April 25, 2012, theCompany has not yet received any decision from the Tax Office on such objection letter.
The tax losses carryover of SMT and the Company as of December 31, 2011 can be carried forward through2016 based on the following schedule:
Year of Expiration Amount
2012 . . . . . . . . . . . . . . . . . . . . . . . . . . . . . . . . . . . . . . . . . . . . . . . . . . . . . . . . . . . . . . . . . . . . 30,2052013 . . . . . . . . . . . . . . . . . . . . . . . . . . . . . . . . . . . . . . . . . . . . . . . . . . . . . . . . . . . . . . . . . . . . 26,6602014 . . . . . . . . . . . . . . . . . . . . . . . . . . . . . . . . . . . . . . . . . . . . . . . . . . . . . . . . . . . . . . . . . . . . 31,9012015 . . . . . . . . . . . . . . . . . . . . . . . . . . . . . . . . . . . . . . . . . . . . . . . . . . . . . . . . . . . . . . . . . . . . 1,192,8322016 . . . . . . . . . . . . . . . . . . . . . . . . . . . . . . . . . . . . . . . . . . . . . . . . . . . . . . . . . . . . . . . . . . . . 289,695
Total . . . . . . . . . . . . . . . . . . . . . . . . . . . . . . . . . . . . . . . . . . . . . . . . . . . . . . . . . . . . . . . . . . . 1,571,293
F-66

PT INDOSAT Tbk AND SUBSIDIARIES
NOTES TO CONSOLIDATED FINANCIAL STATEMENTS—(Continued)as of January 1, 2010 and December 31, 2010 and 2011
and for the years ended December 31, 2009, 2010 and 2011(Expressed in millions of rupiah and thousands of U.S. dollar, except share and tariff data)
17. ACCRUED EXPENSES
This account consists of the following:
December 31,
January 1, 2010 2010 2011
Interest . . . . . . . . . . . . . . . . . . . . . . . . . . . . . . . . . . . . . . . . . . . . . . . . . . . . 228,743 339,957 319,880Network repairs and maintenance . . . . . . . . . . . . . . . . . . . . . . . . . . . . . . . 301,857 265,428 288,731Radio frequency fee . . . . . . . . . . . . . . . . . . . . . . . . . . . . . . . . . . . . . . . . . . 240,718 195,686 283,588Marketing . . . . . . . . . . . . . . . . . . . . . . . . . . . . . . . . . . . . . . . . . . . . . . . . . 125,908 120,092 214,907Employee benefits (Notes 21 and 28) . . . . . . . . . . . . . . . . . . . . . . . . . . . . 152,447 216,732 180,441Dealer incentive (Note 2f5.1) . . . . . . . . . . . . . . . . . . . . . . . . . . . . . . . . . . 80,778 125,836 82,615Blackberry access fee . . . . . . . . . . . . . . . . . . . . . . . . . . . . . . . . . . . . . . . . 10,340 20,679 79,627Rental . . . . . . . . . . . . . . . . . . . . . . . . . . . . . . . . . . . . . . . . . . . . . . . . . . . . . 18,225 28,090 59,929Universal Service Obligation (“USO”) . . . . . . . . . . . . . . . . . . . . . . . . . . . 62,378 59,899 59,716Utilities . . . . . . . . . . . . . . . . . . . . . . . . . . . . . . . . . . . . . . . . . . . . . . . . . . . 94,359 85,650 58,609Link . . . . . . . . . . . . . . . . . . . . . . . . . . . . . . . . . . . . . . . . . . . . . . . . . . . . . . 7,204 31,111 55,593Concession fee . . . . . . . . . . . . . . . . . . . . . . . . . . . . . . . . . . . . . . . . . . . . . . 2,468 38,005 35,370Consultancy fees . . . . . . . . . . . . . . . . . . . . . . . . . . . . . . . . . . . . . . . . . . . . 66,218 65,288 35,309General and administration . . . . . . . . . . . . . . . . . . . . . . . . . . . . . . . . . . . . 25,546 27,706 31,119Others (each below Rp20,000) . . . . . . . . . . . . . . . . . . . . . . . . . . . . . . . . . 108,372 90,726 106,043
Total . . . . . . . . . . . . . . . . . . . . . . . . . . . . . . . . . . . . . . . . . . . . . . . . . . . . . 1,525,561 1,710,885 1,891,477
F-67

PT INDOSAT Tbk AND SUBSIDIARIES
NOTES TO CONSOLIDATED FINANCIAL STATEMENTS—(Continued)as of January 1, 2010 and December 31, 2010 and 2011
and for the years ended December 31, 2009, 2010 and 2011(Expressed in millions of rupiah and thousands of U.S. dollar, except share and tariff data)
18. LOANS PAYABLE
This account consists of the following:
December 31,
January 1, 2010 2010 2011
Third parties—net of unamortized debt issuance cost and consentsolicitation fee of Rp250,888 in 2009, Rp189,979 in 2010 andRp146,511 in 2011; and unamortized debt discount of Rp25,892 in2009, Rp19,267 in 2010 and Rp11,891 in 2011 . . . . . . . . . . . . . . . . . . . . 11,563,262 9,553,906 8,727,473
Related party (Note 29)Mandiri—net of unamortized debt issuance cost and consent
solicitation fee of Rp7,511 in 2009, Rp2,955 in 2010 and Rp1,157in 2011 . . . . . . . . . . . . . . . . . . . . . . . . . . . . . . . . . . . . . . . . . . . . . . . . 2,592,489 1,297,045 998,843
Total loans payable . . . . . . . . . . . . . . . . . . . . . . . . . . . . . . . . . . . . . . . . . . . . 14,155,751 10,850,951 9,726,316
Less current maturities (net of unamortized debt issuance cost and consentsolicitation fees of Rp373 in 2010 and Rp2,295 in 2011):
Third parties . . . . . . . . . . . . . . . . . . . . . . . . . . . . . . . . . . . . . . . . . . . . . . 1,040,259 2,884,147 2,301,694Related party . . . . . . . . . . . . . . . . . . . . . . . . . . . . . . . . . . . . . . . . . . . . . 400,000 300,000 998,843
Total current maturities . . . . . . . . . . . . . . . . . . . . . . . . . . . . . . . . . . . . . . . . . 1,440,259 3,184,147 3,300,537
Long-term portionThird parties . . . . . . . . . . . . . . . . . . . . . . . . . . . . . . . . . . . . . . . . . . . . . . 10,523,003 6,669,759 6,425,779Related party . . . . . . . . . . . . . . . . . . . . . . . . . . . . . . . . . . . . . . . . . . . . . 2,192,489 997,045 —
12,715,492 7,666,804 6,425,779
The loans from third parties consist of the following:
December 31,
January 1, 2010 2010 2011
AB Svensk Exportkredit, Sweden with Guarantee from Export KreditNamnden—net of unamortized debt issuance cost of Rp36,909 in 2009,Rp27,593 in 2010 and Rp26,434 in 2011 . . . . . . . . . . . . . . . . . . . . . . . . . . 1,200,551 1,972,905 2,127,216
Syndicated U.S. Dollar Loan Facility—net of unamortized debt issuancecost and consent solicitation fee of Rp44,563 in 2009, Rp27,122 in 2010and Rp11,621 in 2011 . . . . . . . . . . . . . . . . . . . . . . . . . . . . . . . . . . . . . . . . . 4,185,437 4,018,828 2,069,484
BCA Revolving Time Loan—net of unamortized debt issuance cost ofRp736 . . . . . . . . . . . . . . . . . . . . . . . . . . . . . . . . . . . . . . . . . . . . . . . . . . . . . — — 1,499,264
HSBC France—net of unamortized debt issuance cost and consentsolicitation fee of Rp156,357 in 2009, Rp129,167 in 2010 and Rp104,536in 2011 . . . . . . . . . . . . . . . . . . . . . . . . . . . . . . . . . . . . . . . . . . . . . . . . . . . . . 1,736,678 1,500,434 1,356,403
BCA—net of unamortized debt issuance on cost and consent solicitation feeof Rp7,055 in 2009, Rp2,903 in 2010 and Rp1,138 in 2011 . . . . . . . . . . . . 3,092,945 1,297,097 998,862
Goldman Sachs InternationalPrincipal, net of unamortized debt discount of Rp25,892 in 2009,
Rp19,267 in 2010 and Rp11,891 in 2011 . . . . . . . . . . . . . . . . . . . . . . 408,408 415,033 422,409
F-68

PT INDOSAT Tbk AND SUBSIDIARIES
NOTES TO CONSOLIDATED FINANCIAL STATEMENTS—(Continued)as of January 1, 2010 and December 31, 2010 and 2011
and for the years ended December 31, 2009, 2010 and 2011(Expressed in millions of rupiah and thousands of U.S. dollar, except share and tariff data)
December 31,
January 1, 2010 2010 2011
Foreign Exchange (FX) Conversion Option—net of credit riskadjustment . . . . . . . . . . . . . . . . . . . . . . . . . . . . . . . . . . . . . . . . . . . . . . 97,942 54,595 49,518
9-Year Commercial Loan—net of unamortized debt issuance cost andconsent solicitation fee of Rp3,707 in 2009, Rp2,821 in 2010 andRp2,046 in 2011 . . . . . . . . . . . . . . . . . . . . . . . . . . . . . . . . . . . . . . . . . . . . . 237,733 203,805 181,834
Investment Credit Facility 6 from CIMB Niaga . . . . . . . . . . . . . . . . . . . . . . . 23,772 52,483 22,483Finnish Export Credit Ltd.—net of unamortized debt issuance cost and
consent solicitation fee of Rp1,113 in 2009 and Rp373 in 2010 . . . . . . . . 106,047 33,793 —Investment Credit Facility 5 from CIMB Niaga . . . . . . . . . . . . . . . . . . . . . . . 24,933 4,933 —DBS—net of unamortized debt issuance cost and consent solicitation fee of
Rp1,184 . . . . . . . . . . . . . . . . . . . . . . . . . . . . . . . . . . . . . . . . . . . . . . . . . . . . 448,816 — —
Total . . . . . . . . . . . . . . . . . . . . . . . . . . . . . . . . . . . . . . . . . . . . . . . . . . . . . . . . . 11,563,262 9,553,906 8,727,473Less current maturities (net of unamortized debt Issuance costs and consent
solicitation fees totaling Rp373 in 2010 and Rp2,295 in 2011) . . . . . . . . . 1,040,259 2,884,147 2,301,694
Long-term portion . . . . . . . . . . . . . . . . . . . . . . . . . . . . . . . . . . . . . . . . . . . . . 10,523,003 6,669,759 6,425,779
The details of the loans from a related party and third parties are as follows:
Counterparties Loan Type Maturity Amount Interest Structure Early Repayment
a. Mandiri* • 5-year unsecuredcredit facility 1
• Loan drawdownsare payableannually
September 18,2012
Rp2,000,000 • Year 1: 9.75%p.a.
• Year 2: 10.5%p.a.
• Years 3-5:Average 3-monthJIBOR + 1.5%p.a.
• Payable quarterly
• Without penaltyif the repaymentis made after the24th month afterthe agreementdate subject to7 days’ priorwritten notice
• With penalty of2% of theprepaid amountfor repaymentprior to the24th month afterthe agreementdate
Mandiri* • 5-year unsecuredcredit facility 2
• Loan drawdownsare payableannually
July 28, 2014 Rp1,000,000 • Average 3-monthJIBOR + 4% p.a.
• EffectiveMay 31, 2010:average 3-monthJIBOR + 2.25%p.a.
• Payable quarterly
• Permitted—subject to 2%penalty of theprepaid amount
• On November15, 2010, theCompany madean earlyrepayment of theremaining loanbalanceamounting toRp900,000.
* related party (Note 29)
F-69
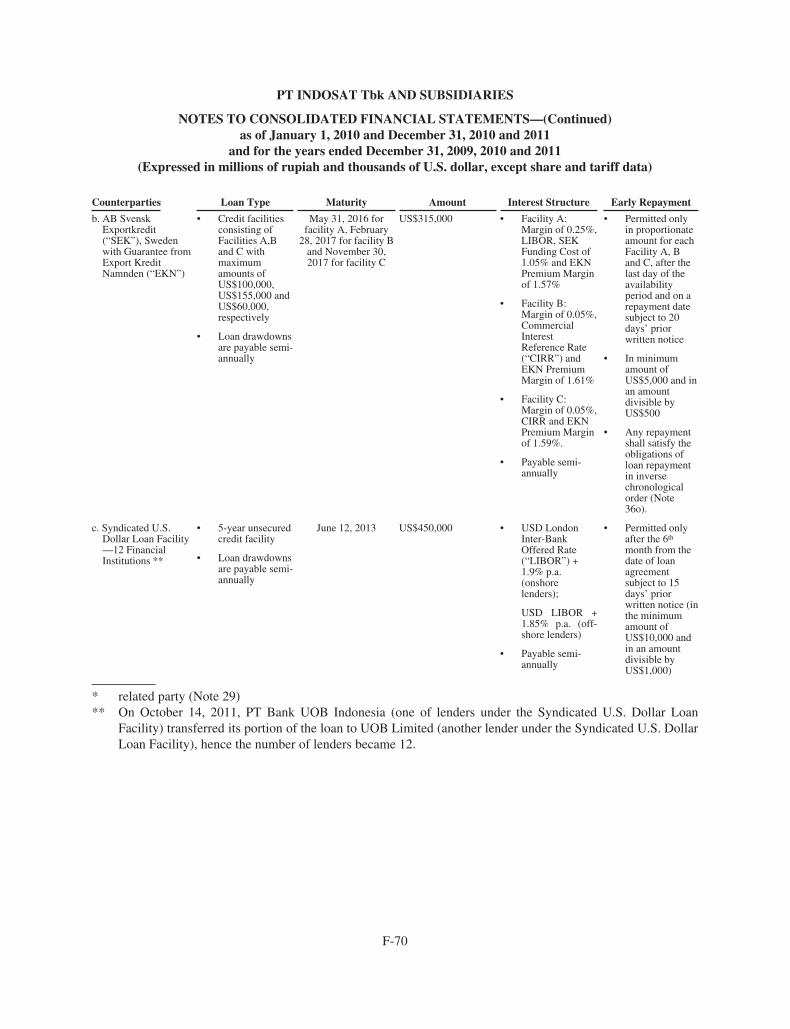
PT INDOSAT Tbk AND SUBSIDIARIES
NOTES TO CONSOLIDATED FINANCIAL STATEMENTS—(Continued)as of January 1, 2010 and December 31, 2010 and 2011
and for the years ended December 31, 2009, 2010 and 2011(Expressed in millions of rupiah and thousands of U.S. dollar, except share and tariff data)
Counterparties Loan Type Maturity Amount Interest Structure Early Repayment
b. AB SvenskExportkredit(“SEK”), Swedenwith Guarantee fromExport KreditNamnden (“EKN”)
• Credit facilitiesconsisting ofFacilities A,Band C withmaximumamounts ofUS$100,000,US$155,000 andUS$60,000,respectively
• Loan drawdownsare payable semi-annually
May 31, 2016 forfacility A, February
28, 2017 for facility Band November 30,2017 for facility C
US$315,000 • Facility A:Margin of 0.25%,LIBOR, SEKFunding Cost of1.05% and EKNPremium Marginof 1.57%
• Facility B:Margin of 0.05%,CommercialInterestReference Rate(“CIRR”) andEKN PremiumMargin of 1.61%
• Facility C:Margin of 0.05%,CIRR and EKNPremium Marginof 1.59%.
• Payable semi-annually
• Permitted onlyin proportionateamount for eachFacility A, Band C, after thelast day of theavailabilityperiod and on arepayment datesubject to 20days’ priorwritten notice
• In minimumamount ofUS$5,000 and inan amountdivisible byUS$500
• Any repaymentshall satisfy theobligations ofloan repaymentin inversechronologicalorder (Note36o).
c. Syndicated U.S.Dollar Loan Facility—12 FinancialInstitutions **
• 5-year unsecuredcredit facility
• Loan drawdownsare payable semi-annually
June 12, 2013 US$450,000 • USD LondonInter-BankOffered Rate(“LIBOR”) +1.9% p.a.(onshorelenders);
USD LIBOR +1.85% p.a. (off-shore lenders)
• Payable semi-annually
• Permitted onlyafter the 6th
month from thedate of loanagreementsubject to 15days’ priorwritten notice (inthe minimumamount ofUS$10,000 andin an amountdivisible byUS$1,000)
* related party (Note 29)** On October 14, 2011, PT Bank UOB Indonesia (one of lenders under the Syndicated U.S. Dollar Loan
Facility) transferred its portion of the loan to UOB Limited (another lender under the Syndicated U.S. DollarLoan Facility), hence the number of lenders became 12.
F-70

PT INDOSAT Tbk AND SUBSIDIARIES
NOTES TO CONSOLIDATED FINANCIAL STATEMENTS—(Continued)as of January 1, 2010 and December 31, 2010 and 2011
and for the years ended December 31, 2009, 2010 and 2011(Expressed in millions of rupiah and thousands of U.S. dollar, except share and tariff data)
Counterparties Loan Type Maturity Amount Interest Structure Early Repayment
d. BCA • The revolvingtime loan withmaximum amountof Rp1,000,000
• Each drawdownmatures 1 monthfrom thedrawdown date.Subsequently, onAugust 9, 2011,the Companyobtained anapproval fromBCA to amend thematurity date ofeach drawdown tobecome at thelatest onFebruary 10, 2014
• On December 1,2011, the facilitywas amended toincrease thefacility amount upto Rp1,500,000and change theinterest rate.
February 10, 2014 Rp1,500,000 • JIBOR + 1.4% p.a.However, startingDecember 1, 2011,JIBOR + 1.25%p.a
• Payable monthly
• Permitted subject to 1day prior writtennotice
• The Company mayrepay the whole orany part of the loan(Notes 36j, 36u and36ab).
e. HSBC France • 12 year -COFACEterm facility
• Payable in twentysemi-annualinstallments
September 30, 2019 US$157,243 • 5.69% p.a.
• Payablesemi-annually
• Permitted with acorrespondingproportionatevoluntary prepaymentunder theSINOSURE Facilityafter the last day ofthe availability periodand on a repaymentdate subject to 30days’ prior writtennotice
• In minimum amountof US$10,000 and inan amount divisibleby US$1,000
• Any repayment shallsatisfy the obligationsof loan repayment ininverse chronologicalorder.
F-71

PT INDOSAT Tbk AND SUBSIDIARIES
NOTES TO CONSOLIDATED FINANCIAL STATEMENTS—(Continued)as of January 1, 2010 and December 31, 2010 and 2011
and for the years ended December 31, 2009, 2010 and 2011(Expressed in millions of rupiah and thousands of U.S. dollar, except share and tariff data)
Counterparties Loan Type Maturity Amount Interest Structure Early Repayment
e. HSBC France • 12 year -SINOSUREterm facility
• Payable in twentysemi-annualinstallments
September 30, 2019 US$44,200 • USD LIBOR +0.35% p.a.
• Payable semi-annually
• Permitted with acorrespondingproportionatevoluntary prepaymentunder the COFACEFacility after the lastday of the availabilityperiod and on arepayment datesubject to 30 days’prior written notice
• In minimum amountof US$10,000 and inan amount divisibleby US$1,000
• Any repayment shallsatisfy the obligationsof loan repayment ininverse chronologicalorder.
f. BCA • 5-year unsecuredcredit facility 1
• Loan drawdownsare payableannually
September 27, 2012 Rp2,000,000 • Year 1: 9.75% p.a.
• Year 2: 10.5% p.a.
• Years 3-5: 3-month JIBOR +1.5% p.a.
• Payable quarterly
• Without penalty if therepayment is madeafter the 24th monthafter the agreementdate subject to 7days’ prior writtennotice
• With penalty of 2%of the prepaid amountfor repayment prior tothe 24th month afterthe agreement date.
g. Goldman SachsInternational(GSI)
• Investment loan
• provides an “FXConversionOption” for GSI toconvert the loanpayable into aU.S. dollar loan ofUS$50,000 onMay 30, 2012(“FX ConversionOption”).
• Fair value of FXConversionOption as ofDecember 31,2009, 2010 and2011 amounting toUS$10,419.43,US$6,072.20 andUS$5,460.78(equivalent toRp97,942,Rp54,595 andRp49,518),respectively(Note 32)
May 30, 2013 Rp434,300 • 8.75% p.a.
• Payable quarterly
• If GSI takes FXConversionOption, startingMay 30, 2012, theloan will bearinterest at thefixed annual rateof 6.45% appliedon the US$50,000principal.
• Certain changesaffecting withholdingtaxes in the UnitedKingdom orIndonesia
• Default underGuaranteed Notesdue 2012
• Default under theCompany’s USDNotes and IDR Bonds
• Redemption,purchase orcancellation of theGuaranteed NotesDue 2012 and thereare no USD IndosatNotes outstandingupon suchredemption, purchaseor cancellation.
• Change of control inthe Company.
F-72
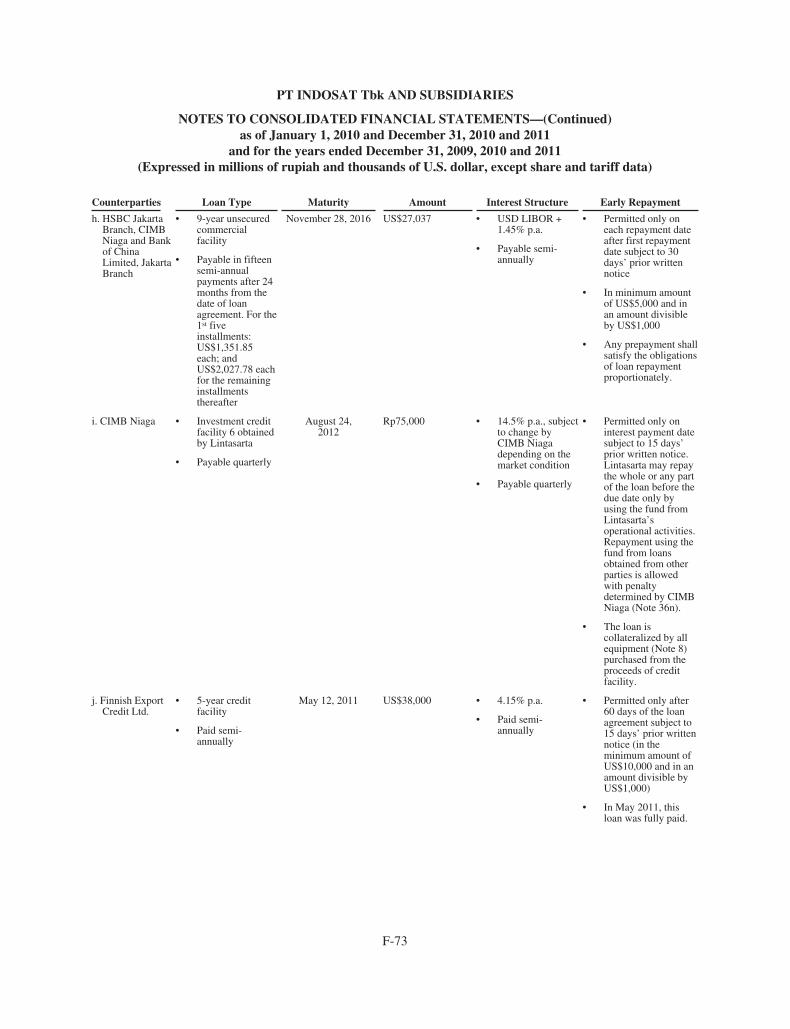
PT INDOSAT Tbk AND SUBSIDIARIES
NOTES TO CONSOLIDATED FINANCIAL STATEMENTS—(Continued)as of January 1, 2010 and December 31, 2010 and 2011
and for the years ended December 31, 2009, 2010 and 2011(Expressed in millions of rupiah and thousands of U.S. dollar, except share and tariff data)
Counterparties Loan Type Maturity Amount Interest Structure Early Repayment
h. HSBC JakartaBranch, CIMBNiaga and Bankof ChinaLimited, JakartaBranch
• 9-year unsecuredcommercialfacility
• Payable in fifteensemi-annualpayments after 24months from thedate of loanagreement. For the1st fiveinstallments:US$1,351.85each; andUS$2,027.78 eachfor the remaininginstallmentsthereafter
November 28, 2016 US$27,037 • USD LIBOR +1.45% p.a.
• Payable semi-annually
• Permitted only oneach repayment dateafter first repaymentdate subject to 30days’ prior writtennotice
• In minimum amountof US$5,000 and inan amount divisibleby US$1,000
• Any prepayment shallsatisfy the obligationsof loan repaymentproportionately.
i. CIMB Niaga • Investment creditfacility 6 obtainedby Lintasarta
• Payable quarterly
August 24,2012
Rp75,000 • 14.5% p.a., subjectto change byCIMB Niagadepending on themarket condition
• Payable quarterly
• Permitted only oninterest payment datesubject to 15 days’prior written notice.Lintasarta may repaythe whole or any partof the loan before thedue date only byusing the fund fromLintasarta’soperational activities.Repayment using thefund from loansobtained from otherparties is allowedwith penaltydetermined by CIMBNiaga (Note 36n).
• The loan iscollateralized by allequipment (Note 8)purchased from theproceeds of creditfacility.
j. Finnish ExportCredit Ltd.
• 5-year creditfacility
• Paid semi-annually
May 12, 2011 US$38,000 • 4.15% p.a.
• Paid semi-annually
• Permitted only after60 days of the loanagreement subject to15 days’ prior writtennotice (in theminimum amount ofUS$10,000 and in anamount divisible byUS$1,000)
• In May 2011, thisloan was fully paid.
F-73

PT INDOSAT Tbk AND SUBSIDIARIES
NOTES TO CONSOLIDATED FINANCIAL STATEMENTS—(Continued)as of January 1, 2010 and December 31, 2010 and 2011
and for the years ended December 31, 2009, 2010 and 2011(Expressed in millions of rupiah and thousands of U.S. dollar, except share and tariff data)
Counterparties Loan Type Maturity Amount Interest Structure Early Repayment
k. CIMB Niaga • Investment creditfacility 5 obtainedby Lintasarta
• Paid quarterly
January 10, 2011 Rp50,000 • 1-month SBI +2.25% p.a.
• Paid quarterly
• Permitted only oninterest payment datesubject to 13 days’prior written notice.Lintasarta may repaythe whole or any partof the loan before thedue date only byusing the fund fromLintasarta’soperational activities.Repayment using thefund from loansobtained from otherparties was allowedwith 1% penalty ofthe early repaidamount.
• The loan wascollateralized by allequipment (Note 8)purchased from theproceeds of creditfacility
• In January 2011, thisloan was fully paid.
l. DBS • 5-year unsecuredcredit facility
• Loan drawdownsare payableannually
November 1, 2012 Rp500,000 • Year 1: 9.7%
• Year 2: 10.4%
• Years 3-5: 3-month SBI + 1.5%p.a.
• Payable quarterly
• Without penalty if therepayment is madeafter the 24th monthafter the agreementdate subject to 15days’ prior writtennotice
• With penalty of 1%of the prepaid amountfor repayment prior tothe 24th month afterthe agreement date
• On October 30, 2010,the Company madean early repayment ofthe remaining loanbalance amounting toRp400,000.
F-74
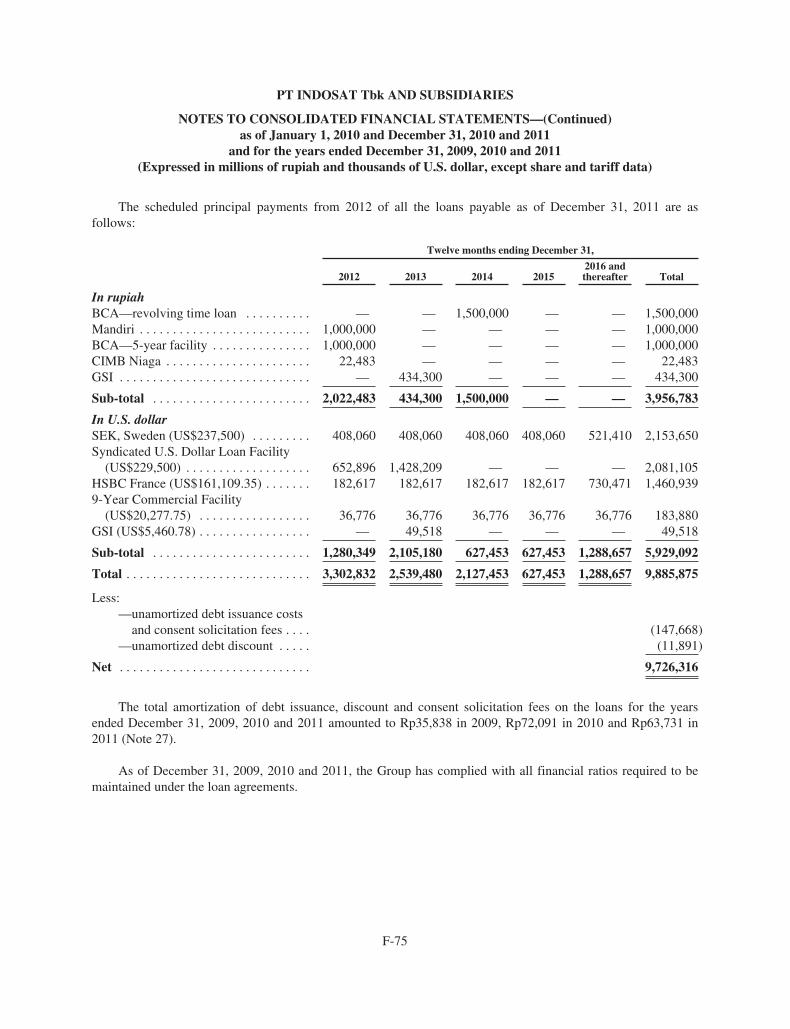
PT INDOSAT Tbk AND SUBSIDIARIES
NOTES TO CONSOLIDATED FINANCIAL STATEMENTS—(Continued)as of January 1, 2010 and December 31, 2010 and 2011
and for the years ended December 31, 2009, 2010 and 2011(Expressed in millions of rupiah and thousands of U.S. dollar, except share and tariff data)
The scheduled principal payments from 2012 of all the loans payable as of December 31, 2011 are asfollows:
Twelve months ending December 31,
2012 2013 2014 20152016 andthereafter Total
In rupiahBCA—revolving time loan . . . . . . . . . . — — 1,500,000 — — 1,500,000Mandiri . . . . . . . . . . . . . . . . . . . . . . . . . . 1,000,000 — — — — 1,000,000BCA—5-year facility . . . . . . . . . . . . . . . 1,000,000 — — — — 1,000,000CIMB Niaga . . . . . . . . . . . . . . . . . . . . . . 22,483 — — — — 22,483GSI . . . . . . . . . . . . . . . . . . . . . . . . . . . . . — 434,300 — — — 434,300
Sub-total . . . . . . . . . . . . . . . . . . . . . . . . 2,022,483 434,300 1,500,000 — — 3,956,783
In U.S. dollarSEK, Sweden (US$237,500) . . . . . . . . . 408,060 408,060 408,060 408,060 521,410 2,153,650Syndicated U.S. Dollar Loan Facility
(US$229,500) . . . . . . . . . . . . . . . . . . . 652,896 1,428,209 — — — 2,081,105HSBC France (US$161,109.35) . . . . . . . 182,617 182,617 182,617 182,617 730,471 1,460,9399-Year Commercial Facility
(US$20,277.75) . . . . . . . . . . . . . . . . . 36,776 36,776 36,776 36,776 36,776 183,880GSI (US$5,460.78) . . . . . . . . . . . . . . . . . — 49,518 — — — 49,518
Sub-total . . . . . . . . . . . . . . . . . . . . . . . . 1,280,349 2,105,180 627,453 627,453 1,288,657 5,929,092
Total . . . . . . . . . . . . . . . . . . . . . . . . . . . . 3,302,832 2,539,480 2,127,453 627,453 1,288,657 9,885,875
Less:—unamortized debt issuance costs
and consent solicitation fees . . . . (147,668)—unamortized debt discount . . . . . (11,891)
Net . . . . . . . . . . . . . . . . . . . . . . . . . . . . . 9,726,316
The total amortization of debt issuance, discount and consent solicitation fees on the loans for the yearsended December 31, 2009, 2010 and 2011 amounted to Rp35,838 in 2009, Rp72,091 in 2010 and Rp63,731 in2011 (Note 27).
As of December 31, 2009, 2010 and 2011, the Group has complied with all financial ratios required to bemaintained under the loan agreements.
F-75
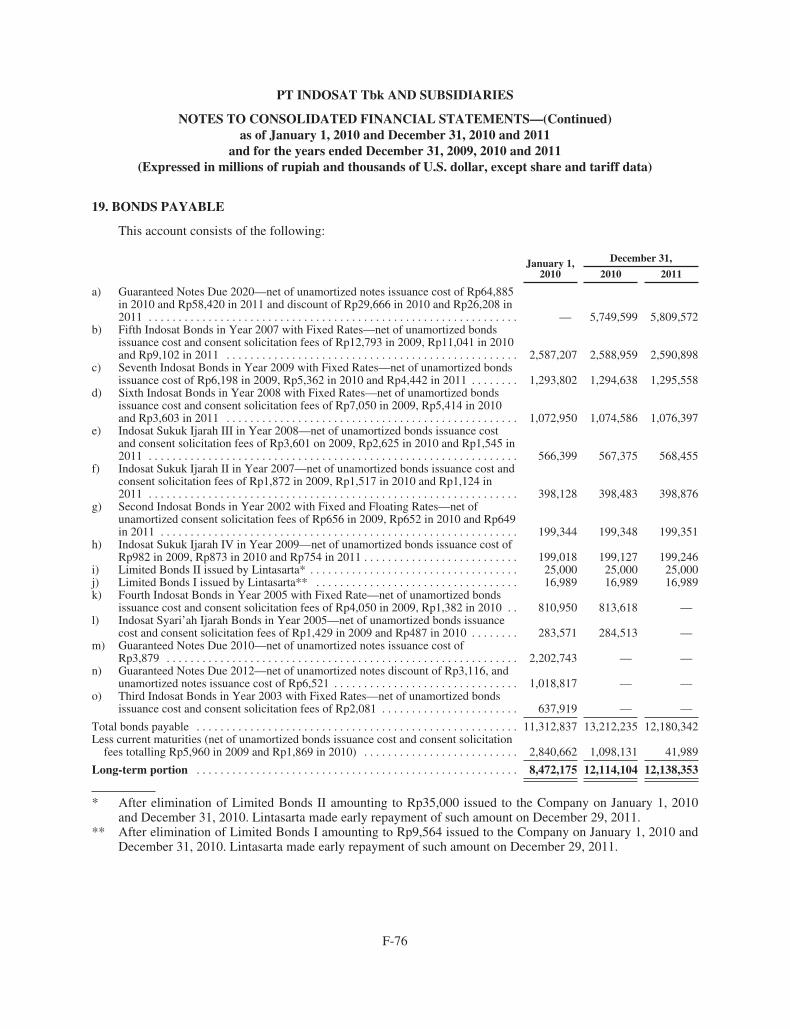
PT INDOSAT Tbk AND SUBSIDIARIES
NOTES TO CONSOLIDATED FINANCIAL STATEMENTS—(Continued)as of January 1, 2010 and December 31, 2010 and 2011
and for the years ended December 31, 2009, 2010 and 2011(Expressed in millions of rupiah and thousands of U.S. dollar, except share and tariff data)
19. BONDS PAYABLE
This account consists of the following:
January 1,2010
December 31,
2010 2011
a) Guaranteed Notes Due 2020—net of unamortized notes issuance cost of Rp64,885in 2010 and Rp58,420 in 2011 and discount of Rp29,666 in 2010 and Rp26,208 in2011 . . . . . . . . . . . . . . . . . . . . . . . . . . . . . . . . . . . . . . . . . . . . . . . . . . . . . . . . . . . . . . — 5,749,599 5,809,572
b) Fifth Indosat Bonds in Year 2007 with Fixed Rates—net of unamortized bondsissuance cost and consent solicitation fees of Rp12,793 in 2009, Rp11,041 in 2010and Rp9,102 in 2011 . . . . . . . . . . . . . . . . . . . . . . . . . . . . . . . . . . . . . . . . . . . . . . . . . 2,587,207 2,588,959 2,590,898
c) Seventh Indosat Bonds in Year 2009 with Fixed Rates—net of unamortized bondsissuance cost of Rp6,198 in 2009, Rp5,362 in 2010 and Rp4,442 in 2011 . . . . . . . . 1,293,802 1,294,638 1,295,558
d) Sixth Indosat Bonds in Year 2008 with Fixed Rates—net of unamortized bondsissuance cost and consent solicitation fees of Rp7,050 in 2009, Rp5,414 in 2010and Rp3,603 in 2011 . . . . . . . . . . . . . . . . . . . . . . . . . . . . . . . . . . . . . . . . . . . . . . . . . 1,072,950 1,074,586 1,076,397
e) Indosat Sukuk Ijarah III in Year 2008—net of unamortized bonds issuance costand consent solicitation fees of Rp3,601 on 2009, Rp2,625 in 2010 and Rp1,545 in2011 . . . . . . . . . . . . . . . . . . . . . . . . . . . . . . . . . . . . . . . . . . . . . . . . . . . . . . . . . . . . . . 566,399 567,375 568,455
f) Indosat Sukuk Ijarah II in Year 2007—net of unamortized bonds issuance cost andconsent solicitation fees of Rp1,872 in 2009, Rp1,517 in 2010 and Rp1,124 in2011 . . . . . . . . . . . . . . . . . . . . . . . . . . . . . . . . . . . . . . . . . . . . . . . . . . . . . . . . . . . . . . 398,128 398,483 398,876
g) Second Indosat Bonds in Year 2002 with Fixed and Floating Rates—net ofunamortized consent solicitation fees of Rp656 in 2009, Rp652 in 2010 and Rp649in 2011 . . . . . . . . . . . . . . . . . . . . . . . . . . . . . . . . . . . . . . . . . . . . . . . . . . . . . . . . . . . . 199,344 199,348 199,351
h) Indosat Sukuk Ijarah IV in Year 2009—net of unamortized bonds issuance cost ofRp982 in 2009, Rp873 in 2010 and Rp754 in 2011 . . . . . . . . . . . . . . . . . . . . . . . . . . 199,018 199,127 199,246
i) Limited Bonds II issued by Lintasarta* . . . . . . . . . . . . . . . . . . . . . . . . . . . . . . . . . . . 25,000 25,000 25,000j) Limited Bonds I issued by Lintasarta** . . . . . . . . . . . . . . . . . . . . . . . . . . . . . . . . . . 16,989 16,989 16,989k) Fourth Indosat Bonds in Year 2005 with Fixed Rate—net of unamortized bonds
issuance cost and consent solicitation fees of Rp4,050 in 2009, Rp1,382 in 2010 . . 810,950 813,618 —l) Indosat Syari’ah Ijarah Bonds in Year 2005—net of unamortized bonds issuance
cost and consent solicitation fees of Rp1,429 in 2009 and Rp487 in 2010 . . . . . . . . 283,571 284,513 —m) Guaranteed Notes Due 2010—net of unamortized notes issuance cost of
Rp3,879 . . . . . . . . . . . . . . . . . . . . . . . . . . . . . . . . . . . . . . . . . . . . . . . . . . . . . . . . . . . 2,202,743 — —n) Guaranteed Notes Due 2012—net of unamortized notes discount of Rp3,116, and
unamortized notes issuance cost of Rp6,521 . . . . . . . . . . . . . . . . . . . . . . . . . . . . . . . 1,018,817 — —o) Third Indosat Bonds in Year 2003 with Fixed Rates—net of unamortized bonds
issuance cost and consent solicitation fees of Rp2,081 . . . . . . . . . . . . . . . . . . . . . . . 637,919 — —
Total bonds payable . . . . . . . . . . . . . . . . . . . . . . . . . . . . . . . . . . . . . . . . . . . . . . . . . . . . . . 11,312,837 13,212,235 12,180,342Less current maturities (net of unamortized bonds issuance cost and consent solicitation
fees totalling Rp5,960 in 2009 and Rp1,869 in 2010) . . . . . . . . . . . . . . . . . . . . . . . . . . 2,840,662 1,098,131 41,989
Long-term portion . . . . . . . . . . . . . . . . . . . . . . . . . . . . . . . . . . . . . . . . . . . . . . . . . . . . . . 8,472,175 12,114,104 12,138,353
* After elimination of Limited Bonds II amounting to Rp35,000 issued to the Company on January 1, 2010and December 31, 2010. Lintasarta made early repayment of such amount on December 29, 2011.
** After elimination of Limited Bonds I amounting to Rp9,564 issued to the Company on January 1, 2010 andDecember 31, 2010. Lintasarta made early repayment of such amount on December 29, 2011.
F-76

PT INDOSAT Tbk AND SUBSIDIARIES
NOTES TO CONSOLIDATED FINANCIAL STATEMENTS—(Continued)as of January 1, 2010 and December 31, 2010 and 2011
and for the years ended December 31, 2009, 2010 and 2011(Expressed in millions of rupiah and thousands of U.S. dollar, except share and tariff data)
BondNominalAmount Interest Maturity Remarks
a. GuaranteedNotes Due 2020
US$650,000 • 7.375% p.a.• Payable semi-
annually
July 29, 2020 The notes are redeemable at theoption of IPBV:
• At any time on or afterJuly 29, 2015.
• Prior to July 29, 2013, IPBVmay redeem up to amaximum of 35% of theoriginal aggregate principalamount.
• At any time, upon not lessthan 30 days’ nor more than60 days’ prior notice, at aprice equal to 100% of theprincipal amount thereof,plus any accrued and unpaidinterest to (but notincluding) the redemptiondate and any additionalamounts, in the event ofcertain changes affectingwithholding taxes inIndonesia and theNetherlands.
• Upon a change in control ofIPBV, the holder of thenotes has the right to requireIPBV to repurchase all orany part of such holder’snotes.
• Based on latest rating reports(released in December 2010,September 2011 and July2011), the notes have BB(stable outlook), Ba1 (stableoutlook) and BBB- (positiveoutlook) ratings fromStandard & Poor’s (“S&P”),Moody’s Investors Service(“Moody’s) and FitchRatings (“Fitch”),respectively (Note 36l).
F-77

PT INDOSAT Tbk AND SUBSIDIARIES
NOTES TO CONSOLIDATED FINANCIAL STATEMENTS—(Continued)as of January 1, 2010 and December 31, 2010 and 2011
and for the years ended December 31, 2009, 2010 and 2011(Expressed in millions of rupiah and thousands of U.S. dollar, except share and tariff data)
BondNominalAmount Interest Maturity Remarks
b. Fifth IndosatBonds in Year2007
• Series A
• Series B
Rp1,230,000
Rp1,370,000
• 10.20% p.a.
• Payable quarterly
• 10.65% p.a.
• Payable quarterly
May 29, 2014
May 29, 2017
• The Company has option tobuy back part or all of thebonds, after the 1st
anniversary of the bonds, atmarket price temporarily oras an early settlement.
• Based on the latest ratingreport released in October2011, the bonds have idAA+(stable outlook) rating fromPT Pemeringkat EfekIndonesia (“Pefindo”).
c. Seventh IndosatBonds in Year2009
• Series A Rp700,000 • 11.25% p.a.
• Payable quarterly
December 8,2014
• The Company has option tobuy back part or all of thebonds, after the 1st
anniversary of the bonds, atmarket price temporarily oras an early settlement.
• Series B Rp600,000 • 11.75% p.a.
• Payable quarterly
December 8,2016
• Based on the latest ratingreport released in October2011, the bonds have idAA+(stable outlook) rating fromPefindo.
d. Sixth IndosatBonds in Year2008
• Series A Rp760,000 • 10.25% p.a.
• Payable quarterly
April 9, 2013 • The Company has option tobuy back part or all of thebonds, after the 1st
anniversary of the bonds, atmarket price temporarily oras an early settlement.
• Series B Rp320,000 • 10.80% p.a.
• Payable quarterly
April 9, 2015 • Based on the latest ratingreport released in October2011, the bonds have idAA+(stable outlook) rating fromPefindo.
F-78

PT INDOSAT Tbk AND SUBSIDIARIES
NOTES TO CONSOLIDATED FINANCIAL STATEMENTS—(Continued)as of January 1, 2010 and December 31, 2010 and 2011
and for the years ended December 31, 2009, 2010 and 2011(Expressed in millions of rupiah and thousands of U.S. dollar, except share and tariff data)
BondNominalAmount Interest Maturity Remarks
e. Indosat SukukIjarah III in Year2008 (“SukukIjarah III”)
Rp570,000 • Bondholders areentitled to annualfixed Ijarah return(“Cicilan ImbalanIjarah”) totallingRp58,425, payableon a quarterly basisstarting July 9, 2008up to April 9, 2013.
April 9,2013
• The Company has option tobuy back part or all of thebonds, after the 1st
anniversary of the bonds, atmarket price.
• Based on the latest ratingreport released in October2011, the bonds haveidAA+(sy) (stable outlook)rating from Pefindo.
f. Indosat SukukIjarah II in Year2007 (“SukukIjarah II”)
Rp400,000 • Bondholders areentitled to annualfixed Ijarah return(“Cicilan ImbalanIjarah”) totallingRp40,800, payableon a quarterly basisstarting August 29,2007 up to May 29,2014.
May 29,2014
• The Company has option tobuy back part or all of thebonds, after the 1st
anniversary of the bonds, atmarket price.
• Based on the latest ratingreport released in October2011, the bonds haveidAA+(sy) (stable outlook)rating from Pefindo.
g. Second IndosatBonds in Year2002—Series B
Rp200,000 • 16% p.a.
• Payable quarterly
November 6,2032
• The Company has buybackoption on the 10th, 15th, 20th
and 25th anniversaries of thebonds at 101% of the bonds’nominal value and thebondholder has sell option ifthe rating of the bondsdecreases to idAA- or loweror on the 15th, 20th and 25th
anniversaries of the bonds.
• Based on the latest ratingreport released in October2011, the bonds have idAA+(stable outlook) rating fromPefindo.
F-79

PT INDOSAT Tbk AND SUBSIDIARIES
NOTES TO CONSOLIDATED FINANCIAL STATEMENTS—(Continued)as of January 1, 2010 and December 31, 2010 and 2011
and for the years ended December 31, 2009, 2010 and 2011(Expressed in millions of rupiah and thousands of U.S. dollar, except share and tariff data)
BondNominalAmount Interest Maturity Remarks
h. Indosat SukukIjarah IV in Year2009 (“SukukIjarah IV”)
• Series A Rp28,000 • Bondholders areentitled to annualfixed ijarah return(“Cicilan ImbalanIjarah”) totallingRp3,150, payable ona quarterly basisstarting March 8,2010 up toDecember 8, 2014.
December 8,2014
• The Company has option tobuy back part or all of thebonds, after the 1st
anniversary of the bonds, atmarket price.
• Based on the latest ratingreport released in October2011, the bonds haveidAA+(sy) (stable outlook)rating from Pefindo.
• Series B Rp172,000 • Bondholders areentitled to annualfixed ijarah return(“Cicilan ImbalanIjarah”) totallingRp20,210, payableon a quarterly basisstarting March 8,2010 up toDecember 8, 2016.
December 8,2016
i. Limited Bonds IIissued byLintasarta(amended onAugust 25, 2009)
Rp66,150,with theremainingamount ofRp60,000sinceJune 14,2009
• Average 3-monthrupiah time depositrates with Mandiri,BNI, BRI and BTN,plus a fixedpremium of 3% (Themaximum limit offloating rates was19% and theminimum limit was11% p.a. and startingJune 14, 2009, theminimum limitincreased to12.75%.)
• Payable quarterly
June 14,2009
extended toJune 14,
2012
• Based on Lintasarta’sdecision and the approvalfrom its bondholders,Lintasarta made earlyrepayment of the portionissued to the Companyamounting to Rp35,000 onDecember 29, 2011. Suchearly repayment is notcharged for any penalty.
• Subsequently, on February29, 2012, Lintasarta madeearly repayment of theremaining balance ofRp25,000 (Note 36r).
F-80
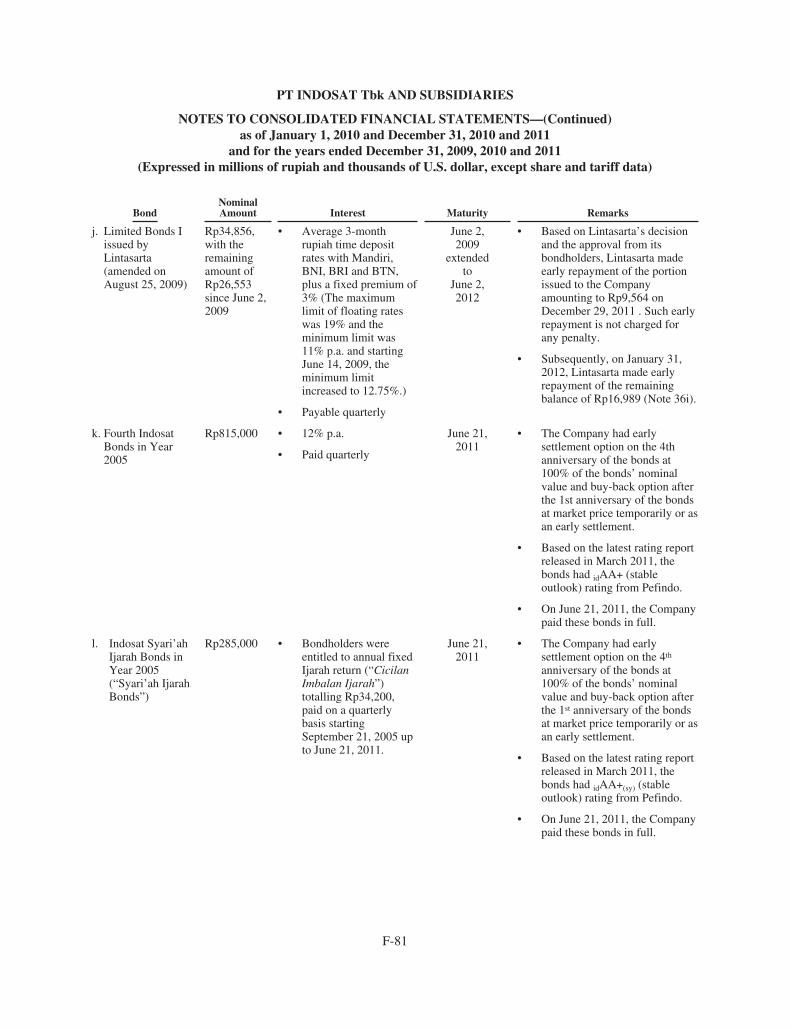
PT INDOSAT Tbk AND SUBSIDIARIES
NOTES TO CONSOLIDATED FINANCIAL STATEMENTS—(Continued)as of January 1, 2010 and December 31, 2010 and 2011
and for the years ended December 31, 2009, 2010 and 2011(Expressed in millions of rupiah and thousands of U.S. dollar, except share and tariff data)
BondNominalAmount Interest Maturity Remarks
j. Limited Bonds Iissued byLintasarta(amended onAugust 25, 2009)
Rp34,856,with theremainingamount ofRp26,553since June 2,2009
• Average 3-monthrupiah time depositrates with Mandiri,BNI, BRI and BTN,plus a fixed premium of3% (The maximumlimit of floating rateswas 19% and theminimum limit was11% p.a. and startingJune 14, 2009, theminimum limitincreased to 12.75%.)
• Payable quarterly
June 2,2009
extendedto
June 2,2012
• Based on Lintasarta’s decisionand the approval from itsbondholders, Lintasarta madeearly repayment of the portionissued to the Companyamounting to Rp9,564 onDecember 29, 2011 . Such earlyrepayment is not charged forany penalty.
• Subsequently, on January 31,2012, Lintasarta made earlyrepayment of the remainingbalance of Rp16,989 (Note 36i).
k. Fourth IndosatBonds in Year2005
Rp815,000 • 12% p.a.
• Paid quarterly
June 21,2011
• The Company had earlysettlement option on the 4thanniversary of the bonds at100% of the bonds’ nominalvalue and buy-back option afterthe 1st anniversary of the bondsat market price temporarily or asan early settlement.
• Based on the latest rating reportreleased in March 2011, thebonds had idAA+ (stableoutlook) rating from Pefindo.
• On June 21, 2011, the Companypaid these bonds in full.
l. Indosat Syari’ahIjarah Bonds inYear 2005(“Syari’ah IjarahBonds”)
Rp285,000 • Bondholders wereentitled to annual fixedIjarah return (“CicilanImbalan Ijarah”)totalling Rp34,200,paid on a quarterlybasis startingSeptember 21, 2005 upto June 21, 2011.
June 21,2011
• The Company had earlysettlement option on the 4th
anniversary of the bonds at100% of the bonds’ nominalvalue and buy-back option afterthe 1st anniversary of the bondsat market price temporarily or asan early settlement.
• Based on the latest rating reportreleased in March 2011, thebonds had idAA+(sy) (stableoutlook) rating from Pefindo.
• On June 21, 2011, the Companypaid these bonds in full.
F-81
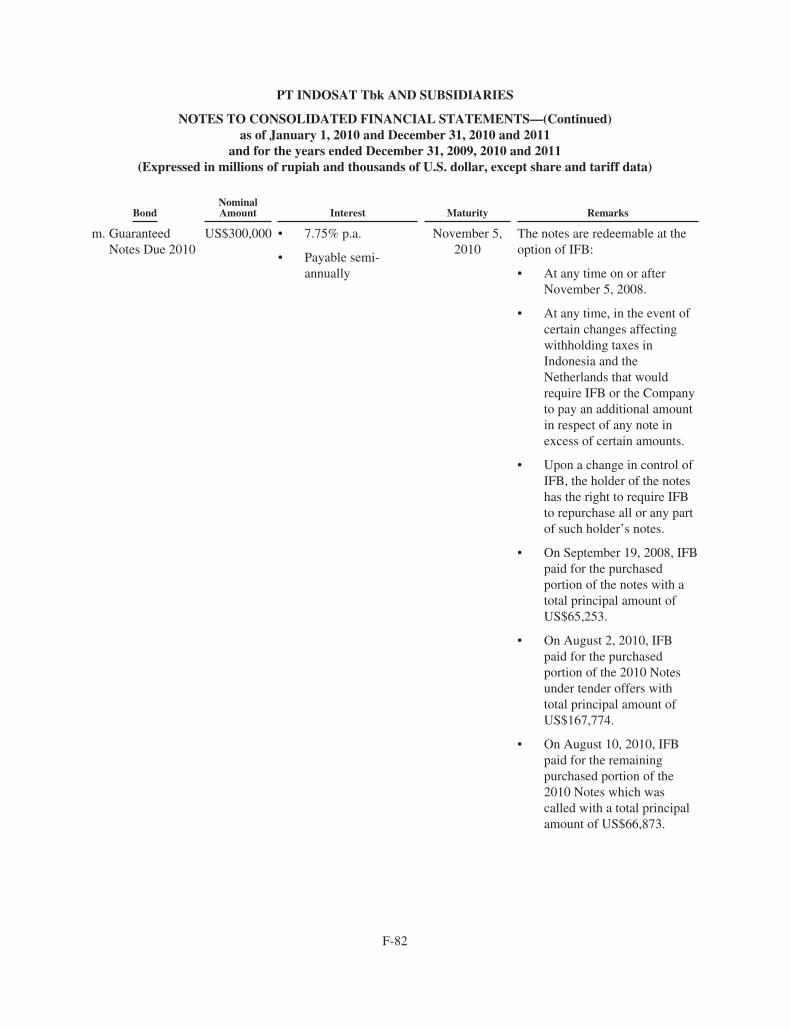
PT INDOSAT Tbk AND SUBSIDIARIES
NOTES TO CONSOLIDATED FINANCIAL STATEMENTS—(Continued)as of January 1, 2010 and December 31, 2010 and 2011
and for the years ended December 31, 2009, 2010 and 2011(Expressed in millions of rupiah and thousands of U.S. dollar, except share and tariff data)
BondNominalAmount Interest Maturity Remarks
m. GuaranteedNotes Due 2010
US$300,000 • 7.75% p.a.
• Payable semi-annually
November 5,2010
The notes are redeemable at theoption of IFB:
• At any time on or afterNovember 5, 2008.
• At any time, in the event ofcertain changes affectingwithholding taxes inIndonesia and theNetherlands that wouldrequire IFB or the Companyto pay an additional amountin respect of any note inexcess of certain amounts.
• Upon a change in control ofIFB, the holder of the noteshas the right to require IFBto repurchase all or any partof such holder’s notes.
• On September 19, 2008, IFBpaid for the purchasedportion of the notes with atotal principal amount ofUS$65,253.
• On August 2, 2010, IFBpaid for the purchasedportion of the 2010 Notesunder tender offers withtotal principal amount ofUS$167,774.
• On August 10, 2010, IFBpaid for the remainingpurchased portion of the2010 Notes which wascalled with a total principalamount of US$66,873.
F-82
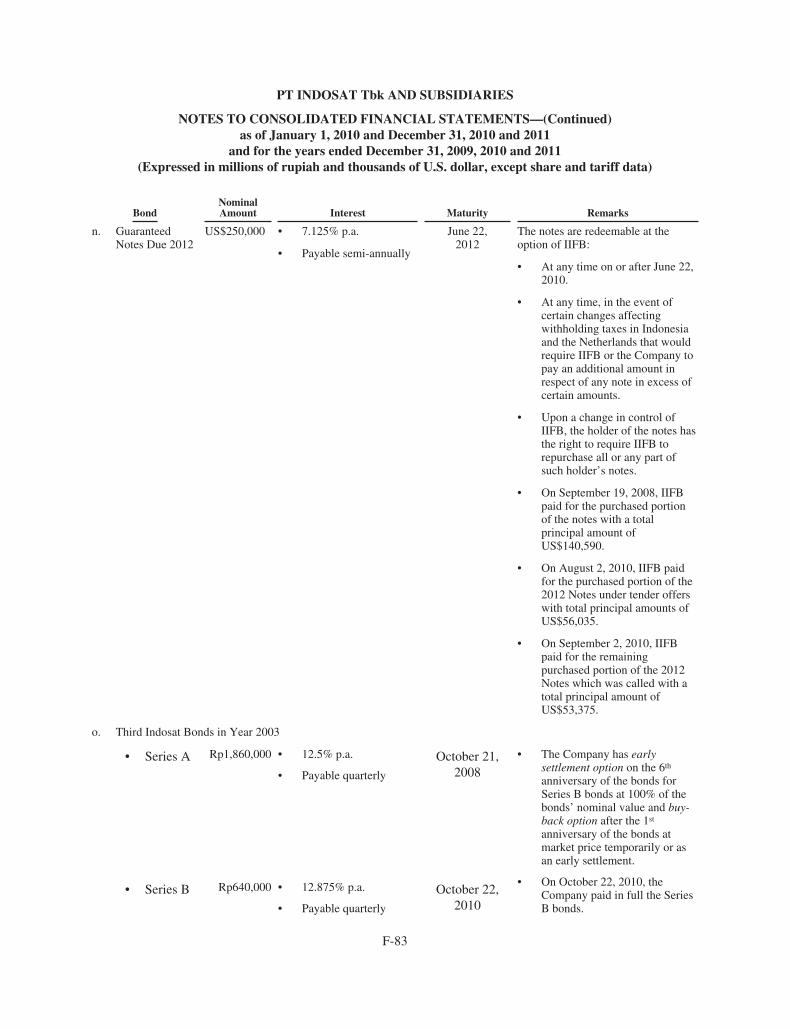
PT INDOSAT Tbk AND SUBSIDIARIES
NOTES TO CONSOLIDATED FINANCIAL STATEMENTS—(Continued)as of January 1, 2010 and December 31, 2010 and 2011
and for the years ended December 31, 2009, 2010 and 2011(Expressed in millions of rupiah and thousands of U.S. dollar, except share and tariff data)
BondNominalAmount Interest Maturity Remarks
n. GuaranteedNotes Due 2012
US$250,000 • 7.125% p.a.
• Payable semi-annually
June 22,2012
The notes are redeemable at theoption of IIFB:
• At any time on or after June 22,2010.
• At any time, in the event ofcertain changes affectingwithholding taxes in Indonesiaand the Netherlands that wouldrequire IIFB or the Company topay an additional amount inrespect of any note in excess ofcertain amounts.
• Upon a change in control ofIIFB, the holder of the notes hasthe right to require IIFB torepurchase all or any part ofsuch holder’s notes.
• On September 19, 2008, IIFBpaid for the purchased portionof the notes with a totalprincipal amount ofUS$140,590.
• On August 2, 2010, IIFB paidfor the purchased portion of the2012 Notes under tender offerswith total principal amounts ofUS$56,035.
• On September 2, 2010, IIFBpaid for the remainingpurchased portion of the 2012Notes which was called with atotal principal amount ofUS$53,375.
o. Third Indosat Bonds in Year 2003
• Series A Rp1,860,000 • 12.5% p.a.
• Payable quarterly
October 21,2008
• The Company has earlysettlement option on the 6th
anniversary of the bonds forSeries B bonds at 100% of thebonds’ nominal value and buy-back option after the 1st
anniversary of the bonds atmarket price temporarily or asan early settlement.
• On October 22, 2010, theCompany paid in full the SeriesB bonds.
• Series B Rp640,000 • 12.875% p.a.
• Payable quarterly
October 22,2010
F-83

PT INDOSAT Tbk AND SUBSIDIARIES
NOTES TO CONSOLIDATED FINANCIAL STATEMENTS—(Continued)as of January 1, 2010 and December 31, 2010 and 2011
and for the years ended December 31, 2009, 2010 and 2011(Expressed in millions of rupiah and thousands of U.S. dollar, except share and tariff data)
The scheduled principal payments of all the bonds payable outstanding as of December 31, 2011 are asfollows:
Twelve months ending December 31,
2012 2013 2014 20152016 and
thereafter* Total
In U.S. dollarGuaranteed Notes* Due 2020
(US$650,000) . . . . . . . . . . . . . . . . . . . . — — — — 5,894,200 5,894,200
In RupiahFifth Indosat Bonds* . . . . . . . . . . . . . . . . . — — 1,230,000 — 1,370,000 2,600,000Seventh Indosat Bonds* . . . . . . . . . . . . . . — — 700,000 — 600,000 1,300,000Sixth Indosat Bonds* . . . . . . . . . . . . . . . . — 760,000 — 320,000 — 1,080,000Sukuk Ijarah III* . . . . . . . . . . . . . . . . . . . . — 570,000 — — — 570,000Sukuk Ijarah II* . . . . . . . . . . . . . . . . . . . . . — — 400,000 — — 400,000Second Indosat Bonds* . . . . . . . . . . . . . . . — — — — 200,000 200,000Sukuk Ijarah IV* . . . . . . . . . . . . . . . . . . . . — — 28,000 — 172,000 200,000Limited Bonds II . . . . . . . . . . . . . . . . . . . . 25,000 — — — — 25,000Limited Bonds I . . . . . . . . . . . . . . . . . . . . . 16,989 — — — — 16,989
Sub-total . . . . . . . . . . . . . . . . . . . . . . . . . . 41,989 1,330,000 2,358,000 320,000 2,342,000 6,391,989
Total . . . . . . . . . . . . . . . . . . . . . . . . . . . . . 41,989 1,330,000 2,358,000 320,000 8,236,200 12,286,189
Less:—unamortized notes issuance cost . . . . . . (58,420)—unamortized notes discount . . . . . . . . . . (26,208)—unamortized bonds issuance costs and
consent solicitation fees . . . . . . . . . . . . (21,219)
Net . . . . . . . . . . . . . . . . . . . . . . . . . . . . . . . 12,180,342
* Refer to previous discussion on early repayment options for each bond/note.
All bonds are neither collateralized by any specific Company assets nor guaranteed by other parties. All ofthe Company’s assets, except for the assets that have been specifically used as security to its other creditors, areused as pari-passu security to all of the Company’s other liabilities including the bonds.
The total amortization of bonds issuance cost, consent solicitation fees, notes issuance cost and discount forthe years ended December 31, 2009, 2010 and 2011 amounted to Rp15,467, Rp18,025 and Rp18,057,respectively (Note 27).
As of December 31, 2009, 2010 and 2011, the Group has complied with all financial ratios required to bemaintained under the Notes Indenture and Trustee Agreements.
F-84

PT INDOSAT Tbk AND SUBSIDIARIES
NOTES TO CONSOLIDATED FINANCIAL STATEMENTS—(Continued)as of January 1, 2010 and December 31, 2010 and 2011
and for the years ended December 31, 2009, 2010 and 2011(Expressed in millions of rupiah and thousands of U.S. dollar, except share and tariff data)
20. FINANCIAL ASSETS AND LIABILITIES
The Group has various financial assets such as trade and other accounts receivable, cash and cashequivalents and short-term investments, which arise directly from the Group’s operations. The Group’s principalfinancial liabilities, other than derivatives, consist of loans and bonds payable, procurement payable, and tradeand other accounts payable. The main purpose of these financial liabilities is to finance the Group’s operations.The Company also enters into derivative transactions, primarily cross currency swaps and interest rate swaps, forthe purpose of managing its foreign exchange and interest rate exposures emanating from the Company’s loansand bonds payable in foreign currencies.
The following table sets forth the Group’s financial assets and financial liabilities as of January 1, 2010 andDecember 31, 2010 and 2011:
December 31,
January 1, 2010 2010 2011
Financial AssetsHeld for trading
Derivative assets . . . . . . . . . . . . . . . . . . . . . . . . . . . . . . . . . . 224,004 69,334 159,349Loans and receivables
Cash and cash equivalents . . . . . . . . . . . . . . . . . . . . . . . . . . . 2,835,999 2,075,270 2,224,206Accounts receivable—trade and others—net . . . . . . . . . . . . 1,949,984 1,558,457 1,446,729Other current financial assets—net . . . . . . . . . . . . . . . . . . . . 35,173 53,119 29,833Due from related parties—net . . . . . . . . . . . . . . . . . . . . . . . . 7,215 8,421 10,654Finance lease receivables . . . . . . . . . . . . . . . . . . . . . . . . . . . — — 81,966Other non-current financial assets—others . . . . . . . . . . . . . . 100,004 77,675 87,686
Available for saleOther current financial assets—short-term investments—
net . . . . . . . . . . . . . . . . . . . . . . . . . . . . . . . . . . . . . . . . . . . — — —Other non-current financial assets—other long-term
investments—net . . . . . . . . . . . . . . . . . . . . . . . . . . . . . . . . 2,730 2,730 2,730
Total Financial Assets . . . . . . . . . . . . . . . . . . . . . . . . . . . . . . . . . . . . . 5,155,109 3,845,006 4,043,153
Financial LiabilitiesHeld for trading
Derivative liabilities . . . . . . . . . . . . . . . . . . . . . . . . . . . . . . . 174,540 215,403 138,189Liabilities at amortized cost
Short-term loan . . . . . . . . . . . . . . . . . . . . . . . . . . . . . . . . . . . — — 1,499,256Accounts payable—trade . . . . . . . . . . . . . . . . . . . . . . . . . . . . 537,476 645,505 319,058Procurement payable . . . . . . . . . . . . . . . . . . . . . . . . . . . . . . . 5,289,782 3,644,467 3,429,921Accrued expenses . . . . . . . . . . . . . . . . . . . . . . . . . . . . . . . . . 1,525,561 1,710,885 1,891,477Deposits from customers . . . . . . . . . . . . . . . . . . . . . . . . . . . . 22,463 50,279 37,265Loans payable—current maturities . . . . . . . . . . . . . . . . . . . . 1,440,259 3,184,147 3,300,537Bonds payable—current maturities . . . . . . . . . . . . . . . . . . . . 2,840,662 1,098,131 41,989Other current financial liabilities . . . . . . . . . . . . . . . . . . . . . . 43,721 23,127 73,201Due to related parties . . . . . . . . . . . . . . . . . . . . . . . . . . . . . . . 13,764 22,099 15,480Obligation under finance lease . . . . . . . . . . . . . . . . . . . . . . . — — 692,907Loans payable—net of current maturities . . . . . . . . . . . . . . . 12,715,492 7,666,804 6,425,779Bonds payable—net of current maturities . . . . . . . . . . . . . . . 8,472,175 12,114,104 12,138,353
Total Financial Liabilities . . . . . . . . . . . . . . . . . . . . . . . . . . . . . . . . . . 33,075,895 30,374,951 30,003,412
F-85
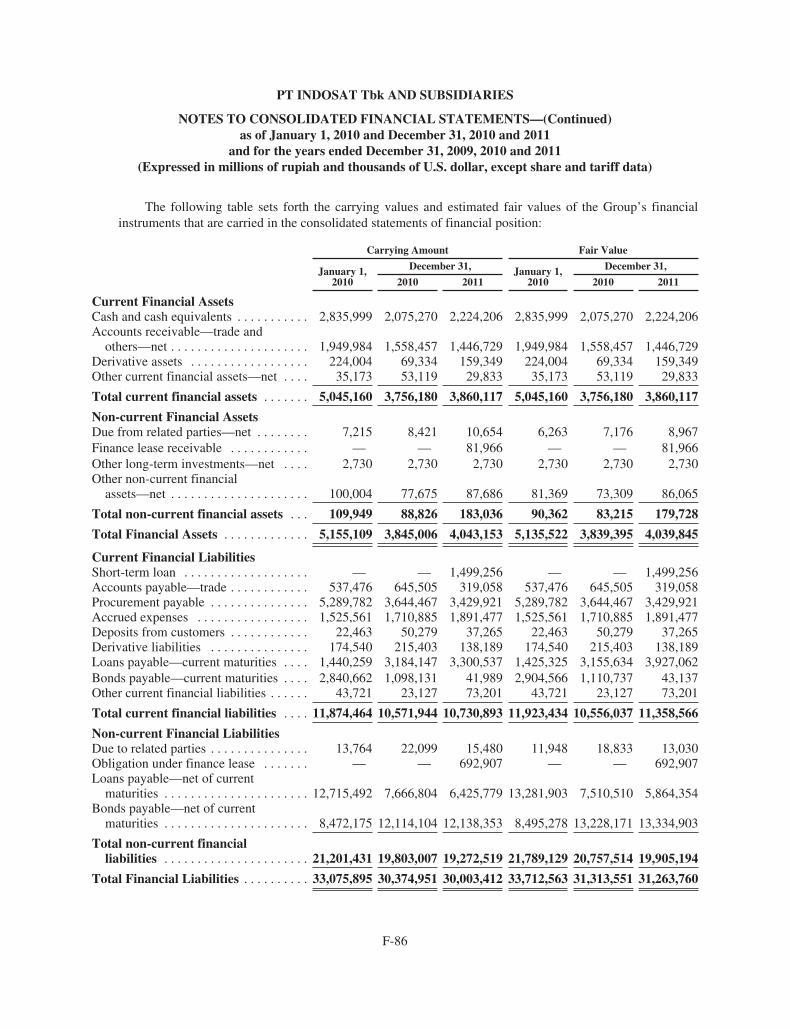
PT INDOSAT Tbk AND SUBSIDIARIES
NOTES TO CONSOLIDATED FINANCIAL STATEMENTS—(Continued)as of January 1, 2010 and December 31, 2010 and 2011
and for the years ended December 31, 2009, 2010 and 2011(Expressed in millions of rupiah and thousands of U.S. dollar, except share and tariff data)
The following table sets forth the carrying values and estimated fair values of the Group’s financialinstruments that are carried in the consolidated statements of financial position:
Carrying Amount Fair Value
January 1,2010
December 31, January 1,2010
December 31,
2010 2011 2010 2011
Current Financial AssetsCash and cash equivalents . . . . . . . . . . . 2,835,999 2,075,270 2,224,206 2,835,999 2,075,270 2,224,206Accounts receivable—trade and
others—net . . . . . . . . . . . . . . . . . . . . . 1,949,984 1,558,457 1,446,729 1,949,984 1,558,457 1,446,729Derivative assets . . . . . . . . . . . . . . . . . . 224,004 69,334 159,349 224,004 69,334 159,349Other current financial assets—net . . . . 35,173 53,119 29,833 35,173 53,119 29,833
Total current financial assets . . . . . . . 5,045,160 3,756,180 3,860,117 5,045,160 3,756,180 3,860,117
Non-current Financial AssetsDue from related parties—net . . . . . . . . 7,215 8,421 10,654 6,263 7,176 8,967Finance lease receivable . . . . . . . . . . . . — — 81,966 — — 81,966Other long-term investments—net . . . . 2,730 2,730 2,730 2,730 2,730 2,730Other non-current financial
assets—net . . . . . . . . . . . . . . . . . . . . . 100,004 77,675 87,686 81,369 73,309 86,065
Total non-current financial assets . . . 109,949 88,826 183,036 90,362 83,215 179,728
Total Financial Assets . . . . . . . . . . . . . 5,155,109 3,845,006 4,043,153 5,135,522 3,839,395 4,039,845
Current Financial LiabilitiesShort-term loan . . . . . . . . . . . . . . . . . . . — — 1,499,256 — — 1,499,256Accounts payable—trade . . . . . . . . . . . . 537,476 645,505 319,058 537,476 645,505 319,058Procurement payable . . . . . . . . . . . . . . . 5,289,782 3,644,467 3,429,921 5,289,782 3,644,467 3,429,921Accrued expenses . . . . . . . . . . . . . . . . . 1,525,561 1,710,885 1,891,477 1,525,561 1,710,885 1,891,477Deposits from customers . . . . . . . . . . . . 22,463 50,279 37,265 22,463 50,279 37,265Derivative liabilities . . . . . . . . . . . . . . . 174,540 215,403 138,189 174,540 215,403 138,189Loans payable—current maturities . . . . 1,440,259 3,184,147 3,300,537 1,425,325 3,155,634 3,927,062Bonds payable—current maturities . . . . 2,840,662 1,098,131 41,989 2,904,566 1,110,737 43,137Other current financial liabilities . . . . . . 43,721 23,127 73,201 43,721 23,127 73,201
Total current financial liabilities . . . . 11,874,464 10,571,944 10,730,893 11,923,434 10,556,037 11,358,566
Non-current Financial LiabilitiesDue to related parties . . . . . . . . . . . . . . . 13,764 22,099 15,480 11,948 18,833 13,030Obligation under finance lease . . . . . . . — — 692,907 — — 692,907Loans payable—net of current
maturities . . . . . . . . . . . . . . . . . . . . . . 12,715,492 7,666,804 6,425,779 13,281,903 7,510,510 5,864,354Bonds payable—net of current
maturities . . . . . . . . . . . . . . . . . . . . . . 8,472,175 12,114,104 12,138,353 8,495,278 13,228,171 13,334,903
Total non-current financialliabilities . . . . . . . . . . . . . . . . . . . . . . 21,201,431 19,803,007 19,272,519 21,789,129 20,757,514 19,905,194
Total Financial Liabilities . . . . . . . . . . 33,075,895 30,374,951 30,003,412 33,712,563 31,313,551 31,263,760
F-86

PT INDOSAT Tbk AND SUBSIDIARIES
NOTES TO CONSOLIDATED FINANCIAL STATEMENTS—(Continued)as of January 1, 2010 and December 31, 2010 and 2011
and for the years ended December 31, 2009, 2010 and 2011(Expressed in millions of rupiah and thousands of U.S. dollar, except share and tariff data)
Fair Value Measurement
The fair values of the financial assets and liabilities are presented at the amount at which the instrumentcould be exchanged in a current transaction between willing parties, other than in a forced sale or liquidation.
The following methods and assumptions were used to estimate the fair value of each class of financialinstrument for which it is practicable to estimate such value:
Short-term financial assets and liabilities:
• Short-term financial instruments with remaining maturities of one year or less (cash and cashequivalents, trade and other accounts receivable, other current financial assets, short-term loan, tradeaccounts payable, procurement payable, accrued expenses, deposits from customers and other currentfinancial liabilities).
These financial instruments approximate their carrying amounts largely due to their short-termmaturities.
• Derivative Financial Instruments
Cross currency swap contracts (including bifurcated embedded derivative)
These derivatives are measured at their fair values using internal valuation techniques as no quotedmarket prices exist for such instruments. The principal technique used to value these instruments is theuse of discounted cash flows. The key inputs include interest rate yield curves, foreign exchange rates,Credit Default Spread (“CDS”), and the spot price of the underlying instruments.
Interest rate swap contracts
These derivatives are measured at their fair values, computed using discounted cash flows based onobservable market inputs which include interest rate yield curves and payment dates.
Currency forward contracts
These derivatives are measured at their fair values, computed using discounted cash flows based onobservable market inputs which include foreign exchange rates, payment dates and the spot price of theunderlying instruments.
Long-term financial assets and liabilities:
• Long-term fixed-rate and variable-rate financial liabilities (unquoted loans and bonds payable)
The fair value of these financial liabilities is determined by discounting future cash flows usingapplicable rates from observable current market transactions for instruments with similar terms, creditrisk and remaining maturities.
• Other long-term financial assets and liabilities (due from / to related parties, finance lease receivable /obligation under finance lease, other long-term investments and other non-current financial assets)
Estimated fair value is based on discounted value of future cash flows adjusted to reflect counterpartyrisk (for financial assets) and the Group’s own credit risk (for financial liabilities) and using risk-freerates for similar instruments.
F-87

PT INDOSAT Tbk AND SUBSIDIARIES
NOTES TO CONSOLIDATED FINANCIAL STATEMENTS—(Continued)as of January 1, 2010 and December 31, 2010 and 2011
and for the years ended December 31, 2009, 2010 and 2011(Expressed in millions of rupiah and thousands of U.S. dollar, except share and tariff data)
• Financial instruments quoted in an active market
The fair value of the bonds issued by the Company which are traded in an active market is determinedwith reference to their quoted market prices.
For equity investments classified as available-for-sale, the fair value is determined based on the latestmarket quotation as published by the Indonesia Stock Exchange as of January 1, 2010 andDecember 31, 2010 and 2011.
Fair Value Hierarchy
Financial assets and liabilities are classified in their entirety based on the lowest level of input that issignificant to the fair value measurements. The assessment of the significance of a particular input to the fairvalue measurements requires judgment, and may affect the valuation of the assets and liabilities being measuredand their placement within the fair value hierarchy.
The best evidence of fair value is quoted prices in an active market. If the market for a financial instrumentis not active, an entity establishes fair value by using a valuation technique. The objective of using a valuationtechnique is to establish what the transaction price would have been on the measurement date in an arm’s lengthexchange motivated by normal business considerations. Valuation techniques include using recent arm’s lengthmarket transactions between knowledgeable, willing parties, if available, reference to the current fair value ofanother instrument that is substantially the same, discounted cash flow analysis and option pricing models. Ifthere is a valuation technique commonly used by market participants to price the instrument and that techniquehas been demonstrated to provide reliable estimates of prices obtained in actual market transactions, the entityuses that technique. The chosen valuation technique makes maximum use of market inputs and relies as little aspossible on entity-specific inputs. It incorporates all factors that market participants would consider in setting aprice and is consistent with accepted economic methodologies for pricing financial instruments. Periodically, theCompany calibrates the valuation technique and tests it for validity using prices from any observable currentmarket transactions in the same instrument (i.e., without modification or repackaging) or based on any availableobservable market data.
The Company’s fair value hierarchy as of January 1, 2010 and December 31, 2010 and 2011 are as follows:
January 1, 2010
TOTAL
Quoted prices inactive markets
for identicalassets or liabilities
(Level 1)
Significant andobservable inputs,
directly orindirectly(Level 2)
Significantunobservable
inputs(Level 3)
Current Financial AssetsDerivative assets . . . . . . . . . . . . . . . . . . . . . . . . . . . . . . . . . . 224,004 — 224,004 —
Total Financial Assets . . . . . . . . . . . . . . . . . . . . . . . . . . . . . 224,004 — 224,004 —
Current Financial LiabilitiesDerivative liabilities . . . . . . . . . . . . . . . . . . . . . . . . . . . . . . . 174,540 — 174,540 —Embedded derivatives . . . . . . . . . . . . . . . . . . . . . . . . . . . . . . 97,942 — 97,942 —
Total Financial Liabilities . . . . . . . . . . . . . . . . . . . . . . . . . . 272,482 — 272,482 —
F-88

PT INDOSAT Tbk AND SUBSIDIARIES
NOTES TO CONSOLIDATED FINANCIAL STATEMENTS—(Continued)as of January 1, 2010 and December 31, 2010 and 2011
and for the years ended December 31, 2009, 2010 and 2011(Expressed in millions of rupiah and thousands of U.S. dollar, except share and tariff data)
December 31, 2010
TOTAL
Quoted pricesin active
markets foridenticalassets orliabilities(Level 1)
Significantand
observableinputs,
directly orindirectly(Level 2)
Significantunobservable
inputs(Level 3)
Current Financial AssetsDerivative assets . . . . . . . . . . . . . . . . . . . . . . . . . . . . . . . . . . . . . 69,334 — 69,334 —
Total Financial Assets . . . . . . . . . . . . . . . . . . . . . . . . . . . . . . . 69,334 — 69,334 —
Current Financial LiabilitiesDerivative liabilities . . . . . . . . . . . . . . . . . . . . . . . . . . . . . . . . . . 215,403 — 215,403 —Embedded derivatives . . . . . . . . . . . . . . . . . . . . . . . . . . . . . . . . 54,595 — 54,595 —
Total Financial Liabilities . . . . . . . . . . . . . . . . . . . . . . . . . . . . 269,998 — 269,998 —
December 31, 2011
TOTAL
Quoted pricesin active
markets foridenticalassets orliabilities(Level 1)
Significantand
observableinputs,
directly orindirectly(Level 2)
Significantunobservable
inputs(Level 3)
Current Financial AssetsDerivative assets . . . . . . . . . . . . . . . . . . . . . . . . . . . . . . . . . . . . . 159,349 — 159,349 —
Total Financial Assets . . . . . . . . . . . . . . . . . . . . . . . . . . . . . . . 159,349 — 159,349 —
Current Financial LiabilitiesDerivative liabilities . . . . . . . . . . . . . . . . . . . . . . . . . . . . . . . . . . 138,189 — 138,189 —Embedded derivatives . . . . . . . . . . . . . . . . . . . . . . . . . . . . . . . . 49,518 — 49,518 —
Total Financial Liabilities . . . . . . . . . . . . . . . . . . . . . . . . . . . . 187,707 — 187,707 —
During the reporting periods ending December 31, 2010 and 2011, there were no transfers between Level 1and Level 2 fair value measurements.
F-89
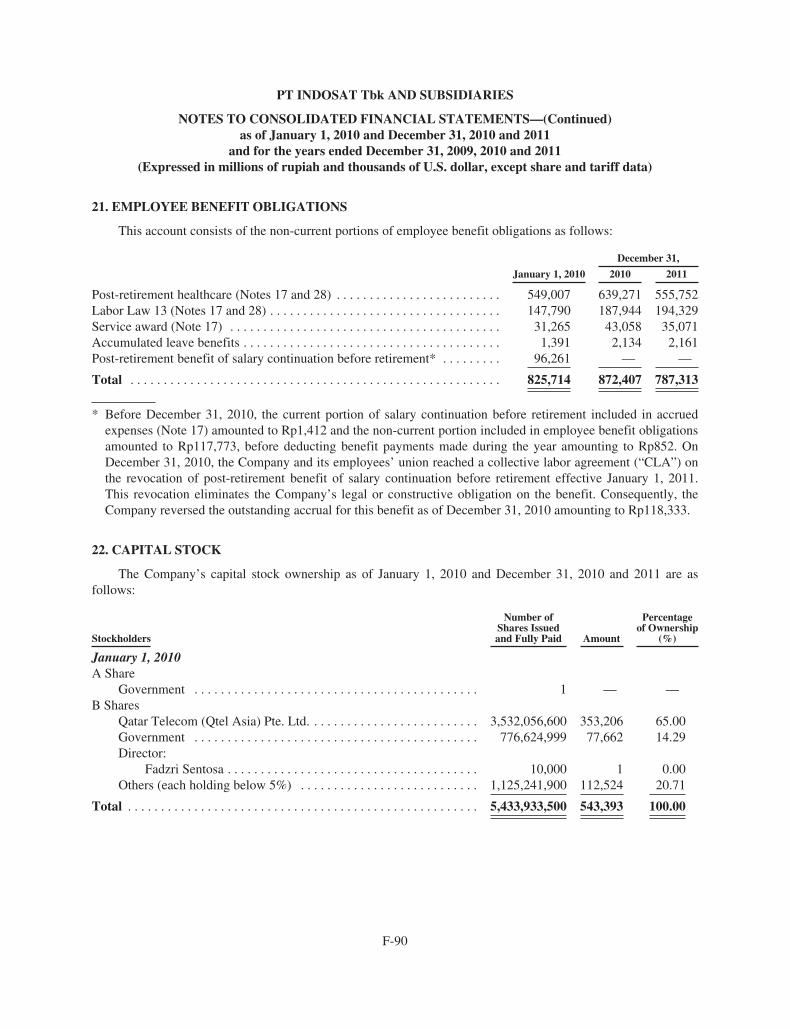
PT INDOSAT Tbk AND SUBSIDIARIES
NOTES TO CONSOLIDATED FINANCIAL STATEMENTS—(Continued)as of January 1, 2010 and December 31, 2010 and 2011
and for the years ended December 31, 2009, 2010 and 2011(Expressed in millions of rupiah and thousands of U.S. dollar, except share and tariff data)
21. EMPLOYEE BENEFIT OBLIGATIONS
This account consists of the non-current portions of employee benefit obligations as follows:
December 31,
January 1, 2010 2010 2011
Post-retirement healthcare (Notes 17 and 28) . . . . . . . . . . . . . . . . . . . . . . . . . 549,007 639,271 555,752Labor Law 13 (Notes 17 and 28) . . . . . . . . . . . . . . . . . . . . . . . . . . . . . . . . . . . 147,790 187,944 194,329Service award (Note 17) . . . . . . . . . . . . . . . . . . . . . . . . . . . . . . . . . . . . . . . . . 31,265 43,058 35,071Accumulated leave benefits . . . . . . . . . . . . . . . . . . . . . . . . . . . . . . . . . . . . . . . 1,391 2,134 2,161Post-retirement benefit of salary continuation before retirement* . . . . . . . . . 96,261 — —
Total . . . . . . . . . . . . . . . . . . . . . . . . . . . . . . . . . . . . . . . . . . . . . . . . . . . . . . . . 825,714 872,407 787,313
* Before December 31, 2010, the current portion of salary continuation before retirement included in accruedexpenses (Note 17) amounted to Rp1,412 and the non-current portion included in employee benefit obligationsamounted to Rp117,773, before deducting benefit payments made during the year amounting to Rp852. OnDecember 31, 2010, the Company and its employees’ union reached a collective labor agreement (“CLA”) onthe revocation of post-retirement benefit of salary continuation before retirement effective January 1, 2011.This revocation eliminates the Company’s legal or constructive obligation on the benefit. Consequently, theCompany reversed the outstanding accrual for this benefit as of December 31, 2010 amounting to Rp118,333.
22. CAPITAL STOCK
The Company’s capital stock ownership as of January 1, 2010 and December 31, 2010 and 2011 are asfollows:
Stockholders
Number ofShares Issuedand Fully Paid Amount
Percentageof Ownership
(%)
January 1, 2010A Share
Government . . . . . . . . . . . . . . . . . . . . . . . . . . . . . . . . . . . . . . . . . . . 1 — —B Shares
Qatar Telecom (Qtel Asia) Pte. Ltd. . . . . . . . . . . . . . . . . . . . . . . . . . 3,532,056,600 353,206 65.00Government . . . . . . . . . . . . . . . . . . . . . . . . . . . . . . . . . . . . . . . . . . . 776,624,999 77,662 14.29Director:
Fadzri Sentosa . . . . . . . . . . . . . . . . . . . . . . . . . . . . . . . . . . . . . . 10,000 1 0.00Others (each holding below 5%) . . . . . . . . . . . . . . . . . . . . . . . . . . . 1,125,241,900 112,524 20.71
Total . . . . . . . . . . . . . . . . . . . . . . . . . . . . . . . . . . . . . . . . . . . . . . . . . . . . . 5,433,933,500 543,393 100.00
F-90

PT INDOSAT Tbk AND SUBSIDIARIES
NOTES TO CONSOLIDATED FINANCIAL STATEMENTS—(Continued)as of January 1, 2010 and December 31, 2010 and 2011
and for the years ended December 31, 2009, 2010 and 2011(Expressed in millions of rupiah and thousands of U.S. dollar, except share and tariff data)
Stockholders
Number ofShares Issuedand Fully Paid Amount
Percentageof Ownership
(%)
December 31, 2010A Share
Government . . . . . . . . . . . . . . . . . . . . . . . . . . . . . . . . . . . . . . . . . . . 1 — —B Shares
Qatar Telecom (Qtel Asia) Pte. Ltd. . . . . . . . . . . . . . . . . . . . . . . . . . 3,532,056,600 353,206 65.00Government . . . . . . . . . . . . . . . . . . . . . . . . . . . . . . . . . . . . . . . . . . . 776,624,999 77,662 14.29SKAGEN Funds (SKAGEN AS) . . . . . . . . . . . . . . . . . . . . . . . . . . . 277,824,400 27,782 5.11Director:
Fadzri Sentosa . . . . . . . . . . . . . . . . . . . . . . . . . . . . . . . . . . . . . . 10,000 1 0.00Others (each holding below 5%) . . . . . . . . . . . . . . . . . . . . . . . . . . . . . . . 847,417,500 84,742 15.60
Total . . . . . . . . . . . . . . . . . . . . . . . . . . . . . . . . . . . . . . . . . . . . . . . . . . . . . 5,433,933,500 543,393 100.00
December 31, 2011A Share
Government . . . . . . . . . . . . . . . . . . . . . . . . . . . . . . . . . . . . . . . . . . . 1 — —B Shares
Qatar Telecom (Qtel Asia) Pte. Ltd. . . . . . . . . . . . . . . . . . . . . . . . . . 3,532,056,600 353,206 65.00Government . . . . . . . . . . . . . . . . . . . . . . . . . . . . . . . . . . . . . . . . . . . 776,624,999 77,662 14.29SKAGEN Funds (SKAGEN AS) . . . . . . . . . . . . . . . . . . . . . . . . . . . 305,498,450 30,550 5.62Director:
Fadzri Sentosa . . . . . . . . . . . . . . . . . . . . . . . . . . . . . . . . . . . . . . 10,000 1 0.00Others (each holding below 5%) . . . . . . . . . . . . . . . . . . . . . . . . . . . 819,743,450 81,974 15.09
Total . . . . . . . . . . . . . . . . . . . . . . . . . . . . . . . . . . . . . . . . . . . . . . . . . . . . . 5,433,933,500 543,393 100.00
The “A” share is a special share held by the Government and has special voting rights. The material rightsand restrictions which are applicable to the “B” shares are also applicable to the “A” share, except that theGovernment may not transfer the “A” share, which has a veto right with respect to (i) amendment to the objectiveand purposes of the Company; (ii) increase of capital without pre-emptive rights; (iii) merger, consolidation,acquisition and demerger; (iv) amendment to the provisions regarding the rights of “A” share as stipulated in theArticles of Association; and (v) dissolution, bankruptcy and liquidation of the Company. The “A” share also hasthe right to appoint one director and one commissioner of the Company.
F-91

PT INDOSAT Tbk AND SUBSIDIARIES
NOTES TO CONSOLIDATED FINANCIAL STATEMENTS—(Continued)as of January 1, 2010 and December 31, 2010 and 2011
and for the years ended December 31, 2009, 2010 and 2011(Expressed in millions of rupiah and thousands of U.S. dollar, except share and tariff data)
23. OPERATING REVENUES
This account consists of the following:
2009 2010 2011
CellularUsage charges . . . . . . . . . . . . . . . . . . . . . . . . . . . . . . . . . . . . . . . . . . 7,085,741 7,943,960 8,040,293Value added services . . . . . . . . . . . . . . . . . . . . . . . . . . . . . . . . . . . . . 5,998,963 7,039,243 7,502,140Interconnection services . . . . . . . . . . . . . . . . . . . . . . . . . . . . . . . . . . 1,709,193 1,252,751 1,182,384Tower leasing (Note 33g) . . . . . . . . . . . . . . . . . . . . . . . . . . . . . . . . . 62,365 251,981 393,301Monthly subscription charges . . . . . . . . . . . . . . . . . . . . . . . . . . . . . . 184,174 200,519 134,032Connection fee . . . . . . . . . . . . . . . . . . . . . . . . . . . . . . . . . . . . . . . . . . 40,355 2,926 14,217Sale of blackberry handsets . . . . . . . . . . . . . . . . . . . . . . . . . . . . . . . . 206,481 34,956 1,706Upfront discount and customer loyalty program (Note 2f5.1) (1,087,064) (1,033,588) (952,976)Others . . . . . . . . . . . . . . . . . . . . . . . . . . . . . . . . . . . . . . . . . . . . . . . . 131,027 174,343 245,869
Sub-total . . . . . . . . . . . . . . . . . . . . . . . . . . . . . . . . . . . . . . . . . . . . . . 14,331,235 15,867,091 16,560,966
MIDIInternet Protocol Virtual Private Network (IP VPN) . . . . . . . . . . . . 566,105 605,685 695,947Internet . . . . . . . . . . . . . . . . . . . . . . . . . . . . . . . . . . . . . . . . . . . . . . . 677,375 519,553 375,743World link and direct link . . . . . . . . . . . . . . . . . . . . . . . . . . . . . . . . . 394,189 278,788 294,956Leased line . . . . . . . . . . . . . . . . . . . . . . . . . . . . . . . . . . . . . . . . . . . . . 211,092 189,112 261,376Application services . . . . . . . . . . . . . . . . . . . . . . . . . . . . . . . . . . . . . 146,137 168,196 192,562Satellite lease . . . . . . . . . . . . . . . . . . . . . . . . . . . . . . . . . . . . . . . . . . . 113,060 136,008 150,894Value-added Service . . . . . . . . . . . . . . . . . . . . . . . . . . . . . . . . . . . . . 13,664 38,506 148,677Frame net . . . . . . . . . . . . . . . . . . . . . . . . . . . . . . . . . . . . . . . . . . . . . . 276,477 227,051 123,249Digital data network . . . . . . . . . . . . . . . . . . . . . . . . . . . . . . . . . . . . . 144,619 94,686 103,098Multiprotocol Label Switching (MPLS) . . . . . . . . . . . . . . . . . . . . . . 67,141 66,579 89,937TV link . . . . . . . . . . . . . . . . . . . . . . . . . . . . . . . . . . . . . . . . . . . . . . . 6,230 5,126 6,127Others . . . . . . . . . . . . . . . . . . . . . . . . . . . . . . . . . . . . . . . . . . . . . . . . 96,543 158,820 135,812
Sub-total . . . . . . . . . . . . . . . . . . . . . . . . . . . . . . . . . . . . . . . . . . . . . . 2,712,632 2,488,110 2,578,378
Fixed TelecommunicationsInternational Calls . . . . . . . . . . . . . . . . . . . . . . . . . . . . . . . . . . . . . . . 1,422,268 993,165 934,021Fixed Wireless . . . . . . . . . . . . . . . . . . . . . . . . . . . . . . . . . . . . . . . . . . 249,886 174,157 192,776Fixed Line . . . . . . . . . . . . . . . . . . . . . . . . . . . . . . . . . . . . . . . . . . . . . 130,885 125,855 123,185
Sub-total . . . . . . . . . . . . . . . . . . . . . . . . . . . . . . . . . . . . . . . . . . . . . . 1,803,039 1,293,177 1,249,982
Total 18,846,906 19,648,378 20,389,326
Operating revenues from related parties amounted to Rp1,474,208, Rp1,640,591 and Rp1,554,780 for theyears ended December 31, 2009, 2010 and 2011, respectively. These amounts represent 7.82%, 8.35% and 7.63%of total operating revenues in 2009, 2010 and 2011, respectively (Note 29).
The operating revenues from interconnection services are presented on a gross basis (Note 2f5.1).
F-92
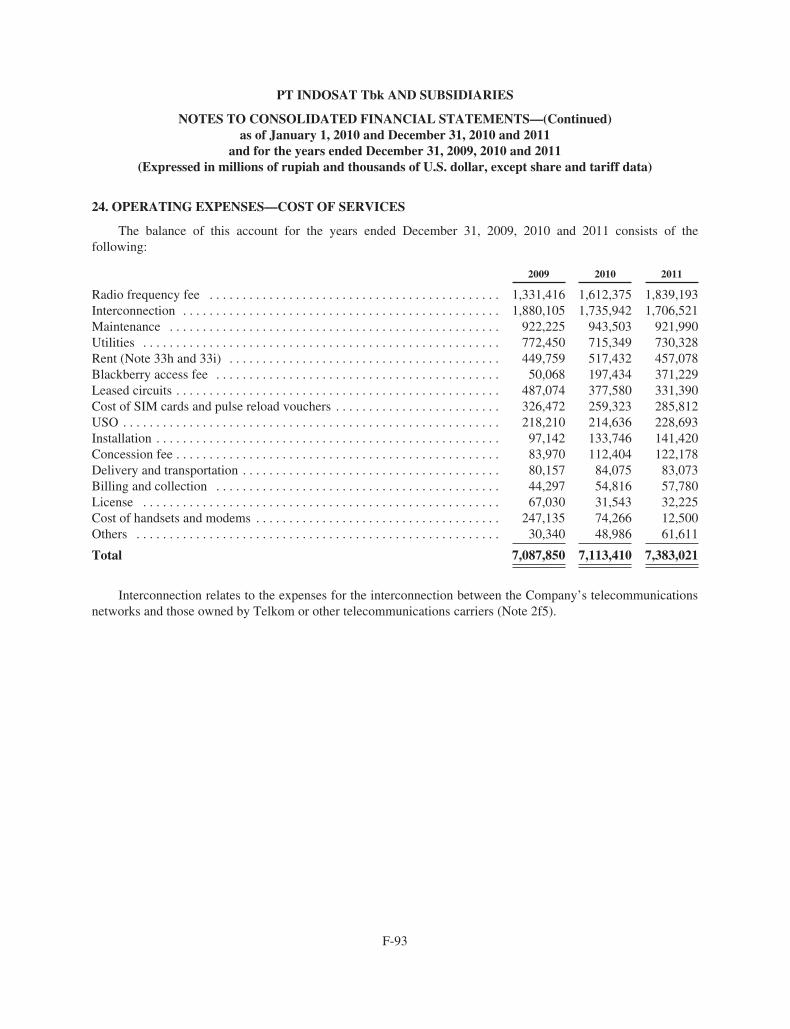
PT INDOSAT Tbk AND SUBSIDIARIES
NOTES TO CONSOLIDATED FINANCIAL STATEMENTS—(Continued)as of January 1, 2010 and December 31, 2010 and 2011
and for the years ended December 31, 2009, 2010 and 2011(Expressed in millions of rupiah and thousands of U.S. dollar, except share and tariff data)
24. OPERATING EXPENSES—COST OF SERVICES
The balance of this account for the years ended December 31, 2009, 2010 and 2011 consists of thefollowing:
2009 2010 2011
Radio frequency fee . . . . . . . . . . . . . . . . . . . . . . . . . . . . . . . . . . . . . . . . . . . . 1,331,416 1,612,375 1,839,193Interconnection . . . . . . . . . . . . . . . . . . . . . . . . . . . . . . . . . . . . . . . . . . . . . . . . 1,880,105 1,735,942 1,706,521Maintenance . . . . . . . . . . . . . . . . . . . . . . . . . . . . . . . . . . . . . . . . . . . . . . . . . . 922,225 943,503 921,990Utilities . . . . . . . . . . . . . . . . . . . . . . . . . . . . . . . . . . . . . . . . . . . . . . . . . . . . . . 772,450 715,349 730,328Rent (Note 33h and 33i) . . . . . . . . . . . . . . . . . . . . . . . . . . . . . . . . . . . . . . . . . 449,759 517,432 457,078Blackberry access fee . . . . . . . . . . . . . . . . . . . . . . . . . . . . . . . . . . . . . . . . . . . 50,068 197,434 371,229Leased circuits . . . . . . . . . . . . . . . . . . . . . . . . . . . . . . . . . . . . . . . . . . . . . . . . . 487,074 377,580 331,390Cost of SIM cards and pulse reload vouchers . . . . . . . . . . . . . . . . . . . . . . . . . 326,472 259,323 285,812USO . . . . . . . . . . . . . . . . . . . . . . . . . . . . . . . . . . . . . . . . . . . . . . . . . . . . . . . . . 218,210 214,636 228,693Installation . . . . . . . . . . . . . . . . . . . . . . . . . . . . . . . . . . . . . . . . . . . . . . . . . . . . 97,142 133,746 141,420Concession fee . . . . . . . . . . . . . . . . . . . . . . . . . . . . . . . . . . . . . . . . . . . . . . . . . 83,970 112,404 122,178Delivery and transportation . . . . . . . . . . . . . . . . . . . . . . . . . . . . . . . . . . . . . . . 80,157 84,075 83,073Billing and collection . . . . . . . . . . . . . . . . . . . . . . . . . . . . . . . . . . . . . . . . . . . 44,297 54,816 57,780License . . . . . . . . . . . . . . . . . . . . . . . . . . . . . . . . . . . . . . . . . . . . . . . . . . . . . . 67,030 31,543 32,225Cost of handsets and modems . . . . . . . . . . . . . . . . . . . . . . . . . . . . . . . . . . . . . 247,135 74,266 12,500Others . . . . . . . . . . . . . . . . . . . . . . . . . . . . . . . . . . . . . . . . . . . . . . . . . . . . . . . 30,340 48,986 61,611
Total 7,087,850 7,113,410 7,383,021
Interconnection relates to the expenses for the interconnection between the Company’s telecommunicationsnetworks and those owned by Telkom or other telecommunications carriers (Note 2f5).
F-93

PT INDOSAT Tbk AND SUBSIDIARIES
NOTES TO CONSOLIDATED FINANCIAL STATEMENTS—(Continued)as of January 1, 2010 and December 31, 2010 and 2011
and for the years ended December 31, 2009, 2010 and 2011(Expressed in millions of rupiah and thousands of U.S. dollar, except share and tariff data)
25. OPERATING EXPENSES—PERSONNEL
The balance of this account for the years ended December 31, 2009, 2010 and 2011 consists of thefollowing:
2009 2010 2011
Severance benefit under Voluntary Separation Scheme (‘VSS’)* . . . . . . . . . — — 579,301Salaries . . . . . . . . . . . . . . . . . . . . . . . . . . . . . . . . . . . . . . . . . . . . . . . . . . . . . . 451,150 492,452 472,826Incentives and other employee benefits . . . . . . . . . . . . . . . . . . . . . . . . . . . . . 260,884 277,361 262,153Employee income tax . . . . . . . . . . . . . . . . . . . . . . . . . . . . . . . . . . . . . . . . . . . 145,421 131,630 260,104Bonuses . . . . . . . . . . . . . . . . . . . . . . . . . . . . . . . . . . . . . . . . . . . . . . . . . . . . . . 207,690 236,950 199,043Medical expense . . . . . . . . . . . . . . . . . . . . . . . . . . . . . . . . . . . . . . . . . . . . . . . 68,471 69,509 60,819Outsourcing . . . . . . . . . . . . . . . . . . . . . . . . . . . . . . . . . . . . . . . . . . . . . . . . . . . 74,809 60,858 36,264Pension (Note 28) . . . . . . . . . . . . . . . . . . . . . . . . . . . . . . . . . . . . . . . . . . . . . . 32,336 45,688 15,943Early retirement** . . . . . . . . . . . . . . . . . . . . . . . . . . . . . . . . . . . . . . . . . . . . . . 38,106 16,253 15,170Separation, appreciation and compensation expense under Labor Law
No. 13/2003 (Note 28) . . . . . . . . . . . . . . . . . . . . . . . . . . . . . . . . . . . . . . . . 40,972 42,833 10,344Post-retirement healthcare cost (income) (Note 28) . . . . . . . . . . . . . . . . . . . . 88,615 104,600 (74,253)Post-retirement benefit of salary continuation before retirement
(Note 21)*** . . . . . . . . . . . . . . . . . . . . . . . . . . . . . . . . . . . . . . . . . . . . . . . . 14,933 (96,820) —Others . . . . . . . . . . . . . . . . . . . . . . . . . . . . . . . . . . . . . . . . . . . . . . . . . . . . . . . 28,173 29,930 54,226
Total . . . . . . . . . . . . . . . . . . . . . . . . . . . . . . . . . . . . . . . . . . . . . . . . . . . . . . . . 1,451,560 1,411,244 1,891,940
* On January 20 and December 28, 2011, the Company’s and Lintasarta’s Boards of Directors issuedDirectors’ Decree No. 003/Direksi/2011 and Directors’ Decree No. 020/Direksi/40000/2011, respectively,regarding the Organizational Restructuring Program through an offering scheme on the basis of mutualagreement between the Group and certain employees (VSS), that became effective on the same date. For theyear ended December 31, 2011, there were 994 and 54 employees of the Company and Lintasarta,respectively, who availed themselves of the scheme, and the benefits paid by the Company and Lintasartaamounted to Rp566,034 and Rp13,267, respectively.
** On June 27, 2006, the Company’s Directors issued Decree No. 051/DIREKSI/2006, “Additional Benefitsfor Voluntarily Resigned Employees”. Under this decree, employees qualified for early retirement and whovoluntarily resigned after the approval from the Board of Directors were given benefits of additionalremuneration, traveling and training package. For the years ended December 31, 2011 and 2010, there were9 and 19 employees, respectively, who took the option.
*** On December 31, 2010, the Company and its employees’ union reached a collective labor agreement(“CLA”) on the revocation of post-retirement benefit of salary continuation before retirement effectiveJanuary 1, 2011. This revocation eliminated the Company’s legal or constructive obligation for the benefit.
The personnel expenses capitalized to properties under construction and installation during the years endedDecember 31, 2009, 2010 and 2011 amounted to Rp34,092, Rp38,668 and Rp46,575, respectively.
F-94

PT INDOSAT Tbk AND SUBSIDIARIES
NOTES TO CONSOLIDATED FINANCIAL STATEMENTS—(Continued)as of January 1, 2010 and December 31, 2010 and 2011
and for the years ended December 31, 2009, 2010 and 2011(Expressed in millions of rupiah and thousands of U.S. dollar, except share and tariff data)
26. OPERATING EXPENSES—GENERAL AND ADMINISTRATION
The balance of this account for the years ended December 31, 2009, 2010 and 2011 consists of thefollowing:
2009 2010 2011
Rent . . . . . . . . . . . . . . . . . . . . . . . . . . . . . . . . . . . . . . . . . . . . . . . . . . . . . . . . . . . . . 144,585 120,428 113,277Professional fees . . . . . . . . . . . . . . . . . . . . . . . . . . . . . . . . . . . . . . . . . . . . . . . . . . . . 103,916 109,374 109,523Utilities . . . . . . . . . . . . . . . . . . . . . . . . . . . . . . . . . . . . . . . . . . . . . . . . . . . . . . . . . . . 78,152 99,642 106,525Transportation . . . . . . . . . . . . . . . . . . . . . . . . . . . . . . . . . . . . . . . . . . . . . . . . . . . . . 58,882 64,485 65,807Insurance . . . . . . . . . . . . . . . . . . . . . . . . . . . . . . . . . . . . . . . . . . . . . . . . . . . . . . . . . 29,183 39,807 44,539Provision for impairment of receivables (Note 5) . . . . . . . . . . . . . . . . . . . . . . . . . . 98,042 67,041 41,051Office . . . . . . . . . . . . . . . . . . . . . . . . . . . . . . . . . . . . . . . . . . . . . . . . . . . . . . . . . . . . 44,710 48,370 34,956Training, education and research . . . . . . . . . . . . . . . . . . . . . . . . . . . . . . . . . . . . . . . 17,289 18,541 23,371Catering . . . . . . . . . . . . . . . . . . . . . . . . . . . . . . . . . . . . . . . . . . . . . . . . . . . . . . . . . . 20,730 25,585 22,693Social activities . . . . . . . . . . . . . . . . . . . . . . . . . . . . . . . . . . . . . . . . . . . . . . . . . . . . 23,988 24,991 16,620Others (each below Rp10,000) . . . . . . . . . . . . . . . . . . . . . . . . . . . . . . . . . . . . . . . . . 103,317 74,317 84,332
Total . . . . . . . . . . . . . . . . . . . . . . . . . . . . . . . . . . . . . . . . . . . . . . . . . . . . . . . . . . . . . 722,794 692,581 662,694
27. OTHER EXPENSES—FINANCING COST
The balance of this account for the years ended December 31, 2009, 2010 and 2011 consists of thefollowing:
2009 2010 2011
Interest on loans . . . . . . . . . . . . . . . . . . . . . . . . . . . . . . . . . . . . . . . . . . . . . . . 1,808,620 2,080,274 1,700,091Amortization of debt and bonds / notes issuance costs, consent solicitation
fees and discount (Notes 14, 18 and 19) . . . . . . . . . . . . . . . . . . . . . . . . . . . 51,305 90,116 83,444Excess of purchase price over nominal value due to redemption of GN 2010
and GN 2012 . . . . . . . . . . . . . . . . . . . . . . . . . . . . . . . . . . . . . . . . . . . . . . . . — 96,487 —Finance charges under finance lease . . . . . . . . . . . . . . . . . . . . . . . . . . . . . . . . — — 135,758Bank charges . . . . . . . . . . . . . . . . . . . . . . . . . . . . . . . . . . . . . . . . . . . . . . . . . . 13,042 4,751 6,152
Total . . . . . . . . . . . . . . . . . . . . . . . . . . . . . . . . . . . . . . . . . . . . . . . . . . . . . . . . 1,872,967 2,271,628 1,925,445
28. PENSION PLAN
The Company, Satelindo and Lintasarta have defined benefit and defined contribution pension planscovering substantially all of their qualified permanent employees.
Defined Benefit Pension Plan
The Company, Satelindo and Lintasarta provide defined benefit pension plans to their respective employeesunder which pension benefits to be paid upon retirement are based on the employees’ most recent basic salaryand number of years of service. PT Asuransi Jiwasraya (“Jiwasraya”), a state-owned life insurance company,manages the plans. Pension contributions are determined by periodic actuarial calculations performed byJiwasraya.
F-95

PT INDOSAT Tbk AND SUBSIDIARIES
NOTES TO CONSOLIDATED FINANCIAL STATEMENTS—(Continued)as of January 1, 2010 and December 31, 2010 and 2011
and for the years ended December 31, 2009, 2010 and 2011(Expressed in millions of rupiah and thousands of U.S. dollar, except share and tariff data)
Based on an amendment dated December 22, 2000 of the Company’s pension plan, which was furtheramended on March 29, 2001, the benefits and premium payment pattern were changed. Before the amendment,the premium was regularly paid annually until the plan would be fully funded and the benefits consisted ofretirement benefit (regular monthly or lump-sum pension) and death insurance. In conjunction with theamendment, the plan would be fully funded after making installment payments up to January 2002 of therequired amount to fully fund the plan determined as of September 1, 2000. The amendment also includes anadditional benefit in the form of thirteenth-month retirement benefit, which is payable annually 14 days beforeIdul Fitri (“Moslem Holiday”).
The amendment covers employees registered as participants of the pension plan as of September 1, 2000and includes an increase in basic salary pension by 9% compounded annually starting from September 1, 2001.The amendment also stipulates that there will be no increase in the premium even in cases of mass employeeterminations or changes in marital status.
The total premium installments based on the amendment amounted to Rp355,000 and were paid on duedates.
On March 1, 2007, the Company entered into an agreement with Jiwasraya to provide defined deathinsurance plan to 1,276 employees as of January 1, 2007, who are not covered by the defined benefit pensionplan as stated above. Based on the agreement, a participating employee will receive:
• Expiration benefit equivalent to the cash value at the normal retirement age, or
• Death benefit not due to accident equivalent to 100% of insurance money plus cash value when theemployee dies not due to accident, or
• Death benefit due to accident equivalent to 200% of insurance money plus cash value when theemployee dies due to accident.
The premium of Rp7,600 was fully paid on March 29, 2007. Subsequently, in August 2007, February toDecember 2008, January to December 2009, January to December 2010 and January to December 2011, theCompany made payments for additional premium of Rp275 for additional 55 employees, Rp805 for additional161 employees, Rp415 for additional 81 employees, Rp120 for additional 14 employees and Rp378 for additional41 employees, respectively.
On June 25, 2003, Satelindo entered into an agreement with Jiwasraya to amend the benefits and premiumpayment pattern of the former’s pension plan. The amendment covers employees registered as participants of thepension plan as of December 25, 2002 up to June 25, 2003. Other new conditions include the following:
• An increase in pension basic salary at 6% compounded annually starting from December 25, 2002
• Thirteenth-month retirement benefit, which is payable annually 14 days before Idul Fitri
• An increase in periodic payment of retirement benefit at 6% compounded annually starting one yearafter receiving periodic retirement benefit for the first time
• If the average annual interest rate of time deposits of government banks exceeds 15%, the participants’retirement benefit will be increased by a certain percentage in accordance with the formula agreed byboth parties.
F-96
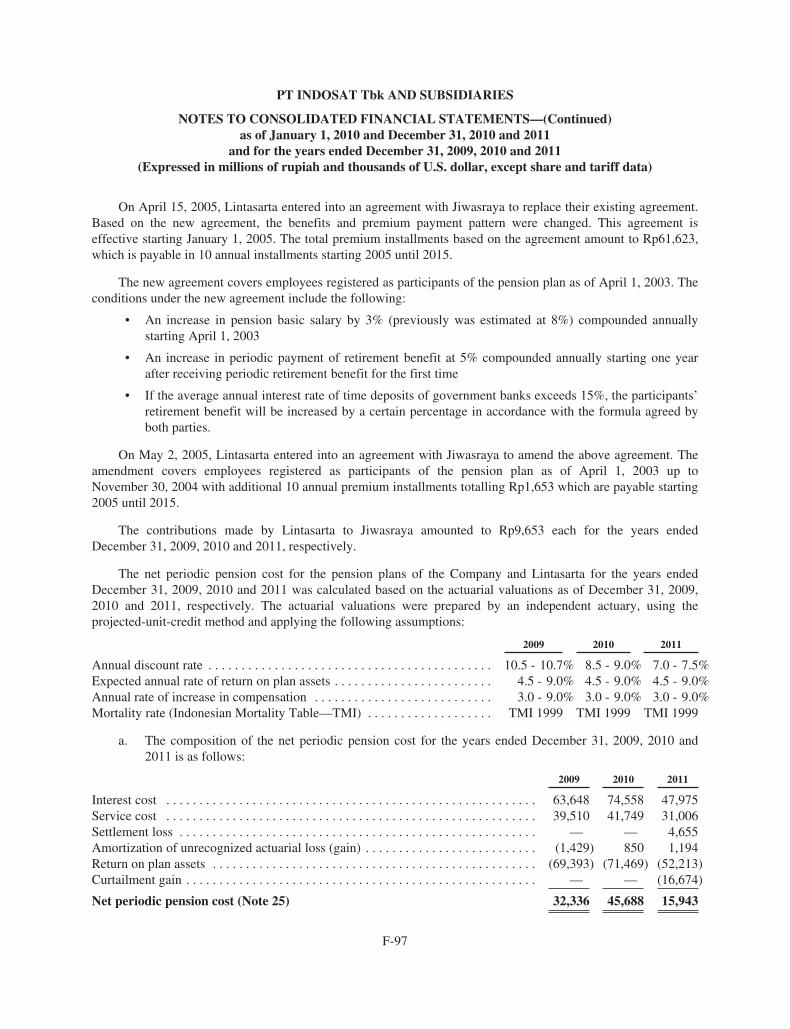
PT INDOSAT Tbk AND SUBSIDIARIES
NOTES TO CONSOLIDATED FINANCIAL STATEMENTS—(Continued)as of January 1, 2010 and December 31, 2010 and 2011
and for the years ended December 31, 2009, 2010 and 2011(Expressed in millions of rupiah and thousands of U.S. dollar, except share and tariff data)
On April 15, 2005, Lintasarta entered into an agreement with Jiwasraya to replace their existing agreement.Based on the new agreement, the benefits and premium payment pattern were changed. This agreement iseffective starting January 1, 2005. The total premium installments based on the agreement amount to Rp61,623,which is payable in 10 annual installments starting 2005 until 2015.
The new agreement covers employees registered as participants of the pension plan as of April 1, 2003. Theconditions under the new agreement include the following:
• An increase in pension basic salary by 3% (previously was estimated at 8%) compounded annuallystarting April 1, 2003
• An increase in periodic payment of retirement benefit at 5% compounded annually starting one yearafter receiving periodic retirement benefit for the first time
• If the average annual interest rate of time deposits of government banks exceeds 15%, the participants’retirement benefit will be increased by a certain percentage in accordance with the formula agreed byboth parties.
On May 2, 2005, Lintasarta entered into an agreement with Jiwasraya to amend the above agreement. Theamendment covers employees registered as participants of the pension plan as of April 1, 2003 up toNovember 30, 2004 with additional 10 annual premium installments totalling Rp1,653 which are payable starting2005 until 2015.
The contributions made by Lintasarta to Jiwasraya amounted to Rp9,653 each for the years endedDecember 31, 2009, 2010 and 2011, respectively.
The net periodic pension cost for the pension plans of the Company and Lintasarta for the years endedDecember 31, 2009, 2010 and 2011 was calculated based on the actuarial valuations as of December 31, 2009,2010 and 2011, respectively. The actuarial valuations were prepared by an independent actuary, using theprojected-unit-credit method and applying the following assumptions:
2009 2010 2011
Annual discount rate . . . . . . . . . . . . . . . . . . . . . . . . . . . . . . . . . . . . . . . . . . . 10.5 - 10.7% 8.5 - 9.0% 7.0 - 7.5%Expected annual rate of return on plan assets . . . . . . . . . . . . . . . . . . . . . . . . 4.5 - 9.0% 4.5 - 9.0% 4.5 - 9.0%Annual rate of increase in compensation . . . . . . . . . . . . . . . . . . . . . . . . . . . 3.0 - 9.0% 3.0 - 9.0% 3.0 - 9.0%Mortality rate (Indonesian Mortality Table—TMI) . . . . . . . . . . . . . . . . . . . TMI 1999 TMI 1999 TMI 1999
a. The composition of the net periodic pension cost for the years ended December 31, 2009, 2010 and2011 is as follows:
2009 2010 2011
Interest cost . . . . . . . . . . . . . . . . . . . . . . . . . . . . . . . . . . . . . . . . . . . . . . . . . . . . . . . . 63,648 74,558 47,975Service cost . . . . . . . . . . . . . . . . . . . . . . . . . . . . . . . . . . . . . . . . . . . . . . . . . . . . . . . . 39,510 41,749 31,006Settlement loss . . . . . . . . . . . . . . . . . . . . . . . . . . . . . . . . . . . . . . . . . . . . . . . . . . . . . . — — 4,655Amortization of unrecognized actuarial loss (gain) . . . . . . . . . . . . . . . . . . . . . . . . . . (1,429) 850 1,194Return on plan assets . . . . . . . . . . . . . . . . . . . . . . . . . . . . . . . . . . . . . . . . . . . . . . . . . (69,393) (71,469) (52,213)Curtailment gain . . . . . . . . . . . . . . . . . . . . . . . . . . . . . . . . . . . . . . . . . . . . . . . . . . . . . — — (16,674)
Net periodic pension cost (Note 25) 32,336 45,688 15,943
F-97
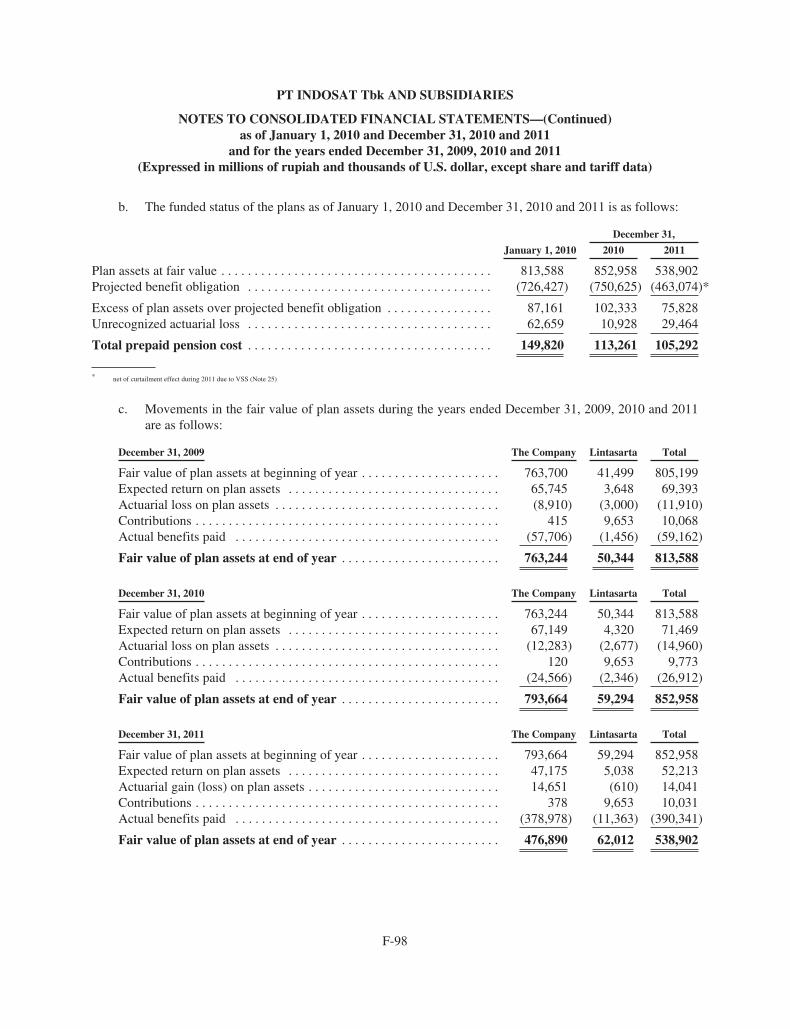
PT INDOSAT Tbk AND SUBSIDIARIES
NOTES TO CONSOLIDATED FINANCIAL STATEMENTS—(Continued)as of January 1, 2010 and December 31, 2010 and 2011
and for the years ended December 31, 2009, 2010 and 2011(Expressed in millions of rupiah and thousands of U.S. dollar, except share and tariff data)
b. The funded status of the plans as of January 1, 2010 and December 31, 2010 and 2011 is as follows:
December 31,
January 1, 2010 2010 2011
Plan assets at fair value . . . . . . . . . . . . . . . . . . . . . . . . . . . . . . . . . . . . . . . . . 813,588 852,958 538,902Projected benefit obligation . . . . . . . . . . . . . . . . . . . . . . . . . . . . . . . . . . . . . (726,427) (750,625) (463,074)*
Excess of plan assets over projected benefit obligation . . . . . . . . . . . . . . . . 87,161 102,333 75,828Unrecognized actuarial loss . . . . . . . . . . . . . . . . . . . . . . . . . . . . . . . . . . . . . 62,659 10,928 29,464
Total prepaid pension cost . . . . . . . . . . . . . . . . . . . . . . . . . . . . . . . . . . . . . 149,820 113,261 105,292
* net of curtailment effect during 2011 due to VSS (Note 25)
c. Movements in the fair value of plan assets during the years ended December 31, 2009, 2010 and 2011are as follows:
December 31, 2009 The Company Lintasarta Total
Fair value of plan assets at beginning of year . . . . . . . . . . . . . . . . . . . . . 763,700 41,499 805,199Expected return on plan assets . . . . . . . . . . . . . . . . . . . . . . . . . . . . . . . . 65,745 3,648 69,393Actuarial loss on plan assets . . . . . . . . . . . . . . . . . . . . . . . . . . . . . . . . . . (8,910) (3,000) (11,910)Contributions . . . . . . . . . . . . . . . . . . . . . . . . . . . . . . . . . . . . . . . . . . . . . . 415 9,653 10,068Actual benefits paid . . . . . . . . . . . . . . . . . . . . . . . . . . . . . . . . . . . . . . . . (57,706) (1,456) (59,162)
Fair value of plan assets at end of year . . . . . . . . . . . . . . . . . . . . . . . . 763,244 50,344 813,588
December 31, 2010 The Company Lintasarta Total
Fair value of plan assets at beginning of year . . . . . . . . . . . . . . . . . . . . . 763,244 50,344 813,588Expected return on plan assets . . . . . . . . . . . . . . . . . . . . . . . . . . . . . . . . 67,149 4,320 71,469Actuarial loss on plan assets . . . . . . . . . . . . . . . . . . . . . . . . . . . . . . . . . . (12,283) (2,677) (14,960)Contributions . . . . . . . . . . . . . . . . . . . . . . . . . . . . . . . . . . . . . . . . . . . . . . 120 9,653 9,773Actual benefits paid . . . . . . . . . . . . . . . . . . . . . . . . . . . . . . . . . . . . . . . . (24,566) (2,346) (26,912)
Fair value of plan assets at end of year . . . . . . . . . . . . . . . . . . . . . . . . 793,664 59,294 852,958
December 31, 2011 The Company Lintasarta Total
Fair value of plan assets at beginning of year . . . . . . . . . . . . . . . . . . . . . 793,664 59,294 852,958Expected return on plan assets . . . . . . . . . . . . . . . . . . . . . . . . . . . . . . . . 47,175 5,038 52,213Actuarial gain (loss) on plan assets . . . . . . . . . . . . . . . . . . . . . . . . . . . . . 14,651 (610) 14,041Contributions . . . . . . . . . . . . . . . . . . . . . . . . . . . . . . . . . . . . . . . . . . . . . . 378 9,653 10,031Actual benefits paid . . . . . . . . . . . . . . . . . . . . . . . . . . . . . . . . . . . . . . . . (378,978) (11,363) (390,341)
Fair value of plan assets at end of year . . . . . . . . . . . . . . . . . . . . . . . . 476,890 62,012 538,902
F-98

PT INDOSAT Tbk AND SUBSIDIARIES
NOTES TO CONSOLIDATED FINANCIAL STATEMENTS—(Continued)as of January 1, 2010 and December 31, 2010 and 2011
and for the years ended December 31, 2009, 2010 and 2011(Expressed in millions of rupiah and thousands of U.S. dollar, except share and tariff data)
d. Movements in the present value of the defined benefit obligation during the years ended December 31,2009, 2010 and 2011 are as follows:
December 31, 2009 The Company Lintasarta Total
Benefit obligation at beginning of year . . . . . . . . . . . . . . . . . . . . . . . . . 512,513 28,726 541,239Interest cost . . . . . . . . . . . . . . . . . . . . . . . . . . . . . . . . . . . . . . . . . . . . . . . 60,288 3,360 63,648Current service cost . . . . . . . . . . . . . . . . . . . . . . . . . . . . . . . . . . . . . . . . . 36,496 3,014 39,510Actuarial loss on obligation . . . . . . . . . . . . . . . . . . . . . . . . . . . . . . . . . . 624 7,809 8,433Actual benefits paid . . . . . . . . . . . . . . . . . . . . . . . . . . . . . . . . . . . . . . . . (57,057) (1,093) (58,150)Effect of changes in actuarial assumptions . . . . . . . . . . . . . . . . . . . . . . . 131,747 — 131,747
Present value of obligation at end of year . . . . . . . . . . . . . . . . . . . . . . 684,611 41,816 726,427
December 31, 2010 The Company Lintasarta Total
Benefit obligation at beginning of year . . . . . . . . . . . . . . . . . . . . . . . . . 684,611 41,816 726,427Interest cost . . . . . . . . . . . . . . . . . . . . . . . . . . . . . . . . . . . . . . . . . . . . . . . 70,279 4,279 74,558Current service cost . . . . . . . . . . . . . . . . . . . . . . . . . . . . . . . . . . . . . . . . . 38,375 3,374 41,749Actuarial loss (gain) on obligation . . . . . . . . . . . . . . . . . . . . . . . . . . . . . (156,345) 2,912 (153,433)Actual benefits paid . . . . . . . . . . . . . . . . . . . . . . . . . . . . . . . . . . . . . . . . (24,102) (2,166) (26,268)Effect of changes in actuarial assumptions . . . . . . . . . . . . . . . . . . . . . . . 87,592 — 87,592
Present value of obligation at end of year . . . . . . . . . . . . . . . . . . . . . . 700,410 50,215 750,625
December 31, 2011 The Company Lintasarta Total
Benefit obligation at beginning of year . . . . . . . . . . . . . . . . . . . . . . . . . 700,410 50,215 750,625Interest cost . . . . . . . . . . . . . . . . . . . . . . . . . . . . . . . . . . . . . . . . . . . . . . . 43,786 4,189 47,975Current service cost . . . . . . . . . . . . . . . . . . . . . . . . . . . . . . . . . . . . . . . . . 27,167 3,839 31,006Actuarial loss (gain) on obligation . . . . . . . . . . . . . . . . . . . . . . . . . . . . . (12,066) 4,315 (7,751)Effect of settlement . . . . . . . . . . . . . . . . . . . . . . . . . . . . . . . . . . . . . . . . . (358,597) (9,080) (367,677)Actual benefits paid . . . . . . . . . . . . . . . . . . . . . . . . . . . . . . . . . . . . . . . . (18,750) (1,857) (20,607)Effect of curtailment . . . . . . . . . . . . . . . . . . . . . . . . . . . . . . . . . . . . . . . . (18,886) 1,645 (17,241)Effect of changes in actuarial assumptions . . . . . . . . . . . . . . . . . . . . . . . 46,744 — 46,744
Present value of obligation at end of year . . . . . . . . . . . . . . . . . . . . . . 409,808 53,266 463,074
F-99

PT INDOSAT Tbk AND SUBSIDIARIES
NOTES TO CONSOLIDATED FINANCIAL STATEMENTS—(Continued)as of January 1, 2010 and December 31, 2010 and 2011
and for the years ended December 31, 2009, 2010 and 2011(Expressed in millions of rupiah and thousands of U.S. dollar, except share and tariff data)
e. Movements in the prepaid pension cost during the years ended December 31, 2009, 2010 and 2011 areas follows:
December 31, 2009 The Company Lintasarta Total
Prepaid pension cost at beginning of year . . . . . . . . . . . . . . . . . . . . . . . . 154,441 18,659 173,100Net periodic pension cost . . . . . . . . . . . . . . . . . . . . . . . . . . . . . . . . . . . . . (29,487) (2,849) (32,336)Refund from Jiwasraya . . . . . . . . . . . . . . . . . . . . . . . . . . . . . . . . . . . . . . . (649) (363) (1,012)Contribution to Jiwasraya . . . . . . . . . . . . . . . . . . . . . . . . . . . . . . . . . . . . . 415 9,653 10,068
Prepaid pension cost at end of year . . . . . . . . . . . . . . . . . . . . . . . . . . . 124,720 25,100 149,820
December 31, 2010The
Company Lintasarta Total
Prepaid pension cost at beginning of year . . . . . . . . . . . . . . . . . . . . . . . . . . . 124,720 25,100 149,820Net periodic pension cost . . . . . . . . . . . . . . . . . . . . . . . . . . . . . . . . . . . . . . . . (41,505) (4,183) (45,688)Refund from Jiwasraya . . . . . . . . . . . . . . . . . . . . . . . . . . . . . . . . . . . . . . . . . . (464) (180) (644)Contribution to Jiwasraya . . . . . . . . . . . . . . . . . . . . . . . . . . . . . . . . . . . . . . . . 120 9,653 9,773
Prepaid pension cost at end of year . . . . . . . . . . . . . . . . . . . . . . . . . . . . . . 82,871 30,390 113,261
December 31, 2011The
Company Lintasarta Total
Prepaid pension cost at beginning of year . . . . . . . . . . . . . . . . . . . . . . . . . . . 82,871 30,390 113,261Net periodic pension cost . . . . . . . . . . . . . . . . . . . . . . . . . . . . . . . . . . . . . . . . (5,887) (10,056) (15,943)Refund from Jiwasraya . . . . . . . . . . . . . . . . . . . . . . . . . . . . . . . . . . . . . . . . . . (1,631) (426) (2,057)Contribution to Jiwasraya . . . . . . . . . . . . . . . . . . . . . . . . . . . . . . . . . . . . . . . . 378 9,653 10,031
Prepaid pension cost at end of year . . . . . . . . . . . . . . . . . . . . . . . . . . . . . . 75,731 29,561 105,292
f. Prepaid pension cost consists of:
January 1, 2010
December 31,
2010 2011
Current portion (presented as part of “Prepaid Expenses”)The Company . . . . . . . . . . . . . . . . . . . . . . . . . . . . . . . . . . . . . . . . . 1,715 1,401 1,730Lintasarta . . . . . . . . . . . . . . . . . . . . . . . . . . . . . . . . . . . . . . . . . . . . . 725 516 381
2,440 1,917 2,111
Long-term portion (presented as “Long-term prepaid pension—net ofcurrent portion”)
The Company . . . . . . . . . . . . . . . . . . . . . . . . . . . . . . . . . . . . . . . . . 123,005 81,470 74,001Lintasarta . . . . . . . . . . . . . . . . . . . . . . . . . . . . . . . . . . . . . . . . . . . . . 24,375 29,874 29,180
147,380 111,344 103,181
Total prepaid pension cost . . . . . . . . . . . . . . . . . . . . . . . . . . . . . . . . . . 149,820 113,261 105,292
F-100

PT INDOSAT Tbk AND SUBSIDIARIES
NOTES TO CONSOLIDATED FINANCIAL STATEMENTS—(Continued)as of January 1, 2010 and December 31, 2010 and 2011
and for the years ended December 31, 2009, 2010 and 2011(Expressed in millions of rupiah and thousands of U.S. dollar, except share and tariff data)
The major categories of plan assets as a percentage of the fair value of total plan assets are as follows:
January 1,2010
December 31,
2010 2011
Investment in mutual fund . . . . . . . . . . . . . . . . . . . . . . . . . . . . . . . . . . . . . . . 74.28% 78.90% 78.11%Investment in time deposits . . . . . . . . . . . . . . . . . . . . . . . . . . . . . . . . . . . . . . . 13.68% 12.16% 12.50%Investment in debt securities . . . . . . . . . . . . . . . . . . . . . . . . . . . . . . . . . . . . . . 6.81% 5.06% 5.19%Investment in shares and properties . . . . . . . . . . . . . . . . . . . . . . . . . . . . . . . . 5.22% 3.87% 4.19%Other investments . . . . . . . . . . . . . . . . . . . . . . . . . . . . . . . . . . . . . . . . . . . . . . 0.01% 0.01% 0.01%The overall expected rate of return on assets is determined based on the market expectations prevailing on
that date, applicable to the period over which the obligation is to be settled. There has been a significant changein the expected rate of return on assets due to the improved stock market scenario.
Defined Contribution Pension Plan
In May 2001 and January 2003, the Company and Satelindo assisted their employees in establishing theirrespective employees’ defined contribution pension plans, in addition to the defined benefit pension plan asmentioned above. Starting June 2004, the Company also assisted ex-IM3 employees in establishing their definedcontribution pension plan. Under the defined contribution pension plan, the employees contribute 10%—20% oftheir basic salaries, while the Company does not contribute to the plans. Total contributions of the employees forthe years ended December 31, 2009, 2010 and 2011 amounted to Rp19,451, Rp46,557 and Rp43,709,respectively. The plan assets are being administered and managed by seven financial institutions appointed by theCompany and Satelindo, based on the choice of the employees.
Labor Law No. 13/2003
The Company, Lintasarta and IMM also accrue benefits under Labor Law No. 13/2003 (“Labor Law”) datedMarch 25, 2003. Their employees will receive the benefits which are higher under either this law or the definedbenefit pension plan.
The net periodic pension cost under the Labor Law for the years ended December 31, 2009, 2010 and 2011was calculated based on the actuarial valuations as of December 31, 2009, 2010 and 2011, respectively. Theactuarial valuations were prepared by an independent actuary, using the projected-unit-credit method andapplying the following assumptions:
2009 2010 2011
Annual discount rate . . . . . . . . . . . . . . . . . . . . . . . . . . . . . . . . . . . . . 10.5% 8.5 - 9.0% 7.5%Annual rate of increase in compensation . . . . . . . . . . . . . . . . . . . . . 9.0 - 10.0% 8.0 - 9.0% 8.0 - 9.0%
F-101

PT INDOSAT Tbk AND SUBSIDIARIES
NOTES TO CONSOLIDATED FINANCIAL STATEMENTS—(Continued)as of January 1, 2010 and December 31, 2010 and 2011
and for the years ended December 31, 2009, 2010 and 2011(Expressed in millions of rupiah and thousands of U.S. dollar, except share and tariff data)
a. The composition of the periodic pension cost under the Labor Law for the years ended December 31,2009, 2010 and 2011 is as follows:
2009 2010 2011
Service cost . . . . . . . . . . . . . . . . . . . . . . . . . . . . . . . . . . . . . . . . . . . . . . . . . . . . . . 19,587 21,747 29,355Interest cost . . . . . . . . . . . . . . . . . . . . . . . . . . . . . . . . . . . . . . . . . . . . . . . . . . . . . . 18,639 19,586 15,888Amortization of unrecognized past service cost . . . . . . . . . . . . . . . . . . . . . . . . . . — — 716Amortization of unrecognized actuarial loss . . . . . . . . . . . . . . . . . . . . . . . . . . . . 1,842 1,500 18Curtailment gain . . . . . . . . . . . . . . . . . . . . . . . . . . . . . . . . . . . . . . . . . . . . . . . . . . — — (35,633)Immediate recognition of past service cost -vested benefit . . . . . . . . . . . . . . . . . 904 — —
Net periodic pension cost under the Labor Law (Note 25) . . . . . . . . . . . . . . . 40,972 42,833 10,344
b. The composition of the accrued pension cost under the Labor Law as of December 31, 2009, 2010 and2011 is as follows:
2009 2010 2011
Projected benefit obligation . . . . . . . . . . . . . . . . . . . . . . . . . . . . . . . . . . . . . . . 187,888 217,754 291,135*Unrecognized actuarial loss . . . . . . . . . . . . . . . . . . . . . . . . . . . . . . . . . . . . . . . (27,147) (17,245) (83,494)Unrecognized past service cost . . . . . . . . . . . . . . . . . . . . . . . . . . . . . . . . . . . . (10,348) (9,632) (8,612)
Accrued pension cost 150,393 190,877 199,029
* net of curtailment effect during 2011 due to VSS (Note 25)
c. Movements in the present value of pension cost obligation under the Labor Law during the years endedDecember 31, 2009, 2010 and 2011 are as follows:
December 31, 2009 The Company Lintasarta IMM Total
Benefit obligation at beginning of year . . . . . . . . . . . . . . . . . . . . . . . 141,316 11,464 3,674 156,454Actuarial gain on obligation . . . . . . . . . . . . . . . . . . . . . . . . . . . . . . . (3,316) (78) (368) (3,762)Current service cost . . . . . . . . . . . . . . . . . . . . . . . . . . . . . . . . . . . . . . 16,173 1,817 1,597 19,587Interest cost . . . . . . . . . . . . . . . . . . . . . . . . . . . . . . . . . . . . . . . . . . . . 16,832 1,372 435 18,639Actual benefits paid . . . . . . . . . . . . . . . . . . . . . . . . . . . . . . . . . . . . . . (3,841) (47) (20) (3,908)Past service cost . . . . . . . . . . . . . . . . . . . . . . . . . . . . . . . . . . . . . . . . . — 10,853 — 10,853Effect of changes in actuarial assumption . . . . . . . . . . . . . . . . . . . . . (8,109) (3,208) 1,342 (9,975)
Present value of obligation at end of year . . . . . . . . . . . . . . . . . . . 159,055 22,173 6,660 187,888
December 31, 2010 The Company Lintasarta IMM Total
Benefit obligation at beginning of year . . . . . . . . . . . . . . . . . . . . . . . 159,055 22,173 6,660 187,888Actuarial loss (gain) on obligation . . . . . . . . . . . . . . . . . . . . . . . . . . 1,166 (890) 804 1,080Current service cost . . . . . . . . . . . . . . . . . . . . . . . . . . . . . . . . . . . . . . 17,661 1,967 2,119 21,747Interest cost . . . . . . . . . . . . . . . . . . . . . . . . . . . . . . . . . . . . . . . . . . . . 16,574 2,319 693 19,586Actual benefits paid . . . . . . . . . . . . . . . . . . . . . . . . . . . . . . . . . . . . . . (2,150) (97) (102) (2,349)Effect of changes in actuarial assumption . . . . . . . . . . . . . . . . . . . . . (9,734) (1,132) 668 (10,198)
Present value of obligation at end of year . . . . . . . . . . . . . . . . . . . 182,572 24,340 10,842 217,754
F-102

PT INDOSAT Tbk AND SUBSIDIARIES
NOTES TO CONSOLIDATED FINANCIAL STATEMENTS—(Continued)as of January 1, 2010 and December 31, 2010 and 2011
and for the years ended December 31, 2009, 2010 and 2011(Expressed in millions of rupiah and thousands of U.S. dollar, except share and tariff data)
December 31, 2011The
Company Lintasarta IMM Total
Benefit obligation at beginning of year . . . . . . . . . . . . . . . . . . . . . . 182,572 24,340 10,842 217,754Actuarial loss (gain) on obligation . . . . . . . . . . . . . . . . . . . . . . . . . 75,163 (5,182) (1,442) 68,539Current service cost . . . . . . . . . . . . . . . . . . . . . . . . . . . . . . . . . . . . . 24,740 2,003 2,612 29,355Interest cost . . . . . . . . . . . . . . . . . . . . . . . . . . . . . . . . . . . . . . . . . . . 12,855 2,064 969 15,888Actual benefits paid . . . . . . . . . . . . . . . . . . . . . . . . . . . . . . . . . . . . . (1,826) (111) (255) (2,192)Effect of curtailment . . . . . . . . . . . . . . . . . . . . . . . . . . . . . . . . . . . . (38,828) (890) — (39,718)Effect of changes in actuarial assumption . . . . . . . . . . . . . . . . . . . . (3,688) 1,936 3,261 1,509
Present value of obligation at end of year . . . . . . . . . . . . . . . . . . 250,988 24,160 15,987 291,135
d. Movements in the accrued pension cost under the Labor Law during the years ended December 31,2009, 2010 and 2011 are as follows:
December 31, 2009The
Company Lintasarta IMM Total
Accrued pension cost under the Labor Law at beginning of year . . . 100,518 8,609 4,202 113,329Periodic Labor Law cost . . . . . . . . . . . . . . . . . . . . . . . . . . . . . . . . . . 34,739 4,209 2,024 40,972Benefit payment . . . . . . . . . . . . . . . . . . . . . . . . . . . . . . . . . . . . . . . . . (3,841) (47) (20) (3,908)
Accrued pension cost under the Labor Law at end of year . . . . . 131,416 12,771 6,206 150,393
December 31, 2010The
Company Lintasarta IMM Total
Accrued pension cost under the Labor Law at beginning of year . . . 131,416 12,771 6,206 150,393Periodic Labor Law cost . . . . . . . . . . . . . . . . . . . . . . . . . . . . . . . . . . 35,019 4,974 2,840 42,833Benefit payment . . . . . . . . . . . . . . . . . . . . . . . . . . . . . . . . . . . . . . . . . (2,150) (97) (102) (2,349)
Accrued pension cost under the Labor Law at end of year . . . . . 164,285 17,648 8,944 190,877
December 31, 2011The
Company Lintasarta IMM Total
Accrued pension cost under the Labor Law at beginning ofyear . . . . . . . . . . . . . . . . . . . . . . . . . . . . . . . . . . . . . . . . . . . . . . . 164,285 17,648 8,944 190,877
Periodic Labor Law cost . . . . . . . . . . . . . . . . . . . . . . . . . . . . . . . . . 2,754 3,952 3,638 10,344Benefit payment . . . . . . . . . . . . . . . . . . . . . . . . . . . . . . . . . . . . . . . . (1,826) (111) (255) (2,192)
Accrued pension cost under the Labor Law at end of year . . . . 165,213 21,489 12,327 199,029
As of January 1, 2010 and December 31, 2010 and 2011, the current portion of pension cost under the LaborLaw included in accrued expenses (Note 17) amounted to Rp2,603, Rp2,933 and Rp4,700, respectively, and thenon-current portion included in employee benefit obligations (Note 21) amounted to Rp147,790, Rp187,944 andRp194,329, respectively.
Post-retirement Healthcare
The Company provides post-retirement healthcare benefits to its employees who leave the Company afterthe employees fulfill the early retirement requirement. The spouse and children who have been officially
F-103
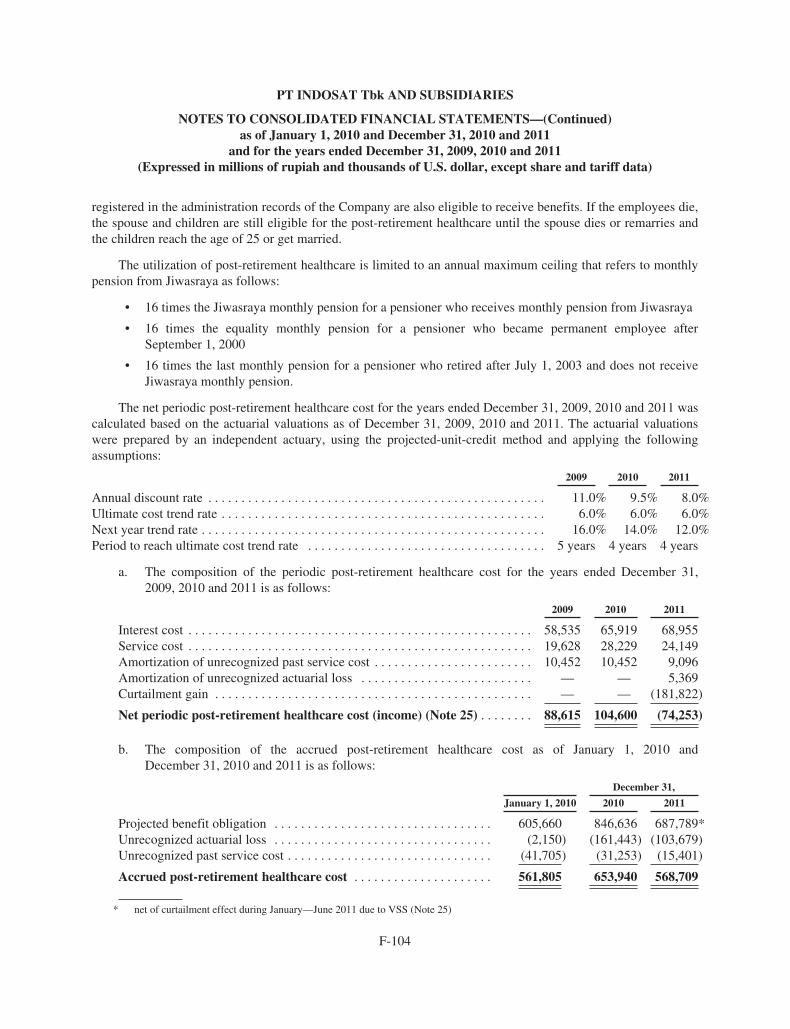
PT INDOSAT Tbk AND SUBSIDIARIES
NOTES TO CONSOLIDATED FINANCIAL STATEMENTS—(Continued)as of January 1, 2010 and December 31, 2010 and 2011
and for the years ended December 31, 2009, 2010 and 2011(Expressed in millions of rupiah and thousands of U.S. dollar, except share and tariff data)
registered in the administration records of the Company are also eligible to receive benefits. If the employees die,the spouse and children are still eligible for the post-retirement healthcare until the spouse dies or remarries andthe children reach the age of 25 or get married.
The utilization of post-retirement healthcare is limited to an annual maximum ceiling that refers to monthlypension from Jiwasraya as follows:
• 16 times the Jiwasraya monthly pension for a pensioner who receives monthly pension from Jiwasraya
• 16 times the equality monthly pension for a pensioner who became permanent employee afterSeptember 1, 2000
• 16 times the last monthly pension for a pensioner who retired after July 1, 2003 and does not receiveJiwasraya monthly pension.
The net periodic post-retirement healthcare cost for the years ended December 31, 2009, 2010 and 2011 wascalculated based on the actuarial valuations as of December 31, 2009, 2010 and 2011. The actuarial valuationswere prepared by an independent actuary, using the projected-unit-credit method and applying the followingassumptions:
2009 2010 2011
Annual discount rate . . . . . . . . . . . . . . . . . . . . . . . . . . . . . . . . . . . . . . . . . . . . . . . . . . . 11.0% 9.5% 8.0%Ultimate cost trend rate . . . . . . . . . . . . . . . . . . . . . . . . . . . . . . . . . . . . . . . . . . . . . . . . . 6.0% 6.0% 6.0%Next year trend rate . . . . . . . . . . . . . . . . . . . . . . . . . . . . . . . . . . . . . . . . . . . . . . . . . . . . 16.0% 14.0% 12.0%Period to reach ultimate cost trend rate . . . . . . . . . . . . . . . . . . . . . . . . . . . . . . . . . . . . 5 years 4 years 4 years
a. The composition of the periodic post-retirement healthcare cost for the years ended December 31,2009, 2010 and 2011 is as follows:
2009 2010 2011
Interest cost . . . . . . . . . . . . . . . . . . . . . . . . . . . . . . . . . . . . . . . . . . . . . . . . . . . . 58,535 65,919 68,955Service cost . . . . . . . . . . . . . . . . . . . . . . . . . . . . . . . . . . . . . . . . . . . . . . . . . . . . 19,628 28,229 24,149Amortization of unrecognized past service cost . . . . . . . . . . . . . . . . . . . . . . . . 10,452 10,452 9,096Amortization of unrecognized actuarial loss . . . . . . . . . . . . . . . . . . . . . . . . . . — — 5,369Curtailment gain . . . . . . . . . . . . . . . . . . . . . . . . . . . . . . . . . . . . . . . . . . . . . . . . — — (181,822)
Net periodic post-retirement healthcare cost (income) (Note 25) . . . . . . . . 88,615 104,600 (74,253)
b. The composition of the accrued post-retirement healthcare cost as of January 1, 2010 andDecember 31, 2010 and 2011 is as follows:
December 31,
January 1, 2010 2010 2011
Projected benefit obligation . . . . . . . . . . . . . . . . . . . . . . . . . . . . . . . . . 605,660 846,636 687,789*Unrecognized actuarial loss . . . . . . . . . . . . . . . . . . . . . . . . . . . . . . . . . (2,150) (161,443) (103,679)Unrecognized past service cost . . . . . . . . . . . . . . . . . . . . . . . . . . . . . . . (41,705) (31,253) (15,401)
Accrued post-retirement healthcare cost . . . . . . . . . . . . . . . . . . . . . 561,805 653,940 568,709
* net of curtailment effect during January—June 2011 due to VSS (Note 25)
F-104

PT INDOSAT Tbk AND SUBSIDIARIES
NOTES TO CONSOLIDATED FINANCIAL STATEMENTS—(Continued)as of January 1, 2010 and December 31, 2010 and 2011
and for the years ended December 31, 2009, 2010 and 2011(Expressed in millions of rupiah and thousands of U.S. dollar, except share and tariff data)
c. Movements in the present value of defined benefit obligation during the years ended December 31,2009, 2010 and 2011 are as follows:
2009 2010 2011
Benefit obligation at beginning of year . . . . . . . . . . . . . . . . . . . . . . . . . . . . . 492,615 605,660 846,636Interest cost . . . . . . . . . . . . . . . . . . . . . . . . . . . . . . . . . . . . . . . . . . . . . . . . . . . 58,535 65,919 68,955Current service cost . . . . . . . . . . . . . . . . . . . . . . . . . . . . . . . . . . . . . . . . . . . . . 19,628 28,229 24,149Actual benefits paid . . . . . . . . . . . . . . . . . . . . . . . . . . . . . . . . . . . . . . . . . . . . (10,582) (12,465) (10,978)Actuarial gain on obligation . . . . . . . . . . . . . . . . . . . . . . . . . . . . . . . . . . . . . . (37,177) (38,574) (160,703)Effect of curtailment . . . . . . . . . . . . . . . . . . . . . . . . . . . . . . . . . . . . . . . . . . . . — — (230,600)Effect of changes in actuarial assumptions . . . . . . . . . . . . . . . . . . . . . . . . . . . 82,641 197,867 150,330
Present value of obligation at end of year . . . . . . . . . . . . . . . . . . . . . . . . . . 605,660 846,636 687,789
d. Movements in the accrued post-retirement healthcare cost during the years ended December 31, 2009,2010 and 2011 are as follows:
2009 2010 2011
Beginning balance . . . . . . . . . . . . . . . . . . . . . . . . . . . . . . . . . . . . . . . . . . . . . . 483,772 561,805 653,940Net periodic post-retirement healthcare cost . . . . . . . . . . . . . . . . . . . . . . . . . . 88,615 104,600 (74,253)Benefit payment . . . . . . . . . . . . . . . . . . . . . . . . . . . . . . . . . . . . . . . . . . . . . . . . (10,582) (12,465) (10,978)
Ending balance . . . . . . . . . . . . . . . . . . . . . . . . . . . . . . . . . . . . . . . . . . . . . . . . 561,805 653,940 568,709
As of January 1, 2010 and December 31, 2010 and 2011, the current portion of post-retirementhealthcare cost included in accrued expenses (Note 17) amounted to Rp12,798, Rp14,669 andRp12,957, respectively, and the non-current portion included in employee benefit obligations (Note 21)amounted to Rp549,007, Rp639,271 and Rp555,752, respectively.
e. The effect of a one percentage point change in assumed post-retirement healthcare cost trend ratewould result in aggregate service and interest costs for the years ended December 31, 2009, 2010 and2011 and accumulated post-retirement healthcare benefit obligation as of January 1, 2010 andDecember 31, 2010 and 2011 as follows:
2009 2010 2011
IncreaseService and interest costs . . . . . . . . . . . . . . . . . . . . . . . . . . . . . . . . . . . 95,709 116,581 118,454
December 31,
January 1, 2010 2010 2011
Accumulated post-retirement healthcare benefit obligation . . . . . . . . 725,664 1,030,938 844,612
2009 2010 2011
DecreaseService and interest costs . . . . . . . . . . . . . . . . . . . . . . . . . . . . . . . . . . . 64,493 76,868 73,626
December 31,
January 1, 2010 2010 2011
Accumulated post-retirement healthcare benefit obligation . . . . . . . . 510,522 702,632 566,627
F-105

PT INDOSAT Tbk AND SUBSIDIARIES
NOTES TO CONSOLIDATED FINANCIAL STATEMENTS—(Continued)as of January 1, 2010 and December 31, 2010 and 2011
and for the years ended December 31, 2009, 2010 and 2011(Expressed in millions of rupiah and thousands of U.S. dollar, except share and tariff data)
Amounts for the current annual period and previous four annual periods of employee benefits:
Defined Benefit Pension Plan
December 31, January 1,2010
December 31,
2007 2008 2010 2011
The CompanyPlan assets . . . . . . . . . . . . . . . . . . . . . . . . . . . . . . . . . . . . 697,641 763,700 763,244 793,664 476,890Projected benefit obligation . . . . . . . . . . . . . . . . . . . . . . (639,131) (512,513) (684,611) (700,410) (409,808)Excess of plan assets over projected benefit
obligation . . . . . . . . . . . . . . . . . . . . . . . . . . . . . . . . . . . 58,510 251,187 78,633 93,254 67,082Unrecognized actuarial loss (gain) . . . . . . . . . . . . . . . . . 129,291 (96,746) 46,087 (10,383) 8,649
Net Prepaid Pension . . . . . . . . . . . . . . . . . . . . . . . . . . . 187,801 154,441 124,720 82,871 75,731
LintasartaPlan assets . . . . . . . . . . . . . . . . . . . . . . . . . . . . . . . . . . . . 33,146 41,499 50,344 59,294 62,012Projected benefit obligation . . . . . . . . . . . . . . . . . . . . . . (33,014) (28,726) (41,816) (50,215) (53,266)Excess of plan assets over projected benefit
obligation . . . . . . . . . . . . . . . . . . . . . . . . . . . . . . . . . . . 132 12,773 8,528 9,079 8,746Unrecognized actuarial loss . . . . . . . . . . . . . . . . . . . . . . 13,058 5,886 16,572 21,311 20,815
Net Prepaid Pension . . . . . . . . . . . . . . . . . . . . . . . . . . . 13,190 18,659 25,100 30,390 29,561
Total . . . . . . . . . . . . . . . . . . . . . . . . . . . . . . . . . . . . . . . . 200,991 173,100 149,820 113,261 105,292
Labor Law No.13/2003
December 31, January 1,2010
December 31,
2007 2008 2010 2011
The CompanyProjected benefit obligation . . . . . . . . . . . . . . . . . . . . . . . (94,063) (141,316) (159,055) (182,572) (250,988)Unrecognized actuarial loss . . . . . . . . . . . . . . . . . . . . . . . 15,459 40,798 27,639 18,287 85,775
Net Accrued Pension (78,604) (100,518) (131,416) (164,285) (165,213)
LintasartaProjected benefit obligation . . . . . . . . . . . . . . . . . . . . . . . (6,297) (11,464) (22,173) (24,340) (24,160)Unrecognized actuarial loss (gain) . . . . . . . . . . . . . . . . . . (716) 2,855 (547) (2,569) (5,598)Unrecognized past service cost . . . . . . . . . . . . . . . . . . . . . — — 9,949 9,261 8,269
Net Accrued Pension (7,013) (8,609) (12,771) (17,648) (21,489)
IMMProjected benefit obligation . . . . . . . . . . . . . . . . . . . . . . . (4,168) (3,674) (6,660) (10,842) (15,987)Unrecognized actuarial loss (gain) . . . . . . . . . . . . . . . . . . 994 (955) 55 1,527 3,317Unrecognized past service cost . . . . . . . . . . . . . . . . . . . . . 455 427 399 371 343
Net Accrued Pension (2,719) (4,202) (6,206) (8,944) (12,327)
Total (88,336) (113,329) (150,393) (190,877) (199,029)
F-106

PT INDOSAT Tbk AND SUBSIDIARIES
NOTES TO CONSOLIDATED FINANCIAL STATEMENTS—(Continued)as of January 1, 2010 and December 31, 2010 and 2011
and for the years ended December 31, 2009, 2010 and 2011(Expressed in millions of rupiah and thousands of U.S. dollar, except share and tariff data)
Post-retirement Healthcare
December 31, January 1,2010
December 31,
2007 2008 2010 2011
The CompanyProjected benefit obligation . . . . . . . . . . . . . . . . . . . . . . (767,828) (492,615) (605,660) (846,636) (687,789)Unrecognized past service cost . . . . . . . . . . . . . . . . . . . . 62,610 52,158 41,705 31,253 15,401Unrecognized actuarial loss (gain) . . . . . . . . . . . . . . . . . 333,412 (43,315) 2,150 161,443 103,679
Net Accrued Pension (371,806) (483,772) (561,805) (653,940) (568,709)
29. ACCOUNTS AND TRANSACTIONS WITH RELATED PARTIES
The details of the accounts and the significant transactions entered into with related parties (affiliates,unless otherwise indicated) are as follows:
AmountPercentage to Total Assets/
Liabilities (%)
January 1,2010
December 31,2010
December 31,2011
January 1,2010
December 31,2010
December 31,2011
Cash and cash equivalents (Note 4)Government-related entities:State-owned banks . . . . . . . . . . . . . . . . . . . 2,068,042 1,615,651 977,960 3.73 3.02 1.82
Accounts receivable—trade (Note 5)Government-related entities:State-owned companies . . . . . . . . . . . . . . . . 179,990 267,319 297,717 0.32 0.50 0.56Ultimate parent company:Qatar Telecom . . . . . . . . . . . . . . . . . . . . . . . 3,460 2,827 6,927 0.01 0.01 0.01
Total . . . . . . . . . . . . . . . . . . . . . . . . . . . . . . 183,450 270,146 304,644 0.33 0.51 0.57Less allowance for impairment of accounts
receivable . . . . . . . . . . . . . . . . . . . . . . . . . 57,538 47,640 47,107 0.10 0.09 0.09
Net . . . . . . . . . . . . . . . . . . . . . . . . . . . . . . . . 125,912 222,506 257,537 0.23 0.42 0.48
Prepaid expensesGovernment-related entities:State-owned companies . . . . . . . . . . . . . . . . 9,041 11,683 8,222 0.02 0.02 0.01Governmental departments . . . . . . . . . . . . . — — 205 — — 0.00Entity under significant influence:Kopindosat . . . . . . . . . . . . . . . . . . . . . . . . . . 2,306 3,294 3,681 0.00 0.01 0.01
Total . . . . . . . . . . . . . . . . . . . . . . . . . . . . . . 11,347 14,977 12,108 0.02 0.03 0.02
Other current and non-current financialassets
Government-related entities:State-owned banks . . . . . . . . . . . . . . . . . . . . 66,397 91,231 71,825 0.12 0.17 0.13Governmental departments . . . . . . . . . . . . . — 87 87 — 0.00 0.00
Total . . . . . . . . . . . . . . . . . . . . . . . . . . . . . . 66,397 91,318 71,912 0.12 0.17 0.13
F-107
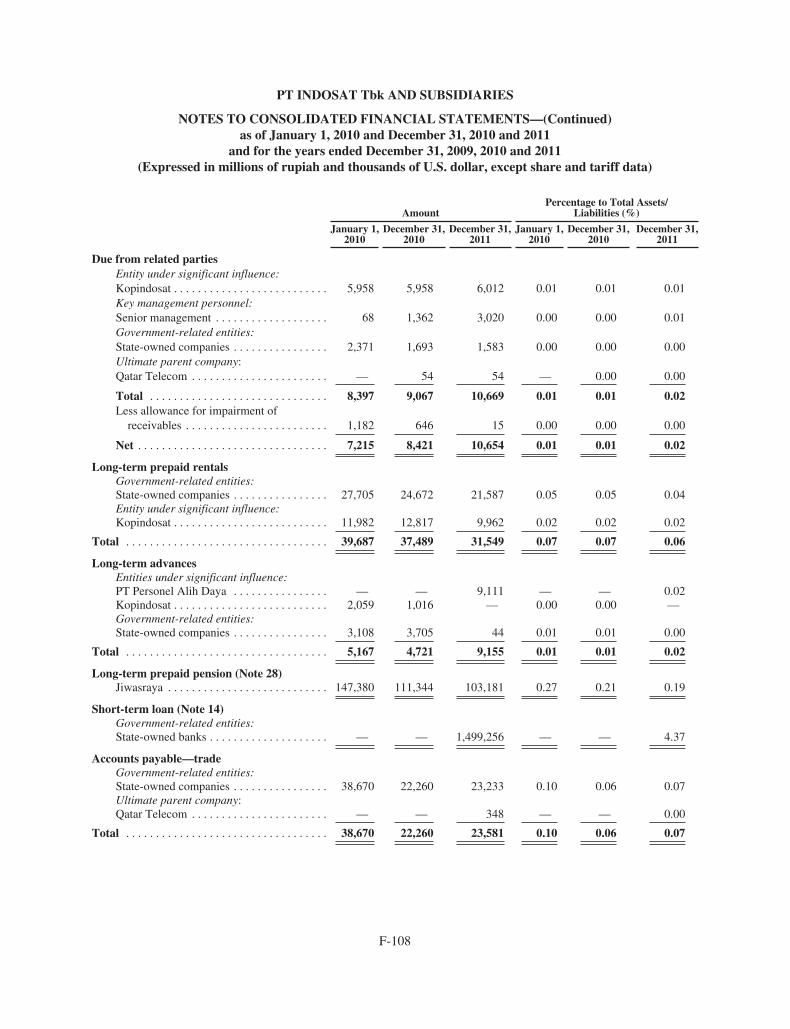
PT INDOSAT Tbk AND SUBSIDIARIES
NOTES TO CONSOLIDATED FINANCIAL STATEMENTS—(Continued)as of January 1, 2010 and December 31, 2010 and 2011
and for the years ended December 31, 2009, 2010 and 2011(Expressed in millions of rupiah and thousands of U.S. dollar, except share and tariff data)
AmountPercentage to Total Assets/
Liabilities (%)
January 1,2010
December 31,2010
December 31,2011
January 1,2010
December 31,2010
December 31,2011
Due from related partiesEntity under significant influence:Kopindosat . . . . . . . . . . . . . . . . . . . . . . . . . . 5,958 5,958 6,012 0.01 0.01 0.01Key management personnel:Senior management . . . . . . . . . . . . . . . . . . . 68 1,362 3,020 0.00 0.00 0.01Government-related entities:State-owned companies . . . . . . . . . . . . . . . . 2,371 1,693 1,583 0.00 0.00 0.00Ultimate parent company:Qatar Telecom . . . . . . . . . . . . . . . . . . . . . . . — 54 54 — 0.00 0.00
Total . . . . . . . . . . . . . . . . . . . . . . . . . . . . . . 8,397 9,067 10,669 0.01 0.01 0.02Less allowance for impairment of
receivables . . . . . . . . . . . . . . . . . . . . . . . . 1,182 646 15 0.00 0.00 0.00
Net . . . . . . . . . . . . . . . . . . . . . . . . . . . . . . . . 7,215 8,421 10,654 0.01 0.01 0.02
Long-term prepaid rentalsGovernment-related entities:State-owned companies . . . . . . . . . . . . . . . . 27,705 24,672 21,587 0.05 0.05 0.04Entity under significant influence:Kopindosat . . . . . . . . . . . . . . . . . . . . . . . . . . 11,982 12,817 9,962 0.02 0.02 0.02
Total . . . . . . . . . . . . . . . . . . . . . . . . . . . . . . . . . . 39,687 37,489 31,549 0.07 0.07 0.06
Long-term advancesEntities under significant influence:PT Personel Alih Daya . . . . . . . . . . . . . . . . — — 9,111 — — 0.02Kopindosat . . . . . . . . . . . . . . . . . . . . . . . . . . 2,059 1,016 — 0.00 0.00 —Government-related entities:State-owned companies . . . . . . . . . . . . . . . . 3,108 3,705 44 0.01 0.01 0.00
Total . . . . . . . . . . . . . . . . . . . . . . . . . . . . . . . . . . 5,167 4,721 9,155 0.01 0.01 0.02
Long-term prepaid pension (Note 28)Jiwasraya . . . . . . . . . . . . . . . . . . . . . . . . . . . 147,380 111,344 103,181 0.27 0.21 0.19
Short-term loan (Note 14)Government-related entities:State-owned banks . . . . . . . . . . . . . . . . . . . . — — 1,499,256 — — 4.37
Accounts payable—tradeGovernment-related entities:State-owned companies . . . . . . . . . . . . . . . . 38,670 22,260 23,233 0.10 0.06 0.07Ultimate parent company:Qatar Telecom . . . . . . . . . . . . . . . . . . . . . . . — — 348 — — 0.00
Total . . . . . . . . . . . . . . . . . . . . . . . . . . . . . . . . . . 38,670 22,260 23,581 0.10 0.06 0.07
F-108

PT INDOSAT Tbk AND SUBSIDIARIES
NOTES TO CONSOLIDATED FINANCIAL STATEMENTS—(Continued)as of January 1, 2010 and December 31, 2010 and 2011
and for the years ended December 31, 2009, 2010 and 2011(Expressed in millions of rupiah and thousands of U.S. dollar, except share and tariff data)
AmountPercentage to Total Assets/
Liabilities (%)
January 1,2010
December 31,2010
December 31,2011
January 1,2010
December 31,2010
December 31,2011
Procurement payable (Note 15)Entities under significant influence:PT Personel Alih daya . . . . . . . . . . . . . . . . . 13,907 13,210 16,319 0.04 0.04 0.05Kopindosat . . . . . . . . . . . . . . . . . . . . . . . . . . 25,509 22,123 9,872 0.07 0.06 0.03Government-related entities:State-owned companies . . . . . . . . . . . . . . . . 77,868 33,348 9,882 0.21 0.10 0.03
Total . . . . . . . . . . . . . . . . . . . . . . . . . . . . . . . . . . 117,284 68,681 36,073 0.32 0.20 0.11
Accrued expensesGovernment-related entities:State-owned companies . . . . . . . . . . . . . . . . 95,449 82,641 66,399 0.26 0.23 0.19Key management personnel:Senior management . . . . . . . . . . . . . . . . . . . 27,825 33,553 37,851 0.08 0.10 0.11Entities under significant influence:PT Personel Alih Daya . . . . . . . . . . . . . . . . 9,305 16,906 18,222 0.02 0.05 0.05Kopindosat . . . . . . . . . . . . . . . . . . . . . . . . . . 6,702 13,838 5,817 0.02 0.04 0.02
Total . . . . . . . . . . . . . . . . . . . . . . . . . . . . . . . . . . 139,281 146,938 128,289 0.38 0.42 0.37
Due to related partiesGovernment-related entities:State-owned companies . . . . . . . . . . . . . . . . 12,274 20,609 14,928 0.03 0.06 0.05Ultimate parent company:Qatar Telecom . . . . . . . . . . . . . . . . . . . . . . . — — 552 — — 0.00Entity under significant influence:Kopindosat . . . . . . . . . . . . . . . . . . . . . . . . . . 1,490 1,490 — 0.01 0.00 —
Total . . . . . . . . . . . . . . . . . . . . . . . . . . . . . . . . . . 13,764 22,099 15,480 0.04 0.06 0.05
Other current and non-current liabilitiesGovernment-related entities:State-owned companies . . . . . . . . . . . . . . . . 9,782 8,118 6,455 0.03 0.02 0.02Governmental departments . . . . . . . . . . . . . — 3,895 2,141 — 0.01 0.01
Total . . . . . . . . . . . . . . . . . . . . . . . . . . . . . . . . . . 9,782 12,013 8,596 0.03 0.03 0.03
Loans payable (Note 18)Government-related entities:State-owned banks . . . . . . . . . . . . . . . . . . . . 2,592,489 1,297,045 998,843 7.03 3.74 2.91
F-109

PT INDOSAT Tbk AND SUBSIDIARIES
NOTES TO CONSOLIDATED FINANCIAL STATEMENTS—(Continued)as of January 1, 2010 and December 31, 2010 and 2011
and for the years ended December 31, 2009, 2010 and 2011(Expressed in millions of rupiah and thousands of U.S. dollar, except share and tariff data)
AmountPercentage to Respective Income or
Expenses (%)
January 1,2010
December 31,2010
December 31,2011
January 1,2010
December 31,2010
December 31,2011
Operating revenuesGovernment-related entities:State-owned companies . . . . . . . . . . . 1,434,021 1,572,147 1,459,979 7.61 8.00 7.15Governmental departments . . . . . . . . 33,473 31,923 24,823 0.18 0.16 0.12Ultimate parent company:Qatar Telecom . . . . . . . . . . . . . . . . . . 6,714 36,521 69,978 0.04 0.19 0.35
Total . . . . . . . . . . . . . . . . . . . . . . . . . . . . . 1,474,208 1,640,591 1,554,780 7.83 8.35 7.62
Operating expensesCost of services
Government-related entities:State-owned companies . . . . . . . . . . . 1,947,205 1,642,288 1,567,294 12.44 10.16 8.91Entities under significant influence:Kopindosat . . . . . . . . . . . . . . . . . . . . 5,661 59,205 121,456 0.04 0.37 0.69PT Personel Alih Daya . . . . . . . . . . . 57,714 80,902 93,190 0.37 0.50 0.53Ultimate parent company:Qatar Telecom . . . . . . . . . . . . . . . . . . 2,821 27,375 66,619 0.02 0.17 0.38
Total . . . . . . . . . . . . . . . . . . . . . . . . . . . . . 2,013,401 1,809,770 1,848,559 12.87 11.20 10.51
PersonnelKey management personnel:Senior managementShort-term employee benefits . . . . . . 136,613 117,282 102,156 0.87 0.73 0.58Termination benefit . . . . . . . . . . . . . . 4,793 13,828 46,316 0.03 0.09 0.26Other long-term benefits . . . . . . . . . . 4,104 796 16,481 0.03 0.00 0.09
Sub-total . . . . . . . . . . . . . . . . . . . . . . 145,510 131,906 164,953 0.93 0.82 0.93
Government-related entities:State-owned companies . . . . . . . . . . . 32,336 45,688 22,185 0.21 0.28 0.13Entity under significant influence:PT Personel Alih Daya . . . . . . . . . . . 56,613 40,139 21,028 0.36 0.25 0.12
Total . . . . . . . . . . . . . . . . . . . . . . . . . . . . . 234,459 217,733 208,166 1.50 1.35 1.18
F-110

PT INDOSAT Tbk AND SUBSIDIARIES
NOTES TO CONSOLIDATED FINANCIAL STATEMENTS—(Continued)as of January 1, 2010 and December 31, 2010 and 2011
and for the years ended December 31, 2009, 2010 and 2011(Expressed in millions of rupiah and thousands of U.S. dollar, except share and tariff data)
AmountPercentage to Respective Income or
Expenses (%)
January 1,2010
December 31,2010
December 31,2011
January 1,2010
December 31,2010
December 31,2011
MarketingEntities under significant influence:PT Personel Alih Daya . . . . . . . . . . . . . . . . . . . 21,968 49,921 75,905 0.14 0.31 0.44Kopindosat . . . . . . . . . . . . . . . . . . . . . . . . . . . . 1,379 11,725 15,953 0.01 0.07 0.09Government-related entities:State-owned companies . . . . . . . . . . . . . . . . . . 19,038 33 62 0.12 0.00 0.00
Total . . . . . . . . . . . . . . . . . . . . . . . . . . . . . 42,385 61,679 91,920 0.27 0.38 0.53
General and administrationGovernment-related entities:State-owned companies . . . . . . . . . . . . . . . . . . 82,947 100,987 100,234 0.53 0.62 0.58Entities under significant influence:Kopindosat . . . . . . . . . . . . . . . . . . . . . . . . . . . . 24,465 26,072 24,294 0.16 0.11 0.14PT Personel Alih Daya . . . . . . . . . . . . . . . . . . . 35,912 17,914 17,971 0.23 0.16 0.10
Total . . . . . . . . . . . . . . . . . . . . . . . . . . . . . 143,324 144,973 142,499 0.92 0.89 0.82
Other income (expenses)Government-related entities:
State owned banks . . . . . . . . . . . . . . . . . (128,841) (124,599) (64,450) (19.76) (5.76) (3.84)
F-111

PT INDOSAT Tbk AND SUBSIDIARIES
NOTES TO CONSOLIDATED FINANCIAL STATEMENTS—(Continued)as of January 1, 2010 and December 31, 2010 and 2011
and for the years ended December 31, 2009, 2010 and 2011(Expressed in millions of rupiah and thousands of U.S. dollar, except share and tariff data)
The relationship and nature of account balances/transactions with related parties are as follows:
No Related Parties Relationship Nature of Account Balances/Transactions
1. State-owned banks Government—related entities
Cash and cash equivalents, other current and non-currentfinancial and non-financial assets, short-term loan, loanpayable and other income (expenses)
2. State-ownedcompanies
Government—related entities
Accounts receivable—trade, due from related parties,prepaid expenses, long-term prepaid rentals, long-termadvances, long-term prepaid pension, accounts payable—trade, procurement payable, accrued expenses, due to relatedparties, other current and non-current financial and non-financial liabilities, operating revenues, operatingexpenses—cost of services, operating expenses - personnel,operating expenses—general and administration andoperating expenses—marketing
3. Qatar Telecom Ultimate parentcompany
Accounts receivable—trade, due from related parties,accounts payable—trade, due to related parties, operatingrevenues—fixed telecommunication and operatingexpenses—cost of services
4. Governmentaldepartments
Government—related entities
Prepaid expenses, other current and non-current financialand non-financial assets, other current and non-currentfinancial and non-financial liabilities, operating revenues—MIDI
5. Kopindosat Entity undercommon significant
influence
Prepaid expenses, due from related parties, long-termadvances, long-term prepaid rentals, procurement payable,accrued expenses, due to related parties, operatingexpenses—cost of services, operating expenses—generaland administration and operating expenses—marketing
6. Senior management Key managementpersonnel
Due from related parties, accrued expenses and operatingexpenses—personnel
7. PT Personel AlihDaya
Entity undercommon significant
influence
Long-term advances, procurement payable, accruedexpenses, operating expenses—cost of services, operatingexpenses—personnel, operating expenses—general andadministration and operating expenses—marketing
F-112

PT INDOSAT Tbk AND SUBSIDIARIES
NOTES TO CONSOLIDATED FINANCIAL STATEMENTS—(Continued)as of January 1, 2010 and December 31, 2010 and 2011
and for the years ended December 31, 2009, 2010 and 2011(Expressed in millions of rupiah and thousands of U.S. dollar, except share and tariff data)
30. BASIC AND DILUTED EARNINGS PER SHARE
The following table sets forth the computation of basic and diluted earnings per share:
2009 2010 2011
Numerator for basic and diluted earnings per share—profit forthe year attributable to the Owners of the Company, aspreviously reported . . . . . . . . . . . . . . . . . . . . . . . . . . . . . . . . . 1,690,804 824,637 1,009,080
Accounting policy change . . . . . . . . . . . . . . . . . . . . . . . . . . . . . 13,094 — —
Numerator for basic and diluted earnings per share—profit forthe year attributable to the Owners of the Company . . . . . . . 1,703,898 824,637 1,009,080
Denominator for basic and diluted earnings per share—weighted-average number of shares outstanding during theyear . . . . . . . . . . . . . . . . . . . . . . . . . . . . . . . . . . . . . . . . . . . . . 5,433,933,500 5,433,933,500 5,433,933,500
Basic and diluted earnings per share . . . . . . . . . . . . . . . . . . . 313.57 151.76 185.70
Basic and diluted earnings per ADS (50 B shares perADS) . . . . . . . . . . . . . . . . . . . . . . . . . . . . . . . . . . . . . . . . . . . . 15,678.31 7,587.85 9,284.99
There are no potential dilutive outstanding shares as of December 31, 2009, 2010 and 2011.
31. DISTRIBUTION OF INCOME AND APPROPRIATION OF RETAINED EARNINGS
At the Company’s Annual Stockholders’ General Meeting (“ASGM”), the stockholders approved, amongothers, the appropriation of annual profit for reserve fund and cash dividend distribution, as follows, and theutilization of the remaining amount for reinvestment and working capital.
ASGM DateReserve Fund
(Rp)Dividend per Share
(Rp)Dividend
Payment Date
2008 ProfitJune 11, 2009 . . . . . . . . . . . . . . . . . . . . . . . . . . . . . . . . . . . . 18,786 172.85 July 22, 2009
2009 ProfitJune 22, 2010 . . . . . . . . . . . . . . . . . . . . . . . . . . . . . . . . . . . . 14,982 137.86 August 2, 2010
2010 ProfitJune 24, 2011 . . . . . . . . . . . . . . . . . . . . . . . . . . . . . . . . . . . . — 59.55 August 5, 2011
Dividend for the Government was paid in accordance with the prevailing laws and regulations in Indonesia.
On July 22 and August 5, 2011, the Company paid dividend amounting to Rp46,248 and Rp277,343,respectively, to the Government and other stockholders for the dividend declared on June 24, 2011.
F-113
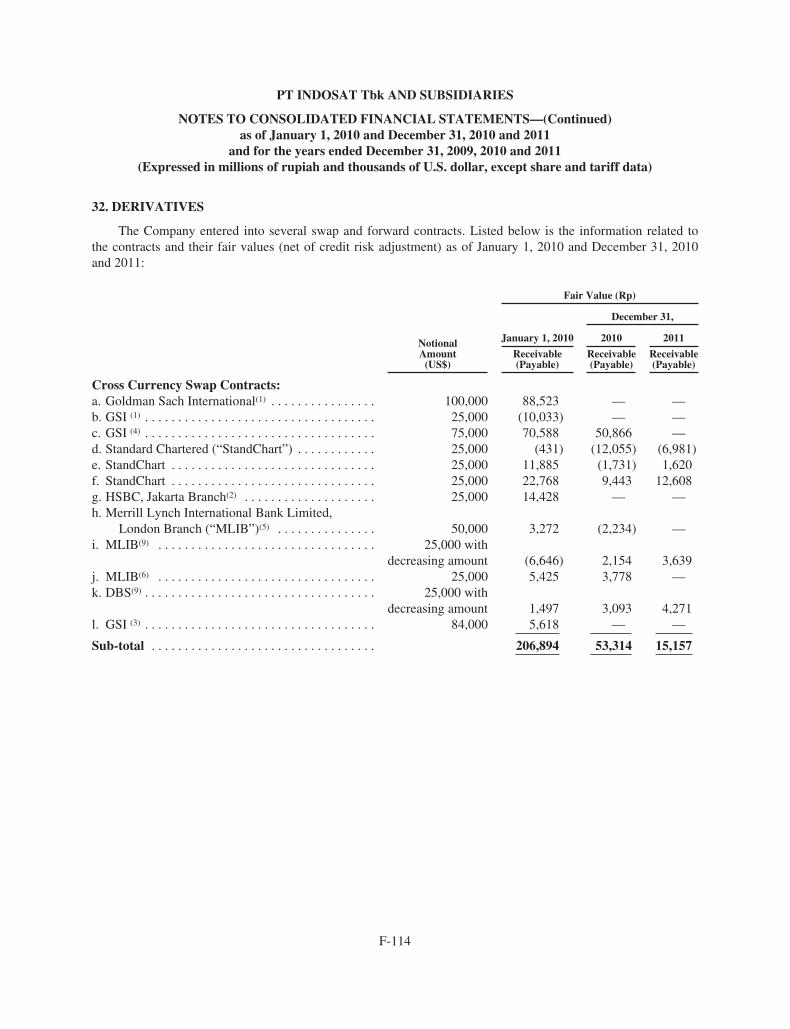
PT INDOSAT Tbk AND SUBSIDIARIES
NOTES TO CONSOLIDATED FINANCIAL STATEMENTS—(Continued)as of January 1, 2010 and December 31, 2010 and 2011
and for the years ended December 31, 2009, 2010 and 2011(Expressed in millions of rupiah and thousands of U.S. dollar, except share and tariff data)
32. DERIVATIVES
The Company entered into several swap and forward contracts. Listed below is the information related tothe contracts and their fair values (net of credit risk adjustment) as of January 1, 2010 and December 31, 2010and 2011:
Fair Value (Rp)
December 31,
NotionalAmount
(US$)
January 1, 2010 2010 2011
Receivable(Payable)
Receivable(Payable)
Receivable(Payable)
Cross Currency Swap Contracts:a. Goldman Sach International(1) . . . . . . . . . . . . . . . . 100,000 88,523 — —b. GSI (1) . . . . . . . . . . . . . . . . . . . . . . . . . . . . . . . . . . . 25,000 (10,033) — —c. GSI (4) . . . . . . . . . . . . . . . . . . . . . . . . . . . . . . . . . . . 75,000 70,588 50,866 —d. Standard Chartered (“StandChart”) . . . . . . . . . . . . 25,000 (431) (12,055) (6,981)e. StandChart . . . . . . . . . . . . . . . . . . . . . . . . . . . . . . . 25,000 11,885 (1,731) 1,620f. StandChart . . . . . . . . . . . . . . . . . . . . . . . . . . . . . . . 25,000 22,768 9,443 12,608g. HSBC, Jakarta Branch(2) . . . . . . . . . . . . . . . . . . . . 25,000 14,428 — —h. Merrill Lynch International Bank Limited,
London Branch (“MLIB”)(5) . . . . . . . . . . . . . . . 50,000 3,272 (2,234) —i. MLIB(9) . . . . . . . . . . . . . . . . . . . . . . . . . . . . . . . . . 25,000 with
decreasing amount (6,646) 2,154 3,639j. MLIB(6) . . . . . . . . . . . . . . . . . . . . . . . . . . . . . . . . . 25,000 5,425 3,778 —k. DBS(9) . . . . . . . . . . . . . . . . . . . . . . . . . . . . . . . . . . . 25,000 with
decreasing amount 1,497 3,093 4,271l. GSI (3) . . . . . . . . . . . . . . . . . . . . . . . . . . . . . . . . . . . 84,000 5,618 — —
Sub-total . . . . . . . . . . . . . . . . . . . . . . . . . . . . . . . . . . 206,894 53,314 15,157
F-114

PT INDOSAT Tbk AND SUBSIDIARIES
NOTES TO CONSOLIDATED FINANCIAL STATEMENTS—(Continued)as of January 1, 2010 and December 31, 2010 and 2011
and for the years ended December 31, 2009, 2010 and 2011(Expressed in millions of rupiah and thousands of U.S. dollar, except share and tariff data)
Fair Value (Rp)
December 31,
NotionalAmount (US$)
January 1, 2010 2010 2011
Receivable(Payable)
Receivable(Payable)
Receivable(Payable)
Interest Rate Swap Contracts:m. HSBC, Jakarta Branch . . . . . . . . . . . . . . . . . . . . . 27,037 with
decreasing amount (9,184) (13,100) (13,254)n. HSBC, Jakarta Branch . . . . . . . . . . . . . . . . . . . . . 44,200 with
decreasing amount (19,935) (29,027) (35,370)o. GSI . . . . . . . . . . . . . . . . . . . . . . . . . . . . . . . . . . . . 100,000 (73,226) (90,273) (60,869)p. DBS . . . . . . . . . . . . . . . . . . . . . . . . . . . . . . . . . . . 25,000 with
decreasing amount (10,680) (9,238) (4,174)q. DBS . . . . . . . . . . . . . . . . . . . . . . . . . . . . . . . . . . . 25,000 with
decreasing amount (9,927) (9,343) (3,678)r. Bank of Tokyo MUFJ (“BTMUFJ”) . . . . . . . . . . 25,000 with
decreasing amount (5,134) (6,656) (2,649)s. BTMUFJ . . . . . . . . . . . . . . . . . . . . . . . . . . . . . . . . 25,000 with
decreasing amount (3,920) (5,885) (2,347)t. BTMUFJ . . . . . . . . . . . . . . . . . . . . . . . . . . . . . . . . 25,000 with
decreasing amount (3,116) (5,297) (2,118)u. StandChart . . . . . . . . . . . . . . . . . . . . . . . . . . . . . . 40,000 with
decreasing amount (1,311) (6,814) (2,692)v. DBS . . . . . . . . . . . . . . . . . . . . . . . . . . . . . . . . . . . 26,000 with
decreasing amount (3,414) (4,966) (1,486)w. DBS . . . . . . . . . . . . . . . . . . . . . . . . . . . . . . . . . . . 26,000 with
decreasing amount (2,307) (4,303) (1,282)x. BTMUFJ . . . . . . . . . . . . . . . . . . . . . . . . . . . . . . . . 36,500 with
decreasing amount (6,485) (7,347) (1,289)y. International Netherlands Group (“ING”) Bank
N.V.(8) . . . . . . . . . . . . . . . . . . . . . . . . . . . . . . . .25,000 with
decreasing amount (4,340) (4,014) —z. ING Bank N.V.(7) . . . . . . . . . . . . . . . . . . . . . . . . . 33,500 (4,451) (3,120 ) —
Sub-total . . . . . . . . . . . . . . . . . . . . . . . . . . . . . . . . . . (157,430) (199,383) (131,208)
(1) contract entered into in May 2005 and settled in November 2010(2) contract entered into in August 2006 and settled in November 2010(3) contract entered into in December 2008 and settled in November 2010(4) contract entered into in August 2005 and terminated in June 2011(5) contract entered into in August 2008 and terminated in June 2011(6) contract entered into in September 2008 and terminated in June 2011(7) contract entered into in April 2009 and settled in June 2011(8) contract entered into in March 2009 and settled in December 2011(9) In December 2011, the Company used the option to exercise US$6,000 of the contract amount.
F-115

PT INDOSAT Tbk AND SUBSIDIARIES
NOTES TO CONSOLIDATED FINANCIAL STATEMENTS—(Continued)as of January 1, 2010 and December 31, 2010 and 2011
and for the years ended December 31, 2009, 2010 and 2011(Expressed in millions of rupiah and thousands of U.S. dollar, except share and tariff data)
Fair Value (Rp)
December 31,
NotionalAmount
(US$)
January 1, 2010 2010 2011
Receivable(Payable)
Receivable(Payable)
Receivable(Payable)
Currency Forward Contracts:aa. JP Morgan (10) . . . . . . . . . . . . . . . . . . . . . . . . . . . . . . . . . . . . 10,000 — — —ab. DBS (10) . . . . . . . . . . . . . . . . . . . . . . . . . . . . . . . . . . . . . . . . . 20,000 — — —ac. Deutche Bank (10) . . . . . . . . . . . . . . . . . . . . . . . . . . . . . . . . . . 20,000 — — —ad. Deutche Bank (10) . . . . . . . . . . . . . . . . . . . . . . . . . . . . . . . . . . 10,000 — — —ae. JP Morgan (10) . . . . . . . . . . . . . . . . . . . . . . . . . . . . . . . . . . . . 10,000 — — —af. StandChart (10) . . . . . . . . . . . . . . . . . . . . . . . . . . . . . . . . . . . . 5,000 — — —ag. JP Morgan (10) . . . . . . . . . . . . . . . . . . . . . . . . . . . . . . . . . . . . 10,000 — — —ah. PT Danareksa (Persero) (“Danareksa”) (10) . . . . . . . . . . . . . . 5,000 — — —ai. JP Morgan (10) . . . . . . . . . . . . . . . . . . . . . . . . . . . . . . . . . . . . 5,000 — — —aj. StandChart (10) . . . . . . . . . . . . . . . . . . . . . . . . . . . . . . . . . . . . 5,000 — — —ak. JP Morgan (10) . . . . . . . . . . . . . . . . . . . . . . . . . . . . . . . . . . . . 5,000 — — —al. HSBC, Jakarta Branch (11) . . . . . . . . . . . . . . . . . . . . . . . . . . . 5,000 — — —am. HSBC, Jakarta Branch (12) . . . . . . . . . . . . . . . . . . . . . . . . . . . 5,000 — — —an. JP Morgan (11) . . . . . . . . . . . . . . . . . . . . . . . . . . . . . . . . . . . . 5,000 — — —ao. HSBC, Jakarta Branch (11) . . . . . . . . . . . . . . . . . . . . . . . . . . . 1,000 — — —ap. HSBC, Jakarta Branch (11) . . . . . . . . . . . . . . . . . . . . . . . . . . . 3,000 — — —aq. HSBC, Jakarta Branch . . . . . . . . . . . . . . . . . . . . . . . . . . . . . 10,000 — — 5,231ar. JP Morgan . . . . . . . . . . . . . . . . . . . . . . . . . . . . . . . . . . . . . . . 2,000 — — 1,011as. StandChart . . . . . . . . . . . . . . . . . . . . . . . . . . . . . . . . . . . . . . . 3,000 — — 3,902at. JP Morgan . . . . . . . . . . . . . . . . . . . . . . . . . . . . . . . . . . . . . . . 9,500 — — 4,832au. HSBC, Jakarta Branch . . . . . . . . . . . . . . . . . . . . . . . . . . . . . 6,000 — — 3,222av. HSBC, Jakarta Branch . . . . . . . . . . . . . . . . . . . . . . . . . . . . . 7,500 — — 4,021aw. JP Morgan . . . . . . . . . . . . . . . . . . . . . . . . . . . . . . . . . . . . . . . 13,750 — — 6,771ax. StandChart . . . . . . . . . . . . . . . . . . . . . . . . . . . . . . . . . . . . . . . 7,000 — — 4,542ay. StandChart . . . . . . . . . . . . . . . . . . . . . . . . . . . . . . . . . . . . . . . 6,600 — — 3,666az. StandChart . . . . . . . . . . . . . . . . . . . . . . . . . . . . . . . . . . . . . . . 8,000 — — 1,486ba. DBS . . . . . . . . . . . . . . . . . . . . . . . . . . . . . . . . . . . . . . . . . . . . 10,000 — — 5,010bb. ING . . . . . . . . . . . . . . . . . . . . . . . . . . . . . . . . . . . . . . . . . . . . 7,000 — — 3,538bc. DBS . . . . . . . . . . . . . . . . . . . . . . . . . . . . . . . . . . . . . . . . . . . . 7,000 — — 3,528bd. DBS . . . . . . . . . . . . . . . . . . . . . . . . . . . . . . . . . . . . . . . . . . . . 10,000 — — 5,497be. JP Morgan . . . . . . . . . . . . . . . . . . . . . . . . . . . . . . . . . . . . . . . 10,000 — — 5,523bf. HSBC . . . . . . . . . . . . . . . . . . . . . . . . . . . . . . . . . . . . . . . . . . 10,000 — — 4,909bg. ING . . . . . . . . . . . . . . . . . . . . . . . . . . . . . . . . . . . . . . . . . . . . 10,000 — — 5,330bh. ING . . . . . . . . . . . . . . . . . . . . . . . . . . . . . . . . . . . . . . . . . . . . 13,000 — — 6,960bi. DBS . . . . . . . . . . . . . . . . . . . . . . . . . . . . . . . . . . . . . . . . . . . . 13,000 — — 6,859bj. ING . . . . . . . . . . . . . . . . . . . . . . . . . . . . . . . . . . . . . . . . . . . . 13,500 — — 7,386bk. ING . . . . . . . . . . . . . . . . . . . . . . . . . . . . . . . . . . . . . . . . . . . . 10,000 — — 5,478bl. ING . . . . . . . . . . . . . . . . . . . . . . . . . . . . . . . . . . . . . . . . . . . . 10,000 — — 5,508bm. GSI . . . . . . . . . . . . . . . . . . . . . . . . . . . . . . . . . . . . . . . . . . . . 8,000 — — 4,558bn. GSI . . . . . . . . . . . . . . . . . . . . . . . . . . . . . . . . . . . . . . . . . . . . 13,000 — — 7,550bo. Royal Bank of Scotland (“RBS”) . . . . . . . . . . . . . . . . . . . . . 12,000 — — 6,370bp. GSI . . . . . . . . . . . . . . . . . . . . . . . . . . . . . . . . . . . . . . . . . . . . 12,000 — — 7,185bq. GSI . . . . . . . . . . . . . . . . . . . . . . . . . . . . . . . . . . . . . . . . . . . . 12,500 — — 7,338
Sub-total — — 137,211Total 49,464 (146,069) 21,160
F-116

PT INDOSAT Tbk AND SUBSIDIARIES
NOTES TO CONSOLIDATED FINANCIAL STATEMENTS—(Continued)as of January 1, 2010 and December 31, 2010 and 2011
and for the years ended December 31, 2009, 2010 and 2011(Expressed in millions of rupiah and thousands of U.S. dollar, except share and tariff data)
(10) contracts entered into in July 2011 and settled in December 2011(11) contracts entered into in August 2011 and settled in November 2011(12) contract entered into in August 2011 and settled in December 2011
The net changes in fair value of the swap contracts, currency forward contracts and embedded derivative(Note 18g), totaling (Rp486,916), (Rp448,831) and Rp57,944 in 2009, 2010 and 2011, respectively, werecredited or charged to “Gain (Loss) on Change in Fair Value of Derivatives—Net”, which is presented underOther Income (Expenses) in the consolidated statements of comprehensive income.
The following are the details of the contracts:
Cross Currency Swap Contracts
No.Counter-parties
Contract Period andSwap Amount Annual Swap Premium Rate
SwapPremium
Payment Date
Amount of Swap PremiumPaid/ Amortized (Rp)
2009 2010 2011
a. GSI (1) May 13, 2005 - November 5, 2010Swap Rp832,250 for US$100,000
(i) Fixed rate of 6.96% per annumfor US$50,000 and (ii) 6-monthU.S. dollar LIBOR plus 2.62% perannum for US$50,000, netted with(a) 6-month U.S. dollar LIBOR perannum multiplied by US$11,750during the period May 13, 2005through May 13, 2008 and (b) theamount of US$11,750 on May 13,2008. On May 14, 2008, theCompany received from GSI thefixed amount of US$11,750(equivalent to Rp109,099) relatedto the cross currency swapcontract.
Every May 5and November 5
54,116 46,136 —
b. GSI (2) May 13, 2005 - November 5, 2010Swap Rp245,000 for US$25,000
4.30% of US$25,000 Every May 5and November 5
10,906 9,841 —
F-117

PT INDOSAT Tbk AND SUBSIDIARIES
NOTES TO CONSOLIDATED FINANCIAL STATEMENTS—(Continued)as of January 1, 2010 and December 31, 2010 and 2011
and for the years ended December 31, 2009, 2010 and 2011(Expressed in millions of rupiah and thousands of U.S. dollar, except share and tariff data)
No.Counter-parties
Contract Period andSwap Amount Annual Swap Premium Rate
SwapPremium
Payment Date
Amount of Swap PremiumPaid/ Amortized (Rp)
2009 2010 2011
c. GSI (4) August 22, 2005 - June 22, 2012The Company will swap thefollowing:
• US$75,000 which isequal to US$75,000multiplied by thelowest IDR/USDexchange rate withinthe period of August22, 2005 - June 22,2012 if the IDR/USDspot rate at terminationdate is less than orequal to the lowest ofIDR/USD exchangerate mentioned aboveplus Rp4,300 (in fullamounts)
• US$75,000 which isequal to US$75,000multiplied by IDR/USD spot rate attermination date minusRp4,300 (in fullamount) if IDR/USDspot rate at terminationdate is greater than thelowest of IDR/USDexchange ratementioned above plusRp4,300 (in fullamounts)
3.28% of US$75,000 Every June 22 andDecember 22
24,357 22,866 10,689
d. StandChart January 11, 2006 - June 22, 2012Swap Rp236,250 for US$25,000
4.78% of US$25,000 Every June 22 andDecember 22
11,791 11,034 10,672
e. StandChart March 15, 2006 - June 22, 2012Swap Rp228,550 for US$25,000
3.75% of US$25,000 Every June 22 andDecember 22
9,250 8,657 8,372
f. StandChart May 12, 2006 - June 22, 2012Swap Rp217,500 for US$25,000
3.45% of US$25,000 Every June 22 andDecember 22
8,510 7,964 7,702
g. HSBC (3) August 8, 2006 - November 5,2010Swap Rp225,000 for US$25,000
4.00% of US$25,000 Every May 5and November 5
10,145 9,074 —
F-118

PT INDOSAT Tbk AND SUBSIDIARIES
NOTES TO CONSOLIDATED FINANCIAL STATEMENTS—(Continued)as of January 1, 2010 and December 31, 2010 and 2011
and for the years ended December 31, 2009, 2010 and 2011(Expressed in millions of rupiah and thousands of U.S. dollar, except share and tariff data)
No.Counter-parties
Contract Period andSwap Amount Annual Swap Premium Rate
SwapPremium
Payment Date
Amount of Swap PremiumPaid/ Amortized (Rp)
2009 2010 2011
h. MLIB (5) August 8, 2008 - June 22, 2012The Company will receive thefollowing:
• zero amount if the IDR/USD spot rate attermination date is lessthan or equal toRp8,950 to US$1 (infull amounts)
• certain U.S. dollaramount which is equalto US$50,000multiplied by (1 -Rp8,950 divided byIDR/USD spot rate) (infull amounts) if theIDR/USD spot rate attermination date isgreater than Rp8,950but is less than or equalto Rp11,000 to US$1(in full amounts)
• certain U.S. dollaramount which is equalto US$50,000multiplied by (Rp11,000- Rp8,950) divided byIDR/USD spot rate (infull amounts) if theIDR/USD spot rate attermination date isgreater than Rp11,000to US$1 (in fullamounts)
4.22% of US$50,000 Every June 22and December 22
22,778 23,965 11,326
(1) On November 5, 2010, this contract expired and the Company received settlement gain on the crosscurrency swap amounting to Rp59,925.
(2) On November 5, 2010, this contract expired and the Company paid settlement loss on the cross currencyswap amounting to (Rp21,881).
(3) On November 5, 2010, this contract expired and the Company paid settlement loss on the cross currencyswap amounting to (Rp2,550).
(4) On June 28, 2011, this contract was terminated and the Company received settlement gain on the crosscurrency swap amounting to US$3,650 or equivalent to Rp31,379 on July 1, 2011.
(5) On June 28, 2011, this contract was terminated and the Company paid settlement loss on the cross currencyswap amounting to (US$1,456) or equivalent to (Rp12,519) on July 1, 2011.
F-119

PT INDOSAT Tbk AND SUBSIDIARIES
NOTES TO CONSOLIDATED FINANCIAL STATEMENTS—(Continued)as of January 1, 2010 and December 31, 2010 and 2011
and for the years ended December 31, 2009, 2010 and 2011(Expressed in millions of rupiah and thousands of U.S. dollar, except share and tariff data)
No.Counter-parties
Contract Period andSwap Amount Annual Swap Premium Rate
SwapPremium
Payment Date
Amount of Swap PremiumPaid/ Amortized (Rp)
2009 2010 2011
i. MLIB (6) September 2, 2008 - June 12,2013The Company will receive thefollowing:
• zero amount if the IDR/USD spot rate attermination date is less thanor equal to Rp8,800 toUS$1 (in full amounts)
• certain U.S. dollar amountas arranged in the contractmultiplied by (IDR/USDspot rate - Rp8,800)divided by IDR/USD spotrate (in full amounts) if theIDR/USD spot rate attermination date is greaterthan Rp8,800 but is lessthan or equal to Rp12,000to US$1 (in full amounts)
• certain U.S. dollar amountas arranged in the contractmultiplied by (Rp3,200divided by IDR/USD spotrate) (in full amounts) if theIDR/USD spot rate attermination date is greaterthan Rp12,000 to US$1 (infull amounts)
4.10% of US$25,000 up to June12, 2011 , and4.10% of decreasing U.S. dollaramount as arranged in thecontract up to June 12, 2013
Every June 12 andDecember 12
11,230 11,852 9,968
F-120

PT INDOSAT Tbk AND SUBSIDIARIES
NOTES TO CONSOLIDATED FINANCIAL STATEMENTS—(Continued)as of January 1, 2010 and December 31, 2010 and 2011
and for the years ended December 31, 2009, 2010 and 2011(Expressed in millions of rupiah and thousands of U.S. dollar, except share and tariff data)
No.Counter-parties
Contract Period andSwap Amount Annual Swap Premium Rate
SwapPremium
Payment Date
Amount of Swap PremiumPaid/ Amortized (Rp)
2009 2010 2011
j. MLIB (7) September 8, 2008 - June 22, 2012The Company will receive the following:
• zero amount if the IDR/USD spot rate attermination date is less than or equal toRp9,000 to US$1 (in full amounts)
• certain U.S. dollar amount which isequal to US$25,000 multiplied by (1 -Rp9,000 divided by IDR/USD spot rate)(in full amounts) if the IDR/USD spotrate at termination date is greater thanRp9,000 but is less than or equal toRp11,000 to US$1 (in full amounts)
• certain U.S. dollar amount which isequal to US$25,000 multiplied by(Rp11,000 - Rp9,000) divided by IDR/USD spot rate (in full amounts) if theIDR/USD spot rate at termination date isgreater than Rp11,000 to US$1 (in fullamounts)
2.52% ofUS$25,000
EveryJune 22 and
December 22
6,801 7,156 3,382
k. DBS (9) September 10, 2008 - June 12, 2013The Company will receive the following:
• zero amount if the IDR/USD spot rate atthe scheduled settlement date is at orless than Rp8,800 to US$1 (in fullamounts)
• certain U.S. dollar amount which isequal to U.S. dollar amount at scheduledsettlement date multiplied by (IDR/USDspot rate - Rp8,800) divided by IDR/USD spot rate (in full amounts) if theIDR/USD spot rate at settlement date isgreater than Rp8,800 and is at or lessthan Rp12,000 to US$1 (in fullamounts)
• certain U.S. dollar amount which isequal to U.S. dollar amount at scheduledsettlement date multiplied by (Rp12,000- Rp8,800) divided by IDR/USD spotrate (in full amounts) if the IDR/USDspot rate at settlement date is greaterthan Rp12,000 to US$1 (in fullamounts)
3.945% ofUS$25,000up toJune 12,2011 , and3.945% ofdecreasingU.S. dollaramount asarranged inthecontract upto June 12,2013
EveryJune 12 and
December 12
9,980 9,044 8,727
(6) On December 12, 2011, the Company used the option to exercise US$6,000 of the contract amount, andreceived settlement gain on the cross currency swap amounting to US$189 or equivalent to Rp1,716.
F-121

PT INDOSAT Tbk AND SUBSIDIARIES
NOTES TO CONSOLIDATED FINANCIAL STATEMENTS—(Continued)as of January 1, 2010 and December 31, 2010 and 2011
and for the years ended December 31, 2009, 2010 and 2011(Expressed in millions of rupiah and thousands of U.S. dollar, except share and tariff data)
(7) On June 28, 2011, this contract was terminated and the Company paid settlement loss on the cross currencyswap amounting to (US$194) or equivalent to (Rp1,666) on July 1, 2011.
(9) On December 12, 2011, the Company used the option to exercise US$6,000 of the contract amount, andreceived settlement gain on the cross currency swap amounting to US$189 or equivalent to Rp1,716.
No.Counter-parties
Contract Period andSwap Amount Annual Swap Premium Rate
SwapPremium
Payment Date
Amount of Swap PremiumPaid/ Amortized (Rp)
2009 2010 2011
l. GSI(8) December 16, 2008 - November 5,2010The Company will receive thefollowing:
• zero amount if the IDR/USDspot rate at termination date isless than or equal to Rp11,500 toUS$1 (in full amounts)
• certain U.S. dollar amount whichis equal to US$84,000 multipliedby (IDR/USD spot rate -Rp11,500 divided by IDR/USDspot rate) (in full amounts) if theIDR/USD spot rate attermination date is greater thanRp11,500 but is less than orequal to Rp15,000 to US$1 (infull amounts)
• certain U.S. dollar amount whichis equal to US$84,000 multipliedby (Rp3,500 divided by IDR/USD spot rate) (in full amounts)if the IDR/USD spot rate attermination date is greater thanRp15,000 to US$1 (in fullamounts)
Upfront premium ofUS$9,500 (equivalent toRp105,212) which was fullypaid on December 19, 2008.The premium is amortizedover the contract period.
— 55,899 47,323 —
Total 235,763 214,912 70,838
(8) On November 5, 2010, this contract expired and the Company received zero settlement on the crosscurrency swap.
All cross currency swap contracts with GSI (contracts No. a, b and c) are structured to include credit-linkagewith the Company as the reference entity and with the Company’s (i) bankruptcy, (ii) failure to pay on certaindebt obligations or (iii) restructuring of certain debt obligations as the relevant credit events. Upon theoccurrence of any of these credit events, the Company’s obligations and those of GSI under these swap contractswill be terminated without any further payments or settlements being made by or owed to either party, includinga payment by either party of any marked-to-market value of the swap contracts.
F-122

PT INDOSAT Tbk AND SUBSIDIARIES
NOTES TO CONSOLIDATED FINANCIAL STATEMENTS—(Continued)as of January 1, 2010 and December 31, 2010 and 2011
and for the years ended December 31, 2009, 2010 and 2011(Expressed in millions of rupiah and thousands of U.S. dollar, except share and tariff data)
Interest Rate Swap Contracts
No.Counter-parties Contract Period Annual Interest Swap Rate
Swap Income (Expense)Receipt Date
Amount of SwapExpense Paid (Rp)
2009 2010 2011
m. HSBC April 23, 2008 -November 27, 2016
5.42% of US$27,037, thenotional amount of whichwill decrease based onpredetermined schedule, inexchange for 6-month U.S.dollar LIBOR plus 1.45%per annum
Every April 1 and October 1up to October 2009, and
every May 27 and November27 up to termination date
4,320 7,589 7,034
n. HSBC April 23, 2008 -September 29, 2019
4.82% of US$44,200, thenotional amount of whichwill decrease based onpredetermined schedule, inexchange for U.S. dollarLIBOR plus 0.35% perannum
Every January 28 and July28 up to July 2009, and
every March 29 andSeptember 29 up to
termination date
7,309 16,920 13,799
0. GSI September 2, 2008 -June 12, 2013
(8.10% - underlyer return) ofUS$100,000 per annum, inexchange for 6-month U.S.dollar LIBOR plus 1.85%per annum
Every June 10 andDecember 10 up to June
2011, and every June 12 andDecember 12 up to
termination date
24,051 39,332 38,978
p DBS September 5, 2008 -June 12, 2013
5.625% of US$25,000 perannum, in exchange for 6-month U.S. dollar LIBORplus 1.85% per annum
Every June 10 andDecember 10 up to
December 2010, and everyJune 12 and December 12 up
to termination date
4,539 7,289 7,463
q. DBS October 23, 2008 - June12, 2013
5.28% of US$25,000, thenotional amount of whichwill decrease based onpredetermined schedule, inexchange for 6-month U.S.dollar LIBOR plus 1.85%per annum
Every March 25 andSeptember 25 up to March
2011, andevery June 12 and December
12 up to termination date
2,106 6,676 8,426
F-123

PT INDOSAT Tbk AND SUBSIDIARIES
NOTES TO CONSOLIDATED FINANCIAL STATEMENTS—(Continued)as of January 1, 2010 and December 31, 2010 and 2011
and for the years ended December 31, 2009, 2010 and 2011(Expressed in millions of rupiah and thousands of U.S. dollar, except share and tariff data)
Interest Rate Swap Contracts
No.Counter-parties Contract Period
Annual InterestSwap Rate
Swap Income(Expense) Receipt
Date
Amount of Swap ExpensePaid (Rp)
2009 2010 2011
r. BTMUFJ December 1, 2008 -June 12, 2013
4.46% of US$25,000,the notional amountof which willdecrease based onpredeterminedschedule, inexchange for6-month U.S. dollarLIBOR plus 1.85%per annum
Every March 25 andSeptember 25 up toMarch 2011, andevery June 12 andDecember 12 up totermination date
1,107 4,778 5,052
s. BTMUFJ December 4, 2008 -June 12, 2013
4.25% of US$25,000,the notional amountof which willdecrease based onpredeterminedschedule, inexchange for6-month U.S. dollarLIBOR plus 1.85%per annum
Every March 25 andSeptember 25 up toMarch 2011, andevery June 12 andDecember 12 up totermination date
935 4,291 5,000
t. BTMUFJ December 12, 2008 -June 12, 2013
4.09% of US$25,000,the notional amountof which willdecrease based onpredeterminedschedule, inexchange for6-month U.S. dollarLIBOR plus 1.85%per annum
Every March 25 andSeptember 25 up toMarch 2011, andevery June 12 andDecember 12 up totermination date
835 3,921 4,381
u. StandChart December 19, 2008 -June 12, 2013
3.85% of US$40,000,the notional amountof which willdecrease based onpredeterminedschedule, inexchange for6-month U.S. dollarLIBOR plus 1.85%per annum
Every March 25 andSeptember 25 up toMarch 2011, andevery June 12 andDecember 12 up totermination date
504 5,384 6,066
v. DBS December 22, 2008 -December 12, 2012
4.02% of US$26,000,the notional amountof which willdecrease based onpredeterminedschedule, inexchange for6-month U.S. dollarLIBOR plus 1.85%per annum
Every March 25 andSeptember 25 up toMarch 2011, andevery June 12 andDecember 12 up totermination date
558 3,909 5,068
F-124
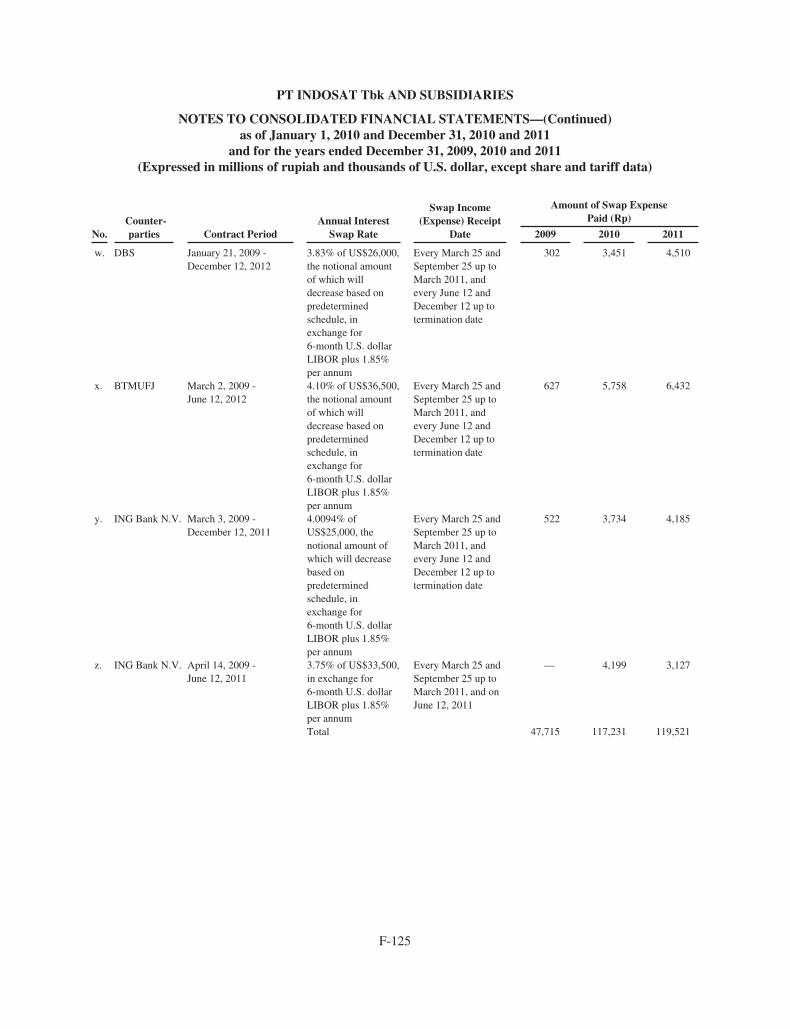
PT INDOSAT Tbk AND SUBSIDIARIES
NOTES TO CONSOLIDATED FINANCIAL STATEMENTS—(Continued)as of January 1, 2010 and December 31, 2010 and 2011
and for the years ended December 31, 2009, 2010 and 2011(Expressed in millions of rupiah and thousands of U.S. dollar, except share and tariff data)
No.Counter-parties Contract Period
Annual InterestSwap Rate
Swap Income(Expense) Receipt
Date
Amount of Swap ExpensePaid (Rp)
2009 2010 2011
w. DBS January 21, 2009 -December 12, 2012
3.83% of US$26,000,the notional amountof which willdecrease based onpredeterminedschedule, inexchange for6-month U.S. dollarLIBOR plus 1.85%per annum
Every March 25 andSeptember 25 up toMarch 2011, andevery June 12 andDecember 12 up totermination date
302 3,451 4,510
x. BTMUFJ March 2, 2009 -June 12, 2012
4.10% of US$36,500,the notional amountof which willdecrease based onpredeterminedschedule, inexchange for6-month U.S. dollarLIBOR plus 1.85%per annum
Every March 25 andSeptember 25 up toMarch 2011, andevery June 12 andDecember 12 up totermination date
627 5,758 6,432
y. ING Bank N.V. March 3, 2009 -December 12, 2011
4.0094% ofUS$25,000, thenotional amount ofwhich will decreasebased onpredeterminedschedule, inexchange for6-month U.S. dollarLIBOR plus 1.85%per annum
Every March 25 andSeptember 25 up toMarch 2011, andevery June 12 andDecember 12 up totermination date
522 3,734 4,185
z. ING Bank N.V. April 14, 2009 -June 12, 2011
3.75% of US$33,500,in exchange for6-month U.S. dollarLIBOR plus 1.85%per annum
Every March 25 andSeptember 25 up toMarch 2011, and onJune 12, 2011
— 4,199 3,127
Total 47,715 117,231 119,521
F-125

PT INDOSAT Tbk AND SUBSIDIARIES
NOTES TO CONSOLIDATED FINANCIAL STATEMENTS—(Continued)as of January 1, 2010 and December 31, 2010 and 2011
and for the years ended December 31, 2009, 2010 and 2011(Expressed in millions of rupiah and thousands of U.S. dollar, except share and tariff data)
Currency Forward Contracts
No. Counter-parties Contract Period IDR/USD Fixing Rate (in full amounts)
aa. JP Morgan(14) July 14, 2011 - December 12, 2011 Rp8,699 to US$1ab. DBS(15) July 19, 2011 - December 12, 2011 Rp8,699 to US$1ac. Deutsche Bank(16) July 19, 2011 - December 12, 2011 Rp8,714 to US$1ad. Deutsche Bank(17) July 21, 2011 - December 12, 2011 Rp8,665 to US$1ae. JP Morgan(18) July 21, 2011 - December 12, 2011 Rp8,665 to US$1af. StandChart(19) July 22, 2011 - December 12, 2011 Rp8,623 to US$1ag. JP Morgan(20) July 22, 2011 - December 12, 2011 Rp8,637 to US$1ah. Danareksa(21) July 26, 2011 - December 12, 2011 Rp8,604 to US$1ai. JP Morgan(22) July 26, 2011 - December 12, 2011 Rp8,614 to US$1aj. StandChart(23) July 26, 2011 - December 12, 2011 Rp8,614 to US$1ak. JP Morgan(24) July 29, 2011 - December 12, 2011 Rp8,568 to US$1al. HSBC(11) August 1, 2011 - November 30, 2011 Rp8,533 to US$1am. HSBC(25) August 1, 2011 - December 12, 2011 Rp8,541 to US$1an. JP Morgan(12) August 2, 2011 - November 30, 2011 Rp8,538 to US$1ao. HSBC(10) August 4, 2011 - November 28, 2011 Rp8,547 to US$1ap. HSBC(13) August 4, 2011 - November 30, 2011 Rp8,549 to US$1aq. HSBC (Note 36f) August 10, 2011 - January 24, 2012 Rp8,698 to US$1ar. JP Morgan (Note 36f) August 10, 2011 - January 24, 2012 Rp8,696 to US$1as. StandChart (Note 36f) August 10, 2011 - January 24, 2012 Rp8,696 to US$1at. JP Morgan (Note 36f) August 11, 2011 - January 24, 2012 Rp8,693 to US$1au. HSBC (Note 36p) August 11, 2011 - February 28, 2012 Rp8,714 to US$1av. HSBC (Note 36p) August 11, 2011 - February 28, 2012 Rp8,715 to US$1aw. JP Morgan August 12, 2011 - March 29, 2012 Rp8,764 to US$1ax. StandChart August 15, 2011 - May 30, 2012 Rp8,785 to US$1ay. StandChart August 15, 2011 - May 30, 2012 Rp8,787 to US$1az. StandChart August 16, 2011 - June 12, 2012 Rp8,788 to US$1ba. DBS (Note 36g) August 19, 2011 - January 27, 2012 Rp8,708 to US$1bb. ING (Note 36g) August 19, 2011 - January 27, 2012 Rp8,706 to US$1bc. DBS (Note 36g) August 19, 2011 - January 27, 2012 Rp8,705 to US$1bd. DBS August 19, 2011 - June 12, 2012 Rp8,819 to US$1be. JP Morgan August 19, 2011 - June 12, 2012 Rp8,826 to US$1bf. HSBC August 19, 2011 - June 12, 2012 Rp8,832 to US$1bg. ING (Note 36b) August 22, 2011 - January 12, 2012 Rp8,662 to US$1bh. ING (Note 36h) August 22, 2011 - January 30, 2012 Rp8,679 to US$1bi. DBS (Note 36p) August 22, 2011 - February 28, 2012 Rp8,715 to US$1bj. ING August 22, 2011 - March 28, 2012 Rp8,737 to US$1bk. ING (Note 36b) August 23, 2011 - January 12, 2012 Rp8,644 to US$1bl. ING (Note 36b) August 23, 2011 - January 12, 2012 Rp8,647 to US$1bm. GSI (Note 36b) August 23, 2011 - January 12, 2012 Rp8,640 to US$1bn. GSI (Note 36g) August 24, 2011 - January 27, 2012 Rp8,645 to US$1bo. RBS (Note 36m) August 24, 2011 - February 10, 2012 Rp8,666 to US$1bp. GSI (Note 36q) August 24, 2011 - February 29, 2012 Rp8,663 to US$1bq. GSI (Note 36q) August 24, 2011 - February 29, 2012 Rp8,675 to US$1
(10) On November 28, 2011, this contract was settled and the Company received settlement gain on the currency forward contract amountingto Rp553.
F-126

PT INDOSAT Tbk AND SUBSIDIARIES
NOTES TO CONSOLIDATED FINANCIAL STATEMENTS—(Continued)as of January 1, 2010 and December 31, 2010 and 2011
and for the years ended December 31, 2009, 2010 and 2011(Expressed in millions of rupiah and thousands of U.S. dollar, except share and tariff data)
(11) On November 30, 2011, this contract was settled and the Company received settlement gain on the currency forward contract amountingto Rp3,185.
(12) On November 30, 2011, this contract was settled and the Company received settlement gain on the currency forward contract amountingto Rp3,160.
(13) On November 30, 2011, this contract was settled and the Company received settlement gain on the currency forward contract amountingto Rp1,863.
(14) On December 12, 2011, this contract was settled and the Company received settlement gain on the currency forward contract amountingto Rp3,860.
(15) On December 12, 2011, this contract was settled and the Company received settlement gain on the currency forward contract amountingto Rp7,720.
(16) On December 12, 2011, this contract was settled and the Company received settlement gain on the currency forward contract amountingto Rp7,420.
(17) On December 12, 2011, this contract was settled and the Company received settlement gain on the currency forward contract amountingto Rp4,200.
(18) On December 12, 2011, this contract was settled and the Company received settlement gain on the currency forward contract amountingto Rp4,200.
(19) On December 12, 2011, this contract was settled and the Company received settlement gain on the currency forward contract amountingto Rp2,310.
(20) On December 12, 2011, this contract was settled and the Company received settlement gain on the currency forward contract amountingto Rp4,480.
(21) On December 12, 2011, this contract was settled and the Company received settlement gain on the currency forward contract amountingto Rp2,405.
(22) On December 12, 2011, this contract was settled and the Company received settlement gain on the currency forward contract amountingto Rp2,355.
(23) On December 12, 2011, this contract was settled and the Company received settlement gain on the currency forward contract amountingto Rp2,355.
(24) On December 12, 2011, this contract was settled and the Company received settlement gain on the currency forward contract amountingto Rp2,585.
(25) On December 12, 2011, this contract was settled and the Company received settlement gain on the currency forward contract amountingto Rp2,720.
33. SIGNIFICANT AGREEMENTS AND COMMITMENTS
a. As of December 31, 2011, commitments on capital expenditures which are contractual agreements notyet realized relate to the procurement and installation of property and equipment amounting toUS$129,861 (Note 36af) and Rp834,536.
The significant commitments on capital expenditures are as follows:
Contract Date Contract Description Vendor
Amount ofContract/Purchase
Orders (“POs”)Already Issued
Amount ofContract/
POs Not YetServed
December 10,2010
Procurement of Technology Upgradefor 2G and 3G TelecommunicationsNetwork in Kalimantan (see “f”below)
PT Nokia SiemensNetworks and NokiaSiemens Networks Oy
US$38,439 US$17,959
October 1,2010
Procurement of TelecommunicationsEquipment and Related Services
PT Ericsson Indonesiaand Ericsson AB
US$81,881 andRp241,947
US$1,567andRp6,470
June 16,2010
Procurement of TelecommunicationsInfrastructure
PT Nokia SiemensNetworks and NokiaSiemens Networks Oy
US$109,274 andRp495,269
US$1,708andRp23,510
F-127

PT INDOSAT Tbk AND SUBSIDIARIES
NOTES TO CONSOLIDATED FINANCIAL STATEMENTS—(Continued)as of January 1, 2010 and December 31, 2010 and 2011
and for the years ended December 31, 2009, 2010 and 2011(Expressed in millions of rupiah and thousands of U.S. dollar, except share and tariff data)
b. On December 30, 2011, Lintasarta, a subsidiary, entered into agreements with MOCIT-Balai Penyediadan Pengelola Pembiayaan Telekomunikasi dan Informatika (MOCIT-BPPPTI), whereby Lintasartaagreed to provide Public Access Services for Wireless Fidelity (WiFi) Internet in Kewajiban PelayananUmum/ Universal Service Obligation (KPU/USO) Regencies (Kabupaten) (Penyediaan Jasa AksesPublik Layanan Internet WiFi Kabupaten KPU/USO) for Work Packages (Paket Pekerjaan) 3 and 6that cover the provinces of West Kalimantan, South Kalimantan, Central Kalimantan, East Kalimantan,Bali, West Nusa Tenggara and East Nusa Tenggara. The agreements have contract values of Rp71,992and Rp44,422 for Work Packages 3 and 6, respectively.
Subsequently on January 10, 2012, Lintasarta also entered into agreement with MOCIT-BPPPTI for theprovision of Public Access Services for Wireless Fidelity (WiFi) Internet in KPU/USO Regencies(Kabupaten KPU/USO) (Penyediaan Jasa Akses Publik Layanan Internet WiFi Kabupaten KPU/USO)for Work Package (Paket Pekerjaan) 4 that covers the provinces of Gorontalo, West Sulawesi, SouthSulawesi, Central Sulawesi, South East Sulawesi and North Sulawesi with contract value of Rp83,174.
c. During May—December 2011, the Company had issued several POs to PT Nokia Siemens Network andNokia Siemens Network OY with total amount of US$35,724 and Rp217,550 for the procurement ofcellular technical equipment in the Sumatra and Java Areas. Based on the POs, the Company agreed toexchange certain existing cellular equipment with new equipment units and pay US$11,921 and Rp176,620to Nokia for the installation services and additional equipment. For the year ended December 31, 2011, thecarrying amount of the cellular technical equipment units given up amounted to Rp115,734 (Note 8).
d. On November 14, 2011, the Company entered into a non-binding memorandum of understanding with PTTower Bersama Infrastructure Tbk to negotiate a proposed transaction involving the sale of a portion ofthe Company’s existing tower assets and the lease of certain site spaces thereon (Notes 36c and 36k).
e. On July 28, 2011, the Company entered into an agreement with PT Quadra Solution, whereby theCompany agreed to provide data communication service to PT Quadra Solution related to Projecte-KTP (electronic Kartu Tanda Penduduk / electronic citizens identity card). The agreement covers theprovision of services until December 2012 for a total contract value of Rp283,352.
Up to December 31, 2011, the Company has recognized the operating revenue related to this agreementamounting to Rp79,615 which is classified as part of MIDI.
f. On December 10, 2010, the Company agreed with PT Nokia Siemens Networks and Nokia SiemensNetworks OY (“Nokia”) to restate and amend the agreement for “Procurement of Technology Upgradefor 2G and 3G Telecommunications Network in Kalimantan” that was originally entered into onJune 30, 2010. Based on the new agreement, the Company agreed to exchange certain existing cellulartechnical equipment units in Kalimantan area with new equipment units from Nokia with total value ofUS$75,243 consisting of cellular technical equipment with net book value of U$66,963 (net of discountamounting to US$2,029) for 1,325 units of 2G Base Transceiver Station (BTS), 24 units of BaseStation Controller (BSC), 11 units of Transcoders, 66 units of Node B equipment and 3 units of RadioNetwork Controller (RNC), and pay US$6,251 to Nokia for the installation services. As ofDecember 31, 2011, the Company has paid for the installation services. For the year endedDecember 31, 2011, the carrying amount of the cellular technical equipment units given up amountedto Rp400,956 (Note 8) and the accumulated carrying amount of such equipment up to December 31,2011 amounted to Rp559,241. The Company also committed to procure additional equipment unitsfrom Nokia with total value of US$11,708 until the end of 2012.
F-128

PT INDOSAT Tbk AND SUBSIDIARIES
NOTES TO CONSOLIDATED FINANCIAL STATEMENTS—(Continued)as of January 1, 2010 and December 31, 2010 and 2011
and for the years ended December 31, 2009, 2010 and 2011(Expressed in millions of rupiah and thousands of U.S. dollar, except share and tariff data)
g. On January 29, April 15, May 24 and June 3 in 2010, and February 4 and 10 in 2011, the Companyagreed to lease part of its telecommunications towers and sites to PT Hutchison CPTelecommunications (“Hutchison”) for a period of 12 years, PT Natrindo Telepon Selular (“NTS”) fora period of 10 years, PT XL Axiata Tbk (“XL Axiata”) for a period of 10 years, PT Berca GlobalAccess (“Berca”) for a period of 10 years, PT Dayamitra Telekomunikasi (“Mitratel”) for a period of10 years and PT First Media Tbk (“FM”) for a period of 5 years, respectively. Hutchison, NTS, and XLAxiata (on annual basis), Berca and Mitratel (on quarterly basis) and FM (on semi-annual basis) arerequired to pay the lease and maintenance fees in advance which are recorded as part of unearnedincome.
On August 18, 2011, the Company and Hutchison amended their tower leasing agreement coveringchanges in certain arrangements with respect to, among others, amount of compensation paid tolandlords or residents around the leased site shouldered by the Company, penalty charged for overduepayments and effective lease period.
Future minimum lease receivables under operating lease agreements as at December 31, 2011 and 2010and January 1, 2010 are as follows:
December 31, January 1,20102011 2010
Wtihin one year . . . . . . . . . . . . . . . . . . . . . . . . . . . . . . . . . . . . . 374,864 410,828 225,625After one year but not more than five years . . . . . . . . . . . . . . . 1,514,834 2,372,145 2,314,947More than five years . . . . . . . . . . . . . . . . . . . . . . . . . . . . . . . . . 1,822,169 2,044,071 2,512,097
Total . . . . . . . . . . . . . . . . . . . . . . . . . . . . . . . . . . . . . . . . . . . . . 3,711,867 4,827,044 5,052,669
Future minimum lease receivables under finance lease agreements as at December 31, 2011 are as follows:
Minimumpayments
Presentvalue of
payments
Within one year . . . . . . . . . . . . . . . . . . . . . . . . . . . . . . . . . . . . . . . . . . . . . . . . . . 15,218 5,043After one year but not more than five years . . . . . . . . . . . . . . . . . . . . . . . . . . . . . 60,870 28,402More than five years . . . . . . . . . . . . . . . . . . . . . . . . . . . . . . . . . . . . . . . . . . . . . . . 66,802 53,564
Total . . . . . . . . . . . . . . . . . . . . . . . . . . . . . . . . . . . . . . . . . . . . . . . . . . . . . . . . . . . 142,890 87,009Less amounts representing unearned finance income . . . . . . . . . . . . . . . . . . . . . 55,881 —
Present value of minimum lease payments . . . . . . . . . . . . . . . . . . . . . . . . . . . . . 87,009 87,009
Current portion (presented as part of Other Current Financial Assets—Net) . . . . . . . . . . . . . . 5,043Long—term portion (presented as Finance Lease Receivables) . . . . . . . . . . . . . . . . . . . . . . . . 81,966
Total . . . . . . . . . . . . . . . . . . . . . . . . . . . . . . . . . . . . . . . . . . . . . . . . . . . . . . . . . . . . . . . . . . . . . . 87,009
Unguaranteed residual values included in the carrying value of finance lease receivables amountedRp835.
F-129
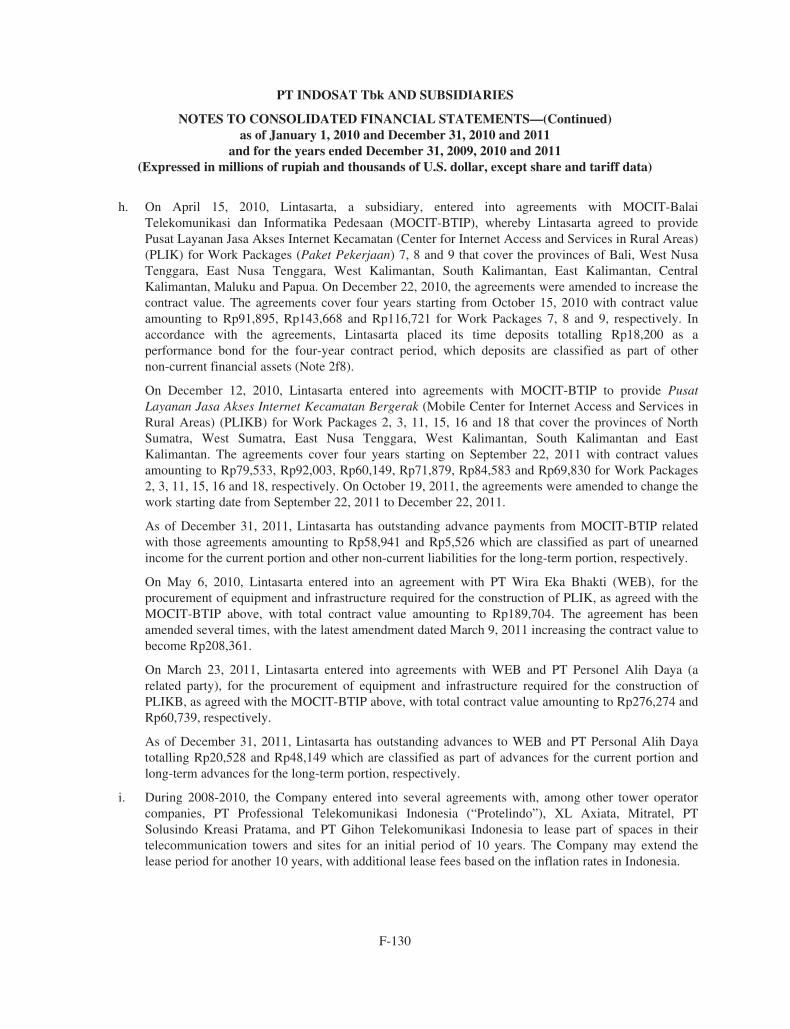
PT INDOSAT Tbk AND SUBSIDIARIES
NOTES TO CONSOLIDATED FINANCIAL STATEMENTS—(Continued)as of January 1, 2010 and December 31, 2010 and 2011
and for the years ended December 31, 2009, 2010 and 2011(Expressed in millions of rupiah and thousands of U.S. dollar, except share and tariff data)
h. On April 15, 2010, Lintasarta, a subsidiary, entered into agreements with MOCIT-BalaiTelekomunikasi dan Informatika Pedesaan (MOCIT-BTIP), whereby Lintasarta agreed to providePusat Layanan Jasa Akses Internet Kecamatan (Center for Internet Access and Services in Rural Areas)(PLIK) for Work Packages (Paket Pekerjaan) 7, 8 and 9 that cover the provinces of Bali, West NusaTenggara, East Nusa Tenggara, West Kalimantan, South Kalimantan, East Kalimantan, CentralKalimantan, Maluku and Papua. On December 22, 2010, the agreements were amended to increase thecontract value. The agreements cover four years starting from October 15, 2010 with contract valueamounting to Rp91,895, Rp143,668 and Rp116,721 for Work Packages 7, 8 and 9, respectively. Inaccordance with the agreements, Lintasarta placed its time deposits totalling Rp18,200 as aperformance bond for the four-year contract period, which deposits are classified as part of othernon-current financial assets (Note 2f8).
On December 12, 2010, Lintasarta entered into agreements with MOCIT-BTIP to provide PusatLayanan Jasa Akses Internet Kecamatan Bergerak (Mobile Center for Internet Access and Services inRural Areas) (PLIKB) for Work Packages 2, 3, 11, 15, 16 and 18 that cover the provinces of NorthSumatra, West Sumatra, East Nusa Tenggara, West Kalimantan, South Kalimantan and EastKalimantan. The agreements cover four years starting on September 22, 2011 with contract valuesamounting to Rp79,533, Rp92,003, Rp60,149, Rp71,879, Rp84,583 and Rp69,830 for Work Packages2, 3, 11, 15, 16 and 18, respectively. On October 19, 2011, the agreements were amended to change thework starting date from September 22, 2011 to December 22, 2011.
As of December 31, 2011, Lintasarta has outstanding advance payments from MOCIT-BTIP relatedwith those agreements amounting to Rp58,941 and Rp5,526 which are classified as part of unearnedincome for the current portion and other non-current liabilities for the long-term portion, respectively.
On May 6, 2010, Lintasarta entered into an agreement with PT Wira Eka Bhakti (WEB), for theprocurement of equipment and infrastructure required for the construction of PLIK, as agreed with theMOCIT-BTIP above, with total contract value amounting to Rp189,704. The agreement has beenamended several times, with the latest amendment dated March 9, 2011 increasing the contract value tobecome Rp208,361.
On March 23, 2011, Lintasarta entered into agreements with WEB and PT Personel Alih Daya (arelated party), for the procurement of equipment and infrastructure required for the construction ofPLIKB, as agreed with the MOCIT-BTIP above, with total contract value amounting to Rp276,274 andRp60,739, respectively.
As of December 31, 2011, Lintasarta has outstanding advances to WEB and PT Personal Alih Dayatotalling Rp20,528 and Rp48,149 which are classified as part of advances for the current portion andlong-term advances for the long-term portion, respectively.
i. During 2008-2010, the Company entered into several agreements with, among other tower operatorcompanies, PT Professional Telekomunikasi Indonesia (“Protelindo”), XL Axiata, Mitratel, PTSolusindo Kreasi Pratama, and PT Gihon Telekomunikasi Indonesia to lease part of spaces in theirtelecommunication towers and sites for an initial period of 10 years. The Company may extend thelease period for another 10 years, with additional lease fees based on the inflation rates in Indonesia.
F-130

PT INDOSAT Tbk AND SUBSIDIARIES
NOTES TO CONSOLIDATED FINANCIAL STATEMENTS—(Continued)as of January 1, 2010 and December 31, 2010 and 2011
and for the years ended December 31, 2009, 2010 and 2011(Expressed in millions of rupiah and thousands of U.S. dollar, except share and tariff data)
Future minimum rentals payable under operating leases agreements as of December 31, 2011 and 2010and January 1, 2010 are as follows:
December 31, January 1,20102011 2010
Within one year . . . . . . . . . . . . . . . . . . . . . . . . . . . . . . . . . . . . . . . 97,522 119,310 59,539After one year but not more than five years . . . . . . . . . . . . . . . . . 488,183 477,243 238,156More than five years . . . . . . . . . . . . . . . . . . . . . . . . . . . . . . . . . . . 193,659 452,738 195,097
Total . . . . . . . . . . . . . . . . . . . . . . . . . . . . . . . . . . . . . . . . . . . . . . . 779,364 1,049,291 492,792
Future minimum rentals payable under finance lease agreements as at December 31, 2011 is as follows:
Minimumpayments
Present valueof payments
Within one year . . . . . . . . . . . . . . . . . . . . . . . . . . . . . . . . . . . . . . . . . . . . . . . 145,496 57,129After one year but not more than five years . . . . . . . . . . . . . . . . . . . . . . . . . 581,986 323,657More than five years . . . . . . . . . . . . . . . . . . . . . . . . . . . . . . . . . . . . . . . . . . . 432,961 369,250
Total . . . . . . . . . . . . . . . . . . . . . . . . . . . . . . . . . . . . . . . . . . . . . . . . . . . . . . . 1,160,443 750,036Less amounts representing finance charge . . . . . . . . . . . . . . . . . . . . . . . . . . 410,407 —Present value of minimum lease payments . . . . . . . . . . . . . . . . . . . . . . . . . . 750,036 750,036
Current portion (presented as part of Other Current FinancialLiabilities) . . . . . . . . . . . . . . . . . . . . . . . . . . . . . . . . . . . . . . . . . . . . . . . . . 57,129
Long—term portion (presented as Obligation under Finance Lease) . . . . . 692,907
Total . . . . . . . . . . . . . . . . . . . . . . . . . . . . . . . . . . . . . . . . . . . . . . . . . . . . . . . 750,036
j. On May 25, 2007, the Company and six other telecommunications operators signed a memorandum ofunderstanding on the construction of the national optical fiber network Palapa Ring for the eastern partof Indonesia (“Palapa Ring Project Phase I”) wherein the Company will share 10% of the total projectcost of Rp3,000,000. In addition, they also agreed to equally bear the cost of preparation andimplementation (“preparation cost”) of Palapa Ring Project Phase I up to the amount of Rp2,000. If thepreparation cost exceeds Rp2,000, there will be further discussion among them. However, one of thetelecommunications operators subsequently decided not to join the project.
On November 10, 2007, the Company and the other five telecommunications operators (includingTelkom, a related party) signed the agreement on the consortium for the construction and maintenanceof Palapa Ring wherein the Company agreed to bear 13.36% of the total project cost of US$225,037.This agreement replaced the previous memorandum of understanding.
Furthermore, in 2011, three of the telecommunications operators also no longer joined the project.Consequently, as of December 31, 2011, the remaining telecommunications operators which are stillcommitted to this project are the Company, Telkom and Bakrie Telecom. Hence, the project’scommitment is being evaluated to accommodate the change in the number of participatingtelecommunications operators.
The Company had paid the amount of US$1,503, but it was returned on December 21, 2011. As ofDecember 31, 2011, the project is in the process of being dissolved (Note 36s).
F-131
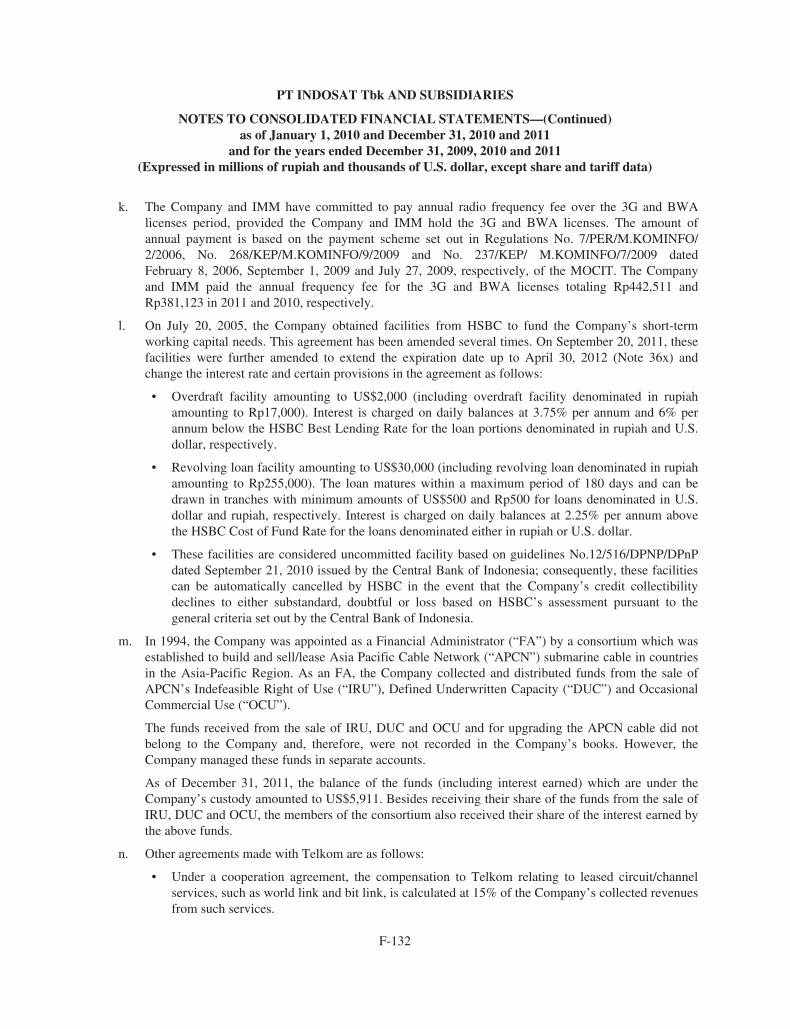
PT INDOSAT Tbk AND SUBSIDIARIES
NOTES TO CONSOLIDATED FINANCIAL STATEMENTS—(Continued)as of January 1, 2010 and December 31, 2010 and 2011
and for the years ended December 31, 2009, 2010 and 2011(Expressed in millions of rupiah and thousands of U.S. dollar, except share and tariff data)
k. The Company and IMM have committed to pay annual radio frequency fee over the 3G and BWAlicenses period, provided the Company and IMM hold the 3G and BWA licenses. The amount ofannual payment is based on the payment scheme set out in Regulations No. 7/PER/M.KOMINFO/2/2006, No. 268/KEP/M.KOMINFO/9/2009 and No. 237/KEP/ M.KOMINFO/7/2009 datedFebruary 8, 2006, September 1, 2009 and July 27, 2009, respectively, of the MOCIT. The Companyand IMM paid the annual frequency fee for the 3G and BWA licenses totaling Rp442,511 andRp381,123 in 2011 and 2010, respectively.
l. On July 20, 2005, the Company obtained facilities from HSBC to fund the Company’s short-termworking capital needs. This agreement has been amended several times. On September 20, 2011, thesefacilities were further amended to extend the expiration date up to April 30, 2012 (Note 36x) andchange the interest rate and certain provisions in the agreement as follows:
• Overdraft facility amounting to US$2,000 (including overdraft facility denominated in rupiahamounting to Rp17,000). Interest is charged on daily balances at 3.75% per annum and 6% perannum below the HSBC Best Lending Rate for the loan portions denominated in rupiah and U.S.dollar, respectively.
• Revolving loan facility amounting to US$30,000 (including revolving loan denominated in rupiahamounting to Rp255,000). The loan matures within a maximum period of 180 days and can bedrawn in tranches with minimum amounts of US$500 and Rp500 for loans denominated in U.S.dollar and rupiah, respectively. Interest is charged on daily balances at 2.25% per annum abovethe HSBC Cost of Fund Rate for the loans denominated either in rupiah or U.S. dollar.
• These facilities are considered uncommitted facility based on guidelines No.12/516/DPNP/DPnPdated September 21, 2010 issued by the Central Bank of Indonesia; consequently, these facilitiescan be automatically cancelled by HSBC in the event that the Company’s credit collectibilitydeclines to either substandard, doubtful or loss based on HSBC’s assessment pursuant to thegeneral criteria set out by the Central Bank of Indonesia.
m. In 1994, the Company was appointed as a Financial Administrator (“FA”) by a consortium which wasestablished to build and sell/lease Asia Pacific Cable Network (“APCN”) submarine cable in countriesin the Asia-Pacific Region. As an FA, the Company collected and distributed funds from the sale ofAPCN’s Indefeasible Right of Use (“IRU”), Defined Underwritten Capacity (“DUC”) and OccasionalCommercial Use (“OCU”).
The funds received from the sale of IRU, DUC and OCU and for upgrading the APCN cable did notbelong to the Company and, therefore, were not recorded in the Company’s books. However, theCompany managed these funds in separate accounts.
As of December 31, 2011, the balance of the funds (including interest earned) which are under theCompany’s custody amounted to US$5,911. Besides receiving their share of the funds from the sale ofIRU, DUC and OCU, the members of the consortium also received their share of the interest earned bythe above funds.
n. Other agreements made with Telkom are as follows:
• Under a cooperation agreement, the compensation to Telkom relating to leased circuit/channelservices, such as world link and bit link, is calculated at 15% of the Company’s collected revenuesfrom such services.
F-132

PT INDOSAT Tbk AND SUBSIDIARIES
NOTES TO CONSOLIDATED FINANCIAL STATEMENTS—(Continued)as of January 1, 2010 and December 31, 2010 and 2011
and for the years ended December 31, 2009, 2010 and 2011(Expressed in millions of rupiah and thousands of U.S. dollar, except share and tariff data)
The Company and Satelindo also lease circuits from Telkom to link Jakarta, Medan and Surabaya.
• In 1994, Satelindo entered into a land transfer agreement for the transfer of Telkom’s rights to usea 134,925-square meter land property located at Daan Mogot, West Jakarta, where Satelindo’searth control station is currently situated. The land transfer agreement enables Satelindo to use theland for a period of 30 years from the date of the agreement, for a price equivalent to US$40,000less Rp43,220. The term of the agreement may be extended based on mutual agreement.
The agreement was subsequently superseded by a land rental agreement dated December 6, 2001,generally under the same terms as those of the land transfer agreement
• In 1999, Lintasarta entered into an agreement with Telkom, whereby Telkom agreed to leasetransponder to Lintasarta. This agreement has been amended several times, the latest amendmentof which is based on the ninth amendment agreement dated May 24, 2010. Transponder leaseexpense charged to operations amounting to Rp21,317 and Rp27,547 in 2011 and 2010,respectively, is presented as part of “Operating Expenses—Cost of Services” in the consolidatedstatements of comprehensive income.
34. OPERATING SEGMENT INFORMATION
The Group manage and evaluate their operations in three major reportable segments: cellular, fixedtelecommunications and MIDI. The operating segments are managed separately because each offers differentservices/products and serves different markets. The Group operate in one geographical area only, so nogeographical information on segments is presented.
The cellular segment currently provides the network coverage in all major cities and population centersacross Indonesia by using GSM 900 and GSM 1800 technology. Its primary service is the provision of voice anddata transfer which is sold through post-paid and prepaid plans.
The fixed telecommunication segment is the provider of international long-distance services, fixed wirelessservices, DLD services and local fixed telephony services.
The MIDI segment offers products and services which include internet, high-speed point-to-pointinternational and domestic digital leased line broadband and narrowband services, a high-performance packet-switching service and satellite transponder leasing and broadcasting services.
Refer to Notes 2f5 and 23 for the description of type of products and services under each reporting segment.
No operating segments have been aggregated to form the above reportable operating segments.
Segment results and assets include items directly attributable to a segment as well as those that can beallocated on a reasonable basis. Expenditures for segment assets represent the total costs incurred during theperiod to acquire segment assets that are expected to be used for more than one year.
Management monitors the operating results of its business units separately for the purpose of makingdecisions about resource allocation and performance assessment. Segment performance is evaluated based onoperating profit or loss which in certain respects, as explained in the table below, is measured differently fromoperating profit or loss in the consolidated financial statements. The Group’s financing (including finance costsand finance income) and income taxes are managed on a group basis and are not allocated to operating segments.
F-133

PT INDOSAT Tbk AND SUBSIDIARIES
NOTES TO CONSOLIDATED FINANCIAL STATEMENTS—(Continued)as of January 1, 2010 and December 31, 2010 and 2011
and for the years ended December 31, 2009, 2010 and 2011(Expressed in millions of rupiah and thousands of U.S. dollar, except share and tariff data)
Operating segments are reported based on financial information determined in conformity with generallyaccepted accounting principles in Indonesia (“Indonesian GAAP”), which information is also consistent with theinternal reporting provided to the chief operation decision maker. The chief operation decision maker isresponsible for allocating resources and assessing performance of the operating segments, and has been identifiedas a steering committee that makes strategic decisions.
Consolidated information by industry segment follows:
Major Segments
Inter-SegmentEliminations (1) Total Adjustments (2) ConsolidatedCellular
FixedTelecommunications MIDI
January 1, 2010Operating revenuesRevenues from external
customers . . . . . . . . . . . . . . . . 14,300,163 1,803,039 2,720,984 — 18,824,186 22,720 18,846,906Inter-segment revenues . . . . . . . — — 515,961 (515,961) — — —
Total operating revenues . . . . . 14,300,163 1,803,039 3,236,945 (515,961) 18,824,186 22,720 18,846,906IncomeOperating income . . . . . . . . . . . . 2,110,666 330,401 742,591 — 3,183,658 12,510 3,196,168Gain on foreign
exchange—net . . . . . . . . . . . . — 1,656,407 — 1,656,407Interest income . . . . . . . . . . . . . . — 138,951 — 138,951Financing cost . . . . . . . . . . . . . . — (1,872,967) — (1,872,967)Total income tax expense . . . . . — (677,265) (106,684) (783,949)Loss on change in fair valueof
derivatives—net . . . . . . . . . . . — (517,655) 30,739 (486,916)Amortization of goodwill . . . . . — (235,420) 235,420 —Others—net . . . . . . . . . . . . . . . . — (120,981) 33,517 (87,464)
Profit for the year . . . . . . . . . . — 1,554,728 205,502 1,760,230
Segment assets . . . . . . . . . . . . . . 43,871,953 2,606,166 7,776,333 (4,953,666) 49,300,786 393,516 49,694,302Unallocated assets . . . . . . . . . . . 5,740,701
Assets—net . . . . . . . . . . . . . . . . 55,435,003
Segment liabilities . . . . . . . . . . . 31,678,430 1,028,375 3,748,888 (3,542,963) 32,912,730 106,890 33,019,620Unallocated liabilities . . . . . . . . 3,840,474
Liabilities—net . . . . . . . . . . . . . 36,860,094
Other disclosuresCapital expenditures . . . . . . . . . 9,661,360 579,862 1,343,327 — 11,584,549 — 11,584,549Depreciation and
amortization . . . . . . . . . . . . . . 4,585,081 335,270 641,039 — 5,561,390 10,210 5,571,600
F-134

PT INDOSAT Tbk AND SUBSIDIARIES
NOTES TO CONSOLIDATED FINANCIAL STATEMENTS—(Continued)as of January 1, 2010 and December 31, 2010 and 2011
and for the years ended December 31, 2009, 2010 and 2011(Expressed in millions of rupiah and thousands of U.S. dollar, except share and tariff data)
Major Segments
Inter-SegmentEliminations (1) Total Adjustments (2) ConsolidatedCellular
FixedTelecommunications MIDI
December 31, 2010Operating revenuesRevenues from external
customers . . . . . . . . . . . . . . . . 16,027,062 1,293,177 2,476,276 — 19,796,515 (148,137) 19,648,378Inter-segment revenues . . . . . . . — — 563,726 (563,726) — — —
Total operating revenues . . . . . 16,027,062 1,293,177 3,040,002 (563,726) 19,796,515 (148,137) 19,648,378IncomeOperating income . . . . . . . . . . . . 2,902,698 (34,495) 573,147 — 3,441,350 47,750 3,489,100Gain on foreign
exchange—net . . . . . . . . . . . . — 492,401 — 492,401Interest income . . . . . . . . . . . . . . — 143,402 — 143,402Financing cost . . . . . . . . . . . . . . — (2,271,628) — (2,271,628)Loss on change in fair value of
derivatives—net . . . . . . . . . . . — (418,092) (30,739) (448,831)Total income tax expense . . . . . — (357,798) (64,540) (422,338)Amortization of goodwill . . . . . — (226,380) 226,380 —Others—net . . . . . . . . . . . . . . . . — (79,236) — (79,236)
Profit for the year . . . . . . . . . . — 724,019 178,851 902,870
Segment assets . . . . . . . . . . . . . . 45,875,021 2,020,957 8,459,948 (7,802,547) 48,553,379 607,508 49,160,887Unallocated assets . . . . . . . . . . . 4,264,808
Assets—net . . . . . . . . . . . . . . . . 53,425,695
Segment liabilities . . . . . . . . . . . 27,195,689 630,442 3,250,615 (6,219,525) 24,857,221 142,031 24,999,252Unallocated liabilities . . . . . . . . 9,724,480
Liabilities—net . . . . . . . . . . . . . 34,723,732
Other disclosuresCapital expenditures . . . . . . . . . 4,455,608 210,770 848,611 — 5,514,989 — 5,514,989Depreciation and
amortization . . . . . . . . . . . . . . 5,052,691 297,334 801,886 — 6,151,911 10,940 6,162,851
F-135
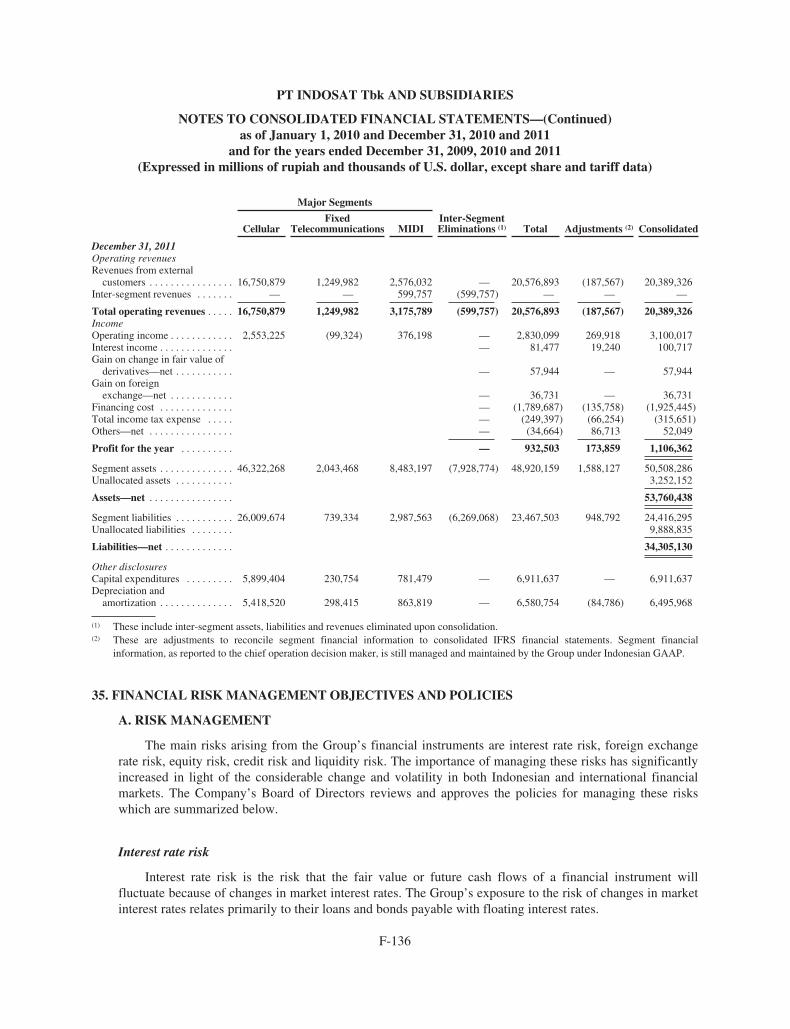
PT INDOSAT Tbk AND SUBSIDIARIES
NOTES TO CONSOLIDATED FINANCIAL STATEMENTS—(Continued)as of January 1, 2010 and December 31, 2010 and 2011
and for the years ended December 31, 2009, 2010 and 2011(Expressed in millions of rupiah and thousands of U.S. dollar, except share and tariff data)
Major Segments
Inter-SegmentEliminations (1) Total Adjustments (2) ConsolidatedCellular
FixedTelecommunications MIDI
December 31, 2011Operating revenuesRevenues from external
customers . . . . . . . . . . . . . . . . 16,750,879 1,249,982 2,576,032 — 20,576,893 (187,567) 20,389,326Inter-segment revenues . . . . . . . — — 599,757 (599,757) — — —
Total operating revenues . . . . . 16,750,879 1,249,982 3,175,789 (599,757) 20,576,893 (187,567) 20,389,326IncomeOperating income . . . . . . . . . . . . 2,553,225 (99,324) 376,198 — 2,830,099 269,918 3,100,017Interest income . . . . . . . . . . . . . . — 81,477 19,240 100,717Gain on change in fair value of
derivatives—net . . . . . . . . . . . — 57,944 — 57,944Gain on foreign
exchange—net . . . . . . . . . . . . — 36,731 — 36,731Financing cost . . . . . . . . . . . . . . — (1,789,687) (135,758) (1,925,445)Total income tax expense . . . . . — (249,397) (66,254) (315,651)Others—net . . . . . . . . . . . . . . . . — (34,664) 86,713 52,049
Profit for the year . . . . . . . . . . — 932,503 173,859 1,106,362
Segment assets . . . . . . . . . . . . . . 46,322,268 2,043,468 8,483,197 (7,928,774) 48,920,159 1,588,127 50,508,286Unallocated assets . . . . . . . . . . . 3,252,152
Assets—net . . . . . . . . . . . . . . . . 53,760,438
Segment liabilities . . . . . . . . . . . 26,009,674 739,334 2,987,563 (6,269,068) 23,467,503 948,792 24,416,295Unallocated liabilities . . . . . . . . 9,888,835
Liabilities—net . . . . . . . . . . . . . 34,305,130
Other disclosuresCapital expenditures . . . . . . . . . 5,899,404 230,754 781,479 — 6,911,637 — 6,911,637Depreciation and
amortization . . . . . . . . . . . . . . 5,418,520 298,415 863,819 — 6,580,754 (84,786) 6,495,968
(1) These include inter-segment assets, liabilities and revenues eliminated upon consolidation.(2) These are adjustments to reconcile segment financial information to consolidated IFRS financial statements. Segment financial
information, as reported to the chief operation decision maker, is still managed and maintained by the Group under Indonesian GAAP.
35. FINANCIAL RISK MANAGEMENT OBJECTIVES AND POLICIES
A. RISK MANAGEMENT
The main risks arising from the Group’s financial instruments are interest rate risk, foreign exchangerate risk, equity risk, credit risk and liquidity risk. The importance of managing these risks has significantlyincreased in light of the considerable change and volatility in both Indonesian and international financialmarkets. The Company’s Board of Directors reviews and approves the policies for managing these riskswhich are summarized below.
Interest rate risk
Interest rate risk is the risk that the fair value or future cash flows of a financial instrument willfluctuate because of changes in market interest rates. The Group’s exposure to the risk of changes in marketinterest rates relates primarily to their loans and bonds payable with floating interest rates.
F-136
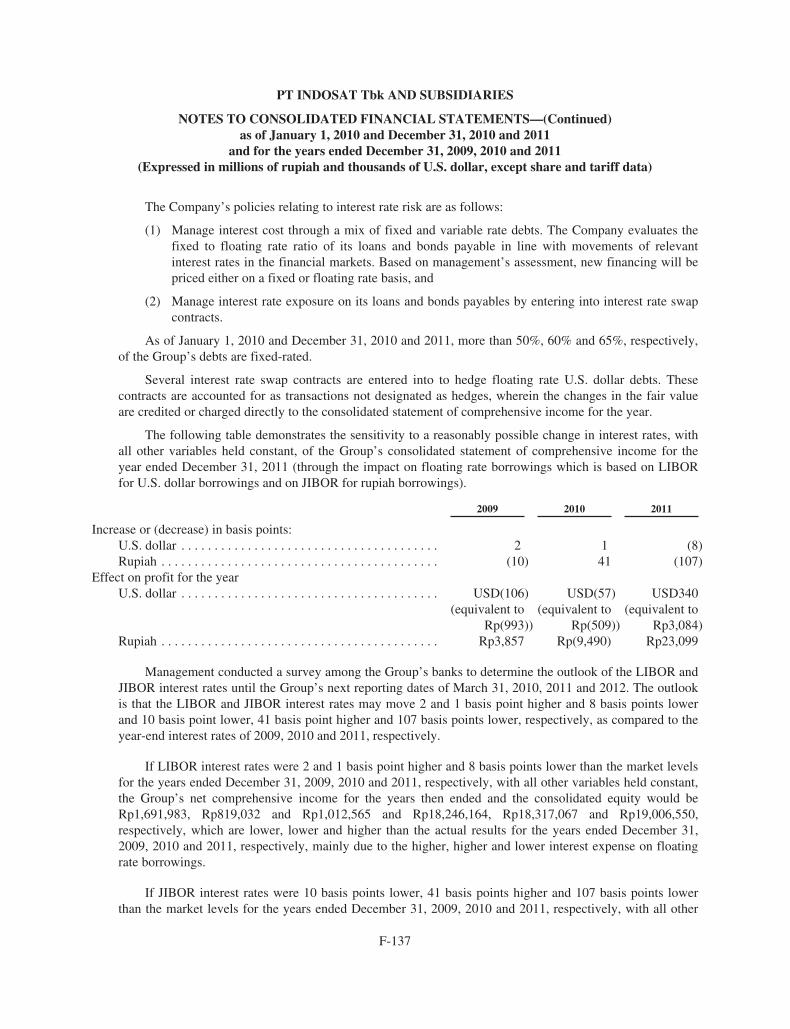
PT INDOSAT Tbk AND SUBSIDIARIES
NOTES TO CONSOLIDATED FINANCIAL STATEMENTS—(Continued)as of January 1, 2010 and December 31, 2010 and 2011
and for the years ended December 31, 2009, 2010 and 2011(Expressed in millions of rupiah and thousands of U.S. dollar, except share and tariff data)
The Company’s policies relating to interest rate risk are as follows:
(1) Manage interest cost through a mix of fixed and variable rate debts. The Company evaluates thefixed to floating rate ratio of its loans and bonds payable in line with movements of relevantinterest rates in the financial markets. Based on management’s assessment, new financing will bepriced either on a fixed or floating rate basis, and
(2) Manage interest rate exposure on its loans and bonds payables by entering into interest rate swapcontracts.
As of January 1, 2010 and December 31, 2010 and 2011, more than 50%, 60% and 65%, respectively,of the Group’s debts are fixed-rated.
Several interest rate swap contracts are entered into to hedge floating rate U.S. dollar debts. Thesecontracts are accounted for as transactions not designated as hedges, wherein the changes in the fair valueare credited or charged directly to the consolidated statement of comprehensive income for the year.
The following table demonstrates the sensitivity to a reasonably possible change in interest rates, withall other variables held constant, of the Group’s consolidated statement of comprehensive income for theyear ended December 31, 2011 (through the impact on floating rate borrowings which is based on LIBORfor U.S. dollar borrowings and on JIBOR for rupiah borrowings).
2009 2010 2011
Increase or (decrease) in basis points:U.S. dollar . . . . . . . . . . . . . . . . . . . . . . . . . . . . . . . . . . . . . . . 2 1 (8)Rupiah . . . . . . . . . . . . . . . . . . . . . . . . . . . . . . . . . . . . . . . . . . (10) 41 (107)
Effect on profit for the yearU.S. dollar . . . . . . . . . . . . . . . . . . . . . . . . . . . . . . . . . . . . . . . USD(106)
(equivalent toRp(993))
USD(57)(equivalent to
Rp(509))
USD340(equivalent to
Rp3,084)Rupiah . . . . . . . . . . . . . . . . . . . . . . . . . . . . . . . . . . . . . . . . . . Rp3,857 Rp(9,490) Rp23,099
Management conducted a survey among the Group’s banks to determine the outlook of the LIBOR andJIBOR interest rates until the Group’s next reporting dates of March 31, 2010, 2011 and 2012. The outlookis that the LIBOR and JIBOR interest rates may move 2 and 1 basis point higher and 8 basis points lowerand 10 basis point lower, 41 basis point higher and 107 basis points lower, respectively, as compared to theyear-end interest rates of 2009, 2010 and 2011, respectively.
If LIBOR interest rates were 2 and 1 basis point higher and 8 basis points lower than the market levelsfor the years ended December 31, 2009, 2010 and 2011, respectively, with all other variables held constant,the Group’s net comprehensive income for the years then ended and the consolidated equity would beRp1,691,983, Rp819,032 and Rp1,012,565 and Rp18,246,164, Rp18,317,067 and Rp19,006,550,respectively, which are lower, lower and higher than the actual results for the years ended December 31,2009, 2010 and 2011, respectively, mainly due to the higher, higher and lower interest expense on floatingrate borrowings.
If JIBOR interest rates were 10 basis points lower, 41 basis points higher and 107 basis points lowerthan the market levels for the years ended December 31, 2009, 2010 and 2011, respectively, with all other
F-137
PT INDOSAT Tbk AND SUBSIDIARIES
NOTES TO CONSOLIDATED FINANCIAL STATEMENTS—(Continued)as of January 1, 2010 and December 31, 2010 and 2011
and for the years ended December 31, 2009, 2010 and 2011(Expressed in millions of rupiah and thousands of U.S. dollar, except share and tariff data)
variables held constant, the Group’s net comprehensive income for the years then ended and theconsolidated equity would be Rp1,696,833, Rp810,051 and Rp1,032,580 and Rp18,251,014, Rp18,308,086and Rp19,026,565, respectively, which are higher, lower and higher than the actual results for the yearsended December 31, 2009, 2010 and 2011, respectively, mainly due to the lower, higher and lower interestexpense on floating rate borrowings.
Foreign exchange rate risk
Foreign exchange rate risk is the risk that the fair value or future cash flows of a financial instrumentwill fluctuate because of changes in foreign exchange rates. The Group’s exposure to exchange ratefluctuations results primarily from U.S. dollar-denominated loans and bonds payable, accounts receivable,accounts payable and procurement payable.
To manage foreign exchange rate risks, the Company entered into several cross currency swap andcurrency forward contracts and other permitted instruments, if considered necessary. These contracts areaccounted for as transactions not designated as hedges, wherein the changes in the fair value are credited orcharged directly to the consolidated statement of comprehensive income for the year.
The Group’s accounts payable are primarily foreign currency net settlement payables to foreigntelecommunications operators, while most of the Group’s accounts receivable are Indonesian rupiah-denominated collections from domestic operators.
To the extent the Indonesian rupiah depreciated further from the exchange rates in effect atDecember 31, 2008, 2009 and 2010, the Group’s obligations under such loans and bonds payable, accountspayable and procurement payable would increase in Indonesian rupiah terms. However, the increases inthese obligations would be offset in part by increases in the values of foreign currency-denominated timedeposits and accounts receivable. As of January 1, 2010 and December 31, 2010 and 2011, 43.31%, 17.90%and 27.33%, respectively, of the Company’s U.S. dollar-denominated debts were insured from exchangerate risk by entering into several cross currency swap and currency forward contracts.
F-138
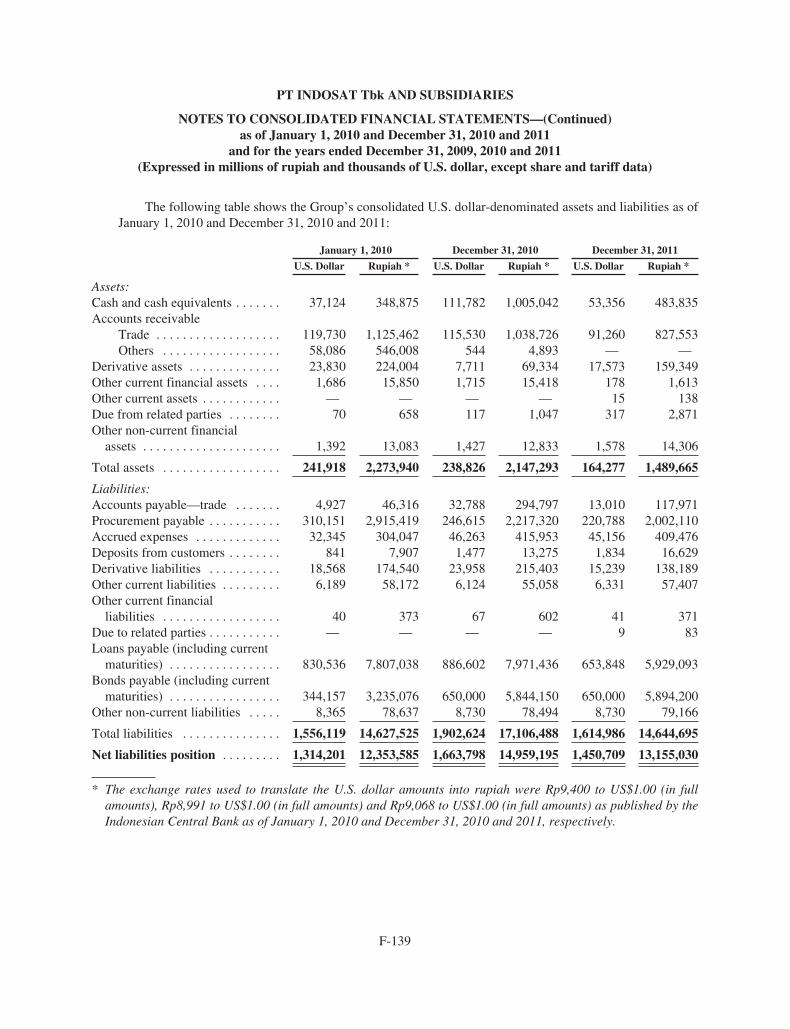
PT INDOSAT Tbk AND SUBSIDIARIES
NOTES TO CONSOLIDATED FINANCIAL STATEMENTS—(Continued)as of January 1, 2010 and December 31, 2010 and 2011
and for the years ended December 31, 2009, 2010 and 2011(Expressed in millions of rupiah and thousands of U.S. dollar, except share and tariff data)
The following table shows the Group’s consolidated U.S. dollar-denominated assets and liabilities as ofJanuary 1, 2010 and December 31, 2010 and 2011:
January 1, 2010 December 31, 2010 December 31, 2011
U.S. Dollar Rupiah * U.S. Dollar Rupiah * U.S. Dollar Rupiah *
Assets:Cash and cash equivalents . . . . . . . 37,124 348,875 111,782 1,005,042 53,356 483,835Accounts receivable
Trade . . . . . . . . . . . . . . . . . . . 119,730 1,125,462 115,530 1,038,726 91,260 827,553Others . . . . . . . . . . . . . . . . . . 58,086 546,008 544 4,893 — —
Derivative assets . . . . . . . . . . . . . . 23,830 224,004 7,711 69,334 17,573 159,349Other current financial assets . . . . 1,686 15,850 1,715 15,418 178 1,613Other current assets . . . . . . . . . . . . — — — — 15 138Due from related parties . . . . . . . . 70 658 117 1,047 317 2,871Other non-current financial
assets . . . . . . . . . . . . . . . . . . . . . 1,392 13,083 1,427 12,833 1,578 14,306
Total assets . . . . . . . . . . . . . . . . . . 241,918 2,273,940 238,826 2,147,293 164,277 1,489,665
Liabilities:Accounts payable—trade . . . . . . . 4,927 46,316 32,788 294,797 13,010 117,971Procurement payable . . . . . . . . . . . 310,151 2,915,419 246,615 2,217,320 220,788 2,002,110Accrued expenses . . . . . . . . . . . . . 32,345 304,047 46,263 415,953 45,156 409,476Deposits from customers . . . . . . . . 841 7,907 1,477 13,275 1,834 16,629Derivative liabilities . . . . . . . . . . . 18,568 174,540 23,958 215,403 15,239 138,189Other current liabilities . . . . . . . . . 6,189 58,172 6,124 55,058 6,331 57,407Other current financial
liabilities . . . . . . . . . . . . . . . . . . 40 373 67 602 41 371Due to related parties . . . . . . . . . . . — — — — 9 83Loans payable (including current
maturities) . . . . . . . . . . . . . . . . . 830,536 7,807,038 886,602 7,971,436 653,848 5,929,093Bonds payable (including current
maturities) . . . . . . . . . . . . . . . . . 344,157 3,235,076 650,000 5,844,150 650,000 5,894,200Other non-current liabilities . . . . . 8,365 78,637 8,730 78,494 8,730 79,166
Total liabilities . . . . . . . . . . . . . . . 1,556,119 14,627,525 1,902,624 17,106,488 1,614,986 14,644,695
Net liabilities position . . . . . . . . . 1,314,201 12,353,585 1,663,798 14,959,195 1,450,709 13,155,030
* The exchange rates used to translate the U.S. dollar amounts into rupiah were Rp9,400 to US$1.00 (in fullamounts), Rp8,991 to US$1.00 (in full amounts) and Rp9,068 to US$1.00 (in full amounts) as published by theIndonesian Central Bank as of January 1, 2010 and December 31, 2010 and 2011, respectively.
F-139

PT INDOSAT Tbk AND SUBSIDIARIES
NOTES TO CONSOLIDATED FINANCIAL STATEMENTS—(Continued)as of January 1, 2010 and December 31, 2010 and 2011
and for the years ended December 31, 2009, 2010 and 2011(Expressed in millions of rupiah and thousands of U.S. dollar, except share and tariff data)
The following table demonstrates the sensitivity to a reasonably possible change in the U.S. dollarexchange rates, with all other variables held constant, of the Group’s consolidated statements ofcomprehensive income for the years ended December 31, 2009, 2010 and 2011:
2009 2010 2011
Change in U.S. dollar exchange rate . . . . . . . . . . . . . . . . . . . . . . . . . . . . . . . . -3% -3% 1.24%Effect on consolidated profit for the year . . . . . . . . . . . . . . . . . . . . . . . . . . . . 266,837 336,582 (122,342)
Management conducted a survey among the Group’s banks to determine the outlook of the U.S. dollarexchange rate until the Group’s next reporting dates of March 31, 2010, 2011 and 2012. The outlook is thatthe U.S. dollar exchange rate may weaken by 3% as compared to the exchange rate at December 31, 2009and 2010 and strenghten by 1.24% as compared to the exchange rate at December 31, 2011, respectively.
If the U.S. dollar exchange rate weakened by 3% as compared to the exchange rate as of December 31,2009 and 2010 and strenghtened by 1.24% compared to the exchange rate as of December 31, 2011, with allother variables held constant, the Group’s net comprehensive income for the years then ended and theconsolidated equity would be Rp1,959,813, Rp1,156,123 and Rp887,139; and Rp18,513,994, Rp18,654,158and Rp18,881,124, respectively, which are higher, higher and lower than the actual results as ofDecember 31, 2009, 2010 and 2011, respectively, mainly due to the consolidated foreign exchange gain andloss on the translation of U.S. dollar-denominated net liabilities.
Equity price risk
The Group’s long-term investments consist primarily of minority investment in the equity of privateIndonesian Group and equity of foreign Group. With respect to the Indonesian Group in which the Grouphas investments, the financial performance of such Group may be adversely affected by the economicconditions in Indonesia.
Credit risk
Credit risk is the risk that the Group will incur a loss arising from their customers, clients orcounterparties that fail to discharge their contractual obligations. There are no significant concentrations ofcredit risk. The Group manage and control this credit risk by setting limits on the amount of risk they arewilling to accept for individual or collective customers and by monitoring exposures in relation to suchlimits.
The Group trades only with recognized and creditworthy third parties. It is the Group’s policy that allcustomers who wish to trade on credit terms are subject to credit verification procedures. In addition,receivable balances are monitored on an ongoing basis to reduce the exposure to bad debts.
F-140

PT INDOSAT Tbk AND SUBSIDIARIES
NOTES TO CONSOLIDATED FINANCIAL STATEMENTS—(Continued)as of January 1, 2010 and December 31, 2010 and 2011
and for the years ended December 31, 2009, 2010 and 2011(Expressed in millions of rupiah and thousands of U.S. dollar, except share and tariff data)
The table below shows the maximum exposure to credit risk for the components of the consolidatedstatements of financial position as of December 31, 2011:
Maximum Exposure (1)
January 1,2010
December 31,2010
December 31,2011
Loans and receivables:Cash and cash equivalents . . . . . . . . . . . . . . . . . . . . . . . . . . . . . . . . . 2,835,999 2,075,270 2,224,206Accounts receivable
Trade—net . . . . . . . . . . . . . . . . . . . . . . . . . . . . . . . . . . . . . . . . . 1,385,125 1,548,426 1,441,069Others—net . . . . . . . . . . . . . . . . . . . . . . . . . . . . . . . . . . . . . . . . 564,859 10,031 5,660
Other current financial assets—net . . . . . . . . . . . . . . . . . . . . . . . . . . 35,173 53,119 29,833Due from related parties—net . . . . . . . . . . . . . . . . . . . . . . . . . . . . . . 7,215 8,421 10,654Finance lease receivable . . . . . . . . . . . . . . . . . . . . . . . . . . . . . . . . . . — — 81,966Other non-current financial assets—others . . . . . . . . . . . . . . . . . . . . 100,004 77,675 87,686
Held-for-trading:Cross currency swaps . . . . . . . . . . . . . . . . . . . . . . . . . . . . . . . . . . . . . 224,004 69,334 22,138Currency forward . . . . . . . . . . . . . . . . . . . . . . . . . . . . . . . . . . . . . . . . — — 137,211
Available-for-sale investments:Other non-current financial assets -other long-term investments—
net . . . . . . . . . . . . . . . . . . . . . . . . . . . . . . . . . . . . . . . . . . . . . . . . . . 2,730 2,730 2,730
Total . . . . . . . . . . . . . . . . . . . . . . . . . . . . . . . . . . . . . . . . . . . . . . . . . . . . . 5,155,109 3,845,006 4,043,153
(1) There are no collaterals held or other credit enhancements or offsetting arrangements that affect this maximumexposure.
Liquidity risk
The liquidity risk is defined as a risk when the cash flow position of the Group indicates that the short-term revenue is not enough to cover the short-term expenditure.
The Group’s liquidity requirements have historically arisen from the need to finance investments andcapital expenditures related to the expansion of their telecommunications business. The Group’stelecommunications business requires substantial capital to construct and expand mobile and data networkinfrastructure and to fund operations, particularly during the network development stage. Although theGroup have substantial existing network infrastructure, the Group expect to incur additional capitalexpenditures primarily in order to focus cellular network development in areas they anticipate will be high-growth areas, as well as to enhance the quality and coverage of their existing network.
In the management of liquidity risk, the Group monitor and maintain a level of cash and cashequivalents deemed adequate to finance the Group’s operations and to mitigate the effects of fluctuation incash flows. The Group also regularly evaluate the projected and actual cash flows, including their loanmaturity profiles, and continuously assess conditions in the financial markets for opportunities to pursuefund-raising initiatives. These activities may include bank loans, debt capital and equity market issues.
F-141
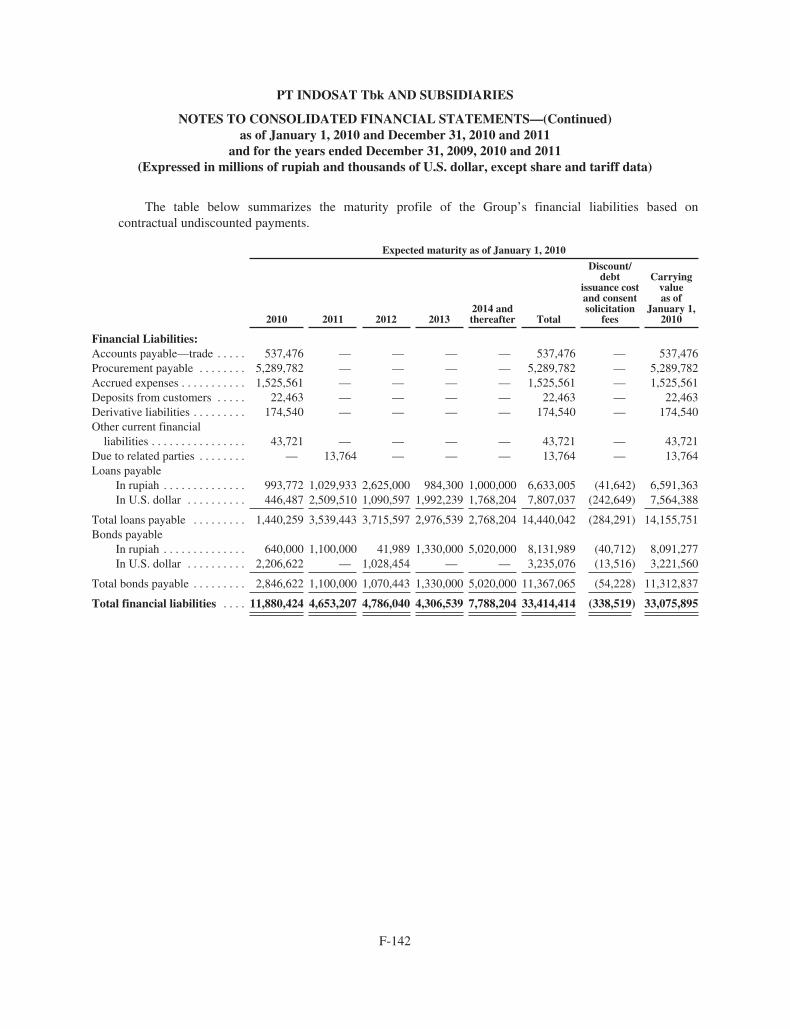
PT INDOSAT Tbk AND SUBSIDIARIES
NOTES TO CONSOLIDATED FINANCIAL STATEMENTS—(Continued)as of January 1, 2010 and December 31, 2010 and 2011
and for the years ended December 31, 2009, 2010 and 2011(Expressed in millions of rupiah and thousands of U.S. dollar, except share and tariff data)
The table below summarizes the maturity profile of the Group’s financial liabilities based oncontractual undiscounted payments.
Expected maturity as of January 1, 2010
2010 2011 2012 20132014 andthereafter Total
Discount/debt
issuance costand consentsolicitation
fees
Carryingvalueas of
January 1,2010
Financial Liabilities:Accounts payable—trade . . . . . 537,476 — — — — 537,476 — 537,476Procurement payable . . . . . . . . 5,289,782 — — — — 5,289,782 — 5,289,782Accrued expenses . . . . . . . . . . . 1,525,561 — — — — 1,525,561 — 1,525,561Deposits from customers . . . . . 22,463 — — — — 22,463 — 22,463Derivative liabilities . . . . . . . . . 174,540 — — — — 174,540 — 174,540Other current financial
liabilities . . . . . . . . . . . . . . . . 43,721 — — — — 43,721 — 43,721Due to related parties . . . . . . . . — 13,764 — — — 13,764 — 13,764Loans payable
In rupiah . . . . . . . . . . . . . . 993,772 1,029,933 2,625,000 984,300 1,000,000 6,633,005 (41,642) 6,591,363In U.S. dollar . . . . . . . . . . 446,487 2,509,510 1,090,597 1,992,239 1,768,204 7,807,037 (242,649) 7,564,388
Total loans payable . . . . . . . . . 1,440,259 3,539,443 3,715,597 2,976,539 2,768,204 14,440,042 (284,291) 14,155,751Bonds payable
In rupiah . . . . . . . . . . . . . . 640,000 1,100,000 41,989 1,330,000 5,020,000 8,131,989 (40,712) 8,091,277In U.S. dollar . . . . . . . . . . 2,206,622 — 1,028,454 — — 3,235,076 (13,516) 3,221,560
Total bonds payable . . . . . . . . . 2,846,622 1,100,000 1,070,443 1,330,000 5,020,000 11,367,065 (54,228) 11,312,837
Total financial liabilities . . . . 11,880,424 4,653,207 4,786,040 4,306,539 7,788,204 33,414,414 (338,519) 33,075,895
F-142
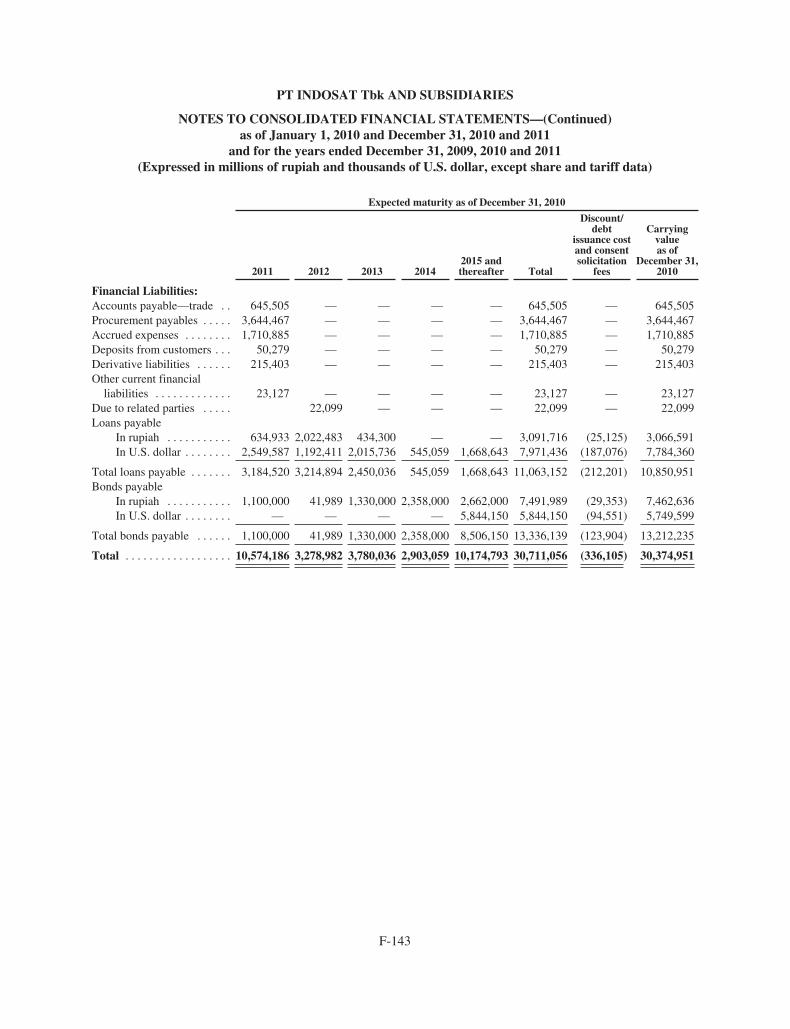
PT INDOSAT Tbk AND SUBSIDIARIES
NOTES TO CONSOLIDATED FINANCIAL STATEMENTS—(Continued)as of January 1, 2010 and December 31, 2010 and 2011
and for the years ended December 31, 2009, 2010 and 2011(Expressed in millions of rupiah and thousands of U.S. dollar, except share and tariff data)
Expected maturity as of December 31, 2010
2011 2012 2013 20142015 andthereafter Total
Discount/debt
issuance costand consentsolicitation
fees
Carryingvalueas of
December 31,2010
Financial Liabilities:Accounts payable—trade . . 645,505 — — — — 645,505 — 645,505Procurement payables . . . . . 3,644,467 — — — — 3,644,467 — 3,644,467Accrued expenses . . . . . . . . 1,710,885 — — — — 1,710,885 — 1,710,885Deposits from customers . . . 50,279 — — — — 50,279 — 50,279Derivative liabilities . . . . . . 215,403 — — — — 215,403 — 215,403Other current financial
liabilities . . . . . . . . . . . . . 23,127 — — — — 23,127 — 23,127Due to related parties . . . . . 22,099 — — — 22,099 — 22,099Loans payable
In rupiah . . . . . . . . . . . 634,933 2,022,483 434,300 — — 3,091,716 (25,125) 3,066,591In U.S. dollar . . . . . . . . 2,549,587 1,192,411 2,015,736 545,059 1,668,643 7,971,436 (187,076) 7,784,360
Total loans payable . . . . . . . 3,184,520 3,214,894 2,450,036 545,059 1,668,643 11,063,152 (212,201) 10,850,951Bonds payable
In rupiah . . . . . . . . . . . 1,100,000 41,989 1,330,000 2,358,000 2,662,000 7,491,989 (29,353) 7,462,636In U.S. dollar . . . . . . . . — — — — 5,844,150 5,844,150 (94,551) 5,749,599
Total bonds payable . . . . . . 1,100,000 41,989 1,330,000 2,358,000 8,506,150 13,336,139 (123,904) 13,212,235
Total . . . . . . . . . . . . . . . . . . 10,574,186 3,278,982 3,780,036 2,903,059 10,174,793 30,711,056 (336,105) 30,374,951
F-143

PT INDOSAT Tbk AND SUBSIDIARIES
NOTES TO CONSOLIDATED FINANCIAL STATEMENTS—(Continued)as of January 1, 2010 and December 31, 2010 and 2011
and for the years ended December 31, 2009, 2010 and 2011(Expressed in millions of rupiah and thousands of U.S. dollar, except share and tariff data)
Expected maturity as of December 31, 2011
2012 2013 2014 20152016 andthereafter Total
Discount/debt
issuance costand consentsolicitation
fees
Carryingvalueas of
December 31,2011
Short-term loan . . . . . . . . . 1,500,000 — — — — 1,500,000 (744) 1,499,256Accounts
payable—trade . . . . . . . . 319,058 — — — — 319,058 — 319,058Procurement payables . . . . 3,429,921 — — — — 3,429,921 — 3,429,921Accrued expenses . . . . . . . 1,891,477 — — — — 1,891,477 — 1,891,477Deposits from
customers . . . . . . . . . . . . 37,265 — — — — 37,265 — 37,265Derivative liabilities . . . . . 138,189 — — — — 138,189 — 138,189Other current financial
liabilities . . . . . . . . . . . . 73,201 — — — — 73,201 — 73,201Due to related parties . . . . . — 15,480 — — — 15,480 — 15,480Obligation under financial
liabilities . . . . . . . . . . . . — 65,326 74,739 85,562 467,280 692,907 — 692,907Loans payable
In rupiah . . . . . . . . . . . 2,022,483 434,300 1,500,000 — — 3,956,783 (14,922) 3,941,861In U.S. dollar . . . . . . . 1,280,349 2,105,180 627,453 627,453 1,288,657 5,929,092 (144,637) 5,784,455
Total loans payable . . . . . . 3,302,832 2,539,480 2,127,453 627,453 1,288,657 9,885,875 (159,559) 9,726,316Bonds payable
In rupiah . . . . . . . . . . . 41,989 1,330,000 2,358,000 320,000 2,342,000 6,391,989 (21,219) 6,370,770In U.S. dollar . . . . . . . — — — — 5,894,200 5,894,200 (84,628) 5,809,572
Total bonds payable . . . . . . 41,989 1,330,000 2,358,000 320,000 8,236,200 12,286,189 (105,847) 12,180,342
Total . . . . . . . . . . . . . . . . . 10,733,932 3,950,286 4,560,192 1,033,015 9,992,137 30,269,562 (266,150) 30,003,412
B. CAPITAL MANAGEMENT
The Group aim to achieve an optimal capital structure in pursuit of their business objectives, whichinclude maintaining healthy capital ratios and strong credit ratings, and maximizing stockholder value.
Some of the Group’s debt instruments contain covenants that impose maximum leverage ratios. Inaddition, the Company’s credit ratings from the international credit ratings agencies are based on its abilityto remain within certain leverage ratios. The Group have complied with all externally imposed capitalrequirements.
Management monitors capital using several financial leverage measurements such as debt-to-equityratio. The Company’s objective is to maintain its debt-to-equity ratio at a maximum of 2.50 each as ofJanuary 1, 2010 and December 31, 2010 and 2011.
The Companies continue to manage their debt covenants and capital structure based on financialinformation determined under Indonesian GAAP.
F-144
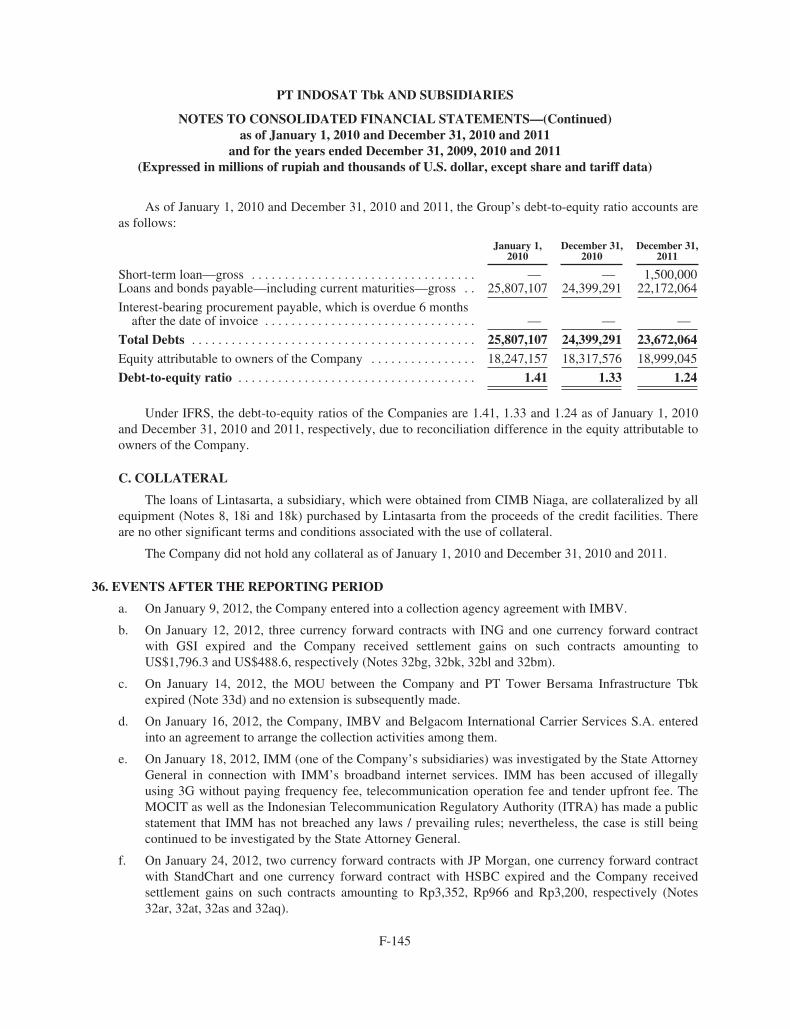
PT INDOSAT Tbk AND SUBSIDIARIES
NOTES TO CONSOLIDATED FINANCIAL STATEMENTS—(Continued)as of January 1, 2010 and December 31, 2010 and 2011
and for the years ended December 31, 2009, 2010 and 2011(Expressed in millions of rupiah and thousands of U.S. dollar, except share and tariff data)
As of January 1, 2010 and December 31, 2010 and 2011, the Group’s debt-to-equity ratio accounts areas follows:
January 1,2010
December 31,2010
December 31,2011
Short-term loan—gross . . . . . . . . . . . . . . . . . . . . . . . . . . . . . . . . . . — — 1,500,000Loans and bonds payable—including current maturities—gross . . 25,807,107 24,399,291 22,172,064
Interest-bearing procurement payable, which is overdue 6 monthsafter the date of invoice . . . . . . . . . . . . . . . . . . . . . . . . . . . . . . . . — — —
Total Debts . . . . . . . . . . . . . . . . . . . . . . . . . . . . . . . . . . . . . . . . . . . 25,807,107 24,399,291 23,672,064Equity attributable to owners of the Company . . . . . . . . . . . . . . . . 18,247,157 18,317,576 18,999,045
Debt-to-equity ratio . . . . . . . . . . . . . . . . . . . . . . . . . . . . . . . . . . . . 1.41 1.33 1.24
Under IFRS, the debt-to-equity ratios of the Companies are 1.41, 1.33 and 1.24 as of January 1, 2010and December 31, 2010 and 2011, respectively, due to reconciliation difference in the equity attributable toowners of the Company.
C. COLLATERAL
The loans of Lintasarta, a subsidiary, which were obtained from CIMB Niaga, are collateralized by allequipment (Notes 8, 18i and 18k) purchased by Lintasarta from the proceeds of the credit facilities. Thereare no other significant terms and conditions associated with the use of collateral.
The Company did not hold any collateral as of January 1, 2010 and December 31, 2010 and 2011.
36. EVENTS AFTER THE REPORTING PERIOD
a. On January 9, 2012, the Company entered into a collection agency agreement with IMBV.
b. On January 12, 2012, three currency forward contracts with ING and one currency forward contractwith GSI expired and the Company received settlement gains on such contracts amounting toUS$1,796.3 and US$488.6, respectively (Notes 32bg, 32bk, 32bl and 32bm).
c. On January 14, 2012, the MOU between the Company and PT Tower Bersama Infrastructure Tbkexpired (Note 33d) and no extension is subsequently made.
d. On January 16, 2012, the Company, IMBV and Belgacom International Carrier Services S.A. enteredinto an agreement to arrange the collection activities among them.
e. On January 18, 2012, IMM (one of the Company’s subsidiaries) was investigated by the State AttorneyGeneral in connection with IMM’s broadband internet services. IMM has been accused of illegallyusing 3G without paying frequency fee, telecommunication operation fee and tender upfront fee. TheMOCIT as well as the Indonesian Telecommunication Regulatory Authority (ITRA) has made a publicstatement that IMM has not breached any laws / prevailing rules; nevertheless, the case is still beingcontinued to be investigated by the State Attorney General.
f. On January 24, 2012, two currency forward contracts with JP Morgan, one currency forward contractwith StandChart and one currency forward contract with HSBC expired and the Company receivedsettlement gains on such contracts amounting to Rp3,352, Rp966 and Rp3,200, respectively (Notes32ar, 32at, 32as and 32aq).
F-145

PT INDOSAT Tbk AND SUBSIDIARIES
NOTES TO CONSOLIDATED FINANCIAL STATEMENTS—(Continued)as of January 1, 2010 and December 31, 2010 and 2011
and for the years ended December 31, 2009, 2010 and 2011(Expressed in millions of rupiah and thousands of U.S. dollar, except share and tariff data)
g. On January 27, 2012, one currency forward contract with ING, two currency forward contracts withDBS and one currency forward contract with GSI expired and the Company received settlement gainson such contracts amounting to US$249, US$603 and US$550, respectively (Notes 32bb, 32ba, 32bcand 32bn).
h. On January 30, 2012, one currency forward contract with ING expired and the Company receivedsettlement gain on such contract amounting to US$451 (Note 32bh).
i. On January 31, 2012, Lintasarta made early repayment of the Limited Bonds I amounting to Rp16,989(Note 19j).
j. On February 2 and 17, 2012, the Company repaid partially the Revolving Time Loan Facilities fromMandiri (Note 14) and BCA (Note 18d) each amounting to Rp200,000.
k. On February 7, 2012, the Company entered into an Asset Purchase Agreement with PT Tower BersamaInfrastructure Tbk and its subsidiary, PT Solusi Menara Bersama (collectively referred to as “TowerBersama”), whereby the Company agreed to sell 2,500 of its telecommunication towers to TowerBersama for a total consideration of US$518,500, consisting of US$406,000 paid upfront and amaximum potential deferred payment of US$112,500. The upfront payment includes PT TowerBersama Infrastructure Tbk’s shares of not less than 5% of the increase in its capital stock (upon theRights Issue of PT Tower Bersama Infrastructure Tbk). Based on the agreement, the Company alsoagreed to lease back the spaces in the 2,500 telecommunication towers (Note 33d).
l. On February 8, 9 and 10, 2012, the Company received affirmation on the rating of the Company’sGuaranteed Notes Due 2020 (Note 19a) from Moody’s, Fitch and S&P’s at Ba1 (stable outlook), BBB-(positive outlook) and BB (watch positive outlook), respectively.
m. On February 10, 2012, one currency forward contract with RBS expired and the Company receivedsettlement gain on such contract amounting to US$433.77 (Note 32bo).
n. On February 24, 2012, Lintasarta paid the loan installment of CIMB Niaga 6 (Note 18i) amounting toRp7,500.
o. On February 28, 2012, the Company paid the fourth installment of SEK credit facility B (Note 18b)amounting to US$11,071.43.
p. On February 28, 2012, two currency forward contracts with HSBC and one currency forward contractwith DBS expired and the Company received settlement gains on such contracts amounting to Rp5,001and US$522.58, respectively (Notes 32au, 32av and 32bi).
q. On February 29, 2012, two currency forward contracts with GSI expired and the Company receivedsettlement gain on such contracts totalling US$1,333.17 (Notes 32bp and 32bq).
r. On February 29, 2012, Lintasarta made early repayment of the Limited Bonds II amounting toRp25,000 (Note 19i).
s. On March 8, 2012, the Company and other telecommunication operators who joined the Palapa RingProject Phase I officially terminated their cooperation agreement. Consequently, the Company nolonger has any commitment on such project (Note 33j).
t. On March 13, 2012, the Company received a Tax Court’s Decision Letter approving the InterestCompensation to the Company totalling Rp60,674 on the overpayment of 2004 Corporate Income Tax.
F-146

PT INDOSAT Tbk AND SUBSIDIARIES
NOTES TO CONSOLIDATED FINANCIAL STATEMENTS—(Continued)as of January 1, 2010 and December 31, 2010 and 2011
and for the years ended December 31, 2009, 2010 and 2011(Expressed in millions of rupiah and thousands of U.S. dollar, except share and tariff data)
u. On March 16, 2012, the Company partially repaid the Revolving Time Loan Facility from BCAamounting to Rp200,000 which was drawn down on December 2, 2011 (Note 18d).
v. On March 16, 2012, in ISPL’s Annual Stockholders’ Meeting, it was resolved that the Company wouldreceive the 2011 dividend from ISPL amounting to US$3,250 with the payment schdedule of 68.09 %by July 2012 and the remaining 31.91 % by December 2012.
w. On March 21, 2012, the Company received Pefindo’s affirmation on the rating of the Company’s localbond and sukuk at idAA+ (stable outlook) and idAA+(sy) (stable outlook), respectively (Note 19).
x. On March 27, 2012, the Company received a letter from HSBC extending the availability period of thefacility to fund the Company’s short-term working capital up to April 30, 2013 (Note 33l).
y. On March 28, 2012, the Company drew down Rp200,000 from its Revolving Time Loan with Mandiri(Note 14).
z. On March 29, 2012, the Company paid the fifth semi-annual installment on its COFACE loan fromHSBC France amounting to US$7,859.34.
aa. On March 29, 2012, the Company paid the fifth semi-annual installment of its SINOSURE loan fromHSBC France amounting to US$2,210.
ab. On March 30, 2012, the Company drew down Rp200,000 from its Revolving Time Loan with BCA(Note 18d).
ac. On April 3, 2012, the Company entered into an agreement of “Perjanjian Pendahuluan PencatatanEfek” with the Indonesian Stock Exchange with regard to the Company’s plan to issue Rp2,000,000conventional bonds and Rp500,000 sukuk.
ad. On April 13, 2012, the Company entered into a trustee ship agreement with BRI, an agreement of“Perjanjian Penjaminan Emisi Obligasi dan Sukuk” with the Appointed Underwriters, an agreement of“Perjanjian Agen Pembayaran” and “Perjanjian Pendaftaran Obligasi dan Sukuk” with the IndonesianCentral Securities Depository (KSEI) in relation to its plan to issue Rp2,000,000 conventional bondsand Rp500,000 sukuk.
ae. On April 16, 2012, the Company made the first registration to BAPEPAM in connection with theCompany’s plan to issue Rp2,000,000 conventional bonds and Rp500,000 sukuk.
af. As of April 25, 2012, the prevailing exchange rate of the rupiah to U.S. dollar is Rp9,194 to US$1 (in fullamounts), while as of December 31, 2011, the prevailing exchange rate was Rp9,068 to US$1 (in fullamounts). Using the exchange rate as of April 25, 2012, the Group suffered from foreign exchange lossamounting to approximately Rp182,789 (excluding the effect of revaluing derivative contracts on April 25,2012) on the foreign currency liabilities, net of foreign currency assets, as of December 31, 2011 (Note 35).
The translation of the foreign currency liabilities, net of foreign currency assets, should not beconstrued as a representation that these foreign currency liabilities and assets have been, could havebeen, or could in the future be, converted into rupiah at the prevailing exchange rate of the rupiah toU.S. dollar as of December 31, 2011 or at any other rate of exchange.
The commitments for the capital expenditures denominated in foreign currencies as of December 31,2011 as disclosed in Note 33a are approximately Rp1,193,942 if translated at the prevailing exchangerate as of April 25, 2012.
F-147

[THIS PAGE INTENTIONALLY LEFT BLANK]