Embed Size (px)
Citation preview
Annual Report on the Performance of
Commissioner’s Network Schools
April 2018
Connecticut State Department of Education
Annual Report on the Performance of Commissioner’s Network Schools Page 2 of 12
TABLE OF CONTENTS
INTRODUCTION............................................................................................................. 3
METHODOLOGY AND DATA ..................................................................................... 3
RESULTS .......................................................................................................................... 4
Overall Performance: The Accountability Index ............................................................. 4
Academic Achievement: The Performance Index ............................................................ 5
Academic Growth ............................................................................................................. 6
Chronic Absenteeism ........................................................................................................ 8
Suspension Rate ................................................................................................................ 8
High School Graduation Rate ........................................................................................... 9
Performance Evaluation Ratings .................................................................................... 10
SUMMARY ..................................................................................................................... 11
APPENDIX ...................................................................................................................... 12
Annual Report on the Performance of Commissioner’s Network Schools Page 3 of 12
INTRODUCTION The Commissioner’s Network is a commitment between local stakeholders and the Connecticut
State Department of Education (CSDE) to improve student achievement in up to 25 schools. It
offers new resources and authorities to empower teachers and school leaders to implement
research-based strategies. Schools are selected by the Commissioner of Education to participate
in the network for a period of three to five years. Network schools remain part of their local
school districts, but the districts and the CSDE secure school-level flexibility and autonomy for
the schools in exchange for heightened accountability. The network began in the fall of 2012. At
present, there are 15 schools participating in the network.
Subsections (j)(1) and j(2) of Connecticut General Statutes Section 10-223h require the CSDE to
submit an annual report on the academic performance of schools in the network to the
Connecticut General Assembly. This report fulfills that requirement. It presents the performance
of each network school and compares/analyzes the performance for all network schools.
METHODOLOGY AND DATA The primary data source for this report are the results from Connecticut’s Next Generation
Accountability System. This system is a broad set of 12 indicators that help tell the story of how
well a school is preparing its students for success in college, careers and life. A brief overview of
the system is contained in an FAQ in the appendix. The system began implementation in 2014-
15. For purposes of comparing and analyzing the academic performance of the network schools,
this report will focus on the following indicators from the accountability system:
Accountability Index
Performance Index
Academic Growth
Chronic absenteeism
Graduation Rate
In addition to these accountability indicators, the report will also analyze student suspension
rates because they are an important measure of school climate and student engagement.
For each school, the appendix includes the accountability reports for 2015-16 and 2016-17, as
well as a one-page “fast facts” report that provides trend charts on some of these indicators. For
many of these indicators, disaggregated data by race/ethnicity, gender, socioeconomic status,
Annual Report on the Performance of Commissioner’s Network Schools Page 4 of 12
special education status, and English learner status are available on the CSDE’s interactive data
portal, EdSight, at http://edsight.ct.gov. Also included in the appendix are the aggregate
performance evaluation results for educators.
RESULTS
Overall Performance: The Accountability Index The accountability index is the total percentage of possible points earned by the school on all
applicable indicators in the system. Each indicator is allotted a maximum possible points. Based
on the results achieved on an indicator, the school earns points on a sliding scale toward that
indicator. The total points earned divided by the total possible points that could have been earned
on all applicable indicators is the accountability index. The maximum possible points allotted for
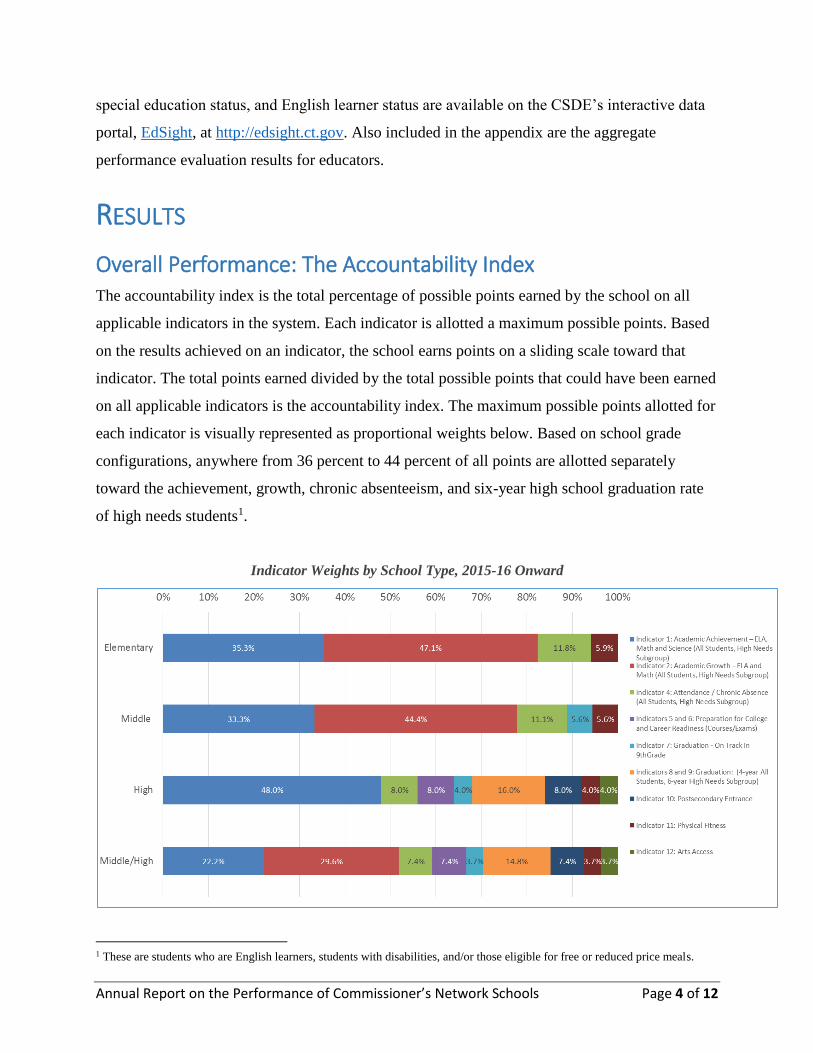
each indicator is visually represented as proportional weights below. Based on school grade
configurations, anywhere from 36 percent to 44 percent of all points are allotted separately
toward the achievement, growth, chronic absenteeism, and six-year high school graduation rate
of high needs students1.
Indicator Weights by School Type, 2015-16 Onward
1 These are students who are English learners, students with disabilities, and/or those eligible for free or reduced price meals.

Annual Report on the Performance of Commissioner’s Network Schools Page 5 of 12
Accountability Index Trend for Commissioner’s Network Schools
District Name School Name When
Entered Network
2014-15 2015-16 2016-17
Bridgeport School District Columbus School Fall 2016 51.3 58.0 49.1
Dunbar School Fall 2013 53.0 41.3 44.8
Luis Munoz Marin School Fall 2014 41.1 43.7 46.9
East Hartford School District East Hartford Middle School Fall 2015 61.9 58.0 56.2
Robert J. O'Brien School Fall 2014 63.0 61.3 66.7
New Britain School District New Britain High School Fall 2017 55.8 55.1 56.3
New Haven School District Clinton Avenue School Fall 2016 54.6 61.2 58.0
Lincoln-Bassett School Fall 2014 48.9 72.4 59.2
Wilbur Cross High School Fall 2013 52.2 55.3 57.3
Norwich School District Uncas Network School Fall 2014 62.7 56.3 64.8
Waterbury School District Crosby High School Fall 2013 50.3 50.0 51.3
Walsh School Fall 2013 51.5 64.5 58.0
Winchester School District Batcheller Early Education Center Fall 2016 65.1 65.2 88.8
Pearson Middle School Fall 2016 74.0 71.2 65.3
Windham School District Windham Middle School Fall 2013 56.3 55.3 53.4
Statewide Accountability Index 76.1 73.1 73.2
Note: Schools in bold have been in the network for more than two years.
Though the network schools perform substantially below the state accountability index, seven of
the nine schools that have been in the network for more than two years (i.e., entered in either fall
2013 or fall 2014) demonstrated improvement in their accountability indexes from 2014-15 to
2016-17.
Academic Achievement: The Performance Index The performance index, which is commonly referred to as the DPI (for districts) and the SPI (for
schools), is an aggregate measure of student achievement. It tells us how well students are doing
academically in a given school year. The simplest way to think of the DPI or SPI is that it is the
average score of students in a subject area (e.g., English language arts, mathematics). A 7-minute
video produced by the CSDE provides a simple overview of the performance index. The primary
advantage of an index approach is that it encourages educators to help improve all students, and
not just those on the cusp of the “proficiency” level.

Annual Report on the Performance of Commissioner’s Network Schools Page 6 of 12
School Performance Index Trend for Commissioner’s Network Schools
English Language Arts Mathematics
District Name School Name 2014-15 2015-16 2016-17 2014-15 2015-16 2016-17
Bridgeport School District Columbus School 47.2 49.8 45.7 35.8 39.0 37.5
Dunbar School 51.1 46.1 41.7 40.2 35.5 35.6
Luis Munoz Marin School 39.1 38.5 40.2 30.1 30.6 34.4
East Hartford School District East Hartford Middle School 54.1 54.5 54.8 43.5 44.7 44.1
Robert J. O'Brien School 56.1 56.1 56.7 46.7 45.0 47.7
New Britain School District New Britain High School 51.6 42.0 44.4 41.4 40.9 41.7
New Haven School District Clinton Avenue School 51.8 54.5 57.5 43.2 48.5 46.4
Lincoln-Bassett School 51.0 56.1 56.0 42.1 51.5 53.8
Wilbur Cross High School 41.0 47.0 45.1 33.9 42.4 40.3
Norwich School District Uncas Network School 54.8 52.6 54.8 46.9 48.5 52.2
Waterbury School District Crosby High School 41.8 43.9 41.5 31.7 38.5 36.6
Walsh School 44.5 53.2 50.5 37.8 44.9 48.3
Winchester School District Pearson Middle School 66.9 63.7 63.8 54.4 55.6 57.8
Windham School District Windham Middle School 49.8 55.0 54.5 41.5 44.8 45.7
Statewide Performance Index 67.9 67.7 67.1 59.3 61.4 62.2
Note: Schools in bold have been in the network for more than two years.
Student achievement in most network schools substantially lags the state average; however, of
the nine schools that have been in the network for over two years, six improved achievement in
ELA while eight improved achievement in mathematics from 2014-15 to 2016-17.
Academic Growth While achievement is a one-time snapshot measurement of a student’s academic performance,
growth is the change in that achievement score for the same student between two or more points
in time. Connecticut’s growth model is a matched student cohort growth model. It evaluates the
achievement of the same student from one grade in year 1 to the next higher grade in year 2. This
is generally considered the gold standard for growth because there are no mismatched students;
only those students who are matched across years are included in this calculation.
Connecticut’s growth model is based on the Smarter Balanced ELA and Mathematics
assessments and applies to students in Grades 4 through 8. Each student’s growth is evaluated
Annual Report on the Performance of Commissioner’s Network Schools Page 7 of 12
against an individualized growth target amount on the Smarter Balanced vertical scale. The
growth targets, if achieved, are designed to get students to higher levels of achievement in future
years. A 20-minute video produced by the CSDE provides an introduction to this growth model.
For those who have a working knowledge of Connecticut’s growth model, an 8-minute video
provides a brief explanation of the two different ways that Connecticut reports academic growth
in English language arts and mathematics. The growth indicator used for accountability purposes
is the Average Percentage of Target Achieved; this is the percentage of the growth target that is
achieved on average by all students. The accountability expectation is that this average will be
100% for all students and subgroups. Since this growth measure applies only to students enrolled
in Grades 4 through 8, high schools are excluded from the growth results table below.
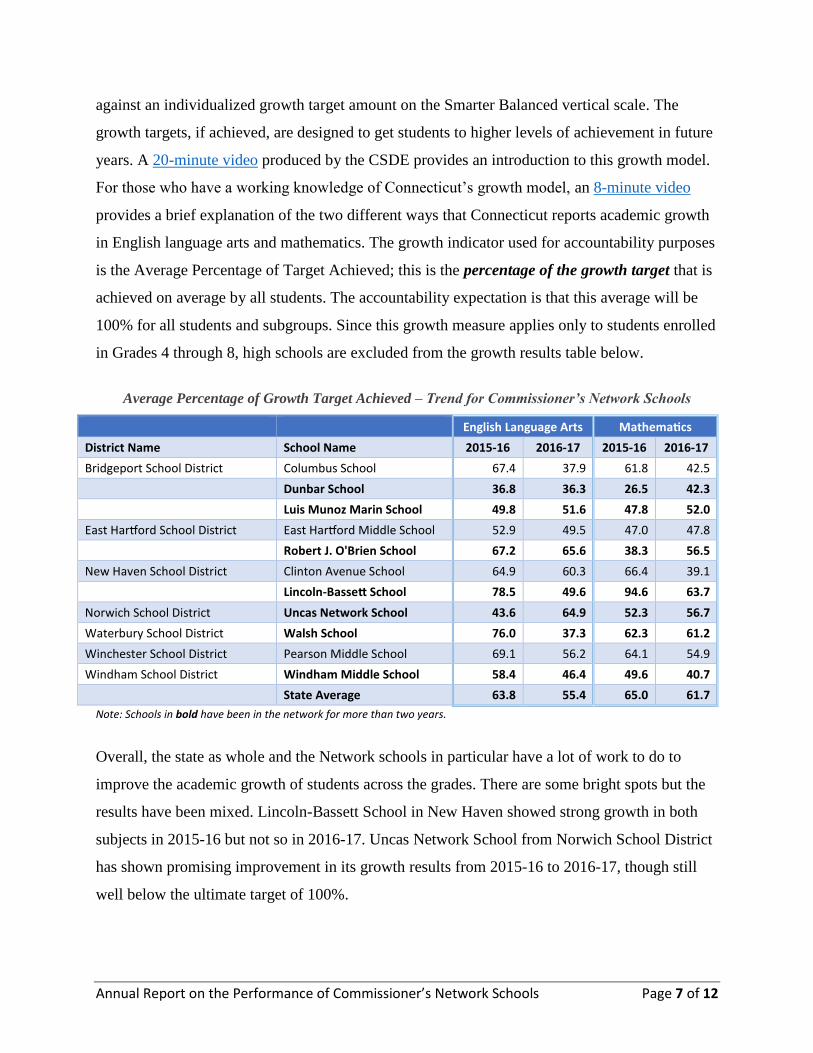
Average Percentage of Growth Target Achieved – Trend for Commissioner’s Network Schools
English Language Arts Mathematics
District Name School Name 2015-16 2016-17 2015-16 2016-17
Bridgeport School District Columbus School 67.4 37.9 61.8 42.5
Dunbar School 36.8 36.3 26.5 42.3
Luis Munoz Marin School 49.8 51.6 47.8 52.0
East Hartford School District East Hartford Middle School 52.9 49.5 47.0 47.8 Robert J. O'Brien School 67.2 65.6 38.3 56.5
New Haven School District Clinton Avenue School 64.9 60.3 66.4 39.1 Lincoln-Bassett School 78.5 49.6 94.6 63.7
Norwich School District Uncas Network School 43.6 64.9 52.3 56.7
Waterbury School District Walsh School 76.0 37.3 62.3 61.2
Winchester School District Pearson Middle School 69.1 56.2 64.1 54.9
Windham School District Windham Middle School 58.4 46.4 49.6 40.7
State Average 63.8 55.4 65.0 61.7
Note: Schools in bold have been in the network for more than two years.
Overall, the state as whole and the Network schools in particular have a lot of work to do to
improve the academic growth of students across the grades. There are some bright spots but the
results have been mixed. Lincoln-Bassett School in New Haven showed strong growth in both
subjects in 2015-16 but not so in 2016-17. Uncas Network School from Norwich School District
has shown promising improvement in its growth results from 2015-16 to 2016-17, though still
well below the ultimate target of 100%.
Annual Report on the Performance of Commissioner’s Network Schools Page 8 of 12
Chronic Absenteeism Indicator 4 of the accountability system is chronic absenteeism. It represents the percentage of
students missing at least 10 percent of the days enrolled for any reason. Chronic absence has
been shown to be related to academic achievement, high school graduation, drop-out, and
juvenile delinquency. Absences occur due to many factors, e.g., health, unstable housing, lack of
transportation, student disengagement from school, and safety/school climate. By removing
barriers to attendance, districts, schools and community partners can improve school attendance.
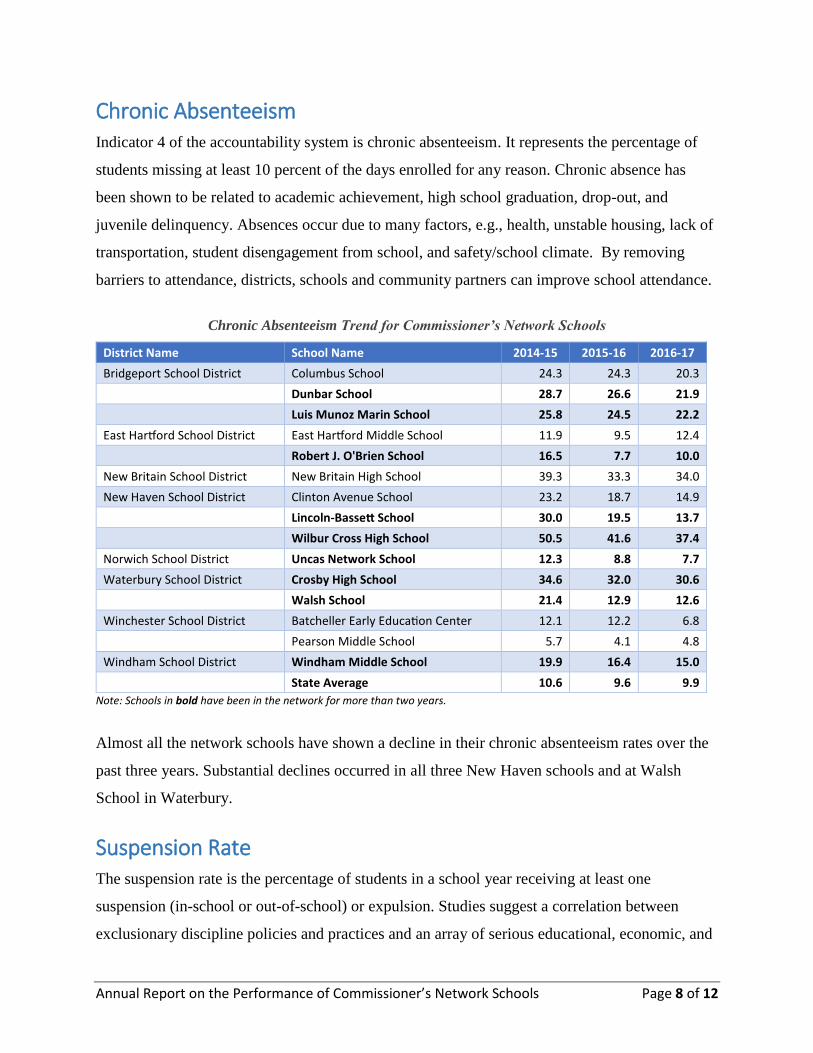
Chronic Absenteeism Trend for Commissioner’s Network Schools
District Name School Name 2014-15 2015-16 2016-17
Bridgeport School District Columbus School 24.3 24.3 20.3
Dunbar School 28.7 26.6 21.9
Luis Munoz Marin School 25.8 24.5 22.2
East Hartford School District East Hartford Middle School 11.9 9.5 12.4 Robert J. O'Brien School 16.5 7.7 10.0
New Britain School District New Britain High School 39.3 33.3 34.0
New Haven School District Clinton Avenue School 23.2 18.7 14.9
Lincoln-Bassett School 30.0 19.5 13.7
Wilbur Cross High School 50.5 41.6 37.4
Norwich School District Uncas Network School 12.3 8.8 7.7
Waterbury School District Crosby High School 34.6 32.0 30.6 Walsh School 21.4 12.9 12.6
Winchester School District Batcheller Early Education Center 12.1 12.2 6.8 Pearson Middle School 5.7 4.1 4.8
Windham School District Windham Middle School 19.9 16.4 15.0
State Average 10.6 9.6 9.9
Note: Schools in bold have been in the network for more than two years.
Almost all the network schools have shown a decline in their chronic absenteeism rates over the
past three years. Substantial declines occurred in all three New Haven schools and at Walsh
School in Waterbury.
Suspension Rate The suspension rate is the percentage of students in a school year receiving at least one
suspension (in-school or out-of-school) or expulsion. Studies suggest a correlation between
exclusionary discipline policies and practices and an array of serious educational, economic, and
Annual Report on the Performance of Commissioner’s Network Schools Page 9 of 12
social problems. These include: school avoidance and diminished educational engagement;
decreased academic achievement; increased behavior problems; increased likelihood of dropping
out; substance abuse; and involvement with juvenile justice systems.
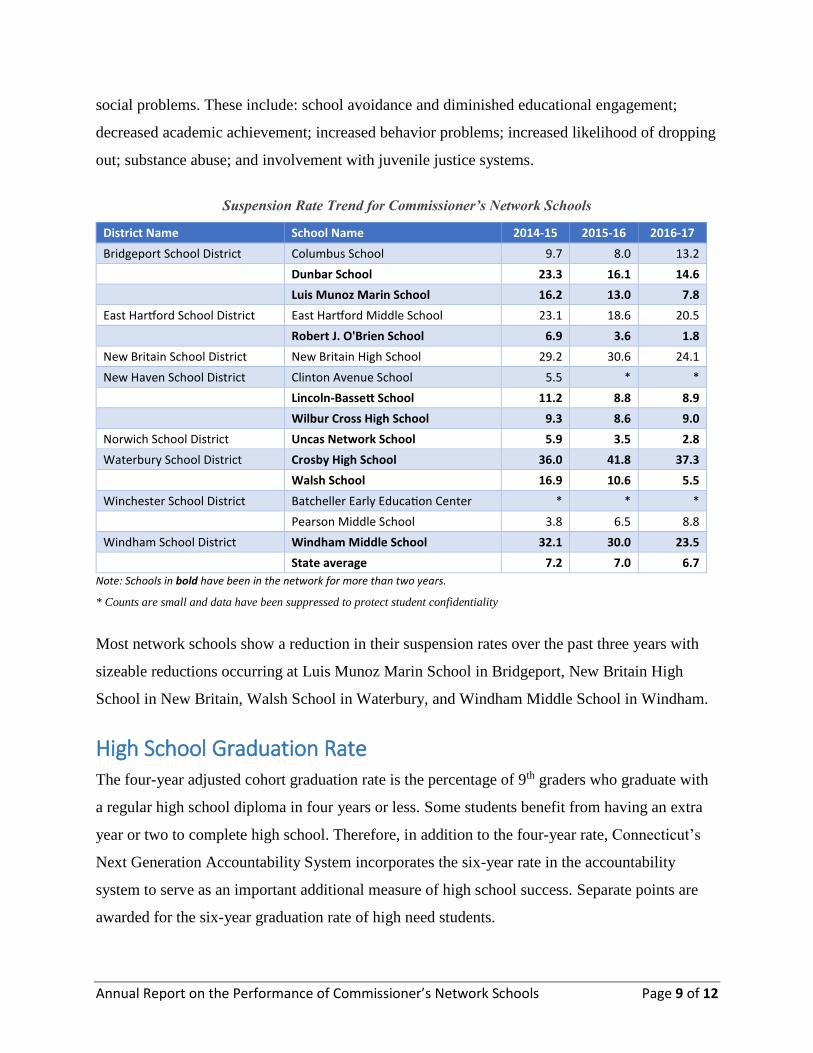
Suspension Rate Trend for Commissioner’s Network Schools
District Name School Name 2014-15 2015-16 2016-17
Bridgeport School District Columbus School 9.7 8.0 13.2
Dunbar School 23.3 16.1 14.6
Luis Munoz Marin School 16.2 13.0 7.8
East Hartford School District East Hartford Middle School 23.1 18.6 20.5 Robert J. O'Brien School 6.9 3.6 1.8
New Britain School District New Britain High School 29.2 30.6 24.1
New Haven School District Clinton Avenue School 5.5 * *
Lincoln-Bassett School 11.2 8.8 8.9
Wilbur Cross High School 9.3 8.6 9.0
Norwich School District Uncas Network School 5.9 3.5 2.8
Waterbury School District Crosby High School 36.0 41.8 37.3 Walsh School 16.9 10.6 5.5
Winchester School District Batcheller Early Education Center * * * Pearson Middle School 3.8 6.5 8.8
Windham School District Windham Middle School 32.1 30.0 23.5
State average 7.2 7.0 6.7
Note: Schools in bold have been in the network for more than two years.
* Counts are small and data have been suppressed to protect student confidentiality
Most network schools show a reduction in their suspension rates over the past three years with
sizeable reductions occurring at Luis Munoz Marin School in Bridgeport, New Britain High
School in New Britain, Walsh School in Waterbury, and Windham Middle School in Windham.
High School Graduation Rate The four-year adjusted cohort graduation rate is the percentage of 9th graders who graduate with
a regular high school diploma in four years or less. Some students benefit from having an extra
year or two to complete high school. Therefore, in addition to the four-year rate, Connecticut’s
Next Generation Accountability System incorporates the six-year rate in the accountability
system to serve as an important additional measure of high school success. Separate points are
awarded for the six-year graduation rate of high need students.
Annual Report on the Performance of Commissioner’s Network Schools Page 10 of 12
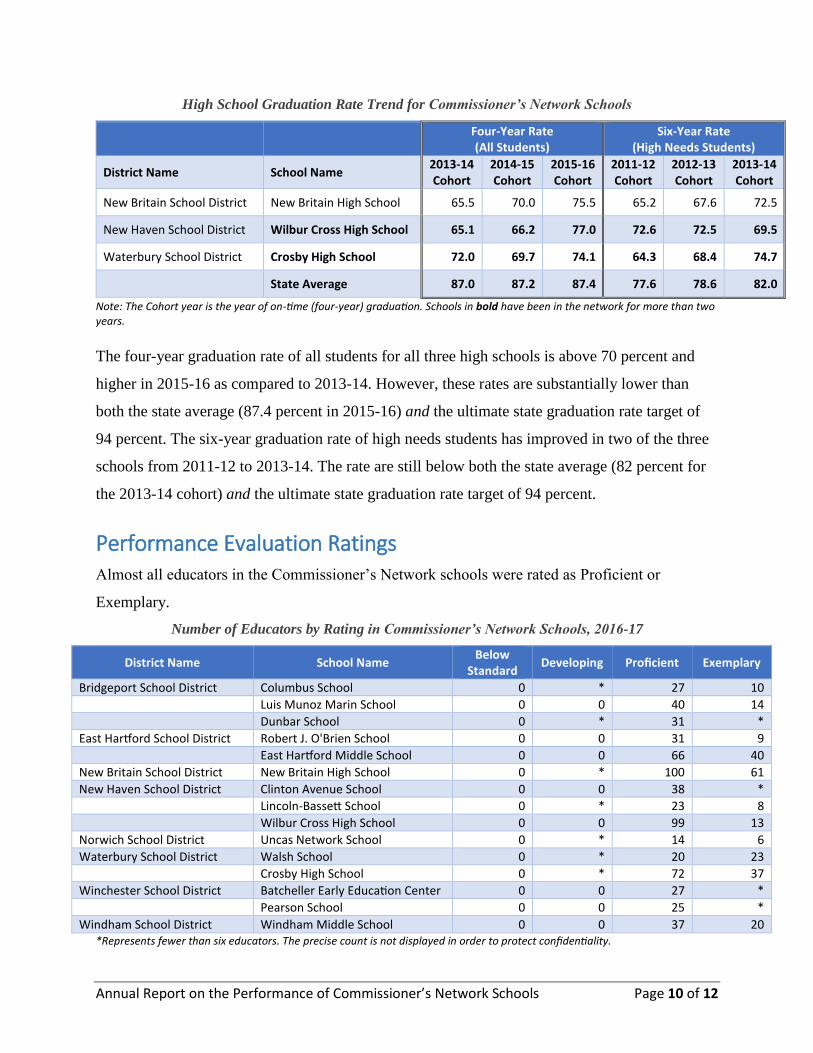
High School Graduation Rate Trend for Commissioner’s Network Schools
Four-Year Rate (All Students)
Six-Year Rate (High Needs Students)
District Name School Name 2013-14 Cohort
2014-15 Cohort
2015-16 Cohort
2011-12 Cohort
2012-13 Cohort
2013-14 Cohort
New Britain School District New Britain High School 65.5 70.0 75.5 65.2 67.6 72.5
New Haven School District Wilbur Cross High School 65.1 66.2 77.0 72.6 72.5 69.5
Waterbury School District Crosby High School 72.0 69.7 74.1 64.3 68.4 74.7
State Average 87.0 87.2 87.4 77.6 78.6 82.0
Note: The Cohort year is the year of on-time (four-year) graduation. Schools in bold have been in the network for more than two years.
The four-year graduation rate of all students for all three high schools is above 70 percent and
higher in 2015-16 as compared to 2013-14. However, these rates are substantially lower than
both the state average (87.4 percent in 2015-16) and the ultimate state graduation rate target of
94 percent. The six-year graduation rate of high needs students has improved in two of the three
schools from 2011-12 to 2013-14. The rate are still below both the state average (82 percent for
the 2013-14 cohort) and the ultimate state graduation rate target of 94 percent.
Performance Evaluation Ratings Almost all educators in the Commissioner’s Network schools were rated as Proficient or
Exemplary.
Number of Educators by Rating in Commissioner’s Network Schools, 2016-17
District Name School Name Below
Standard Developing Proficient Exemplary
Bridgeport School District Columbus School 0 * 27 10
Luis Munoz Marin School 0 0 40 14
Dunbar School 0 * 31 *
East Hartford School District Robert J. O'Brien School 0 0 31 9
East Hartford Middle School 0 0 66 40
New Britain School District New Britain High School 0 * 100 61
New Haven School District Clinton Avenue School 0 0 38 *
Lincoln-Bassett School 0 * 23 8
Wilbur Cross High School 0 0 99 13
Norwich School District Uncas Network School 0 * 14 6
Waterbury School District Walsh School 0 * 20 23
Crosby High School 0 * 72 37
Winchester School District Batcheller Early Education Center 0 0 27 *
Pearson School 0 0 25 *
Windham School District Windham Middle School 0 0 37 20 *Represents fewer than six educators. The precise count is not displayed in order to protect confidentiality.
Annual Report on the Performance of Commissioner’s Network Schools Page 11 of 12
SUMMARY Among schools that have been in the network for more than two years, many are improving
including Uncas Network School in Norwich, Robert J. O’ Brien School in East Hartford,
Wilbur Cross High School and Lincoln-Bassett School in New Haven, and Walsh School in
Waterbury. Luis Munoz Marin School in Bridgeport has trended in the right direction though its
performance is still quite low. The results for Crosby High School in Waterbury and Windham
Middle School in Windham have been somewhat mixed with some indicators improving while
others stagnating or declining. The results for Dunbar School in Bridgeport are concerning;
academic achievement and the accountability index have declined while growth outcomes are
very low. Overall, the state-local partnerships established through the Commissioner’s Network
School and the Alliance District programs can lead to greater levels of student engagement,
growth, and achievement in the network schools.
Annual Report on the Performance of Commissioner’s Network Schools Page 12 of 12
APPENDIX
Accountability System FAQ
Next Generation Accountability System 2016-17 Report for All Network Schools
Commissioner’s Network Schools Fast Facts, 2016-17

What is the Connecticut Next Generation Accountability System?Connecticut’s Next Generation Accountability System is a broad set of 12 indicators that help tell the story of how well a school is preparing its students for success in college, careers and life. The system moves beyond test scores and graduation rates and instead provides a more holistic, multifactor perspective of district and school performance and incorporates student growth over time.
What has changed since the previous accountability system?There are two main differences with this account-ability system, initially implemented in March 2016. First, in addition to measuring academic achievement, this system also focuses on student growth over time. Measuring growth provides a more accurate picture than just looking at a snapshot in time of student performance. The sec-ond big change is that this accountability system includes additional key indicators, such as chron-ic absenteeism, physical fitness and arts access. Research tells us that students who attend school on a daily basis and maintain a healthy lifestyle are more likely to graduate and succeed in college. Access to an engaging arts curriculum creates a more well-rounded educational experience.
What are the 12 indicators?1. Academic achievement status measured
by state assessments2. Academic growth3. Assessment participation rate4. Chronic absenteeism5. Preparation for postsecondary and
career readiness – coursework6. Preparation for postsecondary and
career readiness – exams7. Graduation – on track in ninth grade8. Graduation – four-year adjusted cohort
graduation rate – all students9. Graduation – six-year adjusted cohort
graduation rate – high needs10. Postsecondary entrance rate – all students
(college enrollment)11. Physical fitness12. Arts access
How do we use the accountability system?The Next Generation Accountability System helps us measure school and district success toward the goal of providing every student a quality education that prepares him or her for success down the road. Each school receives a score calculated using a formula that incorporates the accountability system indicators. There is a tiered system of resources and supports for schools based on their
continued on next page
In Connecticut, we believe all students have the ability to learn, grow and rise to the challenge of high expectations. The Connecticut Next Generation Accountability
System helps us deliver on our promise of a high quality education for all by creating a more comprehensive, holistic picture of how our students and schools are performing.
The Connecticut Next Generation ACCOUNTABILITY SYSTEM
Q:
Q:
Q:
Q:
A:
A:
A:
A:
C O N N E C T I C U T S T A T E D E PA R T M E N T O F E D U C A T I O N
score. Schools with low student performance and a low accountability score could be designated turnaround schools, meaning they would have to create and implement a plan for accelerating school improvement.
Will the accountability system help Connecticut close its achievement gap?Yes. A key feature of the system is that it sepa-rates data for high-needs subgroups of students. That gives us a better idea of how students living in poverty, students who have disabilities and students learning English are performing in school and how we can better support them on the path to success.
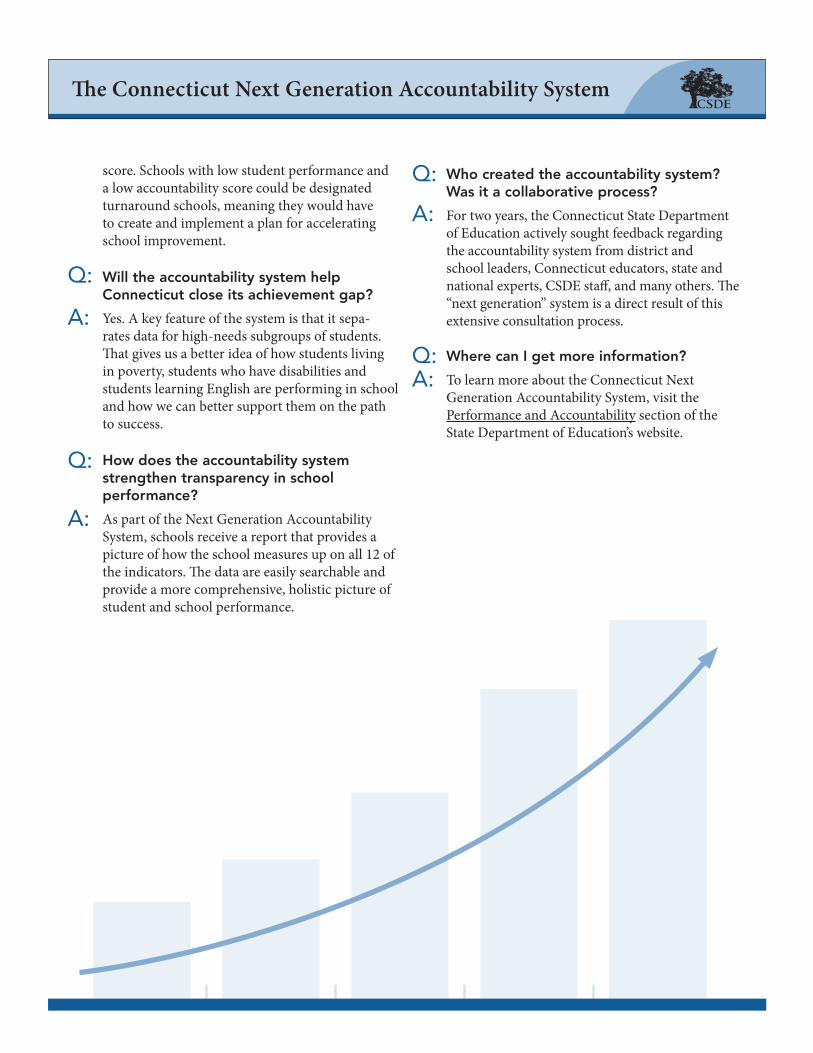
How does the accountability system strengthen transparency in school performance?As part of the Next Generation Accountability System, schools receive a report that provides a picture of how the school measures up on all 12 of the indicators. The data are easily searchable and provide a more comprehensive, holistic picture of student and school performance.
Who created the accountability system? Was it a collaborative process?For two years, the Connecticut State Department of Education actively sought feedback regarding the accountability system from district and school leaders, Connecticut educators, state and national experts, CSDE staff, and many others. The “next generation” system is a direct result of this extensive consultation process.
Where can I get more information?To learn more about the Connecticut Next Generation Accountability System, visit the Performance and Accountability section of the State Department of Education’s website.
The Connecticut Next Generation Accountability System
Q:
Q:
Q:
A:
A:
A:
Q:
A:

Choose a District Choose a School School of Distinction?
Bridgeport School District Columbus School_0150511 No
Choose a District, then Choose a School. To refresh the District List, clear the School name.
No: Indicator TargetPoints Earned
Max Points
% Points Earned
1a. ELA Performance Index – All Students 75 30.4 50 60.9%
1b. ELA Performance Index – High Needs Students 75 29.4 50 58.9%
1c. Math Performance Index – All Students 75 25.0 50 50.0%
1d. Math Performance Index – High Needs Students 75 24.3 50 48.6%
1e. Science Performance Index – All Students 75 24.8 50 49.6%
1f. Science Performance Index – High Needs Students 75 24.3 50 48.6%
2a. ELA Avg. Percentage of Growth Target Achieved – All Students 100 37.9 100 37.9%
2b. ELA Avg. Percentage of Growth Target Achieved – High Needs Students 100 36.0 100 36.0%
2c. Math Avg. Percentage of Growth Target Achieved – All Students 100 42.5 100 42.5%
2d. Math Avg. Percentage of Growth Target Achieved – High Needs Students 100 43.2 100 43.2%
4a. Chronic Absenteeism – All Students <=5% 19.5 50 38.9%
4b. Chronic Absenteeism – High Needs Students <=5% 20.0 50 40.0%
5 Preparation for CCR – % taking courses 75% 0.0 0
6 Preparation for CCR – % passing exams 75% 0.0 0
7 On‐track to High School Graduation 94% 41.9 50 83.7%
8 4‐year Graduation All Students (2016 Cohort) 94% 0.0 0
9 6‐year Graduation ‐ High Needs Students (2014 Cohort) 94% 0.0 0
10 Postsecondary Entrance (Class of 2016) 75% 0.0 0
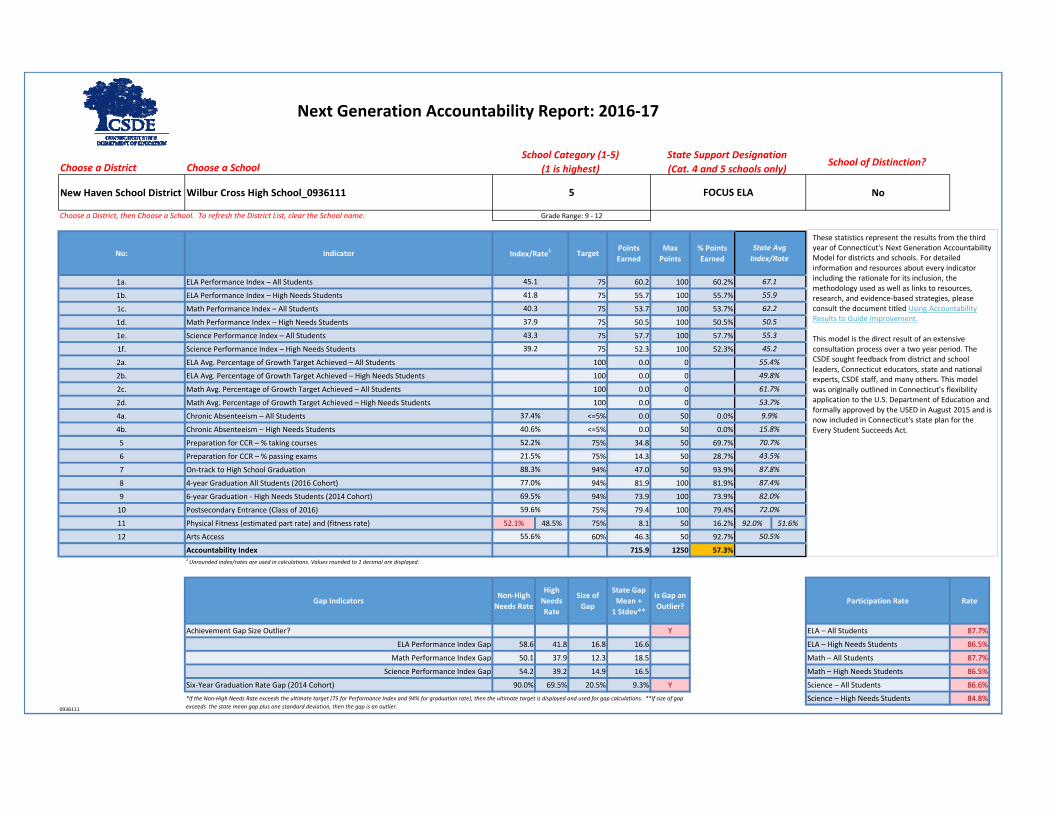
11 Physical Fitness (estimated part rate) and (fitness rate) 100.0% 64.0% 75% 42.7 50 85.3% 92.0% 51.6%
12 Arts Access 60% 0.0 0
Accountability Index 441.8 900 49.1%1 Unrounded index/rates are used in calculations. Values rounded to 1 decimal are displayed.
Gap IndicatorsNon‐High Needs Rate
High Needs Rate
Size of Gap
State Gap Mean +1 Stdev**
Is Gap an Outlier?
Participation Rate Rate
Achievement Gap Size Outlier? N ELA – All Students 99.7%
ELA Performance Index Gap 59.6 44.1 15.4 16.6 ELA – High Needs Students 99.7%
Math Performance Index Gap 47.2 36.4 10.8 18.5 Math – All Students 99.7%
Science Performance Index Gap 36.4 16.5 Math – High Needs Students 99.7%
Six‐Year Graduation Rate Gap (2014 Cohort) N/A Science – All Students 100.0%
Science – High Needs Students 100.0%0150511
School Category (1‐5)(1 is highest)
87.4%
37.9% 55.4%
36.0% 49.8%
42.5% 61.7%
Grade Range: PK ‐ 8
Next Generation Accountability Report: 2016‐17
55.9
62.2
50.5
55.3
45.2
9.9%
15.8%
70.7%
43.5%
87.8%
5
State Support Designation(Cat. 4 and 5 schools only)
FOCUS ELA
*If the Non‐High Needs Rate exceeds the ultimate target (75 for Performance Index and 94% for graduation rate), then the ultimate target is displayed and used for gap calculations. **If size of gap exceeds the state mean gap plus one standard deviation, then the gap is an outlier.
Index/Rate1
45.7
44.1
37.5
36.4
37.2
36.4
20.3%
20.0%
78.7%
State AvgIndex/Rate
67.1
82.0%
72.0%
50.5%
43.2% 53.7%
These statistics represent the results from the third year of Connecticut's Next Generation Accountability Model for districts and schools. For detailed information and resources about every indicator including the rationale for its inclusion, the methodology used as well as links to resources, research, and evidence‐based strategies, please consult the document titled Using Accountability Results to Guide Improvement.
This model is the direct result of an extensive consultation process over a two year period. The CSDE sought feedback from district and school leaders, Connecticut educators, state and national experts, CSDE staff, and many others. This model was originally outlined in Connecticut’s flexibility application to the U.S. Department of Education and formally approved by the USED in August 2015 and is now included in Connecticut's state plan for the Every Student Succeeds Act.

Choose a District Choose a School School of Distinction?
Bridgeport School District Dunbar School_0154111 No
Choose a District, then Choose a School. To refresh the District List, clear the School name.
No: Indicator TargetPoints Earned
Max Points
% Points Earned
1a. ELA Performance Index – All Students 75 27.8 50 55.6%
1b. ELA Performance Index – High Needs Students 75 27.7 50 55.4%
1c. Math Performance Index – All Students 75 23.8 50 47.5%
1d. Math Performance Index – High Needs Students 75 23.8 50 47.6%
1e. Science Performance Index – All Students 75 24.2 50 48.3%
1f. Science Performance Index – High Needs Students 75 24.2 50 48.4%
2a. ELA Avg. Percentage of Growth Target Achieved – All Students 100 36.3 100 36.3%
2b. ELA Avg. Percentage of Growth Target Achieved – High Needs Students 100 37.8 100 37.8%
2c. Math Avg. Percentage of Growth Target Achieved – All Students 100 42.3 100 42.3%
2d. Math Avg. Percentage of Growth Target Achieved – High Needs Students 100 43.8 100 43.8%
4a. Chronic Absenteeism – All Students <=5% 16.3 50 32.5%
4b. Chronic Absenteeism – High Needs Students <=5% 16.3 50 32.5%
5 Preparation for CCR – % taking courses 75% 0.0 0
6 Preparation for CCR – % passing exams 75% 0.0 0
7 On‐track to High School Graduation 94% 39.5 50 79.0%
8 4‐year Graduation All Students (2016 Cohort) 94% 0.0 0
9 6‐year Graduation ‐ High Needs Students (2014 Cohort) 94% 0.0 0
10 Postsecondary Entrance (Class of 2016) 75% 0.0 0
11 Physical Fitness (estimated part rate) and (fitness rate) 88.6% 58.1% 75% 19.4 50 38.7% 92.0% 51.6%
12 Arts Access 60% 0.0 0
Accountability Index 403.0 900 44.8%1 Unrounded index/rates are used in calculations. Values rounded to 1 decimal are displayed.
Gap IndicatorsNon‐High Needs Rate
High Needs Rate
Size of Gap
State Gap Mean +1 Stdev**
Is Gap an Outlier?
Participation Rate Rate
Achievement Gap Size Outlier? N ELA – All Students 99.5%
ELA Performance Index Gap 42.3 41.5 0.8 16.6 ELA – High Needs Students 99.4%
Math Performance Index Gap 35.2 35.7 ‐0.6 18.5 Math – All Students 99.5%
Science Performance Index Gap 36.3 16.5 Math – High Needs Students 99.4%
Six‐Year Graduation Rate Gap (2014 Cohort) N/A Science – All Students 98.7%
Science – High Needs Students 98.4%0154111
School Category (1‐5)(1 is highest)
87.4%
36.3% 55.4%
37.8% 49.8%
42.3% 61.7%
Grade Range: PK ‐ 8
Next Generation Accountability Report: 2016‐17
55.9
62.2
50.5
55.3
45.2
9.9%
15.8%
70.7%
43.5%
87.8%
5
State Support Designation(Cat. 4 and 5 schools only)
FOCUS MATH
*If the Non‐High Needs Rate exceeds the ultimate target (75 for Performance Index and 94% for graduation rate), then the ultimate target is displayed and used for gap calculations. **If size of gap exceeds the state mean gap plus one standard deviation, then the gap is an outlier.
Index/Rate1
41.7
41.5
35.6
35.7
36.2
36.3
21.9%
21.9%
74.3%
State AvgIndex/Rate
67.1
82.0%
72.0%
50.5%
43.8% 53.7%
These statistics represent the results from the third year of Connecticut's Next Generation Accountability Model for districts and schools. For detailed information and resources about every indicator including the rationale for its inclusion, the methodology used as well as links to resources, research, and evidence‐based strategies, please consult the document titled Using Accountability Results to Guide Improvement.
This model is the direct result of an extensive consultation process over a two year period. The CSDE sought feedback from district and school leaders, Connecticut educators, state and national experts, CSDE staff, and many others. This model was originally outlined in Connecticut’s flexibility application to the U.S. Department of Education and formally approved by the USED in August 2015 and is now included in Connecticut's state plan for the Every Student Succeeds Act.

Choose a District Choose a School School of Distinction?
Bridgeport School District Luis Munoz Marin School_0151011 No
Choose a District, then Choose a School. To refresh the District List, clear the School name.
No: Indicator TargetPoints Earned
Max Points
% Points Earned
1a. ELA Performance Index – All Students 75 26.8 50 53.6%
1b. ELA Performance Index – High Needs Students 75 25.9 50 51.8%
1c. Math Performance Index – All Students 75 22.9 50 45.8%
1d. Math Performance Index – High Needs Students 75 22.3 50 44.7%
1e. Science Performance Index – All Students 75 21.9 50 43.9%
1f. Science Performance Index – High Needs Students 75 21.5 50 43.0%
2a. ELA Avg. Percentage of Growth Target Achieved – All Students 100 51.6 100 51.6%
2b. ELA Avg. Percentage of Growth Target Achieved – High Needs Students 100 51.2 100 51.2%
2c. Math Avg. Percentage of Growth Target Achieved – All Students 100 52.0 100 52.0%
2d. Math Avg. Percentage of Growth Target Achieved – High Needs Students 100 51.3 100 51.3%
4a. Chronic Absenteeism – All Students <=5% 15.7 50 31.4%
4b. Chronic Absenteeism – High Needs Students <=5% 15.7 50 31.4%
5 Preparation for CCR – % taking courses 75% 0.0 0
6 Preparation for CCR – % passing exams 75% 0.0 0
7 On‐track to High School Graduation 94% 37.4 50 74.8%
8 4‐year Graduation All Students (2016 Cohort) 94% 0.0 0
9 6‐year Graduation ‐ High Needs Students (2014 Cohort) 94% 0.0 0
10 Postsecondary Entrance (Class of 2016) 75% 0.0 0
11 Physical Fitness (estimated part rate) and (fitness rate) 95.0% 8.7% 75% 5.8 50 11.7% 92.0% 51.6%
12 Arts Access 60% 0.0 0
Accountability Index 422.1 900 46.9%1 Unrounded index/rates are used in calculations. Values rounded to 1 decimal are displayed.
Gap IndicatorsNon‐High Needs Rate
High Needs Rate
Size of Gap
State Gap Mean +1 Stdev**
Is Gap an Outlier?
Participation Rate Rate
Achievement Gap Size Outlier? N ELA – All Students 99.7%
ELA Performance Index Gap 50.5 38.9 11.6 16.6 ELA – High Needs Students 99.6%
Math Performance Index Gap 41.1 33.5 7.6 18.5 Math – All Students 99.3%
Science Performance Index Gap 38.1 32.3 5.9 16.5 Math – High Needs Students 99.2%
Six‐Year Graduation Rate Gap (2014 Cohort) N/A Science – All Students 99.5%
Science – High Needs Students 99.5%0151011
School Category (1‐5)(1 is highest)
87.4%
51.6% 55.4%
51.2% 49.8%
52.0% 61.7%
Grade Range: PK ‐ 8
Next Generation Accountability Report: 2016‐17
55.9
62.2
50.5
55.3
45.2
9.9%
15.8%
70.7%
43.5%
87.8%
5
State Support Designation(Cat. 4 and 5 schools only)
Turnaround
*If the Non‐High Needs Rate exceeds the ultimate target (75 for Performance Index and 94% for graduation rate), then the ultimate target is displayed and used for gap calculations. **If size of gap exceeds the state mean gap plus one standard deviation, then the gap is an outlier.
Index/Rate1
40.2
38.9
34.4
33.5
32.9
32.3
22.2%
22.2%
70.3%
State AvgIndex/Rate
67.1
82.0%
72.0%
50.5%
51.3% 53.7%
These statistics represent the results from the third year of Connecticut's Next Generation Accountability Model for districts and schools. For detailed information and resources about every indicator including the rationale for its inclusion, the methodology used as well as links to resources, research, and evidence‐based strategies, please consult the document titled Using Accountability Results to Guide Improvement.
This model is the direct result of an extensive consultation process over a two year period. The CSDE sought feedback from district and school leaders, Connecticut educators, state and national experts, CSDE staff, and many others. This model was originally outlined in Connecticut’s flexibility application to the U.S. Department of Education and formally approved by the USED in August 2015 and is now included in Connecticut's state plan for the Every Student Succeeds Act.

Choose a District Choose a School School of Distinction?
East Hartford School District
East Hartford Middle School_0435111 No
Choose a District, then Choose a School. To refresh the District List, clear the School name.
No: Indicator TargetPoints Earned
Max Points
% Points Earned
1a. ELA Performance Index – All Students 75 36.5 50 73.0%
1b. ELA Performance Index – High Needs Students 75 33.0 50 66.0%
1c. Math Performance Index – All Students 75 29.4 50 58.8%
1d. Math Performance Index – High Needs Students 75 27.0 50 54.0%
1e. Science Performance Index – All Students 75 29.1 50 58.2%
1f. Science Performance Index – High Needs Students 75 26.2 50 52.3%
2a. ELA Avg. Percentage of Growth Target Achieved – All Students 100 49.5 100 49.5%
2b. ELA Avg. Percentage of Growth Target Achieved – High Needs Students 100 49.2 100 49.2%
2c. Math Avg. Percentage of Growth Target Achieved – All Students 100 47.8 100 47.8%
2d. Math Avg. Percentage of Growth Target Achieved – High Needs Students 100 48.6 100 48.6%
4a. Chronic Absenteeism – All Students <=5% 35.3 50 70.6%
4b. Chronic Absenteeism – High Needs Students <=5% 33.5 50 67.0%
5 Preparation for CCR – % taking courses 75% 0.0 0
6 Preparation for CCR – % passing exams 75% 0.0 0
7 On‐track to High School Graduation 94% 44.5 50 89.0%
8 4‐year Graduation All Students (2016 Cohort) 94% 0.0 0
9 6‐year Graduation ‐ High Needs Students (2014 Cohort) 94% 0.0 0
10 Postsecondary Entrance (Class of 2016) 75% 0.0 0
11 Physical Fitness (estimated part rate) and (fitness rate) 89.7% 47.4% 75% 15.8 50 31.6% 92.0% 51.6%
12 Arts Access 60% 0.0 0
Accountability Index 505.4 900 56.2%1 Unrounded index/rates are used in calculations. Values rounded to 1 decimal are displayed.
Gap IndicatorsNon‐High Needs Rate
High Needs Rate
Size of Gap
State Gap Mean +1 Stdev**
Is Gap an Outlier?
Participation Rate Rate
Achievement Gap Size Outlier? N ELA – All Students 97.8%
ELA Performance Index Gap 63.3 49.5 13.8 16.6 ELA – High Needs Students 96.9%
Math Performance Index Gap 50.0 40.5 9.5 18.5 Math – All Students 93.2%
Science Performance Index Gap 49.9 39.2 10.6 16.5 Math – High Needs Students 92.4%
Six‐Year Graduation Rate Gap (2014 Cohort) N/A Science – All Students 98.1%
Science – High Needs Students 98.2%0435111
School Category (1‐5)(1 is highest)
87.4%
49.5% 55.4%
49.2% 49.8%
47.8% 61.7%
Grade Range: 6 ‐ 8
Next Generation Accountability Report: 2016‐17
55.9
62.2
50.5
55.3
45.2
9.9%
15.8%
70.7%
43.5%
87.8%
4
State Support Designation(Cat. 4 and 5 schools only)
FOCUS MATH
*If the Non‐High Needs Rate exceeds the ultimate target (75 for Performance Index and 94% for graduation rate), then the ultimate target is displayed and used for gap calculations. **If size of gap exceeds the state mean gap plus one standard deviation, then the gap is an outlier.
Index/Rate1
54.8
49.5
44.1
40.5
43.7
39.2
12.4%
13.2%
83.7%
State AvgIndex/Rate
67.1
82.0%
72.0%
50.5%
48.6% 53.7%
These statistics represent the results from the third year of Connecticut's Next Generation Accountability Model for districts and schools. For detailed information and resources about every indicator including the rationale for its inclusion, the methodology used as well as links to resources, research, and evidence‐based strategies, please consult the document titled Using Accountability Results to Guide Improvement.
This model is the direct result of an extensive consultation process over a two year period. The CSDE sought feedback from district and school leaders, Connecticut educators, state and national experts, CSDE staff, and many others. This model was originally outlined in Connecticut’s flexibility application to the U.S. Department of Education and formally approved by the USED in August 2015 and is now included in Connecticut's state plan for the Every Student Succeeds Act.

Choose a District Choose a School School of Distinction?
East Hartford School District
Robert J. O'Brien School_0431811 No
Choose a District, then Choose a School. To refresh the District List, clear the School name.
No: Indicator TargetPoints Earned
Max Points
% Points Earned
1a. ELA Performance Index – All Students 75 37.8 50 75.6%
1b. ELA Performance Index – High Needs Students 75 36.1 50 72.2%
1c. Math Performance Index – All Students 75 31.8 50 63.6%
1d. Math Performance Index – High Needs Students 75 29.9 50 59.9%
1e. Science Performance Index – All Students 75 28.7 50 57.5%
1f. Science Performance Index – High Needs Students 75 27.1 50 54.3%
2a. ELA Avg. Percentage of Growth Target Achieved – All Students 100 65.6 100 65.6%
2b. ELA Avg. Percentage of Growth Target Achieved – High Needs Students 100 66.3 100 66.3%
2c. Math Avg. Percentage of Growth Target Achieved – All Students 100 56.5 100 56.5%
2d. Math Avg. Percentage of Growth Target Achieved – High Needs Students 100 58.8 100 58.8%
4a. Chronic Absenteeism – All Students <=5% 40.0 50 80.1%
4b. Chronic Absenteeism – High Needs Students <=5% 37.8 50 75.7%
5 Preparation for CCR – % taking courses 75% 0.0 0
6 Preparation for CCR – % passing exams 75% 0.0 0
7 On‐track to High School Graduation 94% 0.0 0
8 4‐year Graduation All Students (2016 Cohort) 94% 0.0 0
9 6‐year Graduation ‐ High Needs Students (2014 Cohort) 94% 0.0 0
10 Postsecondary Entrance (Class of 2016) 75% 0.0 0
11 Physical Fitness (estimated part rate) and (fitness rate) 100.0% 84.1% 75% 50.0 50 100.0% 92.0% 51.6%
12 Arts Access 60% 0.0 0
Accountability Index 566.5 850 66.7%1 Unrounded index/rates are used in calculations. Values rounded to 1 decimal are displayed.
Gap IndicatorsNon‐High Needs Rate
High Needs Rate
Size of Gap
State Gap Mean +1 Stdev**
Is Gap an Outlier?
Participation Rate Rate
Achievement Gap Size Outlier? N ELA – All Students 99.6%
ELA Performance Index Gap 62.9 54.1 8.7 16.6 ELA – High Needs Students 99.4%
Math Performance Index Gap 54.4 44.9 9.5 18.5 Math – All Students 99.2%
Science Performance Index Gap 47.5 40.7 6.8 16.5 Math – High Needs Students 98.8%
Six‐Year Graduation Rate Gap (2014 Cohort) N/A Science – All Students 100.0%
Science – High Needs Students 100.0%0431811
School Category (1‐5)(1 is highest)
87.4%
65.6% 55.4%
66.3% 49.8%
56.5% 61.7%
Grade Range: K ‐ 6
Next Generation Accountability Report: 2016‐17
55.9
62.2
50.5
55.3
45.2
9.9%
15.8%
70.7%
43.5%
87.8%
2
State Support Designation(Cat. 4 and 5 schools only)
*If the Non‐High Needs Rate exceeds the ultimate target (75 for Performance Index and 94% for graduation rate), then the ultimate target is displayed and used for gap calculations. **If size of gap exceeds the state mean gap plus one standard deviation, then the gap is an outlier.
Index/Rate1
56.7
54.1
47.7
44.9
43.1
40.7
10.0%
11.1%
State AvgIndex/Rate
67.1
82.0%
72.0%
50.5%
58.8% 53.7%
These statistics represent the results from the third year of Connecticut's Next Generation Accountability Model for districts and schools. For detailed information and resources about every indicator including the rationale for its inclusion, the methodology used as well as links to resources, research, and evidence‐based strategies, please consult the document titled Using Accountability Results to Guide Improvement.
This model is the direct result of an extensive consultation process over a two year period. The CSDE sought feedback from district and school leaders, Connecticut educators, state and national experts, CSDE staff, and many others. This model was originally outlined in Connecticut’s flexibility application to the U.S. Department of Education and formally approved by the USED in August 2015 and is now included in Connecticut's state plan for the Every Student Succeeds Act.

Choose a District Choose a School School of Distinction?
New Britain School District New Britain High School_0896111 No
Choose a District, then Choose a School. To refresh the District List, clear the School name.
No: Indicator TargetPoints Earned
Max Points
% Points Earned
1a. ELA Performance Index – All Students 75 59.3 100 59.3%
1b. ELA Performance Index – High Needs Students 75 55.5 100 55.5%
1c. Math Performance Index – All Students 75 55.6 100 55.6%
1d. Math Performance Index – High Needs Students 75 52.2 100 52.2%
1e. Science Performance Index – All Students 75 52.9 100 52.9%
1f. Science Performance Index – High Needs Students 75 49.7 100 49.7%
2a. ELA Avg. Percentage of Growth Target Achieved – All Students 100 0.0 0
2b. ELA Avg. Percentage of Growth Target Achieved – High Needs Students 100 0.0 0
2c. Math Avg. Percentage of Growth Target Achieved – All Students 100 0.0 0
2d. Math Avg. Percentage of Growth Target Achieved – High Needs Students 100 0.0 0
4a. Chronic Absenteeism – All Students <=5% 0.0 50 0.0%
4b. Chronic Absenteeism – High Needs Students <=5% 0.0 50 0.0%
5 Preparation for CCR – % taking courses 75% 41.8 50 83.6%
6 Preparation for CCR – % passing exams 75% 10.0 50 19.9%
7 On‐track to High School Graduation 94% 30.7 50 61.5%
8 4‐year Graduation All Students (2016 Cohort) 94% 80.3 100 80.3%
9 6‐year Graduation ‐ High Needs Students (2014 Cohort) 94% 77.1 100 77.1%
10 Postsecondary Entrance (Class of 2016) 75% 69.2 100 69.2%
11 Physical Fitness (estimated part rate) and (fitness rate) 100.0% 38.1% 75% 25.4 50 50.8% 92.0% 51.6%
12 Arts Access 60% 44.2 50 88.5%
Accountability Index 704.0 1250 56.3%1 Unrounded index/rates are used in calculations. Values rounded to 1 decimal are displayed.
Gap IndicatorsNon‐High Needs Rate
High Needs Rate
Size of Gap
State Gap Mean +1 Stdev**
Is Gap an Outlier?
Participation Rate Rate
Achievement Gap Size Outlier? N ELA – All Students 91.0%
ELA Performance Index Gap 55.1 41.6 13.5 16.6 ELA – High Needs Students 90.2%
Math Performance Index Gap 51.2 39.2 12.0 18.5 Math – All Students 91.0%
Science Performance Index Gap 53.5 37.3 16.2 16.5 Math – High Needs Students 90.2%
Six‐Year Graduation Rate Gap (2014 Cohort) 89.0% 72.5% 16.5% 9.3% Y Science – All Students 95.0%
Science – High Needs Students 94.2%0896111
School Category (1‐5)(1 is highest)
75.5% 87.4%
55.4%
49.8%
61.7%
Grade Range: 9 ‐ 12
Next Generation Accountability Report: 2016‐17
55.9
62.2
50.5
55.3
45.2
9.9%
15.8%
70.7%
43.5%
87.8%
5
State Support Designation(Cat. 4 and 5 schools only)
FOCUS SCIENCE
*If the Non‐High Needs Rate exceeds the ultimate target (75 for Performance Index and 94% for graduation rate), then the ultimate target is displayed and used for gap calculations. **If size of gap exceeds the state mean gap plus one standard deviation, then the gap is an outlier.
Index/Rate1
44.4
41.6
41.7
39.2
39.6
37.3
34.0%
36.8%
62.7%
15.0%
57.8%
State AvgIndex/Rate
67.1
82.0%
72.0%
50.5%
53.7%
72.5%
51.9%
53.1%
These statistics represent the results from the third year of Connecticut's Next Generation Accountability Model for districts and schools. For detailed information and resources about every indicator including the rationale for its inclusion, the methodology used as well as links to resources, research, and evidence‐based strategies, please consult the document titled Using Accountability Results to Guide Improvement.
This model is the direct result of an extensive consultation process over a two year period. The CSDE sought feedback from district and school leaders, Connecticut educators, state and national experts, CSDE staff, and many others. This model was originally outlined in Connecticut’s flexibility application to the U.S. Department of Education and formally approved by the USED in August 2015 and is now included in Connecticut's state plan for the Every Student Succeeds Act.

Choose a District Choose a School School of Distinction?
New Haven School District Clinton Avenue School_0930611 No
Choose a District, then Choose a School. To refresh the District List, clear the School name.
No: Indicator TargetPoints Earned
Max Points
% Points Earned
1a. ELA Performance Index – All Students 75 38.3 50 76.6%
1b. ELA Performance Index – High Needs Students 75 38.2 50 76.4%
1c. Math Performance Index – All Students 75 30.9 50 61.9%
1d. Math Performance Index – High Needs Students 75 30.9 50 61.7%
1e. Science Performance Index – All Students 75 29.9 50 59.8%
1f. Science Performance Index – High Needs Students 75 29.7 50 59.5%
2a. ELA Avg. Percentage of Growth Target Achieved – All Students 100 60.3 100 60.3%
2b. ELA Avg. Percentage of Growth Target Achieved – High Needs Students 100 60.0 100 60.0%
2c. Math Avg. Percentage of Growth Target Achieved – All Students 100 39.1 100 39.1%
2d. Math Avg. Percentage of Growth Target Achieved – High Needs Students 100 40.2 100 40.2%
4a. Chronic Absenteeism – All Students <=5% 30.2 50 60.4%
4b. Chronic Absenteeism – High Needs Students <=5% 31.0 50 62.0%
5 Preparation for CCR – % taking courses 75% 0.0 0
6 Preparation for CCR – % passing exams 75% 0.0 0
7 On‐track to High School Graduation 94% 41.5 50 83.0%
8 4‐year Graduation All Students (2016 Cohort) 94% 0.0 0
9 6‐year Graduation ‐ High Needs Students (2014 Cohort) 94% 0.0 0
10 Postsecondary Entrance (Class of 2016) 75% 0.0 0
11 Physical Fitness (estimated part rate) and (fitness rate) 100.0% 32.7% 75% 21.8 50 43.6% 92.0% 51.6%
12 Arts Access 60% 0.0 0
Accountability Index 522.1 900 58.0%1 Unrounded index/rates are used in calculations. Values rounded to 1 decimal are displayed.
Gap IndicatorsNon‐High Needs Rate
High Needs Rate
Size of Gap
State Gap Mean +1 Stdev**
Is Gap an Outlier?
Participation Rate Rate
Achievement Gap Size Outlier? N ELA – All Students 99.7%
ELA Performance Index Gap 59.8 57.3 2.4 16.6 ELA – High Needs Students 99.7%
Math Performance Index Gap 48.1 46.3 1.8 18.5 Math – All Students 99.7%
Science Performance Index Gap 44.6 16.5 Math – High Needs Students 99.7%
Six‐Year Graduation Rate Gap (2014 Cohort) N/A Science – All Students 100.0%
Science – High Needs Students 100.0%0930611
School Category (1‐5)(1 is highest)
87.4%
60.3% 55.4%
60.0% 49.8%
39.1% 61.7%
Grade Range: K ‐ 8
Next Generation Accountability Report: 2016‐17
55.9
62.2
50.5
55.3
45.2
9.9%
15.8%
70.7%
43.5%
87.8%
4
State Support Designation(Cat. 4 and 5 schools only)
FOCUS ELA
*If the Non‐High Needs Rate exceeds the ultimate target (75 for Performance Index and 94% for graduation rate), then the ultimate target is displayed and used for gap calculations. **If size of gap exceeds the state mean gap plus one standard deviation, then the gap is an outlier.
Index/Rate1
57.5
57.3
46.4
46.3
44.9
44.6
14.9%
14.5%
78.0%
State AvgIndex/Rate
67.1
82.0%
72.0%
50.5%
40.2% 53.7%
These statistics represent the results from the third year of Connecticut's Next Generation Accountability Model for districts and schools. For detailed information and resources about every indicator including the rationale for its inclusion, the methodology used as well as links to resources, research, and evidence‐based strategies, please consult the document titled Using Accountability Results to Guide Improvement.
This model is the direct result of an extensive consultation process over a two year period. The CSDE sought feedback from district and school leaders, Connecticut educators, state and national experts, CSDE staff, and many others. This model was originally outlined in Connecticut’s flexibility application to the U.S. Department of Education and formally approved by the USED in August 2015 and is now included in Connecticut's state plan for the Every Student Succeeds Act.
Choose a District Choose a School School of Distinction?
New Haven School District Lincoln‐Bassett School_0932011 No
Choose a District, then Choose a School. To refresh the District List, clear the School name.
No: Indicator TargetPoints Earned
Max Points
% Points Earned
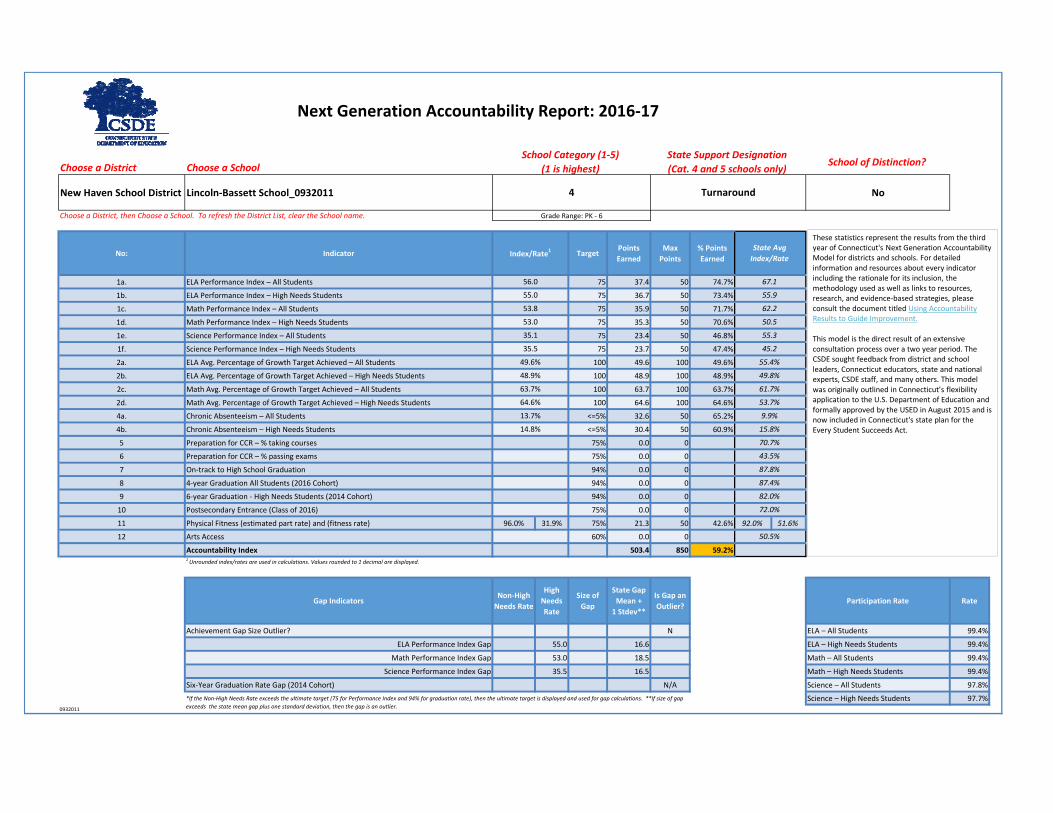
1a. ELA Performance Index – All Students 75 37.4 50 74.7%
1b. ELA Performance Index – High Needs Students 75 36.7 50 73.4%
1c. Math Performance Index – All Students 75 35.9 50 71.7%
1d. Math Performance Index – High Needs Students 75 35.3 50 70.6%
1e. Science Performance Index – All Students 75 23.4 50 46.8%
1f. Science Performance Index – High Needs Students 75 23.7 50 47.4%
2a. ELA Avg. Percentage of Growth Target Achieved – All Students 100 49.6 100 49.6%
2b. ELA Avg. Percentage of Growth Target Achieved – High Needs Students 100 48.9 100 48.9%
2c. Math Avg. Percentage of Growth Target Achieved – All Students 100 63.7 100 63.7%
2d. Math Avg. Percentage of Growth Target Achieved – High Needs Students 100 64.6 100 64.6%
4a. Chronic Absenteeism – All Students <=5% 32.6 50 65.2%
4b. Chronic Absenteeism – High Needs Students <=5% 30.4 50 60.9%
5 Preparation for CCR – % taking courses 75% 0.0 0
6 Preparation for CCR – % passing exams 75% 0.0 0
7 On‐track to High School Graduation 94% 0.0 0
8 4‐year Graduation All Students (2016 Cohort) 94% 0.0 0
9 6‐year Graduation ‐ High Needs Students (2014 Cohort) 94% 0.0 0
10 Postsecondary Entrance (Class of 2016) 75% 0.0 0
11 Physical Fitness (estimated part rate) and (fitness rate) 96.0% 31.9% 75% 21.3 50 42.6% 92.0% 51.6%
12 Arts Access 60% 0.0 0
Accountability Index 503.4 850 59.2%1 Unrounded index/rates are used in calculations. Values rounded to 1 decimal are displayed.
Gap IndicatorsNon‐High Needs Rate
High Needs Rate
Size of Gap
State Gap Mean +1 Stdev**
Is Gap an Outlier?
Participation Rate Rate
Achievement Gap Size Outlier? N ELA – All Students 99.4%
ELA Performance Index Gap 55.0 16.6 ELA – High Needs Students 99.4%
Math Performance Index Gap 53.0 18.5 Math – All Students 99.4%
Science Performance Index Gap 35.5 16.5 Math – High Needs Students 99.4%
Six‐Year Graduation Rate Gap (2014 Cohort) N/A Science – All Students 97.8%
Science – High Needs Students 97.7%0932011
School Category (1‐5)(1 is highest)
87.4%
49.6% 55.4%
48.9% 49.8%
63.7% 61.7%
Grade Range: PK ‐ 6
Next Generation Accountability Report: 2016‐17
55.9
62.2
50.5
55.3
45.2
9.9%
15.8%
70.7%
43.5%
87.8%
4
State Support Designation(Cat. 4 and 5 schools only)
Turnaround
*If the Non‐High Needs Rate exceeds the ultimate target (75 for Performance Index and 94% for graduation rate), then the ultimate target is displayed and used for gap calculations. **If size of gap exceeds the state mean gap plus one standard deviation, then the gap is an outlier.
Index/Rate1
56.0
55.0
53.8
53.0
35.1
35.5
13.7%
14.8%
State AvgIndex/Rate
67.1
82.0%
72.0%
50.5%
64.6% 53.7%
These statistics represent the results from the third year of Connecticut's Next Generation Accountability Model for districts and schools. For detailed information and resources about every indicator including the rationale for its inclusion, the methodology used as well as links to resources, research, and evidence‐based strategies, please consult the document titled Using Accountability Results to Guide Improvement.
This model is the direct result of an extensive consultation process over a two year period. The CSDE sought feedback from district and school leaders, Connecticut educators, state and national experts, CSDE staff, and many others. This model was originally outlined in Connecticut’s flexibility application to the U.S. Department of Education and formally approved by the USED in August 2015 and is now included in Connecticut's state plan for the Every Student Succeeds Act.
Choose a District Choose a School School of Distinction?
New Haven School District Wilbur Cross High School_0936111 No
Choose a District, then Choose a School. To refresh the District List, clear the School name.
No: Indicator TargetPoints Earned
Max Points
% Points Earned
1a. ELA Performance Index – All Students 75 60.2 100 60.2%
1b. ELA Performance Index – High Needs Students 75 55.7 100 55.7%
1c. Math Performance Index – All Students 75 53.7 100 53.7%
1d. Math Performance Index – High Needs Students 75 50.5 100 50.5%
1e. Science Performance Index – All Students 75 57.7 100 57.7%
1f. Science Performance Index – High Needs Students 75 52.3 100 52.3%
2a. ELA Avg. Percentage of Growth Target Achieved – All Students 100 0.0 0
2b. ELA Avg. Percentage of Growth Target Achieved – High Needs Students 100 0.0 0
2c. Math Avg. Percentage of Growth Target Achieved – All Students 100 0.0 0
2d. Math Avg. Percentage of Growth Target Achieved – High Needs Students 100 0.0 0
4a. Chronic Absenteeism – All Students <=5% 0.0 50 0.0%
4b. Chronic Absenteeism – High Needs Students <=5% 0.0 50 0.0%
5 Preparation for CCR – % taking courses 75% 34.8 50 69.7%
6 Preparation for CCR – % passing exams 75% 14.3 50 28.7%
7 On‐track to High School Graduation 94% 47.0 50 93.9%
8 4‐year Graduation All Students (2016 Cohort) 94% 81.9 100 81.9%
9 6‐year Graduation ‐ High Needs Students (2014 Cohort) 94% 73.9 100 73.9%
10 Postsecondary Entrance (Class of 2016) 75% 79.4 100 79.4%
11 Physical Fitness (estimated part rate) and (fitness rate) 52.1% 48.5% 75% 8.1 50 16.2% 92.0% 51.6%
12 Arts Access 60% 46.3 50 92.7%
Accountability Index 715.9 1250 57.3%1 Unrounded index/rates are used in calculations. Values rounded to 1 decimal are displayed.
Gap IndicatorsNon‐High Needs Rate
High Needs Rate
Size of Gap
State Gap Mean +1 Stdev**
Is Gap an Outlier?
Participation Rate Rate
Achievement Gap Size Outlier? Y ELA – All Students 87.7%
ELA Performance Index Gap 58.6 41.8 16.8 16.6 ELA – High Needs Students 86.5%
Math Performance Index Gap 50.1 37.9 12.3 18.5 Math – All Students 87.7%
Science Performance Index Gap 54.2 39.2 14.9 16.5 Math – High Needs Students 86.5%
Six‐Year Graduation Rate Gap (2014 Cohort) 90.0% 69.5% 20.5% 9.3% Y Science – All Students 86.6%
Science – High Needs Students 84.8%0936111
School Category (1‐5)(1 is highest)
77.0% 87.4%
55.4%
49.8%
61.7%
Grade Range: 9 ‐ 12
Next Generation Accountability Report: 2016‐17
55.9
62.2
50.5
55.3
45.2
9.9%
15.8%
70.7%
43.5%
87.8%
5
State Support Designation(Cat. 4 and 5 schools only)
FOCUS ELA
*If the Non‐High Needs Rate exceeds the ultimate target (75 for Performance Index and 94% for graduation rate), then the ultimate target is displayed and used for gap calculations. **If size of gap exceeds the state mean gap plus one standard deviation, then the gap is an outlier.
Index/Rate1
45.1
41.8
40.3
37.9
43.3
39.2
37.4%
40.6%
52.2%
21.5%
88.3%
State AvgIndex/Rate
67.1
82.0%
72.0%
50.5%
53.7%
69.5%
59.6%
55.6%
These statistics represent the results from the third year of Connecticut's Next Generation Accountability Model for districts and schools. For detailed information and resources about every indicator including the rationale for its inclusion, the methodology used as well as links to resources, research, and evidence‐based strategies, please consult the document titled Using Accountability Results to Guide Improvement.
This model is the direct result of an extensive consultation process over a two year period. The CSDE sought feedback from district and school leaders, Connecticut educators, state and national experts, CSDE staff, and many others. This model was originally outlined in Connecticut’s flexibility application to the U.S. Department of Education and formally approved by the USED in August 2015 and is now included in Connecticut's state plan for the Every Student Succeeds Act.

Choose a District Choose a School School of Distinction?
Norwich School District Uncas Network School_1041911 No
Choose a District, then Choose a School. To refresh the District List, clear the School name.
No: Indicator TargetPoints Earned
Max Points
% Points Earned
1a. ELA Performance Index – All Students 75 36.5 50 73.1%
1b. ELA Performance Index – High Needs Students 75 35.8 50 71.6%
1c. Math Performance Index – All Students 75 34.8 50 69.6%
1d. Math Performance Index – High Needs Students 75 33.8 50 67.7%
1e. Science Performance Index – All Students 75 26.2 50 52.3%
1f. Science Performance Index – High Needs Students 75 26.2 50 52.4%
2a. ELA Avg. Percentage of Growth Target Achieved – All Students 100 64.9 100 64.9%
2b. ELA Avg. Percentage of Growth Target Achieved – High Needs Students 100 65.0 100 65.0%
2c. Math Avg. Percentage of Growth Target Achieved – All Students 100 56.7 100 56.7%
2d. Math Avg. Percentage of Growth Target Achieved – High Needs Students 100 55.6 100 55.6%
4a. Chronic Absenteeism – All Students <=5% 44.7 50 89.4%
4b. Chronic Absenteeism – High Needs Students <=5% 44.2 50 88.4%
5 Preparation for CCR – % taking courses 75% 0.0 0
6 Preparation for CCR – % passing exams 75% 0.0 0
7 On‐track to High School Graduation 94% 0.0 0
8 4‐year Graduation All Students (2016 Cohort) 94% 0.0 0
9 6‐year Graduation ‐ High Needs Students (2014 Cohort) 94% 0.0 0
10 Postsecondary Entrance (Class of 2016) 75% 0.0 0
11 Physical Fitness (estimated part rate) and (fitness rate) 100.0% 39.0% 75% 26.0 50 52.0% 92.0% 51.6%
12 Arts Access 60% 0.0 0
Accountability Index 550.4 850 64.8%1 Unrounded index/rates are used in calculations. Values rounded to 1 decimal are displayed.
Gap IndicatorsNon‐High Needs Rate
High Needs Rate
Size of Gap
State Gap Mean +1 Stdev**
Is Gap an Outlier?
Participation Rate Rate
Achievement Gap Size Outlier? N ELA – All Students 100.0%
ELA Performance Index Gap 53.7 16.6 ELA – High Needs Students 100.0%
Math Performance Index Gap 50.8 18.5 Math – All Students 100.0%
Science Performance Index Gap 39.3 16.5 Math – High Needs Students 100.0%
Six‐Year Graduation Rate Gap (2014 Cohort) N/A Science – All Students 100.0%
Science – High Needs Students 100.0%1041911
School Category (1‐5)(1 is highest)
87.4%
64.9% 55.4%
65.0% 49.8%
56.7% 61.7%
Grade Range: K ‐ 5
Next Generation Accountability Report: 2016‐17
55.9
62.2
50.5
55.3
45.2
9.9%
15.8%
70.7%
43.5%
87.8%
2
State Support Designation(Cat. 4 and 5 schools only)
*If the Non‐High Needs Rate exceeds the ultimate target (75 for Performance Index and 94% for graduation rate), then the ultimate target is displayed and used for gap calculations. **If size of gap exceeds the state mean gap plus one standard deviation, then the gap is an outlier.
Index/Rate1
54.8
53.7
52.2
50.8
39.2
39.3
7.7%
7.9%
State AvgIndex/Rate
67.1
82.0%
72.0%
50.5%
55.6% 53.7%
These statistics represent the results from the third year of Connecticut's Next Generation Accountability Model for districts and schools. For detailed information and resources about every indicator including the rationale for its inclusion, the methodology used as well as links to resources, research, and evidence‐based strategies, please consult the document titled Using Accountability Results to Guide Improvement.
This model is the direct result of an extensive consultation process over a two year period. The CSDE sought feedback from district and school leaders, Connecticut educators, state and national experts, CSDE staff, and many others. This model was originally outlined in Connecticut’s flexibility application to the U.S. Department of Education and formally approved by the USED in August 2015 and is now included in Connecticut's state plan for the Every Student Succeeds Act.

Choose a District Choose a School School of Distinction?
Waterbury School District Crosby High School_1516211 No
Choose a District, then Choose a School. To refresh the District List, clear the School name.
No: Indicator TargetPoints Earned
Max Points
% Points Earned
1a. ELA Performance Index – All Students 75 55.3 100 55.3%
1b. ELA Performance Index – High Needs Students 75 54.4 100 54.4%
1c. Math Performance Index – All Students 75 48.9 100 48.9%
1d. Math Performance Index – High Needs Students 75 48.1 100 48.1%
1e. Science Performance Index – All Students 75 45.3 100 45.3%
1f. Science Performance Index – High Needs Students 75 43.2 100 43.2%
2a. ELA Avg. Percentage of Growth Target Achieved – All Students 100 0.0 0
2b. ELA Avg. Percentage of Growth Target Achieved – High Needs Students 100 0.0 0
2c. Math Avg. Percentage of Growth Target Achieved – All Students 100 0.0 0
2d. Math Avg. Percentage of Growth Target Achieved – High Needs Students 100 0.0 0
4a. Chronic Absenteeism – All Students <=5% 0.0 50 0.0%
4b. Chronic Absenteeism – High Needs Students <=5% 0.0 50 0.0%
5 Preparation for CCR – % taking courses 75% 45.5 50 91.0%
6 Preparation for CCR – % passing exams 75% 6.4 50 12.7%
7 On‐track to High School Graduation 94% 35.3 50 70.7%
8 4‐year Graduation All Students (2016 Cohort) 94% 78.8 100 78.8%
9 6‐year Graduation ‐ High Needs Students (2014 Cohort) 94% 79.5 100 79.5%
10 Postsecondary Entrance (Class of 2016) 75% 74.8 100 74.8%
11 Physical Fitness (estimated part rate) and (fitness rate) 8.0% 68.2% 75% 0.0 50 0.0% 92.0% 51.6%
12 Arts Access 60% 25.4 50 50.8%
Accountability Index 640.9 1250 51.3%1 Unrounded index/rates are used in calculations. Values rounded to 1 decimal are displayed.
Gap IndicatorsNon‐High Needs Rate
High Needs Rate
Size of Gap
State Gap Mean +1 Stdev**
Is Gap an Outlier?
Participation Rate Rate
Achievement Gap Size Outlier? N ELA – All Students 95.9%
ELA Performance Index Gap 44.5 40.8 3.7 16.6 ELA – High Needs Students 95.4%
Math Performance Index Gap 39.2 36.1 3.2 18.5 Math – All Students 95.9%
Science Performance Index Gap 41.9 32.4 9.5 16.5 Math – High Needs Students 95.4%
Six‐Year Graduation Rate Gap (2014 Cohort) 81.0% 74.7% 6.2% 9.3% N Science – All Students 98.2%
Science – High Needs Students 98.3%1516211
School Category (1‐5)(1 is highest)
74.1% 87.4%
55.4%
49.8%
61.7%
Grade Range: 9 ‐ 12
Next Generation Accountability Report: 2016‐17
55.9
62.2
50.5
55.3
45.2
9.9%
15.8%
70.7%
43.5%
87.8%
4
State Support Designation(Cat. 4 and 5 schools only)
Turnaround
*If the Non‐High Needs Rate exceeds the ultimate target (75 for Performance Index and 94% for graduation rate), then the ultimate target is displayed and used for gap calculations. **If size of gap exceeds the state mean gap plus one standard deviation, then the gap is an outlier.
Index/Rate1
41.5
40.8
36.6
36.1
33.9
32.4
30.6%
32.2%
68.3%
9.6%
66.4%
State AvgIndex/Rate
67.1
82.0%
72.0%
50.5%
53.7%
74.7%
56.1%
30.5%
These statistics represent the results from the third year of Connecticut's Next Generation Accountability Model for districts and schools. For detailed information and resources about every indicator including the rationale for its inclusion, the methodology used as well as links to resources, research, and evidence‐based strategies, please consult the document titled Using Accountability Results to Guide Improvement.
This model is the direct result of an extensive consultation process over a two year period. The CSDE sought feedback from district and school leaders, Connecticut educators, state and national experts, CSDE staff, and many others. This model was originally outlined in Connecticut’s flexibility application to the U.S. Department of Education and formally approved by the USED in August 2015 and is now included in Connecticut's state plan for the Every Student Succeeds Act.

Choose a District Choose a School School of Distinction?
Waterbury School District Walsh School_1512211 No
Choose a District, then Choose a School. To refresh the District List, clear the School name.
No: Indicator TargetPoints Earned
Max Points
% Points Earned
1a. ELA Performance Index – All Students 75 33.6 50 67.3%
1b. ELA Performance Index – High Needs Students 75 33.3 50 66.7%
1c. Math Performance Index – All Students 75 32.2 50 64.4%
1d. Math Performance Index – High Needs Students 75 31.8 50 63.6%
1e. Science Performance Index – All Students 75 26.8 50 53.5%
1f. Science Performance Index – High Needs Students 75 26.2 50 52.5%
2a. ELA Avg. Percentage of Growth Target Achieved – All Students 100 37.3 100 37.3%
2b. ELA Avg. Percentage of Growth Target Achieved – High Needs Students 100 37.0 100 37.0%
2c. Math Avg. Percentage of Growth Target Achieved – All Students 100 61.2 100 61.2%
2d. Math Avg. Percentage of Growth Target Achieved – High Needs Students 100 59.3 100 59.3%
4a. Chronic Absenteeism – All Students <=5% 34.7 50 69.5%
4b. Chronic Absenteeism – High Needs Students <=5% 34.4 50 68.8%
5 Preparation for CCR – % taking courses 75% 0.0 0
6 Preparation for CCR – % passing exams 75% 0.0 0
7 On‐track to High School Graduation 94% 0.0 0
8 4‐year Graduation All Students (2016 Cohort) 94% 0.0 0
9 6‐year Graduation ‐ High Needs Students (2014 Cohort) 94% 0.0 0
10 Postsecondary Entrance (Class of 2016) 75% 0.0 0
11 Physical Fitness (estimated part rate) and (fitness rate) 100.0% 67.2% 75% 44.8 50 89.6% 92.0% 51.6%
12 Arts Access 60% 0.0 0
Accountability Index 492.7 850 58.0%1 Unrounded index/rates are used in calculations. Values rounded to 1 decimal are displayed.
Gap IndicatorsNon‐High Needs Rate
High Needs Rate
Size of Gap
State Gap Mean +1 Stdev**
Is Gap an Outlier?
Participation Rate Rate
Achievement Gap Size Outlier? N ELA – All Students 100.0%
ELA Performance Index Gap 50.0 16.6 ELA – High Needs Students 100.0%
Math Performance Index Gap 47.7 18.5 Math – All Students 100.0%
Science Performance Index Gap 39.4 16.5 Math – High Needs Students 100.0%
Six‐Year Graduation Rate Gap (2014 Cohort) N/A Science – All Students 100.0%
Science – High Needs Students 100.0%1512211
School Category (1‐5)(1 is highest)
87.4%
37.3% 55.4%
37.0% 49.8%
61.2% 61.7%
Grade Range: PK ‐ 5
Next Generation Accountability Report: 2016‐17
55.9
62.2
50.5
55.3
45.2
9.9%
15.8%
70.7%
43.5%
87.8%
5
State Support Designation(Cat. 4 and 5 schools only)
FOCUS ELA
*If the Non‐High Needs Rate exceeds the ultimate target (75 for Performance Index and 94% for graduation rate), then the ultimate target is displayed and used for gap calculations. **If size of gap exceeds the state mean gap plus one standard deviation, then the gap is an outlier.
Index/Rate1
50.5
50.0
48.3
47.7
40.2
39.4
12.6%
12.8%
State AvgIndex/Rate
67.1
82.0%
72.0%
50.5%
59.3% 53.7%
These statistics represent the results from the third year of Connecticut's Next Generation Accountability Model for districts and schools. For detailed information and resources about every indicator including the rationale for its inclusion, the methodology used as well as links to resources, research, and evidence‐based strategies, please consult the document titled Using Accountability Results to Guide Improvement.
This model is the direct result of an extensive consultation process over a two year period. The CSDE sought feedback from district and school leaders, Connecticut educators, state and national experts, CSDE staff, and many others. This model was originally outlined in Connecticut’s flexibility application to the U.S. Department of Education and formally approved by the USED in August 2015 and is now included in Connecticut's state plan for the Every Student Succeeds Act.

Choose a District Choose a School School of Distinction?
Winchester School District Batcheller Early Education Center_1620411 No
Choose a District, then Choose a School. To refresh the District List, clear the School name.
No: Indicator TargetPoints Earned
Max Points
% Points Earned
1a. ELA Performance Index – All Students 75 0.0 0
1b. ELA Performance Index – High Needs Students 75 0.0 0
1c. Math Performance Index – All Students 75 0.0 0
1d. Math Performance Index – High Needs Students 75 0.0 0
1e. Science Performance Index – All Students 75 0.0 0
1f. Science Performance Index – High Needs Students 75 0.0 0
2a. ELA Avg. Percentage of Growth Target Achieved – All Students 100 0.0 0
2b. ELA Avg. Percentage of Growth Target Achieved – High Needs Students 100 0.0 0
2c. Math Avg. Percentage of Growth Target Achieved – All Students 100 0.0 0
2d. Math Avg. Percentage of Growth Target Achieved – High Needs Students 100 0.0 0
4a. Chronic Absenteeism – All Students <=5% 46.4 50 92.8%
4b. Chronic Absenteeism – High Needs Students <=5% 42.4 50 84.7%
5 Preparation for CCR – % taking courses 75% 0.0 0
6 Preparation for CCR – % passing exams 75% 0.0 0
7 On‐track to High School Graduation 94% 0.0 0
8 4‐year Graduation All Students (2016 Cohort) 94% 0.0 0
9 6‐year Graduation ‐ High Needs Students (2014 Cohort) 94% 0.0 0
10 Postsecondary Entrance (Class of 2016) 75% 0.0 0
11 Physical Fitness (estimated part rate) and (fitness rate) 75% 0.0 0 92.0% 51.6%
12 Arts Access 60% 0.0 0
Accountability Index 88.8 100 88.8%1 Unrounded index/rates are used in calculations. Values rounded to 1 decimal are displayed.
Gap IndicatorsNon‐High Needs Rate
High Needs Rate
Size of Gap
State Gap Mean +1 Stdev**
Is Gap an Outlier?
Participation Rate Rate
Achievement Gap Size Outlier? N ELA – All Students N/A
ELA Performance Index Gap 0.0 ELA – High Needs Students N/A
Math Performance Index Gap 0.0 Math – All Students N/A
Science Performance Index Gap 0.0 Math – High Needs Students N/A
Six‐Year Graduation Rate Gap (2014 Cohort) N/A Science – All Students N/A
Science – High Needs Students N/A1620411
School Category (1‐5)(1 is highest)
87.4%
55.4%
49.8%
61.7%
Grade Range: PK ‐ 2
Next Generation Accountability Report: 2016‐17
55.9
62.2
50.5
55.3
45.2
9.9%
15.8%
70.7%
43.5%
87.8%
N/A
State Support Designation(Cat. 4 and 5 schools only)
*If the Non‐High Needs Rate exceeds the ultimate target (75 for Performance Index and 94% for graduation rate), then the ultimate target is displayed and used for gap calculations. **If size of gap exceeds the state mean gap plus one standard deviation, then the gap is an outlier.
Index/Rate1
6.8%
8.8%
State AvgIndex/Rate
67.1
82.0%
72.0%
50.5%
53.7%
These statistics represent the results from the third year of Connecticut's Next Generation Accountability Model for districts and schools. For detailed information and resources about every indicator including the rationale for its inclusion, the methodology used as well as links to resources, research, and evidence‐based strategies, please consult the document titled Using Accountability Results to Guide Improvement.
This model is the direct result of an extensive consultation process over a two year period. The CSDE sought feedback from district and school leaders, Connecticut educators, state and national experts, CSDE staff, and many others. This model was originally outlined in Connecticut’s flexibility application to the U.S. Department of Education and formally approved by the USED in August 2015 and is now included in Connecticut's state plan for the Every Student Succeeds Act.

Choose a District Choose a School School of Distinction?
Winchester School District Pearson Middle School_1625111 No
Choose a District, then Choose a School. To refresh the District List, clear the School name.
No: Indicator TargetPoints Earned
Max Points
% Points Earned
1a. ELA Performance Index – All Students 75 42.5 50 85.0%
1b. ELA Performance Index – High Needs Students 75 39.3 50 78.6%
1c. Math Performance Index – All Students 75 38.5 50 77.1%
1d. Math Performance Index – High Needs Students 75 35.7 50 71.4%
1e. Science Performance Index – All Students 75 36.9 50 73.7%
1f. Science Performance Index – High Needs Students 75 32.5 50 64.9%
2a. ELA Avg. Percentage of Growth Target Achieved – All Students 100 56.2 100 56.2%
2b. ELA Avg. Percentage of Growth Target Achieved – High Needs Students 100 49.4 100 49.4%
2c. Math Avg. Percentage of Growth Target Achieved – All Students 100 54.9 100 54.9%
2d. Math Avg. Percentage of Growth Target Achieved – High Needs Students 100 46.4 100 46.4%
4a. Chronic Absenteeism – All Students <=5% 50.0 50 100.0%
4b. Chronic Absenteeism – High Needs Students <=5% 46.5 50 92.9%
5 Preparation for CCR – % taking courses 75% 0.0 0
6 Preparation for CCR – % passing exams 75% 0.0 0
7 On‐track to High School Graduation 94% 0.0 0
8 4‐year Graduation All Students (2016 Cohort) 94% 0.0 0
9 6‐year Graduation ‐ High Needs Students (2014 Cohort) 94% 0.0 0
10 Postsecondary Entrance (Class of 2016) 75% 0.0 0
11 Physical Fitness (estimated part rate) and (fitness rate) 98.8% 39.6% 75% 26.4 50 52.9% 92.0% 51.6%
12 Arts Access 60% 0.0 0
Accountability Index 555.1 850 65.3%1 Unrounded index/rates are used in calculations. Values rounded to 1 decimal are displayed.
Gap IndicatorsNon‐High Needs Rate
High Needs Rate
Size of Gap
State Gap Mean +1 Stdev**
Is Gap an Outlier?
Participation Rate Rate
Achievement Gap Size Outlier? N ELA – All Students 99.4%
ELA Performance Index Gap 71.1 59.0 12.1 16.6 ELA – High Needs Students 99.0%
Math Performance Index Gap 64.4 53.5 10.8 18.5 Math – All Students 99.1%
Science Performance Index Gap 64.1 48.7 15.4 16.5 Math – High Needs Students 99.0%
Six‐Year Graduation Rate Gap (2014 Cohort) N/A Science – All Students 100.0%
Science – High Needs Students 100.0%1625111
School Category (1‐5)(1 is highest)
87.4%
56.2% 55.4%
49.4% 49.8%
54.9% 61.7%
Grade Range: 3 ‐ 6
Next Generation Accountability Report: 2016‐17
55.9
62.2
50.5
55.3
45.2
9.9%
15.8%
70.7%
43.5%
87.8%
2
State Support Designation(Cat. 4 and 5 schools only)
*If the Non‐High Needs Rate exceeds the ultimate target (75 for Performance Index and 94% for graduation rate), then the ultimate target is displayed and used for gap calculations. **If size of gap exceeds the state mean gap plus one standard deviation, then the gap is an outlier.
Index/Rate1
63.8
59.0
57.8
53.5
55.3
48.7
4.8%
6.8%
State AvgIndex/Rate
67.1
82.0%
72.0%
50.5%
46.4% 53.7%
These statistics represent the results from the third year of Connecticut's Next Generation Accountability Model for districts and schools. For detailed information and resources about every indicator including the rationale for its inclusion, the methodology used as well as links to resources, research, and evidence‐based strategies, please consult the document titled Using Accountability Results to Guide Improvement.
This model is the direct result of an extensive consultation process over a two year period. The CSDE sought feedback from district and school leaders, Connecticut educators, state and national experts, CSDE staff, and many others. This model was originally outlined in Connecticut’s flexibility application to the U.S. Department of Education and formally approved by the USED in August 2015 and is now included in Connecticut's state plan for the Every Student Succeeds Act.

Choose a District Choose a School School of Distinction?
Windham School District Windham Middle School_1635111 No
Choose a District, then Choose a School. To refresh the District List, clear the School name.
No: Indicator TargetPoints Earned
Max Points
% Points Earned
1a. ELA Performance Index – All Students 75 36.3 50 72.6%
1b. ELA Performance Index – High Needs Students 75 34.7 50 69.4%
1c. Math Performance Index – All Students 75 30.4 50 60.9%
1d. Math Performance Index – High Needs Students 75 28.9 50 57.8%
1e. Science Performance Index – All Students 75 26.9 50 53.9%
1f. Science Performance Index – High Needs Students 75 25.8 50 51.6%
2a. ELA Avg. Percentage of Growth Target Achieved – All Students 100 46.4 100 46.4%
2b. ELA Avg. Percentage of Growth Target Achieved – High Needs Students 100 45.4 100 45.4%
2c. Math Avg. Percentage of Growth Target Achieved – All Students 100 40.7 100 40.7%
2d. Math Avg. Percentage of Growth Target Achieved – High Needs Students 100 38.0 100 38.0%
4a. Chronic Absenteeism – All Students <=5% 29.9 50 59.8%
4b. Chronic Absenteeism – High Needs Students <=5% 27.0 50 54.0%
5 Preparation for CCR – % taking courses 75% 0.0 0
6 Preparation for CCR – % passing exams 75% 0.0 0
7 On‐track to High School Graduation 94% 45.2 50 90.5%
8 4‐year Graduation All Students (2016 Cohort) 94% 0.0 0
9 6‐year Graduation ‐ High Needs Students (2014 Cohort) 94% 0.0 0
10 Postsecondary Entrance (Class of 2016) 75% 0.0 0
11 Physical Fitness (estimated part rate) and (fitness rate) 90.3% 38.0% 75% 25.3 50 50.7% 92.0% 51.6%
12 Arts Access 60% 0.0 0
Accountability Index 481.0 900 53.4%1 Unrounded index/rates are used in calculations. Values rounded to 1 decimal are displayed.
Gap IndicatorsNon‐High Needs Rate
High Needs Rate
Size of Gap
State Gap Mean +1 Stdev**
Is Gap an Outlier?
Participation Rate Rate
Achievement Gap Size Outlier? Y ELA – All Students 99.5%
ELA Performance Index Gap 74.7 52.1 22.6 16.6 ELA – High Needs Students 99.4%
Math Performance Index Gap 65.4 43.3 22.1 18.5 Math – All Students 99.1%
Science Performance Index Gap 52.9 38.7 14.3 16.5 Math – High Needs Students 99.0%
Six‐Year Graduation Rate Gap (2014 Cohort) N/A Science – All Students 99.4%
Science – High Needs Students 99.4%1635111
School Category (1‐5)(1 is highest)
87.4%
46.4% 55.4%
45.4% 49.8%
40.7% 61.7%
Grade Range: 6 ‐ 8
Next Generation Accountability Report: 2016‐17
55.9
62.2
50.5
55.3
45.2
9.9%
15.8%
70.7%
43.5%
87.8%
4
State Support Designation(Cat. 4 and 5 schools only)
FOCUS ELA
*If the Non‐High Needs Rate exceeds the ultimate target (75 for Performance Index and 94% for graduation rate), then the ultimate target is displayed and used for gap calculations. **If size of gap exceeds the state mean gap plus one standard deviation, then the gap is an outlier.
Index/Rate1
54.5
52.1
45.7
43.3
40.4
38.7
15.0%
16.5%
85.0%
State AvgIndex/Rate
67.1
82.0%
72.0%
50.5%
38.0% 53.7%
These statistics represent the results from the third year of Connecticut's Next Generation Accountability Model for districts and schools. For detailed information and resources about every indicator including the rationale for its inclusion, the methodology used as well as links to resources, research, and evidence‐based strategies, please consult the document titled Using Accountability Results to Guide Improvement.
This model is the direct result of an extensive consultation process over a two year period. The CSDE sought feedback from district and school leaders, Connecticut educators, state and national experts, CSDE staff, and many others. This model was originally outlined in Connecticut’s flexibility application to the U.S. Department of Education and formally approved by the USED in August 2015 and is now included in Connecticut's state plan for the Every Student Succeeds Act.

PRIORITIES
COLUMBUS SCHOOL GRADES PK-8
COHORT V — ENTERED NETWORK FALL 2016
Bridgeport Public Schools
SUCCESS
Since entering the Commissioner’s Network in 2016, Columbus School has been focusing on building a strong School Culture and Climate by designing and implementing a uniform Positive Behavioral Interventions and Support (PBIS) structure, including consistent language and expectations schoolwide. Teachers are participating in professional learning communities, on-site training, and embedded coaching opportunities with literacy partners Hill for Literacy, Literacy How, and Fairfield University, to implement the Connecticut K-3 Literacy Initiative.
COMMISSIONER’S NETWORK FUNDING
Talent
Talent
Provide professional learning opportunities bi-monthly through on-site training and embedded coaching.
Provide academic interventionist to provide tiered support for students.
Academics Implement a cross-curricular literacy program redesigning Tier I instruction.
Develop a leveled book room in order to provide students with more time reading just right books in small group settings.
Climate/Culture
Design and implement a uniform PBIS framework supported by Cooperative Education Services (CES) and RULER, providing the Columbus community with a common vision of expectations and practice.
Develop and implement after-school clubs integrating hands-on opportunities embedding engineering, mentorship, graphic design, and social opportunities.
Operations
Embed a blended learning environment for students to support the strengthening of Tier I instruction.
Year 1 Year 2
$850,000 $680,000
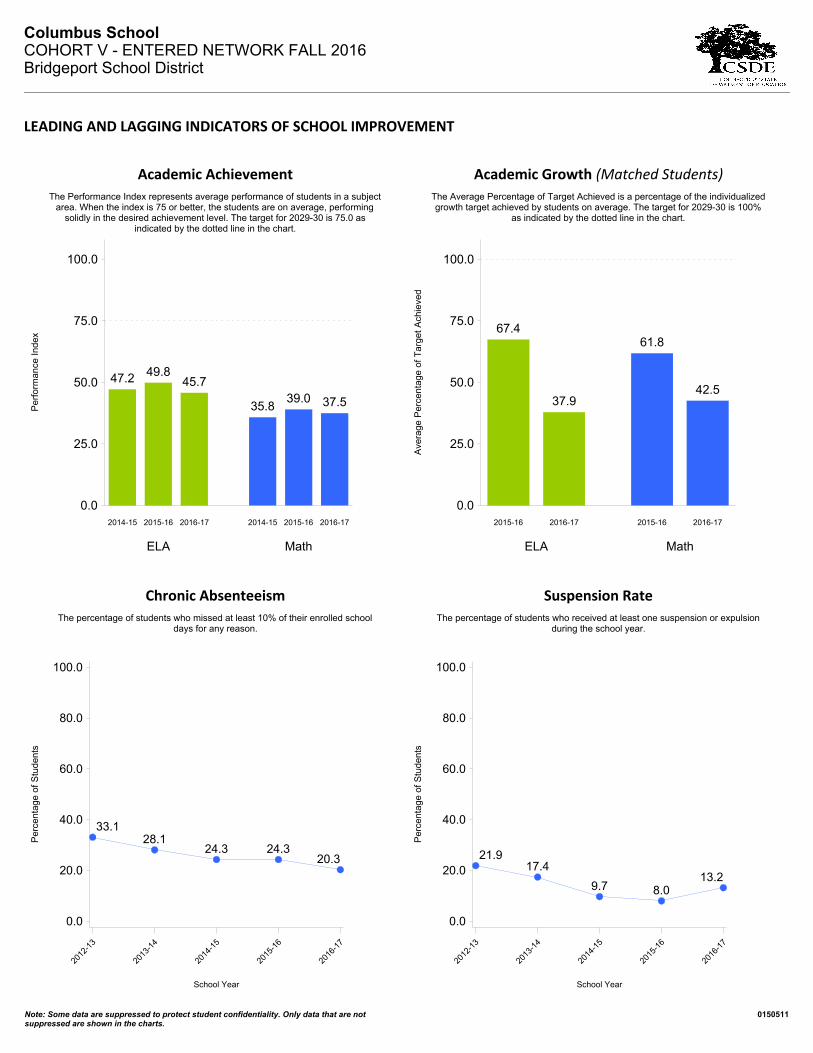
Note: Some data are suppressed to protect student confidentiality. Only data that are notsuppressed are shown in the charts.
0150511
Columbus SchoolCOHORT V - ENTERED NETWORK FALL 2016Bridgeport School District
LEADING AND LAGGING INDICATORS OF SCHOOL IMPROVEMENT
Academic Achievement
The Performance Index represents average performance of students in a subjectarea. When the index is 75 or better, the students are on average, performing
solidly in the desired achievement level. The target for 2029-30 is 75.0 asindicated by the dotted line in the chart.
47.2 49.845.7
35.839.0 37.5
Per
form
ance
Ind
ex
0.0
25.0
50.0
75.0
100.0
ELA Math
2014-15 2015-16 2016-17 2014-15 2015-16 2016-17
Academic Growth (Matched Students)
The Average Percentage of Target Achieved is a percentage of the individualizedgrowth target achieved by students on average. The target for 2029-30 is 100%
as indicated by the dotted line in the chart.
67.4
37.9
61.8
42.5
Ave
rage
Per
cent
age
of T
arge
t A
chie
ved
0.0
25.0
50.0
75.0
100.0
ELA Math
2015-16 2016-17 2015-16 2016-17
Chronic Absenteeism
The percentage of students who missed at least 10% of their enrolled schooldays for any reason.
Per
cent
age
of S
tude
nts
0.0
20.0
40.0
60.0
80.0
100.0
School Year
2012
-13
2013
-14
2014
-15
2015
-16
2016
-17
33.128.1
24.3 24.320.3
Suspension Rate
The percentage of students who received at least one suspension or expulsionduring the school year.
Per
cent
age
of S
tude
nts
0.0
20.0
40.0
60.0
80.0
100.0
School Year
2012
-13
2013
-14
2014
-15
2015
-16
2016
-17
21.917.4
9.7 8.013.2

PAUL LAURENCE DUNBAR SCHOOL GRADES PK-8
COHORT II— ENTERED NETWORK FALL 2013
Bridgeport Public Schools
SUCCESS Paul Laurence Dunbar’s focus on the implementation of Positive Behavioral Interventions and Supports, as well as strengthening effective classroom management strategies, has resulted in a decrease in suspensions. The attention to improved school culture and climate has contributed to a positive rapport among teachers and students, a reduction in office referrals, and a decrease in chronic absenteeism.
COMMISSIONER’S NETWORK FUNDING
PRIORITIES
Analyze assessment data to identify student learning needs and plan
interventions. Strengthen the Literacy Core Instructional Block through continued
implementation of Readers and Writers Workshop.
N/A
Improve teacher effectiveness through professional learning and coaching
focused exclusively on literacy and math instruction.
N/A
Talent
Academics
Operations
Climate/Culture
Year 1 Year 2 Year 3 Year 4 Year 5
$1,289,999 $1,249,308 $500,000 $230,000 $110,000

Note: Some data are suppressed to protect student confidentiality. Only data that are notsuppressed are shown in the charts.
0154111
Paul Laurence Dunbar SchoolCOHORT II - ENTERED NETWORK FALL 2013Bridgeport School District
LEADING AND LAGGING INDICATORS OF SCHOOL IMPROVEMENT
Academic Achievement
The Performance Index represents average performance of students in a subjectarea. When the index is 75 or better, the students are on average, performing
solidly in the desired achievement level. The target for 2029-30 is 75.0 asindicated by the dotted line in the chart.
51.146.1
41.7 40.235.5 35.6P
erfo
rman
ce I
ndex
0.0
25.0
50.0
75.0
100.0
ELA Math
2014-15 2015-16 2016-17 2014-15 2015-16 2016-17
Academic Growth (Matched Students)
The Average Percentage of Target Achieved is a percentage of the individualizedgrowth target achieved by students on average. The target for 2029-30 is 100%
as indicated by the dotted line in the chart.
36.8 36.3
26.5
42.3
Ave
rage
Per
cent
age
of T
arge
t A
chie
ved
0.0
25.0
50.0
75.0
100.0
ELA Math
2015-16 2016-17 2015-16 2016-17
Chronic Absenteeism
The percentage of students who missed at least 10% of their enrolled schooldays for any reason.
Per
cent
age
of S
tude
nts
0.0
20.0
40.0
60.0
80.0
100.0
School Year
2012
-13
2013
-14
2014
-15
2015
-16
2016
-17
25.430.4 28.7 26.6
21.9
Suspension Rate
The percentage of students who received at least one suspension or expulsionduring the school year.
Per
cent
age
of S
tude
nts
0.0
20.0
40.0
60.0
80.0
100.0
School Year
2012
-13
2013
-14
2014
-15
2015
-16
2016
-17
33.4 32.3
23.3
16.1 14.6
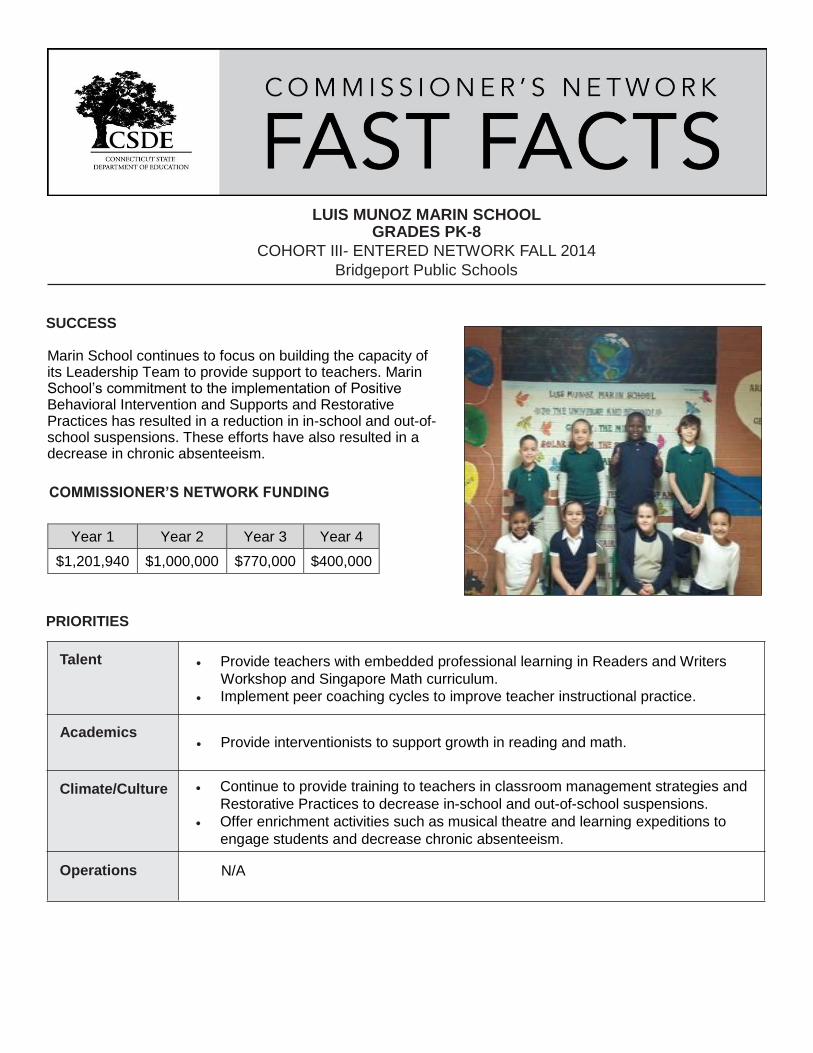
SUCCESS Marin School continues to focus on building the capacity of its Leadership Team to provide support to teachers. Marin School’s commitment to the implementation of Positive Behavioral Intervention and Supports and Restorative Practices has resulted in a reduction in in-school and out-of-school suspensions. These efforts have also resulted in a decrease in chronic absenteeism.
COMMISSIONER’S NETWORK FUNDING
PRIORITIES
Talent
Provide teachers with embedded professional learning in Readers and Writers
Workshop and Singapore Math curriculum.
Implement peer coaching cycles to improve teacher instructional practice.
Academics
Provide interventionists to support growth in reading and math.
Climate/Culture
Continue to provide training to teachers in classroom management strategies and
Restorative Practices to decrease in-school and out-of-school suspensions.
Offer enrichment activities such as musical theatre and learning expeditions to
engage students and decrease chronic absenteeism.
Operations
N/A
LUIS MUNOZ MARIN SCHOOL GRADES PK-8
COHORT III- ENTERED NETWORK FALL 2014
Bridgeport Public Schools
Year 1 Year 2 Year 3 Year 4
$1,201,940 $1,000,000 $770,000 $400,000

Note: Some data are suppressed to protect student confidentiality. Only data that are notsuppressed are shown in the charts.
0151011
Luis Munoz Marin SchoolCOHORT III - ENTERED NETWORK FALL 2014Bridgeport School District
LEADING AND LAGGING INDICATORS OF SCHOOL IMPROVEMENT
Academic Achievement
The Performance Index represents average performance of students in a subjectarea. When the index is 75 or better, the students are on average, performing
solidly in the desired achievement level. The target for 2029-30 is 75.0 asindicated by the dotted line in the chart.
39.1 38.5 40.2
30.1 30.634.4P
erfo
rman
ce I
ndex
0.0
25.0
50.0
75.0
100.0
ELA Math
2014-15 2015-16 2016-17 2014-15 2015-16 2016-17
Academic Growth (Matched Students)
The Average Percentage of Target Achieved is a percentage of the individualizedgrowth target achieved by students on average. The target for 2029-30 is 100%
as indicated by the dotted line in the chart.
49.8 51.647.8
52.0
Ave
rage
Per
cent
age
of T
arge
t A
chie
ved
0.0
25.0
50.0
75.0
100.0
ELA Math
2015-16 2016-17 2015-16 2016-17
Chronic Absenteeism
The percentage of students who missed at least 10% of their enrolled schooldays for any reason.
Per
cent
age
of S
tude
nts
0.0
20.0
40.0
60.0
80.0
100.0
School Year
2012
-13
2013
-14
2014
-15
2015
-16
2016
-17
29.2 27.2 25.8 24.5 22.2
Suspension Rate
The percentage of students who received at least one suspension or expulsionduring the school year.
Per
cent
age
of S
tude
nts
0.0
20.0
40.0
60.0
80.0
100.0
School Year
2012
-13
2013
-14
2014
-15
2015
-16
2016
-17
12.5 10.016.2
13.07.8
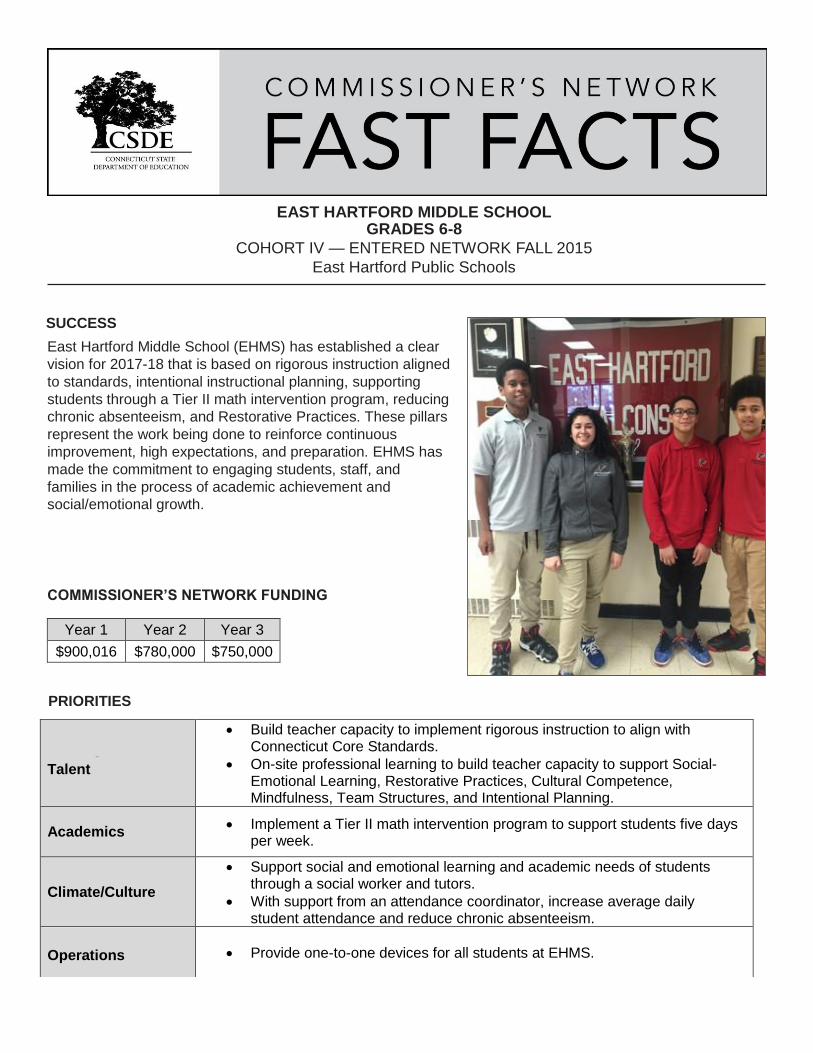
EAST HARTFORD MIDDLE SCHOOL GRADES 6-8
COHORT IV — ENTERED NETWORK FALL 2015
East Hartford Public Schools
SUCCESS
East Hartford Middle School (EHMS) has established a clear
vision for 2017-18 that is based on rigorous instruction aligned
to standards, intentional instructional planning, supporting
students through a Tier II math intervention program, reducing
chronic absenteeism, and Restorative Practices. These pillars
represent the work being done to reinforce continuous
improvement, high expectations, and preparation. EHMS has
made the commitment to engaging students, staff, and
families in the process of academic achievement and
social/emotional growth.
COMMISSIONER’S NETWORK FUNDING
PRIORITIES
Talent
Talent
Build teacher capacity to implement rigorous instruction to align with Connecticut Core Standards.
On-site professional learning to build teacher capacity to support Social-Emotional Learning, Restorative Practices, Cultural Competence, Mindfulness, Team Structures, and Intentional Planning.
Academics Implement a Tier II math intervention program to support students five days
per week.
Climate/Culture
Support social and emotional learning and academic needs of students through a social worker and tutors.
With support from an attendance coordinator, increase average daily student attendance and reduce chronic absenteeism.
Operations Provide one-to-one devices for all students at EHMS.
Year 1 Year 2 Year 3
$900,016 $780,000 $750,000

Note: Some data are suppressed to protect student confidentiality. Only data that are notsuppressed are shown in the charts.
0435111
East Hartford Middle SchoolCOHORT IV - ENTERED NETWORK FALL 2015East Hartford School District
LEADING AND LAGGING INDICATORS OF SCHOOL IMPROVEMENT
Academic Achievement
The Performance Index represents average performance of students in a subjectarea. When the index is 75 or better, the students are on average, performing
solidly in the desired achievement level. The target for 2029-30 is 75.0 asindicated by the dotted line in the chart.
54.1 54.5 54.8
43.5 44.7 44.1
Per
form
ance
Ind
ex
0.0
25.0
50.0
75.0
100.0
ELA Math
2014-15 2015-16 2016-17 2014-15 2015-16 2016-17
Academic Growth (Matched Students)
The Average Percentage of Target Achieved is a percentage of the individualizedgrowth target achieved by students on average. The target for 2029-30 is 100%
as indicated by the dotted line in the chart.
52.949.5 47.0 47.8
Ave
rage
Per
cent
age
of T
arge
t A
chie
ved
0.0
25.0
50.0
75.0
100.0
ELA Math
2015-16 2016-17 2015-16 2016-17
Chronic Absenteeism
The percentage of students who missed at least 10% of their enrolled schooldays for any reason.
Per
cent
age
of S
tude
nts
0.0
20.0
40.0
60.0
80.0
100.0
School Year
2012
-13
2013
-14
2014
-15
2015
-16
2016
-17
32.2
15.411.9 9.5
12.4
Suspension Rate
The percentage of students who received at least one suspension or expulsionduring the school year.
Per
cent
age
of S
tude
nts
0.0
20.0
40.0
60.0
80.0
100.0
School Year
2012
-13
2013
-14
2014
-15
2015
-16
2016
-17
30.526.8
23.118.6 20.5
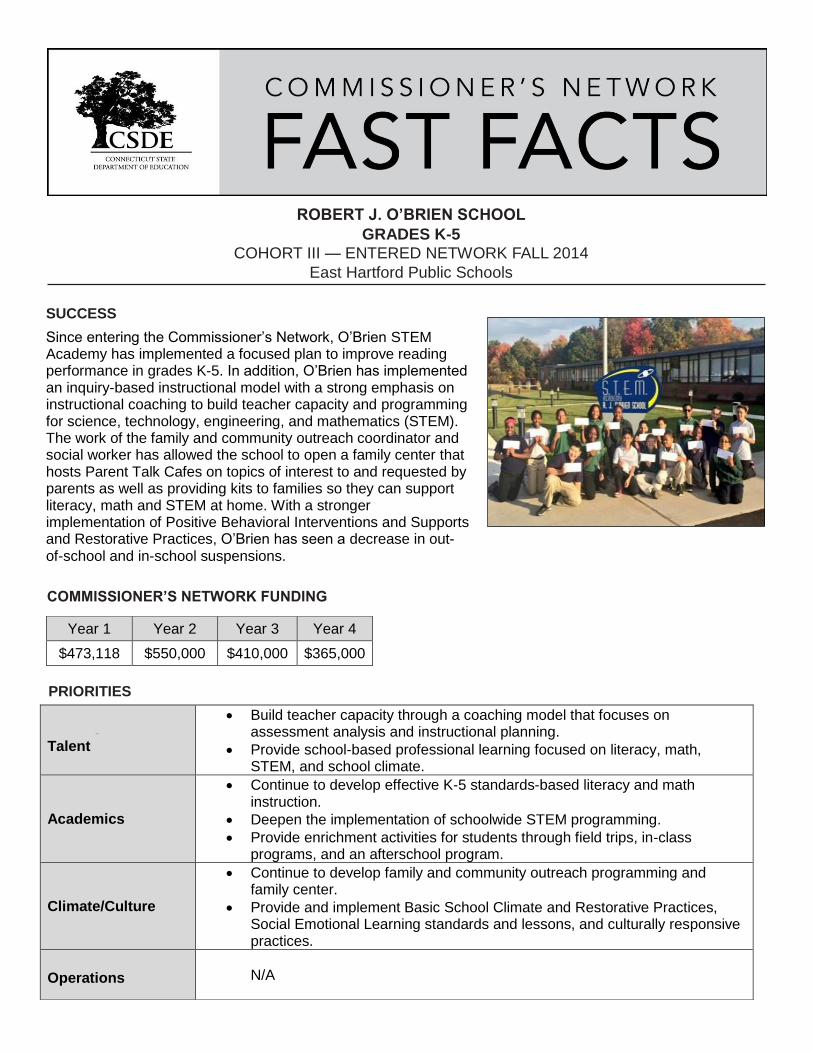
ROBERT J. O’BRIEN SCHOOL
GRADES K-5
COHORT III — ENTERED NETWORK FALL 2014
East Hartford Public Schools
SUCCESS
Since entering the Commissioner’s Network, O’Brien STEM Academy has implemented a focused plan to improve reading performance in grades K-5. In addition, O’Brien has implemented an inquiry-based instructional model with a strong emphasis on instructional coaching to build teacher capacity and programming for science, technology, engineering, and mathematics (STEM). The work of the family and community outreach coordinator and social worker has allowed the school to open a family center that hosts Parent Talk Cafes on topics of interest to and requested by parents as well as providing kits to families so they can support literacy, math and STEM at home. With a stronger implementation of Positive Behavioral Interventions and Supports and Restorative Practices, O’Brien has seen a decrease in out-of-school and in-school suspensions.
COMMISSIONER’S NETWORK FUNDING
PRIORITIES
Talent
Talent
Build teacher capacity through a coaching model that focuses on assessment analysis and instructional planning.
Provide school-based professional learning focused on literacy, math, STEM, and school climate.
Academics
Continue to develop effective K-5 standards-based literacy and math instruction.
Deepen the implementation of schoolwide STEM programming.
Provide enrichment activities for students through field trips, in-class programs, and an afterschool program.
Climate/Culture
Continue to develop family and community outreach programming and family center.
Provide and implement Basic School Climate and Restorative Practices, Social Emotional Learning standards and lessons, and culturally responsive practices.
Operations N/A
Year 1 Year 2 Year 3 Year 4
$473,118 $550,000 $410,000 $365,000
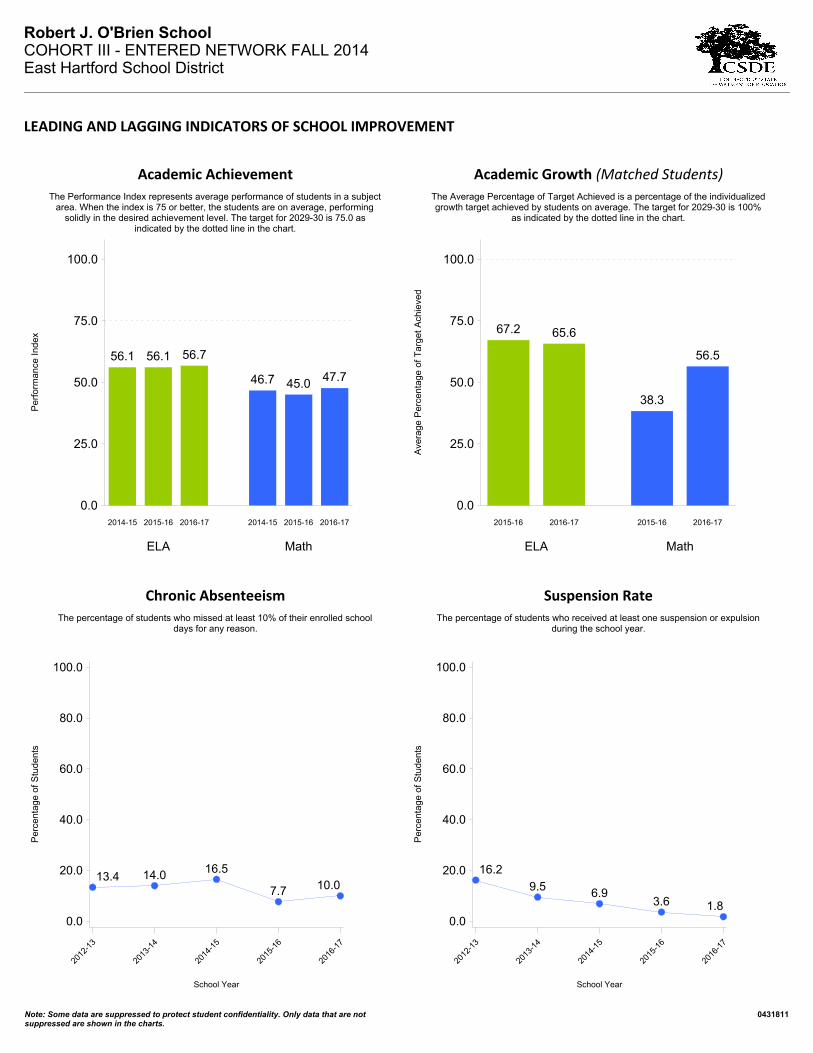
Note: Some data are suppressed to protect student confidentiality. Only data that are notsuppressed are shown in the charts.
0431811
Robert J. O'Brien SchoolCOHORT III - ENTERED NETWORK FALL 2014East Hartford School District
LEADING AND LAGGING INDICATORS OF SCHOOL IMPROVEMENT
Academic Achievement
The Performance Index represents average performance of students in a subjectarea. When the index is 75 or better, the students are on average, performing
solidly in the desired achievement level. The target for 2029-30 is 75.0 asindicated by the dotted line in the chart.
56.1 56.1 56.7
46.7 45.0 47.7
Per
form
ance
Ind
ex
0.0
25.0
50.0
75.0
100.0
ELA Math
2014-15 2015-16 2016-17 2014-15 2015-16 2016-17
Academic Growth (Matched Students)
The Average Percentage of Target Achieved is a percentage of the individualizedgrowth target achieved by students on average. The target for 2029-30 is 100%
as indicated by the dotted line in the chart.
67.2 65.6
38.3
56.5
Ave
rage
Per
cent
age
of T
arge
t A
chie
ved
0.0
25.0
50.0
75.0
100.0
ELA Math
2015-16 2016-17 2015-16 2016-17
Chronic Absenteeism
The percentage of students who missed at least 10% of their enrolled schooldays for any reason.
Per
cent
age
of S
tude
nts
0.0
20.0
40.0
60.0
80.0
100.0
School Year
2012
-13
2013
-14
2014
-15
2015
-16
2016
-17
13.4 14.0 16.5
7.7 10.0
Suspension Rate
The percentage of students who received at least one suspension or expulsionduring the school year.
Per
cent
age
of S
tude
nts
0.0
20.0
40.0
60.0
80.0
100.0
School Year
2012
-13
2013
-14
2014
-15
2015
-16
2016
-17
16.2
9.5 6.93.6 1.8
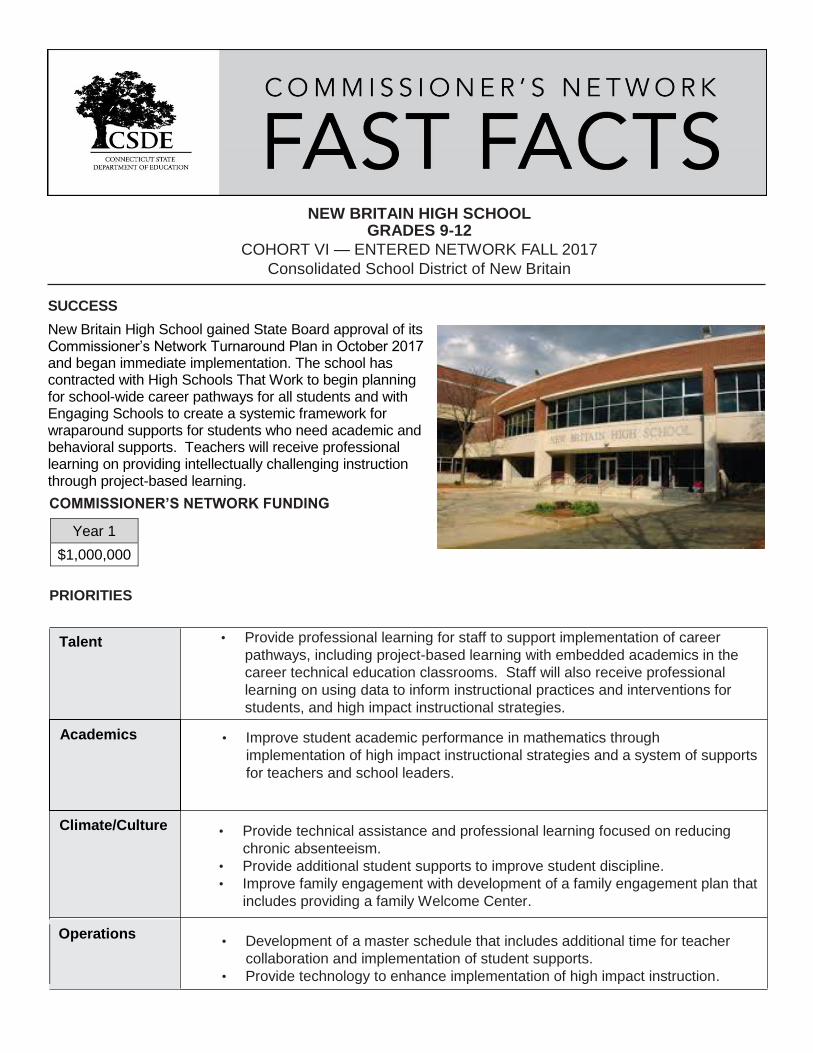
NEW BRITAIN HIGH SCHOOL GRADES 9-12
COHORT VI — ENTERED NETWORK FALL 2017
Consolidated School District of New Britain
COMMISSIONER’S NETWORK FUNDING
PRIORITIES
SUCCESS
New Britain High School gained State Board approval of its Commissioner’s Network Turnaround Plan in October 2017 and began immediate implementation. The school has contracted with High Schools That Work to begin planning for school-wide career pathways for all students and with Engaging Schools to create a systemic framework for wraparound supports for students who need academic and behavioral supports. Teachers will receive professional learning on providing intellectually challenging instruction through project-based learning.
Talent
Climate/Culture
• Provide professional learning for staff to support implementation of career
pathways, including project-based learning with embedded academics in the
career technical education classrooms. Staff will also receive professional
learning on using data to inform instructional practices and interventions for
students, and high impact instructional strategies.
• Improve student academic performance in mathematics through
implementation of high impact instructional strategies and a system of supports
for teachers and school leaders.
• Provide technical assistance and professional learning focused on reducing
chronic absenteeism.
• Provide additional student supports to improve student discipline.
• Improve family engagement with development of a family engagement plan that
includes providing a family Welcome Center.
• Development of a master schedule that includes additional time for teacher
collaboration and implementation of student supports.
• Provide technology to enhance implementation of high impact instruction.
Year 1
$1,000,000
Academics
Operations
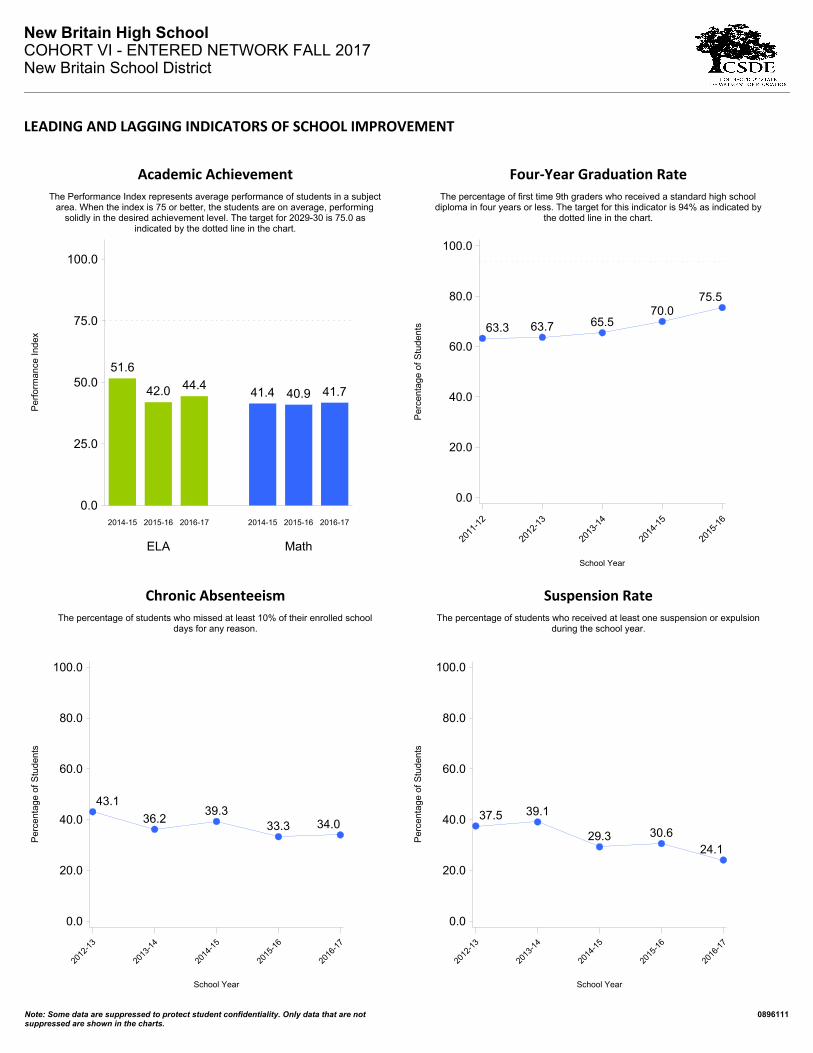
Note: Some data are suppressed to protect student confidentiality. Only data that are notsuppressed are shown in the charts.
0896111
New Britain High SchoolCOHORT VI - ENTERED NETWORK FALL 2017New Britain School District
LEADING AND LAGGING INDICATORS OF SCHOOL IMPROVEMENT
Academic Achievement
The Performance Index represents average performance of students in a subjectarea. When the index is 75 or better, the students are on average, performing
solidly in the desired achievement level. The target for 2029-30 is 75.0 asindicated by the dotted line in the chart.
51.6
42.0 44.441.4 40.9 41.7
Per
form
ance
Ind
ex
0.0
25.0
50.0
75.0
100.0
ELA Math
2014-15 2015-16 2016-17 2014-15 2015-16 2016-17
Four-Year Graduation Rate
The percentage of first time 9th graders who received a standard high schooldiploma in four years or less. The target for this indicator is 94% as indicated by
the dotted line in the chart.
Per
cent
age
of S
tude
nts
0.0
20.0
40.0
60.0
80.0
100.0
School Year
2011
-12
2012
-13
2013
-14
2014
-15
2015
-16
63.3 63.7 65.570.0
75.5
Chronic Absenteeism
The percentage of students who missed at least 10% of their enrolled schooldays for any reason.
Per
cent
age
of S
tude
nts
0.0
20.0
40.0
60.0
80.0
100.0
School Year
2012
-13
2013
-14
2014
-15
2015
-16
2016
-17
43.1
36.239.3
33.3 34.0
Suspension Rate
The percentage of students who received at least one suspension or expulsionduring the school year.
Per
cent
age
of S
tude
nts
0.0
20.0
40.0
60.0
80.0
100.0
School Year
2012
-13
2013
-14
2014
-15
2015
-16
2016
-17
37.5 39.1
29.3 30.624.1

SUCCESS
Clinton Avenue School is currently in its second year in the Commissioner’s Network. Beginning last year, teachers and the instructional leadership team collaboratively developed and implemented standards-based Units of Studies. This year, Clinton Avenue School has established and implemented Stop-and-Drop, an intervention block servicing all students by utilizing all staff members as resources. In an effort to increase parent and community engagement aligned to academic goals, staff will continue the use of the ASPIRE Survey tool to strategically develop meaningful engagement opportunities.
PRIORITIES
Talent
Academics
Climate/Culture
Operations
• Schedule common planning time for staff for professional learning and planning.
CLINTON AVENUE SCHOOL GRADES K-8
COHORT V — ENTERED NETWORK FALL 2016
New Haven Public Schools
COMMISSIONER’S NETWORK FUNDING
• Implement a coaching model to support teachers through model lessons,
co-teaching, observations, walk-throughs, and debriefing sessions.
• Provide professional learning to teachers focused on deepening understanding of
math standards and the implementation of a Project/Inquiry-Based Learning Model.
• Implement an intervention block focused on addressing the needs of all
students.
• Continue to develop and implement a standards-aligned Literacy Framework
for grades K-8.
• Implement Positive Behavioral Interventions and Supports (PBIS) and
Restorative Practices.
• Strategically develop meaningful engagement opportunities utilizing the ASPIRE
Survey tool, focusing on academic goals.
Year 1 Year 2
$880,000 $700,000

Note: Some data are suppressed to protect student confidentiality. Only data that are notsuppressed are shown in the charts.
0930611
Clinton Avenue SchoolCOHORT V - ENTERED NETWORK FALL 2016New Haven School District
LEADING AND LAGGING INDICATORS OF SCHOOL IMPROVEMENT
Academic Achievement
The Performance Index represents average performance of students in a subjectarea. When the index is 75 or better, the students are on average, performing
solidly in the desired achievement level. The target for 2029-30 is 75.0 asindicated by the dotted line in the chart.
51.8 54.557.5
43.248.5 46.4
Per
form
ance
Ind
ex
0.0
25.0
50.0
75.0
100.0
ELA Math
2014-15 2015-16 2016-17 2014-15 2015-16 2016-17
Academic Growth (Matched Students)
The Average Percentage of Target Achieved is a percentage of the individualizedgrowth target achieved by students on average. The target for 2029-30 is 100%
as indicated by the dotted line in the chart.
64.960.3
66.4
39.1
Ave
rage
Per
cent
age
of T
arge
t A
chie
ved
0.0
25.0
50.0
75.0
100.0
ELA Math
2015-16 2016-17 2015-16 2016-17
Chronic Absenteeism
The percentage of students who missed at least 10% of their enrolled schooldays for any reason.
Per
cent
age
of S
tude
nts
0.0
20.0
40.0
60.0
80.0
100.0
School Year
2012
-13
2013
-14
2014
-15
2015
-16
2016
-17
15.2
29.423.2
18.714.9
Suspension Rate
The percentage of students who received at least one suspension or expulsionduring the school year.
Per
cent
age
of S
tude
nts
0.0
20.0
40.0
60.0
80.0
100.0
School Year
2012
-13
2013
-14
2014
-15
2015
-16
2016
-17
6.3 5.5

SUCCESS Weekly analysis of student data, on-going professional learning and support for teachers, as well as a comprehensive technology program, contributed to Lincoln-Bassett’s gains on the Smarter Balanced Assessment. In its third year in the Network, Lincoln-Bassett Community School’s continued attention to strengthening school climate and culture, has resulted in a decrease in chronic absenteeism and in-school suspensions.
COMMISSIONER’S NETWORK FUNDING
PRIORITIES
Talent
Build paraeducator capacity to support teachers in delivering instruction.
Provide professional learning for teachers in the areas of literacy, math, lesson
planning/implementation, Scientific Research-Based Interventions, technology,
and operational support.
Academics
Continue with intervention blocks to provide academic and behavioral
supports to students.
Climate/Culture
Utilize behavior interventionist to implement the restorative practices framework.
Operations
Offer before-and after-school programming to provide additional academic supports and build parental and community engagement to supply families with a safe place for students to work.
LINCOLN-BASSETT COMMUNITY SCHOOL
GRADES PK-6
COHORT III- ENTERED NETWORK FALL 2014
New Haven Public Schools
Year 1 Year 2 Year 3 Year 4
$764,998 $650,000 $465,000 $440,000

Note: Some data are suppressed to protect student confidentiality. Only data that are notsuppressed are shown in the charts.
0932011
Lincoln-Bassett SchoolCOHORT III - ENTERED NETWORK FALL 2014New Haven School District
LEADING AND LAGGING INDICATORS OF SCHOOL IMPROVEMENT
Academic Achievement
The Performance Index represents average performance of students in a subjectarea. When the index is 75 or better, the students are on average, performing
solidly in the desired achievement level. The target for 2029-30 is 75.0 asindicated by the dotted line in the chart.
51.056.1 56.0
42.1
51.5 53.8
Per
form
ance
Ind
ex
0.0
25.0
50.0
75.0
100.0
ELA Math
2014-15 2015-16 2016-17 2014-15 2015-16 2016-17
Academic Growth (Matched Students)
The Average Percentage of Target Achieved is a percentage of the individualizedgrowth target achieved by students on average. The target for 2029-30 is 100%
as indicated by the dotted line in the chart.
78.5
49.6
94.6
63.7
Ave
rage
Per
cent
age
of T
arge
t A
chie
ved
0.0
25.0
50.0
75.0
100.0
ELA Math
2015-16 2016-17 2015-16 2016-17
Chronic Absenteeism
The percentage of students who missed at least 10% of their enrolled schooldays for any reason.
Per
cent
age
of S
tude
nts
0.0
20.0
40.0
60.0
80.0
100.0
School Year
2012
-13
2013
-14
2014
-15
2015
-16
2016
-17
19.3
29.9 30.0
19.513.7
Suspension Rate
The percentage of students who received at least one suspension or expulsionduring the school year.
Per
cent
age
of S
tude
nts
0.0
20.0
40.0
60.0
80.0
100.0
School Year
2012
-13
2013
-14
2014
-15
2015
-16
2016
-17
5.8
21.1
11.2 8.8 8.9
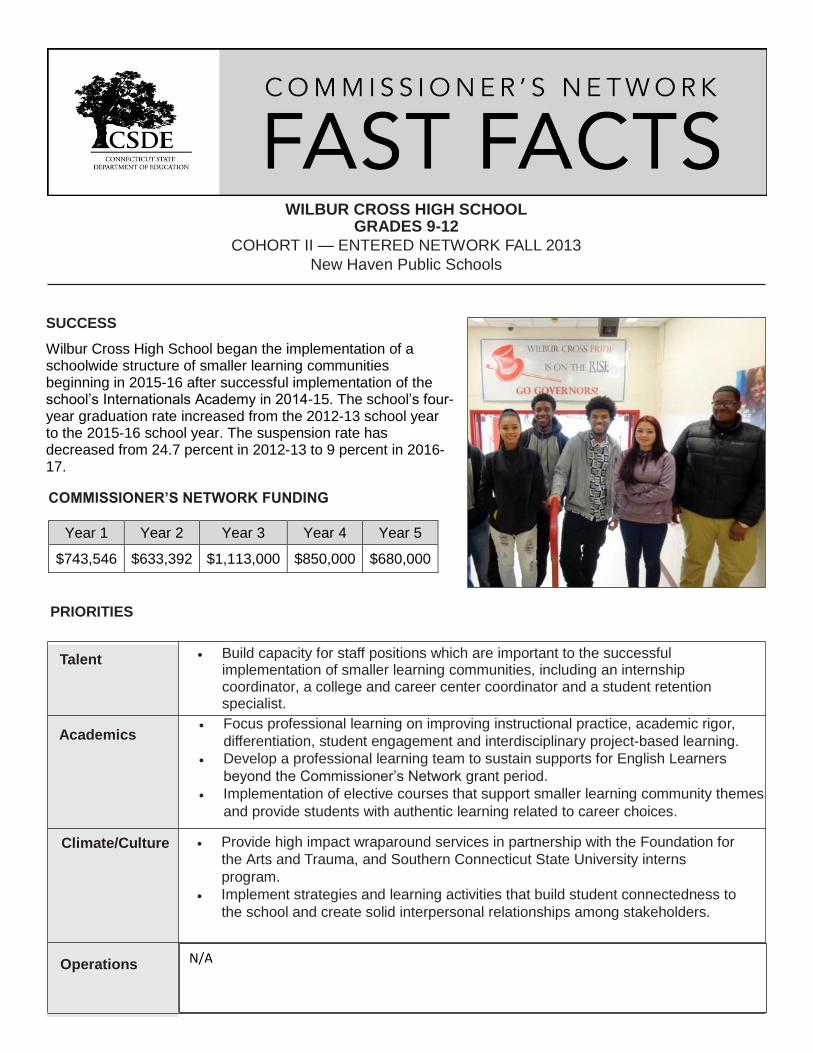
WILBUR CROSS HIGH SCHOOL GRADES 9-12
COHORT II — ENTERED NETWORK FALL 2013
New Haven Public Schools
SUCCESS
Wilbur Cross High School began the implementation of a schoolwide structure of smaller learning communities beginning in 2015-16 after successful implementation of the school’s Internationals Academy in 2014-15. The school’s four-year graduation rate increased from the 2012-13 school year to the 2015-16 school year. The suspension rate has decreased from 24.7 percent in 2012-13 to 9 percent in 2016-17. COMMISSIONER’S NETWORK FUNDING
PRIORITIES
Talent
Academics
Focus professional learning on improving instructional practice, academic rigor,
differentiation, student engagement and interdisciplinary project-based learning.
Develop a professional learning team to sustain supports for English Learners
beyond the Commissioner’s Network grant period.
Implementation of elective courses that support smaller learning community themes
and provide students with authentic learning related to career choices.
Climate/Culture
Provide high impact wraparound services in partnership with the Foundation for
the Arts and Trauma, and Southern Connecticut State University interns
program.
Implement strategies and learning activities that build student connectedness to
the school and create solid interpersonal relationships among stakeholders.
Operations
Build capacity for staff positions which are important to the successful implementation of smaller learning communities, including an internship coordinator, a college and career center coordinator and a student retention specialist.
Year 1 Year 2 Year 3 Year 4 Year 5
$743,546 $633,392 $1,113,000 $850,000 $680,000
N/A

Note: Some data are suppressed to protect student confidentiality. Only data that are notsuppressed are shown in the charts.
0936111
Wilbur Cross High SchoolCOHORT II - ENTERED NETWORK FALL 2013New Haven School District
LEADING AND LAGGING INDICATORS OF SCHOOL IMPROVEMENT
Academic Achievement
The Performance Index represents average performance of students in a subjectarea. When the index is 75 or better, the students are on average, performing
solidly in the desired achievement level. The target for 2029-30 is 75.0 asindicated by the dotted line in the chart.
41.047.0 45.1
33.9
42.4 40.3
Per
form
ance
Ind
ex
0.0
25.0
50.0
75.0
100.0
ELA Math
2014-15 2015-16 2016-17 2014-15 2015-16 2016-17
Four-Year Graduation Rate
The percentage of first time 9th graders who received a standard high schooldiploma in four years or less. The target for this indicator is 94% as indicated by
the dotted line in the chart.
Per
cent
age
of S
tude
nts
0.0
20.0
40.0
60.0
80.0
100.0
School Year
2011
-12
2012
-13
2013
-14
2014
-15
2015
-16
69.064.3 65.1 66.2
77.0
Chronic Absenteeism
The percentage of students who missed at least 10% of their enrolled schooldays for any reason.
Per
cent
age
of S
tude
nts
0.0
20.0
40.0
60.0
80.0
100.0
School Year
2012
-13
2013
-14
2014
-15
2015
-16
2016
-17
52.447.6
50.5
41.637.4
Suspension Rate
The percentage of students who received at least one suspension or expulsionduring the school year.
Per
cent
age
of S
tude
nts
0.0
20.0
40.0
60.0
80.0
100.0
School Year
2012
-13
2013
-14
2014
-15
2015
-16
2016
-17
24.718.6
9.3 8.6 9.0

UNCAS NETWORK SCHOOL GRADES K-5
COHORT III — ENTERED NETWORK FALL 2014
Norwich Public Schools
SUCCESS Revisions to the master schedule at Uncas Network School have created more opportunities for inclusive practices. Strong implementation of the workshop model with differentiated student supports are in place. Full-time art and music enrichment are scaffolding literacy and math instruction. Fundations, a multisensory, foundational skills program in kindergarten and first grade, has proved to be very engaging to students and is improving writing and decoding skills of primary level students. Actively connecting with families has increased student engagement school-wide. School community has been strengthened through the implementation of Restorative Practices and the Choose Love program.
COMMISSIONER’S NETWORK FUNDING
PRIORITIES
Talent
Talent Provide additional support for English learners through the addition of
bilingual personnel.
Academics
Promote collaboration among interventionists, certified support staff, and classroom teachers so that students receive targeted instruction based on individual need.
Provide targeted support and enrichment to students in math and literacy through interventionists providing push-in and pull-out services.
Climate/Culture
Implement Restorative Practices and the Choose Love program to enhance systems of recognition, student ownership and accountability as well as building a stronger school community.
Continue efforts to improve student average daily attendance and reduce chronic absenteeism.
Operations N/A
Year 1 Year 2 Year 3 Year 4
$601,754 $500,000 $350,000 $190,000
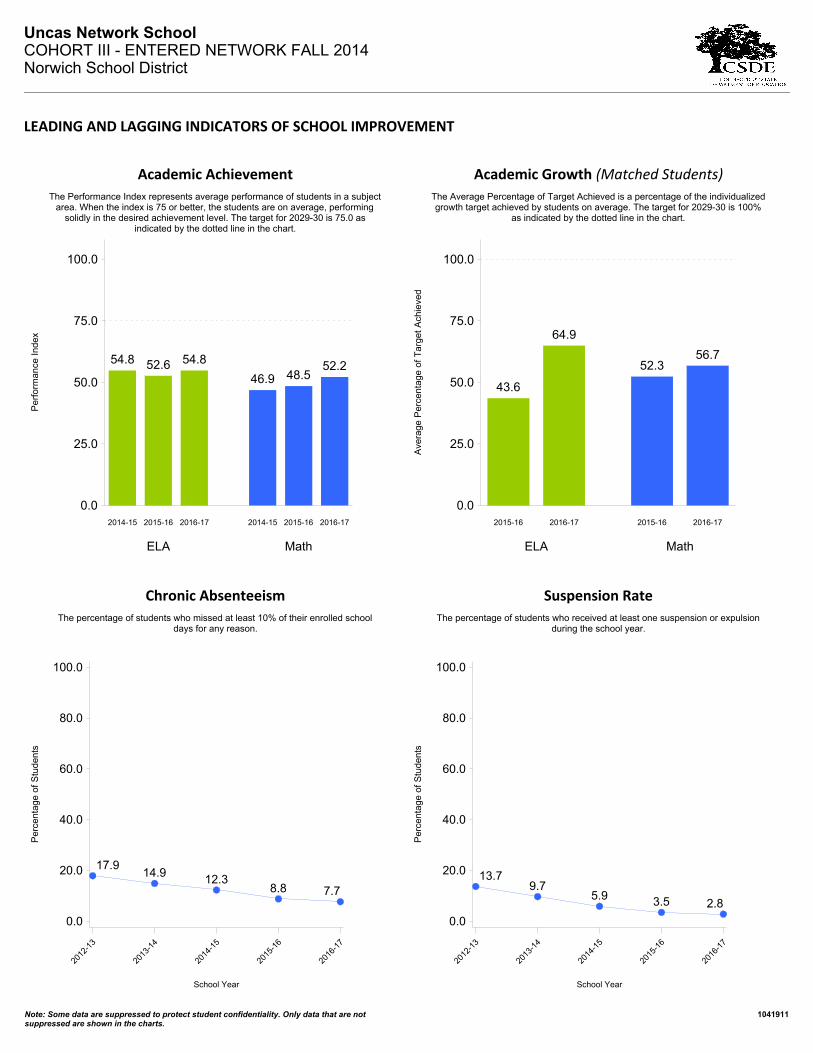
Note: Some data are suppressed to protect student confidentiality. Only data that are notsuppressed are shown in the charts.
1041911
Uncas Network SchoolCOHORT III - ENTERED NETWORK FALL 2014Norwich School District
LEADING AND LAGGING INDICATORS OF SCHOOL IMPROVEMENT
Academic Achievement
The Performance Index represents average performance of students in a subjectarea. When the index is 75 or better, the students are on average, performing
solidly in the desired achievement level. The target for 2029-30 is 75.0 asindicated by the dotted line in the chart.
54.8 52.6 54.8
46.9 48.552.2
Per
form
ance
Ind
ex
0.0
25.0
50.0
75.0
100.0
ELA Math
2014-15 2015-16 2016-17 2014-15 2015-16 2016-17
Academic Growth (Matched Students)
The Average Percentage of Target Achieved is a percentage of the individualizedgrowth target achieved by students on average. The target for 2029-30 is 100%
as indicated by the dotted line in the chart.
43.6
64.9
52.356.7
Ave
rage
Per
cent
age
of T
arge
t A
chie
ved
0.0
25.0
50.0
75.0
100.0
ELA Math
2015-16 2016-17 2015-16 2016-17
Chronic Absenteeism
The percentage of students who missed at least 10% of their enrolled schooldays for any reason.
Per
cent
age
of S
tude
nts
0.0
20.0
40.0
60.0
80.0
100.0
School Year
2012
-13
2013
-14
2014
-15
2015
-16
2016
-17
17.914.9
12.38.8 7.7
Suspension Rate
The percentage of students who received at least one suspension or expulsionduring the school year.
Per
cent
age
of S
tude
nts
0.0
20.0
40.0
60.0
80.0
100.0
School Year
2012
-13
2013
-14
2014
-15
2015
-16
2016
-17
13.79.7
5.9 3.5 2.8
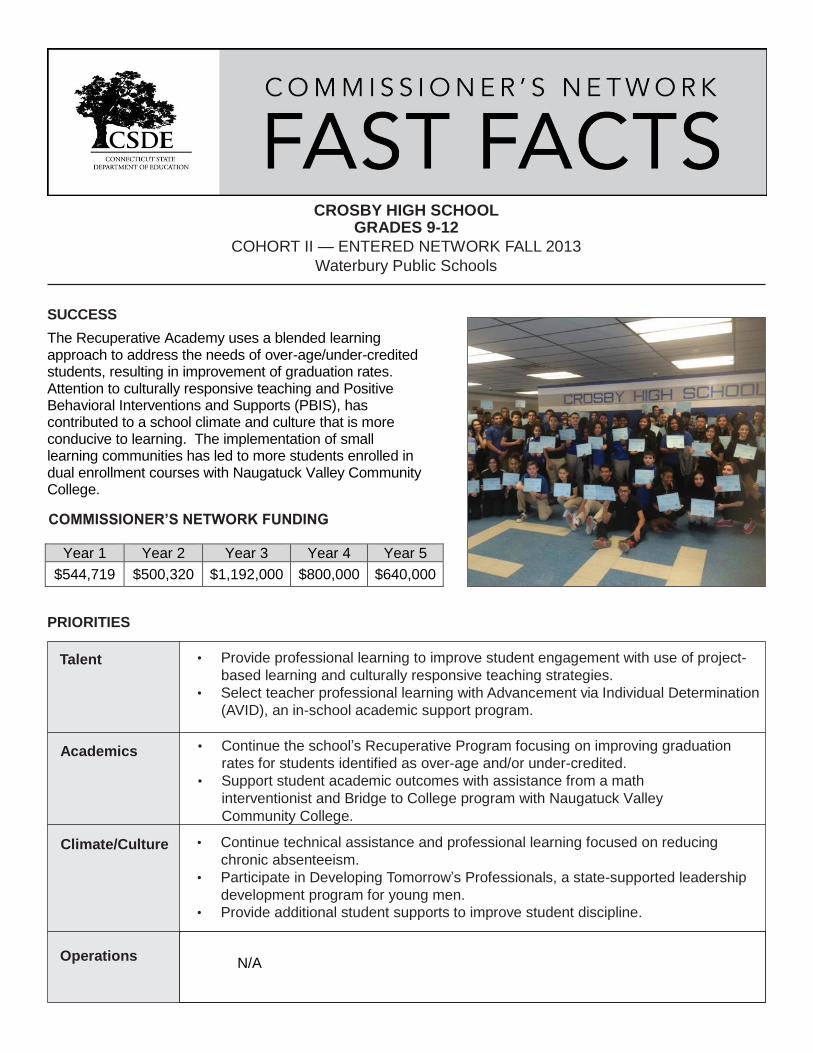
CROSBY HIGH SCHOOL GRADES 9-12
COHORT II — ENTERED NETWORK FALL 2013
Waterbury Public Schools
SUCCESS
The Recuperative Academy uses a blended learning approach to address the needs of over-age/under-credited students, resulting in improvement of graduation rates. Attention to culturally responsive teaching and Positive Behavioral Interventions and Supports (PBIS), has contributed to a school climate and culture that is more conducive to learning. The implementation of small learning communities has led to more students enrolled in dual enrollment courses with Naugatuck Valley Community College.
COMMISSIONER’S NETWORK FUNDING
PRIORITIES
Talent
• Provide professional learning to improve student engagement with use of project-
based learning and culturally responsive teaching strategies.
• Select teacher professional learning with Advancement via Individual Determination
(AVID), an in-school academic support program.
Academics
• Continue the school’s Recuperative Program focusing on improving graduation
rates for students identified as over-age and/or under-credited.
• Support student academic outcomes with assistance from a math
interventionist and Bridge to College program with Naugatuck Valley
Community College.
Climate/Culture
• Continue technical assistance and professional learning focused on reducing
chronic absenteeism.
• Participate in Developing Tomorrow’s Professionals, a state-supported leadership
development program for young men.
• Provide additional student supports to improve student discipline.
Operations
Year 1 Year 2 Year 3 Year 4 Year 5
$544,719 $500,320 $1,192,000 $800,000 $640,000
N/A
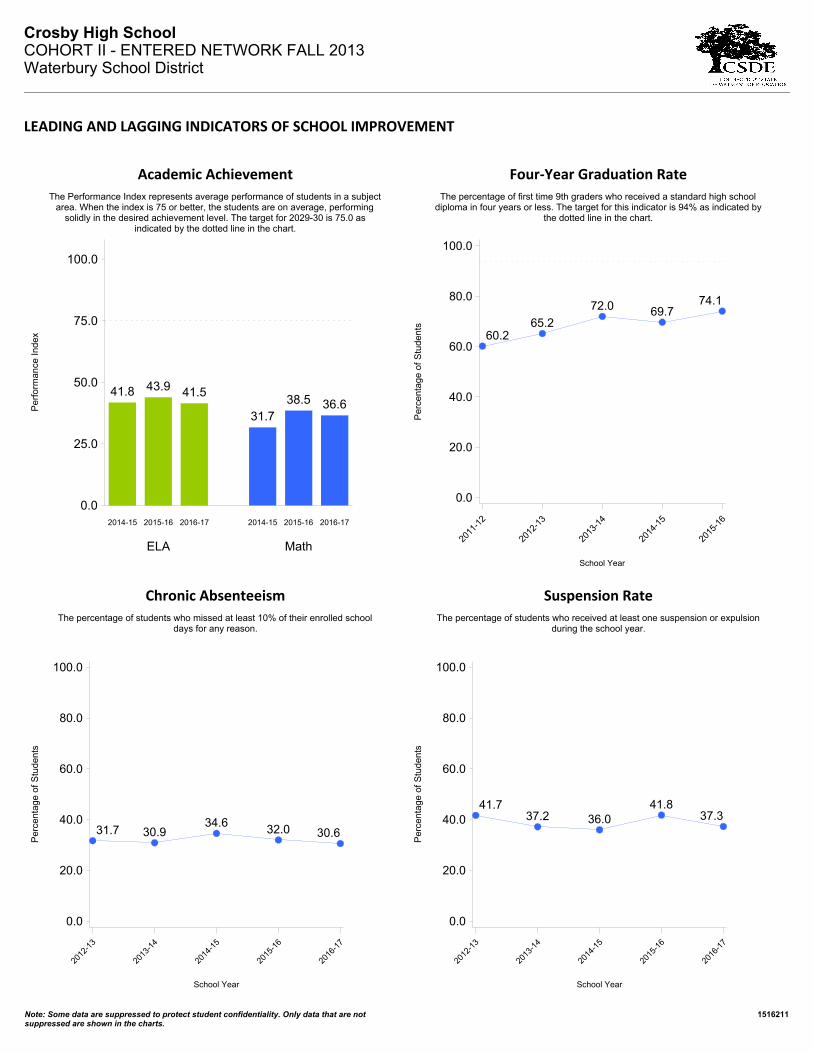
Note: Some data are suppressed to protect student confidentiality. Only data that are notsuppressed are shown in the charts.
1516211
Crosby High SchoolCOHORT II - ENTERED NETWORK FALL 2013Waterbury School District
LEADING AND LAGGING INDICATORS OF SCHOOL IMPROVEMENT
Academic Achievement
The Performance Index represents average performance of students in a subjectarea. When the index is 75 or better, the students are on average, performing
solidly in the desired achievement level. The target for 2029-30 is 75.0 asindicated by the dotted line in the chart.
41.8 43.9 41.5
31.738.5 36.6P
erfo
rman
ce I
ndex
0.0
25.0
50.0
75.0
100.0
ELA Math
2014-15 2015-16 2016-17 2014-15 2015-16 2016-17
Four-Year Graduation Rate
The percentage of first time 9th graders who received a standard high schooldiploma in four years or less. The target for this indicator is 94% as indicated by
the dotted line in the chart.
Per
cent
age
of S
tude
nts
0.0
20.0
40.0
60.0
80.0
100.0
School Year
2011
-12
2012
-13
2013
-14
2014
-15
2015
-16
60.265.2
72.0 69.774.1
Chronic Absenteeism
The percentage of students who missed at least 10% of their enrolled schooldays for any reason.
Per
cent
age
of S
tude
nts
0.0
20.0
40.0
60.0
80.0
100.0
School Year
2012
-13
2013
-14
2014
-15
2015
-16
2016
-17
31.7 30.934.6
32.0 30.6
Suspension Rate
The percentage of students who received at least one suspension or expulsionduring the school year.
Per
cent
age
of S
tude
nts
0.0
20.0
40.0
60.0
80.0
100.0
School Year
2012
-13
2013
-14
2014
-15
2015
-16
2016
-17
41.737.2 36.0
41.837.3

WALSH ELEMENTARY SCHOOL GRADES PK-5
COHORT II — ENTERED NETWORK FALL 2013
Waterbury Public Schools
SUCCESS
With the sustained implementation of the Project CHILD model, Walsh Elementary School continues to build upon best practices proven to be impact with teacher- and student-outcomes. Teachers use the district-adopted curricula aligned to Connecticut Core Standards, together with the Project CHILD model to plan and implement differentiated instruction through small-groups throughout the content areas. Teachers and interventionists work collaboratively with coaches to align supports, lesson design, and instruction.
COMMISSIONER’S NETWORK FUNDING
PRIORITIES
Talent
Academics
Climate/Culture
• Continue efforts to reduce suspensions using the prevention specialist to
facilitate support groups and preventative services.
Operations
• Interventionists will provide Tier II support, aligned to student need. They
will work collaboratively with coaches to align supports, lesson design, and
instruction.
• Improve teacher effectiveness through the purchase of supplemental instructional materials supporting classroom instruction.
NN
Year 1 Year 2 Year 3 Year 4 Year 5
$470,960 $785,246 $624,720 $350,000 $160,000
N/A

Note: Some data are suppressed to protect student confidentiality. Only data that are notsuppressed are shown in the charts.
1512211
Walsh SchoolCOHORT II - ENTERED NETWORK FALL 2013Waterbury School District
LEADING AND LAGGING INDICATORS OF SCHOOL IMPROVEMENT
Academic Achievement
The Performance Index represents average performance of students in a subjectarea. When the index is 75 or better, the students are on average, performing
solidly in the desired achievement level. The target for 2029-30 is 75.0 asindicated by the dotted line in the chart.
44.5
53.2 50.5
37.8
44.948.3
Per
form
ance
Ind
ex
0.0
25.0
50.0
75.0
100.0
ELA Math
2014-15 2015-16 2016-17 2014-15 2015-16 2016-17
Academic Growth (Matched Students)
The Average Percentage of Target Achieved is a percentage of the individualizedgrowth target achieved by students on average. The target for 2029-30 is 100%
as indicated by the dotted line in the chart.
76.0
37.3
62.3 61.2
Ave
rage
Per
cent
age
of T
arge
t A
chie
ved
0.0
25.0
50.0
75.0
100.0
ELA Math
2015-16 2016-17 2015-16 2016-17
Chronic Absenteeism
The percentage of students who missed at least 10% of their enrolled schooldays for any reason.
Per
cent
age
of S
tude
nts
0.0
20.0
40.0
60.0
80.0
100.0
School Year
2012
-13
2013
-14
2014
-15
2015
-16
2016
-17
17.523.8 21.4
12.9 12.6
Suspension Rate
The percentage of students who received at least one suspension or expulsionduring the school year.
Per
cent
age
of S
tude
nts
0.0
20.0
40.0
60.0
80.0
100.0
School Year
2012
-13
2013
-14
2014
-15
2015
-16
2016
-17
12.816.3 16.9
10.65.5
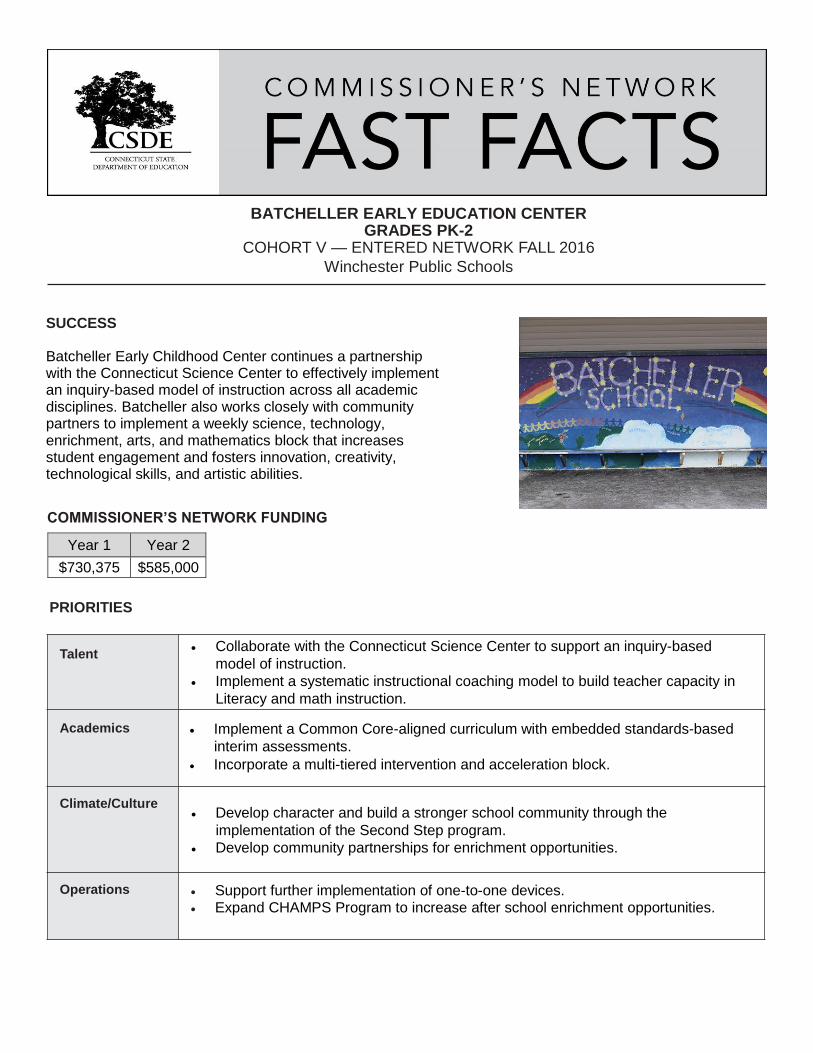
BATCHELLER EARLY EDUCATION CENTER GRADES PK-2
COHORT V — ENTERED NETWORK FALL 2016
Winchester Public Schools
SUCCESS
Batcheller Early Childhood Center continues a partnership with the Connecticut Science Center to effectively implement an inquiry-based model of instruction across all academic disciplines. Batcheller also works closely with community partners to implement a weekly science, technology, enrichment, arts, and mathematics block that increases student engagement and fosters innovation, creativity, technological skills, and artistic abilities.
COMMISSIONER’S NETWORK FUNDING
PRIORITIES
Talent Collaborate with the Connecticut Science Center to support an inquiry-based
model of instruction.
Implement a systematic instructional coaching model to build teacher capacity in
Literacy and math instruction.
Academics Implement a Common Core-aligned curriculum with embedded standards-based
interim assessments.
Incorporate a multi-tiered intervention and acceleration block.
Climate/Culture Develop character and build a stronger school community through the
implementation of the Second Step program.
Develop community partnerships for enrichment opportunities.
Operations Support further implementation of one-to-one devices. Expand CHAMPS Program to increase after school enrichment opportunities.
Year 1 Year 2
$730,375 $585,000

Note: Some data are suppressed to protect student confidentiality. Only data that are notsuppressed are shown in the charts.
1620411
Batcheller Early Education CenterCOHORT V - ENTERED NETWORK FALL 2016Winchester School District
LEADING AND LAGGING INDICATORS OF SCHOOL IMPROVEMENT
Note: This section is intentionally left blank because as a PK-2 school, Batcheller Early Education
Center does not participate in the Smarter Balanced Assessments.
Chronic Absenteeism
The percentage of students who missed at least 10% of their enrolled schooldays for any reason.
Per
cent
age
of S
tude
nts
0.0
20.0
40.0
60.0
80.0
100.0
School Year
2012
-13
2013
-14
2014
-15
2015
-16
2016
-17
7.910.6 12.1 12.2
6.8
Suspension Rate
The percentage of students who received at least one suspension or expulsionduring the school year.
Per
cent
age
of S
tude
nts
0.0
20.0
40.0
60.0
80.0
100.0
School Year
2012
-13
2013
-14
2014
-15
2015
-16
2016
-17
2.9

PEARSON SCHOOL GRADES 3-6
COHORT V — ENTERED NETWORK FALL 2016
Winchester Public Schools
SUCCESS In its second year in the Network, Pearson School continues to enhance its partnership with the Connecticut Science Center to effectively implement an inquiry-based model of instruction across all academic disciplines. Pearson works closely with community partners to implement a weekly science, technology, enrichment, arts, and mathematics (STEAM) block that increases student engagement and fosters innovation, creativity, technological skills, and artistic abilities.
COMMISSIONER’S NETWORK FUNDING
PRIORITIES
Talent
Collaborate with the Connecticut Science Center to increase the capacity of
teachers through inquiry-based instructional coaching.
Provide on-site professional learning and coaching to support instruction,
curriculum, and program development.
Academics
Incorporate a multi-tiered intervention and acceleration block into the school day.
Implement a Connecticut Core-aligned curriculum with embedded standards-
based assessments.
Climate/Culture
Implement recognition and incentives for positive student behavior.
Enhance community partnerships for enrichment opportunities.
Operations
Support further implementation of one-to-one devices for students. Expand CHAMPS Program for before and after-school enrichment opportunities.
Year 1 Year 2
$830,375 $660,000
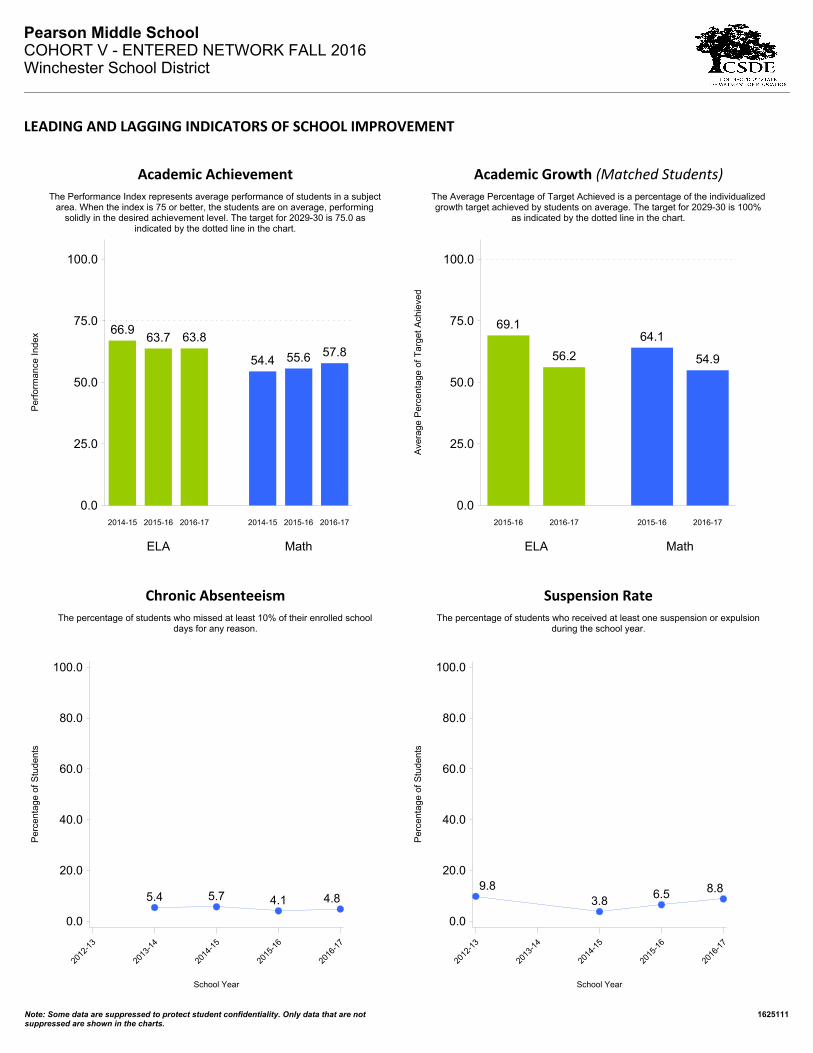
Note: Some data are suppressed to protect student confidentiality. Only data that are notsuppressed are shown in the charts.
1625111
Pearson Middle SchoolCOHORT V - ENTERED NETWORK FALL 2016Winchester School District
LEADING AND LAGGING INDICATORS OF SCHOOL IMPROVEMENT
Academic Achievement
The Performance Index represents average performance of students in a subjectarea. When the index is 75 or better, the students are on average, performing
solidly in the desired achievement level. The target for 2029-30 is 75.0 asindicated by the dotted line in the chart.
66.963.7 63.8
54.4 55.6 57.8
Per
form
ance
Ind
ex
0.0
25.0
50.0
75.0
100.0
ELA Math
2014-15 2015-16 2016-17 2014-15 2015-16 2016-17
Academic Growth (Matched Students)
The Average Percentage of Target Achieved is a percentage of the individualizedgrowth target achieved by students on average. The target for 2029-30 is 100%
as indicated by the dotted line in the chart.
69.1
56.2
64.1
54.9
Ave
rage
Per
cent
age
of T
arge
t A
chie
ved
0.0
25.0
50.0
75.0
100.0
ELA Math
2015-16 2016-17 2015-16 2016-17
Chronic Absenteeism
The percentage of students who missed at least 10% of their enrolled schooldays for any reason.
Per
cent
age
of S
tude
nts
0.0
20.0
40.0
60.0
80.0
100.0
School Year
2012
-13
2013
-14
2014
-15
2015
-16
2016
-17
5.4 5.7 4.1 4.8
Suspension Rate
The percentage of students who received at least one suspension or expulsionduring the school year.
Per
cent
age
of S
tude
nts
0.0
20.0
40.0
60.0
80.0
100.0
School Year
2012
-13
2013
-14
2014
-15
2015
-16
2016
-17
9.83.8
6.5 8.8

WINDHAM MIDDLE SCHOOL GRADES 6-8
COHORT II — ENTERED NETWORK FALL 2013
Windham Public Schools
SUCCESS
In its final year in the Commissioner’s Network, Windham Middle School (WMS) supports district priorities of student achievement, building staff capacity, community engagement, and operational efficiency by implementing its Small Learning Community model, which focuses on teaming and collaboration to increase schoolwide rigor, relevance, and relationships. This model lends itself to lower student-teacher ratios, allows for grade-level data and student-focused team meetings, collaborative planning, grade-level advisory curriculum, and enables students to make stronger connections with adults.
COMMISSIONER’S NETWORK FUNDING
PRIORITIES
Talent
• Continue the implementation of a facilitative coaching model, with coaching
and learning plan templates.
• Reduce teacher turnover and hiring and retaining certified math teachers.
Academics
• Continue the implementation of the Connecticut Core Standards (CCS) in English
language arts and math curricula for all grades; and the rollout of CCS/Next
Generation Science Standards aligned curriculum for social studies and science.
• Increases student engagement through increased rigor and relevance.
Climate/Culture
• Reduce suspension rate, with the goal of increasing student class time.
• Continue to shift culture to celebrating successes, shifting adult mindsets to
relationship building, and fully utilizing family liaisons.
Operations
• Continue extended learning time with an additional period twice per week
to provide remedial instruction, enrichment, and support time.
Year 1 Year 2 Year 3 Year 4 Year 5
$500,000 $891,223 $587,840 $340,000 $140,000
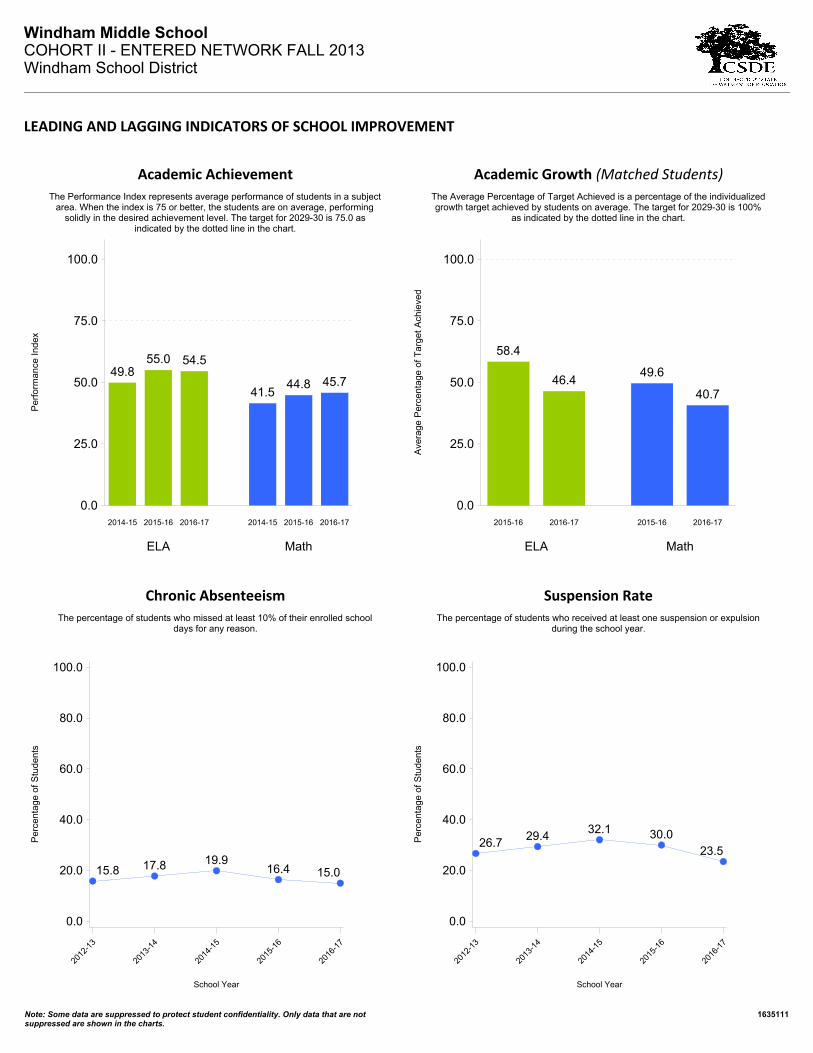
Note: Some data are suppressed to protect student confidentiality. Only data that are notsuppressed are shown in the charts.
1635111
Windham Middle SchoolCOHORT II - ENTERED NETWORK FALL 2013Windham School District
LEADING AND LAGGING INDICATORS OF SCHOOL IMPROVEMENT
Academic Achievement
The Performance Index represents average performance of students in a subjectarea. When the index is 75 or better, the students are on average, performing
solidly in the desired achievement level. The target for 2029-30 is 75.0 asindicated by the dotted line in the chart.
49.855.0 54.5
41.544.8 45.7
Per
form
ance
Ind
ex
0.0
25.0
50.0
75.0
100.0
ELA Math
2014-15 2015-16 2016-17 2014-15 2015-16 2016-17
Academic Growth (Matched Students)
The Average Percentage of Target Achieved is a percentage of the individualizedgrowth target achieved by students on average. The target for 2029-30 is 100%
as indicated by the dotted line in the chart.
58.4
46.449.6
40.7
Ave
rage
Per
cent
age
of T
arge
t A
chie
ved
0.0
25.0
50.0
75.0
100.0
ELA Math
2015-16 2016-17 2015-16 2016-17
Chronic Absenteeism
The percentage of students who missed at least 10% of their enrolled schooldays for any reason.
Per
cent
age
of S
tude
nts
0.0
20.0
40.0
60.0
80.0
100.0
School Year
2012
-13
2013
-14
2014
-15
2015
-16
2016
-17
15.8 17.8 19.916.4 15.0
Suspension Rate
The percentage of students who received at least one suspension or expulsionduring the school year.
Per
cent
age
of S
tude
nts
0.0
20.0
40.0
60.0
80.0
100.0
School Year
2012
-13
2013
-14
2014
-15
2015
-16
2016
-17
26.729.4
32.1 30.023.5