Embed Size (px)
Citation preview

2011 Annual R
eport 2011
Petroliam Nasional Berhad (Company No. 20076-K)
Registered Office: Tower 1, PETRONAS Twin Towers,
Kuala Lumpur City Centre, 50088 Kuala Lumpur Malaysia
Telephone : +603 2051 5000
Fax : +603 2026 5050
www.petronas.com
Annual Report
actual look and feel

Our Business
Exploration, Development and
Production
LiquefactionProcessing
Processed Gas/PGU System
PetrochemicalPlant
PetrochemicalProducts
Liquefied Natural Gas (LNG)
Liquefied Petroleum Gas (LPG)
Refining
PetroleumProducts
CrudeOil
NaturalGas
• ExportSector• Residentialand CommercialSectors
• PowerSector• IndustrialSector
• IndustrialSector-Ethylene,Methanol,MTBE,Polyethylene,Propylene,UreaandVCM
• TransportationSector- Diesel,Gasoline,JetFuel
andLubricants
Non-exhaustive

PETRONAS Annual Report 2011 3
Africa •Algeria–Development•Cameroon–Exploration&Development•Chad – Development & Production •Egypt–Exploration,Development&Production•Mauritania – Exploration & Production • Mozambique–Exploration •Sudan – Exploration, Development & ProductionAsia Pacific •Australia–Exploration•Brunei–Exploration•Indonesia – Exploration, Development & Production •Malaysia –Exploration,Development&Production•Malaysia-Thailand Joint Development Area – Exploration, Development & Production •Myanmar–Exploration,Development&Production•Vietnam – Exploration, Development & ProductionCentral Asia •Turkmenistan–Exploration,Development&Production•Uzbekistan – Exploration, Development & ProductionLatin America •Cuba–Exploration•Venezuela – Development Middle East •Iraq–Development•Oman – Exploration North America •Greenland – Exploration
Exploration & Production (E&P)
Africa •Botswana–OilBusiness•Burundi–OilBusiness•Cameroon–OilBusiness•Chad – Oil Business •Democratic Republic of the Congo–OilBusiness•Gabon–OilBusiness•Ghana–OilBusiness•Guinea Bissau – Oil Business •Kenya–OilBusiness•Malawi–OilBusiness•Mauritius–OilBusiness•Mozambique – Oil Business •Namibia–OilBusiness•Réunion–OilBusiness•Rwanda–OilBusiness•South Africa–OilBusiness•Sudan – Oil Business •Tanzania–OilBusiness•Uganda–OilBusiness•Zambia–OilBusiness•Zimbabwe – Oil BusinessAsia Pacific •China–Oil&PetrochemicalBusinesses•India–Oil&PetrochemicalBusinesses•Indonesia – Oil & Petrochemical Businesses •Japan–Oil&PetrochemicalBusinesses•Malaysia–Oil&PetrochemicalBusinesses•Philippines – Oil & Petrochemical Businesses •Thailand–Oil&PetrochemicalBusinesses•Vietnam – Oil & Petrochemical Businesses Europe •Austria–OilBusiness•Belgium–OilBusiness•Denmark–OilBusiness•France–OilBusiness•Germany – Oil Business •Italy–OilBusiness•Netherlands–OilBusiness•Poland–OilBusiness•Portugal–OilBusiness•Spain – Oil Business •Turkey–OilBusiness•United Kingdom – Oil BusinessLatin America •Argentina–OilBusiness•Brazil – Oil BusinessMiddle East •United Arab Emirates – Oil & Petrochemical BusinessesNorth America •United States of America – Oil Business
Downstream*
Africa •Egypt – LNG Asia Pacific •Australia–LNG&Infrastructure•Indonesia–Infrastructure•Malaysia – LNG, Infrastructure, Utilities & Power •Thailand – InfrastructureEurope •Ireland–Infrastructure•United Kingdom – Infrastructure, Utilities & TradingLatin America •Argentina – Infrastructure
Gas & Power
Our Presence
*Includes Engen subsidiaries and marketing and trading offices.
©2011 PETROLIAM NASIONAL BERHAD (PETRONAS)All rights reserved. No part of this document may be reproduced, stored in a retrieval system or transmitted in any form or by any means (electronic, mechanical, photocopying, recording or otherwise) without the permission of the copyright owner. PETRONAS makes no representation or warranty, whether expressed or implied, as to the accuracy or completeness of the facts presented. PETRONAS disclaims responsibility from any liability arising out of reliance on the contents of this publication.
E&P
Gas & Power
Downstream

4 PETRONAS Annual Report 2011
30 Financial Results
38 Exploration & Production Business
46 Gas & Power Business
52 Downstream Business
60 Maritime & Logistics Business
62 Our People
64 Technology & Engineering
68 Health, Safety & Environment (HSE)
72 Awards & Recognitions
78 Corporate Social Responsibility
82 Main Events
90
93
Glossary
Financial Statements
Our Business
3 Our Presence
5 Corporate Statements
6 Corporate Profile
10 Corporate Enhancement Programme - A Year On
14 Board of Directors
16 Board Committees
18 Executive Committee
19 Management Committee
20 President & CEO and Acting Chairman’s Message
26 Statement of Corporate Governance
27 Statement of Anti-Corruption
28 Statement on Internal Control
Table of Contents
PETRONAS Annual Report 2011 5
CorporateStatements
VISIONTo be a Leading Oil and Gas Multinational of Choice
MISSIONWe are a business entity
Petroleum is our core business
Our primary responsibility is to develop and add value to this national resource
Our objective is to contribute to the well-being of the people and the nation
SHARED VALUES
Loyalty
Loyal to nation and corporation
Integrity
Honest and upright
Professionalism
Committed, innovative and proactive and always striving for excellence
CohesivenessUnited in purpose and fellowship

6 PETRONAS Annual Report 2011
PETRONASat a Glance PETRONAS, the acronym for Petroliam Nasional Berhad, was incorporated on 17 August 1974 under the Companies Act, 1965. It is wholly-owned by the Malaysian Government and is vested with the entire ownership and control of the petroleum resources in Malaysia through the Petroleum Development Act, 1974. Over the years, PETRONAS has grown to become a fully integrated oil and gas corporation and is ranked among the FORTUNE Global 500® largest corporations in the world.
Exploration & Production Business
As custodian of Malaysia’s oil and gas resources, PETRONAS is entrusted with the responsibility to develop and add value to the nation’s hydrocarbon resources. In the early years, PETRONAS focused its efforts on managing the production sharing contractors who were exploring Malaysian acreages, but PETRONAS soon saw the need to take on a bigger and more proactive role in augmenting the nation’s oil and gas reserves. PETRONAS has also reintensified efforts to strengthen Malaysia’s upstream industry through the enhancement of fiscal terms and the introduction of new petroleum solutions, leveraging on the Government’s new tax incentives.
Through its Exploration & Production (E&P) subsidiary, PETRONAS Carigali Sdn Bhd (PETRONAS Carigali), PETRONAS has developed capability as a hands-on operator with a track record of successful oil and gas developments. PETRONAS Carigali works alongside a number of petroleum multinational corporations through Production Sharing Contracts (PSCs) to explore, develop and produce oil and gas in Malaysia. Abroad, PETRONAS continues to strengthen its position by securing new acreages while undertaking various development projects.
The Petroleum Management Unit of PETRONAS acts as resource owner and manager of Malaysia’s domestic oil and gas assets. It manages the optimal exploitation of hydrocarbon resources and enhances the prospectivity of domestic acreages to attract investment and protect the national interest. One of the key drivers of its business growth is deepwater E&P, with many positive prospects emerging in Malaysian acreages.
PETRONAS continues to harness and develop new technologies to maximise opportunities and further strengthen its capabilities as part of its ongoing efforts to become a leading global E&P player.
Corporate Profile

PETRONAS Annual Report 2011 7
Gas & Power BusinessPETRONAS’ Gas & Power Business aspires to be a leading integrated gas, liquefied natural gas (LNG) and power player. To create greater focus in these core areas of growth, the business has been restructured and streamlined into two major portfolios; Global LNG business and Infrastructure, Utilities & Power business.
Global LNG
PETRONAS’ global LNG business comprises the production and sale of LNG through its domestic operations in Bintulu, Sarawak (PETRONAS LNG Complex) and overseas operations in Egypt (Egyptian LNG).PETRONAS operates one of the world’s largest LNG facilities in Bintulu, Sarawak, which consists of three plants, MLNG, MLNG Dua and MLNG Tiga, with a combined capacity of 24 million tonnes per annum.
PETRONAS is also involved in LNG and energy trading activities through its marketing arms in Malaysia and Europe (PETRONAS LNG Ltd and PETRONAS Energy Trading Ltd).
operates the Peninsular Gas Utilisation (PGU) system, comprising six processing plants and approximately 2,505 km of pipelines to process and transmit gas to end-users in the power, industrial and commercial sectors in Peninsular Malaysia. PETRONAS also exports gas for power generation to Singapore.
The PGU system is the principal catalyst for the development of Peninsular Malaysia’s offshore gas fields, the use of natural gas products for power generation and utilities, and the expansion of Malaysia’s petrochemical industry through the use of gas derivative products, such as ethane, propane, butane and condensates.
PGB is also developing Malaysia’s first LNG Regasification Terminal in Melaka, which is due for completion in July 2012. This will facilitate the importation of LNG by PETRONAS and third parties towards ensuring security of gas supply for the nation in the future.
Globally, PETRONAS has investments in pipeline operations in Argentina, Australia, Indonesia and Thailand, as well as gas storage and LNG regasification facilities in Europe.
PETRONAS is also committed to further grow in the power and renewable energy business, leveraging on existing capabilities and venturing into opportunities in key focus markets in Asia and the Middle East. Entry into the power business will support PETRONAS’ vision to be an integrated energy company.
At present, PETRONAS commands a sizeable LNG market share in the Far East. Over the years, PETRONAS has sustained its market position and preserved its reputation as a reliable supplier of LNG, having sold more than 7,000 cargoes since the establishment of its first LNG plant in 1983.
As a global LNG player, PETRONAS is determined to defend its significant traditional Far East market and seize opportunities on the growing spot market, while continuing to grow its LNG presence in the Atlantic basin.
PETRONAS is also establishing its foothold in European energy trading, which includes electricity and carbon trading.
Infrastructure, Utilities & Power
PETRONAS’ Infrastructure, Utilities & Power business focuses its efforts towards ensuring long term security and sustainability of the gas market in Malaysia and expanding its portfolio of infrastructure and power positions in high growth markets. The business is leveraging on its widely respected operational excellence and sustainable energy developments.
PETRONAS, through its majority-owned subsidiary, PETRONAS Gas Berhad (PGB),

8 PETRONAS Annual Report 2011
Downstream BusinessPETRONAS’ Downstream Business plays a strategic role in adding further value to petroleum resources through its integrated operations in refining & trading, marketing, and petrochemicals.
Refining & Trading
PETRONAS owns and operates three refineries in Malaysia, two in Melaka (collectively known as the Melaka Refinery Complex) and another in Kertih (the Kertih Refinery). The first refinery in Melaka is 100% owned by PETRONAS while the second refinery is 53% owned by the Group. PETRONAS also operates a Group III base oil refining (MG3) plant in the Melaka Refinery Complex.
PETRONAS also has an oil refining presence in Africa through its 80% owned subsidiary, Engen Petroleum Limited (Engen), a leading South African refining and marketing company that owns and operates a refinery in Durban, South Africa.
To carry out trading activities in crude oil and petroleum products in the Malaysian and international markets (including Asia, Africa and the Indian subcontinent), PETRONAS formed a whol ly-owned subsid iary, PETRONAS Trading Corporation Sdn Bhd (PETCO). PETCO also trades in crude oil and
petroleum products produced by affiliates and third parties, and has trading operations in Dubai and London via its wholly-owned subsidiaries PETCO Trading DMCC and PETCO Trading UK Limited, respectively.
Downstream Marketing
PETRONAS is engaged in domestic marketing and retailing activities through PETRONAS Dagangan Berhad (PDB), a majority-owned subsidiary, which markets a wide range of petroleum products, including gasoline, Liquefied Petroleum Gas (LPG), jet fuel, kerosene, diesel, fuel oil, asphalt and lubricants. Natural Gas for Vehicles (NGV) is marketed through PDB’s wholly-owned subsidiary PETRONAS NGV Sdn Bhd. PDB also has interest in Malaysia’s Multi-Product Pipeline and the Klang Valley Distribution Terminal that transports gasoline, jet fuel and diesel oil from the refineries to major demand centres in the Klang Valley. Besides marketing activities, PDB also jointly operates a jet fuel storage facility and hydrant line system at the Kuala Lumpur International Airport.
PETRONAS has also establ ished its downstream marketing presence in key Asian markets. PT PETRONAS Niaga Indonesia, a wholly-owned subsidiary, operates retail stations as well as markets petroleum products to industrial and commercial customers, and manages a network of local lubricant distributors in Indonesia. In Thailand similar activities are undertaken by PETRONAS Retail (Thailand) Co Ltd
that also supplies jet fuel to the Don Muang International Airport and the Suvarnabhumi International Airport, Bangkok. In China and India, the Group’s lubricant products are sold through PETRONAS’ wholly-owned subsidiary, PETRONAS Marketing China Company Ltd and PETRONAS Marketing India Private Ltd (PMIPL), respectively. PMIPL also has exclusive supply arrangements and collaborations with major Original Equipment Manufacturer (OEM) partners and car manufacturers.
In Africa, PETRONAS’ subsidiary Engen has the largest retail network of service stations in South Africa as well as a strong retail presence in the Sub-Saharan region in countries including Botswana, Burundi, Kenya, Lesotho, Malawi, Mauritius, Mozambique, Namibia, Réunion, Swaziland, Tanzania, Zambia and Zimbabwe. In the Sudan, PETRONAS Marketing Sudan Limited (PMSL), a wholly-owned subsidiary is engaged in the marketing and retailing of petroleum products and lubricants, as well as owns and operates retail stations. PMSL also provides into-plane service at the Khartoum International Airport and El-Obeid International Airport, which is the main base for the UN World Food Programme’s operations in the Sudan. PMSL also supplies fuel to the UN-African Union Mission peacekeeping force in Darfur and operates refueling stations and depots.
With a presence in more than 20 countries wor ldw ide , PETRONAS Lubr icants International Sdn Bhd (PLISB) is the lubricants arm of PETRONAS. PLISB has established a manufacturing base and distribution channel to sell its products in the European market by virtue of acquiring the FL Selenia Group, (re-named PL Italy Group) and offers lubricants, transmission, anti-freeze and functional fluids for automobiles, trucks, agricultural tractors and earth moving machinery as well as for other industrial equipment to the market.
Leveraging on PL Italy Group’s strong OEM relationships and world-class research and development capabilities, PLISB currently has a long-term supply, technical, collaborative and commercial agreement for the exclusive right to supply lubricants to Fiat Italy via PL Italy Group.
Also in the lubricants marketing sector, PETRONAS Base Oil (M) Sdn Bhd, a wholly-owned subsidiary of PETRONAS, undertakes the marketing of MG3 base oil in Malaysia and the Asia Pacific region whereas marketing in Europe is handled by PETRONAS Marketing Netherlands BV. PETRONAS markets its base oil products under the brand ETRO.
Apart from eight LPG bottling plants in Malaysia, PETRONAS also has LPG facilities in selected Asian countries namely in India, the Philippines and Vietnam, either through a joint venture or wholly-owned subsidiary.
PETRONAS Aviation Sdn Bhd, a wholly-owned subsidiary of PETRONAS, markets PETRONAS’ aviation fuel in the global market, including to Malaysia Airlines, as well as to Shell, Ceylon Petroleum Corporation and Repsol YPF for locations in Buenos Aires, Colombo and Hong Kong.
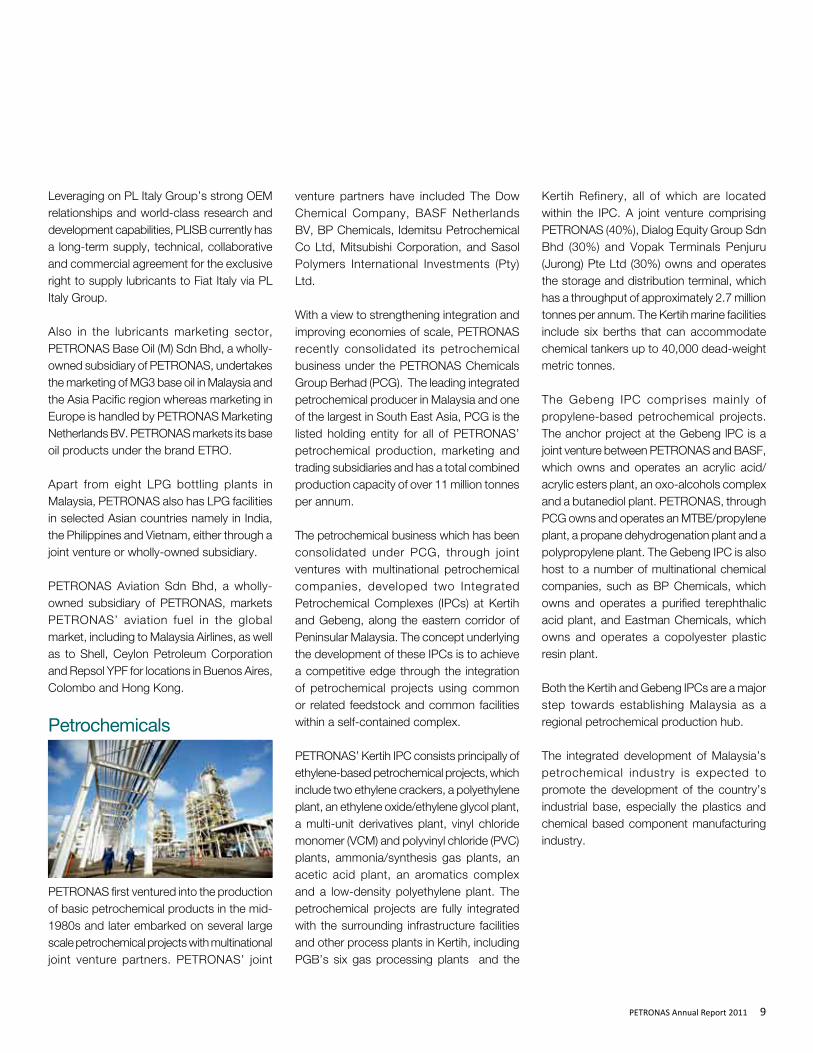
Petrochemicals
PETRONAS first ventured into the production of basic petrochemical products in the mid-1980s and later embarked on several large scale petrochemical projects with multinational joint venture partners. PETRONAS’ joint
venture partners have included The Dow Chemical Company, BASF Netherlands BV, BP Chemicals, Idemitsu Petrochemical Co Ltd, Mitsubishi Corporation, and Sasol Polymers International Investments (Pty) Ltd.
With a view to strengthening integration and improving economies of scale, PETRONAS recently consolidated its petrochemical business under the PETRONAS Chemicals Group Berhad (PCG). The leading integrated petrochemical producer in Malaysia and one of the largest in South East Asia, PCG is the listed holding entity for all of PETRONAS’ petrochemical production, marketing and trading subsidiaries and has a total combined production capacity of over 11 million tonnes per annum.
The petrochemical business which has been consolidated under PCG, through joint ventures with multinational petrochemical companies, developed two Integrated Petrochemical Complexes (IPCs) at Kertih and Gebeng, along the eastern corridor of Peninsular Malaysia. The concept underlying the development of these IPCs is to achieve a competitive edge through the integration of petrochemical projects using common or related feedstock and common facilities within a self-contained complex.
PETRONAS’ Kertih IPC consists principally of ethylene-based petrochemical projects, which include two ethylene crackers, a polyethylene plant, an ethylene oxide/ethylene glycol plant, a multi-unit derivatives plant, vinyl chloride monomer (VCM) and polyvinyl chloride (PVC) plants, ammonia/synthesis gas plants, an acetic acid plant, an aromatics complex and a low-density polyethylene plant. The petrochemical projects are fully integrated with the surrounding infrastructure facilities and other process plants in Kertih, including PGB’s six gas processing plants and the
Kertih Refinery, all of which are located within the IPC. A joint venture comprising PETRONAS (40%), Dialog Equity Group Sdn Bhd (30%) and Vopak Terminals Penjuru (Jurong) Pte Ltd (30%) owns and operates the storage and distribution terminal, which has a throughput of approximately 2.7 million tonnes per annum. The Kertih marine facilities include six berths that can accommodate chemical tankers up to 40,000 dead-weight metric tonnes.
The Gebeng IPC comprises mainly of propylene-based petrochemical projects. The anchor project at the Gebeng lPC is a joint venture between PETRONAS and BASF, which owns and operates an acrylic acid/acrylic esters plant, an oxo-alcohols complex and a butanediol plant. PETRONAS, through PCG owns and operates an MTBE/propylene plant, a propane dehydrogenation plant and a polypropylene plant. The Gebeng IPC is also host to a number of multinational chemical companies, such as BP Chemicals, which owns and operates a purified terephthalic acid plant, and Eastman Chemicals, which owns and operates a copolyester plastic resin plant.
Both the Kertih and Gebeng IPCs are a major step towards establishing Malaysia as a regional petrochemical production hub.
The integrated development of Malaysia’s petrochemical industry is expected to promote the development of the country’s industrial base, especially the plastics and chemical based component manufacturing industry.
PETRONAS Annual Report 2011 9
Downstream BusinessPETRONAS’ Downstream Business plays a strategic role in adding further value to petroleum resources through its integrated operations in refining & trading, marketing, and petrochemicals.
Refining & Trading
PETRONAS owns and operates three refineries in Malaysia, two in Melaka (collectively known as the Melaka Refinery Complex) and another in Kertih (the Kertih Refinery). The first refinery in Melaka is 100% owned by PETRONAS while the second refinery is 53% owned by the Group. PETRONAS also operates a Group III base oil refining (MG3) plant in the Melaka Refinery Complex.
PETRONAS also has an oil refining presence in Africa through its 80% owned subsidiary, Engen Petroleum Limited (Engen), a leading South African refining and marketing company that owns and operates a refinery in Durban, South Africa.
To carry out trading activities in crude oil and petroleum products in the Malaysian and international markets (including Asia, Africa and the Indian subcontinent), PETRONAS formed a whol ly-owned subsid iary, PETRONAS Trading Corporation Sdn Bhd (PETCO). PETCO also trades in crude oil and
petroleum products produced by affiliates and third parties, and has trading operations in Dubai and London via its wholly-owned subsidiaries PETCO Trading DMCC and PETCO Trading UK Limited, respectively.
Downstream Marketing
PETRONAS is engaged in domestic marketing and retailing activities through PETRONAS Dagangan Berhad (PDB), a majority-owned subsidiary, which markets a wide range of petroleum products, including gasoline, Liquefied Petroleum Gas (LPG), jet fuel, kerosene, diesel, fuel oil, asphalt and lubricants. Natural Gas for Vehicles (NGV) is marketed through PDB’s wholly-owned subsidiary PETRONAS NGV Sdn Bhd. PDB also has interest in Malaysia’s Multi-Product Pipeline and the Klang Valley Distribution Terminal that transports gasoline, jet fuel and diesel oil from the refineries to major demand centres in the Klang Valley. Besides marketing activities, PDB also jointly operates a jet fuel storage facility and hydrant line system at the Kuala Lumpur International Airport.
PETRONAS has also establ ished its downstream marketing presence in key Asian markets. PT PETRONAS Niaga Indonesia, a wholly-owned subsidiary, operates retail stations as well as markets petroleum products to industrial and commercial customers, and manages a network of local lubricant distributors in Indonesia. In Thailand similar activities are undertaken by PETRONAS Retail (Thailand) Co Ltd
that also supplies jet fuel to the Don Muang International Airport and the Suvarnabhumi International Airport, Bangkok. In China and India, the Group’s lubricant products are sold through PETRONAS’ wholly-owned subsidiary, PETRONAS Marketing China Company Ltd and PETRONAS Marketing India Private Ltd (PMIPL), respectively. PMIPL also has exclusive supply arrangements and collaborations with major Original Equipment Manufacturer (OEM) partners and car manufacturers.
In Africa, PETRONAS’ subsidiary Engen has the largest retail network of service stations in South Africa as well as a strong retail presence in the Sub-Saharan region in countries including Botswana, Burundi, Kenya, Lesotho, Malawi, Mauritius, Mozambique, Namibia, Réunion, Swaziland, Tanzania, Zambia and Zimbabwe. In the Sudan, PETRONAS Marketing Sudan Limited (PMSL), a wholly-owned subsidiary is engaged in the marketing and retailing of petroleum products and lubricants, as well as owns and operates retail stations. PMSL also provides into-plane service at the Khartoum International Airport and El-Obeid International Airport, which is the main base for the UN World Food Programme’s operations in the Sudan. PMSL also supplies fuel to the UN-African Union Mission peacekeeping force in Darfur and operates refueling stations and depots.
With a presence in more than 20 countries wor ldw ide , PETRONAS Lubr icants International Sdn Bhd (PLISB) is the lubricants arm of PETRONAS. PLISB has established a manufacturing base and distribution channel to sell its products in the European market by virtue of acquiring the FL Selenia Group, (re-named PL Italy Group) and offers lubricants, transmission, anti-freeze and functional fluids for automobiles, trucks, agricultural tractors and earth moving machinery as well as for other industrial equipment to the market.
Leveraging on PL Italy Group’s strong OEM relationships and world-class research and development capabilities, PLISB currently has a long-term supply, technical, collaborative and commercial agreement for the exclusive right to supply lubricants to Fiat Italy via PL Italy Group.
Also in the lubricants marketing sector, PETRONAS Base Oil (M) Sdn Bhd, a wholly-owned subsidiary of PETRONAS, undertakes the marketing of MG3 base oil in Malaysia and the Asia Pacific region whereas marketing in Europe is handled by PETRONAS Marketing Netherlands BV. PETRONAS markets its base oil products under the brand ETRO.
Apart from eight LPG bottling plants in Malaysia, PETRONAS also has LPG facilities in selected Asian countries namely in India, the Philippines and Vietnam, either through a joint venture or wholly-owned subsidiary.
PETRONAS Aviation Sdn Bhd, a wholly-owned subsidiary of PETRONAS, markets PETRONAS’ aviation fuel in the global market, including to Malaysia Airlines, as well as to Shell, Ceylon Petroleum Corporation and Repsol YPF for locations in Buenos Aires, Colombo and Hong Kong.
Petrochemicals
PETRONAS first ventured into the production of basic petrochemical products in the mid-1980s and later embarked on several large scale petrochemical projects with multinational joint venture partners. PETRONAS’ joint
venture partners have included The Dow Chemical Company, BASF Netherlands BV, BP Chemicals, Idemitsu Petrochemical Co Ltd, Mitsubishi Corporation, and Sasol Polymers International Investments (Pty) Ltd.
With a view to strengthening integration and improving economies of scale, PETRONAS recently consolidated its petrochemical business under the PETRONAS Chemicals Group Berhad (PCG). The leading integrated petrochemical producer in Malaysia and one of the largest in South East Asia, PCG is the listed holding entity for all of PETRONAS’ petrochemical production, marketing and trading subsidiaries and has a total combined production capacity of over 11 million tonnes per annum.
The petrochemical business which has been consolidated under PCG, through joint ventures with multinational petrochemical companies, developed two Integrated Petrochemical Complexes (IPCs) at Kertih and Gebeng, along the eastern corridor of Peninsular Malaysia. The concept underlying the development of these IPCs is to achieve a competitive edge through the integration of petrochemical projects using common or related feedstock and common facilities within a self-contained complex.
PETRONAS’ Kertih IPC consists principally of ethylene-based petrochemical projects, which include two ethylene crackers, a polyethylene plant, an ethylene oxide/ethylene glycol plant, a multi-unit derivatives plant, vinyl chloride monomer (VCM) and polyvinyl chloride (PVC) plants, ammonia/synthesis gas plants, an acetic acid plant, an aromatics complex and a low-density polyethylene plant. The petrochemical projects are fully integrated with the surrounding infrastructure facilities and other process plants in Kertih, including PGB’s six gas processing plants and the
Kertih Refinery, all of which are located within the IPC. A joint venture comprising PETRONAS (40%), Dialog Equity Group Sdn Bhd (30%) and Vopak Terminals Penjuru (Jurong) Pte Ltd (30%) owns and operates the storage and distribution terminal, which has a throughput of approximately 2.7 million tonnes per annum. The Kertih marine facilities include six berths that can accommodate chemical tankers up to 40,000 dead-weight metric tonnes.
The Gebeng IPC comprises mainly of propylene-based petrochemical projects. The anchor project at the Gebeng lPC is a joint venture between PETRONAS and BASF, which owns and operates an acrylic acid/acrylic esters plant, an oxo-alcohols complex and a butanediol plant. PETRONAS, through PCG owns and operates an MTBE/propylene plant, a propane dehydrogenation plant and a polypropylene plant. The Gebeng IPC is also host to a number of multinational chemical companies, such as BP Chemicals, which owns and operates a purified terephthalic acid plant, and Eastman Chemicals, which owns and operates a copolyester plastic resin plant.
Both the Kertih and Gebeng IPCs are a major step towards establishing Malaysia as a regional petrochemical production hub.
The integrated development of Malaysia’s petrochemical industry is expected to promote the development of the country’s industrial base, especially the plastics and chemical based component manufacturing industry.
10 PETRONAS Annual Report 2011
As an oil and gas corporation, PETRONAS continues to evolve and re-invent itself, changing the way it carries out its business in order to match the challenging realities of the world around it.
Today’s world is characterised by greater economic and social volati l ity, stiffer competition for dwindling resources and greater scrutiny of corporate conduct and behaviour. Clearly, the changing milieu presents a compelling case for PETRONAS to initiate real and meaningful change.
Given the imperative to raise the performance bar for the organisation and elevate its strategic and operational robustness to international standards, PETRONAS in early 2010 embarked on a Corporate Enhancement Programme (CEP).
The CEP was implemented to transform the Group’s structure and supporting elements, to help drive PETRONAS through the challenges for the next phase of growth. The CEP was conceptualised to:
• E n s u r e g r e a t e r Owne r s h i p &Accountability
• ElevateGovernance&Transparency tointernational standards
• Focus resources to Core Businessactivities
• Establish clear and visible SuccessionPlanning & Leadership Development
Realising the direct link between behaviours and structures that govern its actions and motivations in the corporate setting, PETRONAS’ management had set out to introduce key structural changes from the
very pinnacle of the organisation downwards which include:
• There-constitutionoftheBoardtoconsistof independent industry professionals and eminent personalities, selected for their experience and credibility to guide PETRONAS through the next phase of growth.
• TheestablishmentofBoardCommitteesincluding the Governance and Risk and Remuneration Committees, in addition to the existing Board Audit Committee to elevate standards of corporate governance.
• ThecreationoftheExecutiveCommittee(EXCO) as a guiding coalition allowing for collective decision making, a leadership bench and a platform for clear succession planning.
• The re f i nement o f PETRONAS’organisational structure aimed at aligning our core businesses along its integrated core activities.
PETRONAS has been able to elevate the Group’s levels of openness and transparency, driven by other self-imposed initiatives including regular and consistent disclosure of its financial performance, as well as timely public announcements of its initiatives and its future plans and goals. This allows stakeholders including the public-at-large to assess the health of the Corporation and take an informed position in response to its business performance and pipeline of ventures moving forward. At the same time, the announcement of its performance on a quarterly basis allows the management and staff of PETRONAS to track and measure its business performance and increase efforts
towards meeting or exceeding planned targets.
Positive changes have occurred during the last year resulting in more dynamic and impactful decisions and initiatives. The growth momentum has been intensified, driven by strategic stewardship from the Board on PETRONAS’ direction, with elevated standards of corporate governance mindful of balancing returns with risks.
In its own capacity, the EXCO has successfully driven strategic execution expediently, integrating relevant portions of the PETRONAS value chain to achieve optimal returns for the Group. Stringent risk parameters govern all decision making processes cascaded throughout the organisation, from the Board. The effectiveness of the newly established EXCO structure, in achieving impactful integrated solutions was acknowledged and replicated by the Executive Vice Presidents (EVPs) for their respective core businesses. The mirroring of functions in driving strategic growth and operational efficiency is done in an integrated manner.
The EXCO is at the forefront of the CEP, leading by example and instituting wide-ranging changes in their respective businesses, in driving desired high performance behaviour to be eventually embedded in the DNA and culture of PETRONAS.
The refinement of PETRONAS’ organisational structure to support its core businesses has helped prioritise its allocation of capital, energy and time on investments that will contribute better to its growth. There is greater discipline in controlling costs and stronger focus on the
Corporate Enhancement Programme – A Year On

PETRONAS Annual Report 2011 11
to reward the high performers, develop those with potential and ensure consequence management where necessary. To support the successful realisation of PETRONAS’ hard and soft targets, a premium is placed on greater ownership and accountability, that brings with it a corresponding responsibility to initiate decision making, so long as this contributes positively towards the attainment of PETRONAS’ key goals.
The all encompassing CEP includes dynamic human resource management policies and strategies, incorporating key improvements to meet the changing needs of PETRONAS’ globally diverse workforce. With a strong emphasis on meritocracy, recognising and rewarding performance and rigorous consequence management, PETRONAS is
reinvigorating its Human Resource practices designed to retain critical professionals and attract experienced and capable talents to infuse the Group with the industry’s best, who will bring with them value-adding knowledge, practices and new vitality.
Clearly, the CEP aims to strengthen PETRONAS while providing nimbleness to capitalise on opportunities and reinforce its foundations to weather external shocks in a fast-changing, volati le and often unpredictable industry environment. This allows the Corporation to move decisively in initiating key efforts in favour of business growth and strengthen a culture of high-performance and excellence among staff.
bottom line. Similarly, the new way of thinking has guided PETRONAS to objectively divest non-performing ventures. All of this has made PETRONAS’ operations better geared to achieve hard business targets.
To reinforce the urgency for change and to cascade this to the individual level, the Key Performance Indicators (KPIs) of PETRONAS’ top management are cascaded down to the KPIs of the individual staff. In this way, the success of achieving the larger scorecard targets will be the result of the cumulative effort of each and every one within the organisation.
As such, in driving accountability, the performance of each individual, at all levels, will be subjected to a rigorous appraisal process
BOARD OF DIRECTORS
EVPEXPLORATION &
PRODUCTION
Dato’ Wee Yiaw Hin
VPCORPORATESTRATEGICPLANNING
Md Arif Mahmood
EVPGAS & POWER
Datuk Anuar Ahmad
EVPDOWNSTREAM
Datuk Wan ZulkifleeWan Ariffin
EVPFINANCE
Datuk Manharlal Ratilal
VPTECHNOLOGY &ENGINEERING
Dr Colin WongHee Huing
VPHUMAN RESOURCE
MANAGEMENT
JuniwatiRahmat Hussin
SGMGROUP CORPORATE
AFFAIRS
Mohammad MedanAbdullah
VPLEGAL
Dato’ Mohammed AzharOsman Khairuddin
PRESIDENT &CHIEF EXECUTIVE OFFICER
Dato’ Shamsul Azhar Abbas
EVP - Executive Vice PresidentVP - Vice PresidentSGM - Senior General Manager
*Executive Committee comprises the President & Chief Executive Officer and the four Executive Vice Presidents
PRESIDENT/CEOMISC BERHAD
Datuk NasarudinMd Idris
GROUP CEOKLCC (H) SB
Hashim Wahir
PETRONAS Corporate Structure

12 PETRONAS Annual Report 2011
VP & CEOPETRONASExploration
Effendy Cheng Abdullah
EVPExploration &Production
Dato’ Wee Yiaw Hin
VP & CEOPETRONAS
Development & Production
Datuk Abdullah Karim
VPPetroleum
Management
Ramlan A Malek
VPGlobal LNG
Adnan Zainol Abidin
EVPGas & Power
Datuk Anuar Ahmad
VPInfrastructure &
Utilities
Pramod KumarKarunakaran
Exploration & Production Business Leadership Team
Gas & Power Business Leadership Team

PETRONAS Annual Report 2011 13
EVPDownstream
Datuk Wan ZulkifleeWan Ariffin
VPDownstream Marketing
Amir Hamzah Azizan
VPRefining & Trading
M Farid Adnan
VPDownstream Operations
Ir Kamarudin Zakaria
President/CEOPCG
Dr Abd Hapiz Abdullah
EVPFinance
Datuk Manharlal Ratilal
VPTreasury
Nuraini Ismail
SGMFinance & Accounts
Services
Rashidah Alias
VPSupply Chain &
Risk Management
M Rashid Yusof
HeadTax
Bhupinder Singh
Downstream Business Leadership Team
Finance Division Leadership Team

14 PETRONAS Annual Report 2011
Tan Sri Dr Wan Abdul Aziz Wan AbdullahIndependent Director
Tan Sri Dr Wan Abdul Aziz is a member of the PETRONAS Board and currently serves as the
Secretary-General of Treasury in the Ministry of Finance. He also sits on the Board of various
organisations including Malaysian Airline System Berhad, Bintulu Port Holdings Berhad, Bank
Negara Malaysia, Retirement Fund Incorporated and the Federal Land Development Authority
(FELDA).
02
Dato’ Shamsul Azhar AbbasActing Chairman of the PETRONAS Board,
President & Chief Executive Officer
Dato’ Shamsul Azhar Abbas was appointed to the PETRONAS Board as Acting Chairman
and as President and Chief Executive Officer of PETRONAS on 10 February 2010. He also
serves as Chairman of the Board of several of the Group’s subsidiaries, including wholly-owned
exploration and production arm PETRONAS Carigali Sdn Bhd, South Africa-based petroleum
refining and marketing company Engen Petroleum Limited and public-listed MISC Berhad. Prior
to his current appointment, Dato’ Shamsul, who began his career with PETRONAS in 1975,
held various senior management positions within the Group.
01
Dato’ Muhammad IbrahimIndependent Director
Dato’ Muhammad Ibrahim was appointed to the PETRONAS Board in April 2010. He is currently
the Deputy Governor of Bank Negara Malaysia. His areas of expertise include finance, banking,
supervision and regulation, strategic planning, insurance and financial markets. He is a trustee of
the Tun Ismail Ali Chair Council, a former commissioner of the Securities Commission of Malaysia
and Senior Associate of the Institute of Bankers Malaysia. He sits on the Board of the Retirement
Fund Incorporated and is a member of the Malaysian Institute of Accountants.
03
Krishnan CK Menon, FCAIndependent Director,
Chairman of the PETRONAS
Board Audit Committee
Krishnan CK Menon was appointed to the PETRONAS Board in April 2010. He is a
Fellow of the Institute of Chartered Accountants in England and Wales, a member of
the Malaysian Institute of Accountants and the Malaysian Institute of Certified Public
Accountants. He is currently Chairman of Putrajaya Perdana Berhad, SCICOM (MSC)
Berhad, KLCC Property Holdings Berhad and KLCC (Holdings) Sdn Bhd. He is a
non-executive director of MISC Berhad and is also the Chairman of the Board Audit
Committee in MISC Berhad.
04
Tan Sri Dato’ Seri Hj Megat Najmuddin Datuk Seri Dr Hj Megat KhasIndependent Director,
Chairman of the PETRONAS
Governance & Risk Committee
Tan Sri Megat Najmuddin was appointed to the PETRONAS Board in April 2010. He
is currently the President of both the Federation of Public Listed Companies Berhad
(FPLC) and the Malaysian Institute of Corporate Governance (MICG). He currently
serves as the Non-Executive Chairman of several public listed companies and is active
in Non-Governmental Organisations (NGOs).
05
Datin Yap Siew BeeIndependent Director,
Chairperson of the PETRONAS
Remuneration Committee
Datin Yap Siew Bee was appointed to the PETRONAS Board in April 2010. She is
currently Consultant to the firm of Mah-Kamariyah & Phillip Koh. She has advised as
legal counsel on significant oil and petrochemical projects in Malaysia and has extensive
oil and gas advisory experience including negotiation of international oil and gas ventures
on behalf of PETRONAS. Her areas of expertise include mergers and acquisitions,
corporate finance, corporate restructuring and commercial ventures.
06
Dato’ Mohamad Idris MansorIndependent Director
Dato’ Mohamad Idris Mansor was appointed to the PETRONAS Board in April 2010.
He has extensive experience in the oil and gas industry, having held various senior
management positions within the Group including as Senior Vice President. He is a
Board member of PETRONAS Carigali Sdn Bhd. He was also the International Business
Advisor to PTT Exploration and Production Company of Thailand prior to his current
appointment.
07
01 02 03 04 05 06 07
Board of Directors

PETRONAS Annual Report 2011 15
Dato’ Wee Yiaw HinExecutive Director
Dato’ Wee Yiaw Hin was appointed to the PETRONAS Board in May 2010. He is a
member of the Executive Committee, Management Committee and serves on various
Boards of subsidiary companies in the PETRONAS Group. He is the Executive Vice
President of Exploration & Production Business. Previously, he worked in Talisman and
Shell where he held various senior management positions.
11
Datuk Anuar AhmadExecutive Director
Datuk Anuar Ahmad is a member of the PETRONAS Board, Executive Committee and
Management Committee. He is the Executive Vice President of Gas & Power Business.
Prior to this appointment, he served as Vice President of Human Resource Management
Division and, earlier, as Vice President of Oil Business. He also sits on the Board of
several companies within the PETRONAS Group.
10
Datuk Mohd Omar MustaphaIndependent Director
Datuk Mohd Omar Mustapha was appointed to the PETRONAS Board in September
2009. He is the Founder and Chairman of Ethos & Company, a boutique Malaysian-based
management consulting firm and a General Partner of Ethos Capital, a leading regional
private equity fund. He is a member of the Economic Council chaired by the Prime
Minister, an independent director of Symphony House Berhad and Air Asia Berhad, an
Eisenhower Fellow, a founding member of the World Islamic Economic Forum’s Young
Leaders Roundtable and a YGL member of the World Economic Forum in Davos.
08
Datuk Wan Zulkiflee Wan AriffinExecutive Director
Datuk Wan Zulkiflee Wan Ariffin is a member of the PETRONAS Board, the Executive
Committee, Management Committee and serves on various Boards of several Joint
Ventures and subsidiary companies in the PETRONAS Group. He is the Executive Vice
President of Downstream Business. He is the Chairman of two of PETRONAS’ public
listed subsidiaries namely PETRONAS Chemicals Group Berhad and PETRONAS
Dagangan Berhad. He is also a member of the Board of Directors of MISC Berhad and
is the Industry Advisor to the Engineering Faculty of Universiti Putra Malaysia.
09
Datuk Manharlal RatilalExecutive Director
Datuk Manharlal Ratilal is a member of the PETRONAS Board, Executive Committee
and Management Committee. He is the Executive Vice President of Finance. He also
sits on the Board of several subsidiaries of PETRONAS. His areas of expertise include
corporate finance, mergers and acquisitions, and the capital markets.
12
Dato’ Mohammed Azhar Osman KhairuddinCompany Secretary
Dato’ Mohammed Azhar Osman Khairuddin is the Company Secretary of PETRONAS
since 1 April 2000. He joined PETRONAS in 1979 as a Legal Officer and currently holds
the position of Vice President, Legal. He is a member of the PETRONAS Management
Committee and serves on the Board of Directors of several companies within the
PETRONAS Group. He is also a member of the International Bar Association.
13
Faridah Haris HamidJoint Company Secretary
Faridah Haris Hamid is the Head of Legal Finance & Corporate Secretariat, Legal
Division. She spent 10 years in the banking sector before joining PETRONAS in 1992.
She is the Joint Secretary to the PETRONAS Board of Directors and Secretary to the
Executive Committee of PETRONAS. Her areas of legal expertise include corporate
finance, capital markets and corporate governance.
14
08 09 10 11 12 13 14

16 PETRONAS Annual Report 2011
Audit Committee
Krishnan CK Menon, FCAChairman
Dato’ Mohamad IdrisMansor
Tan Sri Dr Wan Abdul Aziz Wan Abdullah
Dato’ MuhammadIbrahim
Board Committees

PETRONAS Annual Report 2011 17
Governance & Risk Committee
Tan Sri Dato’ Seri Hj Megat NajmuddinDatuk Seri Dr Hj Megat Khas
Chairman
Dato’ MuhammadIbrahim
Krishnan CK Menon, FCA
Remuneration Committee
Datin Yap Siew BeeChairperson
Datuk Mohd OmarMustapha
Datuk Anuar Ahmad

18 PETRONAS Annual Report 2011
Faridah Haris HamidSecretary
Dato’ Shamsul Azhar Abbas
President & Chief Executive Officer
Datuk Wan Zulkiflee Wan AriffinExecutive Vice President
Downstream
Datuk Anuar AhmadExecutive Vice President
Gas & Power
Datuk Manharlal RatilalExecutive Vice President
Finance
Dato’ Wee Yiaw HinExecutive Vice PresidentExploration & Production
Executive Committee

PETRONAS Annual Report 2011 19
Management Committee
Datuk Wan ZulkifleeWan Ariffin
Executive Vice PresidentDownstream
Dato’ Wee Yiaw HinExecutive Vice PresidentExploration & Production
Datuk Manharlal RatilalExecutive Vice President
Finance
Dr Colin Wong Hee HuingVice President
Technology & Engineering
Dato’ Shamsul Azhar AbbasPresident & Chief Executive Officer
Datuk Anuar AhmadExecutive Vice President
Gas & Power
Ramlan Abdul MalekVice President
Petroleum Management
Datuk Nasarudin Md IdrisPresident/CEOMISC Berhad
Md Arif MahmoodVice President
Corporate Strategic Planning
Juniwati Rahmat HussinVice President
Human Resource Management
Dato’ Mohammed AzharOsman Khairuddin
Vice PresidentLegal
Mohammad Medan AbdullahSenior General ManagerGroup Corporate Affairs
Hazleena HamzahSecretary

20 PETRONAS Annual Report 2011
President & CEO andActing Chairman’s Message
In discharging its responsibilities as a
custodian to the people and the nation, the
PETRONAS Group of Companies delivered
a solid financial and operational performance
for the Financial Year Ended 31 March 2011
that reflects the enduring strength of its
proven strategy of integration, adding value
and globalisation, as well as the gains that
have accrued from further progress in the
Groupwide implementation of its Corporate
Enhancement Programme (CEP), reaffirming
once again PETRONAS’ ability to return
greater value to its stakeholders.
Dato’ Shamsul Azhar Abbas

PETRONAS Annual Report 2011 21
Group revenue for the year stood at
RM241.2 billion, an increase of 14.4% from
last year — achieved despite significant
headwinds posed by the strengthening of
the Ringgit against the US dollar. Profit
Before Tax (PBT) rose 34.5% to RM90.5
billion and enabled the Group to more than
comfortably meet its dividend obligations
as well as sustain its capital expenditure
(CAPEX) requirements for the year;
Shareholder’s Funds meanwhile having
increased further by 8.6% to RM263.8
billion. Return on Average Capital
Employed (ROACE) was higher at 17.5%
against last year’s 15.9%, comparable to
those of its peers — namely, oil majors and
other national oil companies.
A marked turnaround in industry conditions
provided the backdrop against which this
performance was attained. During the
year, world oil and gas demand staged
an exceptionally vigorous rebound as
momentum in the global economic
recovery, led primarily by the emerging
economies, continued to strengthen.
Stronger demand, coupled with the
effects of a steadily weakening US dollar
and rising geopolitical risks in the Middle
East and North Africa as the year drew
to a close, helped propel crude oil prices
higher. Average key crude benchmark
prices for the year increased 23% relative
to the previous year’s; Malaysia’s Tapis
averaging USD89.38 per barrel against last
year’s USD72.69 per barrel.
However, equally important were the
concerted efforts expended by the Group
to grow and improve the efficient conduct
of its business that had strengthened
its ability to capture the opportunities
afforded by the industry upswing, both
immediate and longer-term. In Malaysia,
eleven new PSCs were awarded, ten
new discoveries were made and three
new fields were brought onstream.
Abroad, five Petroleum Arrangements
were secured, including the Group’s first
upstream venture in South America — the
Carabobo 1 Project in Venezuela’s Orinoco
Region. Combined efforts in exploration,
intensified and enhanced recovery, as
well as acquisitions, succeeded in adding
two-and-a-half barrels of oil equivalent to
Total Group Petroleum Resources for every
barrel that was produced during the year.
Management’s resolve to highgrade the
Group’s international upstream portfolio
was brought to bear with PETRONAS
exiting Ethiopia and Timor Lesté, as well as
divesting its interests in Pakistan — moves
that pave the way for the redeployment of
vital resources in favour of ventures that
will bring greater focus and synergy to the
Group’s broader strategic goals.
World Oil Demand
World Crude Oil Production Capacity *
77
79
81
8385.2
86.484.9 84.4
87.286.3 86.7 87.0
89.4
91.1
85
87
89
91
* includes non-OPEC production, OPEC crude oil production capacity and OPEC natural gas liquids** as a percentage of demand
Million barrels per day
FY2010 FY2011FY2009FY2008FY2007
Crude Oil Production
Surplus Capacity **
Source: EIA
45
60
80
50
65
85
55
7570
90
95
68.99
87.5790.74
72.69
89.38
60.28
78.5882.88
68.71
84.15
FY2010 FY2011FY2009FY2008FY2007
USD per barrel
Crude Oil Prices
Tapis (Platts) WTI OPEC Basket
4.5%5.9%
2.5%0.3%1.3%

22 PETRONAS Annual Report 2011
Developments in other areas of operations
similarly reflected efforts to expand and
enhance the efficiency of the business.
Improved plant performance during the
year was a key contributing factor in having
enabled the PETRONAS LNG Complex
(PLC) in Bintulu achieve its highest-
ever levels of production and exports
of LNG. Similarly, improved utilisation
rates sustained higher volumes of crude
processing at the Group’s Malaysia
refineries. PETRONAS’ maiden venture
in the unconventional gas business — the
Gladstone LNG (GLNG) in Queensland,
Australia — also took a major step forward
towards commercialisation, with all project
partners having committed to a Final
Investment Decision (FID). GLNG, whose
commissioning cargo is expected by 2015,
will not only seal the Group’s presence
in a dynamic and increasingly important
segment of the global gas value-chain, but
also make a profound contribution towards
enhancing the security of supply of natural
gas to Peninsular Malaysia in the years
ahead.
The year also saw PETRONAS embarking
on numerous key initiatives aimed at
revitalising growth in the Malaysian oil and
gas industry, as well as support efforts in
nation-building. Leveraging on new tax
incentives provided by the Government of
Malaysia, PETRONAS introduced a new
petroleum arrangement solution — the
Risk Service Contract (RSC) — designed
to unleash the potential of Malaysia’s
small and marginal fields on a fast-track
development basis. The first RSC was
awarded in January 2011 for the Berantai
Field, offshore Peninsular Malaysia and
First Gas is expected to be achieved by
end-2011.
Work on the country’s first LNG
Regasification Terminal in the state of
Melaka also commenced during the year and
The year also saw PETRONAS embarking on
numerous key initiatives aimed at revitalising
growth in the Malaysian oil and gas industry,
as well as support efforts in nation-building.

PETRONAS Annual Report 2011 23
is achieving satisfactory progress towards
its targeted completion date of July 2012.
The import of LNG into Peninsular Malaysia
promises not only to unlock latent high-
value gas demand in helping to support
the growth of the country’s manufacturing
sector, but also potentially allow significant
reductions in its total annual energy costs
by expanding the fuel options available to
Malaysian manufacturers.
PETRONAS also initiated the Refinery and
Petrochemical Integrated Development
(RAPID) project, a major downstream
investment to be located in Pengerang,
Johor aimed at strengthening the Group’s
ability to ride the expected robust growth
in energy and chemicals demand in East
Asia, particularly in the specialty chemicals
segment. The project is a significant
contribution by the Group that will support
wider efforts to position southern Johor
as an oil and gas hub for the region,
leveraging on the pre-existing strengths of,
and mutually complementing Singapore.
Furthermore, it will provide the impetus
to spur the area’s economic development
in the same manner PETRONAS’
investments in Kertih 20 years ago had had
a transformational impact on the locality,
help diversify Malaysia’s export capabilities
and contribute to building a critical mass
of human talent in the country through
the creation of up to 4,000 employment
opportunities of highly-skilled oil and gas
professionals.
PETRONAS also listed two of its subsidiaries
on Bursa Malaysia’s main market during
the year — namely, Malaysia Marine and
Heavy Engineering Holdings Berhad (MHB),
a subsidiary of the Group’s shipping arm
MISC Berhad and PETRONAS Chemicals
Group Berhad (PCG). Both listings have
not only helped broaden and deepen
Malaysia’s capital market — indeed, PCG’s
Initial Public Offering (IPO) was the largest-
ever in Southeast Asia — but also provided
avenues through which the investing public
can now participate directly in the growth
of the various PETRONAS businesses.
Financial Highlights
• Group Revenue improved intandem with higher oil prices and volumes sold.
• EBITDA margin increased to44.7% despite rising costs and the negative impact of the Ringgit’s strengthening against the US dollar.
• Achieved a higher ROACE of17.5%, comparable to those of the oil majors and other national oil companies — a reflection of improved overall performance.
Operational Highlights
• Secured17newupstreamventuresin Malaysia and abroad, including the Carabobo 1 Project in Venezuela and also the award of the country’s first Risk Service Contract (RSC).
• AttainedahigherGroupResourceReplenishment Ratio (Triple-R) of 2.5 times for combined oil and gas resources.
• Achievedthehighest-everlevelofproduction and exports of LNG from the PETRONAS Liquefied Natural Gas Complex (PLC).
• A n n o u n c e d t h e R e f i n e r yand Petrochemical Integrated Development (RAPID) project, a major integrated refinery and petrochemicals complex to be located in southern Johor.
• Listed two subsidiaries onBursaMalaysia — Malaysia Marine and Heavy Engineering Holdings Berhad (MHB) and PETRONAS Chemicals Group Berhad (PCG).

24 PETRONAS Annual Report 2011
Looking ahead, the Group’s business
priorities and key areas of focus will
continue to be shaped by an all-out push
for growth, consistent with efforts to
further secure the long-term sustainability
of its business. To this end, PETRONAS
will be guided by the strategic imperatives
of its Corporate Agenda, which have
been conceived explicitly to support its
aspiration of becoming a “Global Energy
Champion Known for its Resilience and
Distinctiveness”, and will continue to
leverage on the transformational objectives
of the CEP to create a high-performance
culture throughout the Group. PETRONAS
will also seek to distinguish itself as an
organisation that “dares-to-be-different”,
possessing both the will and energy to drive
flawless execution even under challenging
circumstances — a resolve neatly embodied
by its new corporate positioning statement,
“Reimagining Energy”.
Through this single-minded pursuit for
growth and performance excellence,
PETRONAS is forging ahead as an entity
with a clear strategic focus, enhanced
organisational robustness and a more
distinctive performance-oriented, capability-
driven culture — all of which will enhance
its ability to continue creating and returning
greater value to its stakeholders.
By way of a final note, I would like to take
this opportunity to place on record my
sincere appreciation to all PETRONAS
employees whose dedication, sacrifice and
steadfast adherence to the Company’s
Shared Values of Loyalty, Integrity,
Professionalism and Cohesiveness was
instrumental in having made this year’s
achievements possible. I would also like to
thank members of the PETRONAS Board
of Directors for their wise counsel, guidance
and stewardship of the Corporation. A
heartfelt tribute goes out to my colleagues
in the Executive Committee (EXCO),
Looking ahead, the Group’s business
priorities and key areas of focus will continue
to be shaped by an all-out push for growth,
consistent with efforts to further secure the
long-term sustainability of its business.
PETRONAS Annual Report 2011 25
whose resolve, vision and commitment to
PETRONAS were instrumental in driving
the solid performance the Group achieved
within such a brief period of time, and
also to the members of the Management
Committee each of whom played a vital
enabling role to this end.
I would also like to express my deepest
gratitude to the Government of Malaysia
for the continued trust and support
granted to PETRONAS, and likewise
to our host governments and various
communities as well as stakeholders that
play host to our operations. My sincere
thanks also goes to our business partners
for their understanding and co-operation,
as well as our clients and customers for
their continued loyalty and confidence
in us. Indeed, your continued support,
partnership and friendship lies at the heart
of PETRONAS’ success — an honour that
PETRONAS deeply appreciates and will
seek always to uphold.
DATO’ SHAMSUL AZHAR ABBAS President & CEO and Acting Chairman
Key Strategiesand Plans
Exploration & Production• Pursuea3.5%CAGRproduction
growth over 5 years
• ResourceReplenishmentRatio>1on a 3-year rolling average basis
• Maximise value creation andgrowth within Malaysia
• Highgradeportfolioofinternationalassets
• AnchorcapabilitybuildingonEOR& CO2 developments
• Explorenewplaytypes
Gas & Power• Securesupplyandmaximisevalue
of gas within Malaysia
• StrengthenandgrowLNGpositionin Asia Pacific and Atlantic
• Establishandgrowenergytrading
in Europe
Downstream• Strengthen presence in selected
markets and pursue opportunistic growth in attractive markets
• Rationalise non-value addingassets
• Grow refining and petrochemicalcapacity and product range
• Buildglobaltradingandmarketing
portfolio

26 PETRONAS Annual Report 2011
Corporate Governance & Transparency
PETRONAS believes that good Corporate Governance is fundamental to ensuring the organisation’s competitiveness, growth and sustainability. Implementing best practices in Corporate Governance is important to PETRONAS given the Group’s strong global orientation and the growing expectations of stakeholders worldwide for good corporate citizenship.
Furthermore, enhanced standards of governance and transparency will serve to strengthen the Group’s organisational effectiveness and drive a high-performance culture within the organisation, and are both essential for PETRONAS to compete successfully in today’s challenging industry environment.
In cognisance of this, the Board maintains and requires the Management to uphold the highest standards of governance, transparency and ethical conduct. PETRONAS has adhered to the highest standards in governance throughout its corporate history, and indeed responsible business has always been a central tenet, as inscribed in our Mission Statement. Today, with a well-established global footprint, PETRONAS continues to pave the way towards ensuring the sustainability of good corporate governance based on international standards.
Following the Corporate Transformation exercise of 2010 and to further elevate the importance of governance and transparency for the Group, the Management of PETRONAS established a Corporate Governance & International Compliance Unit, under the purview of the Legal Division. This unit assists the Management and the Board via the Governance & Risk Committee on a range of current issues relating to Corporate Governance.
As part of PETRONAS’ on-going efforts to enhance the application of the highest standards of governance across the Group in line with best global practices, the Company has a Board Education Programme for all Board members under the PETRONAS Group. The programme is designed to keep the Company’s directors appraised of critical developments relating to 21st Century boardroom and global governance issues such as corruption, ethics & integrity and governance in emerging markets.
Business Ethics
PETRONAS is committed to complying with the highest ethical standards and applicable anti-corruption laws. This is in line with PETRONAS’ core values, business principles and various internal policies which reflect the continuous focus on making ethics and anti-corruption an integral part of PETRONAS’ business operations. Such focus has helped to promote strong ownership in relation to compliance and ethics at all levels.
PETRONAS Board Governance Framework
The Board governance framework was redesigned following the corporate enhancement measures adopted in April 2010.
The Board directs the Company’s strategic planning, financial, operational and resource management, risk assessment and provides effective oversight of the executive management. Certain functions are delegated to Board Committees consisting of Non-Executive Directors as detailed in later sections. The Chairman leads the Board, and the President & Chief Executive Officer (CEO) leads the executive management of the Company and provides direction for the implementation of the strategies and business plans as approved by the Board and the overall management of the business operations Group-wide.
In this regard, the President & CEO has the support of the Executive Committee and Management Committee which he chairs.
The Executive Committee’s role is to assist the President & CEO in his management of the business and affairs of the Company particularly in relation to strategic business development, high impact and high value investments and cross-business issues of the Group. It also serves as a platform for the structured succession planning for the President & CEO in the Company.
The Management Committee continues to act as the advisory and deliberative body that supports the President & CEO and the Executive Committee and implements all the Board resolutions and policies, as well as supervise all management levels in the PETRONAS Group.
The Board
For the period up to FY 2010/11, the Board was made up of the Acting Chairman and President & CEO, five Executive Directors including the CEO and seven Non-Executive Directors. A list of the current Directors, with their biographies, is provided on pages 14 to 15.
Currently, the position of the Chairman is vacant, and the President & CEO is assuming the responsibility until such time as the shareholder makes an official appointment.
The Chairman’s role is to provide leadership to the Board, facilitate the meeting process and ensure that the Board and its Committees function effectively. Together with the Company Secretary, he ensures that the Board members receive regular and timely information regarding the Company prior to Board meetings. The Board members also have access to the Company Secretary for any further information they may require.
During the review period, the Board met a total of 18 times (which include five Special Board Meetings) with a formal schedule of matters reserved to it. These include the consideration of the Company’s long term strategy, plan & budget, monitoring of Management Performance, introduction of CEO’s and Executive Vice Presidents’ (EVP) Performance Scorecards, Talent Management and the Company’s Performance Review. In addition to managing the Company’s financial reporting, the Board needed to monitor and
Statement of CorporateGovernance
PETRONAS Annual Report 2011 27
identify material risks to PETRONAS and ensure that internal systems of risk management and control are in place to mitigate such risks.
The Special Board Meetings, which were held five times in the FY 2010/11, have also given the directors the opportunity to engage in intensive deliberation on PETRONAS’ long term strategy, plan & budget and talent management. These meetings have also been used as a platform for the induction and orientation of the Independent Non-Executive Directors. Such induction and orientation practice is crucial as it provides an informative environment for the Independent Non-Executive Directors to understand the business more closely. In fact, two out of the five meetings were held in the vicinity of business operations to allow the Independent Non-Executive Directors to witness for themselves PETRONAS’ commercial and performance scales.
Through these Special Board meetings, the Board of Directors had gained a better understanding and appreciation of the challenges and issues faced by the Company and the Group and also a greater understanding of PETRONAS’ business, plans, strategies and financial performances. These special meetings were also designed to foster greater collaboration and networking amongst the directors and the management as well as all staff at all levels.
Echoing the 2010 Corporate Transformation imperatives of “Greater Ownership & Accountability”, the Board has also sanctioned the introduction of the CEO’s and EVPs’ Performance Scorecards with a view to enhancing the performance of the top management of the Company.
Board Balance and Independence
The current Board composition reflects a good mix of experience, backgrounds, skills and qualifications and is considered to be of an appropriate size. This diversity is identified by the members as one of the strengths of the Board.
The Non-Executive Directors combine broad business and commercial experience with independent and objective judgment. The
balance between the Non-Executive and Executive Directors enables the Board to provide clear and effective leadership and maintain the highest standards of integrity across the Company’s business activities.
All Non-Executive Directors are considered by the Board to be wholly independent.
In accordance with the provisions of the Company’s Articles of Association, at least one-third of the Directors shall retire from office once every subsequent year but shall be eligible for re-election. This retirement by rotation shall only be applicable to Non-Executive Directors.
Board Committees
There are three Board Committees made up primarily of Non-Executive Directors, namely the Audit Committee, the Governance and Risk Committee and the Remuneration Committee.
Audit CommitteeEstablished in 1985, the PETRONAS Board Audit Committee assists the Board in fulfilling its oversight functions in relation to internal controls, risk management and financial reporting of the Company. The Committee provides the Board with the assurance of the quality and reliability of the financial information issued by the Company whilst ensuring the integrity of the Company’s assets.
The Board Audit Committee is comprised entirely of Non-Executive Directors. The members are as shown on page 16.
Governance & Risk CommitteeReflecting the greater emphasis by the Board on risk management, the Nomination and Corporate Governance Committee was recently renamed Governance & Risk Committee. It now undertakes the oversight of this function for the Board.
The Committee continues to be responsible in the assessing of the performance of the Board, reviewing management succession planning as well as identifying, nominating and orientating new Directors.
The Committee also reviews and recommends to the Board the appropriate corporate governance policies and procedures in accordance with international governance and
best practices. The Committee will have access to the Corporate Governance & International Compliance Unit, recently established by the Management under the purview of the Legal Division, to ensure a structured, consistent and centrally-driven integrated approach to global governance and compliance for the PETRONAS Group.
The members of the Governance & Risk Committee are as shown on page 17.
Remuneration CommitteeThe Remuneration Committee was established to assist the Board in discharging its responsibilities in the determination of the remuneration and compensation of the Executive Directors and certain Senior Management of the Company. The Committee determines and agrees with the Board on the remuneration policy for the President & CEO, the Executive Directors and certain Senior Management of the Company. The Committee also determines and agrees with the Board on the matter of the President & CEO’s Performance Scorecard.
The members of the Remuneration Committee are as shown on page 17.
Statement of Anti-CorruptionPETRONAS is committed to complying with the highest ethical standards and applicable anti-corruption laws. The PETRONAS Code of Conduct and Discipline expressly prohibits the giving and acceptance of bribes by PETRONAS employees. This is in line with PETRONAS’ core values, business principles and various internal policies which reflect its focus on making ethics and anti-corruption an integral part of PETRONAS’ business operations. PETRONAS’ management is committed to communicating the vital importance of strong ethics and anti-corruption practices to all levels of the organisation.

28 PETRONAS Annual Report 2011
Statement on Internal Control
The Board is pleased to provide the following
statement which outlines the nature and scope
of internal control of Petroliam Nasional Berhad
and its subsidiaries (PETRONAS Group) during
the year in review.
Board’s Responsibilities
The Board recognises the importance of sound internal control and risk management practices to good corporate governance with the objective of safeguarding the shareholders’ investment and the Group’s assets. The Board affirms its overall responsibility for the Group’s system of internal controls and for reviewing the adequacy and integrity of those systems including financial and operational controls, compliance with relevant laws and regulations and risk management.
The Group has in place an ongoing process
for managing the significant risks affecting
the achievement of its business objectives
throughout the period, which includes
identifying, evaluating, managing and monitoring
these risks that has been in place for the year
and up to the date of approval of the Annual
Report and Financial Statements.
The Group’s system of internal control seeks to
manage and control risks appropriately, rather
than eliminate the risk of failure to achieve
business objectives. Because of the inherent
limitations in all control systems, these internal
control systems can only provide reasonable
and not absolute assurance against material
misstatement or loss or the occurrence of
unforeseeable circumstances.
Risk Management
Having regard to managing risk as an inherent part of the Group’s activities, risk management
and the ongoing improvement in corresponding control structures in all significant risk areas including among others, financial, health, safety and environment, operations, geopolitics, trading and logistics, remain a key focus of the Board in building a successful and sustainable business.
A Risk Management Committee (RMC) has been
established to serve as a central platform of the
Group to assist the Management in identifying
principal risks at the Group level and providing
assurance on effective implementation of risk
management on a Group-wide basis. The
RMC also promotes sound risk management
practices through sharing of information and
best practices to enhance the risk culture
across the Group. The RMC seeks advice and
direction from the Board Governance and Risk
Committee.
Group risks are being managed on an integrated
basis and their evaluation is incorporated into
the Group’s decision-making process such as
the strategic planning and project feasibility
studies. Separate risk management units or
functions also exist within the Group at various
operating unit levels, particularly for its listed
subsidiaries, to assess and evaluate the risk
management processes for reporting to their
respective Board and Management level.
Internal Audit Function
The Board recognises that the internal audit function is an integral component of the governance process. One of the key functions of PETRONAS’ Group Internal Audit (GIA) Division is to assist the Group in accomplishing its goals by bringing a systematic and disciplined approach to evaluate and improve the effectiveness of risk management, control and governance processes within the Group. GIA maintains its impartiality, proficiency and due professional care by having its plans and reports directly under the purview of the Board Audit Committee (BAC).
The internal audit function performs independent
audits in diverse areas within the Group
including management, accounting, financial
and operational activities, in accordance
with the annual internal audit plan which was
presented to the BAC for approval.
The BAC receives and reviews reports on
all internal audits performed including the
“agreed corrective actions” to be carried out
by the Management. GIA monitors the status
of agreed corrective actions through the
Quarterly Audit Status Report in which they
are recorded and assessed. The consolidated
reports are submitted and presented to the
BAC for deliberations.
GIA adopts the principles of the Institute of
Internal Auditor’s International Standards for the
Professional Practice of Internal Auditing.
Other Elements Of Internal Control
The other elements of the Group’s system of internal control are as follows:
Organisational StructureThe internal control of the Group is supported
by a formal organisation structure with
delineated lines of authority, responsibility
and accountability. The Board has put in
place suitably qualified and experienced
management personnel to head the Group’s
diverse operating units into delivering results
and their performance are measured against
approved performance indicators.
Budget ApprovalBudgets are an important control mechanism
used by the Group to ensure an agreed
allocation of Group resources and that the
operational managers are sufficiently guided
in making business decisions. The Group
performs a comprehensive annual planning and
budgeting exercise including the development
and validation of business strategies for a rolling
5-year period and establishment of performance
indicators against which business units and
subsidiary companies are evaluated.
Variances against the budgets are analysed and
reported to the Board on a quarterly basis. The
Group’s strategic directions are also reviewed
at reasonable intervals taking into account
changes in market conditions and significant
business risks.

PETRONAS Annual Report 2011 29
Limits of AuthorityThe Limits of Authority (LOA) defines revenue
and capital expenditure spending limits for
each level of management within the Group.
These limits cover among others, authority for
payments, capital and revenue expenditure
spending limits and budget approvals. This
LOA manual provides a framework of authority
and accountability within the organisation and
facilitates decision making at the appropriate
level in the organisation’s hierarchy.
ProcurementThe Group has clearly defined authorisation
procedures and authority limits set for awarding
tenders and all procurement transactions
covering both capital and revenue expenditure
items. Tender committees with cross functional
representation have been established to
provide the oversight functions on tendering
matters prior to approval by the approving
authorities as set out in the LOA approved by
the Board.
Financial Control Framework
The Group has developed a Financial Control
Framework (FCF) with the principal objective
of enhancing the quality of the Company’s
financial reports through a structured process
of ensuring the adequacy and effectiveness
of key internal controls operating at various
levels within the Company at all times. FCF
requires among others, documentation of key
controls, remediation of control gaps as well as
a regular conduct of testing of control operating
effectiveness.
On a semi-annual basis, each key process
owner at various management level is required
to complete and submit a Letter of Assurance
which provides confirmation of compliance to
key controls for the areas of the business for
which they are accountable. FCF implementation
is currently ongoing throughout the Group.
Corporate Financial Policy
The Group has established a Corporate
Financial Policy and Guidelines for adoption
and implementation by companies across the
Group. This attempts to prescribe a consistent
framework in which financial risk exposures
of entities within the Group are identified
and strategies developed to mitigate such
risks. The policies contained in the Corporate
Financial Policy are intended to provide clear
communication of the policy stance governing
financial and risk management throughout
the PETRONAS Group of Companies, and
consequently seeks to provide a foundation
upon which financial risk management is
practised across the Group.
Group Health, Safety andEnvironmentThere is a Group Heal th, Safety and
Environment (GHSE) Division which drives
various HSE sustainable initiatives and defines
the framework that exemplifies the Group’s
effort to continuously meet legal compliance
and industry best practices. GHSE also
drives strategies and monitors and reports
performance to the Executive Committee to
ensure HSE risks are reduced to as low as
reasonably practicable.
Crisis Management The Group Contingency Planning Standard
(GCPS) is designed to provide guidelines for
responding to any major emergency or crisis
by defining the framework and delineation of
roles and responsibilities which enable support
and assistance where required. The Group has
implemented a three-tier response system
which seeks to provide a clear demarcation of
roles and responsibilities between emergency
site management, operating unit management,
corporate and authorities. In the event of major
emergency or crisis, the response system will
be activated and the Group’s priority is the
protection of people, environment, asset and
reputation.
Business Continuity PlanThe Group is currently enhancing its Business
Continuity Plans for both plant and non-plant
operations. These plans seek to provide
clear procedures to enhance the Group’s
preparedness in managing the impact of crisis.
The main objective is to minimise impact, avoid
disruption as well as recover and restore the
Group’s critical functions within a short period of
time towards sustaining the Group’s operational
survival thus protecting businesses, partners
and customers during crisis or disaster.
EmployeesSenior Management sets the tone for a
nurturing culture in the organisation through
the Group’s Shared Values, developed to
focus on the importance of these four key
values – loyalty, integrity, professionalism and
cohesiveness. The importance of the Shared
Values is manifested in the Corporation’s Code
of Conduct for Officers and Staff which is issued
to all employees upon joining. Employees
are required to strictly adhere to the Code in
performing their duties.
Employees undergo structured training and
development programmes and potential
entrants or candidates are subject to a
structured recruitment process. A performance
management system is in place, with established
performance indicators to measure employee
performance and the performance review is
conducted on a semi-annual basis. Action
plans to address employee developmental
requirements are in place. The Group believes
that this will enable employees to deliver their
performance indicators so that the Group can
meet its future management requirements.
Conclusion
The Board is of the view that the system of internal control instituted throughout the Group is sound and provides a level of confidence on which the Board relies for assurance. In the year under review, there was no significant control failure or weakness that would have resulted in material losses, contingencies or uncertainties requiring separate disclosure in the Annual Report.
The Board provides for a continuous review
of the internal control system of the Group to
ensure ongoing adequacy and effectiveness
of the system of internal control and risk
management practices to meet the changing
and challenging operating environment.
This statement is made in accordance with
the resolution of the Board of Directors dated
30 May 2011.

30 PETRONAS Annual Report 2011
The Group’s results for the year under review reflect better underlying
performance in all segments aided by higher crude oil and gas prices.
Earnings for the year after minority interests, though affected by a 9%
strengthening of the Ringgit, increased by 36.0% to RM54.8 billion.
Cash flow from operations increased to RM70.8 billion, an increase
of 26.2% from the previous year. During the year, capital expenditure
amounted to RM34.9 billion. Our financial position remained robust
and we returned RM30 billion in dividends to our shareholder.
With effect from the first quarter of the year under review, we
commenced quarterly reporting of our results (unaudited) under FRS
134 Interim Financial Reporting and core operating segments under
FRS 8 Operating Segments.
Recognising increased challenges in our industry with regard to volatility
and investment risks, we have elevated oversight of risk management
to a Board Committee - the Governance & Risk Committee.
Financial Results
Financial ResultsHighlights for FY2011
Datuk Manharlal Ratilal
Executive Vice PresidentFinance
Revenue of RM241.2 billion for the year, up by
14.4% on the back of stronger prices and demand.
RM241.2 billion in Revenue
Return on Total Assets of 20.6% in line with the
trends shown by major players in the industry.
20.6% Return on Total Assets
Earnings Before Interest, Taxes, Depreciation and
Amortisation increased by 29.5% to RM107.9 billion
after accounting for IPO gains of RM9.2 billion.
RM107.9billion in EBITDA
ROACE of 17.5% - an improvement from 15.9%
recorded in FY2010.
17.5%Return on Average Capital Employed (ROACE)
Total Assets increased by 6.8% to RM439.0 billion
reflecting a stronger balance sheet.
RM439.0 billion in Total Assets
Shareholder’s Funds expanded by 8.6% to RM263.8
billion.
RM263.8 billion in Shareholder’s Funds
Review of Financial ResultsThe Group recorded improved results benefiting
from higher crude oil and gas prices and
demand as a result of continuing regional
growth and to some extent the uncertainty
of supply driven by the political unrest in the
Middle-East and North Africa region.
In spite of a 9% strengthening of the Ringgit,
Group revenue increased by 14.4% to RM241.2
billion aided by higher realised prices in major
product categories and higher sales volume.
Earnings Before Interest, Taxes, Depreciation
and Amortisation (EBITDA) for the year increased
to RM107.9 billion which included a net gain
of RM9.2 billion arising from the Initial Public
Offerings (IPOs) of Malaysia Marine and Heavy
Engineering Holdings Berhad (MHB) and
PETRONAS Chemicals Group Berhad (PCG)
on Bursa Malaysia.
Profit before taxation was RM90.5 billion, an
increase of 34.5% over the previous year.

PETRONAS Annual Report 2011 31
Five-Year Group Financial Highlights
In RM billion FY2011 +/- (%) FY2010 FY2009 FY2008 FY2007
Revenue* 241.2 14.4% 210.8 264.2 223.1 184.1
EBITDA* 107.9 29.5% 83.3 105.7 105.9 84.8
Profit Before Taxation (PBT) 90.5 34.5% 67.3 89.1 95.5 76.3
Net Profit after Minority Interests 54.8 36.0% 40.3 52.5 61.0 46.4
Total Assets 439.0 6.8% 410.9 389.8 339.3 294.6
Shareholder’s Funds 263.8 8.6% 242.9 232.1 201.7 171.7
Ratios FY2011 FY2010 FY2009 FY2008 FY2007
Return on Revenue (PBT/Revenue) 37.5% 31.9% 33.7% 42.8% 41.4%
Return on Total Assets (PBT/Total Assets) 20.6% 16.4% 23.0% 28.1% 25.9%
Return on Average Capital Employed (ROACE)* 17.5% 15.9% 22.0% 28.0% 24.0%
Debt/Assets Ratio 0.11x 0.13x 0.11x 0.11x 0.12x
Debt/Equity Ratio 15.3% 17.6% 15.9% 15.8% 17.4%
Dividend Payout Ratio 54.7% 74.4% 57.1% 39.3% 38.8%
Resource Replenishment Ratio (Triple-R) 2.5x 1.1x 1.8x 0.9x 1.8x
*Revenue for FY2010 and EBITDA and ROACE for FY2007 to FY2010 have been
restated to ensure consistency with the current year’s presentation basis.
Financial ResultsHighlights for FY2011
In RM billion
EBITDA Profit Before TaxationRevenue
210.8241.2264.2
223.1184.1
FY2010 FY2011FY2009FY2008FY2007
83.3
107.9105.7105.984.8
FY2010 FY2011FY2009FY2008FY2007
67.3
90.589.195.5
76.3
FY2010 FY2011FY2009FY2008FY2007
Net Profit after Minority Interests Shareholder’s Funds
40.3
54.852.561.0
46.4
FY2010 FY2011FY2009FY2008FY2007
Total Assets
410.9 439.0389.8
339.3294.6
FY2010 FY2011FY2009FY2008FY2007
242.9263.8
232.1201.7
171.7
FY2010 FY2011FY2009FY2008FY2007
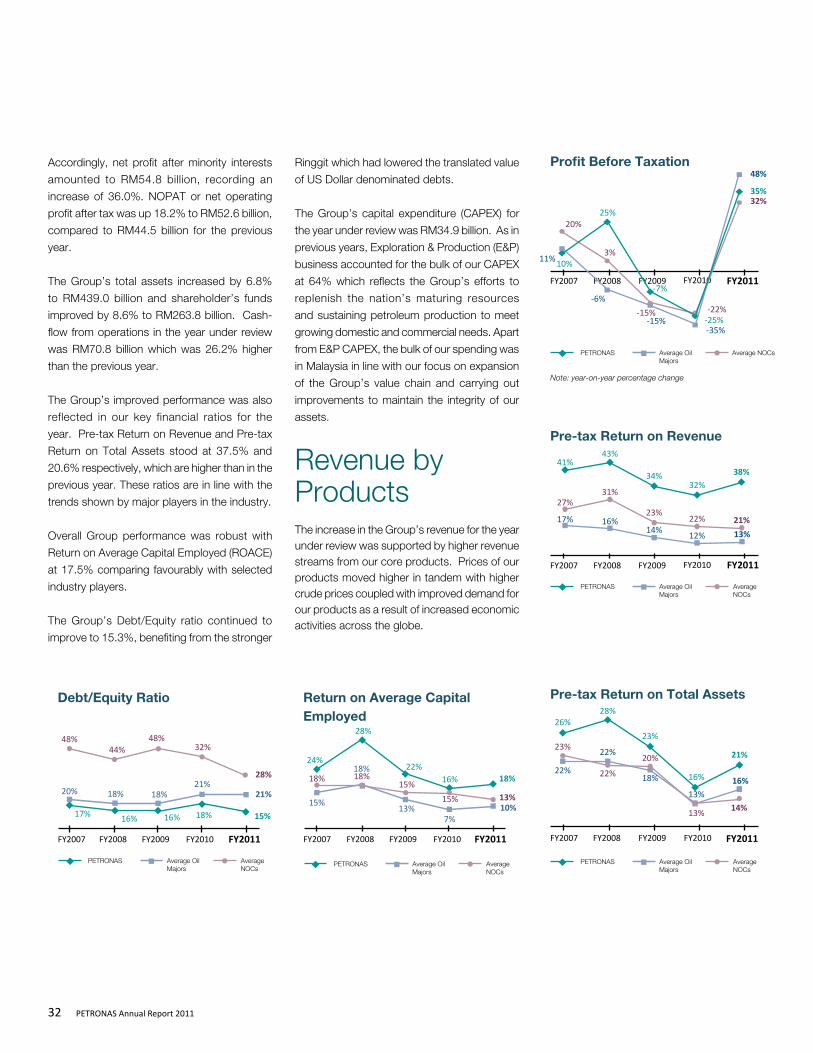
32 PETRONAS Annual Report 2011
Ringgit which had lowered the translated value
of US Dollar denominated debts.
The Group’s capital expenditure (CAPEX) for
the year under review was RM34.9 billion. As in
previous years, Exploration & Production (E&P)
business accounted for the bulk of our CAPEX
at 64% which reflects the Group’s efforts to
replenish the nation’s maturing resources
and sustaining petroleum production to meet
growing domestic and commercial needs. Apart
from E&P CAPEX, the bulk of our spending was
in Malaysia in line with our focus on expansion
of the Group’s value chain and carrying out
improvements to maintain the integrity of our
assets.
Revenue by ProductsThe increase in the Group’s revenue for the year under review was supported by higher revenue streams from our core products. Prices of our products moved higher in tandem with higher crude prices coupled with improved demand for our products as a result of increased economic activities across the globe.
Average NOCsAverage Oil Majors
PETRONAS
Profit Before Taxation
FY2010 FY2011FY2009FY2008FY2007
20%
11%10%
25%
-7%-6%
3%
-15%-15%
-22%
32%
-35%
48%
-25%
35%
Pre-tax Return on Revenue
Average NOCs
Average Oil Majors
PETRONAS
41%43%
34% 38%32%
16%14%
12% 13%
17%
27%31%
23%22% 21%
FY2010 FY2011FY2009FY2008FY2007
Pre-tax Return on Total Assets
Average NOCs
Average Oil Majors
PETRONAS
FY2009 FY2010FY2008FY2007
23%
22%
20%
13% 14%
22%
22%
18%
13%
16%
26%28%
23%
21%
16%
FY2011
Debt/Equity Ratio
Average NOCs
Average Oil Majors
PETRONAS
FY2011FY2009 FY2010FY2008FY2007
20% 18% 18%21%
21%
48%44%
48%32%
28%
17% 18%16% 16% 15%
Return on Average Capital Employed
Average NOCs
Average Oil Majors
PETRONAS
FY2011FY2009 FY2010FY2008FY2007
15%
18%
13%7%
10%
18% 18%15%
15% 13%
24%
16%
28%
22%18%
Accordingly, net profit after minority interests
amounted to RM54.8 billion, recording an
increase of 36.0%. NOPAT or net operating
profit after tax was up 18.2% to RM52.6 billion,
compared to RM44.5 billion for the previous
year.
The Group’s total assets increased by 6.8%
to RM439.0 billion and shareholder’s funds
improved by 8.6% to RM263.8 billion. Cash-
flow from operations in the year under review
was RM70.8 billion which was 26.2% higher
than the previous year.
The Group’s improved performance was also
reflected in our key financial ratios for the
year. Pre-tax Return on Revenue and Pre-tax
Return on Total Assets stood at 37.5% and
20.6% respectively, which are higher than in the
previous year. These ratios are in line with the
trends shown by major players in the industry.
Overall Group performance was robust with
Return on Average Capital Employed (ROACE)
at 17.5% comparing favourably with selected
industry players.
The Group’s Debt/Equity ratio continued to
improve to 15.3%, benefiting from the stronger
Note: year-on-year percentage change
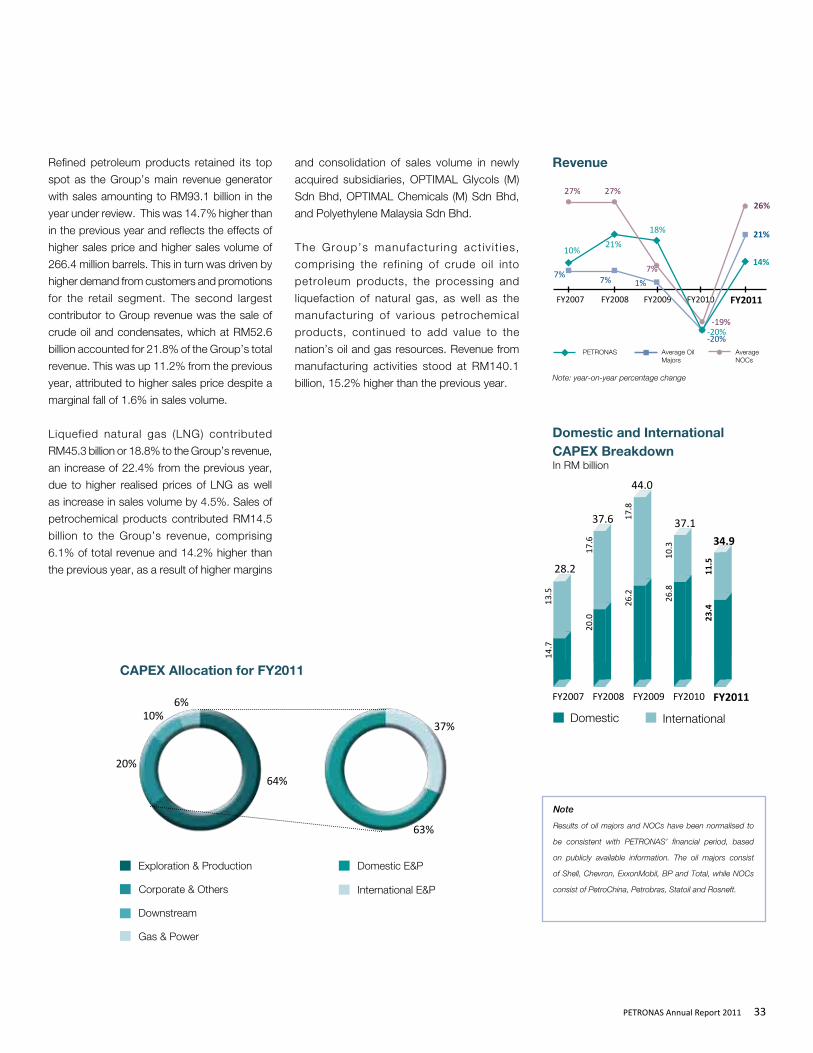
PETRONAS Annual Report 2011 33
Refined petroleum products retained its top
spot as the Group’s main revenue generator
with sales amounting to RM93.1 billion in the
year under review. This was 14.7% higher than
in the previous year and reflects the effects of
higher sales price and higher sales volume of
266.4 million barrels. This in turn was driven by
higher demand from customers and promotions
for the retail segment. The second largest
contributor to Group revenue was the sale of
crude oil and condensates, which at RM52.6
billion accounted for 21.8% of the Group’s total
revenue. This was up 11.2% from the previous
year, attributed to higher sales price despite a
marginal fall of 1.6% in sales volume.
Liquefied natural gas (LNG) contributed
RM45.3 billion or 18.8% to the Group’s revenue,
an increase of 22.4% from the previous year,
due to higher realised prices of LNG as well
as increase in sales volume by 4.5%. Sales of
petrochemical products contributed RM14.5
billion to the Group’s revenue, comprising
6.1% of total revenue and 14.2% higher than
the previous year, as a result of higher margins
and consolidation of sales volume in newly
acquired subsidiaries, OPTIMAL Glycols (M)
Sdn Bhd, OPTIMAL Chemicals (M) Sdn Bhd,
and Polyethylene Malaysia Sdn Bhd.
The Group’s manufactur ing act iv i t ies,
comprising the refining of crude oil into
petroleum products, the processing and
liquefaction of natural gas, as well as the
manufacturing of various petrochemical
products, continued to add value to the
nation’s oil and gas resources. Revenue from
manufacturing activities stood at RM140.1
billion, 15.2% higher than the previous year.
Revenue
Average NOCs
Average Oil Majors
PETRONAS
27% 27%
7%7%
7% 1%
10%21%
18%
-20%
-19%-20%
FY2009FY2008FY2007 FY2010 FY2011
26%
21%
14%
CAPEX Allocation for FY2011
Corporate & Others
Gas & Power
Exploration & Production
Downstream
Domestic E&P
International E&P
64%
63%
37%
20%
10%6%
Note
Results of oil majors and NOCs have been normalised to
be consistent with PETRONAS’ financial period, based
on publicly available information. The oil majors consist
of Shell, Chevron, ExxonMobil, BP and Total, while NOCs
consist of PetroChina, Petrobras, Statoil and Rosneft.
Domestic and InternationalCAPEX BreakdownIn RM billion
FY2010 FY2011FY2009FY2007 FY2008
37.1
26.8
10.3 34.9
23.4
11.5
44.0
26.2
17.8
14.7
13.5
28.2
20.0
37.6
17.6
Domestic International
Note: year-on-year percentage change

34 PETRONAS Annual Report 2011
Revenue by Geographical TradeFor the fourth year running, revenue from international operations continued to make the largest contribution to the Group’s revenue at RM99.1 billion or 41.1% of total revenue. Revenue from exports increased by 22.0% to RM92.5 billion, mainly due to higher revenue earned from the export of LNG, crude oil and condensates, representing about 73.9% of total exports in the year under review. Consequently, revenue from exports contributed 38.3% to the Group’s revenue, where it continued to earn valuable foreign exchange revenue for the nation and contributed positively to the country’s balance of payments. Revenue generated from domestic operations, meanwhile, increased by 16.2% to RM49.6 billion.
Segment Earnings E&P recorded the highest Net Operating Profit After Tax (NOPAT) with RM34.0 billion compared to RM30.8 billion in the previous year, representing an increase of 10.4%. The increase was mainly due to higher realised crude oil and natural gas prices partly offset by lower production in Malaysia. NOPAT for Gas & Power amounted to RM11.2 billion compared to RM8.9 billion in the previous year, representing an increase of 25.8%. The increase was mainly due to higher realised LNG prices and sales volume.
Downstream generated a NOPAT of RM7.2 billion compared to RM4.8 billion in the previous year, representing an increase of 50.0%, driven by improved refining and downstream marketing margins and improved product spreads in the petrochemical business.
NOPAT from Corporate & Others amounted
to RM1.4 billion compared to RM0.9 billion in
the previous year, representing an increase of
55.6%, as a result of higher profits generated
from other business activities.
During the year, the Group undertook two IPOs,
MHB and PCG on the Bursa Malaysia. Gains
arising from these IPOs amounted to RM9.2
billion.
Revenue by Geographical Trade
International Operations
Exports
Domestic
FY2010 FY2011FY2009FY2008FY2007
241.2
99.1
92.5
49.6
210.8
264.2
223.1
184.175
.8
98.3
86.8
73.5
92.311
1.2
89.9
67.5
42.7
54.7
46.4
43.1
Crude Oil &Condensates
Natural & Sales Gas
Petroleum Products
LNG
Maritime & Logistics
Petrochemicals
Property & Others
Revenue by Products
39%
22%
19%
7%
3% 4%
6%
In RM billion

PETRONAS Annual Report 2011 35
Subsidies (Potential Revenue Foregone) FY2011 +/- (%) FY2010 Cumulative total since 1997
In RM billionPOWER SECTOR- Tenaga Nasional Berhad- IPPs
11.64.96.7
3.6%-2.0%8.1%
11.25.06.2
98.242.256.0
NON POWER SECTOR - including industrial, commercial, residential users and NGV
8.5 10.4% 7.7 38.3
Total 20.1 6.3% 18.9 136.5
Dividend Payout Ratio
Average NOCs
Average Oil Majors
PETRONAS
FY2011FY2009 FY2010FY2008FY2007
74%
55%57%
39% 39%
28%
27%28%
40%
38%
27%
27%31%
58%
40%
Payments to Governments and SubsidiesPETRONAS’ payments to Malaysia’s Federal and State Governments in the year under review amounted to RM65.7 billion. This comprised a dividend payment of RM30 billion, taxes of RM25.1 billion, petroleum proceeds of RM9.3 billion and export duties of RM1.3 billion.
PETRONAS returned RM30 billion as dividend payments to the Federal Government for the year under review. Overall Group’s Dividend Payout ratio, which is the fraction of net profits paid out as dividends, was 55%.
In addition to payments to Federal and State Governments, PETRONAS continued with subsidies (representing potential revenue foregone) associated with the supply of gas to the domestic power and non-power sectors at regulated prices. In the year under review, PETRONAS’ potential revenue foregone amounted to RM20.1 billion, an increase of 6.3% from the previous year. Potential revenue foregone related to the power sector was higher by 3.6% as a result of higher average marked-
to-market prices despite lower volume off-take by Independent Power Producers (IPPs). Meanwhile, the potential revenue foregone related to the non-power sector increased by 10.4% to RM8.5 billion as a result of higher volume off-take.
To date, PETRONAS has returned RM594.6 billion to both Federal and State Governments and, in addition, has foregone potential revenue of RM136.5 billion since regulated prices came into effect in May 1997.
Dividend
Taxes
Petroleum Proceeds
Export Duty
Payments to the Malaysian GovernmentIn RM billion
FY2010 FY2011FY2009FY2008FY2007
65.7
30.0
25.1
9.3 1.
3
57.6
74.0
61.6
48.3
18.7
29.4
26.0
21.8
30.0
30.0
24.0
16.0
8.3 0.
6
12.4
2.2
9.5
2.1
8.5 2.
0

36 PETRONAS Annual Report 2011
2.5XResource Replenishment Ratio (Triple-R) of 2.5 times
for the Group, up from 1.1 times in the previous year.
About three quarters of those resources reside in
Malaysia.
28.3billion boeStrong Group total resources of 28.3 billion barrels
of oil equivalent (boe) amid robust contribution of
26% from international resources.

PETRONAS Annual Report 2011 37
2.14 million boe per dayAchieved total production of 2.14
million boe per day comprising
contribution from international
production of 523 thousand boe
per day, equivalent to 25% of the
Group’s total production.

38 PETRONAS Annual Report 2011
The year under review was a year of transition for me and my team.
Recognising early that decisions made must be based on sustainable
solutions, E&P Business focused on key structural changes at
various levels to address the source rather than symptoms of our
challenges.
In this regard, I am pleased to report that E&P has progressed well
in establishing a performance-driven culture across the business,
supported by a value-driven rather than process-driven management
system. At the same time, we have set challenging goals for the
medium and long term growth. Strategies were put in place to
address the production depletion trend in Malaysia and to highgrade
our international portfolio. The need for clear plans to strengthen
competencies is also recognised.
To achieve our goal of driving production growth of 3.5% for the
next five years and replenishing resources, the E&P EXCO and I will
need to drive change deeper into the organisation. It is important that
collectively and individually, we step up to face the new challenges
in PETRONAS’ transformation.
Awarded 11 new Production Sharing Contracts in
Malaysia compared to 4 in the previous year and
sanctioned 2 new Enhanced Oil Recovery (EOR)
projects. Awarded the first Risk Service Contract
(RSC) for the Berantai Field to a consortium in
January 2011.
Malaysia11 PSCs, 2 EOR projects and awarded 1st RSC
Secured 5 new petroleum contracts overseas,
including establishing our presence in Venezuela
through the Carabobo 1 project.
InternationalPetroleum Contracts Overseas
Exploration & Production Business Dato’ Wee Yiaw Hin
Executive Vice PresidentExploration & Production
Overview PETRONAS’ Exploration & Production (E&P)
Business is focused on developing and adding
value to our domestic and international oil and
gas resources. We promote and undertake
exploration, development and production of oil
and natural gas activities, as resource owner in
Malaysia and a global E&P player.
In Malaysia, PETRONAS has been successfully
developing the nation’s oil and gas resources
for over three decades. Despite maturing
fields and challenges posed by poor reservoir
performance, we have endeavoured to maximise
upstream value through enhancing production,
while increasing the prospectivity of Malaysia
acreages through de-risking efforts. PETRONAS
carries out upstream activities in Malaysia
through partnerships with leading global oil
and gas players as well as our wholly-owned
E&P subsidiary PETRONAS Carigali Sdn Bhd
(PETRONAS Carigali).
In the year under review, three key strategies
were established for Malaysia. Firstly, to intensify
focus in sweating our assets by maximising
recovery through dilligent reservoir management
and pursuing EOR potential. Secondly, to
drive the development of effective solutions to
monetise marginal fields and stranded gas. To
support future growth, aggressive exploration
is the third strategy, by focusing on maximising
remaining potential in our mature basins and
pursuing new play types. To achieve our goals,
PETRONAS Carigali relentlessly pursued efforts
in production enhancement and monetisation
of resources this year.
Highlights

PETRONAS Annual Report 2011 39
Underlying PETRONAS’ revitalised role as
an enabler for industry development, new
petroleum arrangements such as the RSC and
improvements in fiscal terms are some measures
that were put in place during the year under
review to create a more favourable environment
for sustaining investment in the upstream
sector. This will in turn spur new exploration
activities that will increase production and our
resource base in Malaysia.
Our close collaboration with the Government has
led to a landmark arrangement in Malaysia with
the introduction of new petroleum tax incentives
to promote the development of resources from
marginal fields, deepwater, high CO2 content
gas fields as well as in EOR and High Pressure
High Temperature (HPHT) potential.
In the international arena, E&P will focus in
highgrading its portfolio. To enhance asset
quality in the geological focus areas, efforts have
been intensified on divestment of assets which
are not optimum in the portfolio. Simultaneously,
continued acquisition of quality assets especially
those in development or production stage, is
imperative to sustain and grow our business
overseas.
The year under review saw PETRONAS divesting
three assets while we were successful in
acquiring five ventures in three countries. These
acquisitions have provided PETRONAS with a
foothold in new countries as well as contributing
significant growth to the Group’s resource
base. Meanwhile, efforts continue to ensure
delivery and value in our international assets
with Iraq making good progress towards First
Commercial Production and First Oil achieved
in the Pearl and Topaz fields in Vietnam.
Overall, total production for PETRONAS was
lower at 2.14 million barrels of oil equivalent (boe)
per day compared to 2.27 million boe per day
in the previous year despite various production
enhancement efforts. This was due largely to
maturing fields, poor reservoir performance and
the expiry of petroleum agreements overseas.
Of this, PETRONAS Group’s production share
amounted to 1.44 million boe per day.
Despite our maturing prospects in Malaysia,
we successfully maintained our domestic
Resource Replenishment Ratio (Triple-R) at
a relatively stable level. At the same time, we
have also improved our international Triple-R
through organic and inorganic resource growth.
For the year under review, Group total new
resource addition was 1.7 billion boe, improving
our Triple-R significantly to 2.5 times for the
Group. It is also worthwhile to note that efforts
to augment our resources showed a good
balance, with 48% coming from exploration,
20% from recovery efforts and 32% from
Highlights
PETRONAS’ Group Oil and Gas ProductionIn ‘000 boe per day
FY2010FY2009FY2008FY2007 FY2011
2,271
1,63
164
0
2,137
1,61
452
3
2,288
1,65
962
9
1,61
158
2
2,193
1,67
3
2,288
615
PETRONAS’ Group Resource AdditionIn million boe
FY2007 FY2008 FY2009 FY2010 FY2011
Malaysia International
Malaysia International
By Source
Exploration AcquisitionIOR/IGR/EOR
1,646
1,24
640
0
1,705
698
1,00
7
1,877
1,04
483
3
821
885
1,706
679
1,593
914
1 January
2011+/- (%)
1 January
2010
Crude Oil & CondensateReserves (2P)
Contingent Resources (2C)
4.689
3.879
0.2%
21.3%
4.680
3.197
Natural GasReserves (2P)
Contingent Resources (2C)
8.508
10.789
-5.4%
9.5%
8.996
9.852
UnconventionalReserves (2P)
Contingent Resources (2C)
0.233
0.188
9.4%
2.2%
0.213
0.184
Total Discovered Resources
PETRONAS Entitlement
Overall Resource Replenishment Ratio
28.286
8.575
2.5x
4.3% 27.122
*
1.1x
PETRONAS’ Group Petroleum ResourcesIn billion boe
* PETRONAS Entitlement disclosed from 1 January 2011
32%
48%
20%

40 PETRONAS Annual Report 2011
Malaysia’sExploration& ProductionAs a resource owner, PETRONAS is responsible for managing and sustaining the domestic production of oil and gas. In the year under review, Malaysia’s total production decreased marginally by 1% to 1.61 million boe per day from 1.63 million boe per day in the previous year.
The challenge to sustain current production
levels is due to maturing fields, and are further
compounded by poor reservoir performance
from our deepwater field which is a major
contributor to oil production. Additionally, ageing
facilities necessitated scheduled shutdowns
for continued reservoir management and
facilities maintenance to ensure asset integrity
and safe operations.
Despite these challenges, the production of
crude oil and condensates amounted to an
average of 627 thousand barrels per day. This
acquisitions. This has resulted in a strong
Group oil and gas resource base of crude oil
and condensate for 2P and 2C of 4.69 and
3.88 billion barrels, respectively, and natural
gas for 2P and 2C of 8.51 and 10.79 billion
boe, respectively. This was complemented
by reserves and contingent resources of 0.23
billion boe and 0.19 billion boe respectively from
unconventional resources. In total, Group oil and
gas resource showed an increase of over 4%
to 28.3 billion boe from 27.1 billion boe in the
previous year, with approximately three quarters
of those resources residing in Malaysia. One
of the key challenges for us moving forward is
to maintain favourable Triple-R as we ramp up
production.
was 5% lower than the previous year’s 657
thousand barrels per day.
Natural gas production fared better averaging
5.92 billion cubic feet per day (equivalent to
987 thousand boe per day), 1% higher than the
previous year’s 5.84 billion cubic feet per day
(974 thousand boe per day).
Production was sustained by the addition of
one new gas field (Serampang) and two new oil
fields (West Belumut & D30) that were brought
on-stream during the year under review. This
increased the total number of producing fields
in Malaysia to 117, comprising 73 oil fields and
44 gas fields.
On the back of higher average oil prices,
PETRONAS’ share of total average domestic
production, inclusive of PETRONAS Carigali’s
domestic production, accounted for 1.11 million
boe per day or 69% of Malaysia’s total average
production, a slight increase from the previous
year’s share of 68%.
Our efforts in EOR have resulted in the
sanctioning of two major projects, namely
Malaysia’s Average Oil & Gas ProductionIn ‘000 boe per day
FY2010
Condensates Natural GasCrude Oil
FY2011FY2009FY2008FY2007
1,614
512
115
987
1,6311,6591,673
1,611
122
125
128
129
535
554
563
532
974
98098
2
950
1 January
2011+/- (%)
1 January
2010
Crude Oil & CondensateReserves (2P)
Contingent Resources (2C)
3.572
2.286
-1.7%
5.6%
3.634
2.165
Natural GasReserves (2P)
Contingent Resources (2C)
6.660
8.337
-4.7%
7.2%
6.989
7.776
Total Discovered Resources
Overall Resource Replenishment Ratio
20.855
1.5x
1.4% 20.564
1.6x
Malaysia’s Petroleum ResourcesIn billion boe

PETRONAS Annual Report 2011 41
International Exploration& ProductionThe Group’s international E&P business
continued to be strong despite the challenging
global operating environment.
Total average production from the Group’s
international operations was 523 thousand boe
per day, a decrease of 18% from the previous
year. Crude oil and condensates production
decreased to 252 thousand boe per day
from 265 thousand boe per day, as a result
of depleting fields in the Sudan and Vietnam.
Average gas production was 271 thousand boe
per day, down from 375 thousand boe per day
in the previous year, mainly due to the expiry of
our contract in Iran.
Tapis and Guntong fields, offshore Peninsular
Malaysia. PETRONAS expects to see EOR
production from these fields, which are operated
by ExxonMobil, within the next three years. We
also signed a strategic cooperation agreement
with China National Petroleum Corporation
(CNPC) as part of efforts to complement internal
capabilities and strengthen the implementation
of EOR in Malaysia.
As at 1 January 2011, Malaysia’s total
discovered resource base increased by 1.4%
to 20.9 billion boe from 20.6 billion boe in the
previous year. This is mainly due to the upward
revision of resources in existing fields and more
significantly, additions from new discoveries.
Among the major discoveries in the year under
review were NC3, Spaoh, Bunga Bakawali
and Anjung Kecil. Crude oil and condensate
resources improved marginally to 5.9 billion boe
from 5.8 billion boe, while natural gas resources
increased by 1.6% to 15.0 billion boe from 14.8
billion boe previously. The Triple-R for the year
was 1.5 times for total oil and gas resources
in Malaysia.
Despite maturing acreages, there is still interest
shown by companies to bid and operate blocks
in Malaysia. Eleven new PSCs were awarded in
the year under review, namely PM313, PM315,
PM330, 2010 PM6/12 & Sepat Oil for offshore
Peninsular Malaysia; SK306, SK313, SK315 &
SK317B in offshore Sarawak; and DW Block
2G/2J & SB307/308 in offshore Sabah, bringing
the total number of PSCs in operation to 82.
A new production sharing contractor on the
domestic front was UK-based Nio Petroleum
Limited, an independent oil and gas company
which was awarded Block SB307/308 jointly
with operator Lundin Petroleum BV and partner
PETRONAS Carigali.
An area of focus for PETRONAS is the
development of marginal and small fields
in Malaysia. In this regard, PETRONAS has
awarded the first RSC for the development
and production of the Berantai field which is
expected to deliver first gas by December 2011.
This RSC is expected to unleash the potential
of our marginal fields and revitalise Malaysia’s
upstream sector.
This RSC will enhance the commercial viability
of small field development through a new
risk sharing model between the contractors
and PETRONAS as the resource owner. This
mutually-beneficial partnership encourages
the participation of niche players to develop
small fields more quickly and efficiently, while
the resource owner gains by ensuring the oil
and gas is monetised. The effort also reflects
PETRONAS’ far-sightedness in addressing
the changing needs of Malaysia’s oil & gas
landscape and the continued drive to attract
investments from key players. To develop the
capacity and capability of local oil and gas
companies, PETRONAS awarded the RSC to
Petrofac Energy Developments Sdn Bhd as
lead operator, with Kencana Energy Sdn Bhd
and Sapura Energy Ventures Sdn Bhd as full
equity partners.
Besides the new petroleum arrangement, a
significant milestone was achieved following the
announcement of new petroleum tax incentives
by the Malaysian Government. These incentives
enhance further the fiscal terms and economic
viability of developing challenging domestic
resources such as small, marginal, deepwater,
high CO2 gas and HPHT fields in order to attract
investments from global oil and gas players.
Overall, a total of RM24.0 billion was spent
in Malaysia’s upstream sector during the
year. Of this, RM17.1 billion or 71% was for
development projects, RM5.2 billion or 22% for
exploration activities, and RM1.8 billion or 7%
for operational expenditure.
PETRONAS’ International Oil and Gas ProductionIn ‘000 boe per day
Natural GasCrude Oil and Condensates
FY2010 FY2011FY2009FY2007 FY2008
64026
537
5
52325
227
1
629
276
353
247
335
582
287
615
328

42 PETRONAS Annual Report 2011
In the year under review, we strengthened our
international resource base which accounted
for 26% of total Group resources.
International discovered resources stood at
7.4 billion boe, up from 6.6 billion boe in the
previous year, showing an increase of 13%
mainly augmented by the successful asset
acquisition in Venezuela’s Carabobo 1 Project.
Crude oil and condensate resources increased
significantly by 30% to 2.7 billion boe from 2.1
billion boe previously while our gas resources
showed an increase of 5% to 4.7 billion boe
from 4.5 billion boe. Our strong international
resource base is the result of contribution from
new resource addition with 43% coming from
exploration and enhanced recovery and the
rest coming from acquisitions. Consequently,
the Triple-R for our international operations
remained strong at 5.6 times for total oil and gas
resources. Our resources are mainly located in
Africa, Middle East and Asia, and South East
Asia and Oceania, and comprise about 30%
each.
In the year under review, decisions were
made to exit a number of countries – Ethiopia,
Pakistan and Timor Lesté – as part of efforts to
highgrade our international portfolio.
PETRONAS secured five new international
petroleum agreements during the year, namely
Venezuela Carabobo 1, Brunei Block CA1 &
Block CA2 and Australia WA402P & WA403P.
This brings the total of the Group’s international
E&P ventures to 75 in 23 countries. Of these,
PETRONAS is the operator for 27 ventures,
By region, Africa continues to dominate
the Group’s international portfolio with a
contribution of 63% to international production.
The year also saw the first production from five
of the Group’s international projects, namely
Pearl and Topaz fields in Vietnam; Teng-Mish
Mish in the Sudan; and Phase 1 Muda Jengka
and MDD Project in the Malaysia-Thailand Joint
Development Area (MTJDA).
The year also saw all four of our ventures in
Iraq achieving pre-development plan approval
by the government of Iraq, and they are on
track to achieving first commercial production
by 2012.
Breakdown of International Production by Region
Note: South East Asia excludes Malaysia production
Note: South East Asia excludes Malaysia resources
Middle Eastand Asia
South East Asiaand Oceania
Africa
63%35%
2%
Breakdown of International Resources by Region
31%
31%
8%
30%
Middle Eastand Asia
South East Asiaand OceaniaAmericas
Africa
1 January 2011
+/- (%)1 January
2010
Crude Oil & CondensateReserves (2P)Contingent Resources (2C)Entitlement (2P)
1.1171.5930.471
6.8%54.4%
-
1.0461.032
-
Natural GasReserves (2P)Contingent Resources (2C)Entitlement (2P)
1.8482.4520.766
-7.9%18.1%
-
2.0072.076
-
Coal Bed MethaneReserves (2P)Contingent Resources (2C)Entitlement (2P)
0.2330.1880.206
9.4%2.2%
-
0.2130.184
-
Total Discovered Resources
Total PETRONAS Entitlement
Overall Resource Replenishment Ratio
7.431
1.443
5.6x
13.3%
-
6.558
-
(0.4x)
PETRONAS’ International Petroleum ResourcesIn billion boe

PETRONAS Annual Report 2011 43
Outlook The global upstream sector is expected to
remain vibrant in 2011, driven by strong oil
prices and lower risk aversion among major
E&P companies.
Oil prices are expected to remain bullish in the
coming year, thus providing an incentive for E&P
companies to invest, with global investments
expected to rise from the previous year.
In 2011, we anticipate IOCs and NOCs to
continue to post strong financial results.
Continued challenges to access resources
will drive investment into newer areas in
deepwater, Arctic, and the Middle East, and
this is expected to result in greater development
of unconventional resources. To thrive in this
environment, companies are expected to
strengthen their capabilities and proficiencies
in niche technologies.
The wave of consolidation that is currently
taking place in the upstream sector is expected
to result in the creation of colossal companies
that specialise in providing a range of services
to the industry. The concentration of skills
and expertise in the hands of a few very large
companies strengthens their bargaining power
and is likely to result in the escalation of fees
for services.
Despite this challenging outlook, there are
opportunities for companies who are on the
lookout to acquire quality assets in the upstream
sector and to establish strategic alliances with
select partners for sustained growth.
For PETRONAS, our focus will be on intensifying
activities in Malaysia and highgrading our
international portfolio to ensure improved yields
that will commensurate with the risk involved.
We will relentlessly pursue our production and
resource replenishment targets in the coming
year as well as our efforts to improve delivery
of projects to acquire quality assets.
In Malaysia our focus will continue to be in
pursuing aggressive exploration, especially in
exploring new play types and more challenging
prospects including deepwater and HPHT plays.
We will continue to accelerate developments
in marginal fields, leveraging on the new tax
incentives announced by the Government,
as well as on the new innovative petroleum
arrangement solutions such as the RSC.
We will also intensify our efforts in EOR and
development of gas resources with high CO2
content. Moving forward, key focus areas will
be on new solutions to enhance commerciality
of gas development.
To enable this, PETRONAS will continue to
harness technology and technical solutions to
overcome E&P challenges.
We are fully committed to HSE excellence.
We recognise that good HSE performance
is essential to our business success and we
expect high standards of ethical business
conduct from our people while they perform
their tasks.
We have put in place several measures to
strengthen HSE practices in our work culture
and these are designed to support best
corporate responsibility practices.
Disclaimer on forward-looking statements: Forward-looking statements involve inherent risks and uncertainties. Should one or more of these or other uncertainties or risks materialise, actual results may vary materially from those estimated, anticipated or projected. Specifically, but without limitation, capital costs could increase, projects could be delayed, and anticipated improvements in capacity, performance or profit levels might not be fully realised. Although PETRONAS believes that the expectations of its management as reflected by such forward-looking statements are reasonable based on information currently available to it, no assurances can be given that such expectations will prove to have been correct. Accordingly, you are cautioned not to place undue reliance on the forward-looking statements, which speak only as of the date they are made. PETRONAS undertakes no obligation to update or revise any of them, whether as a result of new information, future developments or otherwise.
joint operator in 14 and an active partner in the
remaining 34 ventures.
The most notable signing for a new block in
the year was the Carabobo 1 asset which is
PETRONAS’ first contract in Venezuela. It also
signifies our entry into a major development
project involving heavy oil while establishing a
stronger foothold in the South American region.
Our partners in this venture are Repsol YPF,
ONGC Videsh Limited, Petroleos De Venezuela
SA (PDVSA), Indian Oil Corporation Limited and
Oil India Limited.
A total of RM16.6 billion was invested in our
international E&P ventures, of which 57% was
for development, 6% for exploration activities,
while the remaining was for the operation of
existing producing assets.

44 PETRONAS Annual Report 2011
RM11.2 billion
Higher NOPAT of 26% compared to previous year on
the back of higher LNG prices and sales volume, which
contributed around 21% to the overall Group profit for
the year.
99.97% PETRONAS Gas Berhad achieved a 99.97% reliability
rate for the Peninsular Gas Utilisation (PGU) system
pipeline network, exceeding the world class standard
of 99.90%.

PETRONAS Annual Report 2011 45
24.3 million tonnesPETRONAS LNG Complex achieved highest ever
LNG production volume due to improved plant
performance.

46 PETRONAS Annual Report 2011
Gas & Power Business
GLNG Achieved FIDThe Gladstone Coal Bed Methane (CBM) to LNG
project in Australia, with a total capacity of 7.8 million
tonnes per annum (mtpa), achieved Final Investment
Decision (FID) in January 2011.
KIMANIS EPCC awarded for Kimanis Power Plant projectSite preparation work has been completed. In March
2011, the Engineering, Procurement, Construction and
Commissioning (EPCC) contract was signed and limited
notice to proceed issued.
FLNG FEED contract signed for FLNG projectFront End Engineering Design (FEED) contract signed
for the Floating LNG (FLNG) project in January 2011.
Highlights
LNG RGT EPCIC awarded for RGTEngineering, Procurement, Construction, Installation
and Commissioning (EPCIC) was awarded for the first
LNG Regasification Terminal (RGT) project in Malaysia
in January 2011. The project is located in Melaka.
It has been a challenging year for the Gas & Power Business
as we strive to strike a balance between our domestic and
international strategic growth agendas, both of which are equally
important to the sustainability of our business.
Domestically, the Gas & Power Business has been entrusted with
the responsibility of building critical gas infrastructure that would
guarantee Peninsular Malaysia’s security of gas supply to meet
growing needs and to prepare the nation in facing challenges
of a truly open and competitive gas market. Ambitious targets
have been set for the rollout of Malaysia’s first LNG Regasification
Terminal in Melaka, and we are truly committed to realising the
success of this project as envisioned.
Beyond our shores, we are evolving to meet the changing
dynamics of the global LNG market, working hard to sustain our
strong position in the Asia Pacific region, that we have built over
decades, while establishing a foothold in the unconventional
gas-to-LNG industry, which promises to be the next wave of
industry growth.
Datuk Anuar Ahmad
Executive Vice PresidentGas & Power

PETRONAS Annual Report 2011 47
gas fields to enhance the Group’s LNG supply
portfolio.
Construction of Malaysia’s first LNG RGT
and the 300 megawatt Kimanis Power Plant
projects have commenced and are expected
to be completed by July 2012 and end of 2013
respectively.
The Group is also committed to further grow
our power and renewable energy business,
leveraging on existing capabilities and by
seeking new opportunities.
Global LNGIn the year under review, the Group’s total LNG sales of 26.3 million tonnes was higher by 4.78% compared to 25.1 million tonnes* in the previous year, mainly driven by higher volume from PLC.
Exports of LNG from PLC were mainly to term
customers in Japan (60%), South Korea (18%),
Taiwan (13%) and China (5%).
This achievement was only made possible
as a result of concerted efforts within the
Group and the continuing commitment of our
LNG subsidiaries in addressing the various
operational challenges during the year under
review.
During these challenging times, PETRONAS
LNG Ltd (PLL), previously known as Asean
LNG Trading Company Ltd (ALTCO) effectively
played its role as a system balancer to address
shortfalls from the plants towards meeting
our contractual obligations. PLL handled 0.8
million tonnes of LNG volume over and above
its trading volume of 0.4 million tonnes.
It was with this effort that PETRONAS’ LNG
business maintained our market position and
preserved our reputation as a reliable supplier
of LNG.
OverviewPETRONAS’ Gas & Power Business is engaged
in the processing, liquefaction, transmission,
marketing and trading of LNG and gas. It also
participates in power generation and utilities
business, which adds synergistic value in the
integrated gas value chain.
During the year under review, Gas & Power
Business contributed around 21% to the
Group’s profit. The strong financial results for
the business were achieved on the back of
higher LNG production and prices, coupled
with sustained sales gas volume delivered to
our customers.
PETRONAS LNG Complex (PLC) production
volume of 24.3 million tonnes achieved during
the year was the highest ever attained in our
history. This is as a result of improvements in
plant reliability in the second half of the year
under review and debottlenecking efforts in the
MLNG Dua plant.
During the year, the Group was able to sustain
and ensure continuous sales gas delivery to
customers in Peninsular Malaysia. This was also
made possible with PETRONAS Gas Berhad
(PGB) sustaining its performance throughout
the year, exceeding world class operations
standards.
Going forward, initiatives are being undertaken
to ensure the security of gas supply for Malaysia
and positioning PETRONAS as a global LNG
player, leveraging on our world class operations
and infrastructure facilities.
Significant progress has been achieved on
the Group’s growth initiatives. The Gladstone
CBM to LNG project in Australia, with a total
capacity of 7.8 mtpa, achieved FID in January
2011 and is expected to deliver its first LNG
cargo in 2015.
FEED contract for our FLNG project was signed
in January 2011. The project will enable the
monetisation of our marginal and stranded
*Adjusted figure to exclude inter-company volumes
Japan S Korea Taiwan
China Others
60%18%
13%
5%4%
23.9 MT
PLC Sales Volume
FY2010 FY2011FY2009FY2008FY2007
23.324.3
23.4 23.022.4
In million tonnesPLC Production Volume
In million tonnesLNG Sales Volume
PLC
Traded Volume
Egyptian LNG(PETRONAS’ Equity)
FY2010 FY2011FY2009FY2008FY2007
26.3
23.9
2.0
0.425.125.025.124.3
1.9
1.8
1.6
1.8
22.8
22.3
22.5
21.5
0.4
0.9
1.0
1.0

48 PETRONAS Annual Report 2011
Major GasVenturesGladstone LNG (GLNG) in Queensland, AustraliaGLNG is a joint venture between PETRONAS (27.5%), Santos (30%), Total (27.5%) and Kogas (15%).
The project includes the development of CBM resources in the Bowen and Surat Basins in south-east Queensland, construction of a 420 km gas transmission pipeline from the gas fields to Gladstone, and two LNG processing trains with a combined nameplate capacity of 7.8 mtpa.
On 13 January 2011, FID was achieved for
the project and subsequently the Engineering,
Procurement and Construction (EPC) contract
was awarded for the upstream surface facilities,
development of the LNG plant and gas
transmission pipeline.
Infrastructure, Utilities & PowerThe Group sold an average volume of 2,530 million metric standard cubic feet per day (mmscfd) of gas in Malaysia, a marginal decrease of 0.6% from 2,546 mmscfd delivered in the previous year. Of that, 80.9% or an average of 2,047 mmscfd was sold through the PGU system, a decrease of 2.0% from the previous year of 2,088 mmscfd. This was mainly due to upstream reservoir management and maintenance activities, which affected the feedgas volume processed.
To complement the domestic gas supply
portfolio, the Group sourced 554 mmscfd of
gas for the PGU system from Indonesia and
Malaysia-Thailand Joint Development Area
(MTJDA), higher by 11.0% than the previous
year’s volume of 499 mmscfd. This has ensured
continuous sales gas delivery for our customers
throughout the year under review.
Sales gas delivery within the PGU system
was largely consumed by the power sector
with an average of 1,087 mmscfd or 53.1%
of the total volume. The non-power sector,
comprising industrial, petrochemical and other
users, consumed an average of 819 mmscfd or
40.0% of the total volume, while the remaining
141 mmscfd or 6.9% was exported to our
customers in Singapore.
GPPsPGU System
PGB, the Group’s gas processing and
transmission arm, sustained world class
operations standards at its gas processing
plants (GPPs) and PGU system, with reliability
rates of 99.60% and 99.97% respectively. PGB
has also embarked on plant rejuvenation and
revamp activities on its aging facilities to ensure
the sustainability of our operations.
Offshore Peninsular Malaysia
Indonesia & MTJDA
2,047
1,49
355
4
2,088
499
1,58
9
2,146
511
1,63
5
2,170
432
1,73
8
2,128
426
1,70
2
FY2010 FY2011FY2009FY2008FY2007
PGU System Supply Sources In mmscfd
Average Sales Gas Through the PGU System
Power Non - Power Export
FY2010 FY2011FY2009FY2008FY2007
2,1462,1702,128
732
703
665
1,28
0
1,31
0
1,32
9
2,047
1,08
781
914
1
2,088
787
1,17
612
5134
157
134
In mmscfd
PGU System and GPP Reliability RateIn percent
Average Sales Gas Volume Delivery
Peninsular Malaysia (PGU System)
Sarawak
Sabah and Labuan
FY 2010 FY2011
2,088
2,546
196 262
2,047
278
2,530
205
In mmscfd
FY2010 FY2011FY2009FY200895
96
97
98
99
100
FY2007
99.97
99.60

PETRONAS Annual Report 2011 49
OutlookGas demand is projected to remain positive during this decade, primarily driven by the resumption of economic recovery and growth in Asian countries, notably in China and India. The recent earthquake and tsunami in Japan have led to heightened demand for LNG in the short to medium term, although the magnitude of the global impact remains uncertain. The current oversupply in the gas market is expected to shift to a balanced market before the middle of this decade.
Apart from North America and Australia where
the shale gas and CBM developments are
extensive, unconventional gas development
is expected to be moderate over the next five
years. PETRONAS will continue to assess
opportunities within this sector, beyond the
Gladstone CBM to LNG venture, to strengthen
our resource position for the medium to long
term growth.
Gas pricing remains non-uniformed based
on geographical market dynamics, with gas
contracts in Asia and much of Europe to
remain oil-indexed. In contrast, gas prices in
North America and to some extent Europe
will be heavily influenced by the regional price
benchmark. Amidst this gas price fragmentation,
PETRONAS will continue to leverage on the
long term oil-indexed LNG supply contracts,
supplying primarily to the traditional buyers in
East Asia. At the same time, PETRONAS will
continue to strive to be a global LNG player
through trading activities, diversification of
supply sources and market expansion, including
increasing its presence in the Atlantic Basin.
On the domestic front, ensuring the security of
gas supply to meet rising demand remains the
main focus. Gas importation into Peninsular
Malaysia is inevitable and PETRONAS is
undertaking several measures to address the
long term domestic supply needs, including
the construction of an LNG RGT and the
introduction of third-party access to facilitate
the importation of LNG and the transportation
of gas through the PGU network.
The demand for power generation is also
expected to be steady in line with global
economic growth, especially in the emerging
markets. The push for renewable energy for
power generation, driven by environmental
and energy security considerations, is gaining
momentum as more governments are promoting
green policies. PETRONAS will continue to
explore growth opportunities in this sector via
an integrated play through monetisation of
gas reserves and future positioning in selected
renewable energy ventures.
GLNG’s first LNG cargo is expected to be
delivered in 2015 with PETRONAS’ minimum
contracted off-take volumes of 3.5 mtpa.
This strategic venture will further enhance
PETRONAS’ global LNG supply portfolio.
Regasification Terminal in MelakaPETRONAS is developing the first LNG RGT in Malaysia, which will allow for the importation of LNG and ensure continuous and sustainable gas supply for the nation in the future.
The LNG RGT is located in Melaka and designed
to receive, store and regasify LNG with a
maximum capacity of 3.8 mtpa.
In December 2010, PGB signed a Heads of
Agreement with PETRONAS for the development
of LNG RGT. Subsequently, PGB awarded the
contract for the EPCIC for the construction of
an island jetty with a regasification system and
subsea pipeline.
The LNG RGT project is targeted for completion
in July 2012.
Disclaimer on forward-looking statements: Forward-looking statements involve inherent risks and uncertainties. Should one or more of these or other uncertainties or risks materialise, actual results may vary materially from those estimated, anticipated or projected. Specifically, but without limitation, capital costs could increase, projects could be delayed, and anticipated improvements in capacity, performance or profit levels might not be fully realised. Although PETRONAS believes that the expectations of its management as reflected by such forward-looking statements are reasonable based on information currently available to it, no assurances can be given that such expectations will prove to have been correct. Accordingly, you are cautioned not to place undue reliance on the forward-looking statements, which speak only as of the date they are made. PETRONAS undertakes no obligation to update or revise any of them, whether as a result of new information, future developments or otherwise.

50 PETRONAS Annual Report 2011
Restructuring of PETRONAS’ global marketing and trading of crude
oil & petroleum products under a single entity, supported by an
enhanced risk management system.
Enhanced
GovernanceSpearheading the development of Fluid Techology SolutionsTM
for the Mercedes GP PETRONAS Team and the introduction
of improved product offerings such as PRIMAX 95 Xtra,
PETRONAS Nautimar Fishing Boat Oil and NGV Lube.
Innovative product value proposition

PETRONAS Annual Report 2011 51
PETRONAS initiated a study together with international petrochemicals
player BASF towards our expansion into producing high-value specialty
chemicals.
Collaboration with BASF

52 PETRONAS Annual Report 2011
In Malaysia, PETRONAS Dagangan Berhad
(PDB) manages all domestic marketing and
retailing activities of a wide range of petroleum
products. PETRONAS also operates service
stations in various international markets
including Indonesia, South Africa, the Sudan
and Thailand. PETRONAS is the leading
marketer of petroleum products in Malaysia
with a total market share of 42.7%. Through its
South African subsidiary Engen, PETRONAS is
the leading retailer and marketer of petroleum
products in Southern Africa.
Melaka and comprises PETRONAS Penapisan
(Melaka) Sdn Bhd (PPMSB), a 100% owned
PETRONAS entity and Malaysian Refining
Company Sdn Bhd (MRC), a joint venture
refinery with ConocoPhilips. The other refinery
is located on the East Coast of Malaysia in
Kertih. PETRONAS also owns the Engen
Refinery (Enref) in Durban, South Africa through
its majority shareholding in Engen Petroleum
Ltd. Through its wholly-owned global trading
and marketing subsidiary PETRONAS Trading
Corporation Sdn Bhd (PETCO), PETRONAS
further enhances the value of its own equity
crude and petroleum products.
PETRONAS’ Downstream Business plays
a strategic role in enhancing the value of
Malaysia’s oil and gas resources through its
integrated operations in refining and trading,
marketing of crude oil and petroleum products
locally and internationally, as well as through
manufacturing and marketing of petrochemical
products.
PETRONAS owns and operates three refineries
in Malaysia and one in South Africa with a total
refining capacity of 500,000 barrels per day.
Two of the Malaysian refineries are located in
Downstream Business
PETRONAS Chemicals Group Berhad (PCG) was
successfully listed on Bursa Malaysia and was
acclaimed as the largest Initial Public Offering in South
East Asia in 2010.
SuccessfulListing of PCG
Engen Petroleum Limited acquired Chevron’s assets
in seven countries across Africa and PETRONAS
Lubricants International builds on presence in
China through the acquisition of Shandong St Maria
Lubricating Oil Company Limited.
Growth Expansion in Africa and China
The year under review was indeed an exciting year for Downstream
Business as our focus was mainly in the area of organisational and
business enhancement with emphasis on governance as well as
driving strategic growth initiatives to position our business to deliver
higher sustainable value. Moving forward, we will continue to focus on
the business enhancement initiatives for safe and reliable operations
which remain a top priority. Active portfolio management with focus on
quality assets in selected geographies will continue to be undertaken.
Business growth will be underpinned by strategic investments such
as a Refinery and Petrochemical Integrated Development (RAPID)
project in Southern Johor, a fertiliser plant in Sabah and expanding
the lubricants business in selective high growth markets.
Supporting our vision for Downstream to be a Merit Based High
Performing Business, we are committed to enhance performance
tracking focusing on execution, strengthening competencies and
continuously benchmarking with our peers. I would like to take this
opportunity to thank our dedicated team in Downstream Business for
all their professionalism, determination and commitment in making this
year a significant success.
Highlights
Overview
Datuk Wan ZulkifleeWan AriffinExecutive Vice President Downstream

PETRONAS Annual Report 2011 53
PETRONAS Lubricants International Sdn Bhd
(PLISB) has manufacturing and marketing
infrastructure and presence in more than 20
countries globally. The PLISB product range
includes lubricants and system fluids for both
the automotive and industrial markets as well
as a range of car care products.
PETRONAS’ petrochemicals arm, PCG, is the
leading petrochemical producer in Malaysia and
one of the largest producers in Southeast Asia,
involved primarily in manufacturing, marketing
and selling a diversified range of petrochemical
products, including olefins, polymers, fertilisers,
methanol and other basic chemicals and
derivative products. PCG has over 25 years
of combined experience in the petrochemical
industry.
Refining & TradingPETRONAS owns and operates four refineries with a total refining capacity of about 500,000 barrels a day. Our crude oil and petroleum products marketing and trading activities span the globe and our crude oil portfolio includes a range of significant grades from several regions.
Crude Oil RefiningThe Group’s domestic refineries continue to play a strategic role in adding value to the nation’s petroleum resources, as well as enhancing the security of its energy supplies. During the year under review, the Group’s domestic refineries collectively achieved a higher throughput volume of 107.6 million barrels and reflected a higher utilisation rate of 91.0% after bouncing back from a plant revamp and turnaround exercise of subsidiary MRC in 2010. Post revamp, MRC has strengthened its refining capability to an average of 154 thousand barrels per day, higher than the average of 110 thousand barrels per day in the preceding year. The revamp has also provided greater flexibility to MRC in the sourcing of imported crudes.
The overall reliability rate of the domestic
refineries at 98.3% is testimony to the Group’s
continued operational excellence. The strong
emphasis on safe operations was recognised
with both PPMSB and PETRONAS Penapisan
(Terengganu) Sdn Bhd, winning major awards
in the oil and gas sector – Malaysian Society
of Occupational Safety & Health (MSOSH)
Awards 2009 and Chemical Industries Council
of Malaysia (CICM) Awards 2009, in the year
under review.
The Group’s refinery in Durban, South Africa,
recorded a lower throughput volume of 26.8
million barrels from 34.1 million barrels in the
previous year mainly due to a plant shutdown.
As a result, refinery utilisation and reliability
rates have decreased to 60.0% and 94.1%
from 68.0% and 95.6% respectively in the
preceding period. The shutdown is part of a
PETRONAS Chemicals Group Berhad (PCG) was
successfully listed on Bursa Malaysia and was
acclaimed as the largest Initial Public Offering in South
East Asia in 2010.
SuccessfulListing of PCG
Utilisation Ratefor Group’s Refineries
Domestic Refineries (MCO)
Domestic Refineries (Non-MCO)
Overseas Refineries
Refining ThroughputIn million barrels
Domestic Refineries
Total Refineries
FY2007 FY2008 FY2009 FY2010 FY2011
84
88
92
96
100
80
76
86.2
91.691.4
96.6 96.7 97.3
80.882.4
85.7
91.0
*Adjusted figures due to reclassification of volumes
FY2010 FY2011
134.4
82.3
25.3
26.8
138.0*
18.6
85.4
34.1
FY2009FY2008FY2007
158.4150.9148.8
21.4
21.5
23.8
105.
4
94.3
86.4
31.6
35.1
38.6
In percent

54 PETRONAS Annual Report 2011
safety programme to ensure plant integrity and
safe operations. The refinery has also received
awards in the Chemical Manufacturing category
and for Innovation, at the KwaZulu-Natal Waste
Management Awards 2010 in South Africa.
Crude Oil & PetroleumProducts MarketingThe Group’s crude oil and petroleum products marketing activities increased in the year under review to 170.9 million barrels backed by higher exports of Malaysian Crude Oil (MCO). PETRONAS’ MCO entitlement grew 16% year on year to 69.6 million barrels amid higher crude oil prices.
The Group, however, exported lower volumes
of petroleum products of 51.4 million barrels
mainly due to lower products available for
export resulting from higher Malaysian domestic
consumption.
Similarly, the Group’s sales of Foreign Equity
Crude Oil decreased by 5% to 49.9 million
barrels, reflecting lower entitlements from the
Group’s International Operations amid higher
global crude oil prices.
Crude Oil & PetroleumProducts TradingThe Group’s volume of crude oil and petroleum products traded for the year under review decreased by 14.6% to 162.6 million barrels.
The total volume of crude oil and petroleum
products traded decreased to 79.1 million
barrels and 83.5 million barrels respectively.
The decrease in crude volume was generally
due to lower risk trading appetite in the Group’s
West of Suez trading region caused by lower
crude demand, while the decrease in products
volume was mainly caused by geopolitical
events particularly in the Middle East that led
to trading risk exposures.
In million barrelsMarketing Volumes
Malaysian Crude Oil Export
Petroleum Products Export
Sales of Foreign Equity Crude Oil (FEC)
Crude Oil
Petroleum Products
In million barrelsTrading Volumes
FY2010 FY2011
170.9
69.6
51.4
49.9
166.8
55.6
58.8
52.4
FY2009FY2008FY2007
188.5
206.7208.6
60.3
62.2
53.5
76.4
94.610
2.7
51.8
49.9
52.4
FY2010 FY2011
162.6
79.1
83.5
190.4
85.6
104.
8
FY2009FY2008FY2007
172.0
116.9
94.6
75.2
60.5
57.4
96.8
56.4
37.2

PETRONAS Annual Report 2011 55
DownstreamMarketingPetroleum Products RetailPETRONAS’ subsidiaries, PDB and Engen Petroleum Ltd are retail market leaders in Malaysia and South Africa respectively. PETRONAS also supplies aviation fuel in the Asia and Africa regions.
PETRONAS operates a network of more
than 2,700 retail stations through PDB as
the domestic retail arm and Engen as the
main international retail arm in addition to
PETRONAS Marketing Sudan Limited (PMSL),
PT PETRONAS Niaga Indonesia (PTPNI) and
PETRONAS Retail Thailand Co Ltd. In terms of
business growth, Engen achieved another major
step forward in its growth strategy with the
acquisition of Chevron’s downstream interest
in Sub-Saharan Africa.
PETRONAS’ sales volume grew by 7.58% in
tandem with the global economic recovery, with
international subsidiaries contributing 49.6%
of total sales volume. By segment, retail was
the largest contributor to total sales volume at
41.5%.
In the year under review, PDB registered a higher
sales volume of 85.2 million barrels of petroleum
products with a total market share of 42.7%.
PDB has also increased its retail station network
to 955 stations and has the largest network of
convenience stores at retail stations in Malaysia
with more than 600 Kedai Mesra convenience
stores opened to-date.
As part of the on-going commitment to
improve its value proposition to its customers
and position the Company at the forefront
of innovation, PDB has launched a number
of new products including PRIMAX 95 Xtra,
PETRONAS Nautimar Fishing Boat Oil and
NGV Lube.
PRIMAX 95 Xtra, which was developed in the
year under review, was launched in April 2011.
PRIMAX 95 Xtra is a new fuel inspired by F1
technology, proven to deliver more power,
better acceleration and enhanced fuel economy,
replacing the previous PRIMAX 95.
PDB has also entered into partnership and
collaboration with several partners such as the
agreement to become the Exclusive Partner
and Lubricant Supplier to national car distributor
PROTON Edar Sdn Bhd.
In South Africa, Engen maintained its market
dominance. The acquisition of 100% of
Chevron’s interest in Malawi, Mauritius,
Mozambique, Réunion, Tanzania, Zambia, and
Zimbabwe has increased the number of affiliates
outside South Africa to 410 service stations
bringing the total of its retail stations throughout
the African continent to 1,572.
The commercial business also made great
strides by winning some significant supply
contracts, particularly to the mining industry.
In conjunction with the FIFA World Cup 2010
in South Africa, Engen rolled out its dynamic
African Welcome programme to internal and
external stakeholders over a six-month period
leading up to the event. This programme
focused on providing a superior level of service
at all Engen sites, while welcoming visitors to
Africa and South Africa in particular, reflecting
Engen’s brand promise of “With Us You Are
Number One”.
Domestic market leadership*
42.7%market share in Malaysia
* Combined retail, commercial and LPG sectors
Petroleum Products Retail in Malaysia
NUMBER OF RETAIL STATIONS IN MALAYSIA
FY20
10
FY20
11
925
3.24%
955
NUMBER OF RETAIL STATIONSACROSS AFRICA
FY20
10
FY20
11
1,572
5.57%
1,489

56 PETRONAS Annual Report 2011
In the Sudan, PMSL achieved higher sales
volumes reflecting improved performance of its
retail operations, as well as increased sales to
support the United Nation’s operations in the
country. During the year, PMSL also expanded
its network reach, which now boasts a total of
82 stations.
In Indonesia, the number of retail stations under
PTPNI was maintained at 19. PTPNI’s retail
business continues to supply subsidised fuel
in Medan. Its commercial business made a
breakthrough by expanding its presence into
the fifth region, which is East Java, in addition
to North Sumatera, West Java, East Kalimantan
and Riau.
Downstream Marketing Highlights for the Year under Review
•Commercialbusinessmade a breakthrough by expanding its presence into the fifth region, which is East Java, in addition to North Sumatera, West Java, East Kalimantan and Riau.
INDONESIA
•Successfullyenteredlubricants market.
PHILIPPINES
•PETRONASLubricantsInternational builds its presence in China with the acquisition of Shandong St Maria Lubricating Oil Company Limited.
CHINA
•ENGENacquiredChevron’s downstream interests in seven Sub-Saharan countries.
AFRICA AND THE INDIAN OCEAN ISLANDS
Downstream marketing through subsidiary Engen
Downstream marketing
SUDAN
•Increasedsalesvolumesand retail station network expanded to 82 from 78.
VIETNAM
•PETRONAScompletedtheacquisitionofPetroVietnam Gas Corporation’s 28.83%
interest in Thang Long LPG Co. Ltd ( TLLCL), making TLLCL its wholly owned subsidiary.
•PDBandProtonEdarSdnBhd,thedomesticmarketingarmofPROTONHoldingsBerhad signed a Local Supply and Commercial Collaboration Agreement where PDB will be the national carmaker’s exclusive partner and supplier of automotive lubricants for 10 years.
•PETRONASAviationSdnBhd(PAvSB)securedacontractforAviationFuelTechnical Service Assistance with a new customer namely Ceylon Petroleum Company Limited of Sri Lanka for two years with an option of renewal for another year.
MALAYSIA
•PETRONASLubricantsItaly SPA entered into a partnership in Europe with Chrysler Group, as supplier of fluids and lubricants for Chrysler, Dodge and Jeep vehicles and dealer of MOPAR branded products (accessories and spare parts for Chrysler Group vehicles).
EUROPE

PETRONAS Annual Report 2011 57
Percentage market shareLubricants Market Share
Malaysia Italy Brazil
LubricantsThe Group’s lubricants business, led by PLISB, continued to deliver a resilient performance during the year. Through acquisition and strategic partnerships, PLISB aspires to be a leading lubricants and functional fluids company with a global market share and recognised as among the top players.
PLISB has made its first acquisition in China by
acquiring Shandong St Maria Lubricating Oil
Company Limited.
The Company also took another significant
step forward by signing long-term exclusive
technical and supply agreements with Daimler
AG and Mercedes GP respectively in September
2010 for the development and supply of Fluid
Technology SolutionsTM for the Mercedes
GP PETRONAS Team which includes fuel,
engine oils, hydraulic and gear oils as well as
transmission fluids for Formula 1 application.
This opportunity will help to further enhance
PETRONAS’ credibility and image as a serious,
competent and reliable partner in motorsports
and in the automotive world.
PETRONAS aims to be the lubricant market
leader in Malaysia in five to 10 years by
introducing enhanced lubricant products and
rolling out aggressive marketing campaigns.
Currently, PETRONAS controls 22% of the
local lubricants market. The Company has also
signed an exclusive lubricants agreement to
supply Syntium to all Chevrolet and six Cycle &
Carriage service outlets throughout Malaysia.
FY2010 FY2011FY2009FY2008FY2007
2218
9
1720
9
17191817
8

58 PETRONAS Annual Report 2011
PetrochemicalsThe year under review saw the recovery of the olefins and polyolefins market from the residual effects of the economic crisis of 2009. Low density polyethylene (LDPE) prices increased by 17% compared to the previous year due to the tightening of supplies. Polypropylene prices gained 19% year-on-year on the back of healthy demand from emerging economies. The aromatics spot market had been bullish, driven mainly by strong demand for paraxylene, which is used in the production of purified terephthalic acid. The monoethylene glycols market had also been strong during the year under review supported by the rally in fibre intermediate product prices. The market for vinyls also picked up steadily throughout the year.
Average annual price for methanol was higher by 27% compared to the previous year. The methyl tertiary butyl ether (MTBE) market also strengthened throughout the year. In addition, agricultural commodity prices soared to record highs in view of improved demand, leading to stronger prices for urea and ammonia glob-ally.
Overall, petrochemical product prices have
improved tremendously across the board from
the low levels seen in the second half of 2009.
Most petrochemical products demonstrated
strong growth momentum buoyed by improved
economic growth and demand from the Asia
Pacific markets, especially from China and India,
as well as the continuous upward movement in
crude oil prices.
As a result, PETRONAS’ petrochemical
business arm, PCG performed well, with
total production reaching 8.2 million tonnes
compared to 7.8 million tonnes in the previous
financial year. PCG sold 3.3 million tonnes of
olefins and derivatives and 3.4 million tonnes of
fertilisers and methanol, representing increases
of 10% and 6% respectively compared to
the previous year. Higher sales volume was
achieved for the year mainly due to additional
volume from newly acquired subsidiaries,
Optimal Glycols (Malaysia) Sdn Bhd, Optimal
Chemicals (Malaysia) Sdn Bhd and Polyethylene
(Malaysia) Sdn Bhd.
Overall, plant utilisation rate for the year was
slightly lower at 81% compared to 82.5%
in the previous financial year mainly due to
maintenance shutdowns of some plants.
In running a petrochemical complex, it is vital
that the facilities are well maintained. Hence,
PCG’s production facilities are periodically shut
down for scheduled maintenance. Compliance
with maintenance and regulatory requirements
is in line with its commitment to PETRONAS’
Health, Safety and Environment (HSE) policy.
PCG follows a stringent maintenance schedule,
which would in turn enhance product yields
and quality, increase plant efficiency and safety,
reduce the possibility of future unscheduled
plant shutdowns and allow required regulatory
equipment inspections to be performed.
In million tonnesSales Volume
In million tonnesProduction Volume
FY2010 FY2011FY2009FY2008
8.27.8
9.29.3
FY2010 FY2011FY2009FY2008
6.76.25.75.8
In percentUtilisation Rate
20
40
60
80
100
FY2008 FY2009 FY2010 FY2011
81.5 82.2 82.581.0

PETRONAS Annual Report 2011 59
OutlookThe global economic recovery is underway witnessed by a gradual recovery in the developed world to pre-crisis levels, while the developing world continues to surge ahead although at a slower pace. Despite what appears to be a rebound, concerns over increasing inflation levels, particularly in China and India, coupled with increasing interest rates, withdrawal of government stimulus packages and increasing sovereign debt concerns in Europe, can dampen a robust recovery.
In the light of supply disruptions in key oil
producing countries such as Libya, OPEC will be
expected to take the lead in the control and re-
balancing of global oil prices. However, delays in
OPEC’s response to current oil prices portray its
reluctance in boosting production as OPEC is of
the opinion that the high oil prices are driven by
speculation, rather than fundamentals.
The outlook for refiners in the East outshines
that for the West in 2011 as demand in mature
markets remain fairly weak. Global oil demand
is expected to rise by 1.8 million barrels per
day while global refinery throughput will grow
200,000 barrels per day less than that. This
gap will easily be substituted by alternative
fuels and might even lead to an increase in
product inventories. In Asia where end product
demand is high and capacity addition slows
significantly, refining margins are expected to
remain strong.
Capitalising on the opportunity to expand
and enhance our Downstream Business,
in May 2011, PETRONAS announced the
RAPID project in Pengerang, Johor. With a
potential cost of US$20 billion, the components
include a 300,000 barrels per day refinery and
petrochemical complex with a total three million
tonne per annum olefins capacity. If sanctioned,
the RAPID project provides, among others, the
opportunity for PETRONAS to further expand its
petrochemical business through volume growth
and a more diversified products portfolio by
moving into high value and premium specialty
chemicals.
In addition, a joint feasibility study between
PETRONAS and BASF to produce specialty
chemicals in Malaysia is currently underway
and is expected to be completed by December
2011. As the petrochemical business arm of
PETRONAS, PCG will evaluate the outcome
of the feasibility study and will undertake the
collaboration with BASF going forward, if
viable.
Also, PETRONAS is in the final stage of
assessing the viability of a greenfield ammonia
and urea plant in East Malaysia. If sanctioned,
this will position PETRONAS as the largest urea
exporter in South East Asia.
Growth opportunities remain as demand for
petrochemicals in the Asia Pacific is expected
to strengthen in line with population growth,
increasing living standards and improving
regional economies. PCG, with its strong
integration, diversified product portfolio and
advantaged feedstock cost structure, is well-
positioned to benefit from an up-cycle in the
petrochemical industry.
The plans outlined are in line with PETRONAS’
determination to ensure that our Downstream
Business remains resilient. We will continue
to maximise value creation and selectively
expand our business presence in predefined
growth markets, while continuously assessing
the quality of our portfolio of assets in order to
optimise and maximise returns for the Group.
Disclaimer on forward-looking statements: Forward-looking statements involve inherent risks and uncertainties. Should one or more of these or other uncertainties or risks materialise, actual results may vary materially from those estimated, anticipated or projected. Specifically, but without limitation, capital costs could increase, projects could be delayed, and anticipated improvements in capacity, performance or profit levels might not be fully realised. Although PETRONAS believes that the expectations of its management as reflected by such forward-looking statements are reasonable based on information currently available to it, no assurances can be given that such expectations will prove to have been correct. Accordingly, you are cautioned not to place undue reliance on the forward-looking statements, which speak only as of the date they are made. PETRONAS undertakes no obligation to update or revise any of them, whether as a result of new information, future developments or otherwise.

60 PETRONAS Annual Report 2011
Maritime & LogisticsBusiness
OverviewLed by subsidiary MISC Berhad, PETRONAS’
maritime and logistics business is involved in
the business of ship owning, ship operating,
owning and operating of tank terminals and
offshore floating facilities as well as marine
repair, marine conversion and engineering and
construction works.
MISC, with more than 100 vessels and a
combined tonnage of more than 10 million
deadweight tonnes (dwt), is the leading owner
operator of Liquefied Natural Gas (LNG) carriers
and the third largest owner of Aframax fleet in
the world.
Highlights
MHBInitial Public OfferingRaised RM2.03 billion from the listing of
Malaysia Marine and Heavy Engineering
Holdings Bhd (MHB) during the year.
Globaltank terminal businessAcquisition of 50% in Vitol Tank Terminals
International (VTTI) BV gives us presence in
11 locations in 10 countries.
Footholdin South AmericaSecured 15 year time-charter with Petrobras
for 2 Dynamic Positioning (DP) Aframax
shuttle tankers.
Fleet Size
MISC-Owned Fleet by Business FY2011 FY2010
LNG Carriers
29 29
Petroleum Tankers 50 44
Chemical Tankers 19 17
Liner
18 18
Offshore FacilitiesFPSOFSOMOPU
55 1
45 -
Total Fleet Size 127 117

PETRONAS Annual Report 2011 61
The Year in ReviewMISC continued to experience a challenging operating environment amidst the backdrop of unpredictable and volatile global economic and geopolitical conditions. In particular, shipping rates remained under pressure as record new deliveries continued to put pressure on an industry already weighed down by excess tonnage.
Despite the difficult operating conditions, the
period under review saw the achievement of
two significant milestones. Firstly, the acquisition
of a 50% stake in VTTI BV completed in
September 2010, effectively propelled MISC
into the global tank terminal business arena
with immediate access to 11 locations in 10
countries. Secondly, MISC undertook the listing
of its wholly-owned heavy engineering business,
MHB on Bursa Malaysia. The public listing of
MHB was one of the most successful and best
performing IPOs for the year in Malaysia.
MISC’s LNG business safely delivered 22.34
million tonnes of LNG cargo, comprising 10%
of global demand. Cumulatively, since its
maiden voyage in 1983, MISC’s LNG vessels
have now made 6,234 voyages carrying
311.76 million tonnes of LNG for an expanding
portfolio of clients. MISC also recently secured
medium-term contracts with BG Group plc
and International Gas Transportation Co for the
North West Shelf project.
MISC’s wholly owned subsidiary, AET Tanker
Holdings Sdn Bhd, faced one of the more
difficult operating environments during the
year as the petroleum tanker segment was
besieged by heavy delivery of new vessels. With
half of its vessel portfolio under term contracts
which offered rate protection, AET dynamically
managed contract renewals during the year to
mitigate the impact of low spot rates. However,
amid the challenging environment, AET scored
several successes. First, it secured a new 15-
year time charter for two DP Aframax shuttle
tankers with Petrobras commencing 2012.
In addition, several term contracts were also
renewed for longer tenures, providing longer
term earnings stability. AET also took delivery
of three Aframax tankers as part of its fleet
rejuvenation and expansion programme,
bringing the number of Aframax tankers in its
fleet to 37.
In the year under review, MISC took delivery of
10 new chemical vessels of between 19,000
and 45,000 dwt and returned four in-chartered
vessels. The last five newbuildings (4 x 19,000
dwt from Fukuoka Shipbuilding Co Ltd and 1
x 45,000 dwt from SLS Shipbuilding Co Ltd)
from its fleet rationalisation programme which
started in 2007, are scheduled for delivery within
the next 12 months. By then, the chemical
tanker fleet will comprise 29 vessels, totaling
898,117dwt, of which 19 vessels are owned.
While enjoying initial success in the turning
around of the liner business during the early
part of the year following the new focus on
Intra-Asia trade services, operating conditions
in the second half of the year deteriorated,
greatly impacted by natural disasters such
as the earthquake in New Zealand and
floods in Queensland, Australia as well as
weather disruptions in North Asia. Port calls
were disrupted which affected the volume of
liftings.
In the offshore business, MISC saw maiden
contributions from two new assets, namely,
FPSO Ruby II and MOPU Satu. FPSO Ruby
II, operating on Block 01 and 02 of the Ruby
Field, offshore Vietnam officially received First
Oil on 9 June 2010, marking MISC’s second
asset deployed in the waters off Vietnam,
in collaboration with our strategic partner,
PetroVietnam Technical Services Corporation.
This FPSO is owned and operated by Vietnam
Offshore Floating Terminals Ruby Ltd, a joint
venture between MISC and PTSC, of which
MISC has a 40% equity stake.
MISC’s other subsidiary, MHB was successfully
listed on Bursa Malaysia in October 2010,
raising a total of RM2.03 billion for the Company.
In conjunction with the IPO, Technip SA, a
renowned project management, engineering
and construction service provider in the oil
and gas industry, was invited to participate
as an 8% strategic shareholder. This further
strengthens both parties’ previous collaboration
in Turkmenistan but more importantly, provided
MHB with the technical platform to expand and
develop its capabilities to compete with the best
in the world.
MHB successfully completed three major
projects, namely, the 14,505 metric tonne
Tangga Barat Central Platform for a cluster
of gas fields offshore Terengganu, Malaysia;
the Magtymguly Collector Riser Platform
for Turkmenistan Block 1 Phase 1 Gas
Development Project; and the BP Angola
External Turret System. Construction of the
38,000 metric tonne Gumusut-Kakap semi-
submersible Floating Production System (FPS)
(Gumusut) will be MHB’s biggest project on site
this year. Designed to process 150,000 barrels
per day from 19 subsea wells and operating in
up to 1,200 metres water depth, Gumusut will
be Asia’s first deepwater semi-submersible FPS.
MHB’s orderbook stands at RM3.1 billion.

62 PETRONAS Annual Report 2011
As PETRONAS continues to expand its
business at home and around the world, people
remain at the heart of our agenda. We believe
that nurturing a high-performance culture is
crucial in managing, motivating and inspiring our
employees to produce extraordinary results.
In the year under review, several key initiatives
to harness the talent and commitment of our
people have been implemented to elevate talent
management to a more strategic level.
Talent Attraction& SourcingAs the organisation continues to grow rapidly, timely and effective talent sourcing is critical. As a result, PETRONAS is empowering the businesses to make their own decisions over recruitment matters. All Business Heads will drive talent management within their respective businesses to identify the right candidate for the job as well as to put in place a clear succession plan.
Meritocracy is the basis for talent management
in PETRONAS. In sourcing talents, selection
is based not just on performance but also
on soft skills, and potential. During the year
under review, a total of 1,382 candidates were
recruited, of which 1,283 are locals and 99 are
international hires.
TalentDevelopmentIn the year under review we established People Development Committees (PDCs) at various levels in the organisation to provide greater line ownership and better talent management. The committee members in the PDCs are well represented to ensure balanced, objective and fair decisions are made in talent development, performance and consequence management, and mobility.
The PETRONAS Leadership Development
Framework has also been implemented to
ensure that we are able to identify and develop
more top talents in the organisation to support
our business growth and expansion.
As at 31 March 2011, a total of 131 Corporate
Top Talents and 282 Business Top Talents were
identified to fill corporate critical positions and
business critical positions, respectively.
Our People
Highlights
41,628staffPETRONAS employees Group-wide increased by
1.6% to 41,628, as at 31 March 2011, reflecting the
expansion of the business.
Nurturing HighPerformance CulturePETRONAS emphasises on building a high performance culture. We are constantly
improving our people practices in our efforts to motivate employees to deliver their
best and bring real change that will add value to the organisation.
Overview

PETRONAS Annual Report 2011 63
Talent RetentionThe young talents of today in PETRONAS will determine our direction tomorrow. With the younger generation representing about 70% of the workforce in PETRONAS, our investments in people are focused on developing and managing our young talents and our mid-career staff.
To ensure that our young and mid-career staff
are committed to the organisation for the long-
term, we have implemented a differentiated
remuneration package in the year under
review.
Rewards are now distinguished through
differentiated remuneration to enable the
recognition of an individual staff’s performance,
skills and competencies.
To further motivate staff, we also embarked on
flexible working arrangements and introduced
Smart-Casual Fridays as part of our commitment
to ensure a better working environment and to
increase productivity.
With the implementation of these and other
initiatives, we hope to create a more conducive
working environment for our people in our effort
to cultivate a high performance culture within
the organisation.
Enhanced HR Operating ModelTo improve the efficiency and effectiveness
of managing our workforce, and to ensure
consistent and measurable services to our
employees, we have strengthened our Human
Resource (HR) Operating Model. With the
implementation of this enhanced model in
the year under review, HR professionals will
be able to focus more on the formulation of
strategies and development while the routine
transactional and administrative HR activities will
be undertaken by various other units.
In the year under review, PETRONAS introduced
Project SAPPHIRE, a global integrated system
which will include a Shared Services Centre to
manage HR services, applications, processes,
people and innovations. Project SAPPHIRE will
also introduce myPASSPORT as a self-service
portal for staff. This will support the Enhanced
HR Operating Model in line with HR’s role of
becoming a strategic partner to the Group.
Education & SponsorshipIn the year under review, we have streamlined our education efforts following the implementation of the Education Transformation initiative where our learning institutions will now play a greater role in developing and nurturing talents for the organisation, as well as for the industry.
Our Universiti Teknologi PETRONAS, which
offers undergraduate and post-graduate
courses related to the oil & gas industry, is on
track to achieving Research University (RU)
status by 2013, obtaining 62% of the RU score
in 2010 compared to 57% in the previous year.
The research university status is granted by
the Malaysian Ministry of Higher Education and
it provides access to much needed funding
and grants for research, development and
commercialisation activities.
In the year under review, a total of 15,500
employees from the PETRONAS Group
and its affiliates attended various leadership
development programmes at the PETRONAS
Management Training centre while at Institut
Teknologi Petroleum PETRONAS (INSTEP),
more than 11,500 engineers and technicians
attended various upgrading programmes.
INSTEP also produces skilled technicians and
operators through its Petroleum Technology
Programme.
Akademi Laut Malaysia (ALAM) continues
to provide quality maritime education for the
shipping industry. In December 2010, 416
students graduated from ALAM.
Each year, PETRONAS provides sponsorship
to deserving tertiary students. Sponsorships
are given for critical disciplines relevant to
PETRONAS’ business needs.
To ensure that the scholars are well-rounded,
PETRONAS cont inual ly monitors their
academic performance and organises student
development programmes that focus on
strengthening academic, as well as soft skills.
In the year under review, PETRONAS sponsored
a total of 278 students to institutions of higher
learning, 211 locally and 67 overseas. During
the same period, a total of 411 graduates were
recruited to join PETRONAS’ workforce.
In line with our aspiration of becoming the
Regional Education and Learning Hub for the oil
& gas industry, PETRONAS’ education approach
focuses on academy-industry partnerships that
emphasise industry-oriented learning and
research excellence. Our education and R&D
centres focus on technology development,
knowledge management, leadership and
capability building in our quest to compete
globally.
InstitutionNo. of
Graduates in 2010
No. of Graduates in
2009
UTP 1190 1167
INSTEP 613 797
ALAM 416 427
Graduates

64 PETRONAS Annual Report 2011
Overview
Technology& Engineering
Technology plays a fundamental role in the
development of the oil and gas industry. For
PETRONAS, technology is an enabler that drives
our growth and helps us remain competitive. In
an industry environment increasingly fraught
with challenges such as depleting resources,
more complex and difficult to monetise
unconventional hydrocarbon resources, gas
fields with high CO2 content and crudes and
gas with high contaminants, we are committed
to delivering integrated, innovative and value-
adding technology solutions and projects
across the Group. Developing and applying
appropriate technology solutions are central
to the success of our projects and operational
excellence.
PETRONAS has identified Enhanced Oil
Recovery (EOR) and CO2 Management as
critical Exploration & Production (E&P) areas
to build capability that will extend the life of our
current assets, improve hydrocarbon recovery
and enable the development of challenging
assets. With this in mind, PETRONAS is
setting up an Exploration & Production (E&P)
Technology Centre to focus on developing EOR
and CO2 Management technologies.
In the year under review, our Technology &
Engineering (T&E) Division has taken on an
additional portfolio to deliver downstream capital
projects to support PETRONAS’ business
expansion. These projects will be carried out
in compliance with the PETRONAS Project
Management System which ensures that capital
projects are delivered within cost, on schedule,
comply with HSE requirements and will assure
operability.
Integrated teams comprising experienced
project managers and engineers, equipment
& material category managers and technical
solution experts are responsible for the full
spectrum of a project, from engineering
design, identifying cost and value engineering
opportunities to executing the project to meet
best-in-class asset delivery performance.
Our T&E Division has also put together a team of
technical professionals to provide innovative and
value-adding technology solutions, enhance
technical standards and governance, and drive
the technical capability development for Group-
wide sustainable plant operations in helping
us strengthen Operational Excellence. Focus
areas include process safety management,
asset integrity and reliability programmes where
solutions and services have progressively shown
results in increasing production.
Over the years we have significantly reduced our
dependency on third party technical services,
reflecting the strength of our in-house technical
capabilities to deliver value to the Group.
EOR & CO2 ManagementFaced with the prospects of depleting oilfields, EOR is being pursued by PETRONAS to increase the recovery factor (RF) of existing fields. The RF for Malaysia’s oil producing fields is targeted to reach 45% and we are well on our way to achieving this target. As at 1 January 2011, our RF was 39%. EOR technology programmes focusing on Water Alternating Gas, Chemical EOR (CEOR) and Thermal EOR have been planned for implementation at our oil fields in Malaysia and the Sudan. CEOR has been successfully applied at the Angsi field, off Terengganu in Peninsular Malaysia.
In the year under rev iew, PETRONAS collaborated with China National Petroleum Corporation (CNPC) to develop CEOR in four phases. The first phase was completed with the development of low-cost super surfactants and polymers that are capable of withstanding high temperature and high salinity. The application of this technology is targeted for Peninsular Malaysia’s Dulang field and other potential fields.
In managing high content of CO2 in gas fields, PETRONAS is pursuing CO2 management technology in collaboration with Universiti Teknologi Malaysia for the development of membrane technology to remove CO2 at offshore platforms. In addition, together with US-based Cameron International Corporation, PETRONAS has successfully developed and
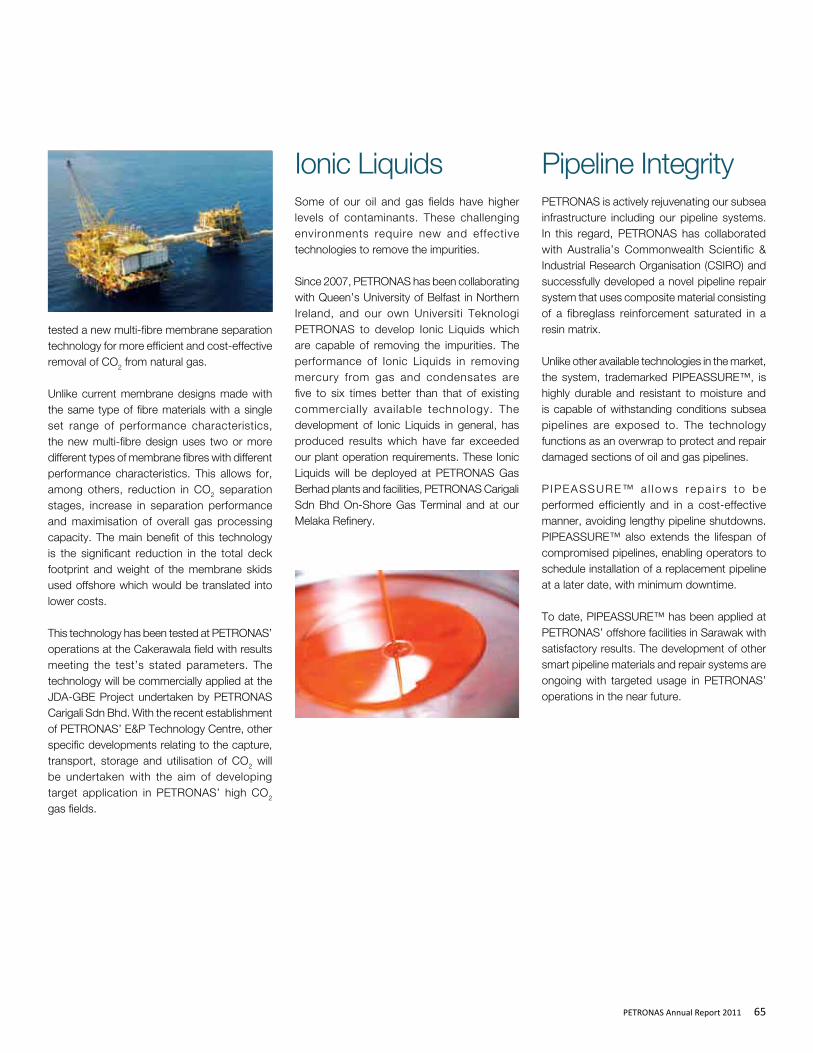
PETRONAS Annual Report 2011 65
Ionic Liquids Some of our oil and gas fields have higher levels of contaminants. These challenging environments require new and effective technologies to remove the impurities.
Since 2007, PETRONAS has been collaborating with Queen’s University of Belfast in Northern Ireland, and our own Universiti Teknologi PETRONAS to develop Ionic Liquids which are capable of removing the impurities. The performance of Ionic Liquids in removing mercury from gas and condensates are five to six times better than that of existing commercially available technology. The development of Ionic Liquids in general, has produced results which have far exceeded our plant operation requirements. These Ionic Liquids will be deployed at PETRONAS Gas Berhad plants and facilities, PETRONAS Carigali Sdn Bhd On-Shore Gas Terminal and at our Melaka Refinery.
tested a new multi-fibre membrane separation technology for more efficient and cost-effective removal of CO2 from natural gas.
Unlike current membrane designs made with the same type of fibre materials with a single set range of performance characteristics, the new multi-fibre design uses two or more different types of membrane fibres with different performance characteristics. This allows for, among others, reduction in CO2 separation stages, increase in separation performance and maximisation of overall gas processing capacity. The main benefit of this technology is the significant reduction in the total deck footprint and weight of the membrane skids used offshore which would be translated into lower costs.
This technology has been tested at PETRONAS’ operations at the Cakerawala field with results meeting the test’s stated parameters. The technology will be commercially applied at the JDA-GBE Project undertaken by PETRONAS Carigali Sdn Bhd. With the recent establishment of PETRONAS’ E&P Technology Centre, other specific developments relating to the capture, transport, storage and utilisation of CO2 will be undertaken with the aim of developing target application in PETRONAS’ high CO2 gas fields.
Pipeline Integrity PETRONAS is actively rejuvenating our subsea infrastructure including our pipeline systems. In this regard, PETRONAS has collaborated with Australia’s Commonwealth Scientific & Industrial Research Organisation (CSIRO) and successfully developed a novel pipeline repair system that uses composite material consisting of a fibreglass reinforcement saturated in a resin matrix.
Unlike other available technologies in the market, the system, trademarked PIPEASSURE™, is highly durable and resistant to moisture and is capable of withstanding conditions subsea pipelines are exposed to. The technology functions as an overwrap to protect and repair damaged sections of oil and gas pipelines.
P IPEASSURE™ a l lows repa i rs to be performed efficiently and in a cost-effective manner, avoiding lengthy pipeline shutdowns. PIPEASSURE™ also extends the lifespan of compromised pipelines, enabling operators to schedule installation of a replacement pipeline at a later date, with minimum downtime.
To date, PIPEASSURE™ has been applied at PETRONAS’ offshore facilities in Sarawak with satisfactory results. The development of other smart pipeline materials and repair systems are ongoing with targeted usage in PETRONAS’ operations in the near future.

66 PETRONAS Annual Report 2011
Renewable EnergyIn line with our commitment to operate in a sustainable manner, PETRONAS has taken steps to explore the application of solar and waste-to-energy technologies. In collaboration with Mitsubishi Corporation, we have embarked on a Solar Photovoltaic project for the installation of solar panels at various PETRONAS facilities in Malaysia.
PETRONAS has also collaborated with technology provider Waztec Pte Ltd and with solid-waste management company Alam Flora Sdn Bhd for a detailed feasibility study to design, build and operate a waste-to-energy plant which will convert organic waste to electricity The project will move to engineering design stage, once the feasibility study has been completed.
Project Management & DeliveryBy apply ing the PETRONAS Pro jec t Management System (PPMS) which was establ ished in 2009, a consistent and transparent project delivery could be achieved, resulting in a greater level of project planning and definition in line with best-in class performance for PETRONAS.
PPMS is a key enabler to attain project excellence in both upstream and downstream projects by adoption of best practices to ensure schedule effectiveness and project cost optimisation.
To ensure the successful delivery of projects, execution of category management for equipment and materials is critical to achieve cost and delivery advantages. This strategic sourcing consolidates purchases of high value
Operational ExcellenceTo ensure Operational Excellence, PETRONAS in 2006 established the Group Technical Solutions (GTS) to provide technical solutions and enhance technical standards for the Group.
With GTS becoming a centre of excellence, PETRONAS has successfully deployed the right technical solutions and best-in-class technical standards for operational requirements. There has been an increase in demand for technical solutions and services provided to the PETRONAS Group of Companies by PETRONAS engineers, resulting in a chargeable manhour utilisation of 72%, which exceeded the industry level of 65%.
In attaining a competitive level of Operational Excellence, PETRONAS has developed the Integrated Plant Operations Capability System (iPOCS) which provides a comprehensive and systematic approach to drive consistent and quality improvement across the businesses. iPOCS also ensures technical governance, optimisation of operations and business processes which have increased PETRONAS’ plant performance through high reliability and utilisation. A total of 13 operating units (OPUs) have been assessed since September 2009, of which seven OPUs were assessed in 2010. The assessment of the remaining six OPUs will be completed by 31 December 2011.
In the year under review, PETRONAS has intensified efforts to undertake optimisation and reliability programmes to ensure asset reliability and integrity. This includes platform optimisation programmes that are being applied at various fields in Malaysia, which has led to a significant increase in oil production and reduction in deferment values.
and/or high impact items and establishing alliance with suppliers and service providers. Hence, T&E undertakes engineering category management for material and equipment to achieve cost and delivery advantage for projects.
As the front-end design determines the success of delivery, T&E strengthens its capability development in Front End Engineering Design (FEED) through various initiatives which include collaboration with third party vendors and engineering contractors to acquire the relevant capabilities. Due to knowledge and technical transfer, many of our engineers have become FEED experts in various projects and have built in-house FEED capabilities.
Among the key projects are the Refinery and Petrochemical Integrated Development (RAPID), Sabah Ammonia Urea Project, PETRONAS Floating Liquefied Natural Gas (FLNG) and Sabah Oil & Gas Terminal (SOGT).

PETRONAS Annual Report 2011 67
Technology Commercialisation & Intellectual Property ManagementThe commercialisation of Technology has paved the way for PETRONAS to generate returns on investments made from our proprietary technology. PETRONAS has col lected RM1.38 million in royalties from previously commercialised technologies and has also filed 12 patents in the year under review.
We have also commercialised the NE01 engine with Star Power Engine Inc for the China market. The start of production for the first engine variant is expected in March 2013.
In the year under review, four more technological breakthroughs have been endorsed for commercialisation and they are: • Mass Transfer Technology for gas and
liquid separation.• Multi Layer Fibre Membrane for CO2
removal process.• AquaMagnetometryTomographyMethods
(MTM) for non-intrusive subsea pipeline inspection.
• SmartCen, an online real-time meteringsupervisory system.
Technical Capability BuildingPETRONAS continues to build a sufficient pool of technical professionals (TP), technical executives and technical trade specialists through a concerted effort for technical capability development. TPs are expected to drive superior business performance through their technical leadership and expertise.
The Accelerated Capability Development (ACD) programme introduced since 2006, has reduced the duration for technical executives to reach the desired competency level while strengthening their ability to work independently, known in the industry as time to autonomy (TTA). For the year under review, the TTA was 8.4 years compared to 9.2 years in the previous year. PETRONAS is well on the way to meeting our target of 7 years.
The PETRONAS Risk Based Inspection (PRBI), which essentially is a tool implemented within the PETRONAS Group, manages the integrity of our assets through an effective and optimised inspection programme. It was successfully deployed at several key OPUs which include the PETRONAS LNG Complex, PETRONAS Gas Berhad and PETRONAS Fertilizer (Kedah) Sdn Bhd. The commercial and industrial viability of PRBI was effectively demonstrated on the global front through its deployment at the Engen Refinery in South Africa in 2010. In addition, PRBI has been accepted by the Department of Occupational Safety and Health (DOSH) as the equipment integrity system in managing Certificate of Fitness (CoF) for DOSH’s registered equipment.
The deployment of technical services solutions implemented Group-wide has resulted in value creation of about RM1 billion for the Group in the year under review through yield improvement, cost savings and opportunity loss avoidance. At the same time, less than 10% of technical services were outsourced to third party contractors in regards to technical solutions deployed Group-wide.

68 PETRONAS Annual Report 2011
As a good corporate citizen PETRONAS is
committed to responsible HSE management
practices in every aspect of our operations.
Cultivating a culture of HSE Excellence is central
to the Company’s long-term sustainability.
In the year under review PETRONAS continued
to place strong emphasis on HSE in all aspects
of our operations by integrating essential
practices into our business activities in line with
international standards and practices.
The Deepwater Horizon disaster last year is an
important reminder for us to be constantly on
guard in observing HSE standards and best
practices. The key lessons from such incidents
are systematically shared Group-wide to ensure
that we understand the catastrophic impact to
business as well as reputation and address key
HSE concerns by taking preventive measures
Overview
Health, Safety& Environment (HSE)
Highlights
OSRLmembershipBecame a Participant Member of the Oil Spill Response
Limited (OSRL), a specialist that provides spill response
support and services internationally, in June 2011.
22.2 million mmBtuCumulative energy savings for
domestic downstream operations.
90%coverageHealth Risk Assessment
(HRA) completed for Malaysia
operations.
at all levels of our operations. At the same time
we continue to ensure that our operations are
governed by HSE environmental standards that
are based on industry best practices.
To safeguard our people, environment, assets
and reputation, PETRONAS’ HSE strategies
are focused on strengthening HSE leadership,
culture and mindset, and enhancing HSE risk
management and HSE governance.

PETRONAS Annual Report 2011 69
InitiativesHSE KPIs for Senior ManagementTo strengthen and elevate a commitment to HSE among PETRONAS’ senior management, HSE Key Performance Indicators (KPIs) have been incorporated into their scorecards. Senior management will be assessed based on the performance of their respective businesses’ Fatal Accident Rate (FAR), Lost Time Injury Frequency (LTIF), major Loss of Primary Containment (LOPC) incidents and major fires. The inclusion of these KPIs will help drive improvement in the Group’s safety, sustainable development and capability performance.
PETRONAS has also aggressively strengthened its HSE organisation Group-wide by employing experienced and competent HSE experts to enhance the governance of HSE compliance. This initiative, which shall be continued consistently, reflects the seriousness of the management and business in improving the Group’s HSE capability and performance.
Risk ManagementHSE risk management is reinforced through the implementation of ZeTo or Zero Tolerance Rules for high-risk activities, land transport safety programme, formulation of guidelines for occupational health and measurement of product carbon footprint by inventorising greenhouse gasses throughout the lifecycle of a product.
Launched in 2010, ZeTo Rules aim to improve the safety performance of the Group by enforcing consequence management on employees and contractors who violate the rules. During the year under review there were 52 cases of ZeTo Rules violations and consequence management was carried out on the 25 staff and 27 contractors involved.
Fire risk assessments were conducted in more than 40 sites since 2006 with three assessments conducted during the year under review with the objective of identifying issues on fire prevention, detection and protection.
Another area of focus is process safety which is balanced with the need for personal safety. Process safety means making sure our facilities are well designed, safely operated and properly maintained. In this respect, three management workshops for process safety leadership were organised, one in August 2010 and two in February 2011, to reinforce understanding among senior leaders of their role in preventing major process safety incidents.
These sessions will be expanded to improve their effectiveness in inculcating process safety behaviour into the PETRONAS safety culture.
In line with our focus on managing growing health risks and to ensure a healthy workforce PETRONAS completed 90% of HRA for our domestic operating units in the year under review and we have received authority approval to conduct Chemical Health Risk Assessment using the HRA methodology. In addition, we have developed best practices in fatigue management and fitness to work as well as organised personal health management programmes to reduce lifestyle-related health problems among employees.

70 PETRONAS Annual Report 2011
Oil Spill Preparedness and ResponseRecognising the potential catastrophic impact of major oil spills on the environment, PETRONAS embarked on a programme to reassess the effectiveness of our oil spill preparedness and response. The outcome of the assessment will also be used to establish a longer term strategy in oil spill preparedness and response. As part of ensuring effective preparedness and response, PETRONAS became a Participant Member of the OSRL in June 2011. One of the key benefits of being a Participant Member of this organisation, apart from round the clock response for all our operations globally, is access to rapid aerial dispersant spraying facilities, one of the most effective methods for combating major oil spills.
In collaboration with the International Maritime Organisation (IMO), International Petroleum Industry Environmental Conservation Association (IPIECA) and Petroleum Industry of Malaysia Mutual Aid Group (PIMMAG), PETRONAS organised a two-day workshop on Dispersant in Oil Spill Response, in February 2011. The workshop brought together oil spill response practitioners from the Malaysian government and from around the region to help enhance the industry’s understanding of the dispersants to combat oil spills more effectively. PETRONAS continues to play an active role in PIMMAG which we initiated in 1993.
Waste Minimisation ProgrammeThe establishment of a waste minimisation programme helps PETRONAS to reduce our environmental footprint. Some of the hazardous and domestic waste minimisation initiatives include the recovery of spent catalysts by PETRONAS Penapisan (Melaka) Sdn Bhd refinery, establishment of an integrated waste management plan at the Engen Refinery in Durban, South Africa, recovery of copper slag and domestic and office waste reduction campaigns at the PETRONAS Twin Towers in Kuala Lumpur, Universiti Teknologi PETRONAS in Perak and other operating units. The Group will continue to look into other waste minimisation opportunities across our various businesses within the Group globally.

PETRONAS Annual Report 2011 71
Energy Savings PETRONAS continued to improve the energy efficiency of our upstream and downstream operations through an Energy Loss Management (ELM) initiative. Increased energy efficiency reduces the greenhouse gas (GHG) footprint of our operations while using natural resources more prudently.
In the year under review, PETRONAS registered energy savings of 2.5 million mmBtu from its domestic downstream operations. This takes the cumulative savings to 22.2 million mmBtu as at 31 March 2011. The savings were achieved primarily through energy efficiency projects carried out at PETRONAS LNG Complex and PETRONAS Gas Berhad facilities. These projects, which include the Strategic Energy Review at PETRONAS LNG Complex, contributed to more than 60% of total downstream savings achieved. In the domestic upstream sector, energy efficiency initiatives have contributed to savings of 0.5 million mmBtu.
HSE Performance Overall, the Group recorded an improvement in our FAR to 2.58 in the year under review from 3.36 in the previous year. This was attributed to a 23% reduction in the number of fatalities despite a 1.49% increase in the total man hours recorded.
However, regrettably, seven people lost their lives in the year under review, all involving contractors working on PETRONAS projects. This was two less than in the previous year. The fatalities were due to road accidents, falling from heights at the workplace and being hit by objects.
The Group’s LTIF rose to 0.39 during the financial year, from 0.31 in the previous year. A similar trend was also demonstrated by the Group’s Total Reportable Case Frequency (TRCF) of 0.81 in the year under review compared to 0.78 in the previous year.
5
10
15
20
25
10.5
13.7
17.9
19.7
22.2
FY2007 FY2008 FY2009 FY2010 FY2011
LTIF and TRCF for the Group
Fatal Accident Rate
LTIF
TRCF
FY2010 FY2011FY2009FY2007 FY2008
0.31
0.78
0.39
0.81
0.44
0.88
0.48
1.49
0.35
0.88
FY2010 FY2011FY2009FY2007 FY2008
3.36
2.58
3.75
8.10
5.72
Cumulative Energy Savings in Domestic Downstream OperationsIn million mmBtu
No. of cases per one million man hours
Reportable Fatalities per 100 million man hours

72 PETRONAS Annual Report 2011
Sector AwardsWinnerCategory - Oil & Gas• PETRONAS Penapisan (Melaka) Sdn Bhd
Highly CommendedCategory - Transport, Storage & Distribution• Kertih Terminals Sdn Bhd
Achievement AwardsWinners
Gold• PETRONAS Ammonia Sdn Bhd
• Star Energy Group Limited
• Asean Bintulu Fertilizer Sdn Bhd
• Egyptian LNG
Silver• PETRONAS Fertilizer (Kedah) Sdn Bhd
• Petlin (Malaysia) Sdn Bhd
Awards & Recognitions
Royal Society for the Prevention of Accidents (RoSPA) Occupational Health and Safety Awards 2010
Awards and recognitions are a testimony to the Group’s continuous search for excellence. We are delighted to have been bestowed with
numerous awards and recognitions in the year under review by our peers, authorities and others in recognition of our accomplishments.
Since 1956, RoSPA has organised this prestigious
national award scheme to recognise excellence in work-
related health and safety performance by private and
public sector organisations. The scheme is based on
an assessment of a broad portfolio of evidence on the
level of development and performance of an entrant’s
occupational health and safety management system, and
also takes into account the entrant’s reportable accident
rate and enforcement experience.

PETRONAS Annual Report 2011 73
WinnersCategory - Petroleum, Gas, Petrochemical and Allied Sectors
Grand• PETRONASAmmoniaSdnBhd
• PETRONASFertilizer(Kedah)SdnBhd
• PETRONASPenapisan(Melaka)SdnBhd
• PolypropyleneMalaysiaSdnBhd
• AseanBintuluFertilizerSdnBhd
• PETRONASGasBerhad,CentralisedUtilityFacilitiesGebeng
• PETRONASGasBerhad,GasProcessingPlant,ComplexB
• PETRONASGasBerhad,TechnicalandFacilities
Development Division
• Petlin(Malaysia)SdnBhd
Gold Merit• MTBE/PolypropyleneMalaysiaSdnBhd
• PETRONASCarigaliSdnBhd,SabahOperations
• VinylChloride(Malaysia)SdnBhd
• PETRONASGasBerhad,CentralisedUtilityFacilitiesKertih
• PETRONASGasBerhad,ExportTerminal
• PETRONASGasBerhad,KertihRegionalOffice
• PETRONASGasBerhad,TransmissionOperationsDivision,
Segamat Regional Operations
• KertihTerminalsSdnBhd
• BPPETRONASAcetylsSdnBhd
Gold (Class I)• PETRONASCarigaliSdnBhd,PeninsularMalaysia,
Onshore Gas Terminal
• PETRONASCarigaliSdnBhd,PeninsularMalaysia,
Terengganu Crude Oil Terminal
• PETRONASPenapisan(Terengganu)SdnBhd
• AromaticsMalaysiaSdnBhd
• PETRONASGasBerhad,BintuluOperations
Gold (Class II)• PETRONASMethanol(Labuan)SdnBhd
• MISCIntegratedLogisticsSdnBhd
Malaysian Society for Occupational Safety and Health (MSOSH) Awards 2010The MSOSH Award is an annual award presented
to companies in Malaysia with proven outstanding
Occupational Safety and Health (OSH) performance.
Identified companies are subjected to stringent
document and site verification audits by MSOSH Panel
of Auditors in order to be considered for the award.
The panel members comprise representatives from the
Department of Occupational Safety and Health (DOSH),
Social Security Organisation (SOCSO), National Institute
for Occupational Safety and Health (NIOSH), SIRIM
Berhad, QAS International and Federation of Malaysian
Manufacturers (FMM).

74 PETRONAS Annual Report 2011
WinnersCategory - Petrochemicals
Platinum• BASF PETRONAS Chemicals Sdn Bhd
Gold• MTBE/Polypropylene Malaysia Sdn Bhd
• PETRONAS Penapisan (Melaka) Sdn Bhd
• PETRONASPenapisan(Terengganu)SdnBhd
• AromaticsMalaysiaSdnBhd
• BASF PETRONAS Chemicals Sdn Bhd
Silver• MTBE/Polypropylene Malaysia Sdn Bhd
• OPTIMAL Chemicals (Malaysia) Sdn Bhd
• Ethylene/PolyethyleneMalaysiaSdnBhd
• BASF PETRONAS Chemicals Sdn Bhd
Merit• MTBE/Polypropylene Malaysia Sdn Bhd
• OPTIMAL Chemicals (Malaysia) Sdn Bhd
• PETRONAS Penapisan (Melaka) Sdn Bhd
• PETRONASPenapisan(Terengganu)SdnBhd
• Ethylene/PolyethyleneMalaysiaSdnBhd
• AromaticsMalaysiaSdnBhd
• Petlin (Malaysia) Sdn Bhd
• BASF PETRONAS Chemicals Sdn Bhd
Chemical Industries Council of Malaysia (CICM) Responsible Care Awards 2009
The Chemical Industries Council of Malaysia or CICM, is
the umbrella body representing the various sub-sector
chemical groups ranging from oleochemicals, paints,
fertilisers, petrochemicals, agriculture chemicals, industrial
gases, coating resins and biodiesel sectors.
The Responsible Care Awards is organised annually to
promote greater awareness of the Responsible Care
Programme and its principles and to give recognition
to those organisations that have made most progress
in implementing the Responsible Care’s Six Codes of
Management Practices in Malaysia. The Codes developed
are the Distribution Code, Process Safety Code, Pollution
Prevention Code, Product Stewardship Code, Community
Awareness and Emergency Response Code and the
Employee Health and Safety Code.
WinnersCategory - Heavy Industry Sector (Petroleum/Gas/Chemical) • PETRONASFertilizer(Kedah)SdnBhd
Category - Gas Utilities• PETRONASGasBerhad,TransmissionOperationsDivision,
Kuantan Regional Operations
Category - Storage• Kertih Terminals Sdn Bhd
National Occupational Safety and Health Excellence AwardThe National Occupational Safety and Health Excellence
Award is an initiative by the National Council of Occupational
Safety and Health, Ministry of Human Resources. It
is intended to give credit and acknowledgement to
organisations, employers and employees in various
sectors in the industry that have achieved excellence in
managing safety and health systems in their workplace.

PETRONAS Annual Report 2011 75
Platinum AwardWinner• PSEKinsaleEnergyLimited
19th Annual National Irish Safety Organisation (NISO)/Northern Ireland Safety Group (NISG) Safety Awards
RecognitionPETRONAS Carigali Sdn Bhd (PETRONAS Carigali) ranked second
among the 41 Exploration and Production companies in OGP for
recording Total Reportable Case Frequency (TRCF) of 0.54. The
average TRCF for OGP is 1.68.
PETRONAS Carigali also achieved a Lost Time Injury Frequency
of 0.23, better than OGP’s average of 0.42 and ranked seventh
among other players.
International Association of Oil & Gas Producers (OGP)
The International Association of Oil & Gas Producers
(OGP) is a unique global forum in which members identify
and share best practices to achieve improvements in
every aspect of health, safety, the environment, security,
social responsibility, engineering and operations.
OGP encompasses most of the world’s leading publicly-
traded, private and state-owned oil & gas companies,
industry associations and major upstream service
companies.
This award is given to the winners of the Supreme Safety
Award which have demonstrated continued commitment
to health and safety.
Winners are assessed on how they have maintained and
improved their HSE Performance under the following
categories:-
• HealthandSafetyManagement
• HazardIdentificationandRiskAssessment
• ImplementationandOperationofHealth andSafety
Policies and Procedures
• EmergencyPreparednessandResponse
• HealthandSafetyCommunication,Consultationand
Promotion
• HealthandSafetyTraining
• ProactiveHealthandSafetyManagement
• ReactiveHealthandSafetyManagement
• DemonstrationofSuperiorPerformanceinHealthand
Safety

76 PETRONAS Annual Report 2011
WinnerTop Ten Companies in Malaysia• PETRONASGasBerhad
Winner• PETRONASFertilizer(Kedah)SdnBhd
Industry Excellence AwardWinnerCategory - Industrial Product and Technology• PETRONASGasBerhad
Wall Street Journal Asia 200 Survey
Anugerah Sumbangsih Jabatan Pelajaran Negeri Kedah
NACRA 2010
The Asia 200 Survey, conducted by the Wall Street
Journal, is the ultimate performance review of Asia’s
leading companies. Winners are determined by the
readers of the magazine.
The Sumbangsih Award, which is the sole award in the
Corporate Category is in recognition of the corporate
sector’s contribution in the field of education in Kedah.
The National Annual Corporate Report Awards (NACRA) is
a collaborative effort of Bursa Malaysia Berhad, Malaysian
Institute of Accountants (MIA), and the Malaysian Institute
of Certified Public Accountants (MICPA). Winning the
prestigious NACRA award has increasingly become a
target of many organisations, which clearly demonstrates
the wide recognition of NACRA as the benchmark for
excellence in corporate reporting. The awards aim to
promote greater corporate accountability and more
effective communication by organisations through the
publication of timely, informative, factual and reader-
friendly annual reports.

PETRONAS Annual Report 2011 77
The Platts Global Energy Awards 2011
The Oil Council’s Awards of Excellence 2010
The Energy Efficiency Programme of the Year category
aims to recognise a long-term, systematic commitment
to energy efficiency. The strongest entries here will have
embraced efficiency in a way that seeks to make it work
now and for the foreseeable future.
The awards, which were held for the first time, aim to
recognise the industry’s best performing companies
and executives in the areas of operations, corporate
governance, shareholder return and track record for the
year 2010.
Award of ExcellenceFinalist• PETRONAS
National Oil Company of the Year Nominee• PETRONAS
Overall Merit AwardWinnerCategory - Best Return to Shareholders Award• PETRONASGasBerhad
Malaysian Business-CIMA Enterprise Governance AwardThe Award confers due recognition for excellence in
enterprise governance among Malaysian companies. The
winners were evaluated based on business and corporate
governance principles and best practices.

78 PETRONAS Annual Report 2011
Corporate SocialResponsibility
HighlightsHighlights
Percentage increase in participation in the National Consumer
Campaign (3K) across Malaysia.
33%increase in consumer participation
Percentage increase in the number of students scoring
As in their UPSR exams as a result of Program Bakti
Pendidikan PETRONAS.
22%improvement in UPSR exam results
5,000 families to receive food aid and skills training from PETRONAS.
Program SentuhanHarapan PETRONASlaunched for hardcore poor families
Support and commitment to environmental conservation,
in partnership with Yayasan Sabah.
Imbak CanyonConservation Area in Sabah
PETRONAS supports community development
programmes that provide the skills and resources
to help make a positive and lasting difference
to the lives and prospects of people and
communities that we come in contact with, in
places where we operate.
Our long-term engagement programmes, carried
out in partnerships with local communities,
industries, government and non-governmental
organisations, are in line with our mission to
ensure that the development of the earth’s
precious natural resources is conducted
responsibly and in a manner that would bring
robust and sustainable shareholder returns so
as to allow us to contribute to the well-being
of peoples, communities and nations where
we operate.
Program Bakti Pendidikan PETRONAS Introduced in 2002 in partnership with schools nationwide, this outreach programme is targeted at providing underprivileged and academically challenged children in communities where PETRONAS operates, with a strong academic foundation. In support of the Government’s efforts to improve the levels of academic achievement in Science, Mathematics and the
Community
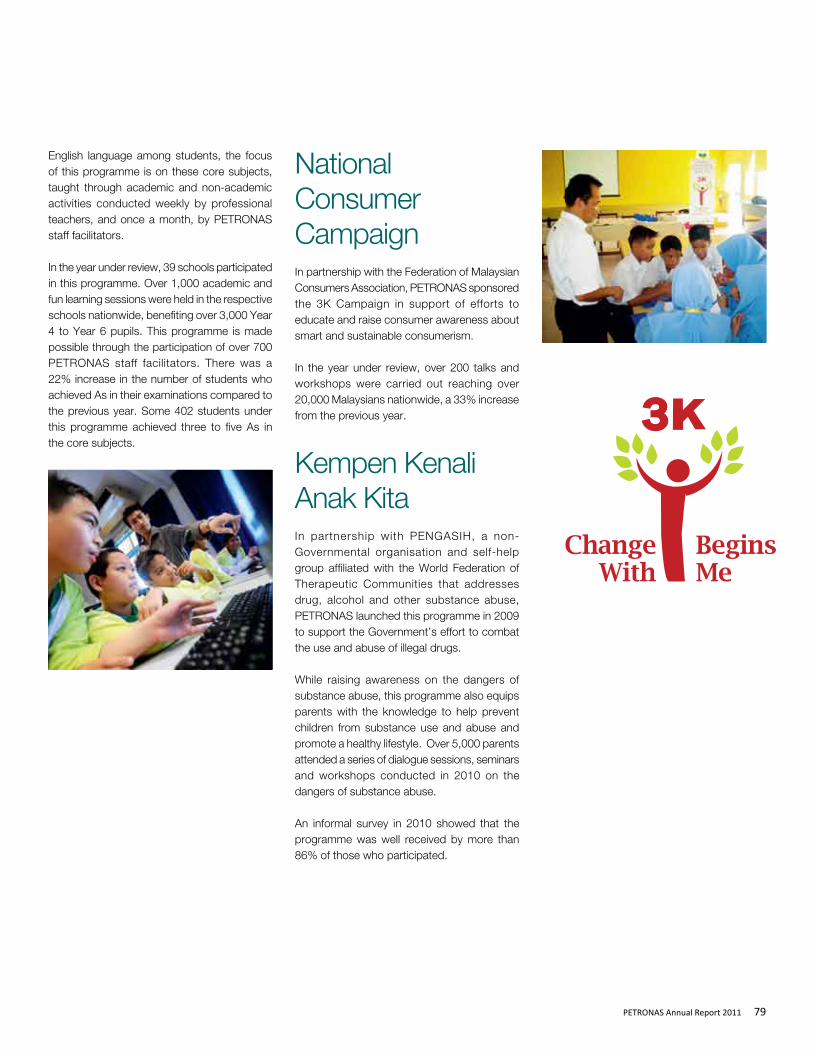
PETRONAS Annual Report 2011 79
National Consumer CampaignIn partnership with the Federation of Malaysian Consumers Association, PETRONAS sponsored the 3K Campaign in support of efforts to educate and raise consumer awareness about smart and sustainable consumerism.
In the year under review, over 200 talks and workshops were carried out reaching over 20,000 Malaysians nationwide, a 33% increase from the previous year.
Kempen Kenali Anak KitaIn partnership with PENGASIH, a non-Governmental organisation and self-help group affiliated with the World Federation of Therapeutic Communities that addresses drug, alcohol and other substance abuse, PETRONAS launched this programme in 2009 to support the Government’s effort to combat the use and abuse of illegal drugs.
While raising awareness on the dangers of substance abuse, this programme also equips parents with the knowledge to help prevent children from substance use and abuse and promote a healthy lifestyle. Over 5,000 parents attended a series of dialogue sessions, seminars and workshops conducted in 2010 on the dangers of substance abuse.
An informal survey in 2010 showed that the programme was well received by more than 86% of those who participated.
English language among students, the focus of this programme is on these core subjects, taught through academic and non-academic activities conducted weekly by professional teachers, and once a month, by PETRONAS staff facilitators.
In the year under review, 39 schools participated in this programme. Over 1,000 academic and fun learning sessions were held in the respective schools nationwide, benefiting over 3,000 Year 4 to Year 6 pupils. This programme is made possible through the participation of over 700 PETRONAS staff facilitators. There was a 22% increase in the number of students who achieved As in their examinations compared to the previous year. Some 402 students under this programme achieved three to five As in the core subjects.

80 PETRONAS Annual Report 2011
Sahabat Pendidikan Pencegahan Dadah (PPDa) PETRONASWhile PETRONAS works closely with parents in the Program Kempen Kenali Anak Kita, the Sahabat PPDa PETRONAS is aimed at raising awareness among students and teachers about substance use and abuse. Various initiatives under this programme were organised in collaboration with Malaysia’s Ministry of Education. In 2010, Sahabat PPDa PETRONAS was the Ministry’s sole nationwide drug awareness and prevention programme. The programme has reached out to more than 10,000 students and teachers who are currently playing a role as drug awareness change agents in their respective schools.
Program Sentuhan Harapan PETRONASLaunched in 2010, this programme involves the distribution of food aid to selected hardcore poor families through PETRONAS Mesra stores in places where we operate. Sentuhan Harapan (A Touch of Hope) aims to enable recipient families to overcome poverty through various programmes to assist them to transform their lives socially and economically. In 2010, PETRONAS contributed RM572,460 in food aid to families in 10 states - Johor, Kedah, Kelantan, Melaka, Pahang, Perak, Sabah, Sarawak, Selangor and Terengganu.
Sentuhan Kasih During Hari Raya, Chinese New Year, Deepavali, Hari Gawai (Sarawak) and Tadau Ka’amatan (Sabah) festivals in the year under review, PETRONAS hosted a series of gatherings for underprivileged children from orphanages and shelter homes in and around our areas of operations, in the spirit of sharing and caring. Between 300 and 500 staff volunteers provided cash donations and engaged with more than 1,000 children who participated in the programme in 2010.
Merdeka AwardThe Merdeka Award was founded in 2007 by PETRONAS, ExxonMobil and Shell as a symbol of the oil and gas industry’s contribution to Malaysia’s enduring legacy, and to celebrate half-a-century of our growth and progress as an independent nation. Each year, the Merdeka Award is presented for outstanding achievements in five categories - Education and Community; Environment; Health, Science and Technology; Outstanding Scholastic Achievement; and Outstanding Contribution to the People of Malaysia. These categories represent key areas which are critical to Malaysia’s continued growth and development. These categories are also development areas which are supported by the Founding Members through their various Corporate Social Responsibility initiatives in Malaysia. In 2010, four outstanding individuals received the Merdeka Award from the Patron, the Prime Minister of Malaysia.

PETRONAS Annual Report 2011 81
Imbak Canyon Conservation Area PETRONAS, in partnership with Yayasan Sabah, has contributed substantial funds in support of the Imbak Canyon Conservation Area, a region of unexplored and pristine jungle with a potential for rich biodiversity. This is in line with our commitment to environmental conservation. Our contribution will be used to set up the Imbak Canyon Study Centre which will manage the area and conduct various activities including research, environmental education and outreach programmes. Imbak Canyon serves as a wildlife corridor linking the Danum Valley and Maliau Basin, areas which also fall under the purview of Yayasan Sabah. Imbak Canyon is expected to play a key role in future forest rehabilitation, while at the same time promote greater interest in environmental education and nature tourism for Sabah and Malaysia in general.
PETRONAS also continued to actively contribute to community projects abroad via our international operations.
MyanmarIn Myanmar, PETRONAS continues to manage
our socio-economic and humanitarian projects
under the Yetagun Socio-Economic Development
Programme. In 2010, PETRONAS organised
computer skills and capability development
training programmes for more than 3,200
students. These programmes are designed to
help improve the students’ chances of gaining
employment.
South SudanPETRONAS extended support for school
refurbishment projects in Juba, South Sudan.
In addition to some restoration work for
selected schools, PETRONAS also supplied
the schools with new tables, desks and chairs
for students and teachers. To usher in the new
academic year in South Sudan, PETRONAS
also distributed new school bags and stationery
under the Back-To-School programme. More
than 1,800 students received assistance under
this project.
SudanIn the Sudan, PETRONAS’ ongoing community
programmes continued to gain momentum in
the year under review. The PETRONAS Mobile
Library has reached 56 schools, up from 44
in the previous year and has spread the joy of
reading to 57,000 students, up from 55,000
a year earlier.

82 PETRONAS Annual Report 2011
Main Events
CORPORATE
1 September 2010An agreement was signed with the Formula One Group to extend PETRONAS’ title sponsorship of the Malaysian round of the FIA Formula One World Championship for another five years. The partnership will also see a change in name, which from 2011 will be known as Formula One PETRONAS Malaysia Grand Prix.
4 October 2010
The PETRONAS Group’s first quarterly financial results was announced to the media for the first time in the Company’s history in line with reporting practices by public listed companies. Net Profit after Minority Interest soared 59.7% year-on-year to RM12.3 billion. The achievement was due to enhanced operational efficiencies and cost optimisation initiatives executed by the Group despite operating in a challenging and dynamic environment.
9 December 2010
PETRONAS Group Corporate Affairs played host to some 20 journalists from Malaysia, Brunei, the Philippines, Indonesia, Mongolia and Uzbekistan in a tour of the PETRONAS Twin Towers, Galeri PETRONAS and Petrosains. The annual programme is designed to bring together early-career journalists from across the globe to be trained in Kuala Lumpur, fostering relationships and exchanging ideas, experience and knowledge among the participants.
26 January 2011
A Technology Commercialisation Agreement was signed between PETRONAS Technical Services Sdn Bhd and AMT International Inc. The signing commemorates another milestone in achievement between the two parties which further enhances the current strategic alliance in Mass Transfer Technology.
7 February 2011PETRONAS debuted the new Silver Arrow Mercedes GP PETRONAS Formula One Team car in Kuala Lumpur City Centre and subsequently launched the 2011 Motorsports campaign.
11 February 2011PETRONAS organised a Majlis Ramah Mesra to bolster ties with the Melaka State Government for future oil and gas developments. The event underscored the need for PETRONAS and the Melaka State Government to foster closer ties to drive major oil and gas projects planned under the National Key Economic Areas as well as to foster socio-economic development in the State.

PETRONAS Annual Report 2011 83
EXPLORATION & PRODUCTION
5 April 2010PETRONAS and China National Petroleum Corporation (CNPC) signed a Memorandum of Understanding (MoU) to collaborate in the area of Enhanced Oil Recovery (EOR). This MoU will enable PETRONAS to enhance its EOR technology and capability by tapping into CNPC’s expertise.
13 May 2010PETRONAS, together with partners Repsol YPF, ONGC Videsh Limited, Indian Oil Corporation Limited and Oil India Limited, signed a joint venture agreement with Petroleos De Venezuela SA for the development and production of hydrocarbons from the Carabobo Project in the Orinoco Region of Venezuela. The award of the project to the joint venture company followed an extensive international selection process conducted by Venezuela’s Ministry of Energy and Petroleum from late 2008 to 2009.
20 May 2010
PETRONAS awarded Blocks SB307 and SB308 offshore Sabah under a single Production Sharing Contract to a partnership comprising Lundin Malaysia BV, Nio Petroleum
Ltd and PETRONAS Carigali Sdn Bhd. Under the terms of the PSC, Lundin Malaysia, with a participating interest of 42.5%, will operate both Blocks. Nio Petroleum, a newcomer to the Malaysian E&P scene, will own another 42.5% interest whereas PETRONAS Carigali, the exploration and production arm of PETRONAS, will own the remaining 15%.
20 August 2010PETRONAS Carigali Overseas Sdn Bhd made a commercial declaration for the Ham-Rong field discoveries to Petrovietnam and the Vietnam Host Authority.
13 September 2010The signing ceremony of a Technical and Operating Services Agreement between PETRONAS Technical Services Sdn Bhd and PETRONAS Carigali Iraq Holding BV (PCIHBV) saw the ratification of a comprehensive agreement in providing the required technical and business support to PCIHBV in delivering its major tasks in Iraq in the Garraf, Halfaya, Badra and Majnoon fields.
8 November 2010PETRONAS Carigali Vietnam Limited celebrated First Oil from the Topaz field which reached the Ruby II FPSO on schedule. It marked another major milestone after the successful start-up of the new Ruby II FPSO in early June 2010 and the Pearl field’s First Oil in early August 2010.
11 March 2011A SmartCenTM agreement between PETRONAS Technical Services Sdn Bhd and Spirit IT BV was signed in an effort to upgrade all metering systems in both onshore and offshore operations for controlling, monitoring, diagnosing and troubleshooting matters.
24 March 2011PETRONAS signed contracts for the provision of external Creative Advertising Above the Line initiatives, Below the Line initiatives and Media Specialist Services to the Group.

84 PETRONAS Annual Report 2011
5 October 2010PETRONAS signed a Sales and Purchase Agreement with Industrial Gas Solution Sdn Bhd and Mox-Linde for the supply of 100,000 tonnes per annum of raw carbon dioxide for a period of 15 years beginning 1 August 2010.
18 October 2010
PETRONAS signed an agreement with
Mitsubishi Corporation for the launch of its
maiden solar project, which will test different
solar technologies and provide data on their
respective performances in Malaysia’s climate.
It also acts as a catalyst for PETRONAS to
explore further opportunities in renewable
energy that offers synergy with PETRONAS’
existing core businesses. The installation of the
solar photovoltaic system will take place at the
roof top of Suria KLCC and a new PETRONAS
Dagangan Berhad service station in 2011.
9 November 2010
PETRONAS Gas Berhad (PGB) and PFC
Engineering Sdn Bhd signed an Engineering,
Procurement, Construction and Commisioning
Contract for the Plant Rejuvenation & Revamp
2 project. The project will look to rejuvenate and
GAS & POWER
19 November 2010
PETRONAS awarded a Production Sharing Contract (PSC) for offshore Sarawak deepwater Block SK317B to Total E&P Malaysia, a subsidiary of Total SA, and PETRONAS Carigali Sdn Bhd. Under the terms of the PSC, Total E&P Malaysia, with a participating interest of 85%, will operate the Block whereas PETRONAS Carigali Sdn Bhd will own the remaining 15% interest.
31 January 2011PETRONAS awarded a Risk Service Contract (RSC) to Petrofac Energy Developments Sdn Bhd, Kencana Energy Sdn Bhd and Sapura Energy Ventures Sdn Bhd for the development and production of the Berantai field, offshore Peninsular Malaysia. The Berantai RSC is the first contract awarded by PETRONAS under this new petroleum arrangement in Malaysia. The RSC model strikes a balance in the sharing of risks with fair returns for the development and production of already discovered fields.

PETRONAS Annual Report 2011 85
GAS & POWER
revamp PGB facilities which have passed their
20-year life span, and is aimed for completion
by 2013.
13 January 2011
PETRONAS, Santos, Total and Kogas
have taken the final investment decision for
developing the Gladstone LNG project near
Gladstone in Queensland, Australia. The
approval paves the way for major works for
upstream field development, a pipeline and
LNG plant facilities at Gladstone.
26 January 2011
PETRONAS announced the development of
Liquefied Natural Gas Regasification Facilities
by PETRONAS Gas Berhad. The project will
be located in the vicinity of Sungai Udang
Port, Melaka. The project is expected to be
completed by July 2012.
6 April 2010
PETRONAS Ammonia Sdn Bhd received
the RoSPA Gold award, which is the highest
award in the achievement category of RoSPA’s
Occupational Health and Safety Awards 2010.
30 July 2010
PETRONAS Penapisan (Melaka) Sdn Bhd
(PPMSB) was accorded the Malaysian
Society for Occupational Safety and Health,
Occupational Safety and Health Grand Award
Winner for 2009 under the category Petroleum,
Gas, Petrochemical and Allied Sectors. This is
the very first time PPMSB has clinched the
Grand Award in this category after 15 years
in operation.
22 September 2010
PETRONAS Dagangan Berhad (PDB) and
Proton Edar Sdn Bhd (PESB) signed an
agreement, appointing PDB as an exclusive
partner and lubricant supplier for PESB. It
is estimated to generate a total revenue of
RM260 million for PDB’s Syntium range of
lubricants.
DOWNSTREAM
28 January 2011
PETRONAS signed a Front End Engineering
Design contract with MISC Berhad and a
consortium of Technip France SAS, Technip
Geoproduction (M) Sdn Bhd and Daewoo
Shipbuilding & Marine Engineering Co Ltd, for
the Floating LNG (FLNG) project. The FLNG
project scope involves developing floating
facilities as a strategic solution to monetise
marginal and stranded gas fields.
30 March 2011
Kimanis Power Plant Sdn Bhd, a joint venture
company between PETRONAS and Yayasan
Sabah, signed and Engineering, Procurement,
Construction and Commissioning contract for
the power plant project in Kimanis Bay, Papar,
Sabah.

86 PETRONAS Annual Report 2011
6 December 2010
PETRONAS and BASF inked a Memorandum of
Understanding to conduct a joint feasibility study
for producing specialty chemicals in Malaysia.
The development of new specialty chemicals
products portfolio will be an important
component of PETRONAS’ long-term plan to
further grow the downstream petrochemical
business as part of its integrated plan to be
a key player in the region as well as to spur
domestic investments in the oil, gas and
petrochemicals industries.
22 December 2010
PETRONAS launched the ‘Gas PETRONAS:
Order Here’ Campaign at selected PETRONAS
Service Stations in the Klang Valley. The effort
is in line with the Company’s objective to further
expand and strengthen its line of services as
the leading Liquefied Petroleum Gas or cooking
gas retailer in the domestic downstream
petroleum products market. With this new
service, customers can now conveniently place
orders for and purchase Gas PETRONAS
cylinders at 50 selected PETRONAS Service
Stations in the Klang Valley, and have them
delivered to their homes.
21 February 2011
PETRONAS Aviation Sdn Bhd successfully
secured a contract for Aviation Fuel Technical
Service Assistance to a new customer, Ceylon
Petroleum Company Limited of Sri Lanka, for
two years with an option of renewal for another
year.
29 March 2011
Malaysian Prime Minister Dato’ Sri Mohd Najib
Tun Haji Abdul Razak received a courtesy call
by a delegation comprising senior executives
of BASF and PETRONAS to explore avenues
for boosting BASF’s investment in Malaysia,
among other matters.
2 November 2010
PETRONAS Chemicals Group Berhad
launched the prospectus for its landmark
Initial Public Offering on the Main Market of
Bursa Malaysia. Held at the Kuala Lumpur
Convention Centre, the launch was officiated
by Deputy Prime Minister Tan Sri Muhyiddin
Mohd Yassin, who represented Prime Minister
Dato’ Sri Mohd Najib Tun Haji Abdul Razak.
26 November 2010
PETRONAS Chemicals Group Berhad (PCG)
closed 2.1% higher on its trading debut on
Bursa Malaysia. During the day, PCG was the
most actively traded stock on Bursa Malaysia,
with 637 million shares changing hands,
reflecting investors’ strong interest in the
stock.

PETRONAS Annual Report 2011 87
10 May 2010
MISC Berhad held a joint-naming ceremony
of two 38,000 deadweight tonnes chemical
tankers, Bunga Aster and Bunga Azalea
in Korea. Bunga Aster was named by our
Lady Sponsor, Datin Sharifah Salwa Syed
Kamaruddin, wife of the Guest of Honour,
President & CEO of PETRONAS and Chairman
of MISC Dato’ Shamsul Azhar Abbas. Bunga
Azalea was named by Lady Sponsor Dato’
Halipah Esa, a member of the MISC Board.
17 May 2010
MISC signed a Sales and Purchase Agreement
via subsidiary MTTI Sdn Bhd (MTTI), to acquire
50% of the shares in VTTI BV (VTTI), a wholly-
owned subsidiary of Vitol. VTTI owns and
operates a network of petroleum products
terminals with a gross combined capacity of
nearly 6 million cubic metres, which is set to
expand to nearly 8 million cubic metres by
2012.
MARITIME & LOGISTICS
10 August 2010
AET, a subsidiary of MISC signed a contract
with Brazil state-owned oil & gas company
Petrobras for the 15-year time charter of
two new sophisticated Dynamic Positioning
Aframax tankers for shuttle tanker operations
off the coast of Brazil. This contract, scheduled
to commence in spring 2012, significantly
strengthens the partnership between AET
and Petrobras, and, more importantly, heralds
MISC’s entrance into the shuttle tanker
market.
6 October 2010
Malaysia Marine and Heavy Engineering
Holdings Berhad (MHB) launched its
Prospectus for its initial public offering (IPO) on
the Main Market of Bursa Malaysia. The launch
was officiated by PETRONAS President &
CEO, Dato’ Shamsul Azhar Abbas.
29 October 2010
Malaysia Marine and Heavy Engineering
Holdings Bhd (MHB), a subsidiary of MISC
debuted strongly on Bursa Malaysia marking
a successful listing exercise with 1.42 billion
shares changing hands on the first day of
trading against Bursa Malaysia’s total trading
volume of 1.62 billion shares.

88 PETRONAS Annual Report 2011
22 July 2010
PETRONAS successfully launched its
community outreach initiative, Program
Sentuhan Harapan, in Miri, Sarawak. The
Prime Minister of Malaysia Dato’ Sri Mohd
Najib Tun Haji Abdul Razak, accompanied by
PETRONAS President & CEO Dato’ Shamsul
Azhar Abbas, presented hampers comprising
basic food items to the representives of 50
deserving families.
3 August 2010
Two teams from PETRONAS participated in
The Edge™ – Bursa Malaysia KL Rat Race®
co-organised by The Edge and Bursa Malaysia.
In the 4.5 km race, participants had to run
through the streets of Kuala Lumpur.
1 September 2010
More than 200 underprivileged children from
five homes and organisations in the Klang
Valley enjoyed a day of fun and merriment
at PETRONAS’ annual Sentuhan Kasih
Programme held in Kuala Lumpur.
26 October 2010
Four recipients were honoured at the Merdeka
Award 2010 presentation ceremony to
celebrate and acknowledge Malaysians and
non-Malaysians who have made outstanding
achievements and contributions to the nation
and people.
7 November 2010
The Terry Fox Run - Kuala Lumpur, an annual
charity event held in aid of cancer research,
which was attended by staff from PETRONAS,
continues to inspire Malaysians after 30 years.
The run is non-competitive, as its primary
objective is for participants to have fun whilst
contributing meaningfully towards cancer
research initiatives.
12 November 2010
Children from schools adopted under Program
Bakti Pendidikan PETRONAS (Program Bakti)
were treated to a fun-filled annual camp where
students were provided motivational and fun
activities for them to excel in studies as well as
build self-confidence and character. Themed
CORPORATE SOCIAL RESPONSIBILITY

PETRONAS Annual Report 2011 89
23 November 2010
PETRONAS continued its commitment to
cancer research in Malaysia by contributing
RM3 million to the Cancer Research Initiatives
Foundation (CARIF) for the study, prevention,
treatment and cure of the disease.
20 December 2010
More than 70 children together with staff of the
Juba Orphanage in South Sudan celebrated
Christmas with senior officials from PETRONAS
and the Government of South Sudan.
“Children around the World”, the camp gave
the children the opportunity to ‘venture’ into
several countries where PETRONAS is present.
These include Egypt, India, Ireland, Japan,
Nigeria, Russia, the Sudan and Vietnam.
16 November 2010
The F1 in Schools Technology Challenge at
the PETRONAS National Finals 2010 was held
with the aim of producing a new generation of
skilled engineers, while bridging the technology
gap between urban and rural schools. A rookie
team, VelospeedF1 from Sekolah Menengah
Sains Hulu Selangor took home the overall
champion’s trophy. The team also won
four additional awards for Best Newcomer,
Best Portfolio, Best Booth Display and the
PETRONAS Knockout Champion award.

90 PETRONAS Annual Report 2011
Glossary Industry terms as generally understood
• Additives Chemicals added in small quantities to fuel
or lubricants to control engine deposits and improve lubricating performance.
• Barrel A standard unit of measurement for oil
production. There are 159 litres in a barrel.
• Barrelsofoilequivalent(boe) A unit of measure to quantify crude oil,
condensates and natural gas amounts using the same basis. Natural gas volumes are converted to barrels on the basis of energy content.
• Baseoil An oil to which other oils or additives are added
to produce a lubricant. This includes Group III base oil that has been subjected to the highest level of refining of the base oil groups, offering very high viscosity index to produce premium quality lubricants.
• Basin A low-lying area beneath the Earth’s surface
accumulated with thick layers of sediment, often a source of valuable hydrocarbons.
• Brentprice The benchmark crude oil price in Europe,
as traded on the International Petroleum Exchange in London. Brent crude refers to a particular grade of crude oil, which is slightly heavier than WTI crude. See WTI price.
• CO2
Carbon dioxide, one of the primary greenhouse gases.
• Coalbedmethane A form of natural gas extracted from coal beds,
as opposed to more conventional natural gas occurring in reservoirs.
• Condensates Liquid hydrocarbons produced with natural
gas, separated by cooling and other means.
• Deadweighttonne(dwt) A ship’s maximum carrying capacity in tonnes
of cargo, including passengers, crew, stores, ballast and fuel.
• Deepwater In of fshore explorat ion, deepwater is
demarcated at water depths exceeding 200 m. Unique methods are required to produce the oil and gas from the ocean bed at such depths. See Floating Production Unit.
• Development Drilling, construction and related activities
following discovery that are necessary to begin production and transportation of crude oil and natural gas.
• Downstream All segment of a value chain that adds value
to the crude oil and natural gas produced, for example, oil refining, gas processing, gas liquefaction, petrochemical manufacturing, marketing of petroleum and petrochemical products, storage and transportation.
• EnergyLossManagement(ELM) An initiative to improve energy efficiency and
reduce greenhouse gas (GHG) emissions.
• Enhancedoilrecovery(EOR) A technique to increase the amount of crude
oil and natural gas that can be extracted from an oil and gas field. EOR is also referred to as improved oil recovery or tertiary recovery.
• Exploration The search for crude oil and/or natural gas by
utilising geologic and topographical studies, geophysical and seismic surveys, and drilling of wells.
• Field A geographical area overlying a hydrocarbons
reservoir.
• FloatingLiquefiedNaturalGas(FLNG) Either a ship or barge that can sail or be towed
to offshore gas fields, extract gas, freeze it to liquefied natural gas (LNG) and offload the LNG to tankers for shipping
• FloatingProductionUnit(FPU) Floating structures of various designs used in
deepwater production. These ‘floaters’ replace traditional offshore shallow water platforms that are able to sit on the ocean bed. See Deepwater.
• FloatingProduction,StorageandOffloading (FPSO)
A converted or custom-built ship-like structure, with modular facilities to process oil and gas and for temporary storage of the oil prior to transfer to tankers.
• GasProcessing An activity to turn streams of natural gas into
saleable products, in addition to treating gas deposits.
• Gastoliquids(GTL) A refinery process to convert natural gas or
other gaseous hydrocarbons into longer chain hydrocarbons, such as gasoline or diesel fuel. It is used predominantly in the creation of high-quality transportation fuels.
• Greenhousegases(GHG) Gases that trap heat in the Earth’s atmosphere,
e.g. carbon dioxide, methane, nitrous oxide, hydrofluorocarbons, perfluorocarbons and sulphur hexafluoride.
• HeavyOil/Bitumen Unlike conventional crude oil that can be
pumped without being heated or diluted, heavy oil is oil that cannot be extracted in its natural state via a well and conventional production method. This definition is also applicable to bitumen.
• HighPressureHighTemperaturewell Well with a surface shut-in pressure greater
than 10,000 psi and a bottomhole temperature greater than 150ºC.
• Integratedoilandgascompany A company engaged in all aspects of the oil
and gas industry - exploring for and producing crude oil and natural gas (upstream); refining, marketing and transporting crude oil, natural gas and refined products (downstream); as well as manufacturing and distributing petrochemicals.
• Ionicliquids Liquids that consist entirely of positive and
negatively charged ions. Ionic liquids are being explored for an array of applications, e.g. as environmentally friendly substitutes for volatile organic compounds in the oil and gas industry.

PETRONAS Annual Report 2011 91
• Jointventure A partnership between two or more companies
to undertake a specific project and share the resulting profit and loss.
• Liquefiednaturalgas(LNG) Natural gas that is liquefied under extremely
cold temperatures of about minus 260 degrees Fahrenheit to facilitate storage or transportation in specially designed vessels.
• Liquefiedpetroleumgas(LPG) Light gases, such as butane and propane
that can be maintained as liquids while under pressure.
• Lubricant A substance to reduce friction and wear
among moving surfaces, resulting in improved efficiency. It contains about 90% base oil and about 10% additives.
• mmBtu Million metric British thermal unit.
• mmscfd Million metric standard cubic feet per day.
• mtpa Million tonnes per annum.
• Naturalgas A clean burning, odourless, colourless,
highly compressible mixture of hydrocarbons occurring naturally in gaseous form. Natural gas is made up of methane but can also include ethane, propane and butane.
• NOPAT Net operating profit after tax is derived from net
profit after tax excluding financing cost, share of profits of associates and jointly controlled entities and other non-operating income and expenses.
• OEM Original Equipment Manufacturer. Refers
to the company that acquires a product or component and reuses or incorporates it into a new product with its own brand name.
• Olefins Any from a class of unsaturated open-chain
hydrocarbons such as ethylene, having the
general formula CnH2n; an alkene with only one carbon-carbon double bond.
• Operational Performance Improvement(OPI)
A set of tools and methodologies that emphasise on instilling operational discipline, with the aim of improving operational excellence of PETRONAS’ producing assets.
• PeninsularGasUtilisation(PGU) The PGU system was developed to spearhead
the use of natural gas in Malaysia. The natural gas produced from offshore Terengganu is processed in six Gas Processing Plants in Kertih and are then fed into a 2,505 km pipeline system that delivers natural gas to the power, industrial, petrochemical and other sectors throughout the Peninsular.
• Petrochemicals Organic and inorganic compounds and mixtures
derived from petroleum, used principally for the manufacture of chemicals, plastics and resins, synthetic fibres, detergents, adhesives and synthetic motor oils.
• ProductionSharingContract(PSC) A contractual agreement between a company
and a host government, whereby the company bears all exploration, development and production costs in return for an agreed-upon share of production.
• RegasificationTerminal(RGT) Also known as a receiving terminal, an RGT is
usually a coastal plant that accepts deliveries of liquefied natural gas and processes it back into gaseous form for injection into the pipeline system.
• Refining A purification process for natural resources,
which include hydrocarbons, using distillation, cooling and/or compression.
• Renewableenergy Energy derived from natural sources that are
replaceable.
• Reserves Crude oil or natural gas contained in underground
rock formations called reservoirs.
• Reservoir A subsur face poo l o f hydrocarbons
predominantly trapped in porous or fractured rock formations.
• Resources Resources in this case refers to 2P+2C
estimates.
• ResourceReplenishmentRatio Figures reported are calculated based on
(Difference of Resource Base of current year and previous year + Production Volume of previous year) / (Production Volume of previous year).
• RiskServiceContract(RSC) A contract between the host authority and
contractors where the host authority is the project owner and the contractors will recover the development cost and are paid a fixed fee for services rendered, based on their performance, relevant to the development execution and subsequent production.
• Seismicdata Visual rendering of the sub-surface geology of
an area composed by reflecting sound waves off underground strata; useful in determining the possible existence of hydrocarbons.
• Throughput The amount of output that is produced by a
system, e.g. a refinery, plant, or pipeline, in a given period of time.
• Unconventionaloilandgas Oil and gas that cannot be produced or
extracted using conventional methods.
• Upstream Segment of value chain pertaining to finding
and producing crude oil and natural gas. These include oil and gas exploration, development and production operations; also known as Exploration & Production (E&P).
• WTIprice Stands for West Texas Intermediate, the
benchmark crude oil price in the US measured in USD per barrel, which refers to a type of high quality, light in gravity crude oil.

This page has been intentionally left blank.

Financial Statements
Directors’ Report 94
Statement by Directors 99
Statutory Declaration 100
Consolidated Statement of Financial Position 101
Consolidated Statement of Comprehensive Income 102
Consolidated Statement of Changes in Equity 103
Consolidated Statement of Cash Flow 105
Statement of Financial Position 106
Statement of Comprehensive Income 107
Statement of Changes in Equity 108
Statement of Cash Flow 109
Notes to the Financial Statements 110
Report of the Auditors to the Members 214
Appendix I 216
94 PETRONAS Annual Report 2011
DIRECTORS’ REPORT FOR THE YEAR ENDED31 MARCH 2011
The Directors have pleasure in submitting their report and the audited financial statements of the Group and of the Company for the year ended 31 March 2011.
PRINCIPAL ACTIVITIES
The principal activities of the Company in the course of the financial year remained unchanged and consist of exploitation of oil and gas through production sharing contracts, the marketing of petroleum and petroleum products and investment holding. The principal activities of significant subsidiaries, associates and jointly controlled entities are stated in note 47, note 48 and note 49 to the financial statements respectively.
RESULTS Group Company RM Mil RM Mil Profit for the year 63,008 50,472 Attributable to:Shareholders of the Company 54,848 50,472 Minority interest 8,160 -
DIVIDENDS
During the financial year, the Company:
(i) paid a third tax exempt interim dividend under Section 84 of the Petroleum (Income Tax) Act, 1967 of RM60,000 per ordinary share amounting to RM6 billion in respect of the financial year ended 31 March 2010;
(ii) paid a tax exempt final dividend under Section 84 of the Petroleum (Income Tax) Act, 1967 of RM100,000 per ordinary share amounting to RM10 billion in respect of the financial year ended 31 March 2010;
(iii) paid a first tax exempt interim dividend under Section 84 of the Petroleum (Income Tax) Act, 1967 of RM60,000 per ordinary share amounting to RM6 billion in respect of the financial year ended 31 March 2011;
(iv) paid a second tax exempt interim dividend under Section 84 of the Petroleum (Income Tax) Act, 1967 of RM80,000 per ordinary share amounting to RM8 billion in respect of the financial year ended 31 March 2011; and
(v) declared a third tax exempt interim dividend under Section 84 of the Petroleum (Income Tax) Act, 1967 of RM60,000 per ordinary share amounting to RM6 billion in respect of the financial year ended 31 March 2011, of which RM4 billion was paid on 29 April 2011 and the remaining RM2 billion to be paid on 31 May 2011.

PETRONAS Annual Report 2011 95
DIVIDENDS (continued)
The Directors propose a tax exempt final dividend under Section 84 of the Petroleum (Income Tax) Act, 1967 of RM220,000 per ordinary share amounting to RM22 billion in respect of the financial year ended 31 March 2011 for shareholders’ approval at the forthcoming Annual General Meeting.
The financial statements for the current financial year do not reflect this proposed dividend. Such dividend, if approved by the shareholders, will be accounted for in equity as an appropriation of retained profits in the financial period ending 31 December 2011.
Subsequent to the end of the current financial year, the Company declared a first tax exempt interim dividend under Section 84 of the Petroleum (Income Tax) Act, 1967 of RM20,000 per ordinary share amounting to RM2 billion in respect of the financial period ending 31 December 2011. The dividend will be paid and accounted for in equity as an appropriation of retained profits in the financial period ending 31 December 2011.
RESERVES AND PROVISIONS
There were no material movements to and from reserves and provisions during the year other than as disclosed in the financial statements.
DIRECTORS OF THE COMPANY
Directors who served since the date of the last report are:
Directors Dato’ Shamsul Azhar bin Abbas (Acting Chairman, President and CEO)Datuk Anuar bin Ahmad (Executive Vice President)Tan Sri Dr. Wan Abdul Aziz bin Wan Abdullah Datuk Wan Zulkiflee bin Wan Ariffin (Executive Vice President) Mohd Omar bin Mustapha Tan Sri Dato’ Seri Hj Megat Najmuddin bin Datuk Seri Dr. Hj Megat Khas Dato’ Muhammad bin Ibrahim Dato’ Mohamad Idris bin Mansor Datin Yap Siew Bee Krishnan C K Menon Datuk Manharlal Ratilal (Executive Vice President)Dato’ Wee Yiaw Hin @ Ong Yiaw Hin (Executive Vice President)Dato’ Siti Halimah binti Ismail (alternate to Tan Sri Dr. Wan Abdul Aziz bin Wan Abdullah)Abdul Kadir bin Md Kassim (resigned on 30 June 2010)
In accordance with Article 71(1) of the Company’s Articles of Association, Tan Sri Dr. Wan Abdul Aziz bin Wan Abdullah and Mohd Omar bin Mustapha retire by rotation from the Board at the forthcoming Annual General Meeting and, being eligible, offer themselves for re-election.
In accordance with Article 71(2) of the Company’s Articles of Association, the Chairman, President and Executive Vice Presidents shall not be subject to retirement by rotation except in the first year of appointment where they are required to retire in accordance with Article 68.

96 PETRONAS Annual Report 2011
DIRECTORS’ INTERESTS
The Directors in office at the end of the year who have interests in the shares of the Company’s related corporations other than wholly owned subsidiaries as recorded in the Register of Directors’ Shareholdings are as follows: Number of ordinary shares of RM1.00 each in PETRONAS Dagangan Berhad Balance at Balance at Name 1.4.2010 Bought Sold 31.3.2011Datuk Anuar bin Ahmad 2,000 - - 2,000 Number of ordinary shares of RM1.00 each in KLCC Property Holdings Berhad Balance at Balance at Name 1.4.2010 Bought Sold 31.3.2011Datuk Manharlal Ratilal 5,000 - - 5,000
Number of ordinary shares of RM0.10 each in PETRONAS Chemicals Group Berhad Balance at Balance at Name 1.4.2010 Bought Sold 31.3.2011Dato’ Shamsul Azhar bin Abbas - 20,000 - 20,000Datuk Anuar bin Ahmad - 20,000 - 20,000Tan Sri Dr. Wan Abdul Aziz bin Wan Abdullah - 20,000 - 20,000Datuk Wan Zulkiflee bin Wan Ariffin - 20,000 - 20,000Mohd Omar bin Mustapha - 20,000 (10,000) 10,000Tan Sri Dato’ Seri Hj Megat Najmuddin bin Datuk Seri Dr. Hj Megat Khas - 20,000 - 20,000Dato’ Muhammad bin Ibrahim - 20,000 - 20,000Dato’ Mohamad Idris bin Mansor - 20,000 - 20,000Datin Yap Siew Bee - 20,000 - 20,000Krishnan C K Menon - 20,000 - 20,000Datuk Manharlal Ratilal - 20,000 - 20,000Dato’ Wee Yiaw Hin @ Ong Yiaw Hin - 20,000 - 20,000
Number of ordinary shares of RM0.50 each in Malaysia Marine and Heavy Engineering Holdings Berhad Balance at Balance at Name 1.4.2010 Bought Sold 31.3.2011Dato’ Shamsul Azhar bin Abbas - 10,000 - 10,000Datuk Wan Zulkiflee bin Wan Ariffin - 10,000 - 10,000Krishnan C K Menon - 10,000 (10,000) -
The other Director holding office at 31 March 2011 had no interest in the ordinary shares of the Company and of its related corporations during the financial year.
PETRONAS Annual Report 2011 97
DIRECTORS’ BENEFITS
Since the end of the previous financial year, no Director of the Company has received or become entitled to receive any benefit (other than the benefit included in the aggregate amount of emoluments received or due and receivable by Directors as shown in the financial statements), by reason of a contract made by the Company or a related corporation with the Director or with a firm of which the Director is a member, or with a company in which the Director has a substantial financial interest.
There were no arrangements during and at the end of the financial year which had the object of enabling Directors of the Company to acquire benefits by means of the acquisition of shares in or debentures of the Company or any other body corporate.
ISSUE OF SHARES
There were no changes in the issued and paid up capital of the Company during the financial year.
OPTIONS GRANTED OVER UNISSUED SHARES
No options were granted to any person to take up unissued shares of the Company during the financial year.
OTHER STATUTORY INFORMATION
Before the financial statements of the Group and of the Company were made out, the Directors took reasonable steps to ascertain that:
(i) all known bad debts have been written off and adequate provision made for doubtful debts, and
(ii) any current assets which were unlikely to realise, in the ordinary course of business, their values as shown in the accounting records of the Group and of the Company, had been written down to an amount which they might be expected so to realise.
At the date of this report, the Directors are not aware of any circumstances:
(i) that would render the amount written off for bad debts, or the amount of the provision for doubtful debts, in the Group and in the Company inadequate to any substantial extent, or
(ii) that would render the value attributed to the current assets in the financial statements of the Group and of the Company misleading, or
(iii) which have arisen which render adherence to the existing method of valuation of assets or liabilities of the Group and of the Company misleading or inappropriate, or
(iv) not otherwise dealt with in this report or the financial statements, that would render any amount stated in the financial statements of the Group and of the Company misleading.

98 PETRONAS Annual Report 2011
OTHER STATUTORY INFORMATION (continued)
At the date of this report, there does not exist:
(i) any charge on the assets of the Group or of the Company that has arisen since the end of the financial year and which secures the liabilities of any other person, or
(ii) any contingent liability in respect of the Group or of the Company that has arisen since the end of the financial year.
No contingent liability or other liability of any company in the Group has become enforceable, or is likely to become enforceable within the period of twelve months after the end of the financial year which, in the opinion of the Directors, will or may substantially affect the ability of the Group and of the Company to meet their obligations as and when they fall due.
In the opinion of the Directors, except as disclosed in note 46 to the financial statements, the financial performance of the Group and of the Company for the financial year ended 31 March 2011 have not been substantially affected by any item, transaction or event of a material and unusual nature nor has any such item, transaction or event occurred in the interval between the end of that financial year and the date of this report.
AUDITORS
The auditors, Messrs KPMG Desa Megat & Co., have indicated their willingness to accept re-appointment.
Signed on behalf of the Board of Directors in accordance with a resolution of the Directors:
………………………………………………………….Dato’ Shamsul Azhar bin Abbas
………………………………………………………….Datuk Anuar bin Ahmad
Kuala Lumpur,Date: 30 May 2011

PETRONAS Annual Report 2011 99
STATEMENT BY DIRECTORS
In the opinion of the Directors, the financial statements set out on pages 101 to 213, are drawn up in accordance with Financial Reporting Standards and the Companies Act, 1965 in Malaysia so as to give a true and fair view of the financial position of the Group and of the Company at 31 March 2011 and of their financial performance and cash flows for the year ended on that date.
Signed on behalf of the Board of Directorsin accordance with a resolution of the Directors:
………………………………………………………….Dato’ Shamsul Azhar bin Abbas
………………………………………………………….Datuk Anuar bin Ahmad
Kuala Lumpur,Date: 30 May 2011

100 PETRONAS Annual Report 2011
STATUTORY DECLARATION
I, Manharlal Ratilal, the Director primarily responsible for the financial management of PETROLIAM NASIONAL BERHAD, do solemnly and sincerely declare that the financial statements set out on pages 101 to 213 are, to the best of my knowledge and belief, correct and I make this solemn declaration conscientiously believing the same to be true, and by virtue of the provisions of the Statutory Declarations Act, 1960.
Subscribed and solemnly declared by the abovenamed Manharlal Ratilal at Kuala Lumpur in Wilayah Persekutuan on 30 May 2011.
BEFORE ME:
PE
SU
RUHJAYA SUMPA
H
MA L A Y S I A
No: W347Hj. Zailan Bin Hj. Mohamed
Suite 2-1-45, Tingkat Satu,Wisma Rampai, Jalan 34/26,
53300 Setapak, Kuala Lumpur

PETRONAS Annual Report 2011 101
CONSOLIDATED STATEMENT OF FINANCIAL POSITION AT 31 MARCH 2011
Note 2011 2010 RM Mil RM Mil (Restated)ASSETS Property, plant and equipment 3 191,575 189,508 Investment properties 4 10,561 8,790 Land held for development 5 1,641 1,690 Prepaid lease payments 6 551 527 Investments in associates 8 5,725 5,321 Investments in jointly controlled entities 9 5,836 3,051 Intangible assets 10 15,389 16,922 Long term receivables 11 3,289 3,150 Fund and other investments 12 11,824 17,268 Deferred tax assets 14 3,975 3,431 Cash and cash equivalents 15 108 288 TOTAL NON-CURRENT ASSETS 250,474 249,946 Property development costs 16 441 473 Trade and other inventories 17 9,700 8,565 Trade and other receivables 18 33,162 27,985 Tax recoverable 446 358 Assets classified as held for sale 19 346 40 Fund and other investments 12 37,869 19,681 Cash and cash equivalents 15 106,556 103,837 TOTAL CURRENT ASSETS 188,520 160,939 TOTAL ASSETS 438,994 410,885
EQUITY Share capital 20 100 100 Reserves 21 263,688 242,802 Total equity attributable to shareholders of the Company 263,788 242,902 Minority shareholders’ interests 22 32,126 24,972TOTAL EQUITY 295,914 267,874 LIABILITIES Borrowings 23 44,354 48,788 Deferred tax liabilities 14 13,258 12,485 Other long term liabilities and provisions 25 24,544 25,782 TOTAL NON-CURRENT LIABILITIES 82,156 87,055 Trade and other payables 26 38,039 32,387 Borrowings 23 3,457 3,082 Taxation 13,428 14,487 Dividend payable 6,000 6,000 TOTAL CURRENT LIABILITIES 60,924 55,956 TOTAL LIABILITIES 143,080 143,011 TOTAL EQUITY AND LIABILITIES 438,994 410,885
The notes set out on pages 110 to 213 are an integral part of these financial statements.
102 PETRONAS Annual Report 2011
CONSOLIDATED STATEMENT OF COMPREHENSIVE INCOMEFOR THE YEAR ENDED 31 MARCH 2011 Note 2011 2010 RM Mil RM Mil Revenue 241,228 210,797 Cost of revenue (143,427) (128,447)Gross profit 27 97,801 82,350 Selling and distribution expenses (4,291) (4,249)Administration expenses (12,072) (10,145)Other expenses (2,766) (2,243)Other income 46 13,221 2,642 Operating profit 28 91,893 68,355 Financing costs (3,473) (2,526)Share of profit after tax and minority interest of equity accounted associates and jointly controlled entities 2,076 1,471 Profit before taxation 90,496 67,300 Tax expense 30 (27,488) (21,811)Profit for the year 63,008 45,489 Other comprehensive income/(expenses) Net movements from exchange differences (7,417) (7,522)Changes in fair value of available-for-sale financial assets 2,274 6,561 Other comprehensive expenses (171) (87)Total other comprehensive expenses for the year (5,314) (1,048)TOTAL COMPREHENSIVE INCOME FOR THE YEAR 57,694 44,441
Profit attributable to: Shareholders of the Company 54,848 40,286 Minority interests 8,160 5,203 PROFIT FOR THE YEAR 63,008 45,489 Total comprehensive income attributable to: Shareholders of the Company 50,871 40,759 Minority interests 6,823 3,682 TOTAL COMPREHENSIVE INCOME FOR THE YEAR 57,694 44,441
The notes set out on pages 110 to 213 are an integral part of these financial statements.
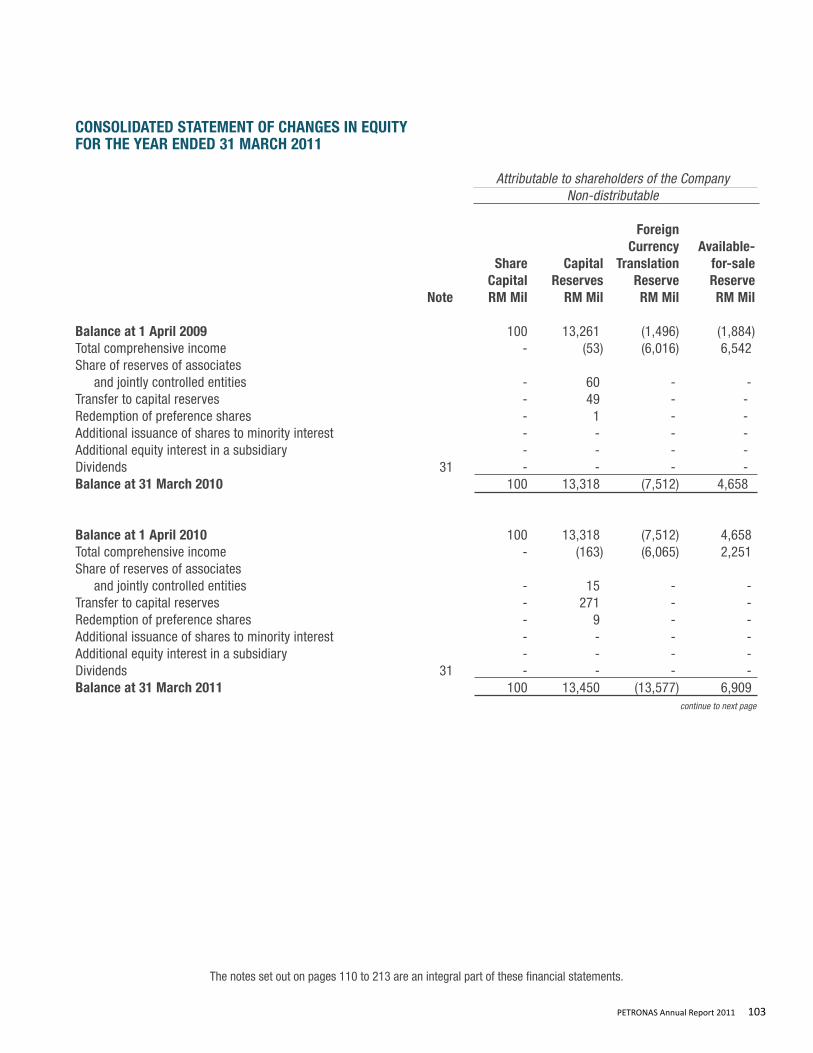
PETRONAS Annual Report 2011 103
CONSOLIDATED STATEMENT OF CHANGES IN EQUITYFOR THE YEAR ENDED 31 MARCH 2011
Attributable to shareholders of the Company Non-distributable
Foreign Currency Available- Share Capital Translation for-sale Capital Reserves Reserve Reserve Note RM Mil RM Mil RM Mil RM Mil
Balance at 1 April 2009 100 13,261 (1,496) (1,884)Total comprehensive income - (53) (6,016) 6,542Share of reserves of associates and jointly controlled entities - 60 - -Transfer to capital reserves - 49 - -Redemption of preference shares - 1 - -Additional issuance of shares to minority interest - - - -Additional equity interest in a subsidiary - - - -Dividends 31 - - - -Balance at 31 March 2010 100 13,318 (7,512) 4,658
Balance at 1 April 2010 100 13,318 (7,512) 4,658 Total comprehensive income - (163) (6,065) 2,251 Share of reserves of associates and jointly controlled entities - 15 - -Transfer to capital reserves - 271 - -Redemption of preference shares - 9 - -Additional issuance of shares to minority interest - - - -Additional equity interest in a subsidiary - - - -Dividends 31 - - - -Balance at 31 March 2011 100 13,450 (13,577) 6,909
continue to next page
The notes set out on pages 110 to 213 are an integral part of these financial statements.

104 PETRONAS Annual Report 2011
CONSOLIDATED STATEMENT OF CHANGES IN EQUITYFOR THE YEAR ENDED 31 MARCH 2011 (continued)
Attributable to shareholders of the Company Distributable General Retained Minority Total Reserve Profits Total Interest Equity Note RM Mil RM Mil RM Mil RM Mil RM Mil
Balance at 1 April 2009 12,000 210,102 232,083 25,006 257,089Total comprehensive income - 40,286 40,759 3,682 44,441Share of reserves of associates and jointly controlled entities - - 60 - 60Transfer to capital reserves - (49) - - -Redemption of preference shares - (1) - (17) (17)Additional issuance of shares to minority interest - - - 1,955 1,955Additional equity interest in a subsidiary - - - (371) (371)Dividends 31 - (30,000) (30,000) (5,283) (35,283)Balance at 31 March 2010 12,000 220,338 242,902 24,972 267,874
Balance at 1 April 2010 12,000 220,338 242,902 24,972 267,874 Total comprehensive income - 54,848 50,871 6,823 57,694 Share of reserves of associates and jointly controlled entities - - 15 - 15 Transfer to capital reserves - (271) - - -Redemption of preference shares - (9) - (28) (28)Additional issuance of shares to minority interest - - - 7,180 7,180 Additional equity interest in a subsidiary - - - (292) (292)Dividends 31 - (30,000) (30,000) (6,529) (36,529)Balance at 31 March 2011 12,000 244,906 263,788 32,126 295,914
continued from previous page
The notes set out on pages 110 to 213 are an integral part of these financial statements.

PETRONAS Annual Report 2011 105
CONSOLIDATED STATEMENT OF CASH FLOWFOR THE YEAR ENDED 31 MARCH 2011
Note 2011 2010 RM Mil RM Mil CASH FLOWS FROM OPERATING ACTIVITIES Cash receipts from customers 233,712 210,903 Cash paid to suppliers and employees (134,410) (128,944) 99,302 81,959 Interest income from fund and other investments 2,466 1,894 Interest expenses paid (2,388) (2,080) Taxation paid (28,615) (25,672)
Net cash generated from operating activities 70,765 56,101
CASH FLOWS FROM INVESTING ACTIVITIES
Net cash used in investing activities 32 (29,183) (23,284)
CASH FLOWS FROM FINANCING ACTIVITIES
Net cash used in financing activities 33 (36,613) (21,429)
NET INCREASE IN CASH AND CASH EQUIVALENTS 4,969 11,388
(INCREASE)/DECREASE IN DEPOSITS RESTRICTED (257) 42
NET FOREIGN EXCHANGE DIFFERENCES (2,338) (2,502)
CASH AND CASH EQUIVALENTS AT BEGINNING OF THE YEAR 103,703 94,775
CASH AND CASH EQUIVALENTS AT END OF THE YEAR 106,077 103,703
CASH AND CASH EQUIVALENTS Cash and bank balances and deposits 15 106,664 104,125 Negotiable certificate of deposits 12 490 630 Bank overdrafts 23 (75) (307) 107,079 104,448 Less: Deposits restricted 15 (1,002) (745) 106,077 103,703
The notes set out on pages 110 to 213 are an integral part of these financial statements.

106 PETRONAS Annual Report 2011
STATEMENT OF FINANCIAL POSITION AT 31 MARCH 2011
Note 2011 2010 RM Mil RM Mil (Restated)ASSETS Property, plant and equipment 3 3,025 3,950 Investments in subsidiaries 7 45,778 34,418 Investments in associates 8 302 839 Investments in jointly controlled entities 9 1,385 1,402 Long term receivables 11 71,813 74,295 Fund and other investments 12 76 76 Deferred tax assets 14 2,108 1,785 TOTAL NON-CURRENT ASSETS 124,487 116,765 Trade and other inventories 17 49 42 Trade and other receivables 18 12,519 14,861 Fund and other investments 12 31,815 20,492 Cash and cash equivalents 15 58,164 56,677 TOTAL CURRENT ASSETS 102,547 92,072 TOTAL ASSETS 227,034 208,837 EQUITY Share capital 20 100 100 Reserves 21 156,877 136,460 TOTAL EQUITY 156,977 136,560 LIABILITIES Borrowings 23 26,591 28,621 Other long term liabilities and provisions 25 21,587 22,580 TOTAL NON-CURRENT LIABILITIES 48,178 51,201 Trade and other payables 26 6,712 5,254 Taxation 9,167 9,822 Dividend payable 6,000 6,000 TOTAL CURRENT LIABILITIES 21,879 21,076 TOTAL LIABILITIES 70,057 72,277 TOTAL EQUITY AND LIABILITIES 227,034 208,837
The notes set out on pages 110 to 213 are an integral part of these financial statements.

PETRONAS Annual Report 2011 107
STATEMENT OF COMPREHENSIVE INCOME FOR THE YEAR ENDED 31 MARCH 2011
Note 2011 2010 RM Mil RM Mil Revenue 96,540 83,402 Cost of revenue (42,797) (37,996)Gross profit 27 53,743 45,406 Selling and distribution expenses (351) (368)Administration expenses (3,209) (3,659)Other expenses (2,840) (4,480)Other income 19,609 4,182 Operating profit 28 66,952 41,081 Financing costs (1,561) (950)Profit before taxation 65,391 40,131 Tax expense 30 (14,919) (10,969)Profit for the year 50,472 29,162
Other comprehensive (expenses)/ income Changes in fair value of available-for-sale financial assets (55) 168
TOTAL COMPREHENSIVE INCOME FOR THE YEAR 50,417 29,330
The notes set out on pages 110 to 213 are an integral part of these financial statements.

108 PETRONAS Annual Report 2011
STATEMENT OF CHANGES IN EQUITYFOR THE YEAR ENDED 31 MARCH 2011
Non-distributable Distributable
Available- Note Share for-sale General Retained Total Capital Reserve Reserve Profits Equity RM Mil RM Mil RM Mil RM Mil RM Mil Balance at 1 April 2009 100 (12) 12,000 125,142 137,230 Total comprehensive income - 168 - 29,162 29,330 Dividends 31 - - - (30,000) (30,000)Balance at 31 March 2010 100 156 12,000 124,304 136,560 Balance at 1 April 2010 100 156 12,000 124,304 136,560 Total comprehensive income - (55) - 50,472 50,417 Dividends 31 - - - (30,000) (30,000)Balance at 31 March 2011 100 101 12,000 144,776 156,977
The notes set out on pages 110 to 213 are an integral part of these financial statements.

PETRONAS Annual Report 2011 109
STATEMENT OF CASH FLOWFOR THE YEAR ENDED 31 MARCH 2011
Note 2011 2010 RM Mil RM Mil CASH FLOWS FROM OPERATING ACTIVITIES Cash receipts from customers 77,321 66,828 Cash paid to suppliers and employees (40,954) (42,416) 36,367 24,412 Interest income from fund and other investments 2,285 2,259 Interest expenses paid (987) (681) Taxation paid (14,996) (15,345)
Net cash generated from operating activities 22,669 10,645 CASH FLOWS FROM INVESTING ACTIVITIES
Net cash generated from investing activities 32 9,981 11,094
CASH FLOWS FROM FINANCING ACTIVITIES
Net cash used in financing activities 33 (30,000) (14,307)
NET INCREASE IN CASH AND CASH EQUIVALENTS 2,650 7,432 NET FOREIGN EXCHANGE DIFFERENCES (1,303) (293) CASH AND CASH EQUIVALENTS AT BEGINNING OF THE YEAR 57,307 50,168 CASH AND CASH EQUIVALENTS AT END OF THE YEAR 58,654 57,307 CASH AND CASH EQUIVALENTS Cash and bank balances and deposits 15 58,164 56,677 Negotiable certificate of deposits 12 490 630 58,654 57,307
The notes set out on pages 110 to 213 are an integral part of these financial statements.

110 PETRONAS Annual Report 2011
NOTES TO THE FINANCIAL STATEMENTS - 31 MARCH 2011
1. BASIS OF PREPARATION
1.1 Statement of compliance
The financial statements of the Group and of the Company have been prepared in accordance with Financial Reporting Standards (FRSs), generally accepted accounting principles and the Companies Act, 1965 in Malaysia.
At the beginning of the current financial year, the Group and the Company had adopted new and revised FRSs, amendments and IC interpretations (collectively referred to as “pronouncements”) that have been issued by the Malaysian Accounting Standards Board (“MASB”) as described fully in note 43.
The MASB has also issued new pronouncements which are not yet effective for the Group and the Company. These pronouncements including their impact on the financial statements in the period of initial application are set out in note 44. New pronouncements that are not relevant to the operations of the Group and of the Company are set out in note 45.
The financial statements were approved and authorised for issue by the Board of Directors on 30 May 2011.
1.2 Basis of measurement
The financial statements of the Group and of the Company have been prepared on the historical cost basis except that, as disclosed in the accounting policies below, certain items are measured at fair value.
1.3 Functional and presentation currency
The individual financial statements of each entity in the Group are measured using the currency of the primary economic environment in which the entity operates (“the functional currency”). The Group and the Company’s financial statements are presented in Ringgit Malaysia, which is the Company’s functional currency.
1.4 Use of estimates and judgments
The preparation of financial statements requires management to make judgments, estimates and assumptions that affect the application of accounting policies and the reported amounts of assets, liabilities, income and expenses. Actual results may differ from these estimates.
Estimates and underlying assumptions are reviewed on an ongoing basis. Revisions to accounting estimates are
recognised in the period in which the estimate is revised and in any future periods affected. In particular, information about significant areas of estimation uncertainty and critical judgments in applying accounting
policies that have the most significant effect on the amount recognised in the financial statements are described in the following notes:
(i) Note 3 : Property, Plant and Equipment; (ii) Note 10 : Intangible Assets; (iii) Note 14 : Deferred Tax; (iv) Note 25 : Other Long Term Liabilities and Provisions; and (v) Note 40 : Financial Instruments.

PETRONAS Annual Report 2011 111
2. SIGNIFICANT ACCOUNTING POLICIES
The accounting policies set out below have been applied consistently to all periods presented in these financial statements, and have been applied consistently by Group entities, unless otherwise stated.
2.1 Basis of consolidation
Subsidiaries are entities controlled by the Company. Control exists when the Company has the power, directly or indirectly, to govern the financial and operating policies of an entity so as to obtain benefits from its activities.
The financial statements of subsidiaries are included in the consolidated financial statements from the date that control commences until the date that control ceases.
All inter-company transactions are eliminated on consolidation and revenue and profits relate to external transactions only. Unrealised losses resulting from intercompany transactions are also eliminated unless cost cannot be recovered.
Acquisitions of subsidiaries are accounted for using the purchase method. The purchase method of accounting involves allocating the cost of the acquisition to the fair value of the assets acquired and liabilities and contingent liabilities assumed at the date of acquisition.
The cost of an acquisition is measured as the aggregate of the fair values, at the date of exchange, of the assets given, liabilities incurred or assumed, and equity instruments issued, plus any costs directly attributable to the acquisition.
Any excess of the cost of the acquisition over the Group’s interest in the net fair value of the identifiable assets, liabilities and contingent liabilities represents goodwill.
Any excess of the Group’s interest in the net fair value of the identifiable assets, liabilities and contingent liabilities over the cost of acquisition is recognised immediately in profit or loss.
Minority interests at the reporting date, being the portion of the net assets of subsidiaries attributable to equity interests
that are not owned by the Company, whether directly or indirectly through subsidiaries, are presented in the consolidated statement of financial position and statement of changes in equity within equity, separately from equity attributable to the equity shareholders of the Company. Minority interests in the results of the Group are presented in the consolidated statement of comprehensive income as an allocation of the profit or loss and the comprehensive income for the year between minority interests and the equity shareholders of the Company.
Where losses applicable to the minority exceed the minority’s interest in the equity of a subsidiary, the excess, and any further losses applicable to the minority, are charged against the Group’s interest except to the extent that the minority has a binding obligation to, and is able to, make additional investment to cover the losses. If the subsidiary subsequently reports profits, the Group’s interest is allocated all such profits until the minority’s share of losses previously absorbed by the Group has been recovered.

112 PETRONAS Annual Report 2011
2. SIGNIFICANT ACCOUNTING POLICIES (continued)
2.2 Associates
Associates are entities in which the Group has significant influence including representation on the Board of Directors, but not control or joint control, over the financial and operating policies of the investee company.
Associates are accounted for in the consolidated financial statements using the equity method. The consolidated financial statements include the Group’s share of post-acquisition profits or losses of the equity accounted associates, after adjustments to align the accounting policies with those of the Group, from the date that significant influence commences until the date that significant influence ceases.
The Group’s share of post-acquisition reserves and retained profits less losses is added to the carrying value of the investment in the consolidated statement of financial position. These amounts are taken from the latest audited financial statements or management financial statements of the associates.
When the Group’s share of post-acquisition losses exceeds its interest in an equity accounted associate, the carrying amount of that interest (including any long-term investments) is reduced to nil and the recognition of further losses is discontinued except to the extent that the Group has an obligation or has made payments on behalf of the investee.
Unrealised profits arising from transactions between the Group and its associates are eliminated to the extent of the Group’s interests in the associates. Unrealised losses on such transactions are also eliminated partially, unless cost cannot be recovered.
2.3 Jointly controlled entities
The Group has interests in joint ventures which are jointly controlled entities. A joint venture is a contractual arrangement whereby the Group and other parties undertake an economic activity that is subject to joint control, established by contractual agreement and requiring unanimous consent for strategic financial and operating decisions. A jointly controlled entity is a joint venture that involves the establishment of a separate entity in which each venturer has an interest.
Investments in jointly controlled entities are accounted for in the consolidated financial statements using the equity method of accounting as described in note 2.2.
2.4 Property, plant and equipment and depreciation
Freehold land and projects-in-progress are stated at cost less accumulated impairment losses and is not depreciated. Other property, plant and equipment are stated at cost less accumulated depreciation and accumulated impairment losses.
Cost includes expenditures that are directly attributable to the acquisition of the asset and any other costs directly attributable to bringing the assets to working condition for their intended use, and the costs of dismantling and removing the items and restoring the site on which they are located. The cost of self-constructed assets also includes the cost of materials and direct labour. For qualifying assets, borrowing costs are capitalised in accordance with the accounting policy on borrowing costs. Purchased software that is integral to the functionality of the related equipment is capitalised as part of that equipment.

PETRONAS Annual Report 2011 113
2. SIGNIFICANT ACCOUNTING POLICIES (continued)
2.4 Property, plant and equipment and depreciation (continued)
When significant parts of an item of property, plant and equipment have different useful lives, they are accounted for as separate items (major components) of property, plant and equipment.
The cost of replacing part of an item of property, plant and equipment is recognised in the carrying amount of the item if it is probable that the future economic benefits embodied within the part will flow to the Group and its cost can be measured reliably. The net book value of the replaced item of property, plant and equipment is derecognised with any corresponding gain or loss recognised in the profit or loss accordingly. The costs of the day-to-day servicing of property, plant and equipment are recognised in the profit or loss as incurred.
When the use of a property changes from owner-occupied to investment property, the property is reclassified as investment property at cost.
Depreciation for property, plant and equipment other than freehold land, oil and gas properties and projects-in-progress, is recognised in the profit or loss on a straight-line basis over the estimated useful lives of each part of an item of property, plant and equipment. Property, plant and equipment are not depreciated until the assets are ready for their intended use.
Depreciation of producing oil and gas properties is computed based on the unit of production method using total proved reserves for capitalised acquisition costs and total proved and probable developed reserves for capitalised exploration and development costs.
Lease properties are depreciated over the lease term or the estimated useful lives, whichever is shorter. Leasehold land is depreciated over the lease term.
The estimated useful lives of the other property, plant and equipment are as follows:
Buildings 14 - 50 years Plant and equipment 3 - 67 years Office equipment, furniture and fittings 5 - 10 years Computer software and hardware 5 years Motor vehicles 3 - 5 years Vessels 25 - 40 years
Estimates in respect of certain items of property, plant and equipment were revised during the year (refer note 3).
Property, plant and equipment individually costing less than RM5,000 are expensed off in the year of purchase.
The depreciable amount is determined after deducting residual value. The residual value, useful life and depreciation method are reviewed at each financial year end to ensure that the amount, period and method of depreciation are consistent with previous estimates and the expected pattern of consumption of the future economic benefits embodied in the items of property, plant and equipment.
An item of property, plant and equipment is derecognised upon disposal or when no future economic benefits are expected from its use or disposal. The difference between the net disposal proceeds, if any, and the net carrying amount is recognised in the profit or loss.

114 PETRONAS Annual Report 2011
2. SIGNIFICANT ACCOUNTING POLICIES (continued)
2.5 Investment properties
Investment properties are properties which are owned either to earn rental income or for capital appreciation or for both. Properties that are occupied by the companies in the Group are accounted for as owner-occupied rather than as investment properties.
Freehold land and projects-in-progress are stated at cost and are not depreciated. Other investment properties are stated at cost less accumulated depreciation and accumulated impairment losses, if any, consistent with the accounting policy for property, plant and equipment as stated in note 2.4.
Cost includes expenditure that is directly attributable to the acquisition of the investment property. The cost of self-constructed investment property includes the cost of materials and direct labour, any other costs directly attributable to bringing the investment property to a working condition for its intended use and capitalised borrowing costs.
An investment property under construction before 1 April 2010 was classified as property, plant and equipment until construction or development is complete, at which time it is reclassified as investment property at cost. Following the amendment made to FRS 140, Investment Property with effect from 1 April 2010, investment property under construction is classified as investment property.
Depreciation is recognised in the profit or loss on a straight-line basis over their estimated useful lives ranging between 10 and 50 years for buildings.
An investment property is derecognised on its disposal, or when it is permanently withdrawn from use and no future economic benefits are expected from its disposal. The difference between the net disposal proceeds and the carrying amount is recognised in profit or loss in the period in which the item is derecognised.
2.6 Land held for development and property development costs (i) Land held for development
Land held for development consists of land or such portions thereof on which no development activities have been carried out or where development activities are not expected to be completed within the normal operating cycle. Such land is classified as non-current asset and is stated at cost less accumulated impairment losses, if any.
Cost includes acquisition cost of land and attributable development expenditure. Cost associated with the acquisition of land includes the purchase price of the land, professional fees, stamp duties, commissions, conversion fees and other relevant levies. Where the Group had previously recorded the land at revalued amount, it continues to retain this amount as its surrogate costs as allowed by FRS 2012004, Property Development Activities.
Land held for development is reclassified as property development costs at the point when development activities have commenced and where it can be demonstrated that the development activities can be completed within the normal operating cycle.

PETRONAS Annual Report 2011 115
2. SIGNIFICANT ACCOUNTING POLICIES (continued)
2.6 Land held for development and property development costs (continued)
(ii) Property development costs
Property development costs comprise costs associated with the acquisition of land, all costs that are directly attributable to development activities or that can be allocated on a reasonable basis to such activities and interest expenses incurred during the period of active development.
Property development cost not recognised as an expense is recognised as an asset and is stated at the lower of cost and net realisable value.
2.7 Leased assets (i) Finance lease
A lease is recognised as a finance lease if it transfers substantially to the Group and the Company all the risks and rewards incidental to ownership. Upon initial recognition, the leased asset is measured at an amount equal to the lower of its fair value and the present value of the minimum lease payments at the inception of the lease. Subsequent to initial recognition, the asset is accounted for in accordance with the accounting policy applicable to that asset. The corresponding liability is included in the statement of financial position as borrowings.
Minimum lease payments made under finance leases are apportioned between the finance costs and the reduction of the outstanding liability. Finance costs, which represent the difference between the total leasing commitments and the fair value of the assets acquired, are recognised in the profit or loss over the lease term so as to produce a constant periodic rate of interest on the remaining balance of the liability for each accounting period.
Contingent lease payments, if any, are accounted for by revising the minimum lease payments over the remaining term of the lease when the lease adjustment is confirmed.
(ii) Operating lease
All leases that do not transfer substantially to the Group and the Company all the risks and rewards incidental to ownership are classified as operating leases and, the leased assets are not recognised on the Group’s statement of financial position.
Payments made under operating leases are recognised as an expense in the profit or loss on a straight-line basis over the term of the lease. Lease incentives received are recognised as a reduction of rental expense over the lease term on a straight-line basis. Contingent rentals are charged to profit or loss in the reporting period in which they are incurred.
(iii) Prepaid lease payments Prepaid rental together with leasehold land which in substance is an operating lease are classified as prepaid
lease payments. The payment made on entering into a lease arrangement or acquiring a leasehold land is accounted for as prepaid lease payments that are amortised over the lease term in accordance with the pattern of benefits provided.

116 PETRONAS Annual Report 2011
2. SIGNIFICANT ACCOUNTING POLICIES (continued)
2.7 Leased assets (continued) (iii) Prepaid lease payments (continued)
The Group and the Company had previously classified leasehold land that normally has an indefinite economic life and title is not expected to pass to the lessee by the end of the lease term as an operating lease and therefore, payment made on entering into or acquiring this leasehold land is accounted for as prepaid lease payments. Following the amendment made to FRS 117, Leases, leasehold land which in substance is a finance lease has been reclassified to property, plant and equipment and measured as such retrospectively.
Leasehold land is classified into long lease and short lease. Long lease is defined as a lease with an unexpired lease period of fifty years or more. Short lease is defined as a lease with an unexpired lease period of less than fifty years.
2.8 Investments
Long term investments in subsidiaries, associates and jointly controlled entities are stated at cost less impairment loss, if any, in the Company’s financial statements.
The carrying amount of these investments includes fair value adjustments on shareholder’s loans and advances, if any (note 2.12(i)).
2.9 Intangible assets
(i) Goodwill
Goodwill arising from acquisitions represents the excess of the cost of the acquisition over the Group’s interest in the fair values of the net identifiable assets and liabilities and contingent liabilities of the acquiree.
When the excess is negative (negative goodwill), it is recognised immediately in the profit or loss.
Goodwill is initially measured at cost. Following the initial recognition, goodwill is measured at cost less any accumulated impairment losses. Goodwill is not amortised but instead, it is reviewed for impairment, annually or more frequently if events or changes in circumstances indicate that the carrying value may be impaired.
In respect of equity accounted investees, the carrying amount of goodwill is included in the carrying amount of the investment. The entire carrying amount of the investment is reviewed for impairment when there is objective evidence of impairment.
(ii) Exploration expenditure
Intangible assets also include expenditure on the exploration for and evaluation of oil and natural gas resources (hereinafter collectively referred to as “exploration expenditure”). The accounting policy for exploration expenditure is described separately in note 2.10.

PETRONAS Annual Report 2011 117
2. SIGNIFICANT ACCOUNTING POLICIES (continued)
2.9 Intangible assets (continued) (iii) Other intangible assets
Intangible assets other than goodwill and exploration expenditure are measured on initial recognition at cost. The costs of intangible assets acquired in a business combination are their fair values as at the date of acquisition.
Following initial recognition, intangible assets with finite useful lives are carried at cost less accumulated
amortisation and any accumulated impairment losses.
Amortisation for intangible assets with finite useful lives is recognised in the profit or loss on a straight line basis over the estimated economic useful lives, other than certain recoverable expenditure which is amortised based on actual costs recovered. The amortisation method and the useful life for intangible assets are reviewed at least at each reporting date. Intangible assets are assessed for impairment whenever there is an indication that the intangible assets may be impaired.
Intangible assets with indefinite useful lives are carried at cost less accumulated impairment losses. These intangible assets are reviewed for impairment annually or more frequently if events or changes in circumstances indicate that the carrying value may be impaired.
2.10 Exploration and development expenditure
The Group follows the successful efforts method of accounting for the exploration and development expenditure.
(i) Exploration expenditure
Costs directly associated with an exploration well, including license acquisition and drilling costs, are initially capitalised as intangible assets until the results have been evaluated.
If a well does not result in successful discovery of economically recoverable volume of hydrocarbons, such costs are written off as a dry hole. If hydrocarbons are found and, subject to further appraisal activity which may include the drilling of further wells, are likely to be capable of commercial development under prevailing economic conditions, the costs continue to be carried as intangible assets. All such carried costs are reviewed at least once a year to determine whether the reserves found or appraised remain economically viable. When this is no longer the case, the costs are written off.
Where development plan is commercially viable and approved by the relevant authorities, the related exploration and evaluation costs are transferred to projects-in-progress in property, plant and equipment.
(ii) Development expenditure
Development expenditure comprises all costs incurred in bringing a field to commercial production and is capitalised as incurred. The amount capitalised includes attributable interests and other financing costs incurred on exploration and development before commencement of production.

118 PETRONAS Annual Report 2011
2. SIGNIFICANT ACCOUNTING POLICIES (continued)
2.10 Exploration and development expenditure (continued) (ii) Development expenditure (continued) Upon commencement of production, the exploration and development expenditure initially capitalised as projects-
in-progress are transferred to oil and gas properties, and are depreciated as described in the accounting policy for property, plant and equipment (note 2.4).
2.11 Non-current assets held for sale
Non-current assets and disposal groups comprising assets and liabilities that are expected to be recovered primarily through sale rather than through continuing use, are classified as held for sale. This condition is regarded as met only when the sale is highly probable and the asset is available for immediate sale in its present condition.
Immediately before classification as held for sale, the assets (or all the assets and liabilities in a disposal group) are remeasured in accordance with the Group’s applicable accounting policies. Thereafter, on initial classification as held for sale, the assets or disposal groups are measured at the lower of carrying amount and fair value less cost to sell. Any differences are charged to the profit or loss.
Property, plant and equipment and investment properties once classified as held for sale are not depreciated. 2.12 Financial instruments
A financial instrument is recognised in the statement of financial position when, and only when, the Group or the Company becomes a party to the contractual provisions of the instrument.
(i) Financial assets
Initial recognition
Financial assets are classified as financial assets at fair value through profit or loss, loans and receivables, held-to-maturity investments or available-for-sale financial assets, as appropriate. The Group and the Company determine the classification of financial assets at initial recognition.
Financial assets are recognised initially at fair value, normally being the transaction price plus, in the case of financial assets not at fair value through profit or loss, any directly attributable transaction costs.
Purchases or sales that require delivery of financial assets within a timeframe established by regulation or convention in the marketplace (regular way purchases) are recognised on the trade date i.e. the date that the Group and the Company commit to purchase or sell the financial asset.
Fair value adjustments on shareholder’s loans and advances at initial recognition, if any, are added to the carrying value of investments in the Company’s financial statements.

PETRONAS Annual Report 2011 119
2. SIGNIFICANT ACCOUNTING POLICIES (continued)
2.12 Financial instruments (continued) (i) Financial assets (continued)
Subsequent measurement
The subsequent measurement of financial assets depends on their classification as follows:
Financial assets at fair value through profit or loss
Financial assets at fair value through profit or loss include financial assets held for trading and financial assets designated upon initial recognition as at fair value through profit or loss. Financial assets are classified as held for trading if they are acquired for the purpose of selling in the near term. This category includes derivative financial instruments entered into by the Group and the Company, including separated embedded derivatives, unless they are designated as effective hedging instruments.
Financial assets at fair value through profit or loss are carried in the statement of financial position at fair value with gains or losses recognised in the profit or loss. The methods used to measure fair values are stated in note 2.12(vi).
Loans and receivables
Loans and receivables are non-derivative financial assets with fixed or determinable payments that are not quoted in an active market. Subsequent to initial recognition, such financial assets are carried at amortised cost, using the effective interest rate method (note 2.12(vii)), less impairment losses.
Gains and losses are recognised in the profit or loss when the loans and receivables are derecognised or impaired, as well as through the amortisation process.
Held-to-maturity investments
Non-derivative financial assets with fixed or determinable payments and fixed maturities are classified as held-to-maturity when the Group and the Company have positive intention and ability to hold the assets to maturity. Subsequent to initial recognition, held-to-maturity investments are measured at amortised cost using the effective interest rate method less impairment losses. Gains and losses are recognised in the profit or loss when the investments are derecognised or impaired, as well as through the amortisation process.
The Group and the Company did not have any held-to-maturity investments during the year ended 31 March 2011.
120 PETRONAS Annual Report 2011
2. SIGNIFICANT ACCOUNTING POLICIES (continued)
2.12 Financial instruments (continued) (i) Financial assets (continued)
Available-for-sale financial assets
Available-for-sale financial assets are non-derivative financial assets that are designated as available-for-sale or are not classified in any of the three preceding categories. Subsequent to initial recognition, such financial assets are measured at fair value with unrealised gains or losses recognised directly in other comprehensive income and accumulated under available-for-sale reserve in equity until the investment is derecognised or determined to be impaired, at which time the cumulative gain or loss previously recorded in equity is recognised in the profit or loss.
(ii) Financial liabilities Initial recognition
Financial liabilities are classified as financial liabilities at fair value through profit or loss or loans and borrowings, as appropriate. The Group and the Company determine the classification of financial liabilities at initial recognition.
Financial liabilities are recognised initially at fair value less, in the case of loans and borrowings, any directly attributable transaction costs.
Subsequent measurement
The subsequent measurement of financial liabilities depends on their classification as follows:
Financial liabilities at fair value through profit or loss
Financial liabilities at fair value through profit or loss include financial liabilities held for trading and financial liabilities designated upon initial recognition as at fair value through profit or loss. This category includes derivative financial instruments entered into by the Group and the Company that do not meet the hedge accounting criteria.
Financial liabilities at fair value through profit or loss are carried on the statement of financial position at fair value with gains or losses recognised in the profit or loss.
Loans and borrowings
Subsequent to initial recognition, loans and borrowings are measured at amortised cost using the effective interest rate method.
Gains and losses are recognised in the profit or loss when the liabilities are derecognised as well as through the amortisation process.

PETRONAS Annual Report 2011 121
2. SIGNIFICANT ACCOUNTING POLICIES (continued)
2.12 Financial instruments (continued)
(iii) Financial guarantee contracts
Financial guarantee contracts issued by the Group and the Company are those contracts that require a payment to be made to reimburse the holder for a loss it incurs because the specified debtor fails to make a payment when due in accordance with the terms of a debt instrument.
Financial guarantee contracts are recognised initially as a liability at fair value, adjusted for transaction costs that are directly attributable to the issuance of the guarantee. When settlement of a financial guarantee contract becomes probable, an estimate of the obligation is made. If the carrying value of the financial guarantee contract is lower than the obligation, the carrying value is adjusted to the obligation amount and accounted for as provision.
Financial guarantee contracts are amortised on a straight-line basis over the contractual period of the debt instrument. Where the guarantee does not have a specific period, the guarantee will only be recognised in the profit or loss when the underlying facilities are withdrawn.
(iv) Derivative financial instruments
The Group and the Company use derivative financial instruments such as interest rate and foreign currency swaps, forward rate contracts, futures and options, to manage certain exposures to fluctuations in foreign currency exchange rates, interest rates and commodity prices.
Derivative financial instruments are initially recognised at fair value on the date on which a derivative contract is entered into and are subsequently remeasured at fair value. Derivatives are carried as financial assets when the fair value is positive and as financial liabilities when the fair value is negative.
Any gains or losses arising from changes in fair value on derivatives during the year are taken directly to the profit or loss.
An embedded derivative is recognised separately from the host contract and accounted for as a derivative if, and only if, it is not closely related to the economic characteristics and risks of the host contract and the host contract is not categorised as at fair value through profit or loss. The host contract, in the event an embedded derivative is recognised separately, is accounted for in accordance with policy applicable to the nature of the host contract.
In general, contracts to sell or purchase non-financial items to meet expected own use requirements are not accounted for as financial instruments. However, contracts to sell or purchase commodities that can be net settled or which contain written options are required to be recognised at fair value, with gains and losses taken to the profit or loss.
(v) Offsetting of financial instruments
Financial assets and financial liabilities are offset and the net amount is reported in the statement of financial position if, and only if, there is a currently enforceable legal right to offset the recognised amounts and there is an intention to settle on a net basis or to realise the assets and settle the liabilities simultaneously.
122 PETRONAS Annual Report 2011
2. SIGNIFICANT ACCOUNTING POLICIES (continued)
2.12 Financial instruments (continued)
(vi) Fair value of financial instruments
The fair value of financial instruments that are actively traded in organised financial markets is determined by reference to quoted market bid prices at the close of business at the end of reporting date. For financial instruments where there is no active market, fair value is determined using valuation techniques. Such techniques may include using recent arm’s length market transactions; reference to the current fair value of another instrument that is substantially the same; discounted cash flow analysis or other valuation models. Where fair value cannot be reliably estimated, assets are carried at cost less impairment losses.
(vii) Amortised cost of financial instruments
Amortised cost is computed using the effective interest rate method. This method uses effective interest rate that exactly discounts estimated future cash receipts or payments through the expected life of the financial instrument to the net carrying amount of the financial instrument. Amortised cost takes into account any transaction costs and any discount or premium on settlement.
(viii) Derecognition of financial instruments
A financial asset is derecognised when the rights to receive cash flows from the asset have expired or, the Group and the Company have transferred their rights to receive cash flows from the asset or have assumed an obligation to pay the received cash flows in full without material delay to a third party under a “pass-through” arrangement without retaining control of the asset or substantially all the risks and rewards of the asset. On derecognition of a financial asset, the difference between the carrying amount and the sum of the consideration received (including any new asset obtained less any new liability assumed) and any cumulative gain or loss that had been recognised in equity is recognised in the profit or loss.
A financial liability is derecognised when the obligation under the liability is discharged or cancelled or expires.
On derecognition of a financial liability, the difference between the carrying amount of the financial liabilities extinguished or transferred to another party and the consideration paid, including any non-cash assets transferred or liabilities assumed, is recognised in the profit or loss.
2.13 Impairment
(i) Financial assets
A financial asset is assessed at each reporting date to determine whether there is any objective evidence that it is impaired. A financial asset is deemed to be impaired if, and only if, there is objective evidence of impairment as a result of one or more events that has occurred after the initial recognition of the asset (an incurred loss event) and that loss event has an impact on the estimated future cash flows of the financial asset that can be reliably estimated.

PETRONAS Annual Report 2011 123
2. SIGNIFICANT ACCOUNTING POLICIES (continued)
2.13 Impairment (continued) (i) Financial assets (continued)
Loans and receivables
For loans and receivables carried at amortised cost, individually significant financial assets are tested for impairment on an individual basis. The remaining financial assets are assessed collectively in groups that share similar credit risk characteristics.
An impairment loss is measured as the difference between an asset’s carrying amount and the present value of estimated future cash flows discounted at the asset’s original effective interest rate. The carrying amount of the asset is reduced through the use of an allowance account and the amount of the loss is recognised in the profit or loss.
If, in a subsequent year, the amount of the estimated impairment loss increases or decreases because of an event occurring after the impairment was recognised, the previously recognised impairment loss is increased or reduced by adjusting the allowance account.
Available-for-sale financial investments
When a decline in the fair value of an available-for-sale financial asset has been recognised directly in equity and there is objective evidence that the asset is impaired, an amount comprising the difference between its cost and its fair value is transferred from equity to the profit or loss.
If, in a subsequent period, the fair value of an available-for-sale financial investment increases and the increase can be objectively related to an event occurring after the impairment loss was recognised in the profit or loss, the impairment loss is reversed, with the amount of the reversal recognised in the profit or loss.
Impairment losses recognised in the profit or loss relating to investment in an equity instrument classified as available-for-sale is not to be reversed through profit or loss.
(ii) Non-financial assets
The carrying amounts of assets, other than inventories, property development costs, deferred tax assets and financial assets (financial assets in this context exclude investments in subsidiaries, associates and jointly controlled entities), are reviewed at each reporting date to determine whether there is any indication of impairment. For certain classes of assets, the carrying amounts are reviewed more frequently if events or changes in circumstances indicate that the carrying value may be impaired, as described in the respective assets’ accounting policies.
If any such indication exists, the asset’s recoverable amount is estimated. An impairment loss is recognised if the carrying amount of an asset or the cash-generating unit to which it belongs exceeds its recoverable amount. Impairment losses are recognised in the profit or loss.

124 PETRONAS Annual Report 2011
2. SIGNIFICANT ACCOUNTING POLICIES (continued)
2.13 Impairment (continued) (ii) Non-financial assets (continued)
A cash-generating-unit is the smallest identifiable asset group that generates cash flows that are largely independent from other assets and groups. An impairment loss recognised in respect of a cash-generating unit is allocated first to reduce the carrying amount of any goodwill allocated to the unit and then to reduce the carrying amount of the other assets in the unit on a pro-rata basis.
The recoverable amount is the greater of the asset’s fair value less cost to sell and its value in use. In assessing value in use, the estimated future cash flows are discounted to their present value using a pre-tax discount rate that reflects current market assessments of the time value of money and the risks specific to the asset. For an asset that does not generate largely independent cash inflows, the recoverable amount is determined for the cash-generating unit to which the asset belongs.
An impairment loss in respect of goodwill is not reversed in a subsequent period. In respect of other assets, impairment losses are reversed if there has been a change in the estimates used to determine the recoverable amount. An impairment loss is reversed only to the extent that the asset’s carrying amount does not exceed the carrying amount that would have been determined, net of depreciation or amortisation, if no impairment loss had been recognised.
Reversals of impairment losses are credited to the profit or loss in the year in which the reversals are recognised.
2.14 Cash and cash equivalents
Cash and cash equivalents consist of cash on hand and bank balances, deposits with licensed financial institutions and highly liquid investments which have an insignificant risk of changes in value. For the purpose of the cash flow statement, cash and cash equivalents are presented net of bank overdrafts and deposits restricted, if any.
2.15 Amount due from contract customers
Amount due from contract customers on construction contracts is included in trade and other receivables and is stated at cost plus attributable profits less foreseeable losses and less progress billings. Cost includes all direct construction costs and other related costs. Where progress billings exceed the aggregate amount due from contract customers plus attributable profits less foreseeable losses, the net credit balance on all such contracts is included in trade and other payables as amount due to contract customers.
2.16 Inventories
Inventories are stated at the lower of cost and net realisable value. Net realisable value is the estimated selling price in the ordinary course of business, less the estimated costs of completion and selling expenses.

PETRONAS Annual Report 2011 125
2. SIGNIFICANT ACCOUNTING POLICIES (continued)
2.16 Inventories (continued) Cost of crude oil and condensates includes costs of bringing the inventories to their present location and condition and
is determined on a weighted average basis.
Cost of petroleum products includes crude oil costs, export duty, transportation charges and processing costs and is determined on a weighted average basis.
Cost of liquefied natural gas (LNG) and petrochemical products includes raw gas costs and production overheads and is determined on a weighted average basis.
Cost of material stores and spares consists of the invoiced value from suppliers and import duty charges and is determined on a weighted average basis.
Cost of developed properties held for sale consists of costs associated with the acquisition of land, direct costs and appropriate proportions of common costs attributable to developing the properties to completion.
2.17 Provisions
A provision is recognised if, as a result of a past event, the Group and the Company have a present legal or constructive obligation that can be estimated reliably, and it is probable that an outflow of economic benefits will be required to settle the obligation. Provisions are determined by discounting the expected future cash flows at a pre-tax rate that reflects current market assessments of the time value of money and the risks specific to the liability. Where discounting is used, the accretion in the provision due to the passage of time is recognised as finance cost.
The amount recognised as a provision is the best estimate of the expenditure required to settle the present obligation at the reporting date. Provisions are reviewed at each reporting date and adjusted to reflect the current best estimate.
Possible obligations whose existence will only be confirmed by the occurrence or non-occurrence of one or more future events not wholly within the control of the Group, are not recognised in the financial statements but are disclosed as contingent liabilities unless the possibility of an outflow of economic resources is considered remote.
In particular, information about provisions that have the most significant effect on the amount recognised in the financial statements is described in note 25.
2.18 Employee benefits
(i) Short term benefits
Wages and salaries, bonuses and social security contributions are recognised as an expense in the year in which the associated services are rendered by employees of the Group and the Company.

126 PETRONAS Annual Report 2011
2. SIGNIFICANT ACCOUNTING POLICIES (continued)
2.18 Employee benefits (continued)
(ii) Defined contribution plans
As required by law, companies in Malaysia make contributions to the state pension scheme, the Employees Provident Fund (“EPF”).
Some of the Group’s foreign subsidiaries make contributions to their respective countries’ statutory pension schemes and certain other independently-administered funds which are defined contribution plans.
Such contributions are recognised as an expense in the profit or loss as incurred.
2.19 Taxation
Tax on the profit and loss for the year comprises current and deferred tax. Income tax is recognised in the profit or loss except to the extent it relates to items recognised directly in equity, in which case it is recognised in equity.
(i) Current tax Current tax expense is the expected tax payable on the taxable income for the year, using the statutory tax rates
at the reporting date, and any adjustment to tax payable in respect of previous years.
(ii) Deferred tax
Deferred tax is provided for, using the liability method, on temporary differences at the reporting date between the tax bases of assets and liabilities and their carrying amounts in the financial statements. In principle, deferred tax liabilities are recognised for all taxable temporary differences and deferred tax assets are recognised for all deductible temporary differences, unabsorbed capital allowances, unused reinvestment allowances, unused investment tax allowances, unused tax losses and unused tax credits to the extent that it is probable that future taxable profit will be available against which the deductible temporary differences, unabsorbed capital allowances, unused reinvestment allowances, unused investment tax allowances, unused tax losses and unused tax credits can be utilised.
Deferred tax is not recognised if the temporary difference arises from goodwill or negative goodwill or from the initial recognition of an asset or liability in a transaction which is not a business combination and at the time of the transaction, affects neither accounting profit nor taxable profit.
Deferred tax is measured at the tax rates that are expected to apply in the period when the asset is realised or the liability is settled, based on statutory tax rates at the reporting date.
Deferred tax asset is reviewed at each reporting date and is reduced to the extent that it is no longer probable
that the related tax benefit will be realised.

PETRONAS Annual Report 2011 127
2. SIGNIFICANT ACCOUNTING POLICIES (continued)
2.20 Foreign currency transactions
In preparing the financial statements of individual entities in the Group, transactions in currencies other than the entity’s functional currency (foreign currencies) are translated to the functional currencies at rates of exchange ruling on the transaction dates.
Monetary assets and liabilities denominated in foreign currencies at the reporting date have been retranslated to the functional currency at rates ruling on the reporting date.
Non-monetary assets and liabilities denominated in foreign currencies, which are measured at fair value, are retranslated to the functional currency at the foreign exchange rates ruling at the date when the fair value was determined. Non-monetary items that are measured in terms of historical cost in a foreign currency are not retranslated.
Gains and losses on exchange arising from retranslation are recognised in the profit or loss, except for differences arising on retranslation of available-for-sale equity instruments, which are recognised in equity.
On consolidation, the assets and liabilities of subsidiaries with functional currencies other than Ringgit Malaysia, are translated into Ringgit Malaysia at the exchange rates approximating those ruling at the reporting date. The income and expenses are translated at the average exchange rates for the year, which approximates the exchange rates at the dates of the transactions. All resulting exchange differences are taken to the foreign currency translation reserve within equity.
Exchange differences arising from monetary items that in substance form part of the Company’s net investment in foreign operation, are recognised in the Company’s income statement. Such exchange differences are reclassified to other comprehensive income and accumulated under foreign currency translation reserve in equity in the Group’s consolidated statement of comprehensive income. Upon disposal of the investment, the cumulative exchange differences previously recorded in equity are recognised in the consolidated profit or loss.
2.21 Borrowing costs and foreign currency exchange differences relating to projects-in-progress
Borrowing costs which are directly attributable to the acquisition, construction or production of qualifying assets, which are assets that necessarily take a substantial period of time to be prepared for their intended use or sale, are capitalised as part of the cost of those assets.
The capitalisation of borrowing costs as part of the cost of a qualifying asset commences when expenditure for the asset is being incurred, borrowing costs are being incurred and activities that are necessary to prepare the asset for its intended use or sale are in progress. Capitalisation of borrowing costs ceases when all activities necessary to prepare the qualifying asset for its intended use or sale are completed.
The capitalisation rate used to determine the amount of borrowing costs eligible for capitalisation is the weighted average of the borrowing costs applicable to borrowings that are outstanding during the year, other than borrowings made specifically for the purpose of financing a specific qualifying asset, in which case the actual borrowing cost incurred on that borrowing less any investment income on the temporary investment of that borrowings, will be capitalised.
Exchange differences arising from foreign currency borrowings, although regarded as an adjustment to borrowing costs, are not capitalised but instead recognised in the profit or loss in the year in which they arise.
128 PETRONAS Annual Report 2011
2. SIGNIFICANT ACCOUNTING POLICIES (continued)
2.22 Revenue
Revenue from sale of oil and gas and their related products are recognised in the profit or loss when the risks and rewards of ownership have been transferred to the buyer.
Revenue from services rendered is recognised in the profit or loss based on actual and estimates of work done in respect of services rendered for long term project management contracts. Work done is measured based on internal certification of project activities. Full provision is made for any foreseeable losses.
Revenue arising from shipping activities are mainly from freight income and charter income. Freight income and the relevant discharged costs of cargoes loaded onto vessels up to the reporting date are accrued for in the profit or loss based on percentage of completion method. Charter income is accrued on time accrual basis.
Revenue from property development activities is recognised based on the stage of completion measured by reference to the proportion that property development costs incurred for work performed to-date, bear to the estimated total property development costs. Where the financial outcome of a property development activity cannot be reliably estimated, property development revenue is recognised only to the extent of property development costs incurred that is probable will be recoverable, and property development costs on the development units sold are recognised as an expense in the period in which they are incurred. Any expected loss on a development project, including costs to be incurred over the defects liability period, is recognised immediately in the profit or loss.
Revenue arising from assets yielding interest is recognised on a time proportion basis that takes into account the effective yield on the assets.
Revenue arising from investments yielding dividend are recognised when the shareholders’ right to receive payment is established.
2.23 Financing costs
Financing costs comprise interest payable on borrowings and profit share margin on Islamic Financing Facilities, as well as any accretion in provision due to the passage of time.
All interest and other costs incurred in connection with borrowings are expensed as incurred, other than that capitalised in accordance with the accounting policy stated in note 2.21. The interest component of finance lease payments is accounted for in accordance with the policy set out in note 2.7(i).
2.24 Operating segments
An operating segment is a component of the Group that engages in business activities from which it may earn revenues and incur expenses, including revenues and expenses that relate to transactions with any of the Group’s other component. An operating segment’s operating results are reviewed regularly by the chief operating decision maker, which in this case is the PETRONAS Executive Committee, to make decision about resources to be allocated to the segment and to assess its performance, and for which discrete financial information is available.

PETRONAS Annual Report 2011 129
3. PROPERTY, PLANT AND EQUIPMENT
2011 At 1.4.2010 Group Effect of Acquisition Opening adopting of balance FRS 117 Restated Additions subsidiaries RM Mil RM Mil RM Mil RM Mil RM MilAt cost: Freehold land 2,531 - 2,531 6 52 Leasehold land - 2,495 2,495 36 8 Lease properties 1,188 - 1,188 - 2 Oil and gas properties 108,147 - 108,147 1,297 -Buildings 14,969 - 14,969 652 212 Plant and equipment 74,532 - 74,532 1,274 756 Office equipment, furniture and fittings 1,988 - 1,988 144 11 Computer software and hardware 2,330 - 2,330 92 19 Motor vehicles 524 - 524 57 7 Vessels 34,803 - 34,803 349 -Projects-in-progress - oil and gas properties 44,101 - 44,101 18,611 -- other projects 11,836 - 11,836 6,884 7 296,949 2,495 299,444 29,402 1,074 continue to next page
At 1.4.2010 Effect of Charge Acquisition Opening adopting for the of balance FRS 117 Restated year subsidiaries RM Mil RM Mil RM Mil RM Mil RM MilAccumulated depreciation and impairment losses: Freehold land 22 - 22 - -Leasehold land - 403 403 112 5 Lease properties 665 - 665 58 -Oil and gas properties 45,396 - 45,396 6,108 -Buildings 4,087 - 4,087 463 53 Plant and equipment 39,494 - 39,494 3,534 498 Office equipment, furniture and fittings 1,470 - 1,470 176 10 Computer software and hardware 1,772 - 1,772 191 18 Motor vehicles 308 - 308 58 7 Vessels 14,109 - 14,109 1,147 -Projects-in-progress - oil and gas properties 2,128 - 2,128 - -- other projects 82 - 82 - - 109,533 403 109,936 11,847 591
continue to next page
The fair value of property, plant and equipment of subsidiaries acquired during the year is presented on a gross basis, where cost is separately presented from accumulated depreciation and impairment losses.

130 PETRONAS Annual Report 2011
3. PROPERTY, PLANT AND EQUIPMENT (continued)
2011 Transfers/ Translation Group Disposals/ reclass/ exchange At write offs adjustment difference 31.3.2011 RM Mil RM Mil RM Mil RM MilAt cost: Freehold land (8) (53) (15) 2,513 Leasehold land (22) - (9) 2,508 Lease properties (2) (4) (8) 1,176 Oil and gas properties (3,290) 8,585 (2,647) 112,092 Buildings (217) 191 (56) 15,751 Plant and equipment (1,580) 3,723 (1,662) 77,043 Office equipment, furniture and fittings (45) 74 (14) 2,158 Computer software and hardware (152) 47 (19) 2,317 Motor vehicles (64) 2 (4) 522 Vessels (1,053) (434) (3,167) 30,498 Projects-in-progress - oil and gas properties (649) (7,316) (842) 53,905 - other projects (1,097) (5,631) (752) 11,247 (8,179) ab (816) (9,195) 311,730 continued from previous page
Transfers/ Translation Impairment Disposals/ reclass/ exchange At loss write offs adjustment difference 31.3.2011 RM Mil RM Mil RM Mil RM Mil RM MilAccumulated depreciation and impairment losses: Freehold land - - - - 22 Leasehold land 63 (12) - (6) 565 Lease properties - (1) (1) (3) 718 Oil and gas properties 528 (51) (99) (1,352) 50,530 Buildings 72 (80) (14) (19) 4,562 Plant and equipment 2,315 (1,039) 11 (1,015) 43,798 Office equipment, furniture and fittings 3 (38) - (7) 1,614 Computer software and hardware 2 (133) (1) (17) 1,832 Motor vehicles 1 (52) (1) (2) 319 Vessels 529 (734) (286) (1,388) 13,377 Projects-in-progress - oil and gas properties 596 - - - 2,724 - other projects 12 - - - 94 4,121 (2,140) ac (391) (3,809) 120,155
continued from previous page
a Includes revision to future cost of dismantlement, removal or restoration of oil and gas properties amounting to (RM684 million) and corresponding depreciation charges of (RM73 million).b Includes net transfers of (RM132 million) comprising transfer from intangible assets of RM2,102 million and transfers to investment properties of (RM1,424 million), assets held for sale of (RM527
million) and other receivables of (RM283 million).c Includes transfer to assets held for sale of (RM318 million).

PETRONAS Annual Report 2011 131
3. PROPERTY, PLANT AND EQUIPMENT (continued)
2010 At 1.4.2009 Group Effect of Acquisition Opening adopting of balance FRS 117 Restated Additions subsidiaries RM Mil RM Mil RM Mil RM Mil RM MilAt cost: Freehold land 2,543 - 2,543 15 1Leasehold land - 2,139 2,139 325 86Lease properties 1,181 - 1,181 - -Oil and gas properties 91,005 - 91,005 1,906 2,320Buildings 14,345 - 14,345 345 55Plant and equipment 68,676 - 68,676 1,131 2,818Office equipment, furniture and fittings 1,780 - 1,780 102 14Computer software and hardware 2,054 - 2,054 81 48Motor vehicles 455 - 455 56 7Vessels 37,103 - 37,103 597 -Projects-in-progress - oil and gas properties 36,284 - 36,284 21,873 - - other projects 11,046 - 11,046 8,300 52 266,472 2,139 268,611 34,731 5,401
continue to next page
At 1.4.2009 Effect of Charge Acquisition Opening adopting for the of balance FRS 117 Restated year subsidiaries RM Mil RM Mil RM Mil RM Mil RM MilAccumulated depreciation and impairment losses: Freehold land 22 - 22 - -Leasehold land - 405 405 33 11Lease properties 614 - 614 48 -Oil and gas properties 36,848 - 36,848 6,949 1,770Buildings 3,479 - 3,479 390 12Plant and equipment 36,283 - 36,283 3,342 1,023Office equipment, furniture and fittings 1,349 - 1,349 131 11Computer software and hardware 1,555 - 1,555 204 35Motor vehicles 271 - 271 51 6Vessels 14,849 - 14,849 1,197 -Projects-in-progress - - oil and gas properties 1,818 - 1,818 - - - other projects 67 - 67 - - 97,155 405 97,560 12,345 2,868
continue to next page
The fair value of property, plant and equipment of subsidiaries acquired during the year is presented on a gross basis, where cost is separately presented from accumulated depreciation and impairment losses.

132 PETRONAS Annual Report 2011
3. PROPERTY, PLANT AND EQUIPMENT (continued)
2010 Transfers/ TranslationGroup Disposals/ reclass/ exchange At write offs adjusment difference 31.3.2010 RM Mil RM Mil RM Mil RM MilAt cost: Freehold land (14) (17) 3 2,531Leasehold land (41) - (14) 2,495Lease properties - - 7 1,188Oil and gas properties (62) 15,609 (2,631) 108,147Buildings (124) 311 37 14,969Plant and equipment (221) 4,252 (2,124) 74,532Office equipment, furniture and fittings (28) 118 2 1,988Computer software and hardware (76) 190 33 2,330Motor vehicles (27) 21 12 524Vessels (1,034) 1,527 (3,390) 34,803Projects-in-progress - oil and gas properties (17) (13,027) (1,012) 44,101 - other projects (166) (6,784) (612) 11,836 (1,810) ab 2,200 (9,689) 299,444
continued from previous page
Transfers/ Translation Impairment Disposals/ reclass/ exchange At loss write offs adjustment difference 31.3.2010 RM Mil RM Mil RM Mil RM Mil RM MilAccumulated depreciation and impairment losses: Freehold land - - - - 22Leasehold land - (35) - (11) 403Lease properties - - - 3 665Oil and gas properties 1,695 (116) (386) (1,364) 45,396Buildings 270 (67) (3) 6 4,087Plant and equipment 315 (138) 2 (1,333) 39,494Office equipment, furniture and fittings 1 (27) 2 3 1,470Computer software and hardware - (48) (2) 28 1,772Motor vehicles - (21) - 1 308Vessels 34 (465) (66) (1,440) 14,109Projects-in-progress - oil and gas properties 310 - - - 2,128 - other projects 15 - - - 82 2,640 (917) ac (453) (4,107) 109,936
continued from previous page
a Includes revision to future cost of dismantlement, removal or restoration of oil and gas properties amounting to RM1,168 million and corresponding depreciation charges of (RM386 million).b Includes net transfers of RM1,032 million comprising transfer from intangible assets of RM1,905 million and transfers to investment properties of (RM401 million), assets held for sale of
(RM107 million) and other receivables of (RM365 million).c Includes transfer to assets held for sale of (RM67 million).

PETRONAS Annual Report 2011 133
3. PROPERTY, PLANT AND EQUIPMENT (continued)
2011 At 1.4.2010 Company Effect of Opening adopting balance FRS 117 Restated Additions RM Mil RM Mil RM Mil RM MilAt cost: Freehold land 53 - 53 -Leasehold land - 127 127 -Lease properties 367 - 367 -Oil and gas properties 7,825 - 7,825 68 Buildings 200 - 200 -Plant and equipment 10 - 10 -Office equipment, furniture and fittings 182 - 182 2 Computer software and hardware 408 - 408 12 Motor vehicles 16 - 16 6 Projects-in-progress - other projects 160 - 160 257 9,221 127 9,348 345 continue to next page
At 1.4.2010 Effect of Charge Opening adopting for the balance FRS 117 Restated year RM Mil RM Mil RM Mil RM MilAccumulated depreciation: Freehold land - - - -Leasehold land - 35 35 1 Lease properties 311 - 311 10 Oil and gas properties 4,704 - 4,704 501 Buildings 49 - 49 3 Plant and equipment 9 - 9 -Office equipment, furniture and fittings 48 - 48 24 Computer software and hardware 229 - 229 47 Motor vehicles 13 - 13 2 Projects-in-progress - other projects - - - - 5,363 35 5,398 588
continue to next page

134 PETRONAS Annual Report 2011
3. PROPERTY, PLANT AND EQUIPMENT (continued)
2011 Reclass/ AtCompany Disposals adjustment 31.3.2011 RM Mil RM Mil RM MilAt cost: Freehold land - - 53 Leasehold land (2) - 125 Lease properties - - 367 Oil and gas properties - (746) 7,147 Buildings - - 200 Plant and equipment - - 10 Office equipment, furniture and fittings - (2) 182 Computer software and hardware - 2 422 Motor vehicles - - 22 Projects-in-progress - other projects (6) - 411 (8) (746) 8,939
continued from previous page
Reclass/ At Disposals adjustment 31.3.2011 RM Mil RM Mil RM MilAccumulated depreciation: Freehold land - - -Leasehold land (1) - 35 Lease properties - - 321 Oil and gas properties - (71) 5,134 Buildings - - 52 Plant and equipment - - 9 Office equipment, furniture and fittings - - 72 Computer software and hardware - - 276 Motor vehicles - - 15 Projects-in-progress - other projects - - - (1) (71) 5,914
continued from previous page

PETRONAS Annual Report 2011 135
3. PROPERTY, PLANT AND EQUIPMENT (continued)
2010 At 1.4.2009Company Effect of Opening adopting balance FRS 117 Restated Additions RM Mil RM Mil RM Mil RM MilAt cost: Freehold land 53 - 53 -Leasehold land - 99 99 28Lease properties 367 - 367 -Oil and gas properties 5,813 - 5,813 868Buildings 191 - 191 9Plant and equipment 10 - 10 -Office equipment, furniture and fittings 98 - 98 5Computer software and hardware 306 - 306 33Motor vehicles 13 - 13 -Projects-in-progress - other projects 206 - 206 162 7,057 99 7,156 1,105
continue to next page
At 1.4.2009 Effect of Charge Opening adopting for the balance FRS 117 Restated year RM Mil RM Mil RM Mil RM MilAccumulated depreciation: Freehold land - - - -Leasehold land - 31 31 4Lease properties 302 - 302 9Oil and gas properties 4,528 - 4,528 577Buildings 46 - 46 3Plant and equipment 9 - 9 -Office equipment, furniture and fittings 35 - 35 13Computer software and hardware 194 - 194 35Motor vehicles 11 - 11 2Projects-in-progress - other projects - - - - 5,125 31 5,156 643
continue to next page

136 PETRONAS Annual Report 2011
3. PROPERTY, PLANT AND EQUIPMENT (continued)
2010 Disposals/ Reclass/ AtCompany write offs adjustment 31.3.2010 RM Mil RM Mil RM MilAt cost: Freehold land - - 53Leasehold land - - 127Lease properties - - 367Oil and gas properties - 1,144 7,825Buildings - - 200Plant and equipment - - 10Office equipment, furniture and fittings - 79 182Computer software and hardware - 69 408Motor vehicles - 3 16Projects-in-progress - other projects (57) (151) 160 (57) 1,144 9,348 continued from previous page
Disposals/ Reclass/ At write offs adjustment 31.3.2010 RM Mil RM Mil RM MilAccumulated depreciation: Freehold land - - -Leasehold land - - 35Lease properties - - 311Oil and gas properties - (401) 4,704Buildings - - 49Plant and equipment - - 9Office equipment, furniture and fittings - - 48Computer software and hardware - - 229Motor vehicles - - 13Projects-in-progress - other projects - - - - (401) 5,398
continued from previous page

PETRONAS Annual Report 2011 137
3. PROPERTY, PLANT AND EQUIPMENT (continued)
Group Company Net Book Value Net Book Value 2011 2010 2011 2010 RM Mil RM Mil RM Mil RM Mil (Restated) (Restated)At cost : Freehold land 2,491 2,509 53 53 Leasehold land 1,943 2,092 90 92 Lease properties 458 523 46 56 Oil and gas properties 61,562 62,751 2,013 3,121 Buildings 11,189 10,882 148 151 Plant and equipment 33,245 35,038 1 1 Office equipment, furniture and fittings 544 518 110 134 Computer software and hardware 485 558 146 179 Motor vehicles 203 216 7 3 Vessels 17,121 20,694 - -Projects-in-progress - oil and gas properties 51,181 41,973 - - - other projects 11,153 11,754 411 160 191,575 189,508 3,025 3,950
Security
Property, plant and equipment of certain subsidiaries costing RM8,175,757,000 (2010: RM9,644,798,000) have been pledged as security for loan facilities as set out in note 23 and note 24 to the financial statements.
Projects-in-progress
Included in additions to projects-in-progress of the Group is finance costs capitalised during the year of RM126,232,000 (2010: RM195,889,000). The interest rate on borrowings capitalised ranges from 2.48% to 5.9% (2010: 2.63% to 5.9%) per annum.
Restriction of land title
The titles to certain freehold land are in the process of being registered in the subsidiaries’ name. Change in estimates
During the year, the Group revised the estimated future cost of dismantlement, removal or restoration of certain property, plant and equipment. The revision was accounted for prospectively as a change in accounting estimates resulting in lower depreciation charges which is not material in relation to the consolidated net profit for the year (refer note 25).

138 PETRONAS Annual Report 2011
3. PROPERTY, PLANT AND EQUIPMENT (continued)
Estimation of oil and gas reserves
Oil and gas reserves are key elements in the Group and the Company investment decision-making process. They are also an important element in testing for impairment. The term “reserves” describes the recoverable quantity of oil and gas volumes that are commercially viable for development given the prevailing economic situation present at the time of estimation. While it is crucial to know the quantity of these oil and gas reserves to the exact volume, in all cases, oil and gas reserves are only estimates.
Estimation of oil and gas reserves are normally conducted using industry-recognised method. Sufficient availability of key technical information are critical to ensure reserves estimates are technically sound while recognising the existence of uncertainties present in the oil and gas reservoirs. Reserves estimates are normally presented alongside the range of level of certainties namely the P1 (proved reserves; high level of certainty), P2 (probable reserves; mean level of certainty) and P3 (possible reserves; low level of certainty). Level of certainties are related to the availability and understanding of the geological and reservoir data available at the time of estimation and is normally represented in the form of probability distribution.
The Group adopts the 2P (or P1 + P2) reserves estimation approach for its reporting and investment decision making purposes. This approach is in line with the general industry-wide applications supported by the Society of Petroleum Engineers (SPE), World Petroleum Congress (WPC) and Society of Petroleum Evaluators and Estimators (SPEE).
The reserves are further subdivided into developed and undeveloped category. Developed reserves are reserves expected to be recovered through existing wells and facilities under the operating conditions that have been designed for. Whereas the undeveloped reserves are reserves to be recovered from approved and sanctioned projects and remain so until the wells are drilled and completed and ready for production which would by then be classified as developed.
In the annual reporting, these reserves may be revised based on new data that may become available (e.g. additional wells, actual production) or changes in economic parameters (e.g. cost, oil prices). These changes will eventually affect the financial and accounting measures such as the standardised measure of discounted cash flow, depreciation and amortisation charges and decommissioning provisions. Ultimately, these changes will also affect profit.
Impairment
In 2011, the Group recognised impairment losses on certain property, plant and equipment amounting to RM4,121,000,000 (2010: RM2,640,000,000).
In arriving at the impairment loss amount, the carrying amount of each impaired cash generating unit is compared with the recoverable amount of the cash generating unit. The recoverable amount is determined from the value in use calculations, using cash flow projections.
The Group uses a range of long term assumptions including prices, volumes, margins and costs based on past performance and management’s expectations of market development. The projected cash flows were discounted using a discount rate between 9% to 10% (2010: 9%).

PETRONAS Annual Report 2011 139
4. INVESTMENT PROPERTIES
Group Translation 2011 At exchange At 1.4.2010 Additions Disposal Transfers difference 31.3.2011 RM Mil RM Mil RM Mil RM Mil RM Mil RM MilAt cost : Freehold land 1,116 3 (152) 137 - 1,104 Buildings 9,968 616 (164) 1 (17) 10,404 Projects-in-progress - 396 (27) 1,311 - 1,680 11,084 1,015 (343) a 1,449 (17) 13,188
Translation At Charge for exchange At 1.4.2010 the year Disposal Transfers difference 31.3.2011 RM Mil RM Mil RM Mil RM Mil RM Mil RM MilAccumulated depreciation : Freehold land - - - - - -Buildings 2,294 364 (22) - (9) 2,627 Projects-in-progress - - - - - - 2,294 364 (22) - (9) 2,627
2010 Translation At Disposal/ exchange At 1.4.2009 Additions write offs Transfers difference 31.3.2010 RM Mil RM Mil RM Mil RM Mil RM Mil RM MilAt cost : Freehold land 1,058 36 (18) 40 - 1,116Buildings 9,467 2 (23) 553 (31) 9,968 10,525 38 (41) b 593 (31) 11,084
Translation At Charge for Disposal/ exchange At 1.4.2009 the year write offs Transfers difference 31.3.2010 RM Mil RM Mil RM Mil RM Mil RM Mil RM MilAccumulated depreciation : Freehold land - - - - - -Buildings 1,967 352 (6) - (19) 2,294 1,967 352 (6) - (19) 2,294
a Comprises transfers from property, plant and equipment of RM1,424 million and land held for development of RM25 million.b Comprises transfers from property, plant and equipment RM401 million, land held for development of RM22 million and assets held for sale of RM170 million.

140 PETRONAS Annual Report 2011
4. INVESTMENT PROPERTIES (continued)
Net Book ValueGroup 2011 2010 RM Mil RM Mil Freehold land 1,104 1,116 Buildings 7,777 7,674 Projects-in-progress 1,680 - 10,561 8,790
The Directors have estimated the fair values of investment properties as at 31 March 2011 to be RM18,300,651,000 (2010: RM16,580,358,000). The fair values have been determined by discounting the estimated future cash flows or by reference to market evidence of transaction prices for similar properties.
Certain investment properties with net book value of RM3,465,042,000 (2010: RM3,266,159,000) have been pledged as securities for loan facilities as set out in note 23 and note 24 to the financial statements.
The title to certain freehold land is in the process of being registered in the subsidiary’s name.
5. LAND HELD FOR DEVELOPMENT
Translation Group Opening Disposal/ Transfers/ exchange Closing balance Additions write offs reclass difference balance2011 RM Mil RM Mil RM Mil RM Mil RM Mil RM MilAt cost : Freehold land 1,186 - (5) (48) (1) 1,132 Leasehold land 50 - - - - 50 Infrastructure development 454 15 (5) 3 (8) 459 1,690 15 (10) a (45) (9) 1,641 2010 At cost : Freehold land 1,337 - (23) (125) (3) 1,186Leasehold land 50 - - - - 50Infrastructure development 380 6 (10) 90 (12) 454 1,767 6 (33) b (35) (15) 1,690
a Comprises transfers to investment properties of (RM25 million) and property development cost of (RM20 million).b Comprises transfers to investment properties of (RM22 million) and property development costs of (RM13 million).

PETRONAS Annual Report 2011 141
6. PREPAID LEASE PAYMENTS
Group At 1.4.20102011 Effect of Opening adopting balance FRS 117 Restated Additions RM Mil RM Mil RM Mil RM MilAt cost : Leasehold land - long lease 1,266 (1,191) 75 14- short lease 536 (481) 55 3Prepaid rental 1,421 (823) 598 33 3,223 (2,495) 728 50
continue to next page
At 1.4.2010 Effect of Charge Opening adopting for the balance FRS 117 Restated year RM Mil RM Mil RM Mil RM MilAccumulated amortisation and impairment losses : Leasehold land - long lease 209 (203) 6 1- short lease 196 (172) 24 2Prepaid rental 199 (28) 171 22 604 (403) 201 25
continue to next page
At 1.4.2009 2010 Effect of Opening adopting balance FRS 117 Restated Additions RM Mil RM Mil RM Mil RM MilAt cost : Leasehold land - long lease 1,160 (1,099) 61 14- short lease 483 (434) 49 6Prepaid rental 1,181 (606) 575 24 2,824 (2,139) 685 44 continue to next page
At 1.4.2009 Effect of Charge Opening adopting for the balance FRS 117 Restated year RM Mil RM Mil RM Mil RM MilAccumulated amortisation and impairment losses : Leasehold land - long lease 212 (207) 5 1- short lease 215 (193) 22 2Prepaid rental 156 (5) 151 20 583 (405) 178 23 continue to next page

142 PETRONAS Annual Report 2011
6. PREPAID LEASE PAYMENTS (continued)
Group Translation 2011 exchange At Transfers Disposals difference 31.3.2011 RM Mil RM Mil RM Mil RM MilAt cost : Leasehold land - long lease - - 89- short lease - - - 58 Prepaid rental - - (1) 630 - - (1) 777
continued from previous page
Translation Impairment exchange At Transfers losses difference 31.3.2011 RM Mil RM Mil RM Mil RM MilAccumulated amortisation and impairment losses : Leasehold land - long lease - - - 7- short lease - - - 26Prepaid rental - - - 193 - - - 226 continued from previous page
2010 Translation exchange At Transfers Disposals difference 31.3.2010 RM Mil RM Mil RM Mil RM MilAt cost : Leasehold land - long lease - - - 75- short lease - - - 55Prepaid rental - (1) - 598 - (1) - 728
continued from previous page
Translation Impairment exchange At Transfers losses difference 31.3.2010 RM Mil RM Mil RM Mil RM MilAccumulated amortisation and impairment losses : Leasehold land - long lease - - - 6- short lease - - - 24Prepaid rental - - - 171
- - - 201 continued from previous page

PETRONAS Annual Report 2011 143
6. PREPAID LEASE PAYMENTS (continued)
Company Effect of Restated at2011 adopting 1.4.2010/ At 1.4.2010 FRS 117 At 31.3.2011 RM Mil RM Mil RM MilAt cost : Leasehold land - long lease 117 (117) -- short lease 10 (10) - 127 (127) - Accumulated amortisation : Leasehold land - long lease 32 (32) -- short lease 3 (3) - 35 (35) -
2010 Effect of Restated at adopting 1.4.2009/ At 1.4.2009 FRS 117 At 31.3.2010 RM Mil RM Mil RM MilAt cost : Leasehold land - long lease 69 (69) -- short lease 30 (30) - 99 (99) - Accumulated amortisation : Leasehold land - long lease 11 (11) -- short lease 20 (20) - 31 (31) -
Group Company 2011 2010 2011 2010 RM Mil RM Mil RM Mil RM Mil (Restated) (Restated)Carrying amount : Leasehold land - long lease 82 69 - -- short lease 32 31 - -Prepaid rental 437 427 - - 551 527 - -
Restrictions of land title
The titles to certain leasehold land are in the process of being registered in the subsidiaries’ name. Certain long term lease-hold land of the Group cannot be disposed of, charged or sub-leased without the prior consent of the relevant authority.

144 PETRONAS Annual Report 2011
7. INVESTMENTS IN SUBSIDIARIES
Company 2011 2010 RM Mil RM Mil
Investments at cost - quoted shares - in Malaysia 16,284 7,497 - unquoted shares 24,117 20,647 Fair value adjustments on loans and advances and financial guarantee 6,325 7,531 46,726 35,675 Less: Impairment losses - unquoted shares (948) (1,257) 45,778 34,418 Market value of quoted shares 84,756 41,255
Details of significant subsidiaries are stated in note 47 to the financial statements.
8. INVESTMENTS IN ASSOCIATES Group Company 2011 2010 2011 2010 RM Mil RM Mil RM Mil RM MilInvestments at cost - quoted shares - in Malaysia 256 256 302 302 - unquoted shares 2,512 2,593 - 537 Share of post-acquisition profits and reserves 3,029 2,559 - - 5,797 5,408 302 839 Less: Impairment losses - unquoted shares (72) (87) - - 5,725 5,321 302 839
Market value of quoted shares 852 817 852 817
Summary of financial information on associates: Total assets (100%) 25,320 27,258 1,021 3,673 Total liabilities (100%) (13,092) (15,066) (176) (804)Revenue (100%) 12,659 11,982 455 3,778 Profit (100%) 4,512 3,543 150 549 Contingent liabilities: Guarantees extended to third parties (12) (23) (2) (14)
Details of significant associates are stated in note 48 to the financial statements.

PETRONAS Annual Report 2011 145
9. INVESTMENTS IN JOINTLY CONTROLLED ENTITIES
Group Company 2011 2010 2011 2010 RM Mil RM Mil RM Mil RM Mil
Investments at cost - unquoted shares 4,116 1,375 677 778 Fair value adjustments on loans and
advances and financial guarantee 1,275 1,300 717 717 Share of post-acquisition profits
and reserves 492 389 - - 5,883 3,064 1,394 1,495 Less: Impairment losses (47) (13) (9) (93) 5,836 3,051 1,385 1,402
Summary of financial information on jointly controlled entities:
Total assets (100%) 18,038 11,950 3,875 5,130 Total liabilities (100%) (11,733) (9,620) (2,139) (2,978) Revenue (100%) 3,091 3,660 615 2,701 Profit (100%) 592 503 249 490
Contingent liabilities: Guarantees extended to third parties (2) (2) (2) (2)
The Group’s share of the current year and cumulative losses of certain jointly controlled entities amounting to RM3,383,000 (2010: RM18,925,000) and RM154,361,000 (2010: RM150,978,000) respectively have not been recognised in the Group’s profit or loss as equity accounting has ceased when the Group’s share of losses of these jointly controlled entities exceeded the carrying amount of its investment in these jointly controlled entities. The investments in these jointly controlled entities have been fully impaired in the respective companies’ financial statements.
Details of significant jointly controlled entities are stated in note 49 to the financial statements.

146 PETRONAS Annual Report 2011
10. INTANGIBLE ASSETS
Group 2011 Disposal/ At 1.4.2010 Additions write-offs TransferAt cost : RM Mil RM Mil RM Mil RM MilGoodwill 6,551 - (28) (792)Exploration expenditure 9,521 3,637 (2,777) (2,200)Other intangible assets 2,309 549 (50) 794 18,381 4,186 (2,855) a (2,198) continue to next page
Charge for Disposal/ ImpairmentAccumulated amortisation At 1.4.2010 the year write-offs loss and impairment losses : RM Mil RM Mil RM Mil RM MilGoodwill 191 - - 351 Exploration expenditure 121 - (121) 965 Other intangible assets 1,147 305 (11) 47 1,459 305 (132) 1,363 continue to next page
2010 At 1.4.2009 Additions Write-offs Transfer At cost : RM Mil RM Mil RM Mil RM MilGoodwill 5,521 - (67) 67Exploration expenditure 10,469 3,342 (1,652) (1,974)Other intangible assets 4,162 252 (1,972) 2 20,152 3,594 (3,691) b (1,905) continue to next page
Charge for ImpairmentAccumulated amortisation and At 1.4.2009 the year Write-offs loss impairment losses : RM Mil RM Mil RM Mil RM MilGoodwill 165 - - 23Exploration expenditure - - - 121Other intangible assets 2,975 154 (1,923) - 3,140 154 (1,923) 144 continue to next page
a Comprises transfer to property, plant and equipment of (RM2,102 million) and transfer to assets held for sale of (RM96 million).b Comprises transfer to property, plant and equipment of (RM1,905 million).

PETRONAS Annual Report 2011 147
10. INTANGIBLE ASSETS (continued)
Group Acquisition Translation 2011 of exchange At subsidiaries difference 31.3.2011At cost : RM Mil RM Mil RM MilGoodwill 442 263 6,436 Exploration expenditure - (382) 7,799 Other intangible assets 569 (40) 4,131 1,011 (159) 18,366 continued from previous page
Acquisition Translation of exchange AtAccumulated amortisation subsidiaries difference 31.3.2011 and impairment losses : RM Mil RM Mil RM MilGoodwill - - 542 Exploration expenditure - - 965 Other intangible assets - (18) 1,470 - (18) 2,977 continued from previous page
2010 Acquisition Translation of exchange At subsidiaries difference 31.3.2010At cost : RM Mil RM Mil RM MilGoodwill 1,308 (278) 6,551Exploration expenditure - (664) 9,521Other intangible assets - (135) 2,309 1,308 (1,077) 18,381 continued from previous page
Acquisition Translation of exchange AtAccumulated amortisation and subsidiaries difference 31.3.2010 impairment losses : RM Mil RM Mil RM MilGoodwill - 3 191Exploration expenditure - - 121Other intangible assets - (59) 1,147 - (56) 1,459 continued from previous page

148 PETRONAS Annual Report 2011
10. INTANGIBLE ASSETS (continued)
Carrying Amounts 2011 2010 RM Mil RM Mil
Group Goodwill 5,894 6,360 Exploration expenditure 6,834 9,400 Other intangible assets 2,661 1,162 15,389 16,922
Impairment review of goodwill
For the purpose of impairment testing, goodwill is allocated to groups of cash-generating units which represent the lowest level within the Group at which the goodwill is monitored for internal management purposes.
In assessing whether goodwill has been impaired, the carrying amount of the cash-generating unit (including goodwill) is compared with the recoverable amount of the cash-generating unit. The recoverable amount is the higher of fair value less costs to sell and value in use. In the absence of any information about the fair value of a cash-generating unit, the recoverable amount is deemed to be the value in use.
Included in goodwill is an amount of RM3,986,000,000 (2010: RM3,986,000,000) arising from the acquisition of PETRONAS Lubricants Italy S.p.A Group (“PLI Group”). The recoverable amount of PLI Group unit was based on its value in use and was determined with the assistance of independent valuers. The value in use was determined by using the discounted cash flow method based on management’s business plan cash flow projections for 5 financial years from 2011 to 2015, adjusted with an estimated terminal value. The cash flow assumes a long term growth rate of 2.9% (2010: 2.5%) and is discounted to present value using discount rate of between 8.1% and 8.4% (2010: 6.6% and 8.4%).
Based on the above, the recoverable amount of the unit was determined to be higher than its carrying amount and therefore, no impairment loss was recognised. The above estimates are sensitive in the following areas:
(i) A decrease of a half percentage point in long term growth rate used would have reduced the recoverable amount by approximately RM325 million but would not result in impairment loss.
(ii) An increase of a one percentage point in discount rate used would have reduced the recoverable amount by approximately RM564 million but would not result in impairment loss.
The value in use of other goodwill is derived from the respective cash-generating units’ business plan cash flow projections for 5 financial years and extrapolated using long term average growth rate of the respective industries those units are engaged in. These cash flows are discounted to present value using discount rate ranging from 7% to 9% (2010: 9%).
Based on the above, the carrying amount of other goodwill of certain units were determined to be higher than their recoverable amount and impairment losses of RM351,000,000 (2010: RM23,000,000) was recognised. The impairment loss was allocated to goodwill and is included in administration expenses.

PETRONAS Annual Report 2011 149
11. LONG TERM RECEIVABLES
Group Company 2011 2010 2011 2010 RM Mil RM Mil RM Mil RM MilTerm loans and advances: Loans and advances due from subsidiaries - - 67,151 69,328 Term loans due from subsidiaries - - 3,502 3,713 Loans and advances due from associates and jointly controlled entities 918 1,607 - 180 Term loans due from associates and jointly controlled entities - 112 - 112 918 1,719 70,653 73,333 Derivative assets (note 13) 433 398 1,663 1,219 Other receivables 2,317 1,419 - - 3,668 3,536 72,316 74,552 Less: Impairment losses - Term loans and advances (68) (19) (503) (226)- Other receivables (311) (336) - - 3,289 3,181 71,813 74,326 Receivable within twelve months (note 18) - 31 - 31 Receivable after twelve months 3,289 3,150 71,813 74,295 3,289 3,181 71,813 74,326
Included in the Company’s loans and advances due from subsidiaries is an amount of RM44,436,480,000 (2010: RM51,142,499,000), which bears interest at rates ranging from 3.10% to 7.88% (2010: 1.21% to 7.88%) per annum.
In 2010, the Company’s loans and advances due from associates and jointly controlled entities bears interest at rates ranging from 2.14% to 3.82% per annum.
Included in the Group’s loans and advances due from associates and jointly controlled entities is an amount of RM538,809,000 (2010: RM938,799,000), which bears interest at rates ranging from 3.22% to 10.00% (2010: 2.14% to 10.00%) per annum.
Term loans due from subsidiaries, associates and jointly controlled entities were on-lending of term loans obtained by the Company, on terms and conditions similar as those of the principal loan agreements entered into by the Company.

150 PETRONAS Annual Report 2011
12. FUND AND OTHER INVESTMENTS
Group Company 2011 2010 2011 2010 RM Mil RM Mil RM Mil RM Mil
Non current Loans and receivables Other unquoted securities 682 737 - - Available-for-sale Quoted shares - in Malaysia 373 337 - - - outside Malaysia 10,344 15,767 - - Unquoted shares 428 430 76 76 11,145 16,534 76 76 Less: Impairment losses Unquoted shares (3) (3) - - 11,142 16,531 76 76 Total non-current investments 11,824 17,268 76 76 Current Available-for-sale Quoted shares - in Malaysia 284 340 286 342 - outside Malaysia 6,731 - - - Treasury Bills 18,450 11,259 18,450 11,259 Negotiable Certificate of Deposits - 130 - 130 25,465 11,729 18,736 11,731 Fair value through profit or loss Designated upon initial recognition Quoted shares - outside Malaysia 104 78 - - Quoted securities - outside Malaysia 1,351 478 1,351 478 Malaysian Government Securities 6,286 4,952 6,193 4,892 Unquoted Corporate Private Debt Securities 3,918 1,764 5,045 2,891 Negotiable Certificate of Deposits 490 500 490 500 Other unquoted securities 250 160 - - Loan Stock 5 20 - - 12,404 7,952 13,079 8,761 Total current investments 37,869 19,681 31,815 20,492 Total fund and other investments 49,693 36,949 31,891 20,568 Representing items: At amortised cost 1,107 1,164 76 76 At fair value 48,586 35,785 31,815 20,492 49,693 36,949 31,891 20,568
Included in unquoted corporate private debt securities of the Company are securities issued by a subsidiary amounting to RM1,127,000,000 (2010: RM1,127,000,000).

PETRONAS Annual Report 2011 151
13. DERIVATIVE ASSETS / LIABILITIES
Group Company 2011 2010 2011 2010 Note RM Mil RM Mil RM Mil RM Mil
Derivative assets Non-current Forward foreign exchange contracts 433 398 1,663 1,219 Current Commodity swaps 4 16 - -Forward foreign exchange contracts 74 47 17 21 78 63 17 21 Included within: Long term receivables 11 433 398 1,663 1,219 Trade and other receivables 18 78 63 17 21 511 461 1,680 1,240 Derivative liabilities Non-current Interest rate swaps (303) (298) - -Forward foreign exchange contracts - - (164) (129) (303) (298) (164) (129)Current Commodity swaps (51) (19) - -Interest rate swaps (4) (4) - -Forward foreign exchange contracts (70) (10) (9) (2)Forward oil price contracts (121) (2) - - (246) (35) (9) (2)Included within: Other long term liabilities and provisions 25 (303) (298) (164) (129)Trade and other payables 26 (246) (35) (9) (2) (549) (333) (173) (131)
Included in non-current derivative assets and derivative liabilities are forward foreign exchange contracts entered into with certain subsidiaries in relation to loans due from the subsidiaries amounting to RM1,230,000,000 (2010: RM821,000,000) and RM164,000,000 (2010: RM129,000,000) respectively.
In the normal course of business, the Group and the Company enter into derivative financial instruments to manage their normal business exposures in relation to commodity prices, foreign currency exchange rates and interest rates, including management of the balance between floating rate and fixed rate debt, consistent with risk management policies and objectives.
The calculation of fair value for derivative financial instruments depends on the type of instruments. The fair value of derivative interest rate contract (e.g. interest rate swap agreements) are estimated by discounting expected future cash flows using current market interest rates and yield curve over the remaining term of the instrument. The fair of forward foreign currency exchange contracts is based on forward exchange rates.

152 PETRONAS Annual Report 2011
14. DEFERRED TAX
The components and movements of deferred tax liabilities and assets during the financial year prior to offsetting are as follows:
Charged/ Acquisition Translation Opening (credited) to of exchange ClosingGroup balance profit or loss subsidiaries Equity difference balance2011 RM Mil RM Mil RM Mil RM Mil RM Mil RM Mil Deferred tax liabilities Property, plant and equipment 13,321 857 66 - (367) 13,877 Other items 228 (13) 491 52 22 780 13,549 844 * 557 52 (345) 14,657 Deferred tax assets Property, plant and equipment 48 (48) - - - -Unused tax losses (2,123) (508) (3) - 17 (2,617)Unabsorbed capital allowances (480) (100) (36) - (15) (631)Unused reinvestment allowances (40) 17 - - - (23)Unused investment tax allowances (522) (597) - - - (1,119)Other items (1,378) 412 (3) - (15) (984) (4,495) (824) (42) - (13) (5,374)
2010 Deferred tax liabilities Property, plant and equipment 12,082 1,506 (11) - (256) 13,321Other items 51 (22) 47 57 95 228 12,133 1,484 36 57 (161) 13,549Deferred tax assets Property, plant and equipment (25) 72 - - 1 48Unused tax losses (1,824) (299) - - - (2,123)Unabsorbed capital allowances (841) 361 - - - (480)Unused reinvestment allowances (73) 33 - - - (40)Unused investment tax allowances (376) (146) - - - (522)Other items (759) 99 (267) (196) (255) (1,378) (3,898) 120 (267) (196) (254) (4,495)
* Includes deferred tax liability of RM264,000,000 which relates to adjustment arising from finalisation of purchase price allocation on acquisition of certain subsidiaries in the previous year.
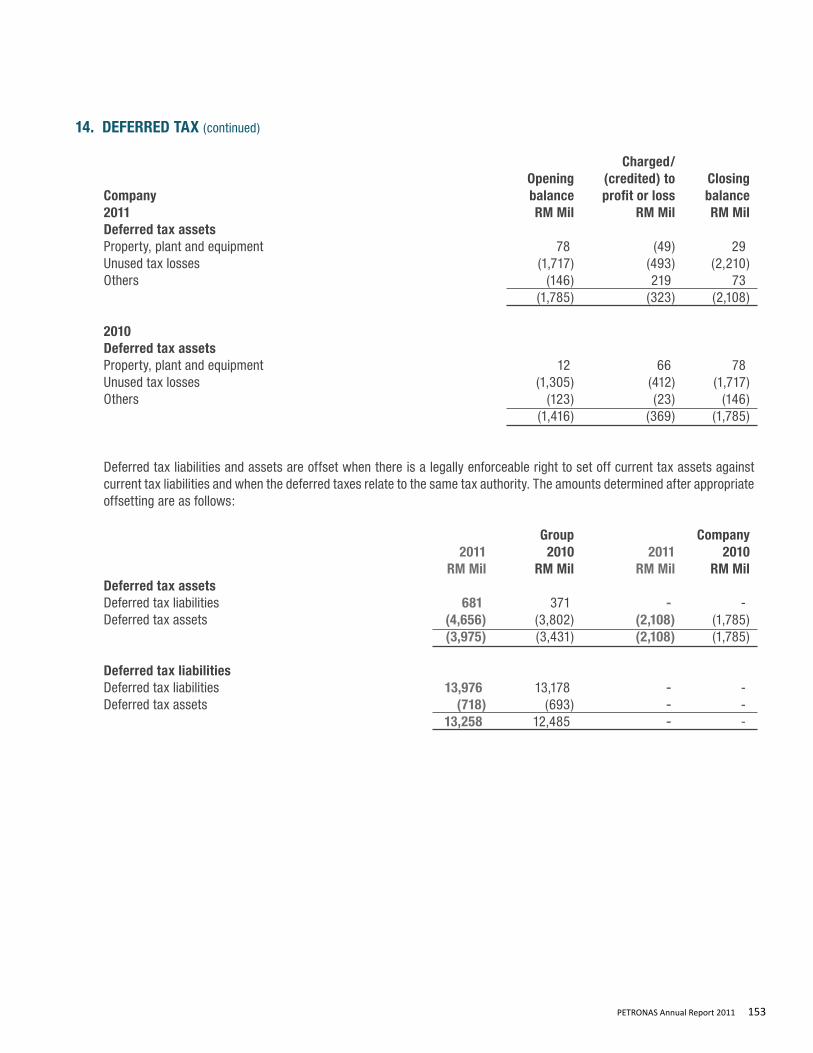
PETRONAS Annual Report 2011 153
14. DEFERRED TAX (continued)
Charged/ Opening (credited) to Closing Company balance profit or loss balance2011 RM Mil RM Mil RM MilDeferred tax assets Property, plant and equipment 78 (49) 29 Unused tax losses (1,717) (493) (2,210)Others (146) 219 73 (1,785) (323) (2,108)
2010 Deferred tax assets Property, plant and equipment 12 66 78Unused tax losses (1,305) (412) (1,717)Others (123) (23) (146) (1,416) (369) (1,785)
Deferred tax liabilities and assets are offset when there is a legally enforceable right to set off current tax assets against current tax liabilities and when the deferred taxes relate to the same tax authority. The amounts determined after appropriate offsetting are as follows:
Group Company 2011 2010 2011 2010 RM Mil RM Mil RM Mil RM MilDeferred tax assets Deferred tax liabilities 681 371 - -Deferred tax assets (4,656) (3,802) (2,108) (1,785) (3,975) (3,431) (2,108) (1,785) Deferred tax liabilities Deferred tax liabilities 13,976 13,178 - -Deferred tax assets (718) (693) - - 13,258 12,485 - -

154 PETRONAS Annual Report 2011
14. DEFERRED TAX (continued)
No deferred tax has been recognised for the following items:
Group 2011 2010 RM Mil RM MilDeductible temporary differences - 33 Unabsorbed capital allowances 771 969 Unused tax losses 3,885 3,203 Unused investment tax allowances 1,863 1,963 6,519 6,168
The unabsorbed capital allowances, unused tax losses and unused investment tax allowances do not expire under current tax legislation. Deferred tax assets have not been recognised in respect of these items because it is not probable that future taxable profit will be available against which the Group can utilise the benefits.
The Group and the Company have unused tax losses carried forward of RM14,353,000,000 (2010: RM11,695,000,000) and RM8,840,000,000 (2010: RM6,868,000,000) respectively which give rise to the recognised and unrecognised deferred tax assets above.
The Group also has unused investment tax allowances and unused reinvestment allowances of RM6,339,000,000 (2010: RM4,051,000,000) and RM92,000,000 (2010: RM160,000,000) respectively, which give rise to the recognised and unrecognised deferred tax assets above.

PETRONAS Annual Report 2011 155
15. CASH AND CASH EQUIVALENTS
Group Company 2011 2010 2011 2010 RM Mil RM Mil RM Mil RM MilNon-current Deposits placed : Banks 108 288 - - Current Cash and bank balances 2,510 2,595 2 2 Deposits placed : Banks 98,850 96,244 54,654 54,183 Finance companies 42 22 - - Other corporations 5,154 4,976 3,508 2,492 106,556 103,837 58,164 56,677 106,664 104,125 58,164 56,677
Included in cash and bank balances of the Group are interest-bearing balances amounting to RM1,901,221,000 (2010: RM2,356,482,000).
Included in cash and bank balances of the Group are amounts of RM26,692,000 (2010: RM38,300,000) held pursuant to the requirement of the Housing Development (Housing Development Account) Regulations 2002 and are therefore restricted from use in other operations.
Included in deposits placed with licensed financial institutions of the Group is an amount of RM1,001,700,00 (2010: RM745,000,000) being deposits held under designated accounts for repayment of term loan and redemption of Islamic Financing Facilities. Deposits held in respect of repayments which are not due within the next 12 months are presented as non-current.

156 PETRONAS Annual Report 2011
16. PROPERTY DEVELOPMENT COSTS
Costs Group incurred/ Transfer 2011 (charged) from land Reversal of Translation Opening during held for completed exchange Closing balance the year development projects differences balance RM Mil RM Mil RM Mil RM Mil RM Mil RM Mil
Freehold land 22 1 16 - - 39 Development costs 453 68 4 (67) (2) 456 Less: Accumulated costs charged to profit or loss (2) (119) - 67 - (54) 473 (50) 20 - (2) 441
2010 Freehold land 537 7 7 (529) - 22Development costs 417 180 6 (147) (3) 453Less: Accumulated costs charged to profit or loss (31) (17) - 46 - (2) 923 170 13 (630) (3) 473
Included in property development costs incurred during the year is finance costs capitalised during the year of RM11,560,000 (2010: RM7,796,000).
The interest rate on the borrowings capitalised is 5.77% (2010: 5.80%) per annum.
17. TRADE AND OTHER INVENTORIES
Group Company 2011 2010 2011 2010 RM Mil RM Mil RM Mil RM Mil Crude oil and condensate 2,072 1,854 - -Petroleum products 4,885 3,511 49 42 Petrochemical products 100 623 - -Liquefied natural gas 485 164 - -Stores, spares and others 1,809 2,012 - -Developed properties held for sale 349 401 - - 9,700 8,565 49 42

PETRONAS Annual Report 2011 157
18. TRADE AND OTHER RECEIVABLES
Group Company 2011 2010 2011 2010 RM Mil RM Mil RM Mil RM Mil Trade receivables 24,451 20,091 3,066 2,995 Staff housing and vehicle loans 338 378 336 376 Other receivables, deposits and prepayments 7,330 6,135 328 385 Amount due from: - contract customers 271 1,811 - - - subsidiaries* - - 9,090 11,948 - associates and jointly controlled entities* 1,147 430 28 37 Term loans due from associates and jointly controlled entities (note 11) - 31 - 31 Derivative assets (note 13) 78 63 17 21 33,615 28,939 12,865 15,793Less: Impairment losses Trade receivables (428) (868) (90) (489)Amount due from subsidiaries - - (238) (399)Other receivables, deposits and prepayments (25) (86) (18) (44) 33,162 27,985 12,519 14,861
* Amount due from subsidiaries, associates and jointly controlled entities arose in the normal course of business.
Amount due from contract customers:
Group 2011 2010 RM Mil RM Mil Aggregate costs incurred to date 2,246 10,255 Add : Attributable profit 311 296 2,557 10,551 Less : Progress billings (2,286) (8,740) 271 1,811
Included in trade receivables of the Group are rental receivables amounting to RM7,295,000 (2010: RM7,923,000), which have been pledged for loan facilities as set out in note 23 and note 24 to the financial statements.
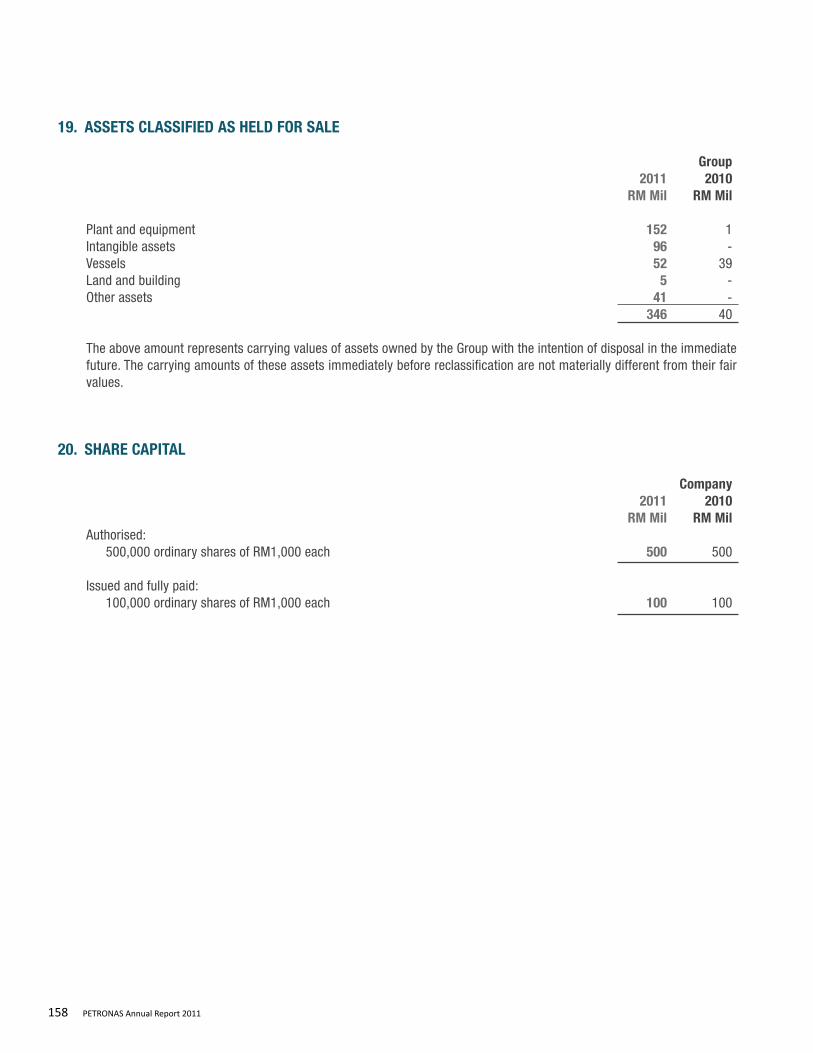
158 PETRONAS Annual Report 2011
19. ASSETS CLASSIFIED AS HELD FOR SALE Group 2011 2010 RM Mil RM Mil
Plant and equipment 152 1 Intangible assets 96 -Vessels 52 39 Land and building 5 -Other assets 41 - 346 40
The above amount represents carrying values of assets owned by the Group with the intention of disposal in the immediate future. The carrying amounts of these assets immediately before reclassification are not materially different from their fair values.
20. SHARE CAPITAL Company 2011 2010 RM Mil RM MilAuthorised: 500,000 ordinary shares of RM1,000 each 500 500 Issued and fully paid: 100,000 ordinary shares of RM1,000 each 100 100
PETRONAS Annual Report 2011 159
21. RESERVES
Pursuant to Section 84 of the Petroleum (Income Tax) Act 1967, dividends paid out on income derived from petroleum operations are not chargeable to income tax. Subject to agreement by the Inland Revenue Board, the Company has sufficient income derived from petroleum operations, Section 108 tax credit and tax exempt income to distribute all its distributable reserves at 31 March 2011, if paid out as dividends.
The Financial Act, 2007 introduced a single tier company income tax system with effect from year of assessment 2008. As such, the remaining Section 108 tax credit as at 31 March 2011 will be available to the Company until such time the credit is fully utilised or upon expiry of the six-year transitional period on 31 December 2013, whichever is earlier.
Capital Reserves
Capital reserves represent primarily reserves created upon redemption of preference shares and the Group’s share of its associate companies’ reserves.
Foreign Currency Translation Reserve
The foreign currency translation reserve comprises all foreign currency differences arising from the translation of the financial statements of subsidiaries whose functional currencies are different from that of the Group’s presentation currency.
Available-for-sale Reserve
This reserve records the changes in fair value of available-for-sale investments. On disposal or impairment, the cumulative changes in fair value are transferred to the profit or loss.
General Reserve
General reserve represents appropriation of retained profits for general purposes rather than for a specific item of future loss or expense. In effect, it is a reserve for unspecified possible events.
22. MINORITY SHAREHOLDERS’ INTERESTS
This consists of the minority shareholders’ proportion of share capital and reserves of partly-owned subsidiaries.

160 PETRONAS Annual Report 2011
23. BORROWINGS Group Company 2011 2010 2011 2010 RM Mil RM Mil RM Mil RM Mil Current Secured Term loans 602 503 - - Islamic financing facilities 679 328 - - Total current secured borrowings 1,281 831 - -
Unsecured Term loans 536 570 - - Islamic financing facilities 1,250 700 - - Revolving credits 274 674 - - Bankers’ acceptances 41 - - - Bank overdrafts 75 307 - - Total current unsecured borrowings 2,176 2,251 - - Total current borrowings 3,457 3,082 - - Non-current Secured Term loans 2,463 3,249 - - Islamic financing facilities 2,292 2,958 - - Total non-current secured borrowings 4,755 6,207 - - Unsecured Term loans 8,167 8,835 - - Notes and Bonds 24,195 26,077 22,055 23,727 Islamic financing facilities 7,237 7,669 4,536 4,894 Total non-current unsecured borrowings 39,599 42,581 26,591 28,621 Total non-current borrowings 44,354 48,788 26,591 28,621 Total borrowings 47,811 51,870 26,591 28,621

PETRONAS Annual Report 2011 161
23. BORROWINGS (continued)
Terms and debt repayment schedule
Under 1-2 2-5 Over 5 Total 1 year years years yearsGroup RM Mil RM Mil RM Mil RM Mil RM Mil Secured Term loans 3,065 602 536 1,810 117 Islamic financing facilities 2,971 679 454 578 1,260 6,036 1,281 990 2,388 1,377 Unsecured Term loans 8,703 536 396 7,648 123 Notes and Bonds 24,195 - 6,068 4,587 13,540 Islamic financing facilities 8,487 1,250 1,050 5,516 671 Revolving credits 274 274 - - -Bankers’ acceptances 41 41 - - -Bank overdrafts 75 75 - - - 41,775 2,176 7,514 17,751 14,334 47,811 3,457 8,504 20,139 15,711
Company Unsecured Notes and Bonds 22,055 - 6,053 2,479 13,523 Islamic financing facilities 4,536 - - 4,536 - 26,591 - 6,053 7,015 13,523
Islamic financing facilities
Details of Islamic financing facilities are included in note 24.
Unsecured term loans
The unsecured term loans obtained by the subsidiaries comprise: In million 2011 2010
USD Term loan US$1,098 US$1,112 RM Term loan RM2,328 RM2,512 BAHT Term loans BAHT714 BAHT1,000 EURO Term loans €859 €881
These unsecured term loans bear interest at rates ranging from 1.10% to 6.00% (2010: 1.24% to 5.12%) per annum and are fully repayable at their various due dates from 2011 to 2023.

162 PETRONAS Annual Report 2011
23. BORROWINGS (continued)
Unsecured Notes and Bonds
The unsecured Notes and Bonds comprise: In million 2011 2010 USD Notes and Bonds 7% Notes due 2012^ US$2,000 US$2,000 6 1/8% Notes due 2014* US$700 US$700 7 3/4% Bonds due 2015 US$625 US$625 5 1/4% Guaranteed Notes due 2019^ US$3,000 US$3,000 7 7/8% Notes due 2022^ US$1,000 US$1,000 7 5/8% Bonds due 2026 US$500 US$500 Samurai Bonds 6th Series 3.4% due 2013 ¥16,000 ¥16,000
* Obtained by a subsidiary. ^ Obtained by the Company via a subsidiary.
Secured term loans
The secured term loans obtained by the subsidiaries comprise:
In million Securities 2011 2010
USD Term loans Secured by way of a charge over certain vessels, property, plant and equipment and investment properties, together with assignments of earnings, charter agreements and insurance of the relevant vessels, property, plant and equipment of certain subsidiaries.
RM Term loans Secured by way of a charge over certain vessels, property, plant and equipment and investment properties, together with assignments of earnings, charter agreements and insurance of the relevant vessels, property, plant and equipment of certain subsidiaries.
US$1,499 US$2,109
RM1,312 RM1,335
The secured term loans bear interest at rates ranging from 1.05% to 7.00% (2010: 1.12% to 7.00%) per annum and are fully repayable at their various due dates from 2011 to 2021.
Unsecured revolving credits, bankers’ acceptances and bank overdrafts
The unsecured revolving credits, bankers’ acceptances and bank overdrafts are obtained by the subsidiaries and primarily bear interest at rates ranging from 2.57% to 6.74% (2010: 2.75% to 7.12%) per annum.

PETRONAS Annual Report 2011 163
23. BORROWINGS (continued) Certain borrowings obtained by the Company are on-lent to subsidiaries, associates and jointly controlled entities. At the reporting date, the outstanding amounts on-lent to subsidiaries, associates and jointly controlled entities are as follows:
Company 2011 2010 RM Mil RM Mil Subsidiaries - after twelve months 3,502 3,713 Associates and jointly - within twelve months - 31 controlled entities - after twelve months - 81 - 112
In connection with the long term borrowing facility agreements, the Group and the Company have agreed on the following significant covenants with the lenders:
i. not to allow any material indebtedness (the minimum aggregate amount exceeding US$30,000,000 or its equivalent in any other currency) for borrowed money of the Company to become due or capable of being declared due before its stated maturity, any material guarantee of the Company is not discharged at maturity or when validly called or the Company goes into default under, or commits a breach of, any instrument or agreement relating to any such indebtedness for borrowed money or guarantee and such default or breach remains unpaid or unremedied for a period of 30 days;
ii. the Company (not including any of its subsidiaries) not to create, incur or have outstanding any mortgage, pledge,
lien, charge, encumbrance or any other lien upon the whole or any part of its property or assets, present or future indebtedness of itself or any other person, unless the aggregate outstanding principal amount of all such secured indebtedness (other than indebtedness secured by the liens already in existence) plus attributable debt of the Company in respect of sales and leaseback transactions would not exceed 10% of the consolidated net tangible assets; and
iii. the Company (not including any of its subsidiaries) not to enter into any sale and leaseback transaction, unless the
attributable debt in respect of such sale and leaseback transaction and all other sale and leaseback transaction plus the aggregate outstanding principal amount of indebtedness for borrowed money secured by security interests (other than permitted security interests) then outstanding which have not equally and rateably secured the total outstandings would not exceed 10% of the Company’s tangible net worth provided that, within 12 months after such sale and leaseback transaction, it applies to the retirement of indebtedness for borrowed money the repayment obligations in respect of which are at least pari passu with its repayment obligations hereunder and which are not secured by any security interest, an amount equal to the greater of:
• thenet proceedsof the sale or transfer of theproperty or other assetswhichare the subject of such sale andleaseback transaction as determined by the Company; or
• thefairmarketvalueofthepropertyorotherassetssoleasedasdeterminedbytheCompany.

164 PETRONAS Annual Report 2011
24. ISLAMIC FINANCING FACILITIES
Secured Islamic Financing Facilities
The secured Islamic financing facilities obtained by the subsidiaries comprise: In million 2011 2010Al Bai’bithaman Ajil long term facilities RM2,450 RM3,764Bai’ Al-Dayn Note Issuance Facilities RM399 RM387Al Murabahah Medium Term Notes RM2,200 RM5,700
The secured Islamic financing facilities bear a yield payable ranging from 3.4% to 8.3% (2010: 3.4% to 8.3%) per annum and are fully repayable at their various due dates from 2011 to 2022.
The Islamic financing facilities are secured by way of a charge over certain property, plant and equipment and investment properties.
Unsecured Islamic Financing Facilities
The unsecured Islamic financing facilities obtained by the subsidiaries comprise: In million 2011 2010Murabahah Note Issuance Facilities RM5,000 RM1,500Sukuk Musyarakah RM1,500 RM300Ijarah Muntahiyah Bit Tamleek RM95 RM95Trust Certificates^ US$1,500 US$1,500
^ Obtained by the Company via a subsidiary.
The unsecured Islamic financing facilities bear a yield payable ranging from 3.08% to 6.20% (2010: 3.60% to 6.25%) per annum and are fully repayable at their various due dates from 2011 to 2019.
In the previous year, the Company has obtained the Trust Certificates financing via a subsidiary of the Group (referred to as special purpose vehicle or “SPV”). In relation to this financing arrangement, certain subsidiaries sold their beneficial ownership of property, plant and equipment (“sukuk assets”) with a net book value of RM2,710,383,000 (2010: RM3,034,000,000) to the SPV to hold in trust for and on behalf of the Trust Certificate holders. The SPV then leased this beneficial ownership of the sukuk assets to the Company in accordance with Syariah Principles.

PETRONAS Annual Report 2011 165
25. OTHER LONG TERM LIABILITIES AND PROVISIONS
Group Company 2011 2010 2011 2010 RM Mil RM Mil RM Mil RM MilDismantlement, removal or restoration of property, plant and equipment 22,354 22,683 20,743 21,552 Financial guarantees 425 558 680 899 Derivative liabilities (note 13) 303 298 164 129 Others 1,462 2,243 - - 24,544 25,782 21,587 22,580
Provision for dismantlement, removal or restoration of property, plant and equipment is recognised when there is an obligation to dismantle and remove a facility or an item of property, plant and equipment and to restore the site on which it is located, and when a reasonable estimate of that liability can be made. The amount recognised is the present value of the estimated future costs determined in accordance with local conditions and requirements.
A corresponding asset of an amount equivalent to the provision is also created. This asset is depreciated in accordance with the policy set out in note 2.4.
The increase in the present value of the provision for the expected costs due to the passage of time is included within finance costs.
Most of these removal events are many years in the future and the precise requirements that will have to be met when the removal events actually occurs are uncertain. Because actual timing and cash outflows can differ from estimates due to changes in laws, regulations, public expectations, technology, prices and conditions, the carrying amounts of provisions, together with the interest rate used in discounting the cash flows and inflation rate, are regularly reviewed and adjusted to take account of such changes. The interest rate and inflation rate used to determine the obligation as at 31 March 2011 was 4.42% (2010: 4.42%) and 3.0% (2010: 3.0%) respectively. Changes in the expected future costs are reflected in both the provision and the asset.
The movement of provision for dismantlement, removal or restoration of property, plant and equipment during the financial year are as follows: Group Company RM Mil RM Mil At 1 April 2010 22,683 21,552 Net changes in provision (1,250) (1,677)Provision utilised (7) -Unwinding of discount 962 868 Translation exchange difference (34) -At 31 March 2011 22,354 20,743

166 PETRONAS Annual Report 2011
25. OTHER LONG TERM LIABILITIES AND PROVISIONS (continued)
Net changes in provision includes foreign exchange gains or losses arising from retranslation of the provision and are adjusted against the carrying amount of the corresponding asset accordingly.
During the year, the Group and the Company revised their estimated future costs of dismantlement, removal or restoration of property, plant and equipment resulting from changes in estimated cash flow. The revision was accounted for prospectively as a change in accounting estimates resulting in the following:
i. decrease in provisions by RM1,745,000,000; ii. decrease in net book value of property, plant and equipment by RM675,000,000; andiii. increase in net profits by RM1,070,000,000.
26. TRADE AND OTHER PAYABLES Group Company 2011 2010 2011 2010 RM Mil RM Mil RM Mil RM Mil Trade payables 14,416 13,013 1,050 1,110 Other payables 23,034 18,976 4,187 2,733 Amount due to: Subsidiaries* - - 1,447 1,408 Associates and jointly controlled entities* 343 363 19 1 Derivative liabilities (note 13) 246 35 9 2 38,039 32,387 6,712 5,254
Included in other payables of the Group are security deposits of RM75,929,000 (2010: RM67,462,000) mainly held in respect of tenancies of a shopping centre and office buildings. These deposits are refundable upon termination of the respective lease agreements.
Also included in trade payables and other payables of the Group are retention sums on construction contracts amounting to RM188,180,000 (2010: RM159,110,000) and RM36,201,000 (2010: RM15,338,000) respectively.
* Amount due to subsidiaries, associates and jointly controlled entities arose in the normal course of business.

PETRONAS Annual Report 2011 167
27. GROSS PROFIT
Group Company 2011 2010 2011 2010 RM Mil RM Mil RM Mil RM MilRevenue - sales of oil and gas 226,496 195,366 78,014 66,392 - others 1,154 1,465 - - 227,650 196,831 78,014 66,392 - rendering of services 2,914 2,990 48 50 - shipping and shipping related services 6,726 7,482 - - - sale and rental of properties 791 826 - - 10,431 11,298 48 50 - dividend income in Malaysia (Quoted) - subsidiaries - - 2,190 1,765 - associates - - 49 54 - investments 13 10 13 10 in Malaysia (Unquoted) - subsidiaries - - 14,008 13,263 - associates - - 263 122 - investments 57 35 57 35 outside Malaysia (Quoted) - investments 285 243 - - 355 288 16,580 15,249 - interest income 2,792 2,380 1,898 1,711 241,228 210,797 96,540 83,402 Cost of revenue - cost of sales (136,189) (119,882) (42,797) (37,996)- cost of services (7,238) (8,565) - - (143,427) (128,447) (42,797) (37,996) Gross profit 97,801 82,350 53,743 45,406

168 PETRONAS Annual Report 2011
28. OPERATING PROFIT
Group Company 2011 2010 2011 2010 RM Mil RM Mil RM Mil RM Mil (Restated) (Restated)Included in operating profit are the following charges: Audit fees 30 30 1 1 Amortisation of: - intangible assets 305 154 - - - prepaid lease payments 25 23 - - Bad debts written off: - trade and other receivables 73 23 56 - Contribution to Tabung Amanah Negara 500 100 500 100 Depreciation of property, plant and equipment and investment properties 12,211 12,697 588 643 Goodwill written off 28 67 - - Impairment losses on: - property, plant and equipment 4,267 2,640 - - - intangible assets 1,363 144 - - - trade and other receivables - 195 - 86 - receivables from subsidiaries - - - 113 - loan and advances to associates, jointly controlled entities and subsidiaries 49 5 277 27 - investments in subsidiaries - - - 828 - investments in associates and jointly controlled entities 34 11 - - - unquoted shares - 3 - - Inventories: - written down to net realisable value 61 2 - - - written off 46 14 - - Loss on disposal of property, plant and equipment 1,564 50 - - Net loss on foreign exchange 1,050 1,330 2,817 3,056 Operating lease rental 212 301 411 344 Property, plant and equipment: - written off 118 66 - - - expensed off 19 17 2 1 Rental of: - land and buildings 442 305 36 23 - plant, machinery, equipment and motor vehicles 527 586 21 50 Research and development expenditure 85 64 33 36 Staff costs - wages, salaries and others 7,008 6,233 624 583 - contributions to Employee’s Provident Fund 760 704 128 116

PETRONAS Annual Report 2011 169
28. OPERATING PROFIT (continued)
Group Company 2011 2010 2011 2010 RM Mil RM Mil RM Mil RM Mil (Restated) (Restated)and credits: Gain on disposal of: - property, plant and equipment 148 19 - - - subsidiaries, associates and jointly controlled entities 291 - 7,200 - - other investments - 2 - -Net gain from subsidiaries’ initial public offering (note 46) 9,190 - 7,275 -Interest income - others 164 63 2,886 3,313 Negative goodwill 51 141 - -Reversal of write down of inventories to net realisable value 12 15 - -Rental income on land and buildings 160 158 130 122 Reversal of contingent payment 607 762 - -Write back of impairment losses on: - property, plant and equipment 146 - - - - investments in subsidiaries - - 309 - - investments in associates and jointly controlled entities 15 - 84 - - trade and other receivables 168 - 26 - - receivables from subsidiaries - - 161 -

170 PETRONAS Annual Report 2011
29. OPERATING LEASES
Total future minimum lease payments under non-cancellable operating leases are as follows:
Group Company 2011 2010 2011 2010 RM Mil RM Mil RM Mil RM Mil Less than one year 678 2,183 349 349 Between one and five years 3,109 3,195 175 524 More than five years 4,347 2,393 - - 8,134 7,771 524 873
30. TAX EXPENSE
Group Company 2011 2010 2011 2010 RM Mil RM Mil RM Mil RM MilCurrent tax expenses Malaysia Current year 24,909 20,583 14,849 12,029 Prior year 215 (1,926) 393 (691) Overseas Current year 2,321 1,514 - - Prior year 23 36 - -Total current tax expenses 27,468 20,207 15,242 11,338 Deferred tax expense Origination and reversal of temporary differences 296 1,114 (519) (665) (Over)/under provision in prior year (276) 490 196 296 Total deferred tax expenses 20 1,604 (323) (369)Total tax expenses 27,488 21,811 14,919 10,969

PETRONAS Annual Report 2011 171
30. TAX EXPENSE (continued)
A reconciliation of income tax expense applicable to profit before taxation at the statutory income tax rate to income tax expense at the effective income tax rate of the Group and of the Company is as follows:
2011 2010 % RM Mil % RM MilGroup
Profit before taxation 90,496 67,300 Taxation at Malaysian statutory tax rate 25 22,624 25 16,825 Effect of different tax rates in foreign jurisdictions 1 992 2 1,219 Effect of different tax rates between corporate income tax and petroleum income tax 5 4,672 6 4,342 Effect of changes in tax rates - 37 - (23)Non deductible expenses, net of non assessable income 5 4,412 7 4,581 Net gain from initial public offering, non assessable income (3) (2,298) - -Tax exempt income (3) (2,632) (6) (3,844)Tax incentives - (134) - (74)Effect of deferred tax benefits not recognised net of utilisation of deferred tax benefits previously not recognised - 88 1 430 Foreign exchange translation difference - (235) - (245) 30 27,526 35 23,211 Over provision in prior years (38) (1,400)Tax expense 27,488 21,811
Company
Profit before taxation 65,391 40,131 Taxation at Malaysian statutory tax rate 25 16,348 25 10,033 Effect of different tax rates between corporate income tax and petroleum income tax 7 4,650 10 3,877 Non deductible expenses, net of non assessable income 1 586 2 946 Net gain from initial public offering, non assessable income (including related gain on disposal) (6) (3,619) - -Tax exempt income (6) (3,635) (9) (3,492) 21 14,330 28 11,364 Under/(over) provision in prior years 589 (395)Tax expense 14,919 10,969

172 PETRONAS Annual Report 2011
31. DIVIDENDS Company 2011 2010 RM Mil RM Mil
Ordinary: Final: 2010 - Tax exempt dividend of RM100,000 (2009 : RM100,000) per ordinary share under Section 84 of the Petroleum (Income Tax) Act, 1967 10,000 10,000
Interim: 2011 - First tax exempt dividend of RM60,000 (2010 : RM60,000) per ordinary share under Section 84 of the Petroleum (Income Tax) Act, 1967 6,000 6,000 2011 - Second tax exempt dividend of RM80,000 (2010 : RM80,000) per ordinary share under Section 84 of the Petroleum (Income Tax) Act, 1967 8,000 8,000 2011 - Third tax exempt dividend of RM60,000 (2010: RM60,000) per ordinary share under Section 84 of the Petroleum (Income Tax) Act,1967 6,000 6,000 30,000 30,000 Proposed: Final: 2011 - Tax exempt dividend of RM220,000 (2010: RM100,000) per ordinary share under Section 84 of the Petroleum (Income Tax) Act, 1967 22,000 10,000
The proposed tax exempt final dividend under Section 84 of the Petroleum (Income Tax) Act, 1967 of RM220,000 per ordinary share amounting to RM22 billion in respect of the financial year ended 31 March 2011, has not been accounted for in the financial statements.

PETRONAS Annual Report 2011 173
32. NET CASH (USED IN)/GENERATED FROM INVESTING ACTIVITIES
The cash (used in)/generated from investing activities comprise: Group Company 2011 2010 2011 2010 RM Mil RM Mil RM Mil RM MilAcquisition of: - subsidiaries, net of cash acquired (note 34) (1,180) (2,253) - - - additional shares in subsidiaries - (132) - (5,968)Dividends received 355 288 15,592 11,712 Investment in: - associates, jointly controlled entities and unquoted companies (2,688) (361) - (72) - securities (13,951) (9,743) (13,732) (9,351)Long term receivables and advances (to)/ repaid from: - subsidiaries - - (5,885) (11,808) - associates and jointly controlled entities 1,008 (667) 179 70 Net cost incurred in property development cost (68) (180) - -Other long term receivables (829) (36) - -Proceeds from disposal of: - investment in associates and jointly controlled entities 9 - - - - property, plant and equipment, prepaid lease payments and intangible assets 3,560 1,247 - - - securities 2,677 26,595 2,573 25,665 Proceeds from initial public offering 16,773 - 11,144 -Purchase of: - property, plant and equipment, prepaid lease payments and intangible assets (34,877) (37,090) (18) (46) - other investments (52) (1,246) - -Redemption of preference shares in: - subsidiaries - - 48 692 - associates 80 294 80 200 (29,183) (23,284) 9,981 11,094

174 PETRONAS Annual Report 2011
33. NET CASH USED IN FINANCING ACTIVITIES The cash used in financing activities comprise:
Group Company 2011 2010 2011 2010 RM Mil RM Mil RM Mil RM Mil Dividends paid (30,000) (30,000) (30,000) (30,000)Dividends paid to minority (6,529) (5,283) - -Drawdown of: - Islamic financing facilities 1,193 7,713 - 5,269 - term loans, notes and bonds 1,030 10,995 - 10,424 - revolving credits and bankers’ acceptances 3,020 5,751 - -Repayment of: - Islamic financing facilities (1,046) (1,950) - - - term loans, notes and bonds (984) (4,548) - - - revolving credits and bankers’ acceptances (3,269) (6,045) - -Payment to minority shareholders on redemption of shares (28) (17) - -Proceeds from shares issued to minority shareholders - 1,955 - - (36,613) (21,429) (30,000) (14,307)
34. SIGNIFICANT ACQUISITIONS
i. Significant acquisitions of subsidiaries
Ethylene Malaysia Sdn. Bhd. (“EMSB”) and Polyethylene Malaysia Sdn. Bhd. (“PEMSB”)
On 2 September 2010, the Group acquired additional equity interest in EMSB and PEMSB for a total purchase consideration of USD272.4 million (approximately RM851.8 million) via a share purchase agreement with BP Chemicals Investment Limited (“BP Chemicals”). On 8 October 2010, the Group acquired another 2.21% additional stake in EMSB from BP Chemicals for USD37.1 million (approximately RM115.0 million).
As a result, the Group increased its equity interest in EMSB from 72.5% to 87.5% while PEMSB which was previously a jointly controlled entity become a wholly-owned subsidiary of the Group. The net profits contributed by the additional equity holdings in PEMSB from the date of acquisition to the year ended 31 March 2011 is not material in relation to the Group consolidated net profit for the year.
Other acquisition of subsidiaries
During the year, the Group also acquired several other companies for a total purchase consideration of RM332 million. As a result, these companies became subsidiaries of the Group. The net profits contributed by these companies from the date of acquisition to the year ended 31 March 2011 is not material in relation to the consolidated net profit for the year.

PETRONAS Annual Report 2011 175
34. SIGNIFICANT ACQUISITIONS (continued)
i. Significant acquisitions of subsidiaries (continued)
The net effect of acquisitions of subsidiaries on the cash flows and fair values of assets and liabilities acquired are as follows:
At initial Fair value At recognition adjustment fair value RM Mil RM Mil RM Mil Property, plant and equipment 483 - 483 Intangible assets 5 564 569 Cash and cash equivalents 119 - 119 Other assets 447 - 447 Deferred taxation (24) (227) (251) Other liabilities (722) - (722) 308 337 645 Add : Share of fair value of net identifiable assets relating to additional equity interests in subsidiary 292 Less : Interests previously held as jointly controlled entities (29) 908 Add : Goodwill on acquisition 442 Less : Negative goodwill on acquisition (51) Purchase consideration 1,299 Less : Cash and cash equivalents of subsidiaries acquired (119) Cash flow on acquisition, net of cash acquired (note 32) 1,180
ii. Significant acquisition of jointly controlled entity
On 17 May 2010, the Group via its subsidiary, MISC Berhad, acquired 50% equity interest in VTTI B.V., a company incorporated in Netherlands, for a purchase consideration of USD882 million (approximately RM2,669 million) via Sale and Purchase Agreement (“SPA”) with Martank B.V., a wholly-owned subsidiary of Vitol Holding B.V. The share of profit contributed by VTTI B.V. from the date of acquisition to the year ended 31 March 2011 is not material in relation to the consolidated net profit for the year.

176 PETRONAS Annual Report 2011
35. COMMITMENTS
Outstanding commitments in respect of capital expenditure at the end of the reporting period not provided for in the financial statements are:
Group Company 2011 2010 2011 2010 RM Mil RM Mil RM Mil RM Mil Property, plant and equipment Approved and contracted for Less than one year 10,824 19,293 15 75 Between one and five years 16,086 4,030 337 182 More than five years 67 - - - 26,977 23,323 352 257 Approved but not contracted for Less than one year 20,027 13,245 17 170 Between one and five years 37,338 35,743 23 484 More than five years 2,461 10 2,451 - 59,826 48,998 2,491 654 86,803 72,321 2,843 911
Share of capital expenditure of joint venture Approved and contracted for Less than one year 10,401 4,342 - - Between one and five years 6,121 1,848 - - 16,522 6,190 - - Approved but not contracted for Less than one year 5,354 11,951 - - Between one and five years 49,310 34,523 - - 54,664 46,474 - - 71,186 52,664 - - Investment in shares Approved and contracted for Less than one year 79 305 - - Approved but not contracted for Less than one year 547 306 - - 626 611 - - Total commitments 158,615 125,596 2,843 911

PETRONAS Annual Report 2011 177
36. CONTINGENT LIABILITIES (UNSECURED)
Group Company 2011 2010 2011 2010 RM Mil RM Mil RM Mil RM Mil Guarantees extended to third parties 155 638 - -Claims filed by/disputes with various parties 3 277 3 -Contingent payments 258 210 - - 416 1,125 3 -
The Terengganu and Kelantan States Government filed legal suits against the Company in the year 2000 and 2010 respectively claiming that they were entitled to certain cash payments arising out of the production of crude oil and gas beyond the territorial waters of the States concerned. The amount of the cash payments has been fully accounted for in the financial statements. The legal suits are still on-going as at year end.
37. RELATED PARTY DISCLOSURES
Key management personnel compensation
Company 2011 2010 RM Mil RM MilDirectors remuneration: - Emoluments 15 9
The Company also paid fees to certain Directors amounting to RM2,189,000 (2010: RM167,500).
The estimated monetary value of Directors’ benefits-in-kind is RM152,000 (2010: RM118,300).
Significant transactions with related parties
For the purpose of these financial statements, parties are considered to be related to the Company if the Company has the ability, directly or indirectly, to control the party or exercise significant influence over the party in making financial and operating decisions, or vice versa. Related parties may be individuals or other entities.

178 PETRONAS Annual Report 2011
37. RELATED PARTY DISCLOSURES (continued)
Significant transactions with related parties (continued)
In addition to the transactions detailed elsewhere in the financial statements, the Group and the Company had the following transactions with related parties during the financial year: 2011 2010 Group RM Mil RM Mil Associate companies: Sales of petrochemical products, processed gas and utilities 3,795 2,902 Lease and rental expenses (247) (145) Other expenses (174) (167) Other income 22 2 Jointly controlled entities: Sales of petrochemical products, processed gas, petroleum products and general merchandise 178 676 Purchase of petrochemical products, processed gas and utilities (310) (760) Interest receivable from jointly controlled entities 91 73 Gas processing fee payable (279) (339) Other income 141 3 Company Subsidiaries: Sales of crude oil, petroleum products and natural gas 43,597 39,711 Interest receivable from subsidiaries 2,135 1,903 Purchase of crude oil and natural gas (18,489) (17,586) Gas processing fee payable (2,747) (2,020) Research cess 107 105 Supplemental payments 3,127 2,292 Handling and storage fees (41) (37) Associate companies: Sales of processed gas 1,375 1,359 Jointly controlled entities: Interest receivable from jointly controlled entities 5 14 Gas processing fee payable (279) (339)

PETRONAS Annual Report 2011 179
37. RELATED PARTY DISCLOSURES (continued)
Significant transactions with related parties (continued)
Information regarding outstanding balances arising from related party transactions as at 31 March 2011 are disclosed in note 11, note 18 and note 26.
Information regarding impairment losses on receivables and bad debts written off during the financial year are disclosed in note 28.
The Directors of the Company are of the opinion that the above transactions have been entered into in the normal course of business and have been established on a commercial basis. The above has been stated at contracted amount.
38. OPERATING SEGMENTS
The Group has four reportable segments, as described below, which offer different products and services and are managed separately because they require different technology and marketing strategies. The following summary describes the operations in each of the Group’s reportable segments:
• Explorationandproduction-activitiesincludeoilandnaturalgasexploration,developmentandproduction,togetherwith related pipeline and transportation activities.
• Gasandpower-activitiesincludegasprocessingandmarketingandtradingofliquefiednaturalgas(LNG)andsalesgas.
• Downstream-activitiesincludethesupplyandtrading,refining,manufacturing,marketingandtransportationofcrudeoil, petroleum and petrochemical products.
• Corporate and others - comprise primarily logistic and maritime segment, property segment and central treasuryfunction.
For each of the reportable segment, the Group chief operating decision maker, which in this case is the PETRONAS Executive Committee, reviews internal management reports at least on a quarterly basis.
Performance is measured based on segment net operating profit after tax (“NOPAT”), which is derived from net profit after tax excluding financing cost, share of profits of associates and jointly controlled entities and other non-operating income and expenses, as included in the internal management reports. Segment NOPAT is used to measure performance as the Executive Committee believes that such information is the most relevant in evaluating the results of the segments.
Segment assets are measured based on total assets (including goodwill) of a segment, as included in the internal management reports and are used to measure the return of assets of each segment.

180 PETRONAS Annual Report 2011
38. OPERATING SEGMENTS (continued)
Group Consolidation 2011 Exploration Corporate adjustments and Gas and and and Production Power Downstream Others eliminations Total RM Mil RM Mil RM Mil RM Mil RM Mil RM Mil Revenue Third parties 43,263 57,027 128,466 12,472 - 241,228 Inter-segment 50,010 6,945 1,520 6,730 (65,205) - Total revenue 93,273 63,972 129,986 19,202 (65,205) 241,228 Reportable segment profit 33,969 11,229 7,175 1,385 (1,145) 52,613 Included in the measure of segment profit are: Depreciation and amortisation (5,339) (2,488) (2,687) (2,027) - (12,541) Impairment losses (1,796) (1,898) (1,339) (631) - (5,664) Tax expense (20,116) (4,744) (1,582) (1,046) - (27,488) Segment assets 135,528 60,167 82,085 175,404 (14,190) 438,994 Included in the measure of segment assets are: Investments in associates and JCEs 2,278 4,587 1,018 3,678 - 11,561 Additions to non-current assets other than financial instruments and deferred tax assets 22,559 3,593 2,098 5,869 - 34,119

PETRONAS Annual Report 2011 181
38. OPERATING SEGMENTS (continued)
Consolidation Group Exploration Corporate adjustments 2010 and Gas and and and Production Power Downstream Others eliminations Total RM Mil RM Mil RM Mil RM Mil RM Mil RM Mil Revenue Third parties 35,833 47,565 114,105 13,294 - 210,797 Inter-segment 45,663 6,057 1,291 7,691 (60,702) - Total revenue 81,496 53,622 115,396 20,985 (60,702) 210,797 Reportable segment profit 30,776 8,912 4,788 883 (830) 44,529 Included in the measure of segment profit are: Depreciation and amortisation (5,875) (2,897) (2,003) (2,099) - (12,874) Impairment losses (943) (1,183) (78) (591) - (2,795) Tax expense (16,166) (3,398) (1,707) (540) - (21,811) Segment assets 134,796 55,808 73,607 170,016 (23,342) 410,885 Included in the measure of segment assets are: Investments in associates and JCEs 2,150 4,264 1,135 823 - 8,372 Additions to non-current assets other than financial instruments and deferred tax assets 26,084 2,463 3,766 5,848 - 38,161
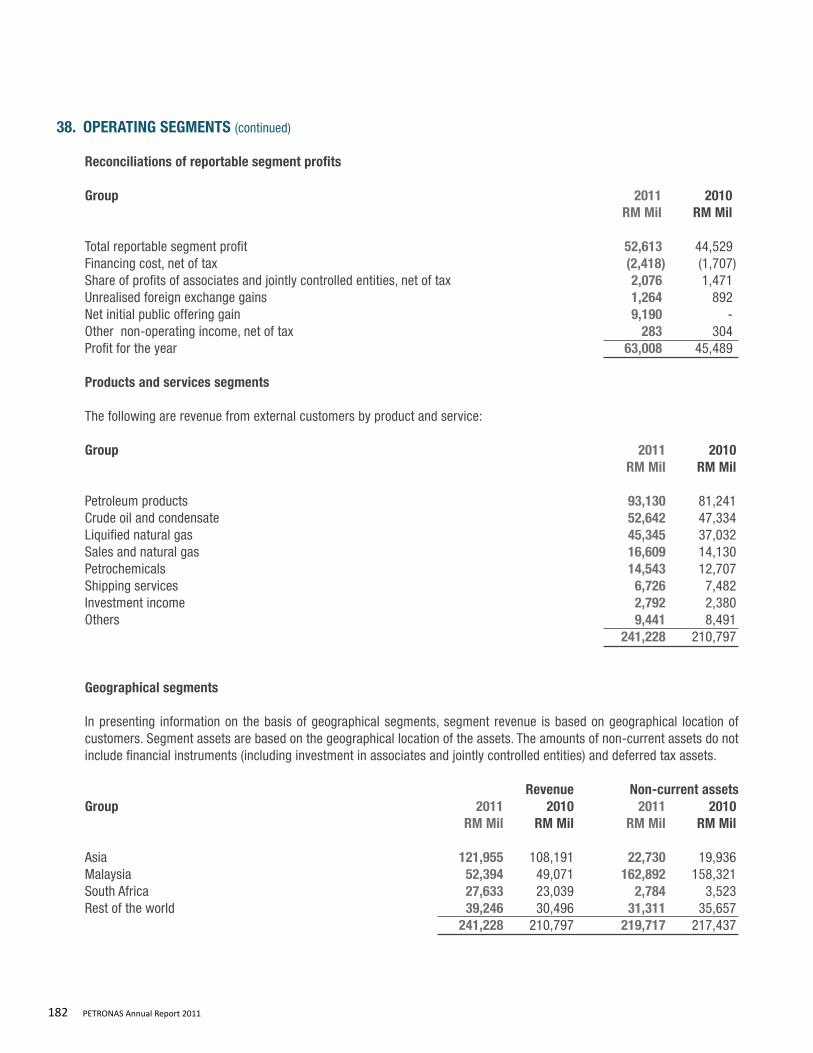
182 PETRONAS Annual Report 2011
38. OPERATING SEGMENTS (continued)
Reconciliations of reportable segment profits
Group 2011 2010 RM Mil RM Mil Total reportable segment profit 52,613 44,529 Financing cost, net of tax (2,418) (1,707)Share of profits of associates and jointly controlled entities, net of tax 2,076 1,471 Unrealised foreign exchange gains 1,264 892 Net initial public offering gain 9,190 -Other non-operating income, net of tax 283 304 Profit for the year 63,008 45,489
Products and services segments
The following are revenue from external customers by product and service: Group 2011 2010 RM Mil RM Mil Petroleum products 93,130 81,241 Crude oil and condensate 52,642 47,334 Liquified natural gas 45,345 37,032 Sales and natural gas 16,609 14,130 Petrochemicals 14,543 12,707 Shipping services 6,726 7,482 Investment income 2,792 2,380 Others 9,441 8,491 241,228 210,797
Geographical segments
In presenting information on the basis of geographical segments, segment revenue is based on geographical location of customers. Segment assets are based on the geographical location of the assets. The amounts of non-current assets do not include financial instruments (including investment in associates and jointly controlled entities) and deferred tax assets.
Revenue Non-current assets Group 2011 2010 2011 2010 RM Mil RM Mil RM Mil RM Mil Asia 121,955 108,191 22,730 19,936 Malaysia 52,394 49,071 162,892 158,321 South Africa 27,633 23,039 2,784 3,523 Rest of the world 39,246 30,496 31,311 35,657 241,228 210,797 219,717 217,437

PETRONAS Annual Report 2011 183
38. OPERATING SEGMENTS (continued)
Major customers
As at 31 March 2011, there are no major customers with revenue that contribute to more than 10 percent of Group revenue.
39. PRODUCTION SHARING CONTRACTS (the “PSC”)
The Petroleum Development Act, 1974 vests the entire ownership, rights, powers, liberties and privileges of exploiting petroleum resources on land and offshore Malaysia in PETRONAS. The exploitation by PETRONAS of petroleum resources is carried out by means of production sharing contracts with international oil and gas companies and with its subsidiaries. Under the terms of the various PSCs that PETRONAS has entered into, the PSC Contractors bear all costs. The PSC Contractors may recover their costs in barrels of crude oil or gas equivalent in accordance with the terms of their respective PSCs.
Certain terms of the PSCs are:
i. Research cess, supplemental payments and crude oil or gas entitlement
The determination of research cess, supplemental payments, and PETRONAS’ and the contractors’ entitlements to crude oil or gas produced subsequent to 31 December 1992 have been based on the returns submitted by contractors and is dependent on agreement being reached on the method of valuation of crude oil or gas and the quantum of costs incurred and claimed by contractors subject to the maximum rate provided under the production sharing contracts for the year. PETRONAS’ entitlements to crude oil and natural gas are taken up as income on the basis of liftings and sales respectively made by the Company.
ii. Property, plant and equipment
Title to all equipment and other assets purchased or acquired by PSC Contractors exclusively for the purpose of petroleum operations, and which costs are recoverable in barrels of cost oil or gas equivalent, vested with PETRONAS. However, the values of these assets are not taken up in the financial statements of PETRONAS other than:
• theproperty,plantandequipmentofasubsidiarywhichisalsoacontractortoPETRONASundercertainPSCs;and
• thecostsofdismantlingandremovingtheassetsandrestoringthesiteonwhichtheyarelocatedwherethereisanobligation to do so.
iii. Inventories
Title to all crude oil held in inventories by the PSC Contractors lies with PETRONAS and title to the contractors’ entitlement passes only upon delivery at point of export. However, the values of these inventories are not taken up in the financial statements of PETRONAS.

184 PETRONAS Annual Report 2011
40. FINANCIAL INSTRUMENTS
Categories of financial instruments
The table below provides an analysis of financial instruments categorised as follows:
i. Loans and receivables (“L&R”)ii. Fair value through profit or loss (“FVTPL”) - Designated upon initial recognition (“DUIR”) - Held for trading (“HFT”)iii. Available-for-sale financial assets (“AFS”)iv. Loans and borrowings (“L&B”)
Group Total2011 L&R/ FVTPL FVTPL carrying (L&B) - DUIR - HFT AFS amount Note RM Mil RM Mil RM Mil RM Mil RM MilFinancial assets Long term receivables * 2,636 - 433 - 3,069 Fund and other investments 12 682 12,404 - 36,607 49,693 Trade and other receivables * 32,794 - 78 - 32,872 Cash and cash equivalents 15 106,664 - - - 106,664 142,776 12,404 511 36,607 192,298 Financial liabilities Borrowings 23 (47,811) - - - (47,811) Other long term liabilities * (425) - (303) - (728) Trade and other payables * (36,945) - (246) - (37,191) Dividend payable (6,000) - - - (6,000) (91,181) - (549) - (91,730)
2010
Financial assets Long term receivables * 2,579 - 398 - 2,977 Fund and other investments 12 737 7,952 - 28,260 36,949 Trade and other receivables * 27,166 - 63 - 27,229 Cash and cash equivalents 15 104,125 - - - 104,125 134,607 7,952 461 28,260 171,280 Financial liabilities Borrowings 23 (51,870) - - - (51,870) Other long term liabilities * (558) - (298) - (856) Trade and other payables * (31,601) - (35) - (31,636) Dividend payable (6,000) - - - (6,000) (90,029) - (333) - (90,362)
* These balances exclude non-financial instruments balances.
Certain fund and other investments have been designated upon initial recognition as at fair value through profit or loss as management internally monitors these investments on fair value basis.

PETRONAS Annual Report 2011 185
40. FINANCIAL INSTRUMENTS (continued)
Categories of financial instruments (continued)
TotalCompany L&R/ FVTPL FVTPL carrying2011 (L&B) - DUIR - HFT AFS amount Note RM Mil RM Mil RM Mil RM Mil RM MilFinancial assets Long term receivables * 70,150 - 1,663 - 71,813 Fund and other investments 12 - 13,079 - 18,812 31,891 Trade and other receivables * 12,499 - 17 - 12,516 Cash and cash equivalents 15 58,164 - - - 58,164 140,813 13,079 1,680 18,812 174,384 Financial liabilities Borrowings 23 (26,591) - - - (26,591) Other long term liabilities * (680) - (164) - (844) Trade and other payables * (6,661) - (9) - (6,670) Dividend payable (6,000) - - - (6,000) (39,932) - (173) - (40,105)
2010 Financial assets Long term receivables * 73,076 - 1,219 - 74,295 Fund and other investments 12 - 8,761 - 11,807 20,568 Trade and other receivables * 14,835 - 21 - 14,856 Cash and cash equivalents 15 56,677 - - - 56,677 144,588 8,761 1,240 11,807 166,396 Financial liabilities Borrowings 23 (28,621) - - - (28,621) Other long term liabilities * (899) - (129) - (1,028) Trade and other payables * (5,235) - (2) - (5,237) Dividend payable (6,000) - - - (6,000) (40,755) - (131) - (40,886)
* These balances exclude non-financial instruments balances.

186 PETRONAS Annual Report 2011
40. FINANCIAL INSTRUMENTS (continued)
Categories of financial instruments (continued)
The fair value of borrowings is shown on page 200. For all other financial instruments, the carrying amount is either the fair value, or are not materially different from the fair value.
The fair value movements for financial assets categorised as at fair value through profit or loss are mainly attributable to changes in market price.
Financial risk management
As an integrated oil and gas company, the Group and the Company are exposed to various risks that are particular to its core business of exploration and production, gas and power and downstream operations. These risks, which arise in the normal course of the Group’s and of the Company’s business, comprise credit risk, liquidity risk and market risk relating to interest rates, foreign currency exchange rates, equity prices and commodity prices.
The Group has policies and guidelines in place that sets the foundation for a consistent approach towards establishing an effective financial risk management across the PETRONAS Group.
The Group and the Company’s goal in risk management are to ensure that the management understands, measures and monitors the various risks that arise in connection with their operations. Policies and guidelines have been developed to identify, analyse, appraise and monitor the dynamic risks facing the Group and the Company. Based on this assessment, each business unit adopts appropriate measures to mitigate these risks in accordance with the business unit’s view of the balance between risk and reward.
Credit risk
Credit risk is the potential exposure of the Group and of the Company to losses in the event of non-performance by counterparties. The Group and the Company’s exposures to credit risk arise principally from their receivables from customers, investment securities and financial guarantees given to financial institutions for credit facilities granted to subsidiaries, jointly controlled entities and associates. Credit risks are controlled by individual operating units in line with PETRONAS’ policies and guidelines.
Receivables
The Group and the Company minimise credit risk by entering into contracts with highly credit rated counterparties. Potential counterparties are subject to credit assessment and approval prior to any transaction being concluded and existing counterparties are subject to regular reviews, including re-appraisal and approval of granted limits. The creditworthiness of counterparties is assessed based on an analysis of all available quantitative and qualitative data regarding business risks and financial standing, together with the review of any relevant third party and market information. Reports are prepared and presented to the management that cover the Group’s overall credit exposure against limits and securities, exposure by segment and overall quality of the portfolio.
Depending on the types of transactions and counterparty creditworthiness, the Group and the Company further mitigate and limit risks related to credit by requiring collateral or other credit enhancements such as cash deposits, letter of credit and bank guarantees.

PETRONAS Annual Report 2011 187
40. FINANCIAL INSTRUMENTS (continued)
Receivables (continued)
Exposure to losses increases with concentrations of credit risk which may exist when a number of counterparties are involved in similar activities or operate in the same industry sector or geographical area, which may result in their ability to meet contractual obligations being impacted by changes in economic, political or other conditions. The Group’s principal customers with which it conducts business are located throughout the world and there is no significant concentration of credit risk at reporting date.
As at the end of the reporting period, the maximum exposure to credit risk arising from receivables is equal to the carrying amount. The ageing of trade receivables net of impairment amount as at the end of the reporting period is analysed below:
Group Company 2011 2010 2011 2010 RM Mil RM Mil RM Mil RM Mil At net Current 21,306 17,511 2,760 2,286 Past due 1 to 30 days 1,002 397 27 24Past due 31 to 60 days 579 417 25 47 Past due 61 to 90 days 288 72 25 21 Past due more than 90 days 848 826 139 128 24,023 19,223 2,976 2,506 Representing: Trade receivables (note 18) 24,451 20,091 3,066 2,995 Less: Impairment losses (note 18) (428) (868) (90) (489) 24,023 19,223 2,976 2,506
With respect to the Group’s trade receivables, there are no indications as of the reporting date that the debtors will not meet their payment obligations except for impairment losses recognised below. Certain receivables past due are secured by bank guarantees and cash deposits valued at RM19,384,000 (2010: RM7,233,000).
The movements in the allowance for impairment losses of trade receivables during the year are as follows:
Group Company RM Mil RM Mil RM Mil RM Mil 2011 2010 2011 2010 Opening balance 868 707 489 411(Reversal)/ Impairment loss recognised (41) 195 - 78 Impairment written off (399) (34) (399) -Closing balance 428 868 90 489

188 PETRONAS Annual Report 2011
40. FINANCIAL INSTRUMENTS (continued)
Fund and other investment
The Group and the Company are also exposed to counterparty credit risk from financial institutions through fund investment activities comprising primarily money market placement and investments in bonds, and trade facilities. These exposures are managed in accordance with existing policies and guidelines that defines the parameters within which the investment activities shall be undertaken in order to achieve the Group’s investment objective of preserving capital and generating optimal returns above appropriate benchmarks within allowable risk parameters.
Investments are only made with approved counterparties who met the appropriate rating and other relevant criteria, and within approved credit limits, as stipulated in the policies and guidelines. The treasury function undertakes a credit risk management activities similar to the credit management and monitoring procedures for receivables.
As at the reporting date, the Group and the Company has invested 97% (2010: 94%) of the investments in domestic securities and 3% (2010: 6%) in foreign securities.
The fund and other investments are unsecured, however, in view of the sound credit rating of counterparties, management does not expect any counterparty to fail to meet its obligation.
Financial guarantees
The Group and the Company provide unsecured financial guarantees to banks in respect of banking facilities granted to certain subsidiaries, jointly controlled entities and associates (“Group entities”). The Group and the Company monitor on an ongoing basis, the results of the Group entities and repayments made by the Group entities.
The maximum exposure to credit risk amounted to RM4,890,000,000 (2010: RM4,550,000,000) which represents the outstanding banking facilities of the Group entities as at reporting date. As at reporting date, there was no indication that any Group entities would default on repayment. The fair value of the financial guarantee recognised is disclosed in note 25.
Liquidity Risk
Liquidity risk is the risk that suitable sources of funding for the Group’s business activities may not be available. In managing its liquidity risk, the Group maintains sufficient cash and liquid marketable assets. The Company’s current credit rating enables it to access banking facilities in excess of current and immediate future requirements of the Group and of the Company. The Group’s borrowing power is not limited by its Articles of Association. However, certain covenants included in agreements impose limited restrictions on some of the debt level of PETRONAS’ subsidiaries.
Maturity analysis
The table below summarises the maturity profile of the Group’s and of the Company’s financial liabilities as at the reporting date based on undiscounted contractual payments:

PETRONAS Annual Report 2011 189
40. FINANCIAL INSTRUMENTS (continued)
Maturity analysis (continued) Contractual Group Carrying interest rates Contractual Within2011 amount per annum cash flows 1 year RM Mil % RM Mil RM MilLoans and borrowings Secured Term Loans USD fixed rate loan 823 5.39 933 206 USD floating rate loan 1,222 4.08 1,322 432 RM fixed rate loan 539 6.52 665 59 RM floating rate loan 466 3.01 544 36 Other fixed rate loan 15 7.75 17 6 Unsecured Term Loans USD floating rate loan 3,302 3.85 3,621 144 RM fixed rate loan 1,378 4.83 1,554 484 RM floating rate loan 182 3.61 281 25 EURO fixed rate loan 15 5.16 17 3 EURO floating rate loan 3,663 3.40 4,284 144 BAHT floating rate loan 71 2.97 78 30 Other fixed rate loan 34 6.75 56 9 Other floating rate loan 58 9.34 63 23 Unsecured Notes and Bonds USD Notes 11,220 7.07 14,757 794 USD Guaranteed Notes 8,984 5.25 12,972 477 USD Bonds 3,405 7.69 5,839 262 JPY Bonds 586 3.40 633 20 Unsecured revolving credits BAHT revolving credits 92 2.93 94 94 RM revolving credits 182 3.20 188 188 Unsecured bankers’ acceptances RM bankers’ acceptances 41 3.05 42 42 Unsecured bank overdrafts EURO bank overdrafts 39 7.00 42 42 ZAR bank overdrafts 36 6.80 38 38 Secured Islamic financing facilities RM Islamic financing facilities 2,971 6.33 3,427 753 Unsecured Islamic financing facilities USD Islamic financing facilities 4,536 4.25 5,185 193 RM Islamic financing facilities 3,951 4.48 4,532 1,377
Trade and other payables 36,945 - 36,945 36,945 Dividend payable 6,000 - 6,000 6,000 Fair value through profit or loss – held for trading Derivative liabilities 549 - 549 246 91,305 104,678 49,072
continue to next page

190 PETRONAS Annual Report 2011
40. FINANCIAL INSTRUMENTS (continued)
Maturity analysis (continued)
Group More than2011 1-2 years 2-5 years 5 years RM Mil RM Mil RM MilLoans and borrowings Secured Term Loans USD fixed rate loan 200 482 45 USD floating rate loan 345 545 - RM fixed rate loan 58 528 20 RM floating rate loan 35 412 61 Other fixed rate loan 11 - - Unsecured Term Loans USD floating rate loan 152 3,325 - RM fixed rate loan 359 711 - RM floating rate loan 25 70 161 EURO fixed rate loan 2 7 5 EURO floating rate loan 128 4,012 - BAHT floating rate loan 31 17 - Other fixed rate loan 3 12 32 Other floating rate loan 20 20 - Unsecured Notes and Bonds USD Notes 6,484 2,989 4,490 USD Guaranteed Notes 477 1,430 10,588 USD Bonds 262 2,586 2,729 JPY Bonds 20 593 - Unsecured revolving credits BAHT revolving credits - - - RM revolving credits - - - Unsecured bankers’ acceptances RM bankers’ acceptances - - - Unsecured bank overdrafts EURO bank overdrafts - - - ZAR bank overdrafts - - - Secured Islamic financing facilities RM Islamic financing facilities 586 788 1,300 Unsecured Islamic financing facilities USD Islamic financing facilities 193 4,799 - RM Islamic financing facilities 1,199 1,203 753
Trade and other payables - - -Dividend payable - - - Fair value through profit or loss – held for trading Derivative liabilities 2 301 - 10,592 24,830 20,184
continued from previous page

PETRONAS Annual Report 2011 191
40. FINANCIAL INSTRUMENTS (continued)
Maturity analysis (continued) ContractualGroup Carrying interest rates Contractual Within 2010 amount per annum cash flows 1 year RM Mil % RM Mil RM Mil Loans and borrowings Secured Term Loans USD fixed rate loan 2,062 5.35 2,255 426 USD floating rate loan 628 2.34 666 98 RM fixed rate loan 575 6.44 877 93 RM floating rate loan 480 2.96 558 31 Other fixed rate loan 7 7.25 7 7 Unsecured Term Loans USD fixed rate loan 74 9.70 91 18 USD floating rate loan 3,604 5.06 4,088 145 RM fixed rate loan 1,263 5.52 1,423 268 RM floating rate loan 489 3.14 535 324 EURO fixed rate loan 24 3.60 26 3 EURO floating rate loan 3,744 1.24 4,053 56 BAHT floating rate loan 137 1.52 140 22 Other fixed rate loan 70 12.41 94 25 Unsecured Notes and Bonds USD Notes 12,149 7.07 17,007 715 USD Guaranteed Notes 9,686 5.25 15,024 515 USD Bonds 3,675 7.69 6,609 242 JPY Bonds 567 3.40 630 19 Unsecured revolving credits BAHT revolving credits 64 2.88 65 65 USD revolving credits 128 4.10 133 133 RM revolving credits 458 2.85 471 471 Other revolving credits 24 7.00 26 26 Unsecured bank overdrafts USD bank overdrafts 3 3.16 3 3 EURO bank overdrafts 11 6.13 12 12 ZAR bank overdrafts 293 7.12 313 313 Secured Islamic financing facilities RM Islamic financing facilities 3,286 5.61 4,191 545 Unsecured Islamic financing facilities USD Islamic financing facilities 4,894 4.25 5,803 208 RM Islamic financing facilities 3,475 4.45 3,879 838 Trade and other payables 31,601 - 31,601 31,601Dividend payable 6,000 - 6,000 6,000 Fair value through profit or loss – held for trading Derivative liabilities 333 - 333 35 89,804 106,913 43,257 continue to next page

192 PETRONAS Annual Report 2011
40. FINANCIAL INSTRUMENTS (continued)
Maturity analysis (continued)
Group More than2010 1-2 years 2-5 years 5 years RM Mil RM Mil RM MilLoans and borrowings Secured Term Loans USD fixed rate loan 430 1,218 181 USD floating rate loan 236 266 66 RM fixed rate loan 92 656 36 RM floating rate loan 33 94 400 Other fixed rate loan - - - Unsecured Term Loans USD fixed rate loan 33 40 - USD floating rate loan 171 3,772 - RM fixed rate loan 180 948 27 RM floating rate loan 22 64 125 EURO fixed rate loan 16 4 3 EURO floating rate loan 98 3,896 3 BAHT floating rate loan 29 67 22 Other fixed rate loan 34 26 9 Unsecured Notes and Bonds USD Notes 715 10,180 5,397 USD Guaranteed Notes 515 1,545 12,449 USD Bonds 242 726 5,399 JPY Bonds 19 592 - Unsecured revolving credits BAHT revolving credits - - - USD revolving credits - - - RM revolving credits - - - Other revolving credits - - - Unsecured bank overdrafts USD bank overdrafts - - - EURO bank overdrafts - - - ZAR bank overdrafts - - - Secured Islamic financing facilities RM Islamic financing facilities 762 1,350 1,534 Unsecured Islamic financing facilities USD Islamic financing facilities 208 5,387 - RM Islamic financing facilities 1,198 1,622 221 Trade and other payables - - -Dividend payable - - - Fair value through profit or loss – held for trading Derivative liabilities 187 111 - 5,220 32,564 25,872 continued from previous page

PETRONAS Annual Report 2011 193
40. FINANCIAL INSTRUMENTS (continued)
Maturity analysis (continued)
Company Contractual 2011 Carrying interest rates Contractual Within amount per annum cash flows 1 year RM Mil % RM Mil RM MilLoans and borrowings Unsecured Notes and Bonds USD Notes 9,080 7.29 12,218 662 USD Guaranteed Notes 8,984 5.25 12,972 477 USD Bonds 3,405 7.69 5,839 262 JPY Bonds 586 3.40 633 20 Unsecured Islamic financing facilities USD Islamic financing facilities 4,536 4.25 5,185 193 Trade and other payables 6,661 - 6,661 6,661 Dividend payable 6,000 - 6,000 6,000 Fair value through profit or loss – held for trading Derivative liabilities 173 - 173 9 39,425 49,681 14,284
continue to next page
2010 Loans and borrowings Unsecured Notes and Bonds USD Notes 9,799 7.29 14,621 715 USD Guaranteed Notes 9,686 5.25 15,024 515 USD Bonds 3,675 7.69 6,871 283 JPY Bonds 567 3.40 630 19 Unsecured Islamic financing facilities USD Islamic financing facilities 4,894 4.25 5,803 208 Trade and other payables 5,235 - 5,235 5,235Dividend payable 6,000 - 6,000 6,000 Fair value through profit or loss – held for trading Derivative liabilities 131 - 131 2 39,987 54,315 12,977 continue to next page

194 PETRONAS Annual Report 2011
40. FINANCIAL INSTRUMENTS (continued)
Maturity analysis (continued) More thanCompany 1-2 years 2-5 years 5 years2011 RM Mil RM Mil RM Mil Loans and borrowings Unsecured Notes and Bonds USD Notes 6,351 715 4,490 USD Guaranteed Notes 477 1,430 10,588 USD Bonds 262 2,586 2,729 JPY Bonds 20 593 - Unsecured Islamic financing facilities USD Islamic financing facilities 193 4,799 - Trade and other payables - - -Dividend payable - - - Fair value through profit or loss – held for trading Derivative liabilities - 164 - 7,303 10,287 17,807
continued from previous page
2010 Loans and borrowings Unsecured Notes and Bonds USD Notes 715 7,828 5,363 USD Guaranteed Notes 515 1,545 12,449 USD Bonds 283 849 5,456 JPY Bonds 19 592 - Unsecured Islamic financing facilities USD Islamic financing facilities 208 5,387 - Trade and other payables - - -Dividend payable - - - Fair value through profit or loss – held for trading Derivative liabilities - 129 - 1,740 16,330 23,268
continued from previous page

PETRONAS Annual Report 2011 195
40. FINANCIAL INSTRUMENTS (continued)
Market risk
Market risk is the risk or uncertainty arising from changes in market prices and their impact on the performance of the business. The market price changes that the Group and the Company is exposed to include interest rates, foreign currency exchange rates, commodity price, equity prices and other indices that could adversely affect the value of the Group’s and the Company’s financial assets, liabilities or expected future cash flows.
Interest rate risk
The Group’s and the Company’s investments in fixed-rate debt securities and fixed rate borrowings are exposed to a risk of change in their fair values due to changes in interest rates. The Group’s variable rate borrowings are exposed to a risk of change in cash flows due to changes in interest rates. Investments in equity securities and short term receivables and payables are not significantly exposed to interest rate risk.
All interest rate exposures are monitored and managed proactively in line with PETRONAS’ policies and guidelines. The Group enters into hedging transactions with respect to interest rate on certain long term borrowings and other debts where necessary and appropriate, in accordance with policies and guidelines.
The interest rate profile of the Group’s and the Company’s interest-bearing financial instruments based on carrying amount as at reporting date is as follows:
Group Company 2011 2010 2011 2010 RM Mil RM Mil RM Mil RM MilFixed rate instruments Financial assets 123,658 120,426 113,693 120,003 Financial liabilities (42,088) (46,860) (27,272) (28,621) 81,570 73,566 86,421 91,382 Floating rate instruments Financial assets 4,434 1,476 15,211 11,939 Financial liabilities (6,030) (5,105) - - (1,596) (3,629) 15,211 11,939
Since most of the Group’s and the Company’s financial assets and liabilities are fixed rate instruments measured at amortised cost, a change in interest rate is not expected to have material impact on the Group’s and the Company’s profit or loss.

196 PETRONAS Annual Report 2011
40. FINANCIAL INSTRUMENTS (continued)
Foreign exchange risk
The Group and the Company are exposed to varying levels of foreign exchange risk when they enter into transactions that are not denominated in the respective companies’ functional currencies and when foreign currency monetary assets and liabilities are translated at the reporting date. The main underlying economic currencies of the Group’s cash flows are Ringgit Malaysia and US Dollars.
The Group and the Company’s foreign exchange management policy is to minimise economic and significant transactional exposures arising from currency movements. The Group coordinates the handling of foreign exchange risks centrally typically by matching receipts and payments for the same currency. For major capital projects, the Group performs assessment of potential foreign exchange risk exposure at the investment decision phase to determine the appropriate foreign exchange risk management strategy. Residual net positions are actively managed and monitored against prescribed policies and control procedures. When deemed necessary and appropriate, the Group will enter into derivative financial instruments to hedge and minimise its exposures to the foreign currency movements.
The Group’s and the Company’s significant exposure to foreign currency risk, based on carrying amounts as at the reporting date is as follows:
2011 2010 Denominated in Denominated in USD MYR USD MYRGroup RM Mil RM Mil RM Mil RM Mil Financial assets Loan and advances to subsidiaries 62,250 - 53,892 - Cash and cash equivalents 15,319 2,040 18,123 6,139 Trade and other receivables 7,722 1,052 5,752 634 Long term receivables 1,846 - 609 - Fund and other investments 989 33 341 77 Other financial assets 1,303 - 841 - 89,429 3,125 79,558 6,850 Financial liabilities Loan and advances from holding company (16,360) (2,962) (16,682) (9,192) Borrowings (26,466) - (28,421) - Trade and other payables (6,362) (2,537) (3,490) (2,019) Other financial liabilities (1,311) - (835) - (50,499) (5,499) (49,428) (11,211) Net exposure 38,930 (2,374) 30,130 (4,361)

PETRONAS Annual Report 2011 197
40. FINANCIAL INSTRUMENTS (continued)
Foreign exchange risk (continued)
Denominated in USD 2011 2010 Company RM Mil RM Mil Financial assets Loan and advances to subsidiaries 53,314 48,294 Cash and cash equivalents 13,461 17,490 Trade and other receivables 3,773 2,778 Fund and other investments 989 341 Other financial assets 1,247 1,565 72,784 70,468 Financial liabilities Borrowings (26,004) (28,054) Trade and other payables (1,026) (1,256) Other financial liabilities (500) (574) (27,530) (29,884) Net exposure 45,254 40,584 Sensitivity analysis for a given market variable provided in this note, discloses the effect on profit or loss and equity as at 31 March 2011 assuming that a reasonably possible change in the relevant market variable had occurred at 31 March 2011 and been applied to the risk exposures in existence at that date to show the effects of reasonably possible changes in price on profit or loss and equity to the next annual reporting date. Reasonably possible changes in market variables used in the sensitivity analysis are based on implied volatilities, where available, or historical data for equity and commodity prices and foreign exchange rates. Reasonably possible changes in interest rates are based on management judgment and historical experience.
The sensitivity analysis is hypothetical and should not be considered to be predictive of future performance because the Group’s actual exposure to market prices is constantly changing with changes in the Group’s portfolio of among others, commodity, debt and foreign currency contracts. Changes in fair values or cash flows based on a variation in a market variable cannot be extrapolated because the relationship between the change in market variable and the change in fair value or cash flows may not be linear. In addition, the effect of a change in a given market variable is calculated independently of any change in another assumption and mitigating actions that would be taken by the Group. In reality, changes in one factor may contribute to changes in another, which may magnify or counteract the sensitivities.

198 PETRONAS Annual Report 2011
40. FINANCIAL INSTRUMENTS (continued)
Foreign exchange risk (continued)
The following table demonstrates the indicative pre-tax effects on the profit or loss and equity of applying reasonably foreseeable market movements in the following currency exchange rates:
Appreciation in foreign currency Group Company rate Reserve Profit or loss Reserve Profit or loss2011 % RM Mil RM Mil RM Mil RM Mil USD 5 993 904 - 2,473 MYR 5 - (118) - -
2010 USD 5 1,093 254 - 2,187MYR 5 - (215) - -
A depreciation in foreign currency rate above would have had equal but opposite effect, on the basis that all other variables remain constant.
Equity price risk
Equity price risk arises from the Group’s and Company’s investments in equity securities. The Group and the Company have Investment Guidelines in place to minimise their exposures on price risk. Permitted investment in terms of allowable financial instruments, minimum credit rating and markets are stipulated in the Investment Guidelines. The Group and the Company monitors the equity investments on a portfolio basis and a performance benchmark is established for each investment portfolio giving consideration to portfolio objectives and return expectation. All buy and sell decision are monitored by the Group Treasury Division.
The Group and the Company also hold equity investment for strategic purposes, that are classified as available-for-sale financial assets. Reports on the equity portfolio performance are submitted to the Group’s and the Company’s senior management on a regular basis.
The Group’s and the Company’s exposure to equity price risk based on carrying amounts as at the reporting date is as follows:
Group Company 2011 2010 2011 2010 RM Mil RM Mil RM Mil RM Mil Local equities 657 778 286 342 Foreign equities 17,179 15,845 - - 17,836 16,623 286 342

PETRONAS Annual Report 2011 199
40. FINANCIAL INSTRUMENTS (continued)
Equity price risk (continued)
The following table demonstrates the indicative pre-tax effects on the profit or loss and equity of applying reasonably foreseeable market movements in the following equities:
Increase in price based on average change in Group Company index rate Reserve Profit or loss Reserve Profit or loss2011 % RM Mil RM Mil RM Mil RM Mil Local equities 15 99 - 43 -Foreign equities 20 2,629 23 - -
2010 Local equities 15 117 - 51 - Foreign equities 20 3,153 16 - -
A decrease in price based on average change in index rate above would have had equal but opposite effect, on the basis that all other variables remain constant.
Commodity price risk
The Group is exposed to changes in crude oil and petroleum products prices which may affect the value of the Group’s assets, liabilities or expected future cash flows. To mitigate these exposures from a business perspective, the Group enters into various financial instruments. In effecting these transactions, the Group operates within policies and procedures designed to ensure that risks are minimised. All financial instruments positions are marked-to-market by independent risk management department and reported to management for performance monitoring and risk management purposes on a daily basis.
Since the Group undertakes hedging using commodity derivatives for the majority of its transactions, a change in commodity price is not likely to result in a significant impact on the Group’s and the Company’s profit or loss and equity.

200 PETRONAS Annual Report 2011
40. FINANCIAL INSTRUMENTS (continued)
Fair value
The fair values of financial liabilities measured at amortised cost, together with the carrying amounts are as follows:
2011 2010 Carrying Fair Carrying Fair amount value amount valueGroup Note RM Mil RM Mil RM Mil RM Mil Loans and borrowings Notes and Bonds 23 24,195 27,084 26,077 28,541 Term loans 23 11,768 11,834 13,157 13,023 Islamic financing facilities 23 11,458 11,701 11,655 12,440 Revolving credits 23 274 274 674 674 Bankers’ acceptances 23 41 41 - - Bank overdrafts 23 75 75 307 307
Company Loans and borrowings Notes and Bonds 23 22,055 24,758 23,727 25,993 Islamic financing facilities 23 4,536 4,773 4,894 4,932

PETRONAS Annual Report 2011 201
40. FINANCIAL INSTRUMENTS (continued)
Income/ (expense), net gains and losses arising from financial instruments
Reversal/ Group Interest Interest (impairment 2011 income expense loss) Others Total RM Mil RM Mil RM Mil RM Mil RM Mil
Financial instruments at fair value through profit or loss - Held for trading - - - 35 35 - Designated upon initial recognition 331 - - (37) 294 Available-for-sale - recognised in profit or loss 794 - - 407 1,201 - recognised in equity - - - 2,251 2,251 Loans and receivables - recognised in profit or loss 1,831 - 119 (861) 1,089 - recognised in equity - - - (1,737) (1,737)Financial liabilities at amortised cost - (2,511) - (234) (2,745)Total 2,956 (2,511) 119 (176) 388
2010 Financial instruments at fair value through profit or loss - Held for trading - - - 23 23 - Designated upon initial recognition 505 - - 22 527Available-for-sale - recognised in profit or loss 698 - (3) 283 978 - recognised in equity - - - 6,489 6,489Loans and receivables - recognised in profit or loss 1,240 - (200) (1,787) (747) - recognised in equity - - - (1,047) (1,047)Financial liabilities at amortised cost - (2,027) - 265 (1,762)Total 2,443 (2,027) (203) 4,248 4,461

202 PETRONAS Annual Report 2011
40. FINANCIAL INSTRUMENTS (continued)
Income/ (expense), net gains and losses arising from financial instruments (continued)
Company Reversal/ 2011 Interest Interest (impairment income expense loss) Others Total RM Mil RM Mil RM Mil RM Mil RM Mil
Financial instruments at fair value through profit or loss - Held for trading - - - 410 410 - Designated upon initial recognition 365 - - (40) 325 Available-for-sale - recognised in profit or loss 397 - - 57 454 - recognised in equity - - - (54) (54)Loans and receivables 4,022 - (90) (2,820) 1,112 Financial liabilities at amortised cost - (693) - - (693)Total 4,784 (693) (90) (2,447) 1,554
2010 Financial instruments at fair value through profit or loss - Held for trading - - - 431 431 - Designated upon initial recognition 440 - - (52) 388Available-for-sale - recognised in profit or loss 359 - - 35 394 - recognised in equity - - - 168 168Loans and receivables 4,225 - (226) (2,994) 1,005Financial liabilities at amortised cost - (504) - - (504)Total 5,024 (504) (226) (2,412) 1,882
Others relates to gains and losses arising from financial instruments other than interest income, interest expense and impairment loss such as realised and unrealised foreign exchange gains or losses, dividend income, and fair value gains or losses.

PETRONAS Annual Report 2011 203
41. CAPITAL MANAGEMENT
The Group, as an essential part of its capital management strategy, is committed to a policy of financial prudence as outlined in the PETRONAS Group Corporate Financial Policy. The Group’s capital structure consists of consolidated equity plus debt, defined as the current and long term portions of the Group’s debt.
The objective of the Group’s capital management is to maintain an optimal capital structure and ensure availability of funds in order to meet financial obligations, support business growth and maximise shareholders’ value. The Group monitors and maintains a prudent level of total debt to total assets ratio and ensures compliance with all covenants.
There were no changes in the Group’s approach to capital management during the year.
42. CHANGE OF FINANCIAL YEAR END The Group and the Company will change their financial year end from 31 March to 31 December which will be implemented after the close of financial year 31 March 2011. The first new financial year end will fall on 31 December 2011 with a shorter 9-month financial period from 1 April 2011 to 31 December 2011. Thereafter, the Group’s and the Company’s financial year will revert to the usual 12 months from 1 January to 31 December.

204 PETRONAS Annual Report 2011
43. ADOPTION OF NEW AND REVISED PRONOUNCEMENTS
On 1 April 2010, the Group and the Company adopted the following new and revised FRSs, amendments and IC interpretations that have been issued by the Malaysian Accounting Standards Board which are effective for annual periods beginning on or after 1 January 2010 (unless otherwise specified):
FRS 4, Insurance Contracts
FRS 8, Operating Segments (effective for annual periods beginning on or after 1 July 2009)
FRS 101, Presentation of Financial Statements (revised)
FRS 123, Borrowing Costs (revised)
Amendments to FRS 1, First-time Adoption of Financial Reporting Standards and FRS 127, Consolidated and Separate Financial Statements: Cost of an Investment in a Subsidiary, Jointly Controlled Entity or Associate
Amendment to FRS 5, Non-current Assets Held for Sale and Discontinued Operations
Amendment to FRS 8, Operating Segments
Amendment to FRS 107, Statement of Cash Flows
Amendment to FRS 108, Accounting Policies, Changes in Accounting Estimates and Errors
Amendment to FRS 110, Events After the Reporting Period
Amendment to FRS 116, Property, Plant and Equipment
Amendment to FRS 117, Leases
Amendment to FRS 118, Revenue
Amendment to FRS 119, Employee Benefits
Amendment to FRS 123, Borrowing Costs
Amendment to FRS 127, Consolidated and Separate Financial Statements
Amendment to FRS 128, Investments in Associates
Amendment to FRS 131, Interests in Joint Ventures
Amendments to FRS 132, Financial Instruments: Presentation (“Puttable Financial Instruments and Obligations Arising on Liquidation”)
Amendments to FRS 132, Financial Instruments: Presentation (“Separation of Compound Instruments” and “Classification of Rights Issues”) (effective for annual periods beginning on or after 1 January 2010 and 1 March 2010 respectively)
Amendment to FRS 134, Interim Financial Reporting
Amendment to FRS 136, Impairment of Assets
Amendment to FRS 138, Intangible Assets
Amendments to FRS 139, Financial Instruments: Recognition and Measurement, FRS 7, Financial Instruments: Disclosures and IC 9, Reassessment of Embedded Derivatives
Amendment to FRS 140, Investment Property
IC 14, FRS 119-The Limit on a Defined Benefit Asset, Minimum Funding Requirements and their Interaction

PETRONAS Annual Report 2011 205
43. ADOPTION OF NEW AND REVISED PRONOUNCEMENTS (continued)
Other than the mandatory adoption of FRS 8 by certain companies within the Group, the Company has also adopted FRS 8 as of the beginning of the current financial year, on a voluntary basis.
The principal changes in accounting policies and their effects are set out below:
i. FRS 8, Operating Segments
As of 1 April 2010, the Company determine and present operating segment based on a component of the Group that engages in business activities from which it may earn revenues and incur expenses, including revenues and expenses that relate to transactions with any of the Group’s other components. An operating segment’s operating results are reviewed regularly by the Group’s chief operating decision maker, which in this case is the PETRONAS Executive Committee, to make decisions about resources to be allocated to the segment and assess its performance, and for which discrete financial information is available.
Comparative segment information has been included. Since the adoption of this standard only impacts presentation and disclosure aspects, there is no impact on the Group’s and the Company’s reported income or net assets.
ii. FRS 101, Presentation of Financial Statements (revised)
The Group applies revised FRS 101 which became effective as of 1 April 2010. Arising from the adoption of FRS 101 (revised), income statements are presented as statement of comprehensive income. All non-owner changes in equity that were presented in the statement of changes in equity are now included in the statement of comprehensive income as other comprehensive income. Consequently, components of comprehensive income are not presented in the statement of changes in equity.
Comparative information has been re-presented so that it is in conformity with the revised standard. Since the change only affects presentation aspects, there is no impact on the Group’s and the Company’s reported income or net assets.
iii. Amendment to FRS 117, Leases
The adoption of Amendment to FRS 117 has resulted in a change in the accounting policy relating to the classification of leases of land.
Prior to the adoption of Amendment to FRS 117, the Group and the Company had previously classified leases of land as operating leases and had recognised the amount of payments made on entering into or acquiring the land as prepaid lease payments. These land are amortised over the lease term in accordance with the pattern of benefits provided.
On adoption of Amendment to FRS 117, the Group treats such leases of land that meets the definition of finance leases as property, with the unamortised carrying amount classified as leasehold land within property, plant and equipment. These land are then accounted for in these financial statements in accordance with the accounting policy for property, plant and equipment. The effects of adopting Amendment to FRS 117 had been accounted for retrospectively in accordance with transitional provisions of the standard, and comparatives have been restated (note 50).
This change in accounting policy does not have material impact on the Group’s and the Company’s reported income and net assets.

206 PETRONAS Annual Report 2011
43. ADOPTION OF NEW AND REVISED PRONOUNCEMENTS (continued)
iv. Amendment to FRS 140, Investment Property
Prior to 1 April 2010, an investment property under construction was classified as property, plant and equipment until construction or development is complete, at which time it is reclassified as investment property at cost. Following the amendment made to FRS 140, with effect from 1 April 2010, investment property under construction is classified as investment property.
This change in accounting policy has been made prospectively in accordance with the transitional provisions of FRS 140. Since the change only affects presentation aspects, there is no impact on the Group’s and the Company’s reported income or net assets.
44. NEW AND REVISED PRONOUNCEMENTS YET IN EFFECT
The following revised FRSs, amendments and IC Interpretations that have been issued by the Malaysian Accounting Standards Board will become effective for future financial reporting periods and have not yet been adopted by the Group.
Effective for annual periods beginning on or after 1 July 2010 FRS 1, First-time Adoption of Financial Reporting Standards (revised) FRS 3, Business Combinations (revised) FRS 127, Consolidated and Separate Financial Statements (revised) Amendment to FRS 5, Non-current Assets Held for Sale and Discontinued Operations Amendments to FRS 138, Intangible Assets IC 12, Service Concession Arrangements IC 16, Hedges of a Net Investment in a Foreign Operation IC 17, Distribution of Non-cash Assets to Owners Amendments to IC 9, Reassessment of Embedded Derivatives
Effective for annual periods beginning on or after 30 August 2010 Amendment to IC 15, Agreements for the Construction of Real Estate
Effective for annual periods beginning on or after 1 January 2011 Amendment to FRS 1, Limited Exemption from Comparative FRS 7 Disclosures for First-time Adopters Amendments to FRS 1, Additional Exemptions for First-time Adopters Amendments to FRS 1, First-time Adoption of Financial Reporting Standards Amendments to FRS 3, Business Combinations Amendments to FRS 7, Improving Disclosures about Financial Instruments Amendments to FRS 7, Financial Instruments: Disclosures Amendments to FRS 101, Presentation of Financial Statements Amendments to FRS 121, The Effects of Changes in Foreign Exchange Rates Amendments to FRS 128, Investments in Associates Amendments to FRS 131, Interests in Joint Ventures Amendments to FRS 132, Financial Instruments: Presentation Amendments to FRS 134, Interim Financial Reporting Amendments to FRS 139, Financial Instruments: Recognition and Measurement IC 4, Determining whether an Arrangement contains a Lease IC 18, Transfer of Assets from Customers Amendments to IC 13, Customer Loyalty Programmes

PETRONAS Annual Report 2011 207
44. NEW AND REVISED PRONOUNCEMENTS YET IN EFFECT (continued)
Initial application of these pronouncements for the Group and the Company will be effective from the annual period beginning 1 April 2011. By virtue of the exemptions in paragraph 30AA of IC 12, the impact of applying IC 12 on the financial statements upon first adoption of this standard as required by paragraph 30(b) of FRS 108, Accounting Policies, Changes in Accounting Estimates and Errors is not disclosed.
The adoption of other FRSs, amendments and IC Interpretations are not expected to have any material impact on the financial statements of the Group and of the Company in the period of initial application.
45. NEW PRONOUNCEMENTS NOT APPLICABLE TO THE GROUP AND THE COMPANY
The MASB has issued amendments to FRSs which are not yet effective, but for which are not relevant to the operations of the Group and the Company and hence, no further disclosure is warranted.
Effective for annual periods beginning on or after 1 July 2010 Amendments to FRS 2, Share-based Payment
Effective for annual periods beginning on or after 1 January 2011 Amendments to FRS 2, Group Cash-settled Share-based Payment Transactions
The following revised FRS, amendments and IC interpretations which will be effective for the Group and the Company from the annual period beginning 1 January 2012, will not be applicable as the Group’s and the Company’s financial statements are expected to be prepared in accordance with the International Financial Reporting Standards framework.
Effective for annual periods beginning on or after 1 July 2011 IC 19, Extinguishing Financial Liabilities with Equity Instruments Amendments to IC 14, Prepayments of a Minimum Funding Requirement
Effective for annual periods beginning on or after 1 January 2012 FRS 124, Related Party Disclosures (revised) IC 15, Agreements for the Construction of Real Estate
46. SIGNIFICANT EVENTS
During the financial year, the Group listed its heavy engineering arm, Malaysia Marine and Heavy Engineering Holdings Berhad (“MHB”) and petrochemical business, PETRONAS Chemicals Group Berhad (“PCGB”) respectively on the Main Market of Bursa Malaysia Securities Berhad.
The listing of PCGB and MHB contributed an additional net cash of approximately RM16.8 billion to the Group and PETRONAS’ effective equity holdings in PCGB and MHB reduced from 100% to 64.3% and 62.6% to 41.6%, respectively. The Group recorded a net gain of RM9.2 billion upon completion of the listings which has been included in other income.
The net impact to the Group consolidated net profit for the year ended 31 March 2011 arising from the reduction of shareholdings in PCGB and MHB from the date of dilution of interest to the year ended 31 March 2011, is not material in relation to the Group’s results.
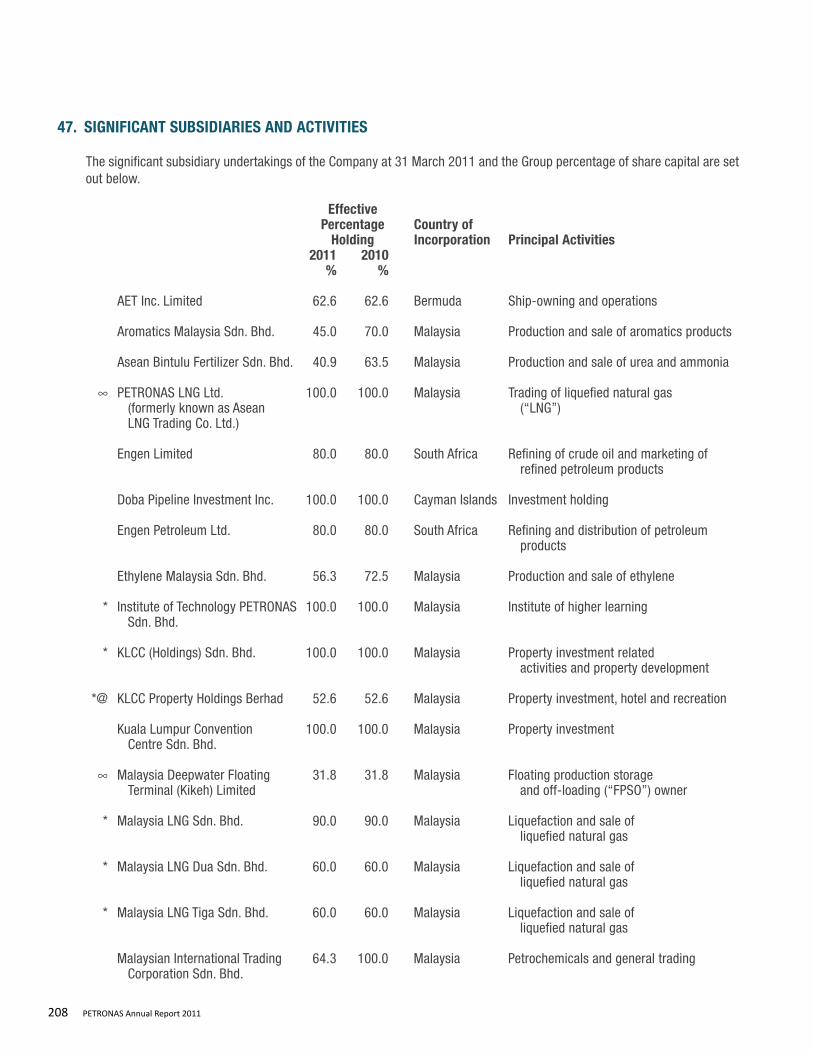
208 PETRONAS Annual Report 2011
47. SIGNIFICANT SUBSIDIARIES AND ACTIVITIES
The significant subsidiary undertakings of the Company at 31 March 2011 and the Group percentage of share capital are set out below.
Effective Percentage Country of Holding Incorporation Principal Activities 2011 2010 % % AET Inc. Limited 62.6 62.6 Bermuda Ship-owning and operations
Aromatics Malaysia Sdn. Bhd. 45.0 70.0 Malaysia Production and sale of aromatics products Asean Bintulu Fertilizer Sdn. Bhd. 40.9 63.5 Malaysia Production and sale of urea and ammonia
∞ PETRONAS LNG Ltd. 100.0 100.0 Malaysia Trading of liquefied natural gas (formerly known as Asean (“LNG”) LNG Trading Co. Ltd.) Engen Limited 80.0 80.0 South Africa Refining of crude oil and marketing of refined petroleum products
Doba Pipeline Investment Inc. 100.0 100.0 Cayman Islands Investment holding Engen Petroleum Ltd. 80.0 80.0 South Africa Refining and distribution of petroleum products
Ethylene Malaysia Sdn. Bhd. 56.3 72.5 Malaysia Production and sale of ethylene
* Institute of Technology PETRONAS 100.0 100.0 Malaysia Institute of higher learning Sdn. Bhd.
* KLCC (Holdings) Sdn. Bhd. 100.0 100.0 Malaysia Property investment related activities and property development
*@ KLCC Property Holdings Berhad 52.6 52.6 Malaysia Property investment, hotel and recreation
Kuala Lumpur Convention 100.0 100.0 Malaysia Property investment Centre Sdn. Bhd.
∞ Malaysia Deepwater Floating 31.8 31.8 Malaysia Floating production storage Terminal (Kikeh) Limited and off-loading (“FPSO”) owner
* Malaysia LNG Sdn. Bhd. 90.0 90.0 Malaysia Liquefaction and sale of liquefied natural gas
* Malaysia LNG Dua Sdn. Bhd. 60.0 60.0 Malaysia Liquefaction and sale of liquefied natural gas
* Malaysia LNG Tiga Sdn. Bhd. 60.0 60.0 Malaysia Liquefaction and sale of liquefied natural gas
Malaysian International Trading 64.3 100.0 Malaysia Petrochemicals and general trading Corporation Sdn. Bhd.

PETRONAS Annual Report 2011 209
47. SIGNIFICANT SUBSIDIARIES AND ACTIVITIES (continued)
Effective Percentage Country of Holding Incorporation Principal Activities 2011 2010 % %
* Malaysian International Trading 100.0 100.0 Malaysia Trading and procurement of Corporation (Japan) Sdn. Bhd. equipment spares and materials
* Malaysian Refining Company 53.0 53.0 Malaysia Refining of crude oil Sdn. Bhd.
@ Malaysia Marine and Heavy 41.6 62.6 Malaysia Investment holding Engineering Holdings Berhad (formerly known as MSE Holdings Sdn. Bhd.)
Midciti Resources Sdn. Bhd. 76.1 76.1 Malaysia Property investment
@* MISC Berhad 62.6 62.6 Malaysia Shipping and shipping related activities
∞ MITCO Labuan Co. Ltd. 100.0 100.0 Malaysia Petrochemicals and general merchandise trading
MTBE Malaysia Sdn. Bhd. 64.3 100.0 Malaysia Production and sale of methyl tertiary butyl ether and propylene
Optimal Olefins (Malaysia) 56.6 88.0 Malaysia Manufacturing and marketing of Sdn. Bhd. ethylene, propylene and other hydrocarbon products
Optimal Chemicals (Malaysia) 64.3 100.0 Malaysia Manufacturing and selling ethylene Sdn. Bhd. and propylene derivative products
Optimal Glycols (Malaysia) 64.3 100.0 Malaysia Manufacturing and selling ethylene Sdn. Bhd. oxide, ethylene glycol and other glycols
PAPL (Upstream) Pty. Ltd. 100.0 100.0 Australia Exploration and production of coal seam gas
PC JDA Ltd. 100.0 100.0 Republic of Petroleum operations Mauritius
PC Vietnam Ltd. 100.0 100.0 Republic of Petroleum operations Mauritius PETRONAS Ammonia Sdn. Bhd. 64.3 100.0 Malaysia Production and sale of ammonia, syngas and carbon monoxide
PETRONAS Australia Pty. Ltd. 100.0 100.0 Australia Investment holding
∞ PETRONAS Capital Ltd. 100.0 100.0 Malaysia Investment holding

210 PETRONAS Annual Report 2011
47. SIGNIFICANT SUBSIDIARIES AND ACTIVITIES (continued)
Effective Percentage Country of Holding Incorporation Principal Activities 2011 2010 % % * PETRONAS Carigali Sdn. Bhd. 100.0 100.0 Malaysia Petroleum exploration, development and production
PETRONAS Carigali (Chad EP) Inc. 100.0 100.0 Cayman Islands Petroleum operations
PETRONAS Carigali Chad 100.0 100.0 Cayman Islands Petroleum operations Exploration and Production Inc.
PETRONAS Carigali (Jabung) Ltd. 100.0 100.0 Bahamas Petroleum operations
PETRONAS Carigali Nile Ltd. 100.0 100.0 Republic of Petroleum operations Mauritius
PETRONAS Carigali Overseas 100.0 100.0 Malaysia Investment holding and Sdn. Bhd. petroleum operations
PETRONAS Carigali 100.0 100.0 Malaysia Petroleum operations (Turkmenistan) Sdn. Bhd. @* PETRONAS Chemicals Group 64.3 100.0 Malaysia Investment holding Berhad (formerly known as Kuantan Terminals Sdn. Bhd.)
@* PETRONAS Dagangan Berhad 69.9 69.9 Malaysia Marketing of petroleum products and operation of service stations
PETRONAS Fertilizer (Kedah) 64.3 100.0 Malaysia Production and sale of urea, ammonia Sdn. Bhd. and methanol
@* PETRONAS Gas Berhad 60.6 60.6 Malaysia Processing and transmission of natural gas
∞ PETRONAS Global Sukuk Limited 100.0 100.0 Malaysia Investment holding
∞* PETRONAS International 100.0 100.0 Malaysia Investment holding Corporation Ltd.
PETRONAS Lubricants Italy S.p.A 100.0 100.0 Italy Manufacturing and marketing of lubricant products
* PETRONAS Lubricants 100.0 100.0 Malaysia Investment holding, manufacturing and International Sdn. Bhd. trading of lubricant products
PETRONAS Marketing Sudan Ltd. 100.0 100.0 Sudan Marketing of petroleum products
PETRONAS Methanol (Labuan) 64.3 100.0 Malaysia Production and sale of methanol Sdn. Bhd.

PETRONAS Annual Report 2011 211
47. SIGNIFICANT SUBSIDIARIES AND ACTIVITIES (continued)
Effective Percentage Country of Holding Incorporation Principal Activities 2011 2010 % %
* PETRONAS Penapisan (Melaka) 100.0 100.0 Malaysia Refining and condensation of crude oil Sdn. Bhd.
* PETRONAS Penapisan 100.0 100.0 Malaysia Refining and condensation of crude oil (Terengganu) Sdn. Bhd.
MISC Tankers Sdn. Bhd. 62.6 62.6 Malaysia Investment holding and provision of (formerly known as PETRONAS management services Tankers Sdn. Bhd.)
* PETRONAS Trading Corporation 100.0 100.0 Malaysia Trading of crude oil and petroleum products Sdn. Bhd.
∞ PICL (Egypt) Corporation Ltd. 100.0 100.0 Malaysia Investment holding, exploration, and production of oil and gas Putrajaya Holdings Sdn. Bhd. 64.4 64.4 Malaysia Property owner and developer
Star Energy Group Plc 100.0 100.0 United Kingdom Provision of gas storage facilities, exploration, development and production of crude oil, sale of natural gas and electricity generation
Suria KLCC Sdn. Bhd. 31.6 31.6 Malaysia Property investment
* Subsidiaries held directly by the Company. @ The shares of these subsidiaries are quoted on the Main Market of Bursa Malaysia Securities Berhad. ∞ Companies incorporated under the Labuan Companies Act 1990.

212 PETRONAS Annual Report 2011
48. SIGNIFICANT ASSOCIATES AND ACTIVITIES
Effective Percentage Country of Holding Incorporation Principal Activities 2011 2010 % %
BASF PETRONAS Chemicals Sdn. Bhd. 25.7 40.0 Malaysia Own and operate acrylic acid and oxo plants
Bintulu Port Holdings Berhad 32.8 32.8 Malaysia Port management
Cameroon Oil Transportation 29.8 29.8 Republic of Pipeline operations Company- S.A. Cameroon
El Behera Natural Gas 35.5 35.5 Egypt Manufacturing and production of LNG Liquefaction Company S.A.E. for the purpose of export
Gas Malaysia Sdn. Bhd. 12.1 12.1 Malaysia Selling, marketing, distribution and promotion of natural gas
IDKU Natural Gas Liquefaction 38.0 38.0 Egypt Manufacturing and production of LNG for Company S.A.E. the purpose of export
PP Oil & Gas (Indonesia- Jabung) 50.0 50.0 United Exploration and production of oil and gas Limited Kingdom
Taninthayi Pipeline Co. LLC 40.9 40.9 Cayman Islands Transportation of gas
Tchad Oil Transportation 30.2 30.2 Republic Pipeline operations Company- S.A. of Chad
The Egyptian LNG Company S.A.E. 35.5 35.5 Egypt Owning, managing and developing the land and the common facilities related to the Egyptian LNG facility
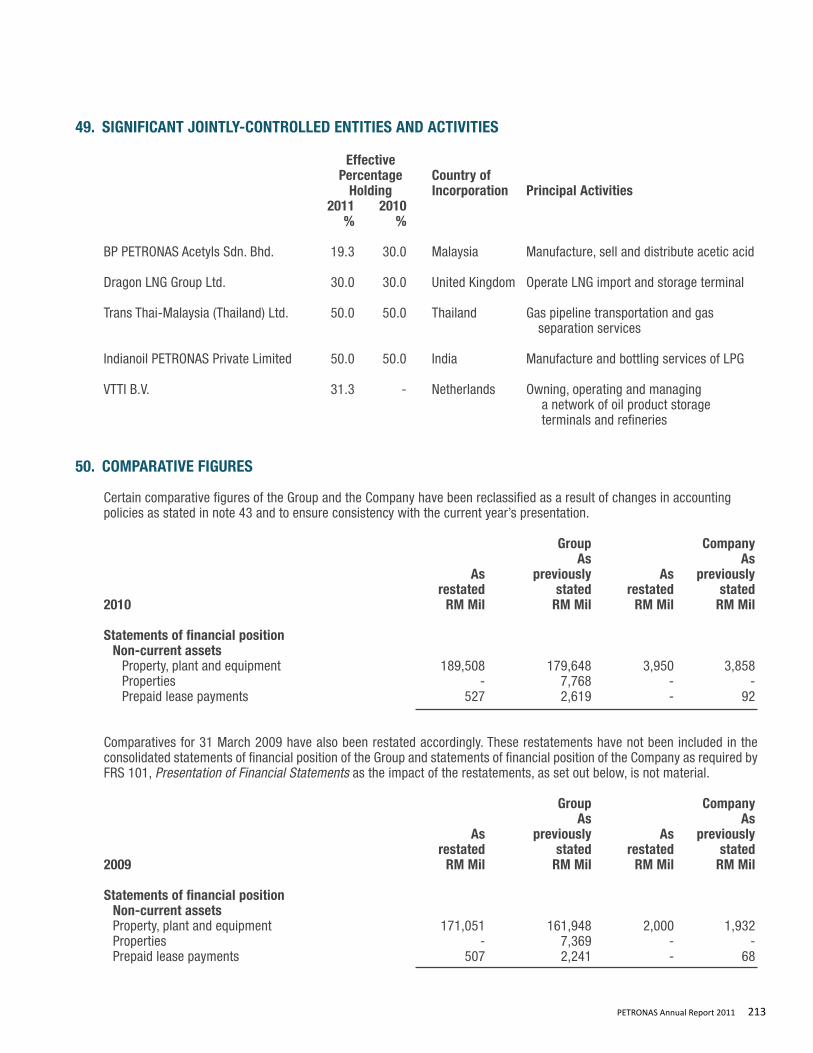
PETRONAS Annual Report 2011 213
49. SIGNIFICANT JOINTLY-CONTROLLED ENTITIES AND ACTIVITIES
Effective Percentage Country of Holding Incorporation Principal Activities 2011 2010 % %
BP PETRONAS Acetyls Sdn. Bhd. 19.3 30.0 Malaysia Manufacture, sell and distribute acetic acid
Dragon LNG Group Ltd. 30.0 30.0 United Kingdom Operate LNG import and storage terminal
Trans Thai-Malaysia (Thailand) Ltd. 50.0 50.0 Thailand Gas pipeline transportation and gas separation services
Indianoil PETRONAS Private Limited 50.0 50.0 India Manufacture and bottling services of LPG
VTTI B.V. 31.3 - Netherlands Owning, operating and managing a network of oil product storage terminals and refineries
50. COMPARATIVE FIGURES
Certain comparative figures of the Group and the Company have been reclassified as a result of changes in accounting policies as stated in note 43 and to ensure consistency with the current year’s presentation. Group Company As As As previously As previously restated stated restated stated2010 RM Mil RM Mil RM Mil RM Mil Statements of financial position Non-current assets Property, plant and equipment 189,508 179,648 3,950 3,858 Properties - 7,768 - - Prepaid lease payments 527 2,619 - 92
Comparatives for 31 March 2009 have also been restated accordingly. These restatements have not been included in the consolidated statements of financial position of the Group and statements of financial position of the Company as required by FRS 101, Presentation of Financial Statements as the impact of the restatements, as set out below, is not material.
Group Company As As As previously As previously restated stated restated stated2009 RM Mil RM Mil RM Mil RM Mil Statements of financial position Non-current assets Property, plant and equipment 171,051 161,948 2,000 1,932 Properties - 7,369 - - Prepaid lease payments 507 2,241 - 68

214 PETRONAS Annual Report 2011
REPORT OF THE AUDITORS TO THE MEMBERS
Report on the Financial Statements
We have audited the financial statements of Petroliam Nasional Berhad, which comprise the statements of financial position as at 31 March 2011 of the Group and of the Company, and the statements of comprehensive income, changes in equity and cash flows of the Group and of the Company for the year then ended, and a summary of significant accounting policies and other explanatory notes, as set out on pages 101 to 213.
Directors’ Responsibility for the Financial Statements
The Directors of the Company are responsible for the preparation of financial statements that give a true and fair view in accordance with Financial Reporting Standards and the Companies Act, 1965 in Malaysia, and for such internal control as the directors determine are necessary to enable the preparation of financial statements that are free from material misstatement, whether due to fraud or error.
Auditors’ Responsibility
Our responsibility is to express an opinion on these financial statements based on our audit. We conducted our audit in accordance with approved standards on auditing in Malaysia. Those standards require that we comply with ethical requirements and plan and perform the audit to obtain reasonable assurance about whether the financial statements are free from material misstatement.
An audit involves performing procedures to obtain audit evidence about the amounts and disclosures in the financial statements. The procedures selected depend on our judgment, including the assessment of risks of material misstatement of the financial statements, whether due to fraud or error. In making those risk assessments, we consider internal control relevant to the entity’s preparation of financial statements that give a true and fair view in order to design audit procedures that are appropriate in the circumstances, but not for the purpose of expressing an opinion on the effectiveness of the entity’s internal control. An audit also includes evaluating the appropriateness of accounting policies used and the reasonableness of accounting estimates made by the Directors, as well as evaluating the overall presentation of the financial statements.
We believe that the audit evidence we have obtained is sufficient and appropriate to provide a basis for our audit opinion.
Opinion
In our opinion, the financial statements have been properly drawn up in accordance with Financial Reporting Standards and the Companies Act, 1965 in Malaysia so as to give a true and fair view of the financial position of the Group and of the Company as of 31 March 2011 and of their financial performance and cash flows for the year then ended.
Report on Other Legal and Regulatory Requirements
In accordance with the requirements of the Companies Act, 1965 in Malaysia, we also report the following:
a) In our opinion, the accounting and other records and the registers required by the Act to be kept by the Company and its subsidiaries of which we have acted as auditors have been properly kept in accordance with the provisions of the Act.
b) We have considered the accounts and the auditors’ reports of all the subsidiaries of which we have not acted as auditors, which are indicated in Appendix I to the financial statements.

PETRONAS Annual Report 2011 215
c) We are satisfied that the accounts of the subsidiaries that have been consolidated with the Company’s financial statements are in form and content appropriate and proper for the purposes of the preparation of the financial statements of the Group and we have received satisfactory information and explanations required by us for those purposes.
d) The audit reports on the accounts of the subsidiaries did not contain any qualification or any adverse comment made under Section 174(3) of the Act.
Other Matters
This report is made solely to the members of the Company, as a body, in accordance with Section 174 of the Companies Act, 1965 in Malaysia and for no other purpose. We do not assume responsibility to any other person for the content of this report.
KPMG Desa Megat & Co. Abdullah Abu SamahFirm Number: AF 0759 PartnerChartered Accountants Approval Number: 2013/06/12(J) Chartered Accountant
Petaling Jaya, Malaysia
Date: 30 May 2011

216 PETRONAS Annual Report 2011
APPENDIX I
SUBSIDIARIES AUDITED BY OTHER FIRMS OF ACCOUNTANTS
Gas District Cooling (Holdings) Sdn. Bhd. and its subsidiaries:
• GasDistrictCooling(KLIA)Sdn.Bhd. • GasDistrictCooling(UTP)Sdn.Bhd.
KLCC (Holdings) Sdn. Bhd. and its subsidiaries:
• AliranModenSdn.Bhd. • ArahModenSdn.Bhd.• CititowerSdn.Bhd. • CityCentreConventionCentreSdn.Bhd.• ConvexMalaysiaSdn.Bhd. • GagasanRiaSdn.Bhd.• GasDistrictCooling(M)Sdn.Bhd. • GasDistrictCooling(Putrajaya)Sdn.Bhd.• GilangCendanaSdn.Bhd. • HeritageLaneSdn.Bhd.• HasratIntisari(M)Sdn.Bhd. • IlhamMerpatiSdn.Bhd.• HLPBinaSdn.Bhd. • IdamanPutrajayaSdn.Bhd.• ImpianBebasSdn.Bhd. • ImpianModenSdn.Bhd.• IndahPutrajayaSdn.Bhd. • KelanaPerkasaSdn.Bhd.• KenyalangMurniSdn.Bhd. • KLCCConventionCentreSdn.Bhd.• KLCCProjeksSdn.Bhd. • KLCCPropertiesSdn.Bhd.• KLCCRealEstateManagementSdn.Bhd. • KomponenAbadiSdn.Bhd.• KLCCProjeksServicesSdn.Bhd. • KualaLumpurCityCentreHoldingsSdn.Bhd.• KualaLumpurCityParkBerhad • KualaLumpurConventionCentreSdn.Bhd.• LayarIntanSdn.Bhd. • LembahPutrajayaSdn.Bhd.• MenaraPutrajayaSdn.Bhd. • MetroKemasikSdn.Bhd.• PedomanPurnamaSdn.Bhd. • PedomanSemarakSdn.Bhd.• PurnamaSepiSdn.Bhd. • PutrajayaCapitalManagementSdn.Bhd.• PutrajayaCorporateServicesSdn.Bhd. • PutrajayaDevelopmentSdn.Bhd.• PutrajayaGroupSdn.Bhd. • PutrajayaHoldingsSdn.Bhd.• PutrajayaHomesSdn.Bhd. • PutrajayaManagementSdn.Bhd.• PutrajayaProjectsSdn.Bhd. • PutrajayaPropertiesSdn.Bhd.• PutrajayaResourcesSdn.Bhd. • PutrajayaVenturesSdn.Bhd.• SenandungAsliSdn.Bhd. • SerbaHarapan(M)Sdn.Bhd.• TapakSenjaSdn.Bhd. KLCC Property Holdings Berhad and its subsidiaries:
• ArenaJohanSdn.Bhd. • ArenaMerduSdn.Bhd.• AsasKlasikSdn.Bhd. • ImpianCemerlangSdn.Bhd.• KLCCParkingManagementSdn.Bhd. • KLCCUrushartaSdn.Bhd.• KompleksDayabumiSdn.Bhd. • MidcitiResourcesSdn.Bhd.• SuriaKLCCSdn.Bhd.
Marmel Incorporated and its subsidiaries:
• DartonLtd. • DartonU.S.HoldingsInc.• GCBAssociatesLLC • GrabhornPropertiesLLC• SparknightLLC • WGParcelBManagementLLC• WGParcelBLLC • WorldGatewayInvestmentsInc.

PETRONAS Annual Report 2011 217
APPENDIX I
SUBSIDIARIES AUDITED BY OTHER FIRM OF ACCOUNTANTS (continued)
MISC Berhad and its subsidiaries:
• AETAgenciesInc. • AETHoldings(L)Pte.Ltd.• AETInc.Limited • AETLighteringServicesLLC• AETOffshoreServicesInc. • AETPetroleumTanker(M)Sdn.Bhd.• AETShipmanagement(India)PrivateLimited • AETShipmanagement(Malaysia)Sdn.Bhd.• AETShipmanagement(Singapore)Pte.Ltd. • AETTankerAzerbaijanLimited• AETTankerHoldingsSdn.Bhd. • AETTanker(India)Pvt.Ltd.• AsiaLNGTransportSdn.Bhd. • AET(UK)Limited• BungaKasturi(L)Pte.Ltd. • AETTankersPte.Ltd.• LeoLaunchesPrivateLimited • AsiaLNGTransportDuaSdn.Bhd.• MalaysiaDeepwaterFloatingTerminal(Kikeh)Limited • FPSOVenturesSdn.Bhd.• MalaysianMaritimeAcademySdn.Bhd. • MalaysiaDeepwaterProductionContractorsSdn.Bhd.• MILS-SterilGammaSdn.Bhd. • MalaysiaMarineandHeavyEngineeringSdn.Bhd.• MISANLogisticsB.V. • MILS-SeafrigoSdn.Bhd.• MISCAgencies(Australia)Pty.Ltd. • MILS-SeafrigoColdChainLogisticsSdn.Bhd.• MISCAgencies(India)Pvt.Ltd. • MISCAgenciesSdn.Bhd.• MISCAgencies(Netherlands)B.V. • MISCAgencies(Japan)Ltd.• MISCAgencies(Sarawak)Sdn.Bhd. • MISCAgencies(NewZealand)Limited• MISCAgencies(U.K.)Ltd. • MISCAgencies(Singapore)PrivateLimited• MISCCapital(L)Limited • MISCEnterprisesHoldingsSdn.Bhd.• MISCFerryServicesSdn.Bhd. • MISCFloatingProductionSystem(Gumusut)Ltd.• MISCHaulageServicesSdn.Bhd. • MISCOffshoreMobileProduction(Labuan)Ltd• MISCInternational(L)Limited • MISCIntegratedLogisticsSdn.Bhd.• MISCNigeriaLtd. • MISCOffshoreFloatingTerminals(L)Limited• MISCOffshoreHoldings(Brazil)Sdn.Bhd. • MISCPropertiesSdn.Bhd.• MISCShipManagementSdn.Bhd. • MISCTankerHoldingsSdn.Bhd.• MISCTankerHoldings(Bermuda)Limited • MISCTruckingandWarehousingServicesSdn.Bhd.• MMHE-ATBSdn.Bhd. • MMHE-SHILNGSdn.Bhd.• MTTISdn.Bhd. • MSECorporationSdn.Bhd.• MalaysiaMarineandHeavyEngineeringHoldingsBerhad •MISCTankersSdn.Bhd. (formerly known as MSE Holdings Sdn. Bhd.) (formerly knows as PETRONAS Tankers Sdn. Bhd.)• PuteriDelimaSatu(L)PrivateLimited •PuteriDelimaSdn.Bhd.• PuteriFirusSatu(L)PrivateLimited •PuteriFirusSdn.Bhd.• PuteriIntanSatu(L)PrivateLimited •PuteriIntanSdn.Bhd.• PuteriNilamSatu(L)PrivateLimited •PuteriMutiaraSatu(L)PrivateLimited• PuteriZamrudSatu(L)PrivateLimited • PuteriNilamSdn.Bhd.• PuteriZamrudSdn.Bhd. • TechnoIndahSdn.Bhd.

218 PETRONAS Annual Report 2011
APPENDIX I
SUBSIDIARIES AUDITED BY OTHER FIRM OF ACCOUNTANTS (continued)
PETRONAS Carigali Sdn. Bhd. and its subsidiaries:
• DobaPipelineInvestmentInc. • PCAlgeriaLtd.(ϒ)• PCGulfLtd. • PCLampungIILtd.• PC(NorthEastMaduraIV)Ltd. • PCRanduguntingLtd.• PC(SEPalungAru)Ltd.(fkaPETRONASCarigaliBahrainLtd.) • PCSouthPars11Ltd.• PC(TimorSea06-102)Ltd. • PCVenezuelaLtd.• PETRONASCarigali(Australia)Pty.Ltd. • PETRONASCarigali(Baisun)OperatingCompanyLLC• PETRONASCarigali(ChadEP)Inc. • PETRONASCarigali(Karapan)Ltd.• PETRONASCarigali(Ketapang)Ltd. • PETRONASCarigaliKetapangIILtd.• PETRONASCarigali(Surumana)Ltd. • PETRONASCarigali(Surkhanski)OperatingCompanyLLC• PETRONASCarigali(TanjungJabung)Ltd. • PETRONASCarigali(TanjungAru)Ltd.• PETRONASCarigaliEquatorialGuineaLtd. • PETRONASCarigaliChadExploration&ProductionInc.• PETRONASChadMarketingInc. • PETRONASCarigaliInternationalSdn.Bhd.• PETRONASCarigaliMyanmarIIInc. • PETRONASCarigaliMozambiqueE&PLtd.• PETRONASCarigaliNigerExploration&ProductionLtd. • PETRONASCarigaliNigeriaLimited• PETRONASCarigaliWhiteNile(5B)Ltd. • PETRONASCarigaliOverseasSdn.Bhd.• PETRONASCarigaliVietnam(B10&B11-1)Ltd. • SeeratRefineryInvestmentInc.• PETRONASCarigali(Mandar)Ltd. • PETRONASCarigaliMozambique(RovumaBasin)Ltd.• PETRONASCarigali(Oman)Ltd. • PETRONASCarigaliCameroonLtd.• PETRONASIraq(Garraf)Ltd. • PETRONASCarigali(Baisun)Ltd. (formerlyknownasPETRONASCarigaliIraq(Garraf)Ltd. • PETRONASCarigaliIraq(Halfaya)Ltd.• PETRONASCarigali(WestGlagahKambuna)Ltd. • PETRONASCarigaliIraq(Majnoon)Ltd.• PETRONASCarigaliIraqHoldingB.V. • PETRONASCarigaliIraq(Badra)Ltd.
PETRONAS Chemicals Group Berhad and its subsidiaries:
• KertihPortSdn.Bhd •PETLIN(M)Sdn.Bhd.• PETRONASAmmoniaSdn.Bhd. •PETRONASFertilizer(Kedah)Sdn.Bhd.• PhuMyPlasticsandChemicalsCompanyLtd.(α) •OptimalChemicals(Malaysia)Sdn.Bhd.• OptimalGlycols(Malaysia)Sdn.Bhd. •OptimalOlefins(Malaysia)Sdn.Bhd.• VinylChloride(Malaysia)Sdn.Bhd.
PETRONAS Hartabina Sdn. Bhd. and its subsidiary:
• PrinceCourtMedicalCentreSdn.Bhd.

PETRONAS Annual Report 2011 219
APPENDIX I
SUBSIDIARIES AUDITED BY OTHER FIRM OF ACCOUNTANTS (continued)
PETRONAS International Corporation Ltd. and its subsidiaries:
• AktolChemicals(Pty.)Ltd. • PETRONASLNGLtd.• AzaniaPetroleum(Pty.)Ltd. (formerlyknownasAseanLNGTradingCo.Ltd.)• BGIPropertiesLtd. • CitycatProperties(Pty.)Ltd.• CavalloEngineering&Construction(Pty.)Ltd. • Chemico(Pty.)Ltd.• DurbanLiquidStorage • EngenAfricanMinorityHoldings• EngenAfricanHoldings • EngenGabonS.A.(PizaShellS.A.)• EngenBotswanaLimited(β) • EngenGroupFundingTrust• EngenGhanaLtd. • EngenHoldings(Ghana)Ltd.• EngenHoldings(Pty.)Ltd. • EngenInternationalHoldings(Mauritius)Ltd.• EngenHoldingsZimbabwe(PVT)Ltd. • EngenLesotho(Pty.)Ltd.• EngenKenyaLtd. • EngenMarketingBotswana(Pty.)Ltd.• EngenLimited • Engen(Nigeria)Ltd.• EngenMarketingLtd. • EngenOffshoreHoldings(Mauritius)Ltd.• EngenMarketingZimbabweLtd. • EngenSwaziland(Pty.)Ltd.• EngenNamibia(Pty.)Ltd. • EngenRwandaLtd.• EngenProducing(Nigeria)Ltd. • EngenZimbabwe(PVT)Ltd.• EngenUgandaLtd. • EngenPetroleumInternationalLtd.• EngenPetroleum(Burundi)Ltd. • EngenPetroleum(Mocambique)Limitada• EngenPetroleum(DRC)Ltd. • EngenPetroleumZambiaLtd.• EngenPetroleumLtd. • EngenGuinea-BissauLtd.• EngenPetroleumTanzaniaLtd. • EnpetInsuranceLtd.• EngenPetroleumZimbabwe(PVT)Ltd. • FedericoTrading(Pty.)Ltd.• EnpetAfricaInsuranceLtd. • IvoryProperties(Pty)Ltd.• GasStorageLimited • Imtrasel(Pty)Ltd.• MITCOLabuanCo.Limited. • LabuanEnergyCorporationLimited• MyanmarPETRONASTradingCo.Ltd. • NewJackTrading(Pty.)Ltd.• LECIrelandEmploymentLtd. • OverseasGasStorageLimited• MITCOLabuanIndiaPrivateLtd. • PAPL(Upstream)Pty.Ltd.• NadaPropertiesCo.Ltd.(ϒ) • PCJDALtd.• Natuna1B.V. • PCMuriahLtd.• OilTankingEPZ(Pty.)Ltd. • PCMyanmar(HongKong)Ltd.(ϒ) • Pakenzyl(Pty.)Ltd. • PAPLServicesPty.Ltd.• ParsiInternationalLtd. • PAPL(UpstreamII)Pty.Ld.• PCMaduraLtd. • PetroleumInvestmentHoldingLtd.• PAPL(Downstream)Pty.Ltd. • PETRONASEnergyTradingLtd.• PCMyanmarHoldingsLtd.(ϒ) (formerly known as PETGAS Trading UK Ltd )(ϒ)• PETRONASCarigaliMyanmarInc. • PCVietnamLtd.• PETRONASCarigaliNileLtd. • PetrarchPetroleum(Pty.)Ltd.• PCGreenlandHoldingsLtd. • ArgentineanPipelineMarketingPty.Ltd.• PCGreenlandA/S (formerlyknownasPETRONASArgentinaS.A.)(α)• PETRONASAustraliaPty.Ltd.(ϒ) • PETRONASCarigali(Pakistan)Ltd.• PETRONASCarigali(Jabung)Ltd. • PETRONASCarigaliMyanmarIIIInc.• PETRONASCarigali(Turkmenistan)Sdn.Bhd. • PETRONASEnergyPhilippines,Inc.• PETRONASCarigali(Urga)OperatingCompanyLLC(ϒ)

220 PETRONAS Annual Report 2011
APPENDIX I
SUBSIDIARIES AUDITED BY OTHER FIRM OF ACCOUNTANTS (continued)
PETRONAS International Corporation Ltd. and its subsidiaries (continued):
• PETRONASCarigali(Urga)Ltd. • PETRONASMarketing(India)PrivateLtd.• PETRONASMarketing(China)Co.Ltd.(ϒ) • PETRONASMarketing(Thailand)Co.Ltd.• PETRONASMarketingSudanLtd. • PETRONASNatunaSdn.Bhd.• PETRONASMyanmarLimited. • PETRONASRetail(Thailand)Co.Ltd.• PETRONASPhilippinesInc.(α) • PETRONASRetailProperty(Thailand)Co.Ltd.• PETRONAS(Thailand)Co.Ltd. • PICLMarketingThailandLtd.(ϒ)• PETRONASVietnamCo.Ltd. • PICL(Egypt)CorporationLtd.• PICLSiriCompanyLimited • PSEIrelandLimited• PICLDownstream(Mauritius)Ltd. • PSESevenHeadLtd.• PSEKinsaleEnergyLtd. • Quickstep284(Pty.)Ltd.• PTPETRONASNiagaIndonesia(α) • Quickstep286(Pty.)Ltd.• PCMauritania1Pty.Ltd. • RockyhillProperties(Pty.)Ltd.• PCMauritania2IIBV • SirriInternationalLtd.• PCBruneiCo.Ltd. • SonapPetroleum(SouthAfrica)(Pty.)Ltd.• PAPL(UpstreamII)Pty.Ltd. • ENGEN(Malawi)Ltd.• Quickstep285(Pty.)Ltd. • ENGENDRCSARL(formerlyknownasShellRepublique• RenaissancePetroleum(Pty.)Ltd. DemocratiqueDuCongo)• StarEnergyGasStorageServicesLimited • SEPBurundi• StarEnergyHGGasStorageLimited • StarEnergy(EastMidlands)Limited• StarEnergyOilandGasLimited • StarEnergyGroupPlc• StarEnergyWealdBasinLimited • StarEnergyLimited• DanskGaslagerApS • StarEnergyOilUKLimited• ThangLongLPGJVCompanyLtd. • TheFifthRetailLtd.• UniversalPropertyCompanyLimited • TrekPetroleum(Pty.)Ltd.• ZenexOil(Pty.)Ltd. • XimexEnergyHoldings(PVT)Ltd.• ValaisInvestments(Pty.)Ltd. PETRONAS Maritime Services Sdn. Bhd. and its subsidiary:
• SungaiUdangPortSdn.Bhd.
PETRONAS Assets Sdn. Bhd. and its subsidiaries:
• iPerintisSdnBhd. • PetrofibreNetwork(M)Sdn.Bhd.

PETRONAS Annual Report 2011 221
APPENDIX I
SUBSIDIARIES AUDITED BY OTHER FIRM OF ACCOUNTANTS (continued)
PLI (Netherlands) B.V. and its subsidiaries:
• PETRONASLubricantsItalyS.p.A(α) • PETRONASLubricantsBelgiumN.V.(α)• PETRONASLubrificantesBrasilS.A.(α) • ViscosityOilCo.(α)• PETRONASLubricantsFranceS.A.S. • PETRONASLubricantsPolandSp.Zo.o(α)• PETRONASLubricantsNetherlandsB.V.(α) • PETRONASLubricantsArgentinaS.A.(α)• PETRONASMadeniYaglarTICLTDSTI(α) • PETRONASLubricantsGreatBritainLtd.(α)• PETRONASLubricantsSpainS.L.U.(α) • PETRONASLubricantsDeutschlandGmbH(α)• PETRONASLubricantsPortugalLda(α) • ViscosityOilFincoLLC(α) Subsidiaries held directly by the Company:
• EnergasInsurance(L)Limited • InstituteofTechnologyPETRONASSdn.Bhd.• PETRONASManagementTrainingSdn.Bhd. • PETRONASe-LearningSolutionsSdn.Bhd.• PETRONASSouthAfrica(Pty.)Ltd.(α) • PETRONASIndia(Holdings)Co.Pte.Ltd.(α)• StyreneMonomer(Malaysia)Sdn.Bhd. • PETRONASNGVSdn.Bhd.
ϒ Consolidated based on management financial statements.α Audited by affiliates of KPMG Desa Megat and Co.@ The shares of this subsidiary are quoted on the Main Market of Bursa Malaysia Securities Berhad.β The shares of this subsidiary are quoted on the Botswana Stock Exchange.

2011 Annual R
eport 2011
Petroliam Nasional Berhad (Company No. 20076-K)
Registered Office: Tower 1, PETRONAS Twin Towers,
Kuala Lumpur City Centre, 50088 Kuala Lumpur Malaysia
Telephone : +603 2051 5000
Fax : +603 2026 5050
www.petronas.com
Annual Report
actual look and feel