Embed Size (px)
Citation preview
VILLAGE ROADSHOW LIMITED
ANNUAL REPORT
T H E M E PA R K S
Village Roadshow has been involved in theme parks since 1989 and is Australia’s leading theme park developer and owner, and one of the pre-eminent theme park operators in the world. In Australia, this includes the well established major parks at Warner Bros. Movie World, Sea World and Wet’n’Wild Gold Coast, as well as Australian Outback Spectacular, Paradise Country, Village Roadshow Studios, Sea World Resort & Water Park, and Sea World Helicopters, all on the Gold Coast in Queensland, and Wet’n’Wild Sydney in New South Wales. VRL also operates Wet’n’Wild Las Vegas in Nevada, USA.
In the past few years VRL has also been pursuing a number of development opportunities throughout Asia, with a specific focus on China. This has resulted in the signing of a binding framework agreement and joint venture agreement for establishment of a funds management business with CITIC Trust Co. Ltd., a Chinese state owned enterprise, with funds raised being used to invest into theme parks, entertainment facilities and related real estate development opportunities.
C I N E M A E X H I B I T I O N
Showing movies has a long tradition with Village Roadshow, having started in 1954 with the first of its drive–in cinemas. Today Village Cinemas jointly owns and operates a combined 722 screens at 75 sites with 538 screens across 52 sites in Australia, 91 screens at 11 sites in Singapore, 81 screens at 11 sites in the United States and 12 screens in the UK.
VRL continues to lead the world with industry trends including stadium seating, 3D blockbuster movies and the growth category of premium cinemas including Gold Class,
and , and is continuing to invest in new cinema development, as well as upgrades and refurbishments to existing cinemas, to deliver state of the art technology and superior comfort across the circuit.
F I L M D I S T R I B U T I O N
Originally started by Village Roadshow in the late 1960’s, Roadshow Films has grown into Australasia’s largest independent film distributor, distributing films to cinemas nationally, to homes with subscription video-on-demand, on Blu-ray and DVD and digital, to subscription television as well as free to air television. Roadshow is a major force in film distribution in all mediums in Australia.
Roadshow enjoys long standing distribution agreements and relationships with key film suppliers, such as Warner Bros. (since 1971), ABC, BBC, Lionsgate, FilmNation, Relativity, The Weinstein Company and Village Roadshow Pictures. VRL also has film distribution operations in New Zealand, and has recently acquired a 31.03% interest in FilmNation Entertainment, a US-based international film sales and production/distribution company.
F I L M P R O D U C T I O N
Village Roadshow has been involved in the movie making business since the 1960’s. Jointly owned with other leading investors in the entertainment industry, Village Roadshow Entertainment Group consists of Village Roadshow Pictures and Village Roadshow Pictures Asia.
Village Roadshow Pictures is one of the leading independent Hollywood movie producers, having won 11 Academy Awards and 4 Golden Globe Awards for films including The Great Gatsby, Training Day, Mystic River and Happy Feet. Since its inception in 1997, Village Roadshow Pictures has produced and released 85 films with global box office takings of over US$15 billion including blockbuster hits such as The Matrix trilogy, the Ocean’s trilogy, The LEGO Movie, American Sniper, San Andreas and Mad Max: Fury Road.
Village Roadshow Pictures Asia is creating a valuable portfolio of films, and released Zhong Kui: Snow Girl and the Dark Crystal during the year which made almost US$70 million at the box office in China.
E D G E L OYA LT Y
Founded in 2006 and subsequently acquired by VRL in 2012, Edge Loyalty has grown to become Australia’s leading provider of consumer promotions, reward and loyalty solutions, with brands such as Gifte, Gift Card Planet and Good Food Gift Card. Edge Loyalty has been acquiring complementary businesses, and will continue to actively seek further growth opportunities.
ABN 43 010 672 054VILLAGE ROADSHOW LIMITED
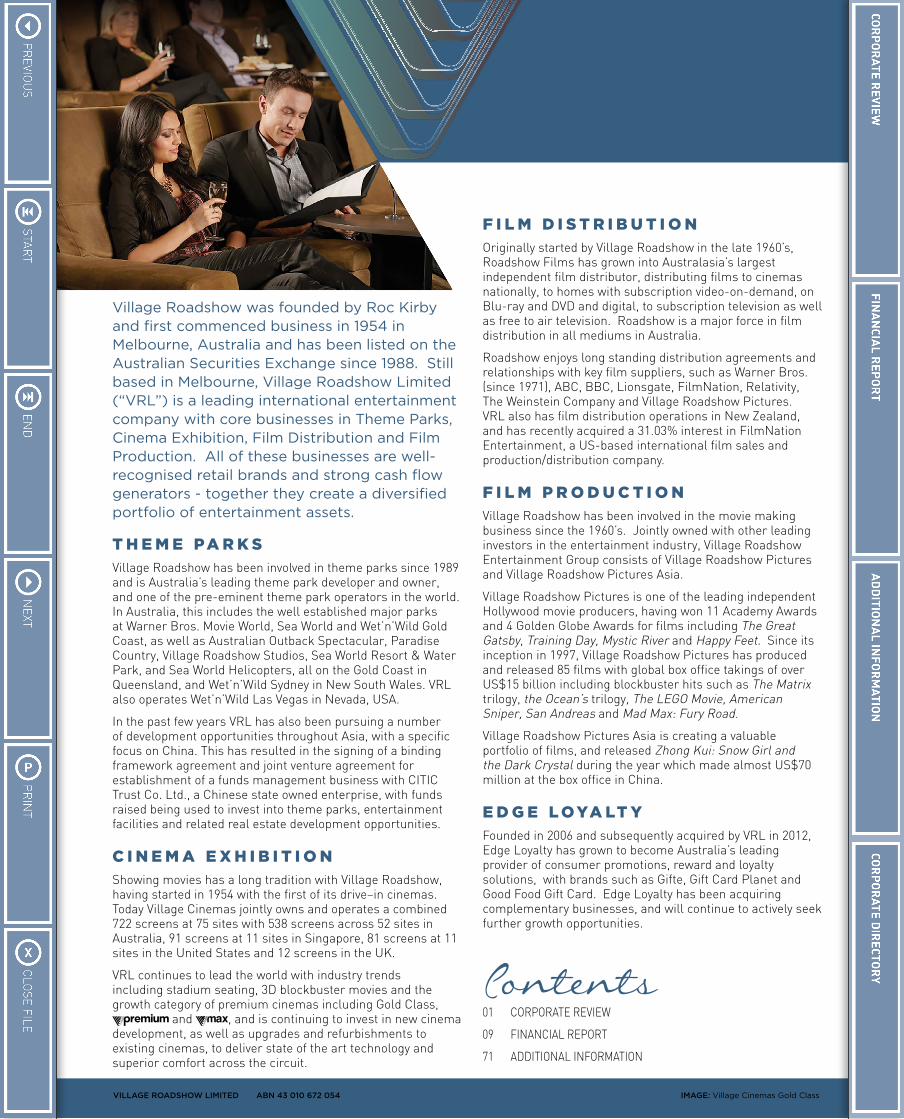
Village Roadshow was founded by Roc Kirby and first commenced business in 1954 in Melbourne, Australia and has been listed on the Australian Securities Exchange since 1988. Still based in Melbourne, Village Roadshow Limited (“VRL”) is a leading international entertainment company with core businesses in Theme Parks, Cinema Exhibition, Film Distribution and Film Production. All of these businesses are well-recognised retail brands and strong cash flow generators - together they create a diversified portfolio of entertainment assets.
Contents01 CORPORATE REVIEW
09 FINANCIAL REPORT
71 ADDITIONAL INFORMATION
IMAGE: Village Cinemas Gold Class
To Our Shareholders
01ANNUAL REPORT 2015
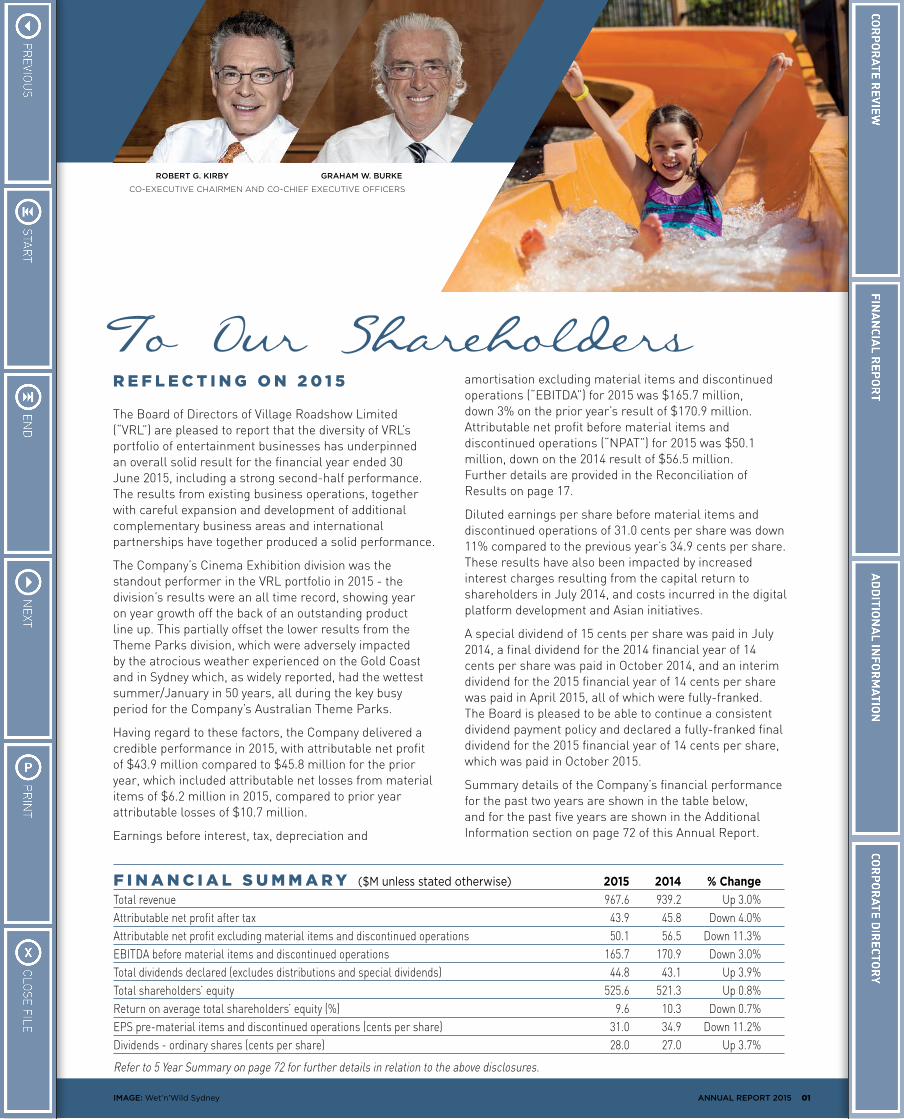
ROBERT G. KIRBY GRAHAM W. BURKE
CO-EXECUTIVE CHAIRMEN AND CO-CHIEF EXECUTIVE OFFICERS
R E F L E C T I N G O N 2 0 1 5
The Board of Directors of Village Roadshow Limited (“VRL”) are pleased to report that the diversity of VRL’s portfolio of entertainment businesses has underpinned an overall solid result for the financial year ended 30 June 2015, including a strong second-half performance. The results from existing business operations, together with careful expansion and development of additional complementary business areas and international partnerships have together produced a solid performance.
The Company’s Cinema Exhibition division was the standout performer in the VRL portfolio in 2015 - the division’s results were an all time record, showing year on year growth off the back of an outstanding product line up. This partially offset the lower results from the Theme Parks division, which were adversely impacted by the atrocious weather experienced on the Gold Coast and in Sydney which, as widely reported, had the wettest summer/January in 50 years, all during the key busy period for the Company’s Australian Theme Parks.
Having regard to these factors, the Company delivered a credible performance in 2015, with attributable net profit of $43.9 million compared to $45.8 million for the prior year, which included attributable net losses from material items of $6.2 million in 2015, compared to prior year attributable losses of $10.7 million.
Earnings before interest, tax, depreciation and
amortisation excluding material items and discontinued operations (“EBITDA”) for 2015 was $165.7 million, down 3% on the prior year’s result of $170.9 million. Attributable net profit before material items and discontinued operations (“NPAT”) for 2015 was $50.1 million, down on the 2014 result of $56.5 million. Further details are provided in the Reconciliation of Results on page 17.
Diluted earnings per share before material items and discontinued operations of 31.0 cents per share was down 11% compared to the previous year’s 34.9 cents per share. These results have also been impacted by increased interest charges resulting from the capital return to shareholders in July 2014, and costs incurred in the digital platform development and Asian initiatives.
A special dividend of 15 cents per share was paid in July 2014, a final dividend for the 2014 financial year of 14 cents per share was paid in October 2014, and an interim dividend for the 2015 financial year of 14 cents per share was paid in April 2015, all of which were fully-franked. The Board is pleased to be able to continue a consistent dividend payment policy and declared a fully-franked final dividend for the 2015 financial year of 14 cents per share, which was paid in October 2015.
Summary details of the Company’s financial performance for the past two years are shown in the table below, and for the past five years are shown in the Additional Information section on page 72 of this Annual Report.
F I N A N C I A L S U M M A R Y ($M unless stated otherwise) 2015 2014 % Change
Total revenue 967.6 939.2 Up 3.0%Attributable net profit after tax 43.9 45.8 Down 4.0%Attributable net profit excluding material items and discontinued operations 50.1 56.5 Down 11.3%EBITDA before material items and discontinued operations 165.7 170.9 Down 3.0%Total dividends declared (excludes distributions and special dividends) 44.8 43.1 Up 3.9%Total shareholders’ equity 525.6 521.3 Up 0.8%Return on average total shareholders’ equity (%) 9.6 10.3 Down 0.7%EPS pre-material items and discontinued operations (cents per share) 31.0 34.9 Down 11.2%Dividends - ordinary shares (cents per share) 28.0 27.0 Up 3.7%
Refer to 5 Year Summary on page 72 for further details in relation to the above disclosures.
IMAGE: Wet’n’Wild Sydney
02 VILLAGE ROADSHOW LIMITED
A U S T R A L I A N T H E M E PA R K S
Village Roadshow Theme Parks (“VRTP”) is Australia’s leading theme park developer and owner, and one of the pre-eminent theme park operators in the world. VRTP includes the well established major parks at Warner Bros. Movie World, Sea World and Wet’n’Wild Gold Coast, as well as Australian Outback Spectacular, Paradise Country, Village Roadshow Studios, Sea World Resort & Water Park, and Sea World Helicopters, all in Queensland, and Wet’n’Wild in Sydney, New South Wales.
VRTP delivers unrivalled and ground-breaking rides, slides, entertainment, attractions, facilities, and dining at all of our attractions, with a vision to always bring “world’s first” and “world’s best” experiences to all of our customers.
In Australia, VRTP reported a full-year EBITDA result of $89.1 million, down slightly on the prior year result of $90.0 million, and operating profit before tax excluding material items and discontinued operations (“PBT”) of $27.3 million, down 15% compared to the prior year. VRTP’s performance reflected a solid second-half despite record rainfall on the East Coast during key trading periods and corresponding softness in ticket sales, and managed to produce an EBITDA result only slightly below that of last year.
Sea World Resort, Village Roadshow Studios and Paradise Country all enjoyed strong results for the year, demonstrating the ability of these businesses to operate strongly through the difficult conditions.
The introduction of Carnivale to Warner Bros. Movie World in July 2014 was so successful, it was followed by a second release of this special event during the 2015 Easter holidays. This new event joins the already popular Halloween Fright Nights and White Christmas events. The new Warner Bros. Movie World’s Junior Driving School which opened in September 2014 has been very popular with our younger customers and their families.
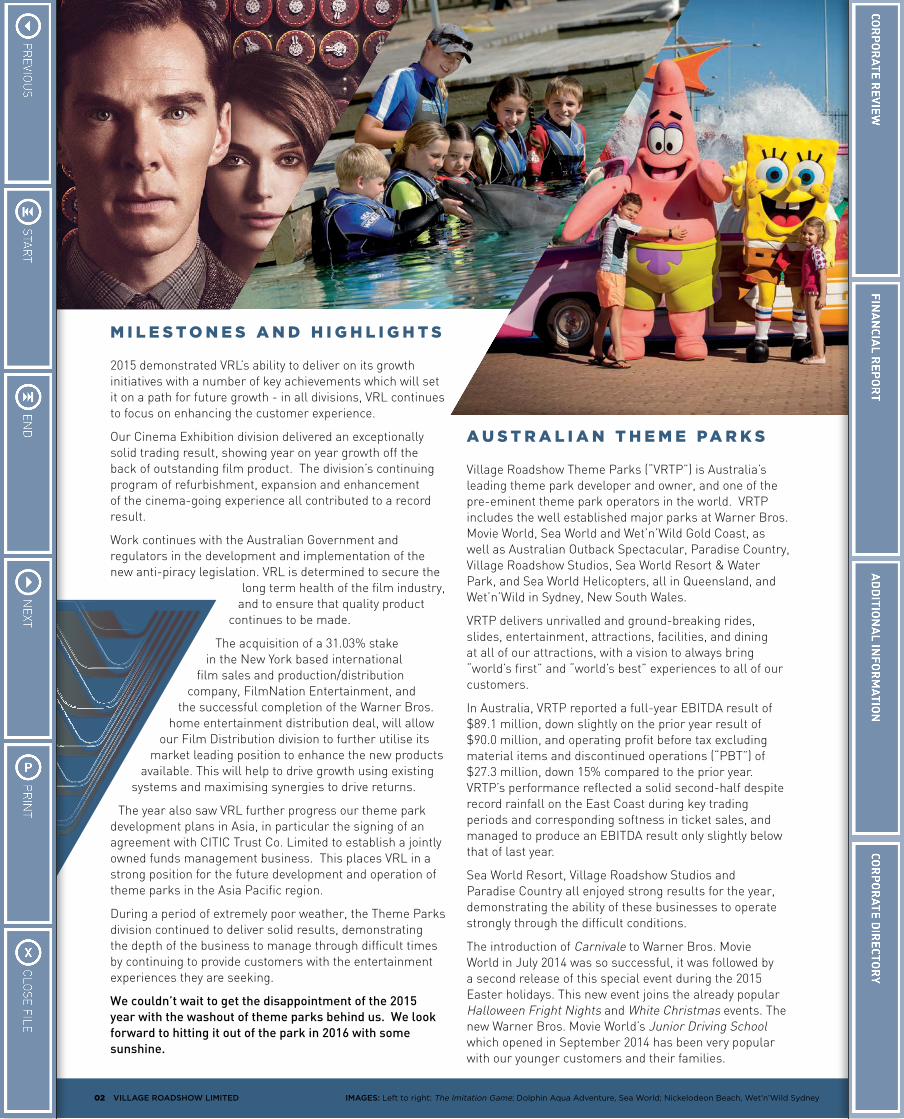
IMAGES: Left to right: The Imitation Game; Dolphin Aqua Adventure, Sea World; Nickelodeon Beach, Wet’n’Wild Sydney
M I L E S T O N E S A N D H I G H L I G H T S
2015 demonstrated VRL’s ability to deliver on its growth initiatives with a number of key achievements which will set it on a path for future growth - in all divisions, VRL continues to focus on enhancing the customer experience.
Our Cinema Exhibition division delivered an exceptionally solid trading result, showing year on year growth off the back of outstanding film product. The division’s continuing program of refurbishment, expansion and enhancement of the cinema-going experience all contributed to a record result.
Work continues with the Australian Government and regulators in the development and implementation of the new anti-piracy legislation. VRL is determined to secure the
long term health of the film industry, and to ensure that quality product
continues to be made.
The acquisition of a 31.03% stake in the New York based international
film sales and production/distribution company, FilmNation Entertainment, and
the successful completion of the Warner Bros. home entertainment distribution deal, will allow
our Film Distribution division to further utilise its market leading position to enhance the new products
available. This will help to drive growth using existing systems and maximising synergies to drive returns.
The year also saw VRL further progress our theme park development plans in Asia, in particular the signing of an agreement with CITIC Trust Co. Limited to establish a jointly owned funds management business. This places VRL in a strong position for the future development and operation of theme parks in the Asia Pacific region.
During a period of extremely poor weather, the Theme Parks division continued to deliver solid results, demonstrating the depth of the business to manage through difficult times by continuing to provide customers with the entertainment experiences they are seeking.
We couldn’t wait to get the disappointment of the 2015 year with the washout of theme parks behind us. We look forward to hitting it out of the park in 2016 with some sunshine.
03
At Sea World the Storm Coaster and the Polar Bears exhibit continued to attract crowds and the Creatures of the Deep exhibit, which opened in June this year, is also proving very popular with young children and their parents. The opening of the Nickelodeon Land children’s area at Sea World in September 2015 has also been very well received and has further added to the offerings for families at this park.
At the adjacent Sea World Resort & Water Park, another outstanding performance was achieved in 2015, with revenue 4.6% up on the previous year and operating profit up 8.8%. The overall performance of the Resort has been outstanding, with an average occupancy rate of 87.8% during the 2015 financial year. This stellar performance is expected to be sustained with the opening of the new 800 seat conference centre at the Resort in July 2015, with forward bookings well ahead of expectations.
The new Wet’n’Wild Junior area at Wet’n’Wild Gold Coast opened successfully in September 2014, and has been well received by guests. With the expected and hopeful return to a stable weather pattern for the upcoming spring/summer season, VRTP expects this new area to drive higher family visitation at this park.
The Australian Outback Spectacular show, High Country Legends, successfully opened in December 2014 and has enjoyed strong attendance to date, and a record year was achieved at Paradise Country.
The recently announced construction of another larger sound stage at Village Roadshow Studios, in conjunction with the Queensland Government, should be a drawcard to major film studios. The stage will initially be used as part of the Commonwealth Games, after which it will revert to a sound stage for Village Roadshow Studios.
The second season for Wet’n’Wild Sydney started strongly, however it was severely impacted by the widely-reported wettest summer/January in Sydney in 50 years. Expectations for the third season are promising following a revised ticket offering and better weather expectations.
VRTP has introduced a new membership/instalment plan for annual passes at its Gold Coast parks, and a number of similar ticketing initiatives are planned at Wet’n’Wild Sydney. VRL continues to invest in attractions, rides and other enhancements to the guest experience at its parks to maintain VRTP’s premium position in the market place.
I N T E R N AT I O N A L T H E M E PA R K S
Throughout 2015, VRL continued to pursue development opportunities in China, and in March this year announced the signing of a joint venture agreement to establish a funds management business with CITIC Trust Co. Ltd (“CITIC”). Funds raised will be for the purpose of investing in theme parks, entertainment facilities and related real estate development throughout Asia, with a particular focus on China. The funds management company for this and future funds will be owned 51% by CITIC and 49% by VRL.
Entering into this long term funds management business with CITIC will be complementary to, and will leverage the advantages of, VRL’s unique theme park opportunities in the region. VRL expects to generate fees through its equity ownership in the fund manager, whilst VRTP will benefit through a minimum 60% ownership of the management company responsible for design/construction/operating contracts for the theme parks initiated by the fund.
Wet’n’Wild Las Vegas’ opened in late May 2013 and operates over the period from April to October. The third season was negatively impacted by the first full season’s operation of the competitor water park in the adjoining suburb, and this had a significant impact given the relatively small core market in Las Vegas. Various strategies to remedy this are being pursued to maintain VRTP’s premium position and market share.
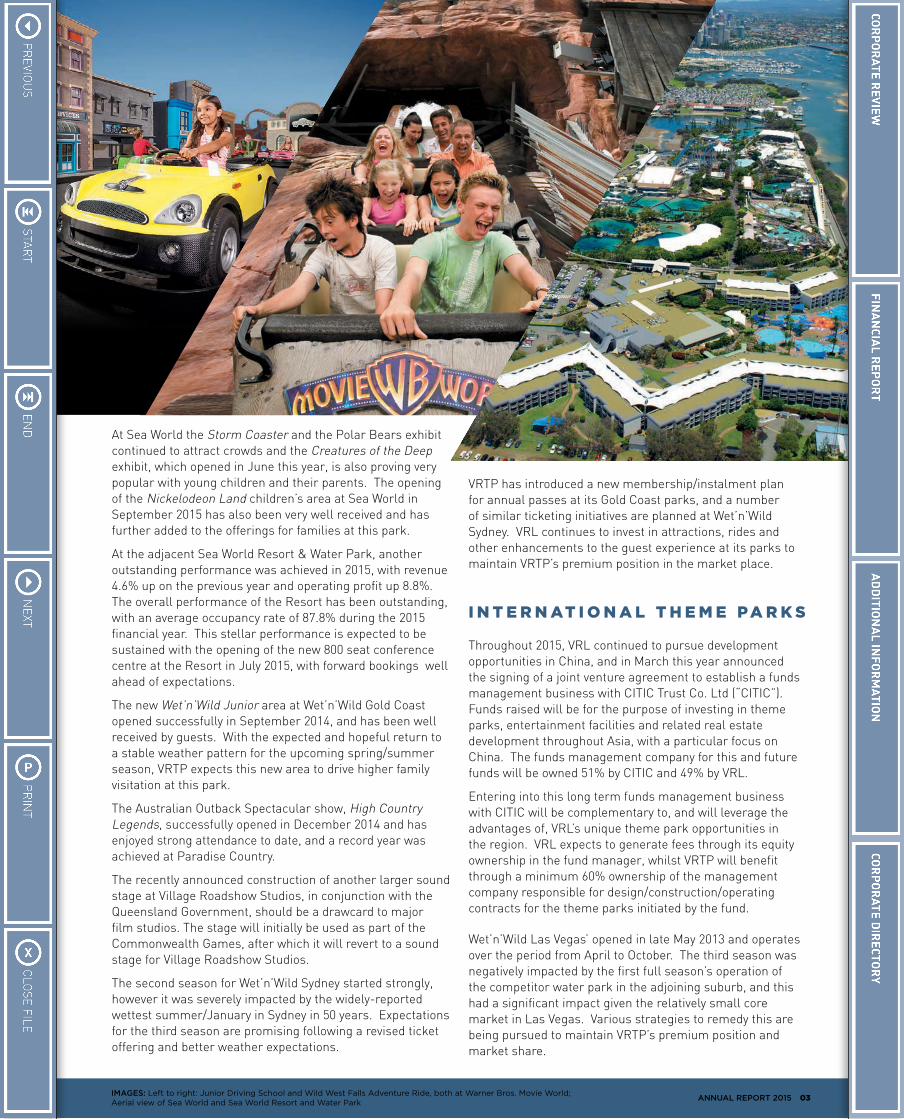
IMAGES: Left to right: Junior Driving School and Wild West Falls Adventure Ride, both at Warner Bros. Movie World; Aerial view of Sea World and Sea World Resort and Water Park
ANNUAL REPORT 2015
04 VILLAGE ROADSHOW LIMITED
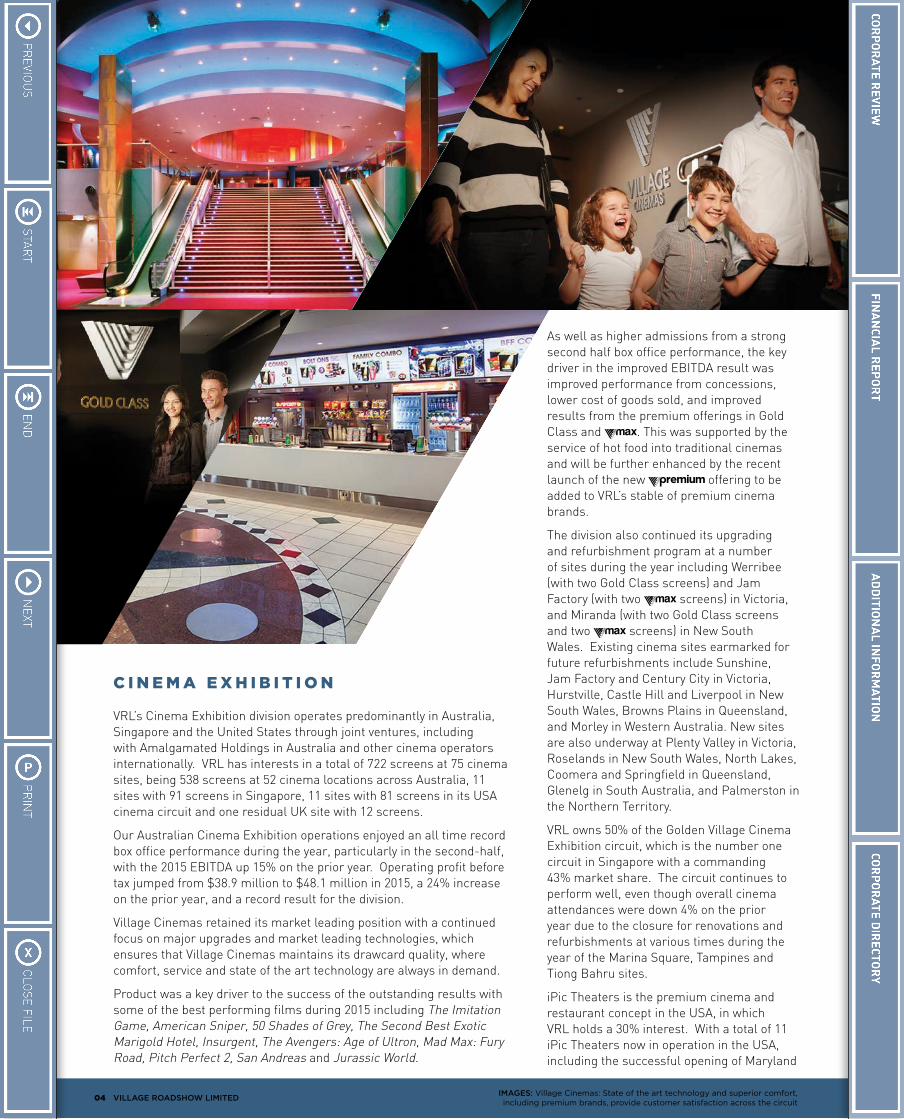
C I N E M A E X H I B I T I O N
VRL’s Cinema Exhibition division operates predominantly in Australia, Singapore and the United States through joint ventures, including with Amalgamated Holdings in Australia and other cinema operators internationally. VRL has interests in a total of 722 screens at 75 cinema sites, being 538 screens at 52 cinema locations across Australia, 11 sites with 91 screens in Singapore, 11 sites with 81 screens in its USA cinema circuit and one residual UK site with 12 screens.
Our Australian Cinema Exhibition operations enjoyed an all time record box office performance during the year, particularly in the second-half, with the 2015 EBITDA up 15% on the prior year. Operating profit before tax jumped from $38.9 million to $48.1 million in 2015, a 24% increase on the prior year, and a record result for the division.
Village Cinemas retained its market leading position with a continued focus on major upgrades and market leading technologies, which ensures that Village Cinemas maintains its drawcard quality, where comfort, service and state of the art technology are always in demand.
Product was a key driver to the success of the outstanding results with some of the best performing films during 2015 including The Imitation Game, American Sniper, 50 Shades of Grey, The Second Best Exotic Marigold Hotel, Insurgent, The Avengers: Age of Ultron, Mad Max: Fury Road, Pitch Perfect 2, San Andreas and Jurassic World.
As well as higher admissions from a strong second half box office performance, the key driver in the improved EBITDA result was improved performance from concessions, lower cost of goods sold, and improved results from the premium offerings in Gold Class and . This was supported by the service of hot food into traditional cinemas and will be further enhanced by the recent launch of the new offering to be added to VRL’s stable of premium cinema brands.
The division also continued its upgrading and refurbishment program at a number of sites during the year including Werribee (with two Gold Class screens) and Jam Factory (with two screens) in Victoria, and Miranda (with two Gold Class screens and two screens) in New South Wales. Existing cinema sites earmarked for future refurbishments include Sunshine, Jam Factory and Century City in Victoria, Hurstville, Castle Hill and Liverpool in New South Wales, Browns Plains in Queensland, and Morley in Western Australia. New sites are also underway at Plenty Valley in Victoria, Roselands in New South Wales, North Lakes, Coomera and Springfield in Queensland, Glenelg in South Australia, and Palmerston in the Northern Territory.
VRL owns 50% of the Golden Village Cinema Exhibition circuit, which is the number one circuit in Singapore with a commanding 43% market share. The circuit continues to perform well, even though overall cinema attendances were down 4% on the prior year due to the closure for renovations and refurbishments at various times during the year of the Marina Square, Tampines and Tiong Bahru sites.
iPic Theaters is the premium cinema and restaurant concept in the USA, in which VRL holds a 30% interest. With a total of 11 iPic Theaters now in operation in the USA, including the successful opening of Maryland
IMAGES: Village Cinemas: State of the art technology and superior comfort, including premium brands, provide customer satisfaction across the circuit
05
in November 2014, together with two further sites in North Miami and Houston slated for opening in the second half of calendar 2015, the circuit is on track to reaching its goal of critical mass. VRL and its partners remain confident, particularly through the great success of the recently opened sites, that this circuit will be a valuable asset in the medium term.
VRL continues to actively seek an exit strategy for its Belfast site, while in the meantime focus remains on controlling costs and maintaining admissions at the site.
With the anticipated tremendous line-up of titles scheduled for the remainder of the year, prospects are looking excellent for yet another year of robust cinema box office. Some of these forthcoming films include the next James Bond epic, Spectre, the hugely anticipated Episode VII of Star Wars: The Force Awakens, as well as Batman v Superman: Dawn of Justice and the final in the Hunger Games franchise.
F I L M D I S T R I B U T I O N
The largest independent film distributor in Australia and New Zealand, VRL’s Film Distribution division includes Roadshow Films, Roadshow Entertainment, Roadshow Digital and Roadshow Television. The division connects film content with audiences through Roadshow Films’ diverse sales distribution network. Titles are provided to various markets throughout a film’s entire life-cycle – from theatrical release to cinemas, to home entertainment on Blu-ray and DVD and digital, subscription television and free to air television - with Roadshow being the one–stop solution for delivering content to audiences.
This division’s EBITDA result of $34.6 million for 2015 was down 17% on the prior year, and PBT was down 18% to $28.7 million in the 2015 financial year. Roadshow finished the year as the leading theatrical distributor in Australia with a commanding 25.4% market share. The results for the 2015 financial year fell short of expectations and prior year due to challenging commercial product mix and higher royalty rates on some titles.
Warner Bros. continued to be a key supplier releasing 14 titles over the year including the stand-out box office
successes of The Hobbit: Battle of the Five Armies and Interstellar. Also notable during the year were the three Village Roadshow Pictures’ films American Sniper, San Andreas and Mad Max: Fury Road, as well as the Lionsgate film Hunger Games: Mockingjay Part 1, the FilmNation Oscar nominated title The Imitation Game, and the Australian movie Paper Planes.
The acquisition, effective from 1 January 2015, of a 31.03% equity share in FilmNation Entertainment, an international film sales and production/distribution company based in New York, has enabled Roadshow to broaden the diversity of its earnings channels. It is anticipated that this business will continue to make a positive contribution to Roadshow’s results.
The upcoming slate of movies in the coming year looks promising, including Batman v Superman: Dawn of Justice and The Intern from Warner Bros. and Sicario and Hunger Games: Mockingjay Part 2 from Lionsgate.
Roadshow Entertainment held the largest market share in 2015 in the physical retail market for DVDs with 31%, as well as 16.8% of the digital transactional market in Australia. The digital transactional market grew by 10.3% in Australia over the year, however the physical DVD market declined by 11.3%. A substantial strategic distribution deal was signed in February 2015, extending the existing Roadshow Films theatrical distribution relationship to include the home entertainment licensing of Warner Bros. film, TV and Home Box Office content in Australia and New Zealand, including the hugely popular HBO Game of Thrones series.
Roadshow’s physical product sales revenue was up 10% on the prior year largely due to the distribution of additional Warner Bros. product and impressive sales from the BBC catalogue. Roadshow shipped over 11.5 million units across all labels during the year, 9% higher than the prior year, with the leading physical retailers being JB Hi Fi,
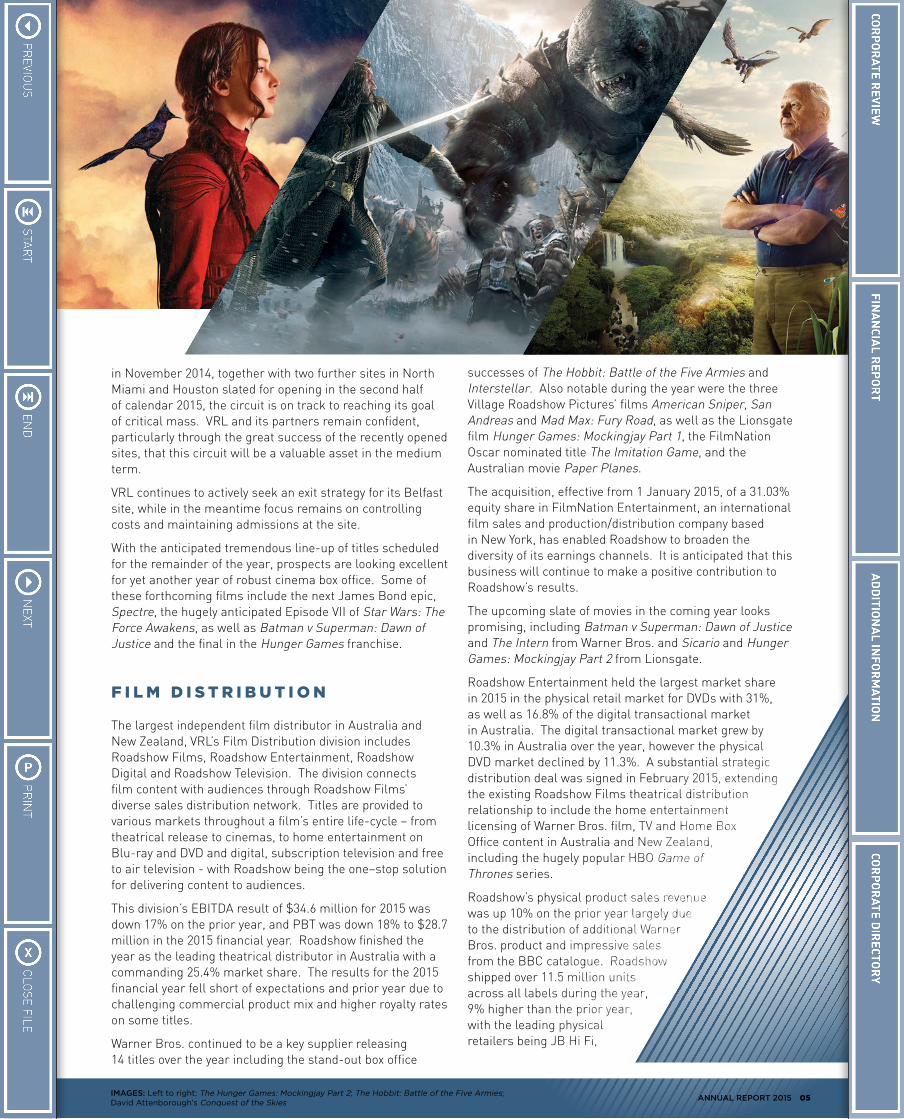
IMAGES: Left to right: The Hunger Games: Mockingjay Part 2; The Hobbit: Battle of the Five Armies; David Attenborough’s Conquest of the Skies
ANNUAL REPORT 2015
06 VILLAGE ROADSHOW LIMITED
Sanity, Target and Big W. The stand out title for 2015 in terms of revenue, both for physical and digital sales, was the Village Roadshow Pictures film The LEGO Movie.
Digital revenues in 2015 were up 39% on the prior year, and even removing the effect of the additional distribution of Warner Bros. digital product, digital revenues were up 29% compared to 2014. Electronic sell-through sales were also significantly up in 2015 over the prior corresponding period. Roadshow’s biggest digital partners – iTunes, Foxtel and Telstra Big Pond – account for approximately 85% of Roadshow’s digital sales and Roadshow was the number one supplier of movies to the iTunes platform in Australia during 2015. Roadshow anticipates that the digital market will evolve further in the year ahead as competition increases and each platform looks to drive transactions on their own platform.
For Roadshow Television, during the year a content licensing deal was signed with the subscription video-on-demand (“SVOD”) platform Stan, providing
access to a selection of Roadshow’s broad catalogue of award-winning film titles and TV
series, accelerating Roadshow’s entry into the growing Digital marketplace. Roadshow
also entered into a multi-year agreement with the dominant global SVOD service
provider Netflix, providing access to a substantial volume of its film library
and selected TV series.
Roadshow Television’s sales and EBITDA were a healthy 10%
and 12% respectively up on the prior year, mainly due
to the launch of the SVOD platforms in the second
half of 2015. Further strong sales growth in
SVOD is anticipated in following years.
F I L M P R O D U C T I O N
Village Roadshow Entertainment Group Limited (“VREG”) is 47.12% owned by the VRL group, and is equity-accounted with no carrying value for accounting purposes. The VRL group results only include cash dividends received from VREG, and no cash dividends were received in 2015, as these are dependent on film performance and available free cash flow in VREG. VREG consists of Village Roadshow Pictures (“VRP”) and Village Roadshow Pictures Asia (“VRP Asia”).
In October 2014 VRP extended its co-production and co-financing agreement with Warner Bros. and incorporated the ability to invest in global film rights as part of that extension. In December 2014, VRP entered an additional global film rights co-production and co-financing agreement with Sony Pictures Entertainment. Both agreements continue to the end of 2019, with the Warner Bros. arrangement now extending into its third decade.
VRP released 8 films in 2015: Into the Storm, The Equalizer, The Judge, Annie, American Sniper, Jupiter Ascending, Mad Max: Fury Road and San Andreas. Standout performers were American Sniper, which won an Academy Award and grossed US$547 million worldwide, the critically acclaimed Mad Max: Fury Road which has grossed US$374 million worldwide and San Andreas, which has grossed US$472 million worldwide to date.
Upcoming titles from VRP include Goosebumps, based on the best-selling young adult book series and starring Jack Black; In the Heart of the Sea, directed by Ron Howard and starring Chris Hemsworth; Concussion, a true story about the doctor, played by Will Smith, who made the first discovery of American football related brain trauma and challenged the NFL; Grimsby, a comedy starring Sasha Baron Cohen; Tarzan, a re-telling of the famous character directed by David Yates and starring Samuel L. Jackson and Christoph Waltz; and King Arthur, directed by Guy Ritchie, who previously directed two highly successful Sherlock Holmes films for VRP.
VRP Asia released one film during the year, Zhong Kui: Snow Girl and The Dark Crystal, in February 2015 during the Chinese New Year holiday period, which made almost US$70 million at the box office in China. Upcoming releases from VRP Asia include Mountain Cry and through Irresistible Films, VRP Asia’s Hong Kong joint venture with Bill Kong, Go Away Mr. Tumor, The Bodyguard, Cold War 2 and Bound.
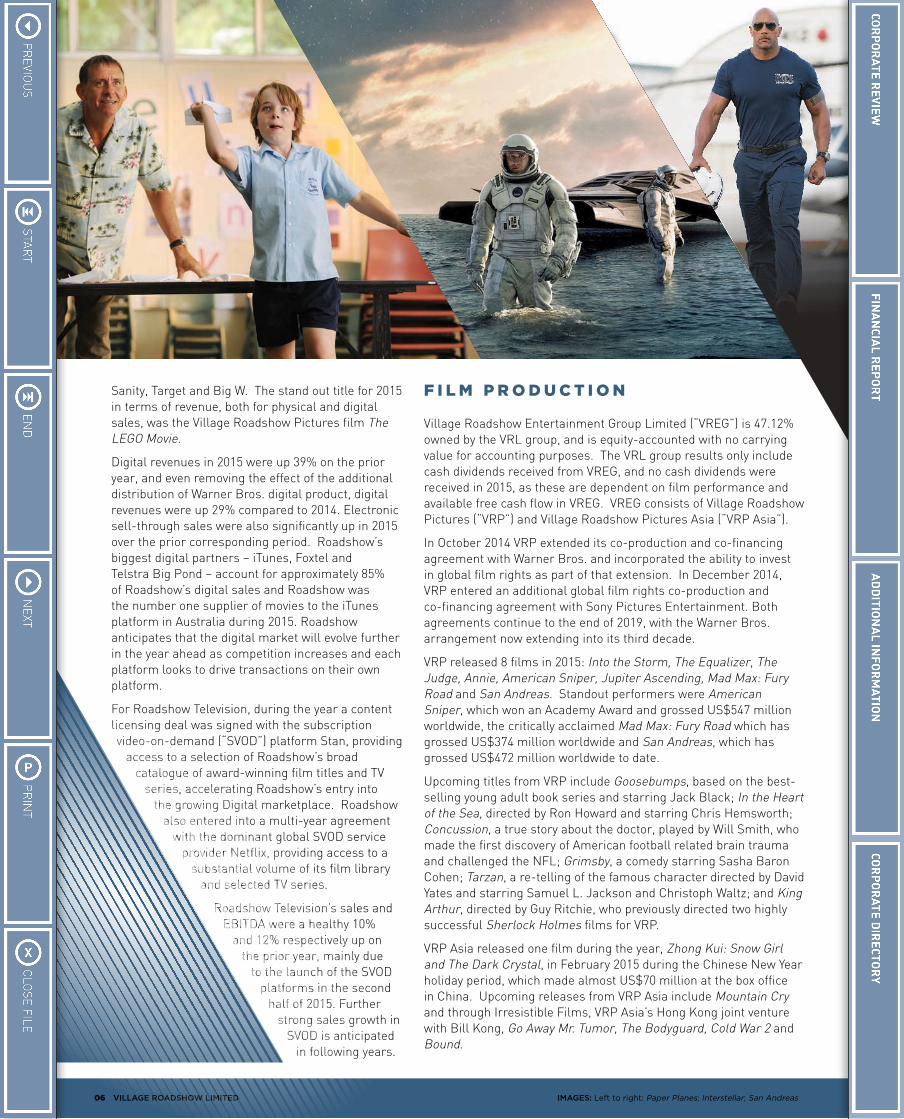
IMAGES: Left to right: Paper Planes; Interstellar; San Andreas
07ANNUAL REPORT 2015
As announced in September 2015, VREG has completed new corporate debt facilities totalling US$325 million, refinancing its existing corporate debt facility and providing additional working capital. The VRL group has contributed US$15 million of this total, which will need to be written off for accounting purposes, despite the company’s confidence in the underlying value of this additional net investment. This accounting loss of opproximately A$20 million will be disclosed with material items in VRL’s results for the 2016 financial year.
C O R P O R AT E A N D D I G I TA L
Founded in 2006 and subsequently acquired by VRL in 2012, Edge Loyalty has grown to become Australia’s leading provider of consumer promotions, reward and loyalty solutions. Edge Loyalty’s competitive advantage is driven by its specialist ability to risk-manage promotions, its unique portfolio of products and the bespoke technologies it has developed to deliver its services. This competitive advantage allows Edge Loyalty to develop innovative solutions that add value to its clients’ brands and accelerate performance.
Edge Loyalty achieved significant growth in the 2015 financial year, with revenues up 67% and delivering an underlying EBITDA of $3.4 million against last year’s result of $1.5 million. The strong performance was driven by growth of the Good Food Gift Card business, the acquisition of the Prime Focus promotions business in November 2014, continued organic growth of Edge Loyalty’s gift cards business, and a restructure of the MyFun business.
Total net Corporate and Other costs for the year ended 30 June 2015 were $38.4 million, compared to $32.3 million for the 2014 financial year, and EBITDA for the year ended 30 June 2015 was ($32.9) million, compared to ($30.1) million in the prior year. The 2015 results included an increase of $3.3 million in Asia Development costs, which related to the substantial ongoing business development work in this area, as well as the establishment and operation of the Hong Kong office.
Over the last 6 months the VRL group has undertaken a detailed review of the cost structures in the IT and shared services areas of the business. This has resulted in the realignment of service areas to meet the changing needs of the group and in savings to overhead corporate costs. Net interest expense was higher in 2015 compared to last year due to lower cash reserves, and draw-downs on debt facilities as a result of shareholder distributions.
VRL continues to operate its businesses in an environmentally and socially responsible manner whilst continuing to maximise long term shareholder value. The Company continues its sustainability initiatives in its operating businesses and also remains a firm supporter of charitable and community involvement endeavours. Summarised information and reporting on these matters is available on the Company’s website at www.villageroadshow.com.au.
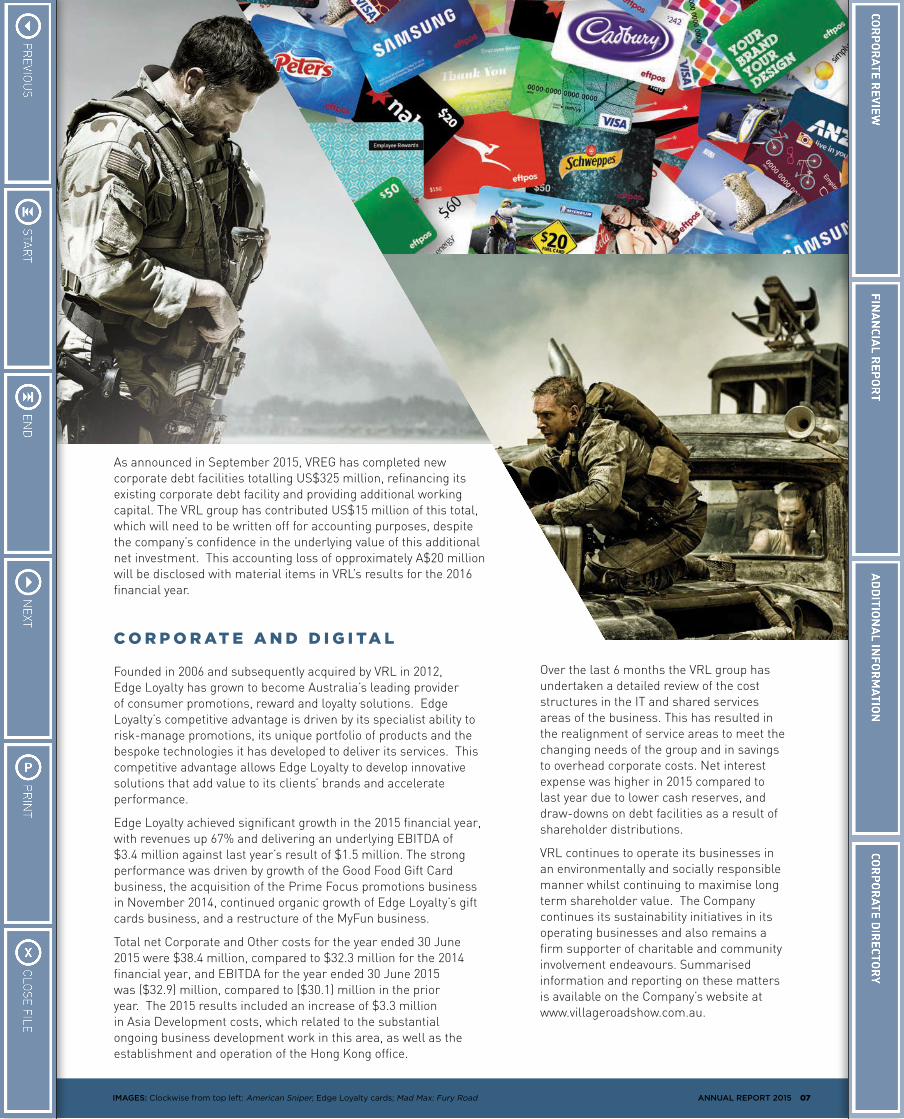
IMAGES: Clockwise from top left: American Sniper; Edge Loyalty cards; Mad Max: Fury Road
08 VILLAGE ROADSHOW LIMITED
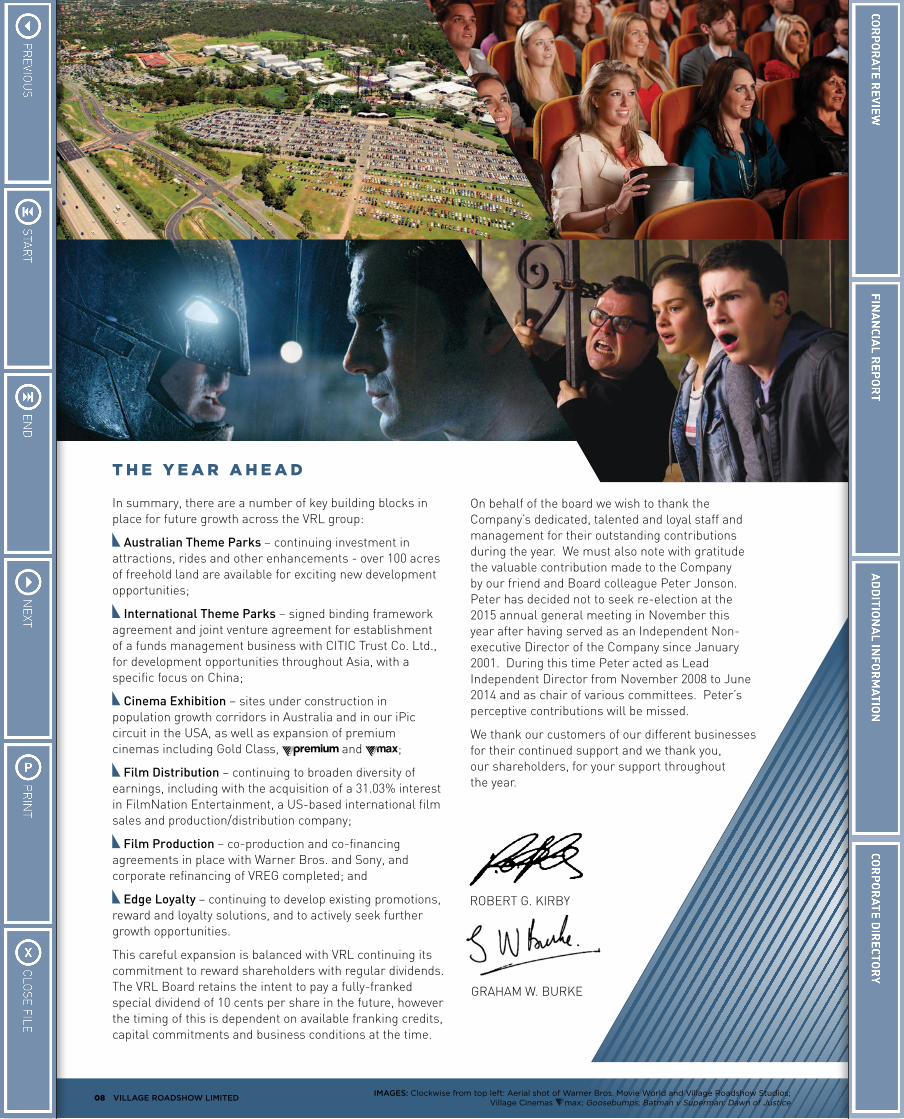
T H E Y E A R A H E A D
In summary, there are a number of key building blocks in place for future growth across the VRL group:
Australian Theme Parks – continuing investment in attractions, rides and other enhancements - over 100 acres of freehold land are available for exciting new development opportunities;
International Theme Parks – signed binding framework agreement and joint venture agreement for establishment of a funds management business with CITIC Trust Co. Ltd., for development opportunities throughout Asia, with a specific focus on China;
Cinema Exhibition – sites under construction in population growth corridors in Australia and in our iPic circuit in the USA, as well as expansion of premium cinemas including Gold Class, and ;
Film Distribution – continuing to broaden diversity of earnings, including with the acquisition of a 31.03% interest in FilmNation Entertainment, a US-based international film sales and production/distribution company;
Film Production – co-production and co-financing agreements in place with Warner Bros. and Sony, and corporate refinancing of VREG completed; and
Edge Loyalty – continuing to develop existing promotions, reward and loyalty solutions, and to actively seek further growth opportunities.
This careful expansion is balanced with VRL continuing its commitment to reward shareholders with regular dividends. The VRL Board retains the intent to pay a fully-franked special dividend of 10 cents per share in the future, however the timing of this is dependent on available franking credits, capital commitments and business conditions at the time.
On behalf of the board we wish to thank the Company’s dedicated, talented and loyal staff and management for their outstanding contributions during the year. We must also note with gratitude the valuable contribution made to the Company by our friend and Board colleague Peter Jonson. Peter has decided not to seek re-election at the 2015 annual general meeting in November this year after having served as an Independent Non-executive Director of the Company since January 2001. During this time Peter acted as Lead Independent Director from November 2008 to June 2014 and as chair of various committees. Peter’s perceptive contributions will be missed.
We thank our customers of our different businesses for their continued support and we thank you, our shareholders, for your support throughout the year.
IMAGES: Clockwise from top left: Aerial shot of Warner Bros. Movie World and Village Roadshow Studios; Village Cinemas max; Goosebumps; Batman v Superman: Dawn of Justice
FIN
ANC
IAL
REP
OR
T 20
15
ABN 43 010 672 054
09ANNUAL REPORT 2015
CONTENTS
10 Directors’ Report16 Auditor’s Independence Declaration17 Reconciliation of Results18 Remuneration Report30 Consolidated Statement of Comprehensive Income31 Consolidated Statement of Financial Position32 Consolidated Statement of Cash Flows33 Consolidated Statement of Changes in Equity34 Notes to the Consolidated Financial Statements34 1 Corporate Information and Summary of Significant
Accounting Policies41 2 Revenue and Expenses from Continuing Operations43 3 Earnings Per Share43 4 Income Tax44 5 Dividends Declared45 6 Cash and Cash Equivalents45 7 Trade and Other Receivables46 8 Inventories46 9 Goodwill and Other Intangible Assets48 10 Other Assets and Film Distribution Royalties48 11 Investments – Equity Accounted50 12 Interests in Joint Operations51 13 Subsidiaries
52 14 Property, Plant & Equipment53 15 Trade and Other Payables53 16 Interest Bearing Loans and Borrowings54 17 Provisions54 18 Other Liabilities55 19 Contributed Equity56 20 Reserves and Retained Earnings57 21 Non-Controlling Interest57 22 Contingencies58 23 Commitments58 24 Key Management Personnel Disclosures59 25 Share Based Payment Plans61 26 Remuneration of Auditors62 27 Events Subsequent to Reporting Date62 28 Parent Entity Disclosures63 29 Segment Reporting64 30 Financial Risk Management
Objectives and Policies69 31 Non-Key Management Personnel
Related Party Transactions69 Directors’ Declaration70 Independent Auditor’s Report
10 VILLAGE ROADSHOW LIMITED
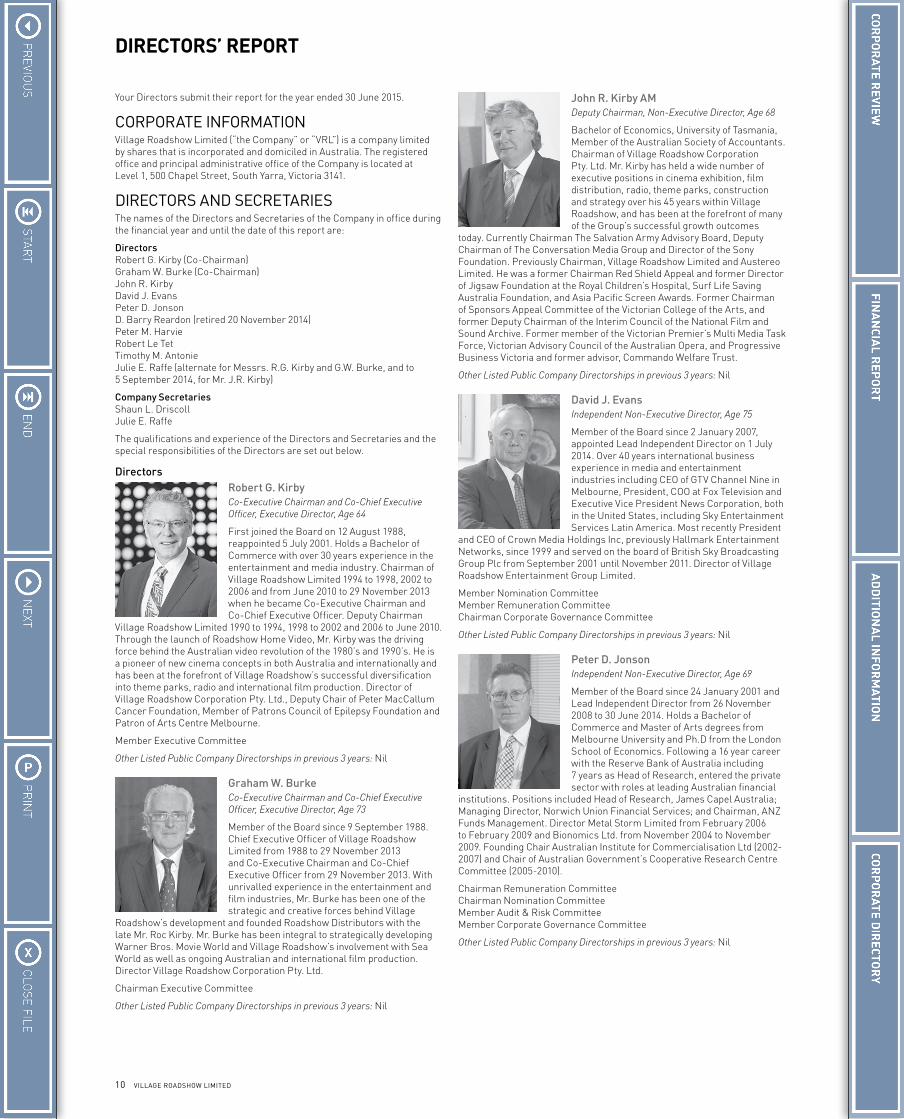
DIRECTORS’ REPORT
Your Directors submit their report for the year ended 30 June 2015.
CORPORATE INFORMATIONVillage Roadshow Limited (“the Company” or “VRL”) is a company limited by shares that is incorporated and domiciled in Australia. The registered office and principal administrative office of the Company is located at Level 1, 500 Chapel Street, South Yarra, Victoria 3141.
DIRECTORS AND SECRETARIESThe names of the Directors and Secretaries of the Company in office during the financial year and until the date of this report are:
DirectorsRobert G. Kirby (Co-Chairman)Graham W. Burke (Co-Chairman)John R. KirbyDavid J. EvansPeter D. JonsonD. Barry Reardon (retired 20 November 2014)Peter M. HarvieRobert Le TetTimothy M. AntonieJulie E. Raffe (alternate for Messrs. R.G. Kirby and G.W. Burke, and to 5 September 2014, for Mr. J.R. Kirby)
Company SecretariesShaun L. DriscollJulie E. Raffe
The qualifications and experience of the Directors and Secretaries and the special responsibilities of the Directors are set out below.
Directors Robert G. Kirby
Co-Executive Chairman and Co-Chief Executive Officer, Executive Director, Age 64
First joined the Board on 12 August 1988, reappointed 5 July 2001. Holds a Bachelor of Commerce with over 30 years experience in the entertainment and media industry. Chairman of Village Roadshow Limited 1994 to 1998, 2002 to 2006 and from June 2010 to 29 November 2013 when he became Co-Executive Chairman and Co-Chief Executive Officer. Deputy Chairman
Village Roadshow Limited 1990 to 1994, 1998 to 2002 and 2006 to June 2010. Through the launch of Roadshow Home Video, Mr. Kirby was the driving force behind the Australian video revolution of the 1980’s and 1990’s. He is a pioneer of new cinema concepts in both Australia and internationally and has been at the forefront of Village Roadshow’s successful diversification into theme parks, radio and international film production. Director of Village Roadshow Corporation Pty. Ltd., Deputy Chair of Peter MacCallum Cancer Foundation, Member of Patrons Council of Epilepsy Foundation and Patron of Arts Centre Melbourne.
Member Executive Committee
Other Listed Public Company Directorships in previous 3 years: Nil
Graham W. BurkeCo-Executive Chairman and Co-Chief Executive Officer, Executive Director, Age 73
Member of the Board since 9 September 1988. Chief Executive Officer of Village Roadshow Limited from 1988 to 29 November 2013 and Co-Executive Chairman and Co-Chief Executive Officer from 29 November 2013. With unrivalled experience in the entertainment and film industries, Mr. Burke has been one of the strategic and creative forces behind Village
Roadshow’s development and founded Roadshow Distributors with the late Mr. Roc Kirby. Mr. Burke has been integral to strategically developing Warner Bros. Movie World and Village Roadshow’s involvement with Sea World as well as ongoing Australian and international film production. Director Village Roadshow Corporation Pty. Ltd.
Chairman Executive Committee
Other Listed Public Company Directorships in previous 3 years: Nil
John R. Kirby AMDeputy Chairman, Non-Executive Director, Age 68
Bachelor of Economics, University of Tasmania, Member of the Australian Society of Accountants. Chairman of Village Roadshow Corporation Pty. Ltd. Mr. Kirby has held a wide number of executive positions in cinema exhibition, film distribution, radio, theme parks, construction and strategy over his 45 years within Village Roadshow, and has been at the forefront of many of the Group’s successful growth outcomes
today. Currently Chairman The Salvation Army Advisory Board, Deputy Chairman of The Conversation Media Group and Director of the Sony Foundation. Previously Chairman, Village Roadshow Limited and Austereo Limited. He was a former Chairman Red Shield Appeal and former Director of Jigsaw Foundation at the Royal Children’s Hospital, Surf Life Saving Australia Foundation, and Asia Pacific Screen Awards. Former Chairman of Sponsors Appeal Committee of the Victorian College of the Arts, and former Deputy Chairman of the Interim Council of the National Film and Sound Archive. Former member of the Victorian Premier’s Multi Media Task Force, Victorian Advisory Council of the Australian Opera, and Progressive Business Victoria and former advisor, Commando Welfare Trust.
Other Listed Public Company Directorships in previous 3 years: Nil
David J. EvansIndependent Non-Executive Director, Age 75
Member of the Board since 2 January 2007, appointed Lead Independent Director on 1 July 2014. Over 40 years international business experience in media and entertainment industries including CEO of GTV Channel Nine in Melbourne, President, COO at Fox Television and Executive Vice President News Corporation, both in the United States, including Sky Entertainment Services Latin America. Most recently President
and CEO of Crown Media Holdings Inc, previously Hallmark Entertainment Networks, since 1999 and served on the board of British Sky Broadcasting Group Plc from September 2001 until November 2011. Director of Village Roadshow Entertainment Group Limited.
Member Nomination CommitteeMember Remuneration CommitteeChairman Corporate Governance Committee
Other Listed Public Company Directorships in previous 3 years: Nil
Peter D. JonsonIndependent Non-Executive Director, Age 69
Member of the Board since 24 January 2001 and Lead Independent Director from 26 November 2008 to 30 June 2014. Holds a Bachelor of Commerce and Master of Arts degrees from Melbourne University and Ph.D from the London School of Economics. Following a 16 year career with the Reserve Bank of Australia including 7 years as Head of Research, entered the private sector with roles at leading Australian financial
institutions. Positions included Head of Research, James Capel Australia; Managing Director, Norwich Union Financial Services; and Chairman, ANZ Funds Management. Director Metal Storm Limited from February 2006 to February 2009 and Bionomics Ltd. from November 2004 to November 2009. Founding Chair Australian Institute for Commercialisation Ltd (2002-2007) and Chair of Australian Government’s Cooperative Research Centre Committee (2005-2010).
Chairman Remuneration CommitteeChairman Nomination CommitteeMember Audit & Risk CommitteeMember Corporate Governance Committee
Other Listed Public Company Directorships in previous 3 years: Nil
11ANNUAL REPORT 2015
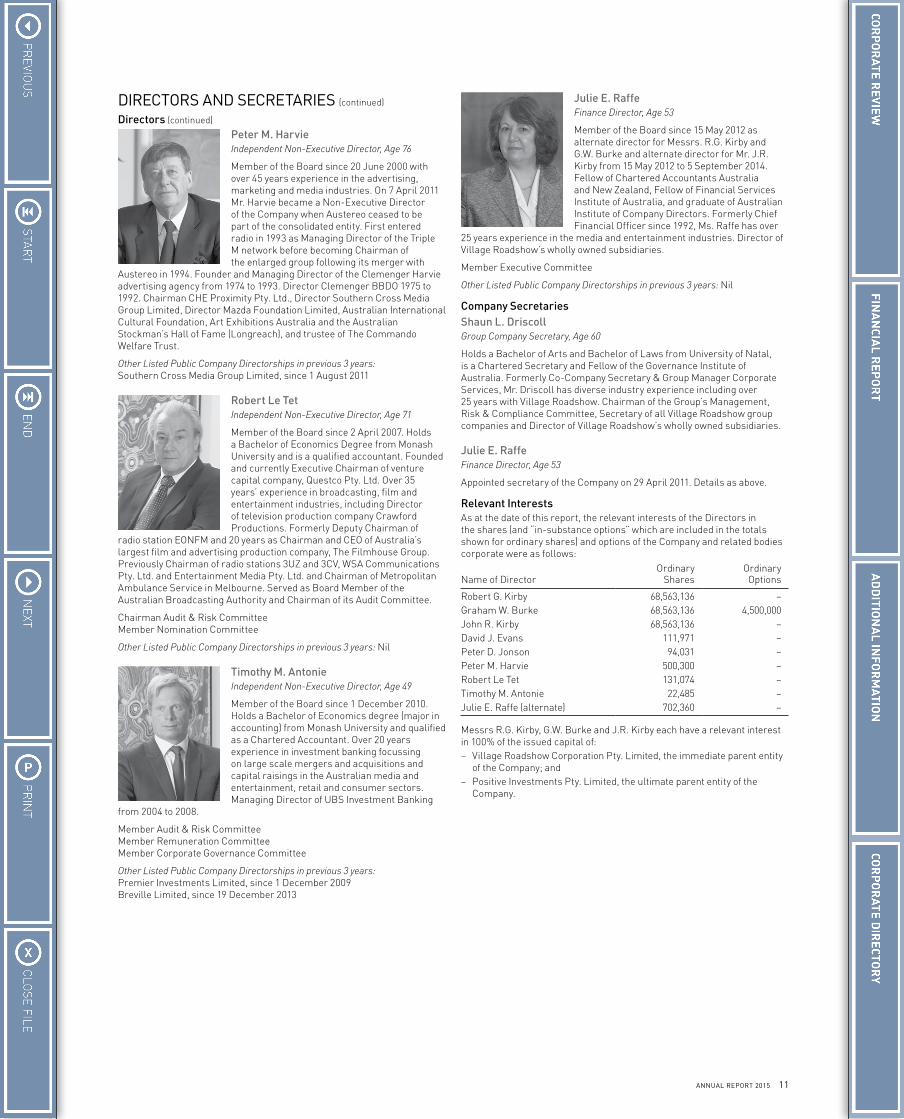
Peter M. HarvieIndependent Non-Executive Director, Age 76
Member of the Board since 20 June 2000 with over 45 years experience in the advertising, marketing and media industries. On 7 April 2011 Mr. Harvie became a Non-Executive Director of the Company when Austereo ceased to be part of the consolidated entity. First entered radio in 1993 as Managing Director of the Triple M network before becoming Chairman of the enlarged group following its merger with
Austereo in 1994. Founder and Managing Director of the Clemenger Harvie advertising agency from 1974 to 1993. Director Clemenger BBDO 1975 to 1992. Chairman CHE Proximity Pty. Ltd., Director Southern Cross Media Group Limited, Director Mazda Foundation Limited, Australian International Cultural Foundation, Art Exhibitions Australia and the Australian Stockman’s Hall of Fame (Longreach), and trustee of The Commando Welfare Trust.
Other Listed Public Company Directorships in previous 3 years:Southern Cross Media Group Limited, since 1 August 2011
Robert Le TetIndependent Non-Executive Director, Age 71
Member of the Board since 2 April 2007. Holds a Bachelor of Economics Degree from Monash University and is a qualified accountant. Founded and currently Executive Chairman of venture capital company, Questco Pty. Ltd. Over 35 years’ experience in broadcasting, film and entertainment industries, including Director of television production company Crawford Productions. Formerly Deputy Chairman of
radio station EONFM and 20 years as Chairman and CEO of Australia’s largest film and advertising production company, The Filmhouse Group. Previously Chairman of radio stations 3UZ and 3CV, WSA Communications Pty. Ltd. and Entertainment Media Pty. Ltd. and Chairman of Metropolitan Ambulance Service in Melbourne. Served as Board Member of the Australian Broadcasting Authority and Chairman of its Audit Committee.
Chairman Audit & Risk CommitteeMember Nomination Committee
Other Listed Public Company Directorships in previous 3 years: Nil
Timothy M. AntonieIndependent Non-Executive Director, Age 49
Member of the Board since 1 December 2010. Holds a Bachelor of Economics degree (major in accounting) from Monash University and qualified as a Chartered Accountant. Over 20 years experience in investment banking focussing on large scale mergers and acquisitions and capital raisings in the Australian media and entertainment, retail and consumer sectors. Managing Director of UBS Investment Banking
from 2004 to 2008.
Member Audit & Risk CommitteeMember Remuneration CommitteeMember Corporate Governance Committee
Other Listed Public Company Directorships in previous 3 years:Premier Investments Limited, since 1 December 2009Breville Limited, since 19 December 2013
Julie E. RaffeFinance Director, Age 53
Member of the Board since 15 May 2012 as alternate director for Messrs. R.G. Kirby and G.W. Burke and alternate director for Mr. J.R. Kirby from 15 May 2012 to 5 September 2014. Fellow of Chartered Accountants Australia and New Zealand, Fellow of Financial Services Institute of Australia, and graduate of Australian Institute of Company Directors. Formerly Chief Financial Officer since 1992, Ms. Raffe has over
25 years experience in the media and entertainment industries. Director of Village Roadshow’s wholly owned subsidiaries.
Member Executive Committee
Other Listed Public Company Directorships in previous 3 years: Nil
Company SecretariesShaun L. DriscollGroup Company Secretary, Age 60
Holds a Bachelor of Arts and Bachelor of Laws from University of Natal, is a Chartered Secretary and Fellow of the Governance Institute of Australia. Formerly Co-Company Secretary & Group Manager Corporate Services, Mr. Driscoll has diverse industry experience including over 25 years with Village Roadshow. Chairman of the Group’s Management, Risk & Compliance Committee, Secretary of all Village Roadshow group companies and Director of Village Roadshow’s wholly owned subsidiaries.
Julie E. RaffeFinance Director, Age 53
Appointed secretary of the Company on 29 April 2011. Details as above.
Relevant InterestsAs at the date of this report, the relevant interests of the Directors in the shares (and “in-substance options” which are included in the totals shown for ordinary shares) and options of the Company and related bodies corporate were as follows:
Name of DirectorOrdinary
SharesOrdinary Options
Robert G. Kirby 68,563,136 –Graham W. Burke 68,563,136 4,500,000John R. Kirby 68,563,136 –David J. Evans 111,971 –Peter D. Jonson 94,031 –Peter M. Harvie 500,300 –Robert Le Tet 131,074 –Timothy M. Antonie 22,485 –Julie E. Raffe (alternate) 702,360 –
Messrs R.G. Kirby, G.W. Burke and J.R. Kirby each have a relevant interest in 100% of the issued capital of:– Village Roadshow Corporation Pty. Limited, the immediate parent entity
of the Company; and– Positive Investments Pty. Limited, the ultimate parent entity of the
Company.
DIRECTORS AND SECRETARIES (continued)
Directors (continued)
12 VILLAGE ROADSHOW LIMITED
DIRECTORS’ REPORT (CONTINUED)
OPERATING AND FINANCIAL REVIEWPrincipal ActivitiesThe principal activities of the Company and its controlled entities (“the Group”, “VRL group” or “consolidated entity”) during the financial year were:– Theme park and water park operations (“Theme Parks”);– Cinema exhibition operations (“Cinema Exhibition”); and– Film and DVD distribution operations (“Film Distribution”).
In addition the VRL group has an equity-accounted 47.12% interest in Village Roadshow Entertainment Group Limited (“VREG”) which has film production activities (“Film Production”) – refer to Note 11 to the Financial Statements for further details. Other investments, including in digital businesses, as well as corporate overheads and financing activities, are included under ‘Other’.
Overview of Results and Dividends/DistributionsThe VRL group reported an attributable net profit of $43.9 million for the year ended 30 June 2015, down from the prior corresponding period result of $45.8 million, which included attributable losses after tax from material items of $6.2 million in the year ended 30 June 2015 and $10.7 million in the prior year. Attributable net profit, before material items and discontinued operations (“NPAT”) for the year ended 30 June 2015 was $50.1 million, down on the prior year result of $56.5 million. Earnings before interest, tax, depreciation and amortisation, excluding material items and discontinued operations (“EBITDA”) for the year ended 30 June 2015 was $165.7 million, down 3% on the prior year result of $170.9 million.
Material items of income and expense after tax and non-controlling interest in the year ended 30 June 2015 comprised pre-tax losses from impairment of non-current assets of $9.1 million, restructuring costs of $3.7 million and legal settlements and expenses of $2.7 million, and profit on disposal of investments/businesses of $3.3 million, total income tax benefit of $2.2 million, and gain from non-controlling interest of $3.8 million.
Basic earnings per share from continuing operations were 27.5 cents per share (2014: 28.7 cents per share). There were 2,082,767 potential ordinary shares that were dilutive in the year ended 30 June 2015 (2014: 2,231,338). Diluted earnings per share before material items and discontinued operations of 31.0 cents per share decreased by 11% compared to the prior year result of 34.9 cents per share, based on a weighted average total of 161,600,932 ordinary shares (2014: 161,721,974 ordinary shares).
In the year ended 30 June 2015, a fully-franked final dividend of 14.0 cents per ordinary share was paid in October 2014, and a fully-franked interim dividend of 14.0 cents per ordinary share was paid in April 2015. Subsequent to 30 June 2015, the VRL Board has declared a fully-franked final dividend of 14.0 cents per ordinary share, which will be paid in October 2015. In the year ended 30 June 2014, a fully-franked final dividend of 13.0 cents per ordinary share was paid in October 2013, a distribution of 25.0 cents per ordinary share was paid in December 2013 (being a capital return of 12.0 cents per ordinary share and a fully-franked distribution of 13.0 cents per ordinary share), and a fully-franked interim dividend of 13.0 cents per ordinary share was paid in March 2014. A fully-franked special dividend of 15.0 cents per share was declared in June 2014, which was subsequently paid in July 2014.
Net cash flows from operations totalled $111.3 million in the year ended 30 June 2015, compared to $96.7 million in the prior year. Cash flows used in investing and financing activities totalled $147.3 million in the year ended 30 June 2015, compared to $113.5 million used in the prior year. The current year included $81.0 million relating to purchases of property, plant, equipment and intangibles, compared to a total of $152.8 million in the prior year, with a significant part of the prior year amount relating to the construction of Wet’n’Wild Sydney, which opened in December 2013. Net proceeds from borrowings in the year ended 30 June 2015 were $13.0 million, compared to $81.6 million in the prior year, and the prior year also included a capital return of 12.0 cents per ordinary share totalling $19.1 million, being part of the total distribution of 25.0 cents per ordinary share which was paid in December 2013.
An analysis of the Company’s operations, financial position, business objectives and future prospects is set out below. Further financial summary information is set out in the Reconciliation of Results on page 17, which forms part of this Directors’ Report, and in Note 29 to the Financial Statements.
Operational ResultsTheme ParksVillage Roadshow Theme Parks (“VRTP”) recorded an EBITDA result of $92.5 million in FY2015, down 4% on the prior year result of $96.6 million, and operating profit before tax excluding material items and discontinued operations (“PBT”) of $27.6 million, down 17% compared to the prior year result of $33.1 million. VRTP’s performance in Australia reflected a solid second half despite record rainfall on the East Coast in the key trading periods and corresponding softness in ticket sales, and managed to produce an Australian EBITDA result of $89.1 million, which was only slightly below that of last year’s result of $90.0 million. Trading at Wet’n’Wild Las Vegas produced an EBITDA of $3.4 million, which was 12% down on the previous year as a result of new waterpark competition in the Las Vegas market, and the prior period also included $2.7 million of EBITDA from Wet’n’Wild Phoenix and Hawaii, which were sold in late November 2013.
With especially poor weather conditions during the peak trading period in December and January and continued softness in the core market, the Gold Coast parks experienced overall static ticket sales over the year resulting in an overall financial performance for FY2015 only slightly below the prior year. Across the parks, attendances were down 1% year on year, and in response VRTP undertook a number of back-of-house cost reduction initiatives during the year resulting in significant savings, to maintain VRTP’s financial performance, but without affecting the quality of the guest experience.
Warner Bros. Movie World’s attendance was assisted by the introduction of Carnivale in July 2014 and a second run of this special event during the Easter holidays, and the continued success of Halloween Fright Nights and White Christmas events, as well as the market’s very positive reception to Warner Bros. Movie World’s Junior Driving School which opened in September 2014. At Sea World the Storm Coaster and the new Polar Bears exhibit continued to attract crowds and the Creatures of the Deep exhibit, which opened in June 2015, is proving very popular with young children and their parents. In addition in September this year the Nickelodeon Land children’s area will open at Sea World, which will further appeal to the family market.
At the adjacent Sea World Resort & Water Park, another outstanding performance was achieved in FY2015, with revenue 4.6% up on the previous year, operating profit up 8.8%, and an average occupancy rate of 87.8% during FY2015. This stellar performance is expected to be sustained with the opening in July 2015 of the new 800 seat conference centre at the Resort, which is enjoying solid attendances, and forward bookings are well ahead of expectations. The new Wet’n’Wild Junior area opened successfully in September 2014, and has been well received by guests at Wet’n’Wild Gold Coast.
Wet’n’Wild Sydney operates over the period from September to the end of Easter. Season pass sales for the second season in the spring of FY2015 started strongly, with over 115,000 tickets sold by mid-October 2014 when the ‘Buy 3 Get 1 Free’ campaign ended. Ticket sales however were softer during the following two months and, when the weather deteriorated in mid-December, this resulted in weaker ticket sales – as widely reported, Sydney went on to record the wettest summer/January in 50 years. As previously advised, the record rainfall during the relatively short peak summer holiday trading period produced a poor result at the Sydney park, well below management’s expectations. With a revised ticket offering (refer below) and better weather, expectations are for a much improved performance in FY2016.
Wet’n’Wild Las Vegas’ third season was negatively impacted by the first full season operation of the competitor water park in the adjoining suburb, and this had a significant impact given the relatively small core market in Las Vegas. With the opening of the competitor park, VRTP has aggressively pursued attendance and, although this strategy has proved successful, it has come at the expense of ticket yield.
For FY2016, VRTP has introduced a new membership/instalment plan for annual passes at its Gold Coast parks, and a number of similar ticketing initiatives are planned at the Wet’n’Wild Sydney and Wet’n’Wild Las Vegas parks. VRTP continues to invest heavily in attractions, rides and other enhancements to the guest experience at its parks, to maintain its premium position in the market place. In addition, FY2016 will see the full year flow-on from the expense reduction strategy implemented in the second half of FY2015, and the success of VRTP’s pre-season ticket sales campaign at the Gold Coast sees record deferred revenues carried into the start of the new financial year. With the successful execution of the above re-investment initiatives, and hopefully more normal weather patterns, management expects to see an increase in attendance and frequency of visitation in future years.
13ANNUAL REPORT 2015
VRL continues to pursue development opportunities in China and remains optimistic of being rewarded in the medium term in relation to this expansion strategy. In March 2015, VRL announced the signing of a joint venture agreement to establish a funds management business with CITIC Trust Co. Ltd (“CITIC”). Funds raised will be for the purpose of investing in theme parks, entertainment facilities and related real estate development throughout Asia with a particular focus on China. The funds management company for this and future funds will be owned 51% by CITIC and 49% by VRL. Entering into this long term funds management business with CITIC will be complementary to, and will leverage the advantages of, VRL’s unique theme park opportunities in the region. VRL expects to generate fees through the funds management company, whilst VRTP will benefit through a minimum 60% ownership of the management company responsible for design/construction/operating contracts for the theme parks initiated by the fund.
There continue to be delays in the Hainan Island development that are beyond the Company’s control. In the meanwhile, other projects are being developed in parallel to maintain the Company’s flexibility to select only the most promising projects. Further details will be announced when firm contractual commitments have been signed.
Cinema ExhibitionThe Cinema Exhibition division operates predominantly in Australia, Singapore and the United States through joint ventures, including with Amalgamated Holdings in Australia and other cinema operators. The division enjoyed an all time record box office performance during the year, particularly in the second half, and total FY2015 EBITDA of $71.5 million was up 14% on the prior period’s result of $62.6 million. Total FY2015 PBT of $53.3 million was up 22% on the prior year’s result of $43.8 million, with the PBT from the Australian operations being $48.1 million in FY2015 compared to $38.9 million in the prior year.
At 30 June 2015, the division had 538 screens at 52 sites in Australia, 91 screens at 11 sites in Singapore, 81 screens at 11 sites in the United States, and 12 screens at one remaining site in the United Kingdom. Some of the best performing films during FY2015 included The Imitation Game, American Sniper, 50 Shades of Grey, The Second Best Exotic Marigold Hotel, Insurgent, The Avengers: Age of Ultron, Mad Max: Fury Road, Pitch Perfect 2, San Andreas and Jurassic World.
As well as higher admissions from a strong second half box office performance, the key driver in the improved EBITDA result was improved performance from concessions, lower cost of goods sold, and improved results from the premium offerings in Gold Class and . This was supported by improved loyalty programs, retail gifting and the higher take-up of digital ticketing, all of which continued to drive improved average overall spend per person and an improved financial performance. This was also assisted by the service of hot food into traditional cinemas and will be further enhanced by the recent launch of the new offering to be added to VRL’s stable of premium cinema brands.
The division also continued its upgrading and refurbishment of a number of sites during the year including Werribee and Jam Factory in Victoria, and Miranda in New South Wales. Existing cinema sites earmarked for future attention include Sunshine, Jam Factory and Century City in Victoria, Hurstville, Castle Hill and Liverpool in New South Wales, Browns Plains in Queensland, and Morley in Western Australia. To add to the existing cinema circuit, new sites are also underway at Plenty Valley in Victoria, Roselands in New South Wales, North Lakes, Coomera and Springfield in Queensland, Glenelg in South Australia, and Palmerston in the Northern Territory.
The VRL group’s equity-accounted share of NPAT of the 50% owned Singapore Cinema Exhibition operations of $8.2 million was up 6% on the FY2014 result of $7.7 million. The Golden Village operations are the number one circuit in Singapore, with a commanding 43% market share. The circuit continues to perform well, even though overall cinema attendances were down 4% on the prior year due to the closure for renovations at various times during the year of a number of sites. Cinema spend per person improved over the prior year result, as did underlying EBITDA, which increased by 11%, assisted by the new key cinema complex at Suntec City, which opened in November 2014.
iPic Theaters is the premium cinema and restaurant concept in the USA, in which VRL holds a 30% interest. With a current total of 11 sites, including the successful opening of Maryland in November 2014, together with two further sites in North Miami and Houston slated for opening in the second half of CY2015, the circuit is on track to reaching its goal of critical mass. VRL and its partners remain confident, particularly through the great success of the recently opened sites, that this circuit will be a valuable asset in the medium term. The exit of VRL’s Belfast cinema is not yet complete and continues to trade unprofitably for the foreseeable future. VRL continues to actively seek an exit strategy for this site.
With the anticipated strong line-up of titles scheduled for the remainder of the year, prospects are looking excellent for yet another year of robust cinema box office. Some of these forthcoming films include the next James Bond epic, Spectre, the hugely anticipated Episode VII of Star Wars: The Force Awakens, as well as Batman vs. Superman and the final in the Hunger Games franchise.
Film DistributionThe Film Distribution division’s EBITDA result of $34.6 million for FY2015 was down 17% on the prior year result of $41.7 million, and PBT of $28.7 million for FY2015 was down 18% on the prior year result of $34.8 million. Roadshow Films finished FY2015 as the leading distributor in Australia with a commanding 25.4% market share. The results for the 2015 financial year fell short of expectations and prior year due to challenging commercial product mix and higher royalty rates on some titles. Revenues were 6% above the prior year in FY2015, predominantly due to the division adding the distribution of Warner Bros. home entertainment product in Australia and New Zealand to its existing Warner Bros. theatrical distribution rights, with effect from March 2015.
Warner Bros. continued to be a key supplier releasing 14 titles over FY2015 including the stand-out box office successes of The Hobbit: Battle of the Five Armies and Interstellar. Also notable during FY2015 were the three Village Roadshow Pictures’ films American Sniper, San Andreas and Mad Max: Fury Road, as well as the Lionsgate film Hunger Games: Mockingjay Part 1, the FilmNation Oscar nominated title The Imitation Game, and the Australian movie Paper Planes. The upcoming slate of movies in the coming year looks promising, including Pan and The Intern from Warner Bros. and Sicario and Hunger Games: Mockingjay Part 2 from Lionsgate.
The acquisition, effective from 1 January 2015, of a 31.03% equity share in FilmNation Entertainment, an international sales agency business based in New York, has enabled Roadshow to broaden the diversity of its earnings channels. This business should continue to make a positive contribution to Roadshow’s results.
Roadshow Home Entertainment held the largest market share in FY2015 in the physical retail market for DVDs with 31%, as well as 16.8% of the digital transactional market in Australia. The digital transactional market grew by 10.3% in Australia over the year, however the physical DVD market declined by 11.3%. A substantial strategic distribution deal was signed in February 2015, extending the existing Roadshow Films theatrical distribution relationship to include the home entertainment licensing of Warner Bros. film, TV and Home Box Office content in Australia and New Zealand, including the hugely popular HBO Game of Thrones series.
Digital revenues in FY2015 were up 39% on the prior year, and even removing the effect of the additional distribution of Warner Bros. digital product, digital revenues were up 29% compared to FY2014. Electronic sell-through sales were also significantly up in FY2015 over the prior year. Roadshow’s biggest digital partners – iTunes, Foxtel and Telstra Big Pond – account for approximately 85% of Roadshow’s digital sales and Roadshow was the number one supplier of movies to the iTunes platform in Australia during FY2015. Roadshow anticipates that the digital market will evolve further in the year ahead as competition increases and each platform looks to drive transactions on their own platform.
In Television, during the year a content licensing deal was signed with the subscription video-on-demand (“SVOD”) platform Stan, providing access to a selection of Roadshow’s broad catalogue of award-winning film titles and TV series, accelerating Roadshow’s entry into the growing Digital marketplace. Roadshow also entered into a multi-year agreement with the dominant global SVOD service provider Netflix, providing access to a substantial volume of its film library and selected TV series. Roadshow Television’s sales and EBITDA were a healthy 10% and 12% respectively up on the prior year, mainly due to the launch of the SVOD platforms in the second half of FY2015, and further strong sales growth in SVOD is anticipated in following years.
OPERATING AND FINANCIAL REVIEW (continued)
Operational Results (continued)
Theme Parks (continued)
14 VILLAGE ROADSHOW LIMITED
DIRECTORS’ REPORT (CONTINUED)
Film ProductionVillage Roadshow Entertainment Group Limited (“VREG”) is 47.12% owned by the VRL group, and is equity-accounted with no carrying value for accounting purposes. The VRL group results only include cash dividends received from VREG, and no cash dividends were received in FY2015, as these are dependent on film performance and available free cash flow in VREG.
VREG consists of Village Roadshow Pictures (“VRP”) and Village Roadshow Pictures Asia (“VRP Asia”). In October 2014 VRP extended its co-production and co-financing agreement with Warner Bros. and incorporated the ability to invest in global film rights as part of that extension. In December 2014, VRP entered an additional global film rights co-production and co-financing agreement with Sony Pictures Entertainment. Both agreements continue to the end of 2019, with the Warner Bros. arrangement now extending into its third decade.
VRP released 8 films in FY2015, and the standout performers were American Sniper, which won an Academy Award and grossed US$547 million worldwide, the critically acclaimed Mad Max: Fury Road which has grossed US$372 million worldwide and San Andreas, which has grossed US$467 million worldwide to date. Upcoming titles from VRP include Goosebumps, starring Jack Black, In the Heart of the Sea, directed by Ron Howard and starring Chris Hemsworth, Concussion, starring Will Smith, Grimsby, a comedy starring Sasha Barron Cohen, Tarzan, starring Samuel L. Jackson and Christoph Waltz, and King Arthur, directed by Guy Ritchie, who directed two highly successful Sherlock Holmes’ films for VRP.
VRP Asia released one film during the year, Zhong Kui: Snow Girl and The Dark Crystal, in February 2015 during the Chinese New Year holiday period, which made almost US$70 million in China. Upcoming releases from VRP Asia include Mountain Cry and through Irresistible Films, VRP Asia’s Hong Kong joint venture with Bill Kong, Go Away Mr. Tumor, The Bodyguard, Cold War 2 and Bound.
OtherThe total net Corporate & Other costs for the year ended 30 June 2015 were $38.4 million compared to $32.3 million for the prior year, which included net costs of $27.8 million (2014: $28.2 million) for Corporate, $5.4 million (2014: $2.1 million) for Asia Development, $2.7 million (2014: $1.3 million) for Digital Development, a profit of $3.0 million (2014: $1.5 million) for Edge Loyalty, depreciation of $1.9 million (2014: $2.0 million) and net interest expense of $3.6 million (2014: $0.2 million). No dividends were received from VREG in FY2015 or FY2014. EBITDA cost for the year to 30 June 2015 was $32.9 million, compared to $30.1 million in the prior year.
The FY2015 results included an increase of $3.3 million in Asia Development costs, which related to the substantial ongoing business development work in this area, as well as the establishment and operation of the Hong Kong office. Net interest expense was higher in FY2015 compared to last year due to lower cash reserves, and draw-downs on debt facilities as a result of shareholder distributions.
During FY2015, the VRL group undertook a detailed review of the cost structures in the IT and shared services areas of the business, which resulted in a number of positions in these areas being made redundant, and others being realigned to meet the changing needs of the Group. These changes have resulted in savings to both the overhead corporate costs and the amounts recharged to the divisions for these services. Given these changes were made late in FY2015, the ongoing savings will be more greatly reflected in FY2016. The restructuring costs incurred have been included with material items in the Reconciliation of Results on page 17.
Edge Loyalty achieved significant growth in FY2015, with revenues up 67% and delivering an underlying EBITDA of $3.4 million against last year’s result of $1.5 million. The strong performance was driven by growth of the Good Food Gift Card business, the acquisition of the Prime Focus promotions business in November 2014, continued organic growth of Edge’s gift cards business, and a restructure of the MyFun business. Edge has grown to become Australia’s leading provider of consumer promotions, reward and loyalty solutions, due to its specialist ability to risk manage promotions, its unique portfolio of products, and the bespoke technologies it has developed to deliver its services.
Financial PositionDuring the year ended 30 June 2015, total assets of the consolidated entity increased by $83.4 million, including increases in trade and other receivables of $38.1 million, intangible assets of $19.0 million and equity accounted investments of $30.2 million, which were partly offset by a reduction in cash of $35.0 million. Total liabilities increased
by $79.1 million, including increases in trade and other payables of $83.6 million and borrowings of $16.6 million, which were partly offset by a reduction in provisions of $28.9 million.
Total equity of the consolidated entity increased by $4.3 million to $525.6 million during the year, which was mainly attributable to an increase in reserves of $5.3 million and a reduction in retained earnings of $1.6 million (mainly resulting from attributable net profit for the year of $43.9 million, less dividends declared during the year of $44.7 million). There have been no significant changes in the state of affairs of the consolidated entity during the financial year.
The VRL group’s net debt as at 30 June 2015 was $402.2 million, giving a gearing ratio of 43%, compared to the prior year’s gearing ratio of 40%. Of the total debt of $497.5 million, $29.5 million is classified as current liabilities, and $468.0 million is classified as non-current liabilities, which has been determined in accordance with the requirements of the VRL group’s relevant finance agreements.
Events Subsequent to Reporting DateOther than the following, there have been no material transactions which significantly affect the financial or operational position of the consolidated entity since the end of the financial year.
As advised to the Australian Securities Exchange on 15 September 2015, Village Roadshow Entertainment Group Limited (“VREG”) has completed new corporate debt facilities totalling USD 325 million, refinancing its existing corporate debt facility and providing additional working capital. Part of the USD 325 million VREG corporate debt refinancing is subordinated debt financing of USD 25 million, repayable by September 2021. The VRL group, which owns 47.12% of the ordinary shares of VREG, has contributed USD 15 million of the subordinated debt, which will earn cash interest of 6% p.a., as well as non-cash interest of 9.5% p.a. payable upon repayment of the debt, plus an entitlement to further non-voting shares.
As a result of VREG’s significant accounting losses, this additional net investment by the VRL group will be required to be immediately written off, resulting in an equity-accounted loss after tax of approximately A$20 million in the VRL group results for the 2016 financial year. As part of the VREG refinancing, the VRL group’s existing non-voting redeemable equity shares in VREG have been converted to non-voting preferred equity, accruing a 14% non-cash dividend, with redemption by March 2022.
Environmental Regulation and PerformanceThe VRL group was subject to the National Greenhouse and Energy Reporting Act for the year ended 30 June 2015, however this has not had any material impact on the VRL group.
Business Objectives and Future ProspectsStrategy/ObjectivesThe strategy and objectives of the VRL group are summarised as follows:– Ongoing improvement in operating performance of each division;– Continued development of innovative and competitive products
and services such as higher yielding cinema offerings and site refurbishments in the Cinema Exhibition division, new attractions at existing locations and development of new locations for the Theme Parks division;
– Ongoing expansion in relation to the Group’s involvement in theme parks in China and South east Asia;
– Ongoing review of potential further investments across the VRL group’s various divisions, subject to acceptable financial returns;
– Increase in output of films per year by VREG, improving the financial performance of the Film Production division;
– Continuing to monitor opportunities in the digital and online space; and– Continuing to closely monitor and review corporate overheads, including
remuneration costs, in light of ongoing efficiency reviews.
Business RisksMaterial business risks that could have an effect on the financial prospects of the VRL group, and the way in which the VRL group seeks to address some of these risks, are as follows:– Consumer spending – a shift in the patterns with which consumers
spend their disposable income could impact the Group in all of its businesses, however historical experience has shown that the Group’s entertainment offerings are generally impacted less by economic downturns compared to other discretionary expenditures of consumers;
– Competition – all of the Group’s businesses are continuously vying for customers against a wide variety of competitive forces;
– Technology – the media through which people receive entertainment content is ever-changing, with increased digitalisation and portability being key focuses for many consumers, although the uniqueness of
OPERATING AND FINANCIAL REVIEW (continued)
Operational Results (continued)
15ANNUAL REPORT 2015
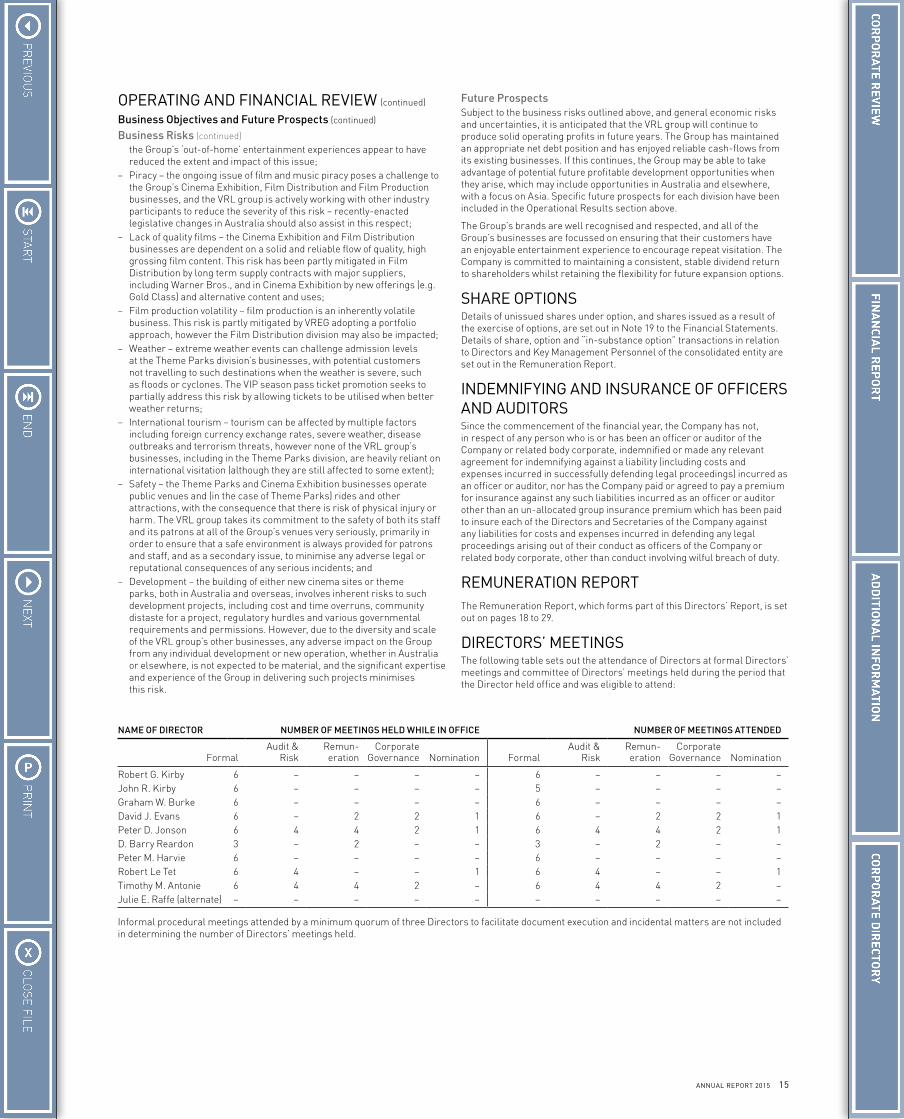
NAME OF DIRECTOR NUMBER OF MEETINGS HELD WHILE IN OFFICE NUMBER OF MEETINGS ATTENDED
FormalAudit &
RiskRemun-eration
Corporate Governance Nomination Formal
Audit & Risk
Remun-eration
Corporate Governance Nomination
Robert G. Kirby 6 – – – – 6 – – – –John R. Kirby 6 – – – – 5 – – – –Graham W. Burke 6 – – – – 6 – – – –David J. Evans 6 – 2 2 1 6 – 2 2 1Peter D. Jonson 6 4 4 2 1 6 4 4 2 1D. Barry Reardon 3 – 2 – – 3 – 2 – –Peter M. Harvie 6 – – – – 6 – – – –Robert Le Tet 6 4 – – 1 6 4 – – 1Timothy M. Antonie 6 4 4 2 – 6 4 4 2 –Julie E. Raffe (alternate) – – – – – – – – – –
Informal procedural meetings attended by a minimum quorum of three Directors to facilitate document execution and incidental matters are not included in determining the number of Directors’ meetings held.
the Group’s ‘out-of-home’ entertainment experiences appear to have reduced the extent and impact of this issue;
– Piracy – the ongoing issue of film and music piracy poses a challenge to the Group’s Cinema Exhibition, Film Distribution and Film Production businesses, and the VRL group is actively working with other industry participants to reduce the severity of this risk – recently-enacted legislative changes in Australia should also assist in this respect;
– Lack of quality films – the Cinema Exhibition and Film Distribution businesses are dependent on a solid and reliable flow of quality, high grossing film content. This risk has been partly mitigated in Film Distribution by long term supply contracts with major suppliers, including Warner Bros., and in Cinema Exhibition by new offerings (e.g. Gold Class) and alternative content and uses;
– Film production volatility – film production is an inherently volatile business. This risk is partly mitigated by VREG adopting a portfolio approach, however the Film Distribution division may also be impacted;
– Weather – extreme weather events can challenge admission levels at the Theme Parks division’s businesses, with potential customers not travelling to such destinations when the weather is severe, such as floods or cyclones. The VIP season pass ticket promotion seeks to partially address this risk by allowing tickets to be utilised when better weather returns;
– International tourism – tourism can be affected by multiple factors including foreign currency exchange rates, severe weather, disease outbreaks and terrorism threats, however none of the VRL group’s businesses, including in the Theme Parks division, are heavily reliant on international visitation (although they are still affected to some extent);
– Safety – the Theme Parks and Cinema Exhibition businesses operate public venues and (in the case of Theme Parks) rides and other attractions, with the consequence that there is risk of physical injury or harm. The VRL group takes its commitment to the safety of both its staff and its patrons at all of the Group’s venues very seriously, primarily in order to ensure that a safe environment is always provided for patrons and staff, and as a secondary issue, to minimise any adverse legal or reputational consequences of any serious incidents; and
– Development – the building of either new cinema sites or theme parks, both in Australia and overseas, involves inherent risks to such development projects, including cost and time overruns, community distaste for a project, regulatory hurdles and various governmental requirements and permissions. However, due to the diversity and scale of the VRL group’s other businesses, any adverse impact on the Group from any individual development or new operation, whether in Australia or elsewhere, is not expected to be material, and the significant expertise and experience of the Group in delivering such projects minimises this risk.
Future ProspectsSubject to the business risks outlined above, and general economic risks and uncertainties, it is anticipated that the VRL group will continue to produce solid operating profits in future years. The Group has maintained an appropriate net debt position and has enjoyed reliable cash-flows from its existing businesses. If this continues, the Group may be able to take advantage of potential future profitable development opportunities when they arise, which may include opportunities in Australia and elsewhere, with a focus on Asia. Specific future prospects for each division have been included in the Operational Results section above.
The Group’s brands are well recognised and respected, and all of the Group’s businesses are focussed on ensuring that their customers have an enjoyable entertainment experience to encourage repeat visitation. The Company is committed to maintaining a consistent, stable dividend return to shareholders whilst retaining the flexibility for future expansion options.
SHARE OPTIONSDetails of unissued shares under option, and shares issued as a result of the exercise of options, are set out in Note 19 to the Financial Statements. Details of share, option and “in-substance option” transactions in relation to Directors and Key Management Personnel of the consolidated entity are set out in the Remuneration Report.
INDEMNIFYING AND INSURANCE OF OFFICERS AND AUDITORSSince the commencement of the financial year, the Company has not, in respect of any person who is or has been an officer or auditor of the Company or related body corporate, indemnified or made any relevant agreement for indemnifying against a liability (including costs and expenses incurred in successfully defending legal proceedings) incurred as an officer or auditor, nor has the Company paid or agreed to pay a premium for insurance against any such liabilities incurred as an officer or auditor other than an un-allocated group insurance premium which has been paid to insure each of the Directors and Secretaries of the Company against any liabilities for costs and expenses incurred in defending any legal proceedings arising out of their conduct as officers of the Company or related body corporate, other than conduct involving wilful breach of duty.
REMUNERATION REPORTThe Remuneration Report, which forms part of this Directors’ Report, is set out on pages 18 to 29.
DIRECTORS’ MEETINGSThe following table sets out the attendance of Directors at formal Directors’ meetings and committee of Directors’ meetings held during the period that the Director held office and was eligible to attend:
OPERATING AND FINANCIAL REVIEW (continued)
Business Objectives and Future Prospects (continued)
Business Risks (continued)
16 VILLAGE ROADSHOW LIMITED
DIRECTORS’ REPORT (CONTINUED)
TAX CONSOLIDATIONA description of the VRL group’s position in relation to Australian Tax Consolidation legislation is set out in Note 4 to the Financial Statements.
AUDITOR INDEPENDENCEThe Auditor’s Independence Declaration to the Directors of the Company, which forms part of this Directors’ Report, is set out below.
NON-AUDIT SERVICES PROVIDED BY AUDITORDetails of the non-audit services provided by the auditor are set out in Note 26 to the Financial Statements. The non-audit services summarised in Note 26 were provided by the VRL group’s auditor, Ernst & Young. The Directors are satisfied that the provision of non-audit services is compatible with the general standard of independence for auditors imposed by the Corporations Act 2001. The nature and scope of each type of non-audit service provided means that auditor independence was not compromised.
ROUNDINGThe amounts contained in this report and in the Financial Statements have been rounded (where applicable) to the nearest thousand dollars (unless stated otherwise) under the option available to the Company under ASIC Class Order 98/100. The Company is an entity to which the Class Order applies.
Signed in accordance with a resolution of the Directors at Melbourne this 17th day of September 2015.
G.W. BurkeDirector
AUDITOR’S INDEPENDENCE DECLARATION
AUDITOR’S INDEPENDENCE DECLARATION TO THE DIRECTORS OF VILLAGE ROADSHOW LIMITEDIn relation to our audit of the financial report of Village Roadshow Limited for the financial year ended 30 June 2015, to the best of my knowledge and belief, there have been no contraventions of the auditor independence requirements of the Corporations Act 2001 or any applicable code of professional conduct.
Ernst & Young
David ShewringPartner
17 September 2015
Ernst & Young8 Exhibition Street Melbourne VIC 3000 AustraliaGPO Box 67 Melbourne VIC 3001
Tel: +61 3 9288 8000Fax: +61 3 8650 7777ey.com/au
A member firm of Ernst & Young Global LimitedLiability limited by a scheme approved under Professional Standards Legislation
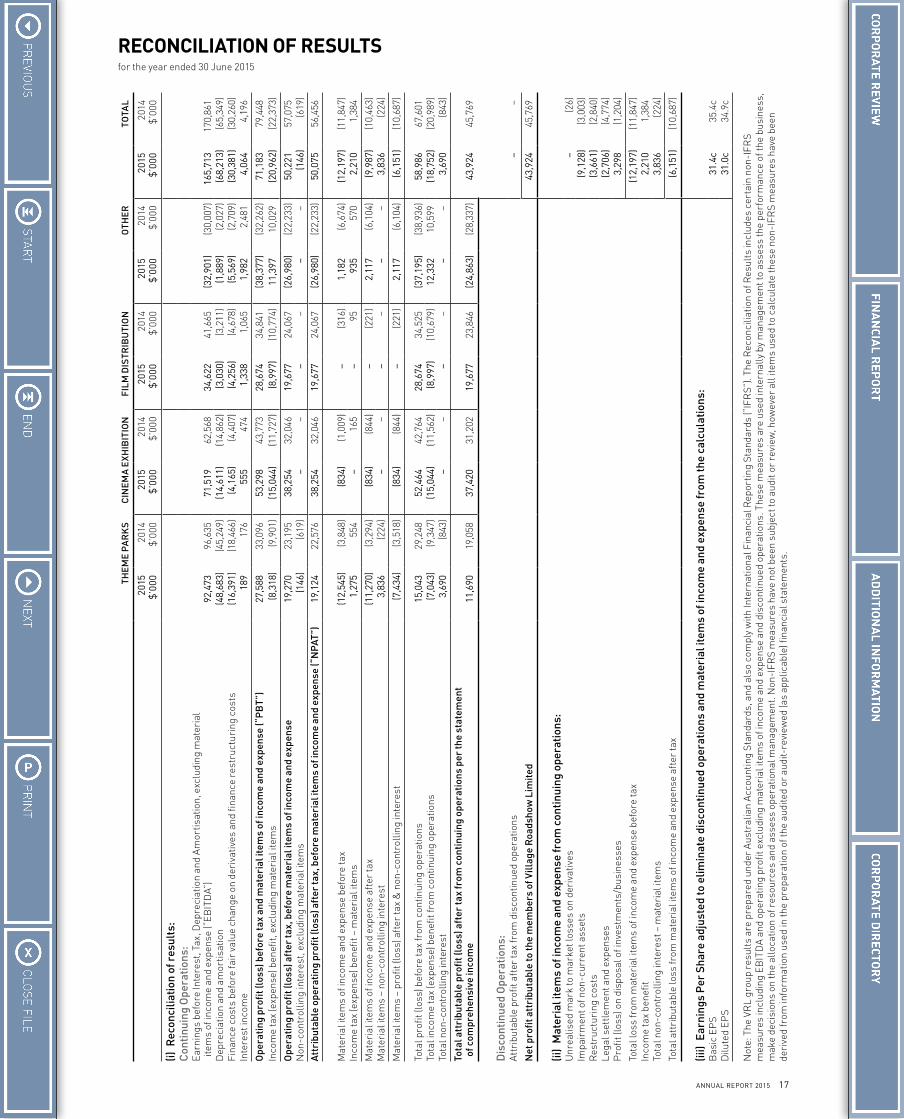
17ANNUAL REPORT 2015
RECONCILIATION OF RESULTSfor the year ended 30 June 2015
THEM
E PA
RK
SC
INEM
A E
XHIB
ITIO
NFI
LM D
ISTR
IBU
TIO
NO
THER
TOTA
L
2015
$’
000
2014
$’
000
2015
$’
000
2014
$’
000
2015
$’
000
2014
$’
000
2015
$’
000
2014
$’
000
2015
$’
000
2014
$’
000
(i) R
econ
cilia
tion
of r
esul
ts:
Con
tinui
ng O
pera
tions
:E
arni
ngs
befo
re In
tere
st, T
ax, D
epre
ciat
ion
and
Am
ortis
atio
n, e
xclu
ding
mat
eria
l i
tem
s of
inco
me
and
expe
nse
(“EB
ITD
A”)
92,4
7396
,635
71,5
1962
,568
34,6
2241
,665
(32,
901)
(30,
007)
165,
713
170,
861
Dep
reci
atio
n an
d am
ortis
atio
n(4
8,68
3)(4
5,24
9)(1
4,61
1)(1
4,86
2)(3
,030
)(3
,211
)(1
,889
)(2
,027
)(6
8,21
3)(6
5,34
9)Fi
nanc
e co
sts
befo
re fa
ir v
alue
cha
nge
on d
eriv
ativ
es a
nd fi
nanc
e re
stru
ctur
ing
cost
s(1
6,39
1)(1
8,46
6)(4
,165
)(4
,407
)(4
,256
)(4
,678
)(5
,569
)(2
,709
)(3
0,38
1)(3
0,26
0)In
tere
st in
com
e18
917
655
547
41,
338
1,06
51,
982
2,48
14,
064
4,19
6
Ope
ratin
g pr
ofit
(los
s) b
efor
e ta
x an
d m
ater
ial i
tem
s of
inco
me
and
expe
nse
(“P
BT”
)27
,588
33,0
9653
,298
43,7
7328
,674
34,8
41(3
8,37
7)(3
2,26
2)71
,183
79,4
48In
com
e ta
x (e
xpen
se) b
enef
it, e
xclu
ding
mat
eria
l ite
ms
(8,3
18)
(9,9
01)
(15,
044)
(11,
727)
(8,9
97)
(10,
774)
11,3
9710
,029
(20,
962)
(22,
373)
Ope
ratin
g pr
ofit
(los
s) a
fter
tax,
bef
ore
mat
eria
l ite
ms
of in
com
e an
d ex
pens
e19
,270
23,1
9538
,254
32,0
4619
,677
24,0
67(2
6,98
0)(2
2,23
3)50
,221
57,0
75N
on-c
ontr
ollin
g in
tere
st, e
xclu
ding
mat
eria
l ite
ms
(146
)(6
19)
––
––
––
(146
)(6
19)
Att
ribu
tabl
e op
erat
ing
prof
it (lo
ss) a
fter
tax,
bef
ore
mat
eria
l ite
ms
of in
com
e an
d ex
pens
e (“
NPA
T”)
19,1
2422
,576
38,2
5432
,046
19,6
7724
,067
(26,
980)
(22,
233)
50,0
7556
,456
Mat
eria
l ite
ms
of in
com
e an
d ex
pens
e be
fore
tax
(12,
545)
(3,8
48)
(834
)(1
,009
)–
(316
)1,
182
(6,6
74)
(12,
197)
(11,
847)
Inco
me
tax
(exp
ense
) ben
efit
– m
ater
ial i
tem
s1,
275
554
–16
5–
9593
557
02,
210
1,38
4
Mat
eria
l ite
ms
of in
com
e an
d ex
pens
e af
ter
tax
(11,
270)
(3,2
94)
(834
)(8
44)
–(2
21)
2,11
7(6
,104
)(9
,987
)(1
0,46
3)M
ater
ial i
tem
s –
non-
cont
rolli
ng in
tere
st3,
836
(224
)–
––
––
–3,
836
(224
)
Mat
eria
l ite
ms
– pr
ofit
(loss
) aft
er ta
x &
non
-con
trol
ling
inte
rest
(7,4
34)
(3,5
18)
(834
)(8
44)
–(2
21)
2,11
7(6
,104
)(6
,151
)(1
0,68
7)
Tota
l pro
fit (l
oss)
bef
ore
tax
from
con
tinui
ng o
pera
tions
15,0
4329
,248
52,4
6442
,764
28,6
7434
,525
(37,
195)
(38,
936)
58,9
8667
,601
Tota
l inc
ome
tax
(exp
ense
) ben
efit
from
con
tinui
ng o
pera
tions
(7,0
43)
(9,3
47)
(15,
044)
(11,
562)
(8,9
97)
(10,
679)
12,3
3210
,599
(18,
752)
(20,
989)
Tota
l non
-con
trol
ling
inte
rest
3,69
0(8
43)
––
––
––
3,69
0(8
43)
Tota
l att
ribu
tabl
e pr
ofit
(los
s) a
fter
tax
from
con
tinui
ng o
pera
tions
per
the
stat
emen
t o
f com
preh
ensi
ve in
com
e11
,690
19,0
5837
,420
31,2
0219
,677
23,8
46(2
4,86
3)(2
8,33
7)43
,924
45,7
69
Dis
cont
inue
d O
pera
tions
:A
ttri
buta
ble
prof
it af
ter
tax
from
dis
cont
inue
d op
erat
ions
––
Net
pro
fit a
ttri
buta
ble
to th
e m
embe
rs o
f Vill
age
Roa
dsho
w L
imite
d43
,924
45,7
69
(ii)
Mat
eria
l ite
ms
of in
com
e an
d ex
pens
e fr
om c
ontin
uing
ope
ratio
ns:
Unr
ealis
ed m
ark
to m
arke
t los
ses
on d
eriv
ativ
es–
(26)
Impa
irm
ent o
f non
-cur
rent
ass
ets
(9,1
28)
(3,0
03)
Res
truc
turi
ng c
osts
(3,6
61)
(2,8
40)
Lega
l set
tlem
ent a
nd e
xpen
ses
(2,7
06)
(4,7
74)
Pro
fit (l
oss)
on
disp
osal
of i
nves
tmen
ts/b
usin
esse
s3,
298
(1,2
04)
Tota
l los
s fr
om m
ater
ial i
tem
s of
inco
me
and
expe
nse
befo
re ta
x(1
2,19
7)(1
1,84
7)In
com
e ta
x be
nefit
2,21
01,
384
Tota
l non
-con
trol
ling
inte
rest
– m
ater
ial i
tem
s3,
836
(224
)
Tota
l att
ribu
tabl
e lo
ss fr
om m
ater
ial i
tem
s of
inco
me
and
expe
nse
afte
r ta
x(6
,151
)(1
0,68
7)
(iii)
Ear
ning
s P
er S
hare
adj
uste
d to
elim
inat
e di
scon
tinue
d op
erat
ions
and
mat
eria
l ite
ms
of in
com
e an
d ex
pens
e fr
om th
e ca
lcul
atio
ns:
Bas
ic E
PS
31.4
c35
.4c
Dilu
ted
EPS
31.0
c34
.9c
Not
e: T
he V
RL
grou
p re
sult
s ar
e pr
epar
ed u
nder
Aus
tral
ian
Acc
ount
ing
Stan
dard
s, a
nd a
lso
com
ply
with
Inte
rnat
iona
l Fin
anci
al R
epor
ting
Stan
dard
s (“
IFR
S”).
The
Rec
onci
liatio
n of
Res
ults
incl
udes
cer
tain
non
-IFR
S m
easu
res
incl
udin
g EB
ITD
A an
d op
erat
ing
prof
it ex
clud
ing
mat
eria
l ite
ms
of in
com
e an
d ex
pens
e an
d di
scon
tinue
d op
erat
ions
. The
se m
easu
res
are
used
inte
rnal
ly b
y m
anag
emen
t to
asse
ss th
e pe
rfor
man
ce o
f the
bus
ines
s,
mak
e de
cisi
ons
on th
e al
loca
tion
of r
esou
rces
and
ass
ess
oper
atio
nal m
anag
emen
t. N
on-I
FRS
mea
sure
s ha
ve n
ot b
een
subj
ect t
o au
dit o
r re
view
, how
ever
all
item
s us
ed to
cal
cula
te th
ese
non-
IFR
S m
easu
res
have
bee
n de
rive
d fr
om in
form
atio
n us
ed in
the
prep
arat
ion
of th
e au
dite
d or
aud
it-re
view
ed (a
s ap
plic
able
) fin
anci
al s
tate
men
ts.
18 VILLAGE ROADSHOW LIMITED
REMUNERATION REPORT
The Directors of the Company present the Remuneration Report (the “Report”) which details the compensation arrangements in place for Directors and senior managers of the Company being the Key Management Personnel (“KMP”) of the VRL group for the year ended 30 June 2015 in accordance with Section 300A of the Corporations Act 2001 (“the Act”).
The information provided in this Report has been audited as required by Section 308(3C) of the Act. The Report forms part of the Directors’ Report.
A. EXECUTIVE SUMMARY1. Categories of Directors and Senior ManagementThe KMP to whose compensation arrangements this Report refers have been segregated into the following categories:
CATEGORIES AND GROUPINGS OF DIRECTORS AND EXECUTIVES REFERRED TO IN REMUNERATION REPORT
Mr. Robert Kirby and Mr. Graham Burke Executive Directors Executives= All members of Village Roadshow Limited’s Executive Committee
“Key Management Personnel” of the Village Roadshow Limited Group
All other non-Director members of Village Roadshow Limited’s Executive Committee Executive Committee
All Non-Executive Directors of Village Roadshow Limited Non-Executive Directors
(a) Key Management Personnel (“KMP”)Those persons who are defined as Key Management Personnel of the VRL group are those persons with authority and responsibility for planning, directing and controlling the activities of the VRL group, and are referred to in this report as “KMP”.
(b) ExecutivesAll Executives are the members of the Village Roadshow Limited Executive Committee. For Village Roadshow Limited, these Executives are further split into 2 categories:
(i) Executive DirectorsThe Company’s Executive Directors are referred to in this Report as “Executive Director”, being Messrs. Robert G. Kirby and Graham W. Burke.
(ii) Executive CommitteeThe non-Director senior executives who are members of the Village Roadshow Limited Executive Committee are referred to in this Report as the “Executive Committee”.
The names, positions, dates of appointment, and dates of cessation (if ceasing up to 30 June 2015), of these Executives for the 2014 and 2015 financial periods are as follows:
Name Title/Position Appointment Cessation CategoryRobert G. Kirby Co-Executive Chairman and Co-CEO + ^ 29 November 2013 – Executive DirectorGraham W. Burke Co-Executive Chairman and Co-CEO + # 29 November 2013 – Executive DirectorClark J. Kirby Chief Operating Officer * 15 May 2012 – Executive CommitteeJulie E. Raffe Finance Director ** 15 May 2012 – Executive CommitteeSimon T. Phillipson General Counsel ^^ 13 May 1996 – Executive CommitteeDavid Kindlen Chief Information Officer ++ 1 December 2006 23 February 2015 Executive Committee
+ Became Co-Executive Chairman and Co-Chief Executive Officer on 29 November 2013^ Executive Chairman since 3 June 2010 and Executive Director since July 2001# Chief Executive Officer and Executive Director since September 1988* Previously Director Business Development and Strategy and KMP since 1 December 2010** Previously Chief Financial Officer and KMP since 28 September 1992^^ Also appointed Director of Corporate Affairs on 20 August 2014++ Resigned from Executive Committee and ceased as KMP on 23 February 2015
(c) Non-Executive DirectorsOther than the Executives referred to above, the Group’s other KMP are referred to as “Non-Executive Directors”. The names, dates of appointment, and dates of cessation of these Non-Executive Directors during the 2014 and 2015 financial periods are as follows:
Name Title/Position Appointment Cessation CategoryDavid J. Evans Independent Director 2 January 2007 – Non-Executive DirectorPeter D. Jonson Independent Director 24 January 2001 – Non-Executive DirectorD. Barry Reardon Independent Director 24 March 1999 20 November 2014 ^ Non-Executive DirectorRobert Le Tet Independent Director 2 April 2007 – Non-Executive DirectorTimothy M. Antonie Independent Director 1 December 2010 – Non-Executive DirectorPeter M. Harvie Independent Director 7 April 2011 – Non-Executive DirectorJohn R. Kirby Non-Executive Director 1 July 2012 – Non-Executive Director
^ Retired on 20 November 2014 and did not seek re-election at 2014 Annual General Meeting
19ANNUAL REPORT 2015
2. Remuneration OutlineThe Company’s movie-related businesses are in an industry that is highly intensive, complex and competitive. Industry specific challenges including technology, financing and marketing have changed dramatically over the past few years, requiring constant attention with new release patterns and windows for movies having a dramatic effect on the overall financial performance and profit/loss on any given picture. The Company’s theme park operations are highly competitive for international executive talent, with specific industry challenges in relation to domestic theme park development and optimisation, and international theme park assessment, negotiation, development and operations. These factors put significant pressure on the executives in the Group to maintain optimum performance. Due to the Group’s overseas business interests and the global nature of the entertainment industry, the Company’s Remuneration Committee considers both international entertainment industry remuneration levels and local remuneration expectations and practices. Executive remuneration and bonuses for these senior executives are based upon performance criteria and other financial objectives which reflect the nature and seniority of their role and unique challenges of the industries in which the Group’s businesses operate.
VRL’s two Executive Directors are the Co-Executive Chairmen and Co-Chief Executive Officers, Mr. Robert Kirby and Mr. Graham Burke, previously Executive Chairman and Chief Executive Officer (“CEO”) respectively. The change in titles since November 2013 was in recognition that both Mr. Kirby and Mr. Burke work closely together as a highly effective team beyond the traditional roles and boundaries of individual Chairman and CEO. The change also reflected that Mr. Kirby and Mr. Burke effectively share both positional functions between them. The flexibility that the joint titles brings to Mr. Kirby and Mr. Burke also facilitates enhanced senior executive input into the day-to-day operations of the Company with both men primarily concentrating their various efforts in different parts of the Company’s businesses.
The remuneration structure of the Executive Directors for the year ended 30 June 2015 was that each received base salary of $2.445 million (2014: $2.374 million) which is CPI indexed each October, $50,000 in superannuation or cash equivalent to their nominated superannuation fund, and a $100,000 per annum car allowance. In addition from 1 July 2014 each are eligible to earn a short-term incentive (“STI”) performance bonus of up to $750,000 per annum, with one-third based on the Company’s cash flow return on investment (“CFROI”) exceeding certain hurdles, and two-thirds based on various levels of achievement of the Company’s nominated budgeted Net Profit After Tax (“Budgeted NPAT”). For the year ended 30 June 2014, each were eligible to earn STI performance bonus amounts of up to $500,000, with 50% based on the CFROI exceeding certain hurdles, and 50% based on the increase in earnings per share (“EPS”) growth exceeding the growth of the top 300 stocks listed on ASX).
Budgeted NPAT is the Board approved nominated budget for the year of attributable net profit after tax before material items and discontinued operations, and is adjusted as appropriate to reflect the acquisition or disposal of a business during the year based on feasibilities at the time of the approval of such transactions.
For the year ended 30 June 2015, each Executive Director’s STI bonus was $230,209 (2014: $499,000) which have been accrued for in 2015 and in the prior year respectively. In relation to the year ended 30 June 2015, the amount payable for Mr. Kirby’s and Mr. Burke’s STI bonus amounts only related to the CFROI component, as the threshold Budgeted NPAT was not achieved for the year (2014: the CFROI component amounted to $249,000 each and the EPS component amounted to $250,000 each).
Executive Committee members can also earn STI bonuses which are based on a mix of the same CFROI and Budgeted NPAT (2014: CFROI and EPS) metrics as the Executive Directors together with specific individual Key Performance Indicators (“KPIs”) for each Executive Committee member. Remaining discretionary components of Executive Committee members’ STI bonus payments, such as against personal performance targets, are determined post balance date each calendar year and are thus not able to be accrued at the respective year end. Accordingly the STI amounts for Executive Committee members shown in the Remuneration tables on pages 20 and 21 are a composite of both (a) CFROI and Budgeted NPAT (2014: CFROI and EPS) bonus components accrued during the financial year and (b) the personal performance KPI bonus component paid during the year for performance during the prior year.
Mr. Graham Burke is eligible to earn up to 4.5 million options over ordinary shares over the five years to March 2018. For the maximum number of options to vest, the three year Compound Annual Growth Rate (“CAGR”) of normalised EPS must be at least 8% in each of the financial years 2015, 2016 and 2017, and the three year CAGR of dividends per share (“DPS”) must be at least 8% in each of calendar years 2015, 2016 and 2017. If the EPS and DPS CAGR is less than 4% then no options vest, with a sliding scale of vesting of options between 4% and 8% growth on these two measures. This Long Term Incentive Plan was approved by shareholders on 15 November 2012 with the options being exercisable at $3.76 per share. Following the $0.25 per share reduction of share capital approved by shareholders at the Annual General Meeting on 29 November 2013, the exercise price of the options was reduced to $3.51 per share, effective from 31 December 2013.
Other than an allotment on 29 June 2015 of 300,000 and 100,000 shares to Messrs C.J. Kirby and S.T. Phillipson respectively at $6.56 per share under the Company’s Executive Share Plan (2014: nil), there have been no long term incentive plan allocations made during the year or the prior year to any Executive.
The detailed compensation arrangements of all KMP for the years ended 30 June 2015 and 30 June 2014 are set out in the tables on pages 20 and 21.
A. EXECUTIVE SUMMARY (continued)
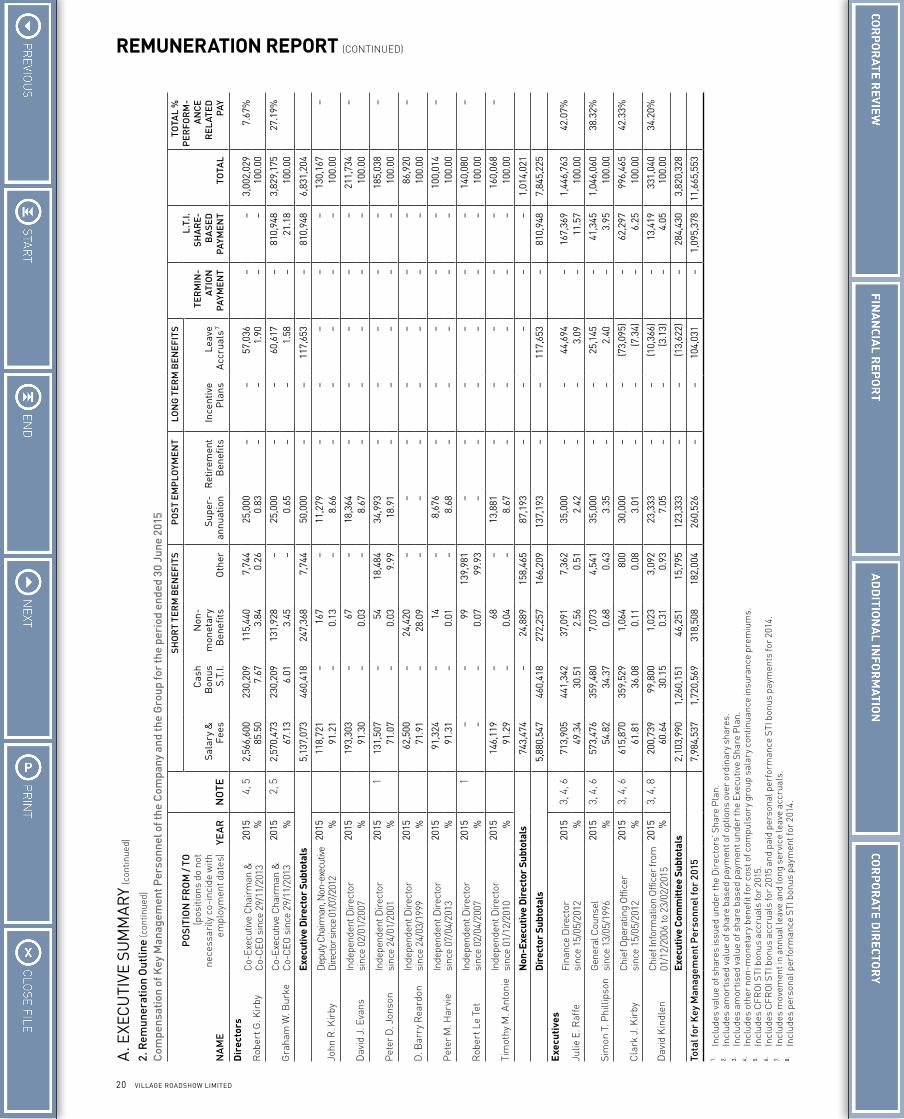
20 VILLAGE ROADSHOW LIMITED
REMUNERATION REPORT (CONTINUED)
Com
pens
atio
n of
Key
Man
agem
ent P
erso
nnel
of t
he C
ompa
ny a
nd th
e G
roup
for
the
peri
od e
nded
30
June
201
5
NA
ME
PO
SITI
ON
FR
OM
/ TO
(p
ositi
ons
do n
ot
nece
ssar
ily c
o-in
cide
with
em
ploy
men
t dat
es)
YEA
RN
OTE
SHO
RT
TER
M B
ENEF
ITS
PO
ST
EMP
LOYM
ENT
LON
G T
ERM
BEN
EFIT
S
TER
MIN
-AT
ION
PA
YMEN
T
L.T.
I. SH
AR
E-B
ASE
D
PAYM
ENT
TOTA
L
TOTA
L %
P
ERFO
RM
-A
NC
E R
ELAT
ED
PAY
Sal
ary
&
Fees
Cas
h B
onus
S.
T.I.
Non
-m
onet
ary
Ben
efits
Oth
erSu
per-
annu
atio
nR
etir
emen
t B
enef
itsIn
cent
ive
Pla
nsLe
ave
Acc
rual
s 7
Dir
ecto
rs
Rob
ert G
. Kir
byC
o-Ex
ecut
ive
Cha
irm
an &
C
o-C
EO s
ince
29/
11/2
013
2015
4, 5
2,56
6,60
023
0,20
911
5,44
07,
744
25,0
00–
–57
,036
––
3,00
2,02
97.
67%
%85
.50
7.67
3.84
0.26
0.83
––
1.90
––
100.
00
Gra
ham
W. B
urke
Co-
Exec
utiv
e C
hair
man
&
Co-
CEO
sin
ce 2
9/11
/201
320
152,
52,
570,
473
230,
209
131,
928
–25
,000
––
60,6
17–
810,
948
3,82
9,17
527
.19%
%67
.13
6.01
3.45
–0.
65–
–1.
58–
21.1
810
0.00
Exec
utiv
e D
irec
tor
Subt
otal
s5,
137,
073
460,
418
247,
368
7,74
450
,000
––
117,
653
–81
0,94
86,
831,
204
John
R. K
irby
Dep
uty C
hairm
an, N
on-e
xecu
tive
Dire
ctor
sin
ce 0
1/07
/201
220
1511
8,72
1–
167
–11
,279
––
––
–13
0,16
7–
%91
.21
–0.
13–
8.66
––
––
–10
0.00
Dav
id J
. Eva
nsIn
depe
nden
t Dire
ctor
si
nce
02/0
1/20
0720
1519
3,30
3–
67–
18,3
64–
––
––
211,
734
–%
91.3
0–
0.03
–8.
67–
––
––
100.
00
Pet
er D
. Jon
son
Inde
pend
ent D
irect
or
sinc
e 24
/01/
2001
2015
113
1,50
7–
5418
,484
34,9
93–
––
––
185,
038
–%
71.0
7–
0.03
9.99
18.9
1–
––
––
100.
00
D. B
arry
Rea
rdon
Inde
pend
ent D
irect
or
sinc
e 24
/03/
1999
2015
62,5
00–
24,4
20–
––
––
––
86,9
20–
%71
.91
–28
.09
––
––
––
–10
0.00
Pet
er M
. Har
vie
Inde
pend
ent D
irect
or
sinc
e 07
/04/
2013
2015
91,3
24–
14–
8,67
6–
––
––
100,
014
–%
91.3
1–
0.01
–8.
68–
––
––
100.
00
Rob
ert L
e Te
tIn
depe
nden
t Dire
ctor
si
nce
02/0
4/20
0720
151
––
9913
9,98
1–
––
––
–14
0,08
0–
%–
–0.
0799
.93
––
––
––
100.
00
Tim
othy
M. A
nton
ieIn
depe
nden
t Dire
ctor
si
nce
01/1
2/20
1020
1514
6,11
9–
68–
13,8
81–
––
––
160,
068
–%
91.2
9–
0.04
–8.
67–
––
––
100.
00
Non
-Exe
cutiv
e D
irec
tor
Subt
otal
s74
3,47
4–
24,8
8915
8,46
587
,193
––
––
–1,
014,
021
Dir
ecto
r Su
btot
als
5,88
0,54
746
0,41
827
2,25
716
6,20
913
7,19
3–
–11
7,65
3–
810,
948
7,84
5,22
5
Exe
cuti
ves
Julie
E. R
affe
Fina
nce
Dire
ctor
si
nce
15/0
5/20
1220
153,
4, 6
713,
905
441,
342
37,0
917,
362
35,0
00–
–44
,694
–16
7,36
91,
446,
763
42.0
7%%
49.3
430
.51
2.56
0.51
2.42
––
3.09
–11
.57
100.
00
Sim
on T
. Phi
llips
onG
ener
al C
ouns
el
sinc
e 13
/05/
1996
2015
3, 4
, 657
3,47
635
9,48
07,
073
4,54
135
,000
––
25,1
45–
41,3
451,
046,
060
38.3
2%%
54.8
234
.37
0.68
0.43
3.35
––
2.40
–3.
9510
0.00
Cla
rk J
. Kir
byC
hief
Ope
ratin
g O
ffice
r si
nce
15/0
5/20
1220
153,
4, 6
615,
870
359,
529
1,06
480
030
,000
––
(73,
095)
–62
,297
996,
465
42.3
3%%
61.8
136
.08
0.11
0.08
3.01
––
(7.3
4)–
6.25
100.
00
Dav
id K
indl
enC
hief
Info
rmat
ion
Offi
cer
from
01
/12/
2006
to 2
3/02
/201
520
153,
4, 8
200,
739
99,8
001,
023
3,09
223
,333
––
(10,
366)
–13
,419
331,
040
34.2
0%%
60.6
430
.15
0.31
0.93
7.05
––
(3.1
3)–
4.05
100.
00
Exec
utiv
e Co
mm
ittee
Sub
tota
ls2,
103,
990
1,26
0,15
146
,251
15,7
9512
3,33
3–
–(1
3,62
2)–
284,
430
3,82
0,32
8
Tota
l for
Key
Man
agem
ent P
erso
nnel
for
2015
7,98
4,53
71,
720,
569
318,
508
182,
004
260,
526
––
104,
031
–1,
095,
378
11,6
65,5
53
1.
Incl
udes
val
ue o
f sha
res
issu
ed u
nder
the
Dir
ecto
rs’ S
hare
Pla
n.2.
Incl
udes
am
ortis
ed v
alue
of s
hare
bas
ed p
aym
ent o
f opt
ions
ove
r or
dina
ry s
hare
s.3.
Incl
udes
am
ortis
ed v
alue
of s
hare
bas
ed p
aym
ent u
nder
the
Exe
cutiv
e Sh
are
Pla
n.4.
Incl
udes
oth
er n
on-m
onet
ary
bene
fit fo
r co
st o
f com
puls
ory
grou
p sa
lary
con
tinua
nce
insu
ranc
e pr
emiu
ms.
5.
Incl
udes
CFR
OI S
TI b
onus
acc
rual
s fo
r 20
15.
6.
Incl
udes
CFR
OI S
TI b
onus
acc
rual
s fo
r 20
15 a
nd p
aid
pers
onal
per
form
ance
STI
bon
us p
aym
ents
for
2014
.7.
Incl
udes
mov
emen
t in
annu
al le
ave
and
long
ser
vice
leav
e ac
crua
ls.
8.
Incl
udes
per
sona
l per
form
ance
STI
bon
us p
aym
ent f
or 2
014.
A. E
XEC
UTI
VE S
UM
MA
RY
(con
tinue
d)
2. R
emun
erat
ion
Out
line
(con
tinue
d)
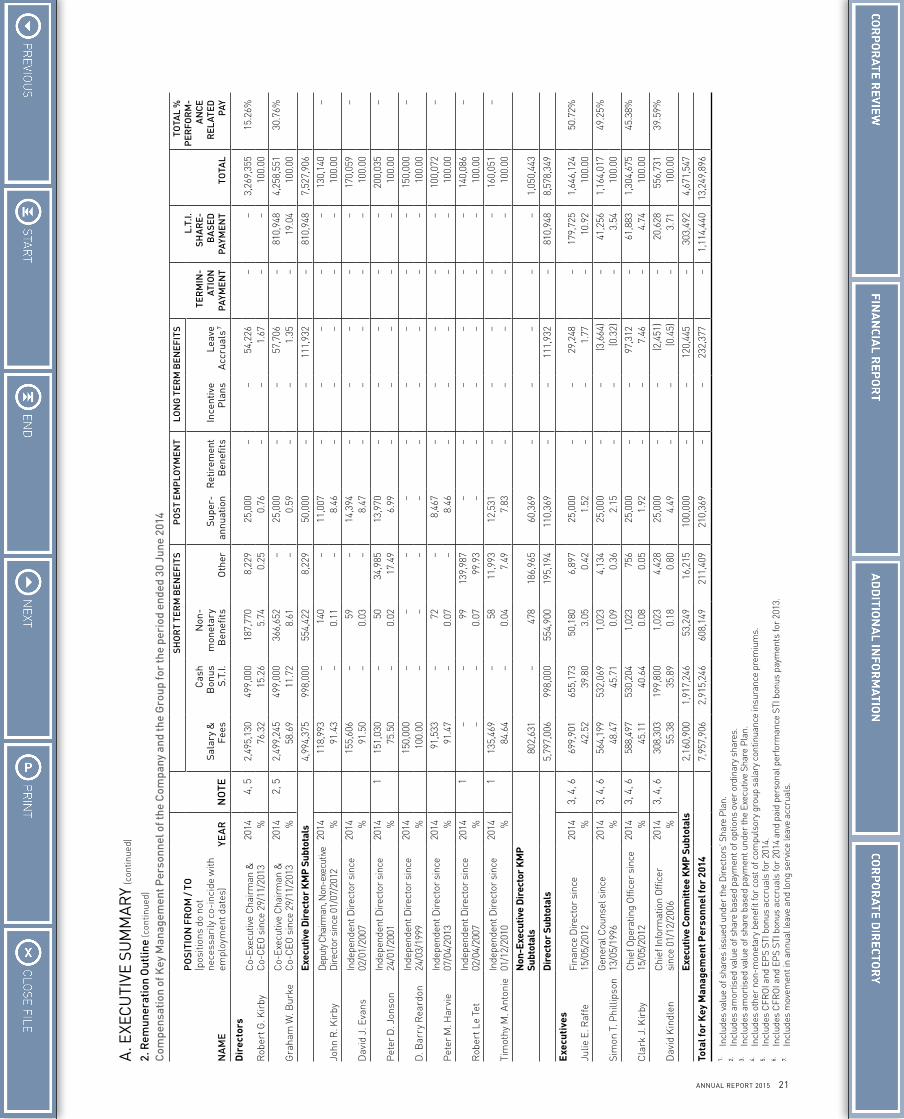
21ANNUAL REPORT 2015
Com
pens
atio
n of
Key
Man
agem
ent P
erso
nnel
of t
he C
ompa
ny a
nd th
e G
roup
for
the
peri
od e
nded
30
June
201
4
NA
ME
PO
SITI
ON
FR
OM
/ TO
(p
ositi
ons
do n
ot
nece
ssar
ily c
o-in
cide
with
em
ploy
men
t dat
es)
YEA
RN
OTE
SHO
RT
TER
M B
ENEF
ITS
PO
ST
EMP
LOYM
ENT
LON
G T
ERM
BEN
EFIT
S
TER
MIN
-AT
ION
PA
YMEN
T
L.T.
I. SH
AR
E-B
ASE
D
PAYM
ENT
TOTA
L
TOTA
L %
P
ERFO
RM
-A
NC
E R
ELAT
ED
PAY
Sal
ary
&
Fees
Cas
h B
onus
S.
T.I.
Non
-m
onet
ary
Ben
efits
Oth
erSu
per-
annu
atio
nR
etir
emen
t B
enef
itsIn
cent
ive
Pla
nsLe
ave
Acc
rual
s 7
Dir
ecto
rs
Rob
ert G
. Kir
byC
o-Ex
ecut
ive
Cha
irm
an &
C
o-C
EO s
ince
29/
11/2
013
2014
4, 5
2,49
5,13
049
9,00
018
7,77
08,
229
25,0
00–
–54
,226
––
3,26
9,35
515
.26%
%76
.32
15.2
65.
740.
250.
76–
–1.
67–
–10
0.00
Gra
ham
W. B
urke
Co-
Exec
utiv
e C
hair
man
&
Co-
CEO
sin
ce 2
9/11
/201
320
142,
52,
499,
245
499,
000
366,
652
–25
,000
––
57,7
06–
810,
948
4,25
8,55
130
.76%
%58
.69
11.7
28.
61–
0.59
––
1.35
–19
.04
100.
00
Exec
utiv
e D
irec
tor
KM
P Su
btot
als
4,99
4,37
599
8,00
055
4,42
28,
229
50,0
00–
–11
1,93
2–
810,
948
7,52
7,90
6
John
R. K
irby
Depu
ty C
hairm
an, N
on-e
xecu
tive
Dire
ctor
sin
ce 0
1/07
/201
220
1411
8,99
3–
140
–11
,007
––
––
–13
0,14
0–
%91
.43
–0.
11–
8.46
––
––
–10
0.00
Dav
id J
. Eva
nsIn
depe
nden
t Dire
ctor
sin
ce
02/0
1/20
0720
1415
5,60
6–
59–
14,3
94–
––
––
170,
059
–%
91.5
0–
0.03
–8.
47–
––
––
100.
00
Pet
er D
. Jon
son
Inde
pend
ent D
irect
or s
ince
24
/01/
2001
2014
115
1,03
0–
5034
,985
13,9
70–
––
––
200,
035
–%
75.5
0–
0.02
17.4
96.
99–
––
––
100.
00
D. B
arry
Rea
rdon
Inde
pend
ent D
irect
or s
ince
24
/03/
1999
2014
150,
000
––
––
––
––
–15
0,00
0–
%10
0.00
––
––
––
––
–10
0.00
Pet
er M
. Har
vie
Inde
pend
ent D
irect
or s
ince
07
/04/
2013
2014
91,5
33–
72–
8,46
7–
––
––
100,
072
–%
91.4
7–
0.07
–8.
46–
––
––
100.
00
Rob
ert L
e Te
tIn
depe
nden
t Dire
ctor
sin
ce
02/0
4/20
0720
141
––
9913
9,98
7–
––
––
–14
0,08
6–
%–
–0.
0799
.93
––
––
––
100.
00
Tim
othy
M. A
nton
ieIn
depe
nden
t Dire
ctor
sin
ce
01/1
2/20
1020
141
135,
469
–58
11,9
9312
,531
––
––
–16
0,05
1–
%84
.64
–0.
047.
497.
83–
––
––
100.
00
Non
-Exe
cutiv
e D
irec
tor
KM
P
Subt
otal
s80
2,63
1–
478
186,
965
60,3
69–
––
––
1,05
0,44
3
Dir
ecto
r Su
btot
als
5,79
7,00
699
8,00
055
4,90
019
5,19
411
0,36
9–
–11
1,93
2–
810,
948
8,57
8,34
9
Exe
cuti
ves
Julie
E. R
affe
Fina
nce
Dire
ctor
sin
ce
15/0
5/20
1220
143,
4, 6
699,
901
655,
173
50,1
806,
897
25,0
00–
–29
,248
–17
9,72
51,
646,
124
50.7
2%%
42.5
239
.80
3.05
0.42
1.52
––
1.77
–10
.92
100.
00
Sim
on T
. Phi
llips
onG
ener
al C
ouns
el s
ince
13
/05/
1996
2014
3, 4
, 656
4,19
953
2,06
91,
023
4,13
425
,000
––
(3,6
64)
–41
,256
1,16
4,01
749
.25%
%48
.47
45.7
10.
090.
362.
15–
–(0
.32)
–3.
5410
0.00
Cla
rk J
. Kir
byC
hief
Ope
ratin
g O
ffice
r si
nce
15/0
5/20
1220
143,
4, 6
588,
497
530,
204
1,02
375
625
,000
––
97,3
12–
61,8
831,
304,
675
45.3
8%%
45.1
140
.64
0.08
0.05
1.92
––
7.46
–4.
7410
0.00
Dav
id K
indl
enC
hief
Info
rmat
ion
Offi
cer
sinc
e 01
/12/
2006
2014
3, 4
, 630
8,30
319
9,80
01,
023
4,42
825
,000
––
(2,4
51)
–20
,628
556,
731
39.5
9%%
55.3
835
.89
0.18
0.80
4.49
––
(0.4
5)–
3.71
100.
00
Exec
utiv
e Co
mm
ittee
KM
P Su
btot
als
2,16
0,90
01,
917,
246
53,2
4916
,215
100,
000
––
120,
445
–30
3,49
24,
671,
547
Tota
l for
Key
Man
agem
ent P
erso
nnel
for
2014
7,95
7,90
62,
915,
246
608,
149
211,
409
210,
369
––
232,
377
–1,
114,
440
13,2
49,8
96
1.
Incl
udes
val
ue o
f sha
res
issu
ed u
nder
the
Dire
ctor
s’ S
hare
Pla
n.2.
Incl
udes
am
ortis
ed v
alue
of s
hare
bas
ed p
aym
ent o
f opt
ions
ove
r or
dina
ry s
hare
s.3.
Incl
udes
am
ortis
ed v
alue
of s
hare
bas
ed p
aym
ent u
nder
the
Exec
utiv
e Sh
are
Pla
n.4.
Incl
udes
oth
er n
on-m
onet
ary
bene
fit fo
r co
st o
f com
puls
ory
grou
p sa
lary
con
tinua
nce
insu
ranc
e pr
emiu
ms.
5.
Incl
udes
CFR
OI a
nd E
PS
STI b
onus
acc
rual
s fo
r 20
14.
6.
Incl
udes
CFR
OI a
nd E
PS
STI b
onus
acc
rual
s fo
r 20
14 a
nd p
aid
pers
onal
per
form
ance
STI
bon
us p
aym
ents
for
2013
.7.
Incl
udes
mov
emen
t in
annu
al le
ave
and
long
ser
vice
leav
e ac
crua
ls.
A. E
XEC
UTI
VE S
UM
MA
RY
(con
tinue
d)
2. R
emun
erat
ion
Out
line
(con
tinue
d)
22 VILLAGE ROADSHOW LIMITED
REMUNERATION REPORT (CONTINUED)
B. REMUNERATION STRATEGY AND POLICYThe performance of the Company depends upon the skills and quality of its Directors and senior executives. To prosper the Group must attract, motivate and retain highly skilled Directors and senior executives. The compensation structure is designed to strike an appropriate balance between fixed and variable remuneration, rewarding capability and experience and providing recognition for contribution to the Group’s overall goals and objectives.
The objectives of the remuneration strategy are to:– Reinforce the short, medium and long term financial targets and
business strategies of the Group as set out in the strategic business plans of the Group and each operating division;
– Provide a common interest between executives and shareholders by aligning the rewards that accrue to executives to the creation of value for shareholders; and
– Be competitive in the markets in which the Group operates in order to attract, motivate and retain high calibre executives.
An explanation of the performance conditions, the methods used to assess whether the performance conditions have been satisfied and why those methods were chosen, including external comparisons, are set out below in the relevant sections of this Report. A discussion of the relationship between the Group’s remuneration policy and the Company’s performance is set out below in section H of this Report.
To implement this policy and to seek to meet the specified objectives, the Group embodies the following principles in its compensation framework:– Provide competitive rewards to attract and retain high calibre Directors
and senior executives who are dedicated to the interests of the Company;– Link executive compensation to the achievement of the Group’s or the
relevant division’s financial and operational performance;– All Executive Committee members and Executive Directors have
a portion of their compensation ‘at risk’ by having the opportunity to participate in the Company’s bonus scheme where specified criteria are met, including criteria relating to profitability and cash flow, or other pre-determined personal performance indicators and benchmarks; and
– Establish appropriate, demanding, personalised performance hurdles in relation to variable executive remuneration and bonuses.
The framework of the Group’s compensation policy provides for a mix of fixed pay and variable (‘at risk’) pay:– Short term, fixed compensation;– Other benefits and post-employment compensation such as
superannuation; and– Variable Compensation:
– Short Term performance Incentive Bonus (“STI”); and– Long Term equity-linked performance Incentive (“LTI”).
The Charter of the Company’s Remuneration Committee provides for the review and decision on the compensation arrangements of the Company’s Executive Directors, Executive Committee and all other senior corporate and divisional executives, including any equity participation by Executive Directors and Executive Committee as well as other non-KMP executives. The Committee takes external advice from time to time on the compensation of the Executive Directors, Executive Committee and non-KMP senior executives with the overall objective of motivating and appropriately rewarding performance.
The Charter, role, responsibilities, operation and membership of the Remuneration Committee of the Board are set out in the Company’s Corporate Governance Statement which is available on the Company’s website at www.villageroadshow.com.au.
C. NON-EXECUTIVE DIRECTOR REMUNERATION1. ObjectiveThe Board seeks to set aggregate remuneration at a level which provides the Company with the ability to attract and retain appropriately qualified and experienced Non-Executive Directors of the highest calibre, whilst incurring a cost which is acceptable to shareholders. The Company operates a complex business in fiercely competitive markets and the duties and obligations of Non-Executive Directors are becoming increasingly onerous and time consuming.
2. StructureThe Constitution of the Company and the ASX Listing Rules specify that the annual aggregate remuneration of Non-Executive Directors shall be determined from time to time by shareholders in general meeting. An amount not exceeding the annual aggregate remuneration so determined is then divided between the Non-Executive Directors as agreed.
The latest determination was at the Annual General Meeting held on 15 November 2012, when shareholders approved an aggregate remuneration level for Non-Executive Directors of $1,300,000 per annum. This aggregate fee level includes any compensation paid to Non-Executive Directors who may serve on Boards of the consolidated entity. Aggregate payments to Non-Executive Directors have never exceeded the total pool approved by shareholders.
Each Non-Executive Director receives a fee for being a Director of the Company. An additional fee is also paid for each Board Committee or major subsidiary or affiliate on which a Non-Executive Director serves. The payment of additional fees for serving on a Committee or subsidiary or affiliate Board recognises the additional time commitment required by that Non-Executive Director.
To preserve the independence and impartiality of Non-Executive Directors, no element of Non-Executive Director remuneration is ‘at risk’ based on the performance of the Company and does not incorporate any bonus or incentive element.
Board and Committee fees are set by reference to a number of relevant considerations including the responsibilities and risks attaching to the role, the time commitment expected of Non-Executive Directors, fees paid by peer-sized companies and independent advice received from external advisors. The remuneration arrangements of Non-Executive Directors are periodically reviewed by the Remuneration Committee to ensure they remain in line with general industry practice, the last review having taken effect from July 2012.
From July 2012, Non-Executive Directors have been paid at the rate of $100,000 per annum, payable quarterly in arrears. In addition Non-Executive Directors receive an additional $20,000 per annum for each Board Committee on which they serve, other than for the Nomination Committee which is set at 50% of the Committee fee. The Lead Independent Director and, from July 2012, the Deputy Chairman, receives an additional $30,000 per annum and Committee Chairs are paid at a rate of 50% above other Committee members in recognition of the additional workload.
During the year ended 30 June 2014 and pro rata for part of the year ended 30 June 2015 until his retirement in November 2014, Mr. D.B. Reardon received an additional $30,000 fee per annum for his services on the board of Village Roadshow Pictures International Pty. Ltd., and Mr. D.J. Evans received an additional $30,000 fee per annum for his services on various Village Roadshow Entertainment Group Limited companies.
The Company does not have and never has had a retirement benefit scheme for Non-Executive Directors, other than their individual statutory superannuation benefits which, where applicable, are included as part of the aggregate fee for Non-Executive Directors as remuneration.
In addition, although not required by the Company’s constitution, the Company considers it appropriate for Non-Executive Directors to have a stake in the company on whose board he or she sits and the Company encourages Non-Executive Directors to hold shares in the Company. Subject to any necessary approvals as may be required by law or by ASX Listing Rules, Directors may be invited from time to time to participate in share and ‘in substance option’ plans offered by the Company.
The Directors’ Share Plan (“DSP”), effective from 1 January 2011 and renewed by shareholders at the 2013 Annual General Meeting of the Company, enables Non-Executive Directors to salary sacrifice some or all of their fees into ordinary shares in the Company. The shares are allotted on a salary sacrifice basis at the weighted average market price on ASX on the first 5 trading days of the third month of the relevant quarter, rounded up to the next whole cent. Non-Executive Directors can vary their participation in the DSP each calendar year. The various allotments during the year under the DSP are set out in the table below.
Name Allotment Date No. shares Issue Price
P.D. Jonson 8 September 20148 December 201410 March 20159 June 2015
620664856749
$7.45$6.96$5.40$6.17
R. Le Tet 8 September 20148 December 201410 March 20159 June 2015
4,6975,0286,4815,672
$7.45$6.96$5.40$6.17
23ANNUAL REPORT 2015
The various share, option and ‘in substance option’ entitlements of all Directors are advised to ASX in accordance with the Listing Rules and the Act requirements and are set out on page 11 of the Directors’ Report.
The remuneration of Non-Executive Directors for the periods ending 30 June 2014 and 30 June 2015 are detailed on pages 20 and 21 of this Report.
D. EXECUTIVE COMPENSATIONThe names and positions of the Executives of the Group for the period ending 30 June 2014 and 2015 are detailed on page 18 of this Report.
1. ObjectiveThe Company aims to reward the Executive Directors and members of the Executive Committee with a level and mix of remuneration commensurate with the seniority of their position and responsibilities within the Group, so as to:– reward for Group financial performance against targets set by reference
to appropriate benchmarks;– reward for achievement of annually set personal performance criteria;– align the interests of the Executive Committee with those of the Company
and of its shareholders;– link their rewards to the strategic goals and performance of the Group;
and– ensure total compensation is competitive by market standards for the
relevant industry.
2. StructureIn determining the level and make-up of Executive compensation, the Remuneration Committee seeks independent advice of external consultants as required from time to time to advise on market levels of compensation for comparable roles in the entertainment industry. The proportion of fixed pay and variable compensation (potential short term and long term incentives) is monitored by the Remuneration Committee, taking into account the Group’s then present circumstances and its future short-term and longer-term goals.
The compensation of Executive Directors and Executive Committee consists of the following key elements:– Short term, fixed compensation;– Other compensation such as post employment compensation (including
superannuation);– Variable Compensation:
– Short Term Incentive Bonus (“STI”); and– Long Term Incentive (“LTI”).
On 29 November 2013 Mr. Graham Burke and Mr. Robert Kirby both became Co-Executive Chairman and Co-Chief Executive Officer of VRL with no change to their remuneration arrangements other than Mr. Burke’s $1.0 million annual performance bonus being shared equally between Mr. Burke and Mr. Kirby (subsequently amended to $750,000 each). This change in titles was in recognition that both Mr. Kirby and Mr. Burke work closely together as a highly effective team beyond the traditional roles and boundaries of individual Chairman and CEO. The change also reflects that Mr. Kirby and Mr. Burke effectively share both positional functions between them. The flexibility that the joint titles brings to Mr. Kirby and Mr. Burke also facilitates enhanced senior executive input into the day-to-day operations of the Company with both men primarily concentrating their various efforts in different parts of the Company’s businesses.
On 23 February 2015 Mr David Kindlen resigned from the Company’s Executive Committee and ceased from that date as KMP, remaining an employee of the Company until 30 June 2015.
The details of the fixed and variable components (and the relevant percentages) of each individual Executive of the Company and the Group are set out on pages 20 and 21 of this Report.
The remuneration and terms and conditions of employment for the Executive Directors and the Executive Committee members are set out in individual contracts of employment. The details of each contract of the relevant Executives are outlined in section E of this Report.
3. Fixed Compensation(a) ObjectiveThe level of fixed pay is set so as to provide a base level of compensation which is fair, reasonable and appropriate to the seniority of the position
and to be competitive in the market. Fixed pay (defined as the base compensation payable to an individual and which is not dependent on the outcome of specific criteria) is reviewed annually by the Remuneration Committee, taking into account other elements of the compensation mix, such as STI bonus and LTI arrangements.
The Remuneration Committee is responsible for approval of the level of fixed pay for Executives and all other senior corporate and divisional executives. No specific remuneration review was undertaken during the year by the Company, however during the year other remuneration advice was provided to the Group by the remuneration consultant, Mercer (Australia) Pty. Ltd., mainly for the provision of market remuneration data for salaried staff other than for KMP, for which the Company paid $5,800 (2014: $5,600).
(b) StructureThe Executive Directors and Executive Committee receive their fixed (primary) compensation in a variety of forms including cash, superannuation and, where applicable, taxable value of fringe benefits such as motor vehicles and other non-monetary benefits. The fixed compensation component is not ‘at risk’ but is set by reference to competitive industry expectations and the scale and complexity of the different businesses together with appropriate benchmark information for the individual’s responsibilities, performance, qualifications, experience and location.
The fixed compensation component of each Executive Director and Executive Committee member for the periods ended 30 June 2015 and 30 June 2014 is detailed on pages 20 and 21 of this Report.
4. Variable Compensation — Short Term Incentive (“STI”) Bonus(a) ObjectiveFor the Executive Directors and the Executive Committee the objective of the STI bonus program is to link the achievement of the Group’s annual operational targets with the compensation received by the Executive Directors and the Executive Committee charged with meeting those targets, as well as relevant personalised individual targets for Executive Committee members. The total potential STI bonus available is set at a level so as to provide appropriate incentive to the Executive Committee members to achieve the operational targets set by the Group and such that the cost to the Group is reasonable in the circumstances. The STI bonus program is also available to other non-KMP executives.
The STI is designed so that a large portion of an Executive’s individual remuneration is ‘at risk’ against meeting targets linked to the Group’s annual performance and mid-term business objectives, weighted so that the more senior the Executive the larger the proportion of remuneration that is at risk. For the Executive Committee, their STI is a blend of financial KPIs applicable to the Group together with personal KPIs based on the relevant responsibilities of each role, whereas the Executive Director’s 2014 STI bonus was based solely on the Company’s achieved CFROI and EPS financial KPIs, and for 2015 was based solely on the Company’s achieved CFROI and achievement of the Budgeted NPAT.
(b) StructureAll Executive Committee members, as well as other corporate and divisional executives, are eligible to participate in the Group’s annual STI bonus scheme after at least six months of service. Actual STI bonus payments made to the Executive Directors and to each Executive Committee member depend on the extent to which pre-determined financial performance benchmarks and/or other individual financial or non-financial criteria set at the beginning of each financial year, are met.
The Group has predetermined financial performance benchmarks which must be met in order to trigger payments under the STI bonus scheme. These Group specific and tailored performance conditions were chosen so as to align the STI payments to the financial performance of the Company and the Group as a whole. These performance criteria include EPS growth benchmarks, minimum CFROI targets and the achievement of Budgeted NPAT targets.
The CFROI performance component used relates to earnings before interest, tax, depreciation and amortisation, excluding material items of income and expense and discontinued operations (“EBITDA”) as a percentage of capital employed, and capital employed is represented by total shareholders’ equity plus net debt. Bonuses are calculated based on the ratio from year to year and are on a sliding scale between 10% and 20% with nil bonus for a CFROI achieved in any year of less than 10% and capped at the maximum bonus where CFROI exceeds 20%. The Company considers that this financial performance condition relating to the Group’s underlying cash flows is appropriately challenging taking into account the group’s cost of capital and investment hurdle rates and directly links STI rewards to those relevant Executives with the financial performance of the
C. NON-EXECUTIVE DIRECTOR REMUNERATION (continued)
2. Structure (continued)
24 VILLAGE ROADSHOW LIMITED
REMUNERATION REPORT (CONTINUED)
Company and the Group and the flow-on consequences for shareholders. For the Executive Directors, half of the maximum STI was measured on this CFROI metric in 2014 and for one third of the maximum STI in 2015 and for future years.
Similarly, until the end of 2014 the Company had chosen EPS as the other suitable STI performance condition for the other half of the maximum STI for the Executive Directors due to the direct linkage to the Group’s underlying financial performance. Bonuses to 2014 used the EPS criteria such that where the Company’s EPS growth percentage was less than the growth achieved for the ASX 300 index, nil bonus was payable, and where the Company’s EPS growth equalled or exceeded 10% more than the ASX 300’s EPS growth for the relevant period (being growth over one or three years, as appropriate), 100% of that bonus component was payable. The Company considers that no direct segment, market index or industry comparators exist for the Company, and thus the ASX 300 comparator had been selected for benchmarking this performance condition as a proxy for similarly sized or larger companies listed on the ASX operating predominantly in Australia, and because the performance of this benchmark was independently externally verifiable. This performance condition ceased at the end of the 2014 year.
From 2015 onwards the second financial performance condition used to assess two-thirds of the maximum STI for the Executive Directors uses the Company’s NPAT for the year compared to Budgeted NPAT. This Budgeted NPAT is benchmarked from the Board approved budget for the year of attributable net profit after tax before material items and discontinued operations, and is adjusted as appropriate to reflect the acquisition or disposal of a business during the year based on feasibilities at the time of the approval of such transactions. Half of the STI using this criteria is payable upon the Company achieving 92.5% of the Budgeted NPAT, and the other half is payable pro rata on a sliding scale up to achievement of 100% of Budgeted NPAT.
For the 2014 financial year Mr. Graham Burke and Mr. Robert Kirby, the two Executive Directors, were eligible to earn up to a maximum of $500,000 each in the form of an annual STI bonus. 50% of the maximum bonus was based on CFROI and 50% was based on EPS growth relative to the top 300 stocks listed on the ASX.
For the year ended 30 June 2015 the maximum STI bonus was increased to $750,000 for each of the Executive Directors. One third of the maximum STI bonus is based on CFROI, one third on achievement of 92.5% of Budgeted NPAT and one third on a sliding scale from 92.5% to 100% of achievement of Budgeted NPAT.
For the 2015 year the CFROI bonus component amounted to $230,209 for each of the Executive Directors (2014: $249,000 each) and, being due and payable, has been accrued for at 30 June 2015, and the EPS bonus component in 2014 amounted to $250,000 each. In the 2015 year, the Budgeted NPAT target was not achieved by the Company and accordingly no STI bonus in respect of that component is due and payable and no amount has been accrued for at 30 June 2015. The CFROI hurdle rates achieved were at 92.1% of the maximum hurdle rate for the 2015 financial year (2014: 99.6%) and the 2014 EPS bonus component for the EPS growth over the previous 3 years amounted to 100% of the maximum hurdle rate.
In addition to CFROI, EPS and Budgeted NPAT performance criteria, as appropriate, to mirror the STI criteria for the Executive Directors, for Executive Committee members, individual personalised key performance indicators (“KPIs”) are also set each year. These individual KPIs include appropriate financial and non-financial performance metrics relevant to the role, position and responsibilities of the individual. The KPIs for the following year are set for each individual Executive Committee member and that individual’s performance against the previous year’s KPIs is reviewed annually.
Only the components of STI bonus payments that can be accurately determined are accrued at balance date – remaining components of STI bonus payments, such as those related to personal KPI performance criteria for Executive Committee members, are calculated after balance date and are paid in the following October.
The STI bonus amounts shown in the Remuneration tables for Executive Committee for the 2015 and 2014 years include both the accrued CFROI and (for 2014 only) EPS components for the current year, being due and payable, as well as their individual personal performance bonus components paid in relation to the prior financial year. Accordingly the STI figures for 2015 and 2014 in the Remuneration tables detailed on pages 20 and 21 of this
Report are a composite of various years’ bonus components and may not be directly comparable.
The overall review of proposed bonus payments to Executive Committee members is decided annually by the Remuneration Committee on the recommendation of the Executive Directors. All bonuses, including any recommended STI bonus payments for the Executive Directors and for Executive Committee, are approved by the Company’s Remuneration Committee.
Future STI bonuses of the Executives are dependent on a number of external variables, including the financial performance of the Company and the Group. For all Executives the minimum potential value of the STI which could be paid in respect of any year, for example as a result of poor performance or missing tailored, pre-set targets, would be nil, and the maximum STI bonus payable in respect of any year would be the maximum amounts, as detailed in the table below for the current year. Therefore, the theoretical percentage of maximum STI bonus payments that could be forfeited in respect of any year would be 100% of the maximum amounts, as detailed in the table below for the current year. In addition, transaction based specific bonuses may be payable to one or more Executives where specific medium term strategic challenges are encountered and successfully overcome.
The STI bonus arrangements for the Executives for the year ended 30 June 2015 are set out as follows:
Name TitleMaximum STI Methodology
Robert G. Kirby
Co-Executive Chairman and Co-Chief Executive Officer
$750,000 * 1/3rd based on CFROI, 1/3rd based on 92.5% of Budgeted NPAT, 1/3rd based on 100% of Budgeted NPAT
Graham W. Burke
Co-Executive Chairman and Co-Chief Executive Officer
$750,000 * 1/3rd based on CFROI, 1/3rd based on 92.5% of Budgeted NPAT, 1/3rd based on 100% of Budgeted NPAT
Julie E. Raffe
Finance Director
100% of base salary
50% based on individual KPIs, 50% based on CFROI and Budgeted NPAT (same as for Executive Directors)
Simon T. Phillipson
General Counsel
100% of base salary
50% based on individual KPIs, 50% based on CFROI and Budgeted NPAT (same as for Executive Directors)
Clark J. Kirby
Chief Operating Officer
100% of base salary
50% based on individual KPIs, 50% based on CFROI and Budgeted NPAT (same as for Executive Directors)
David Kindlen #
Chief Information Officer
$200,000 100% based on individual KPIs
* Previously $500,000 maximum# Ceased as KMP on 23 February 2015
The STI bonus payments made to each of the Executive Directors and the Executive Committee members in the periods ending 30 June 2015 and 30 June 2014, and the relative percentage of such STI incentive remuneration to total remuneration, are detailed on pages 20 and 21 of this Report.
5. Variable Remuneration — Long Term Incentive (“LTI”)(a) ObjectiveThe objective of the Company’s various LTI plans is to reward Executives in a manner which assists in aligning this element of their remuneration with the creation of shareholder wealth.
During the 2014 and 2015 years there have been 2 LTI plans in operation within the consolidated entity:– The Company’s Executive Share Plan and Loan Facility (“ESP”),
introduced in 1996; and– The 2012 Option Plan over ordinary shares to Mr. Graham Burke, the
Company’s Co-Executive Chairman and Co-Chief Executive Officer (“2012 OP”).
D. EXECUTIVE COMPENSATION (continued)
4. Variable Compensation — Short Term Incentive (“STI”) Bonus (continued)
(b) Structure (continued)
25ANNUAL REPORT 2015
In addition the Group has a loan arrangement over a 1993 legacy equity-linked performance plan in which Mr. P.M. Harvie is the sole remaining participant, where dividends are used to repay the interest accrued with any surplus dividend payment used to repay the capital amount of the loan. All grants to Mr. Harvie under this legacy plan were in his capacity as an executive of the consolidated entity and were prior to him becoming a KMP of the Company. Loans over 128,700 shares were repaid from dividends during 2015 (2014: 64,350 shares).
Participation in the LTI plans listed above for the Group’s Executives is set out in Note 25 to the Financial Statements.
All LTI plans have been approved by shareholders at the time of their introduction. Grants are made from time to time as appropriate and all proposed grants to Directors of the Company are put to shareholders for approval. The quantum of LTI grants are reflective of the seniority of the position of the relevant executive and their ability to contribute to the overall performance of the Group.
The LTI for Mr. Burke under the 2012 OP is specifically designed as ‘at risk’ remuneration, linked to the Company’s dividend and earnings per share performance. The performance hurdles relevant to the 2012 grant of options to Mr. Burke are described below.
The LTI plans for other Executive Committee members and senior executives have no specific performance conditions for the removal of restrictions over the relevant shares other than successful achievement of annual personal performance criteria. Any value accruing to an Executive Committee member is derived from improvement in the Company’s share price and dividends and distributions by the Company. The LTI plan is also regarded by the Remuneration Committee as a partial retention mechanism and encourages a sense of ownership with those Executive Committee members and senior executives to whom the LTI’s are granted, assisting in aligning their long term interests with those of shareholders.
The shares that are the subject of the ESP are offered at market value on the date of issue to Executive Committee members and other senior executives and the benefits, if any, under the ESP are correlated to the performance of the Company via the share price performance of the underlying shares.
The Company considers that the five year period over which the ESP shares are ‘earned’ is appropriate given the shorter term performance hurdles to which each Executive and senior executive is subject. Furthermore the long term horizon of the loans from the consolidated entity for the ESP continues past the final restricted holding date of the shares for the duration of the employment of the Executive and senior executive with the Group, further demonstrating the alignment of the LTI with the long term interests of the Company’s shareholders.
There are no provisions within any of the LTI plans for the automatic removal of holding restrictions on the relevant shares in the event of a change of control of the Company.
Other than as noted below, no options have been granted, exercised or lapsed during the reporting period. Details of shares in the Company, unissued shares under option, shares issued as a result of the exercise of options and ‘in substance options’ held during the period in relation to Executives and Non-Executive Directors of the Company are set out in section F of this Report.
The ESP has limited recourse loans secured over the relevant shares together with a buy-back option in the event of default. The Company has full control over all loans and the repayment thereof and full control over all shares including through holding locks. From 1 July 2011 the Company has implemented a policy that specifically prohibits the hedging of incentive remuneration granted to Executives, whether restricted or unrestricted. For the 2012 options granted to Mr. Burke, the terms of the offer specifically prohibit the hedging of unvested options by Mr. Burke. A summary of the Company’s incentive remuneration hedging policy is set out in the Company’s Corporate Governance Statement which is available on the Company’s website at www.villageroadshow.com.au.
The Company has used the fair value measurement provisions of AASB 2: Share-based Payment for all options or equity instruments granted to Executives and senior executives after 7 November 2002 which had not vested as at 1 January 2005. Under AASB 2: Share-based Payment these are all required to be accounted for and valued as equity settled options. For the purpose of this Report, these have been referred to as ‘in substance options’ even where the equity instrument itself is not a share option.
The fair value of such ‘in substance option’ grants are disclosed as part of the Executive’s compensation and are amortised on a straight-line basis over five years. The Company does not consider it is appropriate to ascribe a ‘value’ to the LTI of Executives for remuneration purposes other than the amortised fair value measurement in accordance with the provisions of AASB 2: Share-based Payment. From 1 January 2005, options or ‘in substance options’ granted as part of Executive and other senior executives’ compensation have been valued using the Black Scholes or binomial option-pricing model or the Monte Carlo simulation technique, which takes account of factors including the option exercise price, the current level and volatility of the underlying share price, the risk-free interest rate, expected dividends on the underlying share, current market price of the underlying share and the expected life of the option.
A detailed summary of these two LTI plans is set out below.
(b) Structure(i) Executive Share Plan and Loan Facility (“ESP”)The Company’s ESP was approved by shareholders on 19 November 1996 and allowed for the issue of up to 5% of the Company’s issued shares to executives and employees of the consolidated entity and significant associated entities. Directors of the Company are not eligible to participate in the ESP.
All grants to Mr. P.M. Harvie under the ESP were in his capacity as an executive of the consolidated entity and were prior to him becoming a Director of the Company.
Offers are at the discretion of the Company’s Remuneration Committee and shares are issued at the 5-day weighted average price on the market prior to allotment, rounded up to the next whole cent. The shares are held directly by the Executive Committee member who pays for the allotment by obtaining a loan from the consolidated entity which holds the ESP shares as security.
The ESP was amended in 2012. Shares issued prior to 2012 are earned (become unrestricted) at the rate of 20% per year over five years from date of issue. The loan bears interest at ten cents per share per annum and the first ten cents of dividends per share each year is used to repay the interest accrued and 50% of the remaining dividend per share is used to repay the capital amount of the loan. For shares issued in 2012 and thereafter, one third are earned and become exercisable at the end of years 3, 4 and 5 from the date of issue and the loan bears interest at twenty cents per share per annum and the first twenty cents of dividends per share per year is used to repay the interest charged and 50% of the remaining dividend per share is used to repay the capital amount of the loan. For shares issued in 2012 or thereafter, where the loan balance owing falls below $2.00 per share, the interest rate becomes 10% of the balance owing on the loan.
If the Executive Committee member resigns or is dismissed, the restricted shares are forfeited and the loan on the remaining unrestricted shares must be repaid within six months or such other time as approved by the Company’s Remuneration Committee. In circumstances where the market value of the remaining ESP shares at the end of the six month period is less than the amount owing on the loan, then the Company will buy-back the shares and cancel them in repayment of the loan without further recourse to the former Executive Committee member. This is the basis on which the ESP shares have been described as ‘in substance options’.
On 29 June 2015 an allotment of 300,000 and 100,000 shares was made to Messrs C.J. Kirby and S.T. Phillipson respectively at $6.56 per share under the Company’s Executive Share Plan (2014: nil). The fair value of each ‘in substance option’ estimated at date of grant on 29 June 2015 was $1.30. There have been no other long term incentive plan allocations during the year to any Executive Committee member. The notional adjusted equity value of ESP allotments and the percentage of each Executive Committee member’s total remuneration under the LTI are detailed on pages 20 and 21 of this Report.
D. EXECUTIVE COMPENSATION (continued)
5. Variable Remuneration — Long Term Incentive (“LTI”) (continued)
(a) Objective (continued)
26 VILLAGE ROADSHOW LIMITED
REMUNERATION REPORT (CONTINUED)
(ii) 2012 Option Plan for CEO (“2012 OP”)The extension in October 2012 of the employment contract of Mr. Graham Burke, an Executive Director, to December 2017 included a proposed grant of up to 4.5 million options over ordinary shares. The resulting 2012 OP was approved by the Company’s shareholders on 15 November 2012. The options were issued on 29 November 2012 with the options being exercisable at $3.76 per share, with vesting subject to performance hurdles relating to growth in earnings per share and growth in dividends. Following the $0.25 per share reduction of share capital approved by shareholders at the Annual General Meeting on 29 November 2013, the exercise price of the options was reduced to $3.51 per share, effective from 31 December 2013.
The options are not transferable and do not confer any right to participate in bonus issues or cash issues of ordinary shares. The option exercise price is adjusted for discounted cash issues, and the number of shares issued on exercise of an option is adjusted for bonus issues of shares. The options do not carry voting or dividend rights and are not listed for quotation on ASX. One and a half million options are exercisable subject to certain performance conditions not earlier than 1 March 2016; one and a half million options are exercisable subject to certain performance conditions not earlier than 1 March 2017; and one and a half million options are exercisable subject to certain performance conditions not earlier than 1 March 2018. Accordingly no options were eligible to vest during 2015 (2014: nil).
The EPS performance hurdle has a starting point of 34.4 cents per ordinary share, being diluted earnings per share before material items and discontinued operations for the year ended 30 June 2012, with growth measured on financial year performance, and the DPS performance hurdle has a starting point of 22 cents per ordinary share inclusive of franking credits, being the actual dividends paid in the 2012 calendar year, with growth measured on calendar year performance.
For all options to vest, the Company’s performance must meet a minimum 8% Compound Annual Growth Rate (“CAGR”) in EPS over the 3 year vesting period for half of each tranche to vest, and must meet a minimum 8% CAGR in dividends paid over 2 out of the 4 year vesting period for the other half of each tranche to vest. For half of the options to vest, the Company’s performance must meet a minimum 4% CAGR in EPS over the 3 year vesting period for one quarter of each tranche to vest, and must meet a minimum 4% CAGR in dividends paid over 2 out of the 4 year vesting period for another quarter of each tranche to vest. Below 4% CAGR in either DPS or in EPS, no options vest, with a pro-rata straight line vesting scale between 4% and 8% CAGR for each performance condition.
The effect of the performance hurdles on the potential vesting of the options can be illustrated as follows:
Number of Options able to Vest if:
Compound Annual Growth Rate (“CAGR”)
< 4% 4% 4% – 8% = or > 8%
EPS CAGR hurdle achieved
Nil 375,000 Sliding Scale *
750,000 Maximum 1st Tranche Options
Dividend CAGR hurdle achieved #
Nil 375,000 Sliding Scale *
750,000
EPS CAGR hurdle achieved
Nil 375,000 Sliding Scale *
750,000 Maximum 2nd Tranche Options
Dividend CAGR hurdle achieved #
Nil 375,000 Sliding Scale *
750,000
EPS CAGR hurdle achieved
Nil 375,000 Sliding Scale *
750,000 Maximum 3rd Tranche Options
Dividend CAGR hurdle achieved #
Nil 375,000 Sliding Scale *
750,000
# Subject to ‘2 out of 4 years’ test* A pro rata straight line vesting scale applies.
All the options are exercisable no later than 1 March 2019. In the unlikely event of the termination of Mr. Burke’s contract for cause, Mr. Burke may exercise vested options within one month of cessation of employment and all unvested options will lapse. In the event of termination without cause prior to December 2017, including by way of redundancy, all option terms continue as if Mr. Burke’s employment had not ceased and all options will continue to vest subject to the growth hurdles being met. If Mr. Burke voluntarily terminates his employment with the Company including by way of resignation or retirement, all options terms continue for 12 months as if Mr. Burke’s employment had not ceased and on that date all remaining
vested and unvested options shall lapse. If Mr. Burke dies or involuntarily terminates his employment with the Company including by way of early retirement due to ill health, permanent disablement or mental incapacity, the Company retains the right to allow all option terms to continue as if Mr. Burke’s employment had not ceased and all options will continue to vest subject to the growth hurdles being met.
Subsequent to 30 June 2015, 750,000 first tranche options have lapsed as a result of the 4% EPS CAGR hurdle not being achieved.
The terms of the grant of the options provide that should the Board determine that Mr. Burke has entered into a hedging transaction or other transaction having the effect of limiting or eliminating the economic risk associated with the options as a result of the DPS and EPS growth vesting hurdles to which they are subject, the options will expire.
The fair value of each option estimated at date of grant on 29 November 2012 was $0.73, $0.74 and $0.75 for Tranches 1, 2 and 3 respectively. The notional adjusted equity value of the option allotment and the percentage of Mr Burke’s total remuneration are detailed on pages 20 and 21 of this Report.
6. Other benefitsThe Group has other compensation arrangements with some Executives such as travel and entertainment reimbursement for business only purposes and either Company maintained vehicles, vehicle leases or car allowances as part of their remuneration packages. In addition the payment of superannuation or retirement benefit amounts within prescribed statutory limits are made, including various ancillary insurance covers. Where relevant, the grossed up taxable value of these benefits have been included as a non-monetary benefit, with the details of the value of these benefits set out on pages 20 and 21 of this Report.
With the appointment of Ms. J.E. Raffe as Finance Director of the Company in May 2012, Ms. Raffe’s proposed ESP allocation was delayed from the June 2012 ESP allotment to other Executive Committee members, granted at $3.14, to 29 November 2012 to allow for shareholder approval at the Company’s 2012 annual general meeting, following which the ESP shares were issued at $3.78. The Company agreed to compensate Ms. Raffe with an additional bonus at the time of her future sale of these ESP shares for the additional value, if any, foregone by the deferred grant date. This potential bonus payment to Ms. Raffe represents a cash-settled share-based payment estimated to be a maximum of $275,439, to be re-assessed at each financial year for changes in expected probability of payment. The fair value of this additional bonus amount was estimated on the basis of the estimated after-tax impact of $0.64 per share, being the difference between $3.78 and $3.14, and is accrued for over the 5 years from date of grant, being $71,920 for the 2015 financial year (2014: $71,920).
E. EMPLOYMENT CONTRACTSCompensation and other terms of employment for the Group’s Executives are formalised in service agreements. The main terms of all major employment contracts and bonus payments are reviewed by the Remuneration Committee. The major provisions of the service agreements of these Executives relating to compensation are as set out below.
1. Executive DirectorsBoth Mr. Graham Burke and Mr. Robert Kirby, the Company’s Executive Directors, have signed agreements with the Company setting out the principal terms and remuneration arrangements agreed with the Company’s Remuneration Committee. These terms include a base salary, CPI adjusted, superannuation and car allowance, and an annual capped incentive performance bonus is payable for the Company achieving certain financial performance targets. In addition both Mr. Burke and Mr. Kirby may seek a potential loan from the Company of up to $2 million on terms and conditions to be agreed by the Remuneration Committee of the Company.
Mr. Graham Burke also has a service contract with the Company which expires on 1 December 2017. In addition to the terms outlined above, the contract provides for the granting of four and a half million options over ordinary shares with appropriate exercise hurdles, which options were issued on 29 November 2012. Other than a global twelve month non-compete clause, the contract does not provide for pre-determined compensation in the event of termination.
D. EXECUTIVE COMPENSATION (continued)
5. Variable Remuneration — Long Term Incentive (“LTI”) (continued)
(b) Structure (continued)
27ANNUAL REPORT 2015
2. Executive CommitteeMessrs. C.J. Kirby and S.T. Phillipson and Ms. J.E. Raffe have ongoing employment agreements with the Company with no fixed expiry dates. In addition to base salary and superannuation, and a Company motor vehicle provided to Ms. Raffe and a car allowance provided to Mr. C.J. Kirby, all Executive Committee members are eligible to be paid an annual performance bonus. Executive Committee members have STI performance bonus arrangements similar to the Executive Directors based on CFROI and Budgeted NPAT metrics, as well as a discretionary performance bonus based on annually set personal performance criteria. Mr D. Kindlen ceased as KMP on 23 February 2015.
Payment for termination without cause under these employment contracts for an Executive Committee member is equal to twelve months of salary and reflects the post employment restraints applicable to these Executive Committee members under their relevant employment contracts. Mr. D. Kindlen’s contract terminated with effect from 30 June 2015. The Group may terminate an employment contract at any time without notice if serious misconduct has occurred. Where termination with cause occurs, the Executive is only entitled to that portion of remuneration which is fixed, and only up to the date of termination. On termination with cause, any unexercisable LTI plan shares are immediately forfeited and all remaining loans over such LTI shares must be repaid within 6 months of termination.
F. KMP SHARE AND OPTION HOLDINGS1. Ordinary Shares Held by KMP in Village Roadshow Limited (number)2015
NameBalance at the start of the year
Granted as remuneration1
On exercise of options Net change other
Balance at the end of the year
DirectorsRobert G. Kirby2 68,563,136 – – – 68,563,136Graham W. Burke2 68,563,136 – – – 68,563,136John R. Kirby2 68,563,136 – – – 68,563,136David J. Evans 111,971 – – – 111,971Peter D. Jonson 90,483 2,889 – – 93,372D. Barry Reardon 28,552 – – – 28,552Peter M. Harvie 107,250 – 128,700 – 235,950Robert Le Tet 104,204 21,878 – – 126,082Tim Antonie 22,485 .- – – 22,485ExecutivesJulie E. Raffe – – – – –Clark J. Kirby 2,500 – – – 2,500Simon T. Phillipson 200,000 – – – 200,000David Kindlen 23,025 – – – 23,025
2014
NameBalance at the
start of the yearGranted as
remuneration1On exercise
of options Net change otherBalance at the end of the year
DirectorsRobert G. Kirby2 71,166,999 – – (2,603,863) 68,563,136Graham W. Burke2 71,166,999 – – (2,603,863) 68,563,136John R. Kirby2 71,166,999 – – (2,603,863) 68,563,136David J. Evans 111,971 – – – 111,971Peter D. Jonson 85,464 5,019 – – 90,483D. Barry Reardon 28,552 – – – 28,552Peter M. Harvie 42,900 – 64,350 – 107,250Robert Le Tet 84,564 19,640 – – 104,204Tim Antonie 20,714 1,771 – – 22,485ExecutivesJulie E. Raffe – – – – –Clark J. Kirby 2,500 – – – 2,500Simon T. Phillipson 200,000 – – – 200,000David Kindlen 23,025 – – – 23,025
1. Allotments under Directors’ Share Plan from Directors Fees.2. Refer also to the Directors’ Report disclosures for relevant interests of Directors, in relation to the 100% ownership of the immediate and ultimate parent entities
of VRL.
E. EMPLOYMENT CONTRACTS (continued)
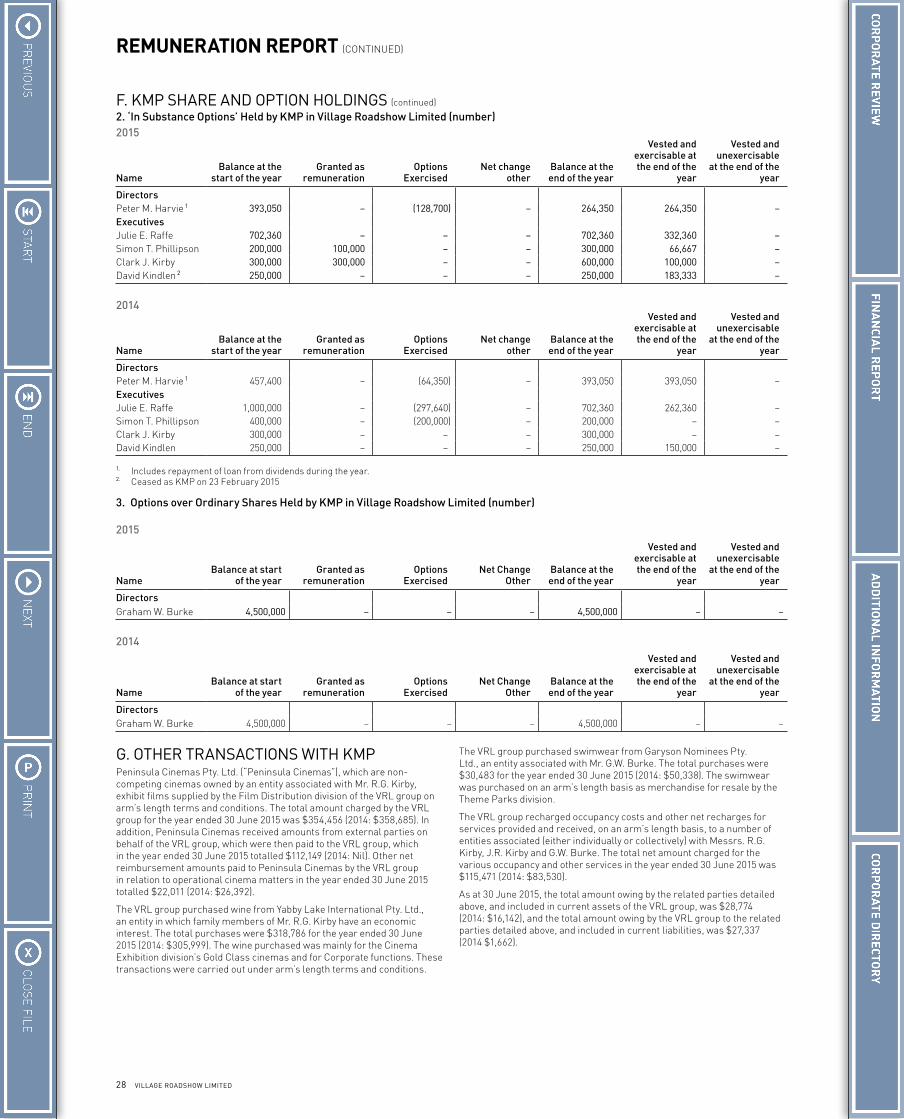
28 VILLAGE ROADSHOW LIMITED
REMUNERATION REPORT (CONTINUED)
2. ‘In Substance Options’ Held by KMP in Village Roadshow Limited (number)2015
NameBalance at the
start of the yearGranted as
remunerationOptions
ExercisedNet change
otherBalance at the end of the year
Vested and exercisable at the end of the
year
Vested and unexercisable
at the end of the year
DirectorsPeter M. Harvie 1 393,050 – (128,700) – 264,350 264,350 –ExecutivesJulie E. Raffe 702,360 – – – 702,360 332,360 –Simon T. Phillipson 200,000 100,000 – – 300,000 66,667 –Clark J. Kirby 300,000 300,000 – – 600,000 100,000 –David Kindlen 2 250,000 – – – 250,000 183,333 –
2014
NameBalance at the
start of the yearGranted as
remunerationOptions
ExercisedNet change
otherBalance at the end of the year
Vested and exercisable at the end of the
year
Vested and unexercisable
at the end of the year
DirectorsPeter M. Harvie 1 457,400 – (64,350) – 393,050 393,050 –ExecutivesJulie E. Raffe 1,000,000 – (297,640) – 702,360 262,360 –Simon T. Phillipson 400,000 – (200,000) – 200,000 – –Clark J. Kirby 300,000 – – – 300,000 – –David Kindlen 250,000 – – – 250,000 150,000 –
1. Includes repayment of loan from dividends during the year.2. Ceased as KMP on 23 February 2015
3. Options over Ordinary Shares Held by KMP in Village Roadshow Limited (number)
2015
NameBalance at start
of the yearGranted as
remunerationOptions
ExercisedNet Change
OtherBalance at the end of the year
Vested and exercisable at the end of the
year
Vested and unexercisable
at the end of the year
DirectorsGraham W. Burke 4,500,000 – – – 4,500,000 – –
2014
NameBalance at start
of the yearGranted as
remunerationOptions
ExercisedNet Change
OtherBalance at the end of the year
Vested and exercisable at the end of the
year
Vested and unexercisable
at the end of the year
DirectorsGraham W. Burke 4,500,000 – – – 4,500,000 – –
G. OTHER TRANSACTIONS WITH KMPPeninsula Cinemas Pty. Ltd. (“Peninsula Cinemas”), which are non-competing cinemas owned by an entity associated with Mr. R.G. Kirby, exhibit films supplied by the Film Distribution division of the VRL group on arm’s length terms and conditions. The total amount charged by the VRL group for the year ended 30 June 2015 was $354,456 (2014: $358,685). In addition, Peninsula Cinemas received amounts from external parties on behalf of the VRL group, which were then paid to the VRL group, which in the year ended 30 June 2015 totalled $112,149 (2014: Nil). Other net reimbursement amounts paid to Peninsula Cinemas by the VRL group in relation to operational cinema matters in the year ended 30 June 2015 totalled $22,011 (2014: $26,392).
The VRL group purchased wine from Yabby Lake International Pty. Ltd., an entity in which family members of Mr. R.G. Kirby have an economic interest. The total purchases were $318,786 for the year ended 30 June 2015 (2014: $305,999). The wine purchased was mainly for the Cinema Exhibition division’s Gold Class cinemas and for Corporate functions. These transactions were carried out under arm’s length terms and conditions.
The VRL group purchased swimwear from Garyson Nominees Pty. Ltd., an entity associated with Mr. G.W. Burke. The total purchases were $30,483 for the year ended 30 June 2015 (2014: $50,338). The swimwear was purchased on an arm’s length basis as merchandise for resale by the Theme Parks division.
The VRL group recharged occupancy costs and other net recharges for services provided and received, on an arm’s length basis, to a number of entities associated (either individually or collectively) with Messrs. R.G. Kirby, J.R. Kirby and G.W. Burke. The total net amount charged for the various occupancy and other services in the year ended 30 June 2015 was $115,471 (2014: $83,530).
As at 30 June 2015, the total amount owing by the related parties detailed above, and included in current assets of the VRL group, was $28,774 (2014: $16,142), and the total amount owing by the VRL group to the related parties detailed above, and included in current liabilities, was $27,337 (2014 $1,662).
F. KMP SHARE AND OPTION HOLDINGS (continued)
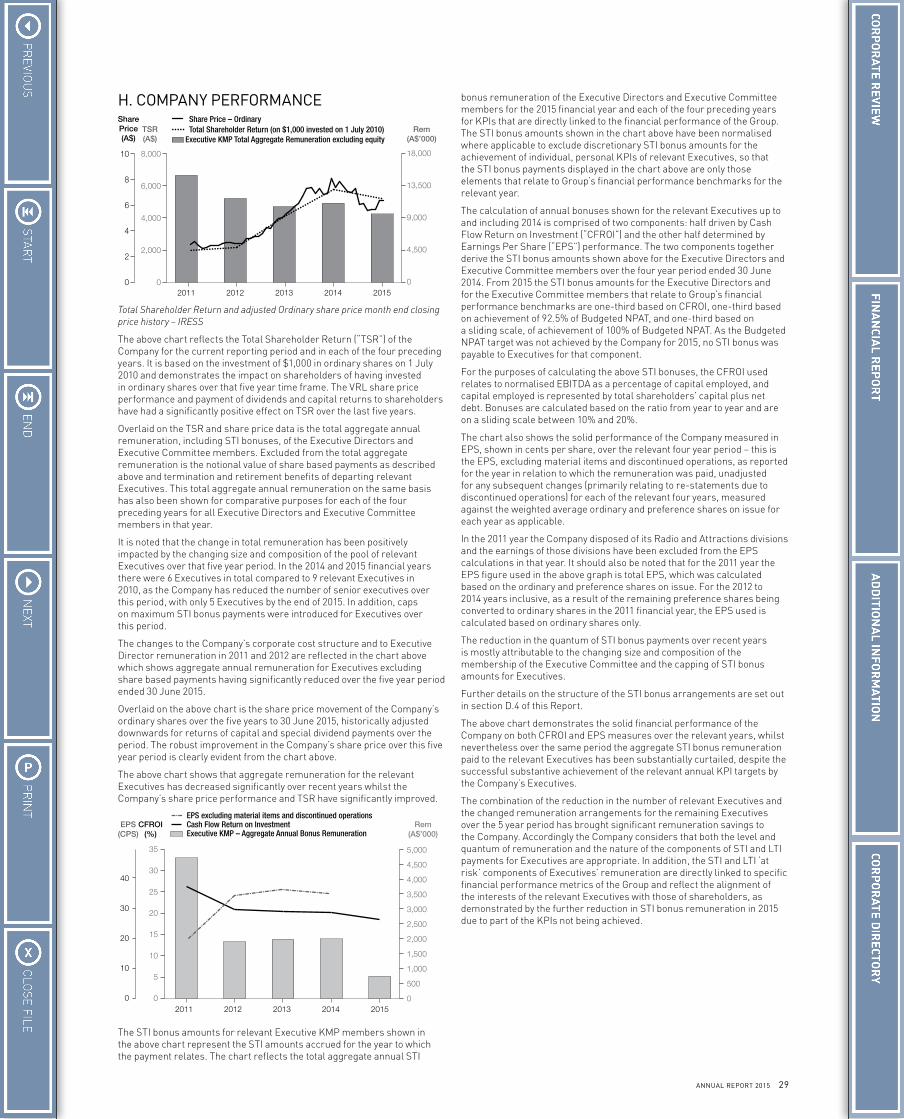
29ANNUAL REPORT 2015
H. COMPANY PERFORMANCE
TSR(A$)
SharePrice(A$)
Rem(A$’000)
Total Shareholder Return (on $1,000 invested on 1 July 2010)Executive KMP Total Aggregate Remuneration excluding equity
Share Price – Ordinary
201520142013201220110
4,500
9,000
13,500
18,000
0
2
4
6
8
10
0
2,000
4,000
6,000
8,000
Total Shareholder Return and adjusted Ordinary share price month end closing price history – IRESS
The above chart reflects the Total Shareholder Return (“TSR”) of the Company for the current reporting period and in each of the four preceding years. It is based on the investment of $1,000 in ordinary shares on 1 July 2010 and demonstrates the impact on shareholders of having invested in ordinary shares over that five year time frame. The VRL share price performance and payment of dividends and capital returns to shareholders have had a significantly positive effect on TSR over the last five years.
Overlaid on the TSR and share price data is the total aggregate annual remuneration, including STI bonuses, of the Executive Directors and Executive Committee members. Excluded from the total aggregate remuneration is the notional value of share based payments as described above and termination and retirement benefits of departing relevant Executives. This total aggregate annual remuneration on the same basis has also been shown for comparative purposes for each of the four preceding years for all Executive Directors and Executive Committee members in that year.
It is noted that the change in total remuneration has been positively impacted by the changing size and composition of the pool of relevant Executives over that five year period. In the 2014 and 2015 financial years there were 6 Executives in total compared to 9 relevant Executives in 2010, as the Company has reduced the number of senior executives over this period, with only 5 Executives by the end of 2015. In addition, caps on maximum STI bonus payments were introduced for Executives over this period.
The changes to the Company’s corporate cost structure and to Executive Director remuneration in 2011 and 2012 are reflected in the chart above which shows aggregate annual remuneration for Executives excluding share based payments having significantly reduced over the five year period ended 30 June 2015.
Overlaid on the above chart is the share price movement of the Company’s ordinary shares over the five years to 30 June 2015, historically adjusted downwards for returns of capital and special dividend payments over the period. The robust improvement in the Company’s share price over this five year period is clearly evident from the chart above.
The above chart shows that aggregate remuneration for the relevant Executives has decreased significantly over recent years whilst the Company’s share price performance and TSR have significantly improved.
CFROI(%)
EPS(CPS)
Rem(A$’000)
Cash Flow Return on InvestmentExecutive KMP – Aggregate Annual Bonus Remuneration
EPS excluding material items and discontinued operations
20152014201320122011
5,000
4,500
4,000
3,500
3,000
2,500
2,000
1,500
1,000
500
0
40
30
20
10
0
35
30
25
20
15
10
5
0
The STI bonus amounts for relevant Executive KMP members shown in the above chart represent the STI amounts accrued for the year to which the payment relates. The chart reflects the total aggregate annual STI
bonus remuneration of the Executive Directors and Executive Committee members for the 2015 financial year and each of the four preceding years for KPIs that are directly linked to the financial performance of the Group. The STI bonus amounts shown in the chart above have been normalised where applicable to exclude discretionary STI bonus amounts for the achievement of individual, personal KPIs of relevant Executives, so that the STI bonus payments displayed in the chart above are only those elements that relate to Group’s financial performance benchmarks for the relevant year.
The calculation of annual bonuses shown for the relevant Executives up to and including 2014 is comprised of two components: half driven by Cash Flow Return on Investment (“CFROI”) and the other half determined by Earnings Per Share (“EPS”) performance. The two components together derive the STI bonus amounts shown above for the Executive Directors and Executive Committee members over the four year period ended 30 June 2014. From 2015 the STI bonus amounts for the Executive Directors and for the Executive Committee members that relate to Group’s financial performance benchmarks are one-third based on CFROI, one-third based on achievement of 92.5% of Budgeted NPAT, and one-third based on a sliding scale, of achievement of 100% of Budgeted NPAT. As the Budgeted NPAT target was not achieved by the Company for 2015, no STI bonus was payable to Executives for that component.
For the purposes of calculating the above STI bonuses, the CFROI used relates to normalised EBITDA as a percentage of capital employed, and capital employed is represented by total shareholders’ capital plus net debt. Bonuses are calculated based on the ratio from year to year and are on a sliding scale between 10% and 20%.
The chart also shows the solid performance of the Company measured in EPS, shown in cents per share, over the relevant four year period – this is the EPS, excluding material items and discontinued operations, as reported for the year in relation to which the remuneration was paid, unadjusted for any subsequent changes (primarily relating to re-statements due to discontinued operations) for each of the relevant four years, measured against the weighted average ordinary and preference shares on issue for each year as applicable.
In the 2011 year the Company disposed of its Radio and Attractions divisions and the earnings of those divisions have been excluded from the EPS calculations in that year. It should also be noted that for the 2011 year the EPS figure used in the above graph is total EPS, which was calculated based on the ordinary and preference shares on issue. For the 2012 to 2014 years inclusive, as a result of the remaining preference shares being converted to ordinary shares in the 2011 financial year, the EPS used is calculated based on ordinary shares only.
The reduction in the quantum of STI bonus payments over recent years is mostly attributable to the changing size and composition of the membership of the Executive Committee and the capping of STI bonus amounts for Executives.
Further details on the structure of the STI bonus arrangements are set out in section D.4 of this Report.
The above chart demonstrates the solid financial performance of the Company on both CFROI and EPS measures over the relevant years, whilst nevertheless over the same period the aggregate STI bonus remuneration paid to the relevant Executives has been substantially curtailed, despite the successful substantive achievement of the relevant annual KPI targets by the Company’s Executives.
The combination of the reduction in the number of relevant Executives and the changed remuneration arrangements for the remaining Executives over the 5 year period has brought significant remuneration savings to the Company. Accordingly the Company considers that both the level and quantum of remuneration and the nature of the components of STI and LTI payments for Executives are appropriate. In addition, the STI and LTI ‘at risk’ components of Executives’ remuneration are directly linked to specific financial performance metrics of the Group and reflect the alignment of the interests of the relevant Executives with those of shareholders, as demonstrated by the further reduction in STI bonus remuneration in 2015 due to part of the KPIs not being achieved.
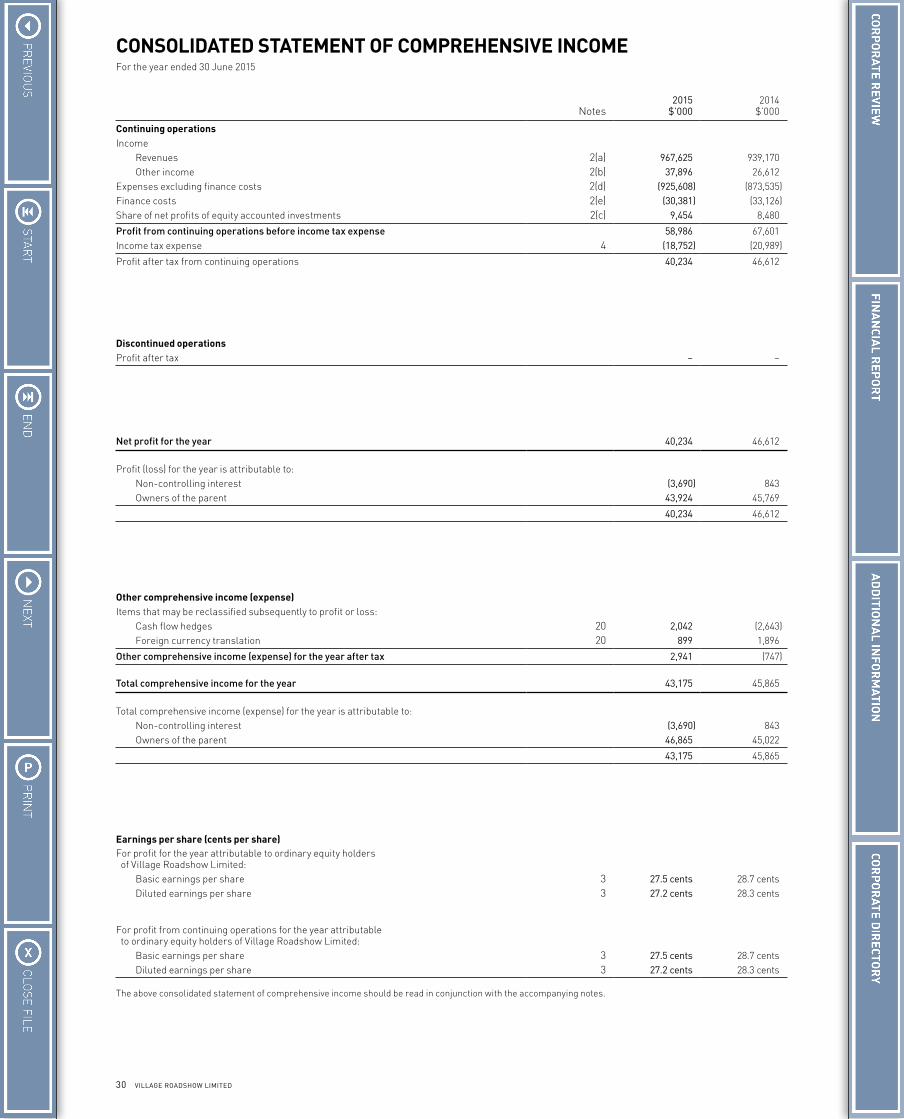
30 VILLAGE ROADSHOW LIMITED
CONSOLIDATED STATEMENT OF COMPREHENSIVE INCOMEFor the year ended 30 June 2015
Notes2015
$’0002014
$’000
Continuing operationsIncome Revenues 2(a) 967,625 939,170 Other income 2(b) 37,896 26,612Expenses excluding finance costs 2(d) (925,608) (873,535)Finance costs 2(e) (30,381) (33,126)Share of net profits of equity accounted investments 2(c) 9,454 8,480
Profit from continuing operations before income tax expense 58,986 67,601Income tax expense 4 (18,752) (20,989)
Profit after tax from continuing operations 40,234 46,612 Discontinued operationsProfit after tax – –
Net profit for the year 40,234 46,612
Profit (loss) for the year is attributable to: Non-controlling interest (3,690) 843 Owners of the parent 43,924 45,769
40,234 46,612
Other comprehensive income (expense)Items that may be reclassified subsequently to profit or loss: Cash flow hedges 20 2,042 (2,643) Foreign currency translation 20 899 1,896
Other comprehensive income (expense) for the year after tax 2,941 (747)
Total comprehensive income for the year 43,175 45,865
Total comprehensive income (expense) for the year is attributable to: Non-controlling interest (3,690) 843 Owners of the parent 46,865 45,022
43,175 45,865
Earnings per share (cents per share)For profit for the year attributable to ordinary equity holders of Village Roadshow Limited: Basic earnings per share 3 27.5 cents 28.7 cents Diluted earnings per share 3 27.2 cents 28.3 cents For profit from continuing operations for the year attributable to ordinary equity holders of Village Roadshow Limited: Basic earnings per share 3 27.5 cents 28.7 cents Diluted earnings per share 3 27.2 cents 28.3 cents
The above consolidated statement of comprehensive income should be read in conjunction with the accompanying notes.
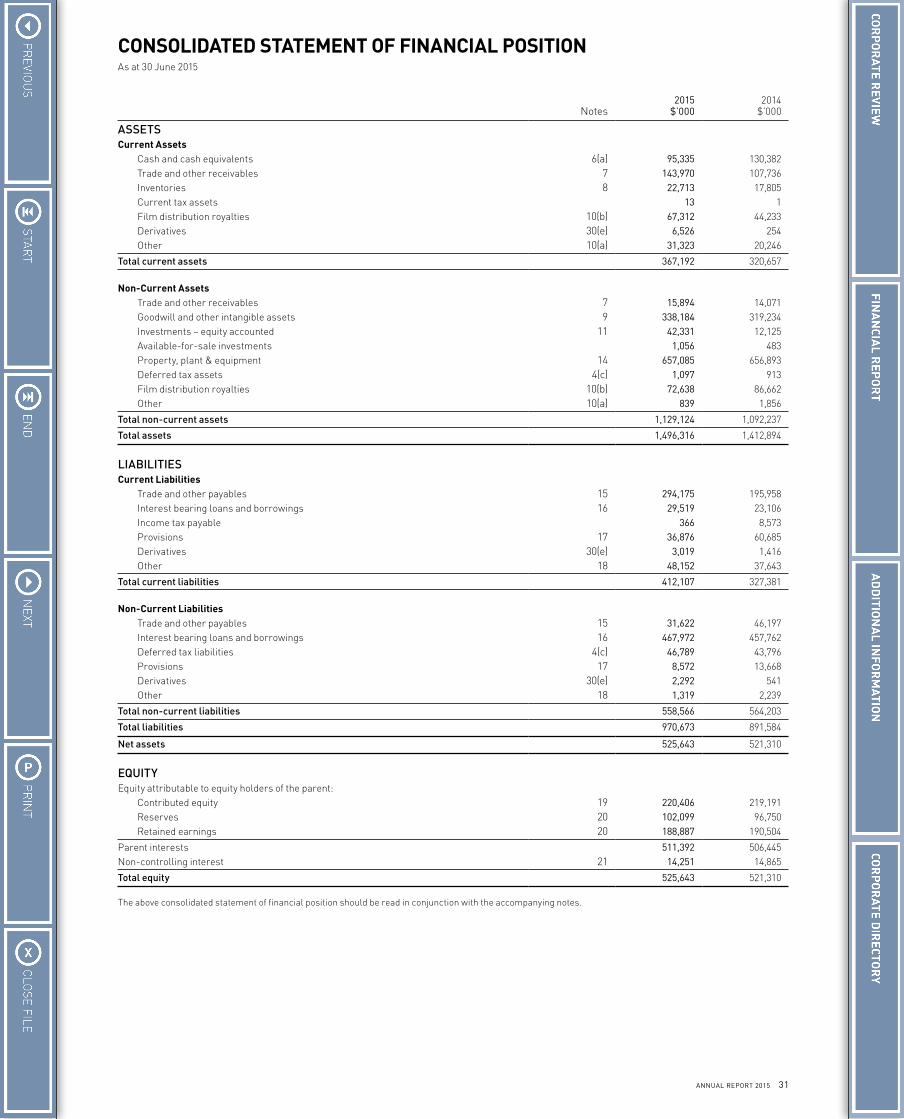
31ANNUAL REPORT 2015
CONSOLIDATED STATEMENT OF FINANCIAL POSITIONAs at 30 June 2015
Notes2015
$’0002014
$’000
ASSETSCurrent Assets Cash and cash equivalents 6(a) 95,335 130,382 Trade and other receivables 7 143,970 107,736 Inventories 8 22,713 17,805 Current tax assets 13 1 Film distribution royalties 10(b) 67,312 44,233 Derivatives 30(e) 6,526 254 Other 10(a) 31,323 20,246
Total current assets 367,192 320,657
Non-Current Assets Trade and other receivables 7 15,894 14,071 Goodwill and other intangible assets 9 338,184 319,234 Investments – equity accounted 11 42,331 12,125 Available-for-sale investments 1,056 483 Property, plant & equipment 14 657,085 656,893 Deferred tax assets 4(c) 1,097 913 Film distribution royalties 10(b) 72,638 86,662 Other 10(a) 839 1,856
Total non-current assets 1,129,124 1,092,237
Total assets 1,496,316 1,412,894
LIABILITIESCurrent Liabilities Trade and other payables 15 294,175 195,958 Interest bearing loans and borrowings 16 29,519 23,106 Income tax payable 366 8,573 Provisions 17 36,876 60,685 Derivatives 30(e) 3,019 1,416 Other 18 48,152 37,643
Total current liabilities 412,107 327,381
Non-Current Liabilities Trade and other payables 15 31,622 46,197 Interest bearing loans and borrowings 16 467,972 457,762 Deferred tax liabilities 4(c) 46,789 43,796 Provisions 17 8,572 13,668 Derivatives 30(e) 2,292 541 Other 18 1,319 2,239
Total non-current liabilities 558,566 564,203
Total liabilities 970,673 891,584
Net assets 525,643 521,310
EQUITYEquity attributable to equity holders of the parent: Contributed equity 19 220,406 219,191 Reserves 20 102,099 96,750 Retained earnings 20 188,887 190,504
Parent interests 511,392 506,445Non-controlling interest 21 14,251 14,865
Total equity 525,643 521,310
The above consolidated statement of financial position should be read in conjunction with the accompanying notes.
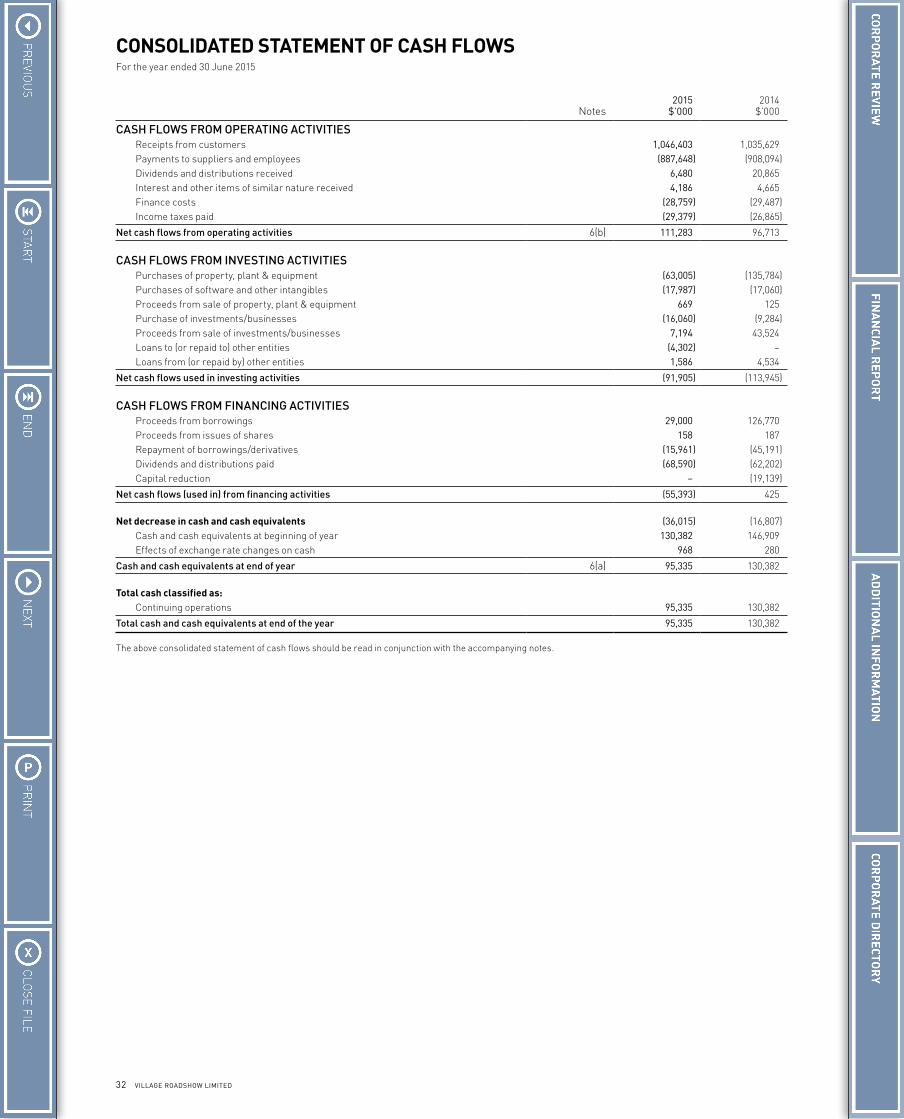
32 VILLAGE ROADSHOW LIMITED
CONSOLIDATED STATEMENT OF CASH FLOWSFor the year ended 30 June 2015
Notes2015
$’0002014
$’000
CASH FLOWS FROM OPERATING ACTIVITIES Receipts from customers 1,046,403 1,035,629 Payments to suppliers and employees (887,648) (908,094) Dividends and distributions received 6,480 20,865 Interest and other items of similar nature received 4,186 4,665 Finance costs (28,759) (29,487) Income taxes paid (29,379) (26,865)
Net cash flows from operating activities 6(b) 111,283 96,713
CASH FLOWS FROM INVESTING ACTIVITIES Purchases of property, plant & equipment (63,005) (135,784) Purchases of software and other intangibles (17,987) (17,060) Proceeds from sale of property, plant & equipment 669 125 Purchase of investments/businesses (16,060) (9,284) Proceeds from sale of investments/businesses 7,194 43,524 Loans to (or repaid to) other entities (4,302) – Loans from (or repaid by) other entities 1,586 4,534
Net cash flows used in investing activities (91,905) (113,945)
CASH FLOWS FROM FINANCING ACTIVITIES Proceeds from borrowings 29,000 126,770 Proceeds from issues of shares 158 187 Repayment of borrowings/derivatives (15,961) (45,191) Dividends and distributions paid (68,590) (62,202) Capital reduction – (19,139)
Net cash flows (used in) from financing activities (55,393) 425
Net decrease in cash and cash equivalents (36,015) (16,807) Cash and cash equivalents at beginning of year 130,382 146,909 Effects of exchange rate changes on cash 968 280
Cash and cash equivalents at end of year 6(a) 95,335 130,382
Total cash classified as: Continuing operations 95,335 130,382
Total cash and cash equivalents at end of the year 95,335 130,382
The above consolidated statement of cash flows should be read in conjunction with the accompanying notes.
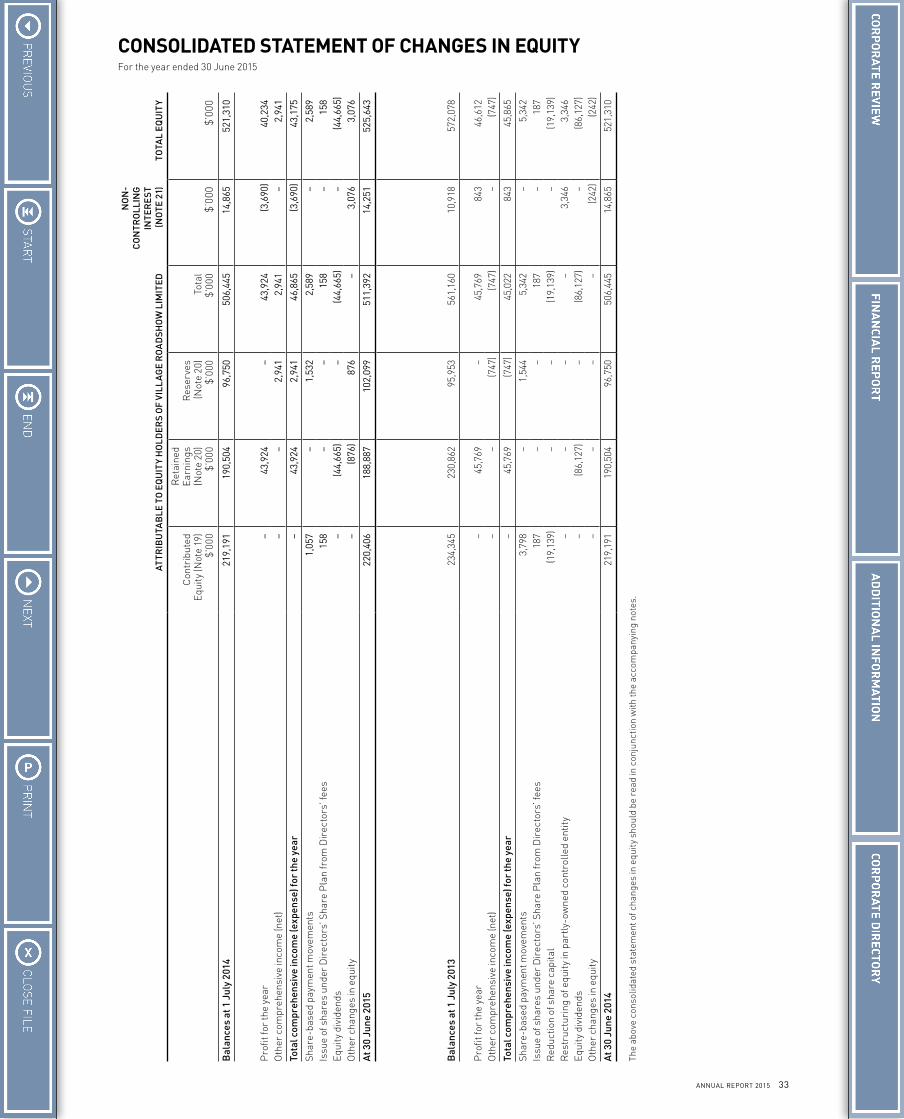
33ANNUAL REPORT 2015
CONSOLIDATED STATEMENT OF CHANGES IN EQUITYFor the year ended 30 June 2015
ATTR
IBU
TAB
LE T
O E
QU
ITY
HO
LDER
S O
F VI
LLA
GE
RO
AD
SHO
W L
IMIT
ED
NO
N-
CO
NTR
OLL
ING
IN
TER
ES
T (N
OTE
21)
TOTA
L EQ
UIT
Y
Con
trib
uted
Eq
uity
(Not
e 19
) $’
000
Ret
aine
d E
arni
ngs
(Not
e 20
) $’
000
Res
erve
s (N
ote
20)
$’00
0To
tal
$’00
0$’
000
$’00
0
Bal
ance
s at
1 J
uly
2014
219,
191
190,
504
96,7
5050
6,44
514
,865
521,
310
Pro
fit fo
r th
e ye
ar–
43,9
24–
43,9
24(3
,690
)40
,234
Oth
er c
ompr
ehen
sive
inco
me
(net
)–
–2,
941
2,94
1–
2,94
1
Tota
l com
preh
ensi
ve in
com
e (e
xpen
se) f
or th
e ye
ar–
43,9
242,
941
46,8
65(3
,690
)43
,175
Shar
e-ba
sed
paym
ent m
ovem
ents
1,05
7–
1,53
22,
589
–2,
589
Issu
e of
sha
res
unde
r D
irec
tors
’ Sha
re P
lan
from
Dir
ecto
rs’ f
ees
158
––
158
–15
8Eq
uity
div
iden
ds–
(44,
665)
–(4
4,66
5)–
(44,
665)
Oth
er c
hang
es in
equ
ity
–(8
76)
876
–3,
076
3,07
6
At 3
0 Ju
ne 2
015
220,
406
188,
887
102,
099
511,
392
14,2
5152
5,64
3
Bal
ance
s at
1 J
uly
2013
234,
345
230,
862
95,9
5356
1,16
010
,918
572,
078
Pro
fit fo
r th
e ye
ar–
45,7
69–
45,7
6984
346
,612
Oth
er c
ompr
ehen
sive
inco
me
(net
)–
–(7
47)
(747
)–
(747
)
Tota
l com
preh
ensi
ve in
com
e (e
xpen
se) f
or th
e ye
ar–
45,7
69(7
47)
45,0
2284
345
,865
Shar
e-ba
sed
paym
ent m
ovem
ents
3,79
8–
1,54
45,
342
–5,
342
Issu
e of
sha
res
unde
r D
irec
tors
’ Sha
re P
lan
from
Dir
ecto
rs’ f
ees
187
––
187
–18
7R
educ
tion
of s
hare
cap
ital
(19,
139)
––
(19,
139)
–(1
9,13
9)R
estr
uctu
ring
of e
quit
y in
par
tly-o
wne
d co
ntro
lled
entit
y–
––
–3,
346
3,34
6Eq
uity
div
iden
ds–
(86,
127)
–(8
6,12
7)–
(86,
127)
Oth
er c
hang
es in
equ
ity
––
––
(242
)(2
42)
At 3
0 Ju
ne 2
014
219,
191
190,
504
96,7
5050
6,44
514
,865
521,
310
The
abov
e co
nsol
idat
ed s
tate
men
t of c
hang
es in
equ
ity
shou
ld b
e re
ad in
con
junc
tion
with
the
acco
mpa
nyin
g no
tes.
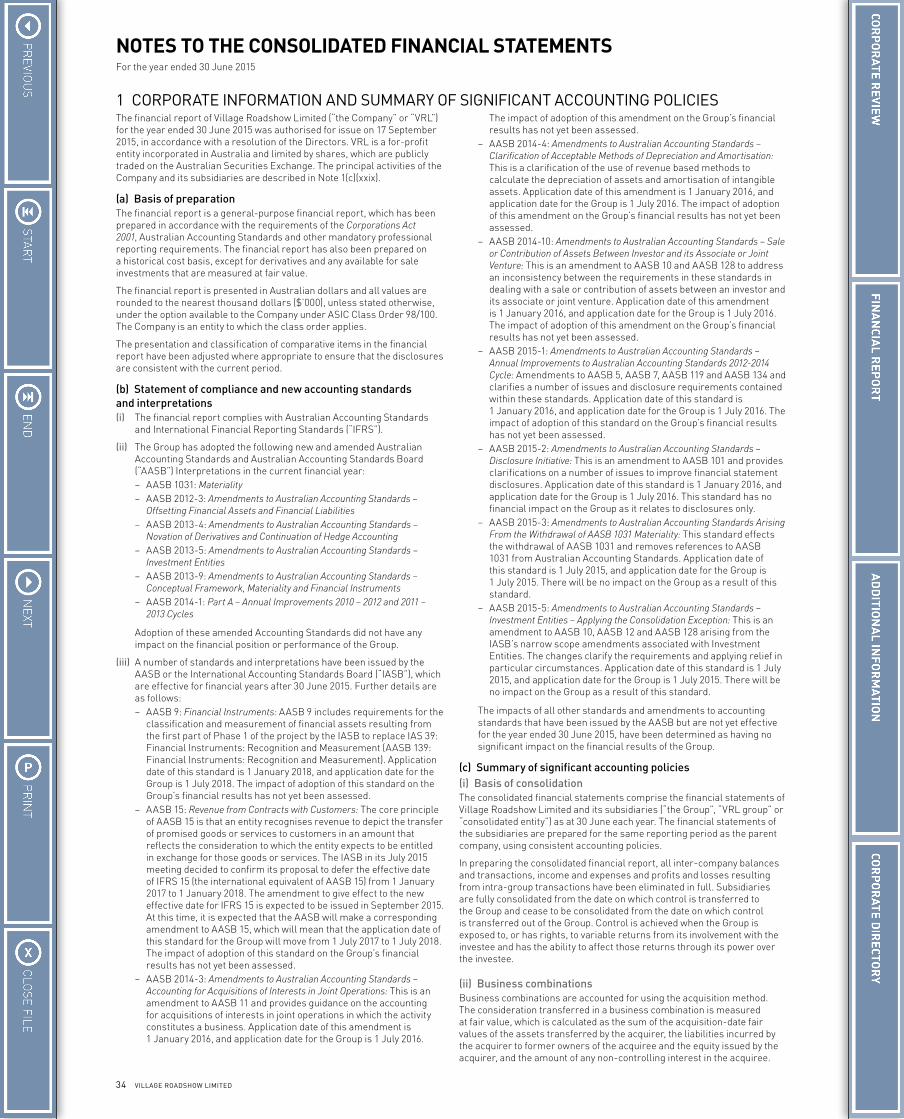
34 VILLAGE ROADSHOW LIMITED
NOTES TO THE CONSOLIDATED FINANCIAL STATEMENTSFor the year ended 30 June 2015
1 CORPORATE INFORMATION AND SUMMARY OF SIGNIFICANT ACCOUNTING POLICIESThe financial report of Village Roadshow Limited (“the Company” or “VRL”) for the year ended 30 June 2015 was authorised for issue on 17 September 2015, in accordance with a resolution of the Directors. VRL is a for-profit entity incorporated in Australia and limited by shares, which are publicly traded on the Australian Securities Exchange. The principal activities of the Company and its subsidiaries are described in Note 1(c)(xxix).
(a) Basis of preparationThe financial report is a general-purpose financial report, which has been prepared in accordance with the requirements of the Corporations Act 2001, Australian Accounting Standards and other mandatory professional reporting requirements. The financial report has also been prepared on a historical cost basis, except for derivatives and any available for sale investments that are measured at fair value.
The financial report is presented in Australian dollars and all values are rounded to the nearest thousand dollars ($’000), unless stated otherwise, under the option available to the Company under ASIC Class Order 98/100. The Company is an entity to which the class order applies.
The presentation and classification of comparative items in the financial report have been adjusted where appropriate to ensure that the disclosures are consistent with the current period.
(b) Statement of compliance and new accounting standards and interpretations(i) The financial report complies with Australian Accounting Standards
and International Financial Reporting Standards (“IFRS”).
(ii) The Group has adopted the following new and amended Australian Accounting Standards and Australian Accounting Standards Board (“AASB”) Interpretations in the current financial year:– AASB 1031: Materiality– AASB 2012-3: Amendments to Australian Accounting Standards –
Offsetting Financial Assets and Financial Liabilities– AASB 2013-4: Amendments to Australian Accounting Standards –
Novation of Derivatives and Continuation of Hedge Accounting– AASB 2013-5: Amendments to Australian Accounting Standards –
Investment Entities– AASB 2013-9: Amendments to Australian Accounting Standards –
Conceptual Framework, Materiality and Financial Instruments– AASB 2014-1: Part A – Annual Improvements 2010 – 2012 and 2011 –
2013 Cycles
Adoption of these amended Accounting Standards did not have any impact on the financial position or performance of the Group.
(iii) A number of standards and interpretations have been issued by the AASB or the International Accounting Standards Board (“IASB”), which are effective for financial years after 30 June 2015. Further details are as follows:– AASB 9: Financial Instruments: AASB 9 includes requirements for the
classification and measurement of financial assets resulting from the first part of Phase 1 of the project by the IASB to replace IAS 39: Financial Instruments: Recognition and Measurement (AASB 139: Financial Instruments: Recognition and Measurement). Application date of this standard is 1 January 2018, and application date for the Group is 1 July 2018. The impact of adoption of this standard on the Group’s financial results has not yet been assessed.
– AASB 15: Revenue from Contracts with Customers: The core principle of AASB 15 is that an entity recognises revenue to depict the transfer of promised goods or services to customers in an amount that reflects the consideration to which the entity expects to be entitled in exchange for those goods or services. The IASB in its July 2015 meeting decided to confirm its proposal to defer the effective date of IFRS 15 (the international equivalent of AASB 15) from 1 January 2017 to 1 January 2018. The amendment to give effect to the new effective date for IFRS 15 is expected to be issued in September 2015. At this time, it is expected that the AASB will make a corresponding amendment to AASB 15, which will mean that the application date of this standard for the Group will move from 1 July 2017 to 1 July 2018. The impact of adoption of this standard on the Group’s financial results has not yet been assessed.
– AASB 2014-3: Amendments to Australian Accounting Standards – Accounting for Acquisitions of Interests in Joint Operations: This is an amendment to AASB 11 and provides guidance on the accounting for acquisitions of interests in joint operations in which the activity constitutes a business. Application date of this amendment is 1 January 2016, and application date for the Group is 1 July 2016.
The impact of adoption of this amendment on the Group’s financial results has not yet been assessed.
– AASB 2014-4: Amendments to Australian Accounting Standards – Clarification of Acceptable Methods of Depreciation and Amortisation: This is a clarification of the use of revenue based methods to calculate the depreciation of assets and amortisation of intangible assets. Application date of this amendment is 1 January 2016, and application date for the Group is 1 July 2016. The impact of adoption of this amendment on the Group’s financial results has not yet been assessed.
– AASB 2014-10: Amendments to Australian Accounting Standards – Sale or Contribution of Assets Between Investor and its Associate or Joint Venture: This is an amendment to AASB 10 and AASB 128 to address an inconsistency between the requirements in these standards in dealing with a sale or contribution of assets between an investor and its associate or joint venture. Application date of this amendment is 1 January 2016, and application date for the Group is 1 July 2016. The impact of adoption of this amendment on the Group’s financial results has not yet been assessed.
– AASB 2015-1: Amendments to Australian Accounting Standards – Annual Improvements to Australian Accounting Standards 2012-2014 Cycle: Amendments to AASB 5, AASB 7, AASB 119 and AASB 134 and clarifies a number of issues and disclosure requirements contained within these standards. Application date of this standard is 1 January 2016, and application date for the Group is 1 July 2016. The impact of adoption of this standard on the Group’s financial results has not yet been assessed.
– AASB 2015-2: Amendments to Australian Accounting Standards – Disclosure Initiative: This is an amendment to AASB 101 and provides clarifications on a number of issues to improve financial statement disclosures. Application date of this standard is 1 January 2016, and application date for the Group is 1 July 2016. This standard has no financial impact on the Group as it relates to disclosures only.
– AASB 2015-3: Amendments to Australian Accounting Standards Arising From the Withdrawal of AASB 1031 Materiality: This standard effects the withdrawal of AASB 1031 and removes references to AASB 1031 from Australian Accounting Standards. Application date of this standard is 1 July 2015, and application date for the Group is 1 July 2015. There will be no impact on the Group as a result of this standard.
– AASB 2015-5: Amendments to Australian Accounting Standards – Investment Entities – Applying the Consolidation Exception: This is an amendment to AASB 10, AASB 12 and AASB 128 arising from the IASB’s narrow scope amendments associated with Investment Entities. The changes clarify the requirements and applying relief in particular circumstances. Application date of this standard is 1 July 2015, and application date for the Group is 1 July 2015. There will be no impact on the Group as a result of this standard.
The impacts of all other standards and amendments to accounting standards that have been issued by the AASB but are not yet effective for the year ended 30 June 2015, have been determined as having no significant impact on the financial results of the Group.
(c) Summary of significant accounting policies(i) Basis of consolidationThe consolidated financial statements comprise the financial statements of Village Roadshow Limited and its subsidiaries (“the Group”, “VRL group” or “consolidated entity”) as at 30 June each year. The financial statements of the subsidiaries are prepared for the same reporting period as the parent company, using consistent accounting policies.
In preparing the consolidated financial report, all inter-company balances and transactions, income and expenses and profits and losses resulting from intra-group transactions have been eliminated in full. Subsidiaries are fully consolidated from the date on which control is transferred to the Group and cease to be consolidated from the date on which control is transferred out of the Group. Control is achieved when the Group is exposed to, or has rights, to variable returns from its involvement with the investee and has the ability to affect those returns through its power over the investee.
(ii) Business combinationsBusiness combinations are accounted for using the acquisition method. The consideration transferred in a business combination is measured at fair value, which is calculated as the sum of the acquisition-date fair values of the assets transferred by the acquirer, the liabilities incurred by the acquirer to former owners of the acquiree and the equity issued by the acquirer, and the amount of any non-controlling interest in the acquiree.
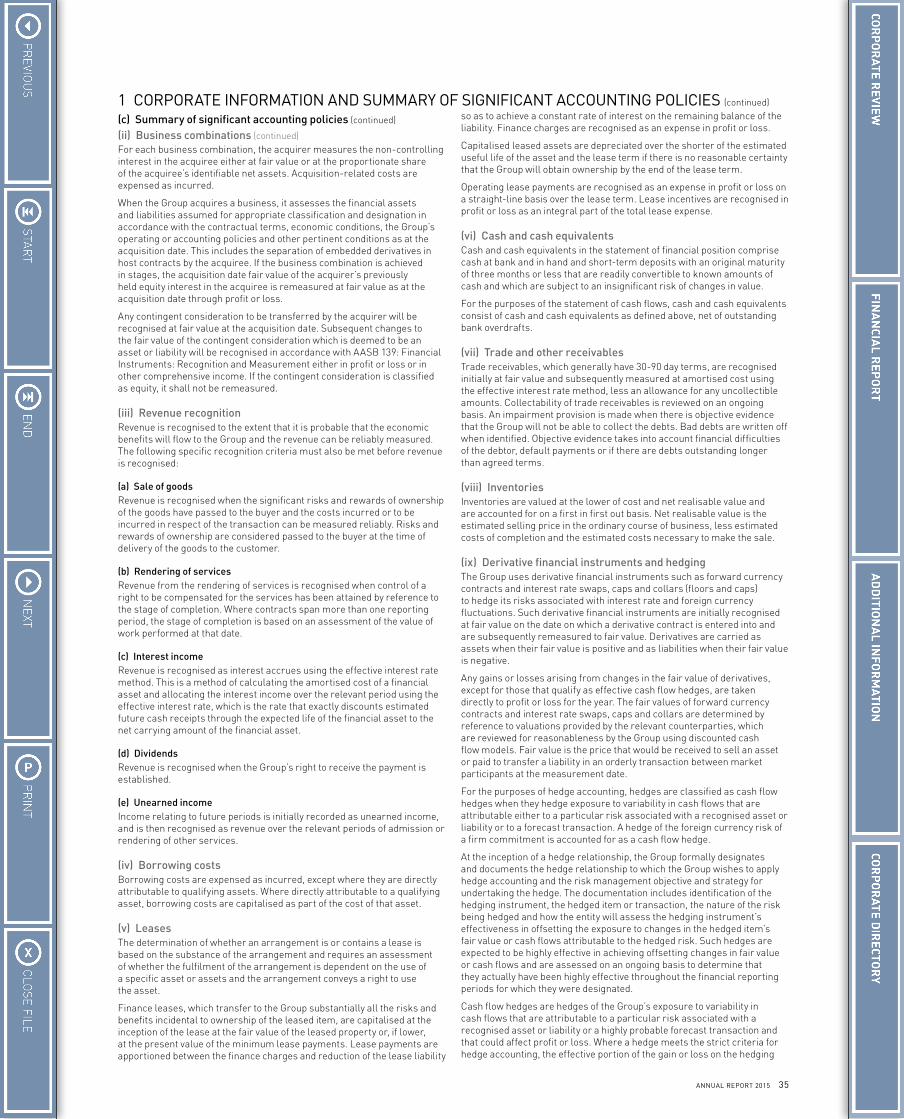
35ANNUAL REPORT 2015
For each business combination, the acquirer measures the non-controlling interest in the acquiree either at fair value or at the proportionate share of the acquiree’s identifiable net assets. Acquisition-related costs are expensed as incurred.
When the Group acquires a business, it assesses the financial assets and liabilities assumed for appropriate classification and designation in accordance with the contractual terms, economic conditions, the Group’s operating or accounting policies and other pertinent conditions as at the acquisition date. This includes the separation of embedded derivatives in host contracts by the acquiree. If the business combination is achieved in stages, the acquisition date fair value of the acquirer’s previously held equity interest in the acquiree is remeasured at fair value as at the acquisition date through profit or loss.
Any contingent consideration to be transferred by the acquirer will be recognised at fair value at the acquisition date. Subsequent changes to the fair value of the contingent consideration which is deemed to be an asset or liability will be recognised in accordance with AASB 139: Financial Instruments: Recognition and Measurement either in profit or loss or in other comprehensive income. If the contingent consideration is classified as equity, it shall not be remeasured.
(iii) Revenue recognitionRevenue is recognised to the extent that it is probable that the economic benefits will flow to the Group and the revenue can be reliably measured. The following specific recognition criteria must also be met before revenue is recognised:
(a) Sale of goodsRevenue is recognised when the significant risks and rewards of ownership of the goods have passed to the buyer and the costs incurred or to be incurred in respect of the transaction can be measured reliably. Risks and rewards of ownership are considered passed to the buyer at the time of delivery of the goods to the customer.
(b) Rendering of servicesRevenue from the rendering of services is recognised when control of a right to be compensated for the services has been attained by reference to the stage of completion. Where contracts span more than one reporting period, the stage of completion is based on an assessment of the value of work performed at that date.
(c) Interest incomeRevenue is recognised as interest accrues using the effective interest rate method. This is a method of calculating the amortised cost of a financial asset and allocating the interest income over the relevant period using the effective interest rate, which is the rate that exactly discounts estimated future cash receipts through the expected life of the financial asset to the net carrying amount of the financial asset.
(d) DividendsRevenue is recognised when the Group’s right to receive the payment is established.
(e) Unearned incomeIncome relating to future periods is initially recorded as unearned income, and is then recognised as revenue over the relevant periods of admission or rendering of other services.
(iv) Borrowing costsBorrowing costs are expensed as incurred, except where they are directly attributable to qualifying assets. Where directly attributable to a qualifying asset, borrowing costs are capitalised as part of the cost of that asset.
(v) LeasesThe determination of whether an arrangement is or contains a lease is based on the substance of the arrangement and requires an assessment of whether the fulfilment of the arrangement is dependent on the use of a specific asset or assets and the arrangement conveys a right to use the asset.
Finance leases, which transfer to the Group substantially all the risks and benefits incidental to ownership of the leased item, are capitalised at the inception of the lease at the fair value of the leased property or, if lower, at the present value of the minimum lease payments. Lease payments are apportioned between the finance charges and reduction of the lease liability
so as to achieve a constant rate of interest on the remaining balance of the liability. Finance charges are recognised as an expense in profit or loss.
Capitalised leased assets are depreciated over the shorter of the estimated useful life of the asset and the lease term if there is no reasonable certainty that the Group will obtain ownership by the end of the lease term.
Operating lease payments are recognised as an expense in profit or loss on a straight-line basis over the lease term. Lease incentives are recognised in profit or loss as an integral part of the total lease expense.
(vi) Cash and cash equivalentsCash and cash equivalents in the statement of financial position comprise cash at bank and in hand and short-term deposits with an original maturity of three months or less that are readily convertible to known amounts of cash and which are subject to an insignificant risk of changes in value.
For the purposes of the statement of cash flows, cash and cash equivalents consist of cash and cash equivalents as defined above, net of outstanding bank overdrafts.
(vii) Trade and other receivablesTrade receivables, which generally have 30-90 day terms, are recognised initially at fair value and subsequently measured at amortised cost using the effective interest rate method, less an allowance for any uncollectible amounts. Collectability of trade receivables is reviewed on an ongoing basis. An impairment provision is made when there is objective evidence that the Group will not be able to collect the debts. Bad debts are written off when identified. Objective evidence takes into account financial difficulties of the debtor, default payments or if there are debts outstanding longer than agreed terms.
(viii) InventoriesInventories are valued at the lower of cost and net realisable value and are accounted for on a first in first out basis. Net realisable value is the estimated selling price in the ordinary course of business, less estimated costs of completion and the estimated costs necessary to make the sale.
(ix) Derivative financial instruments and hedgingThe Group uses derivative financial instruments such as forward currency contracts and interest rate swaps, caps and collars (floors and caps) to hedge its risks associated with interest rate and foreign currency fluctuations. Such derivative financial instruments are initially recognised at fair value on the date on which a derivative contract is entered into and are subsequently remeasured to fair value. Derivatives are carried as assets when their fair value is positive and as liabilities when their fair value is negative.
Any gains or losses arising from changes in the fair value of derivatives, except for those that qualify as effective cash flow hedges, are taken directly to profit or loss for the year. The fair values of forward currency contracts and interest rate swaps, caps and collars are determined by reference to valuations provided by the relevant counterparties, which are reviewed for reasonableness by the Group using discounted cash flow models. Fair value is the price that would be received to sell an asset or paid to transfer a liability in an orderly transaction between market participants at the measurement date.
For the purposes of hedge accounting, hedges are classified as cash flow hedges when they hedge exposure to variability in cash flows that are attributable either to a particular risk associated with a recognised asset or liability or to a forecast transaction. A hedge of the foreign currency risk of a firm commitment is accounted for as a cash flow hedge.
At the inception of a hedge relationship, the Group formally designates and documents the hedge relationship to which the Group wishes to apply hedge accounting and the risk management objective and strategy for undertaking the hedge. The documentation includes identification of the hedging instrument, the hedged item or transaction, the nature of the risk being hedged and how the entity will assess the hedging instrument’s effectiveness in offsetting the exposure to changes in the hedged item’s fair value or cash flows attributable to the hedged risk. Such hedges are expected to be highly effective in achieving offsetting changes in fair value or cash flows and are assessed on an ongoing basis to determine that they actually have been highly effective throughout the financial reporting periods for which they were designated.
Cash flow hedges are hedges of the Group’s exposure to variability in cash flows that are attributable to a particular risk associated with a recognised asset or liability or a highly probable forecast transaction and that could affect profit or loss. Where a hedge meets the strict criteria for hedge accounting, the effective portion of the gain or loss on the hedging
1 CORPORATE INFORMATION AND SUMMARY OF SIGNIFICANT ACCOUNTING POLICIES (continued)
(c) Summary of significant accounting policies (continued)
(ii) Business combinations (continued)
36 VILLAGE ROADSHOW LIMITED
NOTES TO THE CONSOLIDATED FINANCIAL STATEMENTS (CONTINUED)
For the year ended 30 June 2015
instrument is recognised directly in other comprehensive income, while the ineffective portion is recognised in profit or loss.
Amounts taken to other comprehensive income are transferred to profit or loss when the hedged transaction affects profit or loss, such as when hedged income or expenses are recognised or when a forecast sale or purchase occurs. When the hedged item is the cost of a non-financial asset or liability, the amounts taken to other comprehensive income are transferred to the initial carrying amount of the non-financial asset or liability.
If the forecast transaction is no longer expected to occur, amounts previously recognised in other comprehensive income are transferred to profit or loss. If the hedging instrument expires or is sold, terminated or exercised without replacement or rollover, or if its designation as a hedge is revoked, amounts previously recognised in other comprehensive income remain in other comprehensive income until the forecast transaction occurs. If the related transaction is not expected to occur, the amount is taken to profit or loss.
(x) Impairment of financial assetsThe Group assesses at each reporting date whether a financial asset or group of financial assets is impaired.
(a) Financial assets carried at amortised costIf there is objective evidence that an impairment loss on loans and receivables carried at amortised cost has been incurred, the amount of the loss is measured as the difference between the asset’s carrying amount and the present value of estimated future cash flows (excluding future credit losses that have not been incurred) discounted at the financial asset’s original effective interest rate (i.e. the effective interest rate computed at initial recognition). The carrying amount of the asset is reduced either directly or through use of an allowance account. The amount of the loss is recognised in profit or loss.
The Group first assesses whether objective evidence of impairment exists individually for financial assets that are individually significant, and individually or collectively for financial assets that are not individually significant. If it is determined that no objective evidence of impairment exists for an individually assessed financial asset, whether significant or not, the asset is included in a group of financial assets with similar credit risk characteristics and that group of financial assets is collectively assessed for impairment. Assets that are individually assessed for impairment and for which an impairment loss is or continues to be recognised are not included in a collective assessment of impairment.
If, in a subsequent period, the amount of the impairment loss decreases and the decrease can be related objectively to an event occurring after the impairment was recognised, the previously recognised impairment loss is reversed. Any subsequent reversal of an impairment loss is recognised in profit or loss, to the extent that the carrying value of the asset does not exceed its amortised cost at the reversal date.
(b) Financial assets carried at costIf there is objective evidence that an impairment loss has been incurred on an unquoted equity instrument that is not carried at fair value (because its fair value cannot be reliably measured), or on a derivative asset that is linked to and must be settled by delivery of such an unquoted equity instrument, the amount of the loss is measured as the difference between the asset’s carrying amount and the present value of estimated future cash flows, discounted at the current market rate of return for a similar financial asset.
(c) Available-for-sale investments at fair valueIf there is objective evidence that an available-for-sale investment at fair value is impaired, an amount comprising the difference between its cost and its current fair value, less any impairment loss previously recognised in profit or loss, is transferred from equity to profit or loss. Reversals of impairment losses for equity instruments classified as available-for-sale are not recognised in profit.
(xi) Foreign currency translationBoth the functional and presentation currency of the Company and the majority of its Australian subsidiaries is Australian dollars ($). Each entity in the Group determines its own functional currency and items included in the financial statements of each entity are measured using that functional currency.
Transactions in foreign currencies are initially recorded in the functional currency by applying the exchange rates ruling at the date of the transaction. Monetary assets and liabilities denominated in foreign currencies are retranslated at the rate of exchange ruling at the reporting date.
All exchange differences in the consolidated financial report are taken to profit or loss with the exception of differences on foreign currency borrowings that provide a hedge against a net investment in a foreign entity. These are taken directly to other comprehensive income until the disposal of the net investment, at which time they are recognised in profit or loss. Tax charges and credits attributable to exchange differences on those borrowings are also recognised in other comprehensive income.
Non-monetary items that are measured in terms of historical cost in a foreign currency are translated using the exchange rate as at the date of the initial transaction. Non-monetary items measured at fair value in a foreign currency are translated using the exchange rates at the date when the fair value was determined.
As at the reporting date the assets and liabilities of subsidiaries with functional currencies other than Australian dollars are translated into the presentation currency of the Company at the rate of exchange ruling at the reporting date and their profit or loss items are translated at the weighted average exchange rate for the year. The exchange differences arising on the translation are taken directly to other comprehensive income. On disposal of a foreign entity, the deferred cumulative amount recognised in other comprehensive income relating to that particular foreign operation is recognised in profit or loss.
(xii) Discontinued operations and assets held for saleA discontinued operation is a component of an entity that has been disposed of or is classified as held for sale and that represents a separate major line of business or geographical area of operations, is part of a single coordinated plan to dispose of such a line of business or area of operations, or is a subsidiary acquired exclusively with a view to resale. The results of discontinued operations are presented separately on the face of the statement of comprehensive income.
Non-current assets and disposal groups are classified as held for sale and measured at the lower of their carrying amount and fair value less cost to sell if the carrying amount will be recovered principally through a sale transaction. These assets are not depreciated or amortised following classification as held for sale. For an asset or disposal group to be classified as held for sale, it must be available for sale in its present condition and its sale must be highly probable.
(xiii) Investments in associates and joint venturesThe Group’s investments in associates and joint ventures are accounted for using the equity method of accounting in the consolidated financial statements. An associate is an entity in which the Group has significant influence and which is neither a subsidiary nor a joint arrangement. A joint venture is a contractual arrangement whereby two or more parties undertake an economic activity that is subject to joint control. Joint control is the contractually agreed sharing of control of an arrangement, which exists only when decisions about the relevant activities require unanimous consent of the parties sharing control.
Under the equity method, an investment in an associate or joint venture is carried in the consolidated statement of financial position at cost plus post-acquisition changes in the Group’s share of net assets of the associate or joint venture. Goodwill relating to an associate or joint venture is included in the carrying amount of the investment and is not amortised. After application of the equity method, the Group determines whether it is necessary to recognise any additional impairment loss with respect to the Group’s net investment in the associate or joint venture. The consolidated statement of comprehensive income reflects the Group’s share of the results of operations of the associate or joint venture.
Where there has been a change recognised directly in the equity of the associate or joint venture, the Group recognises its share of any changes and discloses this in the consolidated statement of changes in equity. Adjustments are made to bring into line any dissimilar reporting dates or accounting policies that may exist.
When the Group’s share of losses in an associate or joint venture equals or exceeds its interest in the associate or joint venture, including any unsecured long-term receivables and loans, the Group does not recognise further losses, unless it has incurred obligations or made payments on behalf of the associate or joint venture.
1 CORPORATE INFORMATION AND SUMMARY OF SIGNIFICANT ACCOUNTING POLICIES (continued)
(c) Summary of significant accounting policies (continued)
(ix) Derivative financial instruments and hedging (continued)
37ANNUAL REPORT 2015
(xiv) Interests in joint operationsA joint operation involves the use of assets and other resources of the venturers rather than establishment of a separate entity. The Group recognises its interest in joint operations by recognising its share of the assets that the operations control and the liabilities incurred. The Group also recognises its share of the expenses incurred and the income that the operations earn from the sale of goods or services.
(xv) Income taxCurrent tax assets and liabilities for the current and prior periods are measured at the amount expected to be recovered from or paid to the taxation authorities. The tax rates and tax laws used to compute the amount are those that are enacted or substantively enacted by the reporting date.
Deferred income tax is provided on all temporary differences at the reporting date between the tax bases of assets and liabilities and their carrying amounts for financial reporting purposes. Deferred income tax liabilities are recognised for all taxable temporary differences except:– when the deferred income tax liability arises from the initial recognition
of goodwill or of an asset or liability in a transaction that is not a business combination and that, at the time of the transaction, affects neither the accounting profit or loss nor taxable profit or loss; or
– when the taxable temporary difference is associated with investments in subsidiaries, associates or interests in joint ventures, and the timing of the reversal of the temporary difference can be controlled and it is probable that the temporary difference will not reverse in the foreseeable future.
Deferred income tax assets are recognised for all deductible temporary differences, carry-forward of unused tax credits and unused tax losses, to the extent that it is probable that taxable profit will be available against which the deductible temporary differences and the carry-forward of unused tax credits and unused tax losses can be utilised, except:– when the deferred income tax asset relating to the deductible temporary
difference arises from the initial recognition of an asset or liability in a transaction that is not a business combination and, at the time of the transaction, affects neither the accounting profit or loss nor taxable profit or loss; or
– when the deductible temporary difference is associated with investments in subsidiaries, associates or interests in joint ventures, in which case a deferred tax asset is only recognised to the extent that it is probable that the temporary difference will reverse in the foreseeable future and taxable profit will be available against which the temporary difference can be utilised.
The carrying amount of deferred income tax assets is reviewed at each reporting date and reduced to the extent that it is no longer probable that sufficient taxable profit will be available to allow all or part of the deferred income tax asset to be utilised. Unrecognised deferred income tax assets are reassessed at each reporting date and are recognised to the extent that it has become probable that future taxable profit will allow the deferred tax asset to be recovered. Deferred income tax assets and liabilities are measured at the tax rates that are expected to apply to the year when the asset is realised or the liability is settled, based on tax rates (and tax laws) that have been enacted or substantively enacted at the reporting date. Income taxes relating to items recognised directly in other comprehensive income are recognised in other comprehensive income, and not in profit or loss. Deferred tax assets and deferred tax liabilities are offset only if a legally enforceable right exists to set off current tax assets against current tax liabilities and the deferred tax assets and liabilities relate to the same taxable entity and the same taxation authority.
Tax ConsolidationFor Australian income tax purposes, various entities in the Group have formed a Tax Consolidated group, and have executed a combined Tax Sharing and Tax Funding Agreement (“TSA”) in order to allocate income tax expense to the relevant wholly-owned entities predominantly on a stand-alone basis. In addition, the TSA provides for the allocation of income tax liabilities between the entities should the head entity default on its income tax payment obligations to the Australian Taxation Office.
Tax effect accounting by members of the tax consolidated groupUnder the terms of the TSA, wholly owned entities compensate the head entity for any current tax payable assumed and are compensated for any current tax receivable, and are also compensated for deferred tax assets relating to unused tax losses or unused tax credits that are recognised on transfer to the parent entity under tax consolidation legislation. The funding amounts are determined at the end of each six month reporting period by reference to the amounts recognised in the wholly-owned entities’ financial statements, determined predominantly on a stand alone basis. Amounts receivable or payable under the TSA are included with other amounts receivable or payable between entities in the Group.
(xvi) Other taxesRevenues, expenses and assets are recognised net of the amount of GST except:– when the GST incurred on a purchase of goods and services is not
recoverable from the taxation authority, in which case the GST is recognised as part of the cost of acquisition of the asset or as part of the expense item as applicable; and
– receivables and payables, which are stated with the amount of GST included.
The net amount of GST recoverable from, or payable to, the taxation authority is included as part of receivables or payables in the statement of financial position.
Cash flows are included in the statement of cash flows on a gross basis and the GST components of cash flows arising from investing and financing activities, which are recoverable from, or payable to, the taxation authority are classified as operating cash flows.
Commitments and contingencies are disclosed net of the amount of GST recoverable from, or payable to, the taxation authority.
(xvii) Property, plant & equipmentProperty, plant & equipment is stated at cost less accumulated depreciation and any accumulated impairment in value. Such cost includes the cost of replacing parts that are eligible for capitalisation when the cost of replacing the parts is incurred. Similarly, when each major inspection is performed, its cost is recognised in the carrying amount of the plant and equipment as a replacement only if it is eligible for capitalisation.
Depreciation is calculated on a straight-line basis over the estimated useful life of the assets as follows:– Buildings and improvements are depreciated over the lesser of any
relevant lease term and 40 years, using the straight line method.– Plant, equipment and vehicles are depreciated over periods of between
three and 25 years using the straight line or reducing balance method.
Pooled animals are classified as part of property, plant and equipment and are not depreciated.
The assets’ residual values, useful lives and amortisation methods are reviewed, and adjusted if appropriate, at each financial year end, and when acquired as part of a business combination.
ImpairmentThe carrying values of property, plant and equipment are reviewed for impairment at each reporting date, with recoverable amount being estimated when events or changes in circumstances indicate that the carrying value may be impaired.
The recoverable amount of property, plant and equipment is the higher of fair value less costs of disposal and value in use. In assessing value in use, the estimated future cash flows are discounted to their present value using a pre-tax discount rate that reflects current market assessments of the time value of money and the risks specific to the asset.
For an asset that does not generate largely independent cash inflows, recoverable amount is determined for the cash-generating unit to which the asset belongs, unless the asset’s value in use can be estimated to be close to its fair value.
An impairment exists when the carrying value of an asset or cash-generating unit exceeds its estimated recoverable amount. The asset or cash-generating unit is then written down to its recoverable amount.
1 CORPORATE INFORMATION AND SUMMARY OF SIGNIFICANT ACCOUNTING POLICIES (continued)
(c) Summary of significant accounting policies (continued)
38 VILLAGE ROADSHOW LIMITED
NOTES TO THE CONSOLIDATED FINANCIAL STATEMENTS (CONTINUED)
For the year ended 30 June 2015
De-recognition and disposalAn item of property, plant and equipment is de-recognised upon disposal or when no further future economic benefits are expected from its use or disposal.
Any gain or loss arising on de-recognition of the asset (calculated as the difference between the net disposal proceeds and the carrying amount of the asset) is included in profit or loss in the year the asset is de-recognised.
(xviii) Investments and other financial assetsFinancial assets in the scope of AASB 139: Financial Instruments: Recognition and Measurement are classified as either financial assets at fair value through profit or loss, loans and receivables, held-to-maturity investments, or available-for-sale investments, as appropriate. When financial assets are recognised initially, they are measured at fair value, plus, in the case of investments not at fair value through profit or loss, directly attributable transactions costs. The Group determines the classification of its financial assets after initial recognition and, when allowed and appropriate, re-evaluates this designation at each financial year-end.
All regular way purchases and sales of financial assets are recognised on the trade date i.e. the date that the Group commits to purchase the asset. Regular way purchases or sales are purchases or sales of financial assets under contracts that require delivery of the assets within the period established generally by regulation or convention in the marketplace.
(a) Financial assets at fair value through profit or lossIn accordance with AASB 7: Financial Instruments: Disclosures, financial assets classified as held for trading are included in the category ‘financial assets at fair value through profit or loss’. Financial assets are classified as held for trading if they are acquired for the purpose of selling in the near term. Derivatives are also classified as held for trading unless they are designated as effective hedging instruments. Gains or losses on financial assets held for trading are recognised in profit or loss. It should be noted that even though these assets are classified as held for trading (in accordance with AASB 139 terminology), the Group is not involved in speculative activities and only uses derivatives for risk management purposes.
(b) Held-to-maturity investmentsNon-derivative financial assets with fixed or determinable payments and fixed maturity are classified as held-to-maturity when the Group has the positive intention and ability to hold to maturity. Investments intended to be held for an undefined period are not included in this classification. Investments that are intended to be held-to-maturity, such as bonds, are subsequently measured at amortised cost. This cost is computed as the amount initially recognised minus principal repayments, plus or minus the cumulative amortisation using the effective interest method of any difference between the initially recognised amount and the maturity amount. This calculation includes all fees and points paid or received between parties to the contract that are an integral part of the effective interest rate, transaction costs and all other premiums and discounts. For investments carried at amortised cost, gains and losses are recognised in profit or loss when the investments are de-recognised or impaired, as well as through the amortisation process. The Group does not currently have held-to-maturity investments.
(c) Loans and receivablesLoans and receivables are non-derivative financial assets with fixed or determinable payments that are not quoted in an active market. Such assets are carried at amortised cost using the effective interest rate method. Gains and losses are recognised in profit or loss when the loans and receivables are de-recognised or impaired.
(d) Available-for-sale investmentsAvailable-for-sale investments are those derivative financial assets that are designated as available-for-sale or not classified as any of the three preceding categories. After initial recognition, available-for-sale investments are either carried at cost less any accumulated impairment losses, or are measured at fair value with gains or losses being recognised in other comprehensive income until the investments are de-recognised or until the investments are determined to be impaired, at which time the cumulative gain or loss previously reported in other comprehensive income is recognised in profit or loss.
The fair values of investments that are actively traded in organised financial markets are determined by reference to quoted market bid prices at the close of business on the reporting date.
(xix) GoodwillGoodwill acquired in a business combination is initially measured at cost, being the excess of the fair value of the consideration transferred over the Group’s interest in the net fair value of the acquiree’s identifiable assets, liabilities and contingent liabilities.
Following initial recognition, goodwill is measured at cost less any accumulated impairment losses. Goodwill is reviewed for impairment annually or more frequently if events or changes in circumstances indicate that the carrying value may be impaired.
For the purpose of impairment testing, goodwill acquired in a business combination is, from the acquisition date, allocated to each of the Group’s cash-generating units, or groups of cash-generating units, that are expected to benefit from the synergies of the combination, irrespective of whether other assets or liabilities of the Group are assigned to those units or groups of units. Each unit or group of units to which the goodwill is so allocated:– represents the lowest level within the Group at which the goodwill is
monitored for internal management purposes; and– is not larger than an operating segment determined in accordance with
AASB 8: Operating Segments.
Impairment is determined by assessing the recoverable amount of the cash-generating unit (group of cash-generating units), to which the goodwill relates. When the recoverable amount of the cash-generating unit (group of cash-generating units) is less than the carrying amount, an impairment loss is recognised.
When goodwill forms part of a cash-generating unit (group of cash-generating units) and an operation within that unit is disposed of, the goodwill associated with the operation disposed of is included in the carrying amount of the operation when determining the gain or loss on disposal of the operation. Goodwill disposed of in this manner is measured based on the relative values of the operation disposed of and the portion of the cash-generating unit retained.
Impairment losses recognised for goodwill are not subsequently reversed.
(xx) Intangible assetsIntangible assets acquired separately are initially measured at cost. The cost of an intangible asset acquired in a business combination is its fair value as at the date of acquisition. Following initial recognition, intangible assets are carried at cost less any accumulated amortisation and any accumulated impairment losses. Internally generated intangible assets, excluding capitalised development costs, are not capitalised and expenditure is charged against profits in the year in which the expenditure is incurred.
The useful lives of intangible assets are assessed to be either finite or indefinite. Intangible assets with finite lives are amortised over the useful life and assessed for impairment whenever there is an indication that the intangible asset may be impaired. The amortisation period and the amortisation method for an intangible asset with a finite useful life is reviewed at least at each financial year-end. Changes in the expected useful life or the expected pattern of consumption of future economic benefits embodied in the asset are accounted for by changing the amortisation period or method, as appropriate, which is a change in accounting estimate. The amortisation expense on intangible assets with finite lives is recognised in profit or loss in the expense category consistent with the nature of the intangible asset.
Intangible assets with indefinite useful lives are tested for impairment annually either individually or at the cash-generating unit level. Such intangibles are not amortised. The useful life of an intangible asset with an indefinite life is reviewed each reporting period to determine whether indefinite life assessment continues to be supportable. If not, the change in the useful life assessment from indefinite to finite is accounted for as a change in an accounting estimate and is thus accounted for on a prospective basis.
1 CORPORATE INFORMATION AND SUMMARY OF SIGNIFICANT ACCOUNTING POLICIES (continued)
(c) Summary of significant accounting policies (continued)
(xvii) Property, plant & equipment (continued)
39ANNUAL REPORT 2015
A summary of the policies applied to the Group’s intangible assets is as follows:
Brand NamesUseful lives: IndefiniteAmortisation method used: No amortisationInternally generated or acquired: AcquiredImpairment testing: Annually and more frequently when an indication of impairment exists.
Film Distribution RightsUseful lives: FiniteAmortisation method used: Amortised over estimated useful lives which range from 1 to 25 years.Internally generated or acquired: AcquiredImpairment testing: When an indication of impairment exists. The amortisation method and remaining useful life are reviewed at each financial year-end.
Software and Other IntangiblesUseful lives: FiniteAmortisation method used: Amortised over estimated useful lives which range from 2 to 25 years. The estimated useful life remaining is in the range of 2 to 19 years.Internally generated or acquired: AcquiredImpairment testing: When an indication of impairment exists. The amortisation method and remaining useful life are reviewed at each financial year-end.
Assets that are classified as having an indefinite life are the brand names in the Theme Parks division. This conclusion has been based on the length of time that the brands have been in existence, and the fact that they have an established market presence.
(xxi) Impairment of non-financial assetsThe Group assesses at each reporting date whether there is an indication that an asset may be impaired. If any such indication exists, or when annual impairment testing for an asset is required, the Group makes an estimate of the asset’s recoverable amount. An asset’s recoverable amount is the higher of its fair value less costs of disposal and its value in use and is determined for an individual asset, unless the asset does not generate cash inflows that are largely independent of those from other assets or groups of assets and the asset’s value in use cannot be estimated to be close to its fair value. In such cases the asset is tested for impairment as part of the cash-generating unit to which it belongs. When the carrying amount of an asset or cash-generating unit exceeds its recoverable amount, the asset or cash-generating unit is considered impaired and is written down to its recoverable amount.
In assessing fair value less costs of disposal, the estimated future cash flows are discounted to their present value using a pre-tax discount rate that reflects current market assessments of the time value of money and the risks specific to the asset. Impairment losses relating to continuing operations are recognised in those expense categories consistent with the nature of the impaired asset unless the asset is carried at revalued amount (in which case the impairment loss is treated as a revaluation decrease).
An assessment is also made at each reporting date as to whether there is any indication that previously recognised impairment losses may no longer exist or may have decreased. If such indication exists, the recoverable amount is estimated. Other than goodwill, a previously recognised impairment loss is reversed only if there has been a change in the estimates used to determine the asset’s recoverable amount since the last impairment loss was recognised. If that is the case the carrying amount of the asset is increased to its recoverable amount. That increased amount cannot exceed the carrying amount that would have been determined, net of depreciation, had no impairment loss been recognised for the asset in prior years. Such reversal is recognised in profit or loss unless the asset is carried at revalued amount, in which case the reversal is treated as a revaluation increase. After such a reversal the depreciation charge is adjusted in future periods to allocate the asset’s revised carrying amount, less any residual value, on a systematic basis over its remaining useful life.
(xxii) Trade and other payablesTrade payables and other payables are carried at amortised cost and represent liabilities for goods and services provided to the Group prior to the end of the financial year that are unpaid, and arise when the Group becomes obliged to make future payments in respect of the purchase of these goods and services.
(xxiii) Interest bearing loans and borrowingsAll loans and borrowings are initially recognised at the fair value of the consideration received less directly attributable transaction costs. After initial recognition, interest bearing loans and borrowings are subsequently measured at amortised cost using the effective interest rate method. Gains and losses are recognised in profit or loss when the liabilities are de-recognised.
(xxiv) ProvisionsProvisions are recognised when the Group has a present obligation (legal or constructive) as a result of a past event, it is probable that an outflow of resources embodying economic benefits will be required to settle the obligation and a reliable estimate can be made of the amount of the obligation.
When the Group expects some or all of a provision to be reimbursed, for example under an insurance contract, the reimbursement is recognised as a separate asset but only when the reimbursement is virtually certain. The expense relating to any provision is presented in profit or loss net of any reimbursement.
If the effect of the time value of money is material, provisions are discounted using a current pre-tax rate that reflects the risks specific to the liability. When discounting is used, the increase in the provision due to the passage of time is recognised as a borrowing cost.
(xxv) Employee leave benefitsWages, salaries, annual leave and sick leaveProvision is made for wages and salaries, including non-monetary benefits, and annual leave in respect of employees’ services up to the reporting date. They are measured at the amounts expected to be paid when the liabilities are settled. Liabilities for non-accumulating sick leave are recognised when the leave is taken and are measured at the rates paid or payable.
Liabilities arising in respect of wages and salaries, annual leave and any other employee entitlements expected to be settled within twelve months of the reporting date are measured at their nominal amounts. All other employee benefit liabilities are measured at the present value of the estimated future cash outflow to be made in respect of services provided by employees up to the reporting date. The value of the employee share incentive scheme is being charged as an employee benefits expense. Refer to Note 1(c)(xxvi) for the share-based payment transactions policy.
Long service leaveThe liability for long service leave is recognised in the provision for employee benefits and measured as the present value of expected future payments to be made in respect of services provided by employees up to the reporting date using the projected unit credit method. Consideration is given to expected future wage and salary levels, experience of employee departures, and periods of service. Expected future payments are discounted using market yields at the reporting date on high quality corporate bonds with terms to maturity and currencies that match, as closely as possible, the estimated future cash outflows.
(xxvi) Share-based payment transactionsThe Group provides benefits to employees (including senior executives) of the Group in the form of share-based payments, whereby employees render services in exchange for shares or rights over shares (equity-settled transactions). The plans currently in place to provide these benefits are the Company’s Executive Share Plan and Loan Facility and the 2012 Option Plan for the Company’s Chief Executive Officer. The grant of rights under the Executive Share Plan and Loan Facility are treated as “in substance options”, even where the equity instrument is not an option.
The cost of equity-settled transactions with employees is measured by reference to the fair value of the equity instruments at the date at which they are granted. The fair value is determined by an external valuer using either the Monte Carlo, binomial or Black-Scholes models. In valuing equity-settled transactions, no account is taken of any performance conditions, other than conditions linked to the price of the shares of VRL (market conditions) if applicable.
1 CORPORATE INFORMATION AND SUMMARY OF SIGNIFICANT ACCOUNTING POLICIES (continued)
(c) Summary of significant accounting policies (continued)
(xx) Intangible assets (continued)
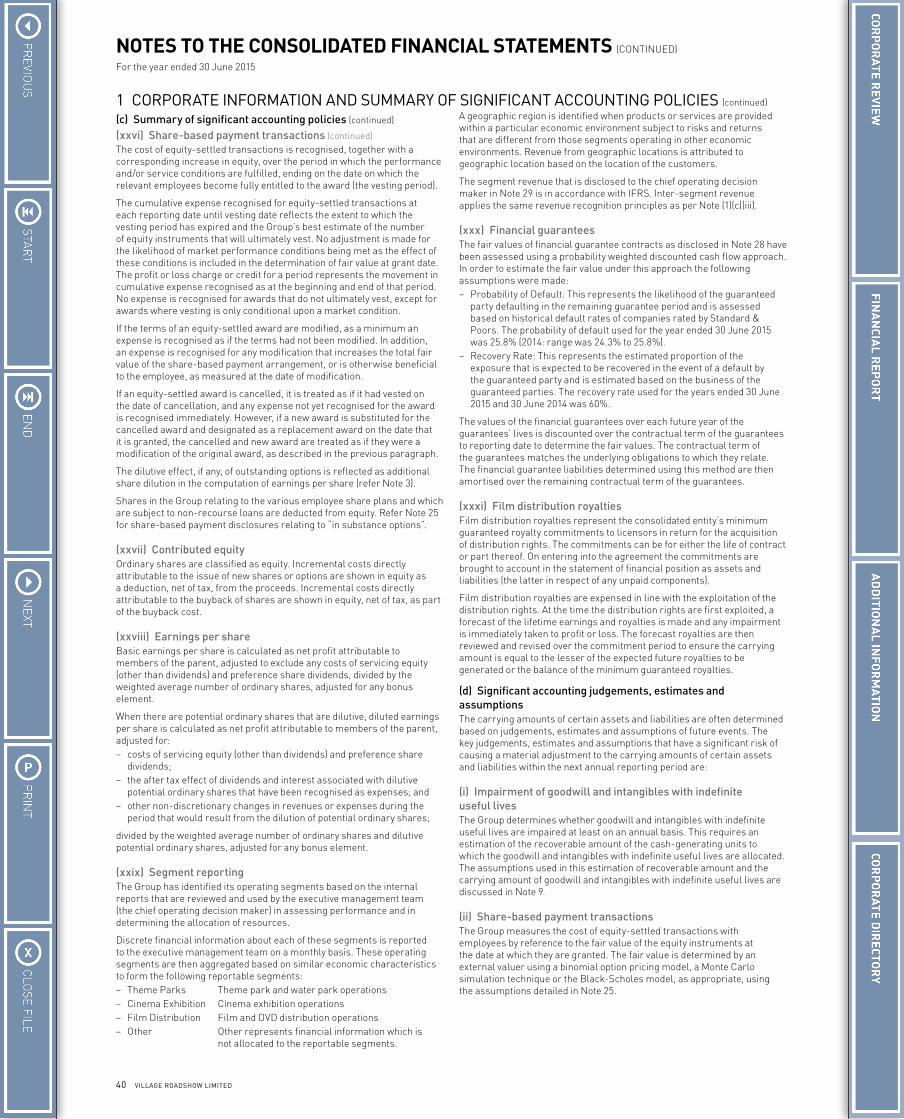
40 VILLAGE ROADSHOW LIMITED
NOTES TO THE CONSOLIDATED FINANCIAL STATEMENTS (CONTINUED)
For the year ended 30 June 2015
The cost of equity-settled transactions is recognised, together with a corresponding increase in equity, over the period in which the performance and/or service conditions are fulfilled, ending on the date on which the relevant employees become fully entitled to the award (the vesting period).
The cumulative expense recognised for equity-settled transactions at each reporting date until vesting date reflects the extent to which the vesting period has expired and the Group’s best estimate of the number of equity instruments that will ultimately vest. No adjustment is made for the likelihood of market performance conditions being met as the effect of these conditions is included in the determination of fair value at grant date. The profit or loss charge or credit for a period represents the movement in cumulative expense recognised as at the beginning and end of that period. No expense is recognised for awards that do not ultimately vest, except for awards where vesting is only conditional upon a market condition.
If the terms of an equity-settled award are modified, as a minimum an expense is recognised as if the terms had not been modified. In addition, an expense is recognised for any modification that increases the total fair value of the share-based payment arrangement, or is otherwise beneficial to the employee, as measured at the date of modification.
If an equity-settled award is cancelled, it is treated as if it had vested on the date of cancellation, and any expense not yet recognised for the award is recognised immediately. However, if a new award is substituted for the cancelled award and designated as a replacement award on the date that it is granted, the cancelled and new award are treated as if they were a modification of the original award, as described in the previous paragraph.
The dilutive effect, if any, of outstanding options is reflected as additional share dilution in the computation of earnings per share (refer Note 3).
Shares in the Group relating to the various employee share plans and which are subject to non-recourse loans are deducted from equity. Refer Note 25 for share-based payment disclosures relating to “in substance options”.
(xxvii) Contributed equityOrdinary shares are classified as equity. Incremental costs directly attributable to the issue of new shares or options are shown in equity as a deduction, net of tax, from the proceeds. Incremental costs directly attributable to the buyback of shares are shown in equity, net of tax, as part of the buyback cost.
(xxviii) Earnings per shareBasic earnings per share is calculated as net profit attributable to members of the parent, adjusted to exclude any costs of servicing equity (other than dividends) and preference share dividends, divided by the weighted average number of ordinary shares, adjusted for any bonus element.
When there are potential ordinary shares that are dilutive, diluted earnings per share is calculated as net profit attributable to members of the parent, adjusted for:– costs of servicing equity (other than dividends) and preference share
dividends;– the after tax effect of dividends and interest associated with dilutive
potential ordinary shares that have been recognised as expenses; and– other non-discretionary changes in revenues or expenses during the
period that would result from the dilution of potential ordinary shares;
divided by the weighted average number of ordinary shares and dilutive potential ordinary shares, adjusted for any bonus element.
(xxix) Segment reportingThe Group has identified its operating segments based on the internal reports that are reviewed and used by the executive management team (the chief operating decision maker) in assessing performance and in determining the allocation of resources.
Discrete financial information about each of these segments is reported to the executive management team on a monthly basis. These operating segments are then aggregated based on similar economic characteristics to form the following reportable segments:– Theme Parks Theme park and water park operations– Cinema Exhibition Cinema exhibition operations– Film Distribution Film and DVD distribution operations– Other Other represents financial information which is
not allocated to the reportable segments.
A geographic region is identified when products or services are provided within a particular economic environment subject to risks and returns that are different from those segments operating in other economic environments. Revenue from geographic locations is attributed to geographic location based on the location of the customers.
The segment revenue that is disclosed to the chief operating decision maker in Note 29 is in accordance with IFRS. Inter-segment revenue applies the same revenue recognition principles as per Note (1)(c)(iii).
(xxx) Financial guaranteesThe fair values of financial guarantee contracts as disclosed in Note 28 have been assessed using a probability weighted discounted cash flow approach. In order to estimate the fair value under this approach the following assumptions were made:– Probability of Default: This represents the likelihood of the guaranteed
party defaulting in the remaining guarantee period and is assessed based on historical default rates of companies rated by Standard & Poors. The probability of default used for the year ended 30 June 2015 was 25.8% (2014: range was 24.3% to 25.8%).
– Recovery Rate: This represents the estimated proportion of the exposure that is expected to be recovered in the event of a default by the guaranteed party and is estimated based on the business of the guaranteed parties. The recovery rate used for the years ended 30 June 2015 and 30 June 2014 was 60%.
The values of the financial guarantees over each future year of the guarantees’ lives is discounted over the contractual term of the guarantees to reporting date to determine the fair values. The contractual term of the guarantees matches the underlying obligations to which they relate. The financial guarantee liabilities determined using this method are then amortised over the remaining contractual term of the guarantees.
(xxxi) Film distribution royaltiesFilm distribution royalties represent the consolidated entity’s minimum guaranteed royalty commitments to licensors in return for the acquisition of distribution rights. The commitments can be for either the life of contract or part thereof. On entering into the agreement the commitments are brought to account in the statement of financial position as assets and liabilities (the latter in respect of any unpaid components).
Film distribution royalties are expensed in line with the exploitation of the distribution rights. At the time the distribution rights are first exploited, a forecast of the lifetime earnings and royalties is made and any impairment is immediately taken to profit or loss. The forecast royalties are then reviewed and revised over the commitment period to ensure the carrying amount is equal to the lesser of the expected future royalties to be generated or the balance of the minimum guaranteed royalties.
(d) Significant accounting judgements, estimates and assumptionsThe carrying amounts of certain assets and liabilities are often determined based on judgements, estimates and assumptions of future events. The key judgements, estimates and assumptions that have a significant risk of causing a material adjustment to the carrying amounts of certain assets and liabilities within the next annual reporting period are:
(i) Impairment of goodwill and intangibles with indefinite useful livesThe Group determines whether goodwill and intangibles with indefinite useful lives are impaired at least on an annual basis. This requires an estimation of the recoverable amount of the cash-generating units to which the goodwill and intangibles with indefinite useful lives are allocated. The assumptions used in this estimation of recoverable amount and the carrying amount of goodwill and intangibles with indefinite useful lives are discussed in Note 9.
(ii) Share-based payment transactionsThe Group measures the cost of equity-settled transactions with employees by reference to the fair value of the equity instruments at the date at which they are granted. The fair value is determined by an external valuer using a binomial option pricing model, a Monte Carlo simulation technique or the Black-Scholes model, as appropriate, using the assumptions detailed in Note 25.
1 CORPORATE INFORMATION AND SUMMARY OF SIGNIFICANT ACCOUNTING POLICIES (continued)
(c) Summary of significant accounting policies (continued)
(xxvi) Share-based payment transactions (continued)
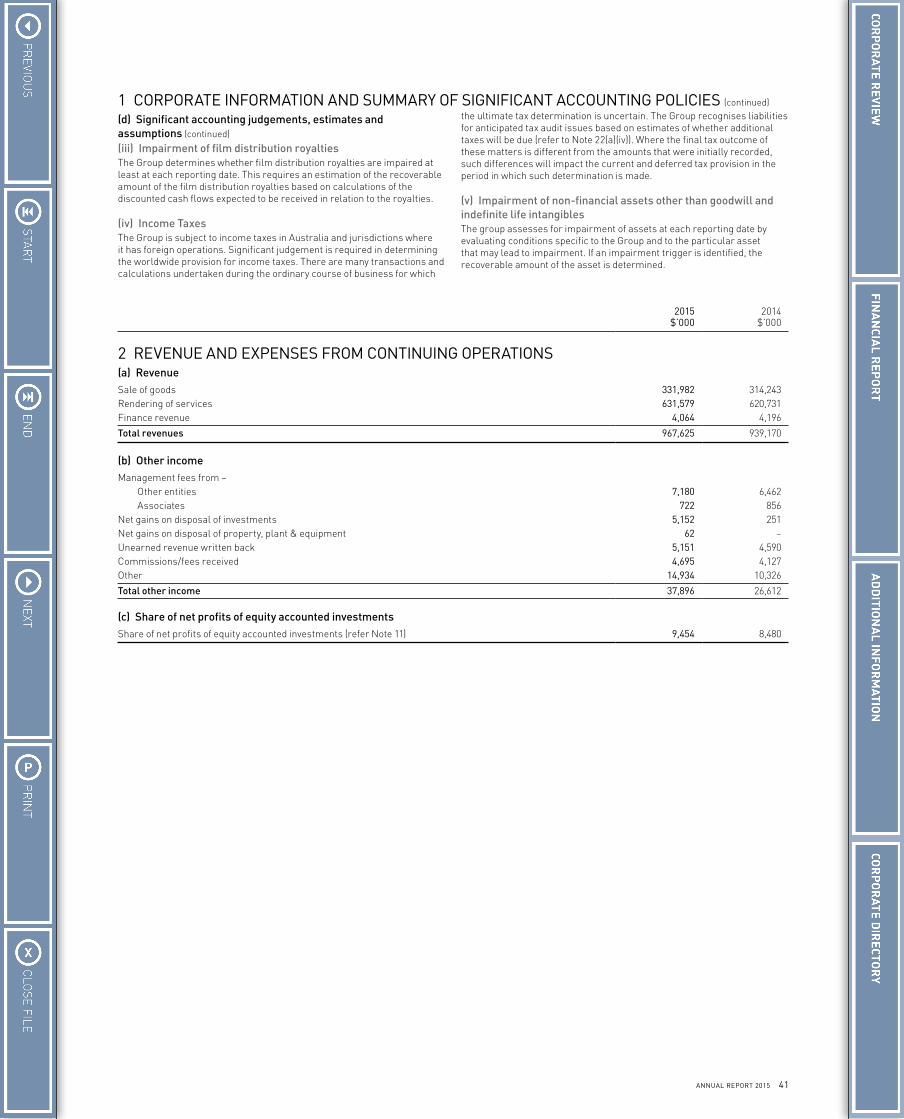
41ANNUAL REPORT 2015
(iii) Impairment of film distribution royaltiesThe Group determines whether film distribution royalties are impaired at least at each reporting date. This requires an estimation of the recoverable amount of the film distribution royalties based on calculations of the discounted cash flows expected to be received in relation to the royalties.
(iv) Income TaxesThe Group is subject to income taxes in Australia and jurisdictions where it has foreign operations. Significant judgement is required in determining the worldwide provision for income taxes. There are many transactions and calculations undertaken during the ordinary course of business for which
the ultimate tax determination is uncertain. The Group recognises liabilities for anticipated tax audit issues based on estimates of whether additional taxes will be due (refer to Note 22(a)(iv)). Where the final tax outcome of these matters is different from the amounts that were initially recorded, such differences will impact the current and deferred tax provision in the period in which such determination is made.
(v) Impairment of non-financial assets other than goodwill and indefinite life intangiblesThe group assesses for impairment of assets at each reporting date by evaluating conditions specific to the Group and to the particular asset that may lead to impairment. If an impairment trigger is identified, the recoverable amount of the asset is determined.
2015 $’000
2014 $’000
2 REVENUE AND EXPENSES FROM CONTINUING OPERATIONS(a) RevenueSale of goods 331,982 314,243Rendering of services 631,579 620,731Finance revenue 4,064 4,196
Total revenues 967,625 939,170
(b) Other incomeManagement fees from – Other entities 7,180 6,462 Associates 722 856Net gains on disposal of investments 5,152 251Net gains on disposal of property, plant & equipment 62 –Unearned revenue written back 5,151 4,590Commissions/fees received 4,695 4,127Other 14,934 10,326
Total other income 37,896 26,612
(c) Share of net profits of equity accounted investmentsShare of net profits of equity accounted investments (refer Note 11) 9,454 8,480
1 CORPORATE INFORMATION AND SUMMARY OF SIGNIFICANT ACCOUNTING POLICIES (continued)
(d) Significant accounting judgements, estimates and assumptions (continued)
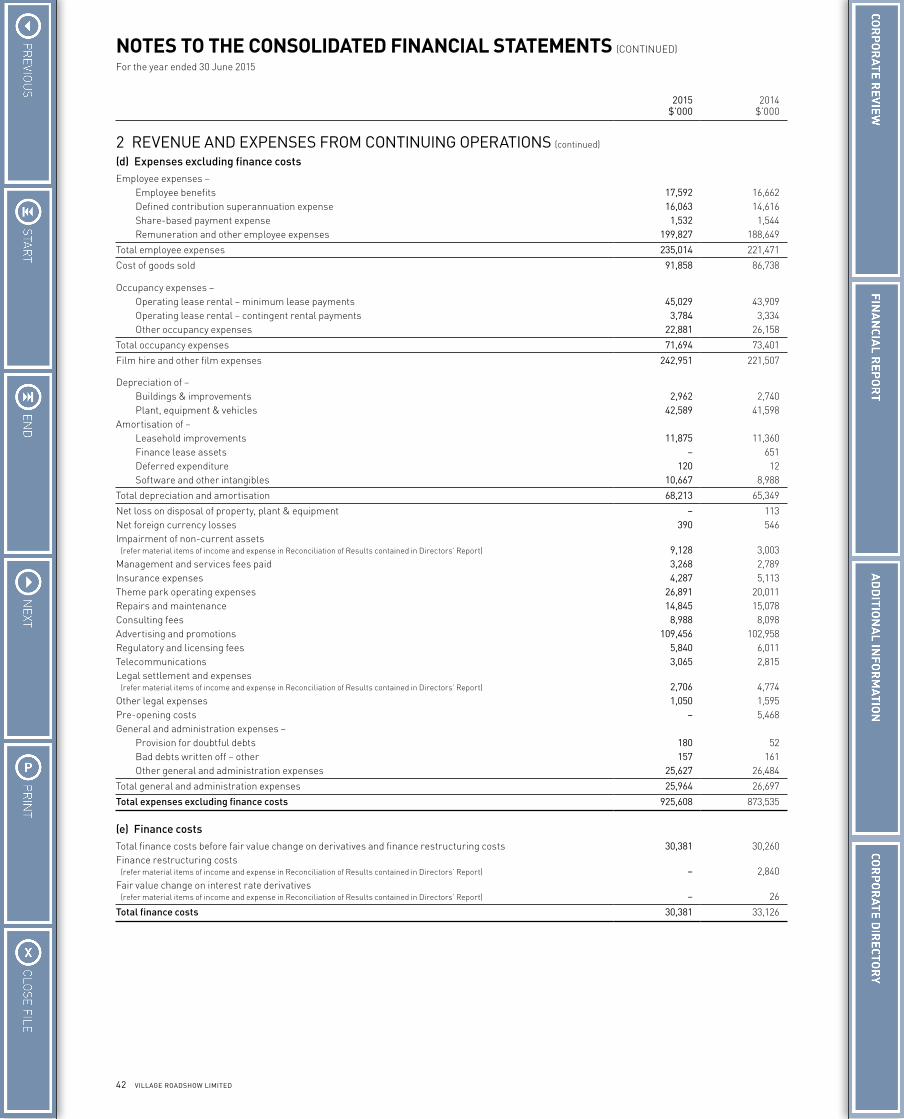
42 VILLAGE ROADSHOW LIMITED
NOTES TO THE CONSOLIDATED FINANCIAL STATEMENTS (CONTINUED)
For the year ended 30 June 2015
2015 $’000
2014 $’000
2 REVENUE AND EXPENSES FROM CONTINUING OPERATIONS (continued)
(d) Expenses excluding finance costsEmployee expenses – Employee benefits 17,592 16,662 Defined contribution superannuation expense 16,063 14,616 Share-based payment expense 1,532 1,544 Remuneration and other employee expenses 199,827 188,649
Total employee expenses 235,014 221,471
Cost of goods sold 91,858 86,738 Occupancy expenses – Operating lease rental – minimum lease payments 45,029 43,909 Operating lease rental – contingent rental payments 3,784 3,334 Other occupancy expenses 22,881 26,158
Total occupancy expenses 71,694 73,401
Film hire and other film expenses 242,951 221,507 Depreciation of – Buildings & improvements 2,962 2,740 Plant, equipment & vehicles 42,589 41,598Amortisation of – Leasehold improvements 11,875 11,360 Finance lease assets – 651 Deferred expenditure 120 12 Software and other intangibles 10,667 8,988
Total depreciation and amortisation 68,213 65,349
Net loss on disposal of property, plant & equipment – 113Net foreign currency losses 390 546Impairment of non-current assets (refer material items of income and expense in Reconciliation of Results contained in Directors’ Report) 9,128 3,003Management and services fees paid 3,268 2,789Insurance expenses 4,287 5,113Theme park operating expenses 26,891 20,011Repairs and maintenance 14,845 15,078Consulting fees 8,988 8,098Advertising and promotions 109,456 102,958Regulatory and licensing fees 5,840 6,011Telecommunications 3,065 2,815Legal settlement and expenses (refer material items of income and expense in Reconciliation of Results contained in Directors’ Report) 2,706 4,774Other legal expenses 1,050 1,595Pre-opening costs – 5,468General and administration expenses – Provision for doubtful debts 180 52 Bad debts written off – other 157 161 Other general and administration expenses 25,627 26,484
Total general and administration expenses 25,964 26,697
Total expenses excluding finance costs 925,608 873,535
(e) Finance costsTotal finance costs before fair value change on derivatives and finance restructuring costs 30,381 30,260Finance restructuring costs (refer material items of income and expense in Reconciliation of Results contained in Directors’ Report) – 2,840Fair value change on interest rate derivatives (refer material items of income and expense in Reconciliation of Results contained in Directors’ Report) – 26
Total finance costs 30,381 33,126
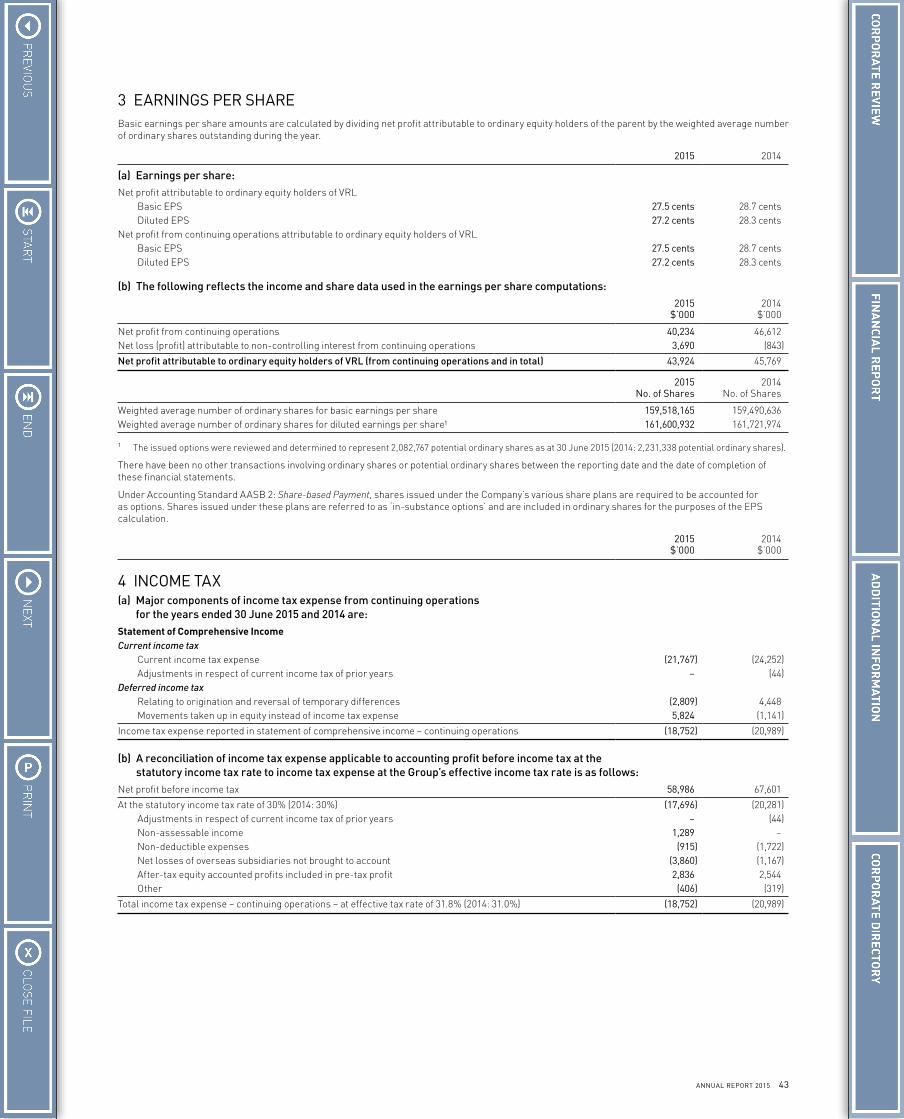
43ANNUAL REPORT 2015
3 EARNINGS PER SHAREBasic earnings per share amounts are calculated by dividing net profit attributable to ordinary equity holders of the parent by the weighted average number of ordinary shares outstanding during the year.
2015 2014
(a) Earnings per share:Net profit attributable to ordinary equity holders of VRL Basic EPS 27.5 cents 28.7 cents Diluted EPS 27.2 cents 28.3 centsNet profit from continuing operations attributable to ordinary equity holders of VRL Basic EPS 27.5 cents 28.7 cents Diluted EPS 27.2 cents 28.3 cents
(b) The following reflects the income and share data used in the earnings per share computations:2015
$’0002014
$’000
Net profit from continuing operations 40,234 46,612Net loss (profit) attributable to non-controlling interest from continuing operations 3,690 (843)
Net profit attributable to ordinary equity holders of VRL (from continuing operations and in total) 43,924 45,769
2015 No. of Shares
2014 No. of Shares
Weighted average number of ordinary shares for basic earnings per share 159,518,165 159,490,636Weighted average number of ordinary shares for diluted earnings per share¹ 161,600,932 161,721,974
1 The issued options were reviewed and determined to represent 2,082,767 potential ordinary shares as at 30 June 2015 (2014: 2,231,338 potential ordinary shares).
There have been no other transactions involving ordinary shares or potential ordinary shares between the reporting date and the date of completion of these financial statements.
Under Accounting Standard AASB 2: Share-based Payment, shares issued under the Company’s various share plans are required to be accounted for as options. Shares issued under these plans are referred to as ‘in-substance options’ and are included in ordinary shares for the purposes of the EPS calculation.
2015 $’000
2014 $’000
4 INCOME TAX(a) Major components of income tax expense from continuing operations
for the years ended 30 June 2015 and 2014 are:Statement of Comprehensive IncomeCurrent income tax Current income tax expense (21,767) (24,252) Adjustments in respect of current income tax of prior years – (44)Deferred income tax Relating to origination and reversal of temporary differences (2,809) 4,448 Movements taken up in equity instead of income tax expense 5,824 (1,141)
Income tax expense reported in statement of comprehensive income – continuing operations (18,752) (20,989)
(b) A reconciliation of income tax expense applicable to accounting profit before income tax at the statutory income tax rate to income tax expense at the Group’s effective income tax rate is as follows:
Net profit before income tax 58,986 67,601
At the statutory income tax rate of 30% (2014: 30%) (17,696) (20,281) Adjustments in respect of current income tax of prior years – (44) Non-assessable income 1,289 – Non-deductible expenses (915) (1,722) Net losses of overseas subsidiaries not brought to account (3,860) (1,167) After-tax equity accounted profits included in pre-tax profit 2,836 2,544 Other (406) (319)
Total income tax expense – continuing operations – at effective tax rate of 31.8% (2014: 31.0%) (18,752) (20,989)
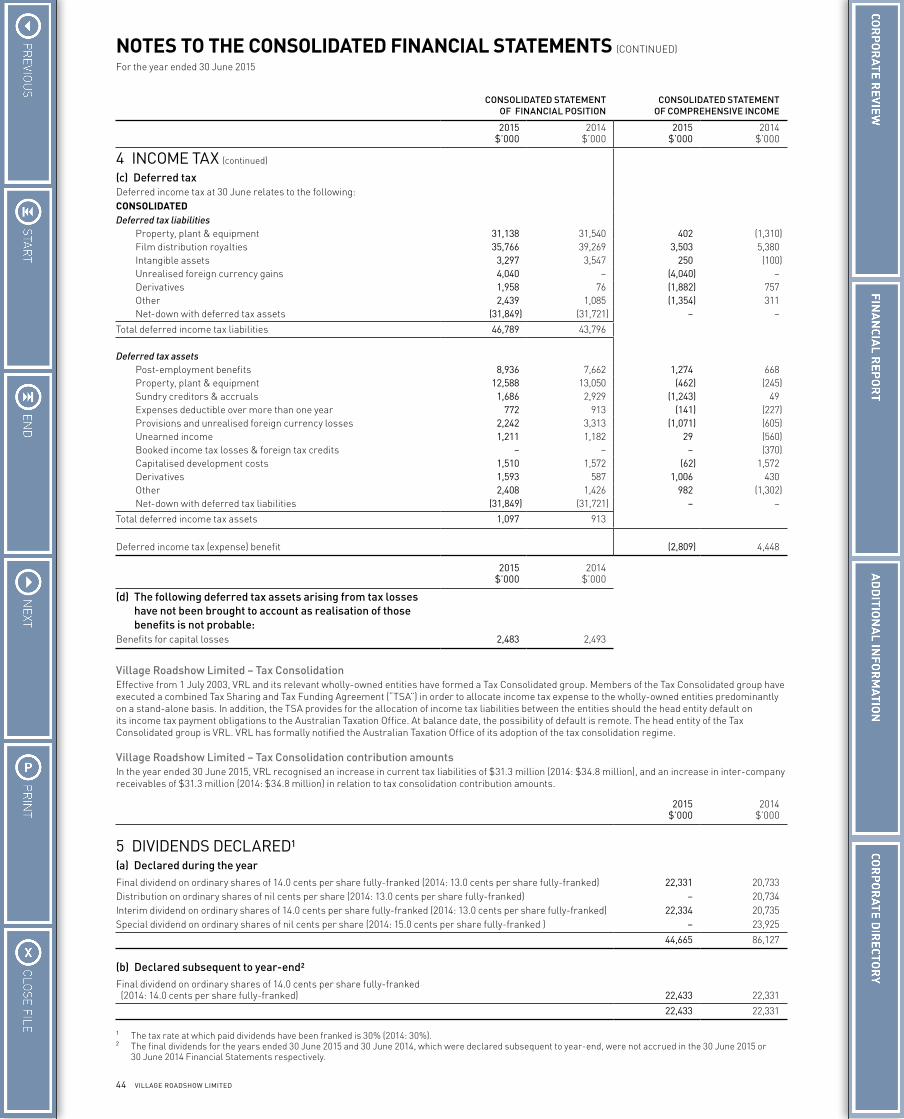
44 VILLAGE ROADSHOW LIMITED
NOTES TO THE CONSOLIDATED FINANCIAL STATEMENTS (CONTINUED)
For the year ended 30 June 2015
CONSOLIDATED STATEMENT OF FINANCIAL POSITION
CONSOLIDATED STATEMENT OF COMPREHENSIVE INCOME
2015 $’000
2014 $’000
2015 $’000
2014 $’000
4 INCOME TAX (continued)
(c) Deferred taxDeferred income tax at 30 June relates to the following:CONSOLIDATEDDeferred tax liabilities Property, plant & equipment 31,138 31,540 402 (1,310) Film distribution royalties 35,766 39,269 3,503 5,380 Intangible assets 3,297 3,547 250 (100) Unrealised foreign currency gains 4,040 – (4,040) – Derivatives 1,958 76 (1,882) 757 Other 2,439 1,085 (1,354) 311 Net-down with deferred tax assets (31,849) (31,721) – –
Total deferred income tax liabilities 46,789 43,796
Deferred tax assets Post-employment benefits 8,936 7,662 1,274 668 Property, plant & equipment 12,588 13,050 (462) (245) Sundry creditors & accruals 1,686 2,929 (1,243) 49 Expenses deductible over more than one year 772 913 (141) (227) Provisions and unrealised foreign currency losses 2,242 3,313 (1,071) (605) Unearned income 1,211 1,182 29 (560) Booked income tax losses & foreign tax credits – – – (370) Capitalised development costs 1,510 1,572 (62) 1,572 Derivatives 1,593 587 1,006 430 Other 2,408 1,426 982 (1,302) Net-down with deferred tax liabilities (31,849) (31,721) – –
Total deferred income tax assets 1,097 913
Deferred income tax (expense) benefit (2,809) 4,448
2015 $’000
2014 $’000
(d) The following deferred tax assets arising from tax losses have not been brought to account as realisation of those benefits is not probable:
Benefits for capital losses 2,483 2,493
Village Roadshow Limited – Tax ConsolidationEffective from 1 July 2003, VRL and its relevant wholly-owned entities have formed a Tax Consolidated group. Members of the Tax Consolidated group have executed a combined Tax Sharing and Tax Funding Agreement (“TSA”) in order to allocate income tax expense to the wholly-owned entities predominantly on a stand-alone basis. In addition, the TSA provides for the allocation of income tax liabilities between the entities should the head entity default on its income tax payment obligations to the Australian Taxation Office. At balance date, the possibility of default is remote. The head entity of the Tax Consolidated group is VRL. VRL has formally notified the Australian Taxation Office of its adoption of the tax consolidation regime.
Village Roadshow Limited – Tax Consolidation contribution amountsIn the year ended 30 June 2015, VRL recognised an increase in current tax liabilities of $31.3 million (2014: $34.8 million), and an increase in inter-company receivables of $31.3 million (2014: $34.8 million) in relation to tax consolidation contribution amounts.
2015 $’000
2014 $’000
5 DIVIDENDS DECLARED¹(a) Declared during the yearFinal dividend on ordinary shares of 14.0 cents per share fully-franked (2014: 13.0 cents per share fully-franked) 22,331 20,733Distribution on ordinary shares of nil cents per share (2014: 13.0 cents per share fully-franked) – 20,734Interim dividend on ordinary shares of 14.0 cents per share fully-franked (2014: 13.0 cents per share fully-franked) 22,334 20,735Special dividend on ordinary shares of nil cents per share (2014: 15.0 cents per share fully-franked ) – 23,925
44,665 86,127
(b) Declared subsequent to year-end²Final dividend on ordinary shares of 14.0 cents per share fully-franked (2014: 14.0 cents per share fully-franked) 22,433 22,331
22,433 22,331
1 The tax rate at which paid dividends have been franked is 30% (2014: 30%).2 The final dividends for the years ended 30 June 2015 and 30 June 2014, which were declared subsequent to year-end, were not accrued in the 30 June 2015 or
30 June 2014 Financial Statements respectively.
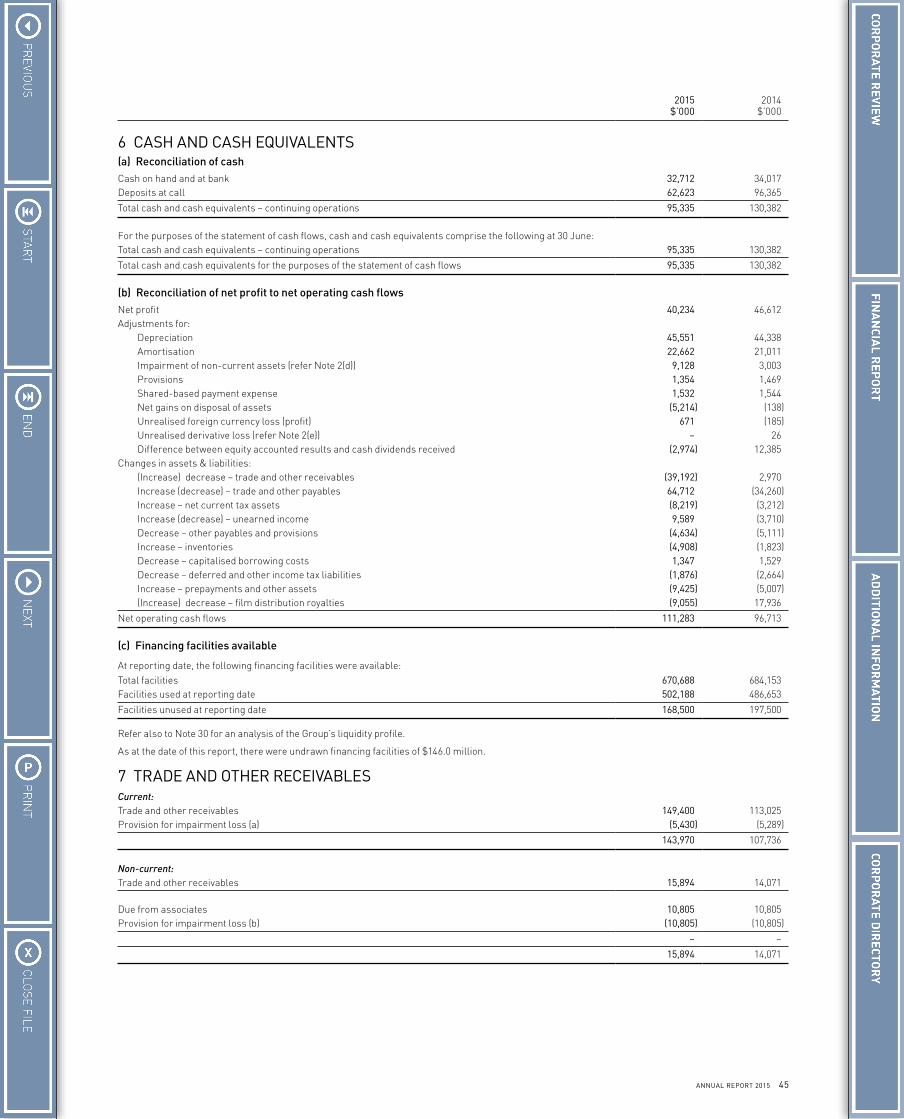
45ANNUAL REPORT 2015
2015 $’000
2014 $’000
6 CASH AND CASH EQUIVALENTS(a) Reconciliation of cashCash on hand and at bank 32,712 34,017Deposits at call 62,623 96,365
Total cash and cash equivalents – continuing operations 95,335 130,382
For the purposes of the statement of cash flows, cash and cash equivalents comprise the following at 30 June:Total cash and cash equivalents – continuing operations 95,335 130,382
Total cash and cash equivalents for the purposes of the statement of cash flows 95,335 130,382
(b) Reconciliation of net profit to net operating cash flowsNet profit 40,234 46,612Adjustments for: Depreciation 45,551 44,338 Amortisation 22,662 21,011 Impairment of non-current assets (refer Note 2(d)) 9,128 3,003 Provisions 1,354 1,469 Shared-based payment expense 1,532 1,544 Net gains on disposal of assets (5,214) (138) Unrealised foreign currency loss (profit) 671 (185) Unrealised derivative loss (refer Note 2(e)) – 26 Difference between equity accounted results and cash dividends received (2,974) 12,385Changes in assets & liabilities: (Increase) decrease – trade and other receivables (39,192) 2,970 Increase (decrease) – trade and other payables 64,712 (34,260) Increase – net current tax assets (8,219) (3,212) Increase (decrease) – unearned income 9,589 (3,710) Decrease – other payables and provisions (4,634) (5,111) Increase – inventories (4,908) (1,823) Decrease – capitalised borrowing costs 1,347 1,529 Decrease – deferred and other income tax liabilities (1,876) (2,664) Increase – prepayments and other assets (9,425) (5,007) (Increase) decrease – film distribution royalties (9,055) 17,936
Net operating cash flows 111,283 96,713
(c) Financing facilities available
At reporting date, the following financing facilities were available:Total facilities 670,688 684,153Facilities used at reporting date 502,188 486,653
Facilities unused at reporting date 168,500 197,500
Refer also to Note 30 for an analysis of the Group’s liquidity profile.
As at the date of this report, there were undrawn financing facilities of $146.0 million.
7 TRADE AND OTHER RECEIVABLESCurrent:Trade and other receivables 149,400 113,025Provision for impairment loss (a) (5,430) (5,289)
143,970 107,736
Non-current:Trade and other receivables 15,894 14,071
Due from associates 10,805 10,805Provision for impairment loss (b) (10,805) (10,805)
– –
15,894 14,071
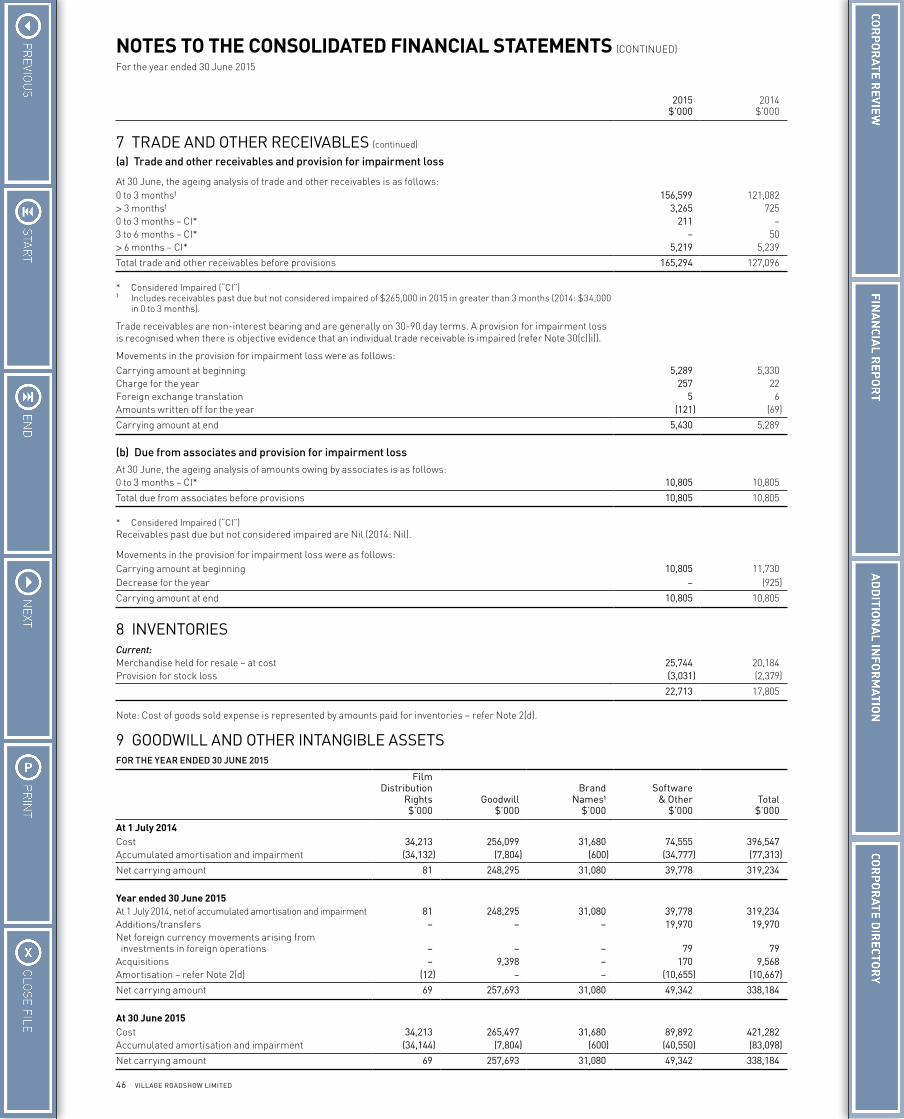
46 VILLAGE ROADSHOW LIMITED
NOTES TO THE CONSOLIDATED FINANCIAL STATEMENTS (CONTINUED)
For the year ended 30 June 2015
2015 $’000
2014 $’000
7 TRADE AND OTHER RECEIVABLES (continued)
(a) Trade and other receivables and provision for impairment loss
At 30 June, the ageing analysis of trade and other receivables is as follows:0 to 3 months¹ 156,599 121,082> 3 months¹ 3,265 7250 to 3 months – CI* 211 –3 to 6 months – CI* – 50> 6 months – CI* 5,219 5,239
Total trade and other receivables before provisions 165,294 127,096
* Considered Impaired (“CI”)1 Includes receivables past due but not considered impaired of $265,000 in 2015 in greater than 3 months (2014: $34,000
in 0 to 3 months).
Trade receivables are non-interest bearing and are generally on 30-90 day terms. A provision for impairment loss is recognised when there is objective evidence that an individual trade receivable is impaired (refer Note 30(c)(i)).
Movements in the provision for impairment loss were as follows:Carrying amount at beginning 5,289 5,330Charge for the year 257 22Foreign exchange translation 5 6Amounts written off for the year (121) (69)
Carrying amount at end 5,430 5,289
(b) Due from associates and provision for impairment lossAt 30 June, the ageing analysis of amounts owing by associates is as follows:0 to 3 months – CI* 10,805 10,805
Total due from associates before provisions 10,805 10,805
* Considered Impaired (“CI”)Receivables past due but not considered impaired are Nil (2014: Nil).
Movements in the provision for impairment loss were as follows:Carrying amount at beginning 10,805 11,730Decrease for the year – (925)
Carrying amount at end 10,805 10,805
8 INVENTORIESCurrent:Merchandise held for resale – at cost 25,744 20,184Provision for stock loss (3,031) (2,379)
22,713 17,805
Note: Cost of goods sold expense is represented by amounts paid for inventories – refer Note 2(d).
9 GOODWILL AND OTHER INTANGIBLE ASSETSFOR THE YEAR ENDED 30 JUNE 2015
Film Distribution
Rights $’000
Goodwill $’000
Brand Names¹
$’000
Software & Other
$’000Total
$’000
At 1 July 2014Cost 34,213 256,099 31,680 74,555 396,547Accumulated amortisation and impairment (34,132) (7,804) (600) (34,777) (77,313)
Net carrying amount 81 248,295 31,080 39,778 319,234
Year ended 30 June 2015At 1 July 2014, net of accumulated amortisation and impairment 81 248,295 31,080 39,778 319,234Additions/transfers – – – 19,970 19,970Net foreign currency movements arising from investments in foreign operations – – – 79 79Acquisitions – 9,398 – 170 9,568Amortisation – refer Note 2(d) (12) – – (10,655) (10,667)
Net carrying amount 69 257,693 31,080 49,342 338,184
At 30 June 2015Cost 34,213 265,497 31,680 89,892 421,282Accumulated amortisation and impairment (34,144) (7,804) (600) (40,550) (83,098)
Net carrying amount 69 257,693 31,080 49,342 338,184
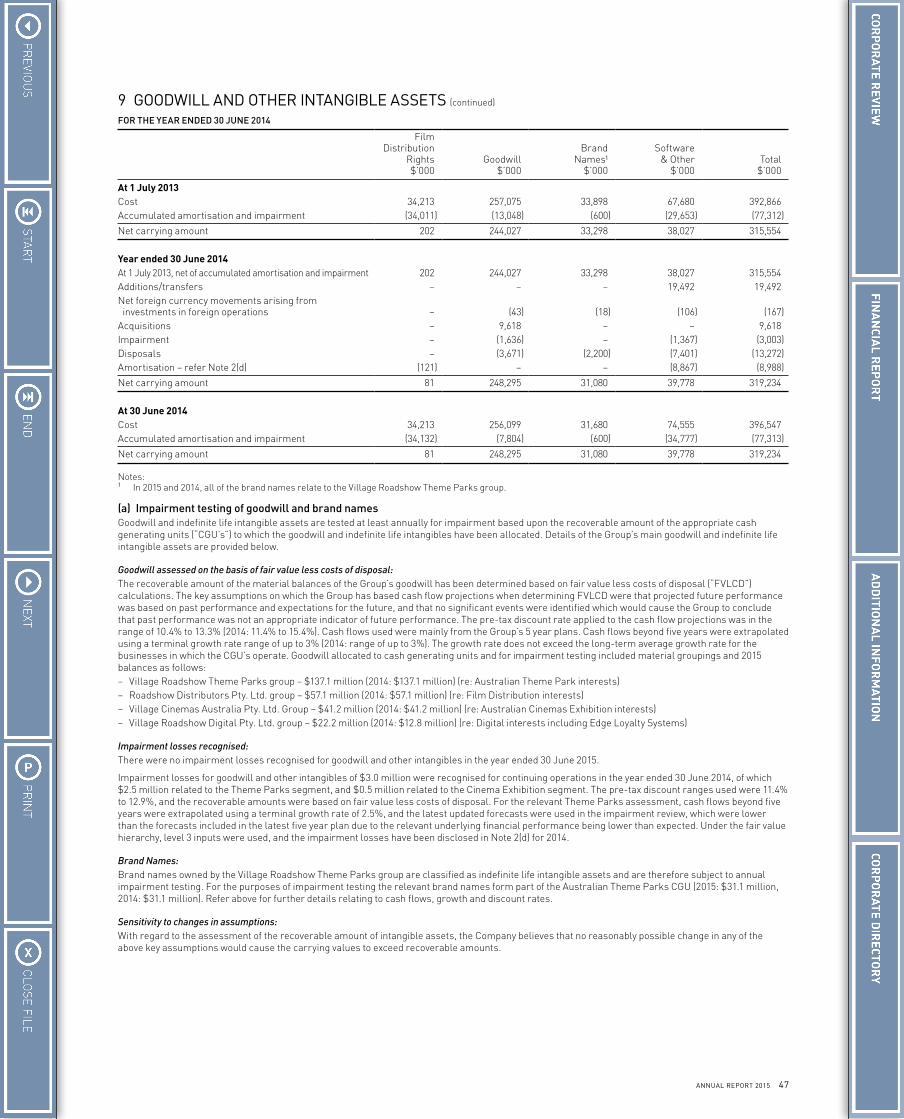
47ANNUAL REPORT 2015
9 GOODWILL AND OTHER INTANGIBLE ASSETS (continued)
FOR THE YEAR ENDED 30 JUNE 2014
Film Distribution
Rights $’000
Goodwill $’000
Brand Names¹
$’000
Software & Other
$’000Total
$’000
At 1 July 2013Cost 34,213 257,075 33,898 67,680 392,866Accumulated amortisation and impairment (34,011) (13,048) (600) (29,653) (77,312)
Net carrying amount 202 244,027 33,298 38,027 315,554
Year ended 30 June 2014At 1 July 2013, net of accumulated amortisation and impairment 202 244,027 33,298 38,027 315,554Additions/transfers – – – 19,492 19,492Net foreign currency movements arising from investments in foreign operations – (43) (18) (106) (167)Acquisitions – 9,618 – – 9,618Impairment – (1,636) – (1,367) (3,003)Disposals – (3,671) (2,200) (7,401) (13,272)Amortisation – refer Note 2(d) (121) – – (8,867) (8,988)
Net carrying amount 81 248,295 31,080 39,778 319,234
At 30 June 2014Cost 34,213 256,099 31,680 74,555 396,547Accumulated amortisation and impairment (34,132) (7,804) (600) (34,777) (77,313)
Net carrying amount 81 248,295 31,080 39,778 319,234
Notes:1 In 2015 and 2014, all of the brand names relate to the Village Roadshow Theme Parks group.
(a) Impairment testing of goodwill and brand namesGoodwill and indefinite life intangible assets are tested at least annually for impairment based upon the recoverable amount of the appropriate cash generating units (“CGU’s”) to which the goodwill and indefinite life intangibles have been allocated. Details of the Group’s main goodwill and indefinite life intangible assets are provided below.
Goodwill assessed on the basis of fair value less costs of disposal:The recoverable amount of the material balances of the Group’s goodwill has been determined based on fair value less costs of disposal (“FVLCD”) calculations. The key assumptions on which the Group has based cash flow projections when determining FVLCD were that projected future performance was based on past performance and expectations for the future, and that no significant events were identified which would cause the Group to conclude that past performance was not an appropriate indicator of future performance. The pre-tax discount rate applied to the cash flow projections was in the range of 10.4% to 13.3% (2014: 11.4% to 15.4%). Cash flows used were mainly from the Group’s 5 year plans. Cash flows beyond five years were extrapolated using a terminal growth rate range of up to 3% (2014: range of up to 3%). The growth rate does not exceed the long-term average growth rate for the businesses in which the CGU’s operate. Goodwill allocated to cash generating units and for impairment testing included material groupings and 2015 balances as follows:– Village Roadshow Theme Parks group – $137.1 million (2014: $137.1 million) (re: Australian Theme Park interests)– Roadshow Distributors Pty. Ltd. group – $57.1 million (2014: $57.1 million) (re: Film Distribution interests)– Village Cinemas Australia Pty. Ltd. Group – $41.2 million (2014: $41.2 million) (re: Australian Cinemas Exhibition interests)– Village Roadshow Digital Pty. Ltd. group – $22.2 million (2014: $12.8 million) (re: Digital interests including Edge Loyalty Systems)
Impairment losses recognised:There were no impairment losses recognised for goodwill and other intangibles in the year ended 30 June 2015.
Impairment losses for goodwill and other intangibles of $3.0 million were recognised for continuing operations in the year ended 30 June 2014, of which $2.5 million related to the Theme Parks segment, and $0.5 million related to the Cinema Exhibition segment. The pre-tax discount ranges used were 11.4% to 12.9%, and the recoverable amounts were based on fair value less costs of disposal. For the relevant Theme Parks assessment, cash flows beyond five years were extrapolated using a terminal growth rate of 2.5%, and the latest updated forecasts were used in the impairment review, which were lower than the forecasts included in the latest five year plan due to the relevant underlying financial performance being lower than expected. Under the fair value hierarchy, level 3 inputs were used, and the impairment losses have been disclosed in Note 2(d) for 2014.
Brand Names:Brand names owned by the Village Roadshow Theme Parks group are classified as indefinite life intangible assets and are therefore subject to annual impairment testing. For the purposes of impairment testing the relevant brand names form part of the Australian Theme Parks CGU (2015: $31.1 million, 2014: $31.1 million). Refer above for further details relating to cash flows, growth and discount rates.
Sensitivity to changes in assumptions:With regard to the assessment of the recoverable amount of intangible assets, the Company believes that no reasonably possible change in any of the above key assumptions would cause the carrying values to exceed recoverable amounts.
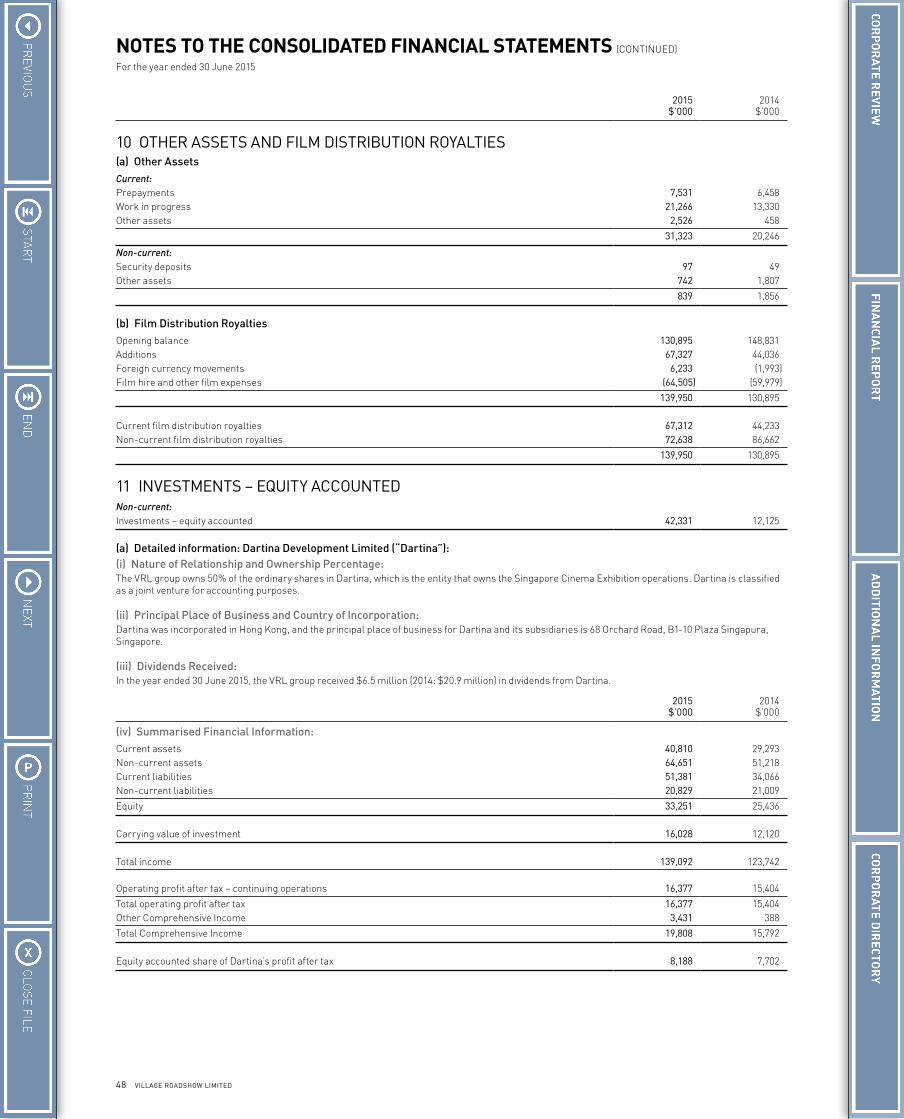
48 VILLAGE ROADSHOW LIMITED
NOTES TO THE CONSOLIDATED FINANCIAL STATEMENTS (CONTINUED)
For the year ended 30 June 2015
2015 $’000
2014 $’000
10 OTHER ASSETS AND FILM DISTRIBUTION ROYALTIES(a) Other AssetsCurrent:Prepayments 7,531 6,458Work in progress 21,266 13,330Other assets 2,526 458
31,323 20,246
Non-current:Security deposits 97 49Other assets 742 1,807
839 1,856
(b) Film Distribution RoyaltiesOpening balance 130,895 148,831Additions 67,327 44,036Foreign currency movements 6,233 (1,993)Film hire and other film expenses (64,505) (59,979)
139,950 130,895
Current film distribution royalties 67,312 44,233Non-current film distribution royalties 72,638 86,662
139,950 130,895
11 INVESTMENTS – EQUITY ACCOUNTEDNon-current:Investments – equity accounted 42,331 12,125
(a) Detailed information: Dartina Development Limited (“Dartina”):(i) Nature of Relationship and Ownership Percentage:The VRL group owns 50% of the ordinary shares in Dartina, which is the entity that owns the Singapore Cinema Exhibition operations. Dartina is classified as a joint venture for accounting purposes.
(ii) Principal Place of Business and Country of Incorporation:Dartina was incorporated in Hong Kong, and the principal place of business for Dartina and its subsidiaries is 68 Orchard Road, B1-10 Plaza Singapura, Singapore.
(iii) Dividends Received:In the year ended 30 June 2015, the VRL group received $6.5 million (2014: $20.9 million) in dividends from Dartina.
2015 $’000
2014 $’000
(iv) Summarised Financial Information:Current assets 40,810 29,293Non-current assets 64,651 51,218Current liabilities 51,381 34,066Non-current liabilities 20,829 21,009
Equity 33,251 25,436
Carrying value of investment 16,028 12,120
Total income 139,092 123,742
Operating profit after tax – continuing operations 16,377 15,404
Total operating profit after tax 16,377 15,404Other Comprehensive Income 3,431 388
Total Comprehensive Income 19,808 15,792
Equity accounted share of Dartina’s profit after tax 8,188 7,702
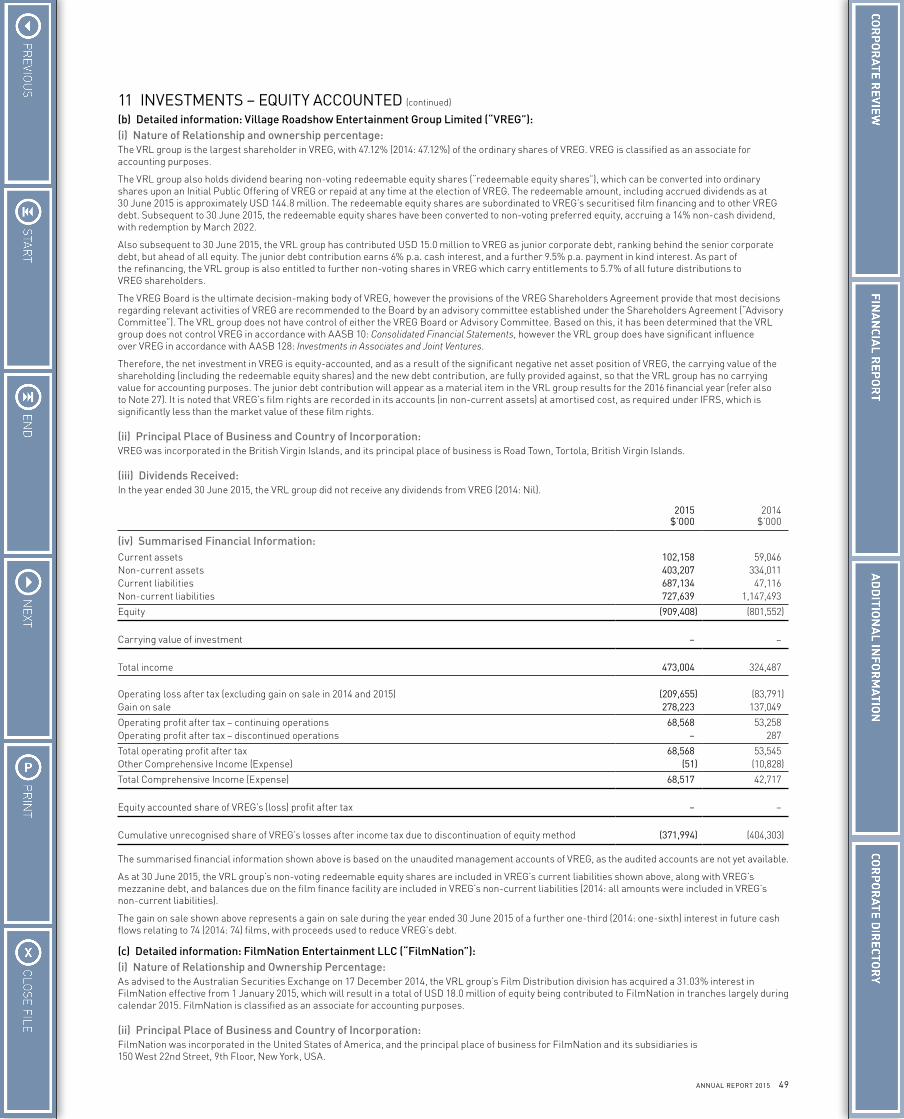
49ANNUAL REPORT 2015
11 INVESTMENTS – EQUITY ACCOUNTED (continued)
(b) Detailed information: Village Roadshow Entertainment Group Limited (“VREG”):(i) Nature of Relationship and ownership percentage:The VRL group is the largest shareholder in VREG, with 47.12% (2014: 47.12%) of the ordinary shares of VREG. VREG is classified as an associate for accounting purposes.
The VRL group also holds dividend bearing non-voting redeemable equity shares (“redeemable equity shares”), which can be converted into ordinary shares upon an Initial Public Offering of VREG or repaid at any time at the election of VREG. The redeemable amount, including accrued dividends as at 30 June 2015 is approximately USD 144.8 million. The redeemable equity shares are subordinated to VREG’s securitised film financing and to other VREG debt. Subsequent to 30 June 2015, the redeemable equity shares have been converted to non-voting preferred equity, accruing a 14% non-cash dividend, with redemption by March 2022.
Also subsequent to 30 June 2015, the VRL group has contributed USD 15.0 million to VREG as junior corporate debt, ranking behind the senior corporate debt, but ahead of all equity. The junior debt contribution earns 6% p.a. cash interest, and a further 9.5% p.a. payment in kind interest. As part of the refinancing, the VRL group is also entitled to further non-voting shares in VREG which carry entitlements to 5.7% of all future distributions to VREG shareholders.
The VREG Board is the ultimate decision-making body of VREG, however the provisions of the VREG Shareholders Agreement provide that most decisions regarding relevant activities of VREG are recommended to the Board by an advisory committee established under the Shareholders Agreement (“Advisory Committee”). The VRL group does not have control of either the VREG Board or Advisory Committee. Based on this, it has been determined that the VRL group does not control VREG in accordance with AASB 10: Consolidated Financial Statements, however the VRL group does have significant influence over VREG in accordance with AASB 128: Investments in Associates and Joint Ventures.
Therefore, the net investment in VREG is equity-accounted, and as a result of the significant negative net asset position of VREG, the carrying value of the shareholding (including the redeemable equity shares) and the new debt contribution, are fully provided against, so that the VRL group has no carrying value for accounting purposes. The junior debt contribution will appear as a material item in the VRL group results for the 2016 financial year (refer also to Note 27). It is noted that VREG’s film rights are recorded in its accounts (in non-current assets) at amortised cost, as required under IFRS, which is significantly less than the market value of these film rights.
(ii) Principal Place of Business and Country of Incorporation:VREG was incorporated in the British Virgin Islands, and its principal place of business is Road Town, Tortola, British Virgin Islands.
(iii) Dividends Received:In the year ended 30 June 2015, the VRL group did not receive any dividends from VREG (2014: Nil).
2015 $’000
2014 $’000
(iv) Summarised Financial Information:Current assets 102,158 59,046Non-current assets 403,207 334,011Current liabilities 687,134 47,116Non-current liabilities 727,639 1,147,493
Equity (909,408) (801,552)
Carrying value of investment – –
Total income 473,004 324,487
Operating loss after tax (excluding gain on sale in 2014 and 2015) (209,655) (83,791)Gain on sale 278,223 137,049
Operating profit after tax – continuing operations 68,568 53,258Operating profit after tax – discontinued operations – 287
Total operating profit after tax 68,568 53,545Other Comprehensive Income (Expense) (51) (10,828)
Total Comprehensive Income (Expense) 68,517 42,717
Equity accounted share of VREG’s (loss) profit after tax – –
Cumulative unrecognised share of VREG’s losses after income tax due to discontinuation of equity method (371,994) (404,303)
The summarised financial information shown above is based on the unaudited management accounts of VREG, as the audited accounts are not yet available.
As at 30 June 2015, the VRL group’s non-voting redeemable equity shares are included in VREG’s current liabilities shown above, along with VREG’s mezzanine debt, and balances due on the film finance facility are included in VREG’s non-current liabilities (2014: all amounts were included in VREG’s non-current liabilities).
The gain on sale shown above represents a gain on sale during the year ended 30 June 2015 of a further one-third (2014: one-sixth) interest in future cash flows relating to 74 (2014: 74) films, with proceeds used to reduce VREG’s debt.
(c) Detailed information: FilmNation Entertainment LLC (“FilmNation”):(i) Nature of Relationship and Ownership Percentage:As advised to the Australian Securities Exchange on 17 December 2014, the VRL group’s Film Distribution division has acquired a 31.03% interest in FilmNation effective from 1 January 2015, which will result in a total of USD 18.0 million of equity being contributed to FilmNation in tranches largely during calendar 2015. FilmNation is classified as an associate for accounting purposes.
(ii) Principal Place of Business and Country of Incorporation:FilmNation was incorporated in the United States of America, and the principal place of business for FilmNation and its subsidiaries is 150 West 22nd Street, 9th Floor, New York, USA.
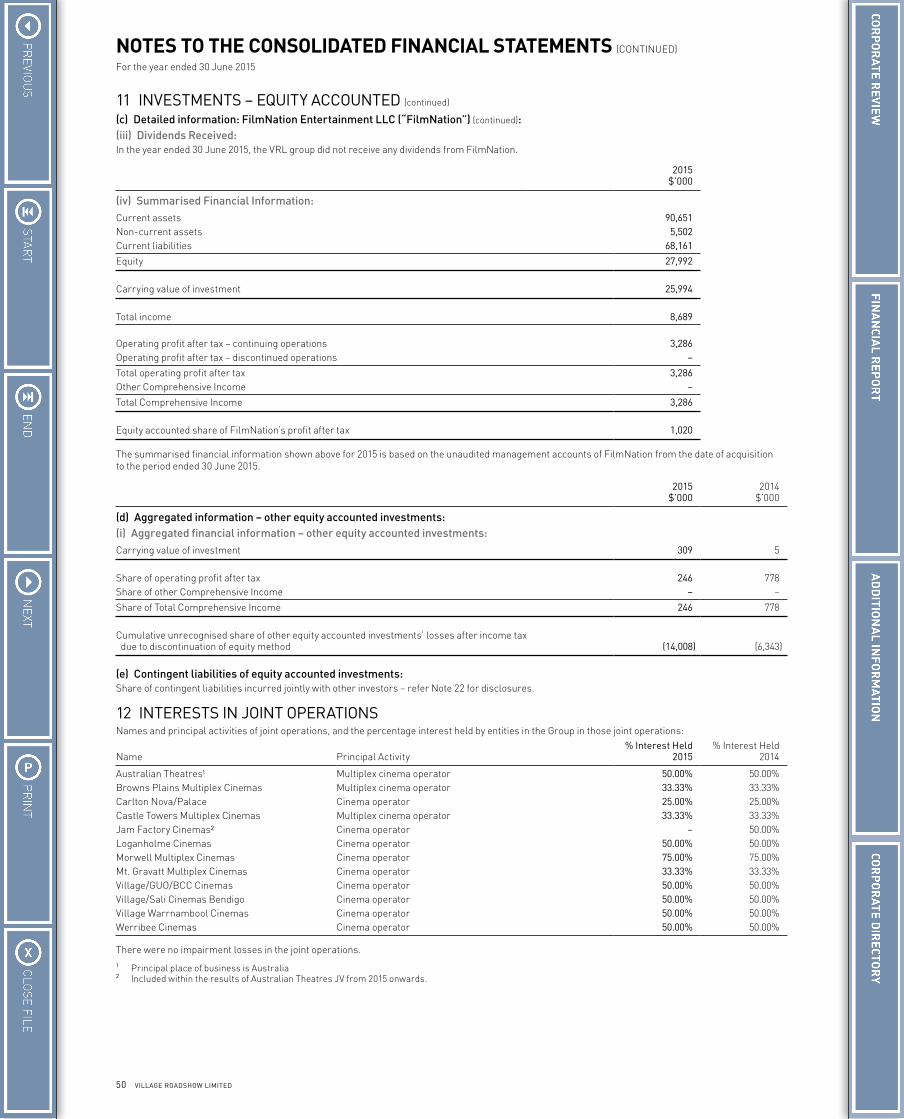
50 VILLAGE ROADSHOW LIMITED
NOTES TO THE CONSOLIDATED FINANCIAL STATEMENTS (CONTINUED)
For the year ended 30 June 2015
11 INVESTMENTS – EQUITY ACCOUNTED (continued)
(c) Detailed information: FilmNation Entertainment LLC (“FilmNation”) (continued):(iii) Dividends Received:In the year ended 30 June 2015, the VRL group did not receive any dividends from FilmNation.
2015 $’000
(iv) Summarised Financial Information:Current assets 90,651Non-current assets 5,502Current liabilities 68,161
Equity 27,992
Carrying value of investment 25,994
Total income 8,689
Operating profit after tax – continuing operations 3,286Operating profit after tax – discontinued operations –
Total operating profit after tax 3,286Other Comprehensive Income –
Total Comprehensive Income 3,286
Equity accounted share of FilmNation’s profit after tax 1,020
The summarised financial information shown above for 2015 is based on the unaudited management accounts of FilmNation from the date of acquisition to the period ended 30 June 2015.
2015 $’000
2014 $’000
(d) Aggregated information – other equity accounted investments:(i) Aggregated financial information – other equity accounted investments:Carrying value of investment 309 5
Share of operating profit after tax 246 778Share of other Comprehensive Income – –
Share of Total Comprehensive Income 246 778
Cumulative unrecognised share of other equity accounted investments’ losses after income tax due to discontinuation of equity method (14,008) (6,343)
(e) Contingent liabilities of equity accounted investments:Share of contingent liabilities incurred jointly with other investors – refer Note 22 for disclosures.
12 INTERESTS IN JOINT OPERATIONSNames and principal activities of joint operations, and the percentage interest held by entities in the Group in those joint operations:
Name Principal Activity% Interest Held
2015% Interest Held
2014
Australian Theatres¹ Multiplex cinema operator 50.00% 50.00%Browns Plains Multiplex Cinemas Multiplex cinema operator 33.33% 33.33%Carlton Nova/Palace Cinema operator 25.00% 25.00%Castle Towers Multiplex Cinemas Multiplex cinema operator 33.33% 33.33%Jam Factory Cinemas² Cinema operator – 50.00%Loganholme Cinemas Cinema operator 50.00% 50.00%Morwell Multiplex Cinemas Cinema operator 75.00% 75.00%Mt. Gravatt Multiplex Cinemas Cinema operator 33.33% 33.33%Village/GUO/BCC Cinemas Cinema operator 50.00% 50.00%Village/Sali Cinemas Bendigo Cinema operator 50.00% 50.00%Village Warrnambool Cinemas Cinema operator 50.00% 50.00%Werribee Cinemas Cinema operator 50.00% 50.00%
There were no impairment losses in the joint operations.1 Principal place of business is Australia2 Included within the results of Australian Theatres JV from 2015 onwards.
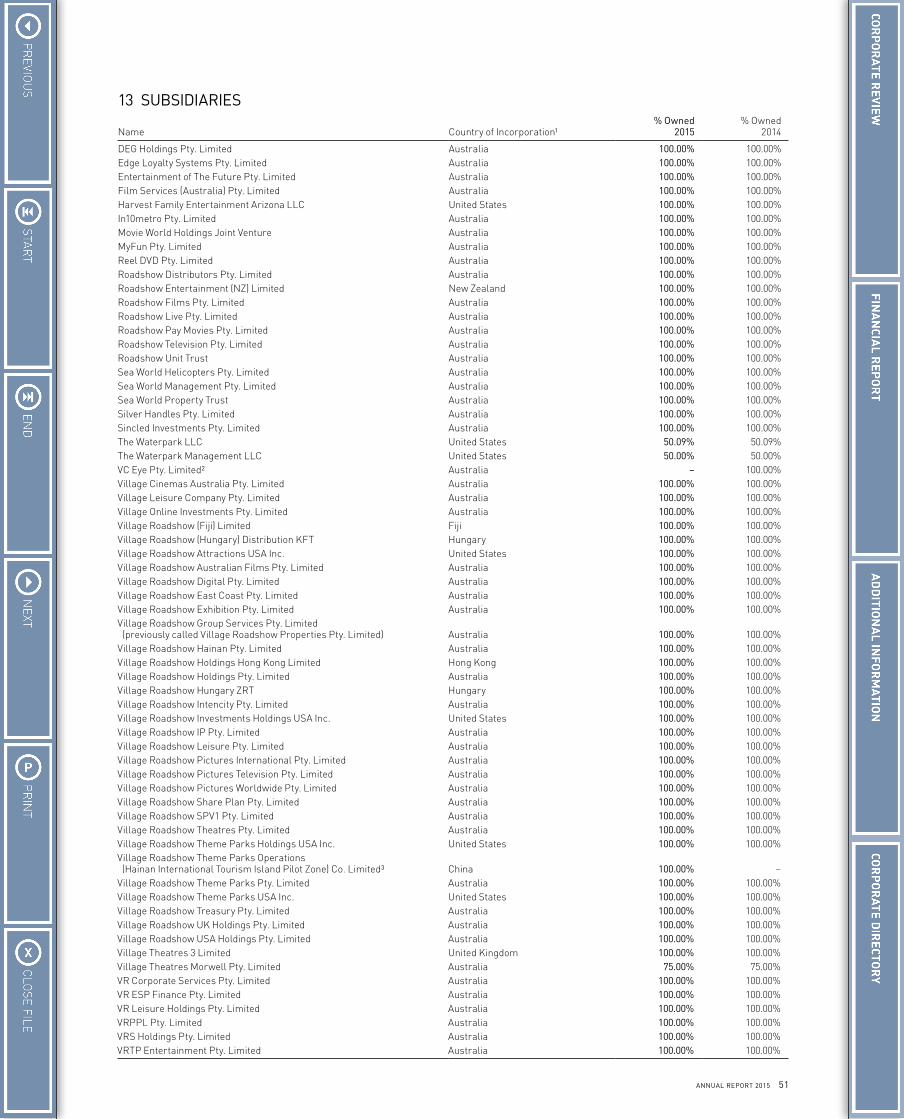
51ANNUAL REPORT 2015
13 SUBSIDIARIES
Name Country of Incorporation¹% Owned
2015% Owned
2014
DEG Holdings Pty. Limited Australia 100.00% 100.00%Edge Loyalty Systems Pty. Limited Australia 100.00% 100.00%Entertainment of The Future Pty. Limited Australia 100.00% 100.00%Film Services (Australia) Pty. Limited Australia 100.00% 100.00%Harvest Family Entertainment Arizona LLC United States 100.00% 100.00%In10metro Pty. Limited Australia 100.00% 100.00%Movie World Holdings Joint Venture Australia 100.00% 100.00%MyFun Pty. Limited Australia 100.00% 100.00%Reel DVD Pty. Limited Australia 100.00% 100.00%Roadshow Distributors Pty. Limited Australia 100.00% 100.00%Roadshow Entertainment (NZ) Limited New Zealand 100.00% 100.00%Roadshow Films Pty. Limited Australia 100.00% 100.00%Roadshow Live Pty. Limited Australia 100.00% 100.00%Roadshow Pay Movies Pty. Limited Australia 100.00% 100.00%Roadshow Television Pty. Limited Australia 100.00% 100.00%Roadshow Unit Trust Australia 100.00% 100.00%Sea World Helicopters Pty. Limited Australia 100.00% 100.00%Sea World Management Pty. Limited Australia 100.00% 100.00%Sea World Property Trust Australia 100.00% 100.00%Silver Handles Pty. Limited Australia 100.00% 100.00%Sincled Investments Pty. Limited Australia 100.00% 100.00%The Waterpark LLC United States 50.09% 50.09%The Waterpark Management LLC United States 50.00% 50.00%VC Eye Pty. Limited² Australia – 100.00%Village Cinemas Australia Pty. Limited Australia 100.00% 100.00%Village Leisure Company Pty. Limited Australia 100.00% 100.00%Village Online Investments Pty. Limited Australia 100.00% 100.00%Village Roadshow (Fiji) Limited Fiji 100.00% 100.00%Village Roadshow (Hungary) Distribution KFT Hungary 100.00% 100.00%Village Roadshow Attractions USA Inc. United States 100.00% 100.00%Village Roadshow Australian Films Pty. Limited Australia 100.00% 100.00%Village Roadshow Digital Pty. Limited Australia 100.00% 100.00%Village Roadshow East Coast Pty. Limited Australia 100.00% 100.00%Village Roadshow Exhibition Pty. Limited Australia 100.00% 100.00%Village Roadshow Group Services Pty. Limited (previously called Village Roadshow Properties Pty. Limited) Australia 100.00% 100.00%Village Roadshow Hainan Pty. Limited Australia 100.00% 100.00%Village Roadshow Holdings Hong Kong Limited Hong Kong 100.00% 100.00%Village Roadshow Holdings Pty. Limited Australia 100.00% 100.00%Village Roadshow Hungary ZRT Hungary 100.00% 100.00%Village Roadshow Intencity Pty. Limited Australia 100.00% 100.00%Village Roadshow Investments Holdings USA Inc. United States 100.00% 100.00%Village Roadshow IP Pty. Limited Australia 100.00% 100.00%Village Roadshow Leisure Pty. Limited Australia 100.00% 100.00%Village Roadshow Pictures International Pty. Limited Australia 100.00% 100.00%Village Roadshow Pictures Television Pty. Limited Australia 100.00% 100.00%Village Roadshow Pictures Worldwide Pty. Limited Australia 100.00% 100.00%Village Roadshow Share Plan Pty. Limited Australia 100.00% 100.00%Village Roadshow SPV1 Pty. Limited Australia 100.00% 100.00%Village Roadshow Theatres Pty. Limited Australia 100.00% 100.00%Village Roadshow Theme Parks Holdings USA Inc. United States 100.00% 100.00%Village Roadshow Theme Parks Operations (Hainan International Tourism Island Pilot Zone) Co. Limited³ China 100.00% –Village Roadshow Theme Parks Pty. Limited Australia 100.00% 100.00%Village Roadshow Theme Parks USA Inc. United States 100.00% 100.00%Village Roadshow Treasury Pty. Limited Australia 100.00% 100.00%Village Roadshow UK Holdings Pty. Limited Australia 100.00% 100.00%Village Roadshow USA Holdings Pty. Limited Australia 100.00% 100.00%Village Theatres 3 Limited United Kingdom 100.00% 100.00%Village Theatres Morwell Pty. Limited Australia 75.00% 75.00%VR Corporate Services Pty. Limited Australia 100.00% 100.00%VR ESP Finance Pty. Limited Australia 100.00% 100.00%VR Leisure Holdings Pty. Limited Australia 100.00% 100.00%VRPPL Pty. Limited Australia 100.00% 100.00%VRS Holdings Pty. Limited Australia 100.00% 100.00%VRTP Entertainment Pty. Limited Australia 100.00% 100.00%
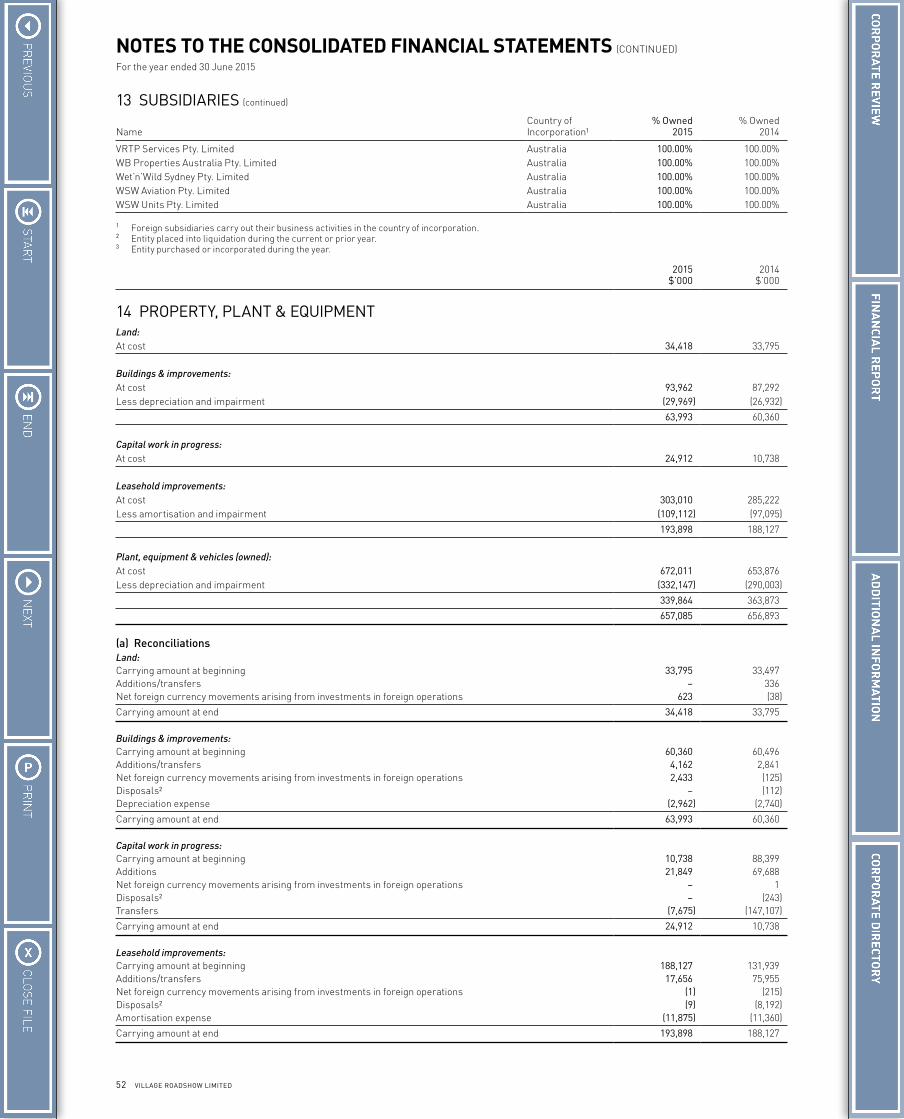
52 VILLAGE ROADSHOW LIMITED
NOTES TO THE CONSOLIDATED FINANCIAL STATEMENTS (CONTINUED)
For the year ended 30 June 2015
13 SUBSIDIARIES (continued)
NameCountry of Incorporation¹
% Owned 2015
% Owned 2014
VRTP Services Pty. Limited Australia 100.00% 100.00%WB Properties Australia Pty. Limited Australia 100.00% 100.00%Wet’n’Wild Sydney Pty. Limited Australia 100.00% 100.00%WSW Aviation Pty. Limited Australia 100.00% 100.00%WSW Units Pty. Limited Australia 100.00% 100.00%
1 Foreign subsidiaries carry out their business activities in the country of incorporation.2 Entity placed into liquidation during the current or prior year.3 Entity purchased or incorporated during the year.
2015 $’000
2014 $’000
14 PROPERTY, PLANT & EQUIPMENTLand:At cost 34,418 33,795
Buildings & improvements:At cost 93,962 87,292Less depreciation and impairment (29,969) (26,932)
63,993 60,360
Capital work in progress:At cost 24,912 10,738
Leasehold improvements:At cost 303,010 285,222Less amortisation and impairment (109,112) (97,095)
193,898 188,127
Plant, equipment & vehicles (owned):At cost 672,011 653,876Less depreciation and impairment (332,147) (290,003)
339,864 363,873
657,085 656,893
(a) ReconciliationsLand:Carrying amount at beginning 33,795 33,497Additions/transfers – 336Net foreign currency movements arising from investments in foreign operations 623 (38)
Carrying amount at end 34,418 33,795 Buildings & improvements:Carrying amount at beginning 60,360 60,496Additions/transfers 4,162 2,841Net foreign currency movements arising from investments in foreign operations 2,433 (125)Disposals² – (112)Depreciation expense (2,962) (2,740)
Carrying amount at end 63,993 60,360 Capital work in progress:Carrying amount at beginning 10,738 88,399Additions 21,849 69,688Net foreign currency movements arising from investments in foreign operations – 1Disposals² – (243)Transfers (7,675) (147,107)
Carrying amount at end 24,912 10,738 Leasehold improvements:Carrying amount at beginning 188,127 131,939Additions/transfers 17,656 75,955Net foreign currency movements arising from investments in foreign operations (1) (215)Disposals² (9) (8,192)Amortisation expense (11,875) (11,360)
Carrying amount at end 193,898 188,127
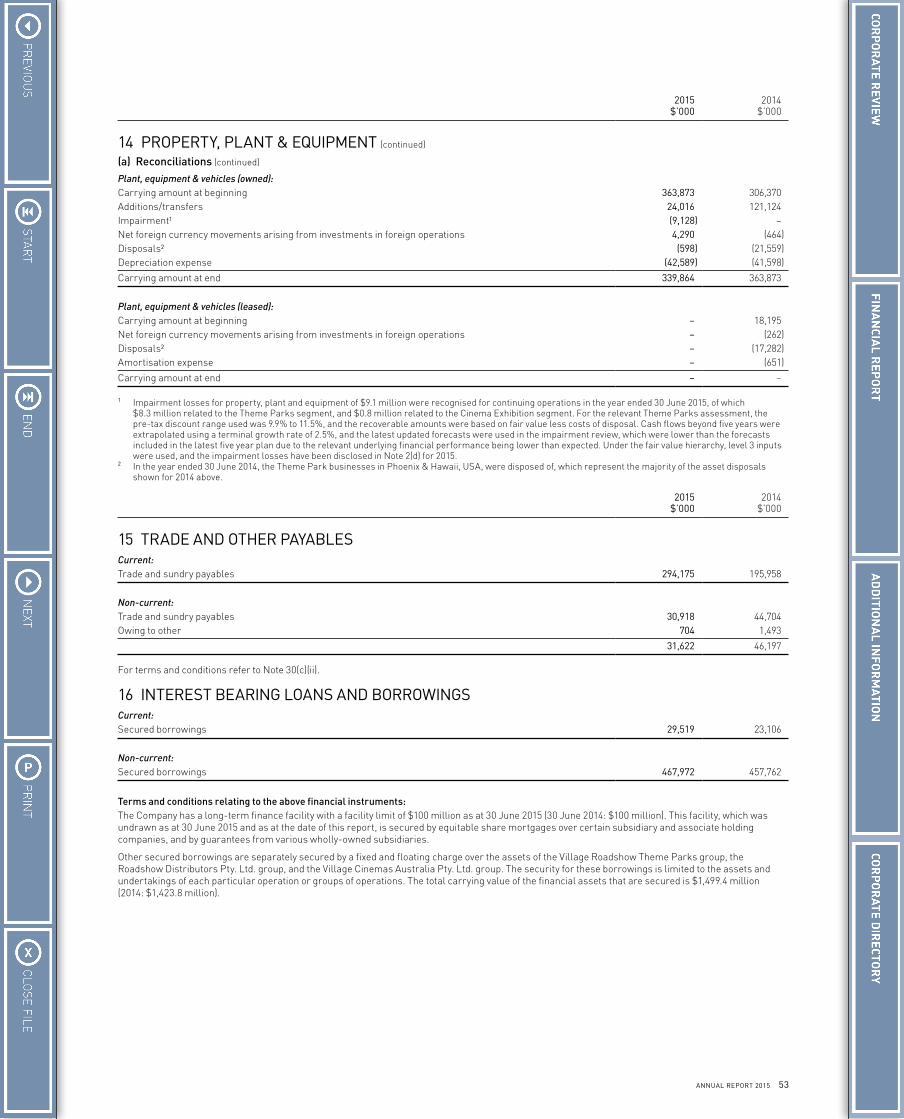
53ANNUAL REPORT 2015
2015 $’000
2014 $’000
14 PROPERTY, PLANT & EQUIPMENT (continued)
(a) Reconciliations (continued)
Plant, equipment & vehicles (owned):Carrying amount at beginning 363,873 306,370Additions/transfers 24,016 121,124Impairment¹ (9,128) –Net foreign currency movements arising from investments in foreign operations 4,290 (464)Disposals² (598) (21,559)Depreciation expense (42,589) (41,598)
Carrying amount at end 339,864 363,873
Plant, equipment & vehicles (leased):Carrying amount at beginning – 18,195Net foreign currency movements arising from investments in foreign operations – (262)Disposals² – (17,282)Amortisation expense – (651)
Carrying amount at end – –
1 Impairment losses for property, plant and equipment of $9.1 million were recognised for continuing operations in the year ended 30 June 2015, of which $8.3 million related to the Theme Parks segment, and $0.8 million related to the Cinema Exhibition segment. For the relevant Theme Parks assessment, the pre-tax discount range used was 9.9% to 11.5%, and the recoverable amounts were based on fair value less costs of disposal. Cash flows beyond five years were extrapolated using a terminal growth rate of 2.5%, and the latest updated forecasts were used in the impairment review, which were lower than the forecasts included in the latest five year plan due to the relevant underlying financial performance being lower than expected. Under the fair value hierarchy, level 3 inputs were used, and the impairment losses have been disclosed in Note 2(d) for 2015.
2 In the year ended 30 June 2014, the Theme Park businesses in Phoenix & Hawaii, USA, were disposed of, which represent the majority of the asset disposals shown for 2014 above.
2015 $’000
2014 $’000
15 TRADE AND OTHER PAYABLESCurrent:Trade and sundry payables 294,175 195,958
Non-current:Trade and sundry payables 30,918 44,704Owing to other 704 1,493
31,622 46,197
For terms and conditions refer to Note 30(c)(ii).
16 INTEREST BEARING LOANS AND BORROWINGSCurrent:Secured borrowings 29,519 23,106
Non-current:Secured borrowings 467,972 457,762
Terms and conditions relating to the above financial instruments:The Company has a long-term finance facility with a facility limit of $100 million as at 30 June 2015 (30 June 2014: $100 million). This facility, which was undrawn as at 30 June 2015 and as at the date of this report, is secured by equitable share mortgages over certain subsidiary and associate holding companies, and by guarantees from various wholly-owned subsidiaries.
Other secured borrowings are separately secured by a fixed and floating charge over the assets of the Village Roadshow Theme Parks group, the Roadshow Distributors Pty. Ltd. group, and the Village Cinemas Australia Pty. Ltd. group. The security for these borrowings is limited to the assets and undertakings of each particular operation or groups of operations. The total carrying value of the financial assets that are secured is $1,499.4 million (2014: $1,423.8 million).
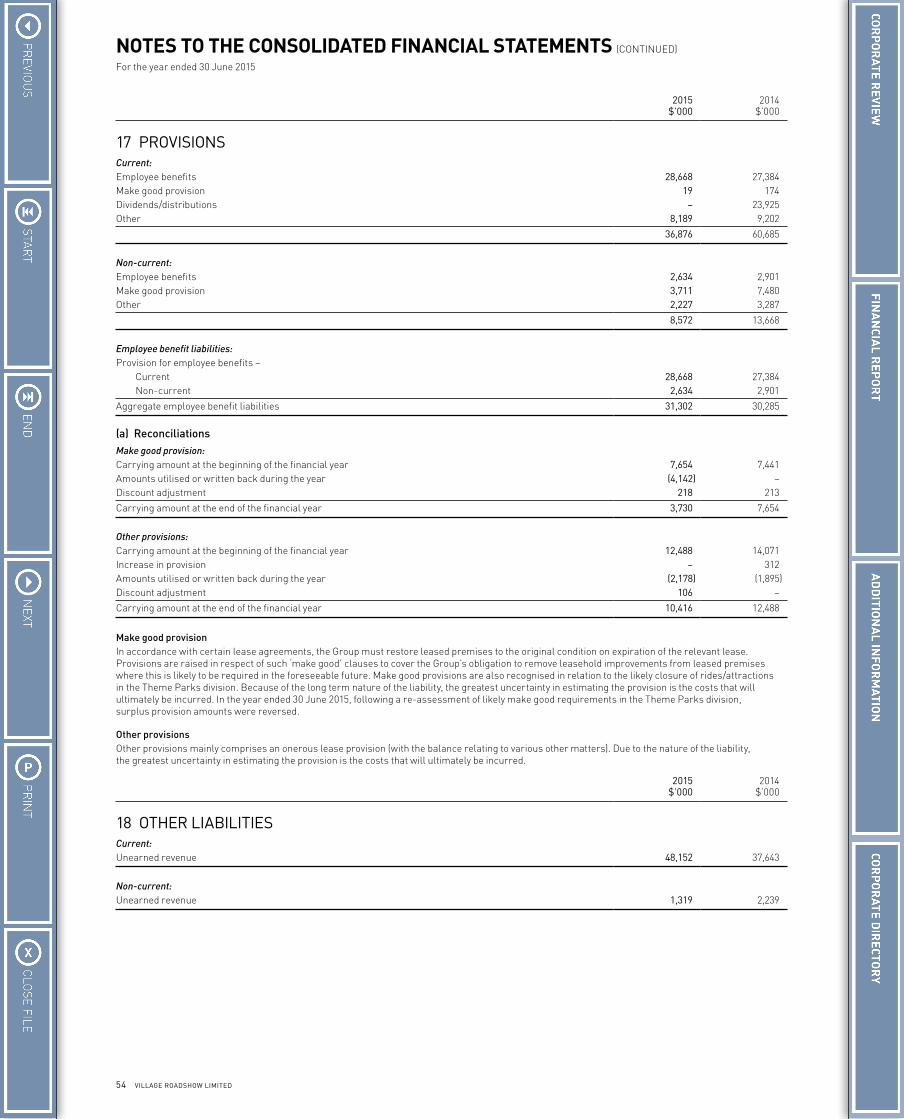
54 VILLAGE ROADSHOW LIMITED
NOTES TO THE CONSOLIDATED FINANCIAL STATEMENTS (CONTINUED)
For the year ended 30 June 2015
2015 $’000
2014 $’000
17 PROVISIONSCurrent:Employee benefits 28,668 27,384Make good provision 19 174Dividends/distributions – 23,925Other 8,189 9,202
36,876 60,685
Non-current:Employee benefits 2,634 2,901Make good provision 3,711 7,480Other 2,227 3,287
8,572 13,668
Employee benefit liabilities:Provision for employee benefits – Current 28,668 27,384 Non-current 2,634 2,901
Aggregate employee benefit liabilities 31,302 30,285
(a) ReconciliationsMake good provision:Carrying amount at the beginning of the financial year 7,654 7,441Amounts utilised or written back during the year (4,142) –Discount adjustment 218 213
Carrying amount at the end of the financial year 3,730 7,654
Other provisions:Carrying amount at the beginning of the financial year 12,488 14,071Increase in provision – 312Amounts utilised or written back during the year (2,178) (1,895)Discount adjustment 106 –
Carrying amount at the end of the financial year 10,416 12,488
Make good provisionIn accordance with certain lease agreements, the Group must restore leased premises to the original condition on expiration of the relevant lease. Provisions are raised in respect of such ‘make good’ clauses to cover the Group’s obligation to remove leasehold improvements from leased premises where this is likely to be required in the foreseeable future. Make good provisions are also recognised in relation to the likely closure of rides/attractions in the Theme Parks division. Because of the long term nature of the liability, the greatest uncertainty in estimating the provision is the costs that will ultimately be incurred. In the year ended 30 June 2015, following a re-assessment of likely make good requirements in the Theme Parks division, surplus provision amounts were reversed.
Other provisionsOther provisions mainly comprises an onerous lease provision (with the balance relating to various other matters). Due to the nature of the liability, the greatest uncertainty in estimating the provision is the costs that will ultimately be incurred.
2015 $’000
2014 $’000
18 OTHER LIABILITIESCurrent:Unearned revenue 48,152 37,643
Non-current:Unearned revenue 1,319 2,239
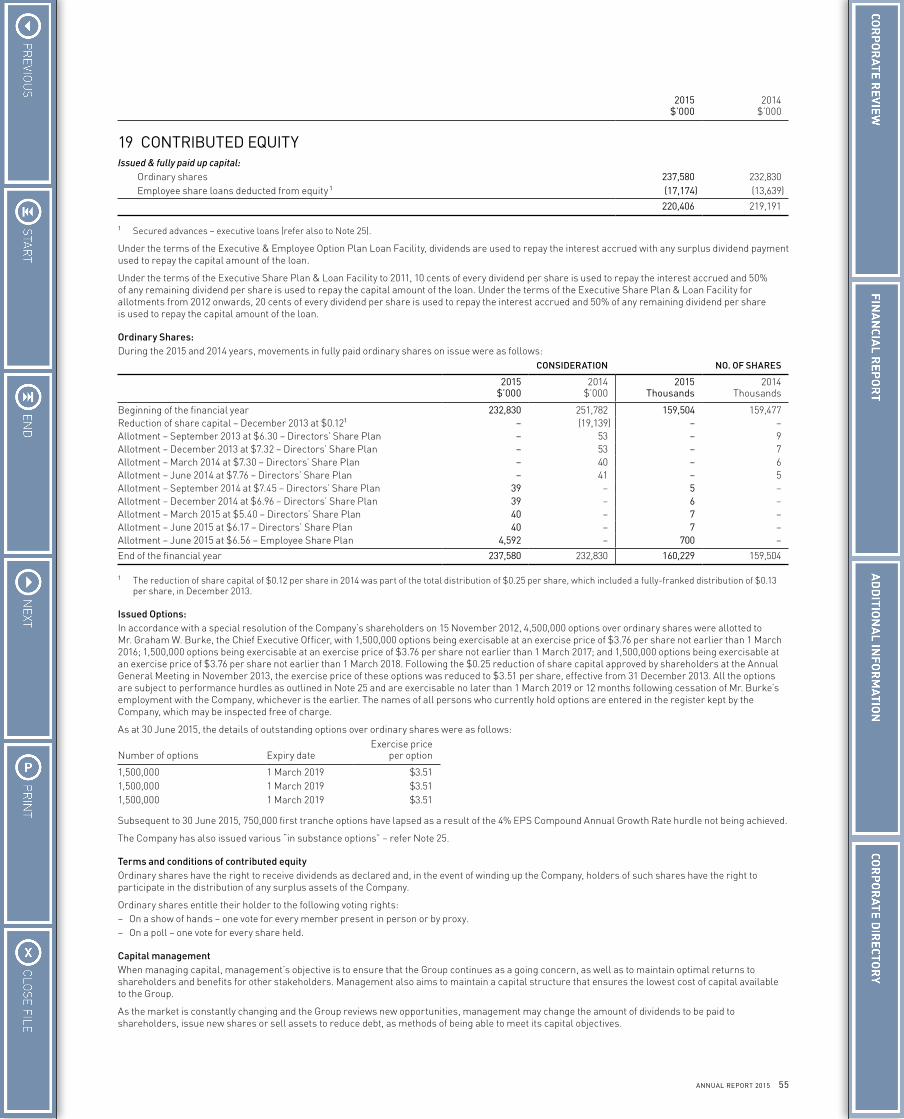
55ANNUAL REPORT 2015
2015 $’000
2014 $’000
19 CONTRIBUTED EQUITYIssued & fully paid up capital: Ordinary shares 237,580 232,830 Employee share loans deducted from equity 1 (17,174) (13,639)
220,406 219,191
1 Secured advances – executive loans (refer also to Note 25).
Under the terms of the Executive & Employee Option Plan Loan Facility, dividends are used to repay the interest accrued with any surplus dividend payment used to repay the capital amount of the loan.
Under the terms of the Executive Share Plan & Loan Facility to 2011, 10 cents of every dividend per share is used to repay the interest accrued and 50% of any remaining dividend per share is used to repay the capital amount of the loan. Under the terms of the Executive Share Plan & Loan Facility for allotments from 2012 onwards, 20 cents of every dividend per share is used to repay the interest accrued and 50% of any remaining dividend per share is used to repay the capital amount of the loan.
Ordinary Shares:During the 2015 and 2014 years, movements in fully paid ordinary shares on issue were as follows:
CONSIDERATION NO. OF SHARES
2015 $’000
2014 $’000
2015 Thousands
2014 Thousands
Beginning of the financial year 232,830 251,782 159,504 159,477Reduction of share capital – December 2013 at $0.121 – (19,139) – –Allotment – September 2013 at $6.30 – Directors’ Share Plan – 53 – 9Allotment – December 2013 at $7.32 – Directors’ Share Plan – 53 – 7Allotment – March 2014 at $7.30 – Directors’ Share Plan – 40 – 6Allotment – June 2014 at $7.76 – Directors’ Share Plan – 41 – 5Allotment – September 2014 at $7.45 – Directors’ Share Plan 39 – 5 –Allotment – December 2014 at $6.96 – Directors’ Share Plan 39 – 6 –Allotment – March 2015 at $5.40 – Directors’ Share Plan 40 – 7 –Allotment – June 2015 at $6.17 – Directors’ Share Plan 40 – 7 –Allotment – June 2015 at $6.56 – Employee Share Plan 4,592 – 700 –
End of the financial year 237,580 232,830 160,229 159,504
1 The reduction of share capital of $0.12 per share in 2014 was part of the total distribution of $0.25 per share, which included a fully-franked distribution of $0.13 per share, in December 2013.
Issued Options:In accordance with a special resolution of the Company’s shareholders on 15 November 2012, 4,500,000 options over ordinary shares were allotted to Mr. Graham W. Burke, the Chief Executive Officer, with 1,500,000 options being exercisable at an exercise price of $3.76 per share not earlier than 1 March 2016; 1,500,000 options being exercisable at an exercise price of $3.76 per share not earlier than 1 March 2017; and 1,500,000 options being exercisable at an exercise price of $3.76 per share not earlier than 1 March 2018. Following the $0.25 reduction of share capital approved by shareholders at the Annual General Meeting in November 2013, the exercise price of these options was reduced to $3.51 per share, effective from 31 December 2013. All the options are subject to performance hurdles as outlined in Note 25 and are exercisable no later than 1 March 2019 or 12 months following cessation of Mr. Burke’s employment with the Company, whichever is the earlier. The names of all persons who currently hold options are entered in the register kept by the Company, which may be inspected free of charge.
As at 30 June 2015, the details of outstanding options over ordinary shares were as follows:
Number of options Expiry dateExercise price
per option
1,500,000 1 March 2019 $3.511,500,000 1 March 2019 $3.511,500,000 1 March 2019 $3.51
Subsequent to 30 June 2015, 750,000 first tranche options have lapsed as a result of the 4% EPS Compound Annual Growth Rate hurdle not being achieved.
The Company has also issued various “in substance options” – refer Note 25.
Terms and conditions of contributed equityOrdinary shares have the right to receive dividends as declared and, in the event of winding up the Company, holders of such shares have the right to participate in the distribution of any surplus assets of the Company.
Ordinary shares entitle their holder to the following voting rights:– On a show of hands – one vote for every member present in person or by proxy.– On a poll – one vote for every share held.
Capital managementWhen managing capital, management’s objective is to ensure that the Group continues as a going concern, as well as to maintain optimal returns to shareholders and benefits for other stakeholders. Management also aims to maintain a capital structure that ensures the lowest cost of capital available to the Group.
As the market is constantly changing and the Group reviews new opportunities, management may change the amount of dividends to be paid to shareholders, issue new shares or sell assets to reduce debt, as methods of being able to meet its capital objectives.
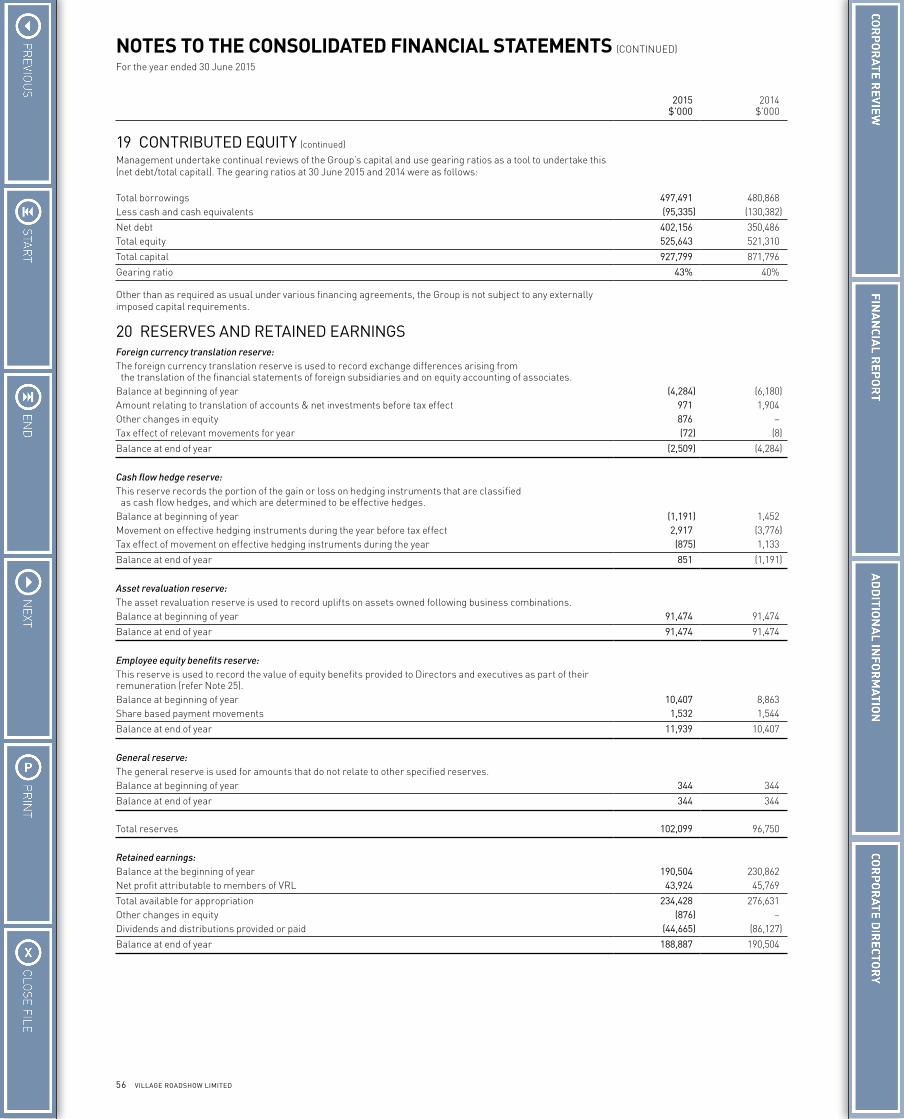
56 VILLAGE ROADSHOW LIMITED
NOTES TO THE CONSOLIDATED FINANCIAL STATEMENTS (CONTINUED)
For the year ended 30 June 2015
2015 $’000
2014 $’000
19 CONTRIBUTED EQUITY (continued)
Management undertake continual reviews of the Group’s capital and use gearing ratios as a tool to undertake this (net debt/total capital). The gearing ratios at 30 June 2015 and 2014 were as follows: Total borrowings 497,491 480,868Less cash and cash equivalents (95,335) (130,382)
Net debt 402,156 350,486Total equity 525,643 521,310
Total capital 927,799 871,796
Gearing ratio 43% 40%
Other than as required as usual under various financing agreements, the Group is not subject to any externally imposed capital requirements.
20 RESERVES AND RETAINED EARNINGSForeign currency translation reserve:The foreign currency translation reserve is used to record exchange differences arising from the translation of the financial statements of foreign subsidiaries and on equity accounting of associates.Balance at beginning of year (4,284) (6,180)Amount relating to translation of accounts & net investments before tax effect 971 1,904Other changes in equity 876 –Tax effect of relevant movements for year (72) (8)
Balance at end of year (2,509) (4,284)
Cash flow hedge reserve:This reserve records the portion of the gain or loss on hedging instruments that are classified as cash flow hedges, and which are determined to be effective hedges.Balance at beginning of year (1,191) 1,452Movement on effective hedging instruments during the year before tax effect 2,917 (3,776)Tax effect of movement on effective hedging instruments during the year (875) 1,133
Balance at end of year 851 (1,191)
Asset revaluation reserve:The asset revaluation reserve is used to record uplifts on assets owned following business combinations.Balance at beginning of year 91,474 91,474
Balance at end of year 91,474 91,474
Employee equity benefits reserve:This reserve is used to record the value of equity benefits provided to Directors and executives as part of their remuneration (refer Note 25).Balance at beginning of year 10,407 8,863Share based payment movements 1,532 1,544
Balance at end of year 11,939 10,407
General reserve:The general reserve is used for amounts that do not relate to other specified reserves.Balance at beginning of year 344 344
Balance at end of year 344 344
Total reserves 102,099 96,750
Retained earnings:Balance at the beginning of year 190,504 230,862Net profit attributable to members of VRL 43,924 45,769
Total available for appropriation 234,428 276,631Other changes in equity (876) –Dividends and distributions provided or paid (44,665) (86,127)
Balance at end of year 188,887 190,504
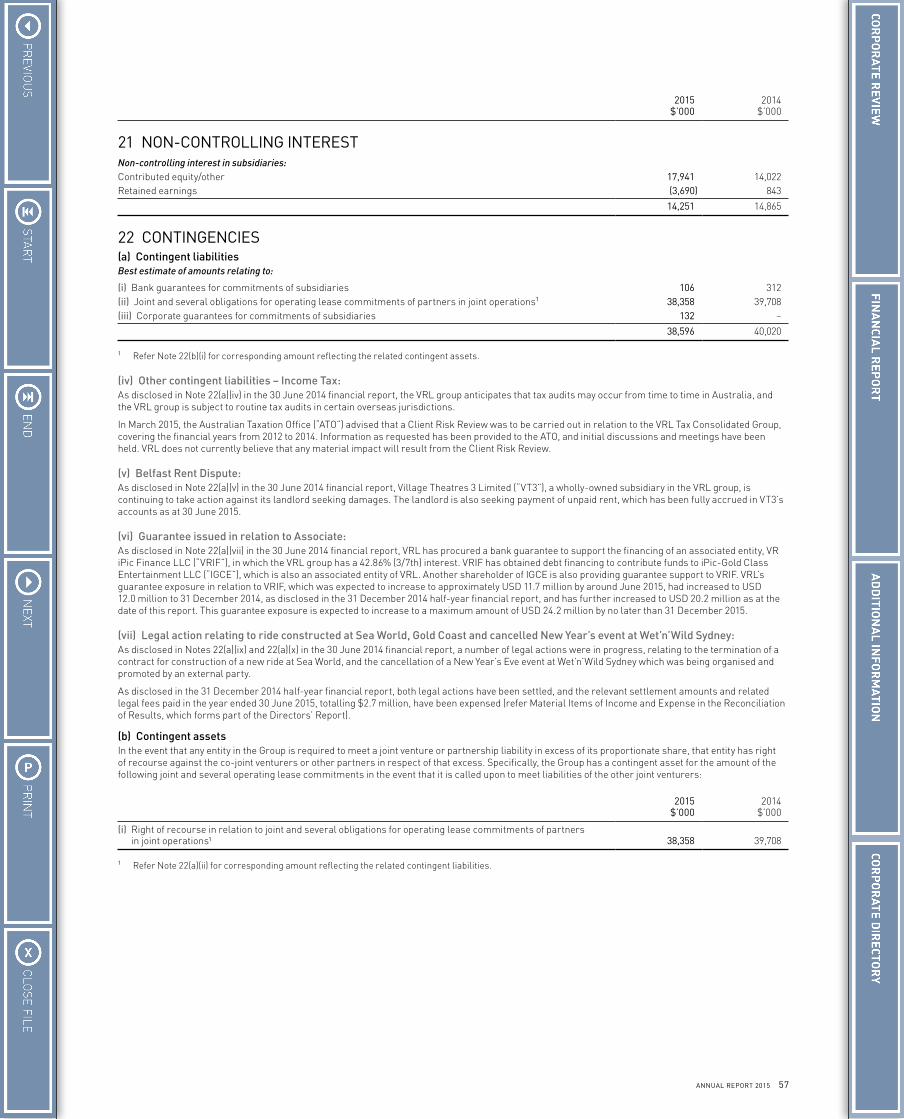
57ANNUAL REPORT 2015
2015 $’000
2014 $’000
21 NON-CONTROLLING INTERESTNon-controlling interest in subsidiaries:Contributed equity/other 17,941 14,022Retained earnings (3,690) 843
14,251 14,865
22 CONTINGENCIES(a) Contingent liabilitiesBest estimate of amounts relating to:
(i) Bank guarantees for commitments of subsidiaries 106 312(ii) Joint and several obligations for operating lease commitments of partners in joint operations1 38,358 39,708(iii) Corporate guarantees for commitments of subsidiaries 132 –
38,596 40,020
1 Refer Note 22(b)(i) for corresponding amount reflecting the related contingent assets.
(iv) Other contingent liabilities – Income Tax:As disclosed in Note 22(a)(iv) in the 30 June 2014 financial report, the VRL group anticipates that tax audits may occur from time to time in Australia, and the VRL group is subject to routine tax audits in certain overseas jurisdictions.
In March 2015, the Australian Taxation Office (“ATO”) advised that a Client Risk Review was to be carried out in relation to the VRL Tax Consolidated Group, covering the financial years from 2012 to 2014. Information as requested has been provided to the ATO, and initial discussions and meetings have been held. VRL does not currently believe that any material impact will result from the Client Risk Review.
(v) Belfast Rent Dispute:As disclosed in Note 22(a)(v) in the 30 June 2014 financial report, Village Theatres 3 Limited (“VT3”), a wholly-owned subsidiary in the VRL group, is continuing to take action against its landlord seeking damages. The landlord is also seeking payment of unpaid rent, which has been fully accrued in VT3’s accounts as at 30 June 2015.
(vi) Guarantee issued in relation to Associate:As disclosed in Note 22(a)(vii) in the 30 June 2014 financial report, VRL has procured a bank guarantee to support the financing of an associated entity, VR iPic Finance LLC (“VRIF”), in which the VRL group has a 42.86% (3/7th) interest. VRIF has obtained debt financing to contribute funds to iPic-Gold Class Entertainment LLC (“IGCE”), which is also an associated entity of VRL. Another shareholder of IGCE is also providing guarantee support to VRIF. VRL’s guarantee exposure in relation to VRIF, which was expected to increase to approximately USD 11.7 million by around June 2015, had increased to USD 12.0 million to 31 December 2014, as disclosed in the 31 December 2014 half-year financial report, and has further increased to USD 20.2 million as at the date of this report. This guarantee exposure is expected to increase to a maximum amount of USD 24.2 million by no later than 31 December 2015.
(vii) Legal action relating to ride constructed at Sea World, Gold Coast and cancelled New Year’s event at Wet’n’Wild Sydney:As disclosed in Notes 22(a)(ix) and 22(a)(x) in the 30 June 2014 financial report, a number of legal actions were in progress, relating to the termination of a contract for construction of a new ride at Sea World, and the cancellation of a New Year’s Eve event at Wet’n’Wild Sydney which was being organised and promoted by an external party.
As disclosed in the 31 December 2014 half-year financial report, both legal actions have been settled, and the relevant settlement amounts and related legal fees paid in the year ended 30 June 2015, totalling $2.7 million, have been expensed (refer Material Items of Income and Expense in the Reconciliation of Results, which forms part of the Directors’ Report).
(b) Contingent assetsIn the event that any entity in the Group is required to meet a joint venture or partnership liability in excess of its proportionate share, that entity has right of recourse against the co-joint venturers or other partners in respect of that excess. Specifically, the Group has a contingent asset for the amount of the following joint and several operating lease commitments in the event that it is called upon to meet liabilities of the other joint venturers:
2015 $’000
2014 $’000
(i) Right of recourse in relation to joint and several obligations for operating lease commitments of partners in joint operations¹ 38,358 39,708
1 Refer Note 22(a)(ii) for corresponding amount reflecting the related contingent liabilities.
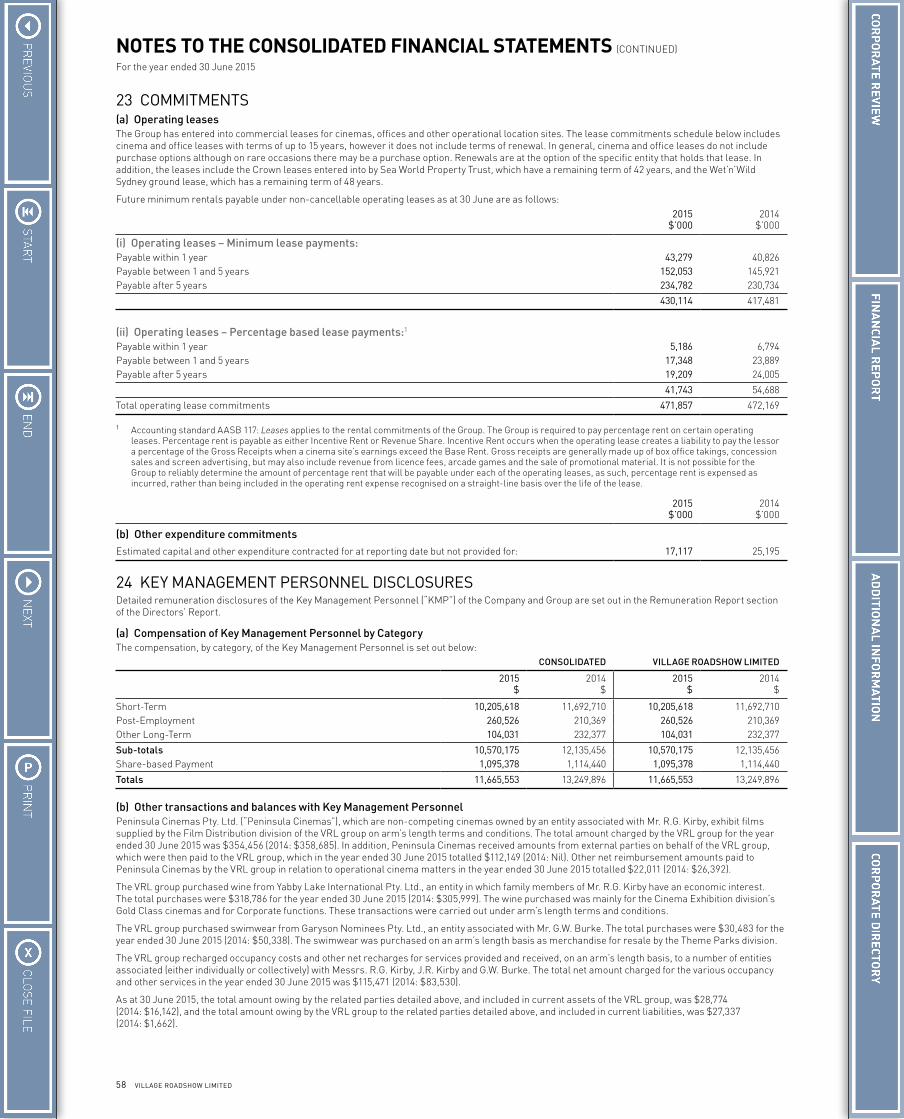
58 VILLAGE ROADSHOW LIMITED
NOTES TO THE CONSOLIDATED FINANCIAL STATEMENTS (CONTINUED)
For the year ended 30 June 2015
23 COMMITMENTS(a) Operating leasesThe Group has entered into commercial leases for cinemas, offices and other operational location sites. The lease commitments schedule below includes cinema and office leases with terms of up to 15 years, however it does not include terms of renewal. In general, cinema and office leases do not include purchase options although on rare occasions there may be a purchase option. Renewals are at the option of the specific entity that holds that lease. In addition, the leases include the Crown leases entered into by Sea World Property Trust, which have a remaining term of 42 years, and the Wet’n’Wild Sydney ground lease, which has a remaining term of 48 years.
Future minimum rentals payable under non-cancellable operating leases as at 30 June are as follows:2015
$’0002014
$’000
(i) Operating leases – Minimum lease payments:Payable within 1 year 43,279 40,826Payable between 1 and 5 years 152,053 145,921Payable after 5 years 234,782 230,734
430,114 417,481
(ii) Operating leases – Percentage based lease payments:1
Payable within 1 year 5,186 6,794Payable between 1 and 5 years 17,348 23,889Payable after 5 years 19,209 24,005
41,743 54,688
Total operating lease commitments 471,857 472,169
1 Accounting standard AASB 117: Leases applies to the rental commitments of the Group. The Group is required to pay percentage rent on certain operating leases. Percentage rent is payable as either Incentive Rent or Revenue Share. Incentive Rent occurs when the operating lease creates a liability to pay the lessor a percentage of the Gross Receipts when a cinema site’s earnings exceed the Base Rent. Gross receipts are generally made up of box office takings, concession sales and screen advertising, but may also include revenue from licence fees, arcade games and the sale of promotional material. It is not possible for the Group to reliably determine the amount of percentage rent that will be payable under each of the operating leases, as such, percentage rent is expensed as incurred, rather than being included in the operating rent expense recognised on a straight-line basis over the life of the lease.
2015 $’000
2014 $’000
(b) Other expenditure commitmentsEstimated capital and other expenditure contracted for at reporting date but not provided for: 17,117 25,195
24 KEY MANAGEMENT PERSONNEL DISCLOSURESDetailed remuneration disclosures of the Key Management Personnel (“KMP”) of the Company and Group are set out in the Remuneration Report section of the Directors’ Report.
(a) Compensation of Key Management Personnel by CategoryThe compensation, by category, of the Key Management Personnel is set out below:
CONSOLIDATED VILLAGE ROADSHOW LIMITED
2015 $
2014 $
2015 $
2014 $
Short-Term 10,205,618 11,692,710 10,205,618 11,692,710Post-Employment 260,526 210,369 260,526 210,369Other Long-Term 104,031 232,377 104,031 232,377
Sub-totals 10,570,175 12,135,456 10,570,175 12,135,456Share-based Payment 1,095,378 1,114,440 1,095,378 1,114,440
Totals 11,665,553 13,249,896 11,665,553 13,249,896
(b) Other transactions and balances with Key Management PersonnelPeninsula Cinemas Pty. Ltd. (“Peninsula Cinemas”), which are non-competing cinemas owned by an entity associated with Mr. R.G. Kirby, exhibit films supplied by the Film Distribution division of the VRL group on arm’s length terms and conditions. The total amount charged by the VRL group for the year ended 30 June 2015 was $354,456 (2014: $358,685). In addition, Peninsula Cinemas received amounts from external parties on behalf of the VRL group, which were then paid to the VRL group, which in the year ended 30 June 2015 totalled $112,149 (2014: Nil). Other net reimbursement amounts paid to Peninsula Cinemas by the VRL group in relation to operational cinema matters in the year ended 30 June 2015 totalled $22,011 (2014: $26,392).
The VRL group purchased wine from Yabby Lake International Pty. Ltd., an entity in which family members of Mr. R.G. Kirby have an economic interest. The total purchases were $318,786 for the year ended 30 June 2015 (2014: $305,999). The wine purchased was mainly for the Cinema Exhibition division’s Gold Class cinemas and for Corporate functions. These transactions were carried out under arm’s length terms and conditions.
The VRL group purchased swimwear from Garyson Nominees Pty. Ltd., an entity associated with Mr. G.W. Burke. The total purchases were $30,483 for the year ended 30 June 2015 (2014: $50,338). The swimwear was purchased on an arm’s length basis as merchandise for resale by the Theme Parks division.
The VRL group recharged occupancy costs and other net recharges for services provided and received, on an arm’s length basis, to a number of entities associated (either individually or collectively) with Messrs. R.G. Kirby, J.R. Kirby and G.W. Burke. The total net amount charged for the various occupancy and other services in the year ended 30 June 2015 was $115,471 (2014: $83,530).
As at 30 June 2015, the total amount owing by the related parties detailed above, and included in current assets of the VRL group, was $28,774 (2014: $16,142), and the total amount owing by the VRL group to the related parties detailed above, and included in current liabilities, was $27,337 (2014: $1,662).
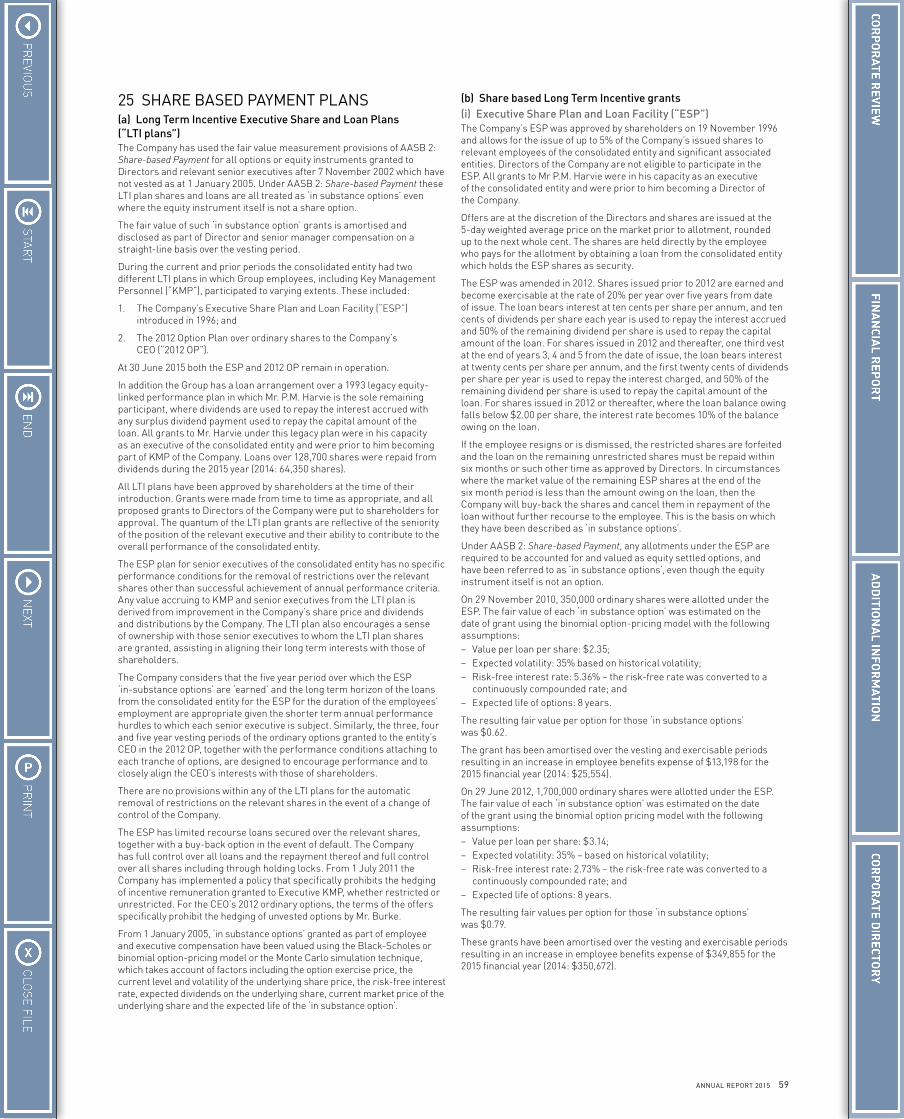
59ANNUAL REPORT 2015
25 SHARE BASED PAYMENT PLANS(a) Long Term Incentive Executive Share and Loan Plans (“LTI plans”)The Company has used the fair value measurement provisions of AASB 2: Share-based Payment for all options or equity instruments granted to Directors and relevant senior executives after 7 November 2002 which have not vested as at 1 January 2005. Under AASB 2: Share-based Payment these LTI plan shares and loans are all treated as ‘in substance options’ even where the equity instrument itself is not a share option.
The fair value of such ‘in substance option’ grants is amortised and disclosed as part of Director and senior manager compensation on a straight-line basis over the vesting period.
During the current and prior periods the consolidated entity had two different LTI plans in which Group employees, including Key Management Personnel (“KMP”), participated to varying extents. These included:
1. The Company’s Executive Share Plan and Loan Facility (“ESP”) introduced in 1996; and
2. The 2012 Option Plan over ordinary shares to the Company’s CEO (“2012 OP”).
At 30 June 2015 both the ESP and 2012 OP remain in operation.
In addition the Group has a loan arrangement over a 1993 legacy equity-linked performance plan in which Mr. P.M. Harvie is the sole remaining participant, where dividends are used to repay the interest accrued with any surplus dividend payment used to repay the capital amount of the loan. All grants to Mr. Harvie under this legacy plan were in his capacity as an executive of the consolidated entity and were prior to him becoming part of KMP of the Company. Loans over 128,700 shares were repaid from dividends during the 2015 year (2014: 64,350 shares).
All LTI plans have been approved by shareholders at the time of their introduction. Grants were made from time to time as appropriate, and all proposed grants to Directors of the Company were put to shareholders for approval. The quantum of the LTI plan grants are reflective of the seniority of the position of the relevant executive and their ability to contribute to the overall performance of the consolidated entity.
The ESP plan for senior executives of the consolidated entity has no specific performance conditions for the removal of restrictions over the relevant shares other than successful achievement of annual performance criteria. Any value accruing to KMP and senior executives from the LTI plan is derived from improvement in the Company’s share price and dividends and distributions by the Company. The LTI plan also encourages a sense of ownership with those senior executives to whom the LTI plan shares are granted, assisting in aligning their long term interests with those of shareholders.
The Company considers that the five year period over which the ESP ‘in-substance options’ are ‘earned’ and the long term horizon of the loans from the consolidated entity for the ESP for the duration of the employees’ employment are appropriate given the shorter term annual performance hurdles to which each senior executive is subject. Similarly, the three, four and five year vesting periods of the ordinary options granted to the entity’s CEO in the 2012 OP, together with the performance conditions attaching to each tranche of options, are designed to encourage performance and to closely align the CEO’s interests with those of shareholders.
There are no provisions within any of the LTI plans for the automatic removal of restrictions on the relevant shares in the event of a change of control of the Company.
The ESP has limited recourse loans secured over the relevant shares, together with a buy-back option in the event of default. The Company has full control over all loans and the repayment thereof and full control over all shares including through holding locks. From 1 July 2011 the Company has implemented a policy that specifically prohibits the hedging of incentive remuneration granted to Executive KMP, whether restricted or unrestricted. For the CEO’s 2012 ordinary options, the terms of the offers specifically prohibit the hedging of unvested options by Mr. Burke.
From 1 January 2005, ‘in substance options’ granted as part of employee and executive compensation have been valued using the Black-Scholes or binomial option-pricing model or the Monte Carlo simulation technique, which takes account of factors including the option exercise price, the current level and volatility of the underlying share price, the risk-free interest rate, expected dividends on the underlying share, current market price of the underlying share and the expected life of the ‘in substance option’.
(b) Share based Long Term Incentive grants(i) Executive Share Plan and Loan Facility (“ESP”)The Company’s ESP was approved by shareholders on 19 November 1996 and allows for the issue of up to 5% of the Company’s issued shares to relevant employees of the consolidated entity and significant associated entities. Directors of the Company are not eligible to participate in the ESP. All grants to Mr P.M. Harvie were in his capacity as an executive of the consolidated entity and were prior to him becoming a Director of the Company.
Offers are at the discretion of the Directors and shares are issued at the 5-day weighted average price on the market prior to allotment, rounded up to the next whole cent. The shares are held directly by the employee who pays for the allotment by obtaining a loan from the consolidated entity which holds the ESP shares as security.
The ESP was amended in 2012. Shares issued prior to 2012 are earned and become exercisable at the rate of 20% per year over five years from date of issue. The loan bears interest at ten cents per share per annum, and ten cents of dividends per share each year is used to repay the interest accrued and 50% of the remaining dividend per share is used to repay the capital amount of the loan. For shares issued in 2012 and thereafter, one third vest at the end of years 3, 4 and 5 from the date of issue, the loan bears interest at twenty cents per share per annum, and the first twenty cents of dividends per share per year is used to repay the interest charged, and 50% of the remaining dividend per share is used to repay the capital amount of the loan. For shares issued in 2012 or thereafter, where the loan balance owing falls below $2.00 per share, the interest rate becomes 10% of the balance owing on the loan.
If the employee resigns or is dismissed, the restricted shares are forfeited and the loan on the remaining unrestricted shares must be repaid within six months or such other time as approved by Directors. In circumstances where the market value of the remaining ESP shares at the end of the six month period is less than the amount owing on the loan, then the Company will buy-back the shares and cancel them in repayment of the loan without further recourse to the employee. This is the basis on which they have been described as ‘in substance options’.
Under AASB 2: Share-based Payment, any allotments under the ESP are required to be accounted for and valued as equity settled options, and have been referred to as ‘in substance options’, even though the equity instrument itself is not an option.
On 29 November 2010, 350,000 ordinary shares were allotted under the ESP. The fair value of each ‘in substance option’ was estimated on the date of grant using the binomial option-pricing model with the following assumptions:– Value per loan per share: $2.35;– Expected volatility: 35% based on historical volatility;– Risk-free interest rate: 5.36% – the risk-free rate was converted to a
continuously compounded rate; and– Expected life of options: 8 years.
The resulting fair value per option for those ‘in substance options’ was $0.62.
The grant has been amortised over the vesting and exercisable periods resulting in an increase in employee benefits expense of $13,198 for the 2015 financial year (2014: $25,554).
On 29 June 2012, 1,700,000 ordinary shares were allotted under the ESP. The fair value of each ‘in substance option’ was estimated on the date of the grant using the binomial option pricing model with the following assumptions:– Value per loan per share: $3.14;– Expected volatility: 35% – based on historical volatility;– Risk-free interest rate: 2.73% – the risk-free rate was converted to a
continuously compounded rate; and– Expected life of options: 8 years.
The resulting fair values per option for those ‘in substance options’ was $0.79.
These grants have been amortised over the vesting and exercisable periods resulting in an increase in employee benefits expense of $349,855 for the 2015 financial year (2014: $350,672).
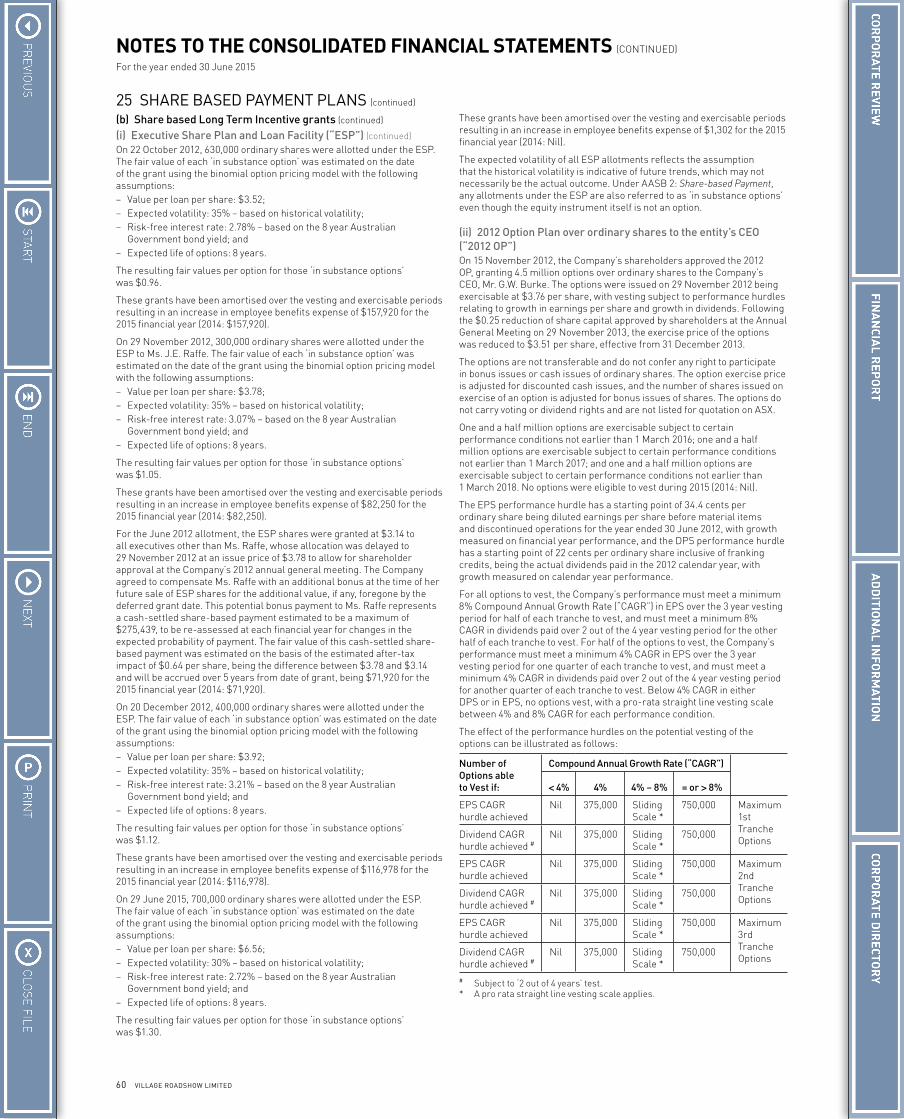
60 VILLAGE ROADSHOW LIMITED
NOTES TO THE CONSOLIDATED FINANCIAL STATEMENTS (CONTINUED)
For the year ended 30 June 2015
25 SHARE BASED PAYMENT PLANS (continued)
(b) Share based Long Term Incentive grants (continued)
(i) Executive Share Plan and Loan Facility (“ESP”) (continued)On 22 October 2012, 630,000 ordinary shares were allotted under the ESP. The fair value of each ‘in substance option’ was estimated on the date of the grant using the binomial option pricing model with the following assumptions:– Value per loan per share: $3.52;– Expected volatility: 35% – based on historical volatility;– Risk-free interest rate: 2.78% – based on the 8 year Australian
Government bond yield; and– Expected life of options: 8 years.
The resulting fair values per option for those ‘in substance options’ was $0.96.
These grants have been amortised over the vesting and exercisable periods resulting in an increase in employee benefits expense of $157,920 for the 2015 financial year (2014: $157,920).
On 29 November 2012, 300,000 ordinary shares were allotted under the ESP to Ms. J.E. Raffe. The fair value of each ‘in substance option’ was estimated on the date of the grant using the binomial option pricing model with the following assumptions:– Value per loan per share: $3.78;– Expected volatility: 35% – based on historical volatility;– Risk-free interest rate: 3.07% – based on the 8 year Australian
Government bond yield; and– Expected life of options: 8 years.
The resulting fair values per option for those ‘in substance options’ was $1.05.
These grants have been amortised over the vesting and exercisable periods resulting in an increase in employee benefits expense of $82,250 for the 2015 financial year (2014: $82,250).
For the June 2012 allotment, the ESP shares were granted at $3.14 to all executives other than Ms. Raffe, whose allocation was delayed to 29 November 2012 at an issue price of $3.78 to allow for shareholder approval at the Company’s 2012 annual general meeting. The Company agreed to compensate Ms. Raffe with an additional bonus at the time of her future sale of ESP shares for the additional value, if any, foregone by the deferred grant date. This potential bonus payment to Ms. Raffe represents a cash-settled share-based payment estimated to be a maximum of $275,439, to be re-assessed at each financial year for changes in the expected probability of payment. The fair value of this cash-settled share-based payment was estimated on the basis of the estimated after-tax impact of $0.64 per share, being the difference between $3.78 and $3.14 and will be accrued over 5 years from date of grant, being $71,920 for the 2015 financial year (2014: $71,920).
On 20 December 2012, 400,000 ordinary shares were allotted under the ESP. The fair value of each ‘in substance option’ was estimated on the date of the grant using the binomial option pricing model with the following assumptions:– Value per loan per share: $3.92;– Expected volatility: 35% – based on historical volatility;– Risk-free interest rate: 3.21% – based on the 8 year Australian
Government bond yield; and– Expected life of options: 8 years.
The resulting fair values per option for those ‘in substance options’ was $1.12.
These grants have been amortised over the vesting and exercisable periods resulting in an increase in employee benefits expense of $116,978 for the 2015 financial year (2014: $116,978).
On 29 June 2015, 700,000 ordinary shares were allotted under the ESP. The fair value of each ‘in substance option’ was estimated on the date of the grant using the binomial option pricing model with the following assumptions:– Value per loan per share: $6.56;– Expected volatility: 30% – based on historical volatility;– Risk-free interest rate: 2.72% – based on the 8 year Australian
Government bond yield; and– Expected life of options: 8 years.
The resulting fair values per option for those ‘in substance options’ was $1.30.
These grants have been amortised over the vesting and exercisable periods resulting in an increase in employee benefits expense of $1,302 for the 2015 financial year (2014: Nil).
The expected volatility of all ESP allotments reflects the assumption that the historical volatility is indicative of future trends, which may not necessarily be the actual outcome. Under AASB 2: Share-based Payment, any allotments under the ESP are also referred to as ‘in substance options’ even though the equity instrument itself is not an option.
(ii) 2012 Option Plan over ordinary shares to the entity’s CEO (“2012 OP”)On 15 November 2012, the Company’s shareholders approved the 2012 OP, granting 4.5 million options over ordinary shares to the Company’s CEO, Mr. G.W. Burke. The options were issued on 29 November 2012 being exercisable at $3.76 per share, with vesting subject to performance hurdles relating to growth in earnings per share and growth in dividends. Following the $0.25 reduction of share capital approved by shareholders at the Annual General Meeting on 29 November 2013, the exercise price of the options was reduced to $3.51 per share, effective from 31 December 2013.
The options are not transferable and do not confer any right to participate in bonus issues or cash issues of ordinary shares. The option exercise price is adjusted for discounted cash issues, and the number of shares issued on exercise of an option is adjusted for bonus issues of shares. The options do not carry voting or dividend rights and are not listed for quotation on ASX.
One and a half million options are exercisable subject to certain performance conditions not earlier than 1 March 2016; one and a half million options are exercisable subject to certain performance conditions not earlier than 1 March 2017; and one and a half million options are exercisable subject to certain performance conditions not earlier than 1 March 2018. No options were eligible to vest during 2015 (2014: Nil).
The EPS performance hurdle has a starting point of 34.4 cents per ordinary share being diluted earnings per share before material items and discontinued operations for the year ended 30 June 2012, with growth measured on financial year performance, and the DPS performance hurdle has a starting point of 22 cents per ordinary share inclusive of franking credits, being the actual dividends paid in the 2012 calendar year, with growth measured on calendar year performance.
For all options to vest, the Company’s performance must meet a minimum 8% Compound Annual Growth Rate (“CAGR”) in EPS over the 3 year vesting period for half of each tranche to vest, and must meet a minimum 8% CAGR in dividends paid over 2 out of the 4 year vesting period for the other half of each tranche to vest. For half of the options to vest, the Company’s performance must meet a minimum 4% CAGR in EPS over the 3 year vesting period for one quarter of each tranche to vest, and must meet a minimum 4% CAGR in dividends paid over 2 out of the 4 year vesting period for another quarter of each tranche to vest. Below 4% CAGR in either DPS or in EPS, no options vest, with a pro-rata straight line vesting scale between 4% and 8% CAGR for each performance condition.
The effect of the performance hurdles on the potential vesting of the options can be illustrated as follows:
Number of Options able to Vest if:
Compound Annual Growth Rate (“CAGR”)
< 4% 4% 4% – 8% = or > 8%
EPS CAGR hurdle achieved
Nil 375,000 Sliding Scale *
750,000 Maximum 1st Tranche Options
Dividend CAGR hurdle achieved #
Nil 375,000 Sliding Scale *
750,000
EPS CAGR hurdle achieved
Nil 375,000 Sliding Scale *
750,000 Maximum 2nd Tranche Options
Dividend CAGR hurdle achieved #
Nil 375,000 Sliding Scale *
750,000
EPS CAGR hurdle achieved
Nil 375,000 Sliding Scale *
750,000 Maximum 3rd Tranche Options
Dividend CAGR hurdle achieved #
Nil 375,000 Sliding Scale *
750,000
# Subject to ‘2 out of 4 years’ test.* A pro rata straight line vesting scale applies.
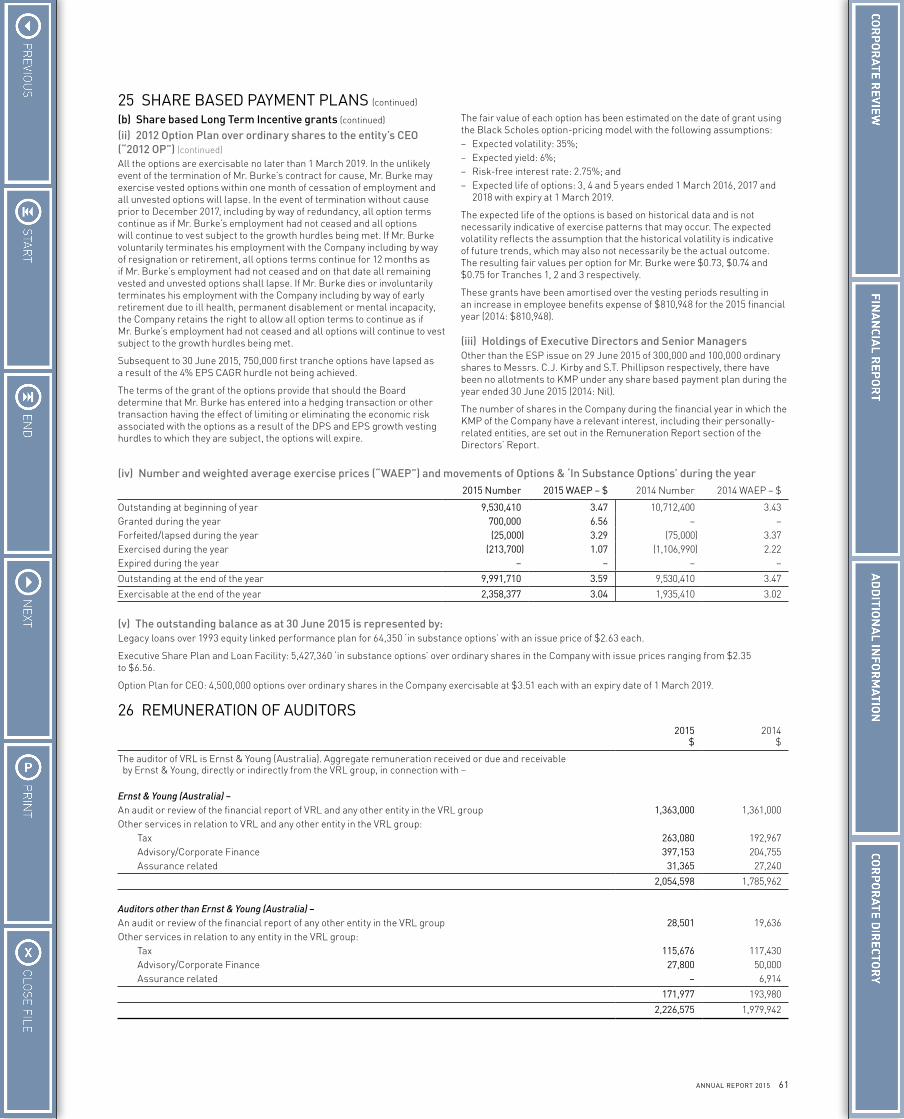
61ANNUAL REPORT 2015
25 SHARE BASED PAYMENT PLANS (continued)
(b) Share based Long Term Incentive grants (continued)
(ii) 2012 Option Plan over ordinary shares to the entity’s CEO (“2012 OP”) (continued)All the options are exercisable no later than 1 March 2019. In the unlikely event of the termination of Mr. Burke’s contract for cause, Mr. Burke may exercise vested options within one month of cessation of employment and all unvested options will lapse. In the event of termination without cause prior to December 2017, including by way of redundancy, all option terms continue as if Mr. Burke’s employment had not ceased and all options will continue to vest subject to the growth hurdles being met. If Mr. Burke voluntarily terminates his employment with the Company including by way of resignation or retirement, all options terms continue for 12 months as if Mr. Burke’s employment had not ceased and on that date all remaining vested and unvested options shall lapse. If Mr. Burke dies or involuntarily terminates his employment with the Company including by way of early retirement due to ill health, permanent disablement or mental incapacity, the Company retains the right to allow all option terms to continue as if Mr. Burke’s employment had not ceased and all options will continue to vest subject to the growth hurdles being met.
Subsequent to 30 June 2015, 750,000 first tranche options have lapsed as a result of the 4% EPS CAGR hurdle not being achieved.
The terms of the grant of the options provide that should the Board determine that Mr. Burke has entered into a hedging transaction or other transaction having the effect of limiting or eliminating the economic risk associated with the options as a result of the DPS and EPS growth vesting hurdles to which they are subject, the options will expire.
The fair value of each option has been estimated on the date of grant using the Black Scholes option-pricing model with the following assumptions:– Expected volatility: 35%;– Expected yield: 6%;– Risk-free interest rate: 2.75%; and– Expected life of options: 3, 4 and 5 years ended 1 March 2016, 2017 and
2018 with expiry at 1 March 2019.
The expected life of the options is based on historical data and is not necessarily indicative of exercise patterns that may occur. The expected volatility reflects the assumption that the historical volatility is indicative of future trends, which may also not necessarily be the actual outcome. The resulting fair values per option for Mr. Burke were $0.73, $0.74 and $0.75 for Tranches 1, 2 and 3 respectively.
These grants have been amortised over the vesting periods resulting in an increase in employee benefits expense of $810,948 for the 2015 financial year (2014: $810,948).
(iii) Holdings of Executive Directors and Senior ManagersOther than the ESP issue on 29 June 2015 of 300,000 and 100,000 ordinary shares to Messrs. C.J. Kirby and S.T. Phillipson respectively, there have been no allotments to KMP under any share based payment plan during the year ended 30 June 2015 (2014: Nil).
The number of shares in the Company during the financial year in which the KMP of the Company have a relevant interest, including their personally-related entities, are set out in the Remuneration Report section of the Directors’ Report.
(iv) Number and weighted average exercise prices (“WAEP”) and movements of Options & ‘In Substance Options’ during the year2015 Number 2015 WAEP – $ 2014 Number 2014 WAEP – $
Outstanding at beginning of year 9,530,410 3.47 10,712,400 3.43Granted during the year 700,000 6.56 – –Forfeited/lapsed during the year (25,000) 3.29 (75,000) 3.37Exercised during the year (213,700) 1.07 (1,106,990) 2.22Expired during the year – – – –
Outstanding at the end of the year 9,991,710 3.59 9,530,410 3.47
Exercisable at the end of the year 2,358,377 3.04 1,935,410 3.02
(v) The outstanding balance as at 30 June 2015 is represented by:Legacy loans over 1993 equity linked performance plan for 64,350 ‘in substance options’ with an issue price of $2.63 each.
Executive Share Plan and Loan Facility: 5,427,360 ‘in substance options’ over ordinary shares in the Company with issue prices ranging from $2.35 to $6.56.
Option Plan for CEO: 4,500,000 options over ordinary shares in the Company exercisable at $3.51 each with an expiry date of 1 March 2019.
26 REMUNERATION OF AUDITORS2015
$2014
$
The auditor of VRL is Ernst & Young (Australia). Aggregate remuneration received or due and receivable by Ernst & Young, directly or indirectly from the VRL group, in connection with – Ernst & Young (Australia) –An audit or review of the financial report of VRL and any other entity in the VRL group 1,363,000 1,361,000Other services in relation to VRL and any other entity in the VRL group: Tax 263,080 192,967 Advisory/Corporate Finance 397,153 204,755 Assurance related 31,365 27,240
2,054,598 1,785,962
Auditors other than Ernst & Young (Australia) –An audit or review of the financial report of any other entity in the VRL group 28,501 19,636Other services in relation to any entity in the VRL group: Tax 115,676 117,430 Advisory/Corporate Finance 27,800 50,000 Assurance related – 6,914
171,977 193,980
2,226,575 1,979,942
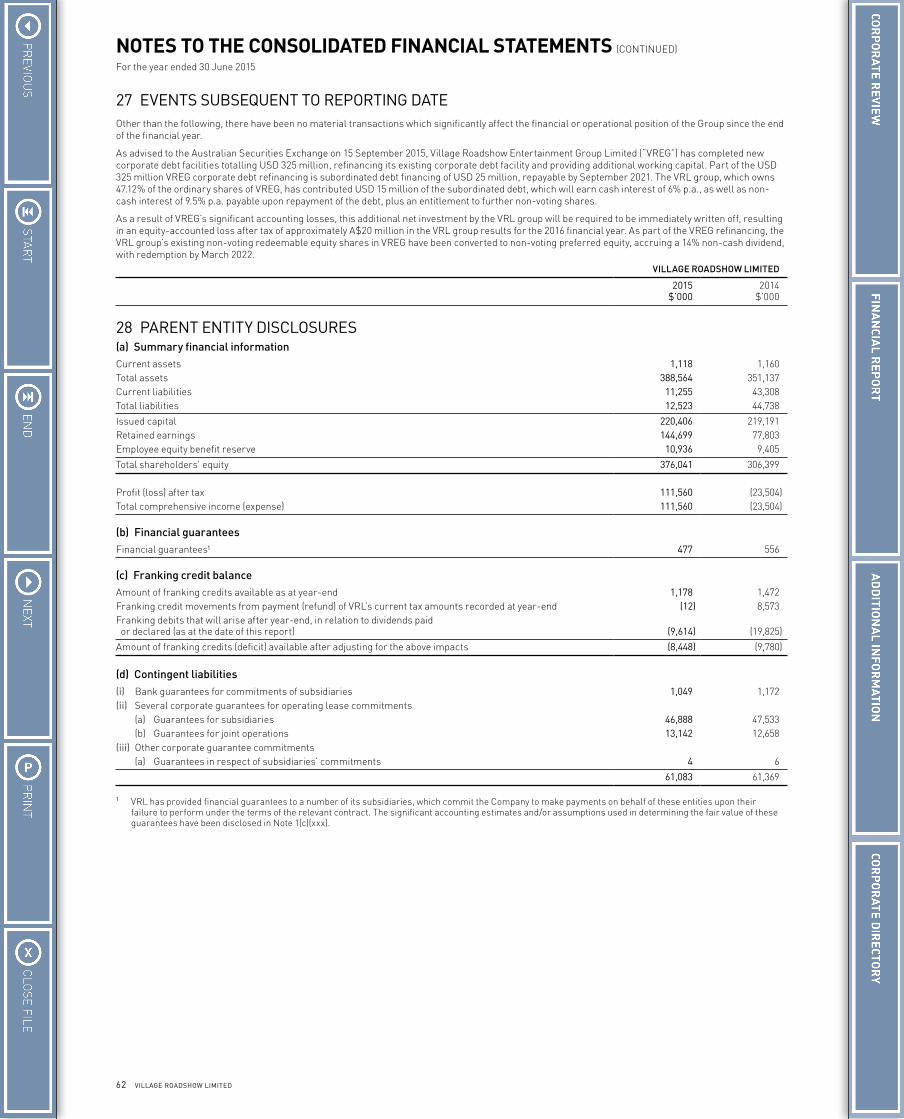
62 VILLAGE ROADSHOW LIMITED
NOTES TO THE CONSOLIDATED FINANCIAL STATEMENTS (CONTINUED)
For the year ended 30 June 2015
27 EVENTS SUBSEQUENT TO REPORTING DATEOther than the following, there have been no material transactions which significantly affect the financial or operational position of the Group since the end of the financial year.
As advised to the Australian Securities Exchange on 15 September 2015, Village Roadshow Entertainment Group Limited (“VREG”) has completed new corporate debt facilities totalling USD 325 million, refinancing its existing corporate debt facility and providing additional working capital. Part of the USD 325 million VREG corporate debt refinancing is subordinated debt financing of USD 25 million, repayable by September 2021. The VRL group, which owns 47.12% of the ordinary shares of VREG, has contributed USD 15 million of the subordinated debt, which will earn cash interest of 6% p.a., as well as non-cash interest of 9.5% p.a. payable upon repayment of the debt, plus an entitlement to further non-voting shares.
As a result of VREG’s significant accounting losses, this additional net investment by the VRL group will be required to be immediately written off, resulting in an equity-accounted loss after tax of approximately A$20 million in the VRL group results for the 2016 financial year. As part of the VREG refinancing, the VRL group’s existing non-voting redeemable equity shares in VREG have been converted to non-voting preferred equity, accruing a 14% non-cash dividend, with redemption by March 2022.
VILLAGE ROADSHOW LIMITED
2015 $’000
2014 $’000
28 PARENT ENTITY DISCLOSURES(a) Summary financial informationCurrent assets 1,118 1,160Total assets 388,564 351,137Current liabilities 11,255 43,308Total liabilities 12,523 44,738
Issued capital 220,406 219,191Retained earnings 144,699 77,803Employee equity benefit reserve 10,936 9,405
Total shareholders’ equity 376,041 306,399
Profit (loss) after tax 111,560 (23,504)Total comprehensive income (expense) 111,560 (23,504)
(b) Financial guaranteesFinancial guarantees¹ 477 556
(c) Franking credit balanceAmount of franking credits available as at year-end 1,178 1,472Franking credit movements from payment (refund) of VRL’s current tax amounts recorded at year-end (12) 8,573Franking debits that will arise after year-end, in relation to dividends paid or declared (as at the date of this report) (9,614) (19,825)
Amount of franking credits (deficit) available after adjusting for the above impacts (8,448) (9,780)
(d) Contingent liabilities(i) Bank guarantees for commitments of subsidiaries 1,049 1,172(ii) Several corporate guarantees for operating lease commitments
(a) Guarantees for subsidiaries 46,888 47,533(b) Guarantees for joint operations 13,142 12,658
(iii) Other corporate guarantee commitments(a) Guarantees in respect of subsidiaries’ commitments 4 6
61,083 61,369
1 VRL has provided financial guarantees to a number of its subsidiaries, which commit the Company to make payments on behalf of these entities upon their failure to perform under the terms of the relevant contract. The significant accounting estimates and/or assumptions used in determining the fair value of these guarantees have been disclosed in Note 1(c)(xxx).
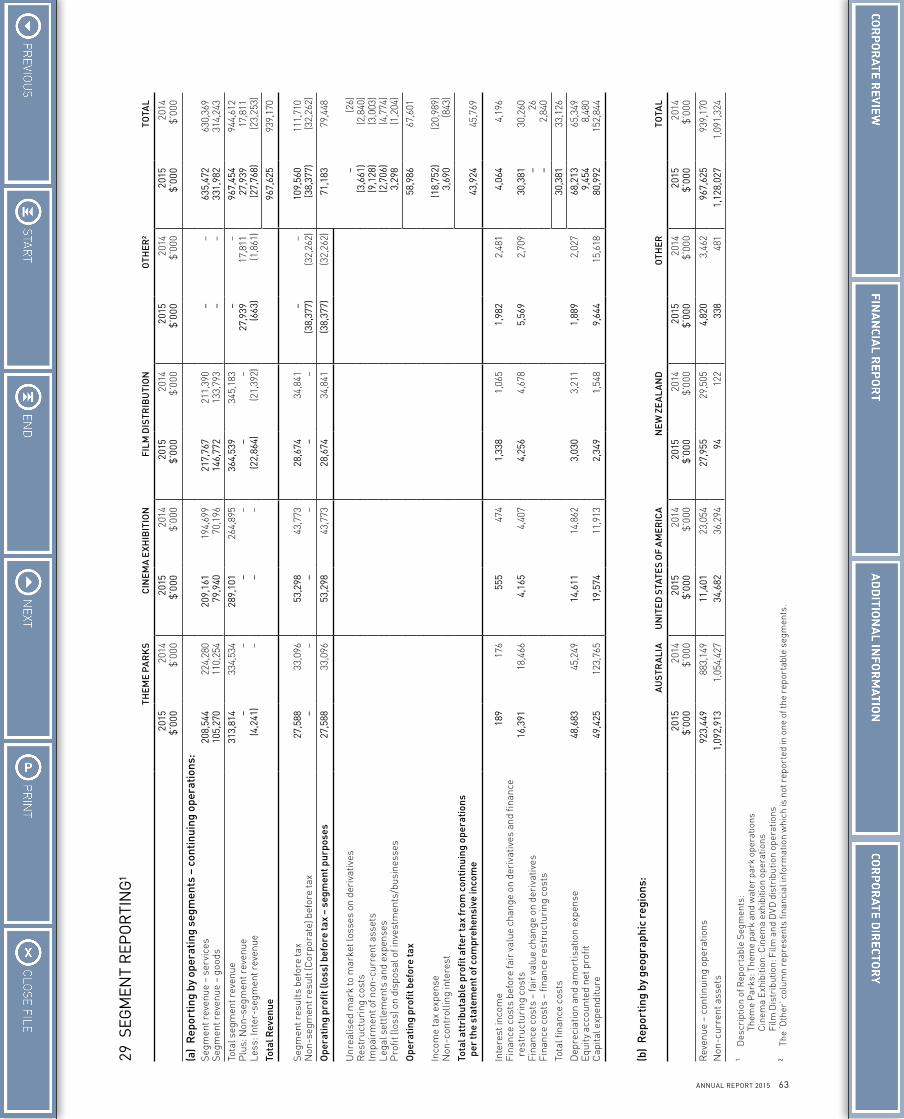
63ANNUAL REPORT 2015
29 S
EGM
ENT
REP
OR
TIN
G¹
THEM
E PA
RK
SC
INEM
A E
XHIB
ITIO
NFI
LM D
ISTR
IBU
TIO
NO
THER
²TO
TAL
2015
$’
000
2014
$’
000
2015
$’
000
2014
$’
000
2015
$’
000
2014
$’
000
2015
$’
000
2014
$’
000
2015
$’
000
2014
$’
000
(a)
Rep
ortin
g by
ope
ratin
g se
gmen
ts –
con
tinui
ng o
pera
tions
:Se
gmen
t rev
enue
– s
ervi
ces
208,
544
224,
280
209,
161
194,
699
217,
767
211,
390
––
635,
472
630,
369
Segm
ent r
even
ue –
goo
ds10
5,27
011
0,25
479
,940
70,1
9614
6,77
213
3,79
3–
–33
1,98
231
4,24
3
Tota
l seg
men
t rev
enue
313,
814
334,
534
289,
101
264,
895
364,
539
345,
183
––
967,
454
944,
612
Plu
s: N
on-s
egm
ent r
even
ue–
––
––
–27
,939
17,8
1127
,939
17,8
11Le
ss: I
nter
-seg
men
t rev
enue
(4,2
41)
––
–(2
2,86
4)(2
1,39
2)(6
63)
(1,8
61)
(27,
768)
(23,
253)
Tota
l Rev
enue
967,
625
939,
170
Segm
ent r
esul
ts b
efor
e ta
x27
,588
33,0
9653
,298
43,7
7328
,674
34,8
41–
–10
9,56
011
1,71
0N
on-s
egm
ent r
esul
t (C
orpo
rate
) bef
ore
tax
––
––
––
(38,
377)
(32,
262)
(38,
377)
(32,
262)
Ope
ratin
g pr
ofit
(los
s) b
efor
e ta
x –
segm
ent p
urpo
ses
27,5
8833
,096
53,2
9843
,773
28,6
7434
,841
(38,
377)
(32,
262)
71,1
8379
,448
Unr
ealis
ed m
ark
to m
arke
t los
ses
on d
eriv
ativ
es–
(26)
Res
truc
turi
ng c
osts
(3,6
61)
(2,8
40)
Impa
irm
ent o
f non
-cur
rent
ass
ets
(9,1
28)
(3,0
03)
Lega
l set
tlem
ents
and
exp
ense
s(2
,706
)(4
,774
)P
rofit
(los
s) o
n di
spos
al o
f inv
estm
ents
/bus
ines
ses
3,29
8(1
,204
)
Ope
ratin
g pr
ofit
befo
re ta
x58
,986
67,6
01 In
com
e ta
x ex
pens
e(1
8,75
2)(2
0,98
9)N
on-c
ontr
ollin
g in
tere
st3,
690
(843
)
Tota
l att
ribu
tabl
e pr
ofit
afte
r ta
x fr
om c
ontin
uing
ope
ratio
ns
per
the
stat
emen
t of c
ompr
ehen
sive
inco
me
43,9
2445
,769
Inte
rest
inco
me
189
176
555
474
1,33
81,
065
1,98
22,
481
4,06
44,
196
Fina
nce
cost
s be
fore
fair
val
ue c
hang
e on
der
ivat
ives
and
fina
nce
res
truc
turi
ng c
osts
16,3
9118
,466
4,16
54,
407
4,25
64,
678
5,56
92,
709
30,3
8130
,260
Fina
nce
cost
s –
fair
val
ue c
hang
e on
der
ivat
ives
–26
Fina
nce
cost
s –
finan
ce r
estr
uctu
ring
cos
ts–
2,84
0
Tota
l fin
ance
cos
ts30
,381
33,1
26
Dep
reci
atio
n an
d am
ortis
atio
n ex
pens
e48
,683
45,2
4914
,611
14,8
623,
030
3,21
11,
889
2,02
768
,213
65,3
49Eq
uity
acc
ount
ed n
et p
rofit
9,45
48,
480
Cap
ital e
xpen
ditu
re49
,425
123,
765
19,5
7411
,913
2,34
91,
548
9,64
415
,618
80,9
9215
2,84
4
(b)
Rep
ortin
g by
geo
grap
hic
regi
ons:
AU
STR
ALI
AU
NIT
ED S
TATE
S O
F A
MER
ICA
NE
W Z
EA
LA
ND
OTH
ERTO
TAL
2015
$’
000
2014
$’
000
2015
$’
000
2014
$’
000
2015
$’
000
2014
$’
000
2015
$’
000
2014
$’
000
2015
$’
000
2014
$’
000
Rev
enue
– c
ontin
uing
ope
ratio
ns92
3,44
988
3,14
911
,401
23,0
5427
,955
29,5
054,
820
3,46
296
7,62
593
9,17
0N
on-c
urre
nt a
sset
s1,
092,
913
1,05
4,42
734
,682
36,2
9494
122
338
481
1,12
8,02
71,
091,
324
1 D
escr
iptio
n of
Rep
orta
ble
Segm
ents
:Th
eme
Par
ks: T
hem
e pa
rk a
nd w
ater
par
k op
erat
ions
Cin
ema
Exh
ibiti
on: C
inem
a ex
hibi
tion
oper
atio
nsFi
lm D
istr
ibut
ion:
Film
and
DVD
dis
trib
utio
n op
erat
ions
2 Th
e ‘O
ther
’ col
umn
repr
esen
ts fi
nanc
ial i
nfor
mat
ion
whi
ch is
not
rep
orte
d in
one
of t
he r
epor
tabl
e se
gmen
ts.
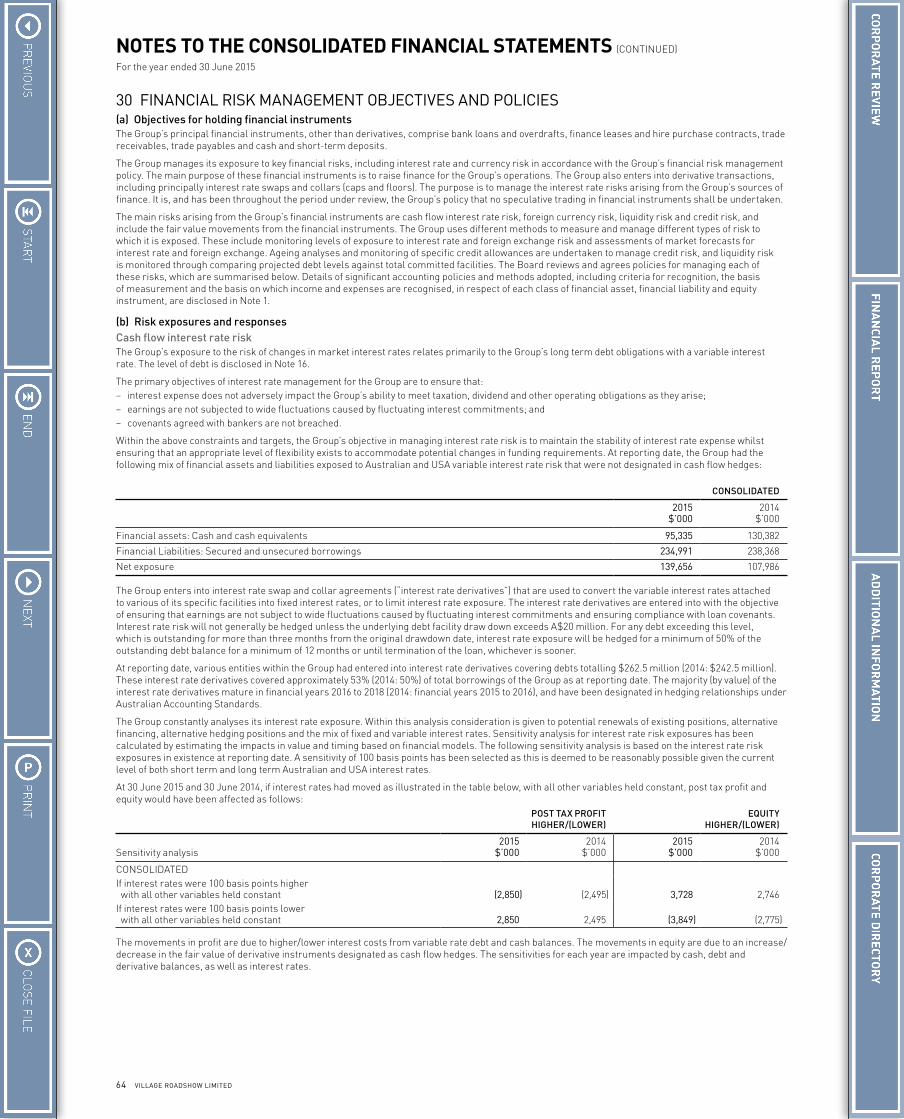
64 VILLAGE ROADSHOW LIMITED
NOTES TO THE CONSOLIDATED FINANCIAL STATEMENTS (CONTINUED)
For the year ended 30 June 2015
30 FINANCIAL RISK MANAGEMENT OBJECTIVES AND POLICIES(a) Objectives for holding financial instrumentsThe Group’s principal financial instruments, other than derivatives, comprise bank loans and overdrafts, finance leases and hire purchase contracts, trade receivables, trade payables and cash and short-term deposits.
The Group manages its exposure to key financial risks, including interest rate and currency risk in accordance with the Group’s financial risk management policy. The main purpose of these financial instruments is to raise finance for the Group’s operations. The Group also enters into derivative transactions, including principally interest rate swaps and collars (caps and floors). The purpose is to manage the interest rate risks arising from the Group’s sources of finance. It is, and has been throughout the period under review, the Group’s policy that no speculative trading in financial instruments shall be undertaken.
The main risks arising from the Group’s financial instruments are cash flow interest rate risk, foreign currency risk, liquidity risk and credit risk, and include the fair value movements from the financial instruments. The Group uses different methods to measure and manage different types of risk to which it is exposed. These include monitoring levels of exposure to interest rate and foreign exchange risk and assessments of market forecasts for interest rate and foreign exchange. Ageing analyses and monitoring of specific credit allowances are undertaken to manage credit risk, and liquidity risk is monitored through comparing projected debt levels against total committed facilities. The Board reviews and agrees policies for managing each of these risks, which are summarised below. Details of significant accounting policies and methods adopted, including criteria for recognition, the basis of measurement and the basis on which income and expenses are recognised, in respect of each class of financial asset, financial liability and equity instrument, are disclosed in Note 1.
(b) Risk exposures and responsesCash flow interest rate riskThe Group’s exposure to the risk of changes in market interest rates relates primarily to the Group’s long term debt obligations with a variable interest rate. The level of debt is disclosed in Note 16.
The primary objectives of interest rate management for the Group are to ensure that:– interest expense does not adversely impact the Group’s ability to meet taxation, dividend and other operating obligations as they arise;– earnings are not subjected to wide fluctuations caused by fluctuating interest commitments; and– covenants agreed with bankers are not breached.
Within the above constraints and targets, the Group’s objective in managing interest rate risk is to maintain the stability of interest rate expense whilst ensuring that an appropriate level of flexibility exists to accommodate potential changes in funding requirements. At reporting date, the Group had the following mix of financial assets and liabilities exposed to Australian and USA variable interest rate risk that were not designated in cash flow hedges:
CONSOLIDATED
2015 $’000
2014 $’000
Financial assets: Cash and cash equivalents 95,335 130,382
Financial Liabilities: Secured and unsecured borrowings 234,991 238,368
Net exposure 139,656 107,986
The Group enters into interest rate swap and collar agreements (“interest rate derivatives”) that are used to convert the variable interest rates attached to various of its specific facilities into fixed interest rates, or to limit interest rate exposure. The interest rate derivatives are entered into with the objective of ensuring that earnings are not subject to wide fluctuations caused by fluctuating interest commitments and ensuring compliance with loan covenants. Interest rate risk will not generally be hedged unless the underlying debt facility draw down exceeds A$20 million. For any debt exceeding this level, which is outstanding for more than three months from the original drawdown date, interest rate exposure will be hedged for a minimum of 50% of the outstanding debt balance for a minimum of 12 months or until termination of the loan, whichever is sooner.
At reporting date, various entities within the Group had entered into interest rate derivatives covering debts totalling $262.5 million (2014: $242.5 million). These interest rate derivatives covered approximately 53% (2014: 50%) of total borrowings of the Group as at reporting date. The majority (by value) of the interest rate derivatives mature in financial years 2016 to 2018 (2014: financial years 2015 to 2016), and have been designated in hedging relationships under Australian Accounting Standards.
The Group constantly analyses its interest rate exposure. Within this analysis consideration is given to potential renewals of existing positions, alternative financing, alternative hedging positions and the mix of fixed and variable interest rates. Sensitivity analysis for interest rate risk exposures has been calculated by estimating the impacts in value and timing based on financial models. The following sensitivity analysis is based on the interest rate risk exposures in existence at reporting date. A sensitivity of 100 basis points has been selected as this is deemed to be reasonably possible given the current level of both short term and long term Australian and USA interest rates.
At 30 June 2015 and 30 June 2014, if interest rates had moved as illustrated in the table below, with all other variables held constant, post tax profit and equity would have been affected as follows:
POST TAX PROFIT HIGHER/(LOWER)
EQUITY HIGHER/(LOWER)
Sensitivity analysis2015
$’0002014
$’0002015
$’0002014
$’000
CONSOLIDATEDIf interest rates were 100 basis points higher with all other variables held constant (2,850) (2,495) 3,728 2,746If interest rates were 100 basis points lower with all other variables held constant 2,850 2,495 (3,849) (2,775)
The movements in profit are due to higher/lower interest costs from variable rate debt and cash balances. The movements in equity are due to an increase/decrease in the fair value of derivative instruments designated as cash flow hedges. The sensitivities for each year are impacted by cash, debt and derivative balances, as well as interest rates.
65ANNUAL REPORT 2015
30 FINANCIAL RISK MANAGEMENT OBJECTIVES AND POLICIES (continued)
(b) Risk exposures and responses (continued)
Foreign currency riskThe Group has transactional foreign currency exposures, which arise from sales or purchases by the relevant division in currencies other than the division’s functional currency. In general, the Group requires all of its divisions to use forward currency contracts to eliminate the foreign currency exposure on any individual transactions in excess of A$0.5 million, which are generally required to be taken out immediately when a firm commitment has occurred. The forward currency contracts must be in the same currency as the hedged item, and it is the Group’s policy not to enter into forward contracts until a firm commitment is in place.
In addition, the Group uses forward currency contracts to eliminate the foreign currency exposure on part of the Group’s estimated foreign currency payments, which are regularly updated to ensure a rolling forward cover position.
It is the Group’s policy to negotiate the terms of the foreign currency derivatives to match the terms of the underlying foreign currency exposures as closely as possible, to maximise the effectiveness of the derivatives. As at 30 June 2015 and 30 June 2014, the Group had hedged the majority (by value) of foreign currency purchases that were firm commitments. The following sensitivity analysis is based on the foreign currency risk exposures in existence at reporting date. A sensitivity of 10% has been selected as this is deemed to be reasonably possible given the current level of the United States Dollar and other relevant exchange rates.
At 30 June 2015 and 30 June 2014, if foreign exchange rates had moved as illustrated in the table below, with all other variables held constant, post tax profit and equity would have been affected as follows:
POST TAX PROFIT HIGHER/(LOWER)
EQUITY HIGHER/(LOWER)
Sensitivity analysis2015
$’0002014
$’0002015
$’0002014
$’000
CONSOLIDATEDIf foreign exchange rates were 10 per cent higher with all other variables held constant – – (4,345) (2,573)If foreign exchange rates were 10 per cent lower with all other variables held constant – – 5,310 3,145
The movement in equity is due to an increase/decrease in the fair value of the derivative instruments, which are all designated as cash flow hedges. The sensitivities for each year are impacted by the derivative balances and exchange rates. There is no movement in profit in this foreign exchange rate sensitivity analysis due to the fact that movements in the unhedged foreign currency amounts only impact asset and liability balances.
Commodity price riskThe Group’s exposure to price risk is minimal.
Credit riskThe Group trades only with recognised, creditworthy third parties. It is the Group’s policy that all customers who wish to trade on credit terms are subject to credit verification procedures. In addition, receivable balances are monitored on an ongoing basis with the result that the Group’s exposure to bad debts is not significant.
Credit risk in trade receivables is managed in the following ways:– payment terms are generally 30 to 90 days; and– a risk assessment process is used for customers over $50,000.
The Group’s maximum exposure to credit risk at reporting date in relation to each class of recognised financial asset, other than derivatives, is the carrying amount of those assets as recognised in the statement of financial position.
In relation to derivative financial instruments, credit risk arises from the potential failure of counterparties to meet their obligations under the contract or arrangement. However, the Group ensures that it only enters into contracts with creditworthy institutions, as set out in the relevant Group policy.
Concentrations of credit risk:The Group minimises concentrations of credit risk in relation to trade accounts receivable by undertaking transactions with a large number of customers within the specified industries. The customers are mainly concentrated in Australia.
Liquidity RiskLiquidity risk management is concerned with ensuring that there are sufficient funds available to meet the Group’s commitments in a timely manner. The Group’s objective is to maintain a balance between continuity of funding and flexibility through the use of bank overdrafts, bank loans, finance leases and hire purchase contracts.
Liquidity risk is measured by comparing projected net debt levels for the next 12 months against total committed facilities on a rolling monthly basis and includes monthly cash flow forecasts from the Group’s operating divisions. Projected net debt levels take into account:– existing debt;– future operating and financing cash flows;– approved capital expenditure;– approved investment expenditure for new sites; and– dividend distributions and income tax payments.
The risk implied from the values shown in the following table reflects a balanced view of cash inflows and outflows. Leasing obligations, trade payables and other financial liabilities mainly originate from the financing of assets used in ongoing operations such as property, plant and equipment and investments in working capital. These assets are considered in the Group’s overall liquidity risk. To ensure that the maturity of funding facilities is not concentrated in one period, the Group will generally ensure that no more than 30% of its committed facilities mature within any 12 month period. As at 30 June 2015, 6% (2014: 5%) of the Group’s debt will mature in less than one year.
To monitor existing financial assets and liabilities as well as to enable an effective controlling of future risks, the Group has established comprehensive risk reporting that reflects the expectations of management of settlement of financial assets and liabilities.
The following table reflects all contractually fixed payables and receivables for settlement, repayments and interest resulting from recognised financial assets and liabilities, including derivative financial instruments as at 30 June 2015. For derivative financial instruments and other obligations, the contractual undiscounted cash flows for the respective upcoming fiscal years are presented. Cash flows for financial assets and liabilities without fixed amount or timing are based on the conditions existing at 30 June 2015.
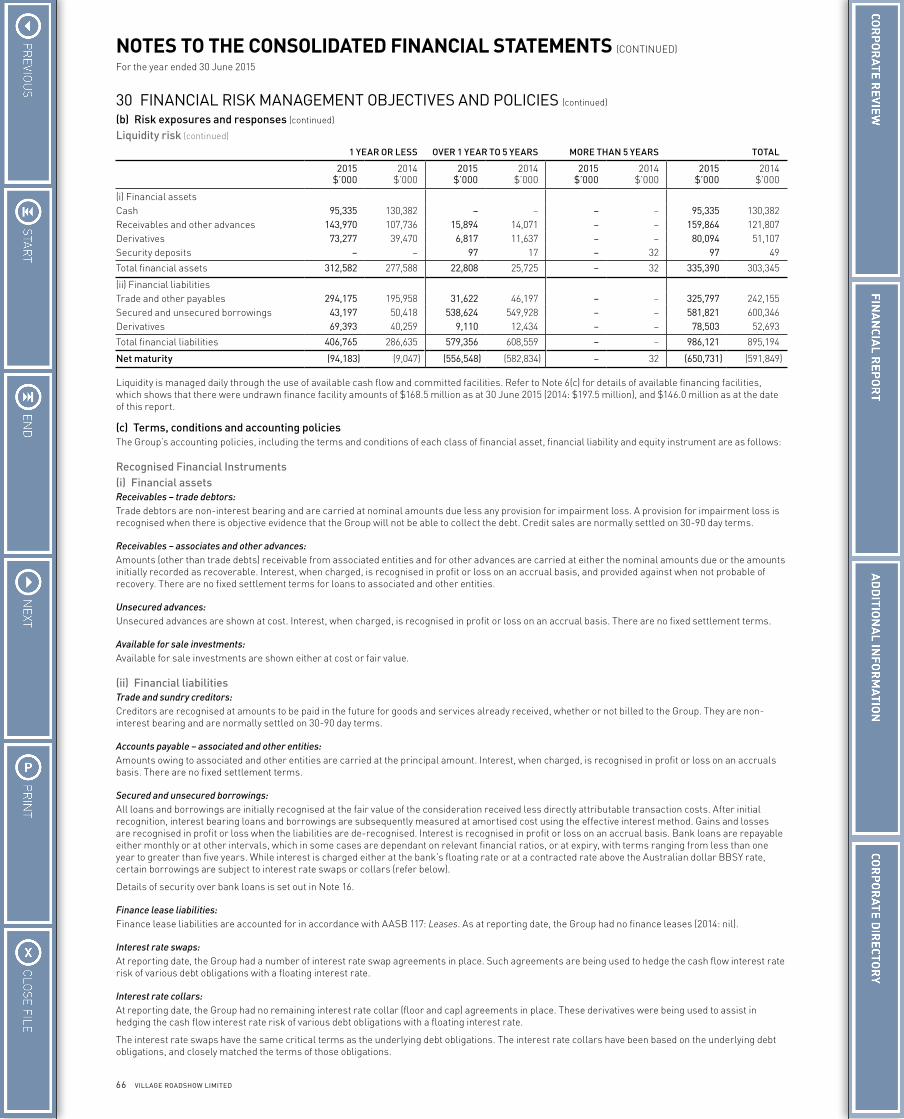
66 VILLAGE ROADSHOW LIMITED
NOTES TO THE CONSOLIDATED FINANCIAL STATEMENTS (CONTINUED)
For the year ended 30 June 2015
30 FINANCIAL RISK MANAGEMENT OBJECTIVES AND POLICIES (continued)
(b) Risk exposures and responses (continued)
Liquidity risk (continued)
1 YEAR OR LESS OVER 1 YEAR TO 5 YEARS MORE THAN 5 YEARS TOTAL
2015 $’000
2014 $’000
2015 $’000
2014 $’000
2015 $’000
2014 $’000
2015 $’000
2014 $’000
(i) Financial assetsCash 95,335 130,382 – – – – 95,335 130,382Receivables and other advances 143,970 107,736 15,894 14,071 – – 159,864 121,807Derivatives 73,277 39,470 6,817 11,637 – – 80,094 51,107Security deposits – – 97 17 – 32 97 49
Total financial assets 312,582 277,588 22,808 25,725 – 32 335,390 303,345
(ii) Financial liabilitiesTrade and other payables 294,175 195,958 31,622 46,197 – – 325,797 242,155Secured and unsecured borrowings 43,197 50,418 538,624 549,928 – – 581,821 600,346Derivatives 69,393 40,259 9,110 12,434 – – 78,503 52,693
Total financial liabilities 406,765 286,635 579,356 608,559 – – 986,121 895,194
Net maturity (94,183) (9,047) (556,548) (582,834) – 32 (650,731) (591,849)
Liquidity is managed daily through the use of available cash flow and committed facilities. Refer to Note 6(c) for details of available financing facilities, which shows that there were undrawn finance facility amounts of $168.5 million as at 30 June 2015 (2014: $197.5 million), and $146.0 million as at the date of this report.
(c) Terms, conditions and accounting policiesThe Group’s accounting policies, including the terms and conditions of each class of financial asset, financial liability and equity instrument are as follows:
Recognised Financial Instruments(i) Financial assetsReceivables – trade debtors:Trade debtors are non-interest bearing and are carried at nominal amounts due less any provision for impairment loss. A provision for impairment loss is recognised when there is objective evidence that the Group will not be able to collect the debt. Credit sales are normally settled on 30-90 day terms.
Receivables – associates and other advances:Amounts (other than trade debts) receivable from associated entities and for other advances are carried at either the nominal amounts due or the amounts initially recorded as recoverable. Interest, when charged, is recognised in profit or loss on an accrual basis, and provided against when not probable of recovery. There are no fixed settlement terms for loans to associated and other entities.
Unsecured advances:Unsecured advances are shown at cost. Interest, when charged, is recognised in profit or loss on an accrual basis. There are no fixed settlement terms.
Available for sale investments:Available for sale investments are shown either at cost or fair value.
(ii) Financial liabilitiesTrade and sundry creditors:Creditors are recognised at amounts to be paid in the future for goods and services already received, whether or not billed to the Group. They are non-interest bearing and are normally settled on 30-90 day terms.
Accounts payable – associated and other entities:Amounts owing to associated and other entities are carried at the principal amount. Interest, when charged, is recognised in profit or loss on an accruals basis. There are no fixed settlement terms.
Secured and unsecured borrowings:All loans and borrowings are initially recognised at the fair value of the consideration received less directly attributable transaction costs. After initial recognition, interest bearing loans and borrowings are subsequently measured at amortised cost using the effective interest method. Gains and losses are recognised in profit or loss when the liabilities are de-recognised. Interest is recognised in profit or loss on an accrual basis. Bank loans are repayable either monthly or at other intervals, which in some cases are dependant on relevant financial ratios, or at expiry, with terms ranging from less than one year to greater than five years. While interest is charged either at the bank’s floating rate or at a contracted rate above the Australian dollar BBSY rate, certain borrowings are subject to interest rate swaps or collars (refer below).
Details of security over bank loans is set out in Note 16.
Finance lease liabilities:Finance lease liabilities are accounted for in accordance with AASB 117: Leases. As at reporting date, the Group had no finance leases (2014: nil).
Interest rate swaps:At reporting date, the Group had a number of interest rate swap agreements in place. Such agreements are being used to hedge the cash flow interest rate risk of various debt obligations with a floating interest rate.
Interest rate collars:At reporting date, the Group had no remaining interest rate collar (floor and cap) agreements in place. These derivatives were being used to assist in hedging the cash flow interest rate risk of various debt obligations with a floating interest rate.
The interest rate swaps have the same critical terms as the underlying debt obligations. The interest rate collars have been based on the underlying debt obligations, and closely matched the terms of those obligations.
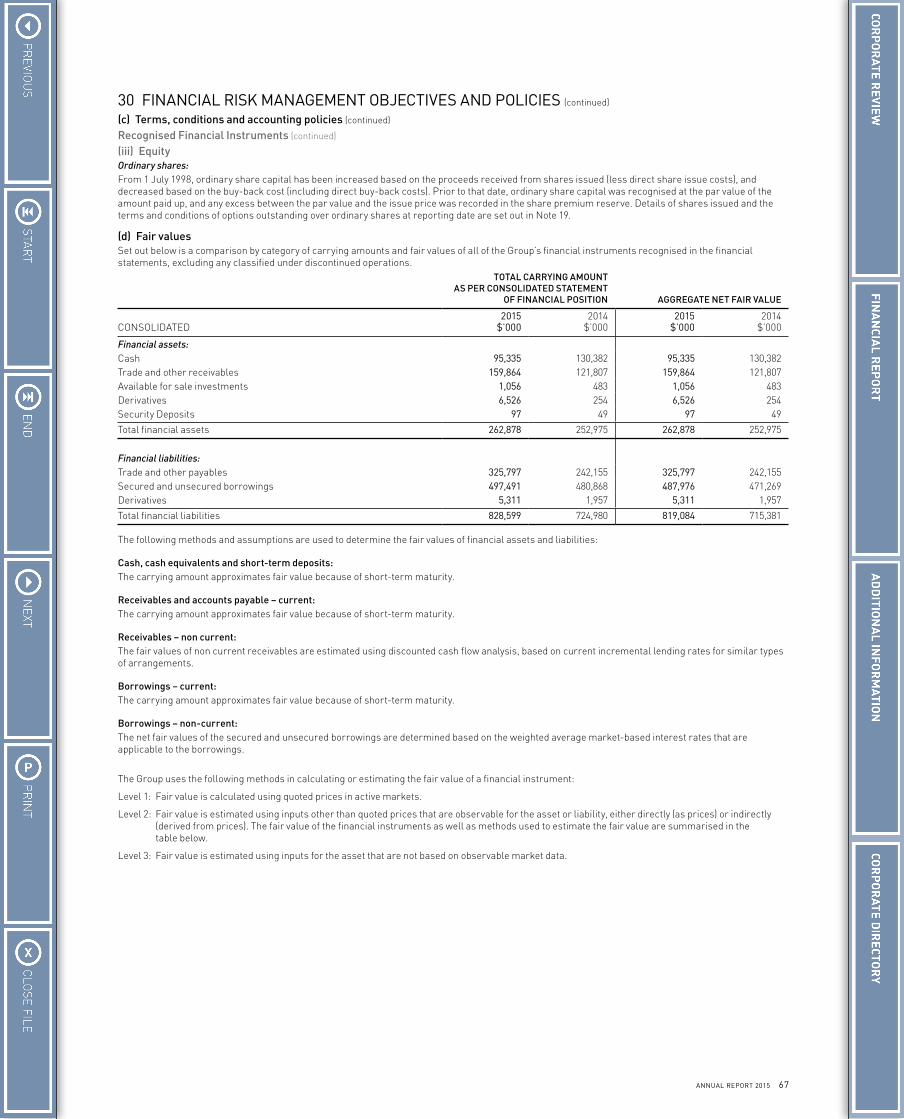
67ANNUAL REPORT 2015
30 FINANCIAL RISK MANAGEMENT OBJECTIVES AND POLICIES (continued)
(c) Terms, conditions and accounting policies (continued)
Recognised Financial Instruments (continued)
(iii) EquityOrdinary shares:From 1 July 1998, ordinary share capital has been increased based on the proceeds received from shares issued (less direct share issue costs), and decreased based on the buy-back cost (including direct buy-back costs). Prior to that date, ordinary share capital was recognised at the par value of the amount paid up, and any excess between the par value and the issue price was recorded in the share premium reserve. Details of shares issued and the terms and conditions of options outstanding over ordinary shares at reporting date are set out in Note 19.
(d) Fair valuesSet out below is a comparison by category of carrying amounts and fair values of all of the Group’s financial instruments recognised in the financial statements, excluding any classified under discontinued operations.
TOTAL CARRYING AMOUNT AS PER CONSOLIDATED STATEMENT
OF FINANCIAL POSITION AGGREGATE NET FAIR VALUE
CONSOLIDATED2015
$’0002014
$’0002015
$’0002014
$’000
Financial assets:Cash 95,335 130,382 95,335 130,382Trade and other receivables 159,864 121,807 159,864 121,807Available for sale investments 1,056 483 1,056 483Derivatives 6,526 254 6,526 254Security Deposits 97 49 97 49
Total financial assets 262,878 252,975 262,878 252,975
Financial liabilities:Trade and other payables 325,797 242,155 325,797 242,155Secured and unsecured borrowings 497,491 480,868 487,976 471,269Derivatives 5,311 1,957 5,311 1,957
Total financial liabilities 828,599 724,980 819,084 715,381
The following methods and assumptions are used to determine the fair values of financial assets and liabilities:
Cash, cash equivalents and short-term deposits:The carrying amount approximates fair value because of short-term maturity.
Receivables and accounts payable – current:The carrying amount approximates fair value because of short-term maturity.
Receivables – non current:The fair values of non current receivables are estimated using discounted cash flow analysis, based on current incremental lending rates for similar types of arrangements.
Borrowings – current:The carrying amount approximates fair value because of short-term maturity.
Borrowings – non-current:The net fair values of the secured and unsecured borrowings are determined based on the weighted average market-based interest rates that are applicable to the borrowings.
The Group uses the following methods in calculating or estimating the fair value of a financial instrument:
Level 1: Fair value is calculated using quoted prices in active markets.
Level 2: Fair value is estimated using inputs other than quoted prices that are observable for the asset or liability, either directly (as prices) or indirectly (derived from prices). The fair value of the financial instruments as well as methods used to estimate the fair value are summarised in the table below.
Level 3: Fair value is estimated using inputs for the asset that are not based on observable market data.
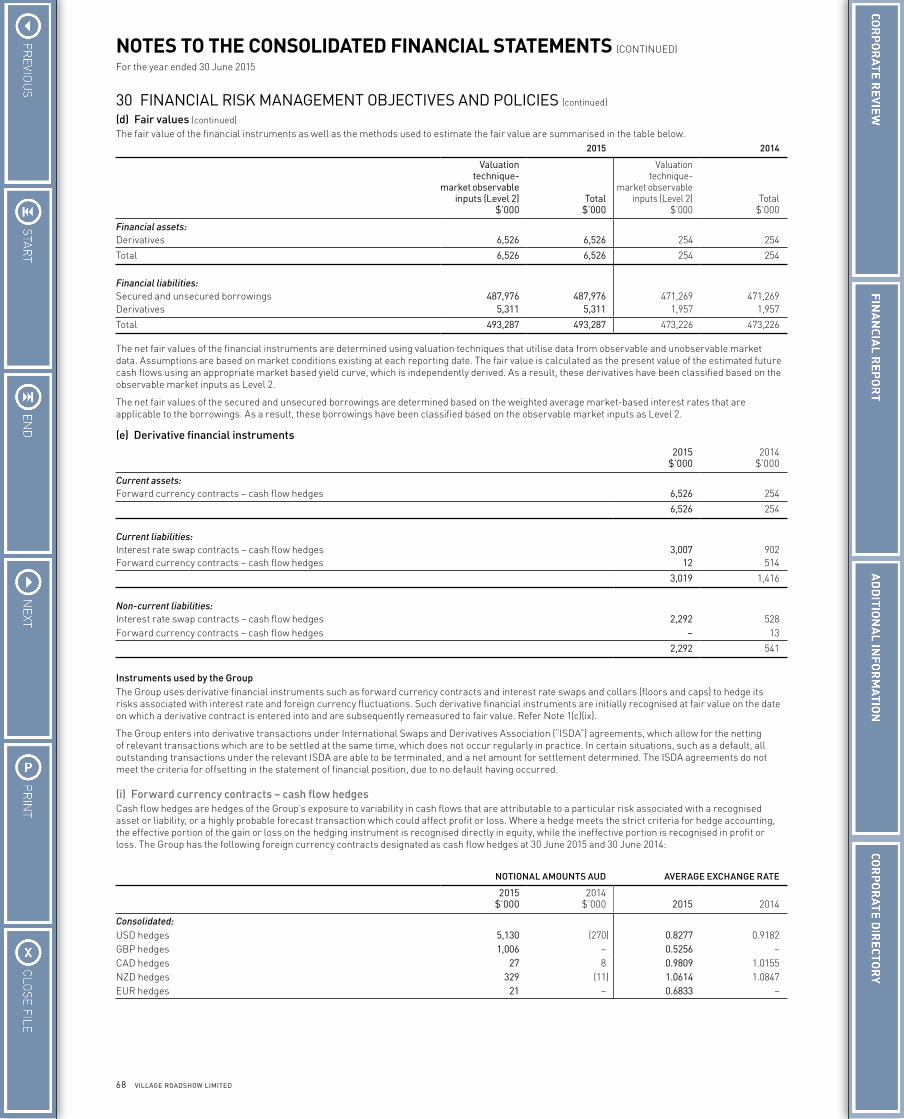
68 VILLAGE ROADSHOW LIMITED
NOTES TO THE CONSOLIDATED FINANCIAL STATEMENTS (CONTINUED)
For the year ended 30 June 2015
30 FINANCIAL RISK MANAGEMENT OBJECTIVES AND POLICIES (continued)
(d) Fair values (continued)The fair value of the financial instruments as well as the methods used to estimate the fair value are summarised in the table below.
2015 2014
Valuation technique-
market observable inputs (Level 2)
$’000Total
$’000
Valuation technique-
market observable inputs (Level 2)
$’000Total
$’000
Financial assets:Derivatives 6,526 6,526 254 254
Total 6,526 6,526 254 254
Financial liabilities:Secured and unsecured borrowings 487,976 487,976 471,269 471,269Derivatives 5,311 5,311 1,957 1,957
Total 493,287 493,287 473,226 473,226
The net fair values of the financial instruments are determined using valuation techniques that utilise data from observable and unobservable market data. Assumptions are based on market conditions existing at each reporting date. The fair value is calculated as the present value of the estimated future cash flows using an appropriate market based yield curve, which is independently derived. As a result, these derivatives have been classified based on the observable market inputs as Level 2.
The net fair values of the secured and unsecured borrowings are determined based on the weighted average market-based interest rates that are applicable to the borrowings. As a result, these borrowings have been classified based on the observable market inputs as Level 2.
(e) Derivative financial instruments2015
$’0002014
$’000
Current assets:Forward currency contracts – cash flow hedges 6,526 254
6,526 254
Current liabilities:Interest rate swap contracts – cash flow hedges 3,007 902Forward currency contracts – cash flow hedges 12 514
3,019 1,416
Non-current liabilities:Interest rate swap contracts – cash flow hedges 2,292 528Forward currency contracts – cash flow hedges – 13
2,292 541
Instruments used by the GroupThe Group uses derivative financial instruments such as forward currency contracts and interest rate swaps and collars (floors and caps) to hedge its risks associated with interest rate and foreign currency fluctuations. Such derivative financial instruments are initially recognised at fair value on the date on which a derivative contract is entered into and are subsequently remeasured to fair value. Refer Note 1(c)(ix).
The Group enters into derivative transactions under International Swaps and Derivatives Association (“ISDA”) agreements, which allow for the netting of relevant transactions which are to be settled at the same time, which does not occur regularly in practice. In certain situations, such as a default, all outstanding transactions under the relevant ISDA are able to be terminated, and a net amount for settlement determined. The ISDA agreements do not meet the criteria for offsetting in the statement of financial position, due to no default having occurred.
(i) Forward currency contracts – cash flow hedgesCash flow hedges are hedges of the Group’s exposure to variability in cash flows that are attributable to a particular risk associated with a recognised asset or liability, or a highly probable forecast transaction which could affect profit or loss. Where a hedge meets the strict criteria for hedge accounting, the effective portion of the gain or loss on the hedging instrument is recognised directly in equity, while the ineffective portion is recognised in profit or loss. The Group has the following foreign currency contracts designated as cash flow hedges at 30 June 2015 and 30 June 2014:
NOTIONAL AMOUNTS AUD AVERAGE EXCHANGE RATE
2015 $’000
2014 $’000 2015 2014
Consolidated:USD hedges 5,130 (270) 0.8277 0.9182GBP hedges 1,006 – 0.5256 –CAD hedges 27 8 0.9809 1.0155NZD hedges 329 (11) 1.0614 1.0847EUR hedges 21 – 0.6833 –
69ANNUAL REPORT 2015
30 FINANCIAL RISK MANAGEMENT OBJECTIVES AND POLICIES (continued)
(e) Derivative financial instruments (continued)
(ii) Interest rate swaps – cash flow hedgesIn order to protect against rising interest rates, the Group has entered into interest rate swap contracts under which it has a right to receive interest at variable rates and to pay interest at fixed rates. At reporting date, the principal amounts and period of expiry of the interest rate swap contracts were as follows:
2015 $’000
2014 $’000
0-1 years (3,007) (902)1-2 years – (528)2-3 years (2,292) –
(5,299) (1,430)
The Group’s interest rate swaps generally require settlement of net interest receivable or payable, and the settlement dates generally coincide with the dates on which interest is payable on the underlying debt. The swaps are measured at fair value and, in respect of derivatives which are classified as effective, all gains and losses attributable to the hedged risk are taken directly to equity and re-classified into profit or loss when the interest expense is recognised.
31 NON-KEY MANAGEMENT PERSONNEL RELATED PARTY TRANSACTIONSThe following related party transactions occurred during the financial year and were conducted on normal commercial terms and conditions unless otherwise stated:
(a) Immediate Parent EntityThe Company’s immediate parent entity is Village Roadshow Corporation Pty. Limited which is incorporated in Australia. The Company’s ultimate parent entity is Positive Investments Pty. Limited which is incorporated in Australia. Refer also to the Directors’ Report disclosures for relevant interests of Directors in relation to the 100% ownership of the immediate and ultimate parent entities by Messrs. R.G. Kirby, J.R. Kirby & G.W. Burke.
(b) Associated Entities:Revenues and expensesThe following transactions with associated entities were included in the determination of the operating profit before tax for the year:
2015 $’000
2014 $’000
Management & service fee revenue – associates 722 856Management & service fee revenue – other associated entities 143 133Film hire and other film expenses (paid by the VRL group to entities in the Village Roadshow Entertainment Group Limited group) 31,210 21,805Film hire and other film expenses (paid by the VRL group to FilmNation Entertainment LLC) 9,247 –
Receivables and payablesAny amounts receivable from, or payable to, associates have been separately disclosed in Notes 7 and 15.
In accordance with a resolution of the Directors of Village Roadshow Limited, I state that:
(1) In the opinion of the Directors –
(a) the financial statements and notes of the consolidated entity are in accordance with the Corporations Act 2001, including:
(i) giving a true and fair view of the consolidated entity’s financial position as at 30 June 2015 and of its performance for the year ended on that date; and
(ii) complying with Accounting Standards and Corporations Regulations 2001; and
(b) there are reasonable grounds to believe that the Company will be able to pay its debts as and when they become due and payable; and
(c) the financial report also complies with International Financial Reporting Standards as issued by the International Accounting Standards Board, as disclosed in Note 1(b)(i).
(2) This declaration has been made after receiving the declarations required to be made to the Directors in accordance with section 295A of the Corporations Act 2001 for the financial year ended 30 June 2015.
On behalf of the Board
G.W. Burke Director
Melbourne, 17 September 2015
DIRECTORS’ DECLARATION
70 VILLAGE ROADSHOW LIMITED
INDEPENDENT AUDITOR’S REPORT
Ernst & Young8 Exhibition Street Melbourne VIC 3000 AustraliaGPO Box 67 Melbourne VIC 3001
Tel: +61 3 9288 8000Fax: +61 3 8650 7777ey.com/au
A member firm of Ernst & Young Global LimitedLiability limited by a scheme approved under Professional Standards Legislation
INDEPENDENT AUDITOR’S REPORT TO THE MEMBERS OF VILLAGE ROADSHOW LIMITED
Report on the financial reportWe have audited the accompanying financial report of Village Roadshow Limited, which comprises the consolidated statement of financial position as at 30 June 2015, the consolidated statement of comprehensive income, the consolidated statement of changes in equity and the consolidated statement of cash flows for the year then ended, notes comprising a summary of significant accounting policies and other explanatory information, and the directors’ declaration of the consolidated entity comprising the company and the entities it controlled at the year’s end or from time to time during the financial year.
Directors’ responsibility for the financial reportThe directors of the company are responsible for the preparation of the financial report that gives a true and fair view in accordance with Australian Accounting Standards and the Corporations Act 2001 and for such internal controls as the directors determine are necessary to enable the preparation of the financial report that is free from material misstatement, whether due to fraud or error. In Note 1(b), the directors also state, in accordance with Accounting Standard AASB 101 Presentation of Financial Statements, that the financial statements comply with International Financial Reporting Standards.
Auditor’s responsibilityOur responsibility is to express an opinion on the financial report based on our audit. We conducted our audit in accordance with Australian Auditing Standards. Those standards require that we comply with relevant ethical requirements relating to audit engagements and plan and perform the audit to obtain reasonable assurance about whether the financial report is free from material misstatement.
An audit involves performing procedures to obtain audit evidence about the amounts and disclosures in the financial report. The procedures selected depend on the auditor’s judgment, including the assessment of the risks of material misstatement of the financial report, whether due to fraud or error. In making those risk assessments, the auditor considers internal controls relevant to the entity’s preparation and fair presentation of the financial report in order to design audit procedures that are appropriate in the circumstances, but not for the purpose of expressing an opinion on the effectiveness of the entity’s internal controls. An audit also includes evaluating the appropriateness of accounting policies used and the reasonableness of accounting estimates made by the directors, as well as evaluating the overall presentation of the financial report.
We believe that the audit evidence we have obtained is sufficient and appropriate to provide a basis for our audit opinion.
IndependenceIn conducting our audit we have complied with the independence requirements of the Corporations Act 2001. We have given to the directors of the company a written Auditor’s Independence Declaration, a copy of which is included in the directors’ report.
OpinionIn our opinion:
a. the financial report of Village Roadshow Limited is in accordance with the Corporations Act 2001, including:
i giving a true and fair view of the consolidated entity’s financial position as at 30 June 2015 and of its performance for the year ended on that date; and
ii complying with Australian Accounting Standards and the Corporations Regulations 2001; and
b. the financial report also complies with International Financial Reporting Standards as disclosed in Note 1(b).
Report on the remuneration reportWe have audited the Remuneration Report included on pages 18 to 29 of the directors’ report for the year ended 30 June 2015. The directors of the company are responsible for the preparation and presentation of the Remuneration Report in accordance with section 300A of the Corporations Act 2001. Our responsibility is to express an opinion on the Remuneration Report, based on our audit conducted in accordance with Australian Auditing Standards.
OpinionIn our opinion, the Remuneration Report of Village Roadshow Limited for the year ended 30 June 2015, complies with section 300A of the Corporations Act 2001.
Ernst & Young
David ShewringPartner
Melbourne17 September 2015
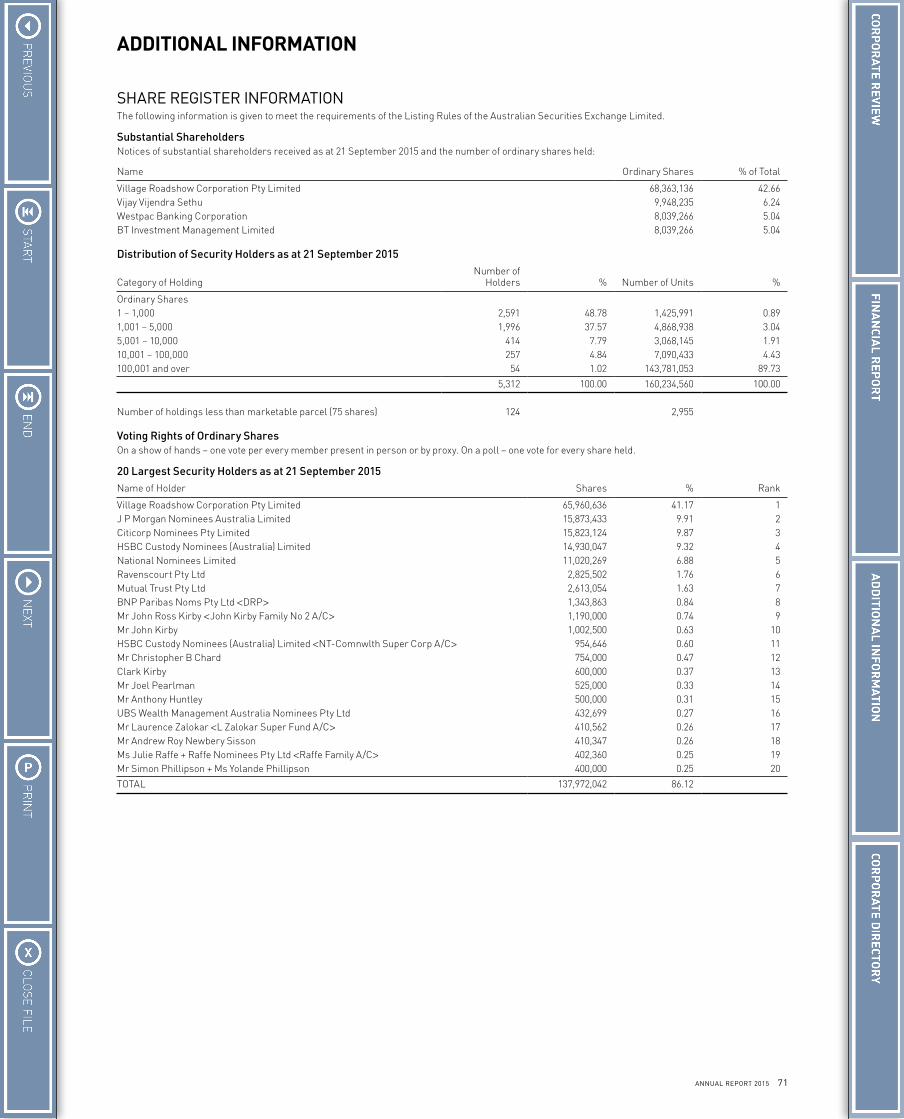
71ANNUAL REPORT 2015
ADDITIONAL INFORMATION
SHARE REGISTER INFORMATIONThe following information is given to meet the requirements of the Listing Rules of the Australian Securities Exchange Limited.
Substantial ShareholdersNotices of substantial shareholders received as at 21 September 2015 and the number of ordinary shares held:
Name Ordinary Shares % of Total
Village Roadshow Corporation Pty Limited 68,363,136 42.66Vijay Vijendra Sethu 9,948,235 6.24Westpac Banking Corporation 8,039,266 5.04BT Investment Management Limited 8,039,266 5.04
Distribution of Security Holders as at 21 September 2015
Category of HoldingNumber of
Holders % Number of Units %
Ordinary Shares1 – 1,000 2,591 48.78 1,425,991 0.891,001 – 5,000 1,996 37.57 4,868,938 3.045,001 – 10,000 414 7.79 3,068,145 1.9110,001 – 100,000 257 4.84 7,090,433 4.43100,001 and over 54 1.02 143,781,053 89.73
5,312 100.00 160,234,560 100.00
Number of holdings less than marketable parcel (75 shares) 124 2,955
Voting Rights of Ordinary SharesOn a show of hands – one vote per every member present in person or by proxy. On a poll – one vote for every share held.
20 Largest Security Holders as at 21 September 2015Name of Holder Shares % Rank
Village Roadshow Corporation Pty Limited 65,960,636 41.17 1J P Morgan Nominees Australia Limited 15,873,433 9.91 2Citicorp Nominees Pty Limited 15,823,124 9.87 3HSBC Custody Nominees (Australia) Limited 14,930,047 9.32 4National Nominees Limited 11,020,269 6.88 5Ravenscourt Pty Ltd 2,825,502 1.76 6Mutual Trust Pty Ltd 2,613,054 1.63 7BNP Paribas Noms Pty Ltd <DRP> 1,343,863 0.84 8Mr John Ross Kirby <John Kirby Family No 2 A/C> 1,190,000 0.74 9Mr John Kirby 1,002,500 0.63 10HSBC Custody Nominees (Australia) Limited <NT-Comnwlth Super Corp A/C> 954,646 0.60 11Mr Christopher B Chard 754,000 0.47 12Clark Kirby 600,000 0.37 13Mr Joel Pearlman 525,000 0.33 14Mr Anthony Huntley 500,000 0.31 15UBS Wealth Management Australia Nominees Pty Ltd 432,699 0.27 16Mr Laurence Zalokar <L Zalokar Super Fund A/C> 410,562 0.26 17Mr Andrew Roy Newbery Sisson 410,347 0.26 18Ms Julie Raffe + Raffe Nominees Pty Ltd <Raffe Family A/C> 402,360 0.25 19Mr Simon Phillipson + Ms Yolande Phillipson 400,000 0.25 20
TOTAL 137,972,042 86.12
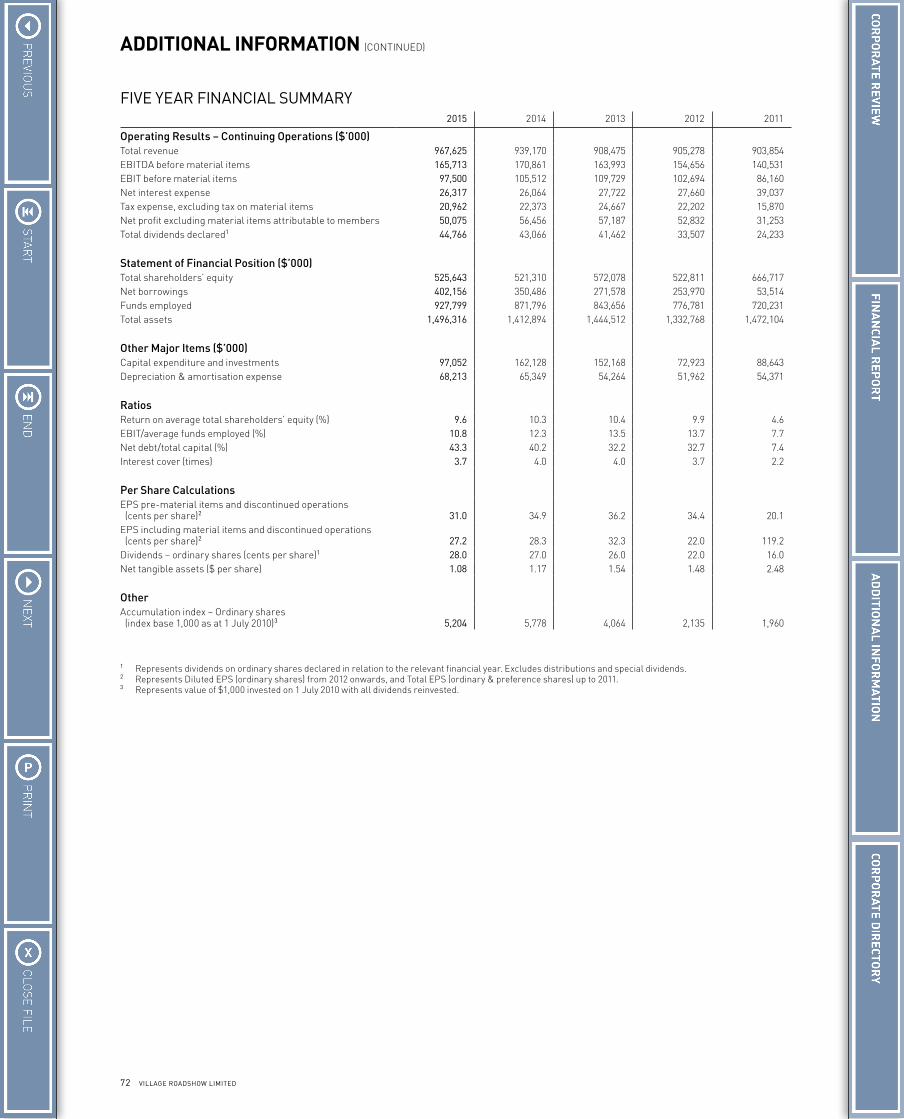
72 VILLAGE ROADSHOW LIMITED
ADDITIONAL INFORMATION (CONTINUED)
FIVE YEAR FINANCIAL SUMMARY2015 2014 2013 2012 2011
Operating Results – Continuing Operations ($’000)Total revenue 967,625 939,170 908,475 905,278 903,854EBITDA before material items 165,713 170,861 163,993 154,656 140,531EBIT before material items 97,500 105,512 109,729 102,694 86,160Net interest expense 26,317 26,064 27,722 27,660 39,037Tax expense, excluding tax on material items 20,962 22,373 24,667 22,202 15,870Net profit excluding material items attributable to members 50,075 56,456 57,187 52,832 31,253Total dividends declared1 44,766 43,066 41,462 33,507 24,233
Statement of Financial Position ($’000)Total shareholders’ equity 525,643 521,310 572,078 522,811 666,717Net borrowings 402,156 350,486 271,578 253,970 53,514Funds employed 927,799 871,796 843,656 776,781 720,231Total assets 1,496,316 1,412,894 1,444,512 1,332,768 1,472,104
Other Major Items ($’000)Capital expenditure and investments 97,052 162,128 152,168 72,923 88,643Depreciation & amortisation expense 68,213 65,349 54,264 51,962 54,371
RatiosReturn on average total shareholders’ equity (%) 9.6 10.3 10.4 9.9 4.6EBIT/average funds employed (%) 10.8 12.3 13.5 13.7 7.7Net debt/total capital (%) 43.3 40.2 32.2 32.7 7.4Interest cover (times) 3.7 4.0 4.0 3.7 2.2
Per Share CalculationsEPS pre-material items and discontinued operations (cents per share)2 31.0 34.9 36.2 34.4 20.1EPS including material items and discontinued operations (cents per share)2 27.2 28.3 32.3 22.0 119.2Dividends – ordinary shares (cents per share)1 28.0 27.0 26.0 22.0 16.0Net tangible assets ($ per share) 1.08 1.17 1.54 1.48 2.48
OtherAccumulation index – Ordinary shares (index base 1,000 as at 1 July 2010)3 5,204 5,778 4,064 2,135 1,960
1 Represents dividends on ordinary shares declared in relation to the relevant financial year. Excludes distributions and special dividends.2 Represents Diluted EPS (ordinary shares) from 2012 onwards, and Total EPS (ordinary & preference shares) up to 2011.3 Represents value of $1,000 invested on 1 July 2010 with all dividends reinvested.
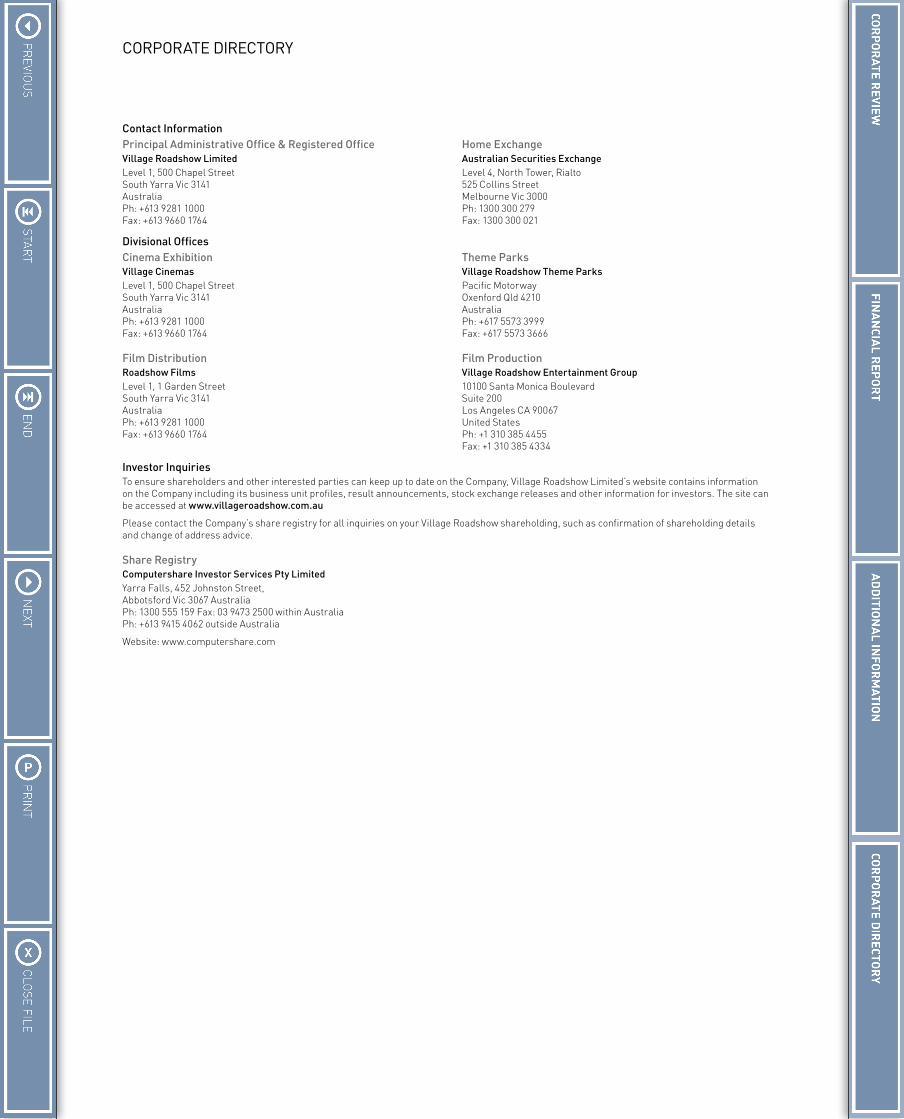
CORPORATE DIRECTORY
Contact InformationPrincipal Administrative Office & Registered OfficeVillage Roadshow LimitedLevel 1, 500 Chapel StreetSouth Yarra Vic 3141AustraliaPh: +613 9281 1000Fax: +613 9660 1764
Home ExchangeAustralian Securities ExchangeLevel 4, North Tower, Rialto525 Collins StreetMelbourne Vic 3000Ph: 1300 300 279Fax: 1300 300 021
Divisional OfficesCinema ExhibitionVillage CinemasLevel 1, 500 Chapel StreetSouth Yarra Vic 3141AustraliaPh: +613 9281 1000Fax: +613 9660 1764
Film DistributionRoadshow FilmsLevel 1, 1 Garden StreetSouth Yarra Vic 3141AustraliaPh: +613 9281 1000Fax: +613 9660 1764
Theme ParksVillage Roadshow Theme ParksPacific MotorwayOxenford Qld 4210AustraliaPh: +617 5573 3999Fax: +617 5573 3666
Film ProductionVillage Roadshow Entertainment Group10100 Santa Monica BoulevardSuite 200Los Angeles CA 90067United StatesPh: +1 310 385 4455Fax: +1 310 385 4334
Investor InquiriesTo ensure shareholders and other interested parties can keep up to date on the Company, Village Roadshow Limited’s website contains information on the Company including its business unit profiles, result announcements, stock exchange releases and other information for investors. The site can be accessed at www.villageroadshow.com.au
Please contact the Company’s share registry for all inquiries on your Village Roadshow shareholding, such as confirmation of shareholding details and change of address advice.
Share RegistryComputershare Investor Services Pty LimitedYarra Falls, 452 Johnston Street,Abbotsford Vic 3067 AustraliaPh: 1300 555 159 Fax: 03 9473 2500 within AustraliaPh: +613 9415 4062 outside Australia
Website: www.computershare.com

w w w.v i l l a g e ro a d s h ow.c o m . a u