Embed Size (px)
Citation preview

PINNACLE VALUE FUNDA SERIES OF THE
BERTOLET CAPITAL TRUST
PINNACLE VALUE FUNDA SERIES OF THE
BERTOLET CAPITAL TRUST
PINNACLE VALUE FUNDA SERIES OF THE
BERTOLET CAPITAL TRUST
PINNACLE VALUE FUNDA SERIES OF THE
BERTOLET CAPITAL TRUST
PINNACLE VALUE FUNDA SERIES OF THE
BERTOLET CAPITAL TRUST
PMS 2573 PMS 298 PMS 375 PMS 237 PMS 1525
PINNACLE VALUE FUNDA SERIES OF THE
BERTOLET CAPITAL TRUST
ANNUAL REPORT
December 31, 2015
www.pinnaclevaluefund.com
PINNACLE VALUE FUND 1BERTOLET CAPITAL TRUST
Pinnacle Value Fund Annual Report December 31, 2015
Dear Fellow Shareholders,Our Fund’s NAV fell 6% in 2015. We ended the year at 42 positions with a weighted average market cap of $420 million, a dividend yield of 1.9%, and a price to book value ratio of 80%. The benchmark R2000 fell 4.4% during the same period.
Total Return 2015 2014 2013 2012 2011Pinnacle Value Fund (6.0)% 4.8% 16.6% 18.9% (4.9)%Russell 2000 (4.4) 4.9 38.6 16.3 (4.2)S&P 500 1.4% 13.7% 32.0% 15.9% 2.1%
(All returns include dividend reinvestment. Past returns do no predict future results. Results do not reflect taxes payable on distributions or redemptions of shares held in taxable accounts.)
Commentary/Portfolio ActivityAs you can see from the above box scores, small cap U.S. equities had a challenging 2015. While we fared slightly worse than the benchmark, our results were disappointing and should have been better. Down years are never fun and our underperformance can be tied primarily to our energy exposure where oil & natural gas prices have remained “lower for longer” than most expected, including us. As mentioned in our Semi-Annual Report (June 30) we suspected that a lot of the energy “bad news” was reflected in current share prices but the stocks might have another leg down. This is exactly what happened and we used the ensuing weakness to add to our positions. Unfortunately, commodity prices continued to fall due to oversupply fears and stocks we considered bargains became even more so. At year end, our energy holdings represented 12% of net assets diversified across 10 positions including royalty trusts, offshore supply vessels, well drillers, seismic shooters and others. All badly lagged the market because of disappointing operating results. We still like them and, except for some minor yearend tax selling, have not sold a share. But their stumbles damaged our performance and it’s no sure thing how quickly they may regain their stride. We are in touch with managements on a regular basis. We have no firm opinion on when energy prices will rise but we suspect they will. While this downturn is the most severe in decades, we see several reasons for optimism:1. According to Baker Hughes, rigs drilling for natural gas in North America have fallen 94% from 1600 to
100 while rigs drilling for oil have fallen 74% from 1600 to 410 which should eventually limit supply. 2. Operators are cutting operating costs and capital expenditures to the bone, setting the stage for
significant earnings leverage when prices eventually rise.3. Many producing countries including Saudi Arabia, Russia, Nigeria and Venezuela are facing budget
woes and cutting back on billions of gasoline and other subsidies. Ordinary citizens are feeling the pinch and further cuts may trigger civil unrest which is the last thing their leaders desire now.
4. Insiders are buying at several of our companies which is usually a good sign.

PINNACLE VALUE FUNDA SERIES OF THE
BERTOLET CAPITAL TRUST
PINNACLE VALUE FUNDA SERIES OF THE
BERTOLET CAPITAL TRUST
PINNACLE VALUE FUNDA SERIES OF THE
BERTOLET CAPITAL TRUST
PINNACLE VALUE FUNDA SERIES OF THE
BERTOLET CAPITAL TRUST
PINNACLE VALUE FUNDA SERIES OF THE
BERTOLET CAPITAL TRUST
PMS 2573 PMS 298 PMS 375 PMS 237 PMS 1525
PINNACLE VALUE FUNDA SERIES OF THE
BERTOLET CAPITAL TRUST
ANNUAL REPORT
December 31, 2015
www.pinnaclevaluefund.com
PINNACLE VALUE FUND 1BERTOLET CAPITAL TRUST
Pinnacle Value Fund Annual Report December 31, 2015
Dear Fellow Shareholders,Our Fund’s NAV fell 6% in 2015. We ended the year at 42 positions with a weighted average market cap of $420 million, a dividend yield of 1.9%, and a price to book value ratio of 80%. The benchmark R2000 fell 4.4% during the same period.
Total Return 2015 2014 2013 2012 2011Pinnacle Value Fund (6.0)% 4.8% 16.6% 18.9% (4.9)%Russell 2000 (4.4) 4.9 38.6 16.3 (4.2)S&P 500 1.4% 13.7% 32.0% 15.9% 2.1%
(All returns include dividend reinvestment. Past returns do no predict future results. Results do not reflect taxes payable on distributions or redemptions of shares held in taxable accounts.)
Commentary/Portfolio ActivityAs you can see from the above box scores, small cap U.S. equities had a challenging 2015. While we fared slightly worse than the benchmark, our results were disappointing and should have been better. Down years are never fun and our underperformance can be tied primarily to our energy exposure where oil & natural gas prices have remained “lower for longer” than most expected, including us. As mentioned in our Semi-Annual Report (June 30) we suspected that a lot of the energy “bad news” was reflected in current share prices but the stocks might have another leg down. This is exactly what happened and we used the ensuing weakness to add to our positions. Unfortunately, commodity prices continued to fall due to oversupply fears and stocks we considered bargains became even more so. At year end, our energy holdings represented 12% of net assets diversified across 10 positions including royalty trusts, offshore supply vessels, well drillers, seismic shooters and others. All badly lagged the market because of disappointing operating results. We still like them and, except for some minor yearend tax selling, have not sold a share. But their stumbles damaged our performance and it’s no sure thing how quickly they may regain their stride. We are in touch with managements on a regular basis. We have no firm opinion on when energy prices will rise but we suspect they will. While this downturn is the most severe in decades, we see several reasons for optimism:1. According to Baker Hughes, rigs drilling for natural gas in North America have fallen 94% from 1600 to
100 while rigs drilling for oil have fallen 74% from 1600 to 410 which should eventually limit supply. 2. Operators are cutting operating costs and capital expenditures to the bone, setting the stage for
significant earnings leverage when prices eventually rise.3. Many producing countries including Saudi Arabia, Russia, Nigeria and Venezuela are facing budget
woes and cutting back on billions of gasoline and other subsidies. Ordinary citizens are feeling the pinch and further cuts may trigger civil unrest which is the last thing their leaders desire now.
4. Insiders are buying at several of our companies which is usually a good sign.
PINNACLE VALUE FUND 15BERTOLET CAPITAL TRUST
2 PINNACLE VALUE FUNDBERTOLET CAPITAL TRUST
We’re hopeful that any or all of the above will lead to higher share prices longer term. However, sentiment remains extremely negative and it’s hard to see an immediate catalyst that will change this.
On the positive side of the ledger, Capital Southwest was our standout performer after they decided to spin off their high margin specialty chemicals business causing the stock to rise nicely. Anchor Banc formed a board committee to evaluate “strategic options” including a sale following the election of a major dissident shareholder to the board. The remaining winners were spread across a variety of firms where strong operating performance resulted in higher share prices including National Security Group,Old Republic and Regency Affiliates. Wilshire Bancorp agreed to merge with BBCN Bancorp, a competing Korean American Bank bringing to a close a long and profitable relationship with the bank.(Please see opposite page for a more complete list of 2015 Winners and Sinners)
OutlookRecently a shareholder asked us what we thought of the US small cap market. We replied that we try not to think too much about the market and devote our efforts to finding compelling values where the shares are trading at a significant discount to underlying asset values or earnings power. However, a large part of our “opportunity set” is driven by the level of the US small cap market, widely defined as the Russell 2000 (R2000). When the R2000 is trading at elevated levels, we often have trouble finding reasonably priced merchandise. Conversely, when the R2000 is trading at depressed levels, bargains are more apparent. At Dec. 31, the R2000 was down about 13% from its all time high set in June 2015.Indeed, we are finding some bargains but hope to uncover more if the market drifts lower.
The world remains awash in excess liquidity fostered by easy central bank policy which, in our opinion, continues to prop up asset prices. There have been few major blowups (economic or political) and corporate profits remain at record highs. All of this will probably continue for a while longer until an event or two triggers a reality check. We have no idea when this will occur. So we’ll stay conservative, be attentive to dislocations and let valuations be our guide.
By now you should have received your year end statement. The Fund distributed $1.39 of long termcapital gains in late December so you also should have received a Form 1099-DIV for 2015 if you hold your shares in a taxable account. As always, should you have any questions about your account or the Fund, don’t hesitate to call or write. Thank you for your continued support of our work.
John E. Deysher Pinnacle Value Fund President & Portfolio Manager 745 Fifth Ave.- 2400212-605-7100 New York, NY 10151
Expense Example (Unaudited)As a shareholder of the Pinnacle Value Fund, you incur ongoing costs which typically include management fees and other Fund expenses. This Example is intended to help you understand your ongoing costs (in dollars) of investing in the Fund and to compare these costs with the ongoing costs of investing in other mutual funds. The Example is based on an investment of $1,000 invested at the beginning of the period and held for the entire period, July 1, 2015 through December 31, 2015.
Actual ExpensesThe first line of the table below provides information about actual account values and actual expenses. You may use the information in this line, together with the amount you invested, to estimate the expenses that you paid over the period. Simply divide your account value by $1,000 (for example, an $8,600 account value divided by $1,000 = 8.6), then multiply the result by the number in the first line under the heading entitled “Expenses Paid During Period” to estimate the expenses you paid on your account during this period.
Hypothetical Example for Comparison PurposesThe second line of the table below provides information about hypothetical account values and hypothetical expenses based on the Fund’s actual expense ratios and an assumed rate of return of 5% per year before expenses, which are not the Fund’s actual returns. The hypothetical account values and expenses may not be used to estimate the actual ending account balance or expenses you paid for the period. You may use this information to compare the ongoing costs of investing in this Fund and other funds. To do so, compare this 5% hypothetical example with the 5% hypothetical examples that appear in the shareholder reports of the other funds.
Pinnacle Value Fund Beginning Account ValueJuly 1, 2015
Ending Account ValueDecember 31, 2015
Expenses Paid During the Period*July 1, 2015 to December 31, 2015
Actual $1,000.00 $907.89 $6.97
Hypothetical(5% Annual Return before expenses) $1,000.00 $1,017.90 $7.38
* Expenses are equal to the Fund’s annualized expense ratio of 1.45%, multiplied by the average account value over the period, multiplied by 184/365 (to reflect the one-half year period).
1 Year 5 Year 10 YearPinnacle Value Fund -5.99% 5.36% 6.09%Russell 2000 Index -4.42% 9.19% 6.81%
Chart assumes an initial investment of $10,000 made on 1/1/2006. Total return is based on the net change in NAV and assuming reinvestment of all dividends and other distributions. Performance figures represent past performance which is not predictive of future performance. Investment return and principal value will fluctuate so that your shares, when redeemed, may be worth more or less than their original cost.Throughout the period shown, the investment adviser has voluntarily waived and reimbursed certain expenses of the Fund. Without such waivers and reimbursements returns would be lower.
AVERAGE ANNUAL RATE OF RETURN (%) FOR PERIOD ENDED DECEMBER 31, 2015
AVERAGE ANNUAL RATE OF RETURN (%) FOR PERIOD ENDED DECEMBER 31, 2014
1 Year 3 Year 5 Year 10 Year
Pinnacle Value Fund -5.99% 4.74% 5.36% 6.09% Russell 2000 Index -4.42% 11.65% 9.19% 6.81%
6,000
8,000
10,000
12,000
14,000
16,000
18,000
20,000
22,000
24,000
26,000
1/1/2006
6/30/2006
12/31/2006
6/30/2007
12/31/2007
6/30/2008
12/31/2008
6/30/2009
12/31/2009
6/30/2010
12/31/2010
6/30/2011
12/31/2011
6/30/2012
12/31/2012
6/30/2013
12/31/2013
6/30/2014
12/31/2014
6/30/2015
12/31/2015
Pinnacle Value Fund $18,050 Russell 2000 Index $19,313
Chart assumes an initial investment of $10,000 made on 1/1/2006. Total return is based on the net change in NAV and assuming reinvestment of all dividends and other distributions. Performance figures represent past performance which is not predictive of future performance. Investment return and principal value will fluctuate so that your shares, when redeemed, may be worth more or less than their original cost. Throughout the period shown, the investment adviser has voluntarily waived and reimbursed certain expenses of the Fund. Without such waivers and reimbursements returns would be lower.

PINNACLE VALUE FUND 3BERTOLET CAPITAL TRUST
14 PINNACLE VALUE FUNDBERTOLET CAPITAL TRUST
TOP 10 POSITIONS % net assets1. Hallmark Financial- multiline P&C insurer 4.9 %2. Anchor Banc- savings bank 3.73. First Acceptance- non standard personal auto insurance 3.74. SWK Holdings- life sciences finance 3.35. National Security Group- regional P&C insurer 2.8 6. Regional Management- consumer finance 2.67. MVC Capital- business development co. 2.18. EMC Insurance- regional P&C insurer 2.09. Endurance Specialty- primary & re-insurance 1.910. Gulf Island Fabrication- shipyards & marine fabrication 1.6 Total 28.6 %
YTD TOP 5 WINNERS (realized & unrealized gains)1. Capital Southwest $883,8002. Anchor Banc 498,2003. National Security Group 184,3004. Old Republic Insurance 168,5005. Regency Affiliates 151,600 Total $1,886,400
YTD TOP 5 SINNERS (realized & unrealized losses)1. Gulfmark Offshore $1,071,7002. Unit Corp. 692,4003. Atwood Oceanics 597,7004. Permian Basin Royalty Trust 489,4005. Dawson Geophysics 434,300 Total $3,285,500
SECURITY CLASSIFICATIONSGovernment & Prime Money Market Funds 47.0 %Insurance 16.4Energy 12.4Financial Services 8.5Closed End Funds 6.7Banks & Thrifts 4.8Consumer Goods & Services 1.5Real Estate 1.0Conglomerates 1.0Industrial Goods & Services 0.7 Total 100.0 %
PROXY VOTING (Unaudited)A description of the policies and procedures the Fund uses to determine how to vote proxies relating to portfolio securities and information regarding how the Fund voted those proxies during the most recent 12 month period ended June 30, are available without charge upon request by calling 877-369-3705 or visiting www.pinnaclevaluefund.com or www.sec.gov.
QUARTERLY PORTFOLIO HOLDINGS (unaudited)Fund files a complete schedule of investments with the SEC for the first and third quarter of each fiscal year on Form N-Q. Fund’s first and third fiscal quarters end on March 31 and Sept. 30. Form N-Q filing must be made within 60 days of the end of the quarter, and Fund’s first Form N-Q was filed with the SEC on Nov. 29, 2004. Fund Form N-Qs are available at www.sec.gov or may be reviewed and copied at the SEC’s Public Reference Room in Washington, DC (call 1-800-732-0330 for information on the operation of the Public Reference Room). You may also obtain copies by calling the Fund at 1-877-369-3705.
SUPPLEMENTAL INFORMATION The following table provides biographical information with respect to each Trustee who may be reached at the Mutual Shareholder Services address below. Our SAI includes additional information about the trustees which may be obtained by visiting www.pinnaclevaluefund.com or by calling 877-369-3705.
Name, Age Position with Fund
Term of Office, Length of Time Served
Principal Occupation During Past 5 years
Other Directorships
Interested Trustee
John E. Deysher, CFA (60) Trustee Unlimited Since Inception
President, Secretary, Treasurer Pinnacle Value Fund None
Independent Trustees
Edward P. Breau, CFA (83) Trustee Unlimited Since Inception Private Investor None
Richard M. Connelly (60) Trustee Unlimited Since Inception
Counsel, CCOJG Wentworth (finance) None
James W. Denney (50) Trustee Unlimited Since Inception
President, Mohawk AssetManagement None
TRUSTEES AND SERVICE PROVIDERSTrustees: Edward P. Breau, Richard M. Connelly, James W. Denney, John E. Deysher Transfer Agent: Mutual Shareholder Services, 8000 Town Centre Dr- 400, Broadview Heights, OH 44147Custodian: US Bank, 425 Walnut St., Cincinnati OH 45202Independent Registered Public Accounting Firm: Tait, Weller & Baker LLP, 1818 Market St,- 2400, Philadelphia PA 19103

PINNACLE VALUE FUND 13BERTOLET CAPITAL TRUST
4 PINNACLE VALUE FUNDBERTOLET CAPITAL TRUST
The accompanying notes are an integral part of the financial statements.
Schedule of InvestmentsDecember 31, 2015
Shares/Principal Amount Basis Market Value % of Assets
REPORT OF INDEPENDENT REGISTERED PUBLIC ACCOUNTING FIRM
To the Shareholders and Board of TrusteesBertolet Capital TrustNew York, New York
We have audited the accompanying statement of assets and liabilities of Pinnacle Value Fund, a series of shares of Bertolet Capital Trust (“Trust”), including the schedule of investments, as of December 31, 2015, and the related statement of operations for the year then ended, the statements of changes in net assets for each of the two years in the period then ended, and the financial highlights for each of the five years in the period then ended. These financial statements and financial highlights are the responsibility of the Trust’s management. Our responsibility is to express an opinion on these financial statements and financial highlights based on our audits.
We conducted our audits in accordance with auditing standards of the Public Company Accounting Oversight Board (United States). Those standards require that we plan and perform the audit to obtain reasonable assurance about whether the financial statements and financial highlights are free of material misstatement. The Trust is not required to have, nor were we engaged to perform, an audit of its internal control over financial reporting. Our audits included consideration of internal control over financial reporting as a basis for designing audit procedures that are appropriate in the circumstances, but not for the purpose of expressing an opinion on the effectiveness of the Trust’s internal control over financial reporting. Accordingly, we express no such opinion. An audit includes examining, on a test basis, evidence supporting the amounts and disclosures in the financial statements. Our procedures included confirmation of securities owned as of December 31, 2015, by correspondence with the custodian. An audit also includes assessing the accounting principles used and significant estimates made by management, as well as evaluating the overall financial statement presentation. We believe that our audits provide a reasonable basis for our opinion.
In our opinion, the financial statements and financial highlights referred to above present fairly, in all material respects, the financial position of Pinnacle Value Fund as of December 31, 2015, the results of its operations for the year then ended, the changes in its net assets for each of the two years in the period then ended, and its financial highlights for each of the five years in the period then ended, in conformity with accounting principles generally accepted in the United States of America.
TAIT, WELLER & BAKER LLP Philadelphia, Pennsylvania February 22, 2016

PINNACLE VALUE FUND 5BERTOLET CAPITAL TRUST
12 PINNACLE VALUE FUNDBERTOLET CAPITAL TRUST
The accompanying notes are an integral part of the financial statements.
Schedule of InvestmentsDecember 31, 2015
Shares/Principal Amount Basis Market Value % of Assets
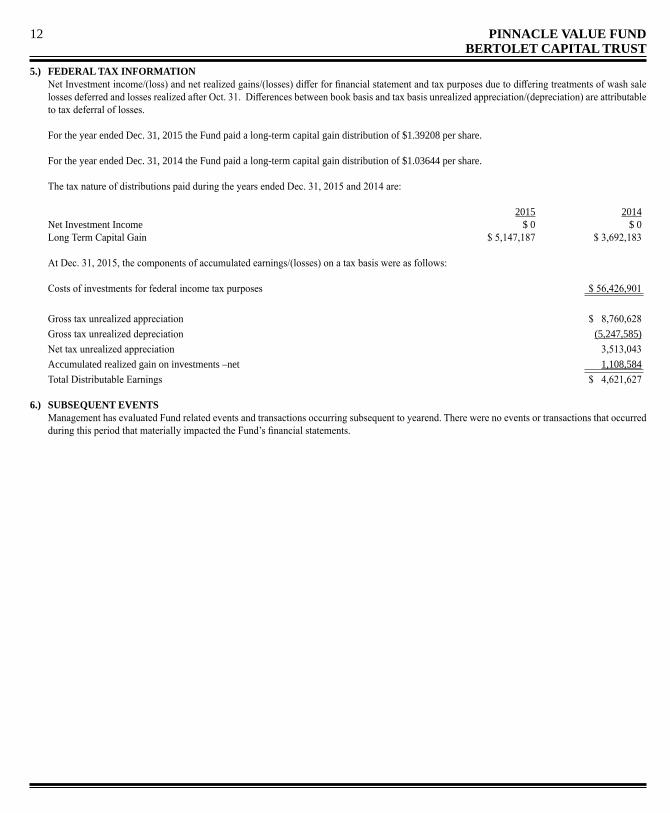
5.) FEDERAL TAX INFORMATION Net Investment income/(loss) and net realized gains/(losses) differ for financial statement and tax purposes due to differing treatments of wash sale
losses deferred and losses realized after Oct. 31. Differences between book basis and tax basis unrealized appreciation/(depreciation) are attributable to tax deferral of losses.
For the year ended Dec. 31, 2015 the Fund paid a long-term capital gain distribution of $1.39208 per share.
For the year ended Dec. 31, 2014 the Fund paid a long-term capital gain distribution of $1.03644 per share.
The tax nature of distributions paid during the years ended Dec. 31, 2015 and 2014 are:
2015 2014 Net Investment Income $ 0 $ 0 Long Term Capital Gain $ 5,147,187 $ 3,692,183
At Dec. 31, 2015, the components of accumulated earnings/(losses) on a tax basis were as follows:
Costs of investments for federal income tax purposes $ 56,426,901 Gross tax unrealized appreciation $ 8,760,628 Gross tax unrealized depreciation (5,247,585) Net tax unrealized appreciation 3,513,043 Accumulated realized gain on investments –net 1,108,584 Total Distributable Earnings $ 4,621,627
6.) SUBSEQUENT EVENTS Management has evaluated Fund related events and transactions occurring subsequent to yearend. There were no events or transactions that occurred
during this period that materially impacted the Fund’s financial statements.

PINNACLE VALUE FUND 11BERTOLET CAPITAL TRUST
6 PINNACLE VALUE FUNDBERTOLET CAPITAL TRUST
The accompanying notes are an integral part of the financial statements.
Statement of Assets and LiabilitiesDecember 31, 2015
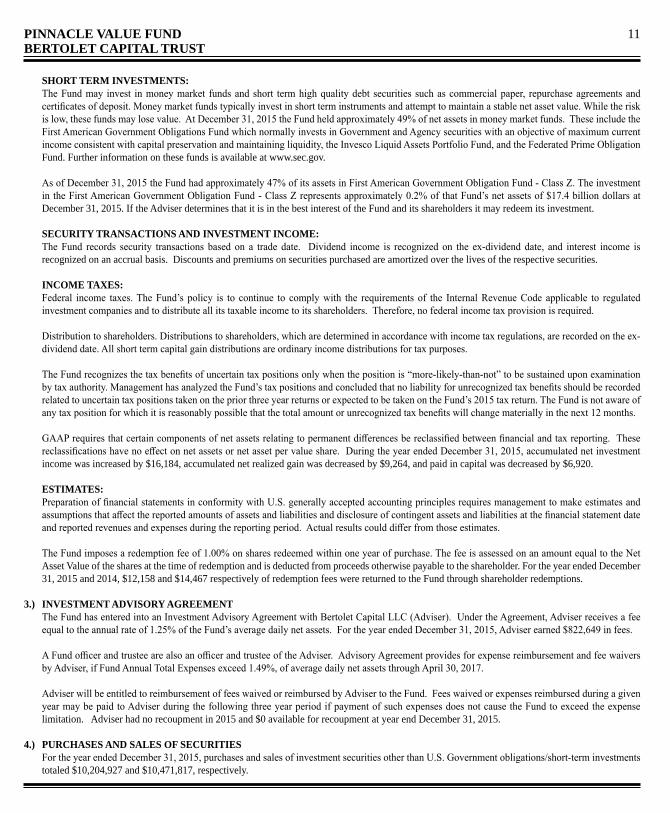
SHORT TERM INVESTMENTS: The Fund may invest in money market funds and short term high quality debt securities such as commercial paper, repurchase agreements and
certificates of deposit. Money market funds typically invest in short term instruments and attempt to maintain a stable net asset value. While the risk is low, these funds may lose value. At December 31, 2015 the Fund held approximately 49% of net assets in money market funds. These include the First American Government Obligations Fund which normally invests in Government and Agency securities with an objective of maximum current income consistent with capital preservation and maintaining liquidity, the Invesco Liquid Assets Portfolio Fund, and the Federated Prime Obligation Fund. Further information on these funds is available at www.sec.gov.
As of December 31, 2015 the Fund had approximately 47% of its assets in First American Government Obligation Fund - Class Z. The investment in the First American Government Obligation Fund - Class Z represents approximately 0.2% of that Fund’s net assets of $17.4 billion dollars at December 31, 2015. If the Adviser determines that it is in the best interest of the Fund and its shareholders it may redeem its investment.
SECURITY TRANSACTIONS AND INVESTMENT INCOME: The Fund records security transactions based on a trade date. Dividend income is recognized on the ex-dividend date, and interest income is
recognized on an accrual basis. Discounts and premiums on securities purchased are amortized over the lives of the respective securities. INCOME TAXES: Federal income taxes. The Fund’s policy is to continue to comply with the requirements of the Internal Revenue Code applicable to regulated
investment companies and to distribute all its taxable income to its shareholders. Therefore, no federal income tax provision is required.
Distribution to shareholders. Distributions to shareholders, which are determined in accordance with income tax regulations, are recorded on the ex-dividend date. All short term capital gain distributions are ordinary income distributions for tax purposes.
The Fund recognizes the tax benefits of uncertain tax positions only when the position is “more-likely-than-not” to be sustained upon examination by tax authority. Management has analyzed the Fund’s tax positions and concluded that no liability for unrecognized tax benefits should be recorded related to uncertain tax positions taken on the prior three year returns or expected to be taken on the Fund’s 2015 tax return. The Fund is not aware of any tax position for which it is reasonably possible that the total amount or unrecognized tax benefits will change materially in the next 12 months.
GAAP requires that certain components of net assets relating to permanent differences be reclassified between financial and tax reporting. These reclassifications have no effect on net assets or net asset per value share. During the year ended December 31, 2015, accumulated net investment income was increased by $16,184, accumulated net realized gain was decreased by $9,264, and paid in capital was decreased by $6,920.
ESTIMATES: Preparation of financial statements in conformity with U.S. generally accepted accounting principles requires management to make estimates and
assumptions that affect the reported amounts of assets and liabilities and disclosure of contingent assets and liabilities at the financial statement date and reported revenues and expenses during the reporting period. Actual results could differ from those estimates.
The Fund imposes a redemption fee of 1.00% on shares redeemed within one year of purchase. The fee is assessed on an amount equal to the Net Asset Value of the shares at the time of redemption and is deducted from proceeds otherwise payable to the shareholder. For the year ended December 31, 2015 and 2014, $12,158 and $14,467 respectively of redemption fees were returned to the Fund through shareholder redemptions.
3.) INVESTMENT ADVISORY AGREEMENT The Fund has entered into an Investment Advisory Agreement with Bertolet Capital LLC (Adviser). Under the Agreement, Adviser receives a fee
equal to the annual rate of 1.25% of the Fund’s average daily net assets. For the year ended December 31, 2015, Adviser earned $822,649 in fees.
A Fund officer and trustee are also an officer and trustee of the Adviser. Advisory Agreement provides for expense reimbursement and fee waivers by Adviser, if Fund Annual Total Expenses exceed 1.49%, of average daily net assets through April 30, 2017.
Adviser will be entitled to reimbursement of fees waived or reimbursed by Adviser to the Fund. Fees waived or expenses reimbursed during a given
year may be paid to Adviser during the following three year period if payment of such expenses does not cause the Fund to exceed the expense limitation. Adviser had no recoupment in 2015 and $0 available for recoupment at year end December 31, 2015.
4.) PURCHASES AND SALES OF SECURITIES For the year ended December 31, 2015, purchases and sales of investment securities other than U.S. Government obligations/short-term investments
totaled $10,204,927 and $10,471,817, respectively.

PINNACLE VALUE FUND 7BERTOLET CAPITAL TRUST
10 PINNACLE VALUE FUNDBERTOLET CAPITAL TRUST
The accompanying notes are an integral part of the financial statements.
Statement of OperationsFor the Year Ended December 31, 2015
Notes to Financial Statements1.) ORGANIZATION: Pinnacle Value Fund (”Fund”) is registered under the Investment Company Act of 1940 as an open-end investment management company and is
the only series of the Bertolet Capital Trust, a Delaware business trust organized on January 1, 2003 (“Trust”). The Trust’s Declaration of Trust authorizes the Board of Trustees to issue an unlimited number of Fund shares. Each share of the Fund has equal voting, dividend, distribution, and liquidation rights. The Fund’s investment objective is long term capital appreciation with income as a secondary objective. The Fund in an investment company and accordingly follows the investment company accounting and reporting guidance of the Financial Accounting Standards Board (FASB) Accounting Standard Codification Topic 946 “Financial Services-Investment Companies”.
2.) SIGNIFICANT ACCOUNTING POLICIES SECURITY VALUATION: The Fund will primarily invest in equities and convertible securities. Investments in securities are carried at market value. Securities traded on any
exchange or on the NASDAQ over-the-counter market are valued at the last quoted sale price on that day. Lacking a last sale price, a security is valued at its last bid price on that day, except when, in the Adviser’s opinion, the last bid price does not accurately reflect the current value of the security. When market quotations are not readily available, when Adviser determines the last bid price does not accurately reflect the current value or when restricted securities are being valued, such securities are valued as determined in good faith by Adviser, in conformity with guidelines adopted by and subject to review of the Board of Trustees.
Fixed income securities are valued by using market quotations, but may be valued on the basis of prices furnished by a pricing service when Adviser believes such prices accurately reflect the fair market value. A pricing service uses electronic data processing techniques based on yield spreads relating to securities with similar characteristics to determine prices for normal institutional-size trading lots of debt securities without regard to sale or bid prices. When prices are not readily available from a pricing service, or when restricted or illiquid securities are being valued, securities are valued at fair value determined in good faith by Adviser, subject to review of the Board of Trustees. Short term investments in fixed income securities with maturities of less than 60 days when acquired, or which are within 60 days of maturity, are valued by using the amortized cost method.
The Trust has performed an analysis of all existing investments to determine the significance and character of all inputs to their fair value determination. Various inputs are used in determining the value of each investment which are summarized in the following three broad levels:
Level 1 – quoted prices in active markets for identical securities Level 2 – other significant observable inputs (including quoted prices for similar securities, interest rates, prepayment speeds, credit risk, yield curves & similar data.) Level 3 – significant unobservable inputs (including the Fund’s own assumptions in determining fair value which may require a high degree of judgement)
The availability of observable inputs may vary by security and is affected by a wide variety of factors including type of security, liquidity and other characteristics unique to the security. If valuation is based on models or inputs that are less observable or unobservable in the market, determination of fair value requires more judgment. Thus, the degree of judgment exercised in determining fair value is greatest for Level 3 investments. Inputs used in valuing securities are not indicative of associated risks. Transfers between levels are recognized at the end of a reporting period. Transfer from Level 1 to Level 2 results when a security priced previously with an official close price (Level 1) has no official close price so the bid price is used. The below table summarizes the inputs used at December 31, 2015:
Level 1 Level 2 Level 3 TotalEquity (a) $ 30,881,554 410,387 - $ 31,291,941Money Market Funds 28,648,003 - - 28,648,003Investments at Market $ 59,529,557 410,387 - $ 59,939,944(a) See Schedule of Investments for industry breakout.
The Fund has adopted the financial accounting reporting rules required by the Derivatives and Hedging Topic of FASB Accounting Standards
Codification (FASB ASC). Fund is required to include enhanced disclosure that enables investors to understand how and why a fund uses derivatives, how they are accounted for and how they affect a fund’s results. For the year ended December 31, 2015, the Fund held no derivative instruments.

PINNACLE VALUE FUND 9BERTOLET CAPITAL TRUST
8 PINNACLE VALUE FUNDBERTOLET CAPITAL TRUST
The accompanying notes are an integral part of the financial statements. The accompanying notes are an integral part of the financial statements.
Statement of Changes in Net Assets Financial HighlightsSelected data for a share outstanding throughout the period.
(a) Net of Redemption Fees of $12,158 for the period ended December 31, 2015, and $14,467 for the period ended December 31, 2014.(b) Includes undistributed net investment loss of $(16,184) at December 31, 2015 and $0 at December 31, 2014.

PINNACLE VALUE FUND 7BERTOLET CAPITAL TRUST
10 PINNACLE VALUE FUNDBERTOLET CAPITAL TRUST
The accompanying notes are an integral part of the financial statements.
Statement of OperationsFor the Year Ended December 31, 2015
Notes to Financial Statements1.) ORGANIZATION: Pinnacle Value Fund (”Fund”) is registered under the Investment Company Act of 1940 as an open-end investment management company and is
the only series of the Bertolet Capital Trust, a Delaware business trust organized on January 1, 2003 (“Trust”). The Trust’s Declaration of Trust authorizes the Board of Trustees to issue an unlimited number of Fund shares. Each share of the Fund has equal voting, dividend, distribution, and liquidation rights. The Fund’s investment objective is long term capital appreciation with income as a secondary objective. The Fund in an investment company and accordingly follows the investment company accounting and reporting guidance of the Financial Accounting Standards Board (FASB) Accounting Standard Codification Topic 946 “Financial Services-Investment Companies”.
2.) SIGNIFICANT ACCOUNTING POLICIES SECURITY VALUATION: The Fund will primarily invest in equities and convertible securities. Investments in securities are carried at market value. Securities traded on any
exchange or on the NASDAQ over-the-counter market are valued at the last quoted sale price on that day. Lacking a last sale price, a security is valued at its last bid price on that day, except when, in the Adviser’s opinion, the last bid price does not accurately reflect the current value of the security. When market quotations are not readily available, when Adviser determines the last bid price does not accurately reflect the current value or when restricted securities are being valued, such securities are valued as determined in good faith by Adviser, in conformity with guidelines adopted by and subject to review of the Board of Trustees.
Fixed income securities are valued by using market quotations, but may be valued on the basis of prices furnished by a pricing service when Adviser believes such prices accurately reflect the fair market value. A pricing service uses electronic data processing techniques based on yield spreads relating to securities with similar characteristics to determine prices for normal institutional-size trading lots of debt securities without regard to sale or bid prices. When prices are not readily available from a pricing service, or when restricted or illiquid securities are being valued, securities are valued at fair value determined in good faith by Adviser, subject to review of the Board of Trustees. Short term investments in fixed income securities with maturities of less than 60 days when acquired, or which are within 60 days of maturity, are valued by using the amortized cost method.
The Trust has performed an analysis of all existing investments to determine the significance and character of all inputs to their fair value determination. Various inputs are used in determining the value of each investment which are summarized in the following three broad levels:
Level 1 – quoted prices in active markets for identical securities Level 2 – other significant observable inputs (including quoted prices for similar securities, interest rates, prepayment speeds, credit risk, yield curves & similar data.) Level 3 – significant unobservable inputs (including the Fund’s own assumptions in determining fair value which may require a high degree of judgement)
The availability of observable inputs may vary by security and is affected by a wide variety of factors including type of security, liquidity and other characteristics unique to the security. If valuation is based on models or inputs that are less observable or unobservable in the market, determination of fair value requires more judgment. Thus, the degree of judgment exercised in determining fair value is greatest for Level 3 investments. Inputs used in valuing securities are not indicative of associated risks. Transfers between levels are recognized at the end of a reporting period. Transfer from Level 1 to Level 2 results when a security priced previously with an official close price (Level 1) has no official close price so the bid price is used. The below table summarizes the inputs used at December 31, 2015:
Level 1 Level 2 Level 3 TotalEquity (a) $ 30,881,554 410,387 - $ 31,291,941Money Market Funds 28,648,003 - - 28,648,003Investments at Market $ 59,529,557 410,387 - $ 59,939,944(a) See Schedule of Investments for industry breakout.
The Fund has adopted the financial accounting reporting rules required by the Derivatives and Hedging Topic of FASB Accounting Standards
Codification (FASB ASC). Fund is required to include enhanced disclosure that enables investors to understand how and why a fund uses derivatives, how they are accounted for and how they affect a fund’s results. For the year ended December 31, 2015, the Fund held no derivative instruments.
PINNACLE VALUE FUND 11BERTOLET CAPITAL TRUST
6 PINNACLE VALUE FUNDBERTOLET CAPITAL TRUST
The accompanying notes are an integral part of the financial statements.
Statement of Assets and LiabilitiesDecember 31, 2015
SHORT TERM INVESTMENTS: The Fund may invest in money market funds and short term high quality debt securities such as commercial paper, repurchase agreements and
certificates of deposit. Money market funds typically invest in short term instruments and attempt to maintain a stable net asset value. While the risk is low, these funds may lose value. At December 31, 2015 the Fund held approximately 49% of net assets in money market funds. These include the First American Government Obligations Fund which normally invests in Government and Agency securities with an objective of maximum current income consistent with capital preservation and maintaining liquidity, the Invesco Liquid Assets Portfolio Fund, and the Federated Prime Obligation Fund. Further information on these funds is available at www.sec.gov.
As of December 31, 2015 the Fund had approximately 47% of its assets in First American Government Obligation Fund - Class Z. The investment in the First American Government Obligation Fund - Class Z represents approximately 0.2% of that Fund’s net assets of $17.4 billion dollars at December 31, 2015. If the Adviser determines that it is in the best interest of the Fund and its shareholders it may redeem its investment.
SECURITY TRANSACTIONS AND INVESTMENT INCOME: The Fund records security transactions based on a trade date. Dividend income is recognized on the ex-dividend date, and interest income is
recognized on an accrual basis. Discounts and premiums on securities purchased are amortized over the lives of the respective securities. INCOME TAXES: Federal income taxes. The Fund’s policy is to continue to comply with the requirements of the Internal Revenue Code applicable to regulated
investment companies and to distribute all its taxable income to its shareholders. Therefore, no federal income tax provision is required.
Distribution to shareholders. Distributions to shareholders, which are determined in accordance with income tax regulations, are recorded on the ex-dividend date. All short term capital gain distributions are ordinary income distributions for tax purposes.
The Fund recognizes the tax benefits of uncertain tax positions only when the position is “more-likely-than-not” to be sustained upon examination by tax authority. Management has analyzed the Fund’s tax positions and concluded that no liability for unrecognized tax benefits should be recorded related to uncertain tax positions taken on the prior three year returns or expected to be taken on the Fund’s 2015 tax return. The Fund is not aware of any tax position for which it is reasonably possible that the total amount or unrecognized tax benefits will change materially in the next 12 months.
GAAP requires that certain components of net assets relating to permanent differences be reclassified between financial and tax reporting. These reclassifications have no effect on net assets or net asset per value share. During the year ended December 31, 2015, accumulated net investment income was increased by $16,184, accumulated net realized gain was decreased by $9,264, and paid in capital was decreased by $6,920.
ESTIMATES: Preparation of financial statements in conformity with U.S. generally accepted accounting principles requires management to make estimates and
assumptions that affect the reported amounts of assets and liabilities and disclosure of contingent assets and liabilities at the financial statement date and reported revenues and expenses during the reporting period. Actual results could differ from those estimates.
The Fund imposes a redemption fee of 1.00% on shares redeemed within one year of purchase. The fee is assessed on an amount equal to the Net Asset Value of the shares at the time of redemption and is deducted from proceeds otherwise payable to the shareholder. For the year ended December 31, 2015 and 2014, $12,158 and $14,467 respectively of redemption fees were returned to the Fund through shareholder redemptions.
3.) INVESTMENT ADVISORY AGREEMENT The Fund has entered into an Investment Advisory Agreement with Bertolet Capital LLC (Adviser). Under the Agreement, Adviser receives a fee
equal to the annual rate of 1.25% of the Fund’s average daily net assets. For the year ended December 31, 2015, Adviser earned $822,649 in fees.
A Fund officer and trustee are also an officer and trustee of the Adviser. Advisory Agreement provides for expense reimbursement and fee waivers by Adviser, if Fund Annual Total Expenses exceed 1.49%, of average daily net assets through April 30, 2017.
Adviser will be entitled to reimbursement of fees waived or reimbursed by Adviser to the Fund. Fees waived or expenses reimbursed during a given
year may be paid to Adviser during the following three year period if payment of such expenses does not cause the Fund to exceed the expense limitation. Adviser had no recoupment in 2015 and $0 available for recoupment at year end December 31, 2015.
4.) PURCHASES AND SALES OF SECURITIES For the year ended December 31, 2015, purchases and sales of investment securities other than U.S. Government obligations/short-term investments
totaled $10,204,927 and $10,471,817, respectively.
PINNACLE VALUE FUND 5BERTOLET CAPITAL TRUST
12 PINNACLE VALUE FUNDBERTOLET CAPITAL TRUST
The accompanying notes are an integral part of the financial statements.
Schedule of InvestmentsDecember 31, 2015
Shares/Principal Amount Basis Market Value % of Assets
5.) FEDERAL TAX INFORMATION Net Investment income/(loss) and net realized gains/(losses) differ for financial statement and tax purposes due to differing treatments of wash sale
losses deferred and losses realized after Oct. 31. Differences between book basis and tax basis unrealized appreciation/(depreciation) are attributable to tax deferral of losses.
For the year ended Dec. 31, 2015 the Fund paid a long-term capital gain distribution of $1.39208 per share.
For the year ended Dec. 31, 2014 the Fund paid a long-term capital gain distribution of $1.03644 per share.
The tax nature of distributions paid during the years ended Dec. 31, 2015 and 2014 are:
2015 2014 Net Investment Income $ 0 $ 0 Long Term Capital Gain $ 5,147,187 $ 3,692,183
At Dec. 31, 2015, the components of accumulated earnings/(losses) on a tax basis were as follows:
Costs of investments for federal income tax purposes $ 56,426,901 Gross tax unrealized appreciation $ 8,760,628 Gross tax unrealized depreciation (5,247,585) Net tax unrealized appreciation 3,513,043 Accumulated realized gain on investments –net 1,108,584 Total Distributable Earnings $ 4,621,627
6.) SUBSEQUENT EVENTS Management has evaluated Fund related events and transactions occurring subsequent to yearend. There were no events or transactions that occurred
during this period that materially impacted the Fund’s financial statements.

PINNACLE VALUE FUND 13BERTOLET CAPITAL TRUST
4 PINNACLE VALUE FUNDBERTOLET CAPITAL TRUST
The accompanying notes are an integral part of the financial statements.
Schedule of InvestmentsDecember 31, 2015
Shares/Principal Amount Basis Market Value % of Assets
REPORT OF INDEPENDENT REGISTERED PUBLIC ACCOUNTING FIRM
To the Shareholders and Board of TrusteesBertolet Capital TrustNew York, New York
We have audited the accompanying statement of assets and liabilities of Pinnacle Value Fund, a series of shares of Bertolet Capital Trust (“Trust”), including the schedule of investments, as of December 31, 2015, and the related statement of operations for the year then ended, the statements of changes in net assets for each of the two years in the period then ended, and the financial highlights for each of the five years in the period then ended. These financial statements and financial highlights are the responsibility of the Trust’s management. Our responsibility is to express an opinion on these financial statements and financial highlights based on our audits.
We conducted our audits in accordance with auditing standards of the Public Company Accounting Oversight Board (United States). Those standards require that we plan and perform the audit to obtain reasonable assurance about whether the financial statements and financial highlights are free of material misstatement. The Trust is not required to have, nor were we engaged to perform, an audit of its internal control over financial reporting. Our audits included consideration of internal control over financial reporting as a basis for designing audit procedures that are appropriate in the circumstances, but not for the purpose of expressing an opinion on the effectiveness of the Trust’s internal control over financial reporting. Accordingly, we express no such opinion. An audit includes examining, on a test basis, evidence supporting the amounts and disclosures in the financial statements. Our procedures included confirmation of securities owned as of December 31, 2015, by correspondence with the custodian. An audit also includes assessing the accounting principles used and significant estimates made by management, as well as evaluating the overall financial statement presentation. We believe that our audits provide a reasonable basis for our opinion.
In our opinion, the financial statements and financial highlights referred to above present fairly, in all material respects, the financial position of Pinnacle Value Fund as of December 31, 2015, the results of its operations for the year then ended, the changes in its net assets for each of the two years in the period then ended, and its financial highlights for each of the five years in the period then ended, in conformity with accounting principles generally accepted in the United States of America.
TAIT, WELLER & BAKER LLP Philadelphia, Pennsylvania February 22, 2016

PINNACLE VALUE FUND 3BERTOLET CAPITAL TRUST
14 PINNACLE VALUE FUNDBERTOLET CAPITAL TRUST
TOP 10 POSITIONS % net assets1. Hallmark Financial- multiline P&C insurer 4.9 %2. Anchor Banc- savings bank 3.73. First Acceptance- non standard personal auto insurance 3.74. SWK Holdings- life sciences finance 3.35. National Security Group- regional P&C insurer 2.8 6. Regional Management- consumer finance 2.67. MVC Capital- business development co. 2.18. EMC Insurance- regional P&C insurer 2.09. Endurance Specialty- primary & re-insurance 1.910. Gulf Island Fabrication- shipyards & marine fabrication 1.6 Total 28.6 %
YTD TOP 5 WINNERS (realized & unrealized gains)1. Capital Southwest $883,8002. Anchor Banc 498,2003. National Security Group 184,3004. Old Republic Insurance 168,5005. Regency Affiliates 151,600 Total $1,886,400
YTD TOP 5 SINNERS (realized & unrealized losses)1. Gulfmark Offshore $1,071,7002. Unit Corp. 692,4003. Atwood Oceanics 597,7004. Permian Basin Royalty Trust 489,4005. Dawson Geophysics 434,300 Total $3,285,500
SECURITY CLASSIFICATIONSGovernment & Prime Money Market Funds 47.0 %Insurance 16.4Energy 12.4Financial Services 8.5Closed End Funds 6.7Banks & Thrifts 4.8Consumer Goods & Services 1.5Real Estate 1.0Conglomerates 1.0Industrial Goods & Services 0.7 Total 100.0 %
PROXY VOTING (Unaudited)A description of the policies and procedures the Fund uses to determine how to vote proxies relating to portfolio securities and information regarding how the Fund voted those proxies during the most recent 12 month period ended June 30, are available without charge upon request by calling 877-369-3705 or visiting www.pinnaclevaluefund.com or www.sec.gov.
QUARTERLY PORTFOLIO HOLDINGS (unaudited)Fund files a complete schedule of investments with the SEC for the first and third quarter of each fiscal year on Form N-Q. Fund’s first and third fiscal quarters end on March 31 and Sept. 30. Form N-Q filing must be made within 60 days of the end of the quarter, and Fund’s first Form N-Q was filed with the SEC on Nov. 29, 2004. Fund Form N-Qs are available at www.sec.gov or may be reviewed and copied at the SEC’s Public Reference Room in Washington, DC (call 1-800-732-0330 for information on the operation of the Public Reference Room). You may also obtain copies by calling the Fund at 1-877-369-3705.
SUPPLEMENTAL INFORMATION The following table provides biographical information with respect to each Trustee who may be reached at the Mutual Shareholder Services address below. Our SAI includes additional information about the trustees which may be obtained by visiting www.pinnaclevaluefund.com or by calling 877-369-3705.
Name, Age Position with Fund
Term of Office, Length of Time Served
Principal Occupation During Past 5 years
Other Directorships
Interested Trustee
John E. Deysher, CFA (60) Trustee Unlimited Since Inception
President, Secretary, Treasurer Pinnacle Value Fund None
Independent Trustees
Edward P. Breau, CFA (83) Trustee Unlimited Since Inception Private Investor None
Richard M. Connelly (60) Trustee Unlimited Since Inception
Counsel, CCOJG Wentworth (finance) None
James W. Denney (50) Trustee Unlimited Since Inception
President, Mohawk AssetManagement None
TRUSTEES AND SERVICE PROVIDERSTrustees: Edward P. Breau, Richard M. Connelly, James W. Denney, John E. Deysher Transfer Agent: Mutual Shareholder Services, 8000 Town Centre Dr- 400, Broadview Heights, OH 44147Custodian: US Bank, 425 Walnut St., Cincinnati OH 45202Independent Registered Public Accounting Firm: Tait, Weller & Baker LLP, 1818 Market St,- 2400, Philadelphia PA 19103

PINNACLE VALUE FUND 15BERTOLET CAPITAL TRUST
2 PINNACLE VALUE FUNDBERTOLET CAPITAL TRUST
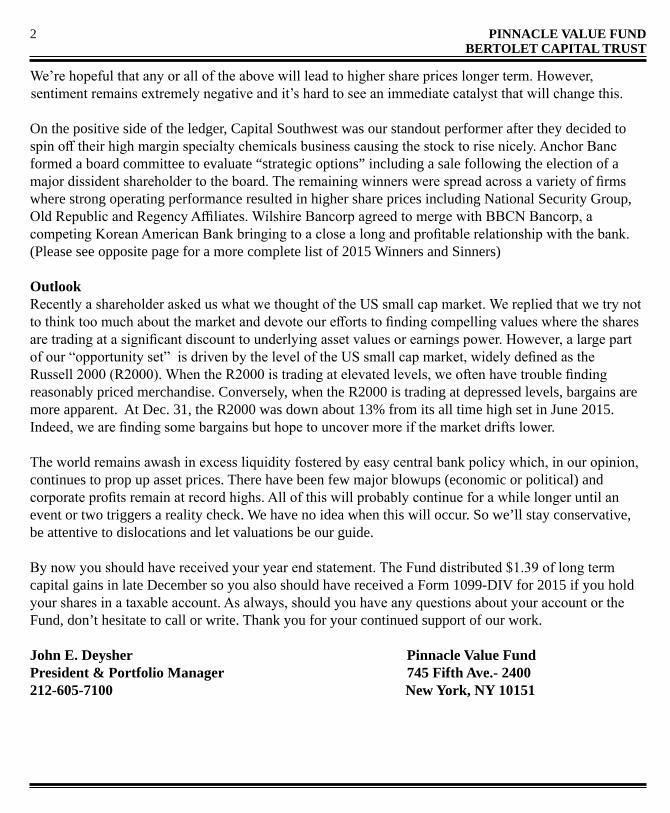
We’re hopeful that any or all of the above will lead to higher share prices longer term. However, sentiment remains extremely negative and it’s hard to see an immediate catalyst that will change this.
On the positive side of the ledger, Capital Southwest was our standout performer after they decided to spin off their high margin specialty chemicals business causing the stock to rise nicely. Anchor Banc formed a board committee to evaluate “strategic options” including a sale following the election of a major dissident shareholder to the board. The remaining winners were spread across a variety of firms where strong operating performance resulted in higher share prices including National Security Group,Old Republic and Regency Affiliates. Wilshire Bancorp agreed to merge with BBCN Bancorp, a competing Korean American Bank bringing to a close a long and profitable relationship with the bank.(Please see opposite page for a more complete list of 2015 Winners and Sinners)
OutlookRecently a shareholder asked us what we thought of the US small cap market. We replied that we try not to think too much about the market and devote our efforts to finding compelling values where the shares are trading at a significant discount to underlying asset values or earnings power. However, a large part of our “opportunity set” is driven by the level of the US small cap market, widely defined as the Russell 2000 (R2000). When the R2000 is trading at elevated levels, we often have trouble finding reasonably priced merchandise. Conversely, when the R2000 is trading at depressed levels, bargains are more apparent. At Dec. 31, the R2000 was down about 13% from its all time high set in June 2015.Indeed, we are finding some bargains but hope to uncover more if the market drifts lower.
The world remains awash in excess liquidity fostered by easy central bank policy which, in our opinion, continues to prop up asset prices. There have been few major blowups (economic or political) and corporate profits remain at record highs. All of this will probably continue for a while longer until an event or two triggers a reality check. We have no idea when this will occur. So we’ll stay conservative, be attentive to dislocations and let valuations be our guide.
By now you should have received your year end statement. The Fund distributed $1.39 of long termcapital gains in late December so you also should have received a Form 1099-DIV for 2015 if you hold your shares in a taxable account. As always, should you have any questions about your account or the Fund, don’t hesitate to call or write. Thank you for your continued support of our work.
John E. Deysher Pinnacle Value Fund President & Portfolio Manager 745 Fifth Ave.- 2400212-605-7100 New York, NY 10151
Expense Example (Unaudited)As a shareholder of the Pinnacle Value Fund, you incur ongoing costs which typically include management fees and other Fund expenses. This Example is intended to help you understand your ongoing costs (in dollars) of investing in the Fund and to compare these costs with the ongoing costs of investing in other mutual funds. The Example is based on an investment of $1,000 invested at the beginning of the period and held for the entire period, July 1, 2015 through December 31, 2015.
Actual ExpensesThe first line of the table below provides information about actual account values and actual expenses. You may use the information in this line, together with the amount you invested, to estimate the expenses that you paid over the period. Simply divide your account value by $1,000 (for example, an $8,600 account value divided by $1,000 = 8.6), then multiply the result by the number in the first line under the heading entitled “Expenses Paid During Period” to estimate the expenses you paid on your account during this period.
Hypothetical Example for Comparison PurposesThe second line of the table below provides information about hypothetical account values and hypothetical expenses based on the Fund’s actual expense ratios and an assumed rate of return of 5% per year before expenses, which are not the Fund’s actual returns. The hypothetical account values and expenses may not be used to estimate the actual ending account balance or expenses you paid for the period. You may use this information to compare the ongoing costs of investing in this Fund and other funds. To do so, compare this 5% hypothetical example with the 5% hypothetical examples that appear in the shareholder reports of the other funds.
Pinnacle Value Fund Beginning Account ValueJuly 1, 2015
Ending Account ValueDecember 31, 2015
Expenses Paid During the Period*July 1, 2015 to December 31, 2015
Actual $1,000.00 $907.89 $6.97
Hypothetical(5% Annual Return before expenses) $1,000.00 $1,017.90 $7.38
* Expenses are equal to the Fund’s annualized expense ratio of 1.45%, multiplied by the average account value over the period, multiplied by 184/365 (to reflect the one-half year period).
1 Year 5 Year 10 YearPinnacle Value Fund -5.99% 5.36% 6.09%Russell 2000 Index -4.42% 9.19% 6.81%
Chart assumes an initial investment of $10,000 made on 1/1/2006. Total return is based on the net change in NAV and assuming reinvestment of all dividends and other distributions. Performance figures represent past performance which is not predictive of future performance. Investment return and principal value will fluctuate so that your shares, when redeemed, may be worth more or less than their original cost.Throughout the period shown, the investment adviser has voluntarily waived and reimbursed certain expenses of the Fund. Without such waivers and reimbursements returns would be lower.
AVERAGE ANNUAL RATE OF RETURN (%) FOR PERIOD ENDED DECEMBER 31, 2015
AVERAGE ANNUAL RATE OF RETURN (%) FOR PERIOD ENDED DECEMBER 31, 2014
1 Year 3 Year 5 Year 10 Year
Pinnacle Value Fund -5.99% 4.74% 5.36% 6.09% Russell 2000 Index -4.42% 11.65% 9.19% 6.81%
6,000
8,000
10,000
12,000
14,000
16,000
18,000
20,000
22,000
24,000
26,000
1/1/2006
6/30/2006
12/31/2006
6/30/2007
12/31/2007
6/30/2008
12/31/2008
6/30/2009
12/31/2009
6/30/2010
12/31/2010
6/30/2011
12/31/2011
6/30/2012
12/31/2012
6/30/2013
12/31/2013
6/30/2014
12/31/2014
6/30/2015
12/31/2015
Pinnacle Value Fund $18,050 Russell 2000 Index $19,313
Chart assumes an initial investment of $10,000 made on 1/1/2006. Total return is based on the net change in NAV and assuming reinvestment of all dividends and other distributions. Performance figures represent past performance which is not predictive of future performance. Investment return and principal value will fluctuate so that your shares, when redeemed, may be worth more or less than their original cost. Throughout the period shown, the investment adviser has voluntarily waived and reimbursed certain expenses of the Fund. Without such waivers and reimbursements returns would be lower.