Embed Size (px)
Citation preview

HOLDING
ANNUALREPORT
2017
2
3
3
3
5
5
6
7
9
9
10
11
11
12
14
14
15
16
16
17
18
37
42
64
65
68
INDEX
© Fabio Mantovani
Administrative and auditing boards
Report Of The Statutory Auditors About The Evolution Management
• Introduction
• Tremagi Group
• Reference framework
- Energy and Gas demand
- Energy and Gas offer
- Energy and Gas prices
• Summary of the management
- Information Technology
- Communication Strategy
- Illumia Offers
- Presence on the market
- Energy Balance
• Financial trends and investments
- Reclassified economic statement
- Reclassified Asset statement
- Financial indicators
• Risk management
• Predictable evolution of the management
• Further information
Consolidated Balance sheet
Explanatory note
Report of the Board of Statutory Auditors concerning the balance sheet
until 12/31st/2013
Report of the Auditing Company concerning the balance sheet until
12/31st/2013
Minutes of the Tremagi Meeting

1

54
ADMINISTRATIVE AND AUDITING BOARDS
PricewaterhouseCoopers SpA
Board of Directors
Audit Board
Firm of AuditorsMarco Bernardi, Chairman
Rag. Andrea Berti, Chairman
Matteo Bernardi, Director
Rag. Alberto Collina, Active Auditor
Giulia Bernardi, Director
Dott.ssa Sara Businelli, Active Auditor
Francesco Maria Bernardi, Honorary Chairman
Pacetti Tiziano, Director

2

98
Dear Shareholders,
in the notes to the consolidated financial statements reports are provided about the presentation of the consolidated balance sheet until December, 31st 2017, being the notes in matter integral part thereof; this report constitutes an autonomous statement, drawn up in accordance to art. 2428 of the Italian Civil Code and is mainly aimed to provide an overall information about the salient facts of the management.
The financial year on December, 31st 2017 ended with a Group positive assessment of: €
1.505 thousand as a summary of the findings as set out in the balance sheet and income statement, and as well outlined in notes to the financial statement.The sole-shareholder Tremagi Srl was incorporated on September, 11th 2009 having as a prevailing company activity to acquire and hold shares of the Tremagi Group, activity that has begun in year 2009.
Below the establishment plan of the direct subsidiaries and related companies at December, 31st 2017 is reported:
100%
ILLUMIA AMERICA INC
100%
ILLUMIA NEXT SRL
100%
ILLUMIA S.P.A.
100%
ILLUMIA SWISS SA
TREMAGI SA
100%
TREMAGI SRL
70%
WEKIWI SRL
80%
ILLUMIA TREND SRL
REPORT OF THE STATUTORY AUDITORS ABOUT THE EVOLUTION MANAGEMENT
INTRODUCTION

1110
TREMAGI GROUP
Below a brief description is reported about the directly participated companies and most relevant company’s operations fulfilled during the financial year.
ILLUMIA SWISS SA
Illumia Swiss Company was incorporated on January, 30th 2015 through registered notary deed drawn up by Public Notary Marazzi, in Lugano, annex A Deed registr.nr.305.
Illumia Swiss operates in the field of energy products and assets trade. In particular, during 2017, as a consequence of the multi-yearly management contract concerning the administration of the San Fiorano Robbia electric interconnection for a proportion of 45MW of power, an analysis and scouting process was started to the aim of evaluating new business opportunities on the Swiss market. At the same time the company financed important negotiations for the subscription of EFET and ISDA contracts with primary importance energy operators. This allowed Illumia Swiss front office to increase the wholesale exchange rate of the electric energy and natural gas market in Italy and abroad.
ILLUMIA TREND SRL
The company accomplishes on behalf of the Group the following business:
• technical consulting about the coverage of the risk related to the fees applied to Illumia SpA final customers and evaluation of contracts concerning wholesale trade of energy products and consulting in the negotiation of framework contracts with the counterparts;
• trade management of electric energy from energy-sparing plants;
• logistic services of gas transport, storage, balance;
• support and consulting activity in the revision, drawing-up, negotiation of natural gas con-signments trade contracts, including assistance in possible negotiation with the counterparts;
• introduction among active counterparties of price risk coverage solutions and possible assis-tance in hedges negotiation;
• individuation of natural gas consignments purchase or sell opportunities as well outside the PSV.
WEKIWI S.R.L.
This is a “project company” aimed to the development of a new web portal for the acquisition of new web customers. On 12/31/2017 appears to be still at the start-up stage.
In particular, Wewiki.it is the web portal aimed to propose itself as the first online provider of electric energy and gas to private customers and micro business. Wekiwi will become the second commercial brand of the group, targeted to the on-line customers. It will provide advanced instruments for the subscription of contracts and supply management. The customers are put in a position to fulfil all the management operations directly on the website or through app. Wekiwi represents also an innovation lab for the Tremagi Group that can experiment through this new brand new products/services or new typology of offer and management of the customer.
ILLUMIA NEXT S.R.L
Illumia Next Srl Company was incorporated on July, 18th 2017 through notary deed drawn up by Public Notary Vico, registered in Bologna on July, 25th 2017, Deed registr.nr.140971IT.
The Company’s object is the electric energy and natural gas trade and on 31/12/2017 appears to be still non-operating.
ILLUMIA SPA
It’s the most important operating company of the Group that, also for what concerns 2017 financial year, reaffirms its trade and consolidation process, being a dynamic and market focused activity. Although the energy sector’s conditions did not provide clear indications about the development of the liberalization process and the indicators described just a very light % increase (3,6% to 4,5%) in the passage from the higher protection market to free market, Illumia achieved the pre-set increase goals. These results have been achieved through an organic and extraordinary increase balance strategy.
The volumes of overall sales on the different markets increased in comparison to 2016:
• electric energy 3.667 GWh to 4.220 GWh (+15%);
• natural gas 68 mln Smc to 86 mln (+27%);
Differently from the previous year the Group’s revenues (+17% in comparison to 2016 balance sheet) have been supported also by Group’s performance external factors like the national increase of the demand and the national decrease of the electric energy price.
An increasingly final customer care aimed strategy, with a view to an increasing opening of the market, obtained more important increases in the higher performance channels productivity:
• Direct Consumer and Micro-business direct networks: +14%;
• Web sales: +34%;
• Inbound toll-free number: +47%;
• SME direct trade network: +183%.
Good results in trading activity has not however prevented Illumia’s ambitions to increase, making an acceleration necessary in the achievement of the Five-Years-Term Industrial Plan. It was therefore chosen to activate an internal Task Force with the aim to individuate acquisitions opportunities on the market. The guidelines at the ground of this research have been mainly 3:
1. electric and gas sector reality, with a higher customer portfolio than 30.000 active points of supply;
2. active realities on market segments where Illumia’s presence was lower;
3. realities containing an expertise non-developed by Illumia.
After having examined different dossiers, Electra Spa’s one was evaluated as corresponding to what required; a company 100% hold by the Swiss BKW AG. The operation, fulfilled between July and October, allowed Illumia to acquire the business branch of Electra dedicated to the Reseller and SME sectors. That operation respected the three defined guidelines: by convey-ing about 70.000 customers, through 20 Resellers, and bringing to Illumia a still non-developed market segment and a specific know-how provided team.
During 2017 the cease of the regulated fees expiration was confirmed, as provided by Act 124/2017 (Legge Annuale per il Mercato e la Concorrenza – Yearly Legislation for Market and Concurrency) June 30th 2019 was determined as the expiry term for the enforcement of the Enhanced Protection. This important guideline however does not solve the market’s un-certainty related to the modalities this termination will be fulfilled. Nevertheless, the end of legislative period on March 2018 defined that the incoming government will draw up the enforcement decrees, as to say the operational modalities of the definitive opening of the market.
During 2017 Illumia played an active role in trying to establish a network among the various market stakeholders in trying to suggest to the regulator some guidelines in favour of an open and pluralist liberalization. In this view some aggregative initiatives among the different operational realities on the market are significant:
1. the entering in the Manifesto for the energy, together with the main operators on the market and the association of consumers has given an important contribution to the politic debate;
2. the subscription of memoranda of understanding with the Codacons [Consumer Defence Association Coordination Agency] and the Movement in defence of the citizen increased the flow of shared information, oriented to a maximization of the relationship between Illumia and the consumers;
3. the active participation in AIGET [Italian Association of Wholesalers and Traders] contributed to put in common issues like concerns and critical issues of the sector.
1312
REFERENCE FRAMEWORK
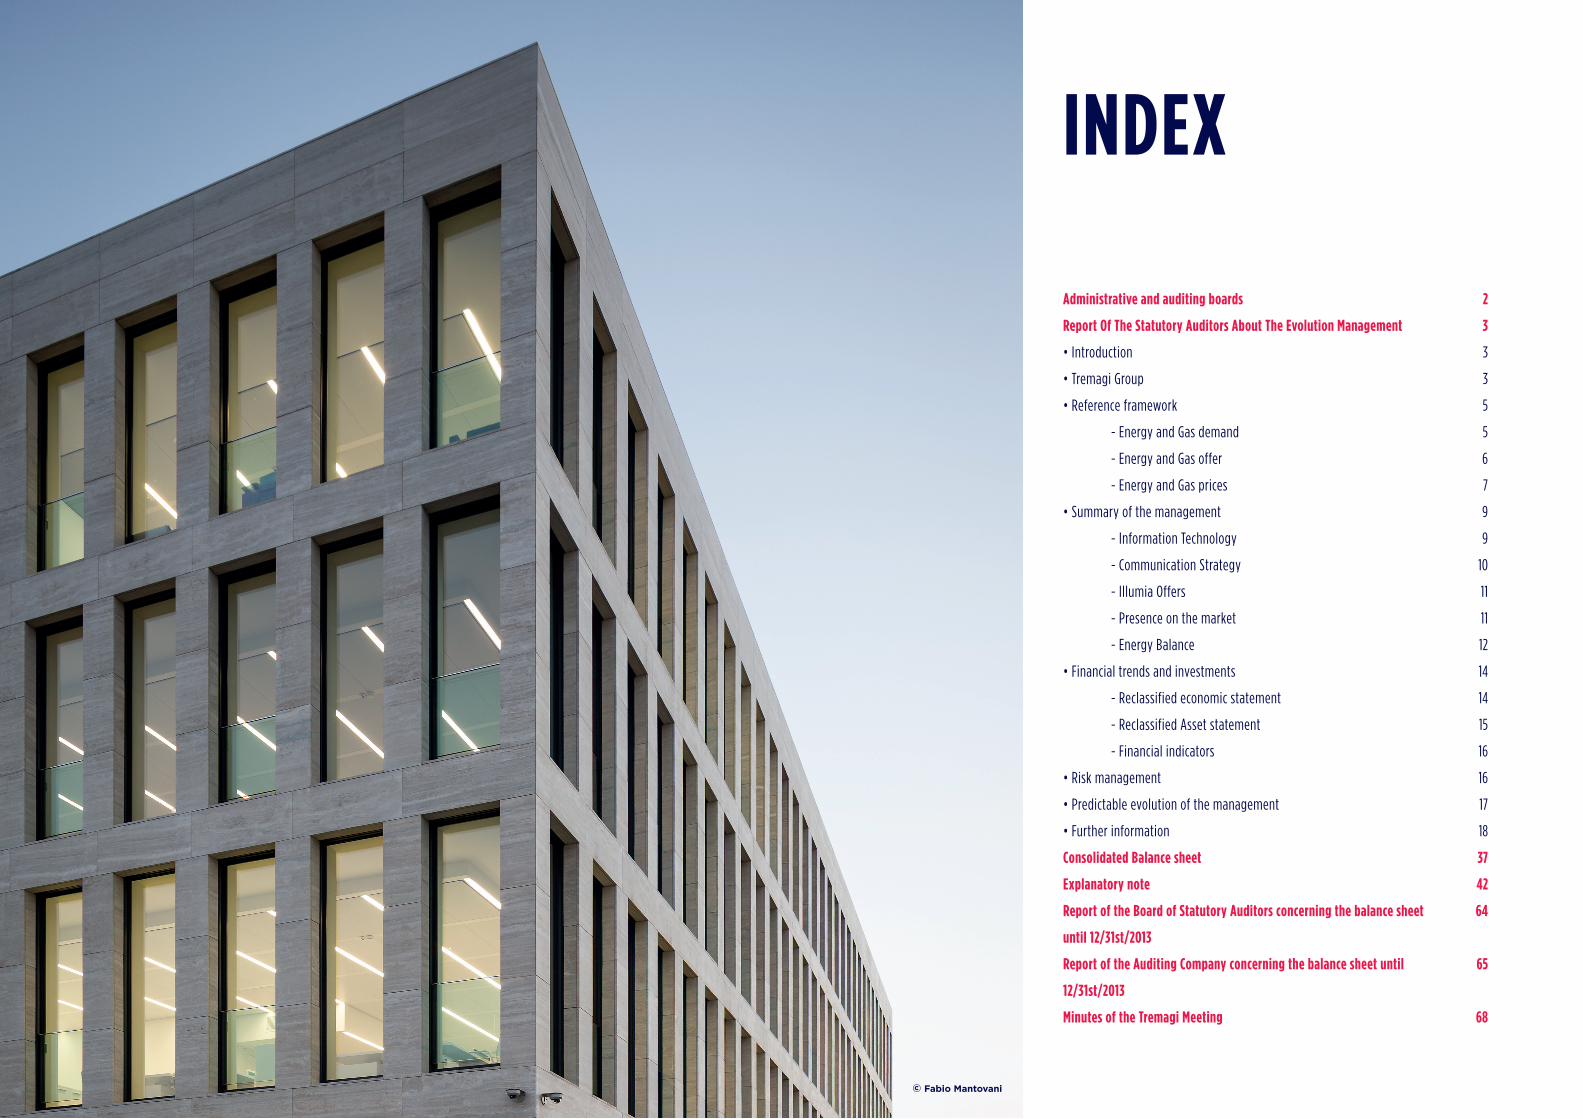
To the aim of a better understanding of the Company’s performance it will be useful to provide some information about the energy reference scenario Illumia operates within.
ENERGY AND GAS DEMAND
As the “Monthly Report about electric system – December 2017 Balance Sheet” edited by Terna, the electric energy consumption in 2017 increased for 2,0% in comparison to the previous year, passing from 314,3 TWh to 320,4 TWh.
The reasons of this increase are to be traced in a resumption of industrial production and the weather effect reported in the months of January and August.
In 2017 the collection of natural gas in Italy, at the third trend upward, confirm the progressive resumption, setting on the value of 85,7 billions of m3 (+5,3%) in comparison to the minimum
value reached in 2014, however remaining on lower levels in comparison to 9 years before, when they have started to withdraw.
Picture 2. Collection of Ml of m3 – Millions of cubic meters
SOURCE: GME Newsletter nr.100 – January 2018
Distribution networks
Thermo-electric
Industrial
Injections in storages
Export, Third-parties networks and system consumptions
Ml d
i mc
0
2008 20122010 20142009 20132011 2015 2016 2017
40.000
20.000
60.000
80.000
10.000
50.000
30.000
70.000
90.000
100.000
The leading force for the increase were mainly the thermo-electric sector’s consumptions that, favoured by the electric energy demand’s increase and the reduction of the hydraulic renewable production move to the highest value from 2012, equal to 25.410 million of m3. At the highest point in the last nine years also the consumption in the industrial sector, equal to 14.313 millions of m3 that contribute to the increase for a +7,2%, giving signs of recovery after a long period of production crisis. Less consistent is the increase in the civil sector’s consumptions (+3,5%) pushed mainly forward by the increase reported in January 2017, characterized by average colder temperatures.
Increasing is also the export, equal to 2.281 millions of m3 (+16,2%) that however remain
non-relevant, representing only the 3% of the whole consumption, while the injection in storage systems withdraw from the historical maximum of the previous year to 11.009 millions of m3 (-1,3%).
GAS AND ENERGY OFFER
Analyzing the annual data appears that in 2017 the electric energy production from renewable sources diminished in comparison to 2016. It is confirmed the significant hydro-electric production decrease that closes 2017 to -14,3% equal to -6,2 TWh in comparison to 2016. The photovoltaic system is increasing in comparison to the values reported for 2016 (+14,0%) while the wind-powered and geothermic production report values in line with 2016 ones.
Picture 1. Cyclical analysis of the demand for electric energy
SOURCE: TERNA – Monthly report about the electric system – 2017 Balance sheet
Seasonally adjusted values Raw Values
2013
J J JF AA OM SM N D23
25
27
29
31
24
26
28
30
32
33
20152014 2016 2017
TWh
J J JF AA OM SM N D J J JF AA OM SM N D J J JF AA OM SM N D J J JF AA OM SM N D

1514
The decrease in the volumes of “green energy” put on the market together with a highly decreasing Foreign Balance, led to an increase in the quantities produced by thermo-electric plants, about plus 9 TWh in comparison to 2016 (equal to +4,6%), thus increasing the demand for natural gas.
The increase in demand for natural gas appears accomplished mainly by import of natural gas that confirm to be the main mean of supply, equal to 69.222 millions of m3 slightly under 2011 levels and 7% increasing. Among enter points, natural gas import from Russia via Tarvisio remain the main source, equal to 30.082 millions of m3 (+6,8%); import of gas from Algeria via Mazara set at the same value of 2016 (18.880
million of m3, +0,3%) follow. In recovery, instead, import from Northern Europe (+8,1%) while the one from Libya has reduced (-3,2%). High and wide increase is reported for the GNL terminal imported gas, favoured by the peak shaving and re-gasification/storage comprehensive service. For the second consecutive year supplying from storage systems reach the record high, equal to 11.234 millions of m3 (+2,5%), representing the 13% of the whole of the input gas; the stored gas stock in the last day of the year reaches 8.487 millions of m3 in decrease in comparison to the same day in 2016 (-3,5%). In decrease, ultimately, the national production, lowering to the record low of 5.239 millions of m3 even if maintaining the whole amount up to 6%.
SOURCE: TERNA – Monthly report about electric system – December 2017 Balance Sheet
Table 1. Energy Balance
[GWh] December2017
December2016 % 17/16 jen-Dic
2017jen-Dic
2016 % 17/16
Hydroelectric 2.350 2.783 -15,6 37.530 43.785 -14,3
Thermal 17.894 19.768 -9,5 199.500 190.771 4,6
of which Biomasses 1.474 1.514 -2,6 17.768 17.956 -1,0
Geothermal 498 497 0,2 5.785 5.867 -1,4
Wind-power 2.228 1.481 50,4 17.492 17.523 -0,2
Photovoltaic 932 923 1,0 24.811 21.757 14,0
Net Whole Production 23.902 25.452 -6,1 285.118 279.703 1,9
Import 3.659 1.872 95,5 42.892 43.181 -0,7
Export 308 554 -44,4 5.132 6.155 -16,6
Foreign Balance 3.351 1.318 154,2 37.760 37.026 2,0
Pumping 315 282 11,7 2.441 2.468 -1,1
Demand for Electric Energy(*) 26.938 26.488 1,7 320.437 314.261 2,0
*Demand for Electric Energy = Production + Foreign Balance – Consumption from pumping
Table 2. Transported gas report for year 2017
Ml di m3 TWh Trend’s Change (%)
Imports 69.222 732.6 +6,7
Mazara 18.880 199.8 +0,3
Tarvisio 30.082 318.4 +6,8
Passo Giries 7.215 76.4 +8,1
Gela 4.641 49.1 -3,2
Gorizia 25 0.3 +299,8
Panigaglia (GNL) 625 6.6 +189,6
Cavarzere (GNL) 6.848 72.5 +20,0
Livorno (GNL) 907 9.6 +90,5
National Production 5.239 55.4 -5,7
Supply from storages 11.234 118.9 +2,5
Placed Total 85.695 906.9 +5,3
Snam Rete Gas network re-delivery 72.405 766.3 +6,1
Industrial 14.313 151.5 +7,2
Thermal-electric 25.410 268.9 +9,0
Delivery networks 32.682 345.9 +3,5
Export, third parties networks and system consumption* 2.281 24.1 +16,2
Consumption whole amount 74.686 790.4 +6,4
Injection in the storages 11.009 117 -1,3
Drawdown whole amount 85.695 906.9 +5,3
* Including reservoir/drawdown variations, losses, consumption and non-itemized gas
SOURCE: GME Newsletter nr.100 – January 2018
ELECTRIC ENERGY AND GAS PRICES
Evolution of electric energy’s price on Power Exchange is below reported in the three
configurations: “Baseload” (for every hour of the day), “Peak” (for daily hours), “Off-peak” (for night hours and holidays) 2005 to 2017.
Picture 3. DAM [MGP Day-Ahead Market], SNP 4[PUN Single National Price]
30
2005 2009 20132007 2011 20152006 2010 20142008 2012 2016 2017
50
70
90
110
40
60
80
100
120
€/M
WH
SOURCE: GME: Newsletter nr.100 – January 2018
Baseload
Peak
Off-peak

1716
In 2017 the purchase price for energy (PUN – SNP) on the Day-Ahead Market (MGP – DAM) sets on 53,95 €/MWh and, although increasing for 11.17 €/MWh in comparison to the recorded low in 2016 (+26,1) recalls the non-high levels of 2014/2015 two-years term. The increase in SNP mirrors a scenario of increasing fees of the main commodities, amongst them mainly the gas one, in its turn led by the increase of the raw oil price and recovery of the exchanged quantities at the highest levels of the last five-years term.
This increase indistinctively characterized all the months of the year, concentrating in the first two-months term, characterized by the continuation of the tensions in French market and, in August, in relation with the exceptional levels of request related to the high temperatures. Emphasized is the higher price per hour, equal to 170.00 €/MWh (the highest value from August 2012), recorded at
6.00 p.m. on Wednesday, December 13th, a day characterized by the declaration of the emergency state by the MiSE [Ministry for the Economic Development].
For what concerns the gas purchase price, fees at Virtual Trading Point (PSV – VTP) reverse the lowering trend of the last years and increase for 26% from the lowest level in 2016.
In terms of prices, weak increases are reported on year term on all the markets, with levels ranging from 19,26 €/MWh of the Management System Guideline (MSG) and 19,67 €/MWh of MI-Gas, all slightly lower in comparison to the average VTP fee. The rise appears concentred in the last two months of 2017 and is attributable to the increase of consumption in the two months term and the episodes reported in December after the accident occurred in Austria, all in a €pean upward trend.
The wholly resumed scenario represents once more an interesting opportunity for Illumia to increase and consolidate its business. The downturn in consumption on the final market, reported in the previous balance sheets, appears to have come to a halt. This will affect positively the wholesale companies that can count on a more steady portfolio. In this environment, Illumia represent an aggregator for demand and enhanced its skills in maximization of the supply and source portfolio’s management. In this regard it is to be highlighted that interesting outlooks to a further growth will come from ongoing initiatives aimed to the overcoming of the greater protection market foreseen
for 2019. Large part of the residential final customers (or also low-tension commercial uses) are until today supplied by greater protection suppliers. The regulations and prices framework until today have been an obstacle to the transfer of millions of customers from the greater protection markets to free market. The fees and regulation framework has been until today an obstacle to the passage of millions of customers from Enhanced Protection Market to the Free market. We hope that the mentioned proceedings will be formalized so to facilitate the complete liberalization of the electric energy market. These forecasts appear as important opportunities of development for Illumia.
Picture 4. Natural gas market prices*
12
24
36
18
30
42
48
2011 2012 2013 2014 2015 20172016
DAM ME PBGAS G-1(1) PBGAS G+1(1)
Royalties VTP QE/Pfor(2) MGS
SOURCE: GME data; Thomson-Reuters; Source: GME Newsletter nr.100 – January 2018
* DAM and ME are continuous trading markets, Royalties and PB-Gas are auction markets, VTP is a listing and Pfor an index.(1) In 2016 for the G+1 and G-1 segments, the data are related to the first 9 months of the year, for MSG and MPL [Monetary Policy Loosening] to the last three.(2) Until September 2013 QE index
SUMMARIES OF THE MANAGEMENT
INFORMATION TECHNOLOGY
In 2017 Illumia fulfilled the refitting project of the whole application platform.
The selection led to the choice of SAP platform as a software of reference, Genesys as a Contact Centre platform, Microsoft PowerBi as Data Warehouse system.
The overall investment is about € 10 million in 5 years and the project provides the delivery on January 2019.
Besides being the world leader in ERP solutions, SAP is in Italy the mostly consolidated solution on Utilities’ market, a solution adopted by the main players on Italian and €pean markets as well.This strategic choice, together with the realization of an avant-garde technologic infrastructure, adopted by the moving to the new registered office occurred during 2016, puts Illumia in condition to have all the necessary technical features to achieve a significant dimensional step forward, as to say play a main role in the liberalization process for the electric sector.
Magic Quadrant for Operational Database Management System
Magic Quadrant for Contact Center Infrastructure, Worldwide
Magic Quadrant for Business Intelligence and Analytics Platforms
FONTE: Gartenr (Febbraio 2017)
VISIONAIRES
CHALLENGERS
NICHE PLAYERS
LEADERS
Ab
ility
to
exe
cute
Completness of vision
VISIONAIRES
CHALLENGERS
NICHE PLAYERS
LEADERS
Ab
ility
to
exe
cute
Completness of vision
VISIONAIRES
CHALLENGERS
NICHE PLAYERS
LEADERS
Ab
ility
to
exe
cute
Completness of vision
MapRDaltaStax
EnterpriseDB
InterSystems
MarkLogic
IBM
SAP
Amazon Web Services
Oracle
Microsoft
ZTE
Unify
SAP
Vocalcom
Aspect
Avaya
Genesys
Mitel
Enghouse InteractiveNEC
Huawei
Cisco
Zoomada
Pentahc
Datameter
Pyramid Analytics
Yellowfin
Domo
MicroStrategy
TIBCO Software
Alberyx
OracleBirsl
Information Builders
Logi Analytics
Logi Analytics
SAP
Qlik
Tableau Microsoft
SAS
IBM
SalesforceSisense
ClearStory Data
Board International
Figura 5. Gartenr Magic Quadrant

1918
Another relevant element is the fact that SAP is recognized as highly reliable solution for the company’s process and data safety management as well, coherently with what requested today by the market and above all the rules and regulations in force both in Italy and Europe. For what concerns the rules and regulations, in 2017 and in continuity in 2018 a series of initiatives aimed to put Illumia in line with what requested by the GDPR within May, 25th 2018.
An equally important role will be played by the Genesys software implementation as the Contact Centre platform. Since 9 years Genesys is the leader in Gartner’s yearly report in the sector of reference.
Microsoft PowerBI was the solution adopted by Illumia for the business intelligence; also in this case the chosen solution has been positioned since more than 10 years as a Leader by Gartner.
COMMUNICATION STRATEGY
At the end of the Brand Identity restyling fulfilled in 2016 the Communication Plan for 2017 was oriented to the consolidation of the new brand and commercial conversion.
The operative fulfilments of these 2 goals have to be identified in 3 strategic lines:
1. Conclusion of the compliance of all the commercial materials to the new Brand;
2. Brand Awareness Consolidation;
3. Trade conversion development through the new Social strategy.
1. Materials
The new logo restyling led to a re-definition of all the Illumia commercial instruments characterized by a new positioning that may be directed to transversal targets, communicating in a more fresh and direct way.
In detail the intervention concerned:
• Website;
• Annual Report
• Institutional Brochure;
• Coordinated Outlook;
• Segment diversified commercial flyers;
• Bills.
2. Brand Awareness Consolidation
The regulatory uncertainty about the end of the protection period stimulated the Company to review the commercial promotion strategy on traditional media, making it abandoning the TV Advertisement and increase instead the investments on Sponsoring and Digital Strategy.
For what concerns Sponsoring activities the taken direction was the one to make sponsorships followed by series of activations aimed to the target prospect profiling. In particular:
• Bologna FC sponsoring:
- Exposure as Back Jersey Partner and Top Sponsor
- Activation of “live” initiatives during the home court matches
- Promo of tickets winning related lotteries.
• Illumia 12 Ship sponsoring for the Ostar Race
- Live updates about the performance of the Race;
- Events organization with the Skipper, Michele Zambelli.
• Meeting of Rimini Sponsoring
- Hall naming for a whole attendance of more than 50.000 people
- Presence of a profile stand related to social initiatives.
3.Digital strategy
The absence of advertisement campaigns on TV channels allowed a relevant development of the segmentation and promotion strategies on social networks and more in general on the web environment. For what concerns Social Networks, investments were oriented in particular on Facebook and LinkedIn, trying to achieve 3 main Company’s goals: trend increase, brand awareness and recruitment. Facebook was dedicated to the first 2 objectives, thus pursuing very satisfactory results in terms of interaction and conversion, Through LinkedIn instead a new talents recruitment strategy was pursued, structured about a communication strategy of the Company’s values and culture. Also in this case the obtained results lead to a significant increase in visualization and acquisitions.
2017 ILLUMIA OFFERS
During 2017 the strategic choice started in 2016 was completed by introducing new optional components in the electric energy and natural gas offers. Through this choice, Illumia on one side characterized its products thus finding a distinguished place on the market, contributing to reaffirm its identity and favouring the customers’ loyaltization, on the other side introduced new revenues and marginalities’ opportunities and therefore contrasted the increasing competition reported for that sector. The implement of the strategy in matter produced optimal results: almost 30% of the subscribed contracts during 2017 have subscribed also an additional optional.
As well during 2017 the Casa Sicura [Safe House] Lottery was launched. This operation provided the courtesy of an Assistance Insurance for the house developed in cooperation with a high profile Italian insurance company, aimed to the customers that subscribed one of the above described additional optional. The additional optional increase is also due to the success of this operation.
Starting from January, 1st 2017 all house customers and small enterprises, served in Enhanced Protection Market were given the choice of Tutela SIMILE (Protection). SIMILE Protection is a special type of electric energy supply contract, established by the Agency for energy to the aim of driving the consumer towards the Free Market and making him understanding modalities and systems to the informed choice of his own provider.
The SIMILE Protection contract is offered by the Free Market’s suppliers but contains contract conditions established by the
Agency, that are compulsory and uniform for all the sellers.
In this environment, Illumia is confirmed as one of the main operators at national level, having met all the requirements of the Agency (only 27 companies have been admitted). The Equal Protection Market offer is characterized by the same prices of the Enhanced Protection Market with, in addiction, a one-time discount for the final customer. In this particular ranking Illumia appears at the 7th place for what concerns residential offer and 12th for the business offer.
The results have been disappointing for all the operators, mainly due to two factors: the lack of an institutional communication campaign and the choice of the web as unique used channel for the subscription of this type of contract. The offer will cease to be commercialized during 2018.
PRESENCE ON THE MARKET
Illumia keeps on having a distributed customers’ portfolio that is additionally and evenly developing on every Italian region. Considering the supplied points, the distribution on regional base is so divided: Lombardy (16%); Emilia-Romagna (10%), Lazio (9%), Tuscany (9%), Veneto (9%), Campania (8%), Piedmont (8%), Sicily (6%), Liguria (5%), Marche (4%) Apulia (4%), Abruzzi (3%). In general, in comparison to 2016 an enhancement is confirmed of the divisions on the minor credit risk regions also thanks to the fulfilled policies aimed to the late payment reduction.
In the first 5 regions the 50% of the customers are condensed. The distribution per geographic area is lopsided to Northern Italy according to the following percentages: 49% in the North, 30% in the Centre, 21% in the South.

2120
The enhancement strategy on Retail market is put into practice also in this year through the condensation of supply points mainly on the house consumption segment.
As a consequence of the acquisition of Electra Italia SpA company branch a high increase in the Reseller portfolio is reported.
Picture 6. Customers’ portfolio per Region
Altre regioni 1%
Umbria 1%
Friuli Venezia Giulia 2%
Calabria 2%
Sardegna 2%
Abruzzo 3%
Puglia 4%
Marche 4%
Liguria 5%
Sicilia 6%
Piemonte 8%
16% Lombardia
10% Emilia-Romagna
9% Lazio
9% Toscana
9% Veneto
8% Campania
Picture 7. 2016 Customers’ portfolio per segment (Nr. of supply points)
49% Consumers
Business 11%
Resellers 40%Electra
Resellers
26%
Other Resellers
14%
Wh Electric Energy 2017 2016
Retail 1.390.852 1.220.028
Terna 36.484 76.990
GME 1.091.694
Wholesalers 1.700.540 2.370.342
Sales 4.219.570 3.667.360
GME 942.504 1.685.166
Plants 35.480 73.417
Wholesalers 3.241.586 1.908.777
Purchases 4.219.570 3.667.360
2017 ENERGY BALANCE
Below is reported the 2017 Energy Balance showing the physic flows of the only just
passed year (data expressed in MWh)
The electric energy balance makes appearing a sales balance equal to 4,2 TWh obtained considering the net positions towards active and/or passive counterparts.
The sales to final customers are equal to a whole of 1,4 TWh, then the sales follow to wholesalers counterparts, GME and Terna for electric system balance services, knowledge that Illumia developed and made concrete in the last years
offering energy on real time markets to solve temporary imbalances between energy demand and offer.
On the other side the purchases are distributed among GME (22%), Plants (1%) and Wholesalers (77%). For what concerns the natural gas sector data are below reported for the gas balance (data reported in SMC – Standard Meter Cube) – PSV – VTP (Virtual Trade Points)
The natural gas invoiced volumes adjusted to about 86 millions of M3 (in 2016 they were equal to 68 mln).
For what concerns supplies, the Company consolidated its own strategy of knowledge development to operate directly on the natural gas wholesale market.
In 2017 Illumia kept on developing the storage gas activity started in 2013. Storage means the stocking of natural gas in underground
structures, kept from the national transport system and later re-introduced in the functioning network according to the requirements of the market.
Natural gas storage in underground plants is actually aimed to meet different requirements:
• gives response in real time to the market’s gas requirements;
• assures a high margin of elasticity to the production and transport structures;
Gas SMC 2017 2016
Retail 77.482.661 48.179.581
Wholesalers 8.663.545 19.898.667
Sales 86.146.206 68.078.248
Purchases at VTP 85.361.407 57.989.042
Other purchases 3.962.895 10.114.928
Storage -3.178.096 -25.722
Purchases 86.146.206 68.078.248

2322
• guarantees the maintenance of “strategic” reserves for the exclusive use to face exceptional situations (particular weather conditions, like abnormal intense cold peaks, or international crisis that partially block the gas supplies from abroad, that are equal to more than 90% of the used gas in Italy).
The main components of a storage plant are: deposit, central stockholding with compression and processing plants and shafts. The deposit is the underground geological structure where is stored the extracted gas whether from the national network or produced at wide distance. Through the central stockholding the gas is displaced between the National Transport Network (NTN) and the deposit; in the central all the necessary plants to gas injection, provision and processing are placed. The shafts are the
structures that put in connection the deposit with the plants on surface where a pipes system allows the gas transport among the shafts and the central, and the central and the NTN. All the plants can be also directed from remote through a remote-control system.
Usually, in the summer season the deposit is filled while, during winter, the provision to the national network system stage is predominant. Therefore the process of storage provides a first stage of filling of the stockholding plants (April to October of every year), when the gas is “injected” inside the disposed sites for storage. During the following stage, the “provision” one, the gradual emptying of the stockholding is fulfilled, during winter time, when the consumption peaks are reached by the final customers, due also to the harsher weather conditions.
Besides the participation management activities, in 2017Tremagi Srl as in the previous years starting from 2010 fulfilled the following services on behalf of the Companies of the Group:
• counseling and legal support;
• services concerning administration, finance and control;
• debt collection only as regards to the collection of higher amount debts;
• staff direction and management activities (HR);
• general and secretarial services.
All the mentioned services have been provided thanks to qualified employees, and through the assistance of external consultants.
Picture 8. Stockholding center general outline (Source: Stogit SpA)
Compression plant
Processing plant
Shafts
Methane pipelineInjection Provision
Covering rock
Aquifer layer
Working Gas
Cushion Gas/porous bedrock
FINANCIAL TREND AND INVESTMENTSTaking into account the Balance Sheet, in observation to the request of information provided by comma 2 art. 2428 Italian Civil Code it is hereby reported the reclassified financial and patrimonial data concerning 2017 financial year in comparison to the ones of
the previous financial year (values expressed in €/000). Below are reported in resume the data in synthesis concerning the last 5 financial years, although the 2013 to 2014 financial years’ data don’t incorporate the above described Accounting Reform’s effects.
Table 3. Tremagi Holding. Consolidated financial statements, reclassified comprehensive income
2017 % 2016 % 2015 % 2014 % 2013 %
Value of production 1 947.390 100% 785.327 100% 814.846 100% 571.656 100% 505.099 100%
Costs for raw material and hardware
722.375 76% 583.831 74% 592.638 73% 363.050 64% 293.409 58%
Changes in inventories of raw material and hardware
-891 0% 177 0% -240 0% -504 0% -677 0%
Costs for services 184.730 19% 164.217 21% 179.301 22% 177.066 31% 179.534 36%
Entitlement to third parties’ assets
437 0% 2.589 0% 2.681 0% 786 0% 731 0%
Different management liabilities
17.149 2% 14.004 2% 15.352 2% 14.683 3% 16.044 3%
Added value 2 23.590 2% 20.509 3% 25.113 3% 16.575 3% 16.059 3%
Staff costs 8.206 1% 6.878 1% 5.938 1% 5.132 1% 4.211 1%
EBITDA (MOL) 3 15.384 2% 13.631 2% 19.175 2% 11.443 2% 11.848 2%
Deprication and amortization (Am)
9.772 1% 6.337 1% 8.483 1% 5.265 1% 3.163 1%
Reserve 698 0% 3.148 0% 277 0% 40 0% 146 0%
EBIT (Diff. between value and cost of the production)
4 4.914 1% 4.146 1% 10.416 1% 6.138 1% 8.539 2%
Financial proceeds and costs
-1.437 0% -1.033 0% -578 0% -304 0% -494 0%
Extraordinary income and losses
- 0% - 0% - 0% - 0% - 0%
Financial correction activities
-385 0% -170 0% -3.065 0% 4 0% 1.356 0%
Result before the taxation 5 3.092 0% 2.943 0% 6.774 1% 5.838 1% 9.401 2%
Taxation -1.587 0% -1.148 0% -3.264 0% -3.847 -1% -4.656 -1%
Profit (loss) of the exercise 6 1.505 0% 1.795 0% 3.508 0% 1.991 0% 4.745 1%

2524
In order to analyze exhaustively and represent accurately and soundly the company’s manage-ment in the other and complementary aspects it is characterized by, index concern the other company’s aspects.
As to say:
• structure and balance sheet indicators;• structure and patrimonial standing indicators;• structure and economic standing indicators.
Table 4. Tremagi Holding. Re-classified balance sheet
2017 2016 2015 2014 2013
Locking-up of capitals 7 59.167 58.474 46.884 43.298 37.502
Tangible assets 45.298 45.415 34.195 28.881 24.152
Intangible assets 7.737 6.879 6.014 6.498 3.051
Financial 6.132 6.180 6.675 7.919 10.299
Receivables to customers - - - - -
Circulating assets 8 193.121 201.792 163.067 164.150 148.109
Receivables to customers within 12 months a 125.310 137.053 123.361 121.479 118.101
Other Receivables b 11.170 16.204 14.082 19.371 16.903
Financial activities which are not fixed assets c 9.312 7.130 3.145 1.000 2.789
Liquid reserve d 37.400 32.382 15.554 12.164 6.721
Prepaid expenses e 7.676 7.608 5.322 8.742 2.826
Remainders f 2.253 1.416 1.604 1.394 768
Aggregate amounts 9 252.288 260.267 209.951 207.448 185.611
Net assets 10 41.506 36.539 39.514 33.035 31.137
Net corporate assets 2.000 2.000 2.000 2.000 2.000
Funds for risks and costs 11 12.126 17.439 5.626 1.362 1.438
Provision 12 1.352 1.166 908 685 482
Non current liabilities 29.723 31.145 9.047 3.418 5.467
Payables with banks and others 15 29.723 31.145 9.047 3.418 5.467
Cash and cash equivalent 13 167.581 173.979 154.857 168.948 147.087
Payables with suppliers 34.900 35.500 29.644 37.190 16.089
Payables with suppliers within the 12 months period 117.464 126.457 108.523 118.346 119.892
Other payables 13.560 9.834 15.225 13.102 10.989
Liable prepaid expenses 1.657 2.189 1.465 310 116
Total liabilities and net 14 252.288 260.267 209.951 207.448 185.611
Table 5. Balance indicators – Tremagi Group
2017 2016 2015 2014 2013
ROE Profit for the period (6) / Equity Capital (10)
4% 5% 9% 6% 15%
ROI EBIT (4) / Invested Capital (9) 2% 2% 5% 3% 5%
ROS EBIT (4) / Revenues (1) 1% 1% 1% 1% 2%
ROT Revenues (1) / Invested Capital (9)
3,76 3,02 3,88 2,76 2,72
MOL EBITDA (3) / Revenues (1) 2% 2% 2% 2% 2%
NON-CHARACTERIZING EFFECT OF THE MANAGEMENT
Profit for the period (6) / EBIT (4)
31% 43% 34% 32% 56%
LEVERAGE Invested Capital (9) / Equity Capital (10)
6,08 7,12 5,31 6,28 5,96
INFLEXIBILITY OF THE EMPLOYMENTS
Locked-up Assets (7) / Invested Capital (9)
23% 22% 22% 21% 20%
FLEXIBILITY OF THE EMPLOYMENTS
Capital Stocks (8) / Invested Capital (9)
77% 78% 78% 79% 80%
GLOBAL FLEXIBILITY Capital stocks (8) / Fixed Assets (7)
3,26 3,45 3,48 3,79 3,95
FINANCIAL INDEPENDENCE Equity Capital (10) / Invested Capital (9)
16% 14% 19% 16% 17%
PRIMARY STRUCTURE MARGIN Locked-up assets (10) / Locked-up assets (7)
0,70 0,62 0,84 0,76 0,83
SECONDARY STRUCTURE MARGIN
Consolidated sources (10+11+12+15) / Locked-up assets (7)
1,43 1,48 1,18 0,89 1,03
CURRENT TEST RATIO Current assets (8) / Current liabilities (13)
1,15 1,16 1,05 0,97 1,01
QUICK RATIOAvailability and liquid assets (8a+b+c+d+e) / Current liabilities
1,14 1,15 1,04 0,96 1,00
2726
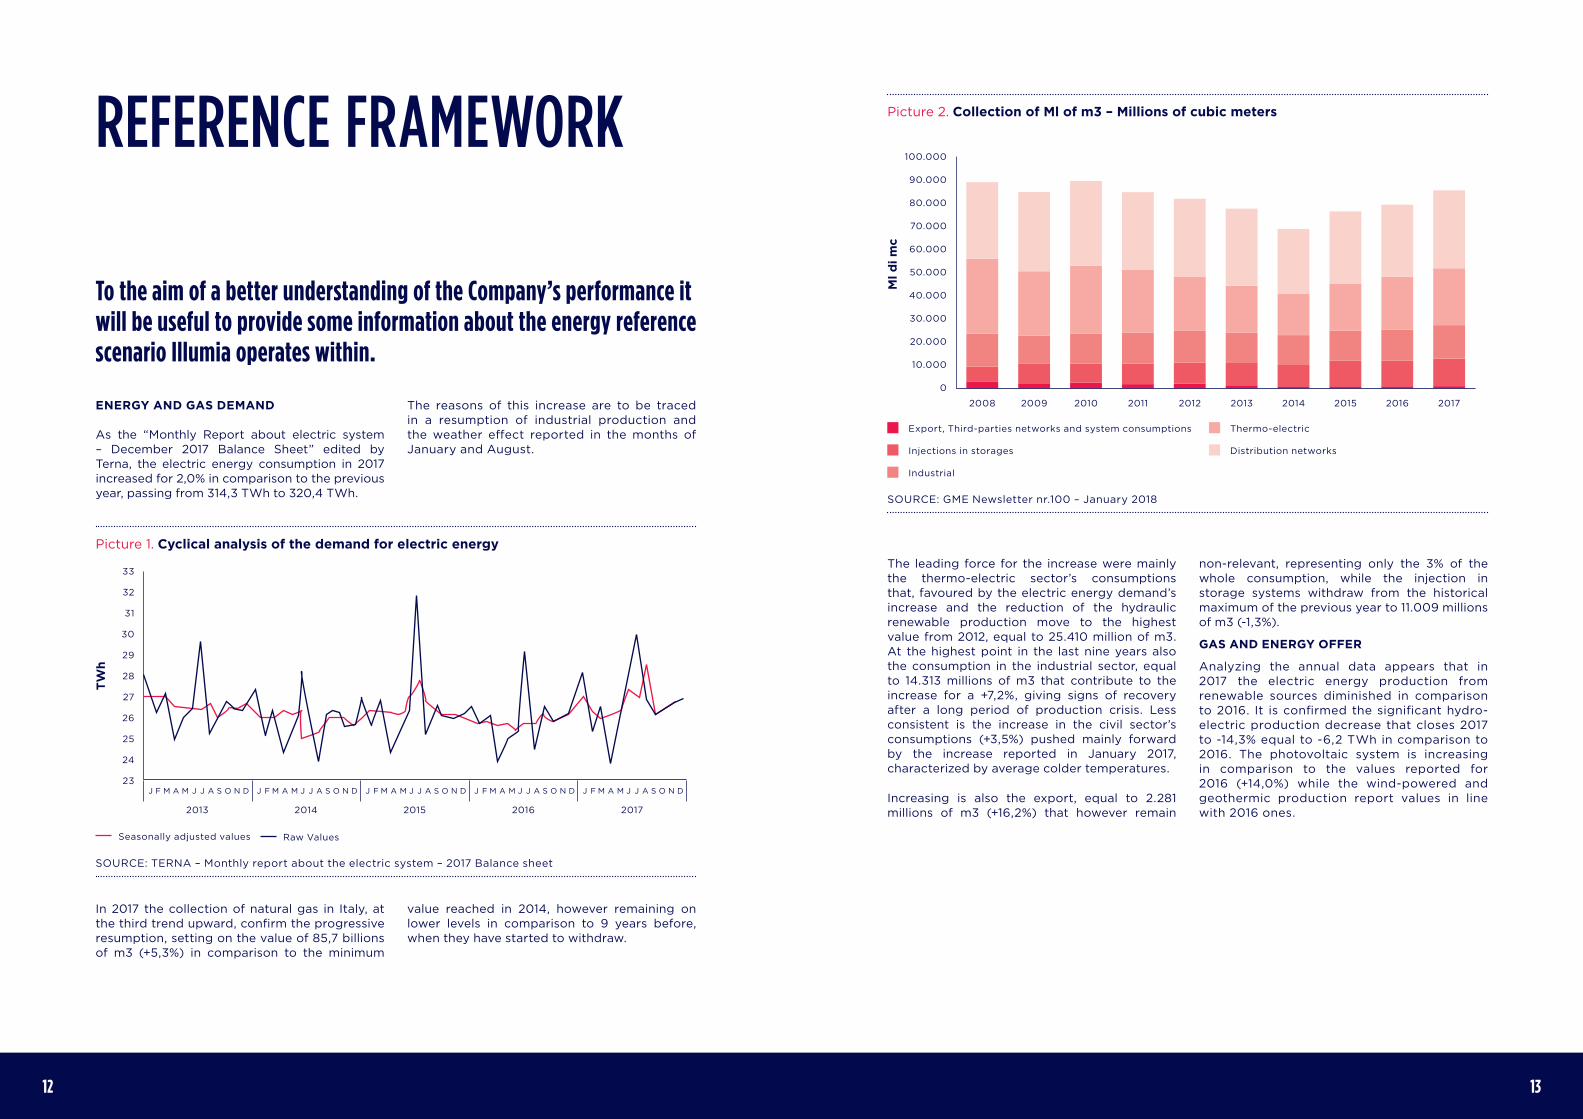
During the financial year the Company negotiated derived tools of management with the aim to manage market risk, in particular trough the backing of fixed selling prices agreed with the customers, by the forward purchase, again at fixed prices, of power through physical contracts or swaps. The market risk is thus reduced to its lowest terms because the derived products purchase is exclusively oriented to the backing of price formulas sold to the customers.
Exchange risk
The Company incurs in exchange risk insofar as purchases listed products or exposes financially in a other currency than €. This can occur, i.e., when buying or selling oil index-linked formulas as a backing for the above mentioned, sold to the final purchasers. When this occurs, however, in case the purchase extent allows it, a backing also of the exchange risk is fulfilled by the use of forward on currencies.
RISKS MANAGEMENT
PREDICTABLE EVOLUTION OF THE MANAGEMENT
The Company is exposed to the following risks deriving from the use of financial instruments:
• credit risk;
• liquid assets risks;
• market risks;
• exchange rate risks;
In this chapter, according to what required by art. 2428 of the Civil Code, comma 6 letter b, information is given concerning the exposition of the company to each one of the above listed risks, objectives, policies and management proceedings for what concerns risks and methods used to evaluate them.
The comprehensive responsibility for creation and supervision of a risk management system for Tremagi Group is upon the Chairman of the Board of Administrators.
The risks management policies of the Group have as an aim the identification and analysis of the risks the Group is liable of, to establish appropriate limits and controls and monitoring risks and respect of the mentioned limits. These policies and concerning systems are regularly revised in order to reflect incidental market conditions variation and the Group’s business. Through the forming, standards and management procedures, the Group aims to the creation of a disciplined and subsidiaries environment where employees can reach the awareness of their roles and responsibilities.
Credit risks
The credit risk is the risk that a customer or one of the counterparts in a financial instrument causes a financial loss by non-fulfilling an obligation and derives mainly from commercial Receivables.
The exposition of the Company to credit risk depends mainly from the specific features of each customer. The demographic variables that are typical of the Company’s customers portfolio, including insolvency risk that is typical of the sector where customers operate affect significantly the Company’s credit risk.
The Company provisions a depreciation fund for value losses that reflects the esteem of the losses on commercial Receivables and, potentially, the non-current financial assets, which main components are individual depreciation of significant expositions and collective depreciation of homogeneous groups of activity opposite to already backed still unidentified losses. The collective depreciation is determined on the ground of the historical series of payment statistics concerning similar financial activities. The Company owns however an insurance policy to back the credit.
Liquid assets risk
It is the risk for the Company to find difficulties in fulfilling obligations attached to financial liabilities. The Company has at its disposal a good liquid assets, generated from rank management. It however disposes of bank credit lines allowing to financially anticipate the compensation of the retail activity.
The Company’s approach to the liquid assets management provides a control and a preventive management of the availability of proportionate funds to fulfil its maturity obligation, whether in normal and financial alarm conditions, aimed to avoid the backing of excessive costs or the risk of damaging its own image. The mentioned control consists in the daily evaluation of all the existing derived contracts, paying particular attention to the ones on maturity, whether daily or at the end of the month’s term. The mentioned report allows every day to have the forecast of the future capital outflows.
Market risk
The market risk is the risk that the fair value or the future cash flows generated by company’s contracts, including financial instruments, fluctuate as a consequence of market prices variations, rates of exchange, interest or capital representative instruments quotations.
The market risk management objective is the management and control of the Company’s exposition to the mentioned risk within acceptable levels, optimizing, at the same, the business profitability and the return of the investments.
In 2018 the expansive strategy of the Company will continue, thus consolidating what set up in 2017.
For what concerns trade, retail segments points to a further increase of home acquisitions. In parallel it continues the enhancement of the Microbusiness and SME sector, while the Industrial target, considered the volume it aimes to, will be for the first time dir ectly managed by a new unit.
The objective is a further improvement of the spread per unit. On the management side, the activity of control of the costs will be continued, with particular attention to the efficiency of external suppliers.
During 2018 new commercial offers will be proposed, whether having as object the energy efficiency products supply to customers or new included services.

2928
PURCHASE OF PARENT COMPANIES’ SHARES
During the financial year the Company does not hold and have not held shares of parent companies, either through trust companies or a third party.
MANAGEMENT AND COORDINATION ACTIVITY
During the financial year the Company is subject to the activity of management and coordination of the Tremagi S.A. parent company, holding 100% of the Tremagi S.r.l. capital stock; the significant data of the last balance sheet passed at the Tremagi S.A. are reported in the notes to the financial statements.
PERSONAL DATA PROCESSING IMPACT EVALUATION DOCUMENT
For what concerns rules and regulations about personal data protection, the subsidiary Illumia S.p.A. as Titular of the personal data processing, also for the financial year this Final Balance refers to, verified the adequacy of the basic measures of safety adopted to guarantee the processing of company information concerning customers, employees, suppliers and testifies the udpdating of the the requirements provided by the Code in matter of personal data protection. Taking into account the legislative evolution and the
Corporate name Receivables to 31/12/2107
Liabilities to 31/12/2017 2017 Revenues 2017 Costs
Tremagi SA 5.300.000 755.563 - 755.563
Sea - 348.000 - 493.000
enforcement of a General Regulation in matter of personal data (EU Regulation, April, 27th 2016, nr.2016/679) the mentioned subsidiary started the adjustment process to the new legislative text, by updating the documents in use for the personal data processing, defining a data processing register and verifying the liability of suppliers and third parties processing the data on behalf of Illumia SpA. In particular, the Privacy Assessment activity referred to the Company’s computer systems, is extended to the related companies to the same holding that make use of Illumia SpA computer systems. In its quality of parent company Tremagi Srl benefits of this testifying documentation of the compliance of the developed processing fulfilled within the Group’s company referring to the Parent Company. This choice confirms an established company’s policy aimed to the ful-fillment of a suitable safety level to prevent illicit processing, also going further the minimum provided safety measures requested by the rules and regulations as mandatory. The updated ver-sion of the Document is recorded in the Minutes at the Holder’s seat.
LEGISLATIVE DECREE 231/01
In the 2017– with reference to the provisions of the Legislative Decree nr.231 dated June, 8th 2001 “Regulation of the administrative responsibility of the juridic persons, companies and associations, without legal status as well” – was verified the updating by the Illumia S.p.A. subsidiary company of the organizational model for the prevention of the crimes provided by the Decree, adopted in 2014. Moreover, the adequacy of the Ethic Code was verified, in order to to control the behaviours and actions of subject that, with various appointments, operate within the Company. It is
underlined that both the Organizational model and Ethic Code were enforced after the approval of the Board of Directors of Illumia S.p.A. on June, 23rd 2014 together with the appointment of the Supervisory Body and Ethic Committee in charge of the application and verification of the adopted texts. In its quality of subsidiary company, Tremagi benefits of the Organizational Model and concerning Ethic Code that, within the limits provided by the rules and regulations in force, are suitable instruments to prevent crimes of the cases in matter as provided by Legislative Decree 231/2001 for the activities of the Group’s company that correspond to the Subsidiary.
During 2017 financial year both the Supervisory Agency and the Ethic Committee have regularly accomplished their tasks, thus drawing up a yearly report about the fulfilled activity in the interest of the company.
It is to be specified that currently both Organizational Model and Ethic Code are formally enforced by the sole Illumia SpA and their effects are extended, even if not formally, to Tremagi S.r.l. and other companies of the Group. Therefore the enforcement of the mentioned instruments by Illumia S.p.A., considered the activity developed by the company in matter within the Group, allows to adequately manage the responsabilities related to the Legislative Decree 231/01 guaranteeing the full company coordination in respect with that matter, as well in respect with the other activities fulfilled by the Group.
In thanking you for the confidence to us allowed, we beg you to adopt the Tremagi Group consolidated balance sheet the way it is presented.
Bologna, March, 30th 2018
The Chairman of the Board of Administrators
Marco Bernardi PhD
FURTHER INFORMATIONINFORMATION ABOUT ENVIRONMENT
In the course of the financial year in matter, for what concerns as well the participated companies:
• no damages were produced to the environment;
• no sanctions or definitive penalties were inflicted to the Company for environmental damages or crimes;
• no emission of greenhouse-effect gas occurred, according to the provisions of Act 316/2004.
For the whole Tremagi Company, environment is a crucial subject both for what concerns eco-nomic policies and industrial activities, being persuaded that the commitment for a sustainable development represents, besides an ethic value for the business, an important aspect of the Company’s management itself.
RESEARCH AND DEVELOPMENT ACTIVITIES
In the financial year closed on December, 12th 2017, the Company has fulfilled no activity of research and development.
EMPLOYMENT STATE
During 2017 financial year the company’s staff employed on average by Tremagi Group Srl were 157 units against the 156 units in comparison to the 151 of the previous financial year (further information in the Explanatory Note).
Since its incorporation Tremagi Group has never recorded deaths or industrial injuries as well as no costs with regard to occupational diseases by employees or former employees the Company was ascertained as responsible for.
RELATIONS WITH THE COMPANIES OF THE GROUP
The economic and patrimonial relations with the Tremagi Group Companies and associates developed as follows:

3

3332
CONSOLIDATED BALANCE SHEET 12.31ST 2017
BALANCE SHEET 31.12.2017 31.12.2016
A. RECEIVABLES FROM SHAREHOLDERS FOR SHARE CAPITAL
Receivables from Shareholders for Share capital
Total Receivables from Shareholders for Share capital - -
B. FIXED ASSETS
I. Intangible Fixed Assets
1) Start-up and enhancement costs 1.094 1.900
2) Development costs - -
3) Industrial patents - -
4) Concessions, licenses, trademarks 965 864
5) Goodwill 164 -
5-BIS) Consolidation differences - -
6) Intangible assets in progress and advances 1.613 389
7) Other intangible fixed assets 3.901 3.726
Total Intangible Fixed Assets 7.737 6.879
II. Tangible Fixed Assets
1) Land and buildings 36.352 37.284
2) Plants and machineries 571 611
3) Industrial and commercial equipments - -
4) Other tangible fixed assets 2.988 3.233
5) Tangible assets in progress and advances 5.387 4.287
Tangible assets in progress and advances 45.298 45.415
Table 1. Assets
31.12.2017 31.12.2016
III. Financial Fixed Assets
1) Investments in:
d-bis) Other investments 139 41
Total Investments 139 41
c) Receivables towards parent companies
- within 12 months 5.000 5.000
- over 12 months - -
5.000 5.000
d-bis) Receivables from others
- within 12 months 189 345
- over 12 months 804 794
993 1.139
Total financial receivables 5.993 6.139
Total Financial Fixed Assets 6.132 6.180
Total Fixed Assets 59.167 58.474
C. CURRENT ASSETS
I. Inventory
1) Raw, subsidiaries and consumption materials 1.094 417
4) Goods and finished products 1.104 890
5) Payments in advance 56 109
Total Inventory 2.253 1.416
II. Receivables
1) Receivables towards Customers:
- within 12 months 125.310 137.053
- over 12 months - -
125.310 137.053
4) Receivables towards parent companies
- within 12 months 300 350
- over 12 months - -
300 350
5-bis) Tax receivables
- within 12 months 4.522 6.468
- over 12 months - -
4.522 6.468

3534
31.12.2017 31.12.2016
5-ter) Deferred Taxes
- within 12 months 1.439 3.016
- over 12 months - -
1.439 3.016
5-quater) Other receivables
- within 12 months 4.909 6.370
- over 12 months - -
4.909 6.370
Total Receivables 136.480 153.257
III Current Financial Assets
5) Derivative financial instruments 9.312 7.130
Total Current Financial Assets 9.312 7.130
IV. Cash and cash equivalents
Bank and post accounts 37.387 32.373
Cash on hand and deposits 13 9
Total cash and cash equivalents 37.400 32.382
Total CURRENT ASSETS 185.445 194.185
D. ACCRUALS AND PREPAYMENTS 7.676 7.608
TOTAL BALANCE SHEET ASSETS 252.289 260.267
31.12.2017 31.12.2016
A. Net equity
I. Share Capital 2.000 2.000
II. Share premium reserve - -
III. Revaluation reserve - -
IV. Legal reserve 400 400
V. Statutory reserve - -
VI. Other reserves - -
1) Extraordinary reserve 32.868 30.147
2) Shareholders capital contribution reserve 5.017 5.017
3) Capital grants - -
4) Fusion surplus 87 87
5) Division surplus - -
6) Adjustment reserve -2 -2
7) Interim losses coverage fund - -
8) Reserve for foreign exchange gains - -
9) Group consolidation reserve -200 -201
10) Reserve for currency translation differences -442 271
Total other reserves 37.328 35.319
VII. Cash flow hedge reserves -30 -4.203
VIII. Retained earnings (losses) -422 544
IX. Profit / (Loss) of the period 1.366 1.755
Total Equity (Group) 40.642 35.815
X. Third parties equity 26 26
IV. Legal Reserve 5 5
VII. Other reserves - -
1) Extraordinary reserve 693 653
IX. minority profit / (loss) of the period 139 40
Total Equity A -X Third Parties Equity 863 724
TOTAL NET EQUITY OF THE GROUP AND THIRD PARTIES 41.506 36.539
Table 2. Net equity
3736
31.12.2017 31.12.2016
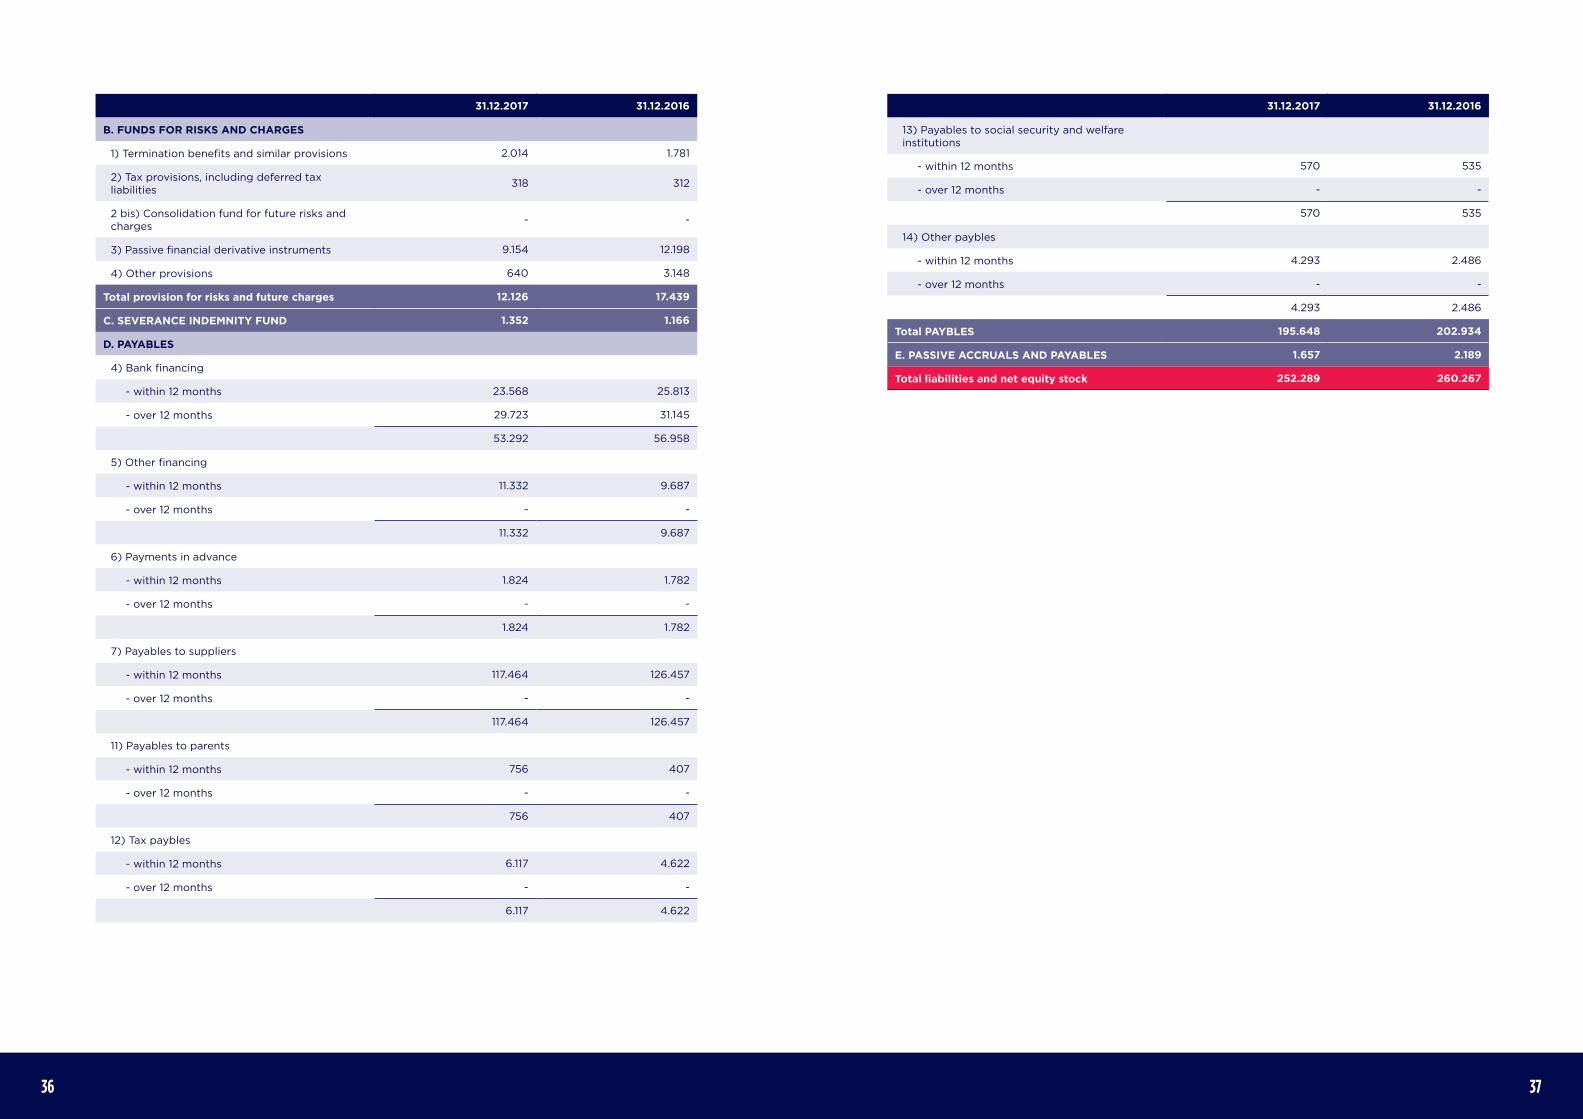
B. FUNDS FOR RISKS AND CHARGES
1) Termination benefits and similar provisions 2.014 1.781
2) Tax provisions, including deferred tax liabilities
318 312
2 bis) Consolidation fund for future risks and charges
- -
3) Passive financial derivative instruments 9.154 12.198
4) Other provisions 640 3.148
Total provision for risks and future charges 12.126 17.439
C. SEVERANCE INDEMNITY FUND 1.352 1.166
D. PAYABLES
4) Bank financing
- within 12 months 23.568 25.813
- over 12 months 29.723 31.145
53.292 56.958
5) Other financing
- within 12 months 11.332 9.687
- over 12 months - -
11.332 9.687
6) Payments in advance
- within 12 months 1.824 1.782
- over 12 months - -
1.824 1.782
7) Payables to suppliers
- within 12 months 117.464 126.457
- over 12 months - -
117.464 126.457
11) Payables to parents
- within 12 months 756 407
- over 12 months - -
756 407
12) Tax paybles
- within 12 months 6.117 4.622
- over 12 months - -
6.117 4.622
31.12.2017 31.12.2016
13) Payables to social security and welfare institutions
- within 12 months 570 535
- over 12 months - -
570 535
14) Other paybles
- within 12 months 4.293 2.486
- over 12 months - -
4.293 2.486
Total PAYBLES 195.648 202.934
E. PASSIVE ACCRUALS AND PAYABLES 1.657 2.189
Total liabilities and net equity stock 252.289 260.267

3938
Table 3. PROFIT AND LOSS
31.12.2017 31.12.2016
A. PRODUCTION’S VALUE
1) Revenues from sales and services 944.317 783.855
5) Other incomes 3.073 1.472
Other revenues 3.073 1.472
Total production value 947.390 785.327
B. PRODUCTION COSTS
6) Cost of raw materials, consumables and merchandise
722.375 583.831
7) Cost of services 184.730 164.217
8) Cost of rents and leases 437 2.589
9) Costs for the staff
a) Wages and salaries 6.463 5.195
b) Social security and welfare contributions 1.368 1.324
c) Severance indemnity 374 358
d) Retirement pension and similar fund - -
e) Other costs 1 1
Total of the costs for the employees 8.206 6.878
10) Amortizations and depreciations
a) Intangible asset amortization 2.197 1.750
b) Tangible asset amortization 1.269 1.237
c) Write-downs of fixed assets - -
d) Write-downs of current asset 6.306 3.350
Total amount of the amortizations and depreciations
9.772 6.337
11)Change in raw materials, consumables and wares
-891 177
12) Accruals for provisions 698 3.148
13) Other accruals - -
14) Other operating expenses 17.149 14.004
Total amount of the production costs 942.476 781.181
DIFFERENCE BETWEEN VALUE AND PRODUCTION COSTS 4.914 4.146
31.12.2017 31.12.2016
C. FINACIAL INCOME AND EXPENSES
16) Other financial incomes 183 246
a) Financial income from long-term financial receivables
- -
a 5) from other companies 2 -
d) Other financial income:
d 5) other companies 181 246
17) interest and other financial expenses 1.470 1.455 d) other companies 1.470 1.455
17-bis) Gains and losses on foreign currency translation -149 176
Net Financial income (expenses) -1.437 -1.033
D. Adjustments to the carrying value of financial assets:
18) write-ups: 3.497 10.237
a) of investments - -
d) of different financial instruments 3.497 10.237
19) write-downs: 3.882 10.407
a) of investments - -
d) of different financial instruments 3.882 10.407
Total Amount Of The Adjustments -385 -170
Result Before Taxation 3.092 2.942
20) Taxes for the period 1.587 1.148
- current taxes 1.393 2.171
- deferred income taxes 194 -1.045
- prepaid taxes - 22
PROFIT (LOSS) FOR THE PERIOD 1.505 1.795
Profit (loss) for the period of minority interests 139 40
PROFIT (LOSS) FOR THE GROUP 1.366 1.754

4140
31.12.2017 31.12.2016
A) Income-management deriving Capital flows (undirect method)
Profit (loss) for the period 1.505 1.754
Income tax 1.587 1.148
Interests 1.470 1.455
(interest income) -181 -246
Asset-disposal deriving Capital Gains (Unrealized losses) - 282
1. Profit/losses for the period before income taxes, interests, dividends and asset-disposal deriving capital gains/unrealized losses
4.381 4.393
No compensation monetary elements in the net work capital adjustments
Provisions 698 3.671
Severance indemnity fund 374 358
Receivables depreciation fund provision 6.306 3.350
Intangible Asset’s amortization 3.466 2.987
Rounding-up (rounding-off) concerning items that affected the capital that not involve currency handling
-1.053 -1.794
Other non-monetary adjustments - -
Total amount of the non-monetary adjustments 9.791 8.572
2. Financial flow before adjustment of the net working capital 14.172 12.965
Variazioni del circolante netto
Increase / (Decrease) of advance -837 187
Increase / (Decrease) of payables to customers 6.233 -13.692
Increase / (Decrease) of payables to suppliers -8.993 17.933
(Increase/ Decrease) of prepaid expenses -68 -2.286
(Increase/ Decrease) of deferred income -532 723
Other adjustments of the net working capital 8.178 -7.429
Total amount of the net working capital 3.981 -4.563
3. Financial flow after adjustment of the net working capital 18.153 8.402
Other adjustments
interests received 181 130
interests (paid) -1.470 -1.208
(Paid income tax) -1.003 -3.448
(Use of the funds) -2.967 -415
(Use of the employee leaving indemnity and paid employee leaving indemnity)
-188 -46
(Use of debt provisions) -796 -93
Total amount of the other adjustments -6.242 -5.080
Table 4. CONSOLIDATED FINANCIAL STATEMENT OIC 1031.12.2017 31.12.2016
Income management financial flow (A) 11.911 3.322
B) Income financial flows deriving from investments
Tangible and intangible fixed assets (investments)
-3.055 -15.216
Tangible and intangible fixed assets withdrawals -1.152 226
Financial assets (investments) 48 -334
Financial assets withdrawals - 828
Non managed financial assets (investments) - -
Non managed financial assets withdrawals - -
Asset financing activities flows (B) -4.159 -14.495
C) Asset-financing activities deriving flows
Third parties assets
Increase/decrease of short-terms liabilities to banking companies
-3.666 27.432
Increase/decrease of liabilities to other investors 1.645 524
Capital resources - -
Principal payment increase - -
Disposal of shares - -
Asset-financinc activities deriving flow(C) -2.022 27.956
Other asset’s itemization -713 44
Increase (Decrease) of liquid asset (A + B + C) 5.018 16.828
Liquid asset on 1/1/2016 32.382 15.554
Bank and post depots 32.373 15.546
Funds and other assets in hand 9 8
Liquid asset 31/12/2016 37.400 32.382
Bank and post depots 37.387 32.373
Funds and other assets in hand 13 9
Net liquid asset 5.018 16.828

4

4544
EXPLANATORY NOTE TO THE CONSOLIDATED BALANCE UNTIL DECEMBER, 31ST 2017
Company% of Asset
ValueStock Capital
2016 2017 2016 2017
Tremagi Srl Parent Company Euro 2.000 2.000
Illumia SpA 100% 100% Euro 2.000 2.000
Illumia Trend Srl 80% 80% Euro 115 115
Wekiwi Srl 70% 70% Euro 10 10
Illumia Swiss SA 100% 100% Euro 92 92
Illumia Next Srl 0% 100% Euro - 50
Illumia America Corp 100% 100% USD 2.515 7.570
PRELIMINARY REMARKS
Dear Shareholders,
the Consolidated Balance Sheet concerning Tremagi Group that we submit to your approval includes Financial Statement, Corporate Account and Explanatory Note in observance of the civil rules and regulations in force in Italy.
Henceforth all the complementary information believed to be necessary to provide a true and correct picture of the company’s patrimonial, financial and economic situation and the Financial Statement of the business is detailed.
EVALUATION CRITERIA
The Consolidated Balance Sheet until December, 31st 2017 of the Tremagi Srl Parent Company was predisposed in the most careful respect of rules and regulations in force and through the same schemes adopted for the Parent Company’s Balance Sheet drawing-up.
The accounting results of the Balance sheet and Income statement, the Consolidated Financial Statement and the Explanatory note are expressed in Thousands of € in accordance to art. 2423 comma 5 of the Italian Civil Code.
See the content of the management report for what concerns the following information (OIC 12 “Report Required by the accounting principles)”
- nature of the business’s activity
- existing relations with who exerts the management and coordination activity and with other companies that are subject, and as well the mentioned activity on the management of the compa-ny business and its results.
This consolidated balance sheet, drawn-up according to Italy’s accountancy principles, is subject to accounting revision by the business named PricewaterhouseCoopers SpA.
Once this premise is over, it is time to turn to the exposition of the indications as provided by Legislative Decree. nr.139/15 for the Integrative Note concerning Consolidated Balance Sheet until December, 31st 2016.
LIST OF THE COMPANIES INCLUDED IN THE CONSOLIDATION BY THE INTEGRAL METHOD
On December, 31st 2017, the consolidation areas concerning this Balance sheet is formed, besides obviously by Tremagi Srl Parent Company, also by the following subsidiary Companies, included in the consolidation by integral method’s application:
Below are reported the main information concerning each subsidiary company of the Group:
The companies in matter were acquired by the company named Dufenergy Italia Spa of February, 10th 2010.
The company has the following social object, synthesized in its essential points:
• electric energy trading, both on national and European territory
• hydrocarbon trading• trading and import of natural gas in general
and coal;• trading of energetic conservation items
(LED lamps)• study, organization and fulfillment in Italy
and abroad of private and public engineering works in other sectors as electronics, electro-optics, computer and automation.
The Company closes its Management Balance on December, 31st of every year.
ILLUMIA SPA:
Registered Office Bologna – via de’ Carracci 69/2Share capital on 12/31/2017 € 2.000Equity on 12/31/2017 € 12.665Owned share 100%Balance inscription value of the Holding € 6.132Load value and owned nominal value difference € 6.532
WEKIWI SRL:
Registered Office Bologna – via de’ Carracci 69/2Share capital on 12/31/2017 € 10Equity on 12/31/2017 € 40Owned share 70%Balance inscription value of the Holding € 661Load value and owned nominal value difference € -637
Wekiwi Srl is “project company” aimed to the development of a new web portal of the Group. It has started its activity in July 2015 and on 12/31/2017 appears to be still at the start-up stage.
In particular, Wewiki.it is the web portal aimed to propose itself as the first online provider of electric energy and gas to private customers and micro business.

4746
Wekiwi is the second commercial brand of the group, targeted to the on-line customers. It provides advanced instruments for the subscription of contracts and supply management putting the customer in condition to fulfil all the management operations directly on the website or through app. Wekiwi represents also an innovation lab for the Tremagi Group
that can experiment through this new brand new products/services or new typology of offer and management of the customer.
The difference from the cost of the participation and the nominal value in the balance sheet closed on 31/12/2017 is not a durable loss in value, being the company still in a Start-Up stage.
The Illumia Trend company accomplishes the following business:
technical and advanced consulting about the coverage of the risk related to the fees ap-plied to final customers and evaluation of contracts concerning wholesale trade of energy products and consulting in the negotiation of framework contracts with the counterparts;
• trade management of electric energy from energy-sparing plants;
• logistic services of gas transport, storage, balance;
• support and consulting activity in the revision, drawing-up, negotiation of natural gas consignments trade contracts, including assistance in possible negotiation with the coun-terparts;
• introduction among active counterparties of price risk coverage solutions and possible assistance in hedges negotiation;
• individuation of natural gas consignments purchase or sell opportunities as well outside the PSV;
The load value and owned nominal value are equal and corresponding to the balance inscription value.
Illumia Swiss Company was incorporated on January, 30th 2015 through registered notary deed drawn up by Public Notary Marazzi, in Lugano, annex A Deed nr.305.
Illumia Swiss operates in the field of energy products and assets trade and accomplishes in particular the following activities:
• Energy products trade: the company financed important negotiations for the
subscription of EFET and ISDA contracts with primary importance energy operators. Some negotiations were already successfully closed during the considered period, thus allowing Illumia Swiss front office to operate the first wholesale exchanges through ISDA contracts, of energy index related to Swiss, German and Italian markets.
• Service: Illumia Swiss know-how was enhanced through supplies having as object
the displacement of production plants and management of suitable appointments for the use of electric interconnections among Switzerland and bordering countries. The activities in matter mainly interested the
management of the appointments on the aimed data processing platforms, management of the plant displacement contracts and the verification of the monthly settlement.
Illumia Next Srl Company was incorporated on July, 18th 2017 through notary deed drawn up by Public Notary Vico, registered in Bologna on July, 25th 2017, Deed registr.nr.140971IT.
The Company’s object is the electric energy and natural gas trade and on 31/12/2017 appears to be still non-operating.
The value of registration on balance reports an increase due to the active financing to the Illumia America Corp. in stock capital, accomplished by the company in matter on April, 18th 2017.
The difference between holding cost and the corresponding net asset in the balance sheet does not represent a durable loss in value, because partly due to the exchange rate variation and, moreover, the subsidiary holds a highly valuable estate of historical value that, at the moment, appears to have a higher market value. That surplus value, that actually guarantees the recoverability of the holding value, is not itemized in the balance sheet.
OTHER EQUITY INVESTMENTS IN SUBSIDIARY AND RELATED COMPANIES EVALUATED BY THE COST.
On December, 31st 2017 within Tremagi Group no participations are reported in subsidiary and related companies evaluated by the cost.
LIST OF OTHER EQUITY INVESTMENTS IN “OTHER BUSINESS” EVALUATED BY THE COST
On December, 31st 2017 within Gruppo Tremagi are reported the following equity investments in other business, owned according to equal or lower that 5% percentages, excluding Mondo Energia that is equal to 10%:
• Mondo Energia srl• Banca Popolare di Verona• Banca di Bologna• Emilbanca Credito Cooperativo• We Sii S.r.l.• Italian Fight Wear S.r.l.• BHS S.r.l.
The participation in Mondo Energia srl concern Illumia SpA indirect commercial networks agencies. The company operates in the sector of consulting, promotion and sales to companies of energetic products and can count on a branched
ILLUMIA TREND SRL.
Registered Office Bologna – via de’ Carracci 69/2Share capital on 12/31/2017 € 115Equity on 12/31/2017 € 4.253Owned share 80%Balance inscription value of the Holding € 130Load value and owned nominal value difference € 3.272
ILLUMIA SWISS SA.
Registered Office Lugano, Via Cantonale 19Share capital on 12/31/2017 € 92Equity on 12/31/2017 € 1.891Owned share 100%Balance inscription value of the Holding € 101Load value and owned nominal value difference € 1.789
ILLUMIA NEXT SRL
Registered Office Bologna – via de’ Carracci 69/2Share capital on 12/31/2017 € 50Equity on 12/31/2017 € 50Owned share 100%Balance inscription value of the Holding € 50Load value and owned nominal value difference € 0
ILLUMIA AMERICA CORPORATION
Registered Office 11 Broadway, Suite 368 – New York 10004
Share capital on 12/31/2017 $ 7.570Equity on 12/31/2017 $ 6.626Owned share 100%Balance inscription value of the Holding $ 6.715Load value and owned nominal value difference $ -1.195
4948
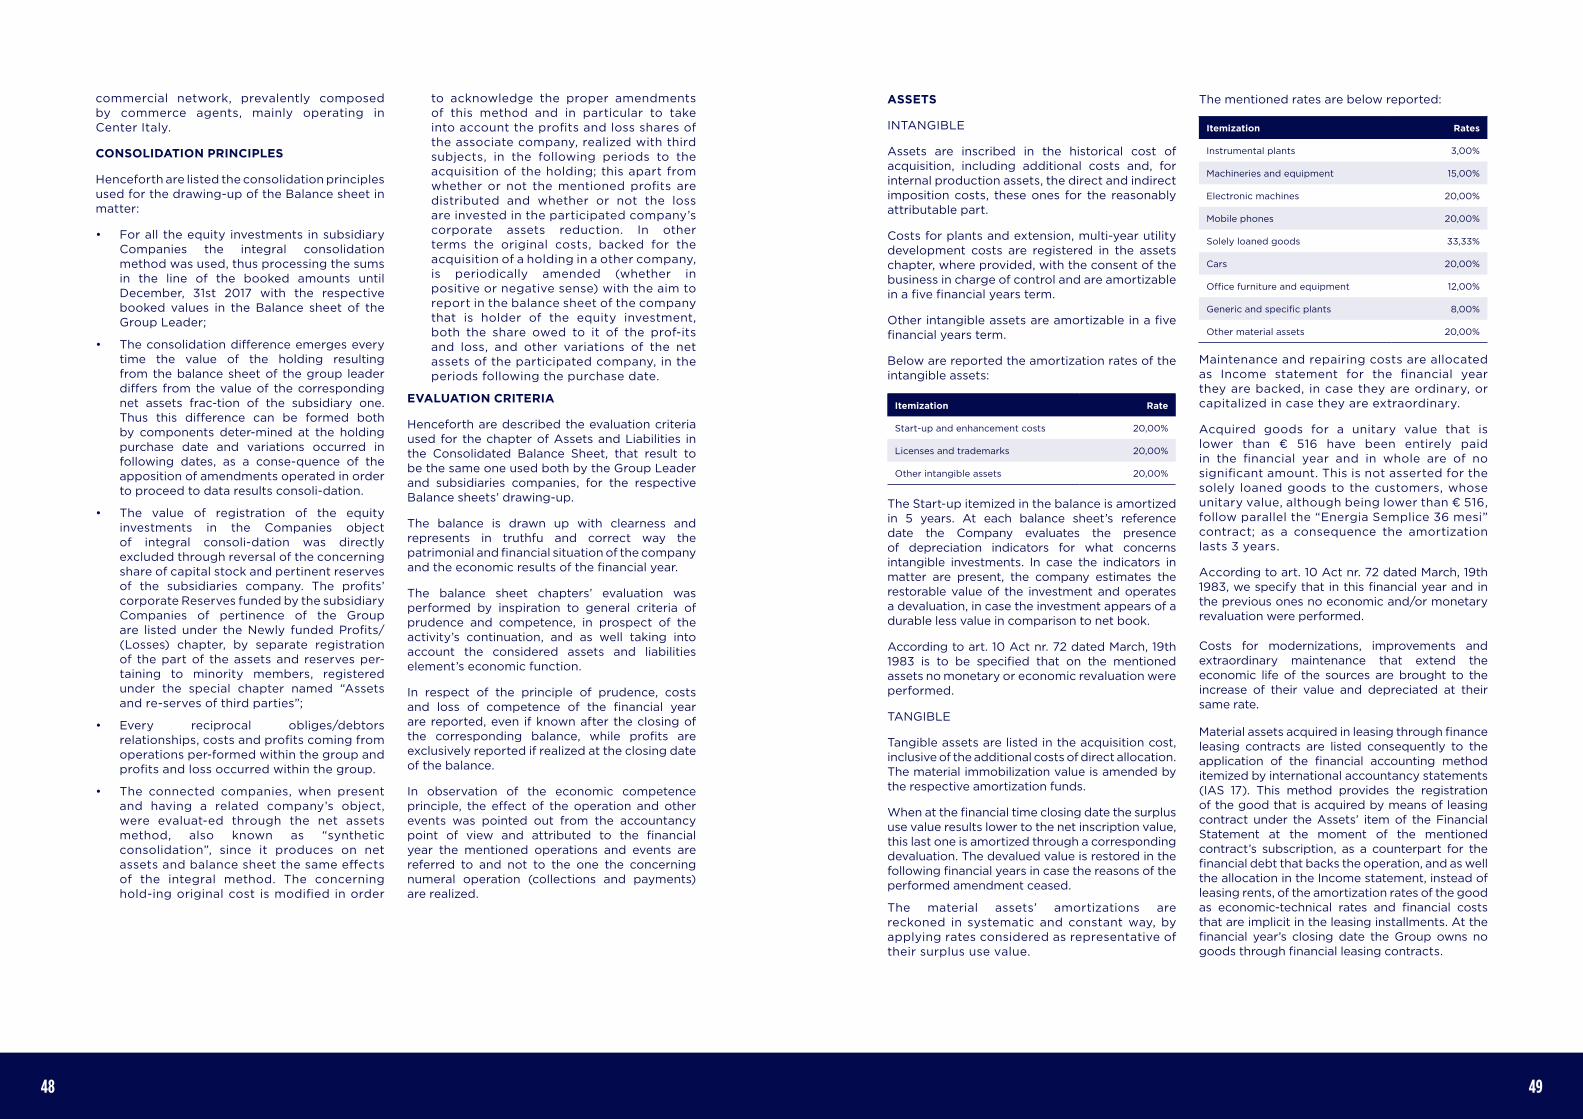
ASSETS
INTANGIBLE
Assets are inscribed in the historical cost of acquisition, including additional costs and, for internal production assets, the direct and indirect imposition costs, these ones for the reasonably attributable part.
Costs for plants and extension, multi-year utility development costs are registered in the assets chapter, where provided, with the consent of the business in charge of control and are amortizable in a five financial years term.
Other intangible assets are amortizable in a five financial years term.
Below are reported the amortization rates of the intangible assets:
The Start-up itemized in the balance is amortized in 5 years. At each balance sheet’s reference date the Company evaluates the presence of depreciation indicators for what concerns intangible investments. In case the indicators in matter are present, the company estimates the restorable value of the investment and operates a devaluation, in case the investment appears of a durable less value in comparison to net book.
According to art. 10 Act nr. 72 dated March, 19th 1983 is to be specified that on the mentioned assets no monetary or economic revaluation were performed.
TANGIBLE
Tangible assets are listed in the acquisition cost, inclusive of the additional costs of direct allocation. The material immobilization value is amended by the respective amortization funds.
When at the financial time closing date the surplus use value results lower to the net inscription value, this last one is amortized through a corresponding devaluation. The devalued value is restored in the following financial years in case the reasons of the performed amendment ceased.
The material assets’ amortizations are reckoned in systematic and constant way, by applying rates considered as representative of their surplus use value.
The mentioned rates are below reported:
Maintenance and repairing costs are allocated as Income statement for the financial year they are backed, in case they are ordinary, or capitalized in case they are extraordinary.
Acquired goods for a unitary value that is lower than € 516 have been entirely paid in the financial year and in whole are of no significant amount. This is not asserted for the solely loaned goods to the customers, whose unitary value, although being lower than € 516, follow parallel the “Energia Semplice 36 mesi” contract; as a consequence the amortization lasts 3 years.
According to art. 10 Act nr. 72 dated March, 19th 1983, we specify that in this financial year and in the previous ones no economic and/or monetary revaluation were performed.
Costs for modernizations, improvements and extraordinary maintenance that extend the economic life of the sources are brought to the increase of their value and depreciated at their same rate.
Material assets acquired in leasing through finance leasing contracts are listed consequently to the application of the financial accounting method itemized by international accountancy statements (IAS 17). This method provides the registration of the good that is acquired by means of leasing contract under the Assets’ item of the Financial Statement at the moment of the mentioned contract’s subscription, as a counterpart for the financial debt that backs the operation, and as well the allocation in the Income statement, instead of leasing rents, of the amortization rates of the good as economic-technical rates and financial costs that are implicit in the leasing installments. At the financial year’s closing date the Group owns no goods through financial leasing contracts.
Itemization Rate
Start-up and enhancement costs 20,00%
Licenses and trademarks 20,00%
Other intangible assets 20,00%
Itemization Rates
Instrumental plants 3,00%
Machineries and equipment 15,00%
Electronic machines 20,00%
Mobile phones 20,00%
Solely loaned goods 33,33%
Cars 20,00%
Office furniture and equipment 12,00%
Generic and specific plants 8,00%
Other material assets 20,00%
commercial network, prevalently composed by commerce agents, mainly operating in Center Italy.
CONSOLIDATION PRINCIPLES
Henceforth are listed the consolidation principles used for the drawing-up of the Balance sheet in matter:
• For all the equity investments in subsidiary Companies the integral consolidation method was used, thus processing the sums in the line of the booked amounts until December, 31st 2017 with the respective booked values in the Balance sheet of the Group Leader;
• The consolidation difference emerges every time the value of the holding resulting from the balance sheet of the group leader differs from the value of the corresponding net assets frac-tion of the subsidiary one. Thus this difference can be formed both by components deter-mined at the holding purchase date and variations occurred in following dates, as a conse-quence of the apposition of amendments operated in order to proceed to data results consoli-dation.
• The value of registration of the equity investments in the Companies object of integral consoli-dation was directly excluded through reversal of the concerning share of capital stock and pertinent reserves of the subsidiaries company. The profits’ corporate Reserves funded by the subsidiary Companies of pertinence of the Group are listed under the Newly funded Profits/(Losses) chapter, by separate registration of the part of the assets and reserves per-taining to minority members, registered under the special chapter named “Assets and re-serves of third parties”;
• Every reciprocal obliges/debtors relationships, costs and profits coming from operations per-formed within the group and profits and loss occurred within the group.
• The connected companies, when present and having a related company’s object, were evaluat-ed through the net assets method, also known as “synthetic consolidation”, since it produces on net assets and balance sheet the same effects of the integral method. The concerning hold-ing original cost is modified in order
to acknowledge the proper amendments of this method and in particular to take into account the profits and loss shares of the associate company, realized with third subjects, in the following periods to the acquisition of the holding; this apart from whether or not the mentioned profits are distributed and whether or not the loss are invested in the participated company’s corporate assets reduction. In other terms the original costs, backed for the acquisition of a holding in a other company, is periodically amended (whether in positive or negative sense) with the aim to report in the balance sheet of the company that is holder of the equity investment, both the share owed to it of the prof-its and loss, and other variations of the net assets of the participated company, in the periods following the purchase date.
EVALUATION CRITERIA
Henceforth are described the evaluation criteria used for the chapter of Assets and Liabilities in the Consolidated Balance Sheet, that result to be the same one used both by the Group Leader and subsidiaries companies, for the respective Balance sheets’ drawing-up.
The balance is drawn up with clearness and represents in truthfu and correct way the patrimonial and financial situation of the company and the economic results of the financial year.
The balance sheet chapters’ evaluation was performed by inspiration to general criteria of prudence and competence, in prospect of the activity’s continuation, and as well taking into account the considered assets and liabilities element’s economic function.
In respect of the principle of prudence, costs and loss of competence of the financial year are reported, even if known after the closing of the corresponding balance, while profits are exclusively reported if realized at the closing date of the balance.
In observation of the economic competence principle, the effect of the operation and other events was pointed out from the accountancy point of view and attributed to the financial year the mentioned operations and events are referred to and not to the one the concerning numeral operation (collections and payments) are realized.

5150
Operative leasing contracts are itemized according to the patrimonial methods providing the registration in profit or loss of the costs for the concerning rentals.
The real estate owned by Gruppo Tremagi are considered civil engineering’s Manufacts constituting a form of investment, are amortized each financial year in case their residual possibility of use appears higher than the net book value.
SUBSIDIARY COMPANIES
Equity investments in subsidiary non-integrally consolidated companies are registered at the purchase cost or subscription that includes accessory costs of direct allocation, in case amended to consider permanent loss of value.
Receivables that are registered under financial assets, are registered at the presumably break-up value. In particular, the criteria of evaluation of immobilized securities is the purchase cost inclusive, transaction, active or passive commissions and every accessory costs, and every difference between initial value and nominal value at maturity are included in the amortized costs reckoning by the method of effective interest.
INVENTORY
The end of financial years inventory represents the costs backed for the purchase or production of determined goods, which profits will be collected only in the following financial year; therefore, according to the principle of competence, must be deferred.
The goods that represent the stock-on-hand are:
• Raw materials: natural gas storage;
• Wares: no-further-processing goods that are assigned to the resale LED storehouse in possession of outside contractors.
Both for what concerns Gas storehouse and LED storehouse the cost configuration of choice is the weighted average cost.
RECEIVABLES (INCLUDING RECEIVABLES ITEMIZED IN THE FINANCIAL ASSETS)
Receivables are itemized according the amortized cost method, taking into account the time factor and the presumable break-up value.
In particular, the initial registration value is given by the nominal value of the credit, after deduction of grants, allowances and rebates, and including the possible costs directly attributable
to the transaction that generates the credit. Transaction costs, possible active and passive commissions and every difference between the initial value and nominal value at maturity are included in the amortized cost’s reckon through the effective interest.
The adjustment of the receivables’ nominal value to the presumable break-up value is obtained through a special allocation to the receivables’ devaluation fund, that considers generic and specific risk of irrecoverableness.
The company did not calculate and booked in the Inventory of arrears concerning the financial year, as allowed by the rules and regulations in force, that allows the booking in the balance sheet of the mentioned Inventory in the very moment they are collected.
Receivables towards other debtors are booked for their nominal value, being at the moment non-recognizable any reasons, precautionary as well, that can lead to operate depreciations on the amounts of the mentioned items.
Receivables for prepaid taxes measure the amount of taxes on the temporary differences among accounting results and the corresponding fiscal values.
The requirements are present to consider met the reasonable certainty of the presence, in the further financial years of taxable income not lower to the amount of the temporary fiscal variations that led to the advance taxes registration.
It is to be specified that, in observance of Legislative Decree 139/15, on December, 31st 2016 the receivables already itemized on December, 31st 2015 are itemized at their nominal value, believed representative of their termination value.
CASH ASSETS
Cash assets are itemized at the nominal or conventional unit that is considered as representative of the presumed break-up value.
PREPAID EXPENSES
Expressed income and costs pertaining to the financial year but collectable in further financial years or backed-up within the balance sheet’s closing date are of competence of further financial years.
For what concerns multi-year duration prepaid expenses, conditions have verified that determined the original booking, adopting, where necessary, the proper variations.
Collectibles deriving from the “commissioning” are compared to the duration of every single drawn-up contract. This allows to correlate at best the costs from commissioning with the concerning income from invoicing.
PROVISIONS FOR RISKS AND COSTS
Allocated against the coverage of loss and payables, and of a determined nature and certain or likely existence, the amount or contingency or timing date can be nevertheless determined at the financial year’s closing time.
In evaluation of the mentioned provisions, general criteria of prudence and economic competence are respected and no generic provisions avoid of economic justification were accrued.
Potential liabilities were pointed out in the balance sheet and booked in the funds’ item as considered likely, and being the concerning reasonably assessable charge.
The risks the showing of a liability is only possible for, are itemized in the Explanatory Note, without proceeding with the allocation of a risks and costs fund.
PROVISIONS FOR EMPLOYEES
Represents the actual debt accrued towards the dependent employees in observance of law dispositions and labor contracts in force, considering every form of permanent nature remuneration.
The debt for provision corresponds to the whole of the single allowance accrued in favor of the employees at the balance sheet’s closing date, after the accrued advance and what lodged at the INPS [Italian national insurance service, TN] treasury and/or integrative social security funds, and is equal to what must be settled to the employees supposing the employment’s termination at that date.
PAYABLES
Payables are itemized at their nominal value, considered representative of redemption value, taking into consideration the time factor. In particular, the value of the initial itemization is given by the nominal value of the payable not including the costs of transactions and grants, allowances and rebates directly attributable to the transaction that generates the credit. Transaction costs, possible active and passive commissions and every difference between the initial value and nominal value at maturity are included in the amortized cost’s reckon through the effective interest.
It is to be specified that, in observance of Legislative Decree 139/15, on December, 31st 2016 the receivables already itemized on December, 31st 2015 are itemized at their nominal value, believed representative of their termination value.Taxes on income are booked on the ground of an estimate of the fiscal year’s tax burdens with reference to rules and regulations in force.
FINANCIAL DERIVATIVES
The Company holds financial derivatives to the aim of hedging financial exposure from the risk of variations in the interest rates or variations in the gas and electric energy prices related to the charge of fixed-price or variable-price fees to customers. With the aim of enhancing the modalities of hedging of the portfolio, the Company is committed to individuate and research on the market not only standard products but also timing profiles and cherry-picking initiatives targeted to maximize the day-by-day coverage. It is moreover equipped of dedicated software that allow its portfolio’s market risk monitoring through VAR and PAR techniques, daily verified within very stringent internal risk policy.
In observance of what provided by the OIC 32 accounting policy introduced by the accounting reform established by Legislative Decree nr.139/15, the financial derivatives are related to the fair value, reckoned through input data directly observed on the market.
The operations that, in the respect of the risk management policy, meet the requirements provided by OIC 32 accounting policy for the treatment in hedge accounting, are classified as Cash Flow Hedge because they are aimed to limit the exposition to financial flows variability risks linked to secure or highly likely future financial operations (mainly hedged through commodity contracts) or financial liabilities entered in the budget (interest rate swap on funding).
Contracts to expire of electric energy and gas purchase and sale, subscribed in order to meet the sale and purchase requirements of the Company or the Group are not subject to evaluation given that are based on physical supply of the purchased and sold quantities.
For the accounting, the Company entry the fair value in the balance sheet: if positive is entered in the “Financial derivative asset” item in the Financial Assets or the Financial Activities which not constitute fixed assets according to the expire of the instrument, while if negative is itemized in the “Passive financial derivatives”

5352
in the Funds for risks and charges; with financial compensation the Net Asset item –A) VII – “Cash Flow hedge coverage for unexpected operations” after deferred taxes. This Net Asset reserve is therefore related to the income statement in the corresponding measure and timing of the occurrence of the cash flows in the hedged instrument. The fair value adjustment possibly referable to the ineffective share is immediately itemized in section D of the income statement.
The adjustments in Fair Value in operations that, though being fulfilled in substantial purpose of hedging, do not meet in full the requirements of the OIC 32 accounting policy are itemized in the Income Statement at the Section D) “Value adjustment of financial assets and liabilities” in the items provided by art. 2425 of the Italian Civil Code:
D) 18) d) re-evaluation of financial derivatives;
D) 19) d) depreciation of financial derivatives
with compensation the balance sheet in the “Active financial derivatives” in the Intangible Fixed Assets or the Financial activities which not constitute fixed assets if the fair value appears positive and/or in the “Active financial derivatives” in the Funds for risks and charges if the fair value appears negative.
SECURITIES, COMMITMENTS, THIRD PARTIES’ GOODS AND RISKS
• Risks for securities given in favor of third parties are itemized in the memorandum ac-counts for an amount that is equal to the given securities amount; in particular, securities given in favor of third parties, whether directly or indirectly, shared among guarantees, backings, other personal and real securities;
• Risks for guarantees given in favor of third parties are itemized as an amount equal to the value of the given guarantee;
• Commitments are itemized in the memorandum accounts in the “Other information” sec-tion at the nominal value, deduced from the concerning records;
• Evaluation of third parties’ goods at the business was performed on the ground of the value that was deduced from existing records.
COSTS AND INCOME
Itemized in the balance sheet according to the principles of prudence and economic competence by survey of the concerning Prepaid expenses.
Income and revenues, costs and charges are registered after returns, discounts, abatements and bonus, and also after taxes that are directly connected given services.
Revenues for the sales of the products are itemized when risks and benefits connected to the property are transferred, a passage that generally coincide with the expedition or delivery of the goods, while the revenues from service provisions are recognized at the date the operations in matter are closed.
Revenues and incomes, costs and charges concerning operations in currency are determined according to the current change at the date the operation in matter is closed.
Income from selling of electric energy and natural gas are referred to the increase in value of quantities respectively supplied and delivered during financial year, even if not yet invoiced, and determined by the integration, through suitable accountant valuations, by surveyed results on the ground of the readings received by suppliers and Terna (the so-called energetic balance mechanism). The mentioned income are grounded on contract agreements with customers and, in case they are applicable, are regulated by the provisions of law issued by the Autorità per l’Energia Elettrica e il Gas [“AEEG” – Electric Energy and Gas Business TN.], in force during the period of reference.
Commercial operations performed with the group’s companies occurred in normal market conditions.
TAXES ON INCOME
Taxes on income in force are determined on the ground of a realistic anticipation of tax costs to be accomplished in application of rules and regulation nowadays in force in matter of revenue.
Delayed taxes are reckoned on the temporary differences existing among the property values registered in the balance sheet and the corresponding values that are recognized for purposes of revenue. In particular, delayed active taxes are registered only in case of
reasonable certainty of their future recovery. Delayed active taxes are not registered in case scarce probabilities occur that the concerning debt arises.
According to what provided by art. 2427, comma 1, nr. 14) of the Italian Civil Code, this Explanatory Note reports a dedicated return containing:
1. description of the temporary differences that involved the survey of delayed and advanced taxes, specifying the applied rate, variations respect previous financial year, accrued or charged amounts to the Income statement or net assets, items excluded from the reckoning and concern-ing justifications;
2. the amount of the advanced taxes booked in balance sheet and concerning loss of financial year or previous financial years and justifications for the booking, the amount that wasn’t still booked and justifications for the potential non-booking.
Particularly, for what concerns the allocation of advanced taxes on accrued and non-used fiscal loss, it must be specified that they are booked only when:
1. there is reasonable certainty to obtain in future taxable values of the company of such extent to absorb the continuative loss (in subsequent fiscal periods in higher than 80% measure of the taxable income of each one of them and for the entire sum contained in that amount),
2. in case the accrued loss may be chargeable to specific circumstances that are considered not to be repeatable in the future.
It is moreover to be pointed out that, running from the financial year closed on December, 31st 2017, the Company renewed consolidated granted taxation through option according to what disposed by articles 117 and following of D.P.R. [Decree of the President of the Republic] 917/86. Option providing group taxation is in force for the 2017-2019 three-years term and the companies that are part of it are Tremagi SA, as consolidating company, and Tremagi Srl, Illumia SpA, Illumia Trend S.r.l. and Wekiwi S.r.l.
Economic relationships, mutual liabilities and obligations are determined in the “Contratto di consolidamento fiscale nazionale” [National Contract of tax consolidation] according to which subsidiaries must recognize to the parent companies the amounts due for the transfers by way of account and in settlement of IRES, in the terms provided by rules and regulations, in force at the moment the parent companies provides to the mentioned transfers.
For the financial year’s tax loss transferred to the parent companies and used in enforcement of the group taxation principles a receivable is provided, to the subsidiaries company that has caused them, in proportion of IRES rate applicable for what concerns fiscal year when the mentioned loss are used in the Group taxation.

5554
Business name 2017 Receivables 31/12/2017
Loans 31/12/2017
Revenues 2017 Costs
Tremagi SA 5.300 756 - 756
Sea - 348 - 493
Balance until 31/12/2017 Balance until 31/12/2016 Variations
7.737 6.879 858
Intangible assets Historic Cost 2016 Increases Reclassification Historic Cost 2017
1) Establishment and enhancement costs
67 - - 67
4) Authorizations, licenses and brands 1.841 375 - 2.216
5) Goodwill - 170 - 170
5bis) Difference of consolidation 3.550 - - 3.550
6) Investments in progress and advance
389 1.609 -385 1.613
7) Altre immobilizzazioni immateriali 6.173 885 254 7.311
Total Intangible Assets 16.801 3.188 -131 19.857
Company staff 31/12/2017 31/12/2016 Variations Average Nr
Directors 2 3 -1 3
Employees 154 148 6 144
Total 156 151 5 1470
RESULTS ABOUT EMPLOYMENT
The national labor contract in force is the one concerning trade and service sector.
Afterwards is reported the composition and variations occurred during financial year of the company staff shared for category.
Henceforth are reported the gross values management of the intangible assets:
TRANSACTIONS WITH RELATED PARTIES
The Board of Administrators individuates as related parties the ones stated by Italian Civil Code, art. 2427 c.1 nr. 22-bis, in detail, in the case of Tremagi S.r.l. the following ones:
a) companies directly or indirectly submitted to the control of Tremagi S.r.l. and the related companies;
b) companies where the executive and non-executive managers or, when appointed, the general managers of Tremagi S.r.l. or its subsidiary companies or the respective close relatives exert a remarkable influence.
Hereby is reported a rear-view scheme of the relations with related companies:
1.Costs for Establishment and enhancement
Expenses borne at the establishment already completely amortized, and the start-up expenses concerning the launch of the Illumia brand, which amortization is ongoing.
2.Development Costs
Expenses borne at the establishment already completely amortized.
3.Authorizations, licenses and brands
This item concerns mainly purchase of software programs for current contracts’ management concerning:
- Electric Energy and Gas supply to final customers
- Sales of supply to resellers
- Commissioning - results-entry system for the current contracts with relevant reckoning of the monthly commissions for agents.
4.Goodwill from Consolidation Procedure
The item is due to the conclusion of the extraordinary Start-up generated for the acquisition of the SME and Reseller customers’ company branch by the Electra Italia SpA company, belonging to the BKW Group (CH),
in force from November, 1st 2017. For further details about the operation please see the Management Report. It is to be pointed out that the Start-up was purchased in return of payment and registered upon consent of the Board of Auditors.
5.bis Difference of consolidation
No net balances are reported for this item because the depreciation of the Start-up generated by the purchase of Illumia SpA, by the Tremagi Srl on February, 10th 2010 was just fulfilled.
6.Investments in progress and advance
The item concerns mainly accounts given to external suppliers for the implementation activity of the new SAP software functioning from 2019.
7. Other intangible assets
Improvement for the period is mainly determined by € 78.600 intangible assets mainly referred to costs borne for the implementation of data processing software in particular of the DWH (Data-Warehouse) environment used for the elaboration of directional report in support of the strategy decisions and analysis report in support of the business.
B) ASSETS
B. Fixed AssetsBI. Intangible Assets
The Balance platform concerning intangible assets amounts to € 7.737.000 and, in comparison with € 6.879.000 booked in the previous Balance
sheet, reports a net increase of € 858.000.
In particular:
The above mentioned operations have been fulfilled at the market value.
Each item of the above reported rear-view scheme is commented in the Explanatory Note.
Company staff 31/12/2017 31/12/2016 Variations Average Nr
Directors 3 4 -1 4
Employees 148 142 6 147
Total 151 146 5 151
In 2016

5756
Intangible Assets Historical Cost 2016
Increases Decreases Reclassifications €/Dollar Effect
Historical Cost 2017
1) Lands and buildings 37.630 22 - 131 -667 37.116
2) Plants and machin. 781 27 - - - 807
4) Other goods 5.705 606 214 - -67 6.243
5) Invest. in progressand advance
4.287 1.100 - - - 5.387
Intangible immob.Total 48.403 1.754 214 131 -734 49.554
Tangible fixed assets NBV 31/12/2016 NBV 31/12/2017
1) Lands and buildings 37.284 36.352
2) Plants and machineries 611 571
4) Other goods 3.233 2.988
5) Invest. in progress and advance 4.287 5.387
Material Assets Total 45.415 45.298
Intangible assets Amortized Fund 31/12/2016 Amortization Rate Decreases Amortized Fund
31/12/2017
1) Costs for plants and extension 957 954 - 1.911
2) Advertisement research and development costs
1.991 - - 1.991
4) Authorizations, licenses and brands 977 275 - 1.251
5) Goodwill - 6 - 6
5bis) Goodwill from consolidation process
3.550 - - 3.550
6) Investments in progress and advance
- - - -
7) Other intangible assets 2.447 963 - 3.410
Intangible Immobilizations Total 9.922 2.197 - 12.119
The following rear-view scheme reports the management of the amortization funds for
what concerns intangible assets:
Intangible assets NBV 31/12/2016 NBV 31/12/2017
1) Costs for plants and extension 1.900 1.094
2) Advertisement Research and development costs
- -
4) Authorizations, licenses and brands 864 965
5) Goodwill - 164
5bis) Goodwill from consolidation process
- -
6) Investments in progress and advance 389 1.613
7) Other intangible assets 3.726 3.901
Intangible Immobilizations Total 6.879 7.737
For what concerns the determination of the amortization reckoned on the Intangible assets,
it is already exposed in the section concerning the “Evaluation Criteria – Intangible Assets”
For what concerns the amortizations’ determination reckoned on material assets see what already itemized in the paragraph concerning “Evaluation criteria – Tangible assets” of this Explanatory Note, pointing out that the amortization on Buildings and Premises exclusively concerns the facility located in Via De’ Carracci 69/2, registered office of the Group.
We believe that the adoption of the mentioned amortization rates is coherent with the requirement to reflect in the balance sheet a value of sources that is corresponding to their residual possibility of utilization in ordinary business management.
Tangible fixed assets Amort. Funds 2016 Amort. Rate Decreases €/Dollar Effect Historical Cost
2017
1) Lands and buildings 347 417 - - 764
2) Plants and machineries 169 67 - - 236
4) Other goods 2.471 785 194 -21 3.042
5) Invest. in progress and advance - - - - -
Material Assets Total Amount 2.988 1.269 194 -21 4.042
The most important increments in the financial year concern:
• Other Goods - the higher increases within this item concerns the purchase of furniture for the new registered seat of the Group. The decrease of the period is referred to the amortization of the solely loaned contracts for the LED Kits.
• In-progress and advance assets and payments on account - the increase for the period concerns the payments in advance for the amount of € 1.100.000 paid during financial year 2017 for the purchase of a new facility for civil use located in Bologna (BO – Italy) for which a preliminary purchase agreement was drawn up on November, 10th 2017 and registered on November, 11th 2017 column 3 nr. 8154.
The following rear-view scheme reports the management of the amortization funds for
what concerns material assets:
Balance until 31712/2017 Balance until 31/12/2016 Variations
45.298 45.415 (117)
B II – Tangible Assets
The Balance sheet’s sector concerning tangible assets amounts to € 45.298.000 and, in comparison to € 45.415.000 booked in the
previous Balance sheet, a net increase of € 117.000 is reported. In particular:

5958
Itemization Balance until 31/12/17 Balance until 31/12/16 Variations
Equity Investments 139 41 98
Dead loans 5.993 6.139 146
Total 6.132 6.180 48
Itemization 2016 2017 Variations
Partecipations 139 41 98
Immobilized loans 5.993 6.139 -146
Total 6.139 6.180 -48
Itemization 2016 2017 Variations
Receivables towards associates 5.000 5.000 -
Receivables towards others 993 1.139 -146
Total 5.993 6.139 149.739
Partecipation in associated companies
% 31/12/16 Increases Decreases 31/12/2017
Mondo Enrgia Srl 10% 1 - - 1
Emilbanca Credito Coop.vo N/a 15 - - 15
Cassa di Risparmio di Ravenna
N/a 4 - 4 -
Banco Popolare di Verona N/a 10 - - 10
BHS 5% - 3 - 3
Banca di Bologna N/a 10 - - 10
We Sii Srl 2% - 38 - 38
Italian Fight Wear Srl 3% - 62 - 62
Total 41 102 4 139
B III – Financial Assets
The Balance sheet area concerning “Financial assets” records a variation in decrease, in comparison to the previous financial year,
equal to € 48.000, passing from € 6.180.000 to € 6.132.000.
1- d-bis) Equity investments in associates companies
Henceforth is detailed the composition and management occurred during the financial year in matter:
1. Equity investment
2. Locked up receivables
In particular:
Below are reported the details of the equity investments in subsidiaries, associates and other business.
The Balance sheet item concerning “locked-up receivables” reports an increasing variation in comparison to the previous financial year
of € 146.000, passing from € 6.139.000 to € 5.993.000.
Receivables towards associates concern the Tremagi SA Holding and have generated after a transfer of participation shares occurred in July 2013. The variation in the receivables
towards other companies derives from the collection of receivables claimed by Illumia America Corp. company.
The minority interests concern participations in Banking Institutes outsourcing the Group.
The participation in Mondo Energia S.r.l. concerns agencies that are parts of the indirect commercial network of Illumia S.p.A. operating in the sector of the consulting, promotion and sale to companies of energy products and can count on a branched trade network, mainly composed by trading agents operating mainly in Center Italy.
Increase in the balance sheet concern the acquisition of shares, respectively 2% and 3% in Wee Sii S.r.l. and Italian Fight Wear S.r.l. companies fulfilled on December, 22nd 2017. The acquisitions in matter allow to enter in the sector of the innovative start-ups operating in the energy market. Moreover, the acquisition is reported of the 5% share of the BHS S.r.l. company occurred on June, 1st 2017 by means of notary deed registered by Public Notary Vico in Bologna on 12/06/2017, registration nr.10530.
Balance until 31712/2017 Balance until 31/12/2016 Variations
6.132 6.180 48
Balance until 31712/2017 Balance until 31/12/2016 Variations
6.132 6.180 -48
Balance until 31712/2017 Balance until 31/12/2016 Variations
5.993 6.139 -146

6160
C – Current assets
I. Remainders
II. Receivables
Itemization 2016 2017 Variations
Raw materials and stocks 1.094 417 677
Finished products 1.104 890 214
Advance 56 109 53
Total 2.253 1.416 837
Itemization Within 12 months Over 12 months Over 5 years TOTAL
From customers 125.310 - - 125.310
From parent companies 300 - - 300
Exercise and revenue receivables 4.522 - - 4.522
Advanced taxes 1.439 - - 1.439
From third subjects 4.909 - - 4.909
Total 136.480 - - 136.480
Itemization Within 12 months Over 12 months Over 5 years TOTAL
From customers 137.053 - - 137.053
From parent companies 350 - - 350
Exercise and revenue receivables 6.468 - - 6.468
Advanced taxes 3.016 - - 3.016
From third subjects 6.370 - - 6.370
Total 1.53.257 - - 1.53.257
Increase of € 837.000 in comparison of the previous year is so booked:
In detail:
1) For what concerns “Raw materials and stock consumption” it is about gas stocks stored until 12.31.2017 and evaluated according to the weighed mean cost. For “storage” is to be meant the storage in underground structures of natural gas collected from national transport network and put again in a second time in the network according to the marker requests.
2) For what concerns the term “Wares” it is about energy efficiency products, like the LED bulbs, batteries, electric bikes targeted to the retail sale. The products in matter, evaluated accord-ing to the weighed mean cost, are in storage at an external logistic-provider center.
3) “Advance” concerns advance payments on LED supplying by the main foreign providers, to be delivered during 2018.
In comparison to the previous financial year the item concerning “Circulating assets receivables” books a net decrease equal to € 16.777, paying
€ 136.480 in comparison with € 153.257 of the previous financial year.The receivables’ maturity is so shared out:
In 2016:
Balance until 31712/2017 Balance until 31/12/2016 Variations
2.253 1.416 837
Balance until 31712/2017 Balance until 31/12/2016 Variations
136.480 153.257 (16.777)
Itemization Italy Abroad TOTAL
To customers 116.050 9.261 125.311
To parent companies - 300 300
Exercise and revenue receivables 4.476 46 4.522
Prepaid income taxes 1.439 - 1.439
From third subjects 3.289 1.621 4.910
Total 125.253 11.228 136.482
Itemization Italy Abroad TOTAL
To customers 126.757 10.296 137.053
To parent companies - 350 350
Exercise and revenue receivables 6.069 399 6.468
Prepaid income taxes 2.847 4.244 6.370
From third subjects 2.126 4.244 6.370
Total 137.799 15.458 153.257
In 2016:
The allocation of funds on December, 31st 2017 according the geographic area of the obligor is reported in the following rear-view scheme:
The item is so composed:
The decrease of the net credits towards customers in 2016 balance sheet is mainly due to different timeframes of collection in
comparison to the previous financial year.Receivables depreciation fund underwent the following operations during the financial year:
Itemization 2017 2016 Variations
Receivables from gross customers 142.714 148.947 -6.233
Receivables depreciation -17.404 -11.894 -5.510
Total 125.310 137.053 -11.743
Itemization 31/12/2017 Non-excised part rate Excised part rate Total amount
Receivables depreciation 11.894 6.306 -796 17.404
Final fund 11.894 6.306 -796 17.404
1. Receivables from customers
Here the circulating assets’ amounts are submitted to analysis:
Itemization 31/12/2017 31/12/2016 Variations
Receivables from customers 125.310 137.053 (11.743)
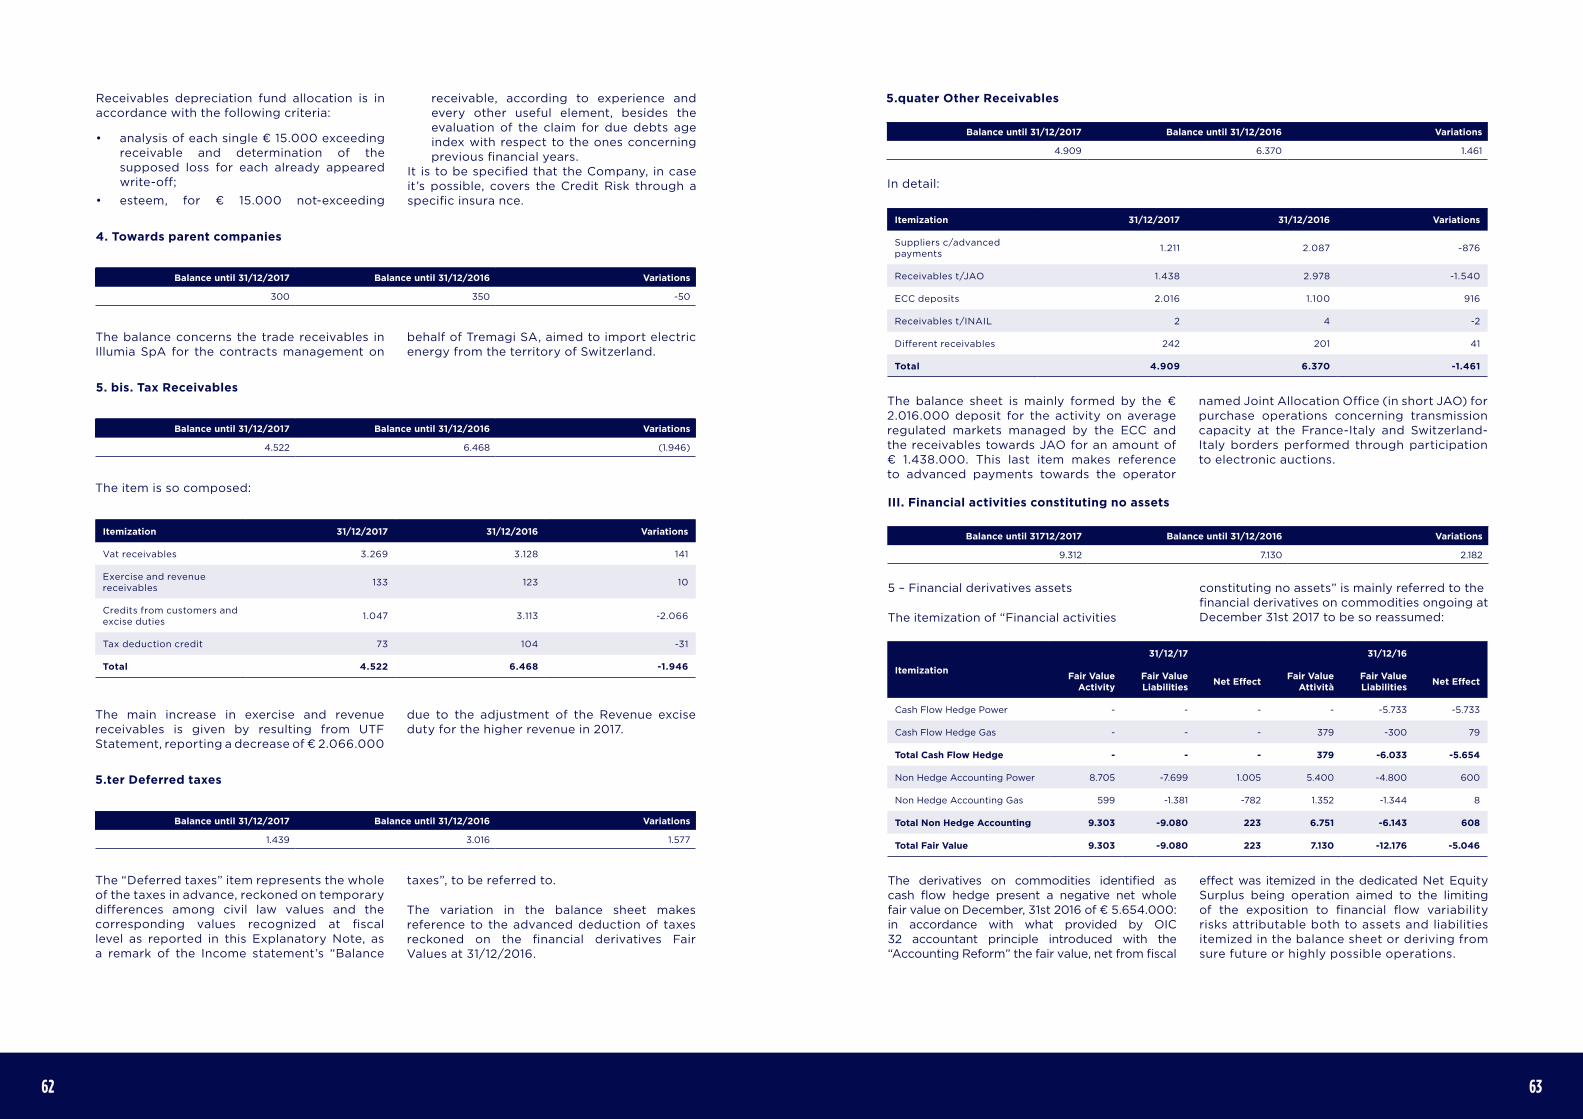
6362
The item is so composed:
The main increase in exercise and revenue receivables is given by resulting from UTF Statement, reporting a decrease of € 2.066.000
due to the adjustment of the Revenue excise duty for the higher revenue in 2017.
The “Deferred taxes” item represents the whole of the taxes in advance, reckoned on temporary differences among civil law values and the corresponding values recognized at fiscal level as reported in this Explanatory Note, as a remark of the Income statement’s “Balance
taxes”, to be referred to.
The variation in the balance sheet makes reference to the advanced deduction of taxes reckoned on the financial derivatives Fair Values at 31/12/2016.
The balance concerns the trade receivables in Illumia SpA for the contracts management on
behalf of Tremagi SA, aimed to import electric energy from the territory of Switzerland.
Itemization 31/12/2017 31/12/2016 Variations
Vat receivables 3.269 3.128 141
Exercise and revenue receivables 133 123 10
Credits from customers and excise duties 1.047 3.113 -2.066
Tax deduction credit 73 104 -31
Total 4.522 6.468 -1.946
4. Towards parent companies
5.ter Deferred taxes
5. bis. Tax Receivables
Balance until 31/12/2017 Balance until 31/12/2016 Variations
300 350 -50
Balance until 31/12/2017 Balance until 31/12/2016 Variations
1.439 3.016 1.577
Balance until 31/12/2017 Balance until 31/12/2016 Variations
4.522 6.468 (1.946)
Receivables depreciation fund allocation is in accordance with the following criteria:
• analysis of each single € 15.000 exceeding receivable and determination of the supposed loss for each already appeared write-off;
• esteem, for € 15.000 not-exceeding
receivable, according to experience and every other useful element, besides the evaluation of the claim for due debts age index with respect to the ones concerning previous financial years.
It is to be specified that the Company, in case it’s possible, covers the Credit Risk through a specific insura nce.
In detail:
The balance sheet is mainly formed by the € 2.016.000 deposit for the activity on average regulated markets managed by the ECC and the receivables towards JAO for an amount of € 1.438.000. This last item makes reference to advanced payments towards the operator
named Joint Allocation Office (in short JAO) for purchase operations concerning transmission capacity at the France-Italy and Switzerland-Italy borders performed through participation to electronic auctions.
Itemization 31/12/2017 31/12/2016 Variations
Suppliers c/advanced payments 1.211 2.087 -876
Receivables t/JAO 1.438 2.978 -1.540
ECC deposits 2.016 1.100 916
Receivables t/INAIL 2 4 -2
Different receivables 242 201 41
Total 4.909 6.370 -1.461
5.quater Other Receivables
Balance until 31/12/2017 Balance until 31/12/2016 Variations
4.909 6.370 1.461
III. Financial activities constituting no assets
5 – Financial derivatives assets
The itemization of “Financial activities
constituting no assets” is mainly referred to the financial derivatives on commodities ongoing at December 31st 2017 to be so reassumed:
Balance until 31712/2017 Balance until 31/12/2016 Variations
9.312 7.130 2.182
Itemization
31/12/17 31/12/16
Fair Value Activity
Fair Value Liabilities Net Effect Fair Value
AttivitàFair Value Liabilities Net Effect
Cash Flow Hedge Power - - - - -5.733 -5.733
Cash Flow Hedge Gas - - - 379 -300 79
Total Cash Flow Hedge - - - 379 -6.033 -5.654
Non Hedge Accounting Power 8.705 -7.699 1.005 5.400 -4.800 600
Non Hedge Accounting Gas 599 -1.381 -782 1.352 -1.344 8
Total Non Hedge Accounting 9.303 -9.080 223 6.751 -6.143 608
Total Fair Value 9.303 -9.080 223 7.130 -12.176 -5.046
The derivatives on commodities identified as cash flow hedge present a negative net whole fair value on December, 31st 2016 of € 5.654.000: in accordance with what provided by OIC 32 accountant principle introduced with the “Accounting Reform” the fair value, net from fiscal
effect was itemized in the dedicated Net Equity Surplus being operation aimed to the limiting of the exposition to financial flow variability risks attributable both to assets and liabilities itemized in the balance sheet or deriving from sure future or highly possible operations.

6564
IV. Liquid assets
Liquid assets until December 31st 2017 are quantified in a whole amount of € 37.400.000 in comparison with € 32.382.000 of the previous financial year, thus recording a net increase of € 5.018.000. They are figured as € 13.000 from cash and vault money and € 37.387.000 from bank deposits on the
corresponding active deposits on accounts at Banking Companies and Post Offices, which of them € 609.000 result as captive in deposit accounts for bank guaranties.
Below is reported the net balance sheet’s historical evolution:
For further details see Enclosure 1 to the “Financial Statement”.
As the scheme points out, on December, 31st 2017 in the Net Equity reserves the Fair value is reported of two derivatives agreed as hedging of loans subscribed by the Company.
The derivatives identified as non hedge accounting are referred to derivatives on commodities and have a whole net fair value positive at December, 31st 2017 equal to € 223.000 (positive equal to
608.000 in the previous balance sheet): the item concerns contracts agreed mainly as hedging but, according to the stringent criteria established by the OIC 32 accounting principle can’t be formally qualified as hedge accounting. The Fair Value variations in these contracts generated income and expenses classified in the item D of the Economic Account “Financial assets and liabilities value adjustments”.
Balance until 31712/2017 Balance until 31/12/2016 Variations
37.400 32.382 5.018
Reserves for hedging of predictable financial flows
Value on 1/1/2017
Tax effect 1/1/2017
Net value 1/1/2017
Derivatives fair value
31/12/2017
Tax effects on
derivatives 31/12/2017
Net value 31/12/2017
Derivatives on commodities -5.654 1.467 -4.187 5.654 -1.467 -
Derivative on interest rate -22 5 -17 -1 -12 -30
Total -5.676 1.473 -4.203 5.653 -1.480 -30
EQUITY BALANCE SHEET 31/12/17 31/12/16
Cash and liquid deposits 37.400 32.382
Current payables from banks -23.568 -25.813
Current payables from short-terms investors -11.332 -9.687
Current payables from short-terms partners - -
Current short-terms net Financial Payables 2.500 -3.118
Non current payables from banking companies -29.723 -31.145
Non current payables from long-terms investors - -
Non current payables from long-terms partners - -
Equity Balance Sheet -27.223 -34.263
The movement of the Reserve can be booked as follows: D – Active Prepaid expenses
Balance until December 31st 2017 amounts to € 7.676.000 and, in comparison with the € 7.608.000 of the balance until December, 31st 2016, reports a net increase of € 68.000.
These values were determined according to financial year’s actual economic competence method and are booked as follows:
Accrued revenues are assessed in € 6.893.000 and refer instead to reversals of economic
competence shares-to-be. In detail:
The increase of the accrued revenues on commissions is determined by the reckoning method that for the ongoing financial year is determined on 36 months instead of on 12 months with the aim of correctly representing the final customers’ average life. However, in case the final customer withdraws from the contract before that term, the concerning quote that is part of the accrued revenues on commissions is completely recognized in profits
or loss. The accrued revenues on guarantees concern the bank commissions in line with the reported period.
“Accrued revenues” are mainly referred for the amount of € 751.963 to the share that is part of the competent revenue deriving from “ISDA” contracts collected in the following period and subscribed with Banking Companies. No accrued revenues are superior to 12 months.
Balance until 31712/2017 Balance until 31/12/2016 Variations
7.676 7.608 68
Itemization 31/12/2017 31/12/2016 Variations
Assets 6.893 5.598 1.295
Accrued revenues 782 2.010 -1.228
Total 7.676 7.608 68
Itemization 31/12/2017 31/12/2016 Variations
Accrued revenues on commission expenses 5.915 4.667 1.248
Accrued revenues on invoices of suppliers for the future financial year
598 233 365
Accrued revenues for bank fees and charges 164 571 -407
Accrued revenues for commission for financing - - -
Other accrued revenues 196 127 69
Total accrued revenues 6.893 5.598 1.295

6766
LIABILITIES
A) Net equity
The area concerning the Group and Third Parties’ Net Equity passes with a whole amount of € 41.506.000 reporting in comparison to the € 36.539 balance of the previous financial year,
an increase of € 5.736.000 mainly due to the hedge accounting reserve issuing determined according the new accounting principles and as appears in the following rear-view scheme:
Capital stock is equal to € 2.000.000, entirely paid. The Legal Reserve is to be meant as non-shareable. Differences deriving from rounding off operations equal to € 2.000 was respectively booked under “AVII – Altre Riserve” [Other Reserves] item and precisely in “Riserva da arrotondamento” [Rounding-off reserve].
According to the provisions of art. 2426 of the Italian Civil Code it is to be specified that on December, 31st 2017 the start-up costs are equal to € 1.094.000, having as a consequence that the “Different reserves” are meant to be unallocated until the cover of the amount in matter and until the mentioned intangible assets depreciation will be over.
Balance until 31/12/2017 Balance until 31/12/2016 Variations
41.506 36.539 5.736
€/000 CURRENT ASSETS
LEGAL RESERVE
OTHER RESERVE
HEDGE ACCOUNTING
RESERVES
INCOME FOR THE
YEAR
REVENUE/LOSS OF
FIN, YEAR
NET EQUITY GROUP
MINORITY INTEREST TOTAL
NET EQUITY UNTIL 31/12/2015 2.000 400 32.235 551 429 3.247 38.862 652 39.514
Destination of the results on 31/12/2015 3.131 114 -3.247 -2 - -2
Translation differences -50 -50 -50
Other variations 3 3 32 35
Revenues/loss of the 2016 financial year 1.755 1.755 40 1.795
Cash Flow Hedge Reserve -4.754 -4.754 -4.754
NET EQUITY UNTIL 31/12/2016 2.000 400 35.319 -4.203 544 1.755 35.815 724 36.539
Destination of the results on 31/12/2016 2.721 -966 -1.755 -0 - -0
Translation differences -713 -713 -713
Other variations 3 3 1 4
Revenues/loss of the 2017 financial year 1.366 1.366 139 1.505
Cash Flow Hedge Reserve 4.173 4.173 4.173
NET EQUITY UNTIL 31/12/2017 2.000 400 37.328 -30 -422 1.366 40.642 863 41.506
For the completeness of the balance sheet information the following Net Assets connection table and financial year’s result of the parent
companies company and consolidated Net asset and consolidated financial year’s results is attached:
€/000EQUITY DIFFERENT
FINANCIALS RESULTS EQUITY
12/2016 MOVIM. 2016 12/2016
Tremagi Srl 31.530 - 1.783 33.313
Elision of the Shareholding in subsidiaries
26.931 - 1.583 28.514
Intercompany Dividends exclusion -20.114 - -2.000 -22.114
Participations in Associates - - - -
Other items of Net Income -2.529 3.460 - 931
Rounding-offs -3 2 - -1
Net Equity of the Group 35.815 3.462 1.366 40.642
Net Equity of Others 724 0 139 863
Tremagi Srl Group 36.539 3.462 1.505 41.506
B) Provisions for Risks and Costs
On December, 31st 2017 the Provisions for Risks and Costs item amounts to € 12.126.000 in comparison with € 17.439.000 of the previous financial year, thus reporting a decrease amount-ing to € 5.313.000, mainly determined by the allocation for the “passive financial
derivatives” as requested by the Italian new accounting principles.
Thus at the balance sheet closed on December, 31st 2017 the Funds for Risks and Costs booking is so composed:
Balance until 31/12/2017 Balance until 31/12/2016 Variations
12.126 17.439 -5.313
Detail of the provisions for risks and charges
31/12/2017 31/12/2016 Variations
B1) For retirement pensions 2.014 1.781 233
B2) For taxes, also deferred 318 312 6
B3) Passive financial derivatives 9.154 12.198 -3.044
B4) Other items 640 3.148 -2.508
Total 12.126 17.439 -5.313

6968
As follows the operations of each single Fund for Risks and Costs:
Itemization 31/12/2017 Increases Decreases 31/12/2017
B1) Customers benefit fund 774 258 -25 1.007
B1) TFM Provisions 1.007 - - 1.007
B1) Retirement pensions fund 1.781 258 -25 2.014
B2) Deferred taxes fund 312 6 - 318
B3) Passive financial derivatives 12.198 3.676 -6.720 9.154
B4) Other items 3.148 698 -3.206 640
Total 17.439 4.638 -9.951 12.126
Itemization 31/12/2017 Use Licenses 31/12/2017
B1) Customers benefit fund 3.148 -3.206 698 640
Total 3.148 -3.206 698 640
B1) Retirement pensions’ fund (Customer benefit fund)
Retirement pensions’ fund represents the esteem of the costs to bear in order to back the in progress and advance business’s relations’ possible interruption.
At the moment of the balance sheet’s drawing-up, on December 31st 2017, we have carried out a survey on the position of each single agent, on the grounds of the agreements provided by the National collective agreement and, as a consequence, the Fund was adjusted through an provisioning of € 258.000.
B1) TFM provision
The TFM [trattamento di fine mandato – employment leaving provision] is an allowance that the business commits itself to pay to directors at
the business’s expiry date.
B2) Deferred income taxes fund
The Deferred income taxes item represents the whole of the prepaid taxes reckoned on the temporary differences among civil values and the corresponding tax-level recognized taxes reported in the item “Tax periods” in the Income Statement.
B3) Passive financial derivatives
The “Passive financial derivatives” item was commented in the paragraph concerning “Financial activities constituting no assets” booking of the Balance Sheet.
B3) Other items
The fund undergone a loss for € 2.508.202 so composed:
The variations in the financial year concern mainly:
• the use of the financial year is mainly related to the enforcement of the decisions of the ARERA [Autorità di Regolazione per l’Energia Reti e Ambiente – Energy Networks and Environment Regulation Agency] concerning the activity qualified in the electric energy sector as “voluntary imbalances”. It consists in the trade of electric energy, having Terna as a counterpart, to the aim of inducing the network balancing. The activity in matter was performed by Illumia, as well as by other electric energy sector operators. During 2012 the Energy
Agency issued a list of measures aimed to modify the discipline regulating the “imbalances”. Illumia believed illegitimate these measures and appealed against them. The TAR [Administrative Regional Court] of the Lombardy, through decision nr.1648/2014 dated June, 24th 2014, granted the application of Illumia and in a second time, the Consiglio di Stato [State Council] through decision nr. 1532/2015 dated March, 20th 2015, reaffirmed the decision issued by the TAR of Lombardy. The effect of these two court decisions compelled Terna, in its quality of counterpart of Illumia, to revise the reckoning of the charges due to our Company, as well as the ones due to
the other operators that have started the same business. This led in favor of Illumia a significant resettlement concerning the receivables matured during the period the cancelled deliberations were enforced. The Energy Agency has nevertheless decided to start a second part of measures aimed to re-introduce, with retroactive effect, the cancelled discipline, also with the aim to recover a part of what resettled by Terna in favor of Illumia and other operators.
Illumia has therefore moved in two directions. The first, in occasion of the approval of the balance sheet concerning 2016 financial year, in observance to the principle of diligence and prudence, was implemented through the constitution of a hedging fund for risks and charges deriving from a possible request to return what received by Terna in fulfillment of the resettlement. Secondly, Illumia, in the conviction of the unlawfulness of the decisions taken by the Agency, appealed in front of the Tar of Lombardy the decisions aimed to recover part of the adjusted amounts resettled by
Terna (decision 333/2016/R/EEL dated June, 24th 2016) and, at the same time, enforced a compliance proceedings by citing that the TAR Sentence nr. 1648/2014 passed and favorable to it, prevented the Agency to deliberate with retroactive effect about a definitively acquired right. Actually on December 2017, in execution of the decision nr. 333/2016/R/EEL, Terna provided to request permanently to Illumia a part of what, in past times, had received as resettlement. Illumia will pay the last of the three tranches, related to the obligation in matter, on April 2018 according to the modalities stated by the Energy Agency itself.
• Also for effect of this request, lower than the assumed share part and provisioned in the fund, a windfall profit was determined for an amount of about 611.000 €.
• An increase equal to € 175.000 concerning the conclusion of a legal dispute deriving from an ongoing lease agreement for withdrawal in advance anticipated by an agency contract.
B) Severance indemnity fund
Balance until 31/12/2017 Balance until 31/12/2016 Variations
1.352 1.166 186
On December, 31st 2017 the T.F.R. Fund [Trattamento di Fine Rapporto – Employee leaving indemnity] results in a total amount of € 1.352.000 in comparison with the previous
financial year’s € 1.166.000. During the financial year the Severance indemnity fund results to have undergone the following variations:
Employment leaving indemnity [Provision] represents the effective debt, until 12/31/2017, of the company towards the employees in activity at that date, net of the allowed payments in
advance and of what paid to pension forms of complementary of social security as provided by nr. 252/2005 Legislative Decree and nr. 296/2006 Financial Act.
itemization Directors Employees Total amount
Employee leaving indemnity 31/12/2016 - 1.166 1.166
Exceptional operation - 33 33
Migration of employees (only intercompany) - 0 0
Revaluation - 22 22
Substitute tax - -4 -4
Uses - -146 -146
2017 payments in advance - -34 -34
2017 accrued Leaving indemnity 29 337 366
Leaving indemnity funds -29 -20 -49
Rounding offs - - -
Employment leaving indemnity [Provision] 31/12/2017 - 1.352 1.352

7170
C) Payables
Balance until 31/12/2017 Balance until 31/12/2016 Variations
195.648 202.934 -7.286
In comparison to the previous financial year’s values, the “payables” concerning item reports a net decrease of € 7.000.
Payables are assessed at their nominal value and their expiry is so booked:
Payables allocation until December, 31st 2014 according to the creditors’ geographic area are
reported in the following rear-view scheme:
In 2016:
Itemization Winthin 12 months Over 12 months Over 5 years Total amount
Banking companies 23.568 28.379 1.344 53.291
Other financial payables 11.332 11.332
Advances 1.824 1.824
Payables to suppliers 117.464 117.464
Payables to subsidiary comp. 756 756
Taxes liabilities 6.117 6.117
Payables to welfare institutions 570 570
Other payables 4.293 4.293
Total 165.924 28.379 1.344 195.648
Itemization Winthin 12 months Over 12 months Over 5 years Total amount
Banking companies 25.813 27.724 3.421 56.958
Other financial payables 9.687 - - 9.687
Advances 1.782 - - 1.782
Payables to suppliers 126.457 - - 126.457
Payables to subsidiary comp. 407 - - 407
Taxes liabilities 4.622 - - 4.622
Payables to welfare institutions 535 - - 535
Other payables 2.486 - - 2.486
Total 171.790 27.724 3.421 202.934
Itemization Italy Abroad Total amount
Banking companies 53.291 - 53.291
Other financial payables 11.332 - 11.332
Advances 1.824 - 1.824
Payables to suppliers 98.380 19.084 117.464
Payables to subsidiary companies - 756 756
Tax liabilities 6.117 - 6.117
Payables to welfare institutions 570 - 570
Other payables 4.215 78 4.293
Total 175.729 19.918 195.649
Itemization Italy Abroad Total amount
Banking companies 56.275 683 56.958
Other financial payables 9.687 - 9.687
Advances 1.782 - 1.782
Payables to suppliers 116.593 9.864 126.457
Payables to subsidiary companies - 407 407
Tax liabilities 4.402 220 4.622
Payables to welfare institutions 521 14 535
Other payables 2.472 14 2.486
Total 191.731 11.202 202.934
Loans 31/12/2017 31/12/2016 Variations
Within 12 months 23.568 25.813 -2.245
Over 12 months 29.723 31.145 -1.423
Total amount 53.292 56.958 -3.666
Loans 31/12/2017 31/12/2016 Variations
RID advance in portfolio, invoices and customer accounts 2.769 3.095 -326
Advances on bills of exchange 3 3 -
Short term funding 20.797 22.725 -1.928
Long and middle term funding 29.723 31.145 -1.423
Total 53.292 56.968 -3.676
In 2016:
4) Loans
This balance is so composed:
For the short terms, 2017 is basically composed in the following way:
Balance until 31/12/2017 Balance until 31/12/2016 Variations
53.292 56.958 -3.666

7372
In the scheme details are reported above the funding in advantage of the Group, explicitly
declaring the short and long term rates:
This value is referred to a reverse factor financing targeted to defer for 50 days the
payment to the E-Distribuzione supplier.
Instalments on commercial customers. Debts will be completely paid off in the first 2018 invoicing.
5) Payables towards other financiers
6) Advances
Balance until 31/12/2017 Balance until 31/12/2016 Variations
11.332 9.687 1.645
Balance until 31/12/2017 Balance until 31/12/2016 Variations
1.824 1.782 42
Company Banking company
Funding Amount
Outstanding Debt on 31/12/17
Within 12 month
Over 12 months and
within 5 yearsOver 5 years Maturity
Illumia Spa Carisbo 3.000 500 500 - - 10/04/18
Illumia Spa Emilbanca 2.000 684 684 - - 04/12/18
Illumia Spa Banca Desio 1.500 758 503 254 - 10/06/19
Illumia Spa Mediocredito 13.200 11.169 2.031 8.123 1.015 31/03/23
Illumia Spa BCC 1.000 253 253 - - 21/06/18
Illumia Spa CR Cento 3.000 1.771 1.005 766 - 01/08/19
Illumia Spa Banca di Bologna 4.000 2.152 1.348 804 - 06/07/19
Illumia Spa B.delMezzogiorno 10.000 7.420 2.167 5.253 - 30/06/21
Illumia Spa UBI Banca 1.500 252 252 - - 26/01/18
Illumia Spa Emilbanca 2.000 1.513 496 1.017 - 24/10/20
Illumia Spa Cariparma 5.000 3.355 1.667 1.689 - 28/10/19
Illumia Spa Banco BPM 4.000 2.514 2.007 507 - 31/03/19
Illumia Spa BPMilano 2.000 1.373 1.267 106 - 31/01/19
Illumia Spa MPS 3.500 3.500 1.400 2.100 - 30/06/20
Illumia Spa CR Cento 2.000 1.837 659 1.178 - 01/08/20
Illumia Spa BP Vicenza 2.000 1.833 667 1.167 - 30/09/20
Illumia Spa Carige 3.000 3.000 1.487 1.513 - 31/12/19
Illumia Spa B. Interprovinciale 3.500 3.214 1.154 2.061 - 30/09/20
Illumia Spa UBI Banca 1.000 1.000 497 503 - 25/10/19
Tremagi Srl Caribo 695 536 37 170 329 01/12/28
Tremagi Srl Caricento 2.375 341 225 116 - 20/02/19
Tremagi Srl BNL 1.500 571 214 357 - 02/08/20
Tremagi Srl Caricento 1.000 939 245 695 - 01/08/21
Illumia Trend Srl BCC 250 34 34 - - 05/06/18
Total 73.020 50.520 20.797 28.379 1.344
Other payables towards suppliers concern costs related to commissioning (commissions, bonus, loyalties) and ordinary costs for technical, executive and administrative consulting.
The item in matter, in comparison to the € 126.457.000 reported in the previous year’s Balance sheet, reports a decrease of € 8.993.
The item is referred to the debt of the Group’s company toward the Tremagi SA parent
company for the 2017 CNM.
The balance, in comparison with previous financial year, is so composed:
For fiscal payables see “Taxes” item.
Among the main payables towards suppliers are:• payables for energy and gas purchase;
• payables for energy and gas transportation;• payables for energy distribution
7) Payables to suppliers
10 ) Payables to associate companies
12) Tax liabilities
Balance until 31/12/2017 Balance until 31/12/2016 Variations
117.464 126.457 -8.993
Balance until 31/12/2017 Balance until 31/12/2016 Variations
756 407 349
Balance until 31/12/2017 Balance until 31/12/2016 Variations
6.117 4.622 1.495
Itemization 31/12/2017 31/12/2016 Variations
Energy excise debts 5.405 3.202 2.200
VAT payables 99 40 59
IRPEF unpaid tax collector to be paid 371 372 22
IRAP payables 48 264 -216
RAI National Broadcasting cp payables 189 288 -99
Other payables 8 351 -343
Total 6.117 4.622 1.495

7574
In the booking, the balance is so composed:
The € 4.293.000 item in matter, in comparison to € 2.486.000 balance booked in the Balance sheet concerning previous financial year,
reports an increase of 1.807.000. This year’s balance is constituted by:
Every above listed welfare contributions have regularly been paid in the first months of 2018.
13) Payables to welfare institutions
14) Other payables
Balance until 31/12/2017 Balance until 31/12/2016 Variations
570 535 35
Balance until 31/12/2017 Balance until 31/12/2016 Variations
4.293 2.486 1.807
Itemization 31/12/2017 31/12/2016 Variations
Payables to INPS 234 224 10
Payables to INAIL 3 2 1
Payables to ENASARCO 84 105 -21
Payables to Supplementary Social Protection 42 41 1
Payables to FIRR 113 87 26
Social security contributions on advance 94 75 19
Total 570 535 35
Itemization 31/12/2017 31/12/2016 Variations
Payables to employees - cooperators 1.849 575 1.274
Security deposits from customers 2.149 1.644 505
Credit card 42 46 -4
EULER HERMES compensation 165 184 -19
Other payables 88 37 51
Total 4.293 2.486 1.807
E) Prepaid expenses
Balance until 31/12/2017 Balance until 31/12/2016 Variations
1.657 2.189 (532)
Concerning entries of the financial year included into an account according to the
economic commission.In detail:
Deferred income concern mainly the allowances for 2018 billed in 2017 by the Wekiwi S.r.l. company.
The accrued expenses is mainly given by the responsibilities on spread liabilities deriving from derived financial instruments subscribed with Banking companies.
To be complete the information required by art. 2427 and 2435-bis of the Italian Civil Code shall contain the following:
• during the financial year no financial charges
have been related to values itemized in the statement of assets;
• no income from participating interests existbut the dividends as provided by art. 2425nr.15 of the Italian Civil Code;
• during this financial year the Group did notissue participation certificates or loan capi-tal convertible into certificates or securities orsimilar values;
• during the financial year Tremagi Group didnot accomplish trade operations with grant-back obligation.
The amount in matter, € 947.390.000, in comparison to the previous financial year’s balance € 785.327 reports a € 162.063.000 increase.
The whole trade volume on market increased in comparison to 2016:
• Electric Energy: 3.667 GWh to 4.220 GWh(+15%);
• Gas: 68 Mln Smc to 86 Mln Smc (+27%);
Differently from what reported for the previous year the revenues of the Group (+17% in comparison to 2016 financial year) have been supported also by external events to the Group’s performance, like the national increase in the demand and the increase in the price of electric energy.
Itemization 31/12/2017 31/12/2016 Variations
Deferred income 407 75 332
Accrued expenses 1.250 2.114 -864
Total 1.657 2.189 -532
Itemization 31/12/2017 31/12/2016 Variations
Revenues from sales and services 944.317 783.855 160.462
Other revenues 3.073 1.472 1.601
Total 947.390 785.327 162.063
INCOME STATEMENT
A) Production value
The booking is so composed:
Balance until 31/12/2017 Balance until 31/12/2016 Variations
947.390 785.327 162.063

7776
In 2016:
The Company confirmed several gross market operations, like purchase-sale operations with wholesale market agents in the sector of electric energy, thanks to the success record track that the Company obtained during the
previous financial years and that have boosted the leading role of Illumia SpA and Illumia Trend on the markets in matter.
Below a description of business and diffusion according to geographic areas.
The “Other incomes and revenues” item is mainly composed by:• € 793.000 for windfall profits deriving from
appropriations of invoices to be collectedby electric energy and gas suppliers anddistributors maturing at 31/12/2016 andhigher than what actually due;
• € 247.000 for compensations fromdistributors;
• € 1.429.000 concerning revision of invoicesagainst third parties;
• € 611.000 for the issue of the fund for risks andcharges due to excess of provisioning. Further details are reported in the commentaries atthe “Funds for risks and charges” item.
Itemization Italy Abroad Total amount
Revenues from electric energy 707.699 76.127 783.826
Revenues from gas 80.886 78.239 159.125
Revenues from LED 1.366 - 1.366
Total 789.951 154.366 944.317
Itemization Italy Abroad Total amount
Revenues from electric energy 664.396 58.741 723.137
Revenues from gas 52.793 6.558 59.351
Revenues from LED 1.367 - 1.367
Total 718.556 65.299 783.855
Itemization 31/12/2017 31/12/2016 Variations
Costs of sales and consumption 722.375 583.831 138.544
Service costs 184.730 164.217 20.513
Availability of Minority’s good 437 2.589 -2.152
Employment costs 8.206 6.878 1.328
Amortization of intangible assets 2.197 1.750 447
Amortization of tangible fixed assets 1.269 1.237 32
Payables depreciation 6.306 3.350 2.956
Final inventory of goods -891 177 -1.068
Provisions for risks 698 3.148 -2.450
Other operating costs 17.149 14.004 3.145
Total 942.476 781.181 161.295
Itemization 31/12/2017 31/12/2016 Variations
Electric energy purchase 646.785 549.963 96.822
Gas purchase 73.767 32.646 41.121
LED purchase 1.397 811 586
Other 426 411 15
Total 722.375 583.831 138.544
B) Operating costs
The booking is so composed:
Henceforth, down below each item is reported.
Purchase cost for electric energy, gas and LED and concerning additional costs from the Illumia SpA and Illumia Swiss SA controlled companies, because other companies within this area
exclusively book purchases of writing materials and/or fuels for non-material amounts.Raw materials, subsidiary and consumption costs can be, principally, so summarized:
In short, costs of sales and consumption can be, principally, so summarized:
• Electric Energy purchase from ordinarysuppliers /wholesalers for € 535.343.000;
• Electric Energy purchase from GME StockExchange for € 86.772.000;
• Other margin of Energy for third parties, forEnergy purchase/sell operations and for €24.792.000;
• Costs for Gas purchase for 72.767.000;
• Purchase of material intended to the re-sale, in particular LED for € 1.397.000;
• Consumption material costs for € 426.000.
Balance until 31/12/2017 Balance until 31/12/2016 Variations
942.476 781.181 161.295
6. Cost of sales and consumption
Balance until 31/12/2017 Balance until 31/12/2016 Variations
722.375 583.831 138.544

7978
Mainly costs for transport and delivery of the Energy produced by Illumia SpA company.
They can be briefly so summarized:
For relations with associates within this areas legal expenses and management consulting
ser-vices provided by SEA SpA for € 368.000 are included.
7. Service Costs
Balance until 31/12/2017 Balance until 31/12/2016 Variations
184.730 164.217 20.513
Itemization 31/12/2017 31/12/2016 Variations
Transport and accessory costs 135.327 120.310 15.017
Costs of delivery 23.640 17.430 6.210
Technical, administrative and fiscal consulting, receivables recovery, portfolio, IT and notary costs
5.466 8.204 -2.738
Costs for the agents 9.448 7.296 2.152
Costs for banking operations 2.788 2.985 -197
Travelling costs for employees, cooperators, statutory auditors
479 465 14
Mail, shipment and telephone costs 1.309 1.285 24
Remuneration for statutory auditors 173 172 1
Remuneration for cooperators (and contributions) and temporary employees
61 39 22
Remuneration for governing directors 1.770 1.857 -87
TFM appropriated surplus - 210 -210
Booking allowance 379 409 -30
Advertisement and sponsoring 684 1.382 -698
Insurance 791 552 239
Canteen 117 111 6
Maintenance 775 384 391
Congresses and professional training 115 69 46
Charges for single buyer 22 - 22
IT costs 110 - 110
Other general expenses 1.275 1.057 218
Total 184.730 164.217 20.513
Costs for availability of minority goods are so booked:
The booking is so composed:
The booking is so composed:
Employment costs will increased as a consequence of the provision for competence of
the bonus that will be disbursed in 2018.
8. Costs for availability of minority goods
9. Employment Costs
10. Amortization and depreciation expenses
Balance until 31/12/2017 Balance until 31/12/2016 Variations
437 2.589 -2.152
Balance until 31/12/2017 Balance until 31/12/2016 Variations
8.206 6.878 1.328
Balance until 31/12/2017 Balance until 31/12/2016 Variations
9.772 6.337 3.435
Itemization 31/12/2017 31/12/2016 Variations
Agency branches rents - 1.932 -1.932
Offices rents 102 293 -191
Ordinary maintenance on third parties’ goods 25 44 -19
Car hire and charter 310 320 -10
Total 437 2.589 -2.152
Itemization 31/12/2017 31/12/2016 Variations
Wages and salaries 6.463 5.195 1.268
Social security contributions 1.368 1.324 44
Employee leaving indemnity 374 358 16
Other employment costs 1 1 -
Total 8.206 6.878 1.328
Itemization 31/12/2017 31/12/2016 Variations
Amortization of intangible assets 2.197 1.750 447
Amortization of fixed assets 1.269 1.237 32
Loans and cash depreciation 6.306 3.350 2.956
Total 9.772 6.337 3.435

8180
Below is reported the booking concerning intangible assets’ amortizations of:
Below the booking is reported:
The financial year’s allowance is a consequence of the prudential in progress and advance
receivables’ risk assessment for the opened positions on 12/31/2017.
10. a) Amortizations of intangible assets
10. b) Tangible Assets Amortizations
10. d) Depreciation of receivables and available cash included in the current assets
11. Variations of raw materials and stocks inventory
Balance until 31/12/2017 Balance until 31/12/2016 Variations
-891 177 -1.068
Initial existences Final remaining Economic Delta until 31/12/2017
1.307 2.198 -891
Itemization Amortization rate
1) Costs for plants and enhancements 954
4) Costs for plants and enhancements 275
5) Start-up 6
7) Other intangible assets 963
Other intangible assets 2.197
Itemization Amortization rate
1) Costs for plants and enhancements 417
4) Costs for plants and enhancements 67
5) Start-up 785
7) Other intangible assets 1.269
During financial year no revaluation and/or depreciation of the intangible assets were reported.For what concerns amortization’s percentages
used in the reckoning and evaluation criteria adopted in the determination of amortizations see what already booked in the “Intangible Assets” item.
For what concerns the determination modalities for amortization’s rates see what already
booked in the “Evaluation Criteria” paragraph of the Explanatory Note.
The variations of inventory are so booked:
In detail, final inventories are • € 1.094 for gas stocking until 12/31/2017;
• € 1.104 for the purchase of materialsassigned to the re-sales.
Itemization 31/12/2017 31/12/2016 Variations
Depreciation of the available cash 6.306 3.350 2.955
Total 6.306 3.350 2.955
12. Allowance for advance
14. Other operating costs
16. Other financial income
Balance until 31/12/2017 Balance until 31/12/2016 Variations
698 3.148 -2.450
Balance until 31/12/2017 Balance until 31/12/2016 Variations
17.149 14.004 3.145
For every further detail see Financial Statement Liabilities at the “Provisions for Risks and
Costs” item.
In detail, this cost can be so booked:
Itemization 31/12/2017 31/12/2016 Variations
Associative contributions 383 363 20
Windfall loss 998 688 310
Tax and charges 311 300 11
Excises on gas 15.266 12.232 3.034
Charity 64 107 -43
Books and magazines 3 6 -3
Fines and penalties 1 17 -16
Compliments 8 21 -13
Losses for divesture 20 200 -180
Non deductible expense 47 51 -4
Other items 48 20 28
Total 17.149 14.004 3.144
Itemization 31/12/2017 31/12/2016 Variations
A5 from other companies 2 - 2
D5 other companies 181 246 -65
Total 183 246 -63
C) Interest expense
Henceforth, the booking of this balance is reported below:
The decrease of € 63.000 is mainly due to the fact that during the previous financial year
higher default interests were invoiced to the Illumia SpA final customers.
Are so booked:
Balance until 31/12/2017 Balance until 31/12/2016 Variations
-1.437 -1.033 -404

8382
17. Interests and other financial charges
17-bis. Net profit on exchanges
The item concerns loss on exchanges mainly accrued by the America Corp. and Illumia Swiss
SA companies.The rear-view scheme is so booked:
Itemization 31/12/2017 31/12/2016 Variations
Exchange-rate loss 78 206 -128
UTF [Revenues Department Office] Interest expenses 2 - 2
Interests expenses on security deposits - 2 -2
Interests expenses on financing 1.012 787 225
Other interest expenses 175 455 -280
Other financial charges 203 5 198
Total 1.470 1.455 15
Itemization 31/12/2017 31/12/2016 Variations
Realized exchange losses -110 -1 -109
Exchange gains 10 15 -5
Realized changes ratio -100 14 -114
Evaluation exchange losses -49 -1 -48
Evaluation exchange gains - 163 -163
Evaluation exchange ratio -49 162 -211
Total -149 176 -325
Itemization 31/12/2017 31/12/2016 Variations
Interests and other financial charges 1.470 1.455 15
Total inventory and other interest expenses 1.470 1.455 15
Itemization 31/12/2017 31/12/2016 Variations
Profit and loss on exchanges -149 176 -325
Total -149 176 -325
In detail: Itemization 31/12/2017 31/12/2016 Variations
18 Revalorization of different financials 3.497 10.237 -6.740
19 Devaluation of different financials 3.882 10.407 -6.525
Total amount -385 -170 -215
Itemization 31/12/2017 31/12/2016 Variations
Current income taxes 1.393 2.171 -778
Deferred income taxes 194 -1.045 1.239
Payable income taxes - 22 -22
Tax base 1.587 1.148 439
D) Correction of value of financial activities
In detail:
The balance of this item represents the Fair Value variation for the contracts agreed with the aim of significant hedging, but that in
observance of the stringent criteria established by the OIC 32 accounting principle can’t be formally qualified as hedge accounting.
Balance until 31/12/2017 Balance until 31/12/2016 Variations
-385 -170 -215
Taxes on income are so booked:
Below is reported the itemization of the balance in matter:
TAXES
Taxes on financial year’s revenues
Balance until 31/12/2017 Balance until 31/12/2016 Variations
1.587 1.148 439
Starting from the financial year closed on December, 31st 2017, the Company renewed their fiscal consolidated, through option according to provisions of art. 117 and following of the 917/86 D.P.R. [Decree of the President of the RepublicTN]. The option is for group taxation and is validfor 2017-2019 three-years term and the companiesadopting this option are Tremagi SA in its role ofconsolidating fiscal entity and Tremagi srl, IllumiaSpA, Illumia Trend and Wekiwi Srl.
Economic relations, responsibilities and reciprocal
obligations are stated in the “Contratto di consolidamento fiscale nazionale” [National tax consolidation contract] establishing that the subsidiaries company must recognize to the parent companies company the due amount for payments in advance and settlement of the IRES, in the terms provided by rules and regulations in force at the moment the parent company provides to the payments in matter. Other companies pertaining to the civil consolidated annuities and not to the fiscal consolidated annuities prearranged the direct taxes reckoning in autonomy.
Current income taxes

8584
The booking of deferred taxes occurred in observance of the principle of prudence and in the company’s activity continuation point of view, considering the real possibility of
production of future taxable income.
The allocation of deferred taxes was performed on the ground of fiscal rates in force.
For what concerns the deferred taxes generated by the booking of derivatives, the item is reported at point “III – Financial
activities constituting no assets.” For each detail reference is made at the “Funds for risks and Charges” chapter.
Deferred taxes
Itemization Tremagi Srl
Illumia Spa
Wekiwi Srl
Illumia Trend Srl
Illumia America
Corp.
Illumia Swiss SA
Total
Costs from civil annuities 11 435 - 231 - - 677
IRES (Taxes on income) - - 2 - 5 109 116
IRAP (Taxes per Region) 48 435 - 117 - - 600
Total 59 870 2 348 5 109 1.393
DeductibleTemporary differences
31/12/16 Increa-ses
Decrea-ses 31/12/17 24,00%
Ires4,82%
Irap
Final Appro-
pr.
Initial Appro-
pr.
C.Im-pact
Risk fund pro-vision
3.148 640 3.207 581 140 28 168 907 -1
Taxed Receivables depreciation fund
2.575 2.871 611 5 0 - 0 618 -1
7/12 Building depreciation
33 33 - 0 0 - 0 8 -0
Default interests 40 53 40 0 0 - 0 10 -0
Total 5.797 3.597 3.858 586 140 28 168 1.543 -1
Passive Defer-red taxes 31/12/16 Increases Decreases 31/12/17 24,00%
Ires4,82%
IrapFinal Ap-
propr. Initial
Appropr. C.Impact
Still uncollected default interests
465 81 82 0 0 - 0 112 0
Total 465 81 82 0 0 - 0 112 0
OPERATING DEFERRED TAXES
PASSIVE DEFERRED TAXES
In detail the booking is the following one:
In observance and in force of art.2427 comma 9 of the Italian Civil Code the further obligations,
provided securities and potential liabilities appear as non booked in the balance sheet.
Further information
Obligations, provided securities and potential liabilities non booked in the balance sheet
Banking company 31/12/2016 INCREASES DECREASES 31/12/2017
BANCA DI IMOLA/CARIRA 10 - -10 -
BANCA DI BOLOGNA - 525 -29 496
BANCO DESIO 2.000 - - 2.000
BARCLAYS 300 - -200 100
BNL 8.713 147 -5.600 3.260
BPER 2.931 - -131 2.800
BPM 479 44 -20 503
CARICENTO 631 561 -12 1.180
CARIGE 7.505 - -1.005 6.500
CARISBO - 4.199 - 4.199
CARIFE 152 - -152 -
CARIM 427 160 -118 469,49
CREDIT AGRICOLE - 200 - 200,00
ICCREA 2.000 - - 2.000
UBI 1.500 - - 1.500
UNICREDIT 14.020 1.201 -11.844 3.377
Total 40.667 7.037 -19.120 28.584
Banking company 31/12/2016 INCREASES DECREASES 31/12/2017
UNICREDIT 2.410 877 -300 2.987
BPM 250 1.500 - 1.750
BANCA DI IMOLA/CARIRA 200 - - 200
MPS 430 230 -230 430
CARICENTO 265 - - 265
EMILBANCA 500 - - 500
BANCO BPM - 310 - 310
Total 4.055 2.917 -530 6.442
Banking Institute 31/12/2016 INCREASES DECREASES 31/12/2017
BANCA STATO 3.375 375 - 3.750
Total 3.375 375 - 3.750
ILLUMIA SPA:
ILLUMIA TREND SRL:
ILLUMIA SWISS SA:
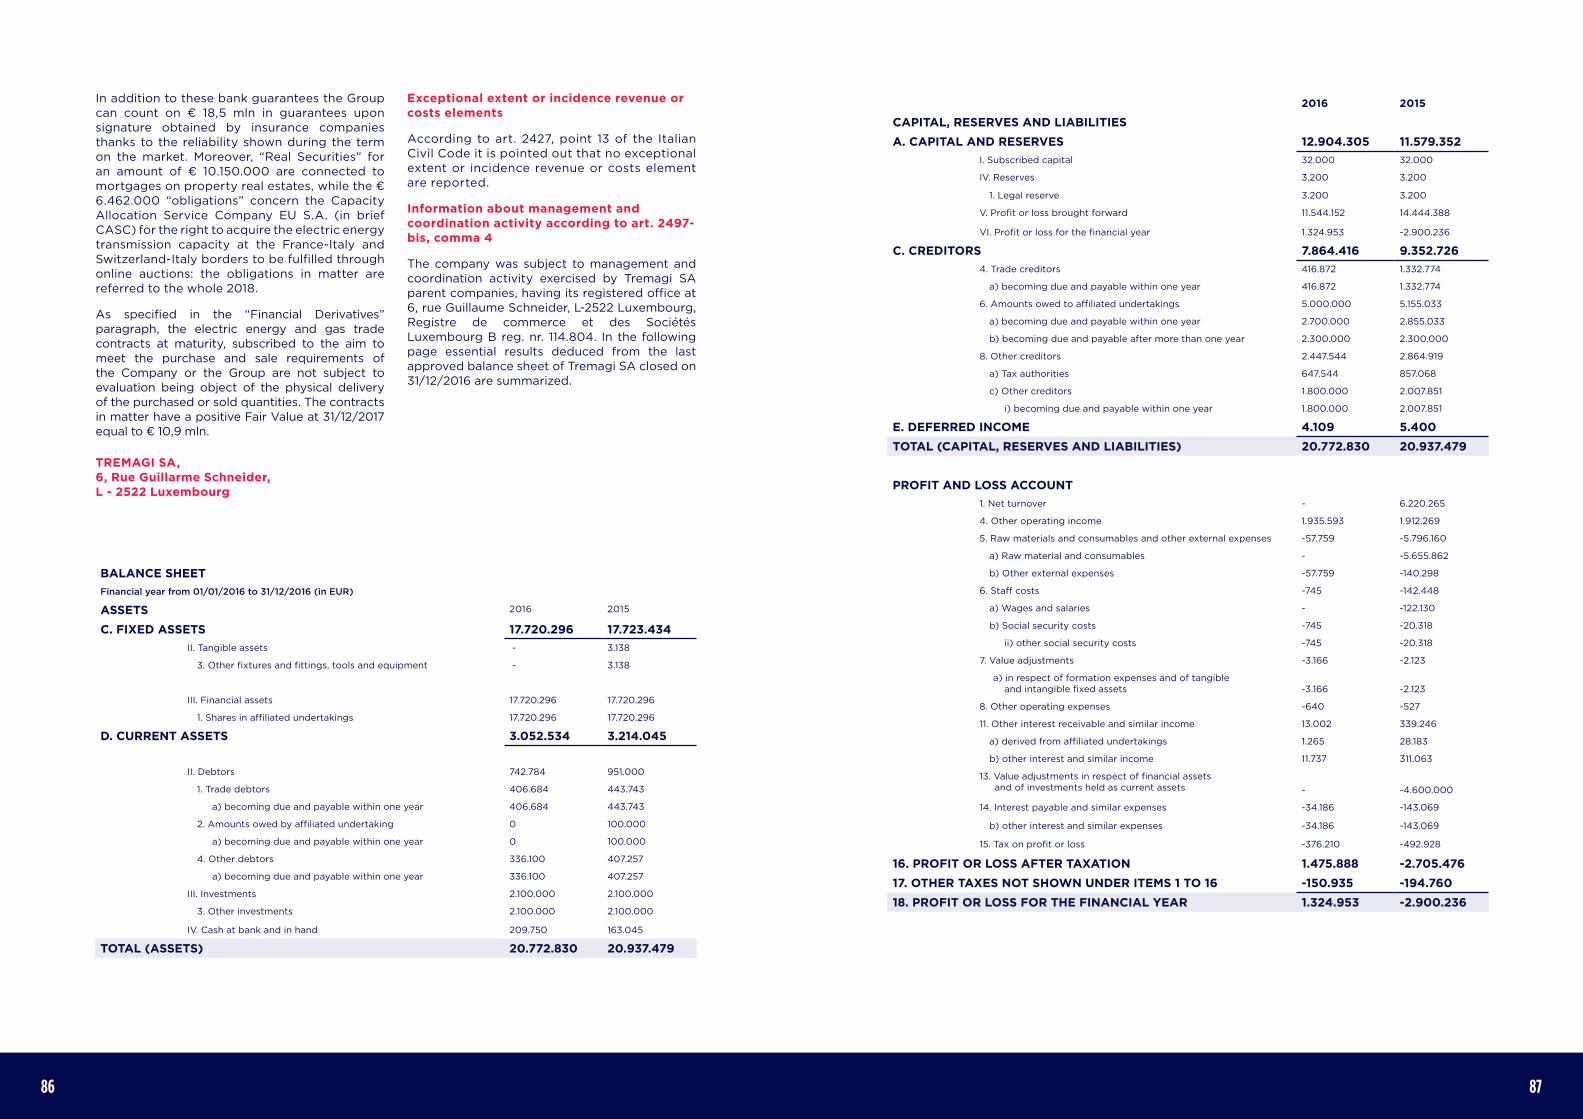
8786
In addition to these bank guarantees the Group can count on € 18,5 mln in guarantees upon signature obtained by insurance companies thanks to the reliability shown during the term on the market. Moreover, “Real Securities” for an amount of € 10.150.000 are connected to mortgages on property real estates, while the € 6.462.000 “obligations” concern the Capacity Allocation Service Company EU S.A. (in brief CASC) for the right to acquire the electric energy transmission capacity at the France-Italy and Switzerland-Italy borders to be fulfilled through online auctions: the obligations in matter are referred to the whole 2018.
As specified in the “Financial Derivatives” paragraph, the electric energy and gas trade contracts at maturity, subscribed to the aim to meet the purchase and sale requirements of the Company or the Group are not subject to evaluation being object of the physical delivery of the purchased or sold quantities. The contracts in matter have a positive Fair Value at 31/12/2017 equal to € 10,9 mln.
Exceptional extent or incidence revenue or costs elements
According to art. 2427, point 13 of the Italian Civil Code it is pointed out that no exceptional extent or incidence revenue or costs element are reported.
Information about management and coordination activity according to art. 2497-bis, comma 4
The company was subject to management and coordination activity exercised by Tremagi SA parent companies, having its registered office at 6, rue Guillaume Schneider, L-2522 Luxembourg, Registre de commerce et des Sociétés Luxembourg B reg. nr. 114.804. In the following page essential results deduced from the last approved balance sheet of Tremagi SA closed on 31/12/2016 are summarized.
BALANCE SHEETFinancial year from 01/01/2016 to 31/12/2016 (in EUR)
ASSETS 2016 2015
C. FIXED ASSETS 17.720.296 17.723.434II. Tangible assets - 3.138
3. Other fixtures and fittings, tools and equipment - 3.138
III. Financial assets 17.720.296 17.720.296
1. Shares in affiliated undertakings 17.720.296 17.720.296
D. CURRENT ASSETS 3.052.534 3.214.045
II. Debtors 742.784 951.000
1. Trade debtors 406.684 443.743
a) becoming due and payable within one year 406.684 443.743
2. Amounts owed by affiliated undertaking 0 100.000
a) becoming due and payable within one year 0 100.000
4. Other debtors 336.100 407.257
a) becoming due and payable within one year 336.100 407.257
III. Investments 2.100.000 2.100.000
3. Other investments 2.100.000 2.100.000
IV. Cash at bank and in hand 209.750 163.045
TOTAL (ASSETS) 20.772.830 20.937.479
TREMAGI SA, 6, Rue Guillarme Schneider, L - 2522 Luxembourg
2016 2015
CAPITAL, RESERVES AND LIABILITIESA. CAPITAL AND RESERVES 12.904.305 11.579.352
I. Subscribed capital 32.000 32.000
IV. Reserves 3.200 3.200
1. Legal reserve 3.200 3.200
V. Profit or loss brought forward 11.544.152 14.444.388
VI. Profit or loss for the financial year 1.324.953 -2.900.236
C. CREDITORS 7.864.416 9.352.726 4. Trade creditors 416.872 1.332.774
a) becoming due and payable within one year 416.872 1.332.774
6. Amounts owed to affiliated undertakings 5.000.000 5.155.033
a) becoming due and payable within one year 2.700.000 2.855.033
b) becoming due and payable after more than one year 2.300.000 2.300.000
8. Other creditors 2.447.544 2.864.919
a) Tax authorities 647.544 857.068
c) Other creditors 1.800.000 2.007.851
i) becoming due and payable within one year 1.800.000 2.007.851
E. DEFERRED INCOME 4.109 5.400 TOTAL (CAPITAL, RESERVES AND LIABILITIES) 20.772.830 20.937.479
PROFIT AND LOSS ACCOUNT1. Net turnover - 6.220.265
4. Other operating income 1.935.593 1.912.269
5. Raw materials and consumables and other external expenses -57.759 -5.796.160
a) Raw material and consumables - -5.655.862
b) Other external expenses -57.759 -140.298
6. Staff costs -745 -142.448
a) Wages and salaries - -122.130
b) Social security costs -745 -20.318
ii) other social security costs -745 -20.318
7. Value adjustments -3.166 -2.123
a) in respect of formation expenses and of tangibleand intangible fixed assets -3.166 -2.123
8. Other operating expenses -640 -527
11. Other interest receivable and similar income 13.002 339.246
a) derived from affiliated undertakings 1.265 28.183
b) other interest and similar income 11.737 311.063
13. Value adjustments in respect of financial assetsand of investments held as current assets - -4.600.000
14. Interest payable and similar expenses -34.186 -143.069
b) other interest and similar expenses -34.186 -143.069
15. Tax on profit or loss -376.210 -492.928
16. PROFIT OR LOSS AFTER TAXATION 1.475.888 -2.705.47617. OTHER TAXES NOT SHOWN UNDER ITEMS 1 TO 16 -150.935 -194.76018. PROFIT OR LOSS FOR THE FINANCIAL YEAR 1.324.953 -2.900.236
Bologna, 30/03/2018
The Chairman of the Directors’ Board
Marco Bernardi PhD
REMUNERATIONS FOR DIRECTORS, STATUTORY AUDITORS AND ACCOUNTANT STATUTORY AUDITORS
On December, 31st 2017 accounts opened for the remunerations of the Illumia SpA Board of Administration’s members, Illumia Trend S.r.l. Sole Director, besides the relevant Statutory Auditors (for Illumia SpA and Tremagi srl) are itemized as follows:
Remuneration for Statutory Auditors 70.000 Remuneration for Directors 1.652.000
For what concerns the company (remunerations booked for service done):
Price WaterhouseCoopers SpA Amounts Balance and bank accounts auditing 122.000
PricewaterhouseCoopers SpA audits the balance sheet of Tremagi srl and Illumia SpA, besides the consolidated balance sheet of the Group.
MAJOR EVENTS OCCURRED AFTER THE END OF THE FINANCIAL YEAR
With reference to the information concerning the nature and the assets, financial and economic effects of the major events occurred after the end of the financial year, in observance of the art.2427 point 22-quater of the Italian Civil Code, appears that at the date of the approval of the balance sheet no mayor events are reported. This balance sheet, composed by Financial Statement, Income statement and Explanatory Note, truthfully and correctly represents the patrimonial and balance sheet as well as the financial year’s economic result, and is in conformity with the book entries’ accounting results.
88

5

9392
TREMAGI S.R.L. – SOLE PARTNER COMPANY – HOLDING
BOARD OF STATUTORY AUDITORS’ REPORTCONCERNING THE CONSOLIDATED BALACE SHEET UNTIL 12/31/2017
Dear Partners,
Tremagi Srl consolidated balance sheet until December, 31st 2017 that is now at Your disposal was
handed over to us in enclosure with Management Report.
It is drawn up according to the law provisions and reports in short the following values (in thousands
of Euro).
(of whom third parties’ assets for 863)
The Income statement points out the positive consolidated result of 2017 financial year equal to €
1.505 (including Minority’s assets for € 139) and corresponds with the Financial Statement’s results.
The balance sheets subject of consolidation are referred to the same closing date of the Group
Leader that corresponds to calendar year (1/1/2017 – 31/12/2017).
The audits carried out by PricewaterhouseCoopers Spa, Auditing company in charge of the revision,
are summarized in the Auditing Report to be referred to, for what concerns the content and in which
is stated that the consolidated balance concerning Tremagi Srl and its associated companies on
12/31/2017 was drawn up with clearness and represents in truthful and correct way the patrimonial
and balance sheet and operating results of the Group: the Auditing Company has moreover expressed
a judgment about the Director’s Report’s coherence with the consolidated balance sheet.
ASSETS 252.289
LIABILITIES 210.783
CONSOLIDATED NET ASSETS 41.506
REPORT OF THE BOARD OF THE STATUTORY AUDITORS
The Board of Statutory Auditors control was not extended to the mentioned results and information
as well as the consolidated balance sheet, except what above specified, in observation of the
dispositions of art. 41 nr.3 Legislative Decree 4/9/1991 – nr. 127.
Consolidation’s area determination, choice of the consolidation’s principles of the Equity investments
and proceedings adopted for the object in view, are to be considered technically correct and, in their
whole, in accordance with the specific rules and regulations in force.
The Directors Report explains adequately economic, patrimonial and balance sheet, operational
trend during 2017 and evolution, after the closing of the financial year, of the whole of companies
that are subject matter of consolidation; for what concerns us we remark its consistency with the
consolidated balance sheet.
BOLOGNA, 13/04/2018
Acc. Andrea Berti - Chairman
Acc. Alberto Collina - Statutory Auditor
Acc. Sara Businelli PhD - Statutory Auditor

6

9796
REPORT OF THE AUDITING COMPANY
REPORT OF THE INDEPENDENT AUDITING COMPANY
ACCORDING TO ART. 14 LEGISLATIVE DECREE 1/27/2010 NR.39.
To the Sole Partner of Tremagi Srl
REPORT ABOUT THE AUDITING OF ACCOUNTS OF THE CONSOLIDATED BALANCE SHEET
Judgment
We have fulfilled the auditing of accounts concerning the consolidated balance sheet of Tremagi Srl
(henceforth “the Group”) given by the consolidated balance sheet closed on December, 31st 2017,
the statement of assets and liabilities and the financial report closed at the same date, together with
the Explanatory note.
In our judgment the consolidated balance sheet represents in truthful and correct way the patrimonial
and balance situation of the Tremagi Group at December, 31st 2017 and the economic result of the
cash flows of the financial year closed at that date, in observance of the Italian rules and regulations
that regulate drawing-up criteria.
Elements at the ground of the judgment
We performed the auditing in accordance to the International Auditing Regulations (ISA Itay).
Our responsibility in pursuance of the mentioned principles are furthermore de-scribed in the
Responsibilities of the auditing company for the auditing of accounts section of this Report. We are
independent from the Tremagi Srl. Company (henceforth “the Company”) in observance of the rules
and regulations require in matter of ethic and inde-pendence in force in Italian legislation in matter
of auditing of balance sheet. We believe to have acquired sufficient and adequate evidence elements
to ground our auditing on.
Other issues
As provided by the law, the Company has included in the Explanatory Note the last bal-ance sheet’s
significant results concerning the company that exercise on it the management and coordination
activity. Our judgment about the consolidated balance sheet of Tremagi Srl is not extended to the
mentioned results.
Responsibilities of the Directors for the consolidated balance sheet
The Directors are responsible for the consolidated balance sheet drawing-up, to be ful-filled with
clearness, representing in truthful and correct way the patrimonial and balance sheet in observance
of the Italian rules and regulations that regulate drawing-up criteria and, in the terms provided by the
legislation, for that part of internal control by themselves considered necessary to allow the drawing-
up of a balance sheet containing no significant errors due to frauds or non intentional behaviors or
occurrences.
The Directors are responsible for the evaluation of the Group’s capacities to continue op-erating like
a functioning entity and, in the drawing-up of the consolidated balance sheet, for the soundness of
the use of the business continuity presumption, and as well for a suitable information in matter. The
Directors make use of the business continuity pre-sumption in the drawing-up of the consolidated
balance sheet unless they have evaluated that conditions occur for the liquidation of the Tremagi
Srl parent company or the interrup-tion of the activity, or they have no realistic alternatives to the
mentioned choices.
Responsibilities of the auditing company in matter of auditing of accounts of the consoli-dated
balance sheet
Our aims are the acquisition of a reasonable certainty that the consolidated balance sheet in its
whole contains no significant errors due to frauds or non intentional behaviors or oc-currences, and the
issuing of an auditing report including our judgment. For reasonable certainty is meant a high certainty
level that, however, provide no guarantee that an audit-ing of accounts performed in accordance to the
International Auditing Regulations (ISA Italy) individuates a significant error, in case it exists. Errors can
come from frauds or non intentional behaviors and occurrences and are considered significant in case
one can rea-sonably expect that, singularly or in their whole, they can influence the economic deci-
sions taken by the users on the ground of the consolidated balance sheets.
In performing the auditing of accounts fulfilled in accordance to the International Auditing Regulations
(ISA Italy), we exerted the professional judgment and maintained the profes-sional skepticism all along
the whole auditing of accounts. Moreover:
• we identified and evaluated significant errors in the consolidated balance sheet, due to frauds
or non intentional behaviors and occurrences; we defined and fulfilled auditing procedures in
response to the mentioned risk; we have acquired evidence elements that are sufficient and proper
to ground our judgment on. The risk not to individuate a significant error due to frauds is higher
in comparison to the risk not to individuate a significant error due to non intentional behaviors or
occurrences, because the fraud can imply the existence of collusion, counterfeiting, intentional
omissions, misleading representations or forced feeding of the internal control;
9998
• we acquired a significant comprehension of the internal control for what concerns auditing of
accounts to the aim of defining suitable auditing procedures for the cir-cumstances and not to
express a judgment about the efficiency of the internal con-trol of the Group;
• we evaluated the adequacy of the adopted auditing principles and the reasonability of the
accounting estimates drawn up by the Directors, including the concerning Explanatory Note;
• we came to a conclusion about the adequacy of the observance by the Directors of the business
continuity principle and, according to the acquired evidence elements, of the possible existence
of a significant uncertainty concerning occurrences and circumstances that can make significant
doubts arise about the capacity of the Group to continue operating as a functioning entity. In
presence of a significant uncertainty we are obliged to call the attention in the auditing report
about the con-cerning balance sheet explanatory note or, in case the information in matter is
inad-equate, to report this circumstance in our judgment. Our conclusions are grounded on the
evidence elements acquired until the date of this report. Nevertheless, suc-cessive occurrences
or circumstances can involve that the Group ceases to operate as a functioning entity;
• we evaluated the presentation, structure and content of the consolidated balance sheet in
its whole, including the Explanatory Note, and if the consolidated balance sheet represents
underlying operations and occurrences so to provide a correct rep-resentation;
• we acquired sufficient and adequate evidence elements about the financial infor-mation of the
companies and different economic activities performed inside the Group to express a judgment
about the consolidated balance sheet. We are respon-sible of the management, supervision and
the fulfillment of the appointment for the auditing of accounts of the Group. We are the unique
responsible of the auditing of accounts of the consolidated balance sheet.
We communicated to the governance activities responsible, identified at an adequate level as
provided by the ISA Italy, among the other aspects, the extent and time schedule pro-vided for
the auditing of accounts and the occurred significant elements, including the possible significant
deficiency in the internal control identified during the auditing pro-ceeding.
REPORT ABOUT OTHER LEGISLATIVE RULES AND REGULATIONS
OPINION IN OBSERVANCE OF ART.14 COMMA 2 LETTER E) OF THE LEGISLATIVE DECREE 39/2010
The Tremagi Srl Directors are responsible for the drawing-up of the report about the man-agement of
the Tremagi Group on 31/12/2017 including its coherence with the concerning consolidated balance
and its accordance with the regulations in force.
We fulfilled the procedures stated by the Auditing Regulations (SA Itay) nr.720B to the aim of
expressing an opinion about the consistency of the management report with the Tremagi Group’s
Consolidated Balance Sheet Report until December, 31st 2017 and the consistency of the mentioned
with the rules and regulations in force, and as well to issue a statement about possible significant
errors.
In our opinion the Management Report is coherent with the consolidated balance sheet of Tremagi
Group until December, 31st 2017 and is drawn in observance of the rules and regulations in force.
With reference to the statement provided by art.14 comma 2 letter e) of the Legislative De-
cree 39/2010 given on the ground of the acknowledges and comprehension of the busi-ness
and concerning environment acquired during the performance of the auditing activity, we have
nothing to report.
Bologna, April, 16th 2018
PricewaterhouseCoopers SpA
Roberto Sollevanti
(Legal external auditor)

7

103102
MINUTES OF THE MEETING OF THE TREMAGI SRL FOR THE APPROVAL OF THE BALANCE SHEET
TREMAGI Srl
Bologna via Galliera 89
Fiscal code and registration number nr. 02965701200
TREMAGI S.R.L. SOLE DIRECTOR COMPANY
Registered office in Bologna, via de’ Carracci 69/2
Company stock Euro 2.000.000
Registered in the Register of the Companies with the number 02965701200
MINUTE OF THE ORDINARY MEETING HELD ON 16/04/2018
Today, April 16th 2018, at 0030 p.m., in Bologna, at the registered office, the ordinary meeting of
the members of the Company named TREMAGI Srl is summoned, in order to discuss and deliberate
about the following items in agenda:
1. adoption of the balance sheet until 12/31st/2017; related and consequent decisions;
2. any other business.
The chairmanship is taken by the Chairman, Marco Bernardi who states the presence of the sole di-
rector for Tremagi S.a., represented by Aldo Bernardoni, by proxy recorded in the deeds of the com-
pany and the presence of the Board of Directors and the Board of Statutory Auditors, and declares
the Meeting as validly constituted and, upon consent of the attending members, appoints Mrs. Va-
leria Giacomoni as Secretary.
About the first issue on the order of business, the Chairman, after a brief resume, reads the tables
of consolidated financial statements ended at December, 31st 2017, for what concerns basic parts,
Balance Sheet, Income Statements, Explanatory Notes, and Directors’ Report about the management.
The Chairman of the Board of Statutory Auditors Mr. Andrea Berti reads then the Report of the
Board of Statutory Auditors and the Report filed up by the PricewaterhouseCoopers S.p.A Company,
appointed of the auditing of accounts in attachment to this minutes.
After a full discussion the Meeting, by unanimous vote
DECIDES
- the adoption of the consolidated financial statements dated December, 31st 2017 for what
con-cerns the explained results.
Having nobody asked to speak about the second point at the business of the day, the Chairman
declares as closed the Meeting at 01.15 p.m. after the reading and approval of this minutes.
COMPLIANCE CERTIFICATE
I, the undersigned Simona Esposito PhD, registered in the Certified Interpreter-Translator Assessors
Roll of the Court of Perugia, registration nr.414/04, in my office of translator appointed by TREMAGI
Srl (Bologna), hereby state and testify that the copies of the foregoing in Italian are the true copies
of the originals.
THE SEGRETARY
Valeria Giacomoni
Perugia, July, 28th 2018
THE CHAIRMAN
Marco Bernardi
THE TRANSLATOR
Simona Esposito
Tremagi S.r.l. società a socio unico - Holding
Sede legale in Via De’ Carracci 69/2 - 40129 Bologna tremagi.it | Tel. 051.04.04.000 | Fax 051.04.04.050
Capitale Sociale 2.000.000,00 i.v. Iscritta al Registro Imprese di Bologna al n. 02965701200
HOLDING