Embed Size (px)
Citation preview
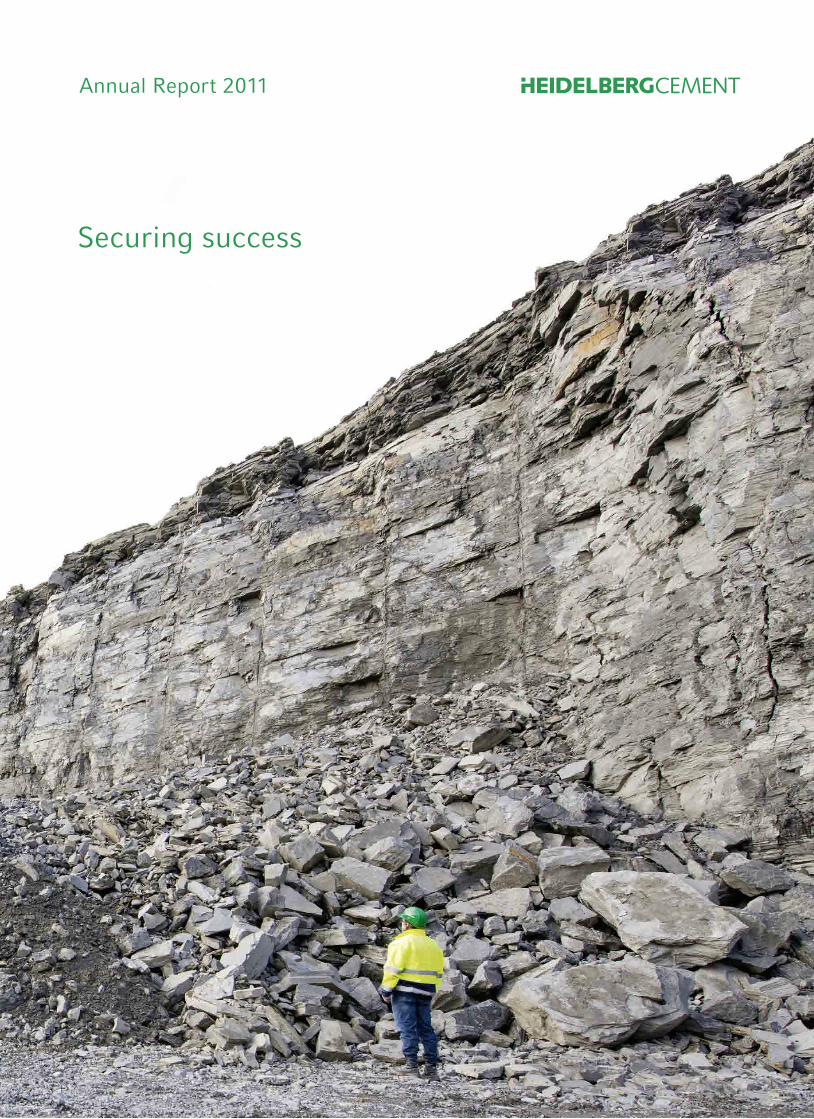
Annual Report 2011
Securing success
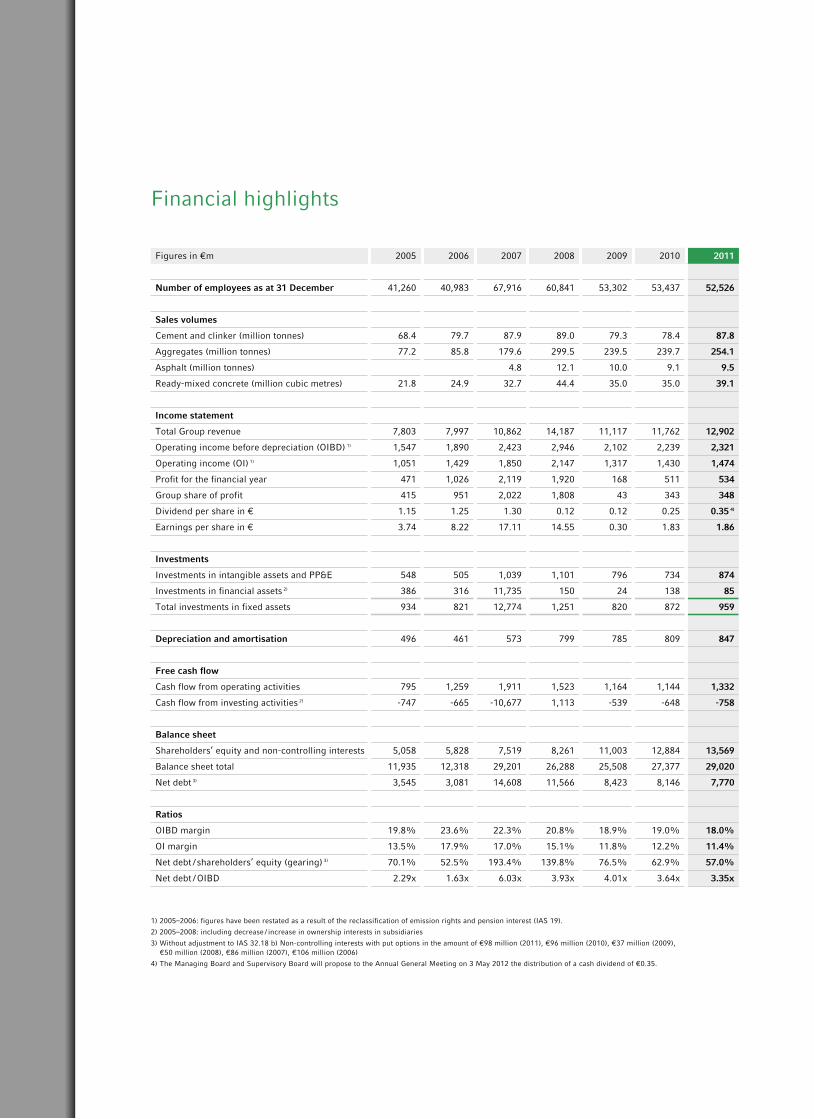
Figures in €m 2005 2006 2007 2008 2009 2010 2011
Number of employees as at 31 December 41,260 40,983 67,916 60,841 53,302 53,437 52,526
Sales volumes
Cement and clinker (million tonnes) 68.4 79.7 87.9 89.0 79.3 78.4 87.8
Aggregates (million tonnes) 77.2 85.8 179.6 299.5 239.5 239.7 254.1
Asphalt (million tonnes) 4.8 12.1 10.0 9.1 9.5
Ready-mixed concrete (million cubic metres) 21.8 24.9 32.7 44.4 35.0 35.0 39.1
Income statement
Total Group revenue 7,803 7,997 10,862 14,187 11,117 11,762 12,902
Operating income before depreciation (OIBD) 1) 1,547 1,890 2,423 2,946 2,102 2,239 2,321
Operating income (OI) 1) 1,051 1,429 1,850 2,147 1,317 1,430 1,474
Profit for the financial year 471 1,026 2,119 1,920 168 511 534
Group share of profit 415 951 2,022 1,808 43 343 348
Dividend per share in € 1.15 1.25 1.30 0.12 0.12 0.25 0.35 4)
Earnings per share in € 3.74 8.22 17.11 14.55 0.30 1.83 1.86
Investments
Investments in intangible assets and PP&E 548 505 1,039 1,101 796 734 874
Investments in financial assets 2) 386 316 11,735 150 24 138 85
Total investments in fixed assets 934 821 12,774 1,251 820 872 959
Depreciation and amortisation 496 461 573 799 785 809 847
Free cash flow
Cash flow from operating activities 795 1,259 1,911 1,523 1,164 1,144 1,332
Cash flow from investing activities 2) -747 -665 -10,677 1,113 -539 -648 -758
Balance sheet
Shareholders’ equity and non-controlling interests 5,058 5,828 7,519 8,261 11,003 12,884 13,569
Balance sheet total 11,935 12,318 29,201 26,288 25,508 27,377 29,020
Net debt 3) 3,545 3,081 14,608 11,566 8,423 8,146 7,770
Ratios
OIBD margin 19.8% 23.6% 22.3% 20.8% 18.9% 19.0% 18.0%
OI margin 13.5% 17.9% 17.0% 15.1% 11.8% 12.2% 11.4%
Net debt / shareholders’ equity (gearing) 3) 70.1% 52.5% 193.4% 139.8% 76.5% 62.9% 57.0%
Net debt / OIBD 2.29x 1.63x 6.03x 3.93x 4.01x 3.64x 3.35x
1) 2005–2006: figures have been restated as a result of the reclassification of emission rights and pension interest (IAS 19).
2) 2005–2008: including decrease / increase in ownership interests in subsidiaries
3) Without adjustment to IAS 32.18 b) Non-controlling interests with put options in the amount of €98 million (2011), €96 million (2010), €37 million (2009), €50 million (2008), €86 million (2007), €106 million (2006)
4) The Managing Board and Supervisory Board will propose to the Annual General Meeting on 3 May 2012 the distribution of a cash dividend of €0.35.
Financial highlights
Fin
anci
al h
ighl
ight
s |
Ove
rvie
w o
f G
roup
are
as
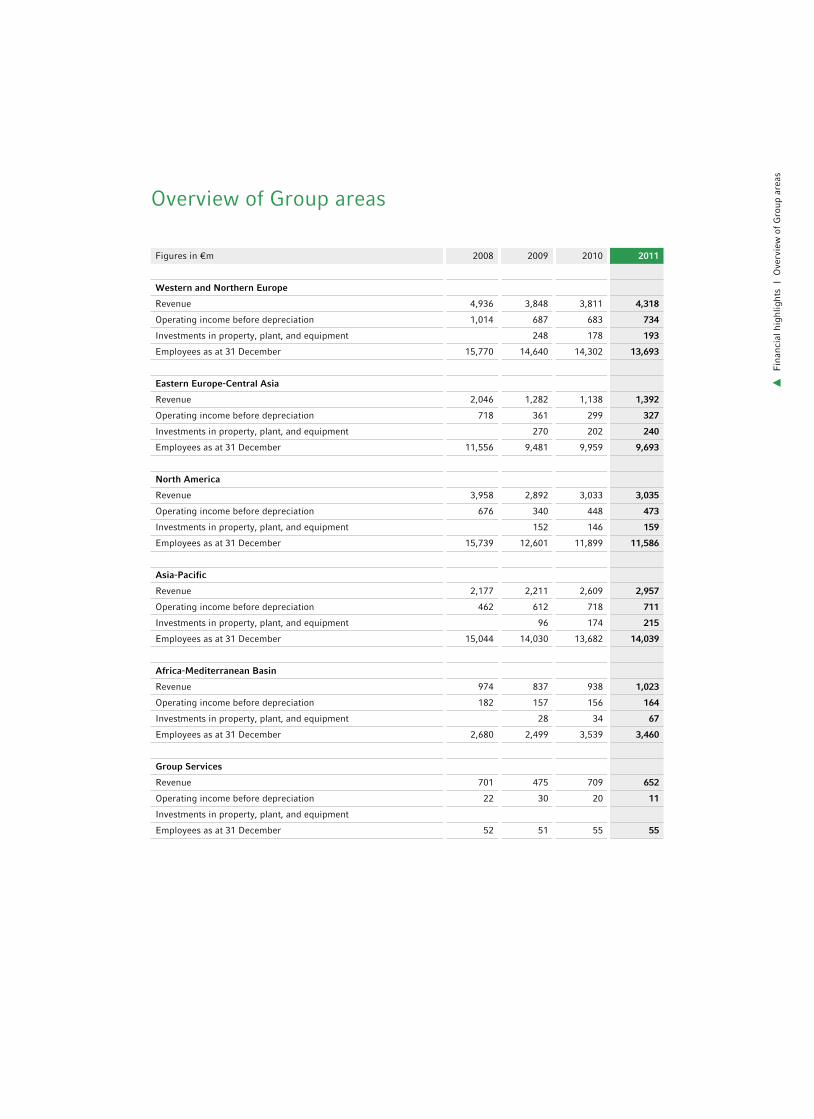
Figures in €m 2008 2009 2010 2011
Western and Northern Europe
Revenue 4,936 3,848 3,811 4,318
Operating income before depreciation 1,014 687 683 734
Investments in property, plant, and equipment 248 178 193
Employees as at 31 December 15,770 14,640 14,302 13,693
Eastern Europe-Central Asia
Revenue 2,046 1,282 1,138 1,392
Operating income before depreciation 718 361 299 327
Investments in property, plant, and equipment 270 202 240
Employees as at 31 December 11,556 9,481 9,959 9,693
North America
Revenue 3,958 2,892 3,033 3,035
Operating income before depreciation 676 340 448 473
Investments in property, plant, and equipment 152 146 159
Employees as at 31 December 15,739 12,601 11,899 11,586
Asia-Pacific
Revenue 2,177 2,211 2,609 2,957
Operating income before depreciation 462 612 718 711
Investments in property, plant, and equipment 96 174 215
Employees as at 31 December 15,044 14,030 13,682 14,039
Africa-Mediterranean Basin
Revenue 974 837 938 1,023
Operating income before depreciation 182 157 156 164
Investments in property, plant, and equipment 28 34 67
Employees as at 31 December 2,680 2,499 3,539 3,460
Group Services
Revenue 701 475 709 652
Operating income before depreciation 22 30 20 11
Investments in property, plant, and equipment
Employees as at 31 December 52 51 55 55
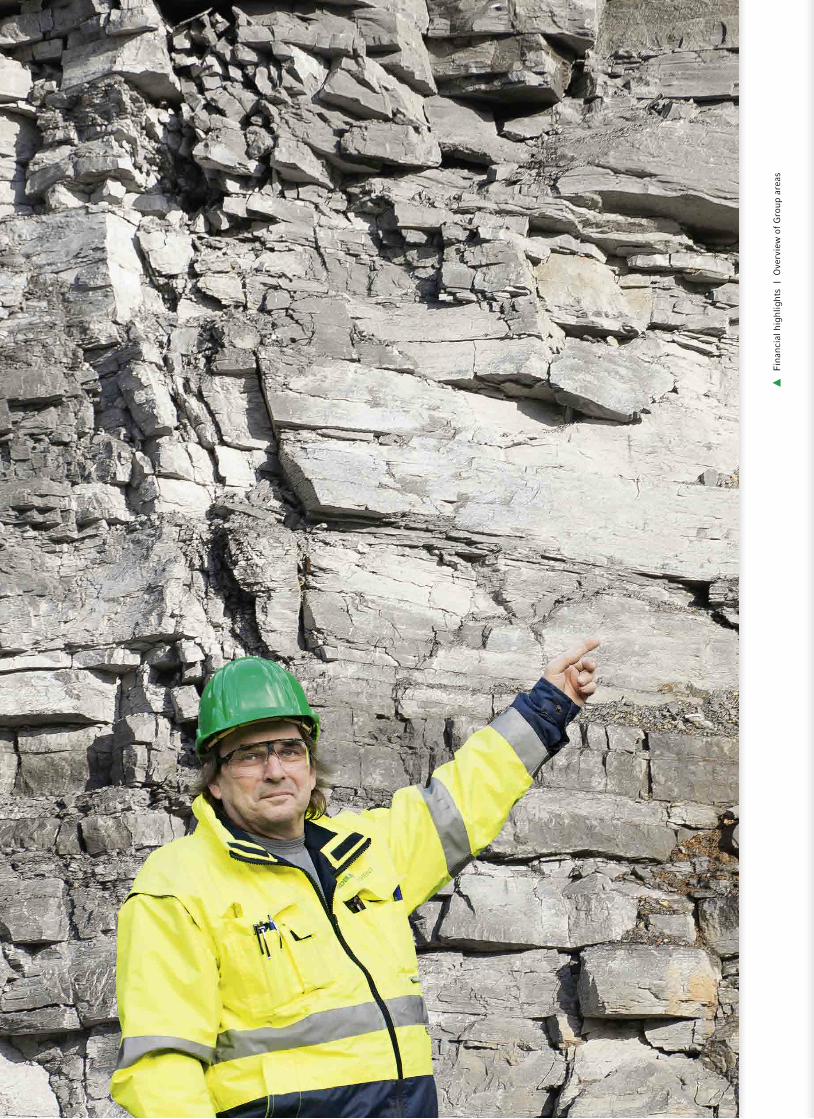
Overview of Group areas
Fin
anci
al h
ighl
ight
s |
Ove
rvie
w o
f G
roup
are
as
Fin
anci
al h
ighl
ight
s |
Ove
rvie
w o
f G
roup
are
as
Providing security means leaving absolutely nothing to chance. Quality and reliability are guiding principles that apply not only to our products. Our long-term success is also built on our reserves of raw materials, solid finances, and close, respectful customer relationships. Our ambitious goals in the areas of occupational safety and ecological sustainability also help to ensure that we remain competitive in the market. Since 1873.
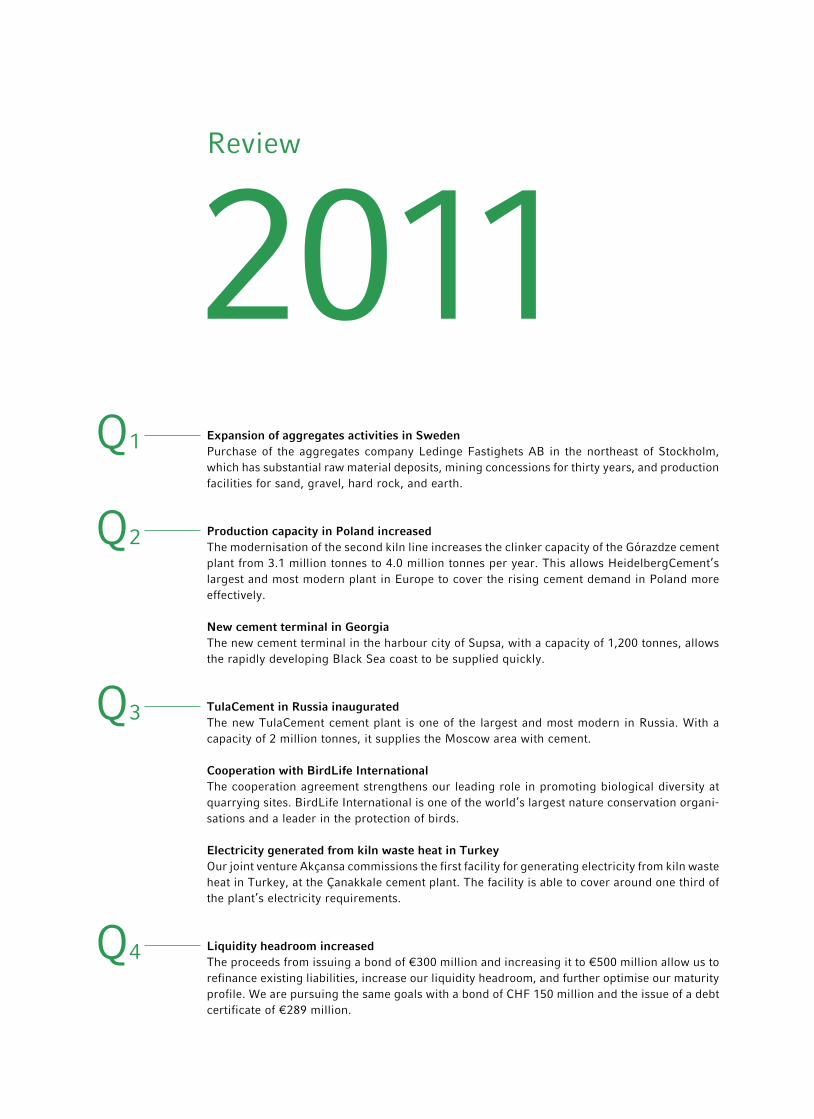
Review
2011Expansion of aggregates activities in SwedenPurchase of the aggregates company Ledinge Fastighets AB in the northeast of Stockholm, which has substantial raw material deposits, mining concessions for thirty years, and production facilities for sand, gravel, hard rock, and earth.
Production capacity in Poland increased The modernisation of the second kiln line increases the clinker capacity of the Górazdze cement plant from 3.1 million tonnes to 4.0 million tonnes per year. This allows HeidelbergCement’s largest and most modern plant in Europe to cover the rising cement demand in Poland more effectively.
New cement terminal in GeorgiaThe new cement terminal in the harbour city of Supsa, with a capacity of 1,200 tonnes, allows the rapidly developing Black Sea coast to be supplied quickly.
Liquidity headroom increased The proceeds from issuing a bond of €300 million and increasing it to €500 million allow us to refinance existing liabilities, increase our liquidity headroom, and further optimise our maturity profile. We are pursuing the same goals with a bond of CHF 150 million and the issue of a debt certificate of €289 million.
TulaCement in Russia inauguratedThe new TulaCement cement plant is one of the largest and most modern in Russia. With a capacity of 2 million tonnes, it supplies the Moscow area with cement.
Cooperation with BirdLife International The cooperation agreement strengthens our leading role in promoting biological diversity at quarrying sites. BirdLife International is one of the world’s largest nature conservation organi-sations and a leader in the protection of birds.
Electricity generated from kiln waste heat in TurkeyOur joint venture Akçansa commissions the first facility for generating electricity from kiln waste heat in Turkey, at the Çanakkale cement plant. The facility is able to cover around one third of the plant’s electricity requirements.
Q1
Q2
Q3
Q4

1Letter to the shareholders 18Report of the Supervisory Board 22Managing Board 28HeidelbergCement in the capital market 30
Core activities and organisational structure 38Strategy, management control, and targets 392011 business trend 42Additional statements 74Risk report 80Sustainability 95Employees and society 96Environmental precaution 104Research and technology 106Procurement 112Outlook 113
Corporate Governance statement 126Remuneration report 131Supervisory Board and Managing Board 140
Consolidated income statement 149Consolidated statement of comprehensive income 150Consolidated statement of cash flows 151Consolidated balance sheet 152Consolidated statement of changes in equity 154Segment reporting 156Notes to the 2011 consolidated financial statements 158Audit opinion 240Responsibility statement 241
Global functions and Country Managers 244Glossary and index 246Imprint 248Cement capacities and aggregates reserves back cover
Contents
1) Part of the combined management report of HeidelbergCement Group and HeidelbergCement AG
2 Combined management report of HeidelbergCement Group and HeidelbergCement AG
To our shareholders
3 Corporate Governance 1)
4 Consolidated financial statements
5 Additional information

The only thing we are running out of is hours in the day.

838 quarries, 2,500 plants worldwide, lime stone reserves for more than 90 years, and aggregates reserves for more than 60 years.

There’s one figure we want to keep at zero: the accident rate.
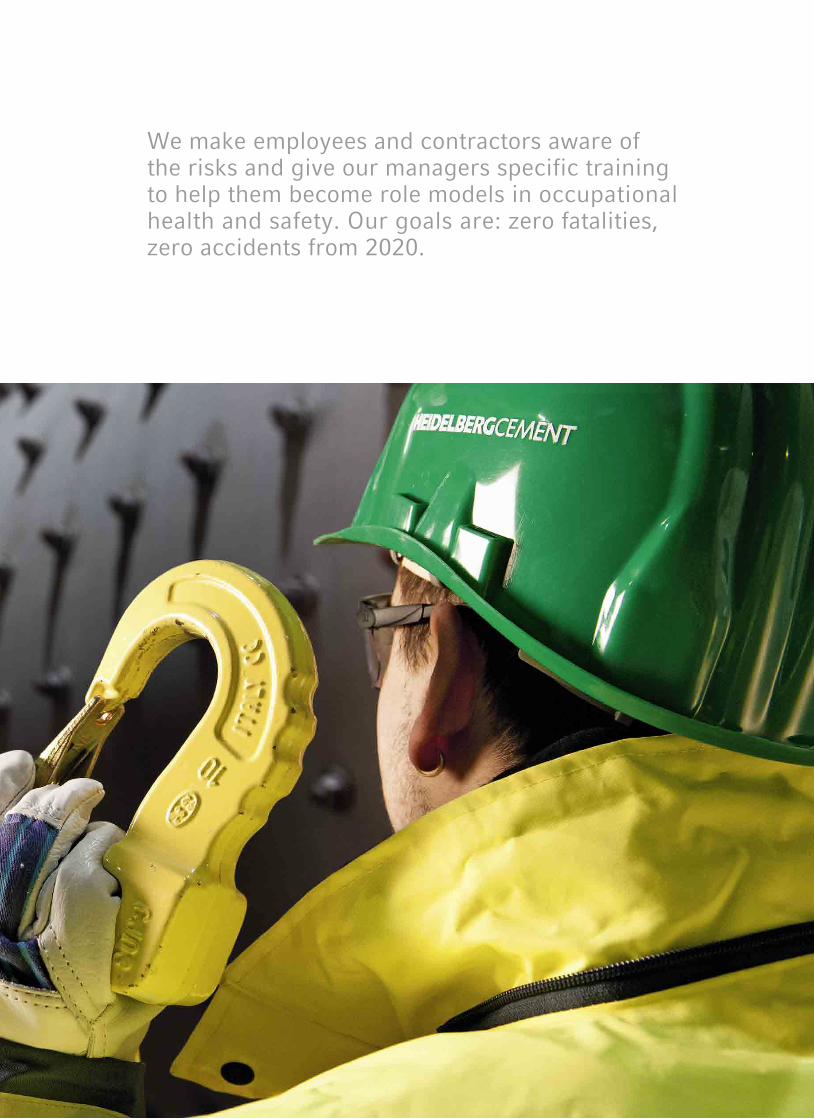
We make employees and contractors aware of the risks and give our managers specific training to help them become role models in occupational health and safety. Our goals are: zero fatalities, zero accidents from 2020.
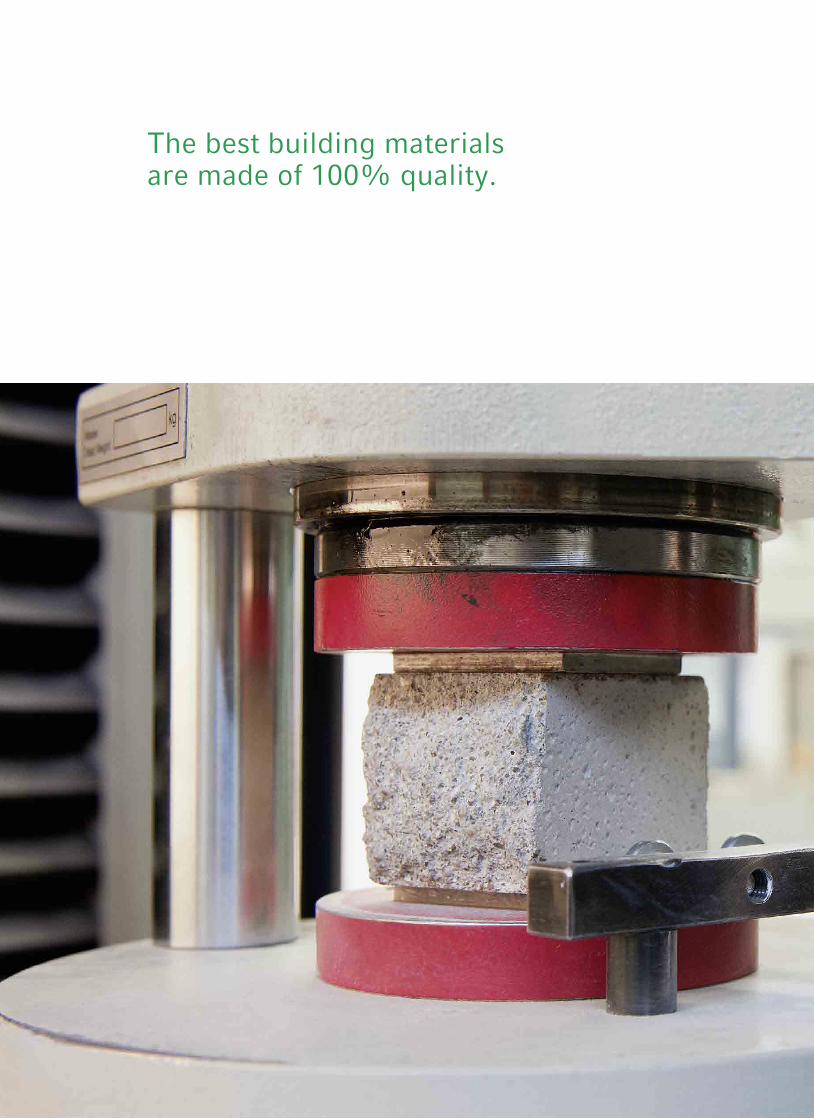
The best building materials are made of 100% quality.
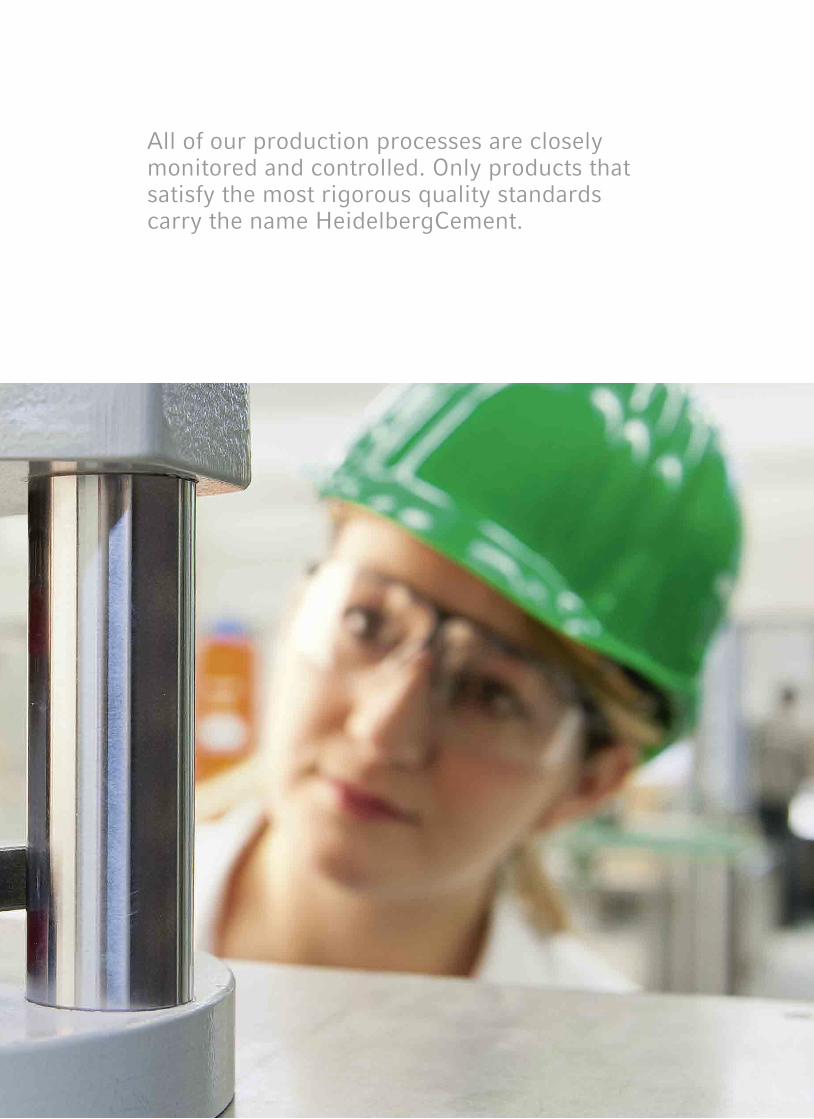
All of our production processes are closely monitored and controlled. Only products that satisfy the most rigorous quality standards carry the name HeidelbergCement.
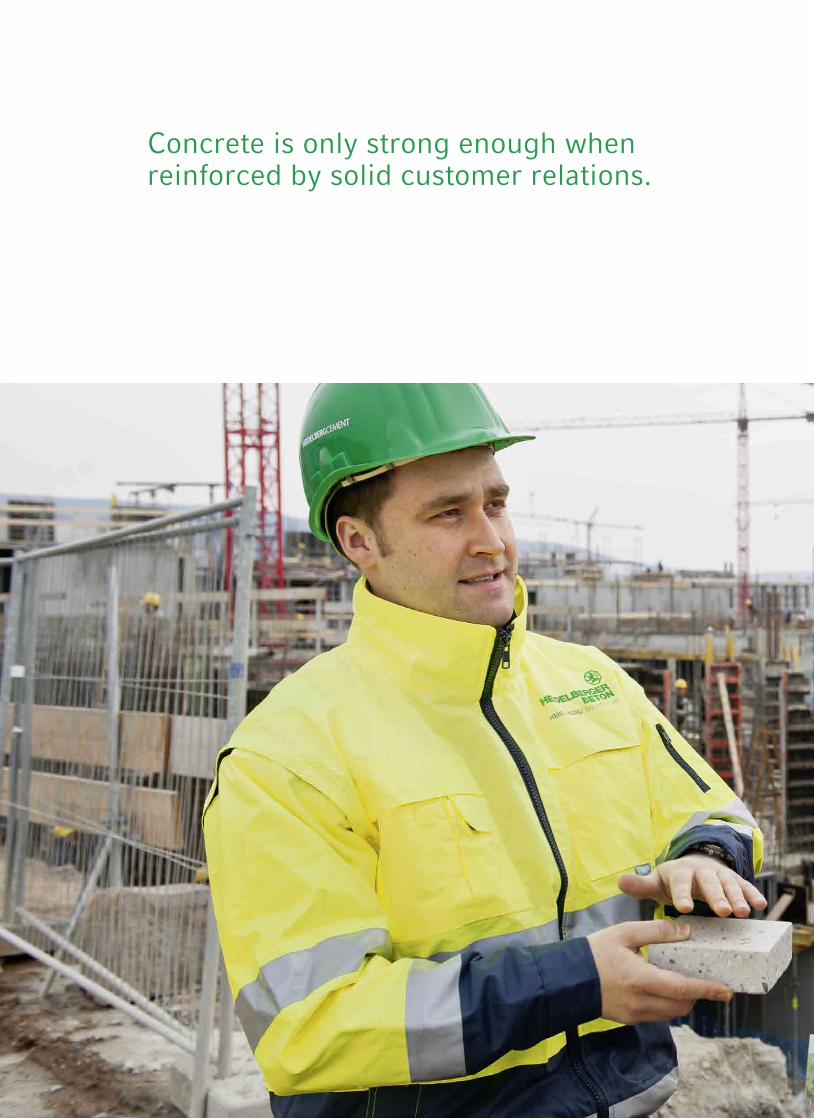
Concrete is only strong enough when reinforced by solid customer relations.
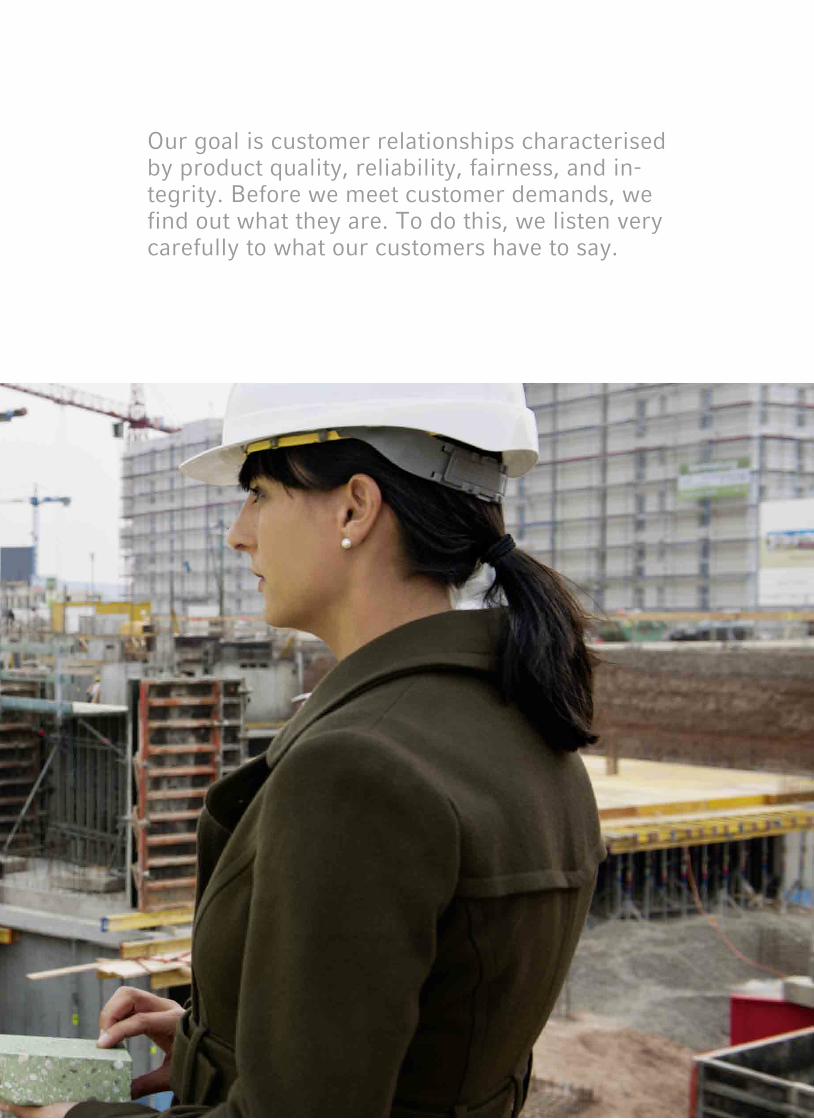
Our goal is customer relationships characterised by product quality, reliability, fairness, and in-tegrity. Before we meet customer demands, we find out what they are. To do this, we listen very carefully to what our customers have to say.
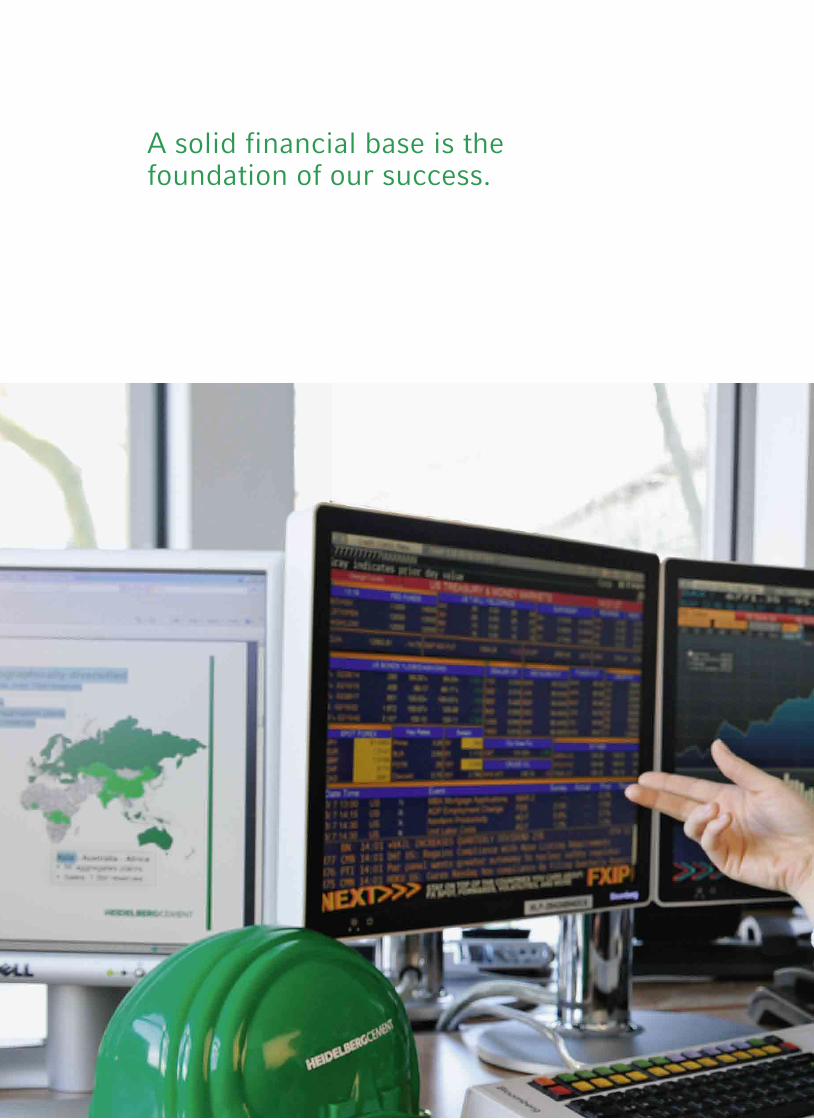
A solid financial base is the foundation of our success.
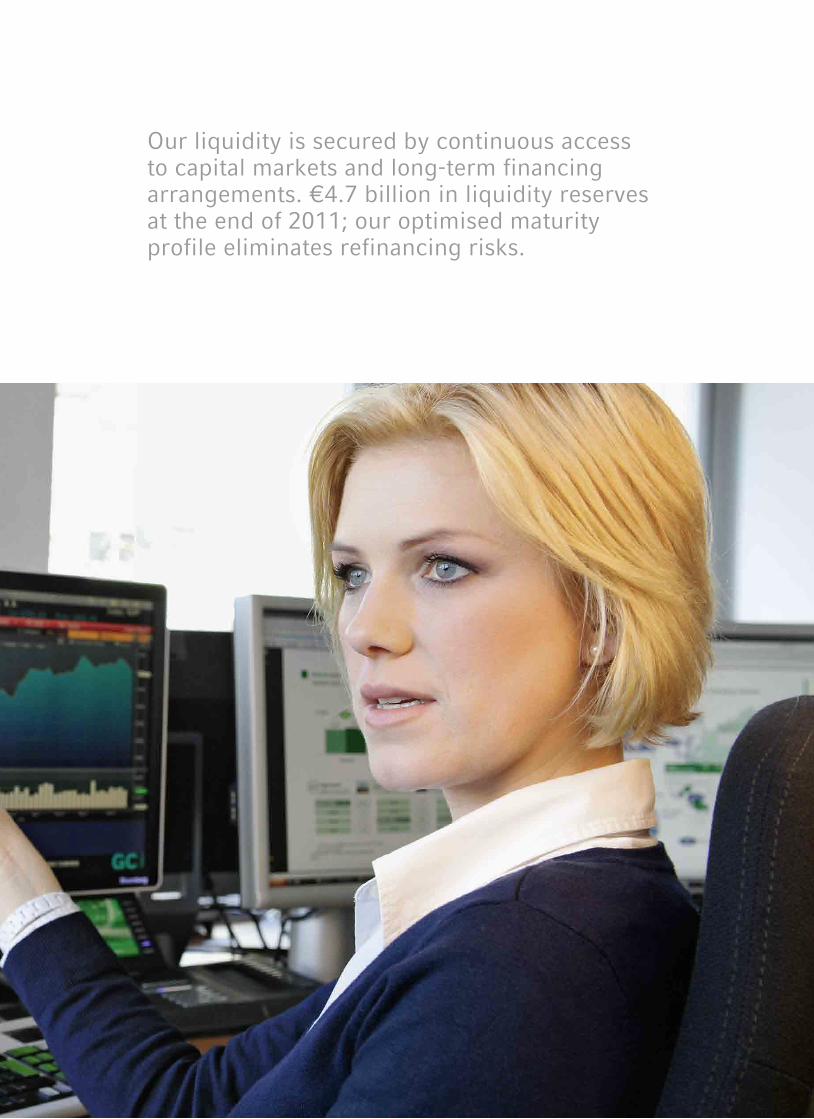
Our liquidity is secured by continuous access to capital markets and long-term financing arrangements. €4.7 billion in liquidity reserves at the end of 2011; our optimised maturity profile eliminates refinancing risks.
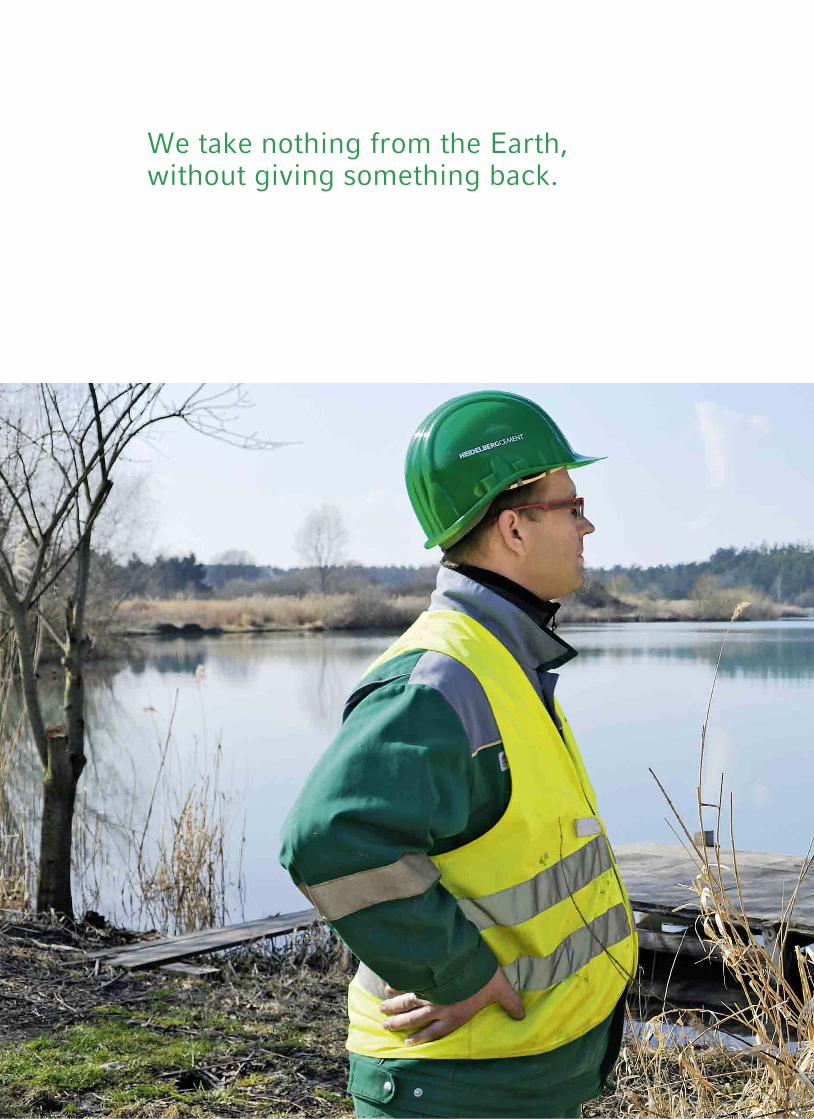
We take nothing from the Earth, without giving something back.

Our quarries offer sanctuary to animals and plants that have become increasingly rare in the overall cultural landscape. Through low-impact methods of extraction, restoration, and reclamation, we make a strong contribution to increasing biodiversity.

16 HeidelbergCement | Annual Report 2011
To our shareholders
1
17HeidelbergCement | Annual Report 2011
Letter to the shareholders 18 Report of the Supervisory Board 22 Managing Board 28 HeidelbergCement in the capital market 30Overview 30Development of the HeidelbergCement share 30Earnings per share 32Dividend 32Shareholder structure and trading volume 32Bonds and credit ratings 33Investor Relations 34
Com
bine
d m
anag
emen
t re
port
Cor
pora
te G
over
nanc
eC
onso
lidat
ed f
inan
cial
sta
tem
ents
Add
itio
nal i
nfor
mat
ion
To
our
shar
ehol
ders
2
3
4
5
1
Com
bine
d m
anag
emen
t re
port
Cor
pora
te G
over
nanc
eC
onso
lidat
ed f
inan
cial
sta
tem
ents
Add
itio
nal i
nfor
mat
ion
To
our
shar
ehol
ders
2
3
4
5
1
Con
ten
ts
1
18 HeidelbergCement | Annual Report 2011
Dear Shareholders, Dear Employees and Friends of HeidelbergCement,
The 2011 financial year drew to a successful close for HeidelbergCement in an environment characterised by extreme political and economic volatility. This success is largely reflected in two developments:
We achieved the goal we set ourselves at the start of the year – a further increase in revenue and operating income – despite the unexpectedly heavy rise in energy prices as a result of the Fukushima reactor disaster. HeidelbergCement has delivered!
Compared with our main competitors, we fared well again in 2011. The positive development of HeidelbergCement’s results, which started in 2010 and continued in 2011, contrasts sharply with the industry’s negative result trend.
Three key factors enabled us to perform successfully:– our corporate culture, which is characterised by consistent implementation, cost efficiency,
speed, and a high level of management competence at all levels,– the success of our “FOX 2013” efficiency improvement initiative, which led to cash-relevant
savings of €384 million in 2011, and– our favourable geographical positioning in attractive micromarkets as well as the good balance
between cement and aggregates in our product portfolio. The fact that we have no major operations in the crisis regions of Southern Europe and the Middle East demonstrates Heidelberg Cement’s advantageous positioning.
2011: Revenue and results increased; net debt further reduced In 2011, we achieved an above-average increase in sales volumes of cement (+12%), aggre-gates (+6%), and ready-mixed concrete (+12%). In addition to the advantageous geographical positioning, exceptionally mild winter weather – particularly in Europe and North America – contributed to this growth. As a result, Group revenue rose by 9.7% to €12.9 billion.
We were able to improve operating income before depreciation (OIBD) by 3.6% to €2.321 bil-lion and operating income by 3.0% to €1.474 billion. This improvement in results was achieved despite the substantial increase in energy costs mentioned above. The increase connected with energy prices alone impaired our results by around €170 million. In the second half of the year, we also had to absorb a significant drop in the prices of CO2 emission certificates. The resulting contribution to operating income was around €130 million lower than in the previous year. However, we responded quickly to these negative developments beyond our control, and focused on three key areas: – further intensifying our “FOX 2013” efficiency improvement initiative, with the result that
the savings goal set for 2011 was exceeded by €184 million,– a noticeable reduction in the investments originally planned for 2011, and – the successful conversion of pension schemes in North America and Western Europe, which
reduced balance sheet risks and generated savings of €129 million.
Thanks to these measures and price increases in key markets, we succeeded in stabilising the operating margin in the aggregates business line at the previous year’s level. The protection against inflation of our raw material reserves is something that makes the aggregates business in the medium- and long-term particularly attractive for us, as the global market leader.
19HeidelbergCement | Annual Report 2011
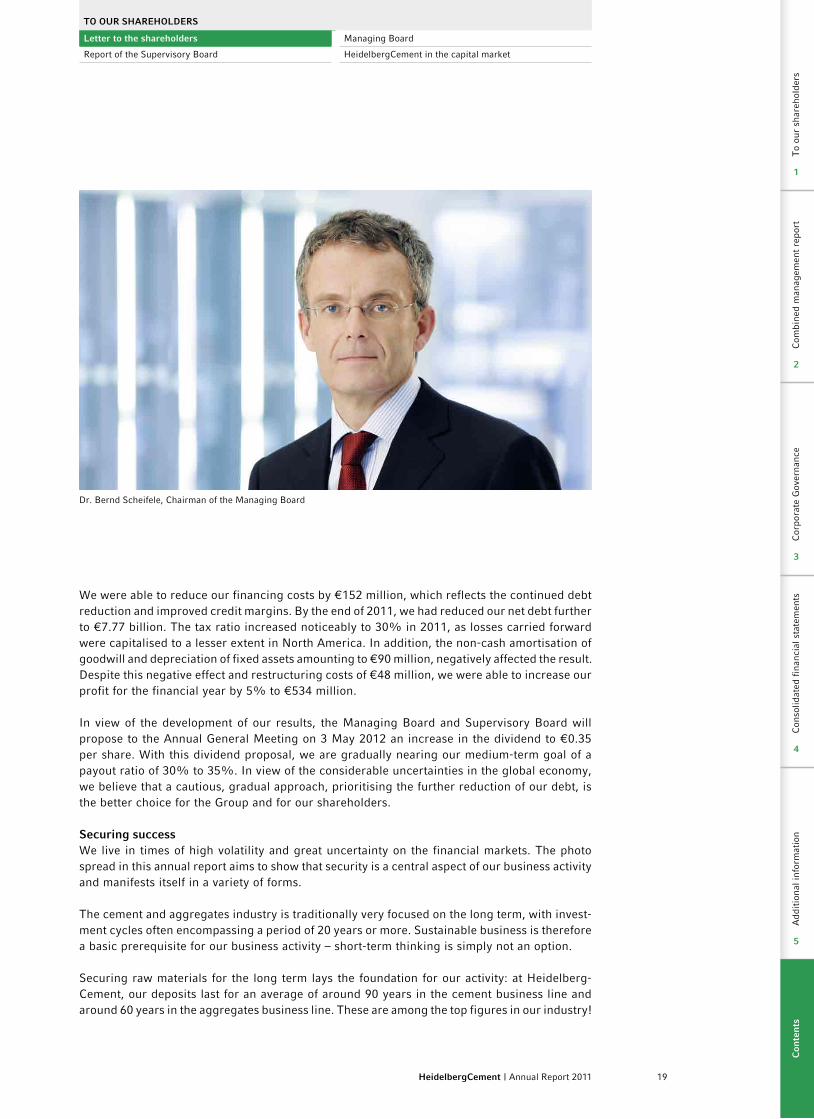
We were able to reduce our financing costs by €152 million, which reflects the continued debt reduction and improved credit margins. By the end of 2011, we had reduced our net debt further to €7.77 billion. The tax ratio increased noticeably to 30% in 2011, as losses carried forward were capitalised to a lesser extent in North America. In addition, the non-cash amortisation of goodwill and depreciation of fixed assets amounting to €90 million, negatively affected the result. Despite this negative effect and restructuring costs of €48 million, we were able to increase our profit for the financial year by 5% to €534 million.
In view of the development of our results, the Managing Board and Supervisory Board will propose to the Annual General Meeting on 3 May 2012 an increase in the dividend to €0.35 per share. With this dividend proposal, we are gradually nearing our medium-term goal of a payout ratio of 30% to 35%. In view of the considerable uncertainties in the global economy, we believe that a cautious, gradual approach, prioritising the further reduction of our debt, is the better choice for the Group and for our shareholders.
Securing successWe live in times of high volatility and great uncertainty on the financial markets. The photo spread in this annual report aims to show that security is a central aspect of our business activity and manifests itself in a variety of forms.
The cement and aggregates industry is traditionally very focused on the long term, with invest-ment cycles often encompassing a period of 20 years or more. Sustainable business is therefore a basic prerequisite for our business activity – short-term thinking is simply not an option.
Securing raw materials for the long term lays the foundation for our activity: at Heidelberg-Cement, our deposits last for an average of around 90 years in the cement business line and around 60 years in the aggregates business line. These are among the top figures in our industry!
Dr. Bernd Scheifele, Chairman of the Managing Board
To ouR SHAREHoLDERS
Letter to the shareholders Managing Board
Report of the Supervisory Board HeidelbergCement in the capital market
Com
bine
d m
anag
emen
t re
port
Cor
pora
te G
over
nanc
eC
onso
lidat
ed f
inan
cial
sta
tem
ents
Add
itio
nal i
nfor
mat
ion
To
our
shar
ehol
ders
2
3
4
5
1
Com
bine
d m
anag
emen
t re
port
Cor
pora
te G
over
nanc
eC
onso
lidat
ed f
inan
cial
sta
tem
ents
Add
itio
nal i
nfor
mat
ion
To
our
shar
ehol
ders
2
3
4
5
1
Con
ten
ts
1
20 HeidelbergCement | Annual Report 2011
In 2011, we made good progress with our sustainability initiatives. We implemented numerous measures in the area of occupational safety. The success is clear to see: we were able to notice-ably reduce the accident frequency rate and the accident severity indicator in comparison with the previous year.
Safeguarding biodiversity at our quarries is an important element of our operating activities. In 2011, we brought in a strong partner – the nature conservation organisation BirdLife Inter-national – to help us further expand our outstanding position in the area of biodiversity.
Last but not least, we responded to the increased uncertainty in the financial markets. We extended the credit line with our core banks until the end of 2015 and secured more liquidity headroom at an early stage by issuing bonds and a debt certificate. Although this is a costly approach in times like these, security comes first. This is underscored by the theme of our annual report “Securing success”.
Thanks to our employeesOur employees faced many challenges in 2011. Their strong personal dedication and uncon-ditional loyalty to our Group laid the foundation for the healthy operating income achieved in the reporting year. For this, I would like to express my sincere gratitude and appreciation and also those of my colleagues on the Managing Board. I would also like to thank the employee representatives, who cooperated very closely, openly, and trustingly with the Managing Board in this difficult environment for the benefit of HeidelbergCement.
As in previous years, I would like to personally thank and express my utmost appreciation to our managers in the operating units worldwide and the staff functions. They responded promptly and consistently to the challenges of 2011 and efficiently implemented the directives of the Managing Board. Without them, the welcome increase in operating income would not have been possible.
The Managing Board and managers of HeidelbergCement have a shared aspiration: we want to be the best-run company in our industry !
2012: Strategic focal points remain unchangedThe three strategic focal points we defined in 2011 still apply: – cost leadership through continuous efficiency improvements, – further reduction of debt with the aim of attaining investment grade status, and– targeted investment in cement capacities in growth markets.
In our industry, cost leadership is a crucial factor for success. For this reason, we started the “FOX 2013” efficiency improvement initiative in 2011, with the aim of achieving cash-relevant savings totalling €600 million over the next three years. In the reporting year, we surpassed our goals by a considerable margin and have therefore increased our target by €250 million to €850 million. The cornerstones of “FOX 2013” are: – further optimisation of the working capital,– improvement in our purchasing conditions,– increase in efficiency at our 600 quarries for sand, gravel, and hard rock, and– further improvement in energy efficiency at our cement plants with the aim of reducing
electricity costs by 5% and fuel costs by 3%.
1
21HeidelbergCement | Annual Report 2011
A high priority is still given to the steady reduction of our debt with the aim of improving our creditworthiness into the investment grade range. In the future, we will continue to strictly apply the discipline that we have observed in the last few years in terms of costs and investment de-cisions. In addition, we are planning to intensify disposals of non-core activities, particularly in light of a noticeable recovery of the markets in North America.
We will continue our successful strategy of targeted capacity expansions in our cement activities in the emerging countries of Asia, Africa, Eastern Europe, and Central Asia. The focus is not on acquisitions but rather on the expansion of our production capacities and the construction of new plants in markets where we already operate. We will also further optimise our position in the aggregates business by means of investments in raw material deposits or the integration of smaller local plants. As in previous years, major acquisitions that would significantly increase the Group’s debt are not part of the strategy.
Prospects for 2012 For 2012, we expect a continuation of the worldwide economic growth. However, growth rates will weaken in most individual markets because of the measures taken to consolidate public finances. In our mature markets in the US, the UK, Germany, the Benelux countries, Northern Europe, and Australia, the economy will develop positively in 2012 and 2013, according to the IMF’s forecast, with growth rates of over 2% in some countries. In Eastern Europe and Central Asia, economic output will increase by between 2% and 6% in Poland, the Czech Republic, the Ukraine, Russia, and Kazakhstan. For our most important markets in Asia and Africa, attractive growth rates of between 5% and 9% are forecast once again.
With regard to costs, we expect a further – albeit significantly weaker – increase in energy and raw material prices as well as rising personnel costs. We will take targeted measures to offset the cost increase and also win back some of the margins lost in 2011. To achieve these objectives, we will place a high priority on price increases and consistently continue our cost reduction and efficiency improvement measures.
On the basis of these assumptions, the Managing Board has set the goal of increasing revenue and further improving operating income. The business trend in the first two months of 2012 makes us confident that we will achieve this objective. Thanks to our advantageous geographical positioning in attractive markets – in both emerging and industrialised countries – and our global market leadership in the aggregates business, HeidelbergCement is excellently positioned to benefit over-proportionally from the continued economic growth.
Yours sincerely,
Dr. Bernd ScheifeleChairman of the Managing BoardHeidelberg, 15 March 2012
To ouR SHAREHoLDERS
Letter to the shareholders Managing Board
Report of the Supervisory Board HeidelbergCement in the capital market
Com
bine
d m
anag
emen
t re
port
Cor
pora
te G
over
nanc
eC
onso
lidat
ed f
inan
cial
sta
tem
ents
Add
itio
nal i
nfor
mat
ion
To
our
shar
ehol
ders
2
3
4
5
1
Com
bine
d m
anag
emen
t re
port
Cor
pora
te G
over
nanc
eC
onso
lidat
ed f
inan
cial
sta
tem
ents
Add
itio
nal i
nfor
mat
ion
To
our
shar
ehol
ders
2
3
4
5
1
Con
ten
ts
1
22 HeidelbergCement | Annual Report 2011
Report of the Supervisory Board
Ladies and Gentlemen,
In the 2011 financial year, the building materials industry and our Group saw pleasing operational increases in revenue in almost all the regions and product lines in which Heidelberg Cement operates. The increase of more than €1 billion in revenue compared with the previous year was primarily due to a rise in sales volumes. The development in the first quarter of the year was operationally particularly good because of the mild weather in the northern hemisphere. Although the increase in quantities – primarily driven by the continued positive development of the building materials markets in the growth regions of Asia and Africa as well as the unexpect-edly fast recovery of the building materials markets in Europe and parts of North America – cre-ated some optimism, this was tempered by significant increases in variable production costs. The prices of coal, oil, and electricity rose dramatically throughout the world in 2011 and had a negative impact on the result, particularly from our energy-intensive cement business line. Freight costs have also increased and so the operating income of the Group for 2011 was only slightly above the previous year’s level at €1.47 billion. In view of the ongoing disruptions on the global economic and financial markets, however, the Managing Board and Supervisory Board can be quite satisfied with the development of the 2011 financial year and the overall Group result. HeidelbergCement’s advantageous geographical positioning with impressive market positions outside the world’s current crisis zones once again ensured that the Group performed well in the market – especially in comparison with other global building materials companies.
On the basis of the development in recent years, the Supervisory Board is convinced that the Group is strategically well positioned. With this in mind, it has held detailed discussions regarding the current Strategic Plan, which was prepared during the reporting year, and has adopted this plan. The plan includes a clear future and growth strategy. This includes projects to secure and expand market positions in growth regions, such as the current expansion pro-jects in India and Indonesia, as well as investment projects for new cement capacities, e.g. in Russia and Kazakhstan. This consistent dual strategy will continue to lead HeidelbergCement into a secure future. The Supervisory Board backs this strategic approach fully and promotes it in the fulfilment of its tasks.
In 2011, HeidelbergCement once again also focused on financing matters. The key tasks were consistently reducing the Group’s financial liabilities to a level well below €8 billion and smoothing the maturity profile of liabilities for the next years. The efforts to guarantee sufficient liquidity at an early stage was another area of focus. This was achieved by means of committed bank credit lines as well as with a spread of liabilities that focuses more heavily on capital market debt, which protects the Group against any difficulties in the banking sector, such as those experienced at the end of 2008. The bonds and debt certificates totalling around €912 million issued on the capital market in the course of the 2011 financial year have made the Group more independent of bank financing and have secured the repayment of the €1 billion bond that matured in January 2012. The Supervisory Board was closely involved in all the financial transactions described as well as in the key decisions to guarantee a viable financing concept for the Group. In particular, it backed the Managing Board’s “safety first” decision in the issue of debenture bonds in the fourth quarter of 2011 and the early extension of the syndicated credit line. In practice, this meant giving priority to a forward-looking and comprehensive approach to safeguarding Group financing, given the extreme volatility of the financial markets, rather than waiting for possible future interest reductions on the bond market, and thus accepting to pay more interest than for existing bonds because of the prevailing market conditions. In the
23HeidelbergCement | Annual Report 2011
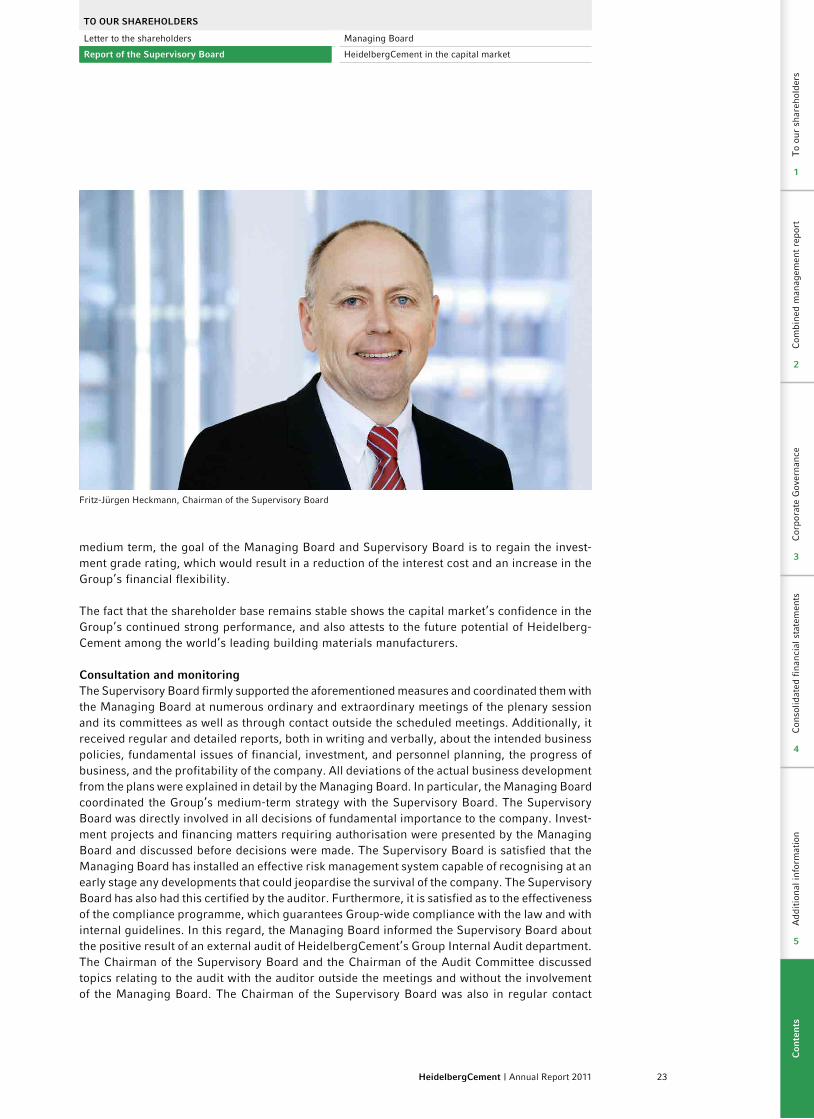
Fritz-Jürgen Heckmann, Chairman of the Supervisory Board
medium term, the goal of the Managing Board and Supervisory Board is to regain the invest-ment grade rating, which would result in a reduction of the interest cost and an increase in the Group’s financial flexibility.
The fact that the shareholder base remains stable shows the capital market’s confidence in the Group’s continued strong performance, and also attests to the future potential of Heidelberg-Cement among the world’s leading building materials manufacturers.
Consultation and monitoringThe Supervisory Board firmly supported the aforementioned measures and coordinated them with the Managing Board at numerous ordinary and extraordinary meetings of the plenary session and its committees as well as through contact outside the scheduled meetings. Additionally, it received regular and detailed reports, both in writing and verbally, about the intended business policies, fundamental issues of financial, investment, and personnel planning, the progress of business, and the profitability of the company. All deviations of the actual business development from the plans were explained in detail by the Managing Board. In particular, the Managing Board coordinated the Group’s medium-term strategy with the Supervisory Board. The Supervisory Board was directly involved in all decisions of fundamental importance to the company. Invest-ment projects and financing matters requiring authorisation were presented by the Managing Board and discussed before decisions were made. The Supervisory Board is satisfied that the Managing Board has installed an effective risk management system capable of recognising at an early stage any developments that could jeopardise the survival of the company. The Supervisory Board has also had this certified by the auditor. Furthermore, it is satisfied as to the effectiveness of the compliance programme, which guarantees Group-wide compliance with the law and with internal guidelines. In this regard, the Managing Board informed the Supervisory Board about the positive result of an external audit of HeidelbergCement’s Group Internal Audit department. The Chairman of the Supervisory Board and the Chairman of the Audit Committee discussed topics relating to the audit with the auditor outside the meetings and without the involvement of the Managing Board. The Chairman of the Supervisory Board was also in regular contact
To ouR SHAREHoLDERS
Letter to the shareholders Managing Board
Report of the Supervisory Board HeidelbergCement in the capital market
Com
bine
d m
anag
emen
t re
port
Cor
pora
te G
over
nanc
eC
onso
lidat
ed f
inan
cial
sta
tem
ents
Add
itio
nal i
nfor
mat
ion
To
our
shar
ehol
ders
2
3
4
5
1
Com
bine
d m
anag
emen
t re
port
Cor
pora
te G
over
nanc
eC
onso
lidat
ed f
inan
cial
sta
tem
ents
Add
itio
nal i
nfor
mat
ion
To
our
shar
ehol
ders
2
3
4
5
1
Con
ten
ts
1
24 HeidelbergCement | Annual Report 2011
with the Chairman of the Managing Board outside the scheduled meetings. In summary, it is evident that the Supervisory Board has duly fulfilled the duties incumbent upon it under the law, the Articles of Association, the Rules of Procedure, and the Corporate Governance Code.
Topics of discussion in the meetings of the Supervisory Board and its committeesThe plenary session of the Supervisory Board met five times in the reporting year, the Audit Committee twice, and the Personnel Committee four times; the Nomination Committee and the Arbitration Committee, formed in accordance with § 27, section 3 of the German Codetermina-tion Law, did not need to meet. In addition, both the Supervisory Board (once) and the Audit Committee (five times) held conference calls during the reporting year. The following plenary session was informed about the results of the committees’ meetings. The members of the Super-visory Board and its committees are listed in the Corporate Governance chapter on page 140 f.
The ordinary plenary sessions in March, May, September, and November dealt, amongst other things, with the adoption of the 2010 annual financial statements and consolidated financial statements, preparations for the 2011 Annual General Meeting, reporting on business trends, as well as reporting and resolutions on refinancing projects, and resolutions on Corporate Govern-ance issues, including decisions on the variable elements of the Managing Board remuneration. The Supervisory Board also confirmed the issue of a seven-year €500 million bond under the existing EMTN programme, a six-year CHF 150 million bond, and a five-year debt certificate of €289 million in order to further improve the maturity profile of the liabilities and to secure the repayment of the €1 billion bond that matured in January 2012.
At its September meeting, the Supervisory Board discussed and agreed the key points of the Strategic Plan and also approved the investment projects in Australia and China. Furthermore, the Supervisory Board was informed, at several meetings during the reporting year, about the progress of the efficiency programme “FOX 2013” with the projects “CLIMB” in the aggregates business and “OPEX” in the cement business, and about the development of the Group’s key financial ratios. Finally, the Supervisory Board studied an analysis carried out by the Managing Board on the competitiveness of the Group’s German cement plants.
At an extraordinary meeting held in February, the Supervisory Board dealt especially with the operational planning and approved the new remuneration system for the Managing Board.
At an extraordinary conference call in the beginning of November, the definitive terms of the issue of the CHF 150 million bond and an authorisation to the Managing Board to issue a debt certificate were discussed and agreed.
In its meetings, the Audit Committee dealt with the 2010 annual financial statements and con-solidated financial statements and the focal points for the audit, the status quo reports from internal audit, risk management, occupational health and safety, and compliance, the quarterly and half-yearly reports for the 2011 financial year, the preparation of the Supervisory Board’s proposal to the 2011 Annual General Meeting for the appointment of the auditor and Group auditor for 2011, and – after the Annual General Meeting followed this proposal – the award of the contract to the audit firm Ernst & Young for the auditing of the annual financial statements and consolidated financial statements for the 2011 financial year. In this context, it defined the focal points for the audit. Finally, the Audit Committee prepared the Supervisory Board’s resolutions on the approval for the issue of bonds and other important financing decisions and also approved the definitive terms of a debt certificate of €289 million, on the basis of prior delegation by the Supervisory Board.
25HeidelbergCement | Annual Report 2011
The topics discussed in the meetings of the Personnel Committee included the preliminary discussion and recommendation to the Supervisory Board regarding the determination of the variable Managing Board remuneration for 2010 and the setting of parameters for the variable Managing Board remuneration for 2011. The Personnel Committee also discussed the extensions of the Managing Board agreements of Daniel Gauthier, Andreas Kern, Dr. Dominik von Achten, and Dr. Albert Scheuer and submitted recommendations to the Supervisory Board, accordingly.
At 95%, attendance at the meetings of the Supervisory Board and its committees was, as it has been in the past, pleasingly high. There were no conflicts of interest of any Supervisory Board member when dealing with topics within the Supervisory Board. There were also no consulting or other contracts for services or work between any member of the Supervisory Board and the company.
Corporate GovernanceThe statement of compliance in the reporting year was submitted by the Managing Board on 8 February 2011 and by the Supervisory Board on 10 February 2011, and this year’s statement of compliance was submitted by the Managing Board on 7 February 2012 and by the Super-visory Board on 9 February 2012. The complete text can be found in the section Statement of compliance in accordance with § 161 of the German Stock Company Act in the Corporate Governance chapter on page 126. The statements of compliance are made permanently available to the share holders on the Group’s website.
As early as 17 March 2010, the Supervisory Board established that, in its opinion, the Super-visory Board and its Audit Committee had a sufficient number of independent members and that at least one independent member of the Supervisory Board and the Audit Committee had the required expertise in the areas of accounting or auditing.
In line with the Corporate Governance Code dated 26 May 2010, the Supervisory Board approved the guidelines regarding the implementation of the diversity principles in the Managing Board and Supervisory Board in its meeting on 10 February 2011. The Supervisory Board is fully com-plying with the guidelines of the Corporate Governance Code regarding the future appointment of Managing Board members and has firmly established its commitment with a corresponding amendment to its Rules of Procedure. Regarding its own composition, it welcomes the diversity goals stipulated in the Corporate Governance Code and aims to have the largest possible pool of candidates available for the election of future Supervisory Board members. However, it de-liberately abstains from setting specific diversity goals, meaning there is neither a set quota for individual candidate groups in its future composition, nor a set quota for the adequate involve-ment of women, because it will evaluate and select all potential candidates solely on the basis of their qualifications and professional achievements to date. Aside from this, the Supervisory Board welcomes and supports the selection criteria for its composition set out in the Code, i.e. an appointment based on a sufficient number of independent members that fulfil one or more of the following criteria: successful work in management positions outside the company, an international background, experience in the industry, and specific knowledge in the areas of accounting or financing. The Supervisory Board confirmed this policy decision in its meetings of September and November 2011 in light of the ongoing political debate on increasing the proportion of women in management positions. The Supervisory Board welcomes and supports the Managing Board’s goal of bringing the proportion of women in management positions at HeidelbergCement in line with the proportion of women employed within the company by 2020. This will more than double the proportion of women in management positions in Germany from 7% to 15%.
To ouR SHAREHoLDERS
Letter to the shareholders Managing Board
Report of the Supervisory Board HeidelbergCement in the capital market
Com
bine
d m
anag
emen
t re
port
Cor
pora
te G
over
nanc
eC
onso
lidat
ed f
inan
cial
sta
tem
ents
Add
itio
nal i
nfor
mat
ion
To
our
shar
ehol
ders
2
3
4
5
1
Com
bine
d m
anag
emen
t re
port
Cor
pora
te G
over
nanc
eC
onso
lidat
ed f
inan
cial
sta
tem
ents
Add
itio
nal i
nfor
mat
ion
To
our
shar
ehol
ders
2
3
4
5
1
Con
ten
ts
1
26 HeidelbergCement | Annual Report 2011
As regards the remuneration structure for the members of the Managing Board for the 2011 financial year, details on remuneration of the Managing Board are included in the Corporate Gov-ernance chapter on page 131 f. to avoid repetition. This chapter also describes the new Manag ing Board remuneration system, which came into force on 1 January 2011 and was approved by the Annual General Meeting on 5 May with a large majority, under the agenda item Say on Pay in accordance with § 120 of the German Stock Company Act. As the system for the Managing Board remuneration has remained unchanged since then, it will not be presented for resolution again at the Annual General Meeting 2012.
The Supervisory Board was also informed about the results of the external audit of the Group’s internal audit system, which were presented to the Audit Committee.
In line with the implementation of the new remuneration system for the Managing Board, the deductibles in the D&O liability insurance for the members of the Supervisory Board were in-creased from 1 January 2011 in accordance with the regulations of the law and the Corporate Governance Code. At several meetings during the reporting year, the Supervisory Board was informed about suitable D&O liability insurance policies for Supervisory Boards currently avail-able on the insurance market.
In 2011, the Supervisory Board once again carried out an efficiency audit of its activity. The points of focus for the audit were the collection and analysis of the information disseminated by the Managing Board, particularly ahead of investment decisions, and the presentation and implementation of the Group’s strategy. The members of the Supervisory Board rated their activity in the aforementioned areas as positive and efficient in the majority of cases. Criticism and suggestions gathered from the Supervisory Board members as part of the efficiency audit are taken as an opportunity for making improvements to future Supervisory Board activity.
In the 2011 and 2012 financial years, several internal training events for the members of the Supervisory Board took place in line with the suggestions of the Corporate Governance Code, last amended in 2010. The following topics were discussed intensively together with external experts: Supervisory Board members’ responsibility in the area of compliance, principles for filling top management positions, the methodology for company strategies, and the impact of future IFRS changes. The Supervisory Board thus reaffirmed its commitment to effective Cor-porate Governance and Compliance in the Group.
Finally, in the first meeting of this year, the changes to the Corporate Governance Code planned by the Government Commission were discussed.
Auditing and approval of annual financial statements and consolidated financial statementsBefore the contract for the auditing of the annual financial statements of the company and the consolidated financial statements of the Group was awarded, the focal points for the audit, the content of the audit, and the costs were discussed in detail with the auditors, Ernst & Young GmbH, Wirtschaftsprüfungsgesellschaft, Stuttgart. In February 2012, the Managing Board informed the Supervisory Board about the interim, uncertified key figures for the 2011 financial year and provided a status report on the financial statements work. The annual financial statements of HeidelbergCement AG, the consolidated financial statements as at 31 December 2011, and the combined management report for the company and the Group, as prepared by the Managing Board, were examined by the independent auditors. The auditors gave the financial statements the unqualified confirmation. The financial statement documents and auditors’ reports were sent to the members of the Supervisory Board. At first, the Audit Committee dealt intensively with the financial statements in the presence of the auditors. The auditors reported on the main results of their audit. Then, the Supervisory Board discussed the financial statements in
27HeidelbergCement | Annual Report 2011
To ouR SHAREHoLDERS
Letter to the shareholders Managing Board
Report of the Supervisory Board HeidelbergCement in the capital market
detail, once again in the presence of the auditors. The Supervisory Board approved the audit results. It examined the annual financial statements and the consolidated financial statements, the combined management report, and the Managing Board’s proposal for the use of net profit shown in the balance sheet. The results of the pre-audit conducted by the Audit Committee and the results of its own audit correspond fully to the results of the official auditor. The Supervisory Board raised no objections to the final results of this examination. The Supervisory Board has therefore approved the annual financial statements and the consolidated financial statements. The annual financial statements have thus been adopted.
The Supervisory Board approved the Managing Board’s proposal for the use of net profit shown in the balance sheet, including the payment of a dividend of €0.35 per share.
Personnel matters and a note of thanksIn its meeting on 10 February 2011, the Supervisory Board followed the recommendation made by the Personnel Committee and extended the Managing Board mandates for both Daniel Gauthier and Andreas Kern by five years until 30 June 2016. In its meeting on 24 November 2011, the Supervisory Board extended the Managing Board mandate of Dr. Dominik von Achten until 30 September 2017 and the Managing Board mandate of Dr. Albert Scheuer until 5 August 2017, also on the recommendation of the Personnel Committee. Besides granting these extensions, the Supervisory Board would like to offer its thanks and recognition for the very successful work of the members of the Managing Board in the Group areas for which they are responsible.
The Supervisory Board would finally like to thank the Group’s management and all the employees of the Group for maintaining their high level of personal dedication during 2011. Their perfor-mance in ensuring the continuing successful development of the Group under the still difficult economic conditions in the building materials industry has been exceptional.
Heidelberg, 14 March 2012
On behalf of the Supervisory Board
Yours sincerely,
Fritz-Jürgen HeckmannChairman
Com
bine
d m
anag
emen
t re
port
Cor
pora
te G
over
nanc
eC
onso
lidat
ed f
inan
cial
sta
tem
ents
Add
itio
nal i
nfor
mat
ion
To
our
shar
ehol
ders
2
3
4
5
1
Com
bine
d m
anag
emen
t re
port
Cor
pora
te G
over
nanc
eC
onso
lidat
ed f
inan
cial
sta
tem
ents
Add
itio
nal i
nfor
mat
ion
To
our
shar
ehol
ders
2
3
4
5
1
Con
ten
ts
1
28 HeidelbergCement | Annual Report 2011
1
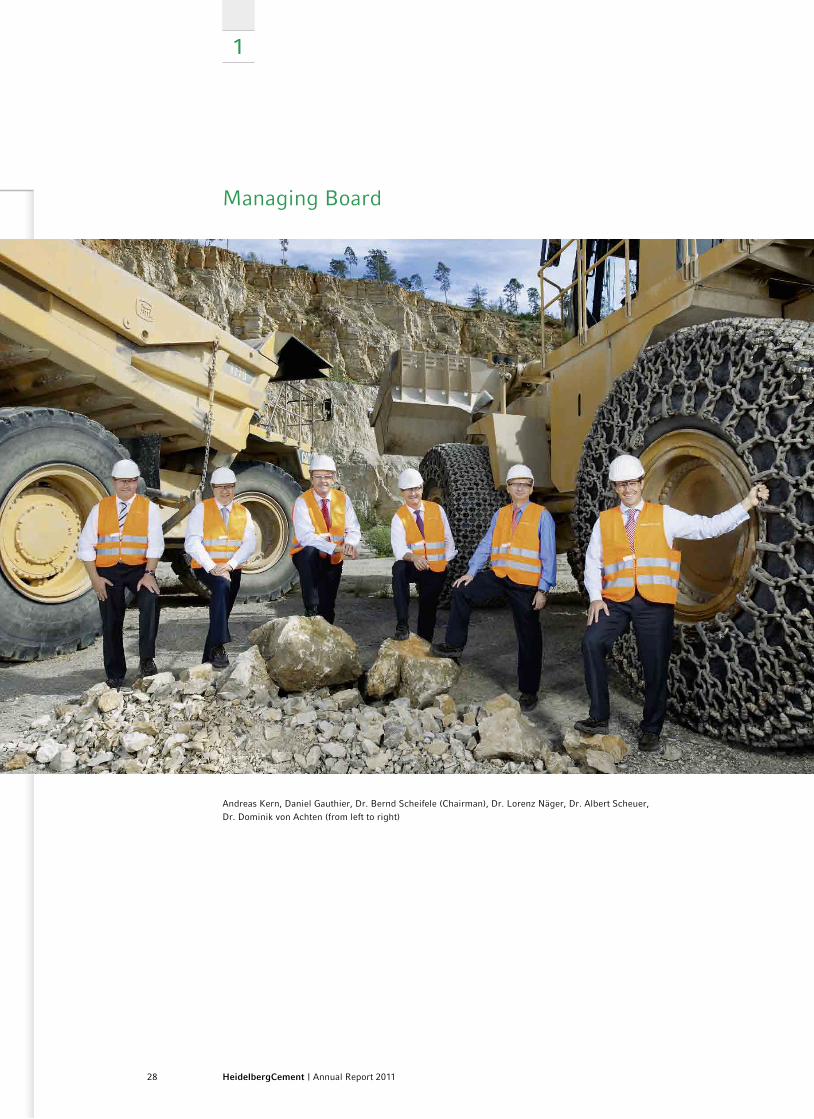
Managing Board
Andreas Kern, Daniel Gauthier, Dr. Bernd Scheifele (Chairman), Dr. Lorenz Näger, Dr. Albert Scheuer, Dr. Dominik von Achten (from left to right)
29HeidelbergCement | Annual Report 2011
To ouR SHAREHoLDERS
Letter to the shareholders Managing Board
Report of the Supervisory Board HeidelbergCement in the capital market
Dr. Bernd ScheifeleBorn in Freiburg (Germany), aged 53 years. Studies in law at the universities of Freiburg, Dijon (France), and the University of Illinois (US). Since 2005, Chairman of the Managing Board; in charge of Strategy and Development, Communication & Investor Relations, Human Resources, Legal, Compliance, and Internal Audit.
Dr. Dominik von AchtenBorn in Munich (Germany), aged 46 years. Studies in law and economics at the German universi-ties of Freiburg and Munich. Member of the Managing Board since 2007; in charge of the North America Group area, Purchasing, and worldwide coordination of the Competence Center Materials.
Daniel GauthierBorn in Charleroi (Belgium), aged 55 years. Studies in mining engineering at the Polytechnic University of Mons (Belgium). Since 1982 at CBR, the Belgian subsidiary of Heidelberg Cement. Member of the Managing Board since 2000; in charge of the Group areas Western and Northern Europe (without Germany), Africa-Mediterranean Basin, and Group Services, as well as Environmental Sustainability.
Andreas KernBorn in Neckarsteinach (Germany), aged 53 years. Studies in business administration at the University of Mannheim (Germany). Since 1983 at HeidelbergCement. Member of the Managing Board since 2000; in charge of the Eastern Europe-Central Asia Group area and Germany, Sales and Marketing, and worldwide coordination of secondary cementitious materials.
Dr. Lorenz NägerBorn in Ravensburg (Germany), aged 51 years. Studies in business administration at the German universities Regensburg and Mannheim and in Swansea (UK). Since 2004, member of the Manag ing Board; in charge of Finance, Group Accounting, Controlling, Taxes, Insurance & Risk Management, IT, Shared Service Center, and Logistics.
Dr. Albert ScheuerBorn in Alsfeld (Germany), aged 54 years. Studies in mechanical engineering/process technology at the Clausthal University of Technology (Germany). Since 1992 at HeidelbergCement. Member of the Managing Board since 2007; in charge of the Asia-Pacific Group area and worldwide coordination of the Heidelberg Tech nology Center.
Com
bine
d m
anag
emen
t re
port
Cor
pora
te G
over
nanc
eC
onso
lidat
ed f
inan
cial
sta
tem
ents
Add
itio
nal i
nfor
mat
ion
To
our
shar
ehol
ders
2
3
4
5
1
Com
bine
d m
anag
emen
t re
port
Cor
pora
te G
over
nanc
eC
onso
lidat
ed f
inan
cial
sta
tem
ents
Add
itio
nal i
nfor
mat
ion
To
our
shar
ehol
ders
2
3
4
5
1
Con
ten
ts
1
30 HeidelbergCement | Annual Report 2011
HeidelbergCement in the capital market
Overview
In Germany, the HeidelbergCement share is listed for trading on the Prime Standard stock market segment of the Frankfurt Stock Exchange and on the Regulated Market of the Stuttgart, Düsseldorf, and Munich stock exchanges. The HeidelbergCement share is listed in the German benchmark index DAX, making HeidelbergCement the only company in the construction and building materials industry to be recognised as one of the 30 largest listed companies in Germany.
Our share ranks among the most important building materials shares in Europe. Besides the DAX, it is also included in other indices, such as the FTSEurofirst 300 Index, the S&P Global 1200 Index, and the Dow Jones Construction & Materials Titans 30 Index, which comprises the 30 largest construction shares and second-tier stocks in the world.
Development of the HeidelbergCement share
Driven by a steady improvement of economic indicators in the US, the HeidelbergCement share reached its highest level in 2011 on 18 February at €52.60. The disaster in Japan, the unrest in North Africa, and the ongoing debt crisis in the euro countries triggered a temporary share price correction in March. The comparably mild weather in Europe helped us to achieve a sig-nificant increase in sales volumes in the first quarter of 2011, which was received positively by the capital markets and contributed to the stable development of our share price. In the further course of the year, the dispute over the lifting of the US debt ceiling and the subsequent down-grading of the US rating, as well as the protracted talks over the effectiveness of a bailout fund in Europe, led to increasing uncertainty in the capital markets. High energy prices, which we could not offset fully by price increases, also put pressure on our profit margins in the second quarter. Following the weakening of the economy in Europe, the US, and China, share prices plummeted in summer. On 4 October 2011, the price of our share reached its lowest point, at €24.57. In the ensuing months, the economic indicators improved, particularly in the US, and some progress was made in resolving the euro crisis. The share indices subsequently recovered and our share price benefited above average from this trend. The HeidelbergCement share closed at €32.79 at the end of 2011.
Overall, the price of our share fell by 30.1%, having been adversely affected in the course of the year by the debt crisis in the euro zone, increased energy costs, and a deterioration of the economic indicators in Europe, China, and the US. The global industry index, the MSCI World Construction Materials Index, weakened by 23.1%. The DAX also recorded considerable losses in the course of the year and closed 14.7% lower. At the end of 2011, HeidelbergCement’s market capitalisation amounted to €6.1 billion, considerably below the previous year’s value of €8.8 billion.

31HeidelbergCement | Annual Report 2011
To ouR SHAREHoLDERS
Letter to the shareholders Managing Board
Report of the Supervisory Board HeidelbergCement in the capital market
Jan Feb Mar Apr May Jun Jul Aug Sep Oct Nov Dec
120
110
100
90
80
70
60
50
HeidelbergCement share MSCI World Construction Materials Index DAX
Development of the HeidelbergCement share compared to MSCI World Construction Materials Index and DAX in 2011
Index (Base: 31 December 2010 = 100)
€55
€50
€45
€40
€35
€30
€25
€20Jan Feb Mar Apr May Jun Jul Aug Sep Oct Nov Dec
Performance of the HeidelbergCement share in 2011
Development of the HeidelbergCement share (ISIN DE0006047004, WKN 604700)
€ 2011
Year-end share price 2010 46.90
Highest share price 52.60
Lowest share price 24.57
Year-end share price 2011 32.79
Shareholders’ equity per share on 31 Dec. 2011 72.37
Market value on 31 Dec. 2011 (€ ’000s) 6,148,125
Change compared with 31 Dec. 2010
HeidelbergCement share -30.1%
DAX -14.7%
MSCI World Construction Materials Index -23.1%
Com
bine
d m
anag
emen
t re
port
Cor
pora
te G
over
nanc
eC
onso
lidat
ed f
inan
cial
sta
tem
ents
Add
itio
nal i
nfor
mat
ion
To
our
shar
ehol
ders
2
3
4
5
1
Com
bine
d m
anag
emen
t re
port
Cor
pora
te G
over
nanc
eC
onso
lidat
ed f
inan
cial
sta
tem
ents
Add
itio
nal i
nfor
mat
ion
To
our
shar
ehol
ders
2
3
4
5
1
Con
ten
ts
1
32 HeidelbergCement | Annual Report 2011
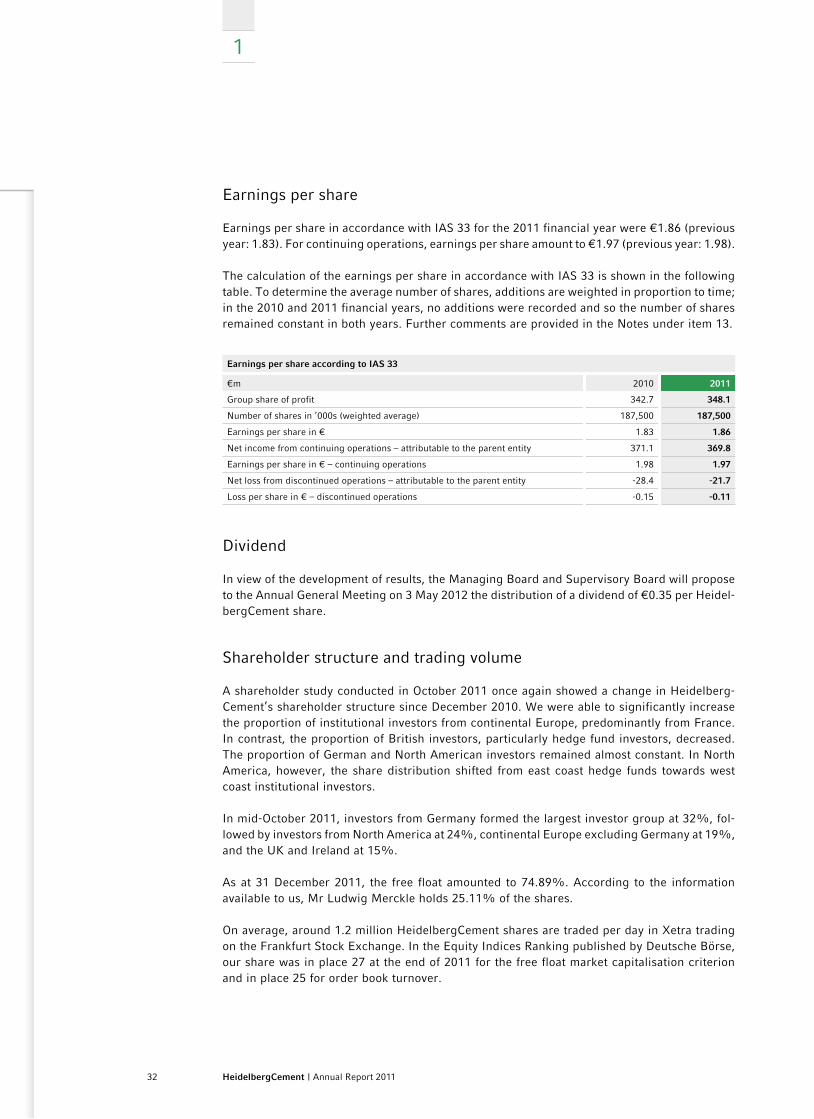
Earnings per share
Earnings per share in accordance with IAS 33 for the 2011 financial year were €1.86 (previous year: 1.83). For continuing operations, earnings per share amount to €1.97 (previous year: 1.98).
The calculation of the earnings per share in accordance with IAS 33 is shown in the following table. To determine the average number of shares, additions are weighted in proportion to time; in the 2010 and 2011 financial years, no additions were recorded and so the number of shares remained constant in both years. Further comments are provided in the Notes under item 13.
Earnings per share according to IAS 33
€m 2010 2011
Group share of profit 342.7 348.1
Number of shares in ’000s (weighted average) 187,500 187,500
Earnings per share in € 1.83 1.86
Net income from continuing operations – attributable to the parent entity 371.1 369.8
Earnings per share in € – continuing operations 1.98 1.97
Net loss from discontinued operations – attributable to the parent entity -28.4 -21.7
Loss per share in € – discontinued operations -0.15 -0.11
Dividend
In view of the development of results, the Managing Board and Supervisory Board will propose to the Annual General Meeting on 3 May 2012 the distribution of a dividend of €0.35 per Heidel-bergCement share.
Shareholder structure and trading volume
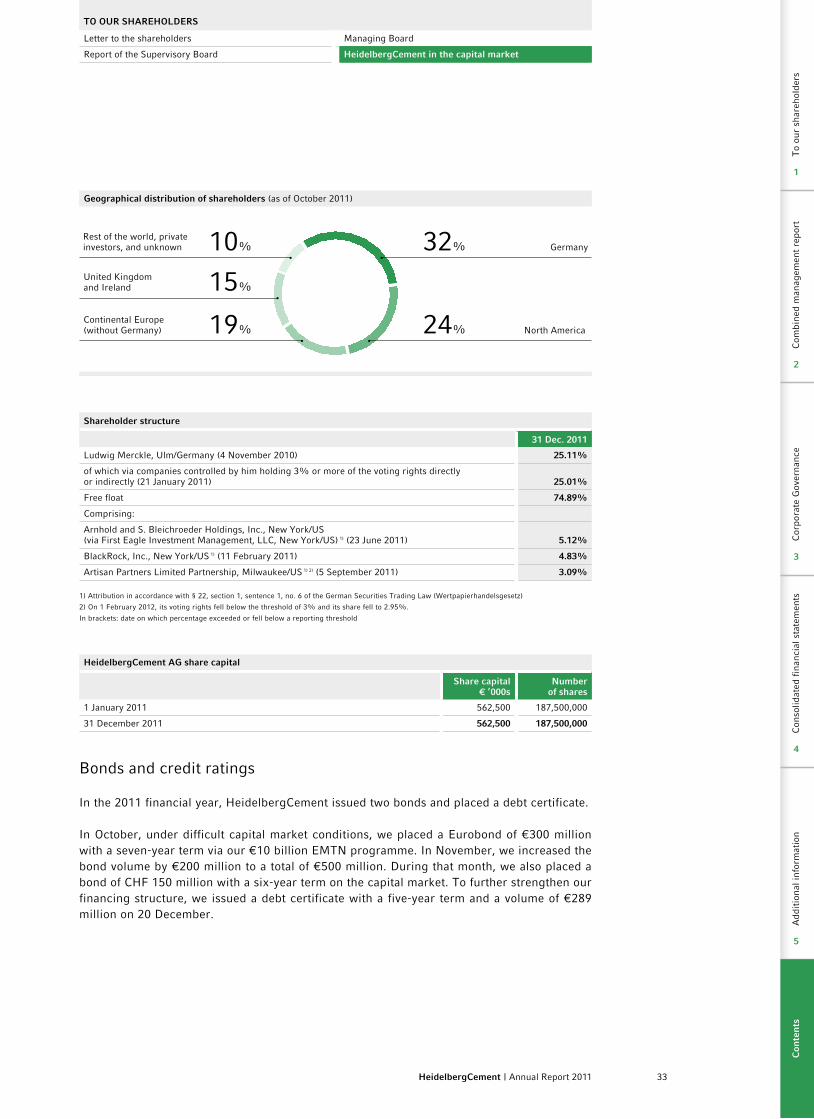
A shareholder study conducted in October 2011 once again showed a change in Heidelberg-Cement’s shareholder structure since December 2010. We were able to significantly increase the proportion of institutional investors from continental Europe, predominantly from France. In contrast, the proportion of British investors, particularly hedge fund investors, decreased. The proportion of German and North American investors remained almost constant. In North America, however, the share distribution shifted from east coast hedge funds towards west coast institutional investors.
In mid-October 2011, investors from Germany formed the largest investor group at 32%, fol-lowed by investors from North America at 24%, continental Europe excluding Germany at 19%, and the UK and Ireland at 15%.
As at 31 December 2011, the free float amounted to 74.89%. According to the information available to us, Mr Ludwig Merckle holds 25.11% of the shares.
On average, around 1.2 million HeidelbergCement shares are traded per day in Xetra trading on the Frankfurt Stock Exchange. In the Equity Indices Ranking published by Deutsche Börse, our share was in place 27 at the end of 2011 for the free float market capitalisation criterion and in place 25 for order book turnover.
33HeidelbergCement | Annual Report 2011
Geographical distribution of shareholders (as of October 2011)
15%
Continental Europe(without Germany)
United Kingdomand Ireland
19%
Germany32%Rest of the world, private investors, and unknown 10%
North America24%
Shareholder structure
31 Dec. 2011
Ludwig Merckle, Ulm/Germany (4 November 2010) 25.11%
of which via companies controlled by him holding 3% or more of the voting rights directly or indirectly (21 January 2011) 25.01%
Free float 74.89%
Comprising:
Arnhold and S. Bleichroeder Holdings, Inc., New York/US (via First Eagle Investment Management, LLC, New York/US) 1) (23 June 2011) 5.12%
BlackRock, Inc., New York/US 1) (11 February 2011) 4.83%
Artisan Partners Limited Partnership, Milwaukee/US 1) 2) (5 September 2011) 3.09%
1) Attribution in accordance with § 22, section 1, sentence 1, no. 6 of the German Securities Trading Law (Wertpapierhandelsgesetz)
2) On 1 February 2012, its voting rights fell below the threshold of 3% and its share fell to 2.95%.
In brackets: date on which percentage exceeded or fell below a reporting threshold
HeidelbergCement AG share capital
Share capital€ ’000s
Numberof shares
1 January 2011 562,500 187,500,000
31 December 2011 562,500 187,500,000
Bonds and credit ratings
In the 2011 financial year, HeidelbergCement issued two bonds and placed a debt certificate.
In October, under difficult capital market conditions, we placed a Eurobond of €300 million with a seven-year term via our €10 billion EMTN programme. In November, we increased the bond volume by €200 million to a total of €500 million. During that month, we also placed a bond of CHF 150 million with a six-year term on the capital market. To further strengthen our financing structure, we issued a debt certificate with a five-year term and a volume of €289 million on 20 December.
To ouR SHAREHoLDERS
Letter to the shareholders Managing Board
Report of the Supervisory Board HeidelbergCement in the capital market
Com
bine
d m
anag
emen
t re
port
Cor
pora
te G
over
nanc
eC
onso
lidat
ed f
inan
cial
sta
tem
ents
Add
itio
nal i
nfor
mat
ion
To
our
shar
ehol
ders
2
3
4
5
1
Com
bine
d m
anag
emen
t re
port
Cor
pora
te G
over
nanc
eC
onso
lidat
ed f
inan
cial
sta
tem
ents
Add
itio
nal i
nfor
mat
ion
To
our
shar
ehol
ders
2
3
4
5
1
Con
ten
ts
1
34 HeidelbergCement | Annual Report 2011
1
The bonds and debt certificate are unsecured and rank pari passu with all other capital market debt. Further information on the bonds issued by HeidelbergCement can be found in the Group financial management section on page 66 f.
HeidelbergCement’s credit quality is assessed by the leading international rating agencies Standard & Poor’s, Moody’s Investors Service, and Fitch Ratings. In the 2011 financial year, the successful continuation of our efforts to consistently reduce net debt resulted in our credit rating being further upgraded by the rating agencies. The ratings are BB/B/Outlook Stable from Standard & Poor’s, Ba1/Not Prime/Outlook Stable from Moody’s Investors Service, and BB+/B/Outlook Stable from Fitch Ratings. Further information on HeidelbergCement’s rating and its development can be found in the Group financial management section on page 69 f.
Investor Relations
In 2011, we intensified our investor relations work and increased the number of financial centers visited worldwide. The main tasks of our investor relations work were to broaden the geographical spread of the shareholder structure and to increase the proportion of long-term investors. These activities focused on making contact with previously uninvolved investors on the west coast of the US. By directly addressing institutional investors through road shows and conferences, particularly in the financial centers of Germany, the US, the UK, and continental Europe, we succeeded in diversifying the shareholder base further and attracting long-term oriented investors as shareholders.
In September 2011, 27 analysts responded to our invitation to attend a presentation and discus-sion forum in London. At this event, the Managing Board gave a short overview of the Group’s operational and financial position in the face of the uncertain general economic situation. The presentations shown during this event and at other visits and conferences, where they contain significant changes from previous presentations, are available on the Internet. Through dis-cussions with analysts, we supported coverage by additional banks. The number of analysts regularly reporting on HeidelbergCement has further increased to 40 since the publication of the last annual report.
As in the previous year, we conducted a survey among selected international investors and analysts at the end of 2011 to determine their opinions and expectations of our Group, and also asked them to assess the performance of the investor relations team. Once again, the results are being incorporated into the ongoing development of our investor relations work this year, with the aim of successfully continuing open dialogue and transparent communication with the capital market and further strengthening trust in our Group and our share.
35HeidelbergCement | Annual Report 2011
Contact us
HeidelbergCement AGGroup Communication & Investor RelationsBerliner Strasse 669120 Heidelberg Germany
Phone:
Institutional investors US and UK (Ozan Kacar): + 49 (0) 6221 481 - 13925 Institutional investors EU and rest of the world (Steffen Schebesta, CFA): + 49 (0) 6221 481 - 39568 Private investors (Günter Wesch): + 49 (0) 6221 481 - 13256 Department Head (Andreas Schaller): + 49 (0) 6221 481 - 13249 Fax: + 49 (0) 6221 481 - 13217 E-mail: [email protected]
To ouR SHAREHoLDERS
Letter to the shareholders Managing Board
Report of the Supervisory Board HeidelbergCement in the capital market
Com
bine
d m
anag
emen
t re
port
Cor
pora
te G
over
nanc
eC
onso
lidat
ed f
inan
cial
sta
tem
ents
Add
itio
nal i
nfor
mat
ion
To
our
shar
ehol
ders
2
3
4
5
1
Com
bine
d m
anag
emen
t re
port
Cor
pora
te G
over
nanc
eC
onso
lidat
ed f
inan
cial
sta
tem
ents
Add
itio
nal i
nfor
mat
ion
To
our
shar
ehol
ders
2
3
4
5
1
Con
ten
ts
36 HeidelbergCement | Annual Report 2011
Combined management report of Heidelberg Cement Group and HeidelbergCement AG
2
37HeidelbergCement | Annual Report 2011
Core activities and organisational structure 38 Strategy, management control, and targets 39 2011 business trend 42Economic environment 42Development of sales volumes and revenue 44Earnings position 45Business trend in the Group areas 47Discontinued operations 61Statement of cash flows 61Investments 63Consolidated balance sheet 64Group financial management 66Results of operations, asset positions, and financial performance of HeidelbergCement AG 70Evaluation of the economic situation by Group management 72Comparison of the business trend with the previous year’s forecasts 72 Additional statements 74 Risk report 80 Sustainability 95 Employees and society 96 Environmental precaution 104 Research and technology 106 Procurement 112 outlook 113 Corporate Governance 124
Due to rounding, numbers presented in the Annual Report may not add up precisely to the totals provided.
Com
bine
d m
anag
emen
t re
port
Cor
pora
te G
over
nanc
eC
onso
lidat
ed f
inan
cial
sta
tem
ents
Add
itio
nal i
nfor
mat
ion
2
3
4
5
Com
bine
d m
anag
emen
t re
port
Cor
pora
te G
over
nanc
eC
onso
lidat
ed f
inan
cial
sta
tem
ents
Add
itio
nal i
nfor
mat
ion
To
our
shar
ehol
ders
2
3
4
5
1
Con
ten
ts
2
38 HeidelbergCement | Annual Report 2011
Core activities and organisational structure
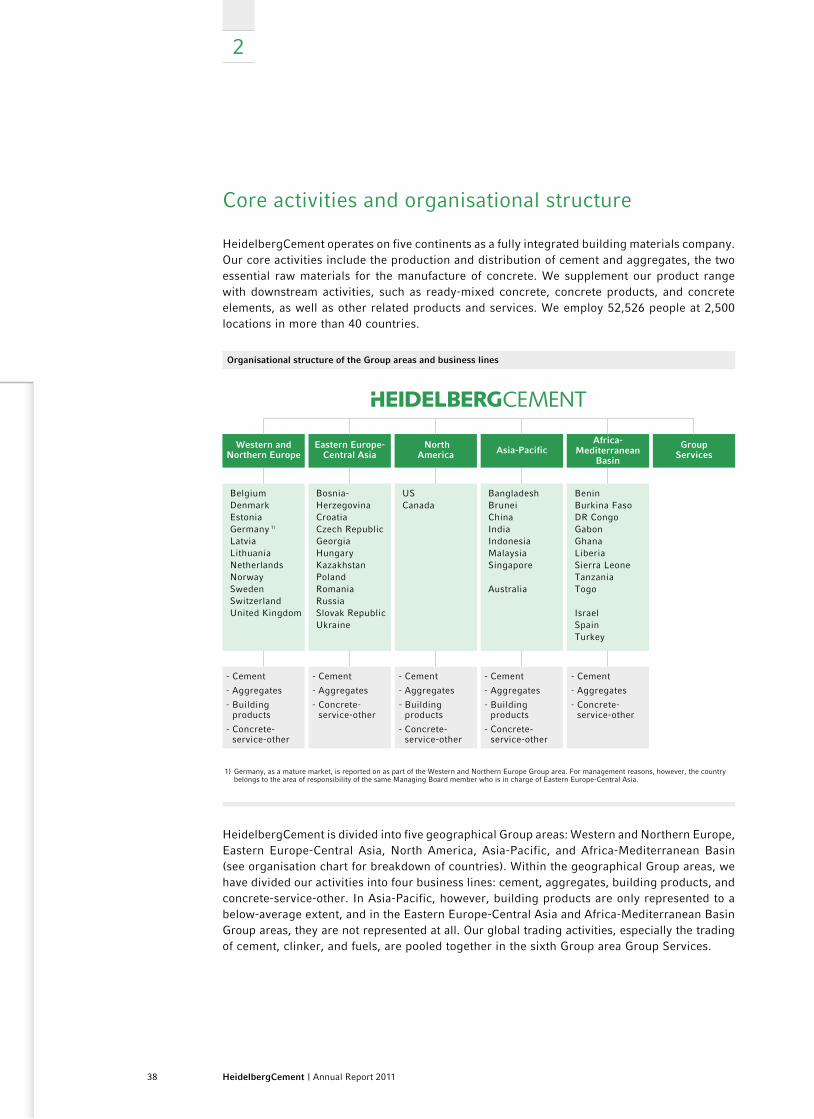
HeidelbergCement operates on five continents as a fully integrated building materials company. Our core activities include the production and distribution of cement and aggregates, the two essential raw materials for the manufacture of concrete. We supplement our product range with downstream activities, such as ready-mixed concrete, concrete products, and concrete elements, as well as other related products and services. We employ 52,526 people at 2,500 locations in more than 40 countries.
organisational structure of the Group areas and business lines
1) Germany, as a mature market, is reported on as part of the Western and Northern Europe Group area. For management reasons, however, the country belongs to the area of responsibility of the same Managing Board member who is in charge of Eastern Europe-Central Asia.
Western and Northern Europe
Eastern Europe- Central Asia
North America Asia-Pacific
Africa-Mediterranean
Basin
Group Services
Belgium Denmark EstoniaGermany 1) Latvia Lithuania Netherlands Norway Sweden Switzerland United Kingdom
Bosnia-Herzegovina Croatia Czech Republic Georgia HungaryKazakhstan Poland Romania Russia Slovak Republic Ukraine
US Canada
Bangladesh Brunei China India Indonesia MalaysiaSingapore
Australia
BeninBurkina FasoDR Congo Gabon Ghana Liberia Sierra Leone Tanzania Togo
Israel Spain Turkey
- Cement
- Aggregates
- Building products
- Concrete- service-other
- Cement
- Aggregates
- Building products
- Concrete- service-other
- Cement
- Aggregates
- Building products
- Concrete- service-other
- Cement
- Aggregates
- Concrete- service-other
- Cement
- Aggregates
- Concrete- service-other
HeidelbergCement is divided into five geographical Group areas: Western and Northern Europe, Eastern Europe-Central Asia, North America, Asia-Pacific, and Africa-Mediterranean Basin (see organisation chart for breakdown of countries). Within the geographical Group areas, we have divided our activities into four business lines: cement, aggregates, building products, and concrete-service-other. In Asia-Pacific, however, building products are only represented to a below-average extent, and in the Eastern Europe-Central Asia and Africa-Mediterranean Basin Group areas, they are not represented at all. Our global trading activities, especially the trading of cement, clinker, and fuels, are pooled together in the sixth Group area Group Services.
39HeidelbergCement | Annual Report 2011
Strategy, management control, and targets
Strategy
Dual growth strategyCement and aggregates form the basis of our dual resource and growth strategy. In cement, the focus is on growth markets. As more and more countries industrialise, we are working to secure raw materials resources and increase diversification in the aggregates business, as well as concentrating on vertical integration through investments in ready-mixed concrete in mature markets. The focus is on growth pockets characterised by higher rates of expansion than their surrounding regions. The expansion can be achieved organically, through partnerships, or acquisitions.
Performance culture and local responsibilityAn excellent management team and dedicated, qualified employees are the source of our busi-ness success. As a company with a focus on performance and results, we greatly value the competence of our employees and management. The focus is on comprehensive efficiency and clear customer-orientation. HeidelbergCement pursues an integrated management approach, the success of which is based on a balance between local operational responsibility, Group-wide standards, and global leadership. Our local operations are key for the success of our business. Local management bears full responsibility for production, market and management development, with the aim of market and cost leadership. They are supported by nationwide shared service centers, which handle administration for all business lines on the basis of a standardised IT infra-structure. In order to ensure transparency, efficiency, and rapid implementation of measures throughout the Group, HeidelbergCement has standardised all important management processes. Group-wide, uniform KPIs facilitate direct comparability and provide a foundation for continual benchmarking.
Cost leadership and benchmarkingIn a market with largely standardised products, cost leadership is a key factor for success. In addition to our consistent focus on cost cutting programmes, emphasis is placed on continual improvement of operational performance at individual production sites. We engage in intensive benchmarking both internally and in relation to competitors, in order to identify optimisation potentials. When it comes to investment, we also aim to keep costs as low as possible through a combination of HeidelbergCement engineering and low-cost suppliers worldwide for machines, equipment, and services.
Sustainability assures long-term commercial successWe build our long-term success on sustainable business practices. This includes securing access to raw materials reserves with adequate lifetimes and introducing innovative production processes. Alongside the use of alternative raw materials and fuels, and the development of new products, this leads to emission reductions and conservation-oriented handling of our raw materials base. HeidelbergCement is also active in the promotion of biodiversity at its extraction sites, through targeted implementation of biodiversity management plans, partnerships with international and national environmental organisations, as well as organising the international “Quarry Life Award” competition.
CoMBINED MANAGEMENT REPoRT
Core activities and organisational structure Sustainability
Strategy, management control, and targets Employees and society
2011 business trend Environmental precaution
Additional statements Research and technology
Risk report Procurement | Outlook
Com
bine
d m
anag
emen
t re
port
Cor
pora
te G
over
nanc
eC
onso
lidat
ed f
inan
cial
sta
tem
ents
Add
itio
nal i
nfor
mat
ion
2
3
4
5
Com
bine
d m
anag
emen
t re
port
Cor
pora
te G
over
nanc
eC
onso
lidat
ed f
inan
cial
sta
tem
ents
Add
itio
nal i
nfor
mat
ion
To
our
shar
ehol
ders
2
3
4
5
1
Con
ten
ts

2
40 HeidelbergCement | Annual Report 2011
Financing strategyFor information on financial management-related targets and policies, please refer to the section Group financial management on page 66 f.
Internal management control and targets
The internal management control system at HeidelbergCement is based primarily on annual operational planning, ongoing management accounting and control, quarterly management meetings, central coordination of investment processes, as well as regular Managing Board meetings and reporting to the Supervisory Board.
Annual planning takes the form of top-down/bottom-up planning, under which the Managing Board first defines a top-down budget on the basis of macroeconomic analyses, its assessment of market conditions and cost targets. From this, specific targets are derived for individual operat-ing units, which are used as the basis of detailed planning for the individual units and setting of targets with local management. The individual operational plans created by the operating units are then consolidated centrally to create the Group-wide plan.
Ongoing management accounting and control of the company is carried out using a com-prehensive system of standardised reports on the Group’s net assets, financial performance, and results of operations. The indicators used for this purpose are determined and presented uniformly throughout the Group. Reports on financial status and selected sales volumes and production overviews are prepared weekly. In order to underline the necessity of increased and more detailed monitoring of cash flow as a key management indicator for the company, monthly reporting on results of operations and developments in working capital was expanded in 2011 to include detailed cash flow reporting. Detailed reports on the assets positions are submitted at the end of each quarter. In 2011, internal quarterly reporting also grew in scope to include detailed tax reporting. At the quarterly management meetings, the Management Board and country managers discuss business developments, including target achievement, along with the outlook for the relevant year and any measures that need to be taken.
Central departments in the areas of strategy, finance, and technology follow a formalised pro-cess to review and assess all major investments and acquisitions. This ensures comparability between different projects and consistent high quality in investment decision making. Invest-ments in expansion are assessed using a discounted cash flow (DCF) model. The standard is that investment projects must generate at least enough income to cover their weighted average cost of capital (WACC). This long-term approach to investment returns is supported by simulated calculations that show the impact of an investment on the income statement, statement of cash flows, balance sheet, and taxes over a period of five years.
The financial analysis is complemented by a strategic analysis of the planned investments. Here, the strategic value of an investment is determined taking into account the expected market posi-tion, growth potential, synergies with other Group units, and the risk structure. The overall result of these analyses is the criterion by which the Managing Board makes its investment decisions.
41HeidelbergCement | Annual Report 2011
Financial targets and management indicators
Earnings, capital expenditure, and return on capitalThe most important short-term indicator of the company’s earnings strength is operating in-come, which is determined in detail and analysed for all operating units. The decisive indicator at Group level is Group share of profit. The financial and assets positions of the operating units are monitored short-term primarily via the amount of working capital and investment. Fixed targets are agreed with all operating units for each indicator.
The company uses return on capital employed (ROCE) at operational level and return on invested capital (ROIC) at strategic level for medium-term management control and capital allocation. ROCE is calculated as the ratio of invested capital to EBIT (earnings before interest and taxes). Taxes and goodwill are not taken into account for calculation. These are strategic-level indica-tors, and are therefore taken into account for determination of ROIC. Strategic management and capital allocation are based on ROIC, which is defined as the ratio of earnings before interest but after tax to the sum of shareholders’ equity and interest-bearing liabilities.
The target is generation of ROCE between 19% and 20% and ROIC at least equivalent to weighted average cost of capital (WACC). HeidelbergCement’s weighted WACC totalled 7.8% at the end of the reporting year, and ranged between 6.4% and 15.4% in the individual countries. Please see page 65 for more information on capital efficiency.
Financing structureHeidelbergCement is determined to achieve an investment grade rating to ensure that we retain our high financial stability as a company that is sensitive to business cycles. Furthermore, invest-ment grade rating facilitates access to attractive and cost-effective funding opportunities. To achieve this goal, we are focussing on the financial indicators most watched by rating agencies. An important indicator is the dynamic debt ratio, i.e. the ratio of net debt to operating income before depreciation, which we intend to lower to less than 2.8x. By the end of 2011, we had succeeded in lowering this ratio to 3.3x, as compared to 3.6x at the end of 2010.
Non-financial targets and sustainable performance indicatorsFurther information on non-financial performance figures is available in the chapters Sustain-ability, Employees and society, and Environmental precaution.
Lead indicatorsHeidelbergCement’s core business is in standardised mass products that are generally ordered at short notice. For the most part, suppliers of such products are interchangeable from a customer standpoint. Moreover, the volume of construction activity – and thus sales volumes of building materials – are dependent on local weather conditions in the respective markets. Given this market constellation, no reliable lead indicators are definable for business forecasting. How-ever, selected statistical data and industry association forecasts can be utilised to gauge the business outlook at country level. In mature markets, for instance, figures on building permits or infrastructure budgets serve as important sources of information. In emerging markets, data on population growth and GDP growth forecasts are frequently used indicators.
CoMBINED MANAGEMENT REPoRT
Core activities and organisational structure Sustainability
Strategy, management control, and targets Employees and society
2011 business trend Environmental precaution
Additional statements Research and technology
Risk report Procurement | Outlook
Com
bine
d m
anag
emen
t re
port
Cor
pora
te G
over
nanc
eC
onso
lidat
ed f
inan
cial
sta
tem
ents
Add
itio
nal i
nfor
mat
ion
2
3
4
5
Com
bine
d m
anag
emen
t re
port
Cor
pora
te G
over
nanc
eC
onso
lidat
ed f
inan
cial
sta
tem
ents
Add
itio
nal i
nfor
mat
ion
To
our
shar
ehol
ders
2
3
4
5
1
Con
ten
ts

2
42 HeidelbergCement | Annual Report 2011
2011 business trend
Economic environment
General economic conditionsAs expected, 2011 was characterised by a worldwide slowdown in economic growth, which resulted – among others – from cost-saving measures connected with budgetary consolidation in some industrialised European countries and a growth dip in the first half of the year in the US. In addition, economic growth cooled slightly in comparison with the previous year in the two most populated countries, China and India, but still remained at a significantly higher level overall than the average for the emerging countries. In Eastern Europe, growth rates in some countries increased further in comparison with the previous year. Although economic growth in Germany slightly declined, it was twice as high as the average for the industrialised countries, at 3%.
During the course of the year, the financial markets appeared increasingly uncertain as to whether the debt crisis would be tackled effectively in the US and Europe without any unmanageable consequences being triggered. As a result, the credit rating of some countries – for instance the US and France – was downgraded. As part of the efforts to combat the economic crisis, central banks in the US and Europe systematically pursued their low interest rate policy and supported the banking sector by providing liquidity. According to the IMF, the global economy grew by 3.8% in 2011, following an increase of 5.2% in the previous year.
Real GDP growth rate in major Group countries
in % 2010 2011 1) in % 2010 2011 1)
Western and Northern Europe Asia-Pacific
Belgium 2.3 1.9 Australia 2.6 2.3
Germany 3.6 3.0 Bangladesh *) 6.4 6.3
Netherlands 1.7 1.2 China 10.4 9.2
Norway 0.7 1.6 India 9.6 7.3
Sweden 6.1 3.9 Indonesia 6.1 6.5
UK 2.1 0.8 Malaysia 7.2 5.0
Eastern Europe-Central Asia Africa-Mediterranean Basin
Czech Republic 2.6 1.8 DR Congo *) 7.2 6.5
Hungary 1.2 1.4 Ghana *) 7.7 13.5
Kazakhstan 7.0 6.3 Tanzania *) 6.4 6.1
Poland 3.9 4.3 Togo *) 3.7 3.8
Romania -1.3 2.1 Israel 4.8 4.8
Russia 4.0 4.3 Spain -0.1 0.7
Ukraine 4.2 4.7 Turkey 8.9 7.0
North America
US 3.0 1.7
Canada 3.2 2.5
Source: Deutsche Bank Research and *) CIA World Factbook Estimates
1) 2011 values are based on estimations and forecasts.
As a result of the strong economic growth in 2010, the prices of raw materials, precious metals, and energy underwent a further significant increase at the start of 2011, reaching their annual high in the first half of the year. The energy price rise was exacerbated as a consequence of
43HeidelbergCement | Annual Report 2011
the reactor disaster in Fukushima in March 2011 and the adjustment of national coal prices in India and Indonesia to the international level. In mid-2011, the European Central Bank raised its interest rate in two stages, as a reaction to the inflationary trends, although this increase was reversed in the second half of the year, with signs of an economic weakening in Europe as a result of the debt crisis. Prices of fuel and energy fell as a result of the cooling of economic growth in the second half of 2011.
Industry-specific conditionsThe construction industry experienced varied regional development in 2011. According to its projection from November 2011, the European market research network Euroconstruct expects a clear bifurcation of construction activity in Europe in 2011. In the countries of Southern Europe, as well as Ireland, affected by the bursting of the housing bubble or the debt crisis, a significant decline in construction activity is anticipated. In contrast, in the other European countries, particularly in Germany, the Benelux countries, and Scandinavia, considerable growth is expected in some areas as a result of the revival of economic activity in 2010. In Germany, construction investments rose by 5.4% in comparison with the previous year, and thus by a significantly higher margin than gross domestic product (+3%). In the US, construction invest-ments rose substantially again at the end of the year. For the whole of 2011, the national cement association Portland Cement Association (PCA) reports an increase of 2.9% in comparison with 2010. Gross domestic product rose by 1.7% in the same period. In Asia, construction activity continued to increase. For example, in Indonesia, our largest Asian market, demand for cement grew by 17.7%, i.e. considerably more strongly than gross domestic product, which increased by 6.5%. This was a consequence of the sustained high demand in the residential construction sector, which was strengthened further by the start of infrastructural projects.
Demand for building materials depends on the development of construction investments. The significant recovery of construction activity in most industrialised countries in 2011 resulted from late-cycle investment in commercial construction, as well as other factors. During a period of economic recovery, office, storage, and sales space that has become vacant as a result of the crisis has to be filled before companies are ready to build and expand. In the US, the growth in commercial construction amounted to 9.3%. In Germany, commercial construction benefited from the significant economic recovery, increasing by 6.6% in 2011.
Some industrialised countries, particularly the US and Spain, are still suffering from a consider-able surplus of housing, which is adversely affecting the prices of houses and apartments. High unemployment is also affecting the demand for houses and apartments. Residential construction in the US recovered slightly in 2011. The PCA reports an increase of 5.8% in residential con-struction investments, driven primarily by the demand for multifamily buildings. In Germany, residential construction investments grew by as much as 5.9% after another significant increase in residential construction approvals in the previous year.
In the area of building construction and civil engineering, demand for building materials was stimulated in some countries in recent years – for example, the US, Germany, and China – as a result of state-funded infrastructural measures. Some of this funding was discontinued in 2011 or will soon come to an end. Investments in infrastructural projects also decreased accordingly. In Germany, for example, investments in public building construction fell by 4.9%, while public construction declined by 4.4% in the US.
Like the construction industry, building materials markets also showed regionally inconsistent trends in 2011. Global cement consumption rose by around 7%. However, excluding China – responsible for more than half the world’s cement consumption – it only rose by around 3.7%.
CoMBINED MANAGEMENT REPoRT
Core activities and organisational structure Sustainability
Strategy, management control, and targets Employees and society
2011 business trend Environmental precaution
Additional statements Research and technology
Risk report Procurement | Outlook
Com
bine
d m
anag
emen
t re
port
Cor
pora
te G
over
nanc
eC
onso
lidat
ed f
inan
cial
sta
tem
ents
Add
itio
nal i
nfor
mat
ion
2
3
4
5
Com
bine
d m
anag
emen
t re
port
Cor
pora
te G
over
nanc
eC
onso
lidat
ed f
inan
cial
sta
tem
ents
Add
itio
nal i
nfor
mat
ion
To
our
shar
ehol
ders
2
3
4
5
1
Con
ten
ts
2
44 HeidelbergCement | Annual Report 2011
The strong increases in some emerging countries were offset by much lower growth rates in the industrialised countries. In China, for example, cement consumption is thought to have risen by around 10%; Indonesia recorded an increase of 17.7% in demand, while India’s growth was below expectations at around 6%. In Eastern Europe, there was a significant rise in cement consumption in Poland (21%) and the Ukraine (11%) in connection with construction activity for the European Football Championship. Thanks to the recovering economy, demand for cement in Russia increased by 11%. Construction activity in Western, Northern, and Eastern Europe was boosted by the mild winter weather at the beginning and end of 2011. A real economic boom in Germany resulted in an increase of 13% in cement consumption. In the UK, the growth rate was higher than expected, at 7.3%. In the US, cement consumption rose by 2.8%, also due to mild winter weather at the end or the year.
Development of sales volumes and revenue
The sales volumes and revenue for 2011 showed significant improvement compared with the previous year. They reflect the sustained positive development in HeidelbergCement’s growing markets, such as Africa and Asia, and the continuing recovery in most Group countries in Europe and North America after the crisis passed through its lowest point in 2010.
In 2011, cement and clinker sales volumes rose significantly in comparison with the previous year, by 12.0% to 87.8 million tonnes (previous year: 78.4); excluding consolidation effects, the increase amounted to 10.2%. All Group areas contributed to this growth. The growth in sales volumes in Eastern Europe-Central Asia and Western and Northern Europe was particu-larly marked because of the continued economic recovery and the mild winter weather at the beginning and end of the year.
At 254.1 million tonnes (previous year: 239.7), we sold 6.0% more aggregates Group-wide in 2011 than in the previous year. The increases in Western and Northern Europe and Asia-Pacific were particularly pleasing, with sales volumes rising by more than 10% in both areas. In North America, a considerable recovery in demand in the second half of the year more than compen-sated for the sales decline in the first half of the year, with slight growth recorded overall. The sustained decline in deliveries in Spain also slightly lowered the total aggregates sales volumes of the Africa-Mediterranean Basin Group area.
Asphalt sales volumes increased by 4.9% to 9.5 million tonnes (previous year: 9.1). The decline in quantities in North America, due to dwindling investments in infrastructural projects, was more than offset by an increase in deliveries in the other Group areas in which we operate asphalt activities.
At 39.1 million cubic metres (previous year: 35.0), our ready-mixed concrete sales volumes were significantly above the previous year’s level. Like in the cement business line, the strongest increases in sales volumes were achieved in the Eastern Europe-Central Asia and Western and Northern Europe Group areas. However, percentage growth rates in Asia-Pacific were also in double figures. In the other two Group areas, sales volumes rose slightly.
Overall, Group revenue increased by 9.7% to €12,902 million (previous year: 11,762). Exclud-ing exchange rate and consolidation effects, revenue increased by as much as 10.7%. The weakening of the US dollar and related currencies in Africa against the euro contributed to a decrease of €200 million in revenue.
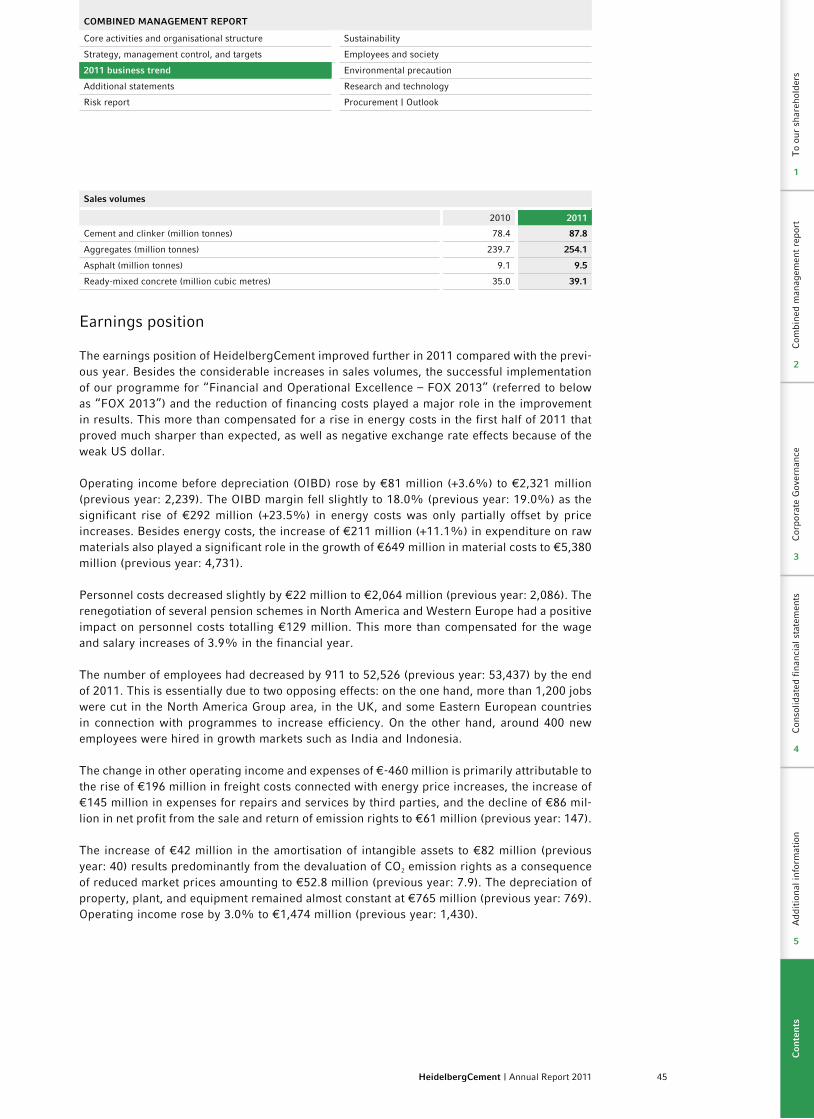
45HeidelbergCement | Annual Report 2011
Sales volumes
2010 2011
Cement and clinker (million tonnes) 78.4 87.8
Aggregates (million tonnes) 239.7 254.1
Asphalt (million tonnes) 9.1 9.5
Ready-mixed concrete (million cubic metres) 35.0 39.1
Earnings position
The earnings position of HeidelbergCement improved further in 2011 compared with the previ-ous year. Besides the considerable increases in sales volumes, the successful implementation of our programme for “Financial and Operational Excellence – FOX 2013” (referred to below as “FOX 2013”) and the reduction of financing costs played a major role in the improvement in results. This more than compensated for a rise in energy costs in the first half of 2011 that proved much sharper than expected, as well as negative exchange rate effects because of the weak US dollar.
Operating income before depreciation (OIBD) rose by €81 million (+3.6%) to €2,321 million (previous year: 2,239). The OIBD margin fell slightly to 18.0% (previous year: 19.0%) as the significant rise of €292 million (+23.5%) in energy costs was only partially offset by price increases. Besides energy costs, the increase of €211 million (+11.1%) in expenditure on raw materials also played a significant role in the growth of €649 million in material costs to €5,380 million (previous year: 4,731).
Personnel costs decreased slightly by €22 million to €2,064 million (previous year: 2,086). The renegotiation of several pension schemes in North America and Western Europe had a positive impact on personnel costs totalling €129 million. This more than compensated for the wage and salary increases of 3.9% in the financial year.
The number of employees had decreased by 911 to 52,526 (previous year: 53,437) by the end of 2011. This is essentially due to two opposing effects: on the one hand, more than 1,200 jobs were cut in the North America Group area, in the UK, and some Eastern European countries in connection with programmes to increase efficiency. On the other hand, around 400 new employees were hired in growth markets such as India and Indonesia.
The change in other operating income and expenses of €-460 million is primarily attributable to the rise of €196 million in freight costs connected with energy price increases, the increase of €145 million in expenses for repairs and services by third parties, and the decline of €86 mil-lion in net profit from the sale and return of emission rights to €61 million (previous year: 147).
The increase of €42 million in the amortisation of intangible assets to €82 million (previous year: 40) results predominantly from the devaluation of CO2 emission rights as a consequence of reduced market prices amounting to €52.8 million (previous year: 7.9). The depreciation of property, plant, and equipment remained almost constant at €765 million (previous year: 769). Operating income rose by 3.0% to €1,474 million (previous year: 1,430).
CoMBINED MANAGEMENT REPoRT
Core activities and organisational structure Sustainability
Strategy, management control, and targets Employees and society
2011 business trend Environmental precaution
Additional statements Research and technology
Risk report Procurement | Outlook
Com
bine
d m
anag
emen
t re
port
Cor
pora
te G
over
nanc
eC
onso
lidat
ed f
inan
cial
sta
tem
ents
Add
itio
nal i
nfor
mat
ion
2
3
4
5
Com
bine
d m
anag
emen
t re
port
Cor
pora
te G
over
nanc
eC
onso
lidat
ed f
inan
cial
sta
tem
ents
Add
itio
nal i
nfor
mat
ion
To
our
shar
ehol
ders
2
3
4
5
1
Con
ten
ts
2
46 HeidelbergCement | Annual Report 2011
The additional ordinary result fell by €43 million to €-145 million (previous year: -102). This was mainly due to the increase of €37 million in non-cash impairment of goodwill and other fixed assets to €90 million (previous year: 53). Restructuring expenses remained almost unchanged at €48.3 million (previous year: 47.1).
The improvement of €43 million in the result from participations to €49 million (previous year: 6) is largely due to the rise of €16 million in results from associated companies, particularly in Germany and Belgium, as well as the decline of €27 million in impairment of participations.
Financial result improved by €152 million to €-582 million (previous year: -735). Interest ex-penses decreased by €41 million to €637 million (previous year: 677), largely as a result of the decline in net debt and better interest terms. Likewise, foreign exchange gains improved by €15 million to €3 million (previous year: -13). The improvement of €99 million in the other financial result to €-39 million (previous year: -138) relates primarily to the elimination of financing expenses of the previous year following the refinancing of the syndicated facility agreement, totalling €75 million.
The profit before tax from continuing operations increased to €794 million (previous year: 599).
Income taxes rose by €179 million to €238 million (previous year: 60). The increase of €25 mil-lion in current taxes to €313 million (previous year: 288) relates primarily to increased income taxes because of the improvements in results, particularly in Canada (up €19 million), Indonesia (up €13 million), and Poland (up €5 million), while the income taxes of the parent company Heidel berg Cement AG decreased, largely as a result of tax optimisation measures, a merger loss in the previous year that could not be recognised for tax purposes, and tax adjustments for previous years (down €31 million).
Deferred taxes fell by €154 million to €74 million (previous year: 229). This was largely due to the fact that, for the first time, losses carried forward were not recognised in the US, leading to a decline of €102 million in deferred taxes to €61 million (previous year: 163), and was also connected with utilised losses carried forward, particularly in Australia, amounting to €16 million.
Net income from continuing operations amounts to €556 million (previous year: 539). Net loss from discontinued operations amounting to €-22 million (previous year: -28) relates to expenses from the Hanson Group takeover in the 2007 financial year.
In total, profit for the financial year amounts to €534 million (previous year: 511). The increase of €18 million in profit attributable to non-controlling interests to €186 million (previous year: 168) is largely a consequence of the improvement in Indocement’s results. The Group share of profit therefore amounts to €348 million (previous year: 343).
Earnings per share – Group share – in accordance with IAS 33 increased to €1.86 (previous year: 1.83). For continuing operations, earnings per share amounts to €1.97 (previous year: 1.98).
In view of the development of results, the Managing Board and Supervisory Board will propose to the Annual General Meeting on 3 May 2012 the distribution of a dividend of €0.35 (previous year: 0.25) per share.
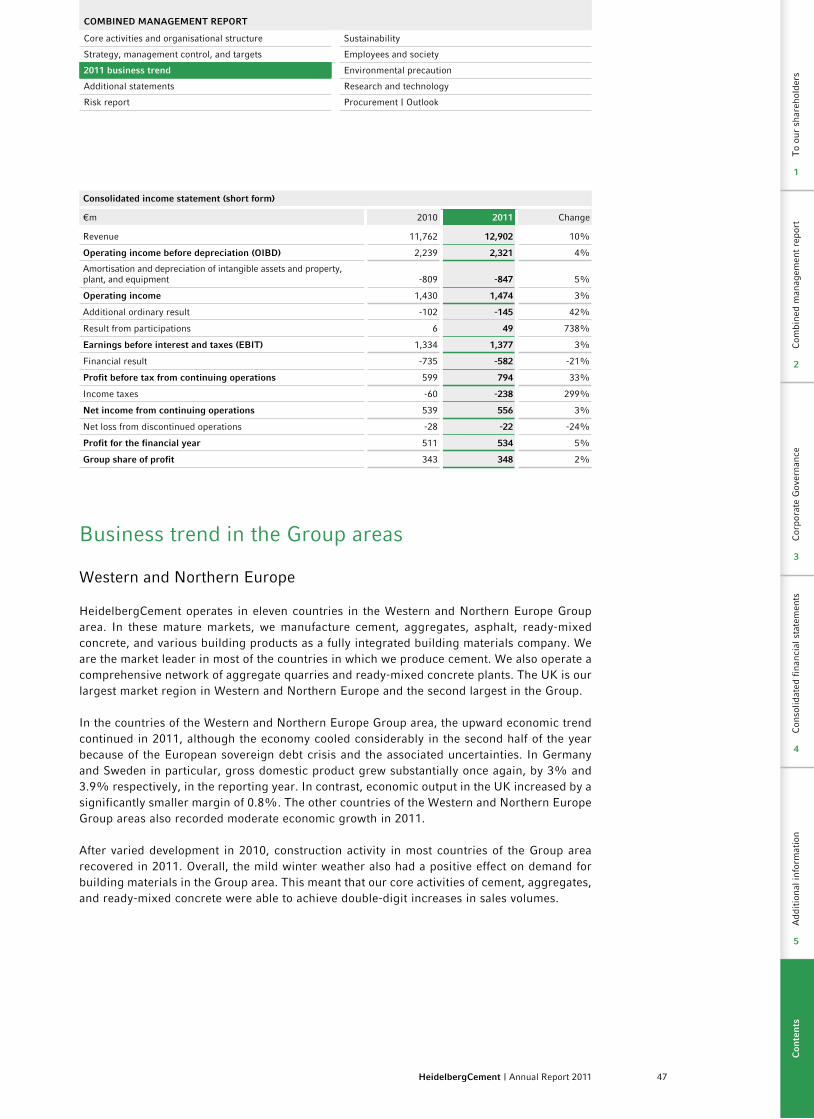
47HeidelbergCement | Annual Report 2011
Consolidated income statement (short form)
€m 2010 2011 Change
Revenue 11,762 12,902 10%
operating income before depreciation (oIBD) 2,239 2,321 4%
Amortisation and depreciation of intangible assets and property, plant, and equipment -809 -847 5%
operating income 1,430 1,474 3%
Additional ordinary result -102 -145 42%
Result from participations 6 49 738%
Earnings before interest and taxes (EBIT) 1,334 1,377 3%
Financial result -735 -582 -21%
Profit before tax from continuing operations 599 794 33%
Income taxes -60 -238 299%
Net income from continuing operations 539 556 3%
Net loss from discontinued operations -28 -22 -24%
Profit for the financial year 511 534 5%
Group share of profit 343 348 2%
Business trend in the Group areas
Western and Northern Europe
HeidelbergCement operates in eleven countries in the Western and Northern Europe Group area. In these mature markets, we manufacture cement, aggregates, asphalt, ready-mixed concrete, and various building products as a fully integrated building materials company. We are the market leader in most of the countries in which we produce cement. We also operate a comprehensive network of aggregate quarries and ready-mixed concrete plants. The UK is our largest market region in Western and Northern Europe and the second largest in the Group.
In the countries of the Western and Northern Europe Group area, the upward economic trend continued in 2011, although the economy cooled considerably in the second half of the year because of the European sovereign debt crisis and the associated uncertainties. In Germany and Sweden in particular, gross domestic product grew substantially once again, by 3% and 3.9% respectively, in the reporting year. In contrast, economic output in the UK increased by a significantly smaller margin of 0.8%. The other countries of the Western and Northern Europe Group areas also recorded moderate economic growth in 2011.
After varied development in 2010, construction activity in most countries of the Group area recovered in 2011. Overall, the mild winter weather also had a positive effect on demand for building materials in the Group area. This meant that our core activities of cement, aggregates, and ready-mixed concrete were able to achieve double-digit increases in sales volumes.
CoMBINED MANAGEMENT REPoRT
Core activities and organisational structure Sustainability
Strategy, management control, and targets Employees and society
2011 business trend Environmental precaution
Additional statements Research and technology
Risk report Procurement | Outlook
Com
bine
d m
anag
emen
t re
port
Cor
pora
te G
over
nanc
eC
onso
lidat
ed f
inan
cial
sta
tem
ents
Add
itio
nal i
nfor
mat
ion
2
3
4
5
Com
bine
d m
anag
emen
t re
port
Cor
pora
te G
over
nanc
eC
onso
lidat
ed f
inan
cial
sta
tem
ents
Add
itio
nal i
nfor
mat
ion
To
our
shar
ehol
ders
2
3
4
5
1
Con
ten
ts
2
48 HeidelbergCement | Annual Report 2011
Construction investments in Germany increased by 5.4% in 2011 compared with the previous year. Residential and commercial construction benefited in particular from the healthy economic situation. In Sweden and Norway, construction activity also recovered significantly during the reporting year. In Norway, residential construction was a particularly strong growth driver, recording an increase of more than 20%. In the Netherlands and Belgium, construction invest-ments rose by 3.7% and 3.9% respectively; growth in social residential construction and higher expenditure on road construction also led to an increase in construction activity in Denmark. Only the UK recorded a slight decline in 2011, due to the weak economy, following an increase in construction activity in 2010.
Cement business lineIn 2011, cement consumption in Germany stood at 28 million tonnes, 13% above the previous year, while it reached 8.4 million tonnes in the UK, a rise of 7.3% in comparison with the previous year. Cement consumption in Belgium rose by 13.4%. Pleasing growth was also achieved in the Netherlands, Sweden, and especially Norway.
In the cement business line, our domestic deliveries were considerably above the previous year’s level in all countries. Cement and clinker shipments in the Group area increased by 12.4% to 22.1 million tonnes (previous year: 19.7). The Baltic States achieved the biggest increase in quantities in domestic shipments, followed by Germany, Norway, the Benelux countries, and Sweden. In the UK, both our cement shipments and deliveries of ground blast furnace slag recorded pleasing growth. However, this was due, in part, to carry-over from December 2010, which was impacted by severe winter weather. While our plants in Germany, the Benelux coun-tries, Sweden, and Estonia were able to increase their cement exports considerably, exports from Norway declined heavily. Business line revenue increased considerably by 10.5% to €1,796 million (previous year: 1,626).
Investments in 2011 were governed by strict expenditure control. In the UK, Norway, and Belgium, we invested in facilities to improve environmental protection. In our Kjøpsvik plant in Norway, for example, we commenced construction of a new filter system. In our Lixhe plant in Belgium, we commissioned a new coal mill. In Malmö, Sweden, and Klaipeda, Lithuania, new cement terminals were opened in the first quarter of 2012 so that we can supply the relevant markets more efficiently. At our plant in Hanover, Germany, we are investing in the construction of a new blending silo to improve our competitiveness.
Aggregates business lineHeidelbergCement operates an extensive network of production sites in the Western and North-ern Europe Group area. Overall, aggregates sales volumes rose by 14.9% to 79.1 million tonnes (previous year: 68.8), a significant improvement on the previous year’s level. While deliveries of aggregates increased by a double-digit percentage in Norway, Sweden, the Benelux countries, and the Baltic region, they were only slightly above the previous year in our largest market re-gion, the UK. Business line revenue rose overall by 13.0% to €870 million (previous year: 770).
The aggregates business line was also governed by strict expenditure control regarding invest-ments. We limited our investments principally to the modernisation of conveying systems in the UK and Belgium as well as the acquisition of 100% of the shares in the aggregates company Ledinge Fastighets AB in Sweden. In Norway, we commissioned the Jelsa quarry, which is the largest in the country.
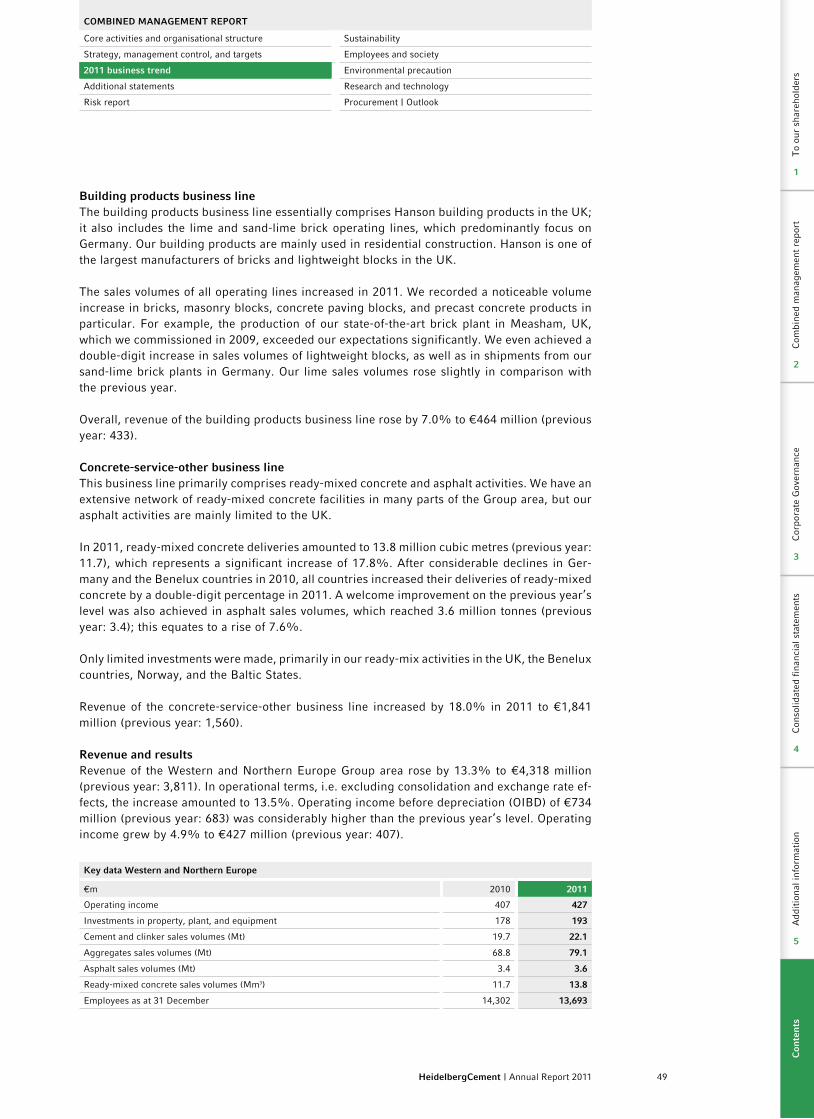
49HeidelbergCement | Annual Report 2011
Building products business lineThe building products business line essentially comprises Hanson building products in the UK; it also includes the lime and sand-lime brick operating lines, which predominantly focus on Germany. Our building products are mainly used in residential construction. Hanson is one of the largest manufacturers of bricks and lightweight blocks in the UK.
The sales volumes of all operating lines increased in 2011. We recorded a noticeable volume increase in bricks, masonry blocks, concrete paving blocks, and precast concrete products in particular. For example, the production of our state-of-the-art brick plant in Measham, UK, which we commissioned in 2009, exceeded our expectations significantly. We even achieved a double-digit increase in sales volumes of lightweight blocks, as well as in shipments from our sand-lime brick plants in Germany. Our lime sales volumes rose slightly in comparison with the previous year.
Overall, revenue of the building products business line rose by 7.0% to €464 million (previous year: 433).
Concrete-service-other business lineThis business line primarily comprises ready-mixed concrete and asphalt activities. We have an extensive network of ready-mixed concrete facilities in many parts of the Group area, but our asphalt activities are mainly limited to the UK.
In 2011, ready-mixed concrete deliveries amounted to 13.8 million cubic metres (previous year: 11.7), which represents a significant increase of 17.8%. After considerable declines in Ger-many and the Benelux countries in 2010, all countries increased their deliveries of ready-mixed concrete by a double-digit percentage in 2011. A welcome improvement on the previous year’s level was also achieved in asphalt sales volumes, which reached 3.6 million tonnes (previous year: 3.4); this equates to a rise of 7.6%.
Only limited investments were made, primarily in our ready-mix activities in the UK, the Benelux countries, Norway, and the Baltic States.
Revenue of the concrete-service-other business line increased by 18.0% in 2011 to €1,841 million (previous year: 1,560).
Revenue and resultsRevenue of the Western and Northern Europe Group area rose by 13.3% to €4,318 million (previous year: 3,811). In operational terms, i.e. excluding consolidation and exchange rate ef-fects, the increase amounted to 13.5%. Operating income before depreciation (OIBD) of €734 million (previous year: 683) was considerably higher than the previous year’s level. Operating income grew by 4.9% to €427 million (previous year: 407).
Key data Western and Northern Europe
€m 2010 2011
Operating income 407 427
Investments in property, plant, and equipment 178 193
Cement and clinker sales volumes (Mt) 19.7 22.1
Aggregates sales volumes (Mt) 68.8 79.1
Asphalt sales volumes (Mt) 3.4 3.6
Ready-mixed concrete sales volumes (Mm3) 11.7 13.8
Employees as at 31 December 14,302 13,693
CoMBINED MANAGEMENT REPoRT
Core activities and organisational structure Sustainability
Strategy, management control, and targets Employees and society
2011 business trend Environmental precaution
Additional statements Research and technology
Risk report Procurement | Outlook
Com
bine
d m
anag
emen
t re
port
Cor
pora
te G
over
nanc
eC
onso
lidat
ed f
inan
cial
sta
tem
ents
Add
itio
nal i
nfor
mat
ion
2
3
4
5
Com
bine
d m
anag
emen
t re
port
Cor
pora
te G
over
nanc
eC
onso
lidat
ed f
inan
cial
sta
tem
ents
Add
itio
nal i
nfor
mat
ion
To
our
shar
ehol
ders
2
3
4
5
1
Con
ten
ts
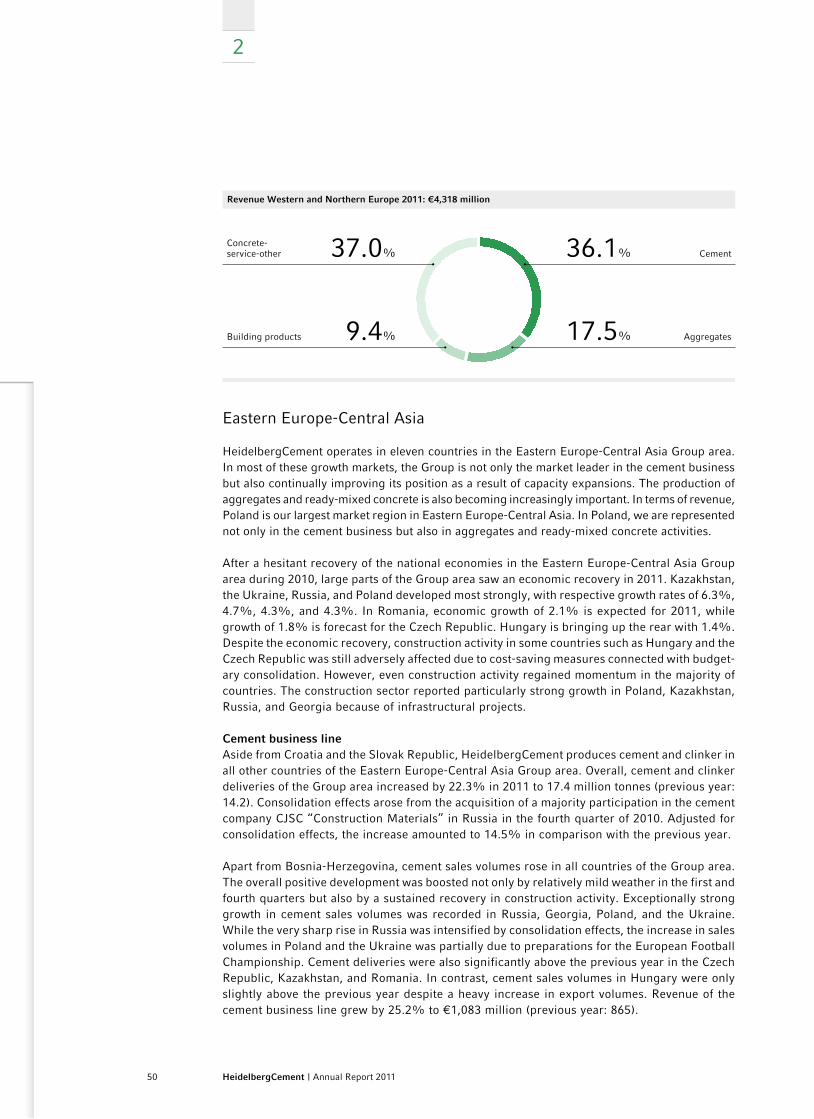
2
50 HeidelbergCement | Annual Report 2011
Revenue Western and Northern Europe 2011: €4,318 million
37.0%
Building products
Concrete-service-other
9.4%
Cement36.1%
Aggregates17.5%
Eastern Europe-Central Asia
HeidelbergCement operates in eleven countries in the Eastern Europe-Central Asia Group area. In most of these growth markets, the Group is not only the market leader in the cement business but also continually improving its position as a result of capacity expansions. The production of aggregates and ready-mixed concrete is also becoming increasingly important. In terms of revenue, Poland is our largest market region in Eastern Europe-Central Asia. In Poland, we are represented not only in the cement business but also in aggregates and ready-mixed concrete activities.
After a hesitant recovery of the national economies in the Eastern Europe-Central Asia Group area during 2010, large parts of the Group area saw an economic recovery in 2011. Kazakhstan, the Ukraine, Russia, and Poland developed most strongly, with respective growth rates of 6.3%, 4.7%, 4.3%, and 4.3%. In Romania, economic growth of 2.1% is expected for 2011, while growth of 1.8% is forecast for the Czech Republic. Hungary is bringing up the rear with 1.4%. Despite the economic recovery, construction activity in some countries such as Hungary and the Czech Republic was still adversely affected due to cost-saving measures connected with budget-ary consolidation. However, even construction activity regained momentum in the majority of countries. The construction sector reported particularly strong growth in Poland, Kazakhstan, Russia, and Georgia because of infrastructural projects.
Cement business lineAside from Croatia and the Slovak Republic, HeidelbergCement produces cement and clinker in all other countries of the Eastern Europe-Central Asia Group area. Overall, cement and clinker deliveries of the Group area increased by 22.3% in 2011 to 17.4 million tonnes (previous year: 14.2). Consolidation effects arose from the acquisition of a majority participation in the cement company CJSC “Construction Materials” in Russia in the fourth quarter of 2010. Adjusted for consolidation effects, the increase amounted to 14.5% in comparison with the previous year.
Apart from Bosnia-Herzegovina, cement sales volumes rose in all countries of the Group area. The overall positive development was boosted not only by relatively mild weather in the first and fourth quarters but also by a sustained recovery in construction activity. Exceptionally strong growth in cement sales volumes was recorded in Russia, Georgia, Poland, and the Ukraine. While the very sharp rise in Russia was intensified by consolidation effects, the increase in sales volumes in Poland and the Ukraine was partially due to preparations for the European Football Championship. Cement deliveries were also significantly above the previous year in the Czech Republic, Kazakhstan, and Romania. In contrast, cement sales volumes in Hungary were only slightly above the previous year despite a heavy increase in export volumes. Revenue of the cement business line grew by 25.2% to €1,083 million (previous year: 865).

51HeidelbergCement | Annual Report 2011
In 2011, the majority of the investments was made in Poland, Russia, and Kazakhstan. We operate our largest cement plant – the most modern in Europe – in Górazdze, Poland. At the end of March, we completed the expansion of the plant’s clinker capacity as planned. At the beginning of April, the second modernised kiln line started operation with a capacity of 6,000 tonnes of clinker per day. In the second phase of the project, the construction of a new cement mill will expand the grinding capacity in line with the clinker capacity. This second phase is scheduled for completion in mid-2012. Overall, this will increase the cement capacity of the plant to 5.6 million tonnes.
In summer 2011, we inaugurated our new Russian cement plant, TulaCement. The construction of the plant commenced in April 2009. The state-of-the-art production facility is located ap-proximately 150 km south of Moscow in the Tula region and has an annual capacity of 2 million tonnes of cement. We will use this plant for the supply of cement to the Moscow area, Russia’s largest cement market.
In addition to our investments in Russia and Poland, we commenced construction of a new cement plant in Shetpe near Aktau, located on the Caspian Sea in Kazakhstan. The Caspi Cement plant will have an annual capacity of 0.8 million tonnes of cement and will predominantly supply the rapidly growing oil- and gas-rich region on the Caspian Sea. We aim to produce the first cement there by 2013.
In Georgia and Russia, we have also invested in new cement terminals to improve our market coverage. We commissioned a new cement terminal in the Georgian harbour city of Supsa on 1 April 2011. Since June 2011, we have supplied the Arkhangelsk region in Russia with cement from our plant in Kjøpsvik, Norway, via a new import terminal.
Aggregates business lineThe main market regions of HeidelbergCement in the aggregates business line are the Czech Republic, Poland, Russia, and Romania. We also operate aggregates activities in Hungary, the Slovak Republic, the Ukraine, and Kazakhstan. At 21.7 million tonnes (previous year: 20.1), aggregates deliveries in the Group area in 2011 were 7.8% higher than in the previous year.
While deliveries of aggregates in the Czech and the Slovak Republic, as well as in Hungary remained below the previous year’s level primarily because of government spending cuts, the other countries of the Group area achieved significant growth. Revenue of the aggregates busi-ness line rose by 8.3% to €135 million (previous year: 125).
Investments in our aggregates activities were largely focused on Hungary. We further expanded our position in the Budapest area by an acquisition.
Concrete-service-other business lineHeidelbergCement has ready-mixed concrete activities in almost all countries of the Group area, with a dense network of plants. Our main market regions are located in the Czech Republic and Poland. In 2011, ready-mixed concrete sales volumes in Eastern Europe-Central Asia rose by 18.9% in comparison with the previous year to 4.6 million cubic metres (previous year: 3.9).
While sales volumes of ready-mixed concrete were below the previous year in Bosnia-Herzegovina and Hungary, we doubled the previous year’s figures in Georgia and Kazakhstan. In all other countries, we achieved double-digit rates of growth in our deliveries. At €286 million (previous year: 241), revenue in the concrete-service-other business line rose by 18.7% in 2011.
CoMBINED MANAGEMENT REPoRT
Core activities and organisational structure Sustainability
Strategy, management control, and targets Employees and society
2011 business trend Environmental precaution
Additional statements Research and technology
Risk report Procurement | Outlook
Com
bine
d m
anag
emen
t re
port
Cor
pora
te G
over
nanc
eC
onso
lidat
ed f
inan
cial
sta
tem
ents
Add
itio
nal i
nfor
mat
ion
2
3
4
5
Com
bine
d m
anag
emen
t re
port
Cor
pora
te G
over
nanc
eC
onso
lidat
ed f
inan
cial
sta
tem
ents
Add
itio
nal i
nfor
mat
ion
To
our
shar
ehol
ders
2
3
4
5
1
Con
ten
ts
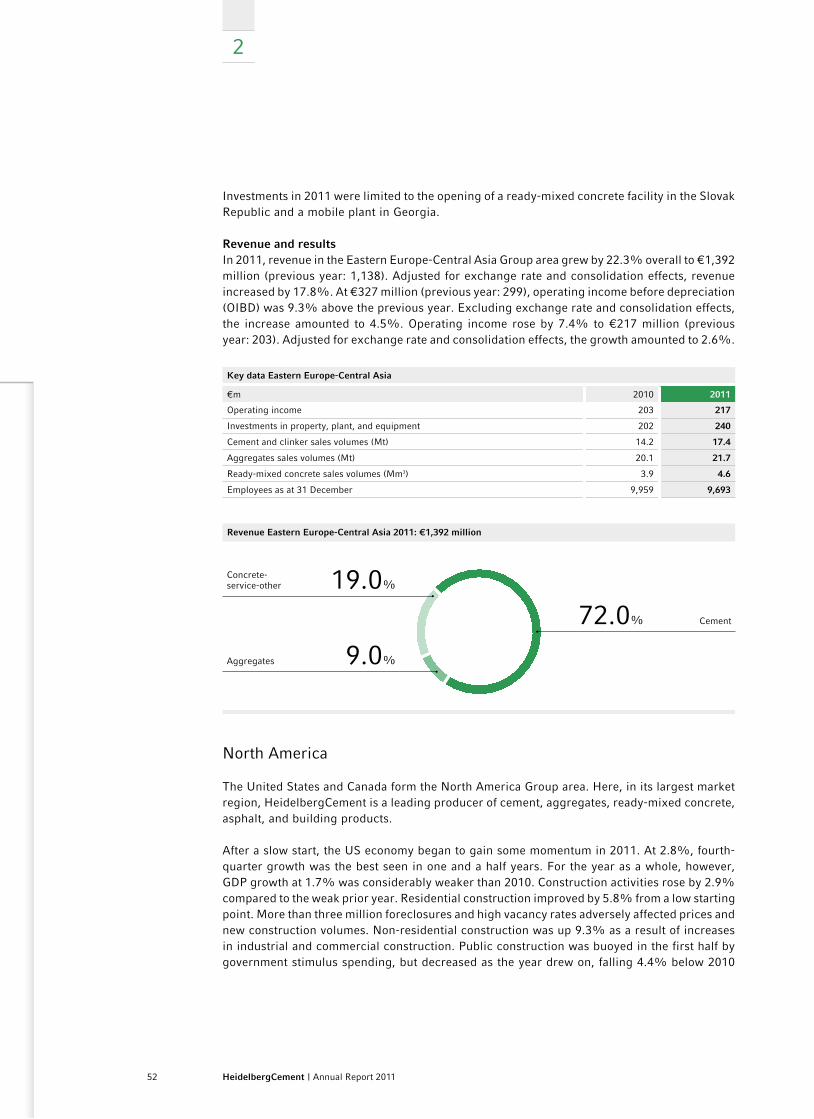
2
52 HeidelbergCement | Annual Report 2011
Investments in 2011 were limited to the opening of a ready-mixed concrete facility in the Slovak Republic and a mobile plant in Georgia.
Revenue and resultsIn 2011, revenue in the Eastern Europe-Central Asia Group area grew by 22.3% overall to €1,392 million (previous year: 1,138). Adjusted for exchange rate and consolidation effects, revenue increased by 17.8%. At €327 million (previous year: 299), operating income before depreciation (OIBD) was 9.3% above the previous year. Excluding exchange rate and consolidation effects, the increase amounted to 4.5%. Operating income rose by 7.4% to €217 million (previous year: 203). Adjusted for exchange rate and consolidation effects, the growth amounted to 2.6%.
Key data Eastern Europe-Central Asia
€m 2010 2011
Operating income 203 217
Investments in property, plant, and equipment 202 240
Cement and clinker sales volumes (Mt) 14.2 17.4
Aggregates sales volumes (Mt) 20.1 21.7
Ready-mixed concrete sales volumes (Mm3) 3.9 4.6
Employees as at 31 December 9,959 9,693
Revenue Eastern Europe-Central Asia 2011: €1,392 million
Concrete-service-other 19.0%
Aggregates 9.0%
Cement72.0%
North America
The United States and Canada form the North America Group area. Here, in its largest market region, HeidelbergCement is a leading producer of cement, aggregates, ready-mixed concrete, asphalt, and building products.
After a slow start, the US economy began to gain some momentum in 2011. At 2.8%, fourth-quarter growth was the best seen in one and a half years. For the year as a whole, however, GDP growth at 1.7% was considerably weaker than 2010. Construction activities rose by 2.9% compared to the weak prior year. Residential construction improved by 5.8% from a low starting point. More than three million foreclosures and high vacancy rates adversely affected prices and new construction volumes. Non-residential construction was up 9.3% as a result of increases in industrial and commercial construction. Public construction was buoyed in the first half by government stimulus spending, but decreased as the year drew on, falling 4.4% below 2010

53HeidelbergCement | Annual Report 2011
levels. This is attributable to declines in state tax revenues, expiry of government incentives, and a delay in multi-year road construction programmes under the new Federal Highway Bill.
Canada’s gross domestic product grew by 2.5% in 2011. Although residential construction was down slightly on prior-year levels, non-residential and public construction improved by 3.1% and 2.9% respectively.
Cement business lineCement consumption in the US rose by 2.8% in 2011 to 72.2 million tonnes; in Canada, consump-tion was slightly higher as well, and totalled 8.8 million tonnes. In 2012, the Portland Cement Association (PCA) expects only a marginal increase in cement consumption for both countries.
Cement and clinker sales volumes at our plants in North America reached 10.6 million tonnes (previous year: 10.0), which equates to an increase of 6.4%. Our West Region plants in California saw particularly pleasing double-digit growth. The construction industry there has passed through the worst and begun to recover from a low level. The South and North Regions also experienced improved demand, while sales volumes at our Canadian plants remained just short of the prior year. Sales volumes at our two white cement plants were slightly up from 2010 levels in the reporting year. As a result of the extended period of inclement weather at the beginning of the year, coupled with negative exchange rate effects, revenue in the cement business line was only marginally higher year on year at €886 million (previous year: 883). In US dollar, however, revenue increased by 5.3%.
The “Operational Excellence” programme, which was launched in 2010 to increase the effi-ciency of our cement plants, was continued successfully in the reporting year at our plants in North America. As a result, fuel and electricity efficiency was improved at our production sites in Edmonton and Mason City. In Tehachapi, we substantially reduced electricity consumption, as well as optimised the fuel mix used by our York and Redding plants. In general, investment in 2011 was governed – as in the previous year – by strict control over expenditures. This excluded important investments needed to improve environmental protection. For instance, at the Cupertino plant in California, we installed a new activated carbon injection system, which reduces mercury emissions by around 90%. At our Canadian plants, various water protection and clean air measures were implemented.
Aggregates business lineHeidelbergCement has a dense network of sand, gravel, and hard stone production sites in the US and western Canada. Overall sales volumes in 2011 were somewhat higher year on year at 105.8 million tonnes (previous year: 105.0). The strongest growth was at our Canadian loca-tions, but the West Region sites in the US also managed to increase sales volumes. However, the North Region – our largest market for aggregates in the US – lagged behind the prior year due to declines in infrastructure investment. Revenue in the aggregates business line rose by 1.7% to €937 million (previous year: 921). In US dollar, this translates to an increase of 6.8%.
Building products business lineThe building products business line includes production of concrete pipes, precast concrete parts, concrete paving blocks, roof tiles, and bricks.
2011 proved to be another difficult year for building products due to their heavy reliance on residential construction. Bricks and roof tiles were the products most affected by declining sales
CoMBINED MANAGEMENT REPoRT
Core activities and organisational structure Sustainability
Strategy, management control, and targets Employees and society
2011 business trend Environmental precaution
Additional statements Research and technology
Risk report Procurement | Outlook
Com
bine
d m
anag
emen
t re
port
Cor
pora
te G
over
nanc
eC
onso
lidat
ed f
inan
cial
sta
tem
ents
Add
itio
nal i
nfor
mat
ion
2
3
4
5
Com
bine
d m
anag
emen
t re
port
Cor
pora
te G
over
nanc
eC
onso
lidat
ed f
inan
cial
sta
tem
ents
Add
itio
nal i
nfor
mat
ion
To
our
shar
ehol
ders
2
3
4
5
1
Con
ten
ts
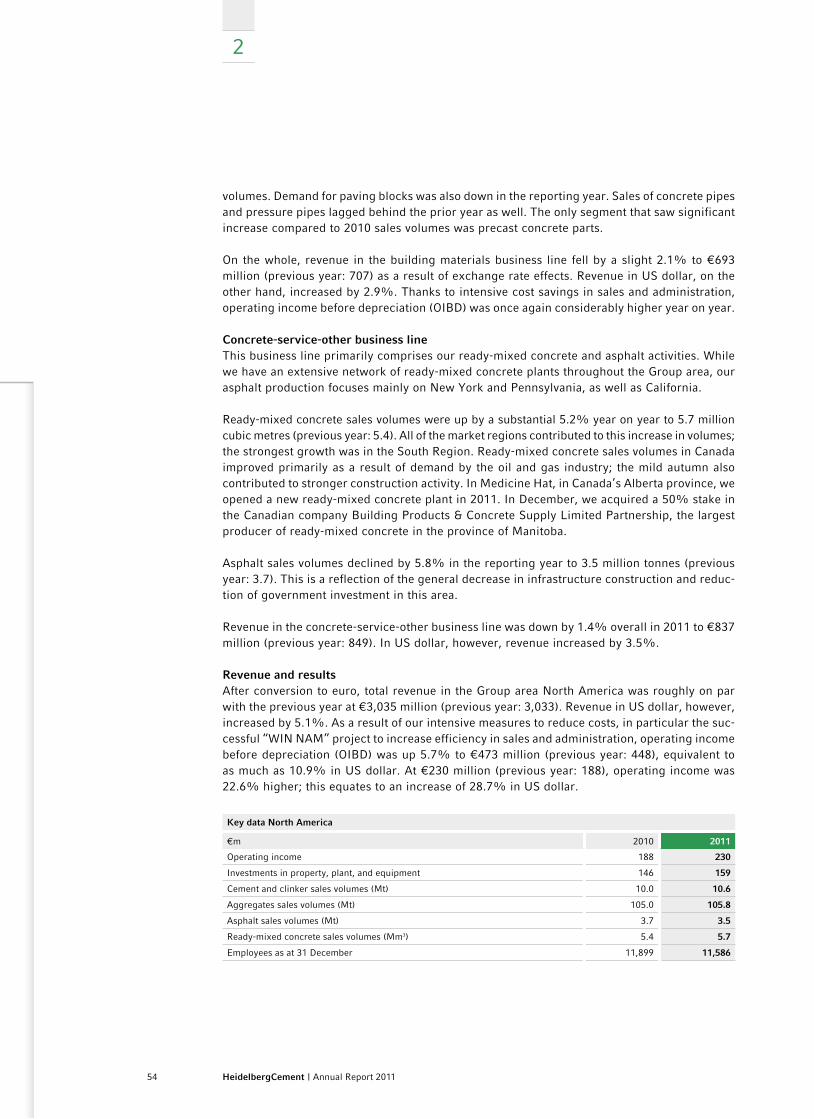
2
54 HeidelbergCement | Annual Report 2011
volumes. Demand for paving blocks was also down in the reporting year. Sales of concrete pipes and pressure pipes lagged behind the prior year as well. The only segment that saw significant increase compared to 2010 sales volumes was precast concrete parts.
On the whole, revenue in the building materials business line fell by a slight 2.1% to €693 million (previous year: 707) as a result of exchange rate effects. Revenue in US dollar, on the other hand, increased by 2.9%. Thanks to intensive cost savings in sales and administration, operating income before depreciation (OIBD) was once again considerably higher year on year.
Concrete-service-other business lineThis business line primarily comprises our ready-mixed concrete and asphalt activities. While we have an extensive network of ready-mixed concrete plants throughout the Group area, our asphalt production focuses mainly on New York and Pennsylvania, as well as California.
Ready-mixed concrete sales volumes were up by a substantial 5.2% year on year to 5.7 million cubic metres (previous year: 5.4). All of the market regions contributed to this increase in volumes; the strongest growth was in the South Region. Ready-mixed concrete sales volumes in Canada improved primarily as a result of demand by the oil and gas industry; the mild autumn also contributed to stronger construction activity. In Medicine Hat, in Canada’s Alberta province, we opened a new ready-mixed concrete plant in 2011. In December, we acquired a 50% stake in the Canadian company Building Products & Concrete Supply Limited Partnership, the largest producer of ready-mixed concrete in the province of Manitoba.
Asphalt sales volumes declined by 5.8% in the reporting year to 3.5 million tonnes (previous year: 3.7). This is a reflection of the general decrease in infrastructure construction and reduc-tion of government investment in this area.
Revenue in the concrete-service-other business line was down by 1.4% overall in 2011 to €837 million (previous year: 849). In US dollar, however, revenue increased by 3.5%.
Revenue and resultsAfter conversion to euro, total revenue in the Group area North America was roughly on par with the previous year at €3,035 million (previous year: 3,033). Revenue in US dollar, however, increased by 5.1%. As a result of our intensive measures to reduce costs, in particular the suc-cessful “WIN NAM” project to increase efficiency in sales and administration, operating income before depreciation (OIBD) was up 5.7% to €473 million (previous year: 448), equivalent to as much as 10.9% in US dollar. At €230 million (previous year: 188), operating income was 22.6% higher; this equates to an increase of 28.7% in US dollar.
Key data North America
€m 2010 2011
Operating income 188 230
Investments in property, plant, and equipment 146 159
Cement and clinker sales volumes (Mt) 10.0 10.6
Aggregates sales volumes (Mt) 105.0 105.8
Asphalt sales volumes (Mt) 3.7 3.5
Ready-mixed concrete sales volumes (Mm3) 5.4 5.7
Employees as at 31 December 11,899 11,586
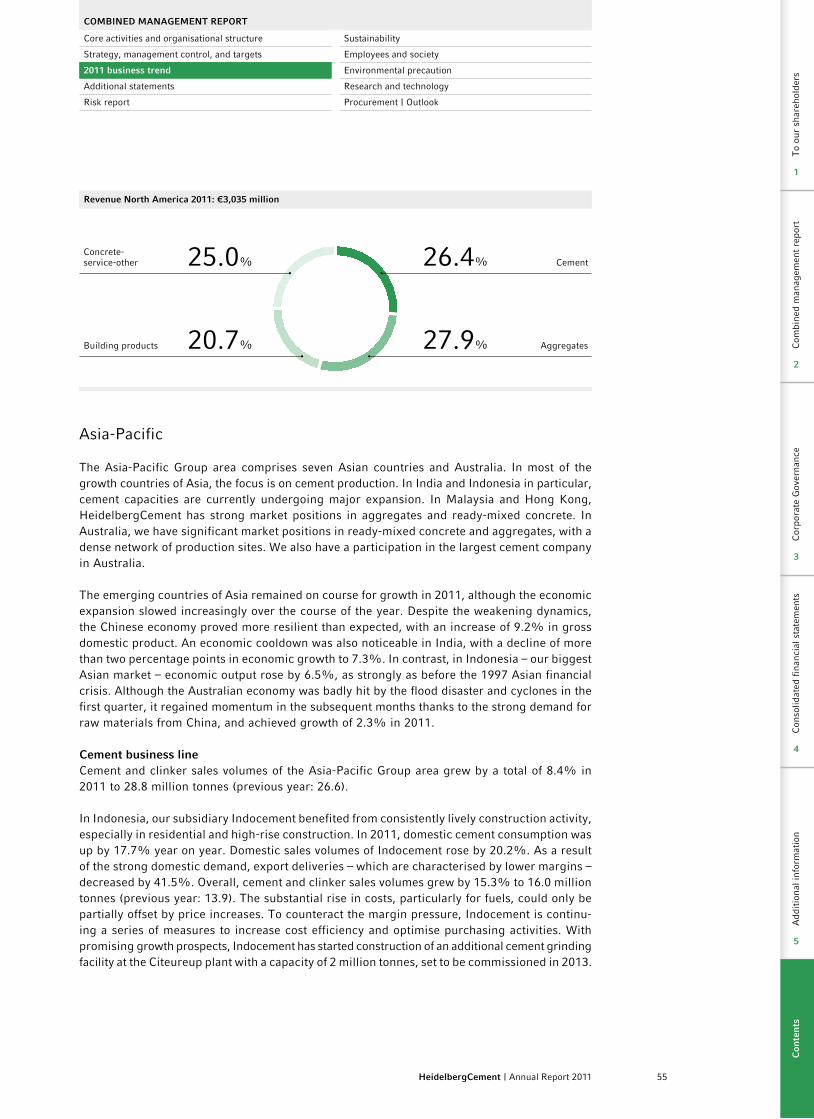
55HeidelbergCement | Annual Report 2011
Revenue North America 2011: €3,035 million
25.0%
Building products
Concrete-service-other
20.7%
Cement26.4%
Aggregates27.9%
Asia-Pacific
The Asia-Pacific Group area comprises seven Asian countries and Australia. In most of the growth countries of Asia, the focus is on cement production. In India and Indonesia in particular, cement capacities are currently undergoing major expansion. In Malaysia and Hong Kong, HeidelbergCement has strong market positions in aggregates and ready-mixed concrete. In Australia, we have significant market positions in ready-mixed concrete and aggregates, with a dense network of production sites. We also have a participation in the largest cement company in Australia.
The emerging countries of Asia remained on course for growth in 2011, although the economic expansion slowed increasingly over the course of the year. Despite the weakening dynamics, the Chinese economy proved more resilient than expected, with an increase of 9.2% in gross domestic product. An economic cooldown was also noticeable in India, with a decline of more than two percentage points in economic growth to 7.3%. In contrast, in Indonesia – our biggest Asian market – economic output rose by 6.5%, as strongly as before the 1997 Asian financial crisis. Although the Australian economy was badly hit by the flood disaster and cyclones in the first quarter, it regained momentum in the subsequent months thanks to the strong demand for raw materials from China, and achieved growth of 2.3% in 2011.
Cement business lineCement and clinker sales volumes of the Asia-Pacific Group area grew by a total of 8.4% in 2011 to 28.8 million tonnes (previous year: 26.6).
In Indonesia, our subsidiary Indocement benefited from consistently lively construction activity, especially in residential and high-rise construction. In 2011, domestic cement consumption was up by 17.7% year on year. Domestic sales volumes of Indocement rose by 20.2%. As a result of the strong domestic demand, export deliveries – which are characterised by lower margins – decreased by 41.5%. Overall, cement and clinker sales volumes grew by 15.3% to 16.0 million tonnes (previous year: 13.9). The substantial rise in costs, particularly for fuels, could only be partially offset by price increases. To counteract the margin pressure, Indocement is continu-ing a series of measures to increase cost efficiency and optimise purchasing activities. With promising growth prospects, Indocement has started construction of an additional cement grinding facility at the Citeureup plant with a capacity of 2 million tonnes, set to be commissioned in 2013.
CoMBINED MANAGEMENT REPoRT
Core activities and organisational structure Sustainability
Strategy, management control, and targets Employees and society
2011 business trend Environmental precaution
Additional statements Research and technology
Risk report Procurement | Outlook
Com
bine
d m
anag
emen
t re
port
Cor
pora
te G
over
nanc
eC
onso
lidat
ed f
inan
cial
sta
tem
ents
Add
itio
nal i
nfor
mat
ion
2
3
4
5
Com
bine
d m
anag
emen
t re
port
Cor
pora
te G
over
nanc
eC
onso
lidat
ed f
inan
cial
sta
tem
ents
Add
itio
nal i
nfor
mat
ion
To
our
shar
ehol
ders
2
3
4
5
1
Con
ten
ts
2
56 HeidelbergCement | Annual Report 2011
In China, HeidelbergCement is represented by the two joint ventures China Century Cement and Jidong Heidelberg Cement Company in the Guangdong and Shaanxi provinces. Once again, both provinces recorded lively construction activity and a rise in cement consumption in 2011. Heavy increases in residential construction more than compensated for the decline in infrastructural projects. However, the consolidated sales volumes of our joint ventures remained slightly below the previous year’s level – despite pleasing growth in the third and fourth quarters – with a decline of 1.0% to 7.2 million tonnes (previous year: 7.3). The decreases in sales volumes relate primarily to production downtimes following a quarry accident in the first quarter. While a positive price development was recorded in Guangdong, cement prices in Shaanxi fell significantly because of excess capacities and the fact that the market consolidation had not yet been completed.
In India, HeidelbergCement operates two cement plants and three grinding facilities in the south and west, as well as in central India. The Indian construction industry lost momentum as a result of the government’s continued restraint in the area of infrastructural projects and the weakening of the property sector because of high interest rates. In 2011, domestic cement consumption increased by around 6%. As a result of strong growth, the deliveries of our Indian cement plants rose by 7.1% in the second half of the year. Following a substantial increase in the first quarter, cement prices fell again in the subsequent months because of the weakening of growth and the monsoon. A substantial price recovery commenced in September, with the end of the monsoon season. The expansion of our cement capacities in central India by 2.9 million tonnes is proceeding according to schedule. New facilities in our Damoh and Jhansi plants are set to be completed in the second quarter of 2012, with production scheduled to start then as well. HeidelbergCement will then have a total capacity of 6 million tonnes in India.
In Bangladesh, prolonged rainfall and nationwide strikes hampered construction activity. As a result, our sales volumes remained just under the previous year’s value. At the Chittagong grinding plant, we completed the construction of an additional cement mill with a capacity of 0.8 million tonnes on schedule; after successful test runs at the end of 2011, production com-menced at the start of 2012. In the Sultanate of Brunei, our cement sales volumes exceeded the previous year’s level as a result of government residential construction projects. In Australia, cement deliveries of the proportionately consolidated 25% participation Cement Australia were adversely affected by the flood disaster at the beginning of the year and therefore remained slightly below the previous year’s quantity.
Revenue of the cement business line rose by 12.0% to €1,732 million (previous year: 1,547).
Aggregates business lineIn the aggregates business line, HeidelbergCement is represented in Australia, Malaysia, Indonesia, and Hong Kong. In 2011, our deliveries of aggregates rose by 11.4% to 37.1 million tonnes (previous year: 33.4). Excluding consolidation effects, the rise amounted to 9.7%.
In Australia, by far our largest market in this Group area, our aggregates sales volumes recorded a pleasing increase despite the flood disaster at the start of the year. To secure raw material reserves, we acquired the aggregates company Galli Quarries Pty Ltd in the Melbourne metro-politan region in August 2011. The company operates a basalt quarry with an annual production of over 500,000 tonnes.
We achieved considerable double-digit volume increases in Malaysia, Indonesia, and Hong Kong. In Malaysia, our aggregates activities benefited from the significant recovery in infrastructure
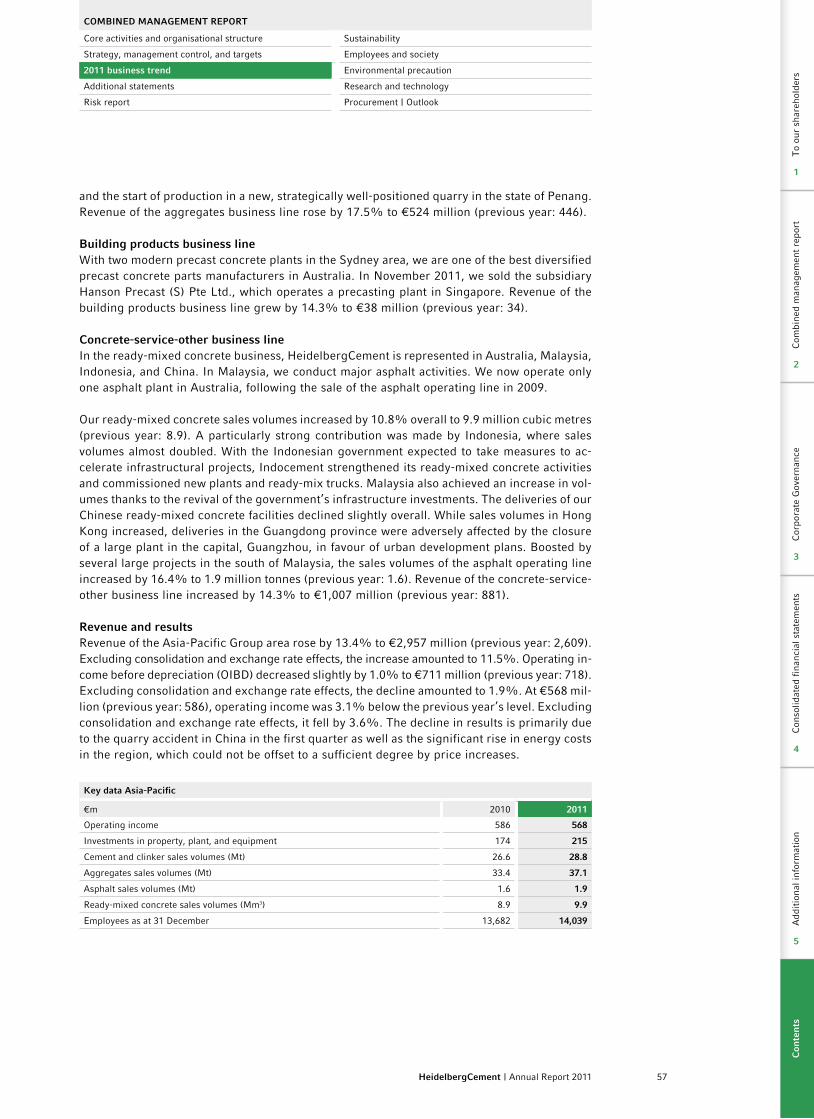
57HeidelbergCement | Annual Report 2011
and the start of production in a new, strategically well-positioned quarry in the state of Penang. Revenue of the aggregates business line rose by 17.5% to €524 million (previous year: 446).
Building products business lineWith two modern precast concrete plants in the Sydney area, we are one of the best diversified precast concrete parts manufacturers in Australia. In November 2011, we sold the subsidiary Hanson Precast (S) Pte Ltd., which operates a precasting plant in Singapore. Revenue of the building products business line grew by 14.3% to €38 million (previous year: 34).
Concrete-service-other business lineIn the ready-mixed concrete business, HeidelbergCement is represented in Australia, Malaysia, Indonesia, and China. In Malaysia, we conduct major asphalt activities. We now operate only one asphalt plant in Australia, following the sale of the asphalt operating line in 2009.
Our ready-mixed concrete sales volumes increased by 10.8% overall to 9.9 million cubic metres (previous year: 8.9). A particularly strong contribution was made by Indonesia, where sales volumes almost doubled. With the Indonesian government expected to take measures to ac-celerate infrastructural projects, Indocement strengthened its ready-mixed concrete activities and commissioned new plants and ready-mix trucks. Malaysia also achieved an increase in vol-umes thanks to the revival of the government’s infrastructure investments. The deliveries of our Chinese ready-mixed concrete facilities declined slightly overall. While sales volumes in Hong Kong increased, deliveries in the Guangdong province were adversely affected by the closure of a large plant in the capital, Guangzhou, in favour of urban development plans. Boosted by several large projects in the south of Malaysia, the sales volumes of the asphalt operating line increased by 16.4% to 1.9 million tonnes (previous year: 1.6). Revenue of the concrete-service-other business line increased by 14.3% to €1,007 million (previous year: 881).
Revenue and resultsRevenue of the Asia-Pacific Group area rose by 13.4% to €2,957 million (previous year: 2,609). Excluding consolidation and exchange rate effects, the increase amounted to 11.5%. Operating in-come before depreciation (OIBD) decreased slightly by 1.0% to €711 million (previous year: 718). Excluding consolidation and exchange rate effects, the decline amounted to 1.9%. At €568 mil-lion (previous year: 586), operating income was 3.1% below the previous year’s level. Excluding consolidation and exchange rate effects, it fell by 3.6%. The decline in results is primarily due to the quarry accident in China in the first quarter as well as the significant rise in energy costs in the region, which could not be offset to a sufficient degree by price increases.
Key data Asia-Pacific
€m 2010 2011
Operating income 586 568
Investments in property, plant, and equipment 174 215
Cement and clinker sales volumes (Mt) 26.6 28.8
Aggregates sales volumes (Mt) 33.4 37.1
Asphalt sales volumes (Mt) 1.6 1.9
Ready-mixed concrete sales volumes (Mm3) 8.9 9.9
Employees as at 31 December 13,682 14,039
CoMBINED MANAGEMENT REPoRT
Core activities and organisational structure Sustainability
Strategy, management control, and targets Employees and society
2011 business trend Environmental precaution
Additional statements Research and technology
Risk report Procurement | Outlook
Com
bine
d m
anag
emen
t re
port
Cor
pora
te G
over
nanc
eC
onso
lidat
ed f
inan
cial
sta
tem
ents
Add
itio
nal i
nfor
mat
ion
2
3
4
5
Com
bine
d m
anag
emen
t re
port
Cor
pora
te G
over
nanc
eC
onso
lidat
ed f
inan
cial
sta
tem
ents
Add
itio
nal i
nfor
mat
ion
To
our
shar
ehol
ders
2
3
4
5
1
Con
ten
ts
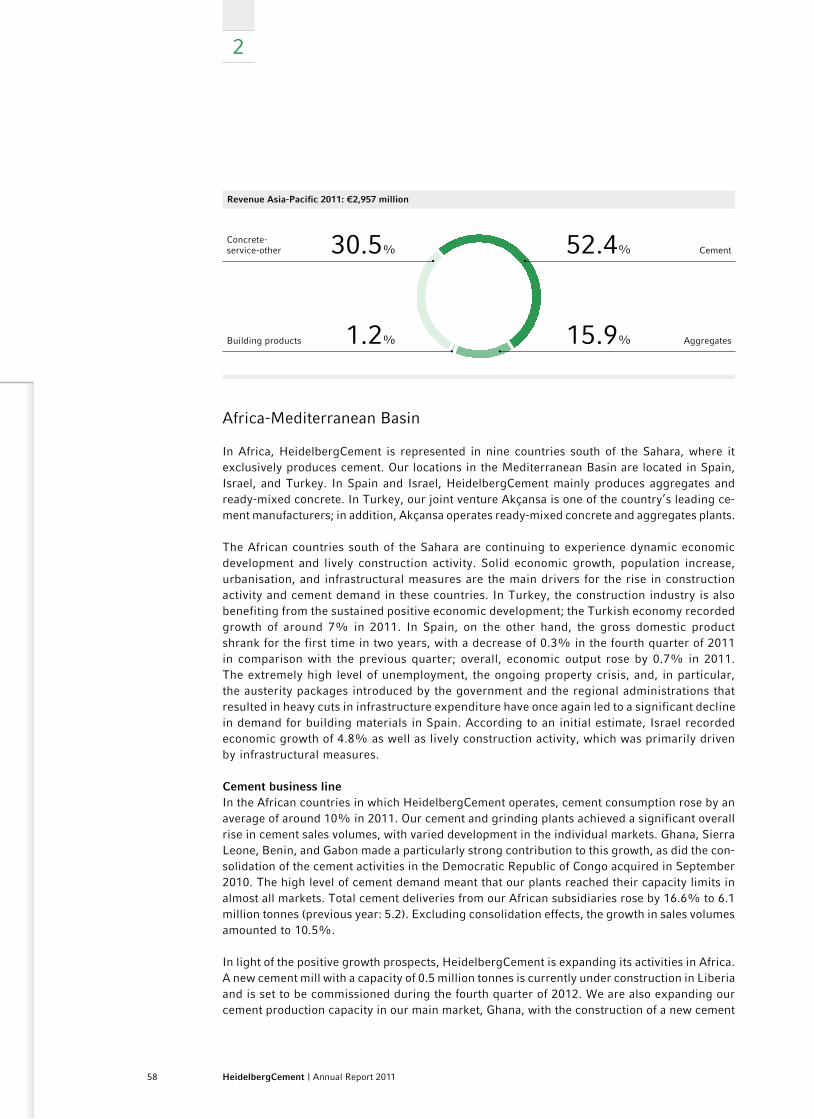
2
58 HeidelbergCement | Annual Report 2011
Revenue Asia-Pacific 2011: €2,957 million
30.5%
Building products
Concrete-service-other
1.2%
Cement52.4%
Aggregates15.9%
Africa-Mediterranean Basin
In Africa, HeidelbergCement is represented in nine countries south of the Sahara, where it exclusively produces cement. Our locations in the Mediterranean Basin are located in Spain, Israel, and Turkey. In Spain and Israel, HeidelbergCement mainly produces aggregates and ready-mixed concrete. In Turkey, our joint venture Akçansa is one of the country’s leading ce-ment manufacturers; in addition, Akçansa operates ready-mixed concrete and aggregates plants.
The African countries south of the Sahara are continuing to experience dynamic economic development and lively construction activity. Solid economic growth, population increase, urbanisation, and infrastructural measures are the main drivers for the rise in construction activity and cement demand in these countries. In Turkey, the construction industry is also benefiting from the sustained positive economic development; the Turkish economy recorded growth of around 7% in 2011. In Spain, on the other hand, the gross domestic product shrank for the first time in two years, with a decrease of 0.3% in the fourth quarter of 2011 in comparison with the previous quarter; overall, economic output rose by 0.7% in 2011. The extremely high level of unemployment, the ongoing property crisis, and, in particular, the austerity packages introduced by the government and the regional administrations that resulted in heavy cuts in infrastructure expenditure have once again led to a significant decline in demand for building materials in Spain. According to an initial estimate, Israel recorded economic growth of 4.8% as well as lively construction activity, which was primarily driven by infrastructural measures.
Cement business lineIn the African countries in which HeidelbergCement operates, cement consumption rose by an average of around 10% in 2011. Our cement and grinding plants achieved a significant overall rise in cement sales volumes, with varied development in the individual markets. Ghana, Sierra Leone, Benin, and Gabon made a particularly strong contribution to this growth, as did the con-solidation of the cement activities in the Democratic Republic of Congo acquired in September 2010. The high level of cement demand meant that our plants reached their capacity limits in almost all markets. Total cement deliveries from our African subsidiaries rose by 16.6% to 6.1 million tonnes (previous year: 5.2). Excluding consolidation effects, the growth in sales volumes amounted to 10.5%.
In light of the positive growth prospects, HeidelbergCement is expanding its activities in Africa. A new cement mill with a capacity of 0.5 million tonnes is currently under construction in Liberia and is set to be commissioned during the fourth quarter of 2012. We are also expanding our cement production capacity in our main market, Ghana, with the construction of a new cement
59HeidelbergCement | Annual Report 2011
mill at the Tema grinding facility; the commissioning of the mill with a capacity of 1 million tonnes is scheduled for the fourth quarter of 2012. In Togo, we are planning to construct a greenfield clinker plant with a capacity of 1.5 million tonnes, provided that we receive final authorisation. The construction work is set to commence this year. At the beginning of 2014, a greenfield cement grinding plant with a capacity of 650,000 tonnes is set to commence opera-tion in Burkina Faso, close to the capital, Ouagadougou. In the Democratic Republic of Congo, we intend to increase our cement capacity from over 500,000 tonnes to more than 1.4 million tonnes in the coming years. In Tanzania, the modernisation and upgrading of cement kiln 3 should increase the clinker capacity of our Tanzania Portland Cement plant by 250,000 tonnes from the second quarter of 2012. We are also evaluating options for capacity expansions in other African countries.
Boosted by the booming construction industry in Turkey, the domestic cement sales volumes of our joint venture Akçansa increased by more than 10%. In view of the strong domestic market, cement prices were increased substantially during the course of the year. Cement and clinker exports were reduced considerably in order to meet domestic demand. Overall, cement and clinker sales volumes of Akçansa rose by 1.1% to 7.7 million tonnes (consolidated quantity: 3.1 million tonnes). At the Çanakkale plant, a facility for generating electricity from kiln waste heat was commissioned at the end of September 2011. The installation covers around 30% of the entire electricity requirement of the plant and will also cut CO2 emissions by 60,000 tonnes per year.
Total cement and clinker sales volumes in the Africa-Mediterranean Basin Group area increased by 10.9% to 9.1 million tonnes (previous year: 8.2); excluding consolidation effects, the growth amounted to 7.0%. Revenue of the cement business line rose by 12.3% to €726 million (previ-ous year: 647).
Aggregates business lineHeidelbergCement is active in the aggregates business line in Spain, Israel, and Turkey. Over-all, the aggregates sales volumes decreased slightly by 0.6% and were just under the previous year’s level at 14.2 million tonnes (previous year: 14.3). The decline is primarily due to the consistently weak construction activity in Spain, where our aggregates activities suffered as a result of cuts in public funding for infrastructural measures. At the start of September 2011, we acquired the operations of a limestone quarry in Barcelona to secure raw material reserves. Our activities in Turkey also failed to achieve last year’s volumes. In Israel, on the other hand, we saw a pleasing increase in deliveries of aggregates, thanks to solid demand for ready-mixed concrete and the increased construction activity in the infrastructure sector. Following the success-ful introduction of price increases, revenue of the aggregates business line improved by 2.3% to €87 million (previous year: 85).
Concrete-service-other business lineIn this Group area, HeidelbergCement operates major ready-mixed concrete activities in Spain, Israel, and Turkey. The asphalt operating line, on the other hand, is only represented in Israel. In 2011, total sales volumes of ready-mixed concrete rose slightly by 1.4% to 5.1 million cubic metres (previous year: 5.0); growth in Turkey and particularly in Israel more than compensated for the losses in Spain. As a result of weak construction activity in Spain, we had to further adjust our ready-mixed concrete capacities in Catalonia. In Turkey, on the other hand, the ready-mixed concrete operating line of Akçansa, which now operates 36 plants, achieved record sales volumes thanks to the lively construction activity. Our ready-mixed concrete activities in Israel benefited from the high level of demand from infrastructure construction. The asphalt operat-ing line in Israel recorded a substantial increase of more than 30% in sales volumes. Revenue of the concrete-service-other business line rose by 3.7% to €284 million (previous year: 274).
CoMBINED MANAGEMENT REPoRT
Core activities and organisational structure Sustainability
Strategy, management control, and targets Employees and society
2011 business trend Environmental precaution
Additional statements Research and technology
Risk report Procurement | Outlook
Com
bine
d m
anag
emen
t re
port
Cor
pora
te G
over
nanc
eC
onso
lidat
ed f
inan
cial
sta
tem
ents
Add
itio
nal i
nfor
mat
ion
2
3
4
5
Com
bine
d m
anag
emen
t re
port
Cor
pora
te G
over
nanc
eC
onso
lidat
ed f
inan
cial
sta
tem
ents
Add
itio
nal i
nfor
mat
ion
To
our
shar
ehol
ders
2
3
4
5
1
Con
ten
ts
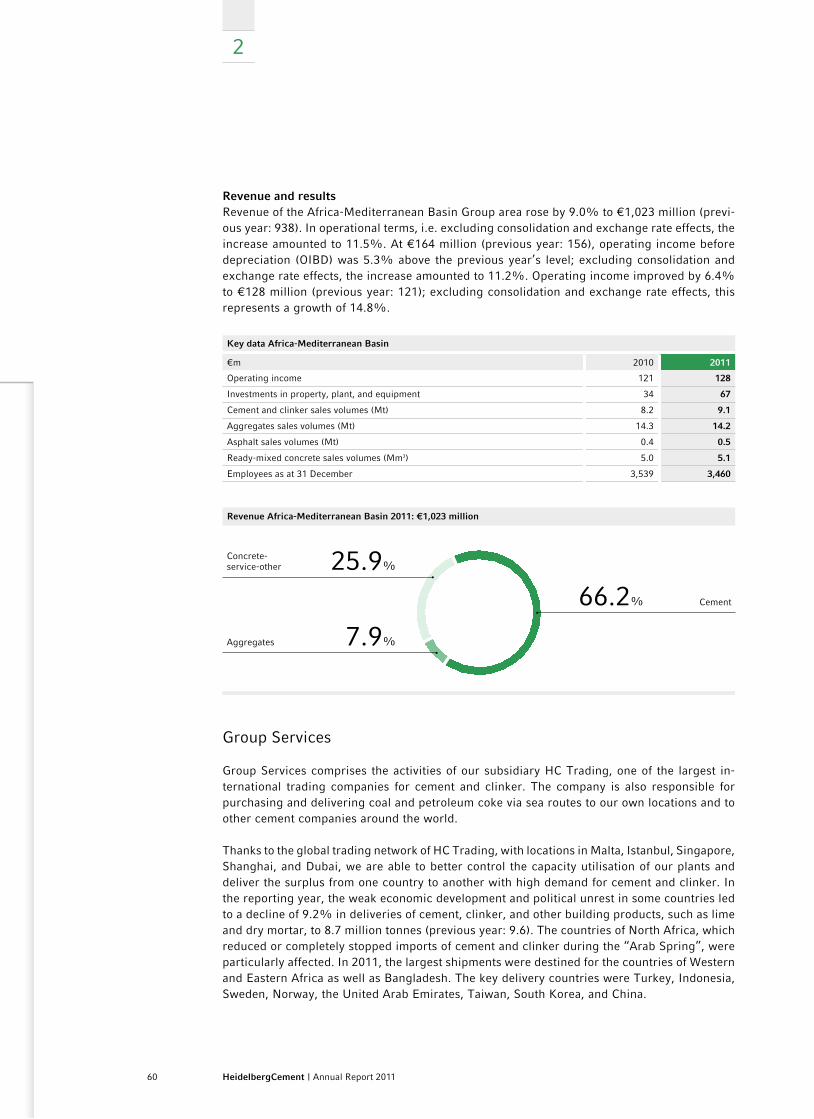
2
60 HeidelbergCement | Annual Report 2011
Revenue and resultsRevenue of the Africa-Mediterranean Basin Group area rose by 9.0% to €1,023 million (previ-ous year: 938). In operational terms, i.e. excluding consolidation and exchange rate effects, the increase amounted to 11.5%. At €164 million (previous year: 156), operating income before depreciation (OIBD) was 5.3% above the previous year’s level; excluding consolidation and exchange rate effects, the increase amounted to 11.2%. Operating income improved by 6.4% to €128 million (previous year: 121); excluding consolidation and exchange rate effects, this represents a growth of 14.8%.
Key data Africa-Mediterranean Basin
€m 2010 2011
Operating income 121 128
Investments in property, plant, and equipment 34 67
Cement and clinker sales volumes (Mt) 8.2 9.1
Aggregates sales volumes (Mt) 14.3 14.2
Asphalt sales volumes (Mt) 0.4 0.5
Ready-mixed concrete sales volumes (Mm3) 5.0 5.1
Employees as at 31 December 3,539 3,460
Revenue Africa-Mediterranean Basin 2011: €1,023 million
Concrete-service-other 25.9%
Aggregates 7.9%
Cement66.2%
Group Services
Group Services comprises the activities of our subsidiary HC Trading, one of the largest in-ternational trading companies for cement and clinker. The company is also responsible for purchasing and delivering coal and petroleum coke via sea routes to our own locations and to other cement companies around the world.
Thanks to the global trading network of HC Trading, with locations in Malta, Istanbul, Singapore, Shanghai, and Dubai, we are able to better control the capacity utilisation of our plants and deliver the surplus from one country to another with high demand for cement and clinker. In the reporting year, the weak economic development and political unrest in some countries led to a decline of 9.2% in deliveries of cement, clinker, and other building products, such as lime and dry mortar, to 8.7 million tonnes (previous year: 9.6). The countries of North Africa, which reduced or completely stopped imports of cement and clinker during the “Arab Spring”, were particularly affected. In 2011, the largest shipments were destined for the countries of Western and Eastern Africa as well as Bangladesh. The key delivery countries were Turkey, Indonesia, Sweden, Norway, the United Arab Emirates, Taiwan, South Korea, and China.
61HeidelbergCement | Annual Report 2011
International trading in coal and petroleum coke, which rose by 4.6% to 2.8 million tonnes (previous year: 2.6), presented a very different picture. The main purchaser was the cement industry worldwide. In the reporting year, we managed to win new customers in Africa, Europe, and North and South America. More than 200 ships, including some with freight capacities of over 140,000 tonnes, were used to cover the cement industry’s heavy demand for fuel.
Overall, more than 900 ships transported goods, mostly via the main sea routes of Asia, the Mediterranean Basin, and Continental Europe to their destinations in Africa, the Middle East, and South America. Thanks to its sophisticated logistics, HC Trading is able to respond quickly to changing market conditions.
Revenue and resultsRevenue in the Group Services business unit decreased by 8.2% to €652 million (previous year: 709). Operating income before depreciation (OIBD) fell by 44.6% to €11 million (pre-vious year: 20). Operating income underwent a comparable decrease of 45.3% to €11 million (previous year: 20). This decline was caused by significant increases in freight costs as well as the falling cement and clinker trade volume.
Key data Group Services
€m 2010 2011
Revenue 709 652
Operating income 20 11
Employees as at 31 December 55 55
Discontinued operations
Net income from discontinued operations includes expenses and income relating to damages and environmental obligations for US subsidiaries of the Hanson group, which was taken over in 2007. In 2011, net loss from discontinued operations amounted to €-22 million (previous year: -28).
Statement of cash flows
Despite a considerable rise in energy costs in the first half of the year, we were able to signifi-cantly increase our internal financing capability in 2011 by consistently pursuing our efficiency improvement and cost-saving programmes and used it to further reduce our financial liabilities as planned.
The cash inflow from operating activities rose by €188 million to €1,332 million (previous year: 1,144). This is primarily due to the increase in operating income before depreciation and the significant improvement of €100 million in working capital. Another contributing factor was the decrease of €144 million in the net interest payments, which was linked to the improved financing structure; the interest received include special items from the refinancing of interest rate swaps amounting to €71 million (previous year: 93). The decrease of €49 million in pay-ments for provisions also helped to increase the operating cash inflow. The increase of €156 million in income tax payments, which was primarily attributable to a one-off effect from tax refunds in North America amounting to €113 million in the first quarter of the previous year, had the opposite effect.
CoMBINED MANAGEMENT REPoRT
Core activities and organisational structure Sustainability
Strategy, management control, and targets Employees and society
2011 business trend Environmental precaution
Additional statements Research and technology
Risk report Procurement | Outlook
Com
bine
d m
anag
emen
t re
port
Cor
pora
te G
over
nanc
eC
onso
lidat
ed f
inan
cial
sta
tem
ents
Add
itio
nal i
nfor
mat
ion
2
3
4
5
Com
bine
d m
anag
emen
t re
port
Cor
pora
te G
over
nanc
eC
onso
lidat
ed f
inan
cial
sta
tem
ents
Add
itio
nal i
nfor
mat
ion
To
our
shar
ehol
ders
2
3
4
5
1
Con
ten
ts
2
62 HeidelbergCement | Annual Report 2011
The cash flow from investing activities increased by €110 million to €758 million (previous year: 648). This was primarily due to the rise of €87 million in cash flow investments to €959 million (previous year: 872). Of this figure, €496 million (previous year: 467) related to investments for sustaining and optimising capacity and €463 million (previous year: 405) to capacity expan-sions. The increase of €140 million in investments in intangible assets and property, plant, and equipment to €874 million (previous year: 734) is predominantly related to expansion projects in Eastern Europe, Asia, and Africa. Payments for the acquisition of subsidiaries and other business units fell by €51 million in comparison with the previous year to €63 million (previ-ous year: 114) and were mainly connected with acquisitions in Sweden, Australia, Canada, and Spain. The largest individual items in the previous year’s figure are the takeover of the majority share of the cement activities of the Forrest Group in the Democratic Republic of Congo for €62 million (US$80 million) and of CJSC “Construction Materials” in Russia for €40 million (US$54 million). More information on the payments for subsidiaries and other business units can be found in the Notes on page 188 f. Investments in other financial assets remained approximately at the previous year’s level, totalling €22 million (previous year: 24).
As a result of lower proceeds from the sale of intangible assets, property, plant, and equipment, and other financial assets, the other inflows of cash and cash equivalents fell by €22 million to €201 million (previous year: 223). In particular, the net proceeds from the sale of excess emission rights decreased by €42 million to €64 million (previous year: 106). The proceeds from the disposal of subsidiaries and other business units amounted to €22 million (previous year: 2) and related mainly to the sale of Solvent Resource Management Limited in the UK for €13 million in cash and the disposal of the German joint venture Heidelberger Betonelemente GmbH & Co. KG for €7 million in cash.
Cash flow from financing activities increased by €944 million in the reporting year to €401 mil-lion (previous year: -543), primarily because of the growth of €1,020 million in the net proceeds from bonds and loans. The increase is essentially due to the issue of two new bonds of €500 million and CHF 150 million and a debt certificate of €289 million. The issue proceeds were used to refinance existing bank debts and to pre-finance the bond of €1 billion maturing in January 2012. Using the uncommitted funds from operating and investing activities, we were able to reduce net debt by €376 million (previous year: 277) to €7,770 million (previous year: 8,146), after exchange rate and other non-cash effects, by means of scheduled repayments of bonds and loans. The change in ownership interests in subsidiaries resulted in a cash outflow of €9 million in the reporting year. In the previous year, this item included a cash inflow of €41 million, which was primarily attributable to the disposal of around 6% of the African activities of the Scancem International Group to IFC and its financial partners for €45 million (US$60 million). Dividend payments led to a cash outflow of €107 million (previous year: 79), including dividend payments of HeidelbergCement AG of €47 million (previous year: 23).
In the 2011 financial year, HeidelbergCement was able to meet its payment obligations at all times.
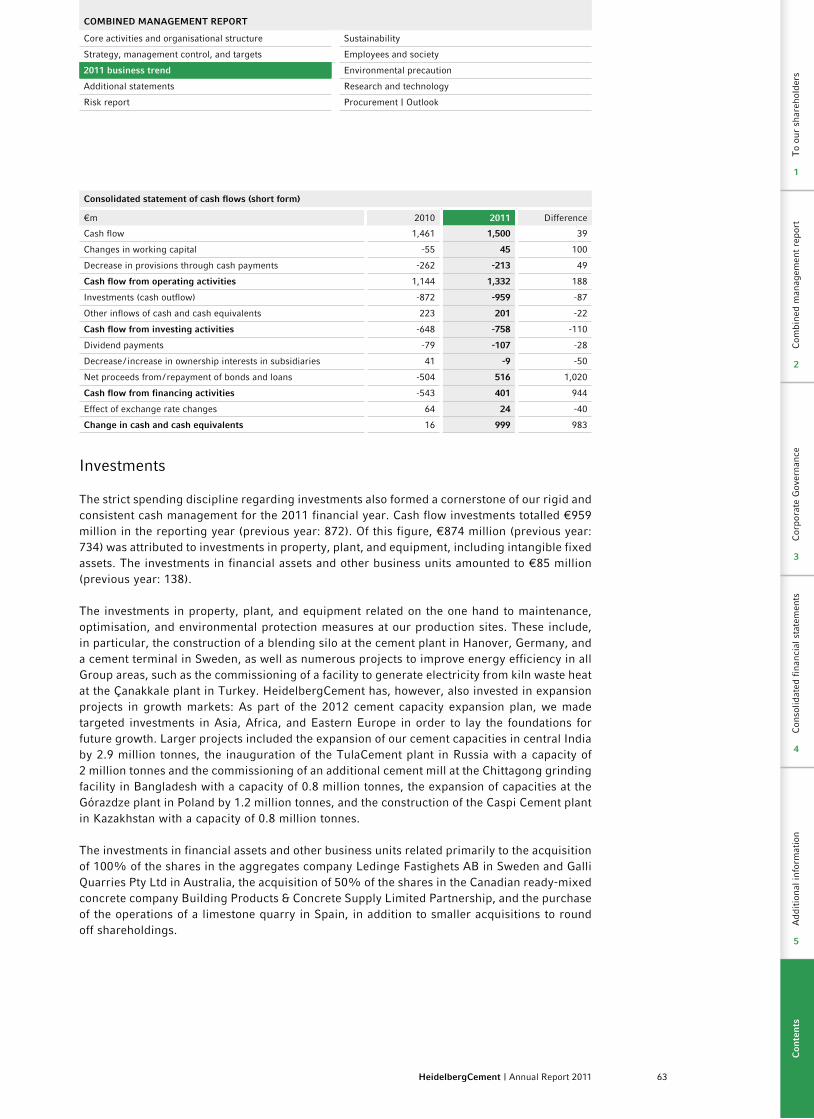
63HeidelbergCement | Annual Report 2011
Consolidated statement of cash flows (short form)
€m 2010 2011 Difference
Cash flow 1,461 1,500 39
Changes in working capital -55 45 100
Decrease in provisions through cash payments -262 -213 49
Cash flow from operating activities 1,144 1,332 188
Investments (cash outflow) -872 -959 -87
Other inflows of cash and cash equivalents 223 201 -22
Cash flow from investing activities -648 -758 -110
Dividend payments -79 -107 -28
Decrease / increase in ownership interests in subsidiaries 41 -9 -50
Net proceeds from / repayment of bonds and loans -504 516 1,020
Cash flow from financing activities -543 401 944
Effect of exchange rate changes 64 24 -40
Change in cash and cash equivalents 16 999 983
Investments
The strict spending discipline regarding investments also formed a cornerstone of our rigid and consistent cash management for the 2011 financial year. Cash flow investments totalled €959 million in the reporting year (previous year: 872). Of this figure, €874 million (previous year: 734) was attributed to investments in property, plant, and equipment, including intangible fixed assets. The investments in financial assets and other business units amounted to €85 million (previous year: 138).
The investments in property, plant, and equipment related on the one hand to maintenance, optimisation, and environmental protection measures at our production sites. These include, in particular, the construction of a blending silo at the cement plant in Hanover, Germany, and a cement terminal in Sweden, as well as numerous projects to improve energy efficiency in all Group areas, such as the commissioning of a facility to generate electricity from kiln waste heat at the Çanakkale plant in Turkey. HeidelbergCement has, however, also invested in expansion projects in growth markets: As part of the 2012 cement capacity expansion plan, we made targeted investments in Asia, Africa, and Eastern Europe in order to lay the foundations for future growth. Larger projects included the expansion of our cement capacities in central India by 2.9 million tonnes, the inauguration of the TulaCement plant in Russia with a capacity of 2 million tonnes and the commissioning of an additional cement mill at the Chittagong grinding facility in Bangladesh with a capacity of 0.8 million tonnes, the expansion of capacities at the Górazdze plant in Poland by 1.2 million tonnes, and the construction of the Caspi Cement plant in Kazakhstan with a capacity of 0.8 million tonnes.
The investments in financial assets and other business units related primarily to the acquisition of 100% of the shares in the aggregates company Ledinge Fastighets AB in Sweden and Galli Quarries Pty Ltd in Australia, the acquisition of 50% of the shares in the Canadian ready-mixed concrete company Building Products & Concrete Supply Limited Partnership, and the purchase of the operations of a limestone quarry in Spain, in addition to smaller acquisitions to round off shareholdings.
CoMBINED MANAGEMENT REPoRT
Core activities and organisational structure Sustainability
Strategy, management control, and targets Employees and society
2011 business trend Environmental precaution
Additional statements Research and technology
Risk report Procurement | Outlook
Com
bine
d m
anag
emen
t re
port
Cor
pora
te G
over
nanc
eC
onso
lidat
ed f
inan
cial
sta
tem
ents
Add
itio
nal i
nfor
mat
ion
2
3
4
5
Com
bine
d m
anag
emen
t re
port
Cor
pora
te G
over
nanc
eC
onso
lidat
ed f
inan
cial
sta
tem
ents
Add
itio
nal i
nfor
mat
ion
To
our
shar
ehol
ders
2
3
4
5
1
Con
ten
ts
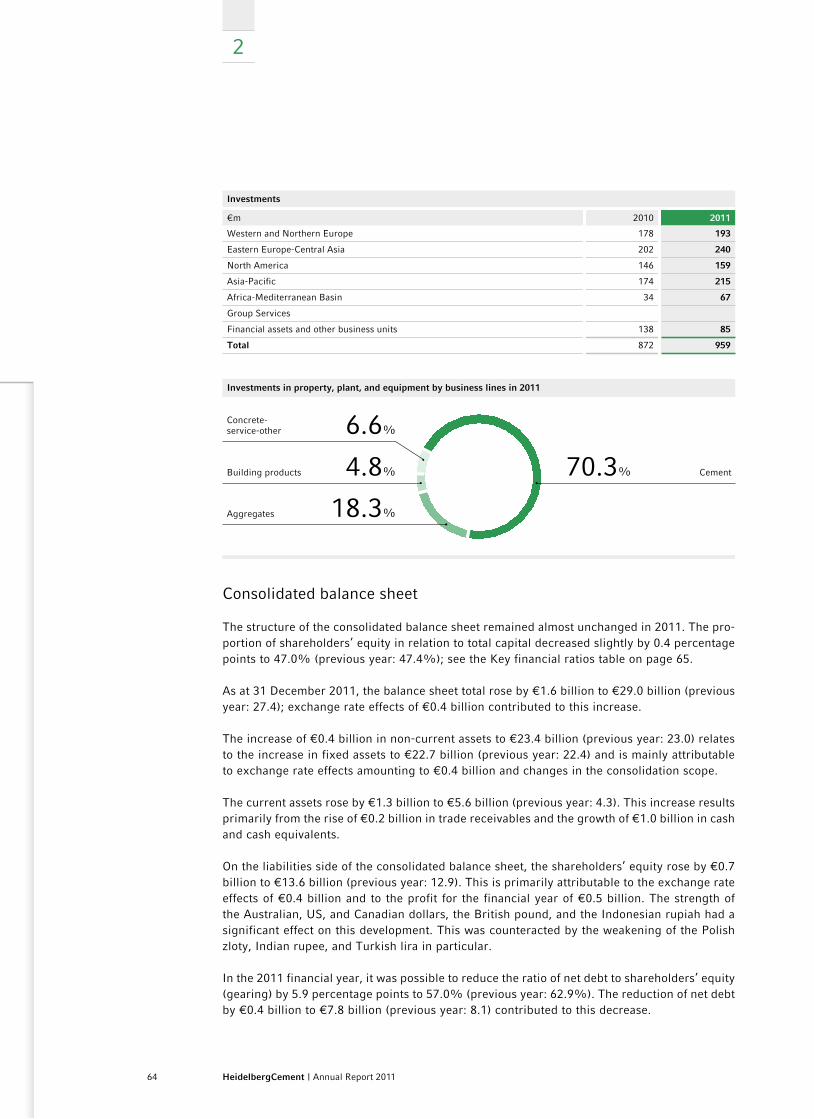
2
64 HeidelbergCement | Annual Report 2011
Investments
€m 2010 2011
Western and Northern Europe 178 193
Eastern Europe-Central Asia 202 240
North America 146 159
Asia-Pacific 174 215
Africa-Mediterranean Basin 34 67
Group Services
Financial assets and other business units 138 85
Total 872 959
Investments in property, plant, and equipment by business lines in 2011
6.6%
Building products
Concrete-service-other
4.8% Cement70.3%
Aggregates 18.3%
Consolidated balance sheet
The structure of the consolidated balance sheet remained almost unchanged in 2011. The pro-portion of shareholders’ equity in relation to total capital decreased slightly by 0.4 percentage points to 47.0% (previous year: 47.4%); see the Key financial ratios table on page 65.
As at 31 December 2011, the balance sheet total rose by €1.6 billion to €29.0 billion (previous year: 27.4); exchange rate effects of €0.4 billion contributed to this increase.
The increase of €0.4 billion in non-current assets to €23.4 billion (previous year: 23.0) relates to the increase in fixed assets to €22.7 billion (previous year: 22.4) and is mainly attributable to exchange rate effects amounting to €0.4 billion and changes in the consolidation scope.
The current assets rose by €1.3 billion to €5.6 billion (previous year: 4.3). This increase results primarily from the rise of €0.2 billion in trade receivables and the growth of €1.0 billion in cash and cash equivalents.
On the liabilities side of the consolidated balance sheet, the shareholders’ equity rose by €0.7 billion to €13.6 billion (previous year: 12.9). This is primarily attributable to the exchange rate effects of €0.4 billion and to the profit for the financial year of €0.5 billion. The strength of the Australian, US, and Canadian dollars, the British pound, and the Indonesian rupiah had a significant effect on this development. This was counteracted by the weakening of the Polish zloty, Indian rupee, and Turkish lira in particular.
In the 2011 financial year, it was possible to reduce the ratio of net debt to shareholders’ equity (gearing) by 5.9 percentage points to 57.0% (previous year: 62.9%). The reduction of net debt by €0.4 billion to €7.8 billion (previous year: 8.1) contributed to this decrease.
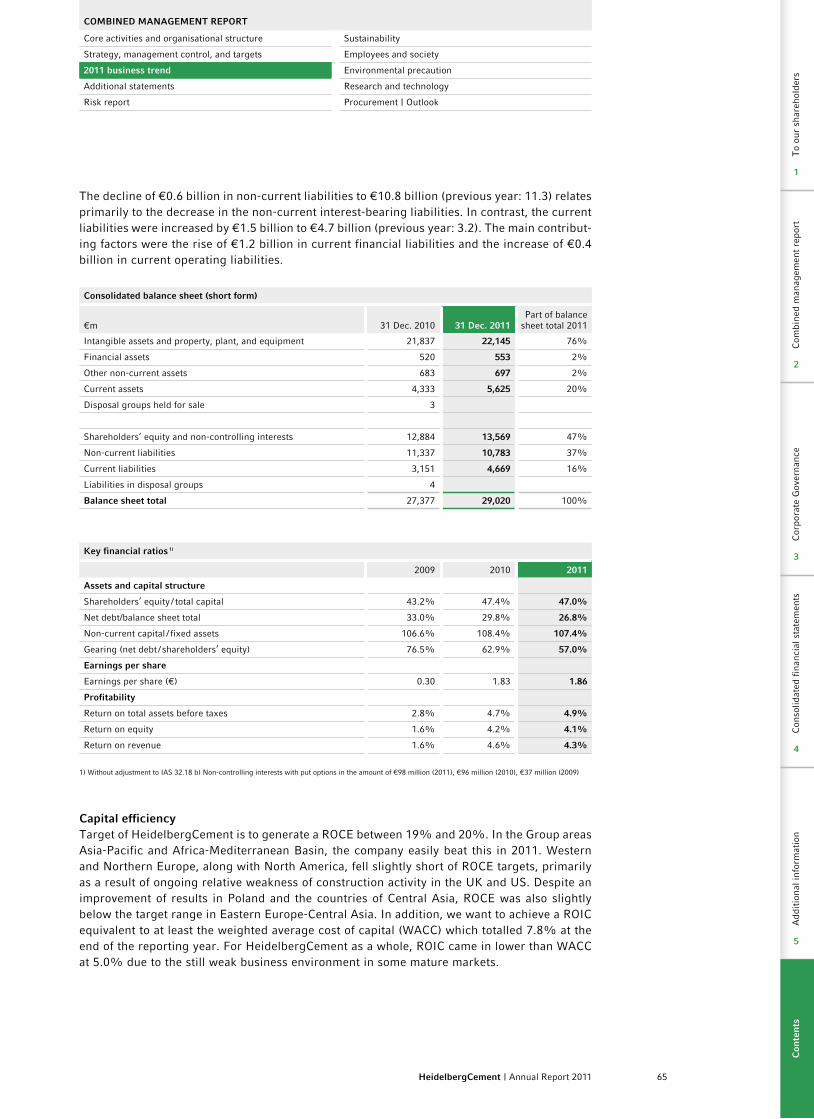
65HeidelbergCement | Annual Report 2011
The decline of €0.6 billion in non-current liabilities to €10.8 billion (previous year: 11.3) relates primarily to the decrease in the non-current interest-bearing liabilities. In contrast, the current liabilities were increased by €1.5 billion to €4.7 billion (previous year: 3.2). The main contribut-ing factors were the rise of €1.2 billion in current financial liabilities and the increase of €0.4 billion in current operating liabilities.
Consolidated balance sheet (short form)
€m 31 Dec. 2010 31 Dec. 2011Part of balance
sheet total 2011
Intangible assets and property, plant, and equipment 21,837 22,145 76%
Financial assets 520 553 2%
Other non-current assets 683 697 2%
Current assets 4,333 5,625 20%
Disposal groups held for sale 3
Shareholders’ equity and non-controlling interests 12,884 13,569 47%
Non-current liabilities 11,337 10,783 37%
Current liabilities 3,151 4,669 16%
Liabilities in disposal groups 4
Balance sheet total 27,377 29,020 100%
Key financial ratios 1)
2009 2010 2011
Assets and capital structure
Shareholders’ equity / total capital 43.2% 47.4% 47.0%
Net debt/balance sheet total 33.0% 29.8% 26.8%
Non-current capital / fixed assets 106.6% 108.4% 107.4%
Gearing (net debt / shareholders’ equity) 76.5% 62.9% 57.0%
Earnings per share
Earnings per share (€) 0.30 1.83 1.86
Profitability
Return on total assets before taxes 2.8% 4.7% 4.9%
Return on equity 1.6% 4.2% 4.1%
Return on revenue 1.6% 4.6% 4.3%
1) Without adjustment to IAS 32.18 b) Non-controlling interests with put options in the amount of €98 million (2011), €96 million (2010), €37 million (2009)
Capital efficiencyTarget of HeidelbergCement is to generate a ROCE between 19% and 20%. In the Group areas Asia-Pacific and Africa-Mediterranean Basin, the company easily beat this in 2011. Western and Northern Europe, along with North America, fell slightly short of ROCE targets, primarily as a result of ongoing relative weakness of construction activity in the UK and US. Despite an improvement of results in Poland and the countries of Central Asia, ROCE was also slightly below the target range in Eastern Europe-Central Asia. In addition, we want to achieve a ROIC equivalent to at least the weighted average cost of capital (WACC) which totalled 7.8% at the end of the reporting year. For HeidelbergCement as a whole, ROIC came in lower than WACC at 5.0% due to the still weak business environment in some mature markets.
CoMBINED MANAGEMENT REPoRT
Core activities and organisational structure Sustainability
Strategy, management control, and targets Employees and society
2011 business trend Environmental precaution
Additional statements Research and technology
Risk report Procurement | Outlook
Com
bine
d m
anag
emen
t re
port
Cor
pora
te G
over
nanc
eC
onso
lidat
ed f
inan
cial
sta
tem
ents
Add
itio
nal i
nfor
mat
ion
2
3
4
5
Com
bine
d m
anag
emen
t re
port
Cor
pora
te G
over
nanc
eC
onso
lidat
ed f
inan
cial
sta
tem
ents
Add
itio
nal i
nfor
mat
ion
To
our
shar
ehol
ders
2
3
4
5
1
Con
ten
ts
2
66 HeidelbergCement | Annual Report 2011
Group financial management
Financial principles and goalsThe objective of external financing is to ensure sufficient liquidity for the Group at all times. The crisis in the international capital markets has emphasised how important it is to focus on liquidity.
Our external financial flexibility is primarily assured by capital markets and a group of major international banks. Within the Group the principle of internal financing applies, i.e. financing requirements of subsidiaries are – where possible – covered by internal loan relationships. In 2011, our subsidiaries were financed according to this principle primarily by our Dutch finance company HeidelbergCement Finance B.V. (HC Finance B.V.) and HeidelbergCement AG. This central financing principle ensures a uniform presence in the capital markets and also in relation to rating agencies, it eliminates structural benefits for individual creditor groups, and strengthens our negotiating position with credit institutions and other market participants. Furthermore, it enables us to allocate liquidity in the most efficient way and to monitor and eliminate the financial risk positions (currencies and interest) across the Group on the basis of net positions.
The Group companies use either liquidity surpluses from other subsidiaries in cash pools (Germany, Scandinavia/Baltic States, United States, Benelux countries, Australia, UK, Canada, Czech Republic, Russia, Spain, and other countries) or are provided with intra-Group loans from HeidelbergCement Finance B.V. or HeidelbergCement AG. In some cases, the Group Treasury department also arranges credit lines for subsidiaries with local banks in order to accommodate legal, tax, or other conditions. Local financing is mainly used for particularly small volumes.
Financing measures – bond issues and debt certificates2011 was characterised by the successful placement of two bonds and a debt certificate issuance. Despite difficult capital market conditions, on 5 October we issued a Eurobond with an issue volume of €300 million and a seven-year term ending on 15 December 2018 via our €10 billion EMTN programme. On 16 November, we tapped the initial bond volume by €200 million to €500 million. The original bond was issued at a price of 99.3% with a fixed interest rate of 9.5%, resulting in a yield to maturity of around 9.6%. The issue price of the tap was 107.5%, giving a rate of return of around 8.1%.
On 14 November, we issued a bond with a six-year term and a volume of CHF 150 million in the capital market. The bond was issued at par with a fixed interest rate of 7.25%.
To further strengthen our financing structure, we issued a debt certificate with a five-year term and a volume of €289 million on 20 December. The debt certificate consists of a tranche of €115.5 million with floating interest rates and a tranche of €173.5 million with a fixed inter-est rate. The fixed interest rate is 6.77% per year, while the variable rate is 4.9% above the six-month Euribor rate. The debt certificate was placed with investors in Germany and abroad.
The €3 billion syndicated credit line from April 2010, which can be used for cash drawings and letters of credit and guarantee facilities, is mainly intended as a liquidity back-up, and as at 31 December 2011, only €256 million had been drawn upon. The free credit line amounted to €2,744 million at year-end 2011 (see following table). Overall, it is thereby ensured that all Group companies have sufficient cash and available headroom for drawings to enable them to successfully finance operational business and new investments.
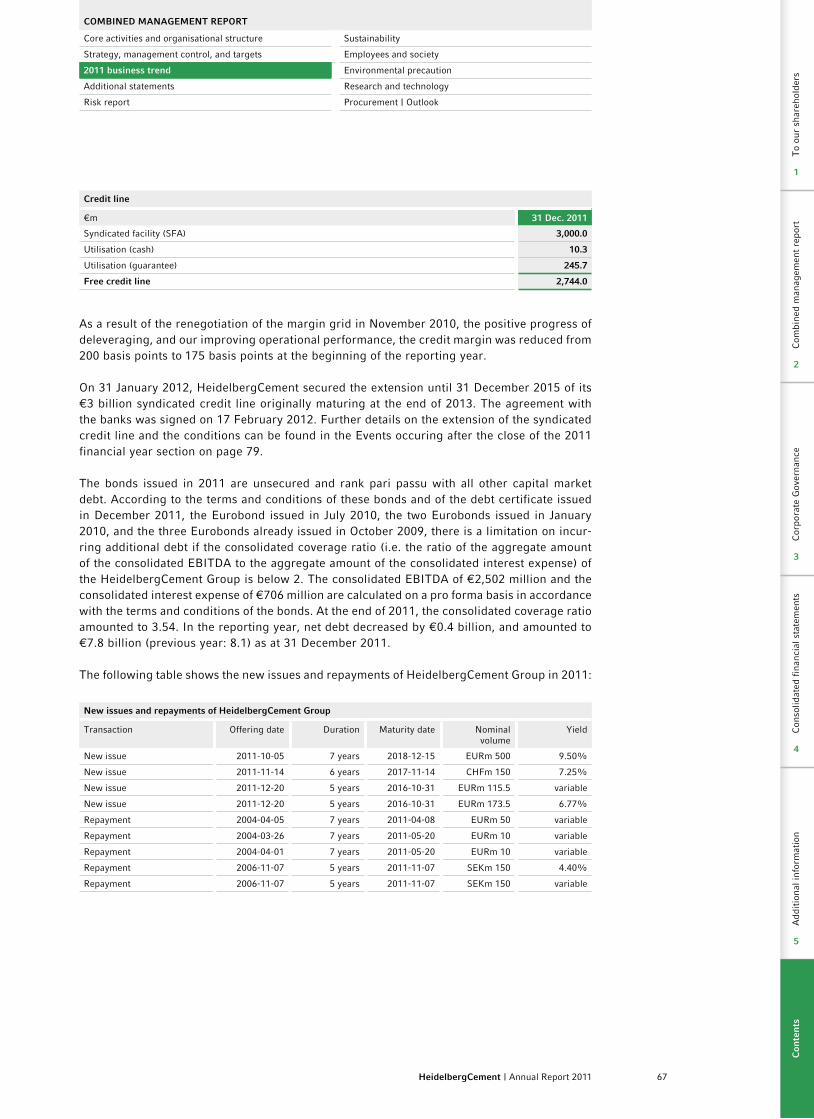
67HeidelbergCement | Annual Report 2011
Credit line
€m 31 Dec. 2011
Syndicated facility (SFA) 3,000.0
Utilisation (cash) 10.3
Utilisation (guarantee) 245.7
Free credit line 2,744.0
As a result of the renegotiation of the margin grid in November 2010, the positive progress of deleveraging, and our improving operational performance, the credit margin was reduced from 200 basis points to 175 basis points at the beginning of the reporting year.
On 31 January 2012, HeidelbergCement secured the extension until 31 December 2015 of its €3 billion syndicated credit line originally maturing at the end of 2013. The agreement with the banks was signed on 17 February 2012. Further details on the extension of the syndicated credit line and the conditions can be found in the Events occuring after the close of the 2011 financial year section on page 79.
The bonds issued in 2011 are unsecured and rank pari passu with all other capital market debt. According to the terms and conditions of these bonds and of the debt certificate issued in December 2011, the Eurobond issued in July 2010, the two Eurobonds issued in January 2010, and the three Eurobonds already issued in October 2009, there is a limitation on incur-ring additional debt if the consolidated coverage ratio (i.e. the ratio of the aggregate amount of the consolidated EBITDA to the aggregate amount of the consolidated interest expense) of the HeidelbergCement Group is below 2. The consolidated EBITDA of €2,502 million and the consolidated interest expense of €706 million are calculated on a pro forma basis in accordance with the terms and conditions of the bonds. At the end of 2011, the consolidated coverage ratio amounted to 3.54. In the reporting year, net debt decreased by €0.4 billion, and amounted to €7.8 billion (previous year: 8.1) as at 31 December 2011.
The following table shows the new issues and repayments of HeidelbergCement Group in 2011:
New issues and repayments of HeidelbergCement Group
Transaction Offering date Duration Maturity date Nominal volume
Yield
New issue 2011-10-05 7 years 2018-12-15 EURm 500 9.50%
New issue 2011-11-14 6 years 2017-11-14 CHFm 150 7.25%
New issue 2011-12-20 5 years 2016-10-31 EURm 115.5 variable
New issue 2011-12-20 5 years 2016-10-31 EURm 173.5 6.77%
Repayment 2004-04-05 7 years 2011-04-08 EURm 50 variable
Repayment 2004-03-26 7 years 2011-05-20 EURm 10 variable
Repayment 2004-04-01 7 years 2011-05-20 EURm 10 variable
Repayment 2006-11-07 5 years 2011-11-07 SEKm 150 4.40%
Repayment 2006-11-07 5 years 2011-11-07 SEKm 150 variable
CoMBINED MANAGEMENT REPoRT
Core activities and organisational structure Sustainability
Strategy, management control, and targets Employees and society
2011 business trend Environmental precaution
Additional statements Research and technology
Risk report Procurement | Outlook
Com
bine
d m
anag
emen
t re
port
Cor
pora
te G
over
nanc
eC
onso
lidat
ed f
inan
cial
sta
tem
ents
Add
itio
nal i
nfor
mat
ion
2
3
4
5
Com
bine
d m
anag
emen
t re
port
Cor
pora
te G
over
nanc
eC
onso
lidat
ed f
inan
cial
sta
tem
ents
Add
itio
nal i
nfor
mat
ion
To
our
shar
ehol
ders
2
3
4
5
1
Con
ten
ts
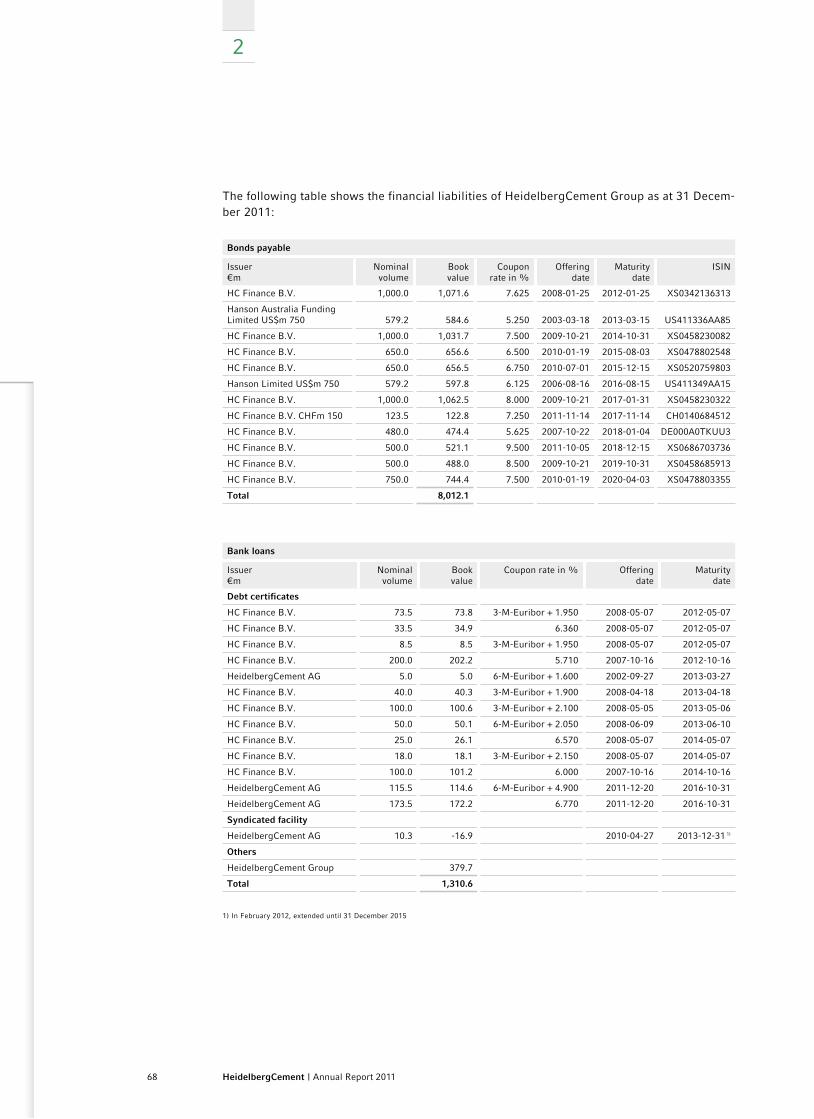
2
68 HeidelbergCement | Annual Report 2011
The following table shows the financial liabilities of HeidelbergCement Group as at 31 Decem-ber 2011:
Bonds payable
Issuer€m
Nominal volume
Book value
Coupon rate in %
Offering date
Maturity date
ISIN
HC Finance B.V. 1,000.0 1,071.6 7.625 2008-01-25 2012-01-25 XS0342136313
Hanson Australia Funding Limited US$m 750 579.2 584.6 5.250 2003-03-18 2013-03-15 US411336AA85
HC Finance B.V. 1,000.0 1,031.7 7.500 2009-10-21 2014-10-31 XS0458230082
HC Finance B.V. 650.0 656.6 6.500 2010-01-19 2015-08-03 XS0478802548
HC Finance B.V. 650.0 656.5 6.750 2010-07-01 2015-12-15 XS0520759803
Hanson Limited US$m 750 579.2 597.8 6.125 2006-08-16 2016-08-15 US411349AA15
HC Finance B.V. 1,000.0 1,062.5 8.000 2009-10-21 2017-01-31 XS0458230322
HC Finance B.V. CHFm 150 123.5 122.8 7.250 2011-11-14 2017-11-14 CH0140684512
HC Finance B.V. 480.0 474.4 5.625 2007-10-22 2018-01-04 DE000A0TKUU3
HC Finance B.V. 500.0 521.1 9.500 2011-10-05 2018-12-15 XS0686703736
HC Finance B.V. 500.0 488.0 8.500 2009-10-21 2019-10-31 XS0458685913
HC Finance B.V. 750.0 744.4 7.500 2010-01-19 2020-04-03 XS0478803355
Total 8,012.1
Bank loans
Issuer€m
Nominal volume
Book value
Coupon rate in % Offering date
Maturity date
Debt certificates
HC Finance B.V. 73.5 73.8 3-M-Euribor + 1.950 2008-05-07 2012-05-07
HC Finance B.V. 33.5 34.9 6.360 2008-05-07 2012-05-07
HC Finance B.V. 8.5 8.5 3-M-Euribor + 1.950 2008-05-07 2012-05-07
HC Finance B.V. 200.0 202.2 5.710 2007-10-16 2012-10-16
HeidelbergCement AG 5.0 5.0 6-M-Euribor + 1.600 2002-09-27 2013-03-27
HC Finance B.V. 40.0 40.3 3-M-Euribor + 1.900 2008-04-18 2013-04-18
HC Finance B.V. 100.0 100.6 3-M-Euribor + 2.100 2008-05-05 2013-05-06
HC Finance B.V. 50.0 50.1 6-M-Euribor + 2.050 2008-06-09 2013-06-10
HC Finance B.V. 25.0 26.1 6.570 2008-05-07 2014-05-07
HC Finance B.V. 18.0 18.1 3-M-Euribor + 2.150 2008-05-07 2014-05-07
HC Finance B.V. 100.0 101.2 6.000 2007-10-16 2014-10-16
HeidelbergCement AG 115.5 114.6 6-M-Euribor + 4.900 2011-12-20 2016-10-31
HeidelbergCement AG 173.5 172.2 6.770 2011-12-20 2016-10-31
Syndicated facility
HeidelbergCement AG 10.3 -16.9 2010-04-27 2013-12-31 1)
others
HeidelbergCement Group 379.7
Total 1,310.6
1) In February 2012, extended until 31 December 2015
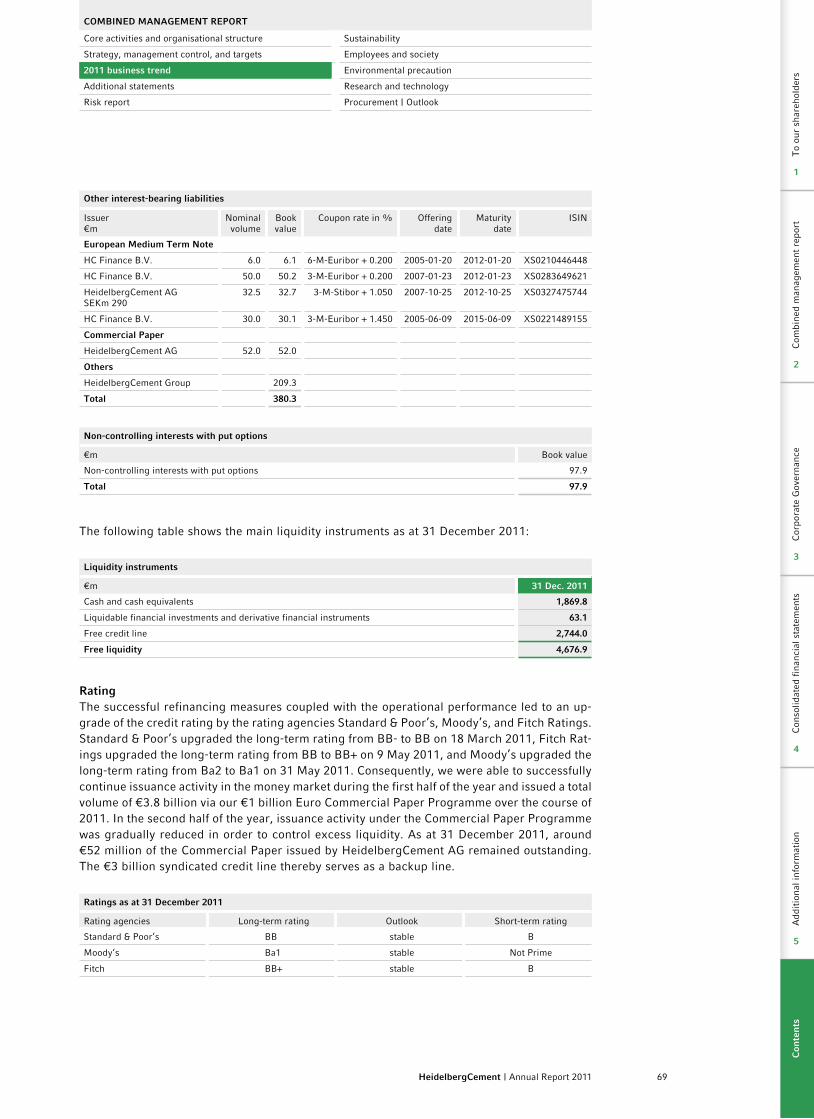
69HeidelbergCement | Annual Report 2011
other interest-bearing liabilities
Issuer€m
Nominal volume
Book value
Coupon rate in % Offering date
Maturity date
ISIN
European Medium Term Note
HC Finance B.V. 6.0 6.1 6-M-Euribor + 0.200 2005-01-20 2012-01-20 XS0210446448
HC Finance B.V. 50.0 50.2 3-M-Euribor + 0.200 2007-01-23 2012-01-23 XS0283649621
HeidelbergCement AG SEKm 290
32.5 32.7 3-M-Stibor + 1.050 2007-10-25 2012-10-25 XS0327475744
HC Finance B.V. 30.0 30.1 3-M-Euribor + 1.450 2005-06-09 2015-06-09 XS0221489155
Commercial Paper
HeidelbergCement AG 52.0 52.0
others
HeidelbergCement Group 209.3
Total 380.3
Non-controlling interests with put options
€m Book value
Non-controlling interests with put options 97.9
Total 97.9
The following table shows the main liquidity instruments as at 31 December 2011:
Liquidity instruments
€m 31 Dec. 2011
Cash and cash equivalents 1,869.8
Liquidable financial investments and derivative financial instruments 63.1
Free credit line 2,744.0
Free liquidity 4,676.9
RatingThe successful refinancing measures coupled with the operational performance led to an up-grade of the credit rating by the rating agencies Standard & Poor’s, Moody’s, and Fitch Ratings. Standard & Poor’s upgraded the long-term rating from BB- to BB on 18 March 2011, Fitch Rat-ings upgraded the long-term rating from BB to BB+ on 9 May 2011, and Moody’s upgraded the long-term rating from Ba2 to Ba1 on 31 May 2011. Consequently, we were able to successfully continue issuance activity in the money market during the first half of the year and issued a total volume of €3.8 billion via our €1 billion Euro Commercial Paper Programme over the course of 2011. In the second half of the year, issuance activity under the Commercial Paper Programme was gradually reduced in order to control excess liquidity. As at 31 December 2011, around €52 million of the Commercial Paper issued by HeidelbergCement AG remained outstanding. The €3 billion syndicated credit line thereby serves as a backup line.
Ratings as at 31 December 2011
Rating agencies Long-term rating Outlook Short-term rating
Standard & Poor‘s BB stable B
Moody‘s Ba1 stable Not Prime
Fitch BB+ stable B
CoMBINED MANAGEMENT REPoRT
Core activities and organisational structure Sustainability
Strategy, management control, and targets Employees and society
2011 business trend Environmental precaution
Additional statements Research and technology
Risk report Procurement | Outlook
Com
bine
d m
anag
emen
t re
port
Cor
pora
te G
over
nanc
eC
onso
lidat
ed f
inan
cial
sta
tem
ents
Add
itio
nal i
nfor
mat
ion
2
3
4
5
Com
bine
d m
anag
emen
t re
port
Cor
pora
te G
over
nanc
eC
onso
lidat
ed f
inan
cial
sta
tem
ents
Add
itio
nal i
nfor
mat
ion
To
our
shar
ehol
ders
2
3
4
5
1
Con
ten
ts
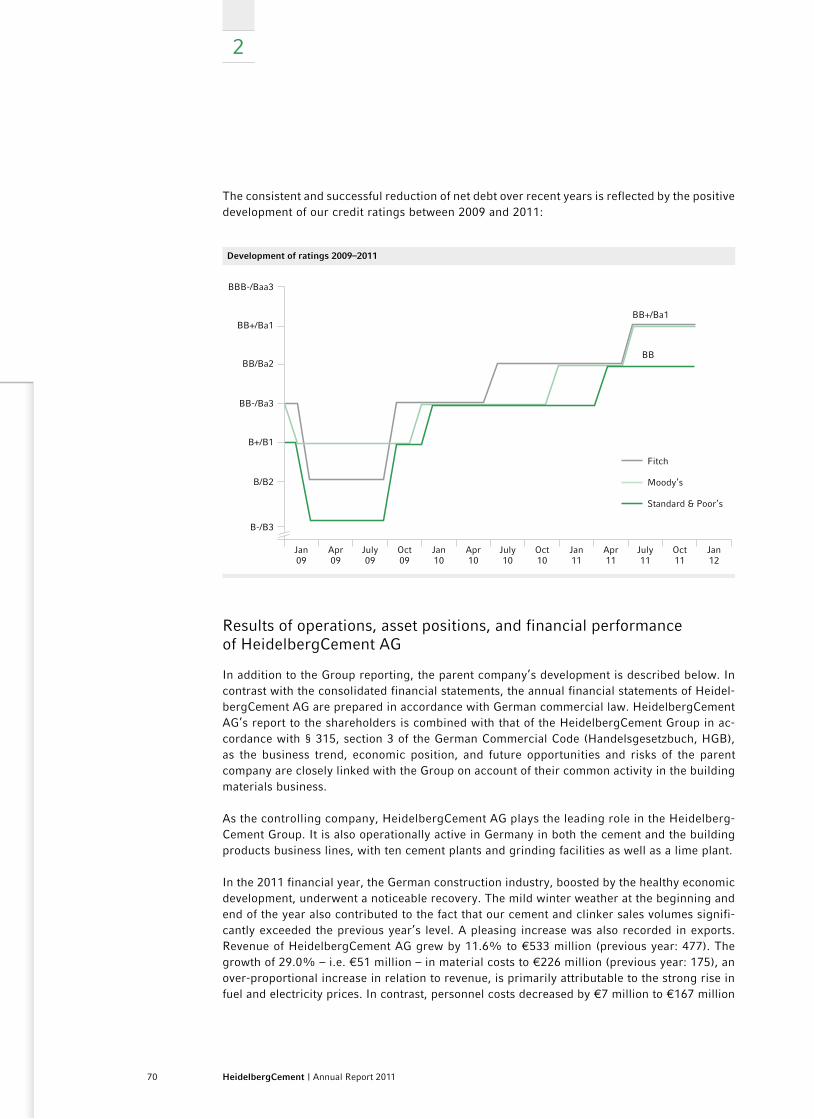
2
70 HeidelbergCement | Annual Report 2011
The consistent and successful reduction of net debt over recent years is reflected by the positive development of our credit ratings between 2009 and 2011:
Development of ratings 2009–2011
Jan09
Fitch
Moody’s
Standard & Poor’s
Apr09
July09
Oct09
Jan10
Apr10
July10
Oct10
Jan11
Apr11
July11
Oct11
Jan12
BBB-/Baa3
BB+/Ba1
BB
B-/B3
BB+/Ba1
BB/Ba2
BB-/Ba3
B+/B1
B/B2
Results of operations, asset positions, and financial performance of HeidelbergCement AG
In addition to the Group reporting, the parent company’s development is described below. In contrast with the consolidated financial statements, the annual financial statements of Heidel-bergCement AG are prepared in accordance with German commercial law. HeidelbergCement AG’s report to the shareholders is combined with that of the HeidelbergCement Group in ac-cordance with § 315, section 3 of the German Commercial Code (Handelsgesetzbuch, HGB), as the business trend, economic position, and future opportunities and risks of the parent company are closely linked with the Group on account of their common activity in the building materials business.
As the controlling company, HeidelbergCement AG plays the leading role in the Heidelberg-Cement Group. It is also operationally active in Germany in both the cement and the building products business lines, with ten cement plants and grinding facilities as well as a lime plant.
In the 2011 financial year, the German construction industry, boosted by the healthy economic development, underwent a noticeable recovery. The mild winter weather at the beginning and end of the year also contributed to the fact that our cement and clinker sales volumes signifi-cantly exceeded the previous year’s level. A pleasing increase was also recorded in exports. Revenue of HeidelbergCement AG grew by 11.6% to €533 million (previous year: 477). The growth of 29.0% – i.e. €51 million – in material costs to €226 million (previous year: 175), an over-proportional increase in relation to revenue, is primarily attributable to the strong rise in fuel and electricity prices. In contrast, personnel costs decreased by €7 million to €167 million
71HeidelbergCement | Annual Report 2011
(previous year: 174), largely because the expenditure connected with the social plan for the closure of the Wetzlar cement plant was included in the 2010 figure. The other operating ex-penses fell significantly by €47 million to €233 million (previous year: 280); the previous year’s value was characterised by a loss of €100 million from the merger of HC Zementwerk Hannover GmbH into HeidelbergCement AG. Overall, earnings before interest and taxes (EBIT) improved by €63 million to €2 million (previous year: -61).
Owing to the poorer development of results of directly held subsidiaries, results from participa-tions decreased to €-18 million (previous year: -7). The interest income from loans fell by €179 million to €78 million (previous year: 257). One reason for this decline is the transfer of loans of €2.5 billion granted to HeidelbergCement UK Holding Limited, UK, to the 100% Dutch sub-sidiary HeidelbergCement Finance B.V. in July 2010. To allow HeidelbergCement Finance B.V. to replace HeidelbergCement AG as the issuer of the three Eurobonds issued in October 2009 with a total issue volume of €2.5 billion and the two Eurobonds issued in January 2010 with a total volume of €1.4 billion, these bonds were transferred to HeidelbergCement Finance B.V. Another reason for the decline in interest income from loans is the sale of a loan of €2.8 billion granted to HeidelbergCement UK Holding Limited to St Yvette S.à.r.l., Luxembourg, as part of internal Group restructuring measures in the reporting year. The other interest and similar earnings fell by €205 million to €334 million (previous year: 539). The previous year’s value was characterised by proceeds from interest rate swaps, including income from the close-out of interest rate swaps with positive market value. The decline of €347 million in interest and similar expenses to €286 million (previous year: 633) relates to the discontinuation of interest expenses that had been incurred since July 2010 for the Eurobonds issued in October 2009 and January 2010, as well as to reduced expenses from interest rate swaps including losses from the transfer at negative market values to HeidelbergCement Finance B.V. in December 2010. The previous year’s value was also marked by the amortisation of the transaction costs for the syndicated credit lines from June 2009 and April 2010 as well as the amortisation of the transaction costs and discount of the Eurobonds issued in January 2010. Income taxes fell by €31 million to €16 million (previous year: 47), primarily because of tax optimisation measures, a merger loss in the previous year that could not be recognised for tax purposes, and tax ad-justments for previous years. Overall, the profit for the financial year amounted to €57 million (previous year: 47), while balance sheet profit amounted to €70 million (previous year: 63).
The balance sheet total rose by €1.1 billion in comparison with the previous year to €17.4 bil-lion (previous year: 16.3). This increase primarily reflects the rise of €1.1 billion in liabilities to affiliated companies in connection with financing activities of HeidelbergCement AG as in-house bank of the Group.
On the assets side, shares in affiliated companies rose by €4.0 billion to €11.7 billion (previous year: 7.6). This is essentially due to the increase in the capital reserves of HeidelbergCement International Holding GmbH, Heidelberg, against contributions in kind by way of the recovery of receivables from St Yvette S.à.r.l. amounting to €3.7 billion and against a cash contribution of €353 million. The decline of €2.7 billion in loans to affiliated companies to €0.8 billion (previous year: 3.5) is primarily attributable to the aforementioned sale of a loan of €2.8 billion granted to HeidelbergCement UK Holding Limited to St Yvette S.à.r.l. Overall, financial assets increased by just under €1.4 billion to €12.5 billion (previous year: 11.2). Total fixed assets also rose by a similar amount to €12.8 billion (previous year: 11.5). In current assets, the receivables and other assets fell to €4.0 billion (previous year: 4.8). This decrease is essentially a result of the decline in receivables from affiliated companies to €4.0 billion (previous year: 4.7). Cash and cash equivalents increased by €466 million to €470 million (previous year: 4).
CoMBINED MANAGEMENT REPoRT
Core activities and organisational structure Sustainability
Strategy, management control, and targets Employees and society
2011 business trend Environmental precaution
Additional statements Research and technology
Risk report Procurement | Outlook
Com
bine
d m
anag
emen
t re
port
Cor
pora
te G
over
nanc
eC
onso
lidat
ed f
inan
cial
sta
tem
ents
Add
itio
nal i
nfor
mat
ion
2
3
4
5
Com
bine
d m
anag
emen
t re
port
Cor
pora
te G
over
nanc
eC
onso
lidat
ed f
inan
cial
sta
tem
ents
Add
itio
nal i
nfor
mat
ion
To
our
shar
ehol
ders
2
3
4
5
1
Con
ten
ts
2
72 HeidelbergCement | Annual Report 2011
On the liabilities side, the shareholders’ equity remained largely unchanged at €11.6 billion (pre-vious year: 11.6), as did the provisions at €0.6 billion (previous year: 0.6). In contrast, liabilities increased by €1.1 billion to €5.1 billion (previous year: 4.0). This primarily reflects the rise of €1.1 billion in liabilities to affiliated companies to €4.7 billion (previous year: 3.6) in connection with Group financing activities.
Evaluation of the economic situation by Group management
The 2011 financial year was characterised by a pleasing rise in demand for building materials in the Group areas of HeidelbergCement. In the emerging countries of Asia and Africa, consump-tion continued to be boosted by the sustained economic growth. As a result of the continued economic recovery, demand for building materials grew in most of the European countries in which we operate, as well as in the US. Our results benefited from the fact that we are not represented, or represented only to a very limited extent, in the crisis countries of Southern Europe and the countries undergoing political upheaval in North Africa. In addition, the mild winter weather in Europe at the beginning and end of the year had a positive impact on our business development.
As the market leader for aggregates and one of the leading manufacturers of cement with vertically integrated activities, we were still able to benefit from infrastructure programmes that were coming to an end, particularly in North America. Private residential construction and commercial construction followed the positive general economic development in our Group countries. Thanks to our advantageous geographical positioning in local growth markets in emerging countries and in the mature markets of North America and Europe, and because of our successful measures to reduce costs and increase efficiency via our “FOX 2013” programme, we were able to at least partially offset the margin pressure that resulted from the significant rise in energy costs. This allowed us to achieve a moderate increase in operating income in comparison with the previous year. The profit for the financial year also benefited from the decline in financing costs.
The financing structure of HeidelbergCement improved further in 2011. The sustainably high cash inflow from operating activities enabled us to reduce net debt from €8.1 billion at the end of 2010 to €7.8 billion at the end of 2011. At the same time, we continued our disciplined and targeted investments to expand cement capacities in attractive growth markets. With the success-ful placement of two bonds and a debt certificate, we also increased our liquidity reserves in view of the uncertainties on the financial markets and further improved the maturity profile. As a result, the available liquidity rose to €4.7 billion at the end of 2011.
Comparison of the business trend with the previous year’s forecasts
Revenue forecastThe forecast for 2011 issued by the Managing Board in the 2010 Annual Report indicated that revenue would increase moderately with comparable exchange rates. This forecast was based
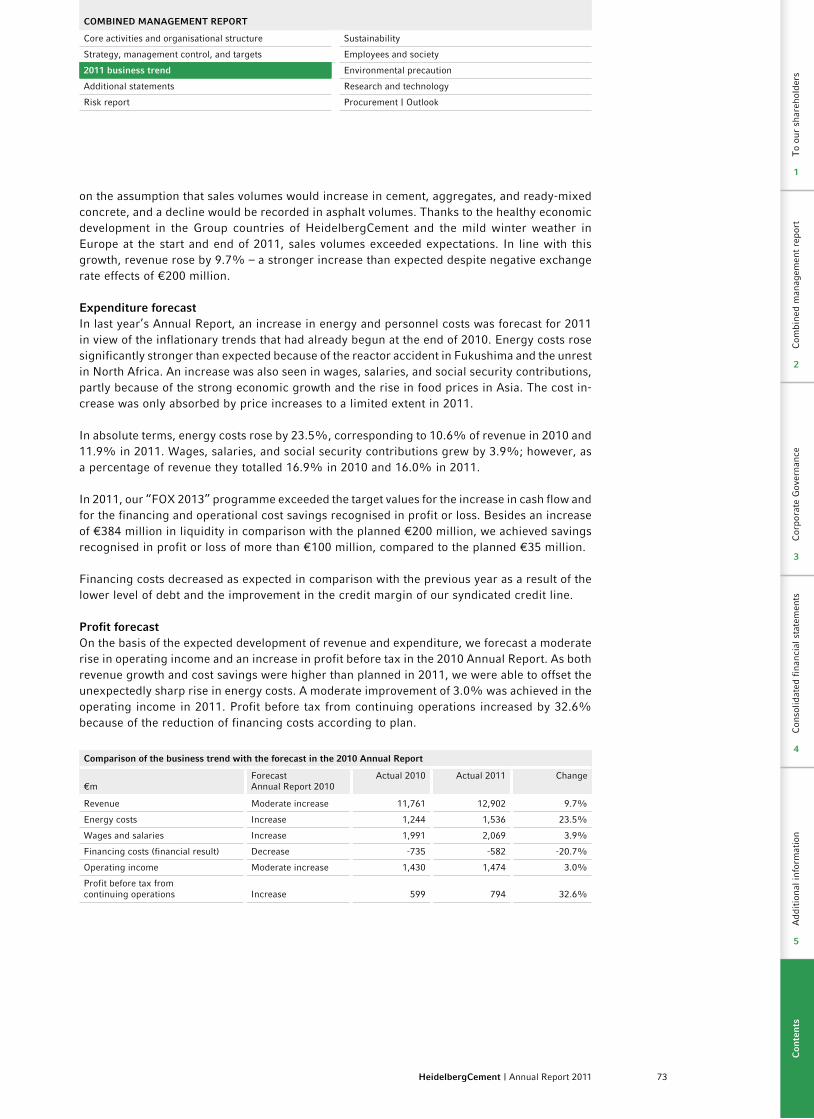
73HeidelbergCement | Annual Report 2011
on the assumption that sales volumes would increase in cement, aggregates, and ready-mixed concrete, and a decline would be recorded in asphalt volumes. Thanks to the healthy economic development in the Group countries of HeidelbergCement and the mild winter weather in Europe at the start and end of 2011, sales volumes exceeded expectations. In line with this growth, revenue rose by 9.7% – a stronger increase than expected despite negative exchange rate effects of €200 million.
Expenditure forecastIn last year’s Annual Report, an increase in energy and personnel costs was forecast for 2011 in view of the inflationary trends that had already begun at the end of 2010. Energy costs rose significantly stronger than expected because of the reactor accident in Fukushima and the unrest in North Africa. An increase was also seen in wages, salaries, and social security contributions, partly because of the strong economic growth and the rise in food prices in Asia. The cost in-crease was only absorbed by price increases to a limited extent in 2011.
In absolute terms, energy costs rose by 23.5%, corresponding to 10.6% of revenue in 2010 and 11.9% in 2011. Wages, salaries, and social security contributions grew by 3.9%; however, as a percentage of revenue they totalled 16.9% in 2010 and 16.0% in 2011.
In 2011, our “FOX 2013” programme exceeded the target values for the increase in cash flow and for the financing and operational cost savings recognised in profit or loss. Besides an increase of €384 million in liquidity in comparison with the planned €200 million, we achieved savings recognised in profit or loss of more than €100 million, compared to the planned €35 million.
Financing costs decreased as expected in comparison with the previous year as a result of the lower level of debt and the improvement in the credit margin of our syndicated credit line.
Profit forecastOn the basis of the expected development of revenue and expenditure, we forecast a moderate rise in operating income and an increase in profit before tax in the 2010 Annual Report. As both revenue growth and cost savings were higher than planned in 2011, we were able to offset the unexpectedly sharp rise in energy costs. A moderate improvement of 3.0% was achieved in the operating income in 2011. Profit before tax from continuing operations increased by 32.6% because of the reduction of financing costs according to plan.
Comparison of the business trend with the forecast in the 2010 Annual Report
€mForecast Annual Report 2010
Actual 2010 Actual 2011 Change
Revenue Moderate increase 11,761 12,902 9.7%
Energy costs Increase 1,244 1,536 23.5%
Wages and salaries Increase 1,991 2,069 3.9%
Financing costs (financial result) Decrease -735 -582 -20.7%
Operating income Moderate increase 1,430 1,474 3.0%
Profit before tax from continuing operations Increase 599 794 32.6%
CoMBINED MANAGEMENT REPoRT
Core activities and organisational structure Sustainability
Strategy, management control, and targets Employees and society
2011 business trend Environmental precaution
Additional statements Research and technology
Risk report Procurement | Outlook
Com
bine
d m
anag
emen
t re
port
Cor
pora
te G
over
nanc
eC
onso
lidat
ed f
inan
cial
sta
tem
ents
Add
itio
nal i
nfor
mat
ion
2
3
4
5
Com
bine
d m
anag
emen
t re
port
Cor
pora
te G
over
nanc
eC
onso
lidat
ed f
inan
cial
sta
tem
ents
Add
itio
nal i
nfor
mat
ion
To
our
shar
ehol
ders
2
3
4
5
1
Con
ten
ts

2
74 HeidelbergCement | Annual Report 2011
Additional statements
Statements in accordance with § 289, section 4 and § 315, section 4 of the German Commercial Code (HGB)
On 31 December 2011, the share capital of HeidelbergCement AG amounted to €562,500,000. It is divided into 187,500,000 no-par value bearer shares, each with a nominal value of €3, which corresponds to a proportionate amount of the subscribed share capital. Each share carries one vote at the Annual General Meeting. All shares carry the same rights and obligations; there are no different classes of shares. The Managing Board knows of no restrictions concerning voting rights or the transfer of shares.
According to information available to the company in accordance with the German Securities Trading Law (Wertpapierhandelsgesetz), as at 31 December 2011, Mr. Ludwig Merckle, Ulm, holds more than 10% of the voting rights in the company. He currently holds 25.11% of the voting rights directly and indirectly via various companies, including UBH Holding GmbH, Zos-sen, and Spohn Cement Beteiligungen GmbH, Zossen. No holder of shares has been granted special rights giving power of control.
The company’s Managing Board is appointed and discharged by the Supervisory Board. The Articles of Association may be amended by the Annual General Meeting with a simple major-ity of the share capital represented at the time of voting, except where a greater majority is required by law. Amendments affecting only the wording of the Articles of Association may be made by the Supervisory Board.
As at 31 December 2011, there were two authorised capitals: namely, authorisation of the Managing Board and Supervisory Board to increase the capital by issuing new shares in return for cash contributions (Authorised Capital I), and authorisation of the Managing Board and Supervisory Board to increase the capital by issuing new shares in return for contributions in kind (Authorised Capital II). The authorised capitals are summarised as below. The complete text of the authorisations can be found in the Articles of Association, which are published on our website www.heidelbergcement.com under “About us/Corporate Governance/Articles of Association”.
Authorised Capital IThe Managing Board is authorised to increase, with the consent of the Supervisory Board, the company’s share capital by a total amount of up to €225,000,000 by issuing new no-par value bearer shares in return for cash contributions on one or more occasions until 5 May 2015 (Authorised Capital I). The shareholders must be granted subscription rights. However, the Managing Board is authorised, in certain cases described in more detail in the authorisation, to exclude the subscription rights of shareholders in order to realise residual amounts or to issue shares totalling up to 10% of the share capital at a near-market price.
75HeidelbergCement | Annual Report 2011
Authorised Capital IIThe Managing Board is also authorised to increase, with the consent of the Supervisory Board, the company’s share capital by a total amount of up to €56,100,000 by issuing new no-par value bearer shares in return for contributions in kind on one or more occasions until 5 May 2015 (Authorised Capital II). The subscription right of shareholders is generally excluded in the case of capital increases in return for contributions in kind. The authorisation governs, in particular, the possibility of excluding the subscription right insofar as the capital increase in return for contributions in kind is performed for the purposes of acquisition of companies or to service option or conversion rights.
As at 31 December 2011, the authorisation to issue new shares in return for cash contributions or contributions in kind forming the basis of the Authorised Capitals I and II had not been used.
Conditional share capitalThe conditional share capital described below existed as at 31 December 2011. The share capital was conditionally increased by a further amount of up to €187,500,000, divided into up to 62,500,000 new no-par value bearer shares (conditional share capital 2009). The conditional capital increase serves to back the issuance of option or conversion rights, or option or conver-sion obligations, on HeidelbergCement shares. The conditional capital increase is only carried out insofar as the Managing Board issues warrant or convertible bonds under the authorisation and the bearers of option or conversion rights make use of their rights. Warrant or convertible bonds may also be issued with option or conversion obligations.
The shareholders generally have a subscription right to newly issued warrant or convertible bonds. The authorisation governs specific cases in which the Managing Board may exclude the subscription right of shareholders to warrant or convertible bonds. The complete text of the conditional share capital can also be found in the Articles of Association, which are published on our website www.heidelbergcement.com under “About us/Corporate Governance/ Articles of Association”.
As at 31 December 2011, the authorisation to issue warrant or convertible bonds forming the basis of the conditional share capital 2009 had not been used.
The company has no treasury shares and there is no authorisation to acquire treasury shares.
A list of the company’s significant agreements contingent on a change of control resulting from a takeover bid, and a summary of the effects thereof, is provided in the following in accord-ance with § 289, section 4, no. 8 and § 315, section 4, no. 8 of the German Commercial Code (HGB). Please note that we are disregarding agreements whose potential consequences for the company fall below the thresholds of €50 million in a singular instance or €100 million in the case of several similar agreements, as they will not normally affect the decision of a potential bidder. These change of control clauses are standard for this industry and type of transaction and have not been agreed with the intention of hindering any takeover bids.
As at 31 December 2011, the following significant agreements of HeidelbergCement AG were contingent on a change of control within HeidelbergCement AG resulting from a takeover bid.
CoMBINED MANAGEMENT REPoRT
Core activities and organisational structure Sustainability
Strategy, management control, and targets Employees and society
2011 business trend Environmental precaution
Additional statements Research and technology
Risk report Procurement | Outlook
Com
bine
d m
anag
emen
t re
port
Cor
pora
te G
over
nanc
eC
onso
lidat
ed f
inan
cial
sta
tem
ents
Add
itio
nal i
nfor
mat
ion
2
3
4
5
Com
bine
d m
anag
emen
t re
port
Cor
pora
te G
over
nanc
eC
onso
lidat
ed f
inan
cial
sta
tem
ents
Add
itio
nal i
nfor
mat
ion
To
our
shar
ehol
ders
2
3
4
5
1
Con
ten
ts
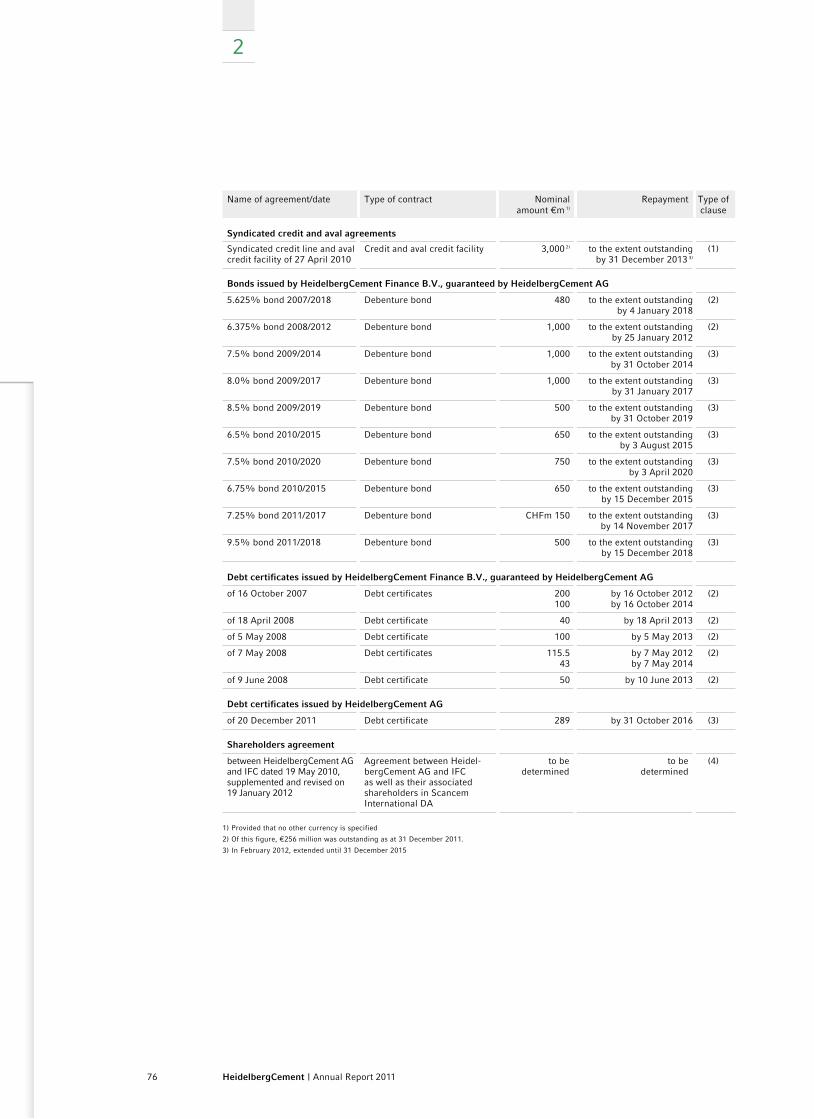
2
76 HeidelbergCement | Annual Report 2011
Name of agreement/date Type of contract Nominal amount €m 1)
Repayment Type of clause
Syndicated credit and aval agreements
Syndicated credit line and aval credit facility of 27 April 2010
Credit and aval credit facility 3,000 2) to the extent outstanding by 31 December 2013 3)
(1)
Bonds issued by HeidelbergCement Finance B.V., guaranteed by HeidelbergCement AG
5.625% bond 2007/2018 Debenture bond 480 to the extent outstanding by 4 January 2018
(2)
6.375% bond 2008/2012 Debenture bond 1,000 to the extent outstanding by 25 January 2012
(2)
7.5% bond 2009/2014 Debenture bond 1,000 to the extent outstanding by 31 October 2014
(3)
8.0% bond 2009/2017 Debenture bond 1,000 to the extent outstanding by 31 January 2017
(3)
8.5% bond 2009/2019 Debenture bond 500 to the extent outstanding by 31 October 2019
(3)
6.5% bond 2010/2015 Debenture bond 650 to the extent outstanding by 3 August 2015
(3)
7.5% bond 2010/2020 Debenture bond 750 to the extent outstanding by 3 April 2020
(3)
6.75% bond 2010/2015 Debenture bond 650 to the extent outstanding by 15 December 2015
(3)
7.25% bond 2011/2017 Debenture bond CHFm 150 to the extent outstanding by 14 November 2017
(3)
9.5% bond 2011/2018 Debenture bond 500 to the extent outstanding by 15 December 2018
(3)
Debt certificates issued by HeidelbergCement Finance B.V., guaranteed by HeidelbergCement AG
of 16 October 2007 Debt certificates 200 100
by 16 October 2012by 16 October 2014
(2)
of 18 April 2008 Debt certificate 40 by 18 April 2013 (2)
of 5 May 2008 Debt certificate 100 by 5 May 2013 (2)
of 7 May 2008 Debt certificates 115.543
by 7 May 2012by 7 May 2014
(2)
of 9 June 2008 Debt certificate 50 by 10 June 2013 (2)
Debt certificates issued by HeidelbergCement AG
of 20 December 2011 Debt certificate 289 by 31 October 2016 (3)
Shareholders agreement
between HeidelbergCement AG and IFC dated 19 May 2010, supplemented and revised on 19 January 2012
Agreement between Heidel-bergCement AG and IFC as well as their associated shareholders in Scancem International DA
to be determined
to be determined
(4)
1) Provided that no other currency is specified
2) Of this figure, €256 million was outstanding as at 31 December 2011.
3) In February 2012, extended until 31 December 2015
77HeidelbergCement | Annual Report 2011
The relevant change of control clauses give the contractual partner or bearer of the bonds or debt certificates the right to immediately accelerate and to demand repayment of the agreement or outstanding loans, debenture bonds, or debt certificates, or to end the common participation in Scancem International DA in the event of a change in the company’s shareholder structure as defined variously below.
The syndicated credit and aval credit facility agreement dated 27 April 2010 marked (1) in the type of clause column gives each bank syndicate creditor the right, in the event of a change of control, to accelerate the loan amount it provided (plus any accrued interest) and to demand repayment accordingly. A change of control is deemed to occur when a person or a group of people acting jointly in the sense of § 2, section 5 of the German Securities Acquisition and Takeover Act (WpÜG) has acquired more than 30% of the shares in the company.
The bonds and debt certificates marked (2) in the type of clause column give each bearer of the debenture bond or debt certificate the right of early termination in the event of changes in the shareholder structure that lead to a change in the control of the company. A change of control is deemed to occur when more than 50% of the subscribed capital or more than 50% of the voting rights are controlled contractually or by other means. In connection with a concept of “registered partner”, a change of control to (a) SC Vermögensverwaltung GmbH (formerly Spohn Cement GmbH) or (b) any partner of SC Vermögensverwaltung GmbH including successors and legatees of partners of SC Vermögensverwaltung GmbH and persons who are beneficial owners of shares in SC Vermögensverwaltung GmbH or (c) any legal person or foundation or comparable institution managed by such persons to whom shares in HeidelbergCement AG were transferred by persons mentioned under (a) to (c) is exempted from the change of control provision and thus from the regulation regarding a right of early termination.
The bonds and debt certificate marked (3) in the type of clause column give each bearer of the debenture bond or debt certificate the right, in the event of a change of control as described below, to demand full or partial repayment of the debt certificate from the company or, in the case of debenture bonds, at the company’s option, the full or partial purchase of his debenture bonds by the company (or, at the company’s request, by a third party) at the ”early repayment amount”. The early repayment amount means, in the case of the debt certificate, 100% of the nominal amount of the debt certificate or, in the case of debenture bonds, 101% of the nominal amount of the debenture bond plus accrued and unpaid interest up to (but not including) the repayment date defined in the bond terms.
A change of control is deemed to occur when one of the following events takes place: – the company becomes aware that a person or group of persons acting in concert in the sense
of § 2, section 5 of the German Securities Acquisition and Takeover Act (WpÜG) has become the legal or beneficial owner of more than 30% of the company’s voting rights, or
– the merger of the company with or into a third person or the merger of a third person with or into the company, or the sale of all or substantially all assets (consolidated) of the company
CoMBINED MANAGEMENT REPoRT
Core activities and organisational structure Sustainability
Strategy, management control, and targets Employees and society
2011 business trend Environmental precaution
Additional statements Research and technology
Risk report Procurement | Outlook
Com
bine
d m
anag
emen
t re
port
Cor
pora
te G
over
nanc
eC
onso
lidat
ed f
inan
cial
sta
tem
ents
Add
itio
nal i
nfor
mat
ion
2
3
4
5
Com
bine
d m
anag
emen
t re
port
Cor
pora
te G
over
nanc
eC
onso
lidat
ed f
inan
cial
sta
tem
ents
Add
itio
nal i
nfor
mat
ion
To
our
shar
ehol
ders
2
3
4
5
1
Con
ten
ts
2
78 HeidelbergCement | Annual Report 2011
to a third person, except in connection with legal transactions, as a result of which (a) in the event of a merger the holders of 100% of the company’s voting rights hold at least the major-ity of the voting rights in the surviving legal entity immediately after such a merger and (b) in the event of the sale of all or substantially all assets, the acquiring legal entity is or becomes a subsidiary of the company and becomes the guarantor for the debenture bonds.
The US$750 million 6.125% bond taken out by Hanson Limited, issued on 16 August 2006 and maturing on 15 August 2016, now guaranteed by HeidelbergCement AG, includes a provision whereby not only the direct but also the indirect acquisition of more than 50% of the shares or voting rights in Hanson Limited may represent a change of control. The acquisition of 30% of the voting rights in HeidelbergCement AG, which indirectly holds 100% of the shares in Hanson Limited, could be regarded as an indirect acquisition. A change of control would grant the bearers of this bond a put option at 101% of the nominal value plus interest against Hanson Limited if, in connection with this change of control, the bond was downgraded below investment grade by Moody’s and Standard & Poor’s. As the bond is already classified below investment grade, this change of control provision is currently not applicable.
In May 2010, HeidelbergCement signed a shareholders agreement, marked (4) in the type of clause column, with International Finance Corporation (IFC), a member of the World Bank Group. The agreement was supplemented and revised on 19 January 2012. This agreement governs the rights of the shareholders in the jointly held Norwegian holding partnership Scancem Inter national DA, which brings together the main African activities of HeidelbergCement in the countries south of the Sahara. The agreement provides IFC and its financial partners with the opportu-nity of selling their indirect holding in Scancem International DA to HeidelbergCement at a price that corresponds to the reference price determined according to certain requirements in the agreement, if an “adverse sponsor change in control” occurs. This is defined as a change in control at HeidelbergCement AG that leads to a mandatory offer, pursuant to the German Securities Acquisition and Takeover Act (WpÜG), for the outside shareholders of Heidelberg-Cement AG, if the purchaser of the control is either included in one of the sanction lists of the UN, EU, France, US, or the World Bank specified in the agreement, or if the purchaser of the control takes action or makes decisions that would end or compromise the objectives planned with the IFC’s participation in Scancem International DA, i.e. the modernisation and expansion of the jointly led activities in the countries south of the Sahara.
Agreements also exist on pension schemes in the United Kingdom, which stipulate that a change of control (not contractually specified) at HeidelbergCement AG must be communicated to the trustees of these pension schemes. If, according to the corresponding regulatory guidelines, a change of control poses a considerable risk to the fulfilment of the pension obligations (Type A Event), the trustees can request negotiations on the suitability of the safeguarding of the pen-sion cover and these can be verified by means of a clearance procedure before the super visory authority, which may lead to the adjustment of the securities.
With the introduction of the new Managing Board remuneration system in November 2010, the HeidelbergCement AG Supervisory Board has decided, in the event of new contracts and the extension of Managing Board contracts in accordance with the German Corporate Governance Code (point 4.2.3), to agree that a possible redundancy payment in the case of early termination of membership of the Managing Board be limited to 150% of the redundancy pay cap, but at the most to the remuneration for the remaining term of the appointment.
The other details required in accordance with § 289, section 4, and § 315, section 4 of the Ger-man Commercial Code (HGB) relate to circumstances that do not exist at HeidelbergCement AG.
79HeidelbergCement | Annual Report 2011
Regional branches
HeidelbergCement has no regional branches either domestically or internationally.
Events occuring after the close of the 2011 financial year
On 25 January 2012, HeidelbergCement repaid the €1 billion Eurobond 2008/2012 by using available liquidity or making use of credit lines. On 31 January 2012, HeidelbergCement secured the extension until 31 December 2015 of its €3 billion syndicated credit line, originally maturing at the end of 2013. All 17 banks involved so far have confirmed their participation and two further banks have joined the syndicate. The agreement was signed on 17 February 2012. The €3 billion multicurrency credit line is intended as a liquidity back-up and can be used for cash drawings and letters of credit and guarantee facilities (see table on page 80). Under the extension, the margins increased by 25 basis points across the existing margin grid, with an additional 50 basis points pricing premium for US dollar drawings. HeidelbergCement paid a one time amendment fee of 45 basis points and pays a first draw fee of 15 basis points whilst all other terms and conditions remained unchanged. The successful extension of the syndicated credit line is proof of the strength of our relationships with our core banks. The fact that, in a difficult financial market environment, two additional banks have joined the syndicate and we were able to limit the margin increase to just 25 basis points, underlines the confidence the banks have in our Group. The extension of the credit line means that we have secured sufficient liquidity until the end of 2015. In this self-arranged credit line, Bank of America/Merrill Lynch, BayernLB, BNP/Fortis, Citigroup, Commerzbank, Danske A/S, Deutsche Bank, Svenska Handelsbanken, Helaba, ING, Intesa, LBBW, Mediobanca, Morgan Stanley, Nordea, RBS, RBI, SEB, and Standard Chartered act as the mandated lead arrangers.
On 8 March 2012, HeidelbergCement issued a Eurobond under its €10 billion EMTN programme with an issue volume of €300 million and a maturity date of 8 March 2016. The bond bears a fixed coupon of 4.00% p.a. The issue price was at 100.0%, resulting in a yield to maturity of 4.00%. The bond is unsecured and ranks pari passu with all other capital market debt. As with all the bonds issued since 2009 and the debt certificate issued in December 2011, the bond terms and conditions include a limitation on incurring additional debt. In addition, the terms and conditions include the same change of control clause as the bonds and debt certificate marked (3) in the type of clause column in the table on page 76. The proceeds of the transaction will be used for general corporate purposes.
CoMBINED MANAGEMENT REPoRT
Core activities and organisational structure Sustainability
Strategy, management control, and targets Employees and society
2011 business trend Environmental precaution
Additional statements Research and technology
Risk report Procurement | Outlook
Com
bine
d m
anag
emen
t re
port
Cor
pora
te G
over
nanc
eC
onso
lidat
ed f
inan
cial
sta
tem
ents
Add
itio
nal i
nfor
mat
ion
2
3
4
5
Com
bine
d m
anag
emen
t re
port
Cor
pora
te G
over
nanc
eC
onso
lidat
ed f
inan
cial
sta
tem
ents
Add
itio
nal i
nfor
mat
ion
To
our
shar
ehol
ders
2
3
4
5
1
Con
ten
ts
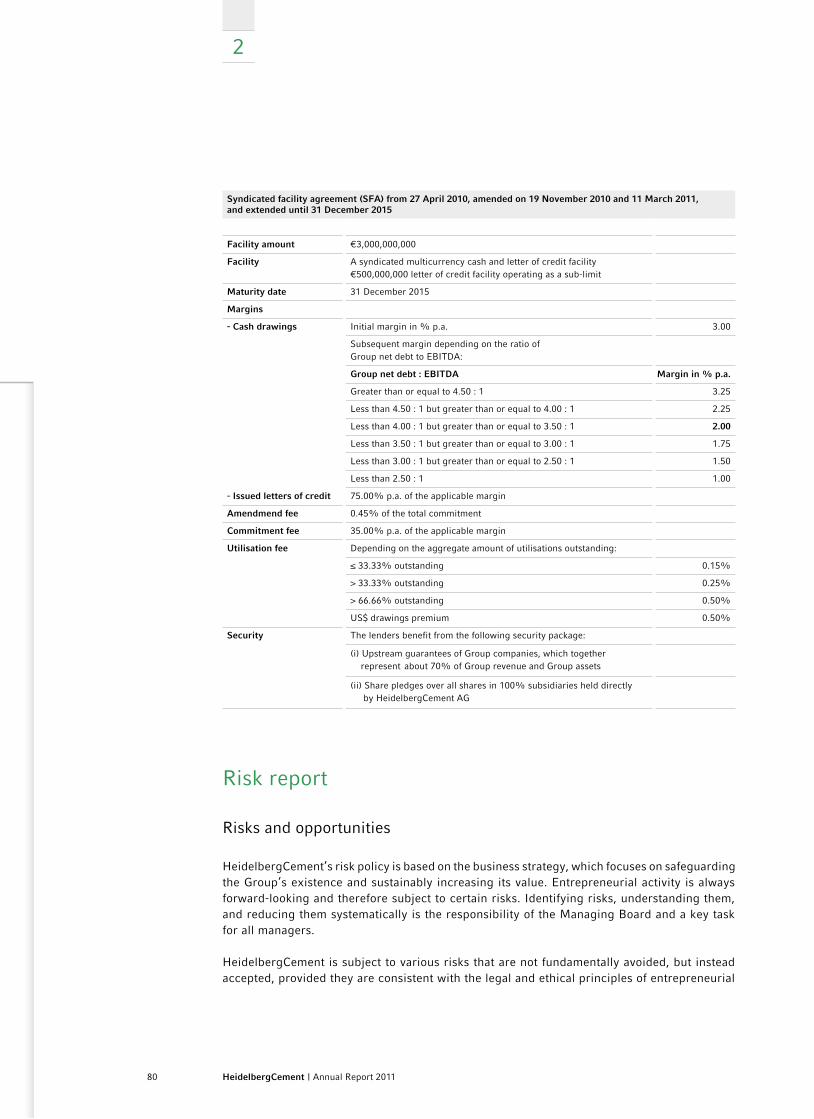
2
80 HeidelbergCement | Annual Report 2011
Syndicated facility agreement (SFA) from 27 April 2010, amended on 19 November 2010 and 11 March 2011, and extended until 31 December 2015
Facility amount €3,000,000,000
Facility A syndicated multicurrency cash and letter of credit facility €500,000,000 letter of credit facility operating as a sub-limit
Maturity date 31 December 2015
Margins
- Cash drawings Initial margin in % p.a. 3.00
Subsequent margin depending on the ratio of Group net debt to EBITDA:
Group net debt : EBITDA Margin in % p.a.
Greater than or equal to 4.50 : 1 3.25
Less than 4.50 : 1 but greater than or equal to 4.00 : 1 2.25
Less than 4.00 : 1 but greater than or equal to 3.50 : 1 2.00
Less than 3.50 : 1 but greater than or equal to 3.00 : 1 1.75
Less than 3.00 : 1 but greater than or equal to 2.50 : 1 1.50
Less than 2.50 : 1 1.00
- Issued letters of credit 75.00% p.a. of the applicable margin
Amendmend fee 0.45% of the total commitment
Commitment fee 35.00% p.a. of the applicable margin
utilisation fee Depending on the aggregate amount of utilisations outstanding:
≤ 33.33% outstanding 0.15%
> 33.33% outstanding 0.25%
> 66.66% outstanding 0.50%
US$ drawings premium 0.50%
Security The lenders benefit from the following security package:
(i) Upstream guarantees of Group companies, which together represent about 70% of Group revenue and Group assets
(ii) Share pledges over all shares in 100% subsidiaries held directly by HeidelbergCement AG
Risk report
Risks and opportunities
HeidelbergCement’s risk policy is based on the business strategy, which focuses on safeguarding the Group’s existence and sustainably increasing its value. Entrepreneurial activity is always forward-looking and therefore subject to certain risks. Identifying risks, understanding them, and reducing them systematically is the responsibility of the Managing Board and a key task for all managers.
HeidelbergCement is subject to various risks that are not fundamentally avoided, but instead accepted, provided they are consistent with the legal and ethical principles of entrepreneurial
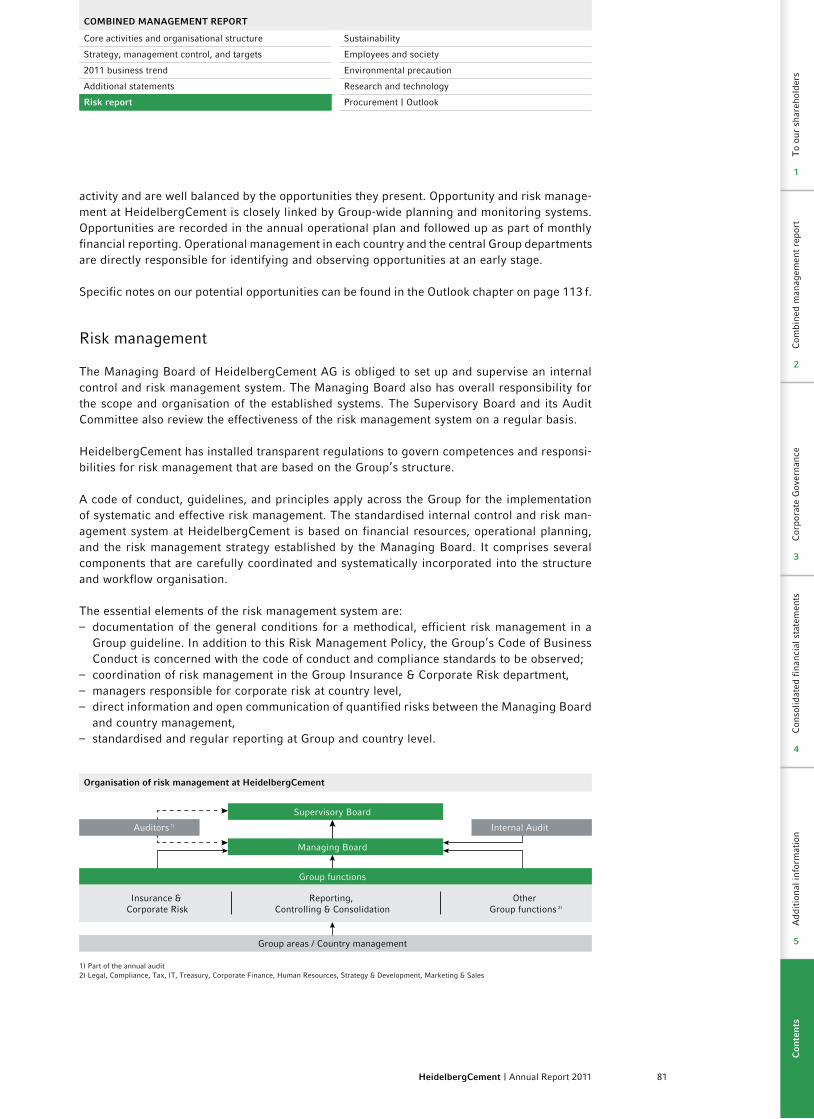
81HeidelbergCement | Annual Report 2011
activity and are well balanced by the opportunities they present. Opportunity and risk manage-ment at HeidelbergCement is closely linked by Group-wide planning and monitoring systems. Opportunities are recorded in the annual operational plan and followed up as part of monthly financial reporting. Operational management in each country and the central Group departments are directly responsible for identifying and observing opportunities at an early stage.
Specific notes on our potential opportunities can be found in the Outlook chapter on page 113 f.
Risk management
The Managing Board of HeidelbergCement AG is obliged to set up and supervise an internal control and risk management system. The Managing Board also has overall responsibility for the scope and organisation of the established systems. The Supervisory Board and its Audit Committee also review the effectiveness of the risk management system on a regular basis.
HeidelbergCement has installed transparent regulations to govern competences and responsi-bilities for risk management that are based on the Group’s structure.
A code of conduct, guidelines, and principles apply across the Group for the implementation of systematic and effective risk management. The standardised internal control and risk man-agement system at HeidelbergCement is based on financial resources, operational planning, and the risk management strategy established by the Managing Board. It comprises several components that are carefully coordinated and systematically incorporated into the structure and workflow organisation.
The essential elements of the risk management system are:– documentation of the general conditions for a methodical, efficient risk management in a
Group guideline. In addition to this Risk Management Policy, the Group’s Code of Business Conduct is concerned with the code of conduct and compliance standards to be observed;
– coordination of risk management in the Group Insurance & Corporate Risk department, – managers responsible for corporate risk at country level,– direct information and open communication of quantified risks between the Managing Board
and country management,– standardised and regular reporting at Group and country level.
organisation of risk management at HeidelbergCement
Supervisory Board
Managing Board
Group functions
Group areas / Country management
Auditors 1)
1) Part of the annual audit2) Legal, Compliance, Tax, IT, Treasury, Corporate Finance, Human Resources, Strategy & Development, Marketing & Sales
Insurance & Corporate Risk
Reporting, Controlling & Consolidation
Other Group functions 2)
Internal Audit
CoMBINED MANAGEMENT REPoRT
Core activities and organisational structure Sustainability
Strategy, management control, and targets Employees and society
2011 business trend Environmental precaution
Additional statements Research and technology
Risk report Procurement | Outlook
Com
bine
d m
anag
emen
t re
port
Cor
pora
te G
over
nanc
eC
onso
lidat
ed f
inan
cial
sta
tem
ents
Add
itio
nal i
nfor
mat
ion
2
3
4
5
Com
bine
d m
anag
emen
t re
port
Cor
pora
te G
over
nanc
eC
onso
lidat
ed f
inan
cial
sta
tem
ents
Add
itio
nal i
nfor
mat
ion
To
our
shar
ehol
ders
2
3
4
5
1
Con
ten
ts
2
82 HeidelbergCement | Annual Report 2011
Risk management process
Identification and assessment of risksThe process of identifying risks is performed regularly on a decentralised basis by the country management and by the globally responsible Group functions. General macro-economic data as well as other industry-specific factors and risk information sources serve as auxiliary parameters for the identification process.
Appropriate thresholds for reporting relevant risks have been established for the individual countries, taking into account their specific circumstances. On the basis of our Group’s risk model and according to the defined risk categories, the risks are assessed with reference to a minimum probability of occurrence of 10% and their potential extent of damage. The decline in operating income, which serves as the key parameter for corporate success, represents the scale for the extent of damage.
The risk statement also includes risks that do not have a direct impact on the financial situation, but that can have an effect on non-monetary factors such as reputation or strategy. In the case of risks that cannot be directly calculated, the potential extent of damage is assessed on the basis of qualitative criteria such as low risk or risks constituting a threat to the Group’s existence.
The process of regular identification is supplemented with an ad-hoc risk report in the event of the sudden occurrence of serious risks or of sudden damage caused. This can arise, in par-ticular, in connection with political events, trends in the financial markets, or natural disasters.
Aggregating, reporting, monitoring, and controlling risksThe quantitative, updated risk reports for all business lines in our Group countries are presented to the Managing Board on a quarterly basis within the framework of central management report-ing to ensure that risks are monitored in a structured and continuous way. Correlations between individual risks and events are considered at local level as far as possible. The quarterly manage-ment meetings provide a platform for the Managing Board and responsible country managers to discuss and determine appropriate risk control measures promptly. Decisions are thus made as to which risks will be intentionally borne independently and which will be transferred to other risk carriers, as well as which measures are suitable for reducing or avoiding potential risks.
The Group Insurance & Corporate Risk department is responsible for coordinating the risk management processes. It also carries out an annual survey amongst the Group functions in order to record risks. Furthermore, all significant quantitative and qualitative risks for countries and Group functions are summarised once a year in a central risk map and presented to the Managing Board.
In 2012, risk identification and prevention are being promoted by various measures, such as employee training. The use of specific risk management software should directly increase risk awareness, simplify risk control, and optimise the overall risk management process in all Group countries.
Monitoring and adjustmentsThe Group Internal Audit department systematically examines and assesses risk management to help increase risk awareness. In addition, the auditor carries out an examination of the risk management system as part of the annual audit in accordance with legal guidelines to determine
83HeidelbergCement | Annual Report 2011
whether the monitoring system is capable of identifying in good time any issues that could threaten the Group’s existence. The Managing Board also regularly informs the Supervisory Board and its Audit Committee about the risk situation.
The internal control and risk management system with regard to the Group accounting process
The internal control system within the HeidelbergCement Group includes all principles, pro-cesses, and measures intended to ensure the effectiveness, cost efficiency, and accuracy of the accounting and to ensure observance of the relevant legal provisions.
The internal monitoring system within the HeidelbergCement Group consists of process-independent and process-integrated control measures. The process-integrated auditing activi-ties include controls that are incorporated into the process (e.g. the principle of dual control). Process-independent measures are controls carried out by persons not directly involved in the accounting process (e.g. Group Internal Audit).
Structures and processesThe organisational and management structure of HeidelbergCement AG and its Group com-panies is clearly defined. The responsibilities and functions within the accounting process (e.g. accounting of HeidelbergCement AG and its Group companies, Group Controlling, Group Treasury, and Group Consolidation) are also clearly separated and defined.
Key characteristics of the accounting processes and the consolidationAll departments involved in the accounting process have the requisite qualifications and are equipped in accordance with the requirements. In the case of accounting issues that are complex or require discretionary judgment, we also call upon the expertise of external service providers such as pension experts or recultivation obligation assessors.
The central accounting guideline and a uniform accounting framework are mandatory for all Group companies. They are continuously adapted to current developments, e.g. in the Group’s economic or legal environment, and to the International Financial Reporting Standards (IFRS) of the European Union. The central accounting guideline and uniform accounting framework guarantee uniform recognition, measurement, and presentation in the consolidated financial statements. Group-wide deadlines set out in a centrally managed financial calendar and instruc-tions pertaining to the financial statements also help to make the accounting process structured, efficient, and uniform across the Group.
In most countries, the financial statements of the Group companies are prepared in shared service centers in order to centralise and standardise the accounting processes. Accounting systems from SAP and Oracle are used in the majority of cases. To prepare the consolidated financial statements, further information is added to the individual financial statements of the Group companies and these are then consolidated using standardised software developed by SAP. All consolidation adjustments, such as the capital consolidation, the debt consolidation, the expense and income consolidation, and the at equity valuation, are carried out and documented. The various elements that make up the consolidated financial statements, including the Notes, are created entirely from this consolidation program.
CoMBINED MANAGEMENT REPoRT
Core activities and organisational structure Sustainability
Strategy, management control, and targets Employees and society
2011 business trend Environmental precaution
Additional statements Research and technology
Risk report Procurement | Outlook
Com
bine
d m
anag
emen
t re
port
Cor
pora
te G
over
nanc
eC
onso
lidat
ed f
inan
cial
sta
tem
ents
Add
itio
nal i
nfor
mat
ion
2
3
4
5
Com
bine
d m
anag
emen
t re
port
Cor
pora
te G
over
nanc
eC
onso
lidat
ed f
inan
cial
sta
tem
ents
Add
itio
nal i
nfor
mat
ion
To
our
shar
ehol
ders
2
3
4
5
1
Con
ten
ts
2
84 HeidelbergCement | Annual Report 2011
At HeidelbergCement, the accounts data is checked at both local and central level. The decen-tralised checking of the local financial statements is carried out by the responsible Financial Director and country controlling. The central checking of the accounts data is carried out by the Group departments Consolidation, Controlling, Tax, and Treasury.
HeidelbergCement’s control system is also supplemented by manual checks, such as regular spot checks and plausibility checks, carried out both locally and centrally. The validations automati-cally performed by the consolidation program also form an integral part of HeidelbergCement’s control system.
Process-independent checks are carried out by the Audit Committee of the Supervisory Board and by Group Internal Audit. The latter checks the internal control system for the structures and processes described and monitors application of the accounting guidelines and accounting framework. The results of the check carried out by Group Internal Audit are reported to the Managing Board and Audit Committee. Additional process-independent monitoring activities are also performed by the Group auditor and other auditing bodies, such as the external tax auditors.
Measures for identifying, assessing, and limiting risksIn order to identify and assess risks, individual business transactions at HeidelbergCement are analysed using the criteria of potential risk and probability of occurrence. Suitable control measures are then established on the basis of these analyses. To limit the risks, transactions above a certain volume or with a certain complexity are subject to an established approval process. Furthermore, organisational measures (e.g. separation of functions in sensitive areas) and ongoing target/actual comparisons are performed for key accounting figures. The IT systems used for accounting are protected from unauthorised access by appropriate security measures.
The established control and risk management systems are not able to guarantee accurate and complete accounting with absolute certainty. In particular, individual false assumptions, inef-ficient controls, and illegal activities may limit the effectiveness of the internal control and risk management systems employed. Exceptional or complex circumstances that are not handled in a routine manner also entail a latent risk.
The statements made here apply only to the Group companies included in the consolidated financial statements of HeidelbergCement AG whose financial and operational policies can be determined directly or indirectly by HeidelbergCement AG for the purpose of deriving benefit from the activity of the company.
Risk areas
Risks that may have a significant impact on our assets, financial, and earnings position in the 2012 financial year and in the foreseeable future thereafter are divided into three categories based on the risk catalogue established in the Group: financial risks, market and strategic risks, and operational risks.
85HeidelbergCement | Annual Report 2011
Financial risks
Our significant financial risks are currency risks, interest rate risks, refinancing risks, and credit risks. We manage these risks primarily as part of our ongoing business and financing activities and, when required, by using derivative financial instruments. These risk areas are monitored on a continuous basis by the Group Treasury department in accordance with internal Group guidelines. All Group companies must identify their risks and hedge them in cooperation with Group Treasury on the basis of these guidelines. The activities and processes of Group Treasury are governed by comprehensive guidelines, which, amongst other things, regulate the separation of trade and the processing of financial transactions. As part of our ongoing risk management, we manage the transaction risk, i.e. the risk of fluctuating prices (e.g. currency exchange rates, interest rates, raw material prices) that may affect the Group’s earnings position.
Currency risksCurrency risks arising as a result of transactions with third parties in foreign currency (trans-action risks) are hedged in certain cases using derivative financial instruments with a hedg-ing horizon of up to twelve months. We primarily use currency swaps and forward exchange contracts for this purpose, as well as currency options in some individual cases. Currency risks arising from intra-Group transactions in goods are not hedged, as the inflows and outflows in the various currency pairs cancel one another out at Group level to a large extent. Through our in-house banking activities, the borrowing and investment of liquidity of the subsidiaries lead to currency positions that are hedged by means of external currency swap transactions, which are appropriate in terms of maturities and amounts.
In general, we do not hedge currency risks arising from converting the financial statements of foreign individual companies or subgroups (translation risks). The associated effects have no impact on cash flow, and influences on the consolidated balance sheet and income statement are monitored on a continuous basis. More information on currency risks can be found in the Notes on page 214 f.
Interest rate risksInterest rate risks exist as a result of potential changes in the market interest rate and may lead to a change in fair value in the case of fixed interest-bearing financial instruments and to fluctuations in interest payments in the case of variable interest-bearing financial instruments. Interest rate risks are maintained within the parameters set by the Group’s Chief Financial Officer. By using financial instruments, primarily interest rate swaps, we are able to hedge both the risk of fluctuating cash flows and the risk of value fluctuations. However, the downgrading of our credit rating by the rating agencies (see Rating section on page 69 f.) could increase the interest margins in the event of a refinancing measure. On the basis of the balanced maturity structure of financial liabilities (see diagram in the Outlook chapter on page 118) and the ex-pected cash inflow from operating activities, there is no significant short- or medium-term need to refinance, meaning that no significant effects on the financial result are to be expected. More information on interest rate risks can be found in the Notes on page 214.
Refinancing/liquidity risksRefinancing/liquidity risks exist when a company is not able to procure the funds necessary to fulfil operational obligations or obligations entered into in connection with financial instruments.
CoMBINED MANAGEMENT REPoRT
Core activities and organisational structure Sustainability
Strategy, management control, and targets Employees and society
2011 business trend Environmental precaution
Additional statements Research and technology
Risk report Procurement | Outlook
Com
bine
d m
anag
emen
t re
port
Cor
pora
te G
over
nanc
eC
onso
lidat
ed f
inan
cial
sta
tem
ents
Add
itio
nal i
nfor
mat
ion
2
3
4
5
Com
bine
d m
anag
emen
t re
port
Cor
pora
te G
over
nanc
eC
onso
lidat
ed f
inan
cial
sta
tem
ents
Add
itio
nal i
nfor
mat
ion
To
our
shar
ehol
ders
2
3
4
5
1
Con
ten
ts
2
86 HeidelbergCement | Annual Report 2011
Possible risks from fluctuating cash flows are considered as part of the Group liquidity plan-ning. Assumptions concerning the expected economic cycle harbour particular uncertainties in liquidity planning, which is why we update them on an ongoing basis and simulate them by means of so-called stress tests. On this basis, we can – if necessary – initiate the appropriate measures, such as the issue of additional money and capital market securities or the raising of fresh funds in the bank market. As a result of our extensive refinancing measures over the last 24 months, including the establishment of a syndicated credit line of €3 billion, we have access to substantial amounts of cash and cash equivalents and have thus considerably reduced the refinancing risk. In addition, cash is continuously accruing from our operating activities. As an additional precautionary measure, an appropriate amount for increasing shareholders’ equity was decided upon at the 2010 Annual General Meeting.
The revolving syndicated credit line of €3 billion mentioned above with a term that now runs until the end of December 2015 (previously until the end of 2013), following the extension of the agreement in February 2012, of which only €256 million had been drawn upon as at the balance sheet date, is available for financing existing payment obligations. In total, we have €4.7 billion of cash and cash equivalents as well as securities in our portfolio across the Group (see liquidity instruments table in the Group financial management section on page 69). More information on liquidity risks can be found in the Notes on page 212 f.
Credit risksCredit risks exist when a contractual partner in a business cannot fulfil its obligations, or at least not within the stipulated period. We minimise the risk position arising from this by diversifica-tion and ongoing assessment of the creditworthiness of the contracting parties.
Credit risks from operating activities are monitored continuously as part of our receivables management. We apply strict standards with regard to the creditworthiness of our business partners. In this way – as well as by avoiding concentrations of positions – we are able to minimise the Group’s credit risks. We minimise credit risks for our financial investments by only conducting transactions with banks that are particularly creditworthy. We select banks for payment transactions and establish cash pools in exactly the same way.
In connection with credit agreements, we agreed to comply with various financial covenants, which were all met in the reporting period. The most important key financial ratios are the ratio of net debt to EBITDA and the interest coverage ratio. Within the framework of Group planning, compliance with the covenants is monitored consistently, with notification issued to the credi-tors on a quarterly basis. In the event of a breach of the covenants, the creditors could, under certain conditions, accelerate corresponding loans irrespective of the contractually agreed terms. Depending on the volume of the relevant loan and the refinancing possibilities in the financial markets, this could lead to a refinancing risk for the Group.
The €3 billion syndicated credit line contains covenants, which were agreed at a level that takes into account the current economic environment and our forecasts. More information on credit risks can be found in the Notes on page 212.
Market and strategic risks
Industry-specific risks and sales market risksIn 2012, the International Monetary Fund anticipates an overall slowdown in global economic growth. Development in the individual regions will still vary greatly in terms of magnitude and time frames. In some countries and regions, we expect considerable risks in relation to demand
87HeidelbergCement | Annual Report 2011
and price trends. The global economic recovery in 2011 meant that prices for energy and food rose significantly in some countries. The price increase was exacerbated substantially in some cases by speculations in raw materials, poor harvests, and natural disasters. In countries such as India and China, analysts still anticipate an increased inflation risk because of the expected significant economic growth.
The global development of demand for building materials naturally represents both an op-portunity and a risk for us, and is dependent on a number of different factors. The key factors include population growth and the increasing need for residential property, economic growth, growing industrialisation and urbanisation, and the increased need for infrastructure. Demand for building materials is essentially divided into three sectors: private residential construction, commercial construction, and public construction.
Demand in private residential construction depends on factors such as access to affordable loans, the trend in house prices, and the available household income, which is in turn influenced by additional parameters such as the rate of unemployment or inflation. The development of these factors and thus the demand in this sector is mostly subject to country-specific risks and uncertainties. In the US, the bursting of the property bubble led to a high excess of houses and apartments and a corresponding price collapse. The recovery of this market is fraught with uncertainties and depends, for example, on future interest rate developments. In Asia, there is a risk that rising food prices could negatively impact the revenue available for construction projects and thereby also the investments in private residential construction. In China, risks arise from speculations in urban residential property. The government and central bank have already taken steps to combat overheating in the booming property market.
The utilisation of production facilities, office spaces, and storage areas is crucial in determin-ing the level of demand in commercial construction, and in turn depends on the general order situation both at home and abroad. As a result of the economic crisis, the vacancy rate of office and industrial spaces is still significant in some countries, such as the US. The time frame of the recovery in this sector is uncertain. In particular, increasing interest rates resulting from rising inflation pressure could have a negative effect on economic growth and the future demand for building materials.
Investments in infrastructure such as roads, railways, airports, and waterways fall into the public construction sector. The demand in this sector depends on national budgets and the implementation of special infrastructure funding programmes. Risks exist insofar as countries could cut back on their infrastructure investments in order to consolidate their budgets. In a few European countries as well as in the US, spending cuts were also announced for public construction and other areas. Noticeable growth in result from state-funded projects will only be seen with a time lag. The scope of the cutbacks and their effects on the demand for building materials cannot be predicted with absolute certainty.
Building materials are characterised by heavy weight in relation to the sales price and are thus not transported overland for long distances. Excess cement volumes are traded by sea on a regional level as well as between individual continents. If the difference in the price level between two countries, with connection to the sea trade, is so high that it exceeds the transportation costs, there is a danger of increased import pressure and thus of a price drop in the importing market.
A major industry-specific risk is the weather-related sales risk for building materials, which is mainly due to the seasonal nature of demand. Harsh winters with extremely low temperatures or high precipitation impact construction activity and have a negative effect on the demand for building materials. In addition to the winter weather, monsoons in some Group countries, such
CoMBINED MANAGEMENT REPoRT
Core activities and organisational structure Sustainability
Strategy, management control, and targets Employees and society
2011 business trend Environmental precaution
Additional statements Research and technology
Risk report Procurement | Outlook
Com
bine
d m
anag
emen
t re
port
Cor
pora
te G
over
nanc
eC
onso
lidat
ed f
inan
cial
sta
tem
ents
Add
itio
nal i
nfor
mat
ion
2
3
4
5
Com
bine
d m
anag
emen
t re
port
Cor
pora
te G
over
nanc
eC
onso
lidat
ed f
inan
cial
sta
tem
ents
Add
itio
nal i
nfor
mat
ion
To
our
shar
ehol
ders
2
3
4
5
1
Con
ten
ts
2
88 HeidelbergCement | Annual Report 2011
as India, are another example of the seasonal weather conditions that adversely affect the sales volumes of our products and thus our business results.
We counteract weather-related fluctuations in sales volumes and risks from trends in sales markets with regional diversification, increased customer focus, the development of special products, and, to the extent possible, with operational measures: for example, we adjust the production level to the demand situation and use flexible working time models. In order to further improve relationships with our customers and to respond to country-specific needs, HeidelbergCement carries out customer surveys across the Group and expands research and development opera-tions at Group level. A continuous transfer of knowledge between our locations, which is sys-tematically supported and promoted by the employees of our technical centers – HTC (cement, binders) and CCM (aggregates) – working at various locations across the Group, ensures that synergy effects are utilised as effectively as possible.
Our expectations regarding the future development of the industry and our sales markets are presented in the Outlook chapter on page 113 f.
Risks from acquisitions and investmentsCapacity expansions from acquisitions and investments ensure opportunities, but also risks. Possible risks in the case of acquisitions arise from the integration of employees, processes, technologies, and products. These also include cultural and language barriers in the growing markets as well as a high personnel turnover in Asia, which leads to an outflow of valuable knowledge. We counteract these risks by targeted personnel development and an integrative corporate culture, including the creation of local management structures.
Acquisitions can affect the debt to equity ratio and financing structure and lead to increases in fixed assets, including goodwill. In particular, impairments of goodwill due to unforeseen business trends can lead to financial burdens.
Investment projects can span several years from the planning phase to completion. In this pro-cess, there are particular risks when it comes to obtaining the necessary permission for mining raw materials or developing infrastructure, including connecting to energy and road networks, as well as risks concerning the requirements for subsequent use plans for quarrying sites.
In the case of future acquisitions, partnerships, and investments, there is a risk that political restrictions may only allow them to be implemented under complicated conditions or may pre-vent them at all. A resulting shortage in capacity expansion projects could affect the growth prospects of HeidelbergCement. In order to minimise financial burdens and risks and better exploit opportunities, we look for suitable partners, particularly in politically unstable regions.
HeidelbergCement constantly monitors the market environment with respect to embarking on suitable acquisition projects or partnerships. In addition, market potential and raw material deposits are also systematically analysed and turned into proposals for investment projects. We place very high return requirements on every acquisition or investment decision, which are explained in the Strategy, management control, and targets chapter on page 39 f. Significant investment and acquisition projects are also subject to subsequent checks. We have many years of experience in integrating companies and have already created the necessary processes and structures.
89HeidelbergCement | Annual Report 2011
The cement industry is building up its capacities in the markets of Eastern Europe, Asia, and Africa in order to benefit from the rising domestic demand. HeidelbergCement is likewise pursuing a capacity expansion programme and, is focusing on local markets with exceptional growth potential. At the start of 2012, we have already commissioned a new cement mill in Bangladesh, with further capacity expansions to follow at our locations in Poland, Kazakhstan, India, Indonesia, Ghana, Liberia, and Burkina Faso. Competitors are also building up new ca-pacities in these regions. If the capacity increases in the markets in which we operate exceed the growth in demand, there is a risk of price collapse, which has negative effects on revenue and operating income. Prior to capacity expansion projects, HeidelbergCement reviews both the market environment and the market potential and responds to excess capacities with cost-saving and efficiency improvement programmes, capacity adjustments, and location enhancements.
Risks resulting from the substitution of productsCement, sand, gravel, and hard rock are the basic raw materials for the construction of houses, industrial facilities, and infrastructure throughout the world. The use of cement-like binders can be traced back to Roman times. Because cement is highly energy- and CO2-intensive, research projects are being undertaken to develop alternative binders with a more favourable energy and climate footprint. An alternative binder called Celitement, developed by the Karlsruhe Institute of Technology, recently won the German Innovation Award.
Employees of the Heidelberg Technology Center (HTC) are closely monitoring the development of alternative binders and are actively exploring this area. However, because the current state of knowledge regarding alternative binders is not sufficient for the stringent requirements relating to the processability, durability, and cost-effective production of the binders, we generally do not anticipate that the alternative binders currently being developed will replace traditional cement types on a large scale in the next few years. If the production costs for traditional binders increase dramatically, particularly in mature markets, e.g. as a result of further shortages of government-issued CO2 emission certificates or significant increases in fuel prices, alternative binders could replace traditional binders provided that they fulfil all the aforementioned requirements.
Political risks and risks arising from exceptional external incidentsAs is the case for all companies, potential turmoil in a political, legal, or social context poses fundamental risks for us, too. HeidelbergCement operates in more than 40 countries around the world and is therefore also exposed to political risks such as nationalisation, prohibition of capital transfer, terrorism, war, and unrest. At a number of locations, we cannot rule out cer-tain security risks because of internal political circumstances. In isolated cases, cement prices are subject to government regulation, e.g. in Ghana or India. There may also be government intervention in production control, such as the temporary decommissioning orders in China.
Exceptional external incidents, such as natural disasters or pandemics, could also negatively impact our business performance. Appropriate compensation limits of our Group-wide property insurance programme guarantee comprehensive coverage against natural disasters, including earthquakes, for our activities in heavily endangered regions of North America and Asia.
CoMBINED MANAGEMENT REPoRT
Core activities and organisational structure Sustainability
Strategy, management control, and targets Employees and society
2011 business trend Environmental precaution
Additional statements Research and technology
Risk report Procurement | Outlook
Com
bine
d m
anag
emen
t re
port
Cor
pora
te G
over
nanc
eC
onso
lidat
ed f
inan
cial
sta
tem
ents
Add
itio
nal i
nfor
mat
ion
2
3
4
5
Com
bine
d m
anag
emen
t re
port
Cor
pora
te G
over
nanc
eC
onso
lidat
ed f
inan
cial
sta
tem
ents
Add
itio
nal i
nfor
mat
ion
To
our
shar
ehol
ders
2
3
4
5
1
Con
ten
ts
2
90 HeidelbergCement | Annual Report 2011
Operational risks
Volatility of energy and raw material pricesFor an energy-intensive company such as HeidelbergCement, price trends in energy markets, which are extremely volatile, represent a considerable risk. Energy and raw material prices have significantly increased across the globe as a result of the economic recovery. In India and Indonesia, for example, there were considerable increases in coal prices after state sup-pliers adjusted the price level of local coal to bring it more in line with the higher international market price.
In addition to the rise in energy prices, infrastructural bottlenecks also pose a common risk for our Group with regard to electricity supply, especially in Africa. In a few countries, risks also arise from cutbacks in state subsidies for electricity or from the state regulation of oil and gas prices.
We minimise the price risks for energy and raw materials by Group-wide, structured procurement processes. Furthermore, we rely on the increasing use of alternative fuels and raw materials. In this way, we minimise price risks while reducing CO2 emissions and the proportion of energy-intensive clinker in the end product cement. The Group-wide “Operational Excellence” programme, which was launched in the summer of 2010, aims to sustainably increase the efficiency of the cement production process. By reducing and optimising our consump-tion of electricity, fuel, and raw materials, we are working directly towards a reduction in energy costs.
At the beginning of 2011, we started the three-year “FOX 2013” programme. This will enable us to further increase the Group’s financial and operational performance and also generate savings in our procurement activities to counteract the rising costs of energy and raw materials. More information on our procurement management can be found on page 112.
In the process of setting prices for our products, we aim to pass on increases in the costs of energy and raw materials to our customers. The success of these price increases is subject to considerable uncertainty, as most of our products are standardised bulk goods whose price is essentially determined by supply and demand. As a result, there is a risk that price increases cannot be passed on or will cause a decline in sales volumes, particularly in markets with ex-cess capacities.
Availability of raw materials and additivesHeidelbergCement requires a considerable amount of raw materials for cement and ag-gregates production, which is ensured by our own high deposits. In order to emphasise the key role of raw materials in our company and to facilitate the transfer of knowledge and synergy effects beyond national borders, we have combined our geology activities across the Group at HTC Global (see the Research and technology chapter on page 107). There is, however, potential for certain risks in particular locations with regard to obtaining mining concessions. In Malaysia, for example, the expansion of urbanisation may prevent a quarry from continuing to operate and the necessary permissions may be refused in the short term. Ecological factors and environmental regulations for access to raw material deposits also create a degree of uncertainty.
Availability and prices of the additive blast furnace slag, which is used in cement manufacturing and is a by-product in steel manufacturing, are subject to economic fluctuations and therefore
91HeidelbergCement | Annual Report 2011
entail a cost risk. Although steel production is expected to weaken slightly this year, the supply of blast furnace slag is guaranteed for 2012. As a precaution against declining volumes in the future, we are optimising our stock keeping and range of cement types.
Production-related risksThe cement industry is a facility-intensive industry with complex technology for storing and processing raw materials, additives, and fuels. Because of accident and operating risks, personal injury and material or environmental damage may occur and operations may be interrupted. In order to avoid the potential occurrence of damage and the resulting consequences, we rely on various surveillance and security systems in our plants as well as integrated management sys-tems, which guarantee high safety standards, and regular checks, maintenance, and servicing. To identify the threat of potential dangers, we aim to provide all employees with appropriate training to raise their risk awareness.
As demand for building materials is heavily dependent on weather conditions, there is a risk that capacity utilisation may fluctuate and production downtimes may occur. We minimise this risk by establishing different regional locations and making use of demand-oriented production control and flexible working time models. In addition, we make use of production downtimes, where possible, to carry out any necessary maintenance work.
HeidelbergCement’s risk transfer strategy sets deductibles for the main insurance programmes that have been adjusted to the size of the Group and are based on many years of failure analyses. As of 2011, the international liability insurance programme has optimised the cover and liability limit, particularly for risks resulting from environmental damage.
Quality risksBuilding materials are subject to a strict standardisation process. If supplied products do not meet the prescribed standards or the customer’s quality requirements, we risk losing sales volumes, facing claims for damages, and/or damaging our customer relationships. Heidel-bergCement ensures compliance with the standards at the Group’s own laboratories by means of fine-meshed quality assurance in parallel with every process step as well as final inspections. Quality assurance controls are also carried out by independent experts as part of the extensive quality assurance programmes already in place.
Regulatory risksAs part of the European climate package adopted in December 2008, which concerns the reduc-tion of greenhouse gas emissions, ambitious goals have been set by the European Parliament and the European Commission with regard to climate protection. The cement industry, like other CO2-intensive industry sectors, will not be affected by the full auction of emission rights from 2013. The emission rights will thus continue to be allocated free of charge, but by 2020 their quantity will have been reduced by 21% compared with 2005. The emission certificates are to be allocated on the basis of demanding, product-specific benchmarks. A rise in climate protec-tion cost may be assumed as the total volume of certificates continues to decrease. In the long term, this could create additional burdens in Europe as a result of higher manufacturing costs and therefore clear competitive disadvantages in comparison with producers from countries not involved in emissions trading.
Emissions trading in the US state of California, in line with the European model, is also sched-uled for introduction from 2013. A cap-and-trade initiative governs the maximum limits of CO2 emissions and permits companies to trade emission rights.
CoMBINED MANAGEMENT REPoRT
Core activities and organisational structure Sustainability
Strategy, management control, and targets Employees and society
2011 business trend Environmental precaution
Additional statements Research and technology
Risk report Procurement | Outlook
Com
bine
d m
anag
emen
t re
port
Cor
pora
te G
over
nanc
eC
onso
lidat
ed f
inan
cial
sta
tem
ents
Add
itio
nal i
nfor
mat
ion
2
3
4
5
Com
bine
d m
anag
emen
t re
port
Cor
pora
te G
over
nanc
eC
onso
lidat
ed f
inan
cial
sta
tem
ents
Add
itio
nal i
nfor
mat
ion
To
our
shar
ehol
ders
2
3
4
5
1
Con
ten
ts
2
92 HeidelbergCement | Annual Report 2011
The National Standards for Hazardous Air Pollutants (NESHAP) issued in the US in September 2010 could have a negative impact on the competitive position of our American plants if there is no harmonisation, e.g. with EU regulations.
Climate protection and reducing CO2 emissions are a focus of HeidelbergCement’s sustainabil-ity strategy. By increasing energy efficiency, developing cement types with a lower proportion of clinker, and using alternative fuels such as biomass, we were able to reduce our specific net CO2 emissions from 1990 to 2011 by 19.1%. Additional measures concerning climate and environmental protection are outlined in the Environmental precaution chapter on page 104 f. and the Research and technology chapter on page 106 f.
Personnel risksPersonnel risks are divided into four areas: the turnover of qualified employees and managers in key positions, difficulties in filling key positions, assurance of the required qualifications and skills of the workforce, as well as problems with laying off personnel. We consider these to be low-level risks. The occurrence of these events would have a negative effect on revenue and results in the medium to long term. When it comes to reducing these risks, we rely on:– our distinctive corporate and management culture,– attractive variable performance and result-oriented remuneration elements,– consistent substitution rules,– university partnerships at home and abroad as well as international recruitment,– targeted and need-based development of skills,– strategic successor planning,– sustainable personnel policy through the incorporation of all relevant interest groups, and– professional, integrated personnel management.
Detailed information on our employee development can be found on page 96 f.
Sustainability and compliance risksAs part of its sustainable corporate governance, HeidelbergCement makes a special commitment to protect the environment, preserve resources, conserve biodiversity, and to act in a socially responsible way. We consider concern for the environment, climate protection, and sustainable resource conservation to be the foundation for the future development of our Group. Compliance with current legal and Group regulations forms an integrated part of our corporate culture and is therefore a task and an obligation for every employee. Violations of our commitments or of laws and Group guidelines pose direct sanction risks in addition to strategic and operational risks, and also entail a risk to our reputation.
We have implemented a compliance programme across the Group to ensure conduct that is compliant with both the law and Group guidelines. This comprises, amongst other things, informa-tional leaflets, a compliance hotline, and employee training measures, which are conducted using state-of-the-art technologies and media such as electronic learning platforms, and which focus on the risk areas of antitrust and competition legislation as well as anticorruption regulations.
See page 95 f. for more information on sustainability, page 104 f. for more on our environmental precaution, and page 130 for more on compliance.
93HeidelbergCement | Annual Report 2011
IT risksIT systems support not only our global business processes but also our internal and external communication. Risks could primarily arise from the unavailability of IT systems, the delayed provision of important data, and the loss or manipulation of data.
To minimise these risks, our Group uses back-up procedures as well as integrated and stand-ardised IT infrastructures and applications. Furthermore, the critical systems are run at two separate computer centers that comply with the latest security standards.
All important server systems (e-mail, application servers, databases) and all PCs are constantly protected against potential threats by up-to-date antivirus software. In addition, operating system platforms and critical business applications are regularly updated and secured by additional safeguards.
Information security is an integral part of the Group-wide IT strategy and is viewed compre-hensively: we prepare, implement, and revise measures to protect data, applications, systems, and networks. One particular focus is access protection as well as the monitoring and filtering of data traffic. The IT security process is structured and divided into a series of guidelines, standards, and recommendations, which help raise our employees’ awareness.
A continuous improvement process facilitates corrections, amendments, and a sustainable increase in the efficiency of security measures. We also take measures to counteract the ageing process of equipment and system technology. In the case of existing applications, we are particularly concerned with business-critical resources (e.g. ERP applications, WAN infrastructure), which are updated or replaced in a consolidation programme.
Legal risks
Hanson asbestos-related claims and environmental damageSome of our Hanson participations in the US are exposed to particular legal risks and disputes relating to former activities. The most significant of these are asbestos-related claims, which, amongst other things, allege bodily injury and involve several American subsidiaries. Products containing asbestos were manufactured in the period from 1973 to 1984, and thus before these companies belonged to the Hanson Group and to HeidelbergCement. In the US, these damage claims are being handled and intensively managed by a team of in-house lawyers in collaboration with insurers and external consultants. The dispute is likely to continue for a few more years because of the complexity of the cases and the peculiarities of the American legal system. Adequate provisions have been formed on the basis of an extrapolation of the claims, the existing liability insurance coverage, and reliable estimates of the development of costs.
Furthermore, there are a considerable number of environmental and product liability claims against former and existing Hanson participations in the US, which relate back to business activities discontinued a long time ago. There is partly insufficient insurance cover for law suits and liability loss claims relating to toxic substances such as coal by-products or wood
CoMBINED MANAGEMENT REPoRT
Core activities and organisational structure Sustainability
Strategy, management control, and targets Employees and society
2011 business trend Environmental precaution
Additional statements Research and technology
Risk report Procurement | Outlook
Com
bine
d m
anag
emen
t re
port
Cor
pora
te G
over
nanc
eC
onso
lidat
ed f
inan
cial
sta
tem
ents
Add
itio
nal i
nfor
mat
ion
2
3
4
5
Com
bine
d m
anag
emen
t re
port
Cor
pora
te G
over
nanc
eC
onso
lidat
ed f
inan
cial
sta
tem
ents
Add
itio
nal i
nfor
mat
ion
To
our
shar
ehol
ders
2
3
4
5
1
Con
ten
ts
2
94 HeidelbergCement | Annual Report 2011
preservatives. Our subsidiaries may also be charged further fines set by the court in addition to the clean-up costs and the compensation; there is, however, a possibility to settle author-ised claims for compensation outside of court. Sufficient financial provision has been made for this event.
Cartel proceedingsIn the cartel proceedings initiated in 2002 against German cement companies, the Düsseldorf High Court (Oberlandesgericht) imposed a fine of around €170 million against Heidelberg-Cement in June 2009; an appeal against the fine has been lodged with the Federal Supreme Court in connection with the breach of various procedural and material regulations. A decision is yet to be made on this matter. The proceedings before the Federal Supreme Court will not result in any increase in the fine. No decision has yet been made regarding the action for damages brought by the Belgian company Cartel Damage Claims SA before the District Court (Landgericht) of Düsseldorf, which is based on allegedly inflated cement prices as the result of a cartel between 1993 and 2002. Even after the decision of the Düsseldorf High Court, Heidel-bergCement believes that it still has a chance of defending itself successfully against the claims. We have made appropriate financial provision for the two proceedings. In November 2008, HeidelbergCement was confronted with additional cartel allegations, with reviews conducted by the European Commission at locations in Germany, Belgium, the Netherlands, and the UK. The investigations of HeidelbergCement and its external lawyers into the circumstances have not confirmed the alleged cartel law violations. The proceedings were continued with the issuing of questionnaires at the end of September 2009 and additional enquiries in 2010 and 2011, which HeidelbergCement answered by the respective deadlines. In December 2010, the European Commission informed HeidelbergCement that in this connection, proceedings had commenced in several EEA countries on the basis of suspicions concerning the violation of EU competition legislation. The notice from the Commission reads in part: “The initiation of proceedings does not imply that the Commission has conclusive proof of the infringements, but merely signifies that the Commission will deal with the case as a matter of priority.”
These and other proceedings motivate us to continuously review and develop intensive internal precautions, particularly regular training initiatives – using modern IT media and other ap-proaches – in order to avoid cartel law violations.
Assessment of the overall risk situation
The assessment of the Group’s overall risk situation is the result of a consolidated examination of all major compound and individual risks. Overall, the Managing Board is not aware of any risks that could threaten the existence of the Group either independently or in combination with other risks. The Group has a solid financial base and the liquidity position is comfortable.
Third-party evaluations serve as another indicator for the overall risk assessment. In 2011, the three globally leading rating agencies all improved their assessment of HeidelbergCement’s credit rating by one notch: Standard & Poor’s from BB- to BB, Moody’s Investors Service from Ba2 to Ba1, and Fitch Ratings from BB to BB+.
95HeidelbergCement | Annual Report 2011
HeidelbergCement is aware of the opportunities and risks for its business activity as presented above. The measures described above play a significant role in allowing HeidelbergCement to make use of the opportunities to further develop the Group without losing sight of the risks. Our control and risk management system, standardised across the Group, ensures that any major risks that could negatively affect our business performance are identified at an early stage.
Sustainability
The commitment to sustainable development is a pillar of HeidelbergCement’s corporate strat-egy. The creation of economic added value, ecological competence, and social responsibility secure the Group’s future viability. For us, sustainable corporate governance means ensuring a balance between making profit and securing future viability. We strive to act in a socially and ecologically responsible way. We take into account the effects of our entrepreneurial activity on the environment and society, and thereby reduce the risks for our business. Our sustainability strategy is thus derived from our corporate profile.
Sustainability strategy
As a commodity company, people, nature, and society are the focus of our sustainability strat-egy. We consider concern for the environment, climate protection, and sustainable resource conservation to be the foundation for the future development of our Group. In the same way, our obligation to prevent employees from work-related dangers and to protect their health has become an integral part of our activities for many years. Last but not least, acting in a sustain-able way for us also means taking on social responsibility at our locations.
Our sustainability strategy and the areas of focus of our sustainability activities are strongly influenced by the expectations of external and internal stakeholders, which are systematically recorded and incorporated into our approach. In addition, the Cement Sustainability Initiative (CSI) of the World Business Council for Sustainable Development (WBCSD) has defined the following six key action areas, after conducting a survey among numerous stakeholder groups and experts: energy and CO2 management, sustainable land use and biodiversity, alternative raw materials and fuels, pollutant emissions, sustainable products and sustainable construction, as well as occupational health and safety.
The intersection in the following materiality matrix shows the main interests we have in com-mon with our stakeholders in the area of sustainability, with the above six key areas appearing at the center. These are the major fields of action outlined in our sustainability strategy. We have defined precise goals for these fields in the HeidelbergCement Sustainability Ambitions 2020 which we intend to achieve by 2020.
CoMBINED MANAGEMENT REPoRT
Core activities and organisational structure Sustainability
Strategy, management control, and targets Employees and society
2011 business trend Environmental precaution
Additional statements Research and technology
Risk report Procurement | Outlook
Com
bine
d m
anag
emen
t re
port
Cor
pora
te G
over
nanc
eC
onso
lidat
ed f
inan
cial
sta
tem
ents
Add
itio
nal i
nfor
mat
ion
2
3
4
5
Com
bine
d m
anag
emen
t re
port
Cor
pora
te G
over
nanc
eC
onso
lidat
ed f
inan
cial
sta
tem
ents
Add
itio
nal i
nfor
mat
ion
To
our
shar
ehol
ders
2
3
4
5
1
Con
ten
ts
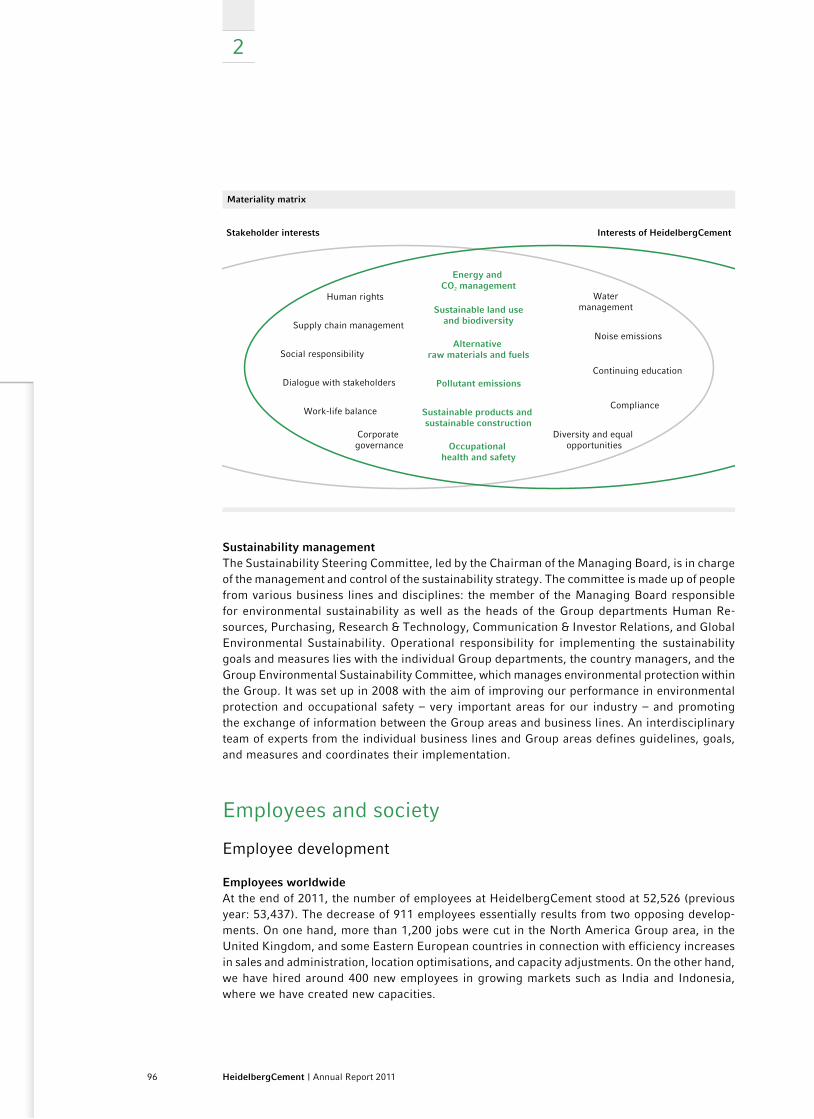
2
96 HeidelbergCement | Annual Report 2011
Materiality matrix
Sustainability management The Sustainability Steering Committee, led by the Chairman of the Managing Board, is in charge of the management and control of the sustainability strategy. The committee is made up of people from various business lines and disciplines: the member of the Managing Board responsible for environmental sustainability as well as the heads of the Group departments Human Re-sources, Purchasing, Research & Technology, Communication & Investor Relations, and Global Environmental Sustainability. Operational responsibility for implementing the sustainability goals and measures lies with the individual Group departments, the country managers, and the Group Environmental Sustainability Committee, which manages environmental protection within the Group. It was set up in 2008 with the aim of improving our performance in environmental protection and occupational safety – very important areas for our industry – and promoting the exchange of information between the Group areas and business lines. An interdisciplinary team of experts from the individual business lines and Group areas defines guidelines, goals, and measures and coordinates their implementation.
Employees and society
Employee development
Employees worldwideAt the end of 2011, the number of employees at HeidelbergCement stood at 52,526 (previous year: 53,437). The decrease of 911 employees essentially results from two opposing develop-ments. On one hand, more than 1,200 jobs were cut in the North America Group area, in the United Kingdom, and some Eastern European countries in connection with efficiency increases in sales and administration, location optimisations, and capacity adjustments. On the other hand, we have hired around 400 new employees in growing markets such as India and Indonesia, where we have created new capacities.
Watermanagement
Energy and CO2 management
Sustainable land useand biodiversity
Alternative raw materials and fuels
Pollutant emissions
Sustainable products and sustainable construction
Occupational health and safety
Noise emissions
Continuing education
Compliance
Diversity and equal opportunities
Human rights
Supply chain management
Social responsibility
Dialogue with stakeholders
Work-life balance
Corporate governance
Stakeholder interests Interests of HeidelbergCement
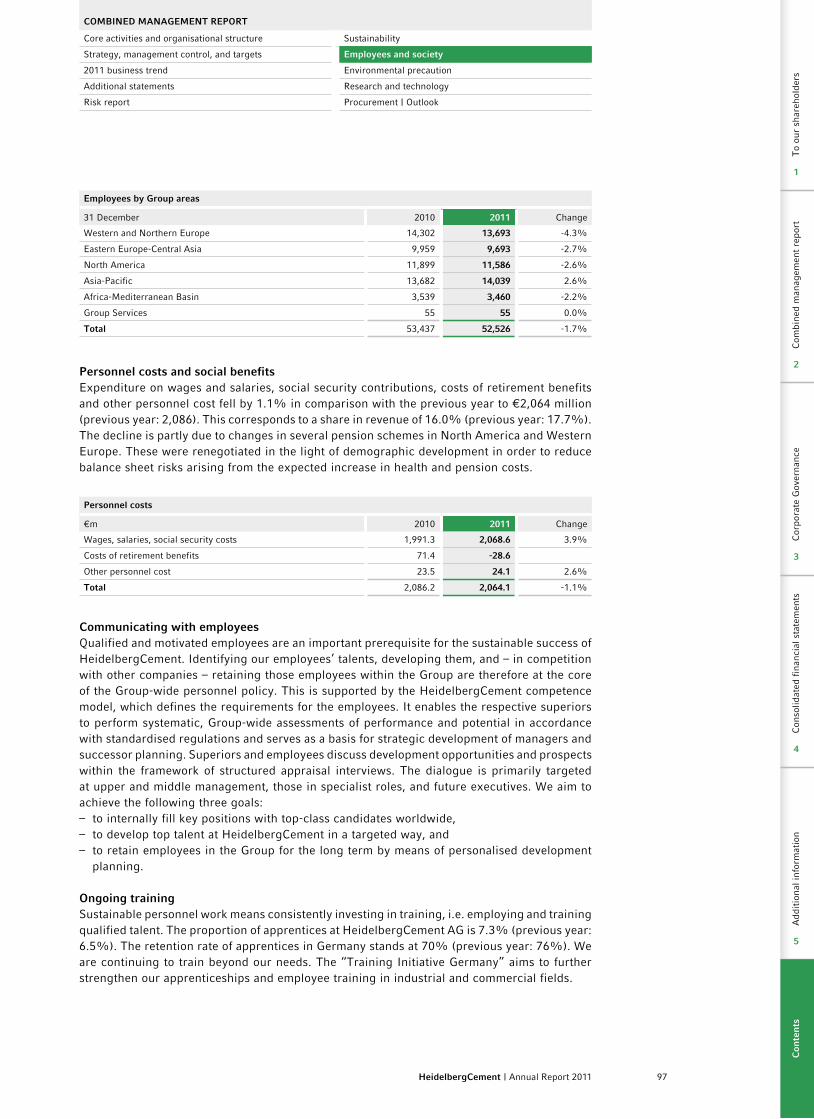
97HeidelbergCement | Annual Report 2011
Employees by Group areas
31 December 2010 2011 Change
Western and Northern Europe 14,302 13,693 -4.3%
Eastern Europe-Central Asia 9,959 9,693 -2.7%
North America 11,899 11,586 -2.6%
Asia-Pacific 13,682 14,039 2.6%
Africa-Mediterranean Basin 3,539 3,460 -2.2%
Group Services 55 55 0.0%
Total 53,437 52,526 -1.7%
Personnel costs and social benefitsExpenditure on wages and salaries, social security contributions, costs of retirement benefits and other personnel cost fell by 1.1% in comparison with the previous year to €2,064 million (previous year: 2,086). This corresponds to a share in revenue of 16.0% (previous year: 17.7%). The decline is partly due to changes in several pension schemes in North America and Western Europe. These were renegotiated in the light of demographic development in order to reduce balance sheet risks arising from the expected increase in health and pension costs.
Personnel costs
€m 2010 2011 Change
Wages, salaries, social security costs 1,991.3 2,068.6 3.9%
Costs of retirement benefits 71.4 -28.6
Other personnel cost 23.5 24.1 2.6%
Total 2,086.2 2,064.1 -1.1%
Communicating with employeesQualified and motivated employees are an important prerequisite for the sustainable success of HeidelbergCement. Identifying our employees’ talents, developing them, and – in competition with other companies – retaining those employees within the Group are therefore at the core of the Group-wide personnel policy. This is supported by the HeidelbergCement competence model, which defines the requirements for the employees. It enables the respective superiors to perform systematic, Group-wide assessments of performance and potential in accordance with standardised regulations and serves as a basis for strategic development of managers and successor planning. Superiors and employees discuss development opportunities and prospects within the framework of structured appraisal interviews. The dialogue is primarily targeted at upper and middle management, those in specialist roles, and future executives. We aim to achieve the following three goals:– to internally fill key positions with top-class candidates worldwide,– to develop top talent at HeidelbergCement in a targeted way, and– to retain employees in the Group for the long term by means of personalised development
planning.
ongoing trainingSustainable personnel work means consistently investing in training, i.e. employing and training qualified talent. The proportion of apprentices at HeidelbergCement AG is 7.3% (previous year: 6.5%). The retention rate of apprentices in Germany stands at 70% (previous year: 76%). We are continuing to train beyond our needs. The “Training Initiative Germany” aims to further strengthen our apprenticeships and employee training in industrial and commercial fields.
CoMBINED MANAGEMENT REPoRT
Core activities and organisational structure Sustainability
Strategy, management control, and targets Employees and society
2011 business trend Environmental precaution
Additional statements Research and technology
Risk report Procurement | Outlook
Com
bine
d m
anag
emen
t re
port
Cor
pora
te G
over
nanc
eC
onso
lidat
ed f
inan
cial
sta
tem
ents
Add
itio
nal i
nfor
mat
ion
2
3
4
5
Com
bine
d m
anag
emen
t re
port
Cor
pora
te G
over
nanc
eC
onso
lidat
ed f
inan
cial
sta
tem
ents
Add
itio
nal i
nfor
mat
ion
To
our
shar
ehol
ders
2
3
4
5
1
Con
ten
ts
2
98 HeidelbergCement | Annual Report 2011
Technical skills are essential in ensuring the functionally sound operational management of process technology and maintenance in our plants. In addition to technical training, we also offer master classes every year at the German Cement Works Association (Verein Deutscher Zementwerke e.V.).
As in the previous year, a focus of our training programmes throughout the Group was on occu-pational safety, which made up around 40% of the total training measures. Around 25% of the Group-wide training programme was devoted to specialist training and around 10% to the develop-ment of our managers.
Our extensive training programmes in virtually every work area are characterised by practical learning and therefore serve as the best prerequisite for ongoing development, both profes-sionally and personally.
Management trainingThe motivation and skills of our managers play a crucial role in determining how well Heidel-bergCement positions itself among its global competitors and how prepared the Group is for future challenges. In order to prepare our managers for their future tasks, we offer training programmes tailored specifically to the needs of our Group. This applies both to traditional topics such as strategy, leadership, and management, or the method of capital expenditure budgeting, and to special training topics, for instance in the area of technology. Uniform training content ensures that a common understanding of strategy, integrated management approach, and leadership is developed everywhere.
As part of a strategic Group-wide initiative, we aim to further develop the skills of our top manag-ers. In cooperation with Duke Corporate Education, we developed the new “Summit” programme and launched it successfully in the first half of 2011. Between 2011 and 2014, 500 managers from across the Group will go through a three-stage curriculum focusing on general management and leadership as well as global, regional, and local issues. Members of the Managing Board will actively partake in all modules through discussion forums and with their own presentation contributions. The mix of theory and practice is a key factor in the programme’s success.
Securing and advancing future executivesIn the reporting year, we consistently pursued our efforts to advance future executives. We offer highly motivated and qualified university graduates international trainee programmes focusing on the following areas: technology, sales, finance, personnel, purchasing, and IT. In total, 246 people took part in these programmes. We also continued to work intensively on expanding our programmes for the advancement of future executives and strengthening our recruitment of university graduates worldwide. The number of participants in these programmes has doubled in comparison with the previous year. This paves the way for us to fill management positions from among our own employees on a sustainable basis.
In 2011, we started a special programme for highly qualified engineers in the cement business as a pilot project in Europe and Central Asia, in order to prepare these employees for senior engineering positions. Upon completion of the “Engineer in Training” programme, the engineers spend several years completing specifically defined training stages in technical fields at various plants both in Germany and abroad – supplemented by training in general management and leadership. This year, we also started setting up the Aggregates Academy in the aggregates business line. One of the academy’s areas of focus is training in the aggregates business in
99HeidelbergCement | Annual Report 2011
accordance with uniform global standards. All of our programmes are geared towards attracting talent and retaining it within the Group as well as directly conveying knowledge and skills that are decisive for the success of our Group.
Demographic developmentOur Group is increasingly faced with the consequences of demographic change. Around 12% of our employees are younger than 30. The majority of the employees are aged between 30 and 49, making up around 55% of the Group’s total workforce. 33% of our employees are above 50 years of age.
We have extended our measures in the areas of health management and training to maintain employees’ performance. In Germany, we have launched a health initiative as a pilot project. It includes a prevention programme for identifying illnesses and risk factors at an early stage, but primarily focuses on the initiative of individuals to adopt a healthy lifestyle. One area of focus was colon cancer screening. The health management activities will continue to focus on the prevention of typical age-related health problems. We are therefore specifically promoting company sports activities for all age groups.
Diversity as a factor for successIn line with our Group-wide personnel policy, we consciously aim for a balanced mix of person-alities, skills, and experience when putting together employee teams. We understand diversity as a management concept, which, through team work and the inclusion of various cultures, talents, and experiences, ensures that the composition of our workforce mirrors our presence in the international markets, our customer structure, and our business environment. We aim to achieve this in the following ways:– with local management at the individual production locations, resulting in the strong inter-
national composition of our management teams around the world, – with an international workforce at the Group headquarters,– by ensuring that the composition of our management reflects the structure of the workforce,
e.g. proportion of men and women (gender diversity),– by forming teams with a wide range of experience and skills, and– by ensuring that the age structure of the workforce is balanced.
The goal is to advance and attract highly qualified and committed employees around the world who can bring various social and professional skills to our company and thus contribute to the success of the Group.
The international composition of our management team enables us to benefit from a broad range of experience and different cultural backgrounds, thereby allowing us to respond more flexibly to both global challenges and local market needs. The proportion of local managers at the upper management level is around 80%.
At the Group headquarters, we consciously aim to ensure that the workforce is composed of employees from the countries in which we operate. We benefit considerably from their local knowledge and this also facilitates cooperation with the local personnel. We have just under 700 employees at the headquarters and at our technical centers, the Competence Center Materials and Heidelberg Technology Center in Heidelberg and Leimen, with more than 130 of these employees representing 35 different countries.
CoMBINED MANAGEMENT REPoRT
Core activities and organisational structure Sustainability
Strategy, management control, and targets Employees and society
2011 business trend Environmental precaution
Additional statements Research and technology
Risk report Procurement | Outlook
Com
bine
d m
anag
emen
t re
port
Cor
pora
te G
over
nanc
eC
onso
lidat
ed f
inan
cial
sta
tem
ents
Add
itio
nal i
nfor
mat
ion
2
3
4
5
Com
bine
d m
anag
emen
t re
port
Cor
pora
te G
over
nanc
eC
onso
lidat
ed f
inan
cial
sta
tem
ents
Add
itio
nal i
nfor
mat
ion
To
our
shar
ehol
ders
2
3
4
5
1
Con
ten
ts
2
100 HeidelbergCement | Annual Report 2011
To aid diversity, we believe it is important for management positions to be held by both men and women, thereby providing a true reflection of our employee structure. Within the Group, women made up 13% of the total workforce and held 9% of the upper management positions in 2011. In Germany, women represent 15% of the total workforce and hold 7% of the upper management positions. Our goal is to more than double the proportion of women in management positions in Germany to 15% by 2020. To achieve this goal, we will be devoting increased attention to our programmes for the advancement of future executives. The proportion of women in these programmes is around 28% across the Group. The high proportion of women in advancement programmes is the result of our intensified recruitment of female university graduates. We are confident that, through our internal advancement of future executives, we can establish a pool of talent that will enable us to achieve this goal with our own employees.
The “Global Ladies Network @ HC Group” is an initiative that brings together women in middle and upper management positions worldwide both virtually and face-to-face. It allows a regular, informal exchange of ideas on individual career development and serves to create a mentoring network for female junior managers.
We consider the diversity of our workforce and management team and the focus on commitment, professional expertise, and conformity with our corporate values to be a decisive advantage in global competition.
Work-life balanceIn the race for the best employees, we adapt ourselves globally to changing lifestyles. In terms of what we offer to encourage a good work-life balance, we focus on models such as flexitime, part-time, and leave of absence. The part-time ratio at HeidelbergCement AG is 9.6%. Because of the small size of our locations, cooperation with external networks has proven itself in terms of children’s daycare, caring for family members, or, for example, holiday camps for children. Employees benefit from having easy access to a professional and flexible network at reasonable costs. As part of our “Fit for Family” initiative, we have entered into cooperations with daycare centers for the Heidelberg and Leimen locations. These arrangements allocate us our own quota of places that can be offered to our employees.
For our numerous foreign employees at the Heidelberg and Leimen locations, we have estab-lished the “Expatriate Network”, which is about helping our employees to help themselves. The company supports this network of employees, friends, and family members to help with the integration into the Rhine-Neckar metropolitan area, e.g. in looking for accommodation, dealing with administrative authorities, nursery/school affairs, etc.
Implementing the results of the management surveyAs part of a management survey in 2010, we asked 1,200 managers worldwide about issues such as Group strategy, management and leadership understanding, and Group values in relation to the workplace. Answers to questions on strategy, corporate culture, corporate governance, and managerial skills proved particularly positive. So far, more than 230 individual measures have been introduced worldwide, with the aim of improving the working environment. 70% of the measures have already been implemented. The focus lies on campaigns to optimise personnel development and cooperation across business lines and functions. In a follow-up survey in 2012/2013, the managers will assess the implementation of these measures.

101HeidelbergCement | Annual Report 2011
Result-oriented remuneration systemsIf you expect performance, you need to create a suitable environment. This includes also an attractive remuneration system. Alongside fixed salaries governed by a collective agreement or an individual work contract, HeidelbergCement AG employees also receive variable remuneration elements based on their individual performance and on corporate success. In the case of manag-ers, we consciously aim to achieve a high variable element as part of the total remuneration in order to take into account, in a clear and direct way, collective and personal performances as well as corporate success. The employees in our foreign subsidiaries benefit from attractively designed remuneration systems that relate to the respective local market conditions. For our 160 top managers we have launched a long-term bonus plan for 2011–2013/14 which follows the same targets as the long-term bonus plan for the Managing Board.
Occupational health and safety
Group standardsAt HeidelbergCement, occupational health and safety is a top priority. In 2011, we therefore took specific measures not only to strengthen the technical and organisational safety standards within the Group but also to reinforce the awareness of our employees for a safety culture.
Having issued a number of Group standards on key risk areas in production and transport in recent years, we focused on their Group-wide implementation in 2011. Strong emphasis was placed on the “Driving Safety” Group standard, which relates to both internal plant traffic and the transportation of our products to customers. In 2012, we will continue the numer-ous theoretical and practical training measures on this subject already carried out at the individual locations.
Another focus during the reporting year was on contractor safety. While we provide our employees with regular training on safety risks, external contractors often have less safety awareness and, naturally, this is harder for us to verify. Nevertheless, safe working practices are crucial for ensuring that contract work is carried out without accidents. Large-scale projects in particular, such as the construction of a new plant, often involve hundreds of employees from external companies and a wide variety of nationalities working together at a construction site over a long period of time. The fact that this can happen without serious accidents, provided that all occu-pational safety regulations are continuously and consistently observed, is demonstrated by our large projects in Górazdze in Poland and Tula in Russia. A second kiln line has been constructed in Górazdze, and a new cement plant in Tula, without any serious accidents. These successes in the area of occupational safety must now be repeated in our ongoing and planned projects.
Raising employees’ risk awarenessAlthough we have been continually improving occupational health and safety at a technical and organisational level for a number of years, we still have to report serious accidents – including some fatalities. These accidents even happen in countries with the highest technical and organisational standards. Our internal accident investigations have shown that human error is the primary cause in most cases. Consequently, in 2011, we once again intensified our efforts to raise employees’ and contractors’ awareness of the risks inherent in their work. Alongside measures specifically tailored to the working situation and needs of the employees
CoMBINED MANAGEMENT REPoRT
Core activities and organisational structure Sustainability
Strategy, management control, and targets Employees and society
2011 business trend Environmental precaution
Additional statements Research and technology
Risk report Procurement | Outlook
Com
bine
d m
anag
emen
t re
port
Cor
pora
te G
over
nanc
eC
onso
lidat
ed f
inan
cial
sta
tem
ents
Add
itio
nal i
nfor
mat
ion
2
3
4
5
Com
bine
d m
anag
emen
t re
port
Cor
pora
te G
over
nanc
eC
onso
lidat
ed f
inan
cial
sta
tem
ents
Add
itio
nal i
nfor
mat
ion
To
our
shar
ehol
ders
2
3
4
5
1
Con
ten
ts
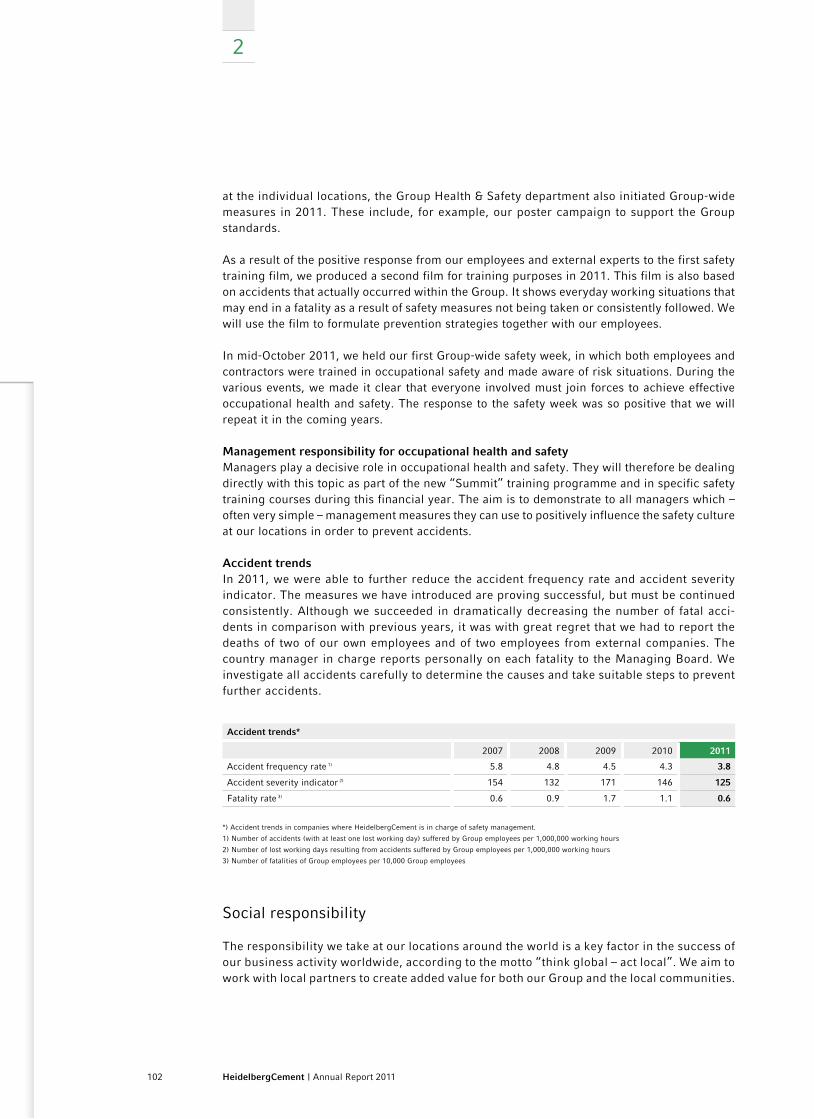
2
102 HeidelbergCement | Annual Report 2011
at the individual locations, the Group Health & Safety department also initiated Group-wide measures in 2011. These include, for example, our poster campaign to support the Group standards.
As a result of the positive response from our employees and external experts to the first safety training film, we produced a second film for training purposes in 2011. This film is also based on accidents that actually occurred within the Group. It shows everyday working situations that may end in a fatality as a result of safety measures not being taken or consistently followed. We will use the film to formulate prevention strategies together with our employees.
In mid-October 2011, we held our first Group-wide safety week, in which both employees and contractors were trained in occupational safety and made aware of risk situations. During the various events, we made it clear that everyone involved must join forces to achieve effective occupational health and safety. The response to the safety week was so positive that we will repeat it in the coming years.
Management responsibility for occupational health and safetyManagers play a decisive role in occupational health and safety. They will therefore be dealing directly with this topic as part of the new “Summit” training programme and in specific safety training courses during this financial year. The aim is to demonstrate to all managers which – often very simple – management measures they can use to positively influence the safety culture at our locations in order to prevent accidents.
Accident trendsIn 2011, we were able to further reduce the accident frequency rate and accident severity indicator. The measures we have introduced are proving successful, but must be continued consistently. Although we succeeded in dramatically decreasing the number of fatal acci-dents in comparison with previous years, it was with great regret that we had to report the deaths of two of our own employees and of two employees from external companies. The country manager in charge reports personally on each fatality to the Managing Board. We investigate all accidents carefully to determine the causes and take suitable steps to prevent further accidents.
Accident trends*
2007 2008 2009 2010 2011
Accident frequency rate 1) 5.8 4.8 4.5 4.3 3.8
Accident severity indicator 2) 154 132 171 146 125
Fatality rate 3) 0.6 0.9 1.7 1.1 0.6
*) Accident trends in companies where HeidelbergCement is in charge of safety management.
1) Number of accidents (with at least one lost working day) suffered by Group employees per 1,000,000 working hours
2) Number of lost working days resulting from accidents suffered by Group employees per 1,000,000 working hours
3) Number of fatalities of Group employees per 10,000 Group employees
Social responsibility
The responsibility we take at our locations around the world is a key factor in the success of our business activity worldwide, according to the motto “think global – act local”. We aim to work with local partners to create added value for both our Group and the local communities.
103HeidelbergCement | Annual Report 2011
We believe in giving local employees responsibility for local management wherever possible. Each plant collaborates closely with local suppliers and service providers. We invest around 30% of our purchasing volume in the areas immediately surrounding our plants. Wages, invest-ments, purchasing, and taxes, as well as the creation of jobs, all help to create added value and promote economic development at our locations.
Corporate citizenshipCorporate responsibility is not limited to a company’s business processes and the areas where they have a direct impact. As a corporate citizen, we are a part of society, and we benefit from being fully involved at the community level at our locations around the world. We are also playing an active role in the search for solutions to social issues that affect these locations. Our understanding of our role is reflected in the Corporate Citizenship Guidelines, which lay down the benchmarks and objectives related to our social commitment. This commitment is focused on areas in which we have specific expertise and can achieve the best results for society: – Building, architecture, and infrastructure: we provide practical help in the construction of
buildings and infrastructure by making products, financial means, and expertise available.– Environment, climate, and biodiversity: we support initiatives that promote environmental
protection and strengthen the diversity of nature at our locations.– Education, training, and culture: in this area, we are guided by the specific needs of our
locations.
Development partnership in TanzaniaIn Tanzania, we launched a development partnership with the German Agency for International Cooperation (GIZ) in 2010. The central project is the construction of a nursery that supplies the plants for afforestation of the decommissioned quarry belonging to our subsidiary Tanzania Portland Cement Company (TPCC) and also aims to contribute to the restoration of depleted forest and green areas within and outside the harbour city of Dar es Salaam. We are collaborat-ing closely on this project with the local provincial government and also work with universities, schools, and non-governmental organisations to organise training on sustainable land use. In 2011, we donated plants to help some of these schools make their sites greener.
Promoting culture and education in the Czech RepublicIn the Czech Republic, our subsidiary Ceskomoravsky Cement supports the international classi-cal music festival Talichuv Beroun, an important cultural event with a tradition spanning almost 30 years, in the town of Beroun. The festival is named after Vaclav Talich, one of the most important Czech conductors of the 20th century.
Ceskomoravsky Cement also supports a number of activities run by Masaryk University in Brno, with the primary aim of increasing the university’s competitiveness, which in turn will benefit the region and the people who live there.
Voluntary activities in GermanyIn many countries, our employees take advantage of opportunities to do voluntary work during their hours of employment. In Germany, for example, our employees take part in the in-house “KIS – Kooperation Industrie und Schule” programme, a cooperative project involving industry and educational institutions. They give students and teachers practical, first-hand insight into various Group areas and processes, and provide information about social topics such as globali-sation, sustainability, and nature conservation.
HeidelbergCement is also a member of the Wissensfabrik (knowledge factory) network of com-panies, whose aims include getting students interested in science and business.
CoMBINED MANAGEMENT REPoRT
Core activities and organisational structure Sustainability
Strategy, management control, and targets Employees and society
2011 business trend Environmental precaution
Additional statements Research and technology
Risk report Procurement | Outlook
Com
bine
d m
anag
emen
t re
port
Cor
pora
te G
over
nanc
eC
onso
lidat
ed f
inan
cial
sta
tem
ents
Add
itio
nal i
nfor
mat
ion
2
3
4
5
Com
bine
d m
anag
emen
t re
port
Cor
pora
te G
over
nanc
eC
onso
lidat
ed f
inan
cial
sta
tem
ents
Add
itio
nal i
nfor
mat
ion
To
our
shar
ehol
ders
2
3
4
5
1
Con
ten
ts
2
104 HeidelbergCement | Annual Report 2011
Environmental precaution
As an active member of the Cement Sustainability Initiative (CSI) of the World Business Council for Sustainable Development (WBCSD), we take our responsibility for the sustainable develop-ment of our business activity seriously. Over the last few years, we have made remarkable pro-gress, particularly with regard to reducing our CO2 emissions and other environmental effects, utilising waste materials as alternative fuels or raw materials, and promoting biodiversity at our quarrying sites. These improvements are driven by the Sustainability Ambitions 2020, which define the Group’s main sustainability issues and goals.
Biodiversity
To speed up the implementation of the biodiversity management plans drawn up for our quarrying sites, we developed and conducted specific training courses for the responsible employees during the reporting year. This training enabled them to identify the biodiversity value of the quarry-ing sites and take the necessary measures to preserve and promote the diversity of species. By the end of 2011, we had introduced biodiversity management plans at 115 European locations.
In 2011, we took another important step to promote biodiversity at our quarrying sites by signing a three-year collaboration with BirdLife International, one of the world’s largest nature conserva-tion organisations. This consolidated our leading role in this area among international building materials companies. The aim of this partnership is to further strengthen HeidelbergCement’s biodiversity management and define shared goals and measures that maximise the conservation value of existing and future activities.
In 2011, HeidelbergCement also launched the first international research and education com-petition focusing on the topic of biodiversity at quarrying sites, with the “Quarry Life Award”. More than 60 quarries in 18 countries will open their doors to allow the participating students and researchers to carry out research projects for this competition. At the end of the competi-tion in December 2012, the national and international winners will receive prize money totalling €200,000.
In the reporting year, we successfully continued our public-private partnership projects with the German Agency for International Cooperation (GIZ) and in close cooperation with local interest groups in Georgia and Tanzania. Since September 2011, we have also been working with the world-renowned Jane Goodall Institute on our afforestation project in Tanzania.
Last but not least, we published a book in 2011 on the extraordinary diversity of dragonflies at our quarrying sites. The book is just the start of a series of publications in which we showcase the typical biodiversity and habitats at our quarrying sites.
Sustainable construction
HeidelbergCement and its subsidiaries are working with the Green Building Councils around the world to develop certification systems for sustainable construction and to make the design, construction, and management of buildings more sustainable. We are currently an active member of ten Green Building Councils worldwide.
105HeidelbergCement | Annual Report 2011
For us, sustainable construction also means intensifying efforts to recycle concrete. Therefore, in 2011, we started a four-year project with the Delft University of Technology in the Nether-lands to investigate the possibilities of recycling all concrete scrap in cement and aggregates.
After carrying out life cycle analyses of our products, we have acquired sufficient expertise within the Group to calculate reliable environmental indicators for our products and pass them on to our customers.
In 2011, we began implementing the “Manifesto for Energy Efficiency in Buildings” drawn up by the World Business Council for Sustainable Development by gathering energy efficiency data for our own buildings. The data will be used as a starting point for improving the energy efficiency of our buildings in the future.
Use of alternative raw materials and fuels
HeidelbergCement regards waste materials and by-products from other industries as valuable raw materials and fuels for the production of cement. With the proportion of alternative fuels in the fuel mix reaching 21.4% in 2011, HeidelbergCement remains one of the front runners among the major international cement manufacturers.
In Europe, we increased the use of processed commercial and industrial waste and sewage sludge as alternative fuels during the reporting year because of the dwindling availability of meat and bone meal. Thanks to investments in the storage and feed-in of alternative fuels, e.g. at the cement plants in Górazdze in Poland and Brevik in Norway, we were able to increase the proportion of energy generated from waste materials. In 2011, ten plants in Europe reduced their consumption of primary fuels by more than 60%.
In the reporting year, we provided an intensive training in Belgium and the Netherlands for the employees of our Chinese joint venture partner CRC, creating a foundation for further success with the use of alternative fuels at our joint cement plants in China. In Turkey, we commis-sioned a new facility that allows us to use dried sewage sludge. As a result, our joint venture Akçansa is able to accept sewage sludge from Istanbul’s state-of-the-art sewage treatment plant all year round.
The introduction of a new biodrying process in 2011 paved the way for several development projects for converting domestic waste into alternative fuels. This process is used in Indonesia, Turkey, and a number of other countries. In Tanzania, Gabon, and Togo, we set up interdisci-plinary expert teams to assess the potential of locally available waste streams such as sawdust and agricultural waste.
Climate protection
Climate protection is at the heart of our environmental policy. As an energy-intensive company, we have been striving for many years to minimise our CO2 emissions. Between 1990 and 2011, we reduced our specific net CO2 emissions by 19.1% to 621 kg CO2 per tonne of cement. In 2011, we revised our strategic CO2 action plan in order to reach our savings goal: by 2015, we want to reduce our specific net CO2 emissions by 23% in comparison with 1990.
CoMBINED MANAGEMENT REPoRT
Core activities and organisational structure Sustainability
Strategy, management control, and targets Employees and society
2011 business trend Environmental precaution
Additional statements Research and technology
Risk report Procurement | Outlook
Com
bine
d m
anag
emen
t re
port
Cor
pora
te G
over
nanc
eC
onso
lidat
ed f
inan
cial
sta
tem
ents
Add
itio
nal i
nfor
mat
ion
2
3
4
5
Com
bine
d m
anag
emen
t re
port
Cor
pora
te G
over
nanc
eC
onso
lidat
ed f
inan
cial
sta
tem
ents
Add
itio
nal i
nfor
mat
ion
To
our
shar
ehol
ders
2
3
4
5
1
Con
ten
ts
2
106 HeidelbergCement | Annual Report 2011
In October 2010, a project to reduce CO2 emissions, developed at our Kryvyi Rih plant in the Ukraine, received official approval from the UN as a joint implementation (JI) project. This suc-cess paved the way for the first issue of emissions reduction certificates in the autumn of 2011. The JI project for the use of alternative raw materials at Kryvyi Rih Cement in the Ukraine is the first of its kind for HeidelbergCement and for Ukraine’s cement industry as a whole.
Reducing other environmental effects
In line with the goals we set in our Sustainability Ambitions 2020, we are implementing environ-mental management systems certified in accordance with ISO 14001 at all our cement plants. At the end of 2011, the Managing Board also decided to conduct systematic environmental audits at our cement, concrete, and aggregates locations.
At our Cupertino cement plant in California, US, the new activated carbon injection system is producing excellent results in lowering mercury emissions. We are anticipating a reduction of around 90%. Over the next few years, we plan to invest strongly at our plants in North America in order to reduce all our emissions.
To further reduce dust emissions, we installed new filter systems, or renovated existing systems, during the 2011 reporting year. For example, we installed additional modern bag filters at the cement plants of Doncement in the Ukraine and of Bukhtarma in Kazakhstan and renovated the filter systems at the Büyükcekmece plant in Turkey; the Kjöpsvik plant in Norway will follow suit in spring 2012. To reduce nitrogen oxide emissions, we optimised the SNCR systems at a number of German cement plants. The washer at the Brevik plant in Norway was optimised to further reduce sulphur dioxide emissions.
Research and technology
Our research and development activities
The innovation work at HeidelbergCement can essentially be divided into three areas:
– Products and applications: Our research and development activities are geared strongly towards the market and our customers. The main priority is the development and improve-ment of binders and concretes with optimised properties and innovative functionalities. However, our work does not end with the product; it also involves providing our customers with a competent, professional technical service on the application and optimisation of their products.
– Production: The focus lies on the continuous improvement of processes and cost structures. This includes the cost-efficient replacement of fossil fuels and natural raw materials as well as reducing energy requirements in cement production. These goals are pursued in the Group-wide “Operational Excellence” initiative, and potential is systematically exploited. In the aggregates business line, the “CLIMB” project is also pursuing the goal of sustainably optimising the cost structure and increasing added value.
107HeidelbergCement | Annual Report 2011
– Development of cements and concretes with improved CO2 balance: The main emphasis here is to further develop composite cements with less clinker – even beyond the limits of today’s existing standards. Reducing the proportion of clinker is the most important lever when it comes to minimising energy consumption and CO2 emissions, and in preserving natural raw materials. Finally, we are also researching entirely new kinds of binder systems that dispense with the use of clinker altogether. These innovative alternative products are only in the early stages of research and it will take several years until they are ready for the market and for wide deployment.
Organisation, fields of activities, and expenditure in the area of research and technology
In the reporting year, we further expanded the global competence center HTC Global (Heidel-berg Technology Center Global) in Leimen. With its numerous international employees, HTC Global is subdivided into four areas: Research & Development, Global Engineering, Geology, and Training & Reporting. The competence center pools the knowledge and expertise in our Group and makes it available to the operational units quickly and comprehensively.
The area of research and technology is divided into the following fields of activities:
Central research and developmentWe have concentrated the Group-wide research and development activities in the cement, concrete, and aggregates business lines at HTC Global. To match the high importance of the development of CO2-minimised products, we are reinforcing this area even more, both financially and in terms of personnel. The individual projects are defined and carried out in close coordina-tion with the operating companies. This close collaboration from the very start of the project facilitates the efficient implementation of the development results and a quick market launch.
Technology and innovationTechnical centers support our national companies in the Group areas. In the cement business line this is the Heidelberg Technology Center (HTC) with two locations in Europe, which also support the Mediterranean Basin, Africa, and Central Asia, one location in North America, and one in Asia with offices in China, India, and Indonesia. They support our cement plants with all technical issues, from securing raw materials and operational optimisations to process control and quality assurance. With investment projects, HTC locations are involved in project manage-ment up until a new installation or plant is commissioned or optimisation measures have been finished. Similarly, the technical centers of the Competence Center Materials (CCM) support our Group companies in the aggregates, ready-mixed concrete, and asphalt business lines. The close dialogue between HTC or CCM and our plants ensures efficient implementation of potential optimisations and a continuous improvement process. Customer-related development and technical serviceOur close proximity to the market requires intensive customer-oriented development and tech-nical service, which is also reflected in high financial expenditure (see the following table). The relevant departments and employees, which are integrated directly into the organisation of the respective national companies, develop and optimise the cements and concretes that are tailored to the local needs, often in close cooperation with the customer.
CoMBINED MANAGEMENT REPoRT
Core activities and organisational structure Sustainability
Strategy, management control, and targets Employees and society
2011 business trend Environmental precaution
Additional statements Research and technology
Risk report Procurement | Outlook
Com
bine
d m
anag
emen
t re
port
Cor
pora
te G
over
nanc
eC
onso
lidat
ed f
inan
cial
sta
tem
ents
Add
itio
nal i
nfor
mat
ion
2
3
4
5
Com
bine
d m
anag
emen
t re
port
Cor
pora
te G
over
nanc
eC
onso
lidat
ed f
inan
cial
sta
tem
ents
Add
itio
nal i
nfor
mat
ion
To
our
shar
ehol
ders
2
3
4
5
1
Con
ten
ts
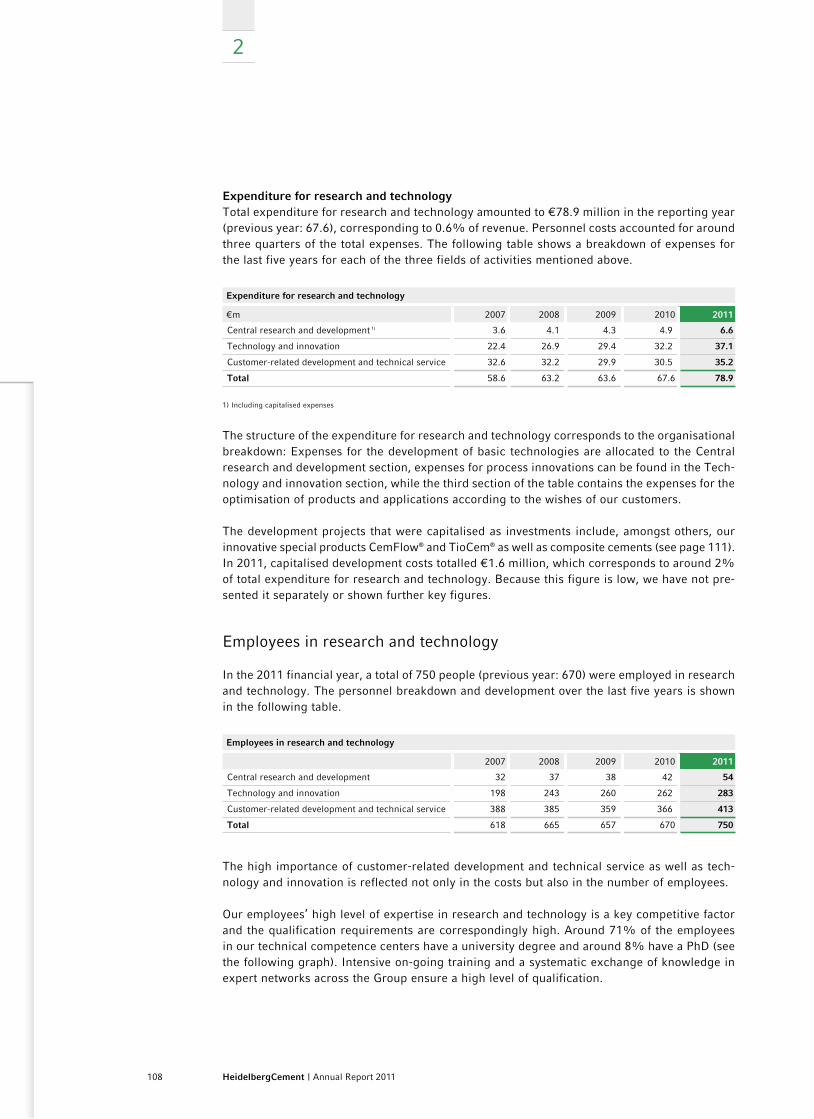
2
108 HeidelbergCement | Annual Report 2011
Expenditure for research and technologyTotal expenditure for research and technology amounted to €78.9 million in the reporting year (previous year: 67.6), corresponding to 0.6% of revenue. Personnel costs accounted for around three quarters of the total expenses. The following table shows a breakdown of expenses for the last five years for each of the three fields of activities mentioned above.
Expenditure for research and technology
€m 2007 2008 2009 2010 2011
Central research and development 1) 3.6 4.1 4.3 4.9 6.6
Technology and innovation 22.4 26.9 29.4 32.2 37.1
Customer-related development and technical service 32.6 32.2 29.9 30.5 35.2
Total 58.6 63.2 63.6 67.6 78.9
1) Including capitalised expenses
The structure of the expenditure for research and technology corresponds to the organisational breakdown: Expenses for the development of basic technologies are allocated to the Central research and development section, expenses for process innovations can be found in the Tech-nology and innovation section, while the third section of the table contains the expenses for the optimisation of products and applications according to the wishes of our customers.
The development projects that were capitalised as investments include, amongst others, our innovative special products CemFlow® and TioCem® as well as composite cements (see page 111). In 2011, capitalised development costs totalled €1.6 million, which corresponds to around 2% of total expenditure for research and technology. Because this figure is low, we have not pre-sented it separately or shown further key figures.
Employees in research and technology
In the 2011 financial year, a total of 750 people (previous year: 670) were employed in research and technology. The personnel breakdown and development over the last five years is shown in the following table.
Employees in research and technology
2007 2008 2009 2010 2011
Central research and development 32 37 38 42 54
Technology and innovation 198 243 260 262 283
Customer-related development and technical service 388 385 359 366 413
Total 618 665 657 670 750
The high importance of customer-related development and technical service as well as tech-nology and innovation is reflected not only in the costs but also in the number of employees.
Our employees’ high level of expertise in research and technology is a key competitive factor and the qualification requirements are correspondingly high. Around 71% of the employees in our technical competence centers have a university degree and around 8% have a PhD (see the following graph). Intensive on-going training and a systematic exchange of knowledge in expert networks across the Group ensure a high level of qualification.
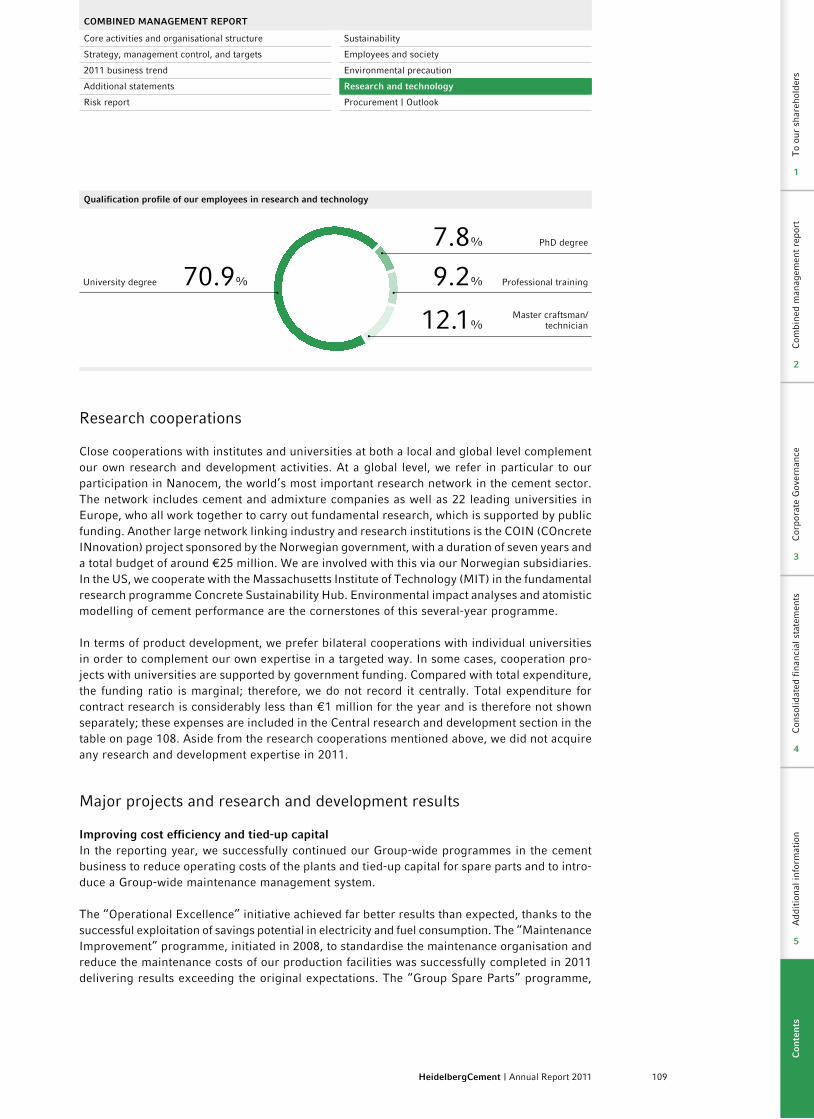
109HeidelbergCement | Annual Report 2011
Qualification profile of our employees in research and technology
Professional training9.2%University degree 70.9%
7.8% PhD degree
Master craftsman/technician12.1%
Research cooperations
Close cooperations with institutes and universities at both a local and global level complement our own research and development activities. At a global level, we refer in particular to our participation in Nanocem, the world’s most important research network in the cement sector. The network includes cement and admixture companies as well as 22 leading universities in Europe, who all work together to carry out fundamental research, which is supported by public funding. Another large network linking industry and research institutions is the COIN (COncrete INnovation) project sponsored by the Norwegian government, with a duration of seven years and a total budget of around €25 million. We are involved with this via our Norwegian subsidiaries. In the US, we cooperate with the Massachusetts Institute of Technology (MIT) in the fundamental research programme Concrete Sustainability Hub. Environmental impact analyses and atomistic modelling of cement performance are the cornerstones of this several-year programme.
In terms of product development, we prefer bilateral cooperations with individual universities in order to complement our own expertise in a targeted way. In some cases, cooperation pro-jects with universities are supported by government funding. Compared with total expenditure, the funding ratio is marginal; therefore, we do not record it centrally. Total expenditure for contract research is considerably less than €1 million for the year and is therefore not shown separately; these expenses are included in the Central research and development section in the table on page 108. Aside from the research cooperations mentioned above, we did not acquire any research and development expertise in 2011.
Major projects and research and development results
Improving cost efficiency and tied-up capitalIn the reporting year, we successfully continued our Group-wide programmes in the cement business to reduce operating costs of the plants and tied-up capital for spare parts and to intro-duce a Group-wide maintenance management system.
The “Operational Excellence” initiative achieved far better results than expected, thanks to the successful exploitation of savings potential in electricity and fuel consumption. The “Maintenance Improvement” programme, initiated in 2008, to standardise the maintenance organisation and reduce the maintenance costs of our production facilities was successfully completed in 2011 delivering results exceeding the original expectations. The “Group Spare Parts” programme,
CoMBINED MANAGEMENT REPoRT
Core activities and organisational structure Sustainability
Strategy, management control, and targets Employees and society
2011 business trend Environmental precaution
Additional statements Research and technology
Risk report Procurement | Outlook
Com
bine
d m
anag
emen
t re
port
Cor
pora
te G
over
nanc
eC
onso
lidat
ed f
inan
cial
sta
tem
ents
Add
itio
nal i
nfor
mat
ion
2
3
4
5
Com
bine
d m
anag
emen
t re
port
Cor
pora
te G
over
nanc
eC
onso
lidat
ed f
inan
cial
sta
tem
ents
Add
itio
nal i
nfor
mat
ion
To
our
shar
ehol
ders
2
3
4
5
1
Con
ten
ts
2
110 HeidelbergCement | Annual Report 2011
which aims to reduce the tied-up capital for spare parts and optimise our warehouse management, also achieved great success in 2011. We were able to reduce the tied-up capital by approximately 17.2% in comparison with 2008, the starting year of the programme.
In the aggregates business, we introduced the Group-wide “CLIMB” project at the start of 2011, with the aim of sustainably optimising all process steps from extraction through processing to the sale of aggregates. In this way, we want to achieve an increase of €120 million in results by the end of 2013. In 2011, we already identified more than a third of the optimisation potential.
The increase in cost efficiency achieved via these programmes is even more significant because all the measures taken are sustainable and represent a major competitive advantage in the long term.
New, expanded, and modernised production sitesIn order to strengthen our position in growing markets, we started or concluded a number of strategic investments alongside our investments to optimise and expand existing facilities. You can read more about this in the Investments section on page 63 f.
In the reporting year, we inaugurated the newly constructed TulaCement cement plant in Russia with a capacity of 2 million tonnes of cement. The plant supplies the Moscow area with cement. In our cement plant Górazdze in Poland, we commissioned a new kiln line with a clinker capacity of 0.9 million tonnes. In Bangladesh, the construction of a new cement mill with a capacity of 0.8 million tonnes of cement was completed at the Chittagong grinding facility.
As part of our investment programme in attractive growing markets, we continued the expan-sion of the clinker and/or cement capacities in India, Indonesia, Poland, Kazakhstan, Liberia, Ghana, and Burkina Faso.
In 2011, we consistently implemented our purchasing strategy of low-cost country sourcing for all investments in our production facilities. This generated positive effects in terms of both the initial investments and the operating costs.
Cements with lower proportions of clinkerWe have made further progress in the development of cements with less clinker, thereby achieving a reduction in both CO2 emissions and costs. Our plants in the Netherlands and Poland were the main frontrunners in this respect. In 2011, our Polish subsidiary Górazdze Cement introduced a CEM V/A cement based on blast furnace slag and fly ash, with a clinker content of only around 50%. With sales volumes of over 700,000 tonnes, the market response was very positive.
New composite cements were also successfully launched in numerous other countries. In Canada, our Delta plant started the production of EcoCemTM, a Portland limestone cement containing around 10% interground limestone. A comparable product was also launched in the UK. In Romania, a CEM III/A cement containing around 40% blast furnace slag was introduced onto the market. In Indonesia, the proportion of clinker in the main cement type was reduced by around 3% following extensive trials.

111HeidelbergCement | Annual Report 2011
Overall, this and additional measures in other countries led to a reduction of the average proportion of clinker in the cement to below 77%. Consequently, CO2 emissions fell by around 0.5 million tonnes in comparison with the previous year.
Preservation of resources and recyclingCCM, HTC, and aggregates companies in the Group countries are undertaking a joint project to develop concepts for processing sands that have previously been unusable for concrete production for quality reasons. Pilot projects are being carried out in Spain and Australia.
In Scandinavia, environmental protection regulations are now restricting the use of natural sands. In Sweden, we have therefore developed a special software for the production of concrete that allows us to use manufactured sand. In Australia, we have already successfully converted our ready-mixed concrete facilities in the Melbourne area to use manufactured sand. In the Netherlands and Belgium, our subsidiaries are involved in various projects, together with HTC, with the aim of increasing the proportion of recycled building materials in concrete.
Innovative binders and concretesWe have also achieved further success in the development and market launch of special binders. Together with a cooperation partner, we have developed Poriment® PRO, a cement-bound aerated light mortar with thermal insulation properties. For the first time, very low dry densities can be achieved without using polystyrene beads. This has not only ecological advantages in a subsequent recycling process but also technical benefits, such as improving the fire protection classification. Poriment® PRO is already successfully produced in a number of German plants. An application for approval as a thermal insulation material by the building authorities has been filed.
In Canada, we launched MICRO-LITETM, a lightweight concrete that combines easier process-ing with economic advantages such as a lower weight and thermal insulation. CemFlow®, a cement-bound fluidised floor finish, was also developed for the Canadian market. A technology that had proved successful in Germany was adapted to the regional raw materials and the new product was launched onto the market within a short period of time. In the UK, we developed Jetmix® on the basis of another technology established in Germany. The first deliveries have already been made for the Victoria Station modernisation project in London. For this project alone, we expect sales volumes of around 30,000 tonnes in 2012. These two examples show how the systematic transfer of technology can shorten development times and allow synergies to be exploited within the Group.
In 2011, white and grey TioCem® cements were used in a large number of projects in Sweden, Germany, Belgium, the Netherlands, and the Czech Republic. Concrete products like paving blocks, for example, that are produced with this photocatalytically active cement reduce air pollutants such as nitrogen oxides and have a lower level of surface contamination and thus better aesthetics. Findings from completed projects in Malmö/Sweden and model tests run by an independent institute have established a considerable reduction in nitrogen oxides in the ambient air. The reduction can be between 5% and 25%, depending on the load, building density, and wind speed, and is particularly effective for peak loads.
CoMBINED MANAGEMENT REPoRT
Core activities and organisational structure Sustainability
Strategy, management control, and targets Employees and society
2011 business trend Environmental precaution
Additional statements Research and technology
Risk report Procurement | Outlook
Com
bine
d m
anag
emen
t re
port
Cor
pora
te G
over
nanc
eC
onso
lidat
ed f
inan
cial
sta
tem
ents
Add
itio
nal i
nfor
mat
ion
2
3
4
5
Com
bine
d m
anag
emen
t re
port
Cor
pora
te G
over
nanc
eC
onso
lidat
ed f
inan
cial
sta
tem
ents
Add
itio
nal i
nfor
mat
ion
To
our
shar
ehol
ders
2
3
4
5
1
Con
ten
ts
2
112 HeidelbergCement | Annual Report 2011
Procurement
In the 2011 reporting year, goods and services with a total value of €8,656 million were procured at HeidelbergCement. This corresponds to 72.7% of the total operating costs (incl. depreciation).
Procurement managementOur lead buyer organisation facilitates cost-effective procurement of important commodity groups at Group level. This means that we bundle process-critical goods and services, usually with high volumes, into commodity groups in order to obtain better terms and conditions from our suppliers. These commodity groups include, for example, energy and raw materials. The tasks of our lead buyers within the Group include conducting price negotiations, concluding framework agreements, and observing current market and price developments. Thanks to their detailed market knowledge, they make an important contribution to increasing efficiency and to risk management in our Group.
Another important part of procurement management is the local purchasing at our production locations, which strengthens our negotiating position with local suppliers. The local purchasing departments can also obtain goods and services directly via the Group framework agreements. In this way, we combine the advantages of central and local procurement.
Increasing efficiency At the start of 2011, HeidelbergCement commenced the three-year “FOX 2013” programme to increase the Group’s financial and operational performance. One of the aims of this programme is to make savings in the area of purchasing in order to counteract the rise in the costs of elec-tricity, fuels, and raw materials. In the reporting year, we succeeded in achieving considerable cost savings in comparison with general market trends.
Another aim of “FOX 2013” is to improve payment periods. At the beginning of 2011, our pay-ment terms represented a competitive disadvantage. Thanks to process optimisations and an improvement of our Group-wide payment terms, we were able to close the gap somewhat on our main competitors and achieve a corresponding liquidity effect by the end of 2011.
Procurement of energyOverall, HeidelbergCement’s purchasing policy for the procurement of fuels and electricity focuses primarily on the short term. This means that agreements with fixed prices and quanti-ties for a long period of time – more than a year – are only concluded in isolated cases. At the beginning of the fourth quarter of 2010, we procured a large quantity of the energy required for 2011. This allowed us to avoid some of the heavy price increases that followed in nearly all energy markets in 2011. In liquid electricity markets in particular, such as Northern Europe, Germany, Belgium, the Netherlands, the Czech Republic, and the United Kingdom, we used low day-ahead prices. This purchasing strategy proved successful and, particularly in the highly productive summer months, led to acceptable electricity costs that allowed us to compensate to some extent for the market distortions following the catastrophe in Fukushima, Japan. At the start of 2011, we decided to pursue the strategy of covering our coal and petroleum coke requirements only two months in advance, and were therefore able to benefit from the slightly decreasing price trend since October 2011. In our diesel purchasing activities, we deliberately set on short-term purchases because of market uncertainties. Therefore, we were exposed to the volatility of the markets for almost the whole of 2011.

113HeidelbergCement | Annual Report 2011
Outlook
The expected future development of HeidelbergCement and the business environment in 2012 and 2013 is described below. As such, please note that this annual report contains forward-looking statements based on the information currently available and the current assumptions and forecasts of the Group management of HeidelbergCement. Such statements are naturally subject to risks and uncertainties and may therefore deviate significantly from the actual develop-ment. HeidelbergCement undertakes no obligation and furthermore has no intention to update the forward-looking statements made in this annual report.
Economic environment
General economic developmentAfter economic growth weakened in 2011 following the significant recovery in the previous year, we expect the effects of the European financial crisis on the world markets to cause a further slowdown in 2012. For 2013, we anticipate an acceleration of global economic growth once again, assuming that the crisis is overcome successfully. The International Monetary Fund (IMF) forecasts global economic growth of 3.3% and 3.9% for 2012 and 2013 respectively, following growth of 3.8% in 2011. The IMF expects that the differences in growth rates – particularly between those of the emerging countries in Asia and Africa on the one hand and the industrialised countries in North America and Europe on the other – will persist. In terms of prices for consumer goods, the IMF anticipates a decline following the significant increase in all regions in 2011. Accord-ingly, the rate of price increases in mature markets is expected to fall from 2.7% in 2011 to 1.6% and 1.3% in 2012 and 2013 respectively. A decline in the rate of price increases is also predicted for the emerging countries, from 7.2% in 2011 to 6.2% in 2012 and 5.5% in 2013. The IMF also anticipates falling raw material prices in 2012 and 2013.
In Asia, China will continue to be the driving force of industrial development. The IMF forecasts a slight decline in growth for the emerging countries in Asia, from 7.9% in 2011 to 7.3% in 2012, followed by a rise to 7.8% in 2013. Economic growth in China is also expected to drop slightly from 9.2% to 8.2%, before it increases once again in 2013 to 8.8%. In contrast, more positive developments are predicted for Africa, especially in the countries south of the Sahara, where growth rates are expected to rise again from 4.9% in 2011 to 5.5% in 2012 and then to fall only slightly to 5.3% in 2013.
As in the Asian markets, a slowdown in the economic recovery is also expected in the mature markets in 2012, followed by an acceleration of growth once again in 2013. After an increase of 1.6% in 2011, the IMF forecasts growth of just 1.2% for 2012 and a rise to 1.9% in the following year. According to IMF forecasts, the important markets for HeidelbergCement in the US, the UK, Germany, and Canada will continue their economic recovery in 2012 and 2013. In 2012, the US is expected to achieve the highest economic growth with a rate of 1.8%, followed by Canada with 1.7%, the UK with 0.6%, and Germany with 0.3%.
Also in Eastern Europe and Central Asia, low economic growth is expected in 2012 and rising growth rates in 2013. In our markets in Poland and the Czech Republic, the economy should develop positively in both years with growth rates between 1.5% and 3.5%. An even stronger
CoMBINED MANAGEMENT REPoRT
Core activities and organisational structure Sustainability
Strategy, management control, and targets Employees and society
2011 business trend Environmental precaution
Additional statements Research and technology
Risk report Procurement | outlook
Com
bine
d m
anag
emen
t re
port
Cor
pora
te G
over
nanc
eC
onso
lidat
ed f
inan
cial
sta
tem
ents
Add
itio
nal i
nfor
mat
ion
2
3
4
5
Com
bine
d m
anag
emen
t re
port
Cor
pora
te G
over
nanc
eC
onso
lidat
ed f
inan
cial
sta
tem
ents
Add
itio
nal i
nfor
mat
ion
To
our
shar
ehol
ders
2
3
4
5
1
Con
ten
ts

2
114 HeidelbergCement | Annual Report 2011
development is expected in our markets that are rich in raw materials – the Ukraine, Russia, and Kazakhstan – with growth rates between 4% and 6%.
Realisation of the economic forecasts predicted for the next two years is associated with various uncertainties. The mature markets face the challenge of combating unemployment while at the same time attempting to relieve public debt through consistent cost-saving measures. The growth markets of emerging countries remain exposed to inflation pressure. Energy prices reached their peak in the first half of 2011 and have decreased at a moderate rate since then. Conflicts in oil-producing countries may lead to a further price increase. The development of raw material and food prices, unemployment, and the interest rate policy of the central banks are all particularly crucial factors for further growth of the world economy.
Industry developmentThe varied development of economic growth is also reflected in the very different forecasts for demand for building materials in the various regions. The forecast of the US cement associa-tion PCA from November 2011 estimates increases of 5.6% and 4.0% in global cement sales volumes for 2012 and 2013 respectively, following a rise of 7.3% in 2011. This development in demand will be driven by the emerging countries with growth rates of 6.1% and 4.1%. Accord-ing to the PCA, just under 60% of globally produced cement in 2012 will be consumed in China.
Cement demand in North America, currently at a low level, is expected to undergo a small increase of just 1.4% in 2012. A rise in private residential construction as well as commercial construction is expected to overcompensate the decline of demand in public construction following the expiry of infrastructure programmes. PCA expects an increase in construction of single-family homes by 3.4% and of multifamily homes by 12%. The budget for the road construction programme under the Federal Highway Bill is expected to be extended at the current level. The decision of the Congress is still pending. In 2013, cement consumption should be driven by an increasing recovery in private residential construction, resulting in considerable growth of 5.8%.
In Europe, trends in the demand for building materials are expected to vary greatly by region. For the countries particularly affected by the property and financial crisis – Spain, Italy, Portugal, and Ireland – Euroconstruct’s forecast from November 2011 suggests a further decline in cement consumption in 2012 and, with the exception of Portugal, a stabilisation in 2013. In contrast, for the countries of Northern Europe – such as Sweden, Norway, and Denmark – whose economies achieved particularly strong growth in 2011, growth rates of up to 5% in cement consumption are expected. Consumption in the Benelux countries should increase slightly in the next two years. For the UK, a percentage decline in the low single figures is forecast for 2012, although slight growth should be resumed in 2013. For Poland a pleasing increase of 5% is expected, with a decline to 1% in the following year. For Germany, the Federal Association of the German Cement Industry (BDZ) predicts a stabilisation of the cement market on the relatively high level of the previous year, largely because of the ongoing healthy development in private residential construction, where orders rose by 17.7% in 2011.
Like the general economic forecasts, the development of demand for building materials during 2012 and 2013 is also associated with uncertainties. With infrastructure development programmes coming to an end and greater efforts to consolidate budgets in some mature markets, the de-mand for building materials is increasingly dependent on the development of private residential
115HeidelbergCement | Annual Report 2011
construction as well as commercial construction. Growth can only be achieved with sustained positive economic development, falling unemployment figures, and affordable property financing. In the growth markets of the emerging countries, continued, steady economic growth also plays an important role, as does income available for private residential construction, which in turn depends on the development of local food prices and thus also on inflation.
Anticipated earnings
RevenueOn the basis of the general economic and industry-specific prospects for the building materials industry and the specific growth prospects for markets in which HeidelbergCement operates, a moderate increase in revenue is expected for 2012 in comparison with the previous year. Capacity expansions in the cement business, which have already been completed in 2011 or are set to be completed in 2012, will play a significant role. These include, in particular, the new TulaCement cement plant in Russia, which has been inaugurated in the summer of 2011, the new cement mill in Bangladesh, which commenced production at the start of January 2012, and the expansion of the production facilities in Central India, which are set to commence operation at the end of May 2012. In the cement business, we therefore anticipate rising sales volumes. In the aggregates business we expect sales volumes to remain stable after a good start to the year in North America. In 2012, price increases will be a high priority in order to offset, as far as possible, the loss of margin suffered in the previous year following a sharper rise in energy costs than expected. The revenue forecast for 2012 has been based on virtually stable exchange rates against the euro in comparison with 2011.
Group areasIn the Western and Northern Europe Group area, we expect a slight overall dip in demand and falling sales volumes in cement and aggregates. This is connected mainly with the strong growth in sales volumes in the previous year, which was significantly higher than expected because of the mild winter weather. Scandinavia forms an exception to this trend, with a further increase in cement shipments anticipated in this region.
In our Eastern Europe-Central Asia Group area, we expect further growth in sales volumes of cement and aggregates, which will be largely driven by the additional capacities and ongo-ing increase in demand in Russia, the Ukraine, and Central Asia. As a consequence of the difficult general economic conditions in Hungary and Romania, we expect the development of sales volumes to remain weak in these countries. In the other countries of Eastern Europe, we anticipate stagnating sales volumes in 2012 following the pleasing development of the previous year.
In North America, we expect a moderate increase in cement volumes because of the slow recovery of investment in private residential construction as well as commercial construction. In the aggregates business, we expect a slight rise despite the ARRA infrastructure develop-ment programme coming to an end. Price increases are planned for both of our core products in order to offset the erosion of our margins in 2011. Overall, we expect demand for building materials from the raw materials industry in Canada and the US to support the sales volumes of our products once again in 2012.
CoMBINED MANAGEMENT REPoRT
Core activities and organisational structure Sustainability
Strategy, management control, and targets Employees and society
2011 business trend Environmental precaution
Additional statements Research and technology
Risk report Procurement | outlook
Com
bine
d m
anag
emen
t re
port
Cor
pora
te G
over
nanc
eC
onso
lidat
ed f
inan
cial
sta
tem
ents
Add
itio
nal i
nfor
mat
ion
2
3
4
5
Com
bine
d m
anag
emen
t re
port
Cor
pora
te G
over
nanc
eC
onso
lidat
ed f
inan
cial
sta
tem
ents
Add
itio
nal i
nfor
mat
ion
To
our
shar
ehol
ders
2
3
4
5
1
Con
ten
ts
2
116 HeidelbergCement | Annual Report 2011
In the Asia-Pacific and Africa-Mediterranean Basin Group areas, we expect a sustainably posi-tive demand trend with strong growth in China, Indonesia, India, and Bangladesh as well as a stable development in Australia. In our African core markets in Tanzania, Gabon, Ghana, and the Democratic Republic of Congo, we anticipate an above-average rise in demand compared with general economic growth. In contrast, we expect demand for building materials to weaken further in Spain. Overall, we anticipate a rise in the sales volumes of cement and aggregates for both Group areas. We expect energy costs to increase further in Asia and are therefore planning price increases in order to stabilise margins.
CostsPrices for energy and raw materials are expected to remain highly volatile. After price indices have been declining since the middle of 2011, prices for oil rose again in February 2012 due to the ban on Iranian oil imports. HeidelbergCement expects a further increase – albeit less marked than in 2011 – in the cost base for electricity, fuels, raw materials, and personnel in 2012. With this situation in mind, we will resolutely continue with our measures to further optimise costs and increase cash flow, which we have combined in the “FOX 2013” programme. The programme focuses on improving efficiency in our core activities of aggregates and cement. In cement manufacturing, we are planning to reduce energy costs sustainably as part of the “Operational Excellence” (OPEX) programme. As regards aggregates, we want to achieve a sustainable improvement in margins and best practices by comprehensive, global benchmark-ing and portfolio optimisations. After “FOX 2013” exceeded our expectations in 2011, we have revised the goals and are now planning measures to increase the cash flow by a total of €850 million for the three-year period of the programme (2011 to 2013). We want to achieve a further €200 million of this total in 2012 in comparison with the base year, 2010.
For 2012, we expect a moderate increase in financing costs, due to the rise in interest margins because of the general uncertainty on the financial markets.
ResultsIn view of the positive development of sales volumes and costs since the beginning of the year, HeidelbergCement expects a moderate increase in operating income in 2012. This assumption is made on the basis that cement sales volumes will increase as expected and that the predicted rise in costs can be at least compensated for by cost-saving measures and price increases.
2013 forecastFor 2013, HeidelbergCement predicts an increase in revenue and results. This is based on the assumption that worldwide economic growth will accelerate once again and trigger a rise in demand for building materials.
DividendAs in 2011, we will also adjust the dividend to the development of the net debt to equity ratio and of cash flow of HeidelbergCement in the next two years, and, in doing so, take into account the general economic development. In the medium term, we aim to achieve an industry-typical payout ratio of 30% to 35% of the Group share of profit.
117HeidelbergCement | Annual Report 2011
Investments
As in previous financial years, HeidelbergCement will continue to exercise strict spending dis-cipline regarding investments. Debt reduction remains an important area of focus. With around €980 million (previous year: 959), cash flow investments will remain at a stable level in 2012.
In 2013, we will also align the amount of our investments with the development of the net debt to equity ratio and the operating income of the Group as well as the expected overall economic trend.
HeidelbergCement will continue with its targeted investments in future growth – especially in cement activities in the emerging countries of Asia, Africa, and Eastern Europe. In the long term, we aim to increase the proportion of our cement capacities in these markets from the current figure of 60% to 67% of total Group capacity.
The capacity expansion at the Górazdze cement plant in Poland is progressing according to plan. Following the increase in clinker capacity with the commissioning of the second, modernised kiln line in spring 2011, the cement grinding capacity is currently being expanded with the construction of a new mill. This second project phase is scheduled for completion in mid-2012; overall, this will increase the cement capacity of the plant by 1.2 million tonnes. The construction of the new Caspi Cement cement plant in western Kazakhstan is also progressing rapidly. The plant with a capacity of 0.8 million tonnes will strengthen our nationwide presence and allow us to supply the oil- and gas-rich region on the Caspian Sea more cost-effectively. We aim to produce the first cement there by 2013.
In view of the promising growth prospects in Indonesia, Indocement is continuing to expand its cement capacity with the construction of an additional cement grinding facility at the Citeureup plant. The commissioning of the grinding facility with a capacity of 2 million tonnes is scheduled for 2013. We are also currently expanding our cement capacities in Central India by 2.9 million tonnes. The completion of the new facilities in our Damoh and Jhansi plants and the start of production are scheduled for the second quarter of 2012. HeidelbergCement will then have a total capacity of 6 million tonnes in India.
Another significant investment focus lies in the expansion of our cement activities in Africa. A new cement mill with a capacity of 0.5 million tonnes is currently under construction in Liberia and is set to be commissioned during the fourth quarter of 2012. We are also expanding our cement production capacity in our main market, Ghana, with the construction of a new cement mill at the Tema grinding plant; the commissioning of the mill with a capacity of 1 million tonnes is scheduled for the fourth quarter of 2012. In Togo, we are planning to construct a greenfield clinker plant with a capacity of 1.5 million tonnes; the construction is set to commence this year. At the beginning of 2014, a greenfield cement grinding plant with a capacity of 650,000 tonnes is set to start operation in Burkina Faso, close to the capital, Ouagadougou. In the Democratic Republic of Congo, we intend to increase our cement capacity from over 500,000 tonnes to more than 1.4 million tonnes in the coming years. In Tanzania, the modernisation and upgrading of cement kiln 3 should increase the clinker capacity of our Tanzania Portland Cement plant by 250,000 tonnes from the second quarter of 2012. We are also evaluating options for capacity expansions in other African countries.
CoMBINED MANAGEMENT REPoRT
Core activities and organisational structure Sustainability
Strategy, management control, and targets Employees and society
2011 business trend Environmental precaution
Additional statements Research and technology
Risk report Procurement | outlook
Com
bine
d m
anag
emen
t re
port
Cor
pora
te G
over
nanc
eC
onso
lidat
ed f
inan
cial
sta
tem
ents
Add
itio
nal i
nfor
mat
ion
2
3
4
5
Com
bine
d m
anag
emen
t re
port
Cor
pora
te G
over
nanc
eC
onso
lidat
ed f
inan
cial
sta
tem
ents
Add
itio
nal i
nfor
mat
ion
To
our
shar
ehol
ders
2
3
4
5
1
Con
ten
ts
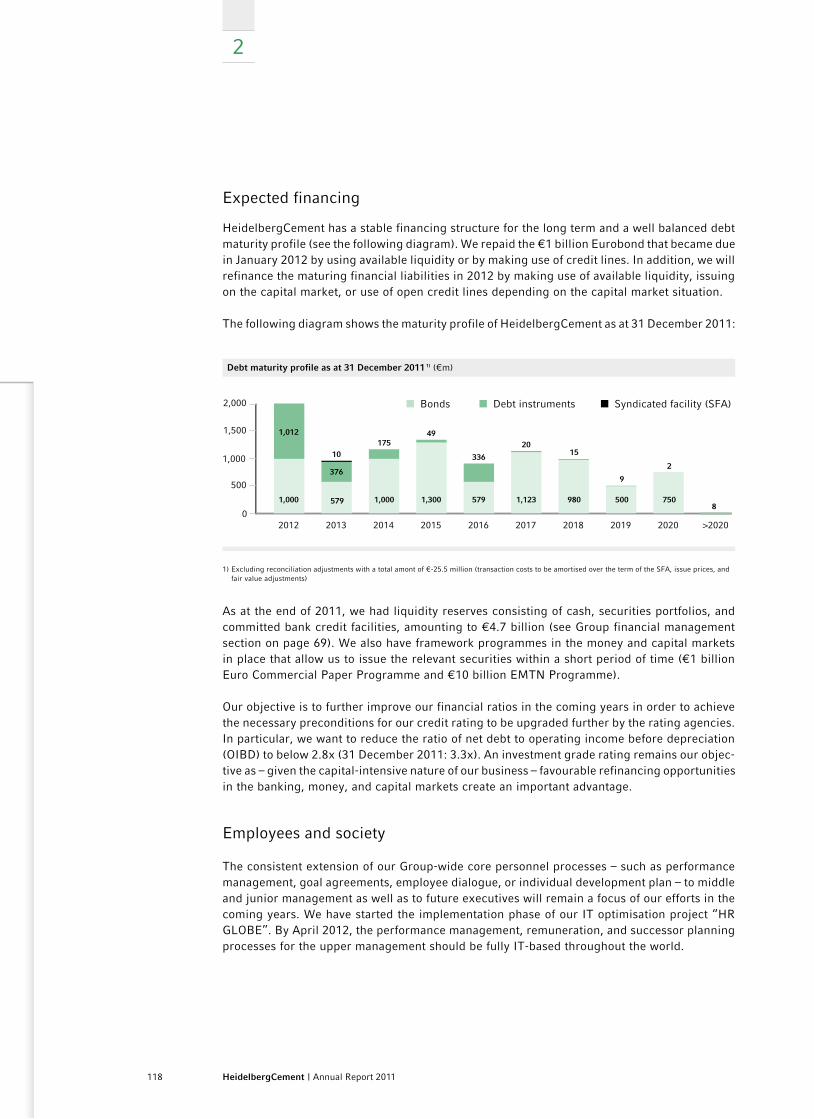
2
118 HeidelbergCement | Annual Report 2011
Expected financing
HeidelbergCement has a stable financing structure for the long term and a well balanced debt maturity profile (see the following diagram). We repaid the €1 billion Eurobond that became due in January 2012 by using available liquidity or by making use of credit lines. In addition, we will refinance the maturing financial liabilities in 2012 by making use of available liquidity, issuing on the capital market, or use of open credit lines depending on the capital market situation.
The following diagram shows the maturity profile of HeidelbergCement as at 31 December 2011:
Debt maturity profile as at 31 December 2011 1) (€m)
2012 2013 2014 2015 2016 2017 2018 2019 2020 >20200
500
1,000
1,500
2,000 Bonds Debt instruments Syndicated facility (SFA)
1,000
1,012
376
10
579 1,000
175
1,300
49
579
336
1,123
20
980 500 750
15
9
2
8
1) Excluding reconciliation adjustments with a total amont of €-25.5 million (transaction costs to be amortised over the term of the SFA, issue prices, and fair value adjustments)
As at the end of 2011, we had liquidity reserves consisting of cash, securities portfolios, and committed bank credit facilities, amounting to €4.7 billion (see Group financial management section on page 69). We also have framework programmes in the money and capital markets in place that allow us to issue the relevant securities within a short period of time (€1 billion Euro Commercial Paper Programme and €10 billion EMTN Programme).
Our objective is to further improve our financial ratios in the coming years in order to achieve the necessary preconditions for our credit rating to be upgraded further by the rating agencies. In particular, we want to reduce the ratio of net debt to operating income before depreciation (OIBD) to below 2.8x (31 December 2011: 3.3x). An investment grade rating remains our objec-tive as – given the capital-intensive nature of our business – favourable refinancing opportunities in the banking, money, and capital markets create an important advantage.
Employees and society
The consistent extension of our Group-wide core personnel processes – such as performance management, goal agreements, employee dialogue, or individual development plan – to middle and junior management as well as to future executives will remain a focus of our efforts in the coming years. We have started the implementation phase of our IT optimisation project “HR GLOBE”. By April 2012, the performance management, remuneration, and successor planning processes for the upper management should be fully IT-based throughout the world.
119HeidelbergCement | Annual Report 2011
The new management training programme in cooperation with Duke Corporate Education will be the focus of our training measures at Group level from 2011 to 2014. In the coming years we will further expand our programmes for the advancement of future executives, such as the trainee programme for new employees from the CIS countries. We have added a follow-up pro-gramme to our existing “Engineer in Training” programme. In the aggregates business line, we are continuing with the set up of the Aggregates Academy. Over a period of four to five years, our talented engineers are specifically prepared for management positions in the technical field both in Germany and abroad.
In 2012, we will devote increased attention to the topic of management responsibility in occupa-tional health and safety and provide specific training for our managers. Consistent implementa-tion of, and compliance with, the existing safety standards is a top priority and is a prerequisite for preventing accidents. As many transport accidents occur off the company premises, the implementation of our “Driving Safety” Group standard is particularly important. In many of the countries in which we operate, the general traffic safety situation poses a huge challenge in itself, making this aim even more crucial. By providing training and raising the awareness of both our own drivers and those from external companies, we aim to play our part in reducing the number of accidents.
The areas surrounding our plants are as diverse as the people living and working there. That is why our social commitment is geared towards their needs. The voluntary activities we undertake at our locations are in line with our Corporate Citizenship Guidelines. All measures should achieve positive results for the benefit of society. We also want to promote mutual trust and partner-ship through transparency, open communication, and cooperation. Because we firmly believe that companies play a vital role in tackling social issues, our commitment is an ongoing one.
Environmental precaution
Over the next years, we will continue with the implementation of our Sustainability Ambitions 2020. Our efforts will focus primarily on the medium-term goals we want to achieve by 2012. We will then review and, if necessary, revise the action plans drawn up to help us achieve the goals for 2020.
In 2012, we will develop a systematic environmental audit scheme for our cement, concrete, and aggregates locations in all Group areas.
In addition to extending our biodiversity management plans to additional locations, we will focus on the tasks we are undertaking in our partnership with the nature conservation organisation BirdLife International. Our goals for 2012 are to develop a joint biodiversity strategy and start the first joint projects at our quarries. We will also present the “Quarry Life Award” for the first time in 2012. More than 60 of our quarrying sites in 18 countries are opening their doors to allow students and researchers to undertake biodiversity projects in order to compete for the award.
Another important activity will be intensifying the use of alternative fuels, focusing on the possibilities we have already identified for the use of household waste, sewage sludge, and hazardous waste in Indonesia, China, Turkey, Togo, Georgia, Sweden, Poland, and Russia. New and modernised facilities at our cement plants in Europe, Turkey, China, North America, and Africa allow us to co-process increasing amounts of biomass and agricultural waste without leaving any residues.
CoMBINED MANAGEMENT REPoRT
Core activities and organisational structure Sustainability
Strategy, management control, and targets Employees and society
2011 business trend Environmental precaution
Additional statements Research and technology
Risk report Procurement | outlook
Com
bine
d m
anag
emen
t re
port
Cor
pora
te G
over
nanc
eC
onso
lidat
ed f
inan
cial
sta
tem
ents
Add
itio
nal i
nfor
mat
ion
2
3
4
5
Com
bine
d m
anag
emen
t re
port
Cor
pora
te G
over
nanc
eC
onso
lidat
ed f
inan
cial
sta
tem
ents
Add
itio
nal i
nfor
mat
ion
To
our
shar
ehol
ders
2
3
4
5
1
Con
ten
ts
2
120 HeidelbergCement | Annual Report 2011
For the third phase of the European Emissions Trading System (EU ETS) beginning in 2013, we are continuing to work on consistently reducing our CO2 emissions.
As a member of the Cement Sustainability Initiative (CSI), we will participate in the development of a global certification system for sustainably produced concrete.
Research and technology
In the coming years, we are planning to further expand our research and development activities in order to further increase our innovative strength. Efforts are centred on developing cement types with a reduced proportion of clinker and thus lower CO2 emissions. The alternative raw materials and fuels used will benefit the environment. Significant cost savings are also expected, depending on the future price development for CO2 emission certificates.
Another area of focus is the development of high-quality binders and concrete applications in order to achieve greater benefit for our customers and added value for our company. In the future, we will intensify the successful transfer of technology to further increase the speed of innovation. For the concrete business line, we plan to increase the profit contribution of special products in mature markets by an additional 9% in 2012.
In the cement business, we will continue the “Operational Excellence” programme started in 2010. By the end of 2013, we will systematically identify and exploit saving potentials in power and fuel costs at all our cement plants by optimising our production facilities. The same applies to our “CLIMB” project in the aggregates business, which was introduced in 2011. By the end of 2013, we aim to achieve a sustainable improvement in results of €120 million through process optimisations and margin increases.
Procurement
Over the next year, we will continue to increase the efficiency of our procurement activities by consistently standardising and optimising our procurement processes. This will include further efforts to bundle commodity groups.
For 2012, we anticipate varying energy price developments in the energy markets that are rele vant to us. While significant price increases are still expected in Asia and Central Asia, partly because of the high rates of inflation, we anticipate a stable price level for Central and Northern Europe in comparison with 2011. North America presents a mixed picture, with electricity and gas prices remaining fairly stable but with coal prices rising because of the price gap that emerged in 2011 between local US coal and the international coal markets. Overall, we will maintain the short-term focus of our purchasing policy for fuels and electricity.
121HeidelbergCement | Annual Report 2011
Estimates for 2012 and 2013 by Group management – risks and opportunities
Following the marked recovery in 2010, the growth of the global economy slowed again in 2011. The construction industry in the mature markets of North America and in the European countries that escaped the debt crisis benefited from a recovery of private residential construc-tion and commercial construction in 2011, as well as from mild winter weather at the end of the year. At the same time, the infrastructure programmes initiated during the crisis largely expired in 2011; this will have the delayed effect of triggering a decline in public construction in the countries concerned, especially in 2012.
RisksThe possibility that global economic growth will fall short of expectations and a potential re-lapse into another recession – also known as a double-dip scenario – pose the main risks to ongoing development. This could be triggered, for example, by an uncontrolled break-up of the euro zone, a delayed recovery of the US economy, an overheating of the Chinese or Indian economy, or military conflicts in countries rich in raw materials. Measures already implemented and potential future measures to reduce debt in individual national budgets – for example, the US and the UK – may lead to cuts in infrastructure investments and have a negative effect on economic growth and thus on demand in commercial construction and the reduction of the unemployment rate and, in turn, on demand in private residential construction.
Following the bursting of the housing bubble, there is still a large number of relatively new houses in foreclosure, especially in the US, which need to be absorbed into the property market. The excess supply of houses and flats puts pressure on prices and reduces demand for new residential property. If the reduction of this excess supply is slow or delayed, there is a risk that recovery will be weaker than expected in private residential construction.
The ongoing high volatility of electricity and fuel prices presents a risk for the development of our earnings in 2012 and 2013. Results would be adversely affected if, for example, electricity and fuel prices rise more sharply than expected because of regional unrest in the countries of North Africa or the Middle East, or if HeidelbergCement is unable to offset this rise by raising prices and improving efficiency.
An additional risk for sales volumes, revenue, and results is that the rise of inflation could turn out to be greater than anticipated, especially in the emerging countries of Asia. As a result, the household income available and thus the demand in the residential construction sector could decrease.
Fluctuations in the exchange rates of foreign currencies against the euro present both risks and opportunities. For example, on the one hand, appreciation of the US dollar against the euro leads to growth in revenue and operating income; on the other hand, the US dollar-based proportion of debt after translation into euro also increases.
CoMBINED MANAGEMENT REPoRT
Core activities and organisational structure Sustainability
Strategy, management control, and targets Employees and society
2011 business trend Environmental precaution
Additional statements Research and technology
Risk report Procurement | outlook
Com
bine
d m
anag
emen
t re
port
Cor
pora
te G
over
nanc
eC
onso
lidat
ed f
inan
cial
sta
tem
ents
Add
itio
nal i
nfor
mat
ion
2
3
4
5
Com
bine
d m
anag
emen
t re
port
Cor
pora
te G
over
nanc
eC
onso
lidat
ed f
inan
cial
sta
tem
ents
Add
itio
nal i
nfor
mat
ion
To
our
shar
ehol
ders
2
3
4
5
1
Con
ten
ts

2
122 HeidelbergCement | Annual Report 2011
opportunities arising from the development of general conditionsIn 2012, opportunities could arise from stronger than expected growth in the economies of Europe and North America and the resulting upturn in commercial and private residential con-struction. Public construction could also benefit as a result of higher tax yield. In the medium and long term, we mainly see opportunities for an increase in demand for building materials for residential, commercial, and public construction as a result of rising population figures, growing wealth, and the ongoing trend of urbanisation, especially in the growth markets of emerging countries.
Strategic Group opportunitiesEven during the crisis we continued to expand our capacities in attractive growth regions in a targeted and highly disciplined way. This enabled us, for example, to continuously increase our cement capacities in the growth markets of Asia, Africa, and Eastern Europe. In 2011, we com-missioned a modernised kiln line in Poland and further expanded our market position in Russia by inaugurating the new TulaCement cement plant. With the new cement mill in Bangladesh and the expansion of the cement capacities in Central India planned for May 2012, we have opportunities to benefit from the anticipated growth in these regions. We intend to continue with this growth strategy in the coming years.
opportunities relating to economic performanceThe consistent and ongoing implementation of measures to improve efficiency and reduce pro-duction costs, as well as the realisation of opportunities associated with this, is an integral part of our strategy. As part of the new “FOX 2013” programme, which was launched in early 2011, we are working on reducing energy consumption in cement manufacturing and improving our margins comprehensively in the aggregates business line. Furthermore, we see opportunities for improving the cost structure by increasing the use of alternative fuels and raw materials and, in doing so, reducing our CO2 emissions.
With its integrated product portfolio, its strong positions in growth markets, and its efficient cost structure, HeidelbergCement considers itself well-equipped to benefit from the opportunities presented, even with a slowdown in worldwide economic growth.

123HeidelbergCement | Annual Report 2011
CoMBINED MANAGEMENT REPoRT
Core activities and organisational structure Sustainability
Strategy, management control, and targets Employees and society
2011 business trend Environmental precaution
Additional statements Research and technology
Risk report Procurement | outlook
Com
bine
d m
anag
emen
t re
port
Cor
pora
te G
over
nanc
eC
onso
lidat
ed f
inan
cial
sta
tem
ents
Add
itio
nal i
nfor
mat
ion
2
3
4
5
Com
bine
d m
anag
emen
t re
port
Cor
pora
te G
over
nanc
eC
onso
lidat
ed f
inan
cial
sta
tem
ents
Add
itio
nal i
nfor
mat
ion
To
our
shar
ehol
ders
2
3
4
5
1
Con
ten
ts
124 HeidelbergCement | Annual Report 2011
Corporate Governance
Part of the combined management report of HeidelbergCement Group and HeidelbergCement AG
3
125HeidelbergCement | Annual Report 2011
Corporate Governance statement 126Statement of compliance in accordance with § 161 of the German Stock Company Act (Aktiengesetz) 126Corporate Governance practices that extend beyond the legal requirements 127Working methods of Managing Board and Supervisory Board, and composition and working methods of their committees 127Compliance 130 Remuneration report 131Managing Board remuneration system 2011 131Amount of Managing Board remuneration in 2011 137Remuneration of the Supervisory Board in 2011 139 Supervisory Board and Managing Board 140Supervisory Board 140Supervisory Board Committees 142Managing Board 142
Cor
pora
te G
over
nanc
eC
onso
lidat
ed f
inan
cial
sta
tem
ents
Add
itio
nal i
nfor
mat
ion
3
4
5
Com
bine
d m
anag
emen
t re
port
Cor
pora
te G
over
nanc
eC
onso
lidat
ed f
inan
cial
sta
tem
ents
Add
itio
nal i
nfor
mat
ion
To
our
shar
ehol
ders
2
3
4
5
1
Con
ten
ts
3
126 HeidelbergCement | Annual Report 2011
Corporate Governance statement 1)
Statement of compliance in accordance with § 161 of the German Stock Company Act (Aktiengesetz)
On 7 February 2012, the Managing Board and on 9 February 2012, the Supervisory Board resolved to submit the following statement of compliance in accordance with § 161, section 1 of the German Stock Company Act: The Managing Board and Supervisory Board of Heidelberg-Cement AG declare, in accordance with § 161, section 1 of the German Stock Company Act, that they have complied with, and are in compliance with, the recommendations of the Government Commission on the German Corporate Governance Code (hereafter referred to as the Code), with the following exceptions:
− Some of the Managing Board agreements do not provide for any limit on redundancy pay-ments (redundancy pay cap) in the event of early termination of membership of the Managing Board without good cause or due to a change of control (deviation from point 4.2.3).
Justification: The Supervisory Board respects the provision for the protection of continuance for the existing Managing Board agreements, which do not provide for any corresponding limit on redundancy payments. New future agreements and extensions to existing Manag-ing Board agreements will, however, include a limit on redundancy payments in line with the Code. All four Managing Board agreements extended in 2011 already contain a limit on redundancy payments in line with the Code. As determined by the start dates of these agree-ments, the limit on redundancy payments for two Managing Board agreements entered into force in 2011; for two other Managing Board agreements, it enters into force in 2012.
− The Chairman of the Supervisory Board does not chair the Personnel Committee (deviation from point 5.2).
Justification: The Supervisory Board deems this allocation appropriate on the basis of the shareholder structure of the company.
− The Supervisory Board shall not designate specific goals and quotas for its composition (deviation from point 5.4.1).
Justification: The Supervisory Board regards the qualification of the Supervisory Board mem-ber and a Supervisory Board candidate as the decisive criterion for taking on a Supervisory Board mandate and its composition. It thereby supports and considers the criteria specified in point 5.4.1 but does not allow itself to be restricted by specific targets or quotas within the scope of its discretion in selection.
− The shareholdings of members of the Supervisory Board are not disclosed (deviation from point 6.6).
Justification: The members of the Supervisory Board are bound by the shareholding disclosure requirements under § 21 of the German Securities Trading Law (Wertpapierhandelsgesetz) and the Directors’ Dealings disclosure requirements under § 15a of the German Securities Trading Law. This seems to guarantee sufficient transparency as regards the shareholdings of members of the Supervisory Board.
The above statement relates to the version of the Code dated 26 May 2010, published on 2 July 2010, for the reporting period from 8/10 February 2011 (submission date of the previous state-ment of compliance).
1) In accordance with § 289a of the German Commercial Code (HGB), likewise the Corporate Governance Report in accordance with point 3.10 of the German Corporate Governance Code
127HeidelbergCement | Annual Report 2011
Corporate Governance practices that extend beyond the legal requirements
A Group-wide Code of Business Conduct requires all employees to observe the basic rules of business decorum – irrespective of whether these rules have been expressed in legal regulations or not. In particular, the Code of Business Conduct calls for:− integrity and professional behaviour towards customers, suppliers, authorities, and business
partners,− consistent avoidance of conflicts of interest,− careful and responsible handling of the Group’s property and assets,− careful and responsible handling of company and business secrets as well as personal data,− fair, non-discriminatory employment conditions and fair dialogue with the employee repre-
sentatives,− the provision of healthy and safe jobs, and− considerate handling of natural resources.
The Code of Business Conduct, which is published on our website www.heidelbergcement.com under “About us/Corporate Governance/Code of Business Conduct”, is part of the comprehensive compliance programme and its observance is monitored by control mechanisms included in the programme.
Working methods of Managing Board and Supervisory Board, and composition and working methods of their committees
As a German public limited company, HeidelbergCement is required by law to have a two-tier board system: The Managing Board is responsible for independently managing the Group; its members are jointly accountable for the management of the Group; the Chairman of the Manag-ing Board coordinates the work of the members of the Managing Board. The Supervisory Board appoints, monitors, and advises the Managing Board and is directly involved in decisions of fundamental importance to the Group; the Chairman of the Supervisory Board coordinates the work of the Supervisory Board.
Management by the Managing BoardIn managing the Group, the Managing Board is obliged to act in the Group’s best interests and increase the sustainable value of the Group. It develops the Group’s strategy, coordinates it with the Supervisory Board, and ensures its implementation. It ensures that all provisions of law and the Group’s internal guidelines are adhered to, and works to achieve compliance by Group companies. It ensures appropriate risk management and risk controlling within the Group. The Managing Board considers diversity when filling management positions within the Group, and in doing so, strives to give due consideration to women; however, the Managing Board is opposed to a fixed quota of women. The Managing Board Rules of Procedure issued by the Managing and Supervisory Boards govern, in connection with the schedule of responsi-bilities approved by the Supervisory Board, the work of the Managing Board, in particular the departmental responsibilities of individual members of the Managing Board, matters reserved for the full Managing Board, and the required majority for resolutions. In accordance with these rules, each member of the Managing Board runs his management department independently, with the provision that all matters of clearly defined fundamental importance are to be decided upon by the full Managing Board. This takes place in the regular meetings of the Managing Board, led by the Chairman of the Managing Board, on the basis of prepared meeting docu-ments. The results of the meetings are recorded in minutes, which are issued to all members of the Managing Board. There are no Managing Board committees.
CoRPoRATE GoVERNANCE
Corporate Governance statement Supervisory Board and Managing Board
Remuneration report
Cor
pora
te G
over
nanc
eC
onso
lidat
ed f
inan
cial
sta
tem
ents
Add
itio
nal i
nfor
mat
ion
3
4
5
Com
bine
d m
anag
emen
t re
port
Cor
pora
te G
over
nanc
eC
onso
lidat
ed f
inan
cial
sta
tem
ents
Add
itio
nal i
nfor
mat
ion
To
our
shar
ehol
ders
2
3
4
5
1
Con
ten
ts

3
128 HeidelbergCement | Annual Report 2011
Consultation and supervision by the Supervisory BoardThe task of the Supervisory Board is to regularly advise and supervise the Managing Board in the management of the Group. The Managing Board must involve the Supervisory Board in decisions of fundamental importance to the Group. The Supervisory Board Rules of Procedure issued by the Supervisory Board govern its organisation and work, in particular the required majority for resolutions, the legal transactions and measures requiring its consent, the standard retirement age for Managing and Supervisory Board members, and the tasks of established committees.
The Supervisory Board meets at least twice every half-year; at these meetings, it usually discusses the open topics and passes the required resolutions, on the basis of reports drawn up by the Managing Board and documents received in advance in preparation for the meeting. Additional meetings are held if necessary. The results of the meetings are recorded in minutes, which are issued to all members of the Supervisory Board. The Supervisory Board comprises a number of independent members – a number which it deems sufficient – and at least one independent member with expertise in either accounting or auditing. In accordance with the Articles of As-sociation, the Supervisory Board has set up a total of four committees, which are entrusted with the tasks and working methods described below. The following respective plenary session of the Supervisory Board is given an account of the results of the committee work.
The Personnel Committee is responsible for preparing the decision of the Supervisory Board concerning the appointment of members of the Managing Board, for preparing the election of the Chairman of the Managing Board, and the establishment of the Managing Board’s remuneration structure as well as the remuneration paid to the individual members of the Managing Board. It is also responsible for making a decision concerning the structuring of the non-remuneration-related legal relationships between the company and the members of the Managing Board. The Personnel Committee comprises Messrs Fritz-Jürgen Heckmann, Josef Heumann, Hans Georg Kraut, Ludwig Merckle, Tobias Merckle, and Heinz Schmitt; the Chairman is Mr Ludwig Merckle.
The Audit Committee is responsible for preparing the decision of the Supervisory Board con-cerning the adoption of the annual financial statements and the approval of the consolidated financial statements. It is also responsible for monitoring the accounting process, the effective-ness of the internal control system, the risk management system, the internal audit system, the compliance programme, and the audit. In addition, it has the task of preparing the Supervisory Board’s proposal to the Annual General Meeting for the appointment of the auditor, issuing the audit assignment, establishing focal points for the audit, concluding the fee agreement with the auditor, obtaining the auditor’s statement of independence, and making the decision concerning measures to be taken if reasons emerge during the audit to warrant the possible disqualification of the auditor or suggest a conflict of interest on the part of the auditor. The Audit Committee discusses the half-yearly and quarterly reports with the Managing Board be-fore they are published. The results of the meetings are recorded in minutes, which are issued to all committee members. In addition to the Chairman, the Audit Committee includes at least one independent member with expertise in either accounting or auditing. The Audit Committee comprises Messrs Robert Feiger, Fritz-Jürgen Heckmann, Max Dietrich Kley, Ludwig Merckle, Heinz Schmitt, and Werner Schraeder; the Chairman is Mr Ludwig Merckle.
The Nomination Committee is responsible for putting suitable candidates forward to the Super-visory Board for its proposals for election to be made to the Annual General Meeting. It comprises Messrs Fritz-Jürgen Heckmann, Ludwig Merckle, and Tobias Merckle as shareholder representa-tives; the Chairman is Mr Fritz-Jürgen Heckmann.
129HeidelbergCement | Annual Report 2011
The Arbitration Committee, formed in accordance with § 27, section 3 and § 31, section 3 of the German Codetermination Law, is responsible for making a proposal to the Supervisory Board for the appointment of members of the Managing Board if the necessary two-thirds majority is not initially achieved. It comprises Messrs Fritz-Jürgen Heckmann, Hans Georg Kraut, Tobias Merckle, and Heinz Schmitt; the Chairman is Mr Fritz-Jürgen Heckmann.
DiversityIn its meeting of 10 February 2011, the Supervisory Board decided regarding its composition to support the principles mentioned in point 5.4.1 of the German Corporate Governance Code (Code) and to consider diversity when selecting the available candidates. In a deviation from point 5.4.1 of the Code, however, it shall not set fixed goals in the form of quotas or absolute figures because it regards the qualification of a Supervisory Board member and a candidate as the decisive criterion for the composition and/or for taking on a Supervisory Board mandate. The Supervisory Board confirmed this policy decision in its meeting of 24 November 2011. The Rules of Procedure for the Supervisory Board specify the standard retirement age for members of the Managing Board as 65, and 75 for members of the Supervisory Board.
Cooperation between Managing Board and Supervisory BoardThe Managing Board and Supervisory Board cooperate closely for the benefit of the Group. To this end, the Managing Board coordinates the Group’s strategic approach with the Supervisory Board and discusses the current state of strategy implementation with the Supervisory Board at regular intervals. For clearly defined transactions of fundamental importance, the Supervisory Board has specified provisions in the Managing Board Rules of Procedure requiring its approval.
The Managing Board informs the Supervisory Board regularly, without delay and comprehen-sively, of all issues of importance to the Group with regard to planning, business development, risk situation, risk management, and compliance. The Managing Board explains deviations of the actual business development from previously formulated plans and goals, indicating the reasons for this. The Supervisory Board has included detailed provisions in the Managing Board Rules of Procedure with regard to the Managing Board’s information and reporting duties. Documents required for decisions, in particular, the annual financial statements, the consolidated financial statements, and the Auditors’ report, are sent to the members of the Supervisory Board in due time before the meeting.
Shareholdings of members of the Managing Board and Supervisory BoardThe direct or indirect ownership of shares or share-based derivatives by members of the Man-aging Board has, neither in any individual case nor in total, exceeded the threshold of 1% of the issued shares.
According to the available reports, Supervisory Board member Ludwig Merckle indirectly holds 25.11% of the issued shares. As regards the other members of the Supervisory Board, the ownership of shares or share-based derivatives has, neither in any individual case nor in total, exceeded the threshold of 1% of the issued shares, according to the available reports.
Relationships with shareholdersIn line with the options provided for in accordance with the law or the Articles of Association, the shareholders exercise their rights before or during the Annual General Meeting and thereby exercise their voting right. Each share carries one vote at the Annual General Meeting (one-share-one-vote principle). The ordinary Annual General Meeting is normally held in the first five months of the financial year. All important documents for exercising shareholder rights as well
CoRPoRATE GoVERNANCE
Corporate Governance statement Supervisory Board and Managing Board
Remuneration report
Cor
pora
te G
over
nanc
eC
onso
lidat
ed f
inan
cial
sta
tem
ents
Add
itio
nal i
nfor
mat
ion
3
4
5
Com
bine
d m
anag
emen
t re
port
Cor
pora
te G
over
nanc
eC
onso
lidat
ed f
inan
cial
sta
tem
ents
Add
itio
nal i
nfor
mat
ion
To
our
shar
ehol
ders
2
3
4
5
1
Con
ten
ts
3
130 HeidelbergCement | Annual Report 2011
as the resolution issues and documentation are duly available on our website for shareholders to access. Both the notice of the agenda for the Annual General Meeting and our website will provide shareholders with the information they need to exercise their rights, and particularly their voting rights at the Annual General Meeting, including by way of proxy. The report given by the Chairman of the Managing Board to the Annual General Meeting will be made available on the Internet at the same time. After the Annual General Meeting is over, our website will be updated with the attendance details and the voting results of each agenda item.
As part of our investor relations work, we provide information to shareholders and other investors comprehensively and regularly on a quarterly basis to tell them about the business development as well as the financial situation and earnings position, and also provide them with notifications in accordance with the German Securities Trading Law and information on analyst presenta-tions, press releases, and the annual financial calendar. Details on our investor relations work can be found on page 34 f.
Compliance
Within the Group’s management culture, strong emphasis is placed on the compliance pro-gramme, which is firmly anchored in the Group-wide management and supervisory structures. It comprises the entire compliance organisation within the Group, the set up of guidelines, and verification of compliance with these guidelines.
The compliance organisation is under the authority of the Chairman of the Managing Board, to whom the Director Group Compliance reports directly. Each country has its own compliance officer; however, responsibility for ensuring that employees’ conduct complies with the law and regulations lies with all managers and, of course, the employees themselves.
The compliance officers are supported by modern technologies and media, such as electronic learning platforms and learning programmes as well as Internet- and telephone-based report-ing systems. These tools will be constantly subject to improvements and further developments during the continuous examination of the whole compliance programme.
Group-wide implementation of the compliance programme is monitored by regular and special audits by Group Internal Audit as well as via special half-yearly compliance reporting by the Director Group Compliance to the Managing Board and the Audit Committee of the Supervisory Board. As part of his responsibilities, the Director Group Compliance monitors the effectiveness of the compliance programme and verifies in particular whether it adequately satisfies the legal requirements and recognised best practices.
In 2011, key topics of the prevention activities of the compliance officers included observance of competition legislation, anticorruption regulations, and the prohibition of insider trading. This work was also supported by intensified training measures in these areas. In the future, particularly in the context of the provisions of the UK Bribery Act, which came into effect on 1 July 2011, the compliance management system will be supplemented by additional tools to ensure that cases of corruption are effectively prevented.
In addition to these key areas, other focuses continue to be occupational safety legislation and environmental law. This reflects the characteristics and specific features of a heavy industry that extracts raw materials and manufactures and markets homogeneous mass goods, and which generally operates locally. Special efforts are also made to observe capital market and data protection regulations, and regulations on non-discrimination in dealings with employees.

131HeidelbergCement | Annual Report 2011
Remuneration report 1)
The remuneration report contains two parts. The first part shows the Managing Board remuneration system and the remuneration of the Managing Board members for the 2011 financial year. The second part shows the remuneration for the Supervisory Board paid for the 2011 financial year.
Managing Board remuneration system 2011
In the context of the Act on the Appropriateness of Managing Board Remuneration, which came into effect on 5 August 2009, the Supervisory Board decided on a new Managing Board remu-neration system, applicable for the first time in the 2011 financial year. The new system was approved by the Annual General Meeting on 5 May 2011 with a majority of 96% of the votes cast, in accordance with § 120, section 4 of the German Stock Company Act.
PrinciplesThe system and amount of remuneration of the Managing Board are determined by the Super-visory Board following a recommendation by the Personnel Committee. They are based on the size and international activity of the Group, its economic and financial situation, its future prospects, the amount and structure of the Managing Board remuneration in comparable com-panies, and the remuneration structure used for the rest of the Group. In addition, the tasks and performance of the relevant member of the Managing Board, and of the entire Managing Board, are taken into account. The remuneration is calculated in such a way that it is competitive on the market for highly qualified senior managers and provides an incentive for successful work in a business culture with a clear focus on performance and results.
Remuneration elementsThe remuneration system applicable since 1 January 2011 consists of a fixed annual salary, a variable annual bonus, and a variable long-term bonus. In comparison with the remuneration system valid until 2010, the new system is geared even more towards the sustainable develop-ment of the Group. This requirement was fulfilled by:− higher weighting of long-term bonus with a multi-year assessment base compared with the
annual bonus,− linking of long-term bonus with performance indicators reflecting result and capital efficiency
as well as the relative development of the HeidelbergCement share compared with the DAX 30 Index and the MSCI World Construction Materials Index, and the absolute development of the HeidelbergCement share,
− obligation for all members of the Managing Board to maintain a fixed number of Heidel-bergCement shares as an individual investment.
The amount of remuneration paid to the Managing Board comprises:1. a fixed annual salary,2. a variable annual bonus,3. a variable long-term bonus with long-term incentive,4. fringe benefits, as well as5. pension promises.
The following graph shows the relation between fixed and variable remuneration elements of the target remuneration (without fringe benefits and pension promises) as well as a comparison of the amount of the individual variable components – when 100% of the target is met – with the fixed annual salary.
CoRPoRATE GoVERNANCE
Corporate Governance statement Supervisory Board and Managing Board
Remuneration report
1) In accordance with point 4.2.5 and 5.4.6 of the German Corporate Governance Code, part of the Corporate Governance Report
Cor
pora
te G
over
nanc
eC
onso
lidat
ed f
inan
cial
sta
tem
ents
Add
itio
nal i
nfor
mat
ion
3
4
5
Com
bine
d m
anag
emen
t re
port
Cor
pora
te G
over
nanc
eC
onso
lidat
ed f
inan
cial
sta
tem
ents
Add
itio
nal i
nfor
mat
ion
To
our
shar
ehol
ders
2
3
4
5
1
Con
ten
ts
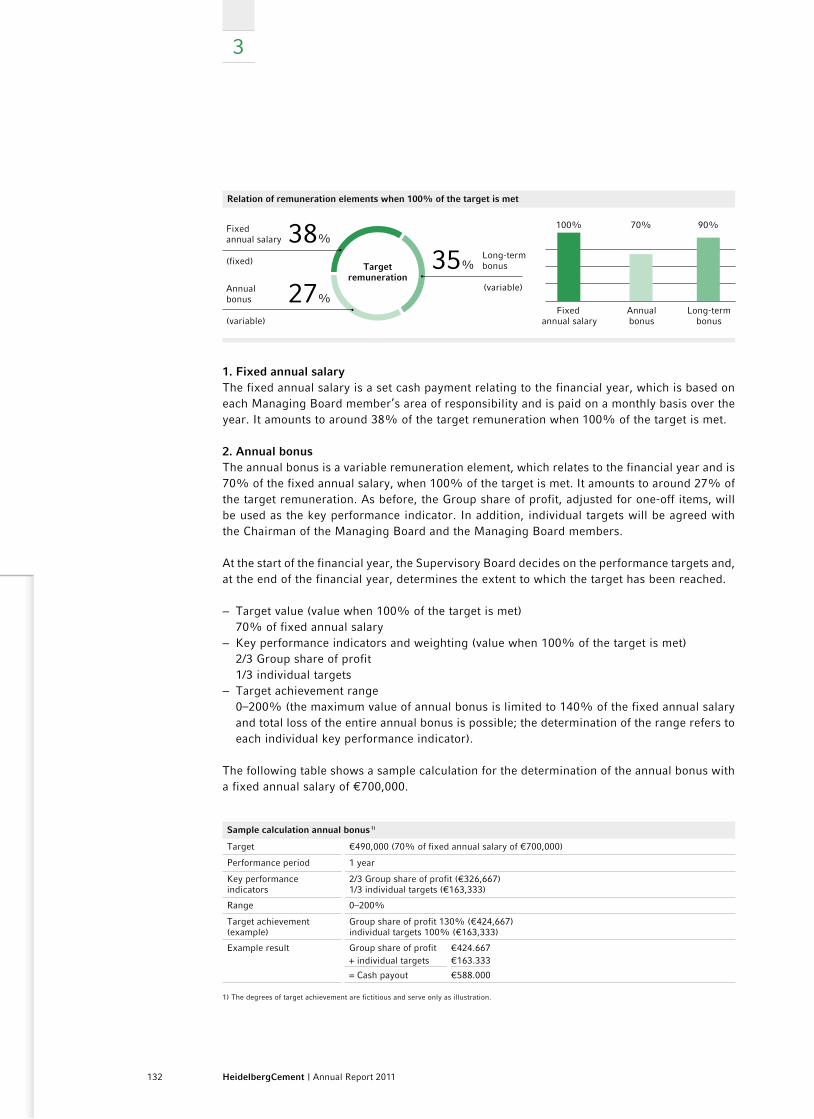
3
132 HeidelbergCement | Annual Report 2011
Relation of remuneration elements when 100% of the target is met
Fixed annual salary
100% 70% 90%
Annualbonus
Long-termbonus
Long-term bonus35%
Fixed annual salary 38%
(fixed)
Annual bonus 27%
(variable)
(variable)
Targetremuneration
1. Fixed annual salaryThe fixed annual salary is a set cash payment relating to the financial year, which is based on each Managing Board member’s area of responsibility and is paid on a monthly basis over the year. It amounts to around 38% of the target remuneration when 100% of the target is met.
2. Annual bonusThe annual bonus is a variable remuneration element, which relates to the financial year and is 70% of the fixed annual salary, when 100% of the target is met. It amounts to around 27% of the target remuneration. As before, the Group share of profit, adjusted for one-off items, will be used as the key performance indicator. In addition, individual targets will be agreed with the Chairman of the Managing Board and the Managing Board members.
At the start of the financial year, the Supervisory Board decides on the performance targets and, at the end of the financial year, determines the extent to which the target has been reached.
− Target value (value when 100% of the target is met) 70% of fixed annual salary− Key performance indicators and weighting (value when 100% of the target is met) 2/3 Group share of profit 1/3 individual targets − Target achievement range 0–200% (the maximum value of annual bonus is limited to 140% of the fixed annual salary
and total loss of the entire annual bonus is possible; the determination of the range refers to each individual key performance indicator).
The following table shows a sample calculation for the determination of the annual bonus with a fixed annual salary of €700,000.
Sample calculation annual bonus 1)
Target €490,000 (70% of fixed annual salary of €700,000)
Performance period 1 year
Key performance indicators
2/3 Group share of profit (€326,667)1/3 individual targets (€163,333)
Range 0–200%
Target achievement(example)
Group share of profit 130% (€424,667)individual targets 100% (€163,333)
Example result Group share of profit+ individual targets
= Cash payout
€424.667€163.333
€588.000
1) The degrees of target achievement are fictitious and serve only as illustration.
133HeidelbergCement | Annual Report 2011
3. Long-term bonusThe long-term bonus is a variable remuneration element based on the long term, which is to be issued in annual tranches starting in 2011. It amounts to 90% of the fixed annual salary, when 100% of the target is met. The long-term bonus makes up around 35% of the target remuneration and comprises two equally weighted components.
The first component (management component with a term of three years) considers the internal added value as measured by earnings before interest and taxes (EBIT) and return on invested capital (ROIC), and is arranged in the form of a bonus with cash payment. The bonus will be paid after the Annual General Meeting in the year following the three-year performance period. The second component (capital market component with a term of four years) considers the external added value as measured by total shareholder return (TSR) – adjusted for the reinvested dividend payments and for changes in the capital – compared with the relevant capital market indices, using performance share units (PSUs). The PSUs are virtual shares used for the calculation of the capital market component.
At the start of every tranche, the Supervisory Board determines the performance targets for both components based on the various key performance indicators, which, if they are achieved, affect the amount of the long-term bonus. After expiry of the respective performance period, the Supervisory Board will ascertain the extent to which the target has been reached.
The target for the management component is based on the Group’s relevant three-year opera-tional plan, presented to the Supervisory Board by the Managing Board. The share-based capital market component is measured over a four-year period, on the basis of § 193, section 2, no. 4 of the German Stock Company Act (AktG).
For the capital market component, the number of performance share units (PSUs) initially granted is ascertained in the first instance: the number of PSUs is calculated from 45% of the fixed annual salary divided by the reference price 1) of the HeidelbergCement share as at the time of issue. After expiry of the four-year performance period, the PSUs definitively earned are to be calculated in a second step according to the attainment of the target and paid in cash at the reference price of the HeidelbergCement share valid at that time – adjusted for the reinvested dividend payments and for changes in the capital.
− Target value (value when 100% of the target is met) 90% of fixed annual salary (of which 50% is the management component and 50% is the
capital market component)− Key performance indicators and weighting (value when 100% of the target is met) Management component: 1/2 cumulated average of EBITs attained during the plan period 2011–2013 1/2 target ROIC 2013 Capital market component: 1/2 peer total shareholder return (TSR); calculation of TSR compared with DAX 30 Index 1/2 peer total shareholder return (TSR); calculation of TSR compared with MSCI World
Construction Materials Index
CoRPoRATE GoVERNANCE
Corporate Governance statement Supervisory Board and Managing Board
Remuneration report
1) The reference price is respectively the average of the daily closing prices of the HeidelbergCement share on the Frankfurt Stock Exchange XETRA trading system for three months retrospectively from the start/expiration of the performance period.
Cor
pora
te G
over
nanc
eC
onso
lidat
ed f
inan
cial
sta
tem
ents
Add
itio
nal i
nfor
mat
ion
3
4
5
Com
bine
d m
anag
emen
t re
port
Cor
pora
te G
over
nanc
eC
onso
lidat
ed f
inan
cial
sta
tem
ents
Add
itio
nal i
nfor
mat
ion
To
our
shar
ehol
ders
2
3
4
5
1
Con
ten
ts
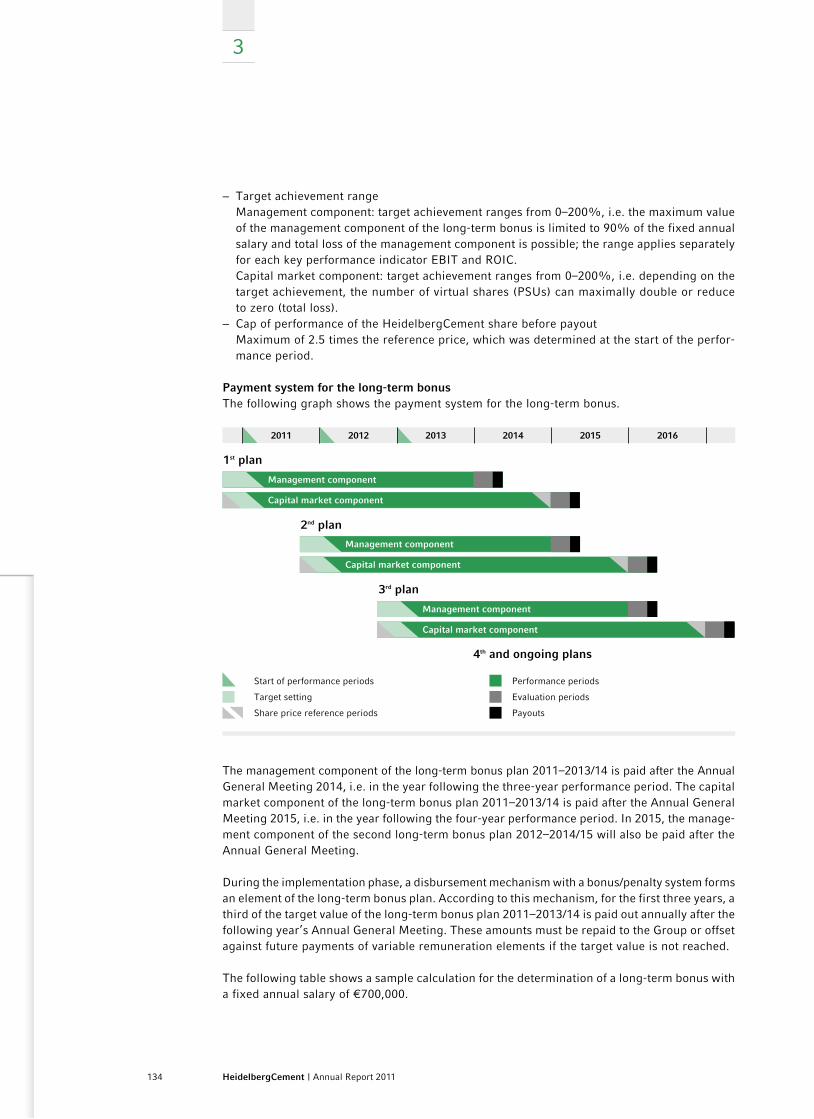
3
134 HeidelbergCement | Annual Report 2011
− Target achievement range Management component: target achievement ranges from 0–200%, i.e. the maximum value
of the management component of the long-term bonus is limited to 90% of the fixed annual salary and total loss of the management component is possible; the range applies separately for each key performance indicator EBIT and ROIC.
Capital market component: target achievement ranges from 0–200%, i.e. depending on the target achievement, the number of virtual shares (PSUs) can maximally double or reduce to zero (total loss).
− Cap of performance of the HeidelbergCement share before payout Maximum of 2.5 times the reference price, which was determined at the start of the perfor-
mance period.
Payment system for the long-term bonusThe following graph shows the payment system for the long-term bonus.
Start of performance periods
Target setting
Share price reference periods
2011 2012 2013 2014 2015 2016
1st plan
Management component
Capital market component
Management component
Capital market component
Management component
Capital market component
2nd plan
Performance periods
Evaluation periods
Payouts
4th and ongoing plans
3rd plan
The management component of the long-term bonus plan 2011–2013/14 is paid after the Annual General Meeting 2014, i.e. in the year following the three-year performance period. The capital market component of the long-term bonus plan 2011–2013/14 is paid after the Annual General Meeting 2015, i.e. in the year following the four-year performance period. In 2015, the manage-ment component of the second long-term bonus plan 2012–2014/15 will also be paid after the Annual General Meeting.
During the implementation phase, a disbursement mechanism with a bonus/penalty system forms an element of the long-term bonus plan. According to this mechanism, for the first three years, a third of the target value of the long-term bonus plan 2011–2013/14 is paid out annually after the following year’s Annual General Meeting. These amounts must be repaid to the Group or offset against future payments of variable remuneration elements if the target value is not reached.
The following table shows a sample calculation for the determination of a long-term bonus with a fixed annual salary of €700,000.
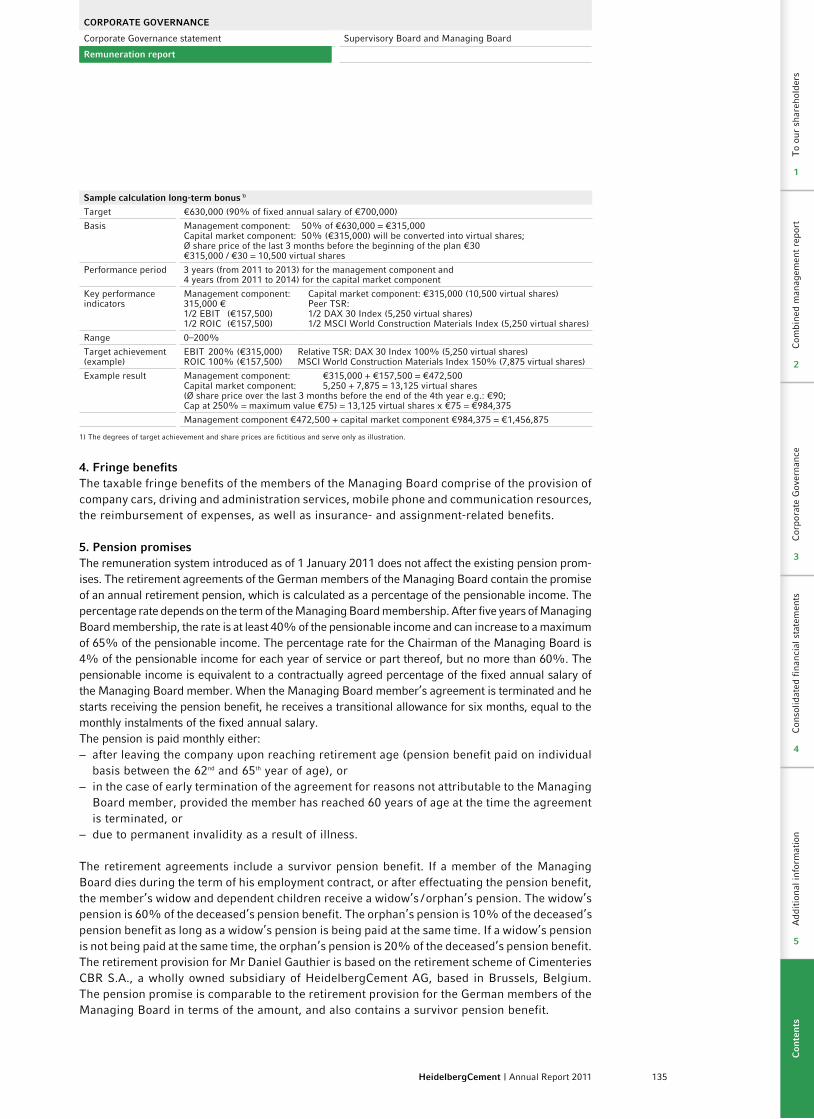
135HeidelbergCement | Annual Report 2011
Sample calculation long-term bonus 1)
Target €630,000 (90% of fixed annual salary of €700,000)
Basis Management component: 50% of €630,000 = €315,000 Capital market component: 50% (€315,000) will be converted into virtual shares; Ø share price of the last 3 months before the beginning of the plan €30€315,000 / €30 = 10,500 virtual shares
Performance period 3 years (from 2011 to 2013) for the management component and4 years (from 2011 to 2014) for the capital market component
Key performance indicators
Management component: 315,000 € 1/2 EBIT (€157,500)1/2 ROIC (€157,500)
Capital market component: €315,000 (10,500 virtual shares) Peer TSR:1/2 DAX 30 Index (5,250 virtual shares)1/2 MSCI World Construction Materials Index (5,250 virtual shares)
Range 0–200%
Target achievement(example)
EBIT 200% (€315,000) Relative TSR: DAX 30 Index 100% (5,250 virtual shares)ROIC 100% (€157,500) MSCI World Construction Materials Index 150% (7,875 virtual shares)
Example result Management component: €315,000 + €157,500 = €472,500Capital market component: 5,250 + 7,875 = 13,125 virtual shares (Ø share price over the last 3 months before the end of the 4th year e.g.: €90; Cap at 250% = maximum value €75) = 13,125 virtual shares x €75 = €984,375
Management component €472,500 + capital market component €984,375 = €1,456,875
1) The degrees of target achievement and share prices are fictitious and serve only as illustration.
4. Fringe benefitsThe taxable fringe benefits of the members of the Managing Board comprise of the provision of company cars, driving and administration services, mobile phone and communication resources, the reimbursement of expenses, as well as insurance- and assignment-related benefits.
5. Pension promisesThe remuneration system introduced as of 1 January 2011 does not affect the existing pension prom-ises. The retirement agreements of the German members of the Managing Board contain the promise of an annual retirement pension, which is calculated as a percentage of the pensionable income. The percentage rate depends on the term of the Managing Board membership. After five years of Managing Board membership, the rate is at least 40% of the pensionable income and can increase to a maximum of 65% of the pensionable income. The percentage rate for the Chairman of the Managing Board is 4% of the pensionable income for each year of service or part thereof, but no more than 60%. The pensionable income is equivalent to a contractually agreed percentage of the fixed annual salary of the Managing Board member. When the Managing Board member’s agreement is terminated and he starts receiving the pension benefit, he receives a transitional allowance for six months, equal to the monthly instalments of the fixed annual salary. The pension is paid monthly either:− after leaving the company upon reaching retirement age (pension benefit paid on individual
basis between the 62nd and 65th year of age), or − in the case of early termination of the agreement for reasons not attributable to the Managing
Board member, provided the member has reached 60 years of age at the time the agreement is terminated, or
− due to permanent invalidity as a result of illness.
The retirement agreements include a survivor pension benefit. If a member of the Managing Board dies during the term of his employment contract, or after effectuating the pension benefit, the member’s widow and dependent children receive a widow’s / orphan’s pension. The widow’s pension is 60% of the deceased’s pension benefit. The orphan’s pension is 10% of the deceased’s pension benefit as long as a widow’s pension is being paid at the same time. If a widow’s pension is not being paid at the same time, the orphan’s pension is 20% of the deceased’s pension benefit.The retirement provision for Mr Daniel Gauthier is based on the retirement scheme of Cimenteries CBR S.A., a wholly owned subsidiary of HeidelbergCement AG, based in Brussels, Belgium. The pension promise is comparable to the retirement provision for the German members of the Managing Board in terms of the amount, and also contains a survivor pension benefit.
CoRPoRATE GoVERNANCE
Corporate Governance statement Supervisory Board and Managing Board
Remuneration report
Cor
pora
te G
over
nanc
eC
onso
lidat
ed f
inan
cial
sta
tem
ents
Add
itio
nal i
nfor
mat
ion
3
4
5
Com
bine
d m
anag
emen
t re
port
Cor
pora
te G
over
nanc
eC
onso
lidat
ed f
inan
cial
sta
tem
ents
Add
itio
nal i
nfor
mat
ion
To
our
shar
ehol
ders
2
3
4
5
1
Con
ten
ts

3
136 HeidelbergCement | Annual Report 2011
Adjustment of remunerationThe Supervisory Board has the option of discretionary adjustment (administrative discretion) by ±25% of the target value of the variable remuneration elements in order to account for the personal performance of the individual members of the Managing Board and/or for exceptional circumstances. In accordance with § 87, section 2 of the German Stock Company Act (AktG), the Supervisory Board’s right and obligation to reduce the Managing Board remuneration to a reasonable amount remains unaffected, if the position of the Group worsens after the fixing to such an extent that it would be unfair for the Group if remuneration of the Managing Board continued to be granted unchanged.
Individual investment (share ownership)To support the sustainable development of the Group, the Supervisory Board has decided upon a set of guidelines for the shareholdings of members of the Managing Board. Members of the Managing Board are obliged to invest part of their personal wealth to purchase a fixed number of HeidelbergCement shares and to hold these shares for the term of their membership on the Managing Board. The number of shares to be held by the Chairman of the Managing Board is set at 30,000 HeidelbergCement shares and at 10,000 HeidelbergCement shares for each of the other members of the Managing Board. In order to comply with the guidelines, half of the amount issued for the long-term bonus is to be used to buy shares of the company until the full individual investment is generated. The accumulation of the individual investment can therefore take several years. Following the first payment from the long-term bonus plan, reports will be drawn up on the individual investment of each member of the Managing Board. Heidelberg Cement shares that are already held by Managing Board members are taken into account in the individual investment.
D&o liability insuranceThe members of the Managing Board are covered in the Group’s existing D&O liability insurance. The agreed deductible corresponds to the minimum deductible pursuant to § 93, section 2, sentence 3 of the German Stock Company Act (AktG) in the respective version.
Guidelines in the case of new agreements and extensions to existing Managing Board agreementsThe following guidelines on the redundancy pay cap and change of control clause are applicable as of 1 January 2011 for new agreements or extensions to existing Managing Board agree-ments. These guidelines entered into force in 2011 for Daniel Gauthier and Andreas Kern; for Dr. Dominik von Achten and Dr. Albert Scheuer, they will enter into force in 2012.
Redundancy pay capIn accordance with the German Corporate Governance Code, when concluding new Manag-ing Board agreements or extending existing Managing Board agreements, it must be ensured that payments to a member of the Managing Board – in the event of the early termination of a Managing Board membership – do not exceed the value of two annual remunerations (including fringe benefits) without serious cause and do not amount to more than the remaining term of the agreement. The redundancy pay cap is calculated based on the amount of the total remu-neration for the past financial year and, if necessary, also on the amount of the anticipated total remuneration for the current financial year.
Change of control clauseIn accordance with the German Corporate Governance Code, when concluding new Managing Board agreements or extending existing Managing Board agreements, it must be ensured – in the event of the early termination of a Managing Board membership – that benefits promised as a result of a change of control do not exceed 150% of the redundancy cap.
No change in the remuneration system is planned for 2012.
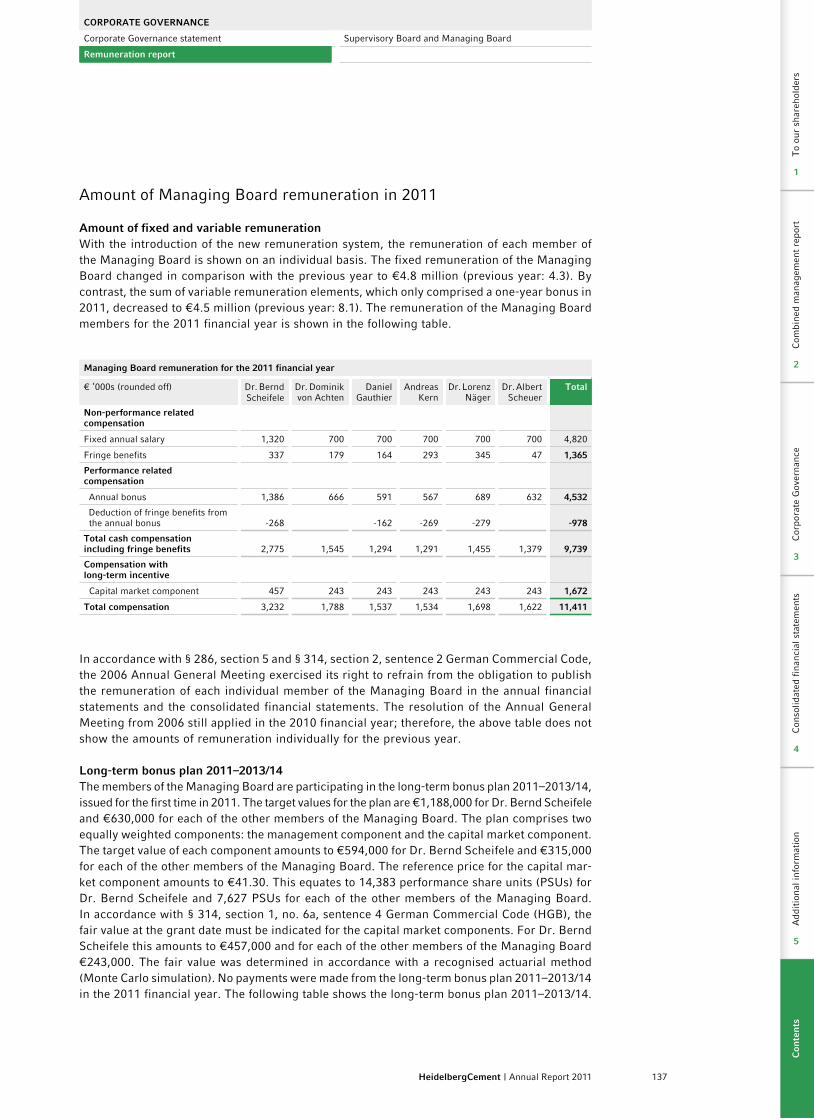
137HeidelbergCement | Annual Report 2011
Amount of Managing Board remuneration in 2011
Amount of fixed and variable remunerationWith the introduction of the new remuneration system, the remuneration of each member of the Managing Board is shown on an individual basis. The fixed remuneration of the Managing Board changed in comparison with the previous year to €4.8 million (previous year: 4.3). By contrast, the sum of variable remuneration elements, which only comprised a one-year bonus in 2011, decreased to €4.5 million (previous year: 8.1). The remuneration of the Managing Board members for the 2011 financial year is shown in the following table.
Managing Board remuneration for the 2011 financial year
€ ’000s (rounded off) Dr. Bernd Scheifele
Dr. Dominik von Achten
Daniel Gauthier
Andreas Kern
Dr. Lorenz Näger
Dr. Albert Scheuer
Total
Non-performance related compensation
Fixed annual salary 1,320 700 700 700 700 700 4,820
Fringe benefits 337 179 164 293 345 47 1,365
Performance related compensation
Annual bonus 1,386 666 591 567 689 632 4,532
Deduction of fringe benefits from the annual bonus -268 -162 -269 -279 -978
Total cash compensation including fringe benefits 2,775 1,545 1,294 1,291 1,455 1,379 9,739
Compensation with long-term incentive
Capital market component 457 243 243 243 243 243 1,672
Total compensation 3,232 1,788 1,537 1,534 1,698 1,622 11,411
In accordance with § 286, section 5 and § 314, section 2, sentence 2 German Commercial Code, the 2006 Annual General Meeting exercised its right to refrain from the obligation to publish the remuneration of each individual member of the Managing Board in the annual financial statements and the consolidated financial statements. The resolution of the Annual General Meeting from 2006 still applied in the 2010 financial year; therefore, the above table does not show the amounts of remuneration individually for the previous year.
Long-term bonus plan 2011–2013/14The members of the Managing Board are participating in the long-term bonus plan 2011–2013/14, issued for the first time in 2011. The target values for the plan are €1,188,000 for Dr. Bernd Scheifele and €630,000 for each of the other members of the Managing Board. The plan comprises two equally weighted components: the management component and the capital market component. The target value of each component amounts to €594,000 for Dr. Bernd Scheifele and €315,000 for each of the other members of the Managing Board. The reference price for the capital mar-ket component amounts to €41.30. This equates to 14,383 performance share units (PSUs) for Dr. Bernd Scheifele and 7,627 PSUs for each of the other members of the Managing Board. In accordance with § 314, section 1, no. 6a, sentence 4 German Commercial Code (HGB), the fair value at the grant date must be indicated for the capital market components. For Dr. Bernd Scheifele this amounts to €457,000 and for each of the other members of the Managing Board €243,000. The fair value was determined in accordance with a recognised actuarial method (Monte Carlo simulation). No payments were made from the long-term bonus plan 2011–2013/14 in the 2011 financial year. The following table shows the long-term bonus plan 2011–2013/14.
CoRPoRATE GoVERNANCE
Corporate Governance statement Supervisory Board and Managing Board
Remuneration report
Cor
pora
te G
over
nanc
eC
onso
lidat
ed f
inan
cial
sta
tem
ents
Add
itio
nal i
nfor
mat
ion
3
4
5
Com
bine
d m
anag
emen
t re
port
Cor
pora
te G
over
nanc
eC
onso
lidat
ed f
inan
cial
sta
tem
ents
Add
itio
nal i
nfor
mat
ion
To
our
shar
ehol
ders
2
3
4
5
1
Con
ten
ts
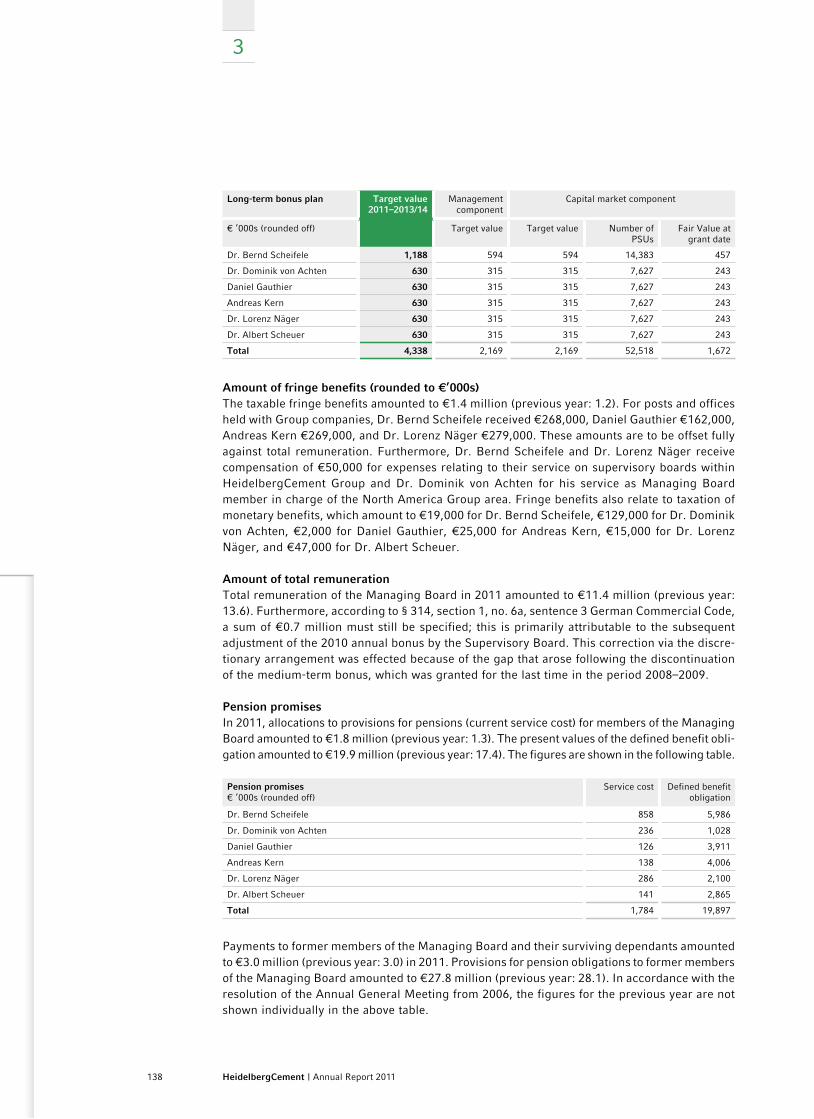
3
138 HeidelbergCement | Annual Report 2011
Long-term bonus plan Target value2011–2013/14
Management component
Capital market component
€ ’000s (rounded off) Target value Target value Number of PSUs
Fair Value at grant date
Dr. Bernd Scheifele 1,188 594 594 14,383 457
Dr. Dominik von Achten 630 315 315 7,627 243
Daniel Gauthier 630 315 315 7,627 243
Andreas Kern 630 315 315 7,627 243
Dr. Lorenz Näger 630 315 315 7,627 243
Dr. Albert Scheuer 630 315 315 7,627 243
Total 4,338 2,169 2,169 52,518 1,672
Amount of fringe benefits (rounded to €’000s)The taxable fringe benefits amounted to €1.4 million (previous year: 1.2). For posts and offices held with Group companies, Dr. Bernd Scheifele received €268,000, Daniel Gauthier €162,000, Andreas Kern €269,000, and Dr. Lorenz Näger €279,000. These amounts are to be offset fully against total remuneration. Furthermore, Dr. Bernd Scheifele and Dr. Lorenz Näger receive compensation of €50,000 for expenses relating to their service on supervisory boards within HeidelbergCement Group and Dr. Dominik von Achten for his service as Managing Board member in charge of the North America Group area. Fringe benefits also relate to taxation of monetary benefits, which amount to €19,000 for Dr. Bernd Scheifele, €129,000 for Dr. Dominik von Achten, €2,000 for Daniel Gauthier, €25,000 for Andreas Kern, €15,000 for Dr. Lorenz Näger, and €47,000 for Dr. Albert Scheuer.
Amount of total remunerationTotal remuneration of the Managing Board in 2011 amounted to €11.4 million (previous year: 13.6). Furthermore, according to § 314, section 1, no. 6a, sentence 3 German Commercial Code, a sum of €0.7 million must still be specified; this is primarily attributable to the subsequent adjustment of the 2010 annual bonus by the Supervisory Board. This correction via the discre-tionary arrangement was effected because of the gap that arose following the discontinuation of the medium-term bonus, which was granted for the last time in the period 2008–2009.
Pension promisesIn 2011, allocations to provisions for pensions (current service cost) for members of the Managing Board amounted to €1.8 million (previous year: 1.3). The present values of the defined benefit obli-gation amounted to €19.9 million (previous year: 17.4). The figures are shown in the following table.
Pension promises€ ’000s (rounded off)
Service cost Defined benefit obligation
Dr. Bernd Scheifele 858 5,986
Dr. Dominik von Achten 236 1,028
Daniel Gauthier 126 3,911
Andreas Kern 138 4,006
Dr. Lorenz Näger 286 2,100
Dr. Albert Scheuer 141 2,865
Total 1,784 19,897
Payments to former members of the Managing Board and their surviving dependants amounted to €3.0 million (previous year: 3.0) in 2011. Provisions for pension obligations to former members of the Managing Board amounted to €27.8 million (previous year: 28.1). In accordance with the resolution of the Annual General Meeting from 2006, the figures for the previous year are not shown individually in the above table.
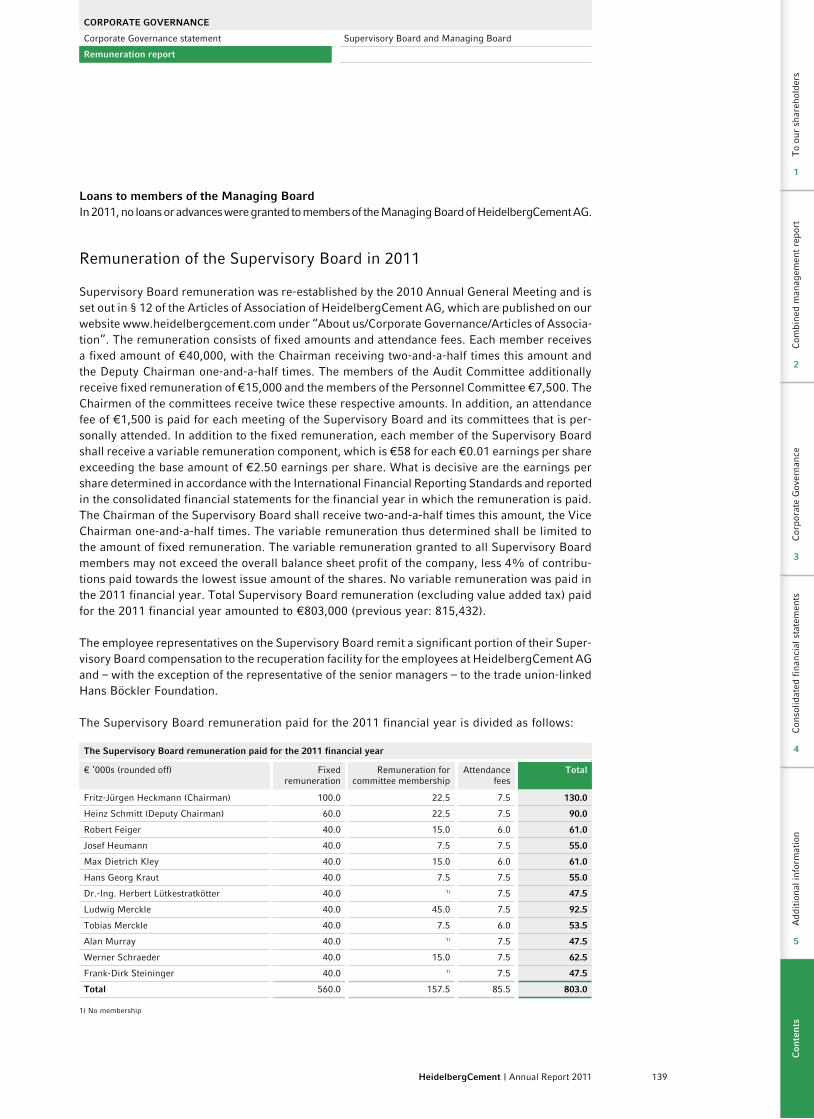
139HeidelbergCement | Annual Report 2011
Loans to members of the Managing BoardIn 2011, no loans or advances were granted to members of the Managing Board of Heidelberg Cement AG.
Remuneration of the Supervisory Board in 2011
Supervisory Board remuneration was re-established by the 2010 Annual General Meeting and is set out in § 12 of the Articles of Association of HeidelbergCement AG, which are published on our website www.heidelbergcement.com under “About us/Corporate Governance/Articles of Associa-tion”. The remuneration consists of fixed amounts and attendance fees. Each member receives a fixed amount of €40,000, with the Chairman receiving two-and-a-half times this amount and the Deputy Chairman one-and-a-half times. The members of the Audit Committee additionally receive fixed remuneration of €15,000 and the members of the Personnel Committee €7,500. The Chairmen of the committees receive twice these respective amounts. In addition, an attendance fee of €1,500 is paid for each meeting of the Supervisory Board and its committees that is per-sonally attended. In addition to the fixed remuneration, each member of the Supervisory Board shall receive a variable remuneration component, which is €58 for each €0.01 earnings per share exceeding the base amount of €2.50 earnings per share. What is decisive are the earnings per share determined in accordance with the International Financial Reporting Standards and reported in the consolidated financial statements for the financial year in which the remuneration is paid. The Chairman of the Supervisory Board shall receive two-and-a-half times this amount, the Vice Chairman one-and-a-half times. The variable remuneration thus determined shall be limited to the amount of fixed remuneration. The variable remuneration granted to all Supervisory Board members may not exceed the overall balance sheet profit of the company, less 4% of contribu-tions paid towards the lowest issue amount of the shares. No variable remuneration was paid in the 2011 financial year. Total Supervisory Board remuneration (excluding value added tax) paid for the 2011 financial year amounted to €803,000 (previous year: 815,432).
The employee representatives on the Supervisory Board remit a significant portion of their Super-visory Board compensation to the recuperation facility for the employees at Heidelberg Cement AG and – with the exception of the representative of the senior managers – to the trade union-linked Hans Böckler Foundation.
The Supervisory Board remuneration paid for the 2011 financial year is divided as follows:
The Supervisory Board remuneration paid for the 2011 financial year
€ ’000s (rounded off) Fixed remuneration
Remuneration for committee membership
Attendance fees
Total
Fritz-Jürgen Heckmann (Chairman) 100.0 22.5 7.5 130.0
Heinz Schmitt (Deputy Chairman) 60.0 22.5 7.5 90.0
Robert Feiger 40.0 15.0 6.0 61.0
Josef Heumann 40.0 7.5 7.5 55.0
Max Dietrich Kley 40.0 15.0 6.0 61.0
Hans Georg Kraut 40.0 7.5 7.5 55.0
Dr.-Ing. Herbert Lütkestratkötter 40.0 1) 7.5 47.5
Ludwig Merckle 40.0 45.0 7.5 92.5
Tobias Merckle 40.0 7.5 6.0 53.5
Alan Murray 40.0 1) 7.5 47.5
Werner Schraeder 40.0 15.0 7.5 62.5
Frank-Dirk Steininger 40.0 1) 7.5 47.5
Total 560.0 157.5 85.5 803.0
1) No membership
CoRPoRATE GoVERNANCE
Corporate Governance statement Supervisory Board and Managing Board
Remuneration report
Cor
pora
te G
over
nanc
eC
onso
lidat
ed f
inan
cial
sta
tem
ents
Add
itio
nal i
nfor
mat
ion
3
4
5
Com
bine
d m
anag
emen
t re
port
Cor
pora
te G
over
nanc
eC
onso
lidat
ed f
inan
cial
sta
tem
ents
Add
itio
nal i
nfor
mat
ion
To
our
shar
ehol
ders
2
3
4
5
1
Con
ten
ts

3
140 HeidelbergCement | Annual Report 2011
Supervisory Board and Managing Board
Supervisory Board
According to the Articles of Association, the Supervisory Board of HeidelbergCement AG consists of twelve members. Half of the members shall be elected by the Annual General Meeting accord-ing to the provisions of the German Stock Company Act and half by the employees according to the provisions of the German Codetermination Law. The term of office for the Supervisory Board started with the conclusion of the Annual General Meeting of 7 May 2009 and ends according to schedule with the conclusion of the ordinary Annual General Meeting in 2014.
Fritz-Jürgen HeckmannChairman of the Supervisory BoardStuttgart; Business LawyerMember since 8 May 2003, Chairman since 1 February 2005; Chairman of the Arbitration and Nomination Committee and member of the Personnel and Audit CommitteeOther mandates:a) Paul Hartmann AG (Chairman) Wieland-Werke AG (Chairman)b) HERMA Holding GmbH + Co. KG (Deputy Chairman) Neue Pressegesellschaft mbH & Co. KG Süddeutsche Verlag GmbH (Deputy Chairman) Südwestdeutsche Medien Holding GmbH (Deputy Chairman) URACA GmbH & Co. KG (Deputy Chairman)
Heinz SchmittDeputy ChairmanHeidelberg; Controller; Chairman of the Council of Employees at the headquarters of HeidelbergCement AG Member since 6 May 2004, Deputy Chairman since 7 May 2009; Member of the Audit, Arbitration, and Personnel Committee
Robert FeigerFrankfurt; Deputy Chairman of the Federal Executive Committee, IG Bauen-Agrar-UmweltMember since 2 January 2008; Member of the Audit CommitteeOther mandates:a) BAUER Aktiengesellschaft (Deputy Chairman)b) Zusatzversorgungskasse des Baugewerbes AG Zusatzversorgungskasse des Gerüstbau gewerbes VVaG
Josef HeumannBurglengenfeld; Kiln Supervisor; Chairman of the Council of Employees at the Burglengenfeld plant, HeidelbergCement AG Member since 6 May 2004; Member of the Personnel Committee
Max Dietrich KleyHeidelberg; AttorneyMember since 6 May 2004; Member of the Audit CommitteeOther mandates:a) BASF SE,
SGL CARBON SE (Chairman)
141HeidelbergCement | Annual Report 2011
Hans Georg KrautSchelklingen; Director of the Schelklingen plant of HeidelbergCement AGMember since 6 May 2004; Member of the Personnel and Arbitration Committee
Dr.-Ing. Herbert LütkestratkötterEssen; former Chairman of the Executive Board of HOCHTIEF AktiengesellschaftMember since 23 January 2010Other mandates:a) TÜV Rheinland Holding AG
Ludwig MerckleUlm; Managing Director of Merckle Service GmbHMember since 2 June 1999; Chairman of the Personnel and Audit Committee and member of the Nomination CommitteeOther mandates:a) Kässbohrer Geländefahrzeug AG (Chairman) Württembergische Leinenindustrie AG (Chairman)b) MerFam AG (Chairman) PHOENIX Pharmahandel GmbH & Co KG
Tobias MerckleLeonberg; Managing Director of the association Seehaus e.V.Member since 23 May 2006; Member of the Personnel, Nomination, and Arbitration Committee
Alan MurrayNaples, Florida / US; former member of the Managing Board of HeidelbergCement AGMember since 21 January 2010Other mandates:b) Hanson Pension Trustees Limited, trustee of the Hanson No 2 Pension Scheme
Werner SchraederEnnigerloh; Building Fitter; Chairman of the General Council of Employees of HeidelbergCement AG and Chairman of the Council of Employees at the Ennigerloh plant of HeidelbergCement AGMember since 7 May 2009; Member of the Audit CommitteeOther mandates:b) Berufsgenossenschaft Rohstoffe und chemische Industrie
Frank-Dirk SteiningerFrankfurt; Specialist in Employment Law for the Federal Executive Committee of IG Bauen-Agrar-UmweltMember since 11 June 2008
The above mentioned indications refer to 31 December 2011 and have the following meaning: a) Membership in other legally required supervisory boards of German companies; b) Membership in comparable German and foreign supervisory committees of commercial enterprises.
CoRPoRATE GoVERNANCE
Corporate Governance statement Supervisory Board and Managing Board
Remuneration report
Cor
pora
te G
over
nanc
eC
onso
lidat
ed f
inan
cial
sta
tem
ents
Add
itio
nal i
nfor
mat
ion
3
4
5
Com
bine
d m
anag
emen
t re
port
Cor
pora
te G
over
nanc
eC
onso
lidat
ed f
inan
cial
sta
tem
ents
Add
itio
nal i
nfor
mat
ion
To
our
shar
ehol
ders
2
3
4
5
1
Con
ten
ts
3
142 HeidelbergCement | Annual Report 2011
Supervisory Board Committees
Personnel CommitteeLudwig Merckle (Chairman), Fritz-Jürgen Heckmann, Josef Heumann, Hans Georg Kraut, Tobias Merckle, Heinz Schmitt
Audit CommitteeLudwig Merckle (Chairman), Robert Feiger, Fritz-Jürgen Heckmann, Max Dietrich Kley, Heinz Schmitt, Werner Schraeder
Nomination CommitteeFritz-Jürgen Heckmann (Chairman), Ludwig Merckle, Tobias Merckle
Arbitration Committee, according to § 27, section 3 of the German Code termination LawFritz-Jürgen Heckmann (Chairman), Hans Georg Kraut, Tobias Merckle, Heinz Schmitt
Managing Board
At present, there are six members on the Managing Board of HeidelbergCement AG: the Chair-man of the Managing Board, the Chief Financial Officer, and four members of the Managing Board with regional responsibilities. The Managing Board organisation is characterised by dual manage ment responsibility: The operating units in the Group areas fall under the line responsibility of individual members of the Managing Board. In addition, they have cross-area responsibility for specific corporate functions with great strategic importance for the Group.
Dr. Bernd Scheifele Chairman of the Managing BoardArea of responsibility: Strategy and Development, Communication & Investor Relations, Human Resources, Legal, Compliance, Internal AuditChairman of the Managing Board since 2005Mandates:a) Verlagsgruppe Georg von Holtzbrinck GmbH (Deputy Chairman)b) Castle Cement Limited 1)
ENCI Holding N.V. 1)
Hanson Limited 1)
Hanson Pioneer España, S.L. 1)
HeidelbergCement Holding S.à.r.l. 1)
HeidelbergCement India Ltd. 1)
HeidelbergCement Netherlands Holding B.V. 1)
PHOENIX Pharmahandel GmbH & Co KG (Chairman) PT Indocement Tunggal Prakarsa Tbk. 1)
RECEM S.A. 1)
Dr. Dominik von AchtenArea of responsibility: North America, Purchasing, worldwide coordination of Competence Center MaterialsMember of the Managing Board since 2007Mandates:b) Castle Cement Limited 1)
HeidelbergCement Canada Holding Limited 1)
HeidelbergCement UK Holding II Limited 1)
143HeidelbergCement | Annual Report 2011
Lehigh Hanson, Inc. 1)
Lehigh Hanson Materials Limited 1)
TITAL GmbH Verlag Lensing-Wolff GmbH & Co. KG (“Medienhaus Lensing”)
Daniel GauthierArea of responsibility: Western and Northern Europe (without Germany), Africa-Mediterranean Basin, Group Services, Environmental SustainabilityMember of the Managing Board since 2000Mandates:b) Akçansa Çimento Sanayi ve Ticaret A.S. (Deputy Chairman) Carmeuse Holding SA Castle Cement Limited 1)
CBR Asset Management S.A. 1) (Chairman) CBR Asset Management Belgium S.A. 1) (Chairman) CBR Finance S.A. 1) (Chairman) CBR International Services S.A. 1) (Chairman) Cementrum I B.V. 1)
Cementrum II B.V. 1)
Cimenteries CBR S.A. 1) (Chairman) Cimenterie de Lukala “CILU” SARL 1) Civil and Marine Limited 1)
ENCI Holding N.V. 1) (Chairman) Genlis Metal Hanson Building Products Limited 1)
Hanson Pioneer España, S.L. 1)
Hanson Quarry Products Europe Limited 1)
HC Green Trading Limited 1)
HC Trading International Inc. 1) (Chairman) HC Trading B.V. 1) (Chairman) HC Trading Malta Ltd 1)
HCT Holding Malta Limited 1) HeidelbergCement Asia Pte Ltd 1)
HeidelbergCement Holding HK Limited 1)
HeidelbergCement Holding S.à.r.l. 1) HeidelbergCement Northern Europe AB 1) (Chairman) HeidelbergCement UK Holding Limited 1)
Interlacs SARL 1) International Trading and Finance (ITF) B.V. 1) (Chairman) Lehigh B.V. 1) (Deputy Chairman) PT Indocement Tunggal Prakarsa Tbk. 1)
RECEM S.A. 1)
Scancem International DA 1) (Chairman) Scancem International a.s 1) (Chairman) Tadir Readymix Concrete (1965) Ltd 1)
TPCC Tanzania Portland Cement Company Ltd. 1)
Andreas KernArea of responsibility: Eastern Europe-Central Asia, Germany, Sales and Marketing, worldwide coordination of secondary cementitious materialsMember of the Managing Board since 2000
CoRPoRATE GoVERNANCE
Corporate Governance statement Supervisory Board and Managing Board
Remuneration report
Cor
pora
te G
over
nanc
eC
onso
lidat
ed f
inan
cial
sta
tem
ents
Add
itio
nal i
nfor
mat
ion
3
4
5
Com
bine
d m
anag
emen
t re
port
Cor
pora
te G
over
nanc
eC
onso
lidat
ed f
inan
cial
sta
tem
ents
Add
itio
nal i
nfor
mat
ion
To
our
shar
ehol
ders
2
3
4
5
1
Con
ten
ts
3
144 HeidelbergCement | Annual Report 2011
Mandates:a) Basalt-Actien-Gesellschaft Kronimus AGb) Carpatcement Holding S.A. 1)
Castle Cement Limited 1)
CaucasusCement Holding B.V. 1) (Chairman) Ceskomoravský cement, a.s., nástupnická spolecnost 1) (Chairman) Duna-Dráva Cement Kft 1) ENCI Holding N.V. 1)
Górazdze Cement S.A. 1) (Chairman) Hanson Pioneer España, S.L. 1)
HeidelbergCement Central Europe East Holding B.V. 1) (Chairman) HeidelbergCement Georgia, Ltd. 1) (Deputy Chairman) HeidelbergCement Netherlands Holding B.V. 1)
Joint Stock Company – Bukhtarminskaya Cement Company 1) (Chairman) Limited Liability Company Kartuli Cementi 1)
Lithonplus GmbH & Co. KG NCD Nederlandse Cement Deelnemingsmaatschappij B.V. 1)
OAO Cesla 1)
Public Joint Stock Company “HeidelbergCement Ukraine” 1)
RECEM S.A. 1)
Tvornica Cementa Kakanj d.d. 1)
Dr. Lorenz NägerArea of responsibility: Finance, Group Accounting, Controlling, Taxes, Insurance & Corporate Risk Management, IT, Shared Service Center, LogisticsMember of the Managing Board since 2004Mandates:a) MVV Energie AGb) Castle Cement Limited 1)
Cimenteries CBR S.A. 1)
ENCI Holding N.V. 1)
Hanson Limited 1)
Hanson Pioneer España, S.L. 1)
HeidelbergCement Canada Holding Limited 1)
HeidelbergCement Holding S.à.r.l. 1)
HeidelbergCement India Ltd. 1)
HeidelbergCement International Holding GmbH 1)
HeidelbergCement Netherlands Holding B.V. 1)
HeidelbergCement UK Holding Limited 1)
HeidelbergCement UK Holding II Limited 1)
Lehigh B.V. 1) (Chairman) Lehigh Hanson, Inc. 1)
Lehigh Hanson Materials Limited 1)
Lehigh UK Limited 1)
Palatina Insurance Ltd 1)
PHOENIX Pharmahandel GmbH & Co KG PT Indocement Tunggal Prakarsa Tbk. 1)
RECEM S.A. 1)
145HeidelbergCement | Annual Report 2011
Dr. Albert ScheuerArea of responsibility: Asia-Pacific, worldwide coordination of Heidelberg Technology CenterMember of the Managing Board since 2007Mandates:b) China Century Cement Ltd. COCHIN Cements Ltd. 1)
Easy Point Industrial Ltd. Guangzhou Heidelberg Yuexiu Enterprise Management Consulting Company Ltd. Hanson Building Materials (S) Pte Ltd 1)
Hanson Investment Holding Pte Ltd 1)
Hanson Pacific (S) Pte Ltd 1)
HeidelbergCement Asia Pte Ltd 1) (Chairman) HeidelbergCement Bangladesh Limited 1)
HeidelbergCement Holding HK Limited 1)
HeidelbergCement India Ltd. 1)
Heidelberger Energie GmbH 1)
Jidong Heidelberg (Fufeng) Cement Company Limited Jidong Heidelberg (Jingyang) Cement Company Limited PT Indocement Tunggal Prakarsa Tbk. 1) (Chairman) Squareal Cement Ltd
The above mentioned indications refer to 31 December 2011 and have the following meaning: a) Membership in other legally required supervisory boards of German companies; b) Membership in comparable German and foreign supervisory committees of commercial enterprises.Group mandates are marked with 1).
CoRPoRATE GoVERNANCE
Corporate Governance statement Supervisory Board and Managing Board
Remuneration report
Cor
pora
te G
over
nanc
eC
onso
lidat
ed f
inan
cial
sta
tem
ents
Add
itio
nal i
nfor
mat
ion
3
4
5
Com
bine
d m
anag
emen
t re
port
Cor
pora
te G
over
nanc
eC
onso
lidat
ed f
inan
cial
sta
tem
ents
Add
itio
nal i
nfor
mat
ion
To
our
shar
ehol
ders
2
3
4
5
1
Con
ten
ts
146 HeidelbergCement | Annual Report 2011146
Consolidated financial statements
4
147HeidelbergCement | Annual Report 2011
Consolidated income statement 149 Consolidated statement of comprehensive income 150 Consolidated statement of cash flows 151 Consolidated balance sheet 152 Consolidated statement of changes in equity 154 Segment reporting / Notes to the 2011 consolidated financial statements 156 Notes to the 2011 consolidated financial statements 158General information 158Accounting and valuation principles 158Notes to the segment reporting 178Notes to the income statement 179Notes to the statement of cash flows 187Notes to the balance sheet – Assets 191Notes to the balance sheet – Equity and liabilities 197List of shareholdings 219 Audit opinion 240 Responsibility statement 241
Con
solid
ated
fin
anci
al s
tate
men
tsA
ddit
iona
l inf
orm
atio
n
4
5
Com
bine
d m
anag
emen
t re
port
Cor
pora
te G
over
nanc
eC
onso
lidat
ed f
inan
cial
sta
tem
ents
Add
itio
nal i
nfor
mat
ion
To
our
shar
ehol
ders
2
3
4
5
1
Con
ten
ts
148 HeidelbergCement | Annual Report 2011
4
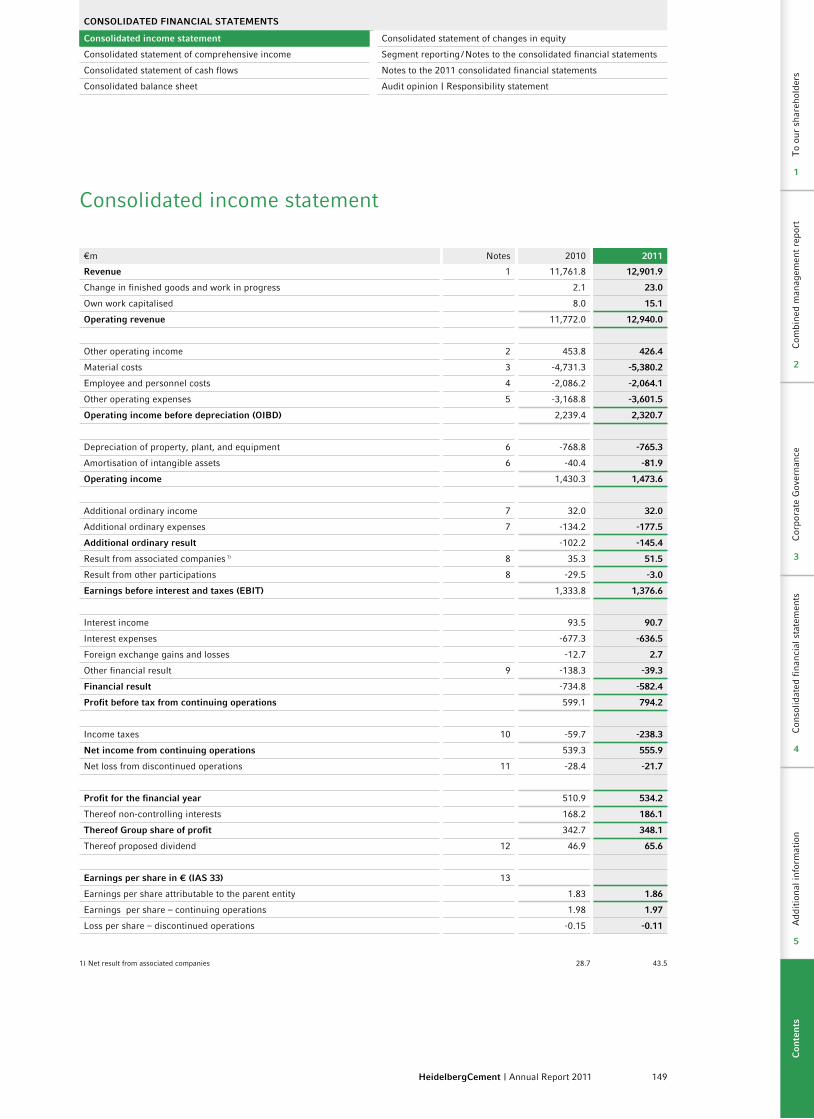
149HeidelbergCement | Annual Report 2011
CoNSoLIDATED FINANCIAL STATEMENTS
Consolidated income statement Consolidated statement of changes in equity
Consolidated statement of comprehensive income Segment reporting / Notes to the consolidated financial statements
Consolidated statement of cash flows Notes to the 2011 consolidated financial statements
Consolidated balance sheet Audit opinion | Responsibility statement
Consolidated income statement
€m Notes 2010 2011
Revenue 1 11,761.8 12,901.9
Change in finished goods and work in progress 2.1 23.0
Own work capitalised 8.0 15.1
operating revenue 11,772.0 12,940.0
Other operating income 2 453.8 426.4
Material costs 3 -4,731.3 -5,380.2
Employee and personnel costs 4 -2,086.2 -2,064.1
Other operating expenses 5 -3,168.8 -3,601.5
operating income before depreciation (oIBD) 2,239.4 2,320.7
Depreciation of property, plant, and equipment 6 -768.8 -765.3
Amortisation of intangible assets 6 -40.4 -81.9
operating income 1,430.3 1,473.6
Additional ordinary income 7 32.0 32.0
Additional ordinary expenses 7 -134.2 -177.5
Additional ordinary result -102.2 -145.4
Result from associated companies 1) 8 35.3 51.5
Result from other participations 8 -29.5 -3.0
Earnings before interest and taxes (EBIT) 1,333.8 1,376.6
Interest income 93.5 90.7
Interest expenses -677.3 -636.5
Foreign exchange gains and losses -12.7 2.7
Other financial result 9 -138.3 -39.3
Financial result -734.8 -582.4
Profit before tax from continuing operations 599.1 794.2
Income taxes 10 -59.7 -238.3
Net income from continuing operations 539.3 555.9
Net loss from discontinued operations 11 -28.4 -21.7
Profit for the financial year 510.9 534.2
Thereof non-controlling interests 168.2 186.1
Thereof Group share of profit 342.7 348.1
Thereof proposed dividend 12 46.9 65.6
Earnings per share in € (IAS 33) 13
Earnings per share attributable to the parent entity 1.83 1.86
Earnings per share – continuing operations 1.98 1.97
Loss per share – discontinued operations -0.15 -0.11
1) Net result from associated companies 28.7 43.5
Con
solid
ated
fin
anci
al s
tate
men
tsA
ddit
iona
l inf
orm
atio
n
4
5
Com
bine
d m
anag
emen
t re
port
Cor
pora
te G
over
nanc
eC
onso
lidat
ed f
inan
cial
sta
tem
ents
Add
itio
nal i
nfor
mat
ion
To
our
shar
ehol
ders
2
3
4
5
1
Con
ten
ts

150 HeidelbergCement | Annual Report 2011
4
Consolidated statement of comprehensive income
€m 2010 2011
Profit for the financial year 510.9 534.2
Actuarial gains and losses 14.7 -173.3
Income taxes -8.8 18.1
5.9 -155.2
Cash flow hedges – change in fair value 7.1 -8.6
Reclassification of gains / losses included in the income statement 5.4
Income taxes -3.4 1.6
9.2 -7.1
Available for sale assets – change in fair value 5.9 -5.1
Reclassification of gains / losses included in the income statement 8.7
Income taxes -3.6 0.3
11.0 -4.8
Business combinations
Income taxes 0.2
0.2
Currency translation 1,394.4 436.5
Income taxes -12.2 -1.3
1,382.1 435.2
other comprehensive income 1,408.4 268.1
Total comprehensive income 1,919.3 802.3
Relating to non-controlling interests 219.6 194.7
Relating to HeidelbergCement AG shareholders 1,699.6 607.6
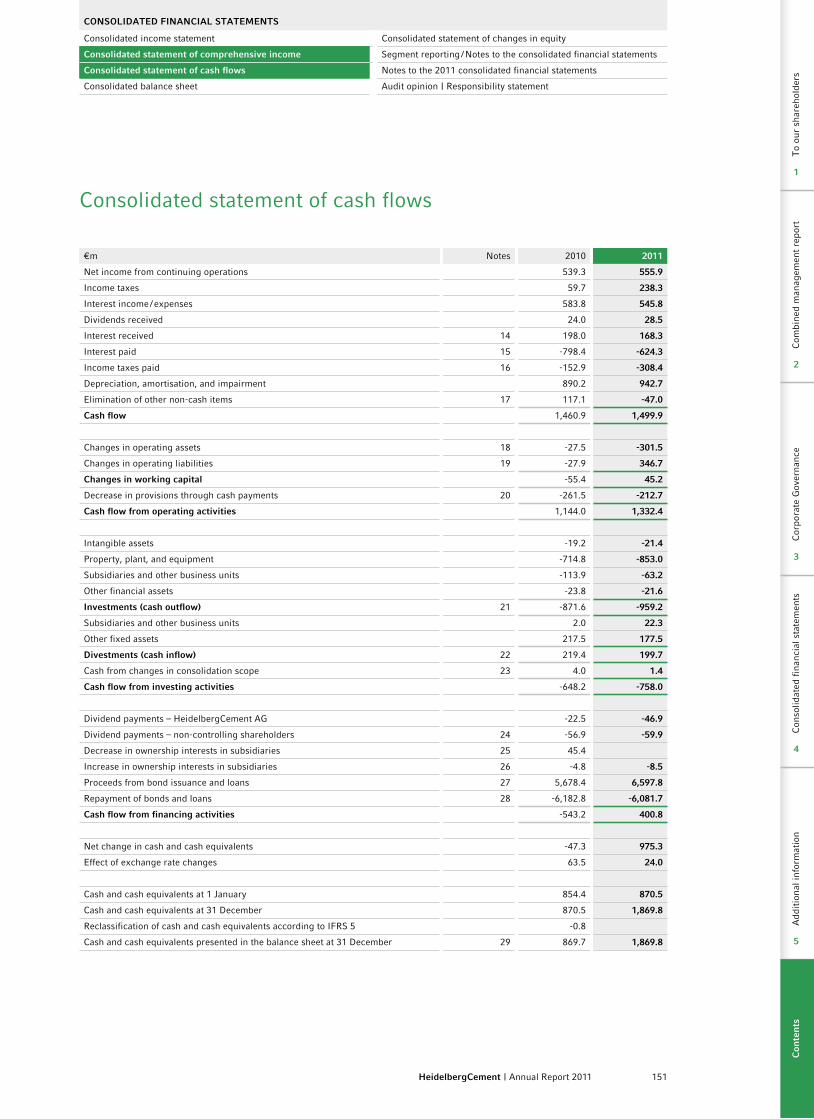
151HeidelbergCement | Annual Report 2011
CoNSoLIDATED FINANCIAL STATEMENTS
Consolidated income statement Consolidated statement of changes in equity
Consolidated statement of comprehensive income Segment reporting / Notes to the consolidated financial statements
Consolidated statement of cash flows Notes to the 2011 consolidated financial statements
Consolidated balance sheet Audit opinion | Responsibility statement
Consolidated statement of cash flows
€m Notes 2010 2011
Net income from continuing operations 539.3 555.9
Income taxes 59.7 238.3
Interest income / expenses 583.8 545.8
Dividends received 24.0 28.5
Interest received 14 198.0 168.3
Interest paid 15 -798.4 -624.3
Income taxes paid 16 -152.9 -308.4
Depreciation, amortisation, and impairment 890.2 942.7
Elimination of other non-cash items 17 117.1 -47.0
Cash flow 1,460.9 1,499.9
Changes in operating assets 18 -27.5 -301.5
Changes in operating liabilities 19 -27.9 346.7
Changes in working capital -55.4 45.2
Decrease in provisions through cash payments 20 -261.5 -212.7
Cash flow from operating activities 1,144.0 1,332.4
Intangible assets -19.2 -21.4
Property, plant, and equipment -714.8 -853.0
Subsidiaries and other business units -113.9 -63.2
Other financial assets -23.8 -21.6
Investments (cash outflow) 21 -871.6 -959.2
Subsidiaries and other business units 2.0 22.3
Other fixed assets 217.5 177.5
Divestments (cash inflow) 22 219.4 199.7
Cash from changes in consolidation scope 23 4.0 1.4
Cash flow from investing activities -648.2 -758.0
Dividend payments – HeidelbergCement AG -22.5 -46.9
Dividend payments – non-controlling shareholders 24 -56.9 -59.9
Decrease in ownership interests in subsidiaries 25 45.4
Increase in ownership interests in subsidiaries 26 -4.8 -8.5
Proceeds from bond issuance and loans 27 5,678.4 6,597.8
Repayment of bonds and loans 28 -6,182.8 -6,081.7
Cash flow from financing activities -543.2 400.8
Net change in cash and cash equivalents -47.3 975.3
Effect of exchange rate changes 63.5 24.0
Cash and cash equivalents at 1 January 854.4 870.5
Cash and cash equivalents at 31 December 870.5 1,869.8
Reclassification of cash and cash equivalents according to IFRS 5 -0.8
Cash and cash equivalents presented in the balance sheet at 31 December 29 869.7 1,869.8
Con
solid
ated
fin
anci
al s
tate
men
tsA
ddit
iona
l inf
orm
atio
n
4
5
Com
bine
d m
anag
emen
t re
port
Cor
pora
te G
over
nanc
eC
onso
lidat
ed f
inan
cial
sta
tem
ents
Add
itio
nal i
nfor
mat
ion
To
our
shar
ehol
ders
2
3
4
5
1
Con
ten
ts

152 HeidelbergCement | Annual Report 2011
4
Consolidated balance sheet
Assets
€m Notes 31 Dec. 2010 31 Dec. 2011
Non-current assets
Intangible assets 30
Goodwill 10,561.3 10,763.3
Other intangible assets 351.9 345.9
10,913.2 11,109.2
Property, plant, and equipment 31
Land and buildings 5,233.4 5,296.7
Plant and machinery 4,584.9 4,380.1
Other operating equipment 240.1 297.8
Prepayments and assets under construction 865.4 1,061.4
10,923.9 11,036.1
Financial assets
Investments in associates 32 367.5 390.7
Financial investments 33 63.8 63.9
Loans to participations 34 19.1 17.0
Other loans and derivative financial instruments 34 70.0 81.0
520.4 552.6
Fixed assets 22,357.4 22,697.8
Deferred taxes 10 355.8 379.2
other non-current receivables 34 305.3 294.0
Non-current income tax assets 22.1 23.9
Total non-current assets 23,040.7 23,394.9
Current assets
Inventories 35
Raw materials and consumables 649.1 705.8
Work in progress 152.3 171.0
Finished goods and goods for resale 659.2 672.3
Prepayments 25.0 34.0
1,485.6 1,583.1
Receivables and other assets 36
Current interest-bearing receivables 76.5 60.5
Trade receivables 1,429.8 1,648.8
Other current operating receivables 374.6 359.0
Current income tax assets 61.0 41.1
1,941.9 2,109.3
Derivative financial instruments 37 36.0 63.1
Cash and cash equivalents 38 869.7 1,869.8
Total current assets 4,333.2 5,625.4
Disposal groups held for sale 39 2.8
Balance sheet total 27,376.7 29,020.3
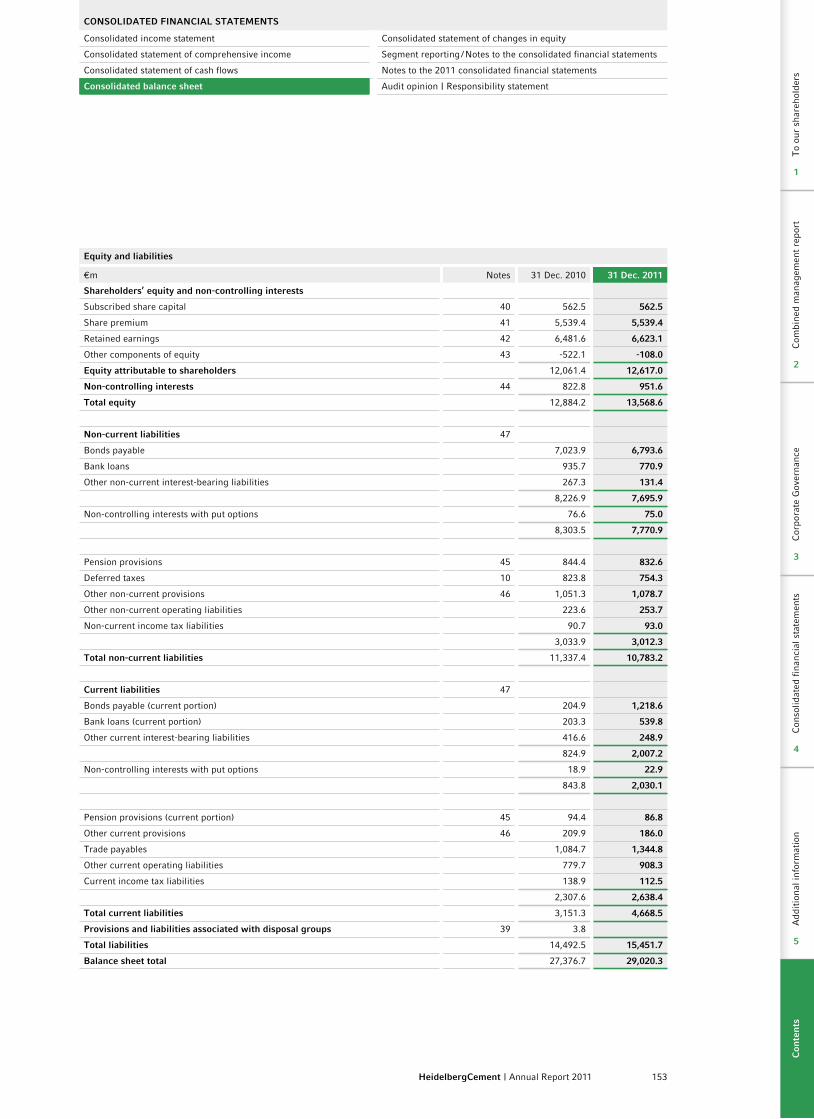
153HeidelbergCement | Annual Report 2011
CoNSoLIDATED FINANCIAL STATEMENTS
Consolidated income statement Consolidated statement of changes in equity
Consolidated statement of comprehensive income Segment reporting / Notes to the consolidated financial statements
Consolidated statement of cash flows Notes to the 2011 consolidated financial statements
Consolidated balance sheet Audit opinion | Responsibility statement
Equity and liabilities
€m Notes 31 Dec. 2010 31 Dec. 2011
Shareholders’ equity and non-controlling interests
Subscribed share capital 40 562.5 562.5
Share premium 41 5,539.4 5,539.4
Retained earnings 42 6,481.6 6,623.1
Other components of equity 43 -522.1 -108.0
Equity attributable to shareholders 12,061.4 12,617.0
Non-controlling interests 44 822.8 951.6
Total equity 12,884.2 13,568.6
Non-current liabilities 47
Bonds payable 7,023.9 6,793.6
Bank loans 935.7 770.9
Other non-current interest-bearing liabilities 267.3 131.4
8,226.9 7,695.9
Non-controlling interests with put options 76.6 75.0
8,303.5 7,770.9
Pension provisions 45 844.4 832.6
Deferred taxes 10 823.8 754.3
Other non-current provisions 46 1,051.3 1,078.7
Other non-current operating liabilities 223.6 253.7
Non-current income tax liabilities 90.7 93.0
3,033.9 3,012.3
Total non-current liabilities 11,337.4 10,783.2
Current liabilities 47
Bonds payable (current portion) 204.9 1,218.6
Bank loans (current portion) 203.3 539.8
Other current interest-bearing liabilities 416.6 248.9
824.9 2,007.2
Non-controlling interests with put options 18.9 22.9
843.8 2,030.1
Pension provisions (current portion) 45 94.4 86.8
Other current provisions 46 209.9 186.0
Trade payables 1,084.7 1,344.8
Other current operating liabilities 779.7 908.3
Current income tax liabilities 138.9 112.5
2,307.6 2,638.4
Total current liabilities 3,151.3 4,668.5
Provisions and liabilities associated with disposal groups 39 3.8
Total liabilities 14,492.5 15,451.7
Balance sheet total 27,376.7 29,020.3
Con
solid
ated
fin
anci
al s
tate
men
tsA
ddit
iona
l inf
orm
atio
n
4
5
Com
bine
d m
anag
emen
t re
port
Cor
pora
te G
over
nanc
eC
onso
lidat
ed f
inan
cial
sta
tem
ents
Add
itio
nal i
nfor
mat
ion
To
our
shar
ehol
ders
2
3
4
5
1
Con
ten
ts
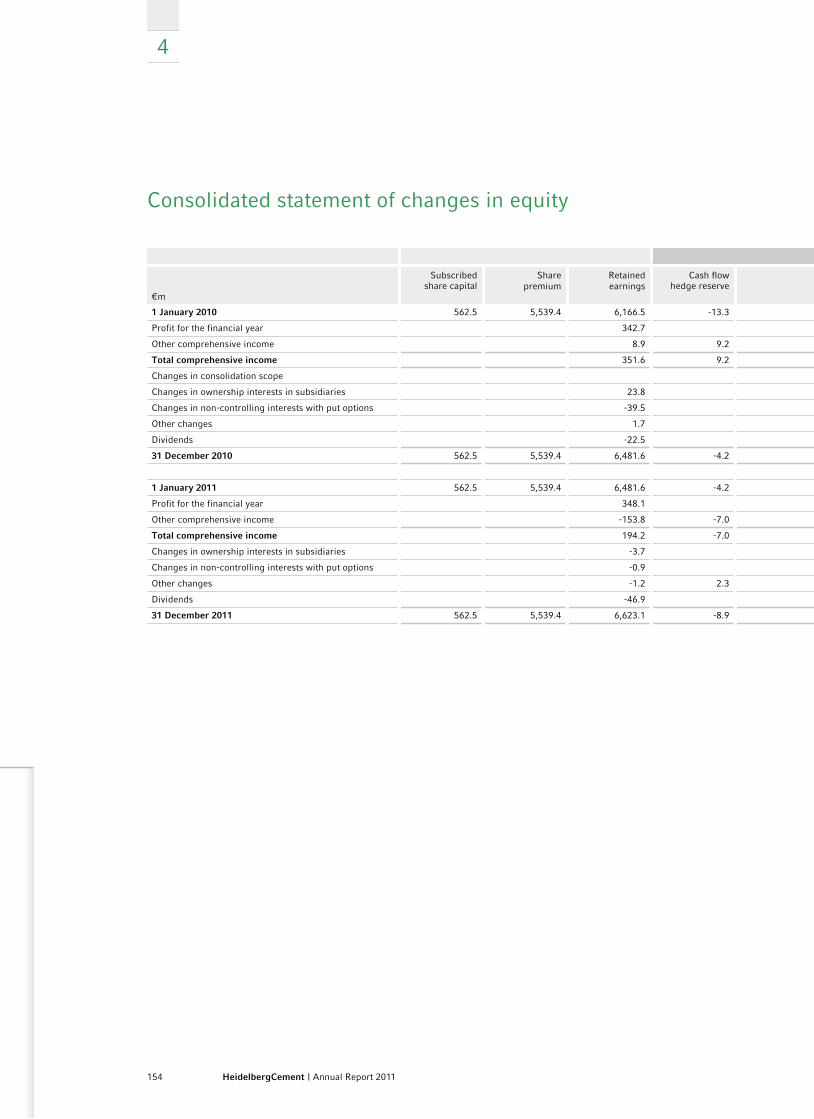
154 HeidelbergCement | Annual Report 2011
4
Consolidated statement of changes in equity
Other components of equity
€m
Subscribed share capital
Share premium
Retained earnings
Cash flow hedge reserve
Available for sale reserve
Asset revaluation reserve
Currency translation
Total other components
of equity
Equity attributable to shareholders
Non-controlling interests
Total equity
1 January 2010 562.5 5,539.4 6,166.5 -13.3 12.9 39.6 -1,906.5 -1,867.4 10,401.0 602.0 11,003.0
Profit for the financial year 342.7 342.7 168.2 510.9
Other comprehensive income 8.9 9.2 11.0 0.2 1,327.6 1,348.0 1,356.9 51.5 1,408.4
Total comprehensive income 351.6 9.2 11.0 0.2 1,327.6 1,348.0 1,699.6 219.6 1,919.3
Changes in consolidation scope 59.6 59.6
Changes in ownership interests in subsidiaries 23.8 23.8 17.8 41.6
Changes in non-controlling interests with put options -39.5 -39.5 -19.3 -58.8
Other changes 1.7 -2.7 -2.7 -1.0 -1.0
Dividends -22.5 -22.5 -56.9 -79.4
31 December 2010 562.5 5,539.4 6,481.6 -4.2 23.9 37.1 -578.9 -522.1 12,061.4 822.8 12,884.2
1 January 2011 562.5 5,539.4 6,481.6 -4.2 23.9 37.1 -578.9 -522.1 12,061.4 822.8 12,884.2
Profit for the financial year 348.1 348.1 186.1 534.2
Other comprehensive income -153.8 -7.0 -4.8 425.2 413.4 259.5 8.6 268.1
Total comprehensive income 194.2 -7.0 -4.8 425.2 413.4 607.6 194.7 802.3
Changes in ownership interests in subsidiaries -3.7 -3.7 -4.5 -8.2
Changes in non-controlling interests with put options -0.9 -0.9 -1.4 -2.4
Other changes -1.2 2.3 -1.6 0.7 -0.5 -0.5
Dividends -46.9 -46.9 -59.9 -106.8
31 December 2011 562.5 5,539.4 6,623.1 -8.9 19.1 35.5 -153.7 -108.0 12,617.0 951.6 13,568.6
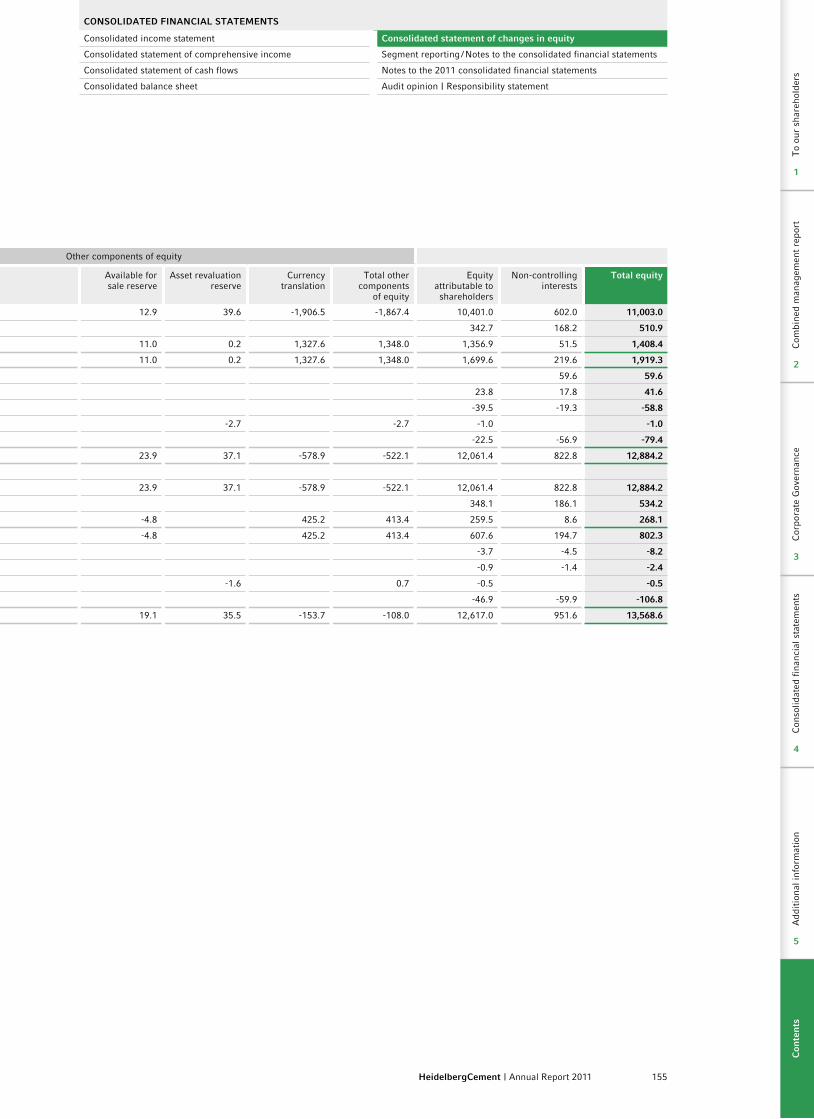
155HeidelbergCement | Annual Report 2011
CoNSoLIDATED FINANCIAL STATEMENTS
Consolidated income statement Consolidated statement of changes in equity
Consolidated statement of comprehensive income Segment reporting / Notes to the consolidated financial statements
Consolidated statement of cash flows Notes to the 2011 consolidated financial statements
Consolidated balance sheet Audit opinion | Responsibility statement
Consolidated statement of changes in equity
Other components of equity
€m
Subscribed share capital
Share premium
Retained earnings
Cash flow hedge reserve
Available for sale reserve
Asset revaluation reserve
Currency translation
Total other components
of equity
Equity attributable to shareholders
Non-controlling interests
Total equity
1 January 2010 562.5 5,539.4 6,166.5 -13.3 12.9 39.6 -1,906.5 -1,867.4 10,401.0 602.0 11,003.0
Profit for the financial year 342.7 342.7 168.2 510.9
Other comprehensive income 8.9 9.2 11.0 0.2 1,327.6 1,348.0 1,356.9 51.5 1,408.4
Total comprehensive income 351.6 9.2 11.0 0.2 1,327.6 1,348.0 1,699.6 219.6 1,919.3
Changes in consolidation scope 59.6 59.6
Changes in ownership interests in subsidiaries 23.8 23.8 17.8 41.6
Changes in non-controlling interests with put options -39.5 -39.5 -19.3 -58.8
Other changes 1.7 -2.7 -2.7 -1.0 -1.0
Dividends -22.5 -22.5 -56.9 -79.4
31 December 2010 562.5 5,539.4 6,481.6 -4.2 23.9 37.1 -578.9 -522.1 12,061.4 822.8 12,884.2
1 January 2011 562.5 5,539.4 6,481.6 -4.2 23.9 37.1 -578.9 -522.1 12,061.4 822.8 12,884.2
Profit for the financial year 348.1 348.1 186.1 534.2
Other comprehensive income -153.8 -7.0 -4.8 425.2 413.4 259.5 8.6 268.1
Total comprehensive income 194.2 -7.0 -4.8 425.2 413.4 607.6 194.7 802.3
Changes in ownership interests in subsidiaries -3.7 -3.7 -4.5 -8.2
Changes in non-controlling interests with put options -0.9 -0.9 -1.4 -2.4
Other changes -1.2 2.3 -1.6 0.7 -0.5 -0.5
Dividends -46.9 -46.9 -59.9 -106.8
31 December 2011 562.5 5,539.4 6,623.1 -8.9 19.1 35.5 -153.7 -108.0 12,617.0 951.6 13,568.6
Con
solid
ated
fin
anci
al s
tate
men
tsA
ddit
iona
l inf
orm
atio
n
4
5
Com
bine
d m
anag
emen
t re
port
Cor
pora
te G
over
nanc
eC
onso
lidat
ed f
inan
cial
sta
tem
ents
Add
itio
nal i
nfor
mat
ion
To
our
shar
ehol
ders
2
3
4
5
1
Con
ten
ts
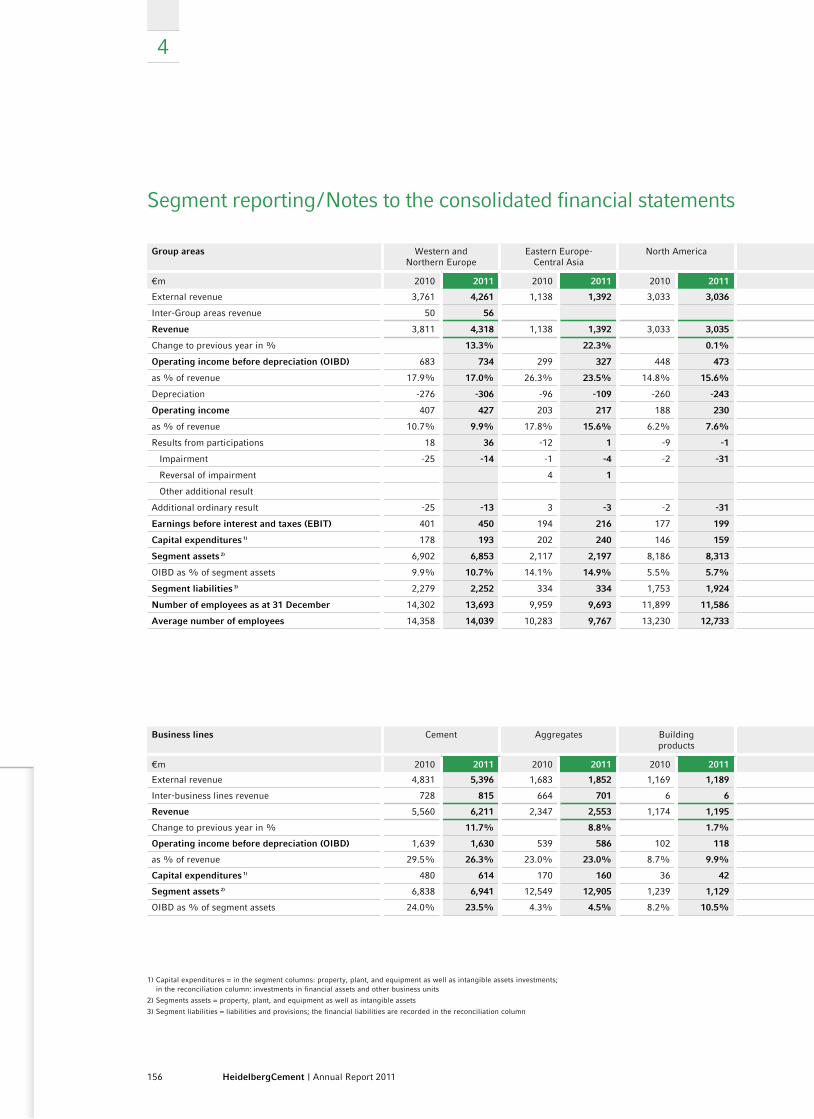
156 HeidelbergCement | Annual Report 2011
4
Segment reporting / Notes to the consolidated financial statements
Group areas Western and Northern Europe
Eastern Europe- Central Asia
North America Asia-Pacific Africa-Mediterranean Basin
Group Services Reconciliation Continuing operations
€m 2010 2011 2010 2011 2010 2011 2010 2011 2010 2011 2010 2011 2010 2011 2010 2011
External revenue 3,761 4,261 1,138 1,392 3,033 3,036 2,582 2,940 901 991 347 282 11,762 12,902
Inter-Group areas revenue 50 56 27 17 37 31 362 370 -476 -475
Revenue 3,811 4,318 1,138 1,392 3,033 3,035 2,609 2,957 938 1,023 709 652 -476 -475 11,762 12,902
Change to previous year in % 13.3% 22.3% 0.1% 13.4% 9.0% -8.2% 9.7%
operating income before depreciation (oIBD) 683 734 299 327 448 473 718 711 156 164 20 11 -84 -99 2,239 2,321
as % of revenue 17.9% 17.0% 26.3% 23.5% 14.8% 15.6% 27.5% 24.0% 16.6% 16.0% 2.9% 1.7% 19.0% 18.0%
Depreciation -276 -306 -96 -109 -260 -243 -132 -143 -35 -35 -10 -10 -809 -847
operating income 407 427 203 217 188 230 586 568 121 128 20 11 -94 -109 1,430 1,474
as % of revenue 10.7% 9.9% 17.8% 15.6% 6.2% 7.6% 22.5% 19.2% 12.9% 12.6% 2.8% 1.7% 12.2% 11.4%
Results from participations 18 36 -12 1 -9 -1 7 7 2 3 1 2 6 49
Impairment -25 -14 -1 -4 -2 -31 -3 -6 -23 -36 -53 -90
Reversal of impairment 4 1 4 1
Other additional result -53 -56 -53 -56
Additional ordinary result -25 -13 3 -3 -2 -31 -3 -6 -23 -36 -53 -56 -102 -145
Earnings before interest and taxes (EBIT) 401 450 194 216 177 199 590 568 99 96 21 13 -147 -165 1,334 1,377
Capital expenditures 1) 178 193 202 240 146 159 174 215 34 67 138 85 872 959
Segment assets 2) 6,902 6,853 2,117 2,197 8,186 8,313 3,837 4,008 755 738 40 37 21,837 22,145
OIBD as % of segment assets 9.9% 10.7% 14.1% 14.9% 5.5% 5.7% 18.7% 17.7% 20.6% 22.2% 50.9% 30.3% 10.3% 10.5%
Segment liabilities 3) 2,279 2,252 334 334 1,753 1,924 606 713 305 330 68 98 9,147 9,801 14,493 15,452
Number of employees as at 31 December 14,302 13,693 9,959 9,693 11,899 11,586 13,682 14,039 3,539 3,460 55 55 53,437 52,526
Average number of employees 14,358 14,039 10,283 9,767 13,230 12,733 13,622 13,811 3,109 3,490 54 50 54,655 53,889
Business lines Cement Aggregates Building products
Concrete-service-other
Reconciliation Total
€m 2010 2011 2010 2011 2010 2011 2010 2011 2010 2011 2010 2011
External revenue 4,831 5,396 1,683 1,852 1,169 1,189 4,079 4,465 11,762 12,902
Inter-business lines revenue 728 815 664 701 6 6 435 441 -1,833 -1,963
Revenue 5,560 6,211 2,347 2,553 1,174 1,195 4,514 4,906 -1,833 -1,963 11,762 12,902
Change to previous year in % 11.7% 8.8% 1.7% 8.7% 9.7%
operating income before depreciation (oIBD) 1,639 1,630 539 586 102 118 46 84 -86 -98 2,239 2,321
as % of revenue 29.5% 26.3% 23.0% 23.0% 8.7% 9.9% 1.0% 1.7% 19.0% 18.0%
Capital expenditures 1) 480 614 170 160 36 42 48 58 138 85 872 959
Segment assets 2) 6,838 6,941 12,549 12,905 1,239 1,129 1,211 1,170 21,837 22,145
OIBD as % of segment assets 24.0% 23.5% 4.3% 4.5% 8.2% 10.5% 3.8% 7.2% 10.3% 10.5%
1) Capital expenditures = in the segment columns: property, plant, and equipment as well as intangible assets investments; in the reconciliation column: investments in financial assets and other business units
2) Segments assets = property, plant, and equipment as well as intangible assets
3) Segment liabilities = liabilities and provisions; the financial liabilities are recorded in the reconciliation column

157HeidelbergCement | Annual Report 2011
Group areas Western and Northern Europe
Eastern Europe- Central Asia
North America Asia-Pacific Africa-Mediterranean Basin
Group Services Reconciliation Continuing operations
€m 2010 2011 2010 2011 2010 2011 2010 2011 2010 2011 2010 2011 2010 2011 2010 2011
External revenue 3,761 4,261 1,138 1,392 3,033 3,036 2,582 2,940 901 991 347 282 11,762 12,902
Inter-Group areas revenue 50 56 27 17 37 31 362 370 -476 -475
Revenue 3,811 4,318 1,138 1,392 3,033 3,035 2,609 2,957 938 1,023 709 652 -476 -475 11,762 12,902
Change to previous year in % 13.3% 22.3% 0.1% 13.4% 9.0% -8.2% 9.7%
operating income before depreciation (oIBD) 683 734 299 327 448 473 718 711 156 164 20 11 -84 -99 2,239 2,321
as % of revenue 17.9% 17.0% 26.3% 23.5% 14.8% 15.6% 27.5% 24.0% 16.6% 16.0% 2.9% 1.7% 19.0% 18.0%
Depreciation -276 -306 -96 -109 -260 -243 -132 -143 -35 -35 -10 -10 -809 -847
operating income 407 427 203 217 188 230 586 568 121 128 20 11 -94 -109 1,430 1,474
as % of revenue 10.7% 9.9% 17.8% 15.6% 6.2% 7.6% 22.5% 19.2% 12.9% 12.6% 2.8% 1.7% 12.2% 11.4%
Results from participations 18 36 -12 1 -9 -1 7 7 2 3 1 2 6 49
Impairment -25 -14 -1 -4 -2 -31 -3 -6 -23 -36 -53 -90
Reversal of impairment 4 1 4 1
Other additional result -53 -56 -53 -56
Additional ordinary result -25 -13 3 -3 -2 -31 -3 -6 -23 -36 -53 -56 -102 -145
Earnings before interest and taxes (EBIT) 401 450 194 216 177 199 590 568 99 96 21 13 -147 -165 1,334 1,377
Capital expenditures 1) 178 193 202 240 146 159 174 215 34 67 138 85 872 959
Segment assets 2) 6,902 6,853 2,117 2,197 8,186 8,313 3,837 4,008 755 738 40 37 21,837 22,145
OIBD as % of segment assets 9.9% 10.7% 14.1% 14.9% 5.5% 5.7% 18.7% 17.7% 20.6% 22.2% 50.9% 30.3% 10.3% 10.5%
Segment liabilities 3) 2,279 2,252 334 334 1,753 1,924 606 713 305 330 68 98 9,147 9,801 14,493 15,452
Number of employees as at 31 December 14,302 13,693 9,959 9,693 11,899 11,586 13,682 14,039 3,539 3,460 55 55 53,437 52,526
Average number of employees 14,358 14,039 10,283 9,767 13,230 12,733 13,622 13,811 3,109 3,490 54 50 54,655 53,889
Business lines Cement Aggregates Building products
Concrete-service-other
Reconciliation Total
€m 2010 2011 2010 2011 2010 2011 2010 2011 2010 2011 2010 2011
External revenue 4,831 5,396 1,683 1,852 1,169 1,189 4,079 4,465 11,762 12,902
Inter-business lines revenue 728 815 664 701 6 6 435 441 -1,833 -1,963
Revenue 5,560 6,211 2,347 2,553 1,174 1,195 4,514 4,906 -1,833 -1,963 11,762 12,902
Change to previous year in % 11.7% 8.8% 1.7% 8.7% 9.7%
operating income before depreciation (oIBD) 1,639 1,630 539 586 102 118 46 84 -86 -98 2,239 2,321
as % of revenue 29.5% 26.3% 23.0% 23.0% 8.7% 9.9% 1.0% 1.7% 19.0% 18.0%
Capital expenditures 1) 480 614 170 160 36 42 48 58 138 85 872 959
Segment assets 2) 6,838 6,941 12,549 12,905 1,239 1,129 1,211 1,170 21,837 22,145
OIBD as % of segment assets 24.0% 23.5% 4.3% 4.5% 8.2% 10.5% 3.8% 7.2% 10.3% 10.5%
CoNSoLIDATED FINANCIAL STATEMENTS
Consolidated income statement Consolidated statement of changes in equity
Consolidated statement of comprehensive income Segment reporting / Notes to the consolidated financial statements
Consolidated statement of cash flows Notes to the 2011 consolidated financial statements
Consolidated balance sheet Audit opinion | Responsibility statement
Con
solid
ated
fin
anci
al s
tate
men
tsA
ddit
iona
l inf
orm
atio
n
4
5
Com
bine
d m
anag
emen
t re
port
Cor
pora
te G
over
nanc
eC
onso
lidat
ed f
inan
cial
sta
tem
ents
Add
itio
nal i
nfor
mat
ion
To
our
shar
ehol
ders
2
3
4
5
1
Con
ten
ts
158 HeidelbergCement | Annual Report 2011
4
Notes to the 2011 consolidated financial statements
General information
HeidelbergCement AG is a public limited company based in Germany. The company has its registered office in Heidelberg, Germany. Its address is: HeidelbergCement AG, Berliner Strasse 6, 69120 Heidelberg.
The core activities of HeidelbergCement include the production and distribution of cement, aggregates, concrete, and building products. Further details are given in the management report.
Accounting and valuation principles
Accounting principlesThe consolidated financial statements of HeidelbergCement AG were prepared in accordance with the International Financial Reporting Standards (IFRS) as adopted by the European Union and the additional requirements of German Commercial Law pursuant to § 315a, section 1 of the German Commercial Code. All binding IFRSs for the 2011 financial year adopted into European law by the European Commission, including the interpretations of the IFRS Interpretations Committee, were applied.
The previous year’s figures were prepared according to the same principles. The consolidated financial state-ments are prepared in euro. The financial statements show a true and fair view of the financial position and performance of the HeidelbergCement Group.
In accordance with IAS 1 (Presentation of Financial Statements), the consolidated financial statements con-tain a balance sheet as at the reporting date, an income statement, a statement of comprehensive income, a statement of changes in equity, and a statement of cash flows in accordance with the principles of IAS 7 (Statement of Cash Flows). The segment reporting is prepared in accordance with the regulations of IFRS 8 (Operating Segments).
For reasons of clarity, some individual items have been combined in the income statement and in the balance sheet. Explanations of these items are contained in the Notes. To improve the level of information, the addi-tional ordinary result is shown separately in the income statement and in the segment reporting. The income statement classifies expenses according to their nature.
Estimation uncertainty and assumptionsThe presentation of the financial position and performance in the consolidated financial statements is dependent on estimates and assumptions made by the management, which affect the amounts and presentation of the assets and liabilities, expenses and income, and contingent liabilities accounted for in the period. The actual values may differ from these estimates. The assumptions and estimates relate particularly to the necessity and calculation of impairment of goodwill, the recognition of deferred tax assets, and the measurement of pension provisions and other provisions.
A cash flow-based method in accordance with IAS 36 (Impairment of Assets) is used to determine the recover-able amount of cash-generating units as part of the impairment test for goodwill. In particular, estimates are required here in relation to future cash flows of the cash-generating units as well as to the discount rates used (discounted cash flow method). Further details are given on pages 163 f. A change in the influencing factors may have a significant impact on the amount of impairment.
159HeidelbergCement | Annual Report 2011
CoNSoLIDATED FINANCIAL STATEMENTS
Consolidated income statement Consolidated statement of changes in equity
Consolidated statement of comprehensive income Segment reporting / Notes to the consolidated financial statements
Consolidated statement of cash flows Notes to the 2011 consolidated financial statements
Consolidated balance sheet Audit opinion | Responsibility statement
To assess the future probability that deferred tax assets can be utilised, various estimates must be adopted, e.g. operational plans, periods of loss carried forward, and tax planning strategies. If the actual results deviate from these estimates, this may impact the financial position and performance.
The obligations arising from defined benefit pension plans are determined on the basis of actuarial methods, which are based on assumptions and estimates concerning the discount rate, expected return on plan assets, future salary increases, development of health care costs, and other influencing factors. A change in the underlying parameters may lead to changes in the amounts recognised in the balance sheet. Further details are given under item 45 Pension provisions.
Provisions to cover liability for damages and environmental obligations are measured on the basis of an extra-polation of the claims and estimates of the development of costs. A change in the influencing parameters may have an impact on the income statement as well as the amounts recognised in the balance sheet.
The recognition and measurement of the other provisions takes place with the aid of estimates of the prob-abilities of future outflow of resources and on the basis of empirical values and the circumstances known at the reporting date. The actual outflow of resources may differ from the outflow of resources expected at the reporting date and may have an impact on the recognition and measurement.
The presentation of liabilities in connection with reimbursements from insurance companies depends on the outcome of pending lawsuits.
Consolidation principlesThe consolidation is performed using the acquisition method in accordance with IFRS 3 (Business Combi-nations). In this process, the acquirer measures the identifiable assets acquired and liabilities assumed at their fair values at the acquisition date. The acquiring entity’s investment, measured at the fair value of the consideration transferred, is eliminated against the revalued equity of the newly consolidated subsidiary at acquisition date. The residual positive difference between the fair value of the cost of acquisition and the fair value of acquired assets and liabilities is shown as goodwill. A residual negative difference is recognised in profit or loss after further review. Non-controlling interests can be recognised either with the proportionate net assets allocated to them or at fair value. This option can be applied separately for every business combi-nation. Transaction costs relating to business combinations are recorded as expenses. Goodwill is tested for impairment according to IAS 36 (Impairment of Assets) at least once a year in the fourth quarter according to the current operational plan or upon the occurrence of significant events or changes in circumstances that indicate an impairment requirement. Business combinations achieved in stages are accounted for on the basis of the regulations of IFRS 3.41 f. Differences between the carrying amount and the fair value of previously held shares are recognised in profit or loss, accordingly. Changes in the ownership interest that do not lead to a loss of control over a subsidiary are recognised outside profit or loss as equity transactions, in accordance with IAS 27.30. In the case of transactions that lead to a loss of control, any residual interests are revalued at fair value in profit or loss.
The consolidated financial statements comprise the subsidiaries in which HeidelbergCement is able to govern the financial and operating policies. Normally, this is the case when more than 50% of the shares are owned. If contractual regulations stipulate that a company can be controlled despite a shareholding of less than 50%, this company is included in the consolidated financial statements as a subsidiary. If a company cannot be controlled with a shareholding of more than 50% as a result of contractual regulations, this company is not included in the consolidated financial statements as a subsidiary.
Con
solid
ated
fin
anci
al s
tate
men
tsA
ddit
iona
l inf
orm
atio
n
4
5
Com
bine
d m
anag
emen
t re
port
Cor
pora
te G
over
nanc
eC
onso
lidat
ed f
inan
cial
sta
tem
ents
Add
itio
nal i
nfor
mat
ion
To
our
shar
ehol
ders
2
3
4
5
1
Con
ten
ts
160 HeidelbergCement | Annual Report 2011
4
The share of equity and the share of profit or loss for the financial year attributable to non-controlling interests are shown separately. In the case of put options held by non-controlling interests (including non-controlling interests in German partnerships), the proportionate share of the period’s overall profits attributable to the non-controlling interests as well as the dividend payments to non-controlling interests are shown over the course of the year as changes in equity. As at the reporting date, a liability from the put option is shown as a financial liability at the present value of the redemption amount and the non-controlling interests are derecognised. The excess of the present value of the liability over the carrying amount of the non-controlling interests is recognised directly in equity. In the statement of changes in equity, this is reported in the line changes in non-controlling interests with put options.
Significant joint ventures of the HeidelbergCement Group are included in the consolidated financial state-ments as proportionately consolidated companies (IAS 31 Interests in Joint Ventures). Using this method, the Group accounts for its share of the assets, liabilities, income, expenses, and cash flows in the corresponding lines of the consolidated financial statements.
Investments in associates, in cases where HeidelbergCement exerts significant influence on the operating and financial policies of the participation through a shareholding of between 20% and 50% are accounted for in accordance with the equity method (IAS 28 Investments in Associates) in the consolidated financial statements. Initially, the acquired investments are recognised at cost, with the Group’s share of profit or loss being recognised as an increase or decrease to the carrying amount of the investment. In order to present the results from participations in a more meaningful way, the Group’s share of income from associates is shown before income taxes. The proportionate income tax expense is shown under income taxes. The net result from associated companies is shown separately below the income statement.
Income and expenses as well as receivables and liabilities between consolidated companies are eliminated according to IAS 27 (Consolidated and Separate Financial Statements). Profits and losses from intra-Group sales of assets are eliminated.
The consequences of consolidation on income tax are taken into account by recognising deferred taxes.
Application of new accounting standardsIn the 2011 financial year, HeidelbergCement applied the following revised standards and interpretations of the International Accounting Standards Board (IASB) for the first time.
– The revised IAS 24 (Related Party Disclosures) simplifies the reporting obligations of government-related entities. Furthermore, the definition of related parties was also fundamentally revised.
– The amendment to IAS 32 (Financial Instruments: Presentation) concerns the classification of rights issues. It states that certain rights issues as well as options and warrants denominated in a foreign currency are to be classified as equity rather than as a liability in the financial statement of the issuer to whose equity instruments these rights relate.
– The amendments to IFRIC 14 (Prepayments of a Minimum Funding Requirement) are relevant if a company that has to fulfil minimum funding requirements in connection with its pension plans, makes prepayments to meet these requirements. The amendment to the interpretation allows the companies to recognise the benefit arising from these prepayments as an asset.
– IFRIC 19 (Extinguishing Financial Liabilities with Equity Instruments) provides guidance on the accounting of transactions referred to as debt for equity swaps and clarifies the requirements set out in the IFRSs if a com-pany renegotiates the conditions of a financial liability with the creditor and, as a result, the creditor accepts shares or other equity instruments of the company as full or partial repayment of the financial liability.
161HeidelbergCement | Annual Report 2011
CoNSoLIDATED FINANCIAL STATEMENTS
Consolidated income statement Consolidated statement of changes in equity
Consolidated statement of comprehensive income Segment reporting / Notes to the consolidated financial statements
Consolidated statement of cash flows Notes to the 2011 consolidated financial statements
Consolidated balance sheet Audit opinion | Responsibility statement
– As part of the 2010 annual improvement process, the IASB made minor amendments to six International Financial Reporting Standards (IFRS) as well as an interpretation (IFRIC).
The first-time application of the standards and interpretations had no impact on the Group’s financial position and performance.
The IASB and IFRS Interpretations Committee also adopted the standards and interpretations listed below, whose application was not yet mandatory for the 2011 financial year or have not yet been ratified by the European Commission as at the reporting date.
– The amendments to IAS 1 (Presentation of Financial Statements) concern the future breakdown of the items shown in other comprehensive income into two categories, depending on whether, in the future, they are reclassified to profit or loss or not. The amendments are to be applied for the first time for financial years beginning on or after 1 July 2012 (not yet adopted by EU law).
– The amendment to IAS 12 (Income Taxes) provides a practical solution to the problem of differentiating whether the carrying amount of an asset is recovered through use or sale. For the measurement of de-ferred taxes, it introduces the rebuttable presumption that the carrying amount of investment property measured at fair value is normally recovered through sale. The remaining guidance contained in SIC 21 (Income Taxes – Recovery of Revalued Non-Depreciable Assets) is integrated into IAS 12. The amend-ments are to be applied for the first time for financial years beginning on or after 1 January 2012 (not yet adopted by EU law).
– In June 2011, the IASB published amendments to IAS 19 (Employee Benefits). The former option of either recognising actuarial gains and losses immediately in the income statement, recognising them immediately in other comprehensive income, or deferring them in accordance with the corridor method, was abolished. In future, these gains or losses may only be recognised in other comprehensive income. HeidelbergCement already exercises the existing option set out in IAS 19 in this form. In addition, the return on plan assets will, in the future, be recognised not on the basis of the expected return but on the basis of the discount rate. Past service costs must, in the future, be recognised fully in the period in which the related plan amend-ment occurs. The requirements for post-employment benefits are also amended. The amended version of IAS 19 results in more extensive disclosures in the Notes. The amendments are to be applied for the first time for financial years beginning on or after 1 January 2013 (not yet adopted by EU law).
– According to the amendments to IFRS 7 (Financial Instruments: Disclosures), for financial assets that – despite a transferral of rights – have not been completely derecognised, additional information must be provided on the assets not derecognised and the associated liabilities. In addition, in the case of a continu-ing involvement, an entity must disclose information that enables users of its financial statements to better understand the nature of, and risks associated with, the continuing involvement in derecognised assets. The amendments are to be applied for the first time for financial years beginning on or after 1 July 2011.
– The publication of IFRS 9 (Financial Instruments) concludes phase 1 of the three-part IASB project to completely revise the accounting of financial instruments. IFRS 9 pursues a new, less complex approach for the categorisation and measurement of financial assets and financial liabilities. Instead of the previous four measurement categories for financial instruments on the assets side, there are now only two. The cat-egorisation is based firstly on the company’s business model for the group of financial instruments under consideration and secondly on the characteristics of the contractual cash flows of the relevant financial asset. The accounting of financial liabilities pursuant to IFRS 9 is essentially performed in the same way as set out in the previous regulations of IAS 39 (Financial Instruments: Recognition and Measurement).
Con
solid
ated
fin
anci
al s
tate
men
tsA
ddit
iona
l inf
orm
atio
n
4
5
Com
bine
d m
anag
emen
t re
port
Cor
pora
te G
over
nanc
eC
onso
lidat
ed f
inan
cial
sta
tem
ents
Add
itio
nal i
nfor
mat
ion
To
our
shar
ehol
ders
2
3
4
5
1
Con
ten
ts
162 HeidelbergCement | Annual Report 2011
4
The only changes made were those within the context of the fair value option: changes in the fair value attributable to changes in the entity’s own credit risk are to be recognised outside profit or loss in other comprehensive income. Furthermore, there will no longer be an option to measure derivative liabilities at cost for unquoted equity instruments in future. IFRS 9 is to be applied for financial years beginning on or after 1 January 2015 (not yet adopted by EU law).
– IFRS 10 (Consolidated Financial Statements) establishes a single definition of the term control and sets out the existence of parent-subsidiary relationships in concrete terms. The first-time application of IFRS 10 may have an impact on the composition of the consolidation scope. IFRS 10 replaces the requirements of IAS 27 (Consolidated and Separate Financial Statements), related to consolidated financial statements, and SIC-12 (Consolidation – Special Purpose Entities). IFRS 10 is to be applied for the first time for financial years beginning on or after 1 January 2013 (not yet adopted by EU law).
– IFRS 11 (Joint Arrangements) describes the accounting for situations where a company exercises joint
control over a joint venture or a joint operation. IFRS 11 supersedes IAS 31 (Interests in Joint Ventures). The most significant effect of the new standard is the abolition of proportionate consolidation for joint ventures. In the future, all joint ventures must be accounted for using the equity method. Assets and liabilities as well as income and expenses of a joint operation will continue to be included proportionately in the consolidated financial statements. The first-time application of IFRS 11 will have an impact on the structure of HeidelbergCement’s consolidated financial statements. The assets and liabilities as well as the income and expenses of joint ventures will no longer be shown proportionately in the relevant balance sheet or income statement items, but will only be shown in a separate line using the equity method: the proportionate carry ing amount in the balance sheet and the result from participations in the income statement. IFRS 11 is to be applied for the first time for financial years beginning on or after 1 January 2013 (not yet adopted by EU law).
– IFRS 12 (Disclosure of Interests in Other Entities) includes all of the disclosure requirements for subsidi-aries, joint arrangements, and associates, which were previously included in IAS 27, IAS 31, and IAS 28, and extends the disclosure requirements in relation to the consolidation scope and subsidiaries with non-controlling interests. IFRS 12 is to be applied for the first time for financial years beginning on or after 1 January 2013 (not yet adopted by EU law).
– IFRS 13 (Fair Value Measurement) introduces a uniform framework for fair value measurement, which applies to all IFRSs, with a few exceptions (IFRS 2 Share-based Payment, IAS 2 Inventories, IAS 17 Leases, and IAS 36 Impairment of Assets). IFRS 13 is to be applied for the first time for financial years beginning on or after 1 January 2013 (not yet adopted by EU law).
– IFRIC 20 (Stripping Costs in the Production Phase of a Surface Mine) describes the accounting of stripping costs during the production phase in surface mining and clarifies when production stripping costs should lead to the recognition of an asset and how that asset should be measured both initially and in subsequent periods. IFRIC 20 is to be applied for the first time for financial years beginning on or after 1 January 2013 (not yet adopted by EU law).
– The amendment to IAS 32 (Offsetting Financial Assets and Financial Liabilities) clarifies details concerning the netting of financial assets and liabilities. The amendment is to be applied for the first time for financial years beginning on or after 1 January 2014 (not yet adopted by EU law).
163HeidelbergCement | Annual Report 2011
CoNSoLIDATED FINANCIAL STATEMENTS
Consolidated income statement Consolidated statement of changes in equity
Consolidated statement of comprehensive income Segment reporting / Notes to the consolidated financial statements
Consolidated statement of cash flows Notes to the 2011 consolidated financial statements
Consolidated balance sheet Audit opinion | Responsibility statement
– The amendment to IFRS 7 (Disclosures – Offsetting Financial Assets and Financial Liabilities) results in additional disclosures relating to the netting of financial instruments in the Notes. The amendment is to be applied for the first time for financial years beginning on or after 1 January 2013 (not yet adopted by EU law).
HeidelbergCement will not apply these standards and interpretations until the date when their application first becomes mandatory and after ratification by the EU Commission. The effects of IFRS 9, IFRS 10, IFRS 11, IFRS 12, IFRS 13, and IFRIC 20, as well as the amendments to IAS 19, are currently being analysed. Accord-ing to current estimates, the first-time application of the other standards will not have a significant impact on the financial position and performance of the Group.
Recognition and measurement principlesThe consolidated financial statements are generally prepared using the historical cost principle. Exceptions to this are derivative financial instruments and available-for-sale investments, which are measured at fair value. The carrying amounts of hedged assets and liabilities, recognised in the balance sheet and hedged by fair value hedge relationships, are adjusted for changes in the fair value attributable to the risk being hedged. These assets and liabilities would otherwise be accounted for at cost. The fundamental recognition and measurement principles are outlined below.
According to IAS 38 (Intangible Assets), an intangible asset is an identifiable non-monetary asset without physical substance. The definition requires an intangible asset to be identifiable in order to distinguish it from goodwill. An asset meets the identifiability criterion if it is separable or arises from contractual or other legal rights. Intangible assets are initially measured at cost. In subsequent periods, intangible assets with a finite useful life are measured at cost less accumulated amortisation and impairment, and intangible assets with an indefinite useful life are measured at cost less impairment. Intangible assets with a finite useful life are amortised using the unit of production method, in the case of quarrying licences, otherwise using the straight line method.
Emission rights are shown as intangible assets. Emission rights granted free of charge are initially meas-ured at a nominal value of zero. Emission rights acquired for consideration are accounted for at cost and are subject to write-down in the event of impairment. The second national allocation plan (NAP II) for the allocation of CO2 emissions allowances (EUA – European Union Allowances) spans a period of five years (2008–2012). This period serves as a basis for assessing the deficit or surplus. Provisions for the obligation to return emission rights are recognised if the actual CO2 emissions up to the reporting date are not covered by emission rights granted free of charge. The amount of provision for emission rights already acquired for consideration is measured at the carrying amount and, for emission rights yet to be acquired in order to fulfil the obligation, at the market value as at the reporting date. The Group has made a commitment to supply emission rights allowances in exchange for emission reductions (CER – Certified Emission Reductions and ERU – Emission Reduction Units) in a series of swaps. In addition, CER were exchanged for ERU in a series of swaps. In accordance with IAS 38.45 for exchange transactions, the swaps are accounted for as a sale of the emission rights given up and an acquisition, for consideration, of the emission rights received, using the fair value at the transaction date.
In accordance with IFRS 3 (Business Combinations), goodwill arising from business combinations is not amortised. Instead, an impairment test in accordance with IAS 36 (Impairment of Assets) is carried out. In this impairment test, the carrying amount of a group of cash-generating units (CGUs) to which goodwill is allocated is compared with the recoverable amount of this group of CGUs. On the basis of the sales and management structure, a group of cash-generating units is defined generally as a country or region.
Con
solid
ated
fin
anci
al s
tate
men
tsA
ddit
iona
l inf
orm
atio
n
4
5
Com
bine
d m
anag
emen
t re
port
Cor
pora
te G
over
nanc
eC
onso
lidat
ed f
inan
cial
sta
tem
ents
Add
itio
nal i
nfor
mat
ion
To
our
shar
ehol
ders
2
3
4
5
1
Con
ten
ts
164 HeidelbergCement | Annual Report 2011
4
As soon as the carrying amount of an asset exceeds its recoverable amount, an impairment loss is recognised in profit or loss to reduce the asset to its recoverable amount. The recoverable amount is the higher of an asset’s fair value less costs to sell and its value in use. The fair value is the amount obtainable from the sale of an asset in an arm’s length transaction. The value in use is calculated by discounting estimated future cash flows after taxes with a post-tax risk-adjusted discount rate (WACC).
Cash flow estimates extend over a five-year planning period after which a terminal value is applied. A detailed bottom-up operational plan approved by management forms the basis of the estimate for the first three years. It is extended by a top-down plan for a further two years, which incorporates medium term expectations of the management based on estimates about future demand, market shares, cost and price development.
As a general rule, the top-down plan is derived by applying an annual growth rate of 1.5% or 2.0% to the detailed three year operating plan. For CGUs operating in a market, which is not in a steady state, a detailed planning is conducted. This applies especially to those markets, which are heavily affected by the financial and economic crisis. For these CGUs it is assumed that the demand for building materials and building products will return to a sustainable level as it was before the crisis. The sales derived thereof are generally based on the assumption of constant market shares.
Variable costs are assumed to evolve in line with the development of sales volumes and prices. Generally, it is assumed that the contribution margin in percent of gross sales remains on a stable level. Given increasing sales volumes this leads to an improving operating margin. Furthermore, it was assumed that the savings achieved by cost reduction programmes (”Fitness 2009“, ”FitnessPlus 2010“, and ”Fox 2013“) positively influence the operating margins.
The assumptions for the estimated growth rates of the terminal value are consistent at 1.5% or 2.0% and are based on long-term future inflation rates.
The WACC rates for the Group were calculated using a two-phase approach, whereby a phase one WACC rate was used to discount the cash flows for the first five years and a phase two WACC was applied for the determination of the terminal value. The difference between the two WACC rates results from the adjustment of the perpetual growth rate in phase two. The credit spread was derived from the rating of the peer group. The terminal value thus determined was then discounted back to the valuation date with the phase one WACC.
The following key assumptions were used in the determination of the recoverable amount on the value in use basis, for each group of CGUs where the goodwill is either a significant proportion of the Group total or where impairment has been recognised or where a segment consists of an amalgamation of groups of CGUs with attributable goodwill that is not a significant proportion of the Group total.
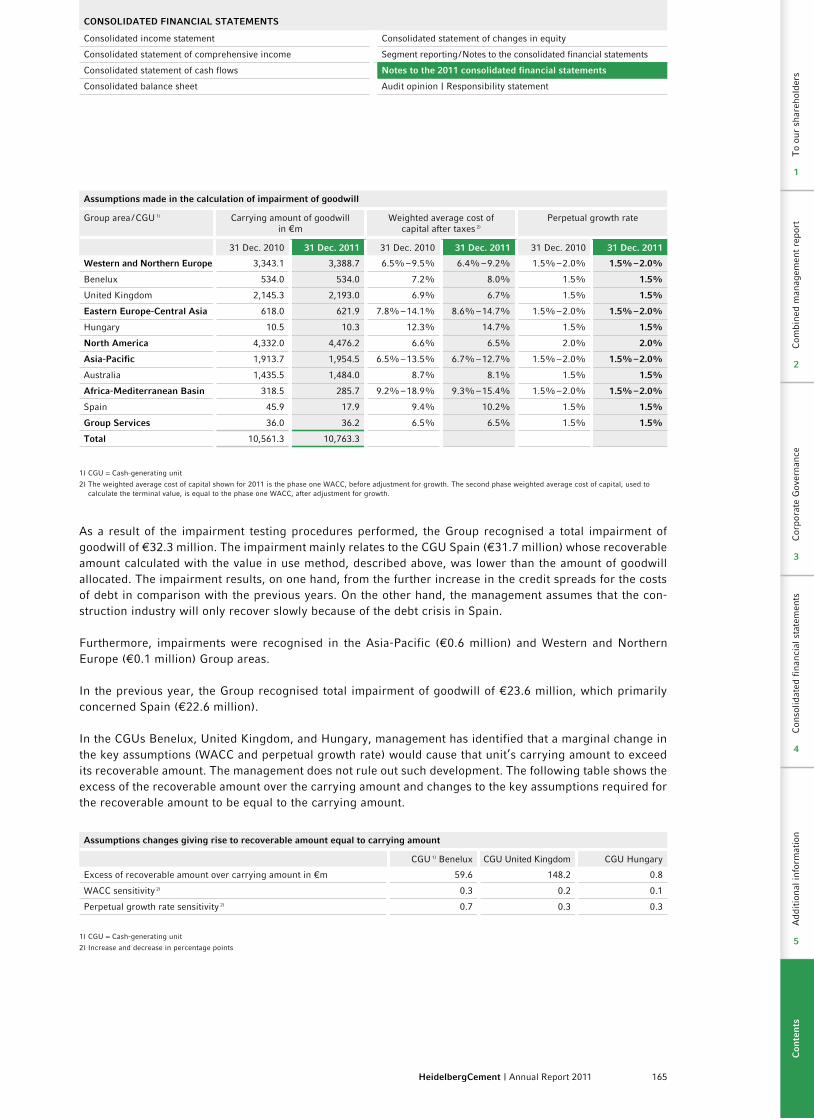
165HeidelbergCement | Annual Report 2011
CoNSoLIDATED FINANCIAL STATEMENTS
Consolidated income statement Consolidated statement of changes in equity
Consolidated statement of comprehensive income Segment reporting / Notes to the consolidated financial statements
Consolidated statement of cash flows Notes to the 2011 consolidated financial statements
Consolidated balance sheet Audit opinion | Responsibility statement
Assumptions made in the calculation of impairment of goodwill
Group area / CGU 1) Carrying amount of goodwill in €m
Weighted average cost of capital after taxes 2)
Perpetual growth rate
31 Dec. 2010 31 Dec. 2011 31 Dec. 2010 31 Dec. 2011 31 Dec. 2010 31 Dec. 2011
Western and Northern Europe 3,343.1 3,388.7 6.5% – 9.5% 6.4% – 9.2% 1.5% – 2.0% 1.5% – 2.0%
Benelux 534.0 534.0 7.2% 8.0% 1.5% 1.5%
United Kingdom 2,145.3 2,193.0 6.9% 6.7% 1.5% 1.5%
Eastern Europe-Central Asia 618.0 621.9 7.8% – 14.1% 8.6% – 14.7% 1.5% – 2.0% 1.5% – 2.0%
Hungary 10.5 10.3 12.3% 14.7% 1.5% 1.5%
North America 4,332.0 4,476.2 6.6% 6.5% 2.0% 2.0%
Asia-Pacific 1,913.7 1,954.5 6.5% – 13.5% 6.7% – 12.7% 1.5% – 2.0% 1.5% – 2.0%
Australia 1,435.5 1,484.0 8.7% 8.1% 1.5% 1.5%
Africa-Mediterranean Basin 318.5 285.7 9.2% – 18.9% 9.3% – 15.4% 1.5% – 2.0% 1.5% – 2.0%
Spain 45.9 17.9 9.4% 10.2% 1.5% 1.5%
Group Services 36.0 36.2 6.5% 6.5% 1.5% 1.5%
Total 10,561.3 10,763.3
1) CGU = Cash-generating unit
2) The weighted average cost of capital shown for 2011 is the phase one WACC, before adjustment for growth. The second phase weighted average cost of capital, used to calculate the terminal value, is equal to the phase one WACC, after adjustment for growth.
As a result of the impairment testing procedures performed, the Group recognised a total impairment of goodwill of €32.3 million. The impairment mainly relates to the CGU Spain (€31.7 million) whose recoverable amount calculated with the value in use method, described above, was lower than the amount of goodwill allocated. The impairment results, on one hand, from the further increase in the credit spreads for the costs of debt in comparison with the previous years. On the other hand, the management assumes that the con-struction industry will only recover slowly because of the debt crisis in Spain.
Furthermore, impairments were recognised in the Asia-Pacific (€0.6 million) and Western and Northern Europe (€0.1 million) Group areas.
In the previous year, the Group recognised total impairment of goodwill of €23.6 million, which primarily concerned Spain (€22.6 million).
In the CGUs Benelux, United Kingdom, and Hungary, management has identified that a marginal change in the key assumptions (WACC and perpetual growth rate) would cause that unit’s carrying amount to exceed its recoverable amount. The management does not rule out such development. The following table shows the excess of the recoverable amount over the carrying amount and changes to the key assumptions required for the recoverable amount to be equal to the carrying amount.
Assumptions changes giving rise to recoverable amount equal to carrying amount
CGU 1) Benelux CGU United Kingdom CGU Hungary
Excess of recoverable amount over carrying amount in €m 59.6 148.2 0.8
WACC sensitivity 2) 0.3 0.2 0.1
Perpetual growth rate sensitivity 2) 0.7 0.3 0.3
1) CGU = Cash-generating unit
2) Increase and decrease in percentage points
Con
solid
ated
fin
anci
al s
tate
men
tsA
ddit
iona
l inf
orm
atio
n
4
5
Com
bine
d m
anag
emen
t re
port
Cor
pora
te G
over
nanc
eC
onso
lidat
ed f
inan
cial
sta
tem
ents
Add
itio
nal i
nfor
mat
ion
To
our
shar
ehol
ders
2
3
4
5
1
Con
ten
ts

166 HeidelbergCement | Annual Report 2011
4
All other groups of CGUs remain unaffected by a WACC increase of up to 0.5 percentage points or with a reduction of 1.0 percentage points in the perpetual growth rate.
Property, plant and equipment are accounted for according to IAS 16 (Property, Plant and Equipment) at cost less accumulated depreciation and impairment. Cost includes all costs that can be attributed to the manufacturing process and appropriate amounts of production overheads. Costs for repair and maintenance of property, plant, and equipment are expensed as incurred. Capitalisation takes place if the measures lead to an extension or significant improvement of the asset. Property, plant, and equipment are depreciated on a straight-line basis unless there is another depreciation method more appropriate for the pattern of use. Borrowing costs that can be allocated directly or indirectly to the construction of large facilities with a crea-tion period of more than twelve months (Qualifying Assets) are capitalised as part of the cost in accordance with IAS 23 (Borrowing Costs).
Inventories are measured in accordance with IAS 2 (Inventories) at the lower of cost and net realisable value, using the weighted average cost method. Adequate provisions are made for risks relating to quality and quan-tity. Besides direct expenses, the costs for finished goods and work in progress include production-related indirect materials and indirect labour costs, as well as production-related depreciation. The overhead rates are calculated on the basis of the average operating performance rate. Borrowing costs are not recognised as part of the costs because the production period is less than twelve months. Spare parts for equipment are reported under inventories or fixed assets if purchased in connection with the acquisition of the facility.
Long-term service and construction contracts spanning a longer period of time are accounted according to the stage of completion (Percentage of Completion Method).
Pension provisions and similar obligations are determined in accordance with IAS 19 (Employee Benefits). For numerous employees, the Group makes provision for retirement either directly or indirectly through contributions to pension funds. Various retirement benefit systems are in place, depending on the legal, economic, and tax framework in each country, which are generally based on employees’ years of service and remuneration. The pension provisions include those from current pensions and from entitlements from pensions to be paid in the future.
At HeidelbergCement, the company pension schemes include both defined contribution and defined benefit plans. In defined contribution plans, the Group pays contributions into earmarked funds. After paying the contributions, the Group has no further benefit obligations. In defined benefit plans, the Group’s obligation is to provide the agreed benefits to current and former employees. A distinction is made between benefit systems financed by provisions and those financed by funds.
The most significant retirement benefit plans financed by funds exist in Belgium, the Netherlands, the United Kingdom, the United States, Canada, Norway, India, and Indonesia. The retirement benefit system in Indonesia consists of a statutory defined benefit plan and a company-based defined contribution plan financed by funds, the benefits from which may be set off against the statutory benefits. In Germany and Sweden, the retirement benefit plans are financed by means of provisions. HeidelbergCement also has a retirement benefit system financed by provisions to cover the medical care costs of pension recipients in Belgium, Indonesia, Canada, and the United States, and for early retirement commitments in Belgium.
The pension obligations and the available plan assets are valued annually by independent experts for all major Group companies. The pension obligations and the expenses required to cover this obligation are measured in accordance with the internationally accepted projected unit credit method.

167HeidelbergCement | Annual Report 2011
CoNSoLIDATED FINANCIAL STATEMENTS
Consolidated income statement Consolidated statement of changes in equity
Consolidated statement of comprehensive income Segment reporting / Notes to the consolidated financial statements
Consolidated statement of cash flows Notes to the 2011 consolidated financial statements
Consolidated balance sheet Audit opinion | Responsibility statement
The actuarial assumptions are dependent on the economic situation in each individual country. The interest rate is based on the interest rate level obtained on the measurement date for high-quality fixed interest-bearing corporate bonds with a duration corresponding to the pension plans concerned in the relevant country. In countries or currency areas without a liquid market for corporate bonds, the interest rate is determined on the basis of government bonds or using other approximation methods. The expected return on assets from the pension funds is determined using a uniform method based on long-term actual historical yields, the portfolio structure, and the future yields expected in the long term. Actuarial gains and losses may result from increases or decreases in the present value of the defined benefit obligations or the fair value of the plan assets. These may be caused by, for example, changes in the calculation parameters, changes in estimates of the risk experience of the pension obligations, or differences between the actual and expected return on plan assets. HeidelbergCement records the actuarial gains and losses outside profit or loss in retained earnings through other comprehensive income in accordance with IAS 19.93A and shows these in the statement of comprehensive income. This method of presentation is one of three options permitted under IAS 19. According to HeidelbergCement’s assessment, this option produces the most eco-nomically meaningful representation of pension obligations. The corridor method also permitted under IAS 19 would smooth out the balance sheet values in comparison with the approach chosen by HeidelbergCement. The other option set out in IAS 19, which requires the actuarial gains and losses to be recognised in profit or loss, would make the income statement more volatile from year to year.
Gains and losses that have to be shown in profit or loss may arise from plan changes (curtailments or past service cost) or plan settlements. Curtailments and settlements have to be amortised immediately, while past service cost may be amortised over the period until they are vested.
other provisions are recognised in accordance with IAS 37 (Provisions, Contingent Liabilities and Con tingent Assets) if, as a result of past events, there are legal or constructive obligations towards third parties that are likely to lead to outflows of resources embodying economic benefits that can be reliably estimated. The pro-visions are calculated on the basis of the best estimate, taking into account all identifiable risks.
The capital market components of the Group-wide virtual stock option plan are accounted for as a cash-settled, share-based payment transaction in accordance with IFRS 2 (Share-based Payment). As at the reporting date, a provision is recognised pro rata temporis in the amount of the fair value of the payment obligation. Changes in the fair value are recognised in profit or loss. The fair value of the options is determined using a recognised option price model. Deferred tax assets and liabilities are recognised in accordance with the balance sheet liability method (IAS 12 Income Taxes). This means that, with the exception of goodwill arising on capital consolidation, deferred taxes are recognised for all temporary differences between the IFRS financial statements and the tax accounts regardless of the period of time within which these differences are likely to reverse. Furthermore, deferred tax assets are recognised on unused tax losses carried forward, to the extent that the probability of their recovery in subsequent years is sufficiently high. Deferred tax liabilities are considered in connection with undistributed profits from subsidiaries, joint ventures, and associates, unless HeidelbergCement is able to control the dividend policy of the companies and no dividend distribution or disposal is anticipated in the foreseeable future. The deferred taxes are measured using the rates of taxation that, as of the reporting date, are applicable or have been announced as applicable in the individual countries for the period when the deferred taxes are realised. Deferred tax assets and liabilities are offset if there is an enforceable right to set off current tax assets and liabilities and if they relate to income taxes levied by the same taxing authority
Con
solid
ated
fin
anci
al s
tate
men
tsA
ddit
iona
l inf
orm
atio
n
4
5
Com
bine
d m
anag
emen
t re
port
Cor
pora
te G
over
nanc
eC
onso
lidat
ed f
inan
cial
sta
tem
ents
Add
itio
nal i
nfor
mat
ion
To
our
shar
ehol
ders
2
3
4
5
1
Con
ten
ts
168 HeidelbergCement | Annual Report 2011
4
and the Group intends to settle its current tax assets and liabilities on a net basis. In principle, changes in the deferred taxes in the balance sheet lead to deferred tax expense or income. If circumstances that lead to a change in the deferred taxes are recognised outside profit or loss in other comprehensive income or directly in equity, the change in deferred taxes is also taken into account in other comprehensive income or directly in equity. If deferred taxes were formed via other income, they are also subsequently released via other comprehensive income.
A financial instrument is any contract that gives rise to a financial asset of one entity and a financial liabil-ity or equity instrument of another entity. The financial instruments include non-derivative and derivative financial instruments.
Non-derivative financial instruments are, in principle, measured at fair value when first recognised. These include non-current and current investments, loans and receivables granted, and financial liabilities.
Financial instruments classified as held for trading are measured at fair value through profit or loss.
Non-current and current investments that are categorised as available for sale in accordance with IAS 39 (Financial Instruments – Recognition and Measurement) are regularly measured at fair value if it can be reli-ably ascertained. This class of instruments is referred to, in the following, as investments available for sale at fair value. The unrealised gains and losses resulting from the subsequent measurement are recognised outside profit or loss in equity through other comprehensive income. The stock market price at the reporting date forms the basis of the fair value. If the fair values of investments available for sale at fair value fall below the cost and there is objective evidence of a significant or permanent impairment, the accumulated gains and losses previously recognised in equity are recognised directly in profit or loss. Investments in equity instruments, for which no listed price on an active market exists and whose fair values cannot be reliably determined with justifiable expense, are measured at cost. This class of instruments is referred to, in the following, as investments available for sale at cost. This concerns other participations that are not listed on the stock exchange. If there is objective evidence of a significant or permanent impairment, the impairment losses are recognised directly in profit or loss. The recognition of reversals of impairment in profit or loss for equity instruments held is not permitted.
Loans and receivables are measured at amortised cost, using the effective interest method if applicable, provided that they are not linked with hedging instruments. This concerns non-current, interest-bearing receivables, trade receivables, and other current operating receivables. In principle, the amortised cost in the case of current receivables corresponds to the nominal value or the redemption amount. If there is ob-jective evidence of impairment of the loans and receivables (e.g. significant financial difficulties or negative changes in the market environment of the debtor), impairment losses are recognised in profit or loss. For trade receivables, the impairment losses are recognised through the use of a provision for doubtful debts ac-count. A derecognition is booked as soon as a default of receivables occurs. Reversals are carried out if the reasons for the impairment losses no longer apply. In the reporting year, there were no financial assets (as in the previous year) whose terms have been changed which would otherwise have been overdue or impaired.
169HeidelbergCement | Annual Report 2011
CoNSoLIDATED FINANCIAL STATEMENTS
Consolidated income statement Consolidated statement of changes in equity
Consolidated statement of comprehensive income Segment reporting / Notes to the consolidated financial statements
Consolidated statement of cash flows Notes to the 2011 consolidated financial statements
Consolidated balance sheet Audit opinion | Responsibility statement
Non-derivative financial liabilities are recognised for the first time at the fair value of the consideration re-ceived or at the value of the cash received less transaction costs incurred, if applicable. These instruments are subsequently measured at amortised cost, using the effective interest method if applicable. This includes trade payables, other current operating liabilities, as well as current and non-current financial liabilities. Non-current financial liabilities are discounted. In principle, the amortised cost in the case of current financial liabilities corresponds to the nominal value or the redemption amount.
The Group has not yet made use of the possibility of designating non-derivative financial instruments, when first recognised, as financial instruments at fair value through profit or loss. All non-derivative financial in-struments are accounted for at the settlement date.
A derivative financial instrument is a contract whose value is dependent on a variable, which usually requires no initial net investment or an initial net investment that is smaller than would be required for other types of contracts that would be expected to have a similar response to changes in market factors, and which is settled at a later date. All derivative financial instruments are measured at fair value on the trade date when first recognised. The fair values are also relevant for the subsequent measurement. The fair value of traded derivative financial instruments corresponds to the market value. This value can be positive or negative. For derivative financial instruments, the fair value corresponds to the amount that HeidelbergCement would either receive or have to pay at the reporting date in the case of early termination of this financial instrument. This is calculated on the basis of the relevant exchange and interest rates on the reporting date. Average rates are used for the calculation.
In the HeidelbergCement Group, derivative financial instruments such as currency forwards, currency option contracts, interest rate swaps, or interest rate options are, in principle, used to minimise financial risks. The focus is on hedging interest, currency, and other market price risks. The market valuations are monitored regularly by the Group Treasury department. No derivative financial instruments are contracted or held for speculative purposes.
Contracts concluded for the purpose of receiving or supplying non-financial items in accordance with the company’s expected purchase, sale, or usage requirements and held as such (own use contracts) are accounted for as pending transactions rather than derivative financial instruments. Written options for the purchase or sale of non-financial items that can be cash settled are not classified as own use contracts.
Hybrid financial instruments consist of a non-derivative host contract and an embedded financial derivative. The two components are legally inseparable. These are usually contracts with riders. Separate accounting of the embedded derivative and the host contract is required if the economic characteristics and risks are not closely linked with the host contract, the embedded derivative fulfils the same definition criteria as a stand-alone derivative and the hybrid financial instrument is not measured at fair value through profit or loss. The contract of the hybrid financial instrument may also be measured in total at fair value through profit or loss unless the embedded derivative changes the resulting cash flows to an insignificant degree or separation of the embedded derivative is not permitted.
Hedge accounting denotes a specific accounting method that modifies the accounting of the hedged item and hedge of a hedging relationship so that the results of measuring the hedged item or hedge are recognised in the period incurred directly in equity or in profit or loss. Accordingly, hedge accounting is based on matching the offsetting values of the hedge and the hedged item.
Con
solid
ated
fin
anci
al s
tate
men
tsA
ddit
iona
l inf
orm
atio
n
4
5
Com
bine
d m
anag
emen
t re
port
Cor
pora
te G
over
nanc
eC
onso
lidat
ed f
inan
cial
sta
tem
ents
Add
itio
nal i
nfor
mat
ion
To
our
shar
ehol
ders
2
3
4
5
1
Con
ten
ts
170 HeidelbergCement | Annual Report 2011
4
For accounting purposes, three types of hedge exist in accordance with IAS 39, provided that the stringent conditions for hedge accounting are fulfilled in each individual case.
– Cash flow hedgesWhere necessary, HeidelbergCement hedges the risk of fluctuation in future cash flows. The risk of interest rate fluctuations in the case of variable interest is hedged by means of swaps that convert variable interest payments into fixed interest payments. This method is also used for hedging currency risks of transactions to be executed in foreign currency in the future. The market value of the derivatives used for hedging is shown in the balance sheet. As an offsetting item, the other components of equity are adjusted to the amount of the effective portion, taking deferred taxes into account. They are only recognised in profit or loss when the hedged future cash flows are realised. The ineffective portion is recognised directly in the profit or loss for the period.
– Fair value hedgesThe Group hedges against fluctuations in the fair value of assets or liabilities. In particular, the foreign ex-change risk that arises when financial instruments are accounted for in a currency other than the functional currency is hedged. In addition, the fair value of fixed interest-bearing liabilities is selectively hedged by means of conversion to variable interest. In the case of hedging against fluctuations in the fair value of certain balance sheet items (fair value hedges), both the hedge and the hedged share of the risk of the underlying transaction are recognised at fair value. Changes in fair value are recognised in profit or loss.
– Hedging a net investment in a foreign operationWhen acquiring foreign companies, the investment can, for example, be hedged with loans in the functional currency of the foreign company. In these cases, the currency risk arising on the subsidiary’s equity through fluctuations in exchange rates (translation risk) is designated as a hedged risk. The loans are translated using the exchange rate applicable at the reporting date. As an offsetting item, the foreign currency translation reserves in equity are adjusted. Consequently, translation differences are recognised outside profit or loss in equity through other comprehensive income until the net investment is sold, and are recognised in profit or loss on its disposal.
Derivative financial instruments for which no hedge accounting is used nevertheless represent an effective hedge in an economic sense within the context of the Group strategy. In accordance with IAS 39, these instruments are classified for accounting purposes as held for trading. The changes in the market values of these derivative financial instruments recognised in profit or loss are almost offset by changes in the market values of the hedged items.
Assets held for sale and discontinued operations are shown separately in the balance sheet if they can be sold in their present condition and the sale is highly probable. Assets classified as held for sale are recognised at the lower of their carrying amount and fair value less costs to sell. According to their classification, debts directly connected with these assets are shown separately on the liability side.
For discontinued operations, the profit after tax is shown in a separate line in the income statement. In the statement of cash flows, the cash flows are broken down into continuing and discontinued operations. Likewise, the discontinued operations are shown separately in the segment reporting. For discontinued operations, the previous year’s values in the income statement, the statement of cash flows, and the segment reporting are restated. The Notes include additional details on the assets held for sale and discontinued operations.
171HeidelbergCement | Annual Report 2011
CoNSoLIDATED FINANCIAL STATEMENTS
Consolidated income statement Consolidated statement of changes in equity
Consolidated statement of comprehensive income Segment reporting / Notes to the consolidated financial statements
Consolidated statement of cash flows Notes to the 2011 consolidated financial statements
Consolidated balance sheet Audit opinion | Responsibility statement
Contingent liabilities and assets are current or possible obligations or assets arising from past events and whose existence is due to the occurrence or non-occurrence of one or more uncertain future events that are not within the Group’s control. Contingent liabilities are recognised in the balance sheet at their fair value if they have been assumed as a result of a business combination. Contingent assets are only recognised in the balance sheet if they are virtually certain. Insofar as an outflow or inflow of economic benefits is possible, details of contingent liabilities and assets are provided in the Notes.
Finance leases, for which all risks and rewards incidental to ownership of the leased asset are transferred to the lessee, lead to capitalisation of the leased asset at the inception of the lease. The leased asset is re cog-nis ed at the lower of its fair value and the present value of the minimum lease payments. Lease payments are apportioned between the finance charge and the reduction of the outstanding liability so as to produce a constant rate of interest on the remaining balance of the liability over the term of the lease. The finance charge is recognised in profit or loss. Leased assets are depreciated over the useful life of the asset. If, however, there is insufficient certainty that the transfer of title to the Group will take place at the end of the lease term, the leased asset is depreciated fully over the shorter of the expected useful life and the lease term.
Lease payments for operating leases are recognised as an expense in the income statement over the lease term on a straight-line basis.
Income is recognised if it is sufficiently probable that the Group will receive future economic benefits that can be reliably determined. It is measured at the fair value of the consideration received; sales tax and other duties are not taken into account. Revenue is recognised as soon as the goods have been delivered and the risks and rewards have passed to the purchaser. Interest income is recognised pro rata temporis using the effective interest method. Dividend income is realised when the legal entitlement to payment arises.
Foreign currency translationThe financial statements of the Group’s foreign subsidiaries are translated into euro according to IAS 21 (The Effects of Changes in Foreign Exchange Rates) using the concept of functional currency. In general, for operating companies, the functional currency is that of the country in which the subsidiary is based, since all foreign subsidiaries are financially, economically, and organisationally independent in the conduct of their business. Assets and liabilities are translated using the closing rates at the reporting date, with equity, in contrast, using the historical exchange rates. The translation differences resulting from this are recognised outside profit or loss in other components of equity through other comprehensive income until the subsidiary is disposed of. The share of equity of the foreign associates is translated using the same method. Income and expenses are translated using average annual exchange rates.
Foreign currency transactions in the companies’ separate financial statements are recorded at the spot ex-change rate at the date of the transaction. Exchange gains or losses from the measurement of monetary items in foreign currency at the closing rate up to the reporting date are recognised in profit or loss. Exchange differences arising from foreign currency borrowings, to the extent that they are part of a net investment in a foreign operation, form an exception to recognition in profit or loss. They are part of a net investment in a foreign operation if settlement is neither planned nor likely to occur in the foreseeable future. Translation differences are recognised directly in equity through other comprehensive income until the net investment is sold and are not recognised in profit or loss until its disposal. Non-monetary items in foreign currency are recorded at historical exchange rates.
Con
solid
ated
fin
anci
al s
tate
men
tsA
ddit
iona
l inf
orm
atio
n
4
5
Com
bine
d m
anag
emen
t re
port
Cor
pora
te G
over
nanc
eC
onso
lidat
ed f
inan
cial
sta
tem
ents
Add
itio
nal i
nfor
mat
ion
To
our
shar
ehol
ders
2
3
4
5
1
Con
ten
ts
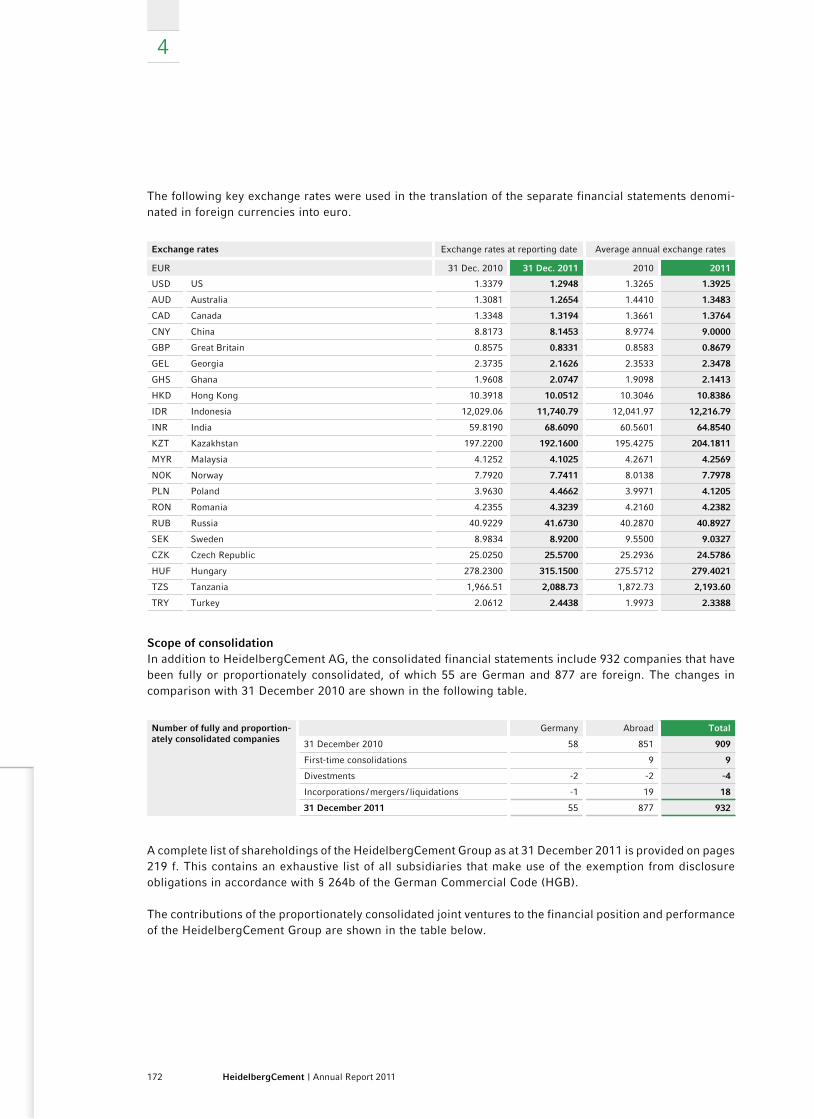
172 HeidelbergCement | Annual Report 2011
4
The following key exchange rates were used in the translation of the separate financial statements denomi-nated in foreign currencies into euro.
Exchange rates Exchange rates at reporting date Average annual exchange rates
EUR 31 Dec. 2010 31 Dec. 2011 2010 2011
USD US 1.3379 1.2948 1.3265 1.3925
AUD Australia 1.3081 1.2654 1.4410 1.3483
CAD Canada 1.3348 1.3194 1.3661 1.3764
CNY China 8.8173 8.1453 8.9774 9.0000
GBP Great Britain 0.8575 0.8331 0.8583 0.8679
GEL Georgia 2.3735 2.1626 2.3533 2.3478
GHS Ghana 1.9608 2.0747 1.9098 2.1413
HKD Hong Kong 10.3918 10.0512 10.3046 10.8386
IDR Indonesia 12,029.06 11,740.79 12,041.97 12,216.79
INR India 59.8190 68.6090 60.5601 64.8540
KZT Kazakhstan 197.2200 192.1600 195.4275 204.1811
MYR Malaysia 4.1252 4.1025 4.2671 4.2569
NOK Norway 7.7920 7.7411 8.0138 7.7978
PLN Poland 3.9630 4.4662 3.9971 4.1205
RON Romania 4.2355 4.3239 4.2160 4.2382
RUB Russia 40.9229 41.6730 40.2870 40.8927
SEK Sweden 8.9834 8.9200 9.5500 9.0327
CZK Czech Republic 25.0250 25.5700 25.2936 24.5786
HUF Hungary 278.2300 315.1500 275.5712 279.4021
TZS Tanzania 1,966.51 2,088.73 1,872.73 2,193.60
TRY Turkey 2.0612 2.4438 1.9973 2.3388
Scope of consolidationIn addition to HeidelbergCement AG, the consolidated financial statements include 932 companies that have been fully or proportionately consolidated, of which 55 are German and 877 are foreign. The changes in comparison with 31 December 2010 are shown in the following table.
Number of fully and proportion-ately consolidated companies
Germany Abroad Total
31 December 2010 58 851 909
First-time consolidations 9 9
Divestments -2 -2 -4
Incorporations / mergers / liquidations -1 19 18
31 December 2011 55 877 932
A complete list of shareholdings of the HeidelbergCement Group as at 31 December 2011 is provided on pages 219 f. This contains an exhaustive list of all subsidiaries that make use of the exemption from disclosure obligations in accordance with § 264b of the German Commercial Code (HGB).
The contributions of the proportionately consolidated joint ventures to the financial position and performance of the HeidelbergCement Group are shown in the table below.
173HeidelbergCement | Annual Report 2011
CoNSoLIDATED FINANCIAL STATEMENTS
Consolidated income statement Consolidated statement of changes in equity
Consolidated statement of comprehensive income Segment reporting / Notes to the consolidated financial statements
Consolidated statement of cash flows Notes to the 2011 consolidated financial statements
Consolidated balance sheet Audit opinion | Responsibility statement
Impact of proportionately consolidated joint ventures
€m
2010 2011
Balance sheet
Non-current assets 934.1 940.9
Current assets 335.1 506.8
1,269.2 1,447.7
Non-current liabilities 290.3 327.3
Current liabilities 270.1 449.2
560.4 776.5
Income statement
Revenue 967.9 1,158.8
Other income 85.3 51.9
Expenses -903.2 -1,117.9
Profit for the financial year 150.0 92.8
Statement of cash flows
Cash flow from operating activities 149.9 170.7
Cash flow from investing activities -55.9 -50.6
Cash flow from financing activities 13.5 2.4
Business combinations in the reporting yearIn order to expand its activities in the aggregates business line in the north of the Swedish capital, Stockholm, HeidelbergCement acquired 100% of the shares in Ledinge Fastighets AB, Rimbo, and its subsidiaries on 31 January 2011. The acquired group’s area of activity primarily comprises the operation of sand, gravel, and crushed stone pits. The goodwill of €6.1 million arising on the difference between the purchase price of €10.0 million and the provisionally measured net assets of €3.9 million represents growth prospects resulting from the improved market position. The purchase price was paid in cash. The transaction costs of €0.2 million were recognised in the income statement as additional ordinary expenses. The purchase price allocation has not yet been completed, as not all final valuation reports are yet available. The figure may be revised following the adjustment of the fair values of the intangible assets, property, plant, and equipment, and the deferred taxes applicable to these assets. The receivables recognised as at the acquisition date primarily include trade receivables and other short-term operating receivables with fair values amounting to €1.4 and €0.5 million respectively, which are expected to be fully recoverable.
To secure the aggregates reserves in the Melbourne metropolitan region, HeidelbergCement acquired 100% of the shares in Galli Quarries Pty Ltd, Bundoora, Australia, and its subsidiaries on 1 August 2011. The purchase price of €25.3 million was paid in cash. The provisionally measured net assets amount to €29.8 million. The difference between the purchase price and the provisionally measured net assets results from a bargain purchase and is shown in the additional ordinary income. The transaction costs of €0.2 million were recognised in the additional ordinary expenses. The purchase price allocation has not yet been completed, as not all final valuation reports are yet available. The figure may be revised following the adjustment of the fair values of the intangible assets, property, plant, and equipment, and deferred taxes. In connection with the business combination, HeidelbergCement acquired trade receivables with a gross value of €1.7 million, which are likely to be fully recoverable.
Con
solid
ated
fin
anci
al s
tate
men
tsA
ddit
iona
l inf
orm
atio
n
4
5
Com
bine
d m
anag
emen
t re
port
Cor
pora
te G
over
nanc
eC
onso
lidat
ed f
inan
cial
sta
tem
ents
Add
itio
nal i
nfor
mat
ion
To
our
shar
ehol
ders
2
3
4
5
1
Con
ten
ts
174 HeidelbergCement | Annual Report 2011
4
On 6 September 2011, HeidelbergCement acquired the operations of a limestone quarry in Barcelona, Spain, for a cash purchase price of €11.8 million as part of an asset deal to secure raw material reserves. An advance payment of €1.0 million on the purchase price was made in the previous year. The taxable goodwill of €3.6 million arising on the difference between the purchase price and the provisionally measured net assets of €8.2 million represents synergy effects in the ready-mixed concrete business. The transaction costs of €0.8 million were recognised in the additional ordinary expenses. The purchase price allocation has not yet been completed, as not all valuation reports are yet available. The figure may be revised following the adjustment of the fair values of the property, plant, and equipment.
The following table shows the provisional fair values of the identifiable assets and liabilities of the business combinations as at the acquisition date.
Preliminary fair values recognised as at the acquisition date
€m Sweden Australia Spain Total
Intangible assets 23.6 23.6
Property, plant and equipment 7.1 5.9 8.4 21.4
Inventories 1.2 0.2 1.4
Trade receivables 1.4 1.7 3.1
Cash and cash equivalents 0.4 0.1 0.5
Other assets 0.6 0.6
Total assets 10.7 31.5 8.4 50.6
Provisions 0.6 0.1 0.2 0.9
Liabilities 5.0 1.6 6.6
Deferred taxes 1.2 1.2
Total liabilities 6.8 1.7 0.2 8.7
Net assets 3.9 29.8 8.2 41.9
The acquired property, plant, and equipment relates to real estate and buildings (€9.1 million), technical equipment and machinery (€11.3 million), and advance payments (€1.0 million).
The following table shows the revenue and profit or loss of Ledinge Fastighets AB and Galli Quarries Pty Ltd since the acquisition date and the amounts that would have arisen if the companies had been fully consoli-dated on 1 January 2011.
Revenue and profit or loss
€m
Sweden Australia Total
Since acquisition date
Revenue 5.1 3.4 8.5
Profit or loss -0.5 1.5 1.0
Since 1 January 2011
Revenue 5.3 8.2 13.5
Profit or loss -0.6 4.3 3.7
The revenue and profit or loss of the acquired operation in Spain cannot be determined separately as the unit was integrated into the existing business following its acquisition.
HeidelbergCement also effected smaller business combinations in the 2011 financial year in the Asia-Pacific and Western and Northern Europe Group areas, which did not have a significant impact on the financial position and performance of the Group. In addition, in the North America Group area, HeidelbergCement acquired 50% of the shares in the joint venture Building Products & Concrete Supply Limited Partnership,
175HeidelbergCement | Annual Report 2011
CoNSoLIDATED FINANCIAL STATEMENTS
Consolidated income statement Consolidated statement of changes in equity
Consolidated statement of comprehensive income Segment reporting / Notes to the consolidated financial statements
Consolidated statement of cash flows Notes to the 2011 consolidated financial statements
Consolidated balance sheet Audit opinion | Responsibility statement
Winnipeg, Canada, in December 2011. The company is included proportionately in the consolidated financial statements in accordance with IAS 31 (Interests in Joint Ventures). The purchase price was €14.3 million, made up of a cash payment of €13.7 million and a liability of €0.6 million. The amount of €9.9 million arising from the difference between the purchase price and the provisionally measured proportionate net assets of €4.4 million was capitalised as goodwill. The following table shows the proportionate provisional fair values of the identifiable assets and liabilities of the company.
Preliminary fair values recog-nised as at the acquisition date
€m
Total
Non-current assets 3.3
Current assets 3.3
Cash and cash equivalents 2.0
Total assets 8.6
Non-current liabilities 0.5
Current liabilities 3.7
Total liabilities 4.2
Net assets 4.4
Divestments in the reporting yearOn 1 January 2011, the 50% proportionately consolidated Mibau Group sold all shares in the shipping partner ship MS “Splittnes” GmbH & Co. KG, Cadenberge, Germany, for €7.7 million. The purchase price was offset against a liability of €7.0 million; the remainder was paid in cash.
On 9 February 2011, HeidelbergCement disposed of all shares in the proportionately consolidated company Heidelberger Betonelemente GmbH & Co. KG (HDBB), Baden-Baden, Germany, for a sales price of €7.0 million, which was paid in cash.
On 5 September 2011, HeidelbergCement sold Solvent Resource Management Limited (SRM), Maidenhead, United Kingdom. The sales price of €13.2 million is made up of a cash payment of €12.6 million and a re-ceivable of €0.6 million.
On 30 November 2011, Hanson Precast (S) Pte Ltd., Singapore, was disposed of for €2.2 million. The sales price was paid in cash.
The (proportionate) assets and liabilities of the companies at the date of disposal are shown in the following table.
Assets and liabilities at date of disposal
€m HDBB MS “Splittnes” SRM Hanson Precast Total
Non-current assets 5.6 1.9 19.1 0.2 26.8
Current assets 7.6 0.1 12.0 2.8 22.5
Cash and cash equivalents 0.8 0.2 0.2 1.2
Total assets 13.2 2.8 31.3 3.2 50.5
Non-current liabilities 0.2 3.6 1.4 5.2
Current liabilities 4.3 0.2 7.0 1.1 12.6
Total liabilities 4.5 3.8 8.4 1.1 17.8
Net assets 8.7 -1.0 22.9 2.1 32.7
The gains and losses on disposals are shown in the additional ordinary result and explained in more detail in Note 7.
Con
solid
ated
fin
anci
al s
tate
men
tsA
ddit
iona
l inf
orm
atio
n
4
5
Com
bine
d m
anag
emen
t re
port
Cor
pora
te G
over
nanc
eC
onso
lidat
ed f
inan
cial
sta
tem
ents
Add
itio
nal i
nfor
mat
ion
To
our
shar
ehol
ders
2
3
4
5
1
Con
ten
ts
176 HeidelbergCement | Annual Report 2011
4
Business combinations in the previous yearOn 13 May 2010, HeidelbergCement acquired the remaining 50% of the shares in the joint venture Pioneer North Queensland Pty Ltd, thus further strengthening its activities in Australia. The purchase price amounted to €11.4 million and was paid in cash. The company was previously accounted for using the equity method. The fair value of the equity participation amounted to €11.4 million. The revaluation of the shareholding resulted in a loss of €1.1 million, which was recognised in the additional ordinary expenses. The goodwill of €8.4 million, which is not tax-deductible, reflects the synergy potential arising from the business combination. Transaction costs of €34,000 were recognised in the additional ordinary expenses. As part of the business combination, receivables with a fair value of €3.8 million were acquired. The gross value of the receivables is €4.3 million, of which €0.5 million is likely to be irrecoverable. The purchase price allocation has been completed. There have been no changes from the values published on 31 December 2010.
In order to expand cement production capacity in the Democratic Republic of Congo, HeidelbergCement acquired 55% of the shares in Cimenterie de Lukala S.A.R.L. (CILU), Kinshasa, and 70% of the shares in Interlacs S.A.R.L., Lubumbashi, from the Forrest Group on 15 September 2010. The purchase price of €62.2 million was paid in cash. The goodwill of €35.3 million, which is not tax-deductible, represents, in particular, the future market potential in the Democratic Republic of Congo. The non-controlling interests were measured at €21.6 million on the basis of their proportionate interest in the fair value of the identifiable net assets. As part of the acquisition, receivables with a fair value of €2.4 million were recognised. Their gross value amounts to €2.5 million. Of this total, €0.1 million is expected to be irrecoverable. The transaction costs amounted to €0.1 million and were recognised in the additional ordinary expenses. The purchase price allocation has been completed. Subsequent adjustments have had only an immaterial impact on the assets and liabilities.
As part of the expansion of the activities in Russia, HeidelbergCement acquired a total of 51% of the shares in CJSC “Construction Materials”, Sterlitamak, Russia, in several stages between 5 and 14 October 2010. The goodwill of €14.0 million, which is not tax-deductible, arising on the difference between the purchase price of €54.2 million and the proportionate net assets of €40.2 million represents the strategic potential of the state-of-the-art cement plant acquired, which is located in one of the most important investment regions of Russia. The purchase price is made up of a cash payment of €40.0 million and a purchase price liability with a present value of €14.2 million. The US$ purchase price liability amounts to a nominal €15.9 (US$22.5) million and is fixed in value. The cash outflow will take place in February 2013. The transaction costs of €0.7 million incurred in 2010 were recognised in the additional ordinary expenses. Transaction costs of €1.1 million occurring before 1 January 2010 were recognised directly in retained earnings. The non-controlling interests of €38.5 million were measured on the basis of their proportionate interest in the fair value of the identifiable net assets. The acquired receivables primarily include short-term trade receivables with a fair value of €1.1 million, calculated by deducting the receivables of €0.2 million expected to be irrecoverable from the gross value of €1.3 million. The purchase price allocation has been completed. Subsequent adjustments have had only an immaterial impact on the assets and liabilities.
The following table shows the final fair values of the assets and liabilities.
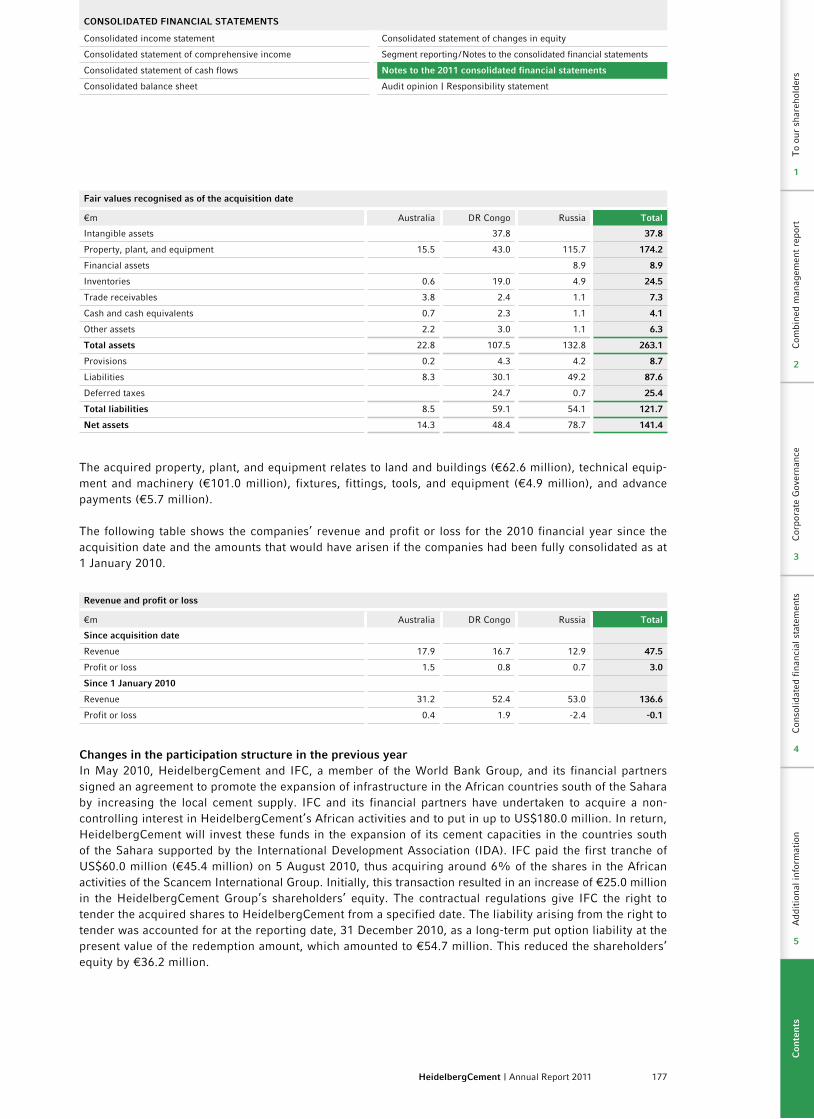
177HeidelbergCement | Annual Report 2011
CoNSoLIDATED FINANCIAL STATEMENTS
Consolidated income statement Consolidated statement of changes in equity
Consolidated statement of comprehensive income Segment reporting / Notes to the consolidated financial statements
Consolidated statement of cash flows Notes to the 2011 consolidated financial statements
Consolidated balance sheet Audit opinion | Responsibility statement
Fair values recognised as of the acquisition date
€m Australia DR Congo Russia Total
Intangible assets 37.8 37.8
Property, plant, and equipment 15.5 43.0 115.7 174.2
Financial assets 8.9 8.9
Inventories 0.6 19.0 4.9 24.5
Trade receivables 3.8 2.4 1.1 7.3
Cash and cash equivalents 0.7 2.3 1.1 4.1
Other assets 2.2 3.0 1.1 6.3
Total assets 22.8 107.5 132.8 263.1
Provisions 0.2 4.3 4.2 8.7
Liabilities 8.3 30.1 49.2 87.6
Deferred taxes 24.7 0.7 25.4
Total liabilities 8.5 59.1 54.1 121.7
Net assets 14.3 48.4 78.7 141.4
The acquired property, plant, and equipment relates to land and buildings (€62.6 million), technical equip-ment and machinery (€101.0 million), fixtures, fittings, tools, and equipment (€4.9 million), and advance payments (€5.7 million).
The following table shows the companies’ revenue and profit or loss for the 2010 financial year since the acquisition date and the amounts that would have arisen if the companies had been fully consolidated as at 1 January 2010.
Revenue and profit or loss
€m Australia DR Congo Russia Total
Since acquisition date
Revenue 17.9 16.7 12.9 47.5
Profit or loss 1.5 0.8 0.7 3.0
Since 1 January 2010
Revenue 31.2 52.4 53.0 136.6
Profit or loss 0.4 1.9 -2.4 -0.1
Changes in the participation structure in the previous year In May 2010, HeidelbergCement and IFC, a member of the World Bank Group, and its financial partners signed an agreement to promote the expansion of infrastructure in the African countries south of the Sahara by increasing the local cement supply. IFC and its financial partners have undertaken to acquire a non-controlling interest in HeidelbergCement’s African activities and to put in up to US$180.0 million. In return, HeidelbergCement will invest these funds in the expansion of its cement capacities in the countries south of the Sahara supported by the International Development Association (IDA). IFC paid the first tranche of US$60.0 million (€45.4 million) on 5 August 2010, thus acquiring around 6% of the shares in the African activities of the Scancem International Group. Initially, this transaction resulted in an increase of €25.0 million in the HeidelbergCement Group’s shareholders’ equity. The contractual regulations give IFC the right to tender the acquired shares to HeidelbergCement from a specified date. The liability arising from the right to tender was accounted for at the reporting date, 31 December 2010, as a long-term put option liability at the present value of the redemption amount, which amounted to €54.7 million. This reduced the shareholders’ equity by €36.2 million.
Con
solid
ated
fin
anci
al s
tate
men
tsA
ddit
iona
l inf
orm
atio
n
4
5
Com
bine
d m
anag
emen
t re
port
Cor
pora
te G
over
nanc
eC
onso
lidat
ed f
inan
cial
sta
tem
ents
Add
itio
nal i
nfor
mat
ion
To
our
shar
ehol
ders
2
3
4
5
1
Con
ten
ts
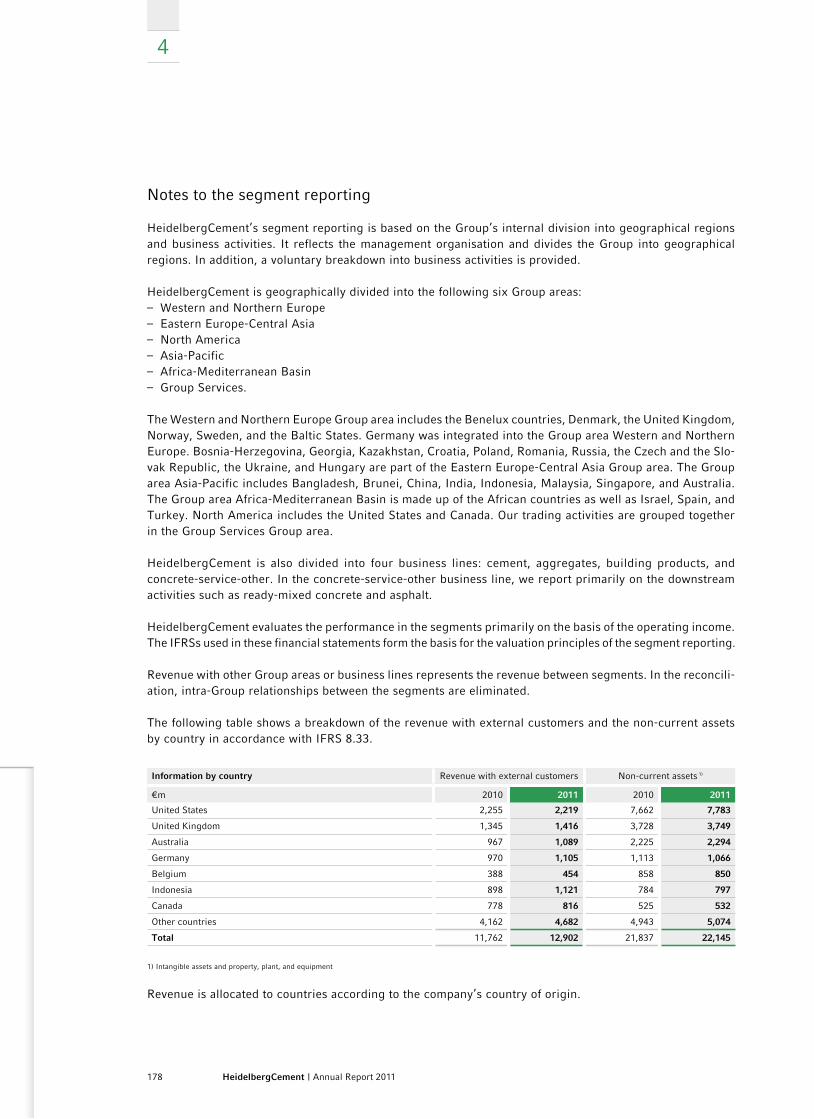
178 HeidelbergCement | Annual Report 2011
4
Notes to the segment reporting
HeidelbergCement’s segment reporting is based on the Group’s internal division into geographical regions and business activities. It reflects the management organisation and divides the Group into geographical regions. In addition, a voluntary breakdown into business activities is provided.
HeidelbergCement is geographically divided into the following six Group areas:– Western and Northern Europe– Eastern Europe-Central Asia– North America– Asia-Pacific– Africa-Mediterranean Basin– Group Services.
The Western and Northern Europe Group area includes the Benelux countries, Denmark, the United Kingdom, Norway, Sweden, and the Baltic States. Germany was integrated into the Group area Western and Northern Europe. Bosnia-Herzegovina, Georgia, Kazakhstan, Croatia, Poland, Romania, Russia, the Czech and the Slo-vak Republic, the Ukraine, and Hungary are part of the Eastern Europe-Central Asia Group area. The Group area Asia-Pacific includes Bangladesh, Brunei, China, India, Indonesia, Malaysia, Singapore, and Australia. The Group area Africa-Mediterranean Basin is made up of the African countries as well as Israel, Spain, and Turkey. North America includes the United States and Canada. Our trading activities are grouped together in the Group Services Group area.
HeidelbergCement is also divided into four business lines: cement, aggregates, building products, and concrete-service-other. In the concrete-service-other business line, we report primarily on the downstream activities such as ready-mixed concrete and asphalt.
HeidelbergCement evaluates the performance in the segments primarily on the basis of the operating income. The IFRSs used in these financial statements form the basis for the valuation principles of the segment reporting.
Revenue with other Group areas or business lines represents the revenue between segments. In the reconcili-ation, intra-Group relationships between the segments are eliminated.
The following table shows a breakdown of the revenue with external customers and the non-current assets by country in accordance with IFRS 8.33.
Information by country Revenue with external customers Non-current assets 1)
€m 2010 2011 2010 2011
United States 2,255 2,219 7,662 7,783
United Kingdom 1,345 1,416 3,728 3,749
Australia 967 1,089 2,225 2,294
Germany 970 1,105 1,113 1,066
Belgium 388 454 858 850
Indonesia 898 1,121 784 797
Canada 778 816 525 532
Other countries 4,162 4,682 4,943 5,074
Total 11,762 12,902 21,837 22,145
1) Intangible assets and property, plant, and equipment
Revenue is allocated to countries according to the company’s country of origin.
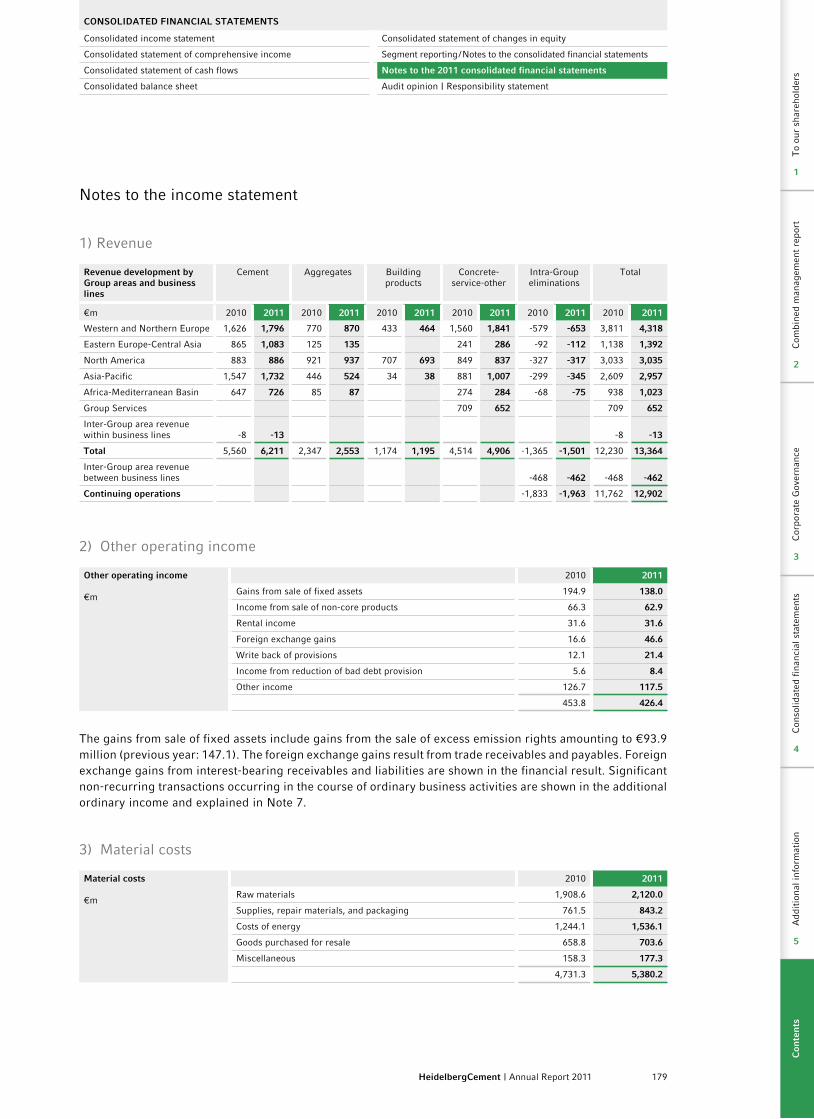
179HeidelbergCement | Annual Report 2011
CoNSoLIDATED FINANCIAL STATEMENTS
Consolidated income statement Consolidated statement of changes in equity
Consolidated statement of comprehensive income Segment reporting / Notes to the consolidated financial statements
Consolidated statement of cash flows Notes to the 2011 consolidated financial statements
Consolidated balance sheet Audit opinion | Responsibility statement
Notes to the income statement
1) Revenue
Revenue development by Group areas and business lines
Cement Aggregates Building products
Concrete-service-other
Intra-Group eliminations
Total
€m 2010 2011 2010 2011 2010 2011 2010 2011 2010 2011 2010 2011
Western and Northern Europe 1,626 1,796 770 870 433 464 1,560 1,841 -579 -653 3,811 4,318
Eastern Europe-Central Asia 865 1,083 125 135 241 286 -92 -112 1,138 1,392
North America 883 886 921 937 707 693 849 837 -327 -317 3,033 3,035
Asia-Pacific 1,547 1,732 446 524 34 38 881 1,007 -299 -345 2,609 2,957
Africa-Mediterranean Basin 647 726 85 87 274 284 -68 -75 938 1,023
Group Services 709 652 709 652
Inter-Group area revenue within business lines -8 -13 -8 -13
Total 5,560 6,211 2,347 2,553 1,174 1,195 4,514 4,906 -1,365 -1,501 12,230 13,364
Inter-Group area revenue between business lines -468 -462 -468 -462
Continuing operations -1,833 -1,963 11,762 12,902
2) Other operating income
other operating income
€m
2010 2011
Gains from sale of fixed assets 194.9 138.0
Income from sale of non-core products 66.3 62.9
Rental income 31.6 31.6
Foreign exchange gains 16.6 46.6
Write back of provisions 12.1 21.4
Income from reduction of bad debt provision 5.6 8.4
Other income 126.7 117.5
453.8 426.4
The gains from sale of fixed assets include gains from the sale of excess emission rights amounting to €93.9 million (previous year: 147.1). The foreign exchange gains result from trade receivables and payables. Foreign exchange gains from interest-bearing receivables and liabilities are shown in the financial result. Significant non-recurring transactions occurring in the course of ordinary business activities are shown in the additional ordinary income and explained in Note 7.
3) Material costs
Material costs
€m
2010 2011
Raw materials 1,908.6 2,120.0
Supplies, repair materials, and packaging 761.5 843.2
Costs of energy 1,244.1 1,536.1
Goods purchased for resale 658.8 703.6
Miscellaneous 158.3 177.3
4,731.3 5,380.2
Con
solid
ated
fin
anci
al s
tate
men
tsA
ddit
iona
l inf
orm
atio
n
4
5
Com
bine
d m
anag
emen
t re
port
Cor
pora
te G
over
nanc
eC
onso
lidat
ed f
inan
cial
sta
tem
ents
Add
itio
nal i
nfor
mat
ion
To
our
shar
ehol
ders
2
3
4
5
1
Con
ten
ts
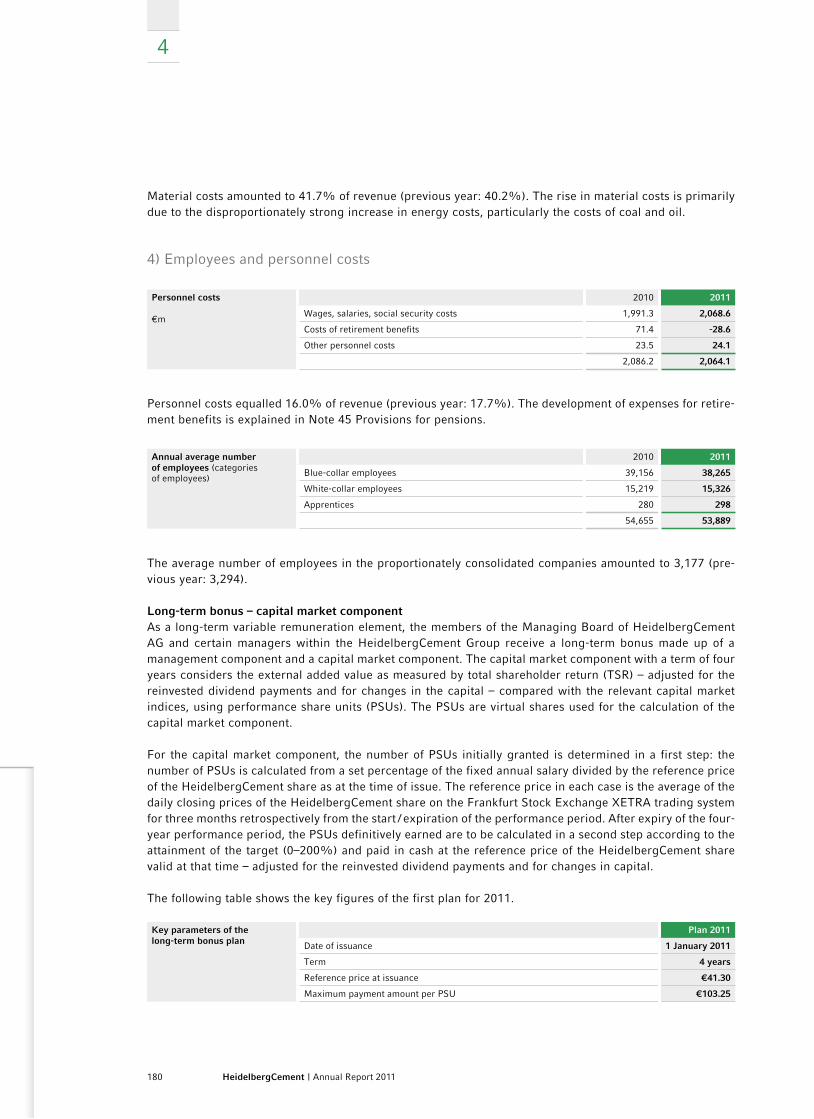
180 HeidelbergCement | Annual Report 2011
4
Material costs amounted to 41.7% of revenue (previous year: 40.2%). The rise in material costs is primarily due to the disproportionately strong increase in energy costs, particularly the costs of coal and oil.
4) Employees and personnel costs
Personnel costs
€m
2010 2011
Wages, salaries, social security costs 1,991.3 2,068.6
Costs of retirement benefits 71.4 -28.6
Other personnel costs 23.5 24.1
2,086.2 2,064.1
Personnel costs equalled 16.0% of revenue (previous year: 17.7%). The development of expenses for retire-ment benefits is explained in Note 45 Provisions for pensions.
Annual average number of employees (categories of employees)
2010 2011
Blue-collar employees 39,156 38,265
White-collar employees 15,219 15,326
Apprentices 280 298
54,655 53,889
The average number of employees in the proportionately consolidated companies amounted to 3,177 (pre-vious year: 3,294).
Long-term bonus – capital market componentAs a long-term variable remuneration element, the members of the Managing Board of HeidelbergCement AG and certain managers within the HeidelbergCement Group receive a long-term bonus made up of a management component and a capital market component. The capital market component with a term of four years considers the external added value as measured by total shareholder return (TSR) – adjusted for the reinvested dividend payments and for changes in the capital – compared with the relevant capital market indices, using performance share units (PSUs). The PSUs are virtual shares used for the calculation of the capital market component.
For the capital market component, the number of PSUs initially granted is determined in a first step: the number of PSUs is calculated from a set percentage of the fixed annual salary divided by the reference price of the HeidelbergCement share as at the time of issue. The reference price in each case is the average of the daily closing prices of the HeidelbergCement share on the Frankfurt Stock Exchange XETRA trading system for three months retrospectively from the start / expiration of the performance period. After expiry of the four-year performance period, the PSUs definitively earned are to be calculated in a second step according to the attainment of the target (0–200%) and paid in cash at the reference price of the HeidelbergCement share valid at that time – adjusted for the reinvested dividend payments and for changes in capital.
The following table shows the key figures of the first plan for 2011.
Key parameters of the long-term bonus plan
Plan 2011
Date of issuance 1 January 2011
Term 4 years
Reference price at issuance €41.30
Maximum payment amount per PSU €103.25

181HeidelbergCement | Annual Report 2011
CoNSoLIDATED FINANCIAL STATEMENTS
Consolidated income statement Consolidated statement of changes in equity
Consolidated statement of comprehensive income Segment reporting / Notes to the consolidated financial statements
Consolidated statement of cash flows Notes to the 2011 consolidated financial statements
Consolidated balance sheet Audit opinion | Responsibility statement
The reconciliation of the number of PSUs from 1 January 2011 to 31 December 2011 is shown in the follow-ing table.
Number of PSus Plan 2011
Granted as of 1 January 2011
Additions 151,169
Disposals -3,430
Granted as of 31 December 2011 147,739
For accounting in accordance with IFRS 2 (Share-based Payment), the fair value of the PSUs is calculated using a recognised option price model. A large number of different development paths for the HeidelbergCement share – taking into account the effects of reinvested dividends – and the benchmark indices are simulated (Monte Carlo simulation). As at the reporting date, the benchmark index DAX 30 had 5,898 points and the benchmark index MSCI World Construction Materials 117.9 points. The measurement parameters are shown in the table below.
Measurement parameters Plan 2011
Fair value as of 31 December 2011 21.26 €
Expected dividend yield 8%
Share price at 31 December 2011 32.79 €
Volatility of HeidelbergCement share 1) 42%
Volatility of the MSCI World Construction Materials Index 1) 33%
Volatility of the DAX 30 Index 1) 24%
Correlation between the HeidelbergCement share and the MSCI World Construction Materials Index 1) 93%
Correlation between the HeidelbergCement share and the DAX 30 Index 1) 71%
Correlation between the DAX 30 Index and the MSCI World Construction Materials Index 1) 52%
1) Average over the last two years
As at the reporting date, the provision recognised via the personnel costs amounted to €0.8 million. The capital market component of the long-term bonus plan 2011–2013/14 is paid after the Annual General Meeting 2015, i.e. in the year following the four-year performance period.
5) Other operating expenses
other operating expenses
€m
2010 2011
Selling and administrative expenses 886.8 899.2
Freight 1,182.2 1,378.0
Expenses for third party repairs and services 832.5 977.5
Rental and leasing expenses 155.1 174.8
Other taxes 38.0 44.6
Foreign exchange losses 27.8 48.7
Other expenses 46.4 78.7
3,168.8 3,601.5
The foreign exchange losses result from trade receivables and payables. Foreign exchange losses from interest-bearing receivables and liabilities are shown in the financial result.
Con
solid
ated
fin
anci
al s
tate
men
tsA
ddit
iona
l inf
orm
atio
n
4
5
Com
bine
d m
anag
emen
t re
port
Cor
pora
te G
over
nanc
eC
onso
lidat
ed f
inan
cial
sta
tem
ents
Add
itio
nal i
nfor
mat
ion
To
our
shar
ehol
ders
2
3
4
5
1
Con
ten
ts

182 HeidelbergCement | Annual Report 2011
4
The other expenses include expenses connected with emission rights acquired for consideration amount-ing to €33.2 million (previous year: 0.4). Expenses of €78.9 million (previous year: 67.6) for research and development are not capitalised according to the conditions stated in IAS 38 (Intangible Assets). Significant non-recurring transactions occurring in the course of ordinary business activities are shown in the additional ordinary expenses and explained in Note 7.
6) Amortisation and depreciation of intangible assets and property, plant, and equipment
Scheduled amortisation and depreciation of intangible assets and property, plant, and equipment is determined on the basis of the following Group-wide useful lives:
useful lives Years
Standard software 3
SAP applications 3 to 5
Buildings 20 to 40
Technical equipment and machinery 10 to 20
Plant and office equipment 5 to 10
IT hardware 4 to 5
Amortisation of intangible assets includes expenses from the devaluation of emission rights as a result of reduced market prices amounting to €52.8 million (previous year: 7.9).
Impairment is shown in the additional ordinary expenses and explained in Note 7.
7) Additional ordinary result
The additional ordinary result includes transactions which, although occurring in the course of ordinary business activities, are not shown in operating income because they are non-recurring.
Additional ordinary result
€m
2010 2011
Additional ordinary income
Gains from the disposal of subsidiaries and other business units 1.2 2.2
Gains from the disposal of other non-current assets 0.3 23.7
Reversal of impairment losses 4.4 0.9
Other non-recurring income 26.1 5.2
32.0 32.0
Additional ordinary expenses
Losses from the disposal of subsidiaries and other business units -1.8 -17.7
Impairment of goodwill -23.6 -32.3
Impairment of other intangible assets and property, plant, and equipment -29.8 -57.7
Restructuring expenses -47.1 -48.3
Other non-recurring expenses -31.9 -21.5
-134.2 -177.5
-102.2 -145.4
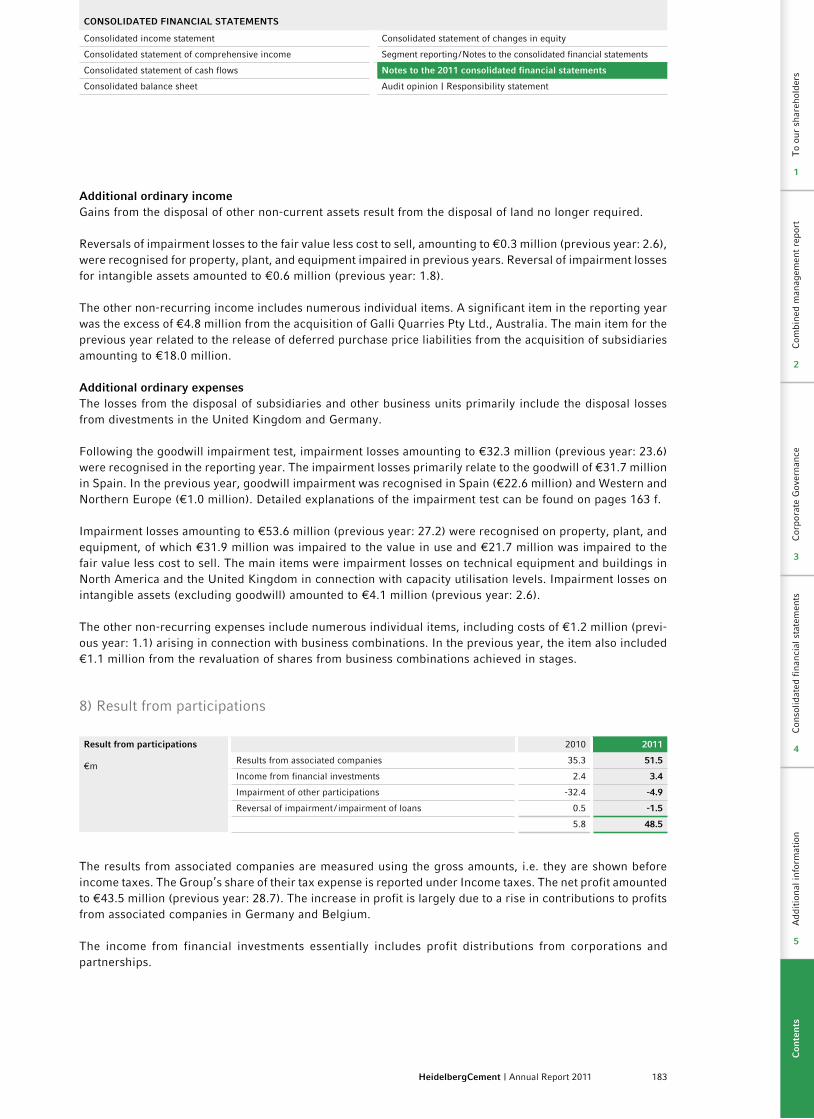
183HeidelbergCement | Annual Report 2011
CoNSoLIDATED FINANCIAL STATEMENTS
Consolidated income statement Consolidated statement of changes in equity
Consolidated statement of comprehensive income Segment reporting / Notes to the consolidated financial statements
Consolidated statement of cash flows Notes to the 2011 consolidated financial statements
Consolidated balance sheet Audit opinion | Responsibility statement
Additional ordinary incomeGains from the disposal of other non-current assets result from the disposal of land no longer required.
Reversals of impairment losses to the fair value less cost to sell, amounting to €0.3 million (previous year: 2.6), were recognised for property, plant, and equipment impaired in previous years. Reversal of impairment losses for intangible assets amounted to €0.6 million (previous year: 1.8).
The other non-recurring income includes numerous individual items. A significant item in the reporting year was the excess of €4.8 million from the acquisition of Galli Quarries Pty Ltd., Australia. The main item for the previous year related to the release of deferred purchase price liabilities from the acquisition of subsidiaries amounting to €18.0 million.
Additional ordinary expensesThe losses from the disposal of subsidiaries and other business units primarily include the disposal losses from divestments in the United Kingdom and Germany.
Following the goodwill impairment test, impairment losses amounting to €32.3 million (previous year: 23.6) were recognised in the reporting year. The impairment losses primarily relate to the goodwill of €31.7 million in Spain. In the previous year, goodwill impairment was recognised in Spain (€22.6 million) and Western and Northern Europe (€1.0 million). Detailed explanations of the impairment test can be found on pages 163 f.
Impairment losses amounting to €53.6 million (previous year: 27.2) were recognised on property, plant, and equipment, of which €31.9 million was impaired to the value in use and €21.7 million was impaired to the fair value less cost to sell. The main items were impairment losses on technical equipment and buildings in North America and the United Kingdom in connection with capacity utilisation levels. Impairment losses on intangible assets (excluding goodwill) amounted to €4.1 million (previous year: 2.6).
The other non-recurring expenses include numerous individual items, including costs of €1.2 million (previ-ous year: 1.1) arising in connection with business combinations. In the previous year, the item also included €1.1 million from the revaluation of shares from business combinations achieved in stages.
8) Result from participations
Result from participations
€m
2010 2011
Results from associated companies 35.3 51.5
Income from financial investments 2.4 3.4
Impairment of other participations -32.4 -4.9
Reversal of impairment / impairment of loans 0.5 -1.5
5.8 48.5
The results from associated companies are measured using the gross amounts, i.e. they are shown before income taxes. The Group’s share of their tax expense is reported under Income taxes. The net profit amounted to €43.5 million (previous year: 28.7). The increase in profit is largely due to a rise in contributions to profits from associated companies in Germany and Belgium.
The income from financial investments essentially includes profit distributions from corporations and partner ships.
Con
solid
ated
fin
anci
al s
tate
men
tsA
ddit
iona
l inf
orm
atio
n
4
5
Com
bine
d m
anag
emen
t re
port
Cor
pora
te G
over
nanc
eC
onso
lidat
ed f
inan
cial
sta
tem
ents
Add
itio
nal i
nfor
mat
ion
To
our
shar
ehol
ders
2
3
4
5
1
Con
ten
ts
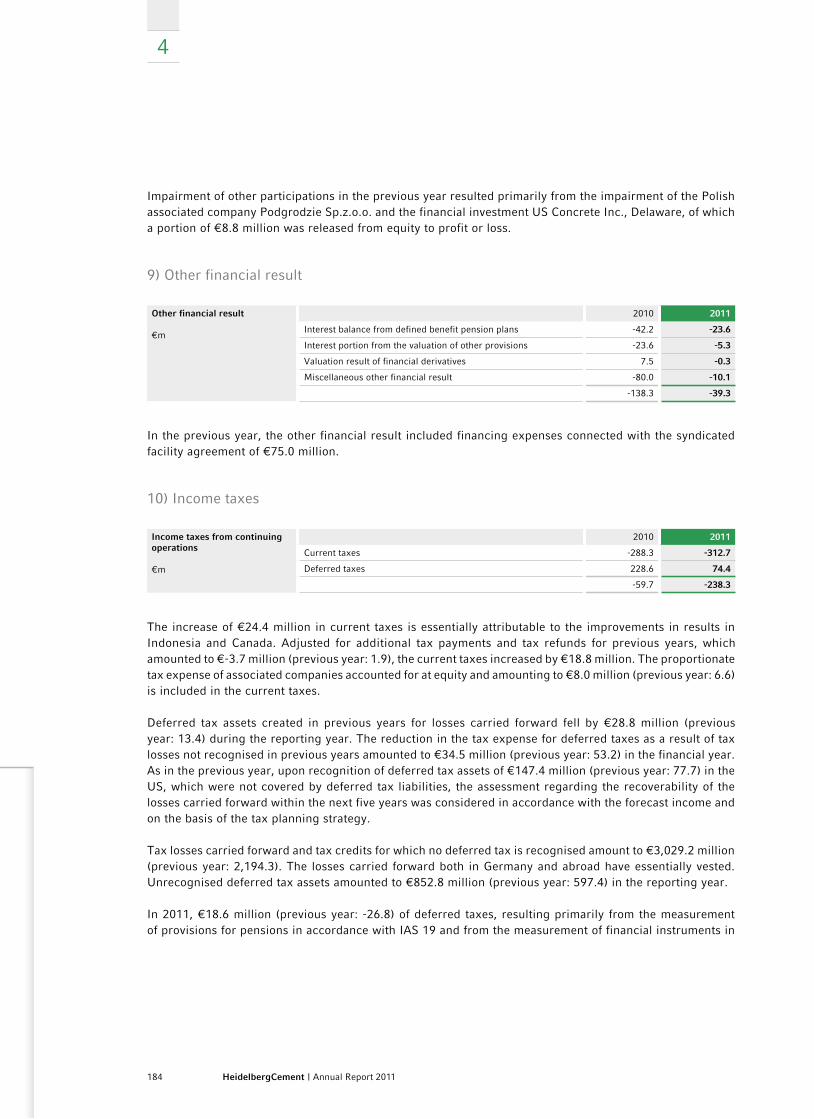
184 HeidelbergCement | Annual Report 2011
4
Impairment of other participations in the previous year resulted primarily from the impairment of the Polish associated company Podgrodzie Sp.z.o.o. and the financial investment US Concrete Inc., Delaware, of which a portion of €8.8 million was released from equity to profit or loss.
9) Other financial result
other financial result
€m
2010 2011
Interest balance from defined benefit pension plans -42.2 -23.6
Interest portion from the valuation of other provisions -23.6 -5.3
Valuation result of financial derivatives 7.5 -0.3
Miscellaneous other financial result -80.0 -10.1
-138.3 -39.3
In the previous year, the other financial result included financing expenses connected with the syndicated facility agreement of €75.0 million.
10) Income taxes
Income taxes from continuing operations
€m
2010 2011
Current taxes -288.3 -312.7
Deferred taxes 228.6 74.4
-59.7 -238.3
The increase of €24.4 million in current taxes is essentially attributable to the improvements in results in Indonesia and Canada. Adjusted for additional tax payments and tax refunds for previous years, which amounted to €-3.7 million (previous year: 1.9), the current taxes increased by €18.8 million. The proportionate tax expense of associated companies accounted for at equity and amounting to €8.0 million (previous year: 6.6) is included in the current taxes.
Deferred tax assets created in previous years for losses carried forward fell by €28.8 million (previous year: 13.4) during the reporting year. The reduction in the tax expense for deferred taxes as a result of tax losses not recognised in previous years amounted to €34.5 million (previous year: 53.2) in the financial year. As in the previous year, upon recognition of deferred tax assets of €147.4 million (previous year: 77.7) in the US, which were not covered by deferred tax liabilities, the assessment regarding the recoverability of the losses carried forward within the next five years was considered in accordance with the forecast income and on the basis of the tax planning strategy.
Tax losses carried forward and tax credits for which no deferred tax is recognised amount to €3,029.2 million (previous year: 2,194.3). The losses carried forward both in Germany and abroad have essentially vested. Unrecognised deferred tax assets amounted to €852.8 million (previous year: 597.4) in the reporting year.
In 2011, €18.6 million (previous year: -26.8) of deferred taxes, resulting primarily from the measurement of provisions for pensions in accordance with IAS 19 and from the measurement of financial instruments in
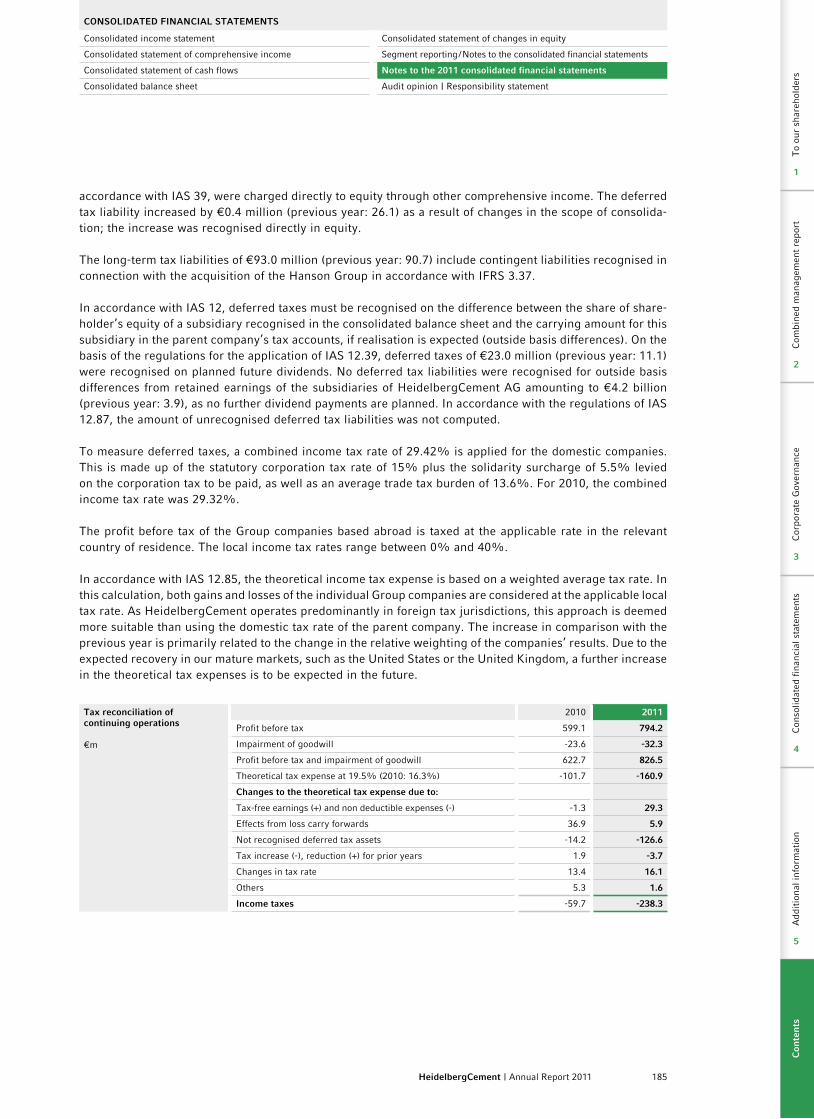
185HeidelbergCement | Annual Report 2011
CoNSoLIDATED FINANCIAL STATEMENTS
Consolidated income statement Consolidated statement of changes in equity
Consolidated statement of comprehensive income Segment reporting / Notes to the consolidated financial statements
Consolidated statement of cash flows Notes to the 2011 consolidated financial statements
Consolidated balance sheet Audit opinion | Responsibility statement
accordance with IAS 39, were charged directly to equity through other comprehensive income. The deferred tax liability increased by €0.4 million (previous year: 26.1) as a result of changes in the scope of consolida-tion; the increase was recognised directly in equity.
The long-term tax liabilities of €93.0 million (previous year: 90.7) include contingent liabilities recognised in connection with the acquisition of the Hanson Group in accordance with IFRS 3.37.
In accordance with IAS 12, deferred taxes must be recognised on the difference between the share of share-holder’s equity of a subsidiary recognised in the consolidated balance sheet and the carrying amount for this subsidiary in the parent company’s tax accounts, if realisation is expected (outside basis differences). On the basis of the regulations for the application of IAS 12.39, deferred taxes of €23.0 million (previous year: 11.1) were recognised on planned future dividends. No deferred tax liabilities were recognised for outside basis differences from retained earnings of the subsidiaries of HeidelbergCement AG amounting to €4.2 billion (previous year: 3.9), as no further dividend payments are planned. In accordance with the regulations of IAS 12.87, the amount of unrecognised deferred tax liabilities was not computed.
To measure deferred taxes, a combined income tax rate of 29.42% is applied for the domestic companies. This is made up of the statutory corporation tax rate of 15% plus the solidarity surcharge of 5.5% levied on the corporation tax to be paid, as well as an average trade tax burden of 13.6%. For 2010, the combined income tax rate was 29.32%.
The profit before tax of the Group companies based abroad is taxed at the applicable rate in the relevant country of residence. The local income tax rates range between 0% and 40%.
In accordance with IAS 12.85, the theoretical income tax expense is based on a weighted average tax rate. In this calculation, both gains and losses of the individual Group companies are considered at the applicable local tax rate. As HeidelbergCement operates predominantly in foreign tax jurisdictions, this approach is deemed more suitable than using the domestic tax rate of the parent company. The increase in comparison with the previous year is primarily related to the change in the relative weighting of the companies’ results. Due to the expected recovery in our mature markets, such as the United States or the United Kingdom, a further increase in the theoretical tax expenses is to be expected in the future.
Tax reconciliation of continuing operations
€m
2010 2011
Profit before tax 599.1 794.2
Impairment of goodwill -23.6 -32.3
Profit before tax and impairment of goodwill 622.7 826.5
Theoretical tax expense at 19.5% (2010: 16.3%) -101.7 -160.9
Changes to the theoretical tax expense due to:
Tax-free earnings (+) and non deductible expenses (-) -1.3 29.3
Effects from loss carry forwards 36.9 5.9
Not recognised deferred tax assets -14.2 -126.6
Tax increase (-), reduction (+) for prior years 1.9 -3.7
Changes in tax rate 13.4 16.1
Others 5.3 1.6
Income taxes -59.7 -238.3
Con
solid
ated
fin
anci
al s
tate
men
tsA
ddit
iona
l inf
orm
atio
n
4
5
Com
bine
d m
anag
emen
t re
port
Cor
pora
te G
over
nanc
eC
onso
lidat
ed f
inan
cial
sta
tem
ents
Add
itio
nal i
nfor
mat
ion
To
our
shar
ehol
ders
2
3
4
5
1
Con
ten
ts

186 HeidelbergCement | Annual Report 2011
4
Deferred tax by type of temporary difference
€m
2010 2011
Deferred tax assets
Fixed assets 72.2 83.0
Other assets 54.2 60.2
Provisions and liabilities 658.4 658.0
Carry forward of unused tax losses and tax credits 535.5 564.7
Gross amount 1,320.3 1,365.9
Netting -964.5 -986.7
355.8 379.2
Deferred tax liabilities
Fixed assets 1,576.7 1,528.5
Other assets 15.0 18.5
Provisions and liabilities 196.6 194.1
Gross amount 1,788.3 1,741.0
Netting -964.5 -986.7
823.8 754.3
11) Discontinued operations
The following table shows the composition of the results from discontinued operations.
Net loss from discontinued operations
€m
2010 2011
Expenses -44.1 -26.8
Income taxes 15.6 5.1
Net loss from discontinued operations -28.4 -21.7
The results include expenses incurred in connection with operations of the Hanson Group discontinued in previous years and which result essentially from provisions for damages and environmental obligations. Further details on the obligations are provided in Note 46 Other provisions. In the previous year, expenses in connection with maxit Group, disposed of in 2008, were also included.
12) Proposed dividend
The Managing Board and Supervisory Board propose the following dividend: €0.35 per share. Based on 187,500,000 no-par value shares, entitled to participate in dividends for the 2011 financial year, the amount for dividend payment is €65,625,000 (previous year: 46,875,000).
13) Earnings per share
Earnings per share
€m
2010 2011
Profit for the financial year 510.9 534.2
Non-controlling interests 168.2 186.1
Group share of profit 342.7 348.1
Number of shares in '000s (weighted average) 187,500 187,500
Earnings per share in € 1.83 1.86
Net income from continuing operations – attributable to the parent entity 371.1 369.8
Earnings per share in € – continuing operations 1.98 1.97
Net loss from discontinued operations – attributable to the parent entity -28.4 -21.7
Loss per share in € – discontinued operations -0.15 -0.11
187HeidelbergCement | Annual Report 2011
CoNSoLIDATED FINANCIAL STATEMENTS
Consolidated income statement Consolidated statement of changes in equity
Consolidated statement of comprehensive income Segment reporting / Notes to the consolidated financial statements
Consolidated statement of cash flows Notes to the 2011 consolidated financial statements
Consolidated balance sheet Audit opinion | Responsibility statement
The basic earnings per share are calculated in accordance with IAS 33 (Earnings per Share), by dividing the Group share of profit for the financial year by the weighted average of the number of issued shares. The diluted earnings per share indicator takes into account not only currently issued shares but also shares poten tially available through option rights. The earnings per share were not diluted in the reporting period in accordance with IAS 33.30.
Notes to the statement of cash flows
The statement of cash flows shows how the Group’s cash and cash equivalents changed through inflows and outflows during the reporting year. In accordance with IAS 7 (Statement of Cash Flows), a distinction is made between cash flows from operating, investing, and financing activities. The changes in the relevant balance sheet items cannot be directly derived from the consolidated balance sheet, as non-cash transactions – such as effects arising from foreign currency translation and changes in the consolidation scope – are adjusted.
The cash flow is calculated as net income from continuing operations adjusted for income taxes, net interest, depreciation, amortisation, impairment losses, and other non-cash items. Cash flows from dividends received from non-consolidated companies, from interest received and paid, and from taxes paid are also recognised. Changes in working capital and decrease in provisions through cash payments are taken into account when determining the cash flow from operating activities.
Cash flows from the acquisition or sale of intangible assets as well as property, plant, and equipment and financial assets are recognised in the cash flow from investing activities. If these relate to the acquisition or disposal of subsidiaries or other business units (gain or loss of control), the effects on the statement of cash flows are shown in separate items.
The cash flow from financing activities mainly results from changes in capital and dividend payments, as well as proceeds from and repayments of bonds and loans. In addition, cash flows from changes in ownership interests in subsidiaries that do not result in a loss of control are classified as financing activities.
The cash flows from foreign Group companies shown in the statement are generally translated into euro using the average annual exchange rates. By contrast, cash is translated using the exchange rate at year end, as in the consolidated balance sheet. The effects of exchange rate changes on cash are shown separately.
The significant individual items in the statement of cash flows are explained below.
14) Interest received
The decline of €29.7 million in interest received to €168.3 million (previous year: 198.0) is primarily due to a decrease in special items from the settlement of interest rate swaps. In the reporting year, these items led to a cash inflow of €71.2 million (previous year: 93.4).
15) Interest paid
Interest payments fell by €174.1 million to €624.3 million (previous year: 798.4). This is primarily attributable to reduced refinancing costs.
Con
solid
ated
fin
anci
al s
tate
men
tsA
ddit
iona
l inf
orm
atio
n
4
5
Com
bine
d m
anag
emen
t re
port
Cor
pora
te G
over
nanc
eC
onso
lidat
ed f
inan
cial
sta
tem
ents
Add
itio
nal i
nfor
mat
ion
To
our
shar
ehol
ders
2
3
4
5
1
Con
ten
ts
188 HeidelbergCement | Annual Report 2011
4
16) Taxes paid
The increase of €155.5 million in taxes paid to €308.4 million (previous year: 152.9) relates primarily to the one-off effect of tax refunds in North America amounting to €112.6 million included in the first quarter of the previous year.
17) Elimination of other non-cash items
The other non-cash items mainly include additions to and releases of provisions. Furthermore, the profits were adjusted for the book profits and losses from fixed asset disposals. The total amount earned from these disposals is shown under divestments in investing activities.
18) Changes in operating assets
Operating assets consist of inventories, trade receivables, and other assets used in operating activities.
19) Changes in operating liabilities
Operating liabilities include trade payables and other liabilities from operating activities.
20) Decrease in provisions through cash payments
This item includes the cash outflow of provisions for pensions and other provisions.
21) Investments (cash outflow)
The payments for investments differ from additions in the fixed-asset movement schedule, which shows, for example, non-cash items as additions, e.g. additions in connection with exchange transactions or contribu-tions in kind.
Of the total cash flow investments of €959.2 million (previous year: 871.6), €496.3 million (previous year: 466.7) related to measures for sustaining and optimising capacity and €462.9 million (previous year: 404.9) to capacity expansions.
Investments in intangible assets and property, plant, and equipment amounted to €874.4 million (previous year: 734.0) and concerned maintenance, optimisation, and environmental protection measures at our pro-duction sites, as well as expansion projects in growth markets.
Expenditure for the acquisition of subsidiaries and other business units totalled €63.2 million (previous year: 113.9) and related mainly to the acquisitions listed below:– 100% of the shares in Ledinge Fastighets AB, Sweden, and its subsidiaries for €10.0 million in cash,– 100% of the shares in Galli Quarries Pty Ltd, Australia, and its subsidiaries for €25.3 million in cash,– 50% of the shares in Building Products & Concrete Supply Limited Partnership, Canada, for €13.7 million
in cash. There is also a purchase price liability of €0.6 million.
189HeidelbergCement | Annual Report 2011
CoNSoLIDATED FINANCIAL STATEMENTS
Consolidated income statement Consolidated statement of changes in equity
Consolidated statement of comprehensive income Segment reporting / Notes to the consolidated financial statements
Consolidated statement of cash flows Notes to the 2011 consolidated financial statements
Consolidated balance sheet Audit opinion | Responsibility statement
In addition, the operations of a limestone quarry in Barcelona, Spain, were acquired for a cash purchase price of €11.8 million as part of an asset deal. An advance payment of €1.0 million on the purchase price was made in the previous year.
Investments in subsidiaries and other business units less acquired cash and cash equivalents amounted to €60.4 million (previous year: 109.9).
22) Divestments (cash inflow)
The cash inflow from the disposal of subsidiaries and other business units amounted to €22.3 million (pre-vious year: 2.0). The following list shows the most important divestments in the reporting year:– 100% of the shares in Solvent Resource Management Limited, United Kingdom, for €12.6 million in cash;
besides the cash payment, there is also a purchase price receivable of €0.6 million,– all shares in the proportionately consolidated company Heidelberger Betonelemente GmbH & Co. KG,
Germany, for €7.0 million in cash,– 100% of the shares in Hanson Precast (S) Pte Ltd, Singapore, for €2.2 million in cash.
The payments from the disposal of subsidiaries and other business units less cash and cash equivalents given up amounted to €21.0 million (previous year: 2.0). Proceeds from the disposal of other fixed assets amounting to €177.5 million (previous year: 217.5) essentially include proceeds from the disposal of intangible assets and property, plant, and equipment totalling €169.2 million (previous year: 196.6). These include, in particular, net proceeds from the sale of excess emission rights amounting to €63.5 (previous year: 106.0).
23) Cash from changes in consolidation scope
This line shows the cash and cash equivalents acquired or disposed of in connection with a gain or loss of control over subsidiaries and other business units.
24) Dividend payments to non-controlling shareholders
The item dividend payments to non-controlling shareholders shows dividends paid during the financial year for non-controlling interests.
25) Decrease in ownership interests in subsidiaries
In the previous year, this showed the net cash of €45.4 million (US$60.0 million) from the sale of around 6% of the African activities of the Scancem International Group to IFC and its financial partners.
Con
solid
ated
fin
anci
al s
tate
men
tsA
ddit
iona
l inf
orm
atio
n
4
5
Com
bine
d m
anag
emen
t re
port
Cor
pora
te G
over
nanc
eC
onso
lidat
ed f
inan
cial
sta
tem
ents
Add
itio
nal i
nfor
mat
ion
To
our
shar
ehol
ders
2
3
4
5
1
Con
ten
ts
190 HeidelbergCement | Annual Report 2011
4
26) Increase in ownership interests in subsidiaries
This item shows cash flows from the increase of ownership interests in subsidiaries. The largest transaction was the acquisition of 33.35% of the shares in HKS Hunziker Kalksandstein AG, Switzerland, for €6.2 million. In the previous year, this item included the acquisition of 26.6% of the shares in Carrières d’Antoing S.A., Belgium, for €3.5 million.
27) Proceeds from bond issuance and loans
This item essentially includes the proceeds from the syndicated facility agreement of €3 billion. In addition, two new bonds and a debt certificate were issued. The issue proceeds were used to refinance existing bank debts and to pre-finance the bond of €1 billion maturing in January 2012. The bonds were issued in October and November with terms of seven years (€300 million in October and increase of €200 million in November to a total of €500 million) and six years (issue of CHF 150 million in November). The debt certificate of €289 million with a maturity date of October 2016 was placed in December.
In the previous year, this item essentially included the proceeds from the syndicated facility agreement of €3 billion. In addition, three new bonds were issued, with the issue proceeds being used entirely for refinancing existing bank debts. The three bonds with a total volume of €2.05 billion were issued in January and July 2010 and had terms of five years (€650 million), ten years (€750 million), and five and a half years (€650 million).
28) Repayment of bonds and loans
This item includes the scheduled repayments of financial liabilities and the balance from the proceeds and payments for items with a high turnover rate, large amounts, and short terms from financing activities.
This mainly relates to the partial repayment of the syndicated facility agreement of €3 billion in the 2011 financial year. Furthermore, various drawings under the EMTN programme as well as commercial papers were repaid on schedule.
In the previous year, the item included the full repayment of the outstanding amount of the syndicated facility agreement of €8.7 billion, the repayment of the US$750 million bond, and the partial repayment of the syndicated facility agreement of €3 billion. Scheduled repayments of commercial papers also took place.
29) Cash and cash equivalents
This item includes cash and cash equivalents with a remaining term of less than three months. Of this cash, €28.4 million (previous year: 22.3) is not available for use by HeidelbergCement. This relates in particular to amounts pledged as collateral for local guarantee facilities or earmarked for recultivation payments and margin accounts in connection with energy trading.
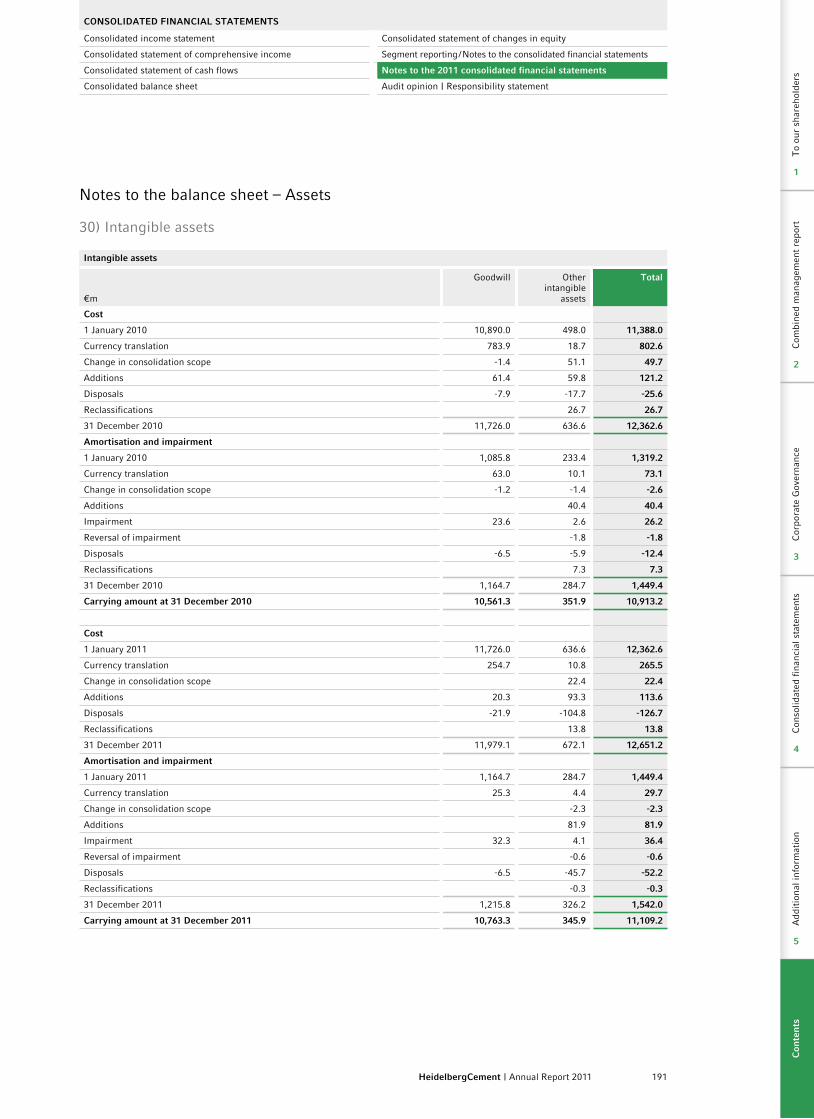
191HeidelbergCement | Annual Report 2011
CoNSoLIDATED FINANCIAL STATEMENTS
Consolidated income statement Consolidated statement of changes in equity
Consolidated statement of comprehensive income Segment reporting / Notes to the consolidated financial statements
Consolidated statement of cash flows Notes to the 2011 consolidated financial statements
Consolidated balance sheet Audit opinion | Responsibility statement
Notes to the balance sheet – Assets
30) Intangible assets
Intangible assets
€m
Goodwill Other intangible
assets
Total
Cost
1 January 2010 10,890.0 498.0 11,388.0
Currency translation 783.9 18.7 802.6
Change in consolidation scope -1.4 51.1 49.7
Additions 61.4 59.8 121.2
Disposals -7.9 -17.7 -25.6
Reclassifications 26.7 26.7
31 December 2010 11,726.0 636.6 12,362.6
Amortisation and impairment
1 January 2010 1,085.8 233.4 1,319.2
Currency translation 63.0 10.1 73.1
Change in consolidation scope -1.2 -1.4 -2.6
Additions 40.4 40.4
Impairment 23.6 2.6 26.2
Reversal of impairment -1.8 -1.8
Disposals -6.5 -5.9 -12.4
Reclassifications 7.3 7.3
31 December 2010 1,164.7 284.7 1,449.4
Carrying amount at 31 December 2010 10,561.3 351.9 10,913.2
Cost
1 January 2011 11,726.0 636.6 12,362.6
Currency translation 254.7 10.8 265.5
Change in consolidation scope 22.4 22.4
Additions 20.3 93.3 113.6
Disposals -21.9 -104.8 -126.7
Reclassifications 13.8 13.8
31 December 2011 11,979.1 672.1 12,651.2
Amortisation and impairment
1 January 2011 1,164.7 284.7 1,449.4
Currency translation 25.3 4.4 29.7
Change in consolidation scope -2.3 -2.3
Additions 81.9 81.9
Impairment 32.3 4.1 36.4
Reversal of impairment -0.6 -0.6
Disposals -6.5 -45.7 -52.2
Reclassifications -0.3 -0.3
31 December 2011 1,215.8 326.2 1,542.0
Carrying amount at 31 December 2011 10,763.3 345.9 11,109.2
Con
solid
ated
fin
anci
al s
tate
men
tsA
ddit
iona
l inf
orm
atio
n
4
5
Com
bine
d m
anag
emen
t re
port
Cor
pora
te G
over
nanc
eC
onso
lidat
ed f
inan
cial
sta
tem
ents
Add
itio
nal i
nfor
mat
ion
To
our
shar
ehol
ders
2
3
4
5
1
Con
ten
ts
192 HeidelbergCement | Annual Report 2011
4
Larger individual items of goodwill are connected with the acquisition of the Hanson Group, London, United Kingdom; S.A. Cimenteries CBR, Brussels, Belgium; Lehigh Hanson, Inc., Wilmington, US; Heidelberg-Cement Northern Europe AB, Stockholm, Sweden; Akçansa Cimento Sanayi ve Ticaret A.S., Istanbul, Turkey, and ENCI N.V., ’s-Hertogenbosch, Netherlands. The goodwill comprises acquired market shares and synergy effects that cannot be assigned to any other determinable and separable intangible assets.
Goodwill impairment tests are carried out annually in accordance with IAS 36 (Impairment of Assets). Impair-ment losses of €32.3 million were recognised in the reporting year. This impairment is taken into account in the additional ordinary expenses and explained in more detail in Note 7. A detailed explanation of the impairment test can be found on page 163 f.
Other intangible assets include quarrying rights, concessions, and software. Emission rights acquired through emissions trading have been accounted for with a carrying amount of €36.3 million (previous year: 78.3). The amortisation includes expenses from the devaluation of emission rights as a result of reduced market prices amounting to €52.8 million (previous year: 7.9).
Impairment of other intangible assets amounting to €4.1 million (previous year: 2.6) was recognised.
Internally generated intangible assets of €0.1 million (previous year: 0.1) were capitalised. Development costs of €1.6 million (previous year: 0.9) were recognised as intangible assets in the financial year. Intangible assets with finite useful lives amounted to €330.7 million (previous year: 337.1) and those with indefinite useful lives (trademark rights in the United Kingdom) to €15.2 million (previous year: 14.8).
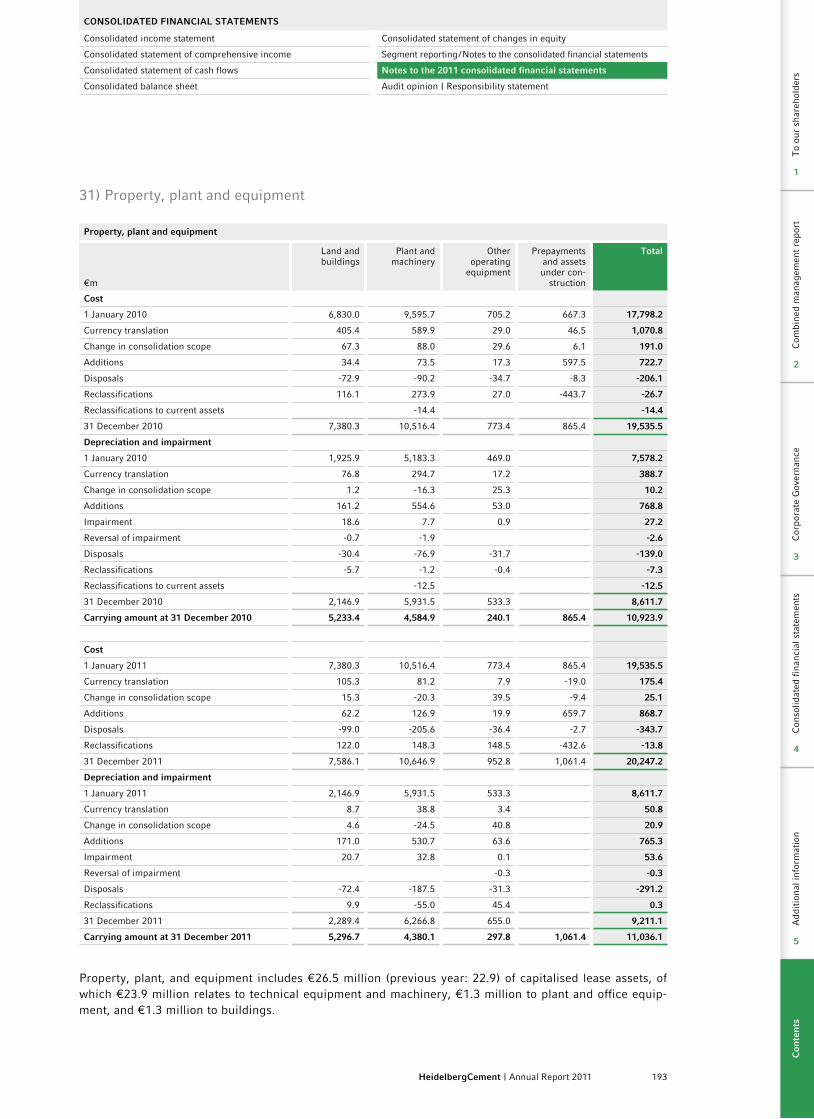
193HeidelbergCement | Annual Report 2011
CoNSoLIDATED FINANCIAL STATEMENTS
Consolidated income statement Consolidated statement of changes in equity
Consolidated statement of comprehensive income Segment reporting / Notes to the consolidated financial statements
Consolidated statement of cash flows Notes to the 2011 consolidated financial statements
Consolidated balance sheet Audit opinion | Responsibility statement
31) Property, plant and equipment
Property, plant and equipment
€m
Land and buildings
Plant and machinery
Other operating
equipment
Prepayments and assets under con-
struction
Total
Cost
1 January 2010 6,830.0 9,595.7 705.2 667.3 17,798.2
Currency translation 405.4 589.9 29.0 46.5 1,070.8
Change in consolidation scope 67.3 88.0 29.6 6.1 191.0
Additions 34.4 73.5 17.3 597.5 722.7
Disposals -72.9 -90.2 -34.7 -8.3 -206.1
Reclassifications 116.1 273.9 27.0 -443.7 -26.7
Reclassifications to current assets -14.4 -14.4
31 December 2010 7,380.3 10,516.4 773.4 865.4 19,535.5
Depreciation and impairment
1 January 2010 1,925.9 5,183.3 469.0 7,578.2
Currency translation 76.8 294.7 17.2 388.7
Change in consolidation scope 1.2 -16.3 25.3 10.2
Additions 161.2 554.6 53.0 768.8
Impairment 18.6 7.7 0.9 27.2
Reversal of impairment -0.7 -1.9 -2.6
Disposals -30.4 -76.9 -31.7 -139.0
Reclassifications -5.7 -1.2 -0.4 -7.3
Reclassifications to current assets -12.5 -12.5
31 December 2010 2,146.9 5,931.5 533.3 8,611.7
Carrying amount at 31 December 2010 5,233.4 4,584.9 240.1 865.4 10,923.9
Cost
1 January 2011 7,380.3 10,516.4 773.4 865.4 19,535.5
Currency translation 105.3 81.2 7.9 -19.0 175.4
Change in consolidation scope 15.3 -20.3 39.5 -9.4 25.1
Additions 62.2 126.9 19.9 659.7 868.7
Disposals -99.0 -205.6 -36.4 -2.7 -343.7
Reclassifications 122.0 148.3 148.5 -432.6 -13.8
31 December 2011 7,586.1 10,646.9 952.8 1,061.4 20,247.2
Depreciation and impairment
1 January 2011 2,146.9 5,931.5 533.3 8,611.7
Currency translation 8.7 38.8 3.4 50.8
Change in consolidation scope 4.6 -24.5 40.8 20.9
Additions 171.0 530.7 63.6 765.3
Impairment 20.7 32.8 0.1 53.6
Reversal of impairment -0.3 -0.3
Disposals -72.4 -187.5 -31.3 -291.2
Reclassifications 9.9 -55.0 45.4 0.3
31 December 2011 2,289.4 6,266.8 655.0 9,211.1
Carrying amount at 31 December 2011 5,296.7 4,380.1 297.8 1,061.4 11,036.1
Property, plant, and equipment includes €26.5 million (previous year: 22.9) of capitalised lease assets, of which €23.9 million relates to technical equipment and machinery, €1.3 million to plant and office equip-ment, and €1.3 million to buildings.
Con
solid
ated
fin
anci
al s
tate
men
tsA
ddit
iona
l inf
orm
atio
n
4
5
Com
bine
d m
anag
emen
t re
port
Cor
pora
te G
over
nanc
eC
onso
lidat
ed f
inan
cial
sta
tem
ents
Add
itio
nal i
nfor
mat
ion
To
our
shar
ehol
ders
2
3
4
5
1
Con
ten
ts
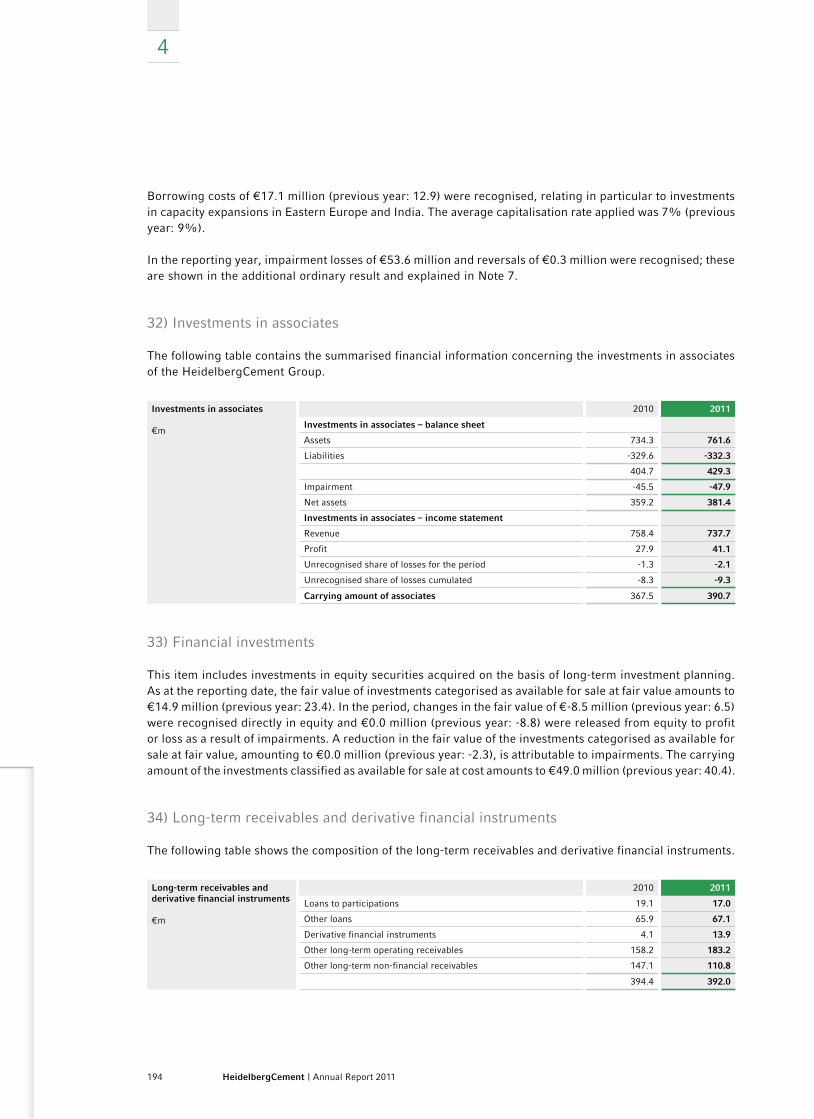
194 HeidelbergCement | Annual Report 2011
4
Borrowing costs of €17.1 million (previous year: 12.9) were recognised, relating in particular to investments in capacity expansions in Eastern Europe and India. The average capitalisation rate applied was 7% (pre vious year: 9%).
In the reporting year, impairment losses of €53.6 million and reversals of €0.3 million were recognised; these are shown in the additional ordinary result and explained in Note 7.
32) Investments in associates
The following table contains the summarised financial information concerning the investments in associates of the HeidelbergCement Group.
Investments in associates
€m
2010 2011
Investments in associates – balance sheet
Assets 734.3 761.6
Liabilities -329.6 -332.3
404.7 429.3
Impairment -45.5 -47.9
Net assets 359.2 381.4
Investments in associates – income statement
Revenue 758.4 737.7
Profit 27.9 41.1
Unrecognised share of losses for the period -1.3 -2.1
Unrecognised share of losses cumulated -8.3 -9.3
Carrying amount of associates 367.5 390.7
33) Financial investments
This item includes investments in equity securities acquired on the basis of long-term investment planning. As at the reporting date, the fair value of investments categorised as available for sale at fair value amounts to €14.9 million (previous year: 23.4). In the period, changes in the fair value of €-8.5 million (previous year: 6.5) were recognised directly in equity and €0.0 million (previous year: -8.8) were released from equity to profit or loss as a result of impairments. A reduction in the fair value of the investments categorised as available for sale at fair value, amounting to €0.0 million (previous year: -2.3), is attributable to impairments. The carrying amount of the investments classified as available for sale at cost amounts to €49.0 million (previous year: 40.4).
34) Long-term receivables and derivative financial instruments
The following table shows the composition of the long-term receivables and derivative financial instruments.
Long-term receivables and derivative financial instruments
€m
2010 2011
Loans to participations 19.1 17.0
Other loans 65.9 67.1
Derivative financial instruments 4.1 13.9
Other long-term operating receivables 158.2 183.2
Other long-term non-financial receivables 147.1 110.8
394.4 392.0
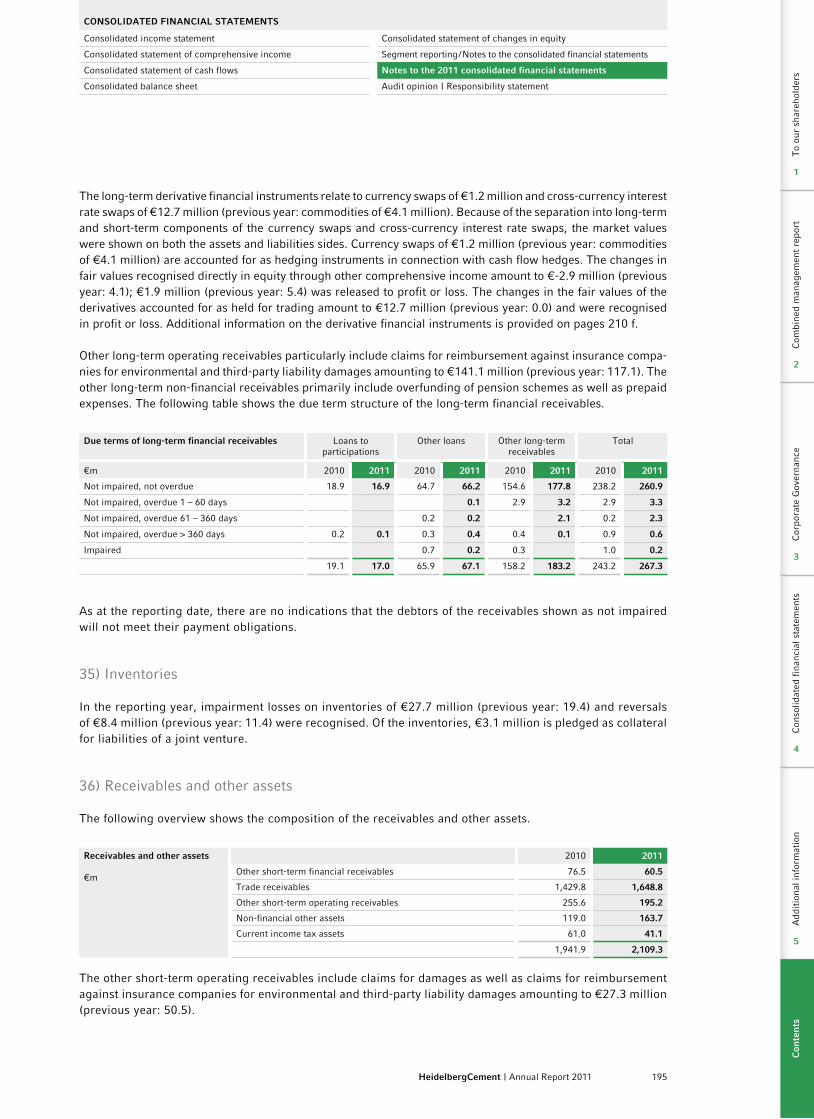
195HeidelbergCement | Annual Report 2011
CoNSoLIDATED FINANCIAL STATEMENTS
Consolidated income statement Consolidated statement of changes in equity
Consolidated statement of comprehensive income Segment reporting / Notes to the consolidated financial statements
Consolidated statement of cash flows Notes to the 2011 consolidated financial statements
Consolidated balance sheet Audit opinion | Responsibility statement
The long-term derivative financial instruments relate to currency swaps of €1.2 million and cross-currency interest rate swaps of €12.7 million (previous year: commodities of €4.1 million). Because of the separation into long-term and short-term components of the currency swaps and cross-currency interest rate swaps, the market values were shown on both the assets and liabilities sides. Currency swaps of €1.2 million (previous year: commodities of €4.1 million) are accounted for as hedging instruments in connection with cash flow hedges. The changes in fair values recognised directly in equity through other comprehensive income amount to €-2.9 million (previous year: 4.1); €1.9 million (previous year: 5.4) was released to profit or loss. The changes in the fair values of the derivatives accounted for as held for trading amount to €12.7 million (previous year: 0.0) and were recognised in profit or loss. Additional information on the derivative financial instruments is provided on pages 210 f.
Other long-term operating receivables particularly include claims for reimbursement against insurance compa-nies for environmental and third-party liability damages amounting to €141.1 million (previous year: 117.1). The other long-term non-financial receivables primarily include overfunding of pension schemes as well as prepaid expenses. The following table shows the due term structure of the long-term financial receivables.
Due terms of long-term financial receivables Loans to participations
Other loans Other long-term receivables
Total
€m 2010 2011 2010 2011 2010 2011 2010 2011
Not impaired, not overdue 18.9 16.9 64.7 66.2 154.6 177.8 238.2 260.9
Not impaired, overdue 1 – 60 days 0.1 2.9 3.2 2.9 3.3
Not impaired, overdue 61 – 360 days 0.2 0.2 2.1 0.2 2.3
Not impaired, overdue > 360 days 0.2 0.1 0.3 0.4 0.4 0.1 0.9 0.6
Impaired 0.7 0.2 0.3 1.0 0.2
19.1 17.0 65.9 67.1 158.2 183.2 243.2 267.3
As at the reporting date, there are no indications that the debtors of the receivables shown as not impaired will not meet their payment obligations.
35) Inventories
In the reporting year, impairment losses on inventories of €27.7 million (previous year: 19.4) and reversals of €8.4 million (previous year: 11.4) were recognised. Of the inventories, €3.1 million is pledged as collateral for liabilities of a joint venture.
36) Receivables and other assets
The following overview shows the composition of the receivables and other assets.
Receivables and other assets
€m
2010 2011
Other short-term financial receivables 76.5 60.5
Trade receivables 1,429.8 1,648.8
Other short-term operating receivables 255.6 195.2
Non-financial other assets 119.0 163.7
Current income tax assets 61.0 41.1
1,941.9 2,109.3
The other short-term operating receivables include claims for damages as well as claims for reimbursement against insurance companies for environmental and third-party liability damages amounting to €27.3 million (previous year: 50.5).
Con
solid
ated
fin
anci
al s
tate
men
tsA
ddit
iona
l inf
orm
atio
n
4
5
Com
bine
d m
anag
emen
t re
port
Cor
pora
te G
over
nanc
eC
onso
lidat
ed f
inan
cial
sta
tem
ents
Add
itio
nal i
nfor
mat
ion
To
our
shar
ehol
ders
2
3
4
5
1
Con
ten
ts
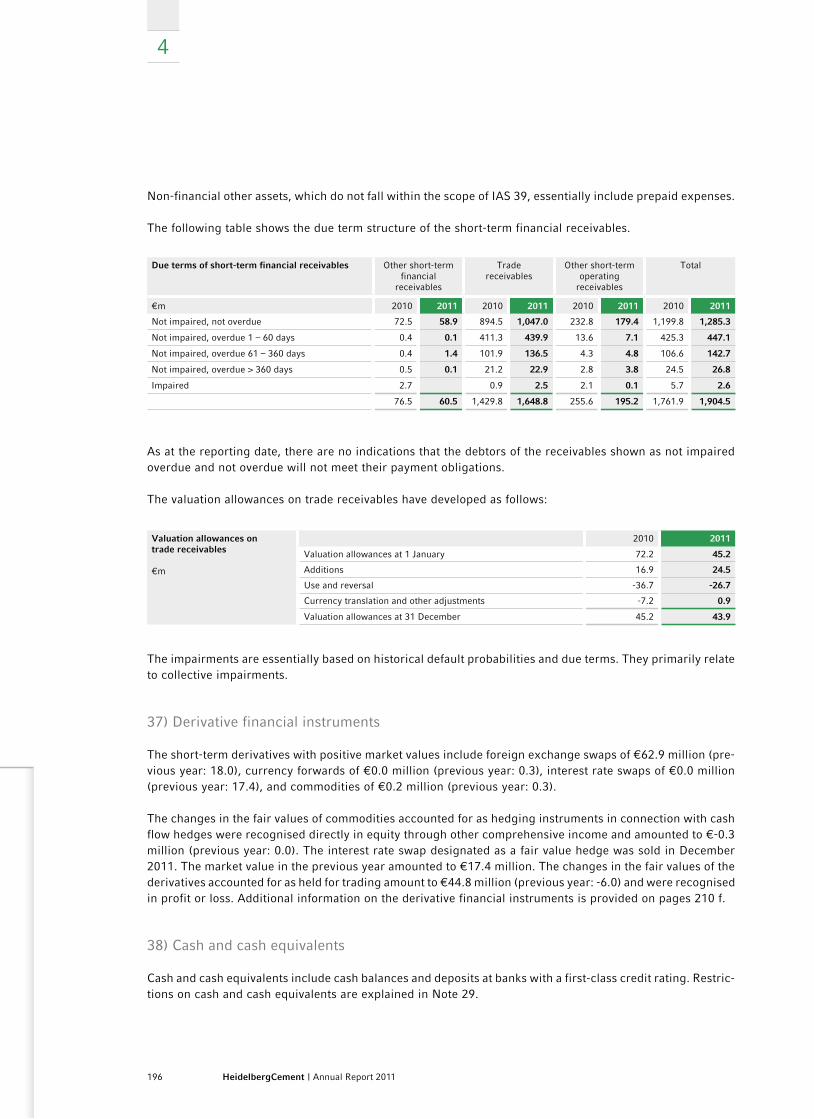
196 HeidelbergCement | Annual Report 2011
4
Non-financial other assets, which do not fall within the scope of IAS 39, essentially include prepaid expenses.
The following table shows the due term structure of the short-term financial receivables.
Due terms of short-term financial receivables Other short-term financial
receivables
Trade receivables
Other short-term operating
receivables
Total
€m 2010 2011 2010 2011 2010 2011 2010 2011
Not impaired, not overdue 72.5 58.9 894.5 1,047.0 232.8 179.4 1,199.8 1,285.3
Not impaired, overdue 1 – 60 days 0.4 0.1 411.3 439.9 13.6 7.1 425.3 447.1
Not impaired, overdue 61 – 360 days 0.4 1.4 101.9 136.5 4.3 4.8 106.6 142.7
Not impaired, overdue > 360 days 0.5 0.1 21.2 22.9 2.8 3.8 24.5 26.8
Impaired 2.7 0.9 2.5 2.1 0.1 5.7 2.6
76.5 60.5 1,429.8 1,648.8 255.6 195.2 1,761.9 1,904.5
As at the reporting date, there are no indications that the debtors of the receivables shown as not impaired overdue and not overdue will not meet their payment obligations.
The valuation allowances on trade receivables have developed as follows:
Valuation allowances on trade receivables
€m
2010 2011
Valuation allowances at 1 January 72.2 45.2
Additions 16.9 24.5
Use and reversal -36.7 -26.7
Currency translation and other adjustments -7.2 0.9
Valuation allowances at 31 December 45.2 43.9
The impairments are essentially based on historical default probabilities and due terms. They primarily relate to collective impairments.
37) Derivative financial instruments
The short-term derivatives with positive market values include foreign exchange swaps of €62.9 million (pre-vious year: 18.0), currency forwards of €0.0 million (previous year: 0.3), interest rate swaps of €0.0 million (previous year: 17.4), and commodities of €0.2 million (previous year: 0.3).
The changes in the fair values of commodities accounted for as hedging instruments in connection with cash flow hedges were recognised directly in equity through other comprehensive income and amounted to €-0.3 million (previous year: 0.0). The interest rate swap designated as a fair value hedge was sold in December 2011. The market value in the previous year amounted to €17.4 million. The changes in the fair values of the derivatives accounted for as held for trading amount to €44.8 million (previous year: -6.0) and were recognised in profit or loss. Additional information on the derivative financial instruments is provided on pages 210 f.
38) Cash and cash equivalents
Cash and cash equivalents include cash balances and deposits at banks with a first-class credit rating. Restric-tions on cash and cash equivalents are explained in Note 29.
197HeidelbergCement | Annual Report 2011
CoNSoLIDATED FINANCIAL STATEMENTS
Consolidated income statement Consolidated statement of changes in equity
Consolidated statement of comprehensive income Segment reporting / Notes to the consolidated financial statements
Consolidated statement of cash flows Notes to the 2011 consolidated financial statements
Consolidated balance sheet Audit opinion | Responsibility statement
39) Assets and liabilities held for sale
In the previous year, the assets and liabilities of the shipping partnership MS “Splittnes” GmbH & Co. KG, Cadenberge, Germany, a 50% proportionately consolidated company in the Mibau Group, were classified as held for sale. The Mibau Group is allocated to the Western and Northern Europe Group area. The company was disposed of on 1 January 2011. The assets and liabilities as at the date of disposal are shown under divestments on page 175.
Notes to the balance sheet – Equity and liabilities
40) Subscribed share capital
As at the reporting date 31 December 2011, the subscribed share capital amounts to €562,500,000 – unchanged from the previous year – and is divided into 187,500,000 shares; the shares are no-par value bearer shares. The nominal value of each share is €3.00, which corresponds to a proportionate amount of the subscribed share capital.
Authorised share capitalAs at 31 December 2011, there were two authorised capitals: namely, authorisation of the Managing Board and Supervisory Board to increase the capital by issuing new shares in return for cash contributions (Authorised Capital I), and authorisation of the Managing Board and Supervisory Board to increase the capital by issuing new shares in return for contributions in kind (Authorised Capital II). The authorised capitals are summarised below; the complete text of the authorisations can be found in the Articles of Association, which are published on our website www.heidelbergcement.com under “About us/Corporate Governance/Articles of Association”.
Authorised Capital IThe Annual General Meeting held on 6 May 2010 authorised the Managing Board, with the consent of the Supervisory Board, to increase the company’s subscribed share capital by a total amount of up to €225,000,000 by issuing up to 75,000,000 new no-par value bearer shares in total in return for cash contributions on one or more occasions until 5 May 2015 (Authorised Capital I). The shareholders must be granted subscription rights. However, the Managing Board is authorised, in certain cases described in more detail in the authorisa-tion, to exclude the subscription rights of shareholders in order to realise residual amounts or to issue shares totalling up to 10% of the share capital at a near-market price.
Authorised Capital IIFurthermore, the Annual General Meeting of 6 May 2010 authorised the Managing Board, with the consent of the Supervisory Board, to increase the company’s subscribed share capital by a total amount of up to €56,100,000 by issuing up to 18,700,000 new no-par value bearer shares in total against contributions in kind on one or more occasions until 5 May 2015 (Authorised Capital II). The subscription right of shareholders is generally excluded in the case of capital increases in return for contributions in kind. The authorisation governs, in particular, the possibility of excluding the subscription right insofar as the capital increase in return for contributions in kind is performed for the purposes of acquisition of companies or to service op-tion or conversion rights. As at 31 December 2011, the authorisation to issue new shares in return for cash contributions or contributions in kind forming the basis of the Authorised Capitals I and II had not been used.
Conditional share capitalThe conditional share capital described below existed as at 31 December 2011: The Annual General Meet-ing of 7 May 2009 decided to conditionally increase the subscribed share capital by a further amount of up to €187,500,000, divided into up to 62,500,000 new no-par value bearer shares (Conditional Share Capital 2009). The conditional capital increase serves to back the issuance of option or conversion rights, or option or conversion obligations, on HeidelbergCement shares. The conditional capital increase is only carried out
Con
solid
ated
fin
anci
al s
tate
men
tsA
ddit
iona
l inf
orm
atio
n
4
5
Com
bine
d m
anag
emen
t re
port
Cor
pora
te G
over
nanc
eC
onso
lidat
ed f
inan
cial
sta
tem
ents
Add
itio
nal i
nfor
mat
ion
To
our
shar
ehol
ders
2
3
4
5
1
Con
ten
ts
198 HeidelbergCement | Annual Report 2011
4
insofar as the Managing Board issues warrant or convertible bonds under the authorisation and the bearers of option or conversion rights make use of their rights. Warrant or convertible bonds may also be issued with option or conversion obligations. The shareholders generally have a subscription right to newly issued warrant or convertible bonds. The authorisation governs specific cases in which the Managing Board may exclude the subscription right of shareholders to warrant or convertible bonds. The complete text of the conditional share capital can also be found in the Articles of Association, which are published on our web-site (www.heidelbergcement.com under “About us/Corporate Governance/Articles of Association”). As at 31 December 2011, the authorisation to issue warrant or convertible bonds forming the basis of the conditional share capital 2009 had not been used.
As at the reporting date of 31 December 2011, the company has no treasury shares and there is no authorisa-tion to acquire treasury shares.
41) Share premium
The share premium of €5,539.4 million is unchanged from the previous year. It was essentially created from the premium from capital increases.
42) Retained earnings
Retained earnings include profits earned by HeidelbergCement AG and its subsidiaries which have not yet been distributed, as well as changes in the provisions for pensions recognised in other comprehensive income. The retained earnings rose by €141.5 million to €6,623.1 million in the reporting period. The increase is made up of the profit for the period of €348.1 million as well as the actuarial losses and limitations in accordance with IAS 19.58 B recognised in other comprehensive income, totalling €-153.8 million, a decrease resulting from other consolidation measures of €-5.8 million, and dividend payments to the shareholders of Heidelberg Cement AG of €-46.9 million (€0.25 per share). The changes in comparison with the previous year are explained in the consolidated statement of comprehensive income and the consolidated statement of changes in equity.
43) Other components of equity
The other components of equity include currency translation differences, reserves from investments catego-rised as available for sale at fair value, reserves from cash flow hedges, and asset revaluation reserves. The changes in the financial year totalling €414.1 million relate to foreign currency translation (€425.2 million), the cash flow hedge reserve (€-4.7 million), the asset revaluation reserve (€-1.6 million), and the available-for-sale reserve (€-4.8 million). The changes are explained in the consolidated statement of comprehensive income and the consolidated statement of changes in equity.
44) Non-controlling interests
The major non-controlling interests in the shareholders’ equity relate to PT Indocement Tunggal Prakasa Tbk., Indonesia; HeidelbergCement India Ltd., India; Kunda Nordic Cement Corp., Estonia; CJSC “Construction Materials”, Russia; TPCC Tanzania Portland Cement Company Ltd., Tanzania; Lehigh White Cement Company, US; La Cimenterie de Lukala S.A.R.L., Democratic Republic of Congo; and HeidelbergCement Bangladesh Limited, Bangladesh.
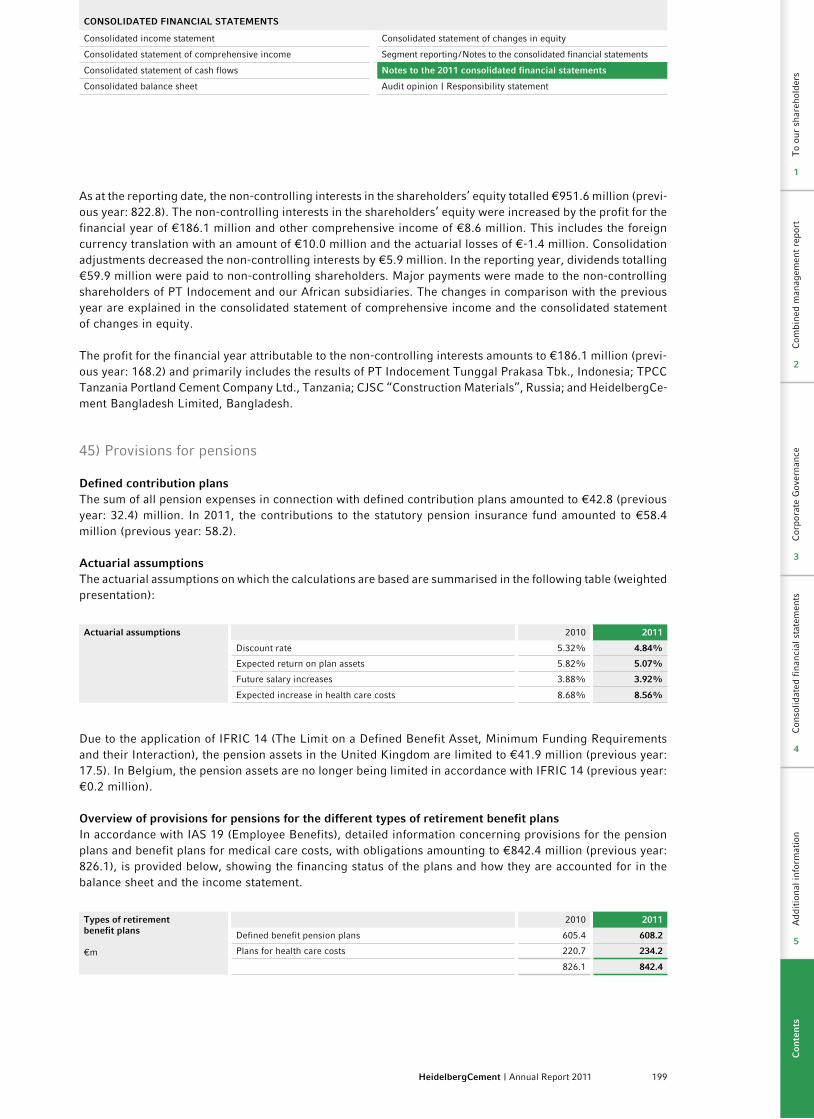
199HeidelbergCement | Annual Report 2011
CoNSoLIDATED FINANCIAL STATEMENTS
Consolidated income statement Consolidated statement of changes in equity
Consolidated statement of comprehensive income Segment reporting / Notes to the consolidated financial statements
Consolidated statement of cash flows Notes to the 2011 consolidated financial statements
Consolidated balance sheet Audit opinion | Responsibility statement
As at the reporting date, the non-controlling interests in the shareholders’ equity totalled €951.6 million (previ-ous year: 822.8). The non-controlling interests in the shareholders’ equity were increased by the profit for the financial year of €186.1 million and other comprehensive income of €8.6 million. This includes the foreign currency translation with an amount of €10.0 million and the actuarial losses of €-1.4 million. Consolidation adjustments decreased the non-controlling interests by €5.9 million. In the reporting year, dividends totalling €59.9 million were paid to non-controlling shareholders. Major payments were made to the non-controlling shareholders of PT Indocement and our African subsidiaries. The changes in comparison with the previous year are explained in the consolidated statement of comprehensive income and the consolidated statement of changes in equity.
The profit for the financial year attributable to the non-controlling interests amounts to €186.1 million (previ-ous year: 168.2) and primarily includes the results of PT Indocement Tunggal Prakasa Tbk., Indonesia; TPCC Tanzania Portland Cement Company Ltd., Tanzania; CJSC “Construction Materials”, Russia; and HeidelbergCe-ment Bangladesh Limited, Bangladesh.
45) Provisions for pensions
Defined contribution plansThe sum of all pension expenses in connection with defined contribution plans amounted to €42.8 (previous year: 32.4) million. In 2011, the contributions to the statutory pension insurance fund amounted to €58.4 million (previous year: 58.2).
Actuarial assumptionsThe actuarial assumptions on which the calculations are based are summarised in the following table (weighted presentation):
Actuarial assumptions 2010 2011
Discount rate 5.32% 4.84%
Expected return on plan assets 5.82% 5.07%
Future salary increases 3.88% 3.92%
Expected increase in health care costs 8.68% 8.56%
Due to the application of IFRIC 14 (The Limit on a Defined Benefit Asset, Minimum Funding Requirements and their Interaction), the pension assets in the United Kingdom are limited to €41.9 million (previous year: 17.5). In Belgium, the pension assets are no longer being limited in accordance with IFRIC 14 (previous year: €0.2 million).
overview of provisions for pensions for the different types of retirement benefit plansIn accordance with IAS 19 (Employee Benefits), detailed information concerning provisions for the pension plans and benefit plans for medical care costs, with obligations amounting to €842.4 million (previous year: 826.1), is provided below, showing the financing status of the plans and how they are accounted for in the balance sheet and the income statement.
Types of retirement benefit plans
€m
2010 2011
Defined benefit pension plans 605.4 608.2
Plans for health care costs 220.7 234.2
826.1 842.4
Con
solid
ated
fin
anci
al s
tate
men
tsA
ddit
iona
l inf
orm
atio
n
4
5
Com
bine
d m
anag
emen
t re
port
Cor
pora
te G
over
nanc
eC
onso
lidat
ed f
inan
cial
sta
tem
ents
Add
itio
nal i
nfor
mat
ion
To
our
shar
ehol
ders
2
3
4
5
1
Con
ten
ts
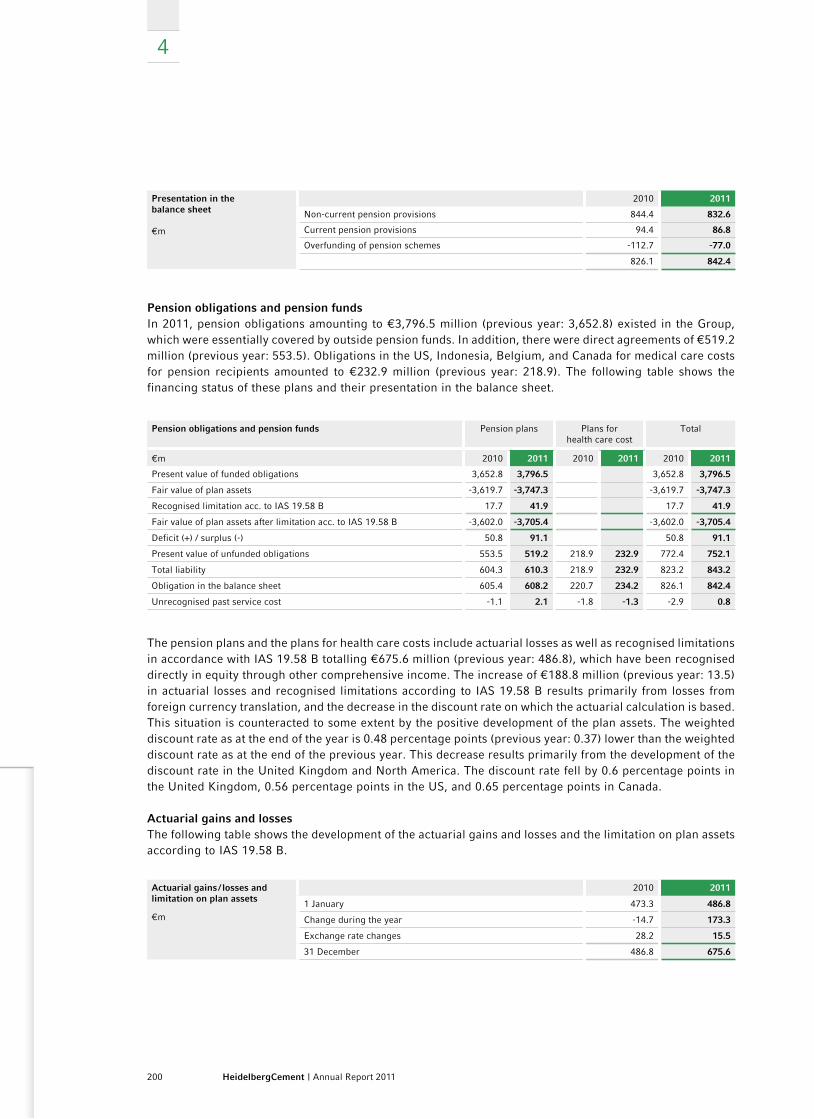
200 HeidelbergCement | Annual Report 2011
4
Presentation in the balance sheet
€m
2010 2011
Non-current pension provisions 844.4 832.6
Current pension provisions 94.4 86.8
Overfunding of pension schemes -112.7 -77.0
826.1 842.4
Pension obligations and pension fundsIn 2011, pension obligations amounting to €3,796.5 million (previous year: 3,652.8) existed in the Group, which were essentially covered by outside pension funds. In addition, there were direct agreements of €519.2 million (previous year: 553.5). Obligations in the US, Indonesia, Belgium, and Canada for medical care costs for pension recipients amounted to €232.9 million (previous year: 218.9). The following table shows the financing status of these plans and their presentation in the balance sheet.
Pension obligations and pension funds Pension plans Plans for health care cost
Total
€m 2010 2011 2010 2011 2010 2011
Present value of funded obligations 3,652.8 3,796.5 3,652.8 3,796.5
Fair value of plan assets -3,619.7 -3,747.3 -3,619.7 -3,747.3
Recognised limitation acc. to IAS 19.58 B 17.7 41.9 17.7 41.9
Fair value of plan assets after limitation acc. to IAS 19.58 B -3,602.0 -3,705.4 -3,602.0 -3,705.4
Deficit (+) / surplus (-) 50.8 91.1 50.8 91.1
Present value of unfunded obligations 553.5 519.2 218.9 232.9 772.4 752.1
Total liability 604.3 610.3 218.9 232.9 823.2 843.2
Obligation in the balance sheet 605.4 608.2 220.7 234.2 826.1 842.4
Unrecognised past service cost -1.1 2.1 -1.8 -1.3 -2.9 0.8
The pension plans and the plans for health care costs include actuarial losses as well as recognised limitations in accordance with IAS 19.58 B totalling €675.6 million (previous year: 486.8), which have been recognised directly in equity through other comprehensive income. The increase of €188.8 million (previous year: 13.5) in actuarial losses and recognised limitations according to IAS 19.58 B results primarily from losses from foreign currency translation, and the decrease in the discount rate on which the actuarial calculation is based. This situation is counteracted to some extent by the positive development of the plan assets. The weighted discount rate as at the end of the year is 0.48 percentage points (previous year: 0.37) lower than the weighted discount rate as at the end of the previous year. This decrease results primarily from the development of the discount rate in the United Kingdom and North America. The discount rate fell by 0.6 percentage points in the United Kingdom, 0.56 percentage points in the US, and 0.65 percentage points in Canada. Actuarial gains and lossesThe following table shows the development of the actuarial gains and losses and the limitation on plan assets according to IAS 19.58 B.
Actuarial gains / losses and limitation on plan assets
€m
2010 2011
1 January 473.3 486.8
Change during the year -14.7 173.3
Exchange rate changes 28.2 15.5
31 December 486.8 675.6
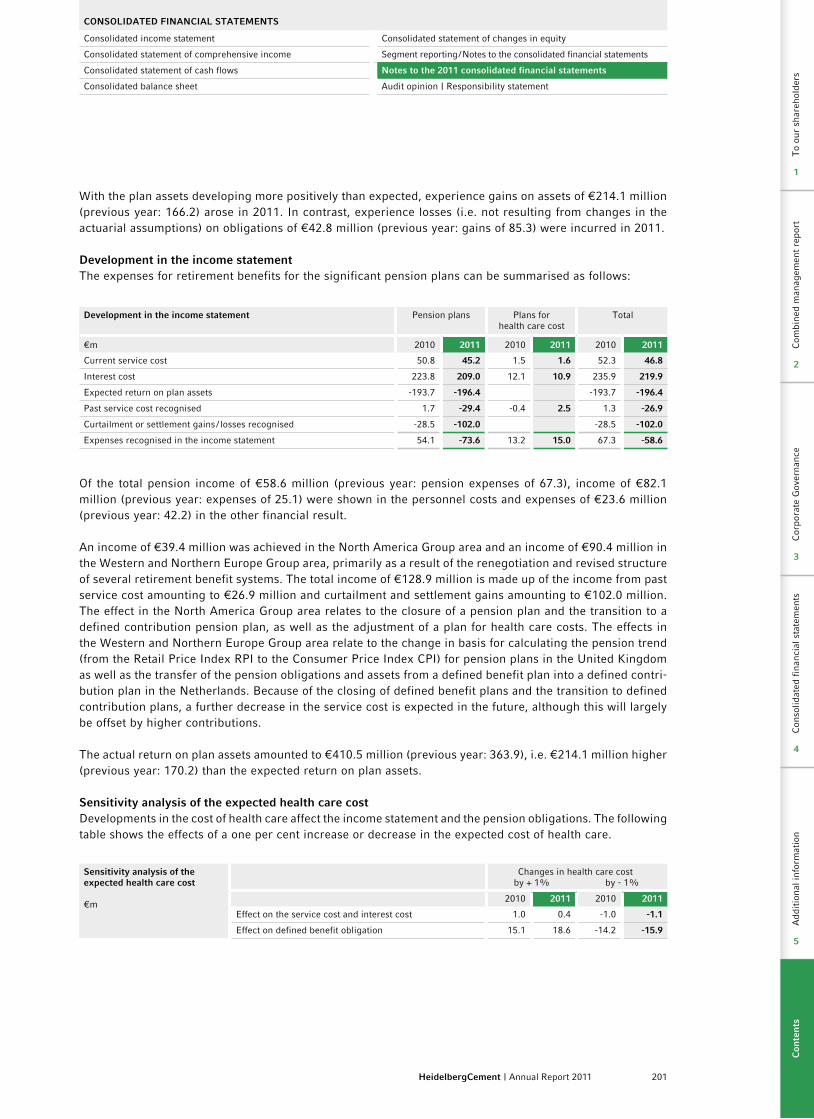
201HeidelbergCement | Annual Report 2011
CoNSoLIDATED FINANCIAL STATEMENTS
Consolidated income statement Consolidated statement of changes in equity
Consolidated statement of comprehensive income Segment reporting / Notes to the consolidated financial statements
Consolidated statement of cash flows Notes to the 2011 consolidated financial statements
Consolidated balance sheet Audit opinion | Responsibility statement
With the plan assets developing more positively than expected, experience gains on assets of €214.1 million (previous year: 166.2) arose in 2011. In contrast, experience losses (i.e. not resulting from changes in the actuarial assumptions) on obligations of €42.8 million (previous year: gains of 85.3) were incurred in 2011.
Development in the income statementThe expenses for retirement benefits for the significant pension plans can be summarised as follows:
Development in the income statement Pension plans Plans for health care cost
Total
€m 2010 2011 2010 2011 2010 2011
Current service cost 50.8 45.2 1.5 1.6 52.3 46.8
Interest cost 223.8 209.0 12.1 10.9 235.9 219.9
Expected return on plan assets -193.7 -196.4 -193.7 -196.4
Past service cost recognised 1.7 -29.4 -0.4 2.5 1.3 -26.9
Curtailment or settlement gains / losses recognised -28.5 -102.0 -28.5 -102.0
Expenses recognised in the income statement 54.1 -73.6 13.2 15.0 67.3 -58.6
Of the total pension income of €58.6 million (previous year: pension expenses of 67.3), income of €82.1 million (previous year: expenses of 25.1) were shown in the personnel costs and expenses of €23.6 million (previous year: 42.2) in the other financial result.
An income of €39.4 million was achieved in the North America Group area and an income of €90.4 million in the Western and Northern Europe Group area, primarily as a result of the renegotiation and revised structure of several retirement benefit systems. The total income of €128.9 million is made up of the income from past service cost amounting to €26.9 million and curtailment and settlement gains amounting to €102.0 million. The effect in the North America Group area relates to the closure of a pension plan and the transition to a defined contribution pension plan, as well as the adjustment of a plan for health care costs. The effects in the Western and Northern Europe Group area relate to the change in basis for calculating the pension trend (from the Retail Price Index RPI to the Consumer Price Index CPI) for pension plans in the United Kingdom as well as the transfer of the pension obligations and assets from a defined benefit plan into a defined contri-bution plan in the Netherlands. Because of the closing of defined benefit plans and the transition to defined contribution plans, a further decrease in the service cost is expected in the future, although this will largely be offset by higher contributions.
The actual return on plan assets amounted to €410.5 million (previous year: 363.9), i.e. €214.1 million higher (previous year: 170.2) than the expected return on plan assets.
Sensitivity analysis of the expected health care costDevelopments in the cost of health care affect the income statement and the pension obligations. The following table shows the effects of a one per cent increase or decrease in the expected cost of health care.
Sensitivity analysis of the expected health care cost
€m
Changes in health care cost by + 1% by - 1%
2010 2011 2010 2011
Effect on the service cost and interest cost 1.0 0.4 -1.0 -1.1
Effect on defined benefit obligation 15.1 18.6 -14.2 -15.9
Con
solid
ated
fin
anci
al s
tate
men
tsA
ddit
iona
l inf
orm
atio
n
4
5
Com
bine
d m
anag
emen
t re
port
Cor
pora
te G
over
nanc
eC
onso
lidat
ed f
inan
cial
sta
tem
ents
Add
itio
nal i
nfor
mat
ion
To
our
shar
ehol
ders
2
3
4
5
1
Con
ten
ts
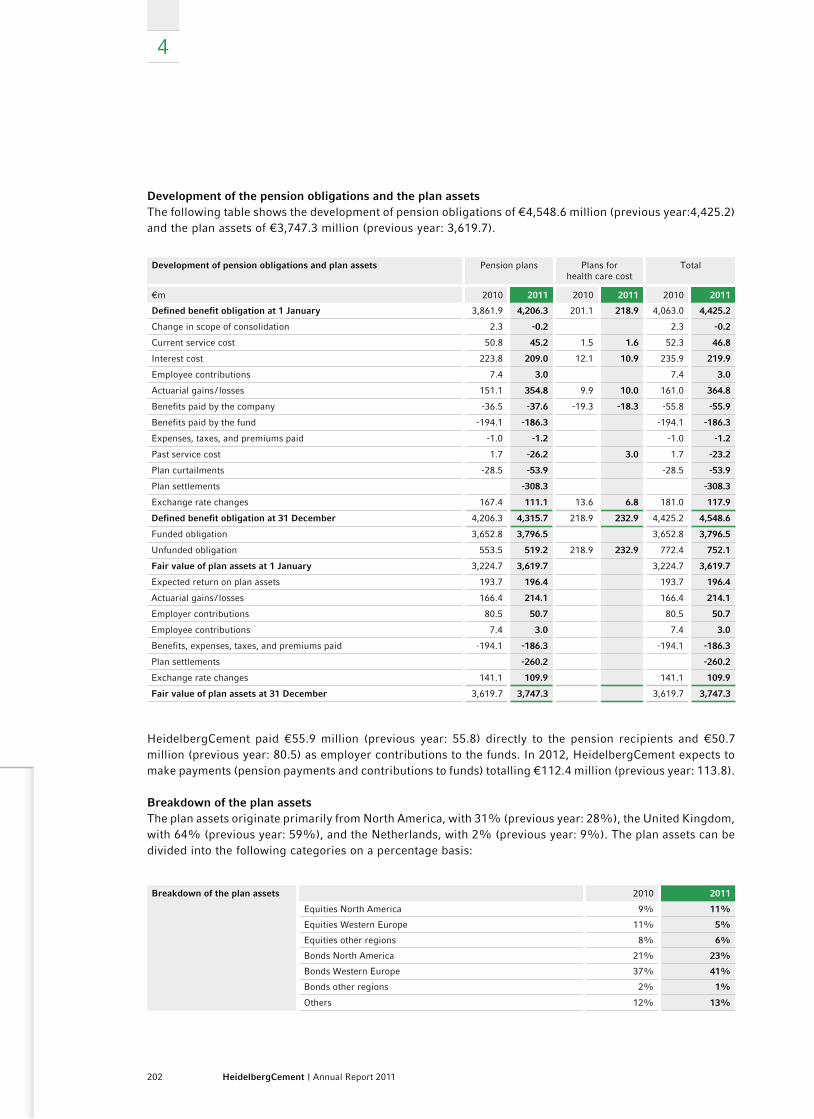
202 HeidelbergCement | Annual Report 2011
4
Development of the pension obligations and the plan assetsThe following table shows the development of pension obligations of €4,548.6 million (previous year:4,425.2) and the plan assets of €3,747.3 million (previous year: 3,619.7).
Development of pension obligations and plan assets Pension plans Plans for health care cost
Total
€m 2010 2011 2010 2011 2010 2011
Defined benefit obligation at 1 January 3,861.9 4,206.3 201.1 218.9 4,063.0 4,425.2
Change in scope of consolidation 2.3 -0.2 2.3 -0.2
Current service cost 50.8 45.2 1.5 1.6 52.3 46.8
Interest cost 223.8 209.0 12.1 10.9 235.9 219.9
Employee contributions 7.4 3.0 7.4 3.0
Actuarial gains / losses 151.1 354.8 9.9 10.0 161.0 364.8
Benefits paid by the company -36.5 -37.6 -19.3 -18.3 -55.8 -55.9
Benefits paid by the fund -194.1 -186.3 -194.1 -186.3
Expenses, taxes, and premiums paid -1.0 -1.2 -1.0 -1.2
Past service cost 1.7 -26.2 3.0 1.7 -23.2
Plan curtailments -28.5 -53.9 -28.5 -53.9
Plan settlements -308.3 -308.3
Exchange rate changes 167.4 111.1 13.6 6.8 181.0 117.9
Defined benefit obligation at 31 December 4,206.3 4,315.7 218.9 232.9 4,425.2 4,548.6
Funded obligation 3,652.8 3,796.5 3,652.8 3,796.5
Unfunded obligation 553.5 519.2 218.9 232.9 772.4 752.1
Fair value of plan assets at 1 January 3,224.7 3,619.7 3,224.7 3,619.7
Expected return on plan assets 193.7 196.4 193.7 196.4
Actuarial gains / losses 166.4 214.1 166.4 214.1
Employer contributions 80.5 50.7 80.5 50.7
Employee contributions 7.4 3.0 7.4 3.0
Benefits, expenses, taxes, and premiums paid -194.1 -186.3 -194.1 -186.3
Plan settlements -260.2 -260.2
Exchange rate changes 141.1 109.9 141.1 109.9
Fair value of plan assets at 31 December 3,619.7 3,747.3 3,619.7 3,747.3
HeidelbergCement paid €55.9 million (previous year: 55.8) directly to the pension recipients and €50.7 million (previous year: 80.5) as employer contributions to the funds. In 2012, HeidelbergCement expects to make payments (pension payments and contributions to funds) totalling €112.4 million (previous year: 113.8).
Breakdown of the plan assets The plan assets originate primarily from North America, with 31% (previous year: 28%), the United Kingdom, with 64% (previous year: 59%), and the Netherlands, with 2% (previous year: 9%). The plan assets can be divided into the following categories on a percentage basis:
Breakdown of the plan assets 2010 2011
Equities North America 9% 11%
Equities Western Europe 11% 5%
Equities other regions 8% 6%
Bonds North America 21% 23%
Bonds Western Europe 37% 41%
Bonds other regions 2% 1%
Others 12% 13%
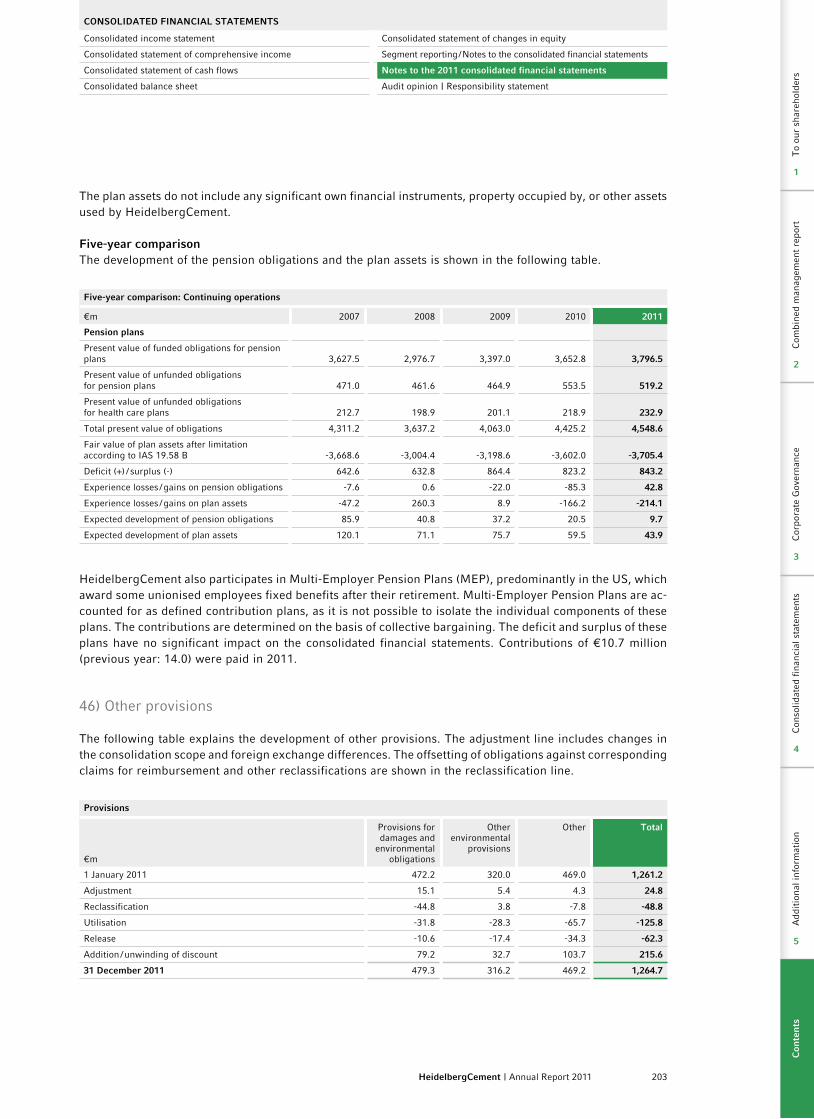
203HeidelbergCement | Annual Report 2011
CoNSoLIDATED FINANCIAL STATEMENTS
Consolidated income statement Consolidated statement of changes in equity
Consolidated statement of comprehensive income Segment reporting / Notes to the consolidated financial statements
Consolidated statement of cash flows Notes to the 2011 consolidated financial statements
Consolidated balance sheet Audit opinion | Responsibility statement
The plan assets do not include any significant own financial instruments, property occupied by, or other assets used by HeidelbergCement.
Five-year comparisonThe development of the pension obligations and the plan assets is shown in the following table.
Five-year comparison: Continuing operations
€m 2007 2008 2009 2010 2011
Pension plans
Present value of funded obligations for pension plans 3,627.5 2,976.7 3,397.0 3,652.8 3,796.5
Present value of unfunded obligations for pension plans 471.0 461.6 464.9 553.5 519.2
Present value of unfunded obligations for health care plans 212.7 198.9 201.1 218.9 232.9
Total present value of obligations 4,311.2 3,637.2 4,063.0 4,425.2 4,548.6
Fair value of plan assets after limitation according to IAS 19.58 B -3,668.6 -3,004.4 -3,198.6 -3,602.0 -3,705.4
Deficit (+) / surplus (-) 642.6 632.8 864.4 823.2 843.2
Experience losses / gains on pension obligations -7.6 0.6 -22.0 -85.3 42.8
Experience losses / gains on plan assets -47.2 260.3 8.9 -166.2 -214.1
Expected development of pension obligations 85.9 40.8 37.2 20.5 9.7
Expected development of plan assets 120.1 71.1 75.7 59.5 43.9
HeidelbergCement also participates in Multi-Employer Pension Plans (MEP), predominantly in the US, which award some unionised employees fixed benefits after their retirement. Multi-Employer Pension Plans are ac-counted for as defined contribution plans, as it is not possible to isolate the individual components of these plans. The contributions are determined on the basis of collective bargaining. The deficit and surplus of these plans have no significant impact on the consolidated financial statements. Contributions of €10.7 million (previous year: 14.0) were paid in 2011.
46) Other provisions
The following table explains the development of other provisions. The adjustment line includes changes in the consolidation scope and foreign exchange differences. The offsetting of obligations against corresponding claims for reimbursement and other reclassifications are shown in the reclassification line.
Provisions
€m
Provisions for damages and
environmental obligations
Other environmental
provisions
Other Total
1 January 2011 472.2 320.0 469.0 1,261.2
Adjustment 15.1 5.4 4.3 24.8
Reclassification -44.8 3.8 -7.8 -48.8
Utilisation -31.8 -28.3 -65.7 -125.8
Release -10.6 -17.4 -34.3 -62.3
Addition / unwinding of discount 79.2 32.7 103.7 215.6
31 December 2011 479.3 316.2 469.2 1,264.7
Con
solid
ated
fin
anci
al s
tate
men
tsA
ddit
iona
l inf
orm
atio
n
4
5
Com
bine
d m
anag
emen
t re
port
Cor
pora
te G
over
nanc
eC
onso
lidat
ed f
inan
cial
sta
tem
ents
Add
itio
nal i
nfor
mat
ion
To
our
shar
ehol
ders
2
3
4
5
1
Con
ten
ts
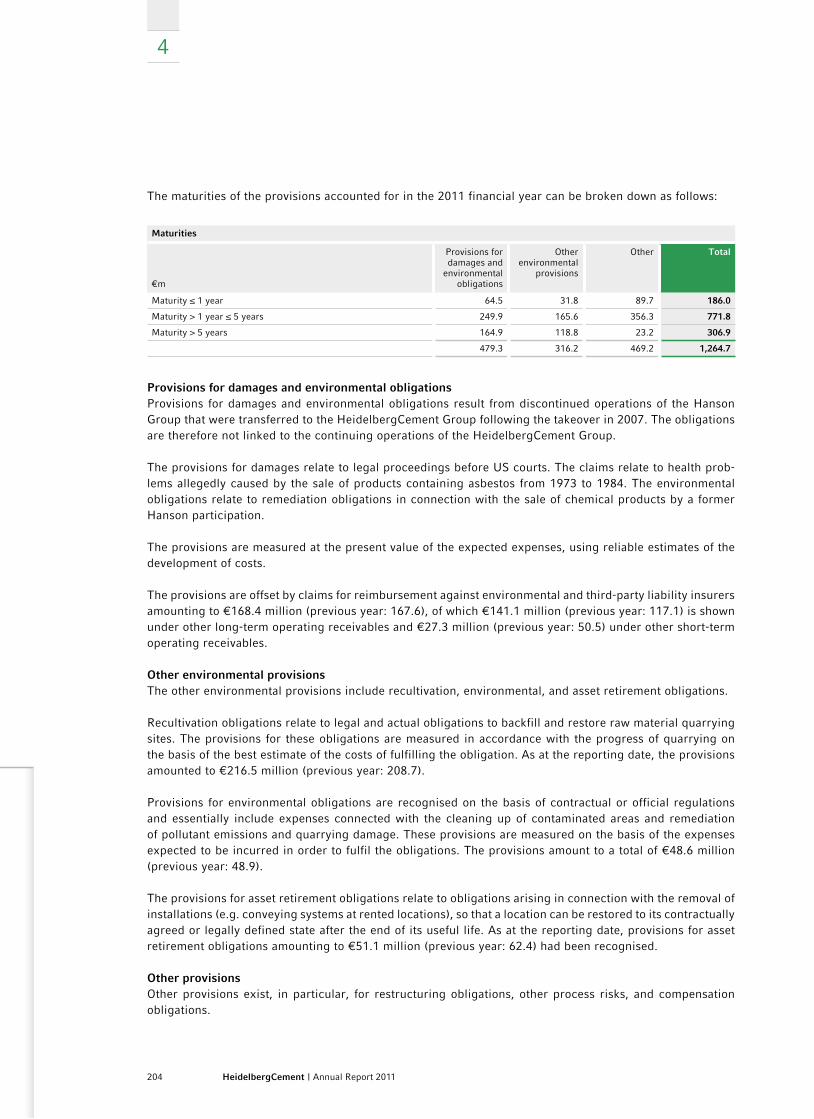
204 HeidelbergCement | Annual Report 2011
4
The maturities of the provisions accounted for in the 2011 financial year can be broken down as follows:
Maturities
€m
Provisions for damages and
environmental obligations
Other environmental
provisions
Other Total
Maturity ≤ 1 year 64.5 31.8 89.7 186.0
Maturity > 1 year ≤ 5 years 249.9 165.6 356.3 771.8
Maturity > 5 years 164.9 118.8 23.2 306.9
479.3 316.2 469.2 1,264.7
Provisions for damages and environmental obligationsProvisions for damages and environmental obligations result from discontinued operations of the Hanson Group that were transferred to the HeidelbergCement Group following the takeover in 2007. The obligations are therefore not linked to the continuing operations of the HeidelbergCement Group.
The provisions for damages relate to legal proceedings before US courts. The claims relate to health prob-lems allegedly caused by the sale of products containing asbestos from 1973 to 1984. The environmental obligations relate to remediation obligations in connection with the sale of chemical products by a former Hanson participation.
The provisions are measured at the present value of the expected expenses, using reliable estimates of the development of costs.
The provisions are offset by claims for reimbursement against environmental and third-party liability insurers amounting to €168.4 million (previous year: 167.6), of which €141.1 million (previous year: 117.1) is shown under other long-term operating receivables and €27.3 million (previous year: 50.5) under other short-term operating receivables.
other environmental provisionsThe other environmental provisions include recultivation, environmental, and asset retirement obligations.
Recultivation obligations relate to legal and actual obligations to backfill and restore raw material quarrying sites. The provisions for these obligations are measured in accordance with the progress of quarrying on the basis of the best estimate of the costs of fulfilling the obligation. As at the reporting date, the provisions amounted to €216.5 million (previous year: 208.7).
Provisions for environmental obligations are recognised on the basis of contractual or official regulations and essentially include expenses connected with the cleaning up of contaminated areas and remediation of pollutant emissions and quarrying damage. These provisions are measured on the basis of the expenses expected to be incurred in order to fulfil the obligations. The provisions amount to a total of €48.6 million (previous year: 48.9).
The provisions for asset retirement obligations relate to obligations arising in connection with the removal of installations (e.g. conveying systems at rented locations), so that a location can be restored to its contractually agreed or legally defined state after the end of its useful life. As at the reporting date, provisions for asset retirement obligations amounting to €51.1 million (previous year: 62.4) had been recognised.
other provisionsOther provisions exist, in particular, for restructuring obligations, other process risks, and compensation obligations.

205HeidelbergCement | Annual Report 2011
CoNSoLIDATED FINANCIAL STATEMENTS
Consolidated income statement Consolidated statement of changes in equity
Consolidated statement of comprehensive income Segment reporting / Notes to the consolidated financial statements
Consolidated statement of cash flows Notes to the 2011 consolidated financial statements
Consolidated balance sheet Audit opinion | Responsibility statement
The provisions for restructuring obligations concern expenses for various optimisation programmes, such as the closure of plants or relocation of activities. Provisions of €37.6 million (previous year: 47.3) had been recognised for this purpose as at the reporting date.
Because of pending legal actions against the Group, provisions for process risks, including those relating to pending antitrust proceedings, were set up in an amount of €194.5 million (previous year: 203.6).
Provisions for compensation obligations relate to the Group’s obligations arising from occupational accidents. As at the reporting date, provisions of €73.7 million (previous year: 72.2) had been recognised for this purpose.
Other provisions were also recognised for a variety of minor issues.
Impact of interest rate effectsProvisions are measured at their present value, which is determined on the basis of the expected payments in combination with a risk-adjusted pre-tax interest rate.
The unwinding of discount increased the provisions for damages and environmental obligations by €17.7 mil-lion and the other environmental provisions by €7.0 million. Changes in the discount rate led to an increase of €18.3 million in provisions for damages and environmental obligations and a reduction of €1.7 million in other environmental provisions.
47) Liabilities
The following table splits up the liabilities into interest-bearing and operating liabilities.
Liabilities
€m
2010 2011
Interest-bearing liabilities
Bonds payable 7,228.8 8,012.2
Bank loans 1,139.0 1,310.7
Other interest-bearing liabilities
Miscellaneous interest-bearing liabilities 613.0 339.7
Liabilities from finance lease 15.6 18.7
Derivative financial instruments 55.3 21.8
683.9 380.2
Non-controlling interests with put options 95.5 97.9
9,147.2 9,801.0
operating liabilities
Trade payables 1,084.7 1,344.8
Income tax liabilities 229.6 205.5
Liabilities relating to personnel 233.6 259.3
Other operating liabilities 657.4 783.4
Deferred income and non-financial liabilities 112.2 119.2
2,317.5 2,712.2
11,464.7 12,513.2
The increase in bond liabilities is essentially attributable to the issue of two bonds of €0.5 billion and CHF 150 million by HeidelbergCement Finance B.V. The rise in bank loans results principally from the issue of a debt certificate amounting to €289 million. The other interest-bearing liabilities primarily include drawings under the Euro Medium Term Note programme and outstanding drawings under the Euro Commercial Paper programme.
Con
solid
ated
fin
anci
al s
tate
men
tsA
ddit
iona
l inf
orm
atio
n
4
5
Com
bine
d m
anag
emen
t re
port
Cor
pora
te G
over
nanc
eC
onso
lidat
ed f
inan
cial
sta
tem
ents
Add
itio
nal i
nfor
mat
ion
To
our
shar
ehol
ders
2
3
4
5
1
Con
ten
ts
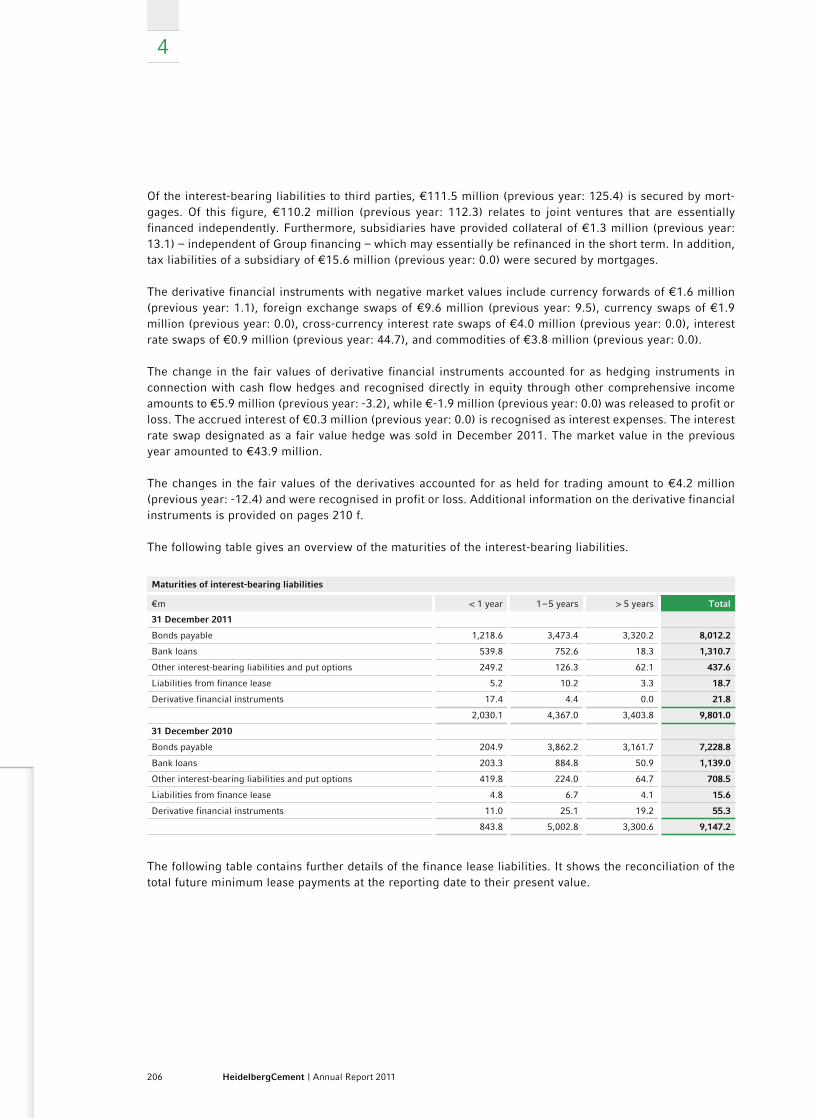
206 HeidelbergCement | Annual Report 2011
4
Of the interest-bearing liabilities to third parties, €111.5 million (previous year: 125.4) is secured by mort-gages. Of this figure, €110.2 million (previous year: 112.3) relates to joint ventures that are essentially financed independently. Furthermore, subsidiaries have provided collateral of €1.3 million (previous year: 13.1) – independent of Group financing – which may essentially be refinanced in the short term. In addition, tax liabilities of a subsidiary of €15.6 million (previous year: 0.0) were secured by mortgages.
The derivative financial instruments with negative market values include currency forwards of €1.6 million (previous year: 1.1), foreign exchange swaps of €9.6 million (previous year: 9.5), currency swaps of €1.9 million (previous year: 0.0), cross-currency interest rate swaps of €4.0 million (previous year: 0.0), interest rate swaps of €0.9 million (previous year: 44.7), and commodities of €3.8 million (previous year: 0.0).
The change in the fair values of derivative financial instruments accounted for as hedging instruments in connection with cash flow hedges and recognised directly in equity through other comprehensive income amounts to €5.9 million (previous year: -3.2), while €-1.9 million (previous year: 0.0) was released to profit or loss. The accrued interest of €0.3 million (previous year: 0.0) is recognised as interest expenses. The interest rate swap designated as a fair value hedge was sold in December 2011. The market value in the previous year amounted to €43.9 million.
The changes in the fair values of the derivatives accounted for as held for trading amount to €4.2 million (previous year: -12.4) and were recognised in profit or loss. Additional information on the derivative financial instruments is provided on pages 210 f.
The following table gives an overview of the maturities of the interest-bearing liabilities.
Maturities of interest-bearing liabilities
€m < 1 year 1 – 5 years > 5 years Total
31 December 2011
Bonds payable 1,218.6 3,473.4 3,320.2 8,012.2
Bank loans 539.8 752.6 18.3 1,310.7
Other interest-bearing liabilities and put options 249.2 126.3 62.1 437.6
Liabilities from finance lease 5.2 10.2 3.3 18.7
Derivative financial instruments 17.4 4.4 0.0 21.8
2,030.1 4,367.0 3,403.8 9,801.0
31 December 2010
Bonds payable 204.9 3,862.2 3,161.7 7,228.8
Bank loans 203.3 884.8 50.9 1,139.0
Other interest-bearing liabilities and put options 419.8 224.0 64.7 708.5
Liabilities from finance lease 4.8 6.7 4.1 15.6
Derivative financial instruments 11.0 25.1 19.2 55.3
843.8 5,002.8 3,300.6 9,147.2
The following table contains further details of the finance lease liabilities. It shows the reconciliation of the total future minimum lease payments at the reporting date to their present value.

207HeidelbergCement | Annual Report 2011
CoNSoLIDATED FINANCIAL STATEMENTS
Consolidated income statement Consolidated statement of changes in equity
Consolidated statement of comprehensive income Segment reporting / Notes to the consolidated financial statements
Consolidated statement of cash flows Notes to the 2011 consolidated financial statements
Consolidated balance sheet Audit opinion | Responsibility statement
Minimum lease payments of finance leases
€m < 1 year 1 – 5 years > 5 years Total
31 December 2011
Present value of future minimum lease payments 5.2 10.2 3.3 18.7
Interest of future minimum lease payments 1.8 3.1 0.4 5.3
Future minimum lease payments 7.0 13.3 3.7 24.0
31 December 2010
Present value of future minimum lease payments 4.8 6.7 4.1 15.6
Interest of future minimum lease payments 1.2 2.7 3.9
Future minimum lease payments 6.0 9.4 4.1 19.5
Additional disclosures on financial instrumentsThe following table assigns the individual balance sheet items for the financial instruments to classes and categories. In addition, the aggregate carrying amounts for each measurement category and the fair values for each class are shown.
Carrying amounts and fair values of financial instruments 31 December 2010 31 December 2011
€mCarrying amount
Fair value Carrying amount
Fair value
Assets
Financial investments – available for sale at cost 40.4 49.0
Financial investments – available for sale at fair value 23.4 23.4 14.9 14.9
Loans and other interest-bearing receivables 161.5 166.3 144.6 144.6
Trade receivables and other operating receivables 1,843.6 1,843.4 2,027.2 2,027.1
Cash and cash equivalents 869.7 869.7 1,869.8 1,869.8
Derivatives – hedge accounting 21.8 21.8 1.2 1.2
Derivatives – held for trading 18.3 18.3 75.8 75.8
Liabilities
Bonds, loans, and other financial liabilities 9,076.3 9,466.8 9,760.5 9,910.0
Trade creditors and other operating liabilities 1,975.7 1,976.9 2,387.5 2,387.5
Liabilities from finance lease 15.6 15.6 18.7 18.7
Derivatives – hedge accounting 45.0 45.0 7.3 7.3
Derivatives – held for trading 10.3 10.3 14.5 14.5
Available for sale at cost investments are equity investments measured at cost, for which no listed price on an active market exists and whose fair values cannot be reliably determined. Therefore, no fair value is indicated for these instruments. Available for sale at fair value investments are measured at fair value on the basis of the stock market prices on the reporting date. Derivative financial instruments, both those designated as hedges and those held for trading, are also measured at fair value. In these items, the fair value always corresponds to the carrying amount.
The fair values of the long-term loans, other long-term operating receivables, bank loans, finance lease liabilities, and other long-term interest-bearing and operating liabilities correspond to the present values of the future payments, taking into account the interest parameters at the time of payment.
Con
solid
ated
fin
anci
al s
tate
men
tsA
ddit
iona
l inf
orm
atio
n
4
5
Com
bine
d m
anag
emen
t re
port
Cor
pora
te G
over
nanc
eC
onso
lidat
ed f
inan
cial
sta
tem
ents
Add
itio
nal i
nfor
mat
ion
To
our
shar
ehol
ders
2
3
4
5
1
Con
ten
ts
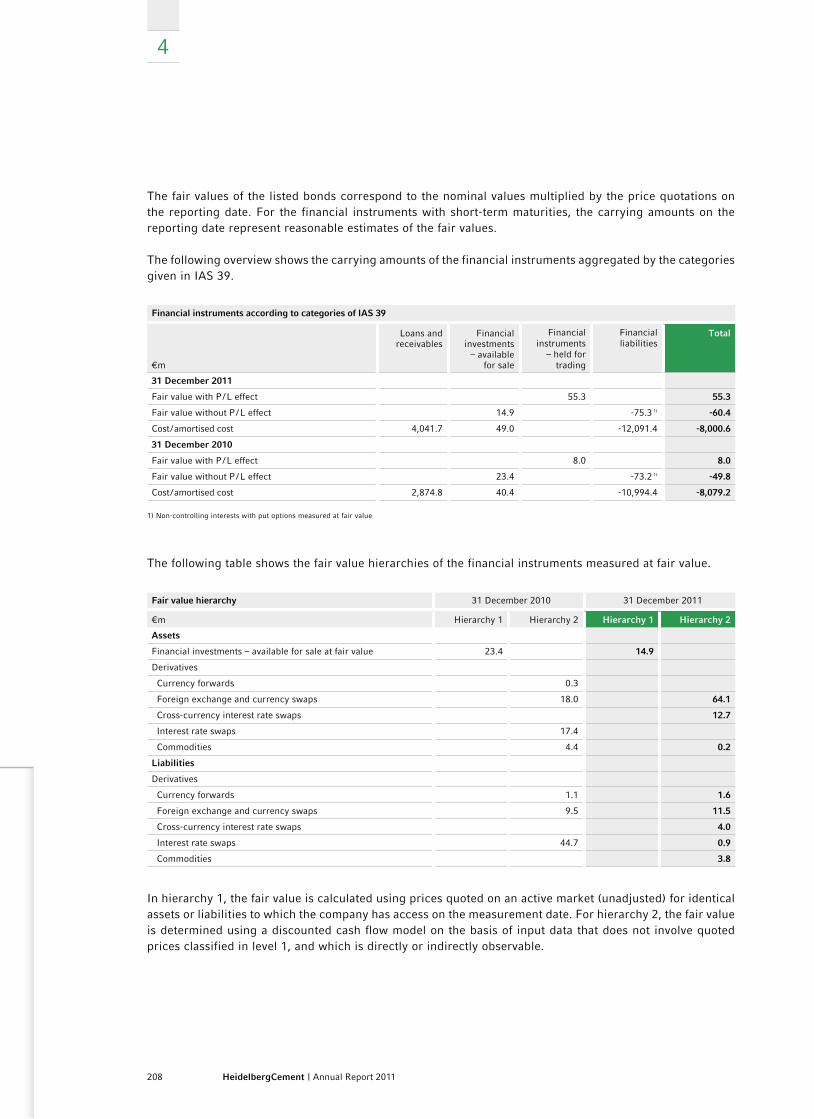
208 HeidelbergCement | Annual Report 2011
4
The fair values of the listed bonds correspond to the nominal values multiplied by the price quotations on the reporting date. For the financial instruments with short-term maturities, the carrying amounts on the reporting date represent reasonable estimates of the fair values.
The following overview shows the carrying amounts of the financial instruments aggregated by the categories given in IAS 39.
Financial instruments according to categories of IAS 39
€m
Loans and receivables
Financial investments
– available for sale
Financial instruments
– held for trading
Financial liabilities
Total
31 December 2011
Fair value with P / L effect 55.3 55.3
Fair value without P / L effect 14.9 -75.3 1) -60.4
Cost / amortised cost 4,041.7 49.0 -12,091.4 -8,000.6
31 December 2010
Fair value with P / L effect 8.0 8.0
Fair value without P / L effect 23.4 -73.2 1) -49.8
Cost / amortised cost 2,874.8 40.4 -10,994.4 -8,079.2
1) Non-controlling interests with put options measured at fair value
The following table shows the fair value hierarchies of the financial instruments measured at fair value.
Fair value hierarchy 31 December 2010 31 December 2011
€m Hierarchy 1 Hierarchy 2 Hierarchy 1 Hierarchy 2
Assets
Financial investments – available for sale at fair value 23.4 14.9
Derivatives
Currency forwards 0.3
Foreign exchange and currency swaps 18.0 64.1
Cross-currency interest rate swaps 12.7
Interest rate swaps 17.4
Commodities 4.4 0.2
Liabilities
Derivatives
Currency forwards 1.1 1.6
Foreign exchange and currency swaps 9.5 11.5
Cross-currency interest rate swaps 4.0
Interest rate swaps 44.7 0.9
Commodities 3.8
In hierarchy 1, the fair value is calculated using prices quoted on an active market (unadjusted) for identical assets or liabilities to which the company has access on the measurement date. For hierarchy 2, the fair value is determined using a discounted cash flow model on the basis of input data that does not involve quoted prices classified in level 1, and which is directly or indirectly observable.
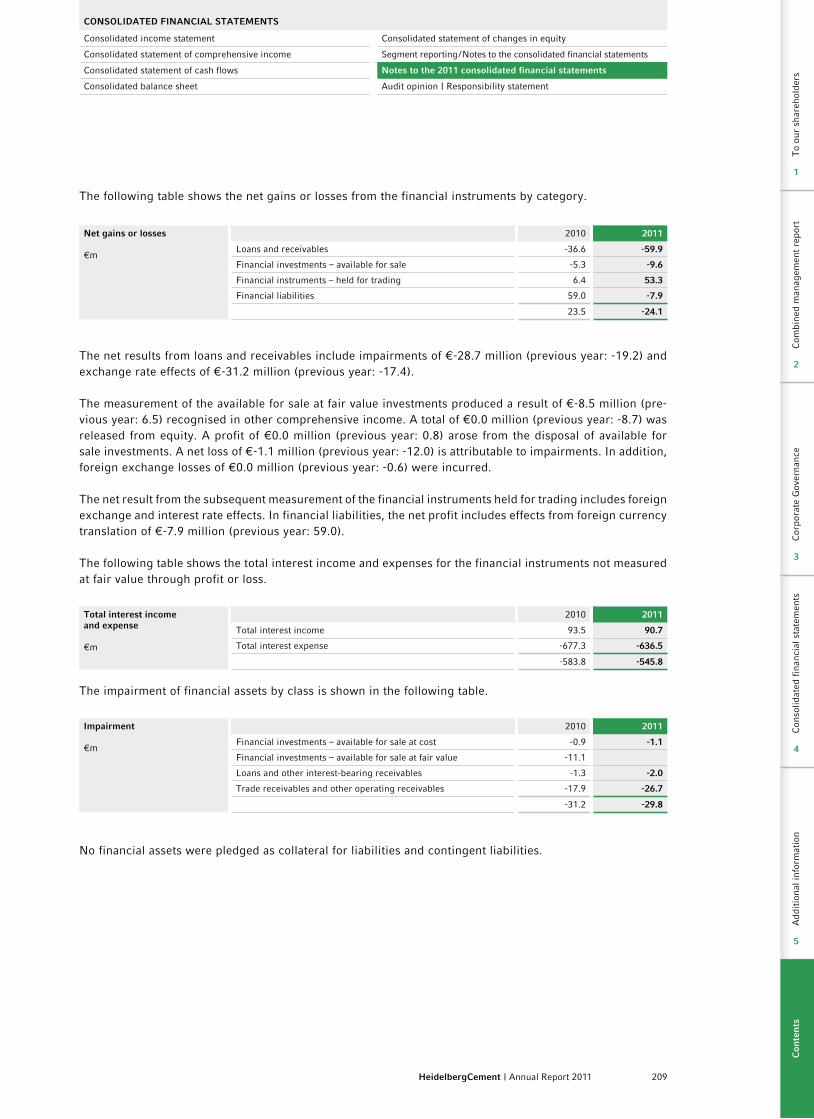
209HeidelbergCement | Annual Report 2011
CoNSoLIDATED FINANCIAL STATEMENTS
Consolidated income statement Consolidated statement of changes in equity
Consolidated statement of comprehensive income Segment reporting / Notes to the consolidated financial statements
Consolidated statement of cash flows Notes to the 2011 consolidated financial statements
Consolidated balance sheet Audit opinion | Responsibility statement
The following table shows the net gains or losses from the financial instruments by category.
Net gains or losses
€m
2010 2011
Loans and receivables -36.6 -59.9
Financial investments – available for sale -5.3 -9.6
Financial instruments – held for trading 6.4 53.3
Financial liabilities 59.0 -7.9
23.5 -24.1
The net results from loans and receivables include impairments of €-28.7 million (previous year: -19.2) and exchange rate effects of €-31.2 million (previous year: -17.4).
The measurement of the available for sale at fair value investments produced a result of €-8.5 million (pre-vious year: 6.5) recognised in other comprehensive income. A total of €0.0 million (previous year: -8.7) was released from equity. A profit of €0.0 million (previous year: 0.8) arose from the disposal of available for sale investments. A net loss of €-1.1 million (previous year: -12.0) is attributable to impairments. In addition, foreign exchange losses of €0.0 million (previous year: -0.6) were incurred.
The net result from the subsequent measurement of the financial instruments held for trading includes foreign exchange and interest rate effects. In financial liabilities, the net profit includes effects from foreign currency translation of €-7.9 million (previous year: 59.0).
The following table shows the total interest income and expenses for the financial instruments not measured at fair value through profit or loss.
Total interest income and expense
€m
2010 2011
Total interest income 93.5 90.7
Total interest expense -677.3 -636.5
-583.8 -545.8
The impairment of financial assets by class is shown in the following table.
Impairment
€m
2010 2011
Financial investments – available for sale at cost -0.9 -1.1
Financial investments – available for sale at fair value -11.1
Loans and other interest-bearing receivables -1.3 -2.0
Trade receivables and other operating receivables -17.9 -26.7
-31.2 -29.8
No financial assets were pledged as collateral for liabilities and contingent liabilities.
Con
solid
ated
fin
anci
al s
tate
men
tsA
ddit
iona
l inf
orm
atio
n
4
5
Com
bine
d m
anag
emen
t re
port
Cor
pora
te G
over
nanc
eC
onso
lidat
ed f
inan
cial
sta
tem
ents
Add
itio
nal i
nfor
mat
ion
To
our
shar
ehol
ders
2
3
4
5
1
Con
ten
ts
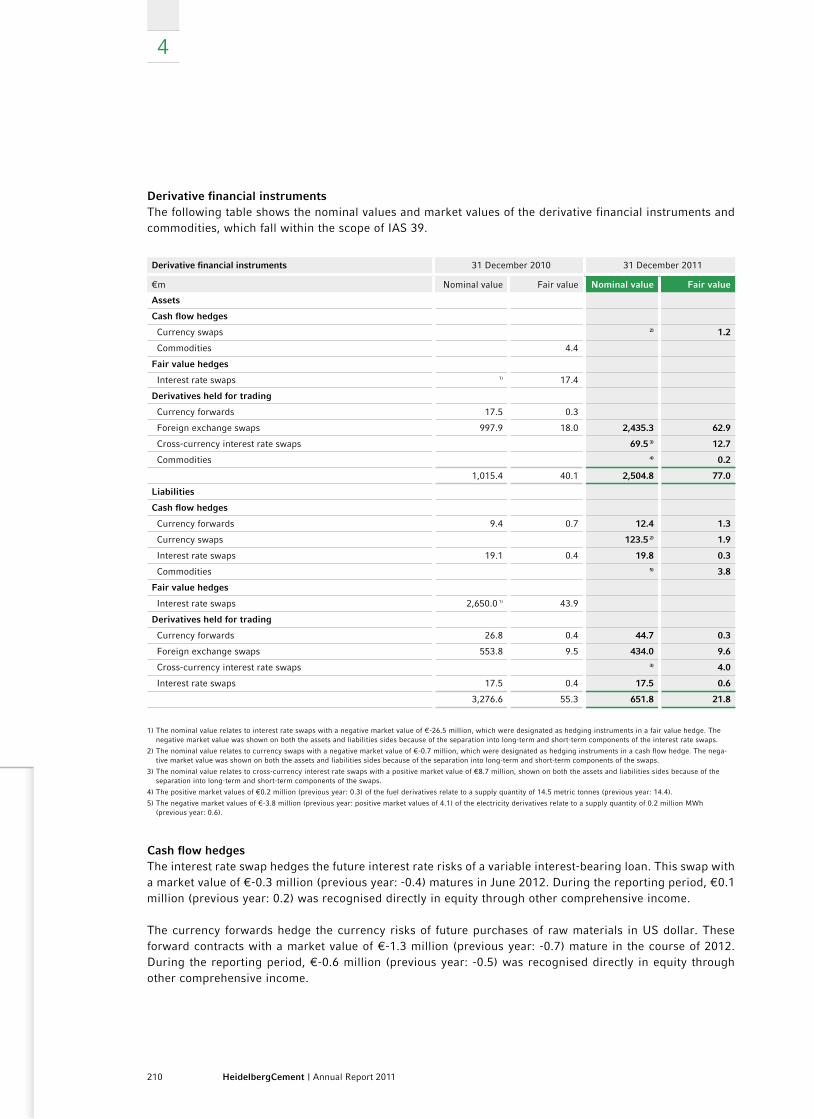
210 HeidelbergCement | Annual Report 2011
4
Derivative financial instruments The following table shows the nominal values and market values of the derivative financial instruments and commodities, which fall within the scope of IAS 39.
Derivative financial instruments 31 December 2010 31 December 2011
€m Nominal value Fair value Nominal value Fair value
Assets
Cash flow hedges
Currency swaps 2) 1.2
Commodities 4.4
Fair value hedges
Interest rate swaps 1) 17.4
Derivatives held for trading
Currency forwards 17.5 0.3
Foreign exchange swaps 997.9 18.0 2,435.3 62.9
Cross-currency interest rate swaps 69.5 3) 12.7
Commodities 4) 0.2
1,015.4 40.1 2,504.8 77.0
Liabilities
Cash flow hedges
Currency forwards 9.4 0.7 12.4 1.3
Currency swaps 123.5 2) 1.9
Interest rate swaps 19.1 0.4 19.8 0.3
Commodities 5) 3.8
Fair value hedges
Interest rate swaps 2,650.0 1) 43.9
Derivatives held for trading
Currency forwards 26.8 0.4 44.7 0.3
Foreign exchange swaps 553.8 9.5 434.0 9.6
Cross-currency interest rate swaps 3) 4.0
Interest rate swaps 17.5 0.4 17.5 0.6
3,276.6 55.3 651.8 21.8
1) The nominal value relates to interest rate swaps with a negative market value of €-26.5 million, which were designated as hedging instruments in a fair value hedge. The negative market value was shown on both the assets and liabilities sides because of the separation into long-term and short-term components of the interest rate swaps.
2) The nominal value relates to currency swaps with a negative market value of €-0.7 million, which were designated as hedging instruments in a cash flow hedge. The nega-tive market value was shown on both the assets and liabilities sides because of the separation into long-term and short-term components of the swaps.
3) The nominal value relates to cross-currency interest rate swaps with a positive market value of €8.7 million, shown on both the assets and liabilities sides because of the separation into long-term and short-term components of the swaps.
4) The positive market values of €0.2 million (previous year: 0.3) of the fuel derivatives relate to a supply quantity of 14.5 metric tonnes (previous year: 14.4).
5) The negative market values of €-3.8 million (previous year: positive market values of 4.1) of the electricity derivatives relate to a supply quantity of 0.2 million MWh (previous year: 0.6).
Cash flow hedgesThe interest rate swap hedges the future interest rate risks of a variable interest-bearing loan. This swap with a market value of €-0.3 million (previous year: -0.4) matures in June 2012. During the reporting period, €0.1 million (previous year: 0.2) was recognised directly in equity through other comprehensive income.
The currency forwards hedge the currency risks of future purchases of raw materials in US dollar. These forward contracts with a market value of €-1.3 million (previous year: -0.7) mature in the course of 2012. During the reporting period, €-0.6 million (previous year: -0.5) was recognised directly in equity through other comprehensive income.

211HeidelbergCement | Annual Report 2011
CoNSoLIDATED FINANCIAL STATEMENTS
Consolidated income statement Consolidated statement of changes in equity
Consolidated statement of comprehensive income Segment reporting / Notes to the consolidated financial statements
Consolidated statement of cash flows Notes to the 2011 consolidated financial statements
Consolidated balance sheet Audit opinion | Responsibility statement
The currency swap with a market value of €-0.7 million (previous year: 0.0) as at the reporting date hedges the currency risk of the fixed interest-bearing CHF 150 million bond, which matures in 2017. The currency swap matures in the following time bands: A portion with a negative market value of €-1.9 million matures within one year and was shown under short-term derivative liabilities. Of the foreign exchange swaps shown under the long-term derivative receivables with a market value of €1.2 million, the portion with a negative market value of €-6.4 million has a term of between 1 and 5 years and the portion with a positive market value of €7.6 million has a term of more than 5 years. During the reporting period, €-0.4 million (previous year: 0.0) was recognised directly in equity through other comprehensive income and €-1.9 million (previous year: 0.0) was released to profit or loss. The accrued interest of €0.3 million (previous year: 0.0) included in the market value was recognised as interest expenses.
The commodities of €-3.8 million (previous year: 4.4) hedge future electricity prices and mature from 2012. In the reporting year, valuation effects of €-8.2 million (previous year: 7.2) were recognised directly in equity through other comprehensive income. The settlement of electricity derivatives caused effects of €1.9 million (previous year: 5.4) to be reclassified from equity to profit or loss.
There was no appreciable ineffectiveness in the cash flow hedges.
Fair value hedgesThe interest rate swap designated as a fair value hedge was disposed of in December 2011 and the designation of the hedging relationship was revoked. The market value in the previous year amounted to €-26.5 million.
The increase in the fair value excluding accrued interest to €37.7 million (previous year: -59.3) in the 2011 reporting period was recognised in profit or loss in the hedging result. Accordingly, the change in the fair value of the loan underlying the hedged risk to €-39.7 million (previous year: 59.4) was also shown in the hedging result. The fair value adjustment of the loan is amortised over the remaining term of the loan in the interest expenses. The accrued interest of €33.5 million (previous year: 32.8) included in the market value of the interest rate swaps was recognised in profit or loss in the interest expenses.
Derivatives not accounted for as hedges (held for trading)Of the derivatives with a market value of €61.3 million (previous year: 8.0), which were not accounted for as hedges in accordance with IAS 39, €49.2 million (previous year: 8.0) matures within a year. The market value of €12.1 million (previous year: 0.0) has a term of between 1 and 5 years.
Risks from financial instruments As regards its assets, liabilities, firm commitments, and planned transactions, HeidelbergCement is particu-larly exposed to risks arising from changes in foreign exchange rates, interest rates, and market and stock market prices. These market price risks may have a negative impact on the Group’s financial position and performance. The Group manages these risks primarily as part of its ongoing business and financing activi-ties and, when required, by using derivative financial instruments. The main aspects of the financial policy are determined by the Managing Board. The Group Treasury department is responsible for implementation of the financial policy and ongoing risk management.
The Group Treasury department acts on the basis of existing binding guidelines, which determine the decision criteria, competences, responsibilities, and processes for managing the financial risks. Certain transactions also require the prior approval of the Managing Board. The Group Treasury department informs the Managing Board on an ongoing basis about the amount and scope of the current risk exposure and the current market development on the global financial markets. The Group Internal Audit department monitors the observance of the guidelines mentioned above and the corresponding legal framework by means of targeted auditing.
Con
solid
ated
fin
anci
al s
tate
men
tsA
ddit
iona
l inf
orm
atio
n
4
5
Com
bine
d m
anag
emen
t re
port
Cor
pora
te G
over
nanc
eC
onso
lidat
ed f
inan
cial
sta
tem
ents
Add
itio
nal i
nfor
mat
ion
To
our
shar
ehol
ders
2
3
4
5
1
Con
ten
ts
212 HeidelbergCement | Annual Report 2011
4
Credit riskHeidelbergCement is exposed to credit risks through its operating activities and certain financial transac-tions. The credit risk is the risk that a contracting party unexpectedly does not fulfil, or only partially fulfils, the obligations agreed when signing a financial instruments contract. The Group limits its credit risk by only concluding contracts for financial investments and derivative financial instruments with partners with a first-class credit rating.
Credit ratingThe rating agencies Standard & Poor’s, Moody’s, and Fitch Ratings assess the creditworthiness of Heidel-bergCement as BB/B (stable outlook), Ba1/Not Prime (stable outlook), and BB+/B (stable outlook) as at the end of 2011. Any potential downgrading of the ratings awarded by the rating agencies could have a negative impact on HeidelbergCement’s cost of capital and refinancing possibilities.
Cash and cash equivalentsThis item essentially comprises cash. The Group is exposed to losses arising from credit risks in connection with the investment of cash and cash equivalents if contracting parties do not fulfil their obligations. Hei-delbergCement manages the resulting risk position by diversification of contracting parties. Cash and cash equivalents are invested in selected companies, banks, and financial institutions following a thorough credit analysis. At present, no cash or cash equivalents are overdue or impaired as a result of default. The maximum credit risk of the cash and cash equivalents corresponds to the carrying amount.
Trade receivablesTrade receivables result mainly from the sale of cement, concrete, and aggregates. In operating activities, the outstanding debts are monitored on an ongoing basis. Credit risks are taken into account by means of individual impairments and collective impairments. The maximum risk position from the trade receivables corresponds to the carrying amount.
other receivables and assetsThe credit risk position from other receivables and assets corresponds to the carrying amount of these instru-ments. HeidelbergCement regards this credit risk as insignificant.
Derivative financial instrumentsDerivative financial instruments are generally used to reduce risks. In the course of its business activity, HeidelbergCement is exposed to interest rate, currency, and energy price risks. For accounting purposes, a significant portion of the derivatives are not accounted for as hedges in accordance with IAS 39, but as in-struments in the category held for trading. However, from a commercial perspective, the changes in the fair values of these instruments represent an economically effective hedge within the context of the Group strategy. The maximum credit risk of this item corresponds to the fair value of the derivative financial instruments that have a positive market value and are shown as financial assets at the reporting date. Interest rate swaps and cross-currency interest rate swaps were contracted to hedge the fair value risk, and were designated as hedging instruments in accordance with IAS 39. In order to reduce the credit risk, the hedging transactions are, in principle, only concluded with leading financial institutions with a first-class credit rating. The contract-ing parties have very good credit ratings, awarded by external rating agencies, such as Moody’s, Standard & Poor’s, or Fitch Ratings. There are currently no past-due derivative financial instruments in the portfolio.
Liquidity riskThe liquidity risk describes the risk that a company cannot fulfil its financial obligations to a sufficient degree. To manage HeidelbergCement’s liquidity, the Group maintains sufficient cash and extensive credit lines with banks, besides the cash inflow from operating activities. The operating liquidity management includes a daily

213HeidelbergCement | Annual Report 2011
CoNSoLIDATED FINANCIAL STATEMENTS
Consolidated income statement Consolidated statement of changes in equity
Consolidated statement of comprehensive income Segment reporting / Notes to the consolidated financial statements
Consolidated statement of cash flows Notes to the 2011 consolidated financial statements
Consolidated balance sheet Audit opinion | Responsibility statement
reconciliation of cash and cash equivalents; the Group Treasury department, based in Heidelberg, acts as an in-house bank. This allows liquidity surpluses and requirements to be managed in accordance with the needs of the entire Group and of individual Group companies.
As at the end of the year, HeidelbergCement still has as yet undrawn, confirmed credit lines of €2.7 billion available in order to secure liquidity, as well as available cash. A framework agreement for an unlimited period for the issue of short-term bearer bonds (Commercial Paper) of €1.0 billion is available to cover short-term liquidity peaks. Within the framework of the programme, individual tranches with different terms will be issued at different times depending on the market situation. As at the end of 2011, Commercial Papers total-ling €52.0 million were outstanding. Further information on liquidity risks can be found in the Management report, Risk report chapter, on page 85 f.
As the financial contracts of HeidelbergCement do not contain any clauses that trigger a repayment obligation in the event of the credit rating being downgraded, the maturity structure will remain unaffected even if the credit quality assessments change. Margin calls that could lead to an outflow of liquidity are not agreed in any of the material financial instruments. All derivative financial instruments are contracted on the basis of existing framework agreements that contain netting agreements for the purpose of reducing credit and liquidity risks.
In 2011, two bonds and a debt certificate were issued. The issue proceeds were used to refinance existing bank debts and to pre-finance the bond of €1 billion maturing in January 2012. The bonds were issued in October and November with terms of seven years (€300 million in October and increase of €200 million in November to a total of €500 million) and six years (issue of CHF 150 million in November). The debt certificate of €289 million with a maturity date of October 2016 was placed in December.
The following maturity overview shows how the cash flows of the liabilities as at 31 December 2011 affect the Group’s liquidity position. The overview describes the progress of:– undiscounted repayments and interest payments for debenture loans,– undiscounted bank loans and interest payments to banks,– undiscounted other liabilities, and– undiscounted contractually agreed payments for derivative financial instruments, as a total for the year.
The trade payables are assigned to short-term maturities (within a year). For variable interest payments, the current interest rate is taken as a basis. Payments in foreign currency are translated using the exchange rate at year end.
Cash flows of interest-bearing liabilities and derivative financial instruments
€m
Carrying amount
31 Dec. 2011Cash flows
2012Cash flows
2013Cash flows
2014Cash flows
2015Cash flows
2016 – 2024
Bonds payable 8,012.2 1,574.1 1,052.9 1,458.5 1,683.5 4,752.7
Bank loans 1,310.7 601.5 821.5 184.3 29.1 397.5
Other interest-bearing liabilities 456.3 228.0 35.9 24.8 48.2 15.0
Derivatives with positive market value
Cash flow hedges 1.2 1)
Derivatives held for trading 75.8 2,440.9 5.6 5.6 5.6 2.0
Derivatives with negative market value
Cash flow hedges 7.3 24.0 10.9 10.9 10.9 20.5
Derivatives held for trading 14.5 479.1 0.5 0.5 0.5 0.5
1) The contractually agreed payments are shown in the payments from cash flow hedges with negative market value.
Con
solid
ated
fin
anci
al s
tate
men
tsA
ddit
iona
l inf
orm
atio
n
4
5
Com
bine
d m
anag
emen
t re
port
Cor
pora
te G
over
nanc
eC
onso
lidat
ed f
inan
cial
sta
tem
ents
Add
itio
nal i
nfor
mat
ion
To
our
shar
ehol
ders
2
3
4
5
1
Con
ten
ts

214 HeidelbergCement | Annual Report 2011
4
Cash flows of interest-bearing liabilities and derivative financial instruments
€m
Carrying amount
31 Dec. 2010Cash flows
2011Cash flows
2012Cash flows
2013Cash flows
2014Cash flows
2015 – 2024
Bonds payable 7,728.8 506.4 1,506.4 976.2 1,400.9 5,574.8
Bank loans 1,139.0 215.8 455.4 378.2 159.8 56.3
Other interest-bearing liabilities 724.1 374.0 180.0 1.9 2.0 37.0
Derivatives with positive market value
Cash flow hedges 4.4 2.0
Fair value hedges 17.4
Derivatives held for trading 18.3 1,015.4
Derivatives with negative market value
Cash flow hedges 1.1 8.7 0.6
Fair value hedges 43.9 176.5 176.5 176.5 165.1 181.7
Derivatives held for trading 10.3 581.1 0.4 0.4 0.4 0.9
The inflow of liquidity of €64.3 million (previous year: 993.5) from interest rate and cross-currency interest rate swaps has not been taken into account in the table.
The undiscounted contractual cash flows of the finance lease liabilities are shown in a separate table on page 207.
Interest rate riskInterest rate risks exist as a result of potential changes in the market rate of interest and may lead to a change in fair value in the case of fixed interest-bearing financial instruments and to fluctuations in interest payments in the case of variable interest-bearing financial instruments. The Managing Board and Supervisory Board of HeidelbergCement AG have decided against hedging the variable interest-bearing financial instruments. This strategy is based on the historically strong correlation between increasing profits and rising interest rates. For financial instruments with fixed interest that are measured at amortised cost, interest rate risks have no impact on the results and equity.
The average share of variable interest-bearing financial instruments is 40% (previous year: 43%). If the market interest rate level had been 100 basis points higher (lower) on 31 December 2011, the interest cost of the HeidelbergCement Group would have risen (fallen) by €34 million (previous year: 38).
Currency riskHeidelbergCement’s currency risks result from its investing, financing, and operating activities. Risks from foreign currencies are primarily hedged insofar as they affect the Group’s cash flows. By contrast, foreign currency risks that do not affect the Group’s cash flows (i.e. the risks resulting from the translation of the assets and liabilities of foreign subsidiaries into the Group reporting currency) generally remain unhedged. However, if necessary, HeidelbergCement can also hedge this foreign currency risk. Currency forwards and foreign exchange swaps are used in the elimination of existing currency risks.
Through the in-house banking activities of HeidelbergCement AG, the borrowing and investment of liquidity of the subsidiaries leads to currency positions that are hedged by means of external foreign exchange swap transactions, which are appropriate in terms of maturities and amounts. Consequently, currency fluctuations in connection with the in-house banking activities would have no impact on results or equity.
The hypothetical result implications, considering the external financial instruments (primarily foreign exchange swap transactions) in isolation and in the event of a 10% increase (decrease) in the value of the euro against all other currencies on 31 December 2011, would be as follows:

215HeidelbergCement | Annual Report 2011
CoNSoLIDATED FINANCIAL STATEMENTS
Consolidated income statement Consolidated statement of changes in equity
Consolidated statement of comprehensive income Segment reporting / Notes to the consolidated financial statements
Consolidated statement of cash flows Notes to the 2011 consolidated financial statements
Consolidated balance sheet Audit opinion | Responsibility statement
On 31 Dec. 2011: EUR/USD: EUR +103.0 million, EUR/AUD: EUR +58.5 million, EUR/CHF: EUR -4.0 million, EUR/SEK: EUR -6.0 million, EUR/GBP: EUR +13.7 million, EUR/NOK: EUR +22.7 million, EUR/CAD: EUR +12.4 million, EUR/DKK: EUR -1.6 million, EUR/CZK: EUR +1.5 million, EUR/RUB: EUR -38.3 million, EUR/ILS: EUR +5.2 million, EUR/LTL: EUR -0.2 million, EUR/PLN: EUR +1.5 million, EUR/SGD: EUR +0.9 million, EUR/HKD: EUR +0.2 million, EUR/KZT: EUR -5.0 million, EUR/RON: EUR +5.6 million, AUD/USD: EUR -0.3 million, GEL/USD: EUR -1.6 million, DKK/CHF: EUR -0.7 million, CNY/USD: EUR -1.6 million, TRY/USD: EUR -0.6 million.
On 31 Dec. 2010: EUR/USD: EUR +11.8 million, EUR/AUD: EUR +49.2 million, EUR/SEK: EUR -4.9 million, EUR/GBP: EUR +6.0 million, EUR/NOK: EUR +11.1 million, EUR/CAD: EUR +21.1 million, EUR/DKK: EUR -0.8 million, EUR/CZK: EUR +1.2 million, EUR/RUB: EUR -25.2 million, EUR/ILS: EUR +4.3 million, EUR/PLN: EUR +0.4 million, EUR/HKD: EUR +2.7 million, EUR/LVL: EUR -0.4 million, EUR/INR: EUR -0.6 million, EUR/MYR EUR +0.7 million, IDR/USD: EUR -1.9 million, EUR/KZT: EUR -3.2 million, EUR/RON: EUR -6.0 million, CAD/USD: EUR -0.8 million, SEK/LVL: EUR -0.4 million, AUD/USD: EUR -0.4 million.
Capital managementTo ensure the sustainability of the Group’s financial position and performance, the management primarily employs three instruments. The investments are aligned with HeidelbergCement’s strategic and operational planning. For all investments, with the exception of replacement investments, the long-term contribution to results for the Group is measured and tested. Significant strategic investments with a volume exceeding €10 million are subject to central testing and are presented individually to the Managing Board. The test centers on the impact of investments on the income statement, balance sheet, and statement of cash flows of the Group.
HeidelbergCement also uses country-specific weighted average cost of capital after tax, which was between 6.4% and 15.4% for 2011 (previous year: between 6.5% and 18.9%). All decisions regarding the profitability of expansion investments are measured against the internal profitability goals on the basis of the weighted average cost of capital.
HeidelbergCement has a worldwide, results-related remuneration system for the management. Clear goal agreements ensure a management approach that focuses on results and capital requirements. For all countries in the Group, the Managing Board defines the target result and working capital required in order to obtain bonus payments.
Through quarterly meetings with all country managers, the Managing Board of HeidelbergCement discusses and follows up on agreed goals and countries’ results and outlook, as well as the strategic orientation. An extensive discussion on operational planning at national level is held with all countries in the fourth quarter. In face-to-face meetings with the national management, the Managing Board establishes result goals, steering of specific activities, and major investments.
The ratio of net debt to operating income before depreciation (OIBD) is of fundamental importance in the monitoring of the Group’s capital.
Net debt / oIBD
€m
31 Dec. 2010 31 Dec. 2011
Cash and derivative financial instruments 905.7 1,932.9
Interest-bearing liabilities 9,147.3 9,801.0
Non-controlling interests with put options -95.6 -97.9
Net debt 8,146.0 7,770.2
Operating income before depreciation (OIBD) 2,239.4 2,320.7
Net debt / oIBD 3.64 3.35
Con
solid
ated
fin
anci
al s
tate
men
tsA
ddit
iona
l inf
orm
atio
n
4
5
Com
bine
d m
anag
emen
t re
port
Cor
pora
te G
over
nanc
eC
onso
lidat
ed f
inan
cial
sta
tem
ents
Add
itio
nal i
nfor
mat
ion
To
our
shar
ehol
ders
2
3
4
5
1
Con
ten
ts
216 HeidelbergCement | Annual Report 2011
4
In connection with credit agreements, HeidelbergCement agreed to comply with various financial covenants, which were all met in the reporting period. The most important key financial ratios are the ratio of net debt to EBITDA and the interest coverage ratio. The EBITDA key figure is derived from the credit agreements and therefore differs from the operating income before depreciation key figure as it takes elements of the ad-ditional ordinary result and adjustments from changes in the consolidation scope into consideration. Further explanations are given in the Management report on page 86.
Within the framework of the Group planning, compliance with the credit agreements is monitored consist-ently, with notification issued to the creditors on a quarterly basis. In the event of a breach of the covenants, the creditors could, under certain conditions, accelerate corresponding loans irrespective of the contractually agreed terms.
Guarantees and other financial commitmentsGuarantees are potential future obligations to third parties, the existence of which depends on the occurrence of at least one uncertain future event outside HeidelbergCement’s control.
As at the reporting date, there were contingent liabilities of €34.5 million (previous year: 34.4) in connec-tion with tax-related and other risks. Contingent liabilities also exist for contractually provided guarantees of €591.6 million (previous year: 523.9), for which the Group assesses the probability of outflow to be remote.
other financial commitments
€m
2010 2011
Rental and leasing contracts
Total of all leasing payments mature within 1 year 98.6 142.5
Total of all leasing payments mature within 1 to 5 years 246.5 313.0
Total of all leasing payments mature after more than 5 years 362.0 412.6
707.1 868.1
other financial commitments for planned investments in property, plant, and equipment, and financial assets 270.7 244.6
Other financial commitments are listed with their nominal values. The future rental and leasing obligations refer primarily to property and other assets used by HeidelbergCement.
Related parties disclosuresIAS 24 requires a statement concerning the most important relationships with related parties that may exert a significant influence on HeidelbergCement AG. This applies also to companies accounted for as joint ventures or associates and key management personnel.
As at 31 December 2011, Mr Ludwig Merckle, Ulm, indirectly holds a 25.11% share in HeidelbergCement AG via various companies including UBH Holding GmbH, Zossen, and Spohn Cement Beteiligungen GmbH, Zossen.
HeidelbergCement AG provided services with a net amount of €215,000 (previous year: 574,100) to PHOENIX Pharmahandel GmbH & Co KG, Mannheim, a company of the Merckle Group.
On 13 September 2009, HeidelbergCement AG reached a cooperation agreement with the following com-panies belonging to the Merckle Group: SC Vermögensverwaltung GmbH (formerly Spohn Cement GmbH), VEM Vermögensverwaltung GmbH, HC Treuhand GmbH, and VEM erste Treuhand GmbH. The agreement expired on 30 June 2011.
Business transactions with associates include revenue and other sales amounting to €15.1 million (previous year: 22.9), the procurement of goods and services amounting to €22.7 million (previous year: 9.0), and
217HeidelbergCement | Annual Report 2011
CoNSoLIDATED FINANCIAL STATEMENTS
Consolidated income statement Consolidated statement of changes in equity
Consolidated statement of comprehensive income Segment reporting / Notes to the consolidated financial statements
Consolidated statement of cash flows Notes to the 2011 consolidated financial statements
Consolidated balance sheet Audit opinion | Responsibility statement
services provided amounting to €0.5 million (previous year: 0.3). In addition, capital increases of €0.4 million (previous year: 2.4) were carried out at associated companies in 2011. Receivables of €1.0 million (previous year: 0.0) were impaired.
Intra-Group revenue and other sales with joint ventures amounted to €153.3 million (previous year: 66.1). Raw materials, goods, and other services amounting to €342.5 million (previous year: 114.5) were procured from these joint ventures. A total of €7.6 million (previous year: 3.3) was generated in financial and other services. Receivables amounting to €169.4 million (previous year: 81.4) and liabilities of €74.8 million (previous year: 39.2) exist in connection with these activities and financial transactions.
In addition, capital increases of €18.2 million (previous year: 1.1) were carried out for joint ventures. This primarily related to capital increases carried out by Heidelberger Beton GmbH in Lithonplus GmbH & Co. KG for €10.2 million, by S.A. Cimenteries CBR in GriVaLim S.A. for €2.2 million, by Heidelberger Sand und Kies GmbH in Mibau Holding GmbH for €2.0 million, and by Hanson Aggregates LLC in Terrell Materials LLC for €1.9 million.
Guarantees of €58.4 million (previous year:70.6) were outstanding to joint ventures.
In addition, companies of the HeidelbergCement Group have not carried out reportable transactions of any kind with members of the Supervisory Board or of the Managing Board as persons in key positions or with companies in whose executive or governing bodies these persons are represented.
Statement of compliance with the German Corporate Governance CodeThe statement of compliance with the German Corporate Governance Code required by § 161 of the Ger-man Stock Company Act (Aktiengesetz) was submitted by the Managing Board and the Supervisory Board of HeidelbergCement AG on 10 February 2011. The statement for 2012 was published on the website www.heidelbergcement.com on 9 February 2012.
Fees of the independent auditorsIn 2011, the independent auditors Ernst & Young GmbH Wirtschaftsprüfungsgesellschaft received fees amount-ing to €4.2 million (previous year: 4.7).
Fees of the independent auditors
€m
2010 2011
Audit services 2.9 3.1 1)
Other assurance services 1.0 0.3
Tax services 0.3 0.5
Other services 0.5 0.3
4.7 4.2
1) Thereof for the previous year: €0.2 million
Supervisory Board and Managing BoardWe refer to the details given in the Corporate Governance chapter of the management report (pages 127 f.)
The fixed remuneration of the Managing Board increased in comparison with the previous year to €4.8 million (previous year: 4.3). By contrast, the sum of short-term variable remuneration elements, which only comprised a one-year bonus in 2011, decreased to €4.5 million (previous year: 8.1).
The members of the Managing Board are participating in the long-term bonus plan 2011–2013/14, issued for the first time in 2011. The target values for the plan are €1,188,000 for Dr. Bernd Scheifele and €630,000 for each of the other members of the Managing Board. The plan comprises two equally weighted components:
Con
solid
ated
fin
anci
al s
tate
men
tsA
ddit
iona
l inf
orm
atio
n
4
5
Com
bine
d m
anag
emen
t re
port
Cor
pora
te G
over
nanc
eC
onso
lidat
ed f
inan
cial
sta
tem
ents
Add
itio
nal i
nfor
mat
ion
To
our
shar
ehol
ders
2
3
4
5
1
Con
ten
ts
218 HeidelbergCement | Annual Report 2011
4
the management component and the capital market component. The target value of each component amounts to €594,000 for Dr. Bernd Scheifele and €315,000 for each of the other members of the Managing Board. The reference price for the capital market component amounts to €41.30. This equates to 14,383 Performance Share Units (PSUs) for Dr. Bernd Scheifele and 7,627 PSUs for each of the other members of the Managing Board. In accordance with § 314, section 1, no. 6a, sentence 4 German Commercial Code (HGB), the fair value at the grant date must be indicated for the capital market components. For Dr. Bernd Scheifele this amounts to €457,000 and for each of the other members of the Managing Board €243,000.
The expenses from the long-term capital market component in accordance with IFRS 2.15 amounted to €279,000 (previous year: 0), of which €76,500 relate to Dr. Scheifele and €40,500 relate to each of the other members of the management board. The expenses recognised relating to the long-term management com-ponent amounted to €0 million (previous year: 0).
Other remuneration elements totalled €1.4 million (previous year: 1.2). The other remuneration elements con-sisted of payments for committee activities at subsidiaries of HeidelbergCement AG and taxable fringe benefits consisting of the provision of company cars, driving and administration services, mobile phone and commu-nication resources, the reimbursement of expenses, as well as insurance- and assignment-related benefits.
Total remuneration of the Managing Board in 2011 amounted to €11.4 million (previous year: 13.6). Furthermore, according to § 314, section 1, no. 6a, sentence 3 German Commercial Code (HGB), a sum of €0.7 million must still be specified; this is primarily attributable to the subsequent adjustment of the 2010 annual bonus by the Supervisory Board. This correction via the discretionary arrangement was effected because of the gap that arose following the discontinuation of the medium-term bonus, which was granted for the last time in the period 2008–2009.
In 2011, allocations to provisions for pensions (current service cost) for members of the Managing Board amounted to €1.8 million (previous year: 1.3). The present values of the defined benefit obligation amounted to €19.9 million (previous year: 17.4). Payments to former members of the Managing Board and their surviving dependants amounted to €3.0 million (previous year: 3.0) in 2011. Provisions for pension obligations to former members of the Managing Board amounted to €27.8 million (previous year: 28.1).
Total Supervisory Board remuneration (excluding value added tax) paid for the 2011 financial year amounted to €803,000 (previous year: 815,432). The total remuneration received by the members of the Supervisory Board in the 2011 financial year for their activities at HeidelbergCement AG outside their service on the Super-visory Board amounted to €403,000 (previous year: 394,000). These amounts only include remuneration that the employee representatives received as employees of HeidelbergCement AG.
Events occurring after the close of the 2011 financial yearOn 25 January 2012, HeidelbergCement repaid the €1 billion Eurobond 2008/2012 by using available liquidity and by making use of credit lines.
On 31 January 2012, HeidelbergCement secured the extension of its €3 billion syndicated credit line, originally maturing at the end of 2013, until 31 December 2015. All 17 banks involved so far have confirmed their partici-pation and two further banks have joined the syndicate. The agreement was signed on 17 February 2012. The €3 billion credit line with a currency option is intended as a liquidity reserve and can be used for cash drawings and avals. As a result of the extension, the margins rose by 25 basis points over the entire margin grid and by a further 50 basis points in the case of US dollar drawings. The one-off extension fee amounted to 45 basis points. HeidelbergCement will pay a utilisation fee of 15 basis points upon first drawing. All other terms remained unchanged.
On 8 March 2012, HeidelbergCement issued a Eurobond under its €10 billion EMTN programme with an issue volume of €300 million and a maturity date of 8 March 2016. The bond bears a fixed coupon of 4.00% p.a. The issue price was at 100.0%, resulting in a yield to maturity of 4.00%. The bond is unsecured and ranks
219HeidelbergCement | Annual Report 2011
CoNSoLIDATED FINANCIAL STATEMENTS
Consolidated income statement Consolidated statement of changes in equity
Consolidated statement of comprehensive income Segment reporting / Notes to the consolidated financial statements
Consolidated statement of cash flows Notes to the 2011 consolidated financial statements
Consolidated balance sheet Audit opinion | Responsibility statement
pari passu with all other capital market debt. As with all the bonds issued since 2009 and the debt certificate issued in December 2011, the bond terms and conditions include a limitation on incurring additional debt. The proceeds of the transaction will be used for general corporate purposes.
Approval of the consolidated financial statementsThe consolidated financial statements were prepared by the Managing Board and adopted on 14 March 2012. They were then submitted to the Supervisory Board for approval.
List of shareholdings of HeidelbergCement Group and HeidelbergCement AG as at 31 December 2011 (§ 313, section 2, resp. § 285, no. 11 of the German Commercial Code (HGB))
Company name Corporate seat HC AG direct
owner-ship %
Group owner-ship %
Cur-rency
Equity in million
Net in-come in million
Subsidiaries
Western and Northern Europe
“Exakt” Kiesaufbereitung-Gesellschaft mit beschränkter Haftung & Co Kommanditgesellschaft * Paderborn, DEU 100.00 100.00 EUR 1 0
A.R.C. (Western) Limited Maidenhead, GBR 100.00 GBP 6 0**
AB Gotlands Kalkverk Stockholm, SWE 100.00 SEK 8 0**
Abetong AB Växjö, SWE 100.00 SEK 285 42
Alexandre Limited Maidenhead, GBR 100.00 GBP 4 0**
Amey Group Limited (The) Maidenhead, GBR 100.00 GBP 13 0**
Amey Roadstone International Limited Maidenhead, GBR 100.00 GBP 0 0**
Appleby Group Limited Maidenhead, GBR 100.00 GBP 75 1**
ARC Aggregates Limited Maidenhead, GBR 100.00 GBP 3 0**
ARC Building Limited Maidenhead, GBR 100.00 GBP -18 0**
ARC Concrete (Anglia) Limited Maidenhead, GBR 100.00 GBP 0 0**
ARC Concrete Limited Maidenhead, GBR 100.00 GBP 0 0**
ARC Holdings Limited Maidenhead, GBR 100.00 GBP 0 0**
ARC Land Holdings Limited Maidenhead, GBR 100.00 GBP 0 0**
ARC Limited Maidenhead, GBR 100.00 GBP 0 0**
ARC Property Investments Limited Maidenhead, GBR 100.00 GBP 39 0**
ARC Slimline Limited Maidenhead, GBR 100.00 GBP -3 0**
ARC South Wales Limited Maidenhead, GBR 100.00 GBP 0 0**
ARC South Wales Mortar Limited Maidenhead, GBR 100.00 GBP 0 0**
ARC South Wales Quarries Limited Maidenhead, GBR 100.00 GBP 0 0**
ARC South Wales Surfacing Limited Maidenhead, GBR 100.00 GBP 0 0**
ARC Wales Limited Maidenhead, GBR 100.00 GBP 0 0**
Aridos Martinez Garcia S.L. Toledo, ESP 100.00 EUR 0 -1**
Aridos Sanz S.L. Valladolid, ESP 100.00 EUR 5 0**
Aridos Velilla, S.A. Toledo, ESP 100.00 EUR -3 -2**
AS Abetong Oslo, NOR 100.00 NOK 5 0**
Attendflower Limited Maidenhead, GBR 100.00 GBP 1,000 0**
B.V. Betoncentrale De Schelde Bergen op Zoom, NLD 60.00 EUR 4 0**
B.V. Betonmortelcentrale “BEMA” Alkmaar, NLD 66.67 EUR 7 0**
B.V. Bouwgrondstoffen A.G.M. Amsterdam, NLD 90.00 EUR 2 1**
B.V. Internationale Bagger- Scheepvaart- en Handel Maatschappij I Amsterdam, NLD 100.00 EUR 2 0**
Baltic Saule Riga, LVA 100.00 LVL 1 0**
Banbury Alton Limited Maidenhead, GBR 100.00 GBP 0 0**
Basalt Ibérica, S.A. Madrid, ESP 100.00 EUR 2 0**
Bath and Portland Stone (Holdings) Limited Maidenhead, GBR 100.00 GBP 0 0**
Baustoffwerke Dresden GmbH & Co. KG * Dresden, DEU 51.00 EUR 1 1
Beazer Insurance Services Limited Douglas, IMN 100.00 GBP 1 0**
Beazer Limited Maidenhead, GBR 100.00 GBP 3 0**
Beforebeam Limited Maidenhead, GBR 100.00 GBP 400 0**
Beforeblend Limited Maidenhead, GBR 100.00 GBP 204 0**
Con
solid
ated
fin
anci
al s
tate
men
tsA
ddit
iona
l inf
orm
atio
n
4
5
Com
bine
d m
anag
emen
t re
port
Cor
pora
te G
over
nanc
eC
onso
lidat
ed f
inan
cial
sta
tem
ents
Add
itio
nal i
nfor
mat
ion
To
our
shar
ehol
ders
2
3
4
5
1
Con
ten
ts
220 HeidelbergCement | Annual Report 2011
4
Company name Corporate seat HC AG direct
owner-ship %
Group owner-ship %
Cur-rency
Equity in million
Net in-come in million
Berec Holdings B.V. Amsterdam, NLD 100.00 EUR 188 12
Beton Baguette Marcel S.A. Brussels, BEL 85.29 EUR 1 0**
Béton de Liège SA Brussels, BEL 85.27 EUR 1 0**
Betong Sör AS Oslo, NOR 67.50 NOK 15 4**
Betongindustri AB Stockholm, SWE 100.00 SEK 92 1
Bickleylake Limited Maidenhead, GBR 100.00 GBP 7 0**
Birchwood Concrete Products Limited Maidenhead, GBR 100.00 GBP 159 0**
Birchwood Omnia Limited Maidenhead, GBR 100.00 GBP 1,012 27**
BLG Betonlieferungsgesellschaft mit beschränkter Haftung Munich, DEU 100.00 EUR 5 0
Bonny Holding Ltd. Irish Town, GIB 93.94 USD 3 -1**
Boons Granite Quarries Limited Maidenhead, GBR 100.00 GBP 0 0**
Brazier Aggregates Limited Maidenhead, GBR 100.00 GBP 2 0**
Bristol Sand and Gravel Company Limited Maidenhead, GBR 100.00 GBP 0 0**
British Agricultural Services Limited Maidenhead, GBR 100.00 GBP 345 3**
British Ever Ready Limited Maidenhead, GBR 100.00 GBP 24 0**
Buckland Sand & Silica Company Limited Maidenhead, GBR 100.00 GBP 0 0**
Building Material Holdings B.V. Amsterdam, NLD 100.00 EUR 1 1
Bulldog Company Limited St. Peter Port, GGY 100.00 USD 61 -2**
Butterley Brick Investments (No 2) Limited Maidenhead, GBR 100.00 GBP 26 0**
Butterley Brick Limited Maidenhead, GBR 100.00 GBP 0 0**
C.B.R. Finance S.A. Luxembourg, LUX 100.00 EUR 4 0**
Calumite Limited Maidenhead, GBR 51.00 GBP 2 1**
Cantera El Hoyon, S.A. Madrid, ESP 100.00 EUR 5 0**
Canteras Mecánicas Cárcaba, S.A. Oviedo, ESP 100.00 EUR 13 1**
Carrières d’Antoing S.A. Tournai, BEL 100.00 EUR 14 0**
Castle Building Products Limited Maidenhead, GBR 100.00 GBP 0 0**
Castle Cement (Chatburn) Limited Maidenhead, GBR 100.00 GBP 0 0**
Castle Cement (Clyde) Limited Maidenhead, GBR 100.00 GBP 0 0**
Castle Cement (Ketton) Limited Maidenhead, GBR 100.00 GBP 23 0**
Castle Cement (Padeswood) Limited Maidenhead, GBR 100.00 GBP 6 0**
Castle Cement (Pitstone) Limited Maidenhead, GBR 100.00 GBP 10 0**
Castle Cement (Ribblesdale) Limited Maidenhead, GBR 100.00 GBP 21 0**
Castle Cement Limited Maidenhead, GBR 100.00 GBP 124 35**
Castle Lime Limited Maidenhead, GBR 100.00 GBP 0 0**
CaucasusCement Holding B.V. ’s-Hertogenbosch, NLD 75.00 EUR 95 0
CBR Asset Management Belgium S.A. Brussels, BEL 100.00 EUR 9 0**
CBR Baltic B.V. ’s-Hertogenbosch, NLD 100.00 EUR 206 31
CBR International Services S.A. Brussels, BEL 100.00 EUR 1,294 48
CBR Portland B.V. ’s-Hertogenbosch, NLD 100.00 EUR 74 0
Cem Invest Ltd 1) Irish Town, GIB 46.97 USD 3 0**
Cementa AB Stockholm, SWE 100.00 SEK 417 0
Cementa Fastighets AB Stockholm, SWE 100.00 SEK 0 0**
Cementrum I B.V. ’s-Hertogenbosch, NLD 100.00 EUR 4 -1
Cementrum II B.V. ’s-Hertogenbosch, NLD 100.00 EUR 1 0
CGF Capital B.V. Amsterdam, NLD 100.00 EUR 0 12
CHB Exeter Limited Maidenhead, GBR 100.00 GBP 6 0**
CHB Group Limited Maidenhead, GBR 100.00 GBP 415 0**
CHB P H R Limited Maidenhead, GBR 100.00 GBP -20 0**
CHB Products Limited Maidenhead, GBR 100.00 GBP 2,000 0**
Chemical Manufacture and Refining Limited Maidenhead, GBR 100.00 GBP 5 0**
Chester Road Sand and Gravel Company Limited Maidenhead, GBR 100.00 GBP 0 0**
City of London Heliport Limited Maidenhead, GBR 55.56 GBP -2 0**
Civil and Marine (Holdings) Limited Maidenhead, GBR 100.00 GBP 11 -5**
Civil and Marine Limited Maidenhead, GBR 100.00 GBP 276 14**
Civil and Marine Slag Cement Limited Maidenhead, GBR 100.00 GBP 161 0**
Claughton Manor Brick Limited (The) Maidenhead, GBR 100.00 GBP 0 0**
Clyde Cement Limited Maidenhead, GBR 100.00 GBP 0 0**
Coln Gravel Company Limited Maidenhead, GBR 100.00 GBP 0 0**
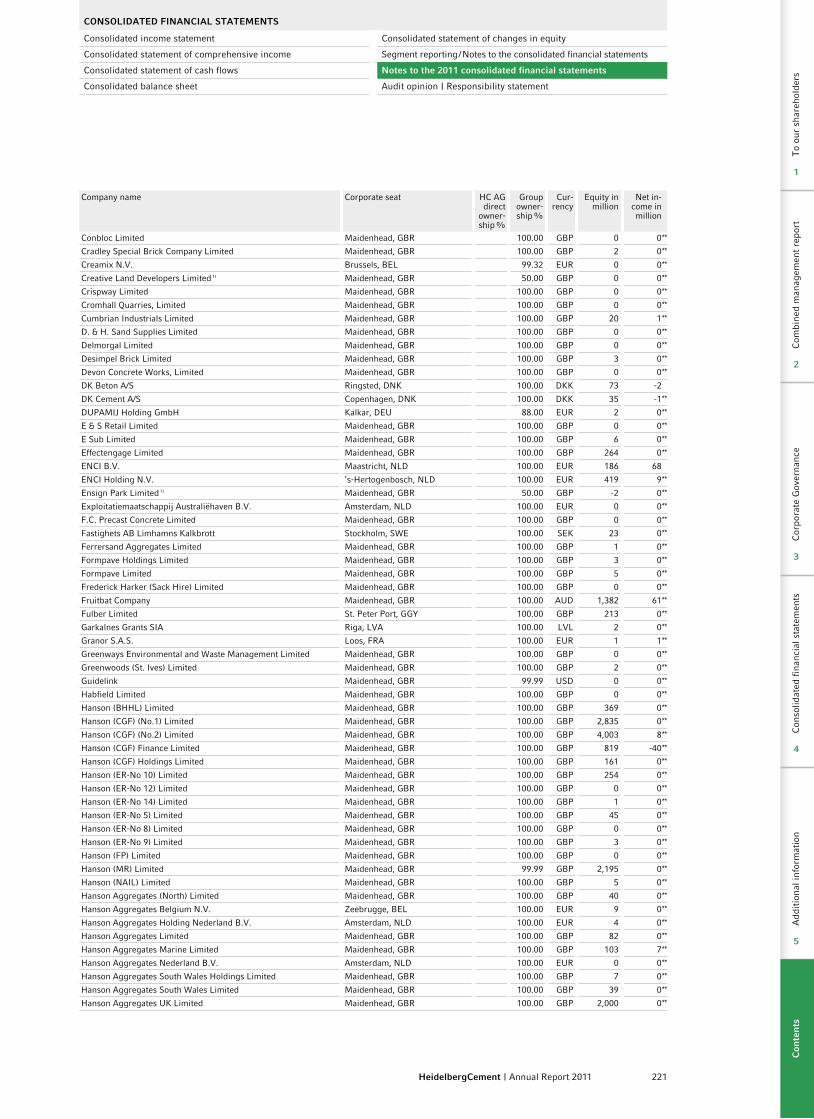
221HeidelbergCement | Annual Report 2011
CoNSoLIDATED FINANCIAL STATEMENTS
Consolidated income statement Consolidated statement of changes in equity
Consolidated statement of comprehensive income Segment reporting / Notes to the consolidated financial statements
Consolidated statement of cash flows Notes to the 2011 consolidated financial statements
Consolidated balance sheet Audit opinion | Responsibility statement
Company name Corporate seat HC AG direct
owner-ship %
Group owner-ship %
Cur-rency
Equity in million
Net in-come in million
Conbloc Limited Maidenhead, GBR 100.00 GBP 0 0**
Cradley Special Brick Company Limited Maidenhead, GBR 100.00 GBP 2 0**
Creamix N.V. Brussels, BEL 99.32 EUR 0 0**
Creative Land Developers Limited 1) Maidenhead, GBR 50.00 GBP 0 0**
Crispway Limited Maidenhead, GBR 100.00 GBP 0 0**
Cromhall Quarries, Limited Maidenhead, GBR 100.00 GBP 0 0**
Cumbrian Industrials Limited Maidenhead, GBR 100.00 GBP 20 1**
D. & H. Sand Supplies Limited Maidenhead, GBR 100.00 GBP 0 0**
Delmorgal Limited Maidenhead, GBR 100.00 GBP 0 0**
Desimpel Brick Limited Maidenhead, GBR 100.00 GBP 3 0**
Devon Concrete Works, Limited Maidenhead, GBR 100.00 GBP 0 0**
DK Beton A/S Ringsted, DNK 100.00 DKK 73 -2
DK Cement A/S Copenhagen, DNK 100.00 DKK 35 -1**
DUPAMIJ Holding GmbH Kalkar, DEU 88.00 EUR 2 0**
E & S Retail Limited Maidenhead, GBR 100.00 GBP 0 0**
E Sub Limited Maidenhead, GBR 100.00 GBP 6 0**
Effectengage Limited Maidenhead, GBR 100.00 GBP 264 0**
ENCI B.V. Maastricht, NLD 100.00 EUR 186 68
ENCI Holding N.V. ’s-Hertogenbosch, NLD 100.00 EUR 419 9**
Ensign Park Limited 1) Maidenhead, GBR 50.00 GBP -2 0**
Exploitatiemaatschappij Australiëhaven B.V. Amsterdam, NLD 100.00 EUR 0 0**
F.C. Precast Concrete Limited Maidenhead, GBR 100.00 GBP 0 0**
Fastighets AB Limhamns Kalkbrott Stockholm, SWE 100.00 SEK 23 0**
Ferrersand Aggregates Limited Maidenhead, GBR 100.00 GBP 1 0**
Formpave Holdings Limited Maidenhead, GBR 100.00 GBP 3 0**
Formpave Limited Maidenhead, GBR 100.00 GBP 5 0**
Frederick Harker (Sack Hire) Limited Maidenhead, GBR 100.00 GBP 0 0**
Fruitbat Company Maidenhead, GBR 100.00 AUD 1,382 61**
Fulber Limited St. Peter Port, GGY 100.00 GBP 213 0**
Garkalnes Grants SIA Riga, LVA 100.00 LVL 2 0**
Granor S.A.S. Loos, FRA 100.00 EUR 1 1**
Greenways Environmental and Waste Management Limited Maidenhead, GBR 100.00 GBP 0 0**
Greenwoods (St. Ives) Limited Maidenhead, GBR 100.00 GBP 2 0**
Guidelink Maidenhead, GBR 99.99 USD 0 0**
Habfield Limited Maidenhead, GBR 100.00 GBP 0 0**
Hanson (BHHL) Limited Maidenhead, GBR 100.00 GBP 369 0**
Hanson (CGF) (No.1) Limited Maidenhead, GBR 100.00 GBP 2,835 0**
Hanson (CGF) (No.2) Limited Maidenhead, GBR 100.00 GBP 4,003 8**
Hanson (CGF) Finance Limited Maidenhead, GBR 100.00 GBP 819 -40**
Hanson (CGF) Holdings Limited Maidenhead, GBR 100.00 GBP 161 0**
Hanson (ER-No 10) Limited Maidenhead, GBR 100.00 GBP 254 0**
Hanson (ER-No 12) Limited Maidenhead, GBR 100.00 GBP 0 0**
Hanson (ER-No 14) Limited Maidenhead, GBR 100.00 GBP 1 0**
Hanson (ER-No 5) Limited Maidenhead, GBR 100.00 GBP 45 0**
Hanson (ER-No 8) Limited Maidenhead, GBR 100.00 GBP 0 0**
Hanson (ER-No 9) Limited Maidenhead, GBR 100.00 GBP 3 0**
Hanson (FP) Limited Maidenhead, GBR 100.00 GBP 0 0**
Hanson (MR) Limited Maidenhead, GBR 99.99 GBP 2,195 0**
Hanson (NAIL) Limited Maidenhead, GBR 100.00 GBP 5 0**
Hanson Aggregates (North) Limited Maidenhead, GBR 100.00 GBP 40 0**
Hanson Aggregates Belgium N.V. Zeebrugge, BEL 100.00 EUR 9 0**
Hanson Aggregates Holding Nederland B.V. Amsterdam, NLD 100.00 EUR 4 0**
Hanson Aggregates Limited Maidenhead, GBR 100.00 GBP 82 0**
Hanson Aggregates Marine Limited Maidenhead, GBR 100.00 GBP 103 7**
Hanson Aggregates Nederland B.V. Amsterdam, NLD 100.00 EUR 0 0**
Hanson Aggregates South Wales Holdings Limited Maidenhead, GBR 100.00 GBP 7 0**
Hanson Aggregates South Wales Limited Maidenhead, GBR 100.00 GBP 39 0**
Hanson Aggregates UK Limited Maidenhead, GBR 100.00 GBP 2,000 0**
Con
solid
ated
fin
anci
al s
tate
men
tsA
ddit
iona
l inf
orm
atio
n
4
5
Com
bine
d m
anag
emen
t re
port
Cor
pora
te G
over
nanc
eC
onso
lidat
ed f
inan
cial
sta
tem
ents
Add
itio
nal i
nfor
mat
ion
To
our
shar
ehol
ders
2
3
4
5
1
Con
ten
ts
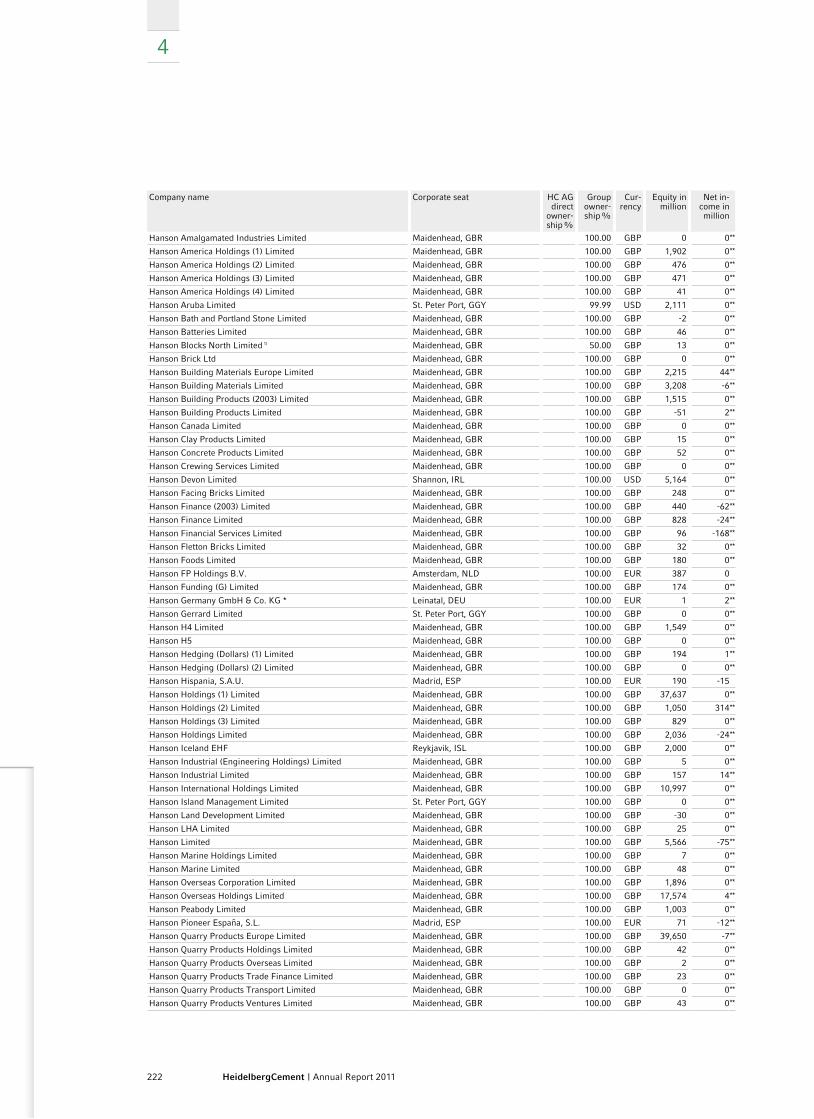
222 HeidelbergCement | Annual Report 2011
4
Company name Corporate seat HC AG direct
owner-ship %
Group owner-ship %
Cur-rency
Equity in million
Net in-come in million
Hanson Amalgamated Industries Limited Maidenhead, GBR 100.00 GBP 0 0**
Hanson America Holdings (1) Limited Maidenhead, GBR 100.00 GBP 1,902 0**
Hanson America Holdings (2) Limited Maidenhead, GBR 100.00 GBP 476 0**
Hanson America Holdings (3) Limited Maidenhead, GBR 100.00 GBP 471 0**
Hanson America Holdings (4) Limited Maidenhead, GBR 100.00 GBP 41 0**
Hanson Aruba Limited St. Peter Port, GGY 99.99 USD 2,111 0**
Hanson Bath and Portland Stone Limited Maidenhead, GBR 100.00 GBP -2 0**
Hanson Batteries Limited Maidenhead, GBR 100.00 GBP 46 0**
Hanson Blocks North Limited 1) Maidenhead, GBR 50.00 GBP 13 0**
Hanson Brick Ltd Maidenhead, GBR 100.00 GBP 0 0**
Hanson Building Materials Europe Limited Maidenhead, GBR 100.00 GBP 2,215 44**
Hanson Building Materials Limited Maidenhead, GBR 100.00 GBP 3,208 -6**
Hanson Building Products (2003) Limited Maidenhead, GBR 100.00 GBP 1,515 0**
Hanson Building Products Limited Maidenhead, GBR 100.00 GBP -51 2**
Hanson Canada Limited Maidenhead, GBR 100.00 GBP 0 0**
Hanson Clay Products Limited Maidenhead, GBR 100.00 GBP 15 0**
Hanson Concrete Products Limited Maidenhead, GBR 100.00 GBP 52 0**
Hanson Crewing Services Limited Maidenhead, GBR 100.00 GBP 0 0**
Hanson Devon Limited Shannon, IRL 100.00 USD 5,164 0**
Hanson Facing Bricks Limited Maidenhead, GBR 100.00 GBP 248 0**
Hanson Finance (2003) Limited Maidenhead, GBR 100.00 GBP 440 -62**
Hanson Finance Limited Maidenhead, GBR 100.00 GBP 828 -24**
Hanson Financial Services Limited Maidenhead, GBR 100.00 GBP 96 -168**
Hanson Fletton Bricks Limited Maidenhead, GBR 100.00 GBP 32 0**
Hanson Foods Limited Maidenhead, GBR 100.00 GBP 180 0**
Hanson FP Holdings B.V. Amsterdam, NLD 100.00 EUR 387 0
Hanson Funding (G) Limited Maidenhead, GBR 100.00 GBP 174 0**
Hanson Germany GmbH & Co. KG * Leinatal, DEU 100.00 EUR 1 2**
Hanson Gerrard Limited St. Peter Port, GGY 100.00 GBP 0 0**
Hanson H4 Limited Maidenhead, GBR 100.00 GBP 1,549 0**
Hanson H5 Maidenhead, GBR 100.00 GBP 0 0**
Hanson Hedging (Dollars) (1) Limited Maidenhead, GBR 100.00 GBP 194 1**
Hanson Hedging (Dollars) (2) Limited Maidenhead, GBR 100.00 GBP 0 0**
Hanson Hispania, S.A.U. Madrid, ESP 100.00 EUR 190 -15
Hanson Holdings (1) Limited Maidenhead, GBR 100.00 GBP 37,637 0**
Hanson Holdings (2) Limited Maidenhead, GBR 100.00 GBP 1,050 314**
Hanson Holdings (3) Limited Maidenhead, GBR 100.00 GBP 829 0**
Hanson Holdings Limited Maidenhead, GBR 100.00 GBP 2,036 -24**
Hanson Iceland EHF Reykjavik, ISL 100.00 GBP 2,000 0**
Hanson Industrial (Engineering Holdings) Limited Maidenhead, GBR 100.00 GBP 5 0**
Hanson Industrial Limited Maidenhead, GBR 100.00 GBP 157 14**
Hanson International Holdings Limited Maidenhead, GBR 100.00 GBP 10,997 0**
Hanson Island Management Limited St. Peter Port, GGY 100.00 GBP 0 0**
Hanson Land Development Limited Maidenhead, GBR 100.00 GBP -30 0**
Hanson LHA Limited Maidenhead, GBR 100.00 GBP 25 0**
Hanson Limited Maidenhead, GBR 100.00 GBP 5,566 -75**
Hanson Marine Holdings Limited Maidenhead, GBR 100.00 GBP 7 0**
Hanson Marine Limited Maidenhead, GBR 100.00 GBP 48 0**
Hanson Overseas Corporation Limited Maidenhead, GBR 100.00 GBP 1,896 0**
Hanson Overseas Holdings Limited Maidenhead, GBR 100.00 GBP 17,574 4**
Hanson Peabody Limited Maidenhead, GBR 100.00 GBP 1,003 0**
Hanson Pioneer España, S.L. Madrid, ESP 100.00 EUR 71 -12**
Hanson Quarry Products Europe Limited Maidenhead, GBR 100.00 GBP 39,650 -7**
Hanson Quarry Products Holdings Limited Maidenhead, GBR 100.00 GBP 42 0**
Hanson Quarry Products Overseas Limited Maidenhead, GBR 100.00 GBP 2 0**
Hanson Quarry Products Trade Finance Limited Maidenhead, GBR 100.00 GBP 23 0**
Hanson Quarry Products Transport Limited Maidenhead, GBR 100.00 GBP 0 0**
Hanson Quarry Products Ventures Limited Maidenhead, GBR 100.00 GBP 43 0**

223HeidelbergCement | Annual Report 2011
CoNSoLIDATED FINANCIAL STATEMENTS
Consolidated income statement Consolidated statement of changes in equity
Consolidated statement of comprehensive income Segment reporting / Notes to the consolidated financial statements
Consolidated statement of cash flows Notes to the 2011 consolidated financial statements
Consolidated balance sheet Audit opinion | Responsibility statement
Company name Corporate seat HC AG direct
owner-ship %
Group owner-ship %
Cur-rency
Equity in million
Net in-come in million
Hanson RBS Trustees Limited Maidenhead, GBR 100.00 GBP 0 0**
Hanson Recycling Limited Maidenhead, GBR 100.00 GBP 0 0**
Hanson Retail Limited Maidenhead, GBR 100.00 GBP 101 2**
Hanson Ship Management Ltd St. Peter Port, GGY 100.00 GBP 0 0**
Hanson Thermalite Limited Maidenhead, GBR 100.00 GBP 42 0**
Hanson TIS Holdings Limited Maidenhead, GBR 100.00 GBP 0 0**
Hanson TIS Limited Maidenhead, GBR 100.00 GBP -2 0**
Hanson Trust Limited Maidenhead, GBR 100.00 GBP 97 0**
Hanson Trustees Limited Maidenhead, GBR 100.00 GBP -1 1**
Harrisons Limeworks Limited Maidenhead, GBR 100.00 GBP 0 0**
Hartsholme Property Limited Maidenhead, GBR 100.00 GBP 0 0**
HB Hotels Limited Maidenhead, GBR 100.00 GBP -1 0**
HB Pacific Limited Maidenhead, GBR 100.00 GBP 3 0**
HC Asia Holding GmbH Heidelberg, DEU 100.00 100.00 EUR 21 9
HC Betons SIA Riga, LVA 100.00 LVL 1 -1**
HC Betoon AS, Estonia Tallinn, EST 100.00 EEK 92 -9**
HC Central Asia B.V. ’s-Hertogenbosch, NLD 100.00 EUR 0 0
HC Fuels Limited London, GBR 100.00 GBP 8 1**
HC Hanson Holding B.V. ’s-Hertogenbosch, NLD 100.00 EUR 326 0
HC Italia SRL Rome, Italy 100.00 EUR 1 0**
HC Kalkproduktionsgesellschaft Istein mbH Efringen-Kirchen, DEU 100.00 100.00 EUR 2 0
HC Materialen B.V. Nieuwegein, NLD 100.00 EUR 3 0**
HC Trading B.V. ’s-Hertogenbosch, NLD 100.00 EUR 14 0
HC Trading Malta Limited St. Julian’s, MLT 100.00 USD 0 18**
HCT Holding Malta Limited St. Julian’s, MLT 100.00 100.00 USD 94 29**
HeidelbergCement Baustoffe für Geotechnik GmbH & Co. KG * Ennigerloh, DEU 100.00 100.00 EUR 4 1
Heidelbergcement Canada Holding Limited Maidenhead, GBR 100.00 CAD 4,427 111**
HeidelbergCement Central Europe East Holding B.V. ’s-Hertogenbosch, NLD 100.00 EUR 962 45
HeidelbergCement Danmark A/S Ringsted, DNK 100.00 DKK 375 0**
HeidelbergCement Finance B.V. ’s-Hertogenbosch, NLD 100.00 100.00 EUR 80 73
HeidelbergCement Grundstücksgesellschaft mbH & Co. KG * Heidelberg, DEU 100.00 100.00 EUR 18 1
HeidelbergCement Holding Coöperatief U.A. ’s-Hertogenbosch, NLD 100.00 EUR 1,126 31
HeidelbergCement Holding S.à r.l. Luxembourg, LUX 100.00 EUR 13,427 1**
HeidelbergCement Holdings Limited Maidenhead, GBR 100.00 100.00 GBP 2 0**
HeidelbergCement International Holding GmbH Heidelberg, DEU 100.00 100.00 EUR 10,848 0
HeidelbergCement Luxembourg S.à.r.l. Luxembourg, LUX 100.00 EUR 0 0
HeidelbergCement Mediterranean Basin Holdings S.L. Madrid, ESP 100.00 EUR 301 12**
HeidelbergCement Miljö AB Stockholm, SWE 100.00 SEK 28 0**
HeidelbergCement Netherlands Holding B.V. ’s-Hertogenbosch, NLD 100.00 EUR 693 1
HeidelbergCement Northern Europe AB Stockholm, SWE 100.00 100.00 SEK 5,333 174**
HeidelbergCement Northern Europe Pumps & Trucks A/S Ringsted, DNK 100.00 DKK 1 0**
HeidelbergCement Norway a.s. Oslo, NOR 100.00 NOK 1,840 371**
HeidelbergCement Shared Service Centre AB Stockholm, SWE 100.00 SEK 374 0**
HeidelbergCement Sweden AB Stockholm, SWE 100.00 SEK 7,063 41**
HeidelbergCement UK Holding II Limited Maidenhead, GBR 100.00 USD 13,731 514**
HeidelbergCement UK Holding Limited Maidenhead, GBR 100.00 EUR 4,494 -573**
HeidelbergCement UK Limited Maidenhead, GBR 100.00 100.00 GBP 79 0**
Heidelberger Beton Donau-Naab GmbH & Co. KG * Burglengenfeld, DEU 85.00 EUR 1 1
Heidelberger Beton GmbH Heidelberg, DEU 100.00 100.00 EUR 19 -15
Heidelberger Betonelemente GmbH & Co. KG * Chemnitz, DEU 83.00 EUR 3 2**
Heidelberger Betonpumpen Rhein-Main-Nahe GmbH & Co. KG * Frankfurt/Main, DEU 93.77 EUR 1 0
Heidelberger Kalksandstein GmbH Durmersheim, DEU 100.00 100.00 EUR 17 3
Heidelberger Kalksandstein Grundstücks- und Beteiligungs- GmbH & Co. KG * Durmersheim, DEU 100.00 EUR 17 -1
Heidelberger Kieswerke Niederrhein GmbH Essen, DEU 100.00 EUR 1 0
Heidelberger Kieswerke Rhein-Ruhr GmbH Essen, DEU 100.00 EUR -1 0**
Heidelberger KS Beteiligungen Deutschland GmbH & Co. KG * Heidelberg, DEU 100.00 EUR 5 0
Heidelberger Sand und Kies GmbH Heidelberg, DEU 100.00 100.00 EUR 76 -2
Heidelberger Weserkies GmbH & Co. KG * Bremen, DEU 100.00 EUR 0 0
Con
solid
ated
fin
anci
al s
tate
men
tsA
ddit
iona
l inf
orm
atio
n
4
5
Com
bine
d m
anag
emen
t re
port
Cor
pora
te G
over
nanc
eC
onso
lidat
ed f
inan
cial
sta
tem
ents
Add
itio
nal i
nfor
mat
ion
To
our
shar
ehol
ders
2
3
4
5
1
Con
ten
ts
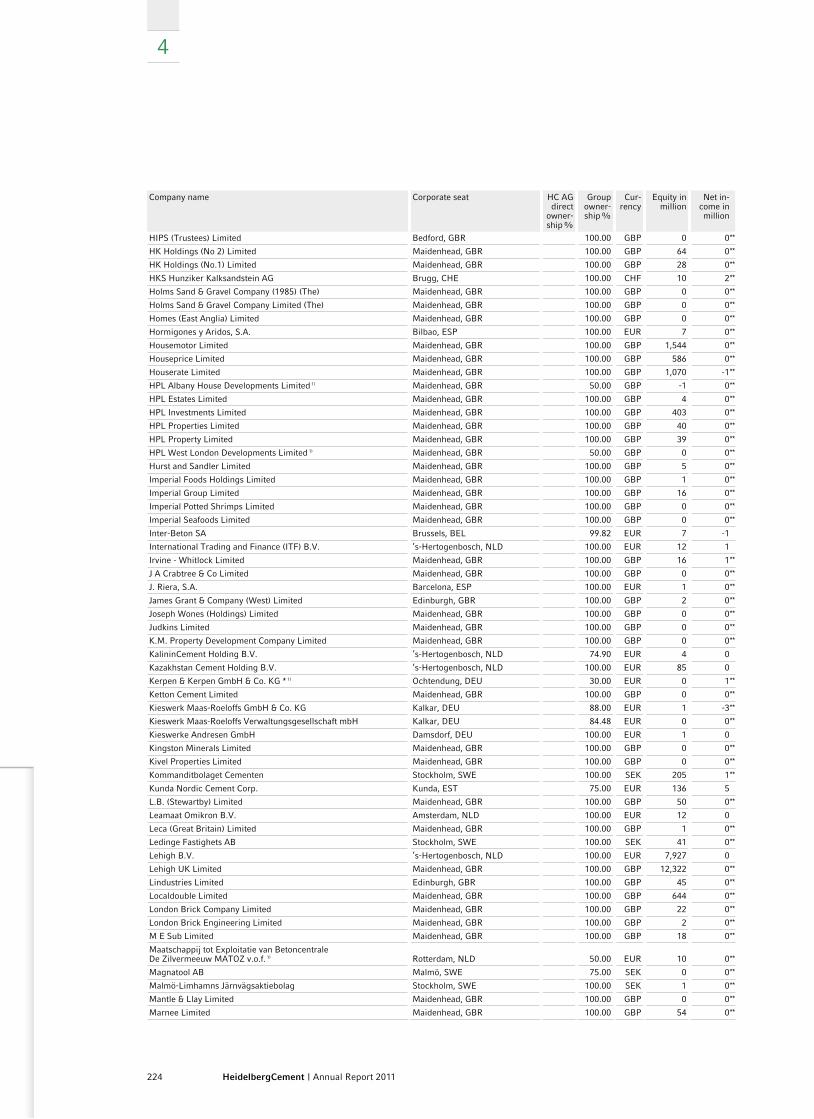
224 HeidelbergCement | Annual Report 2011
4
Company name Corporate seat HC AG direct
owner-ship %
Group owner-ship %
Cur-rency
Equity in million
Net in-come in million
HIPS (Trustees) Limited Bedford, GBR 100.00 GBP 0 0**
HK Holdings (No 2) Limited Maidenhead, GBR 100.00 GBP 64 0**
HK Holdings (No.1) Limited Maidenhead, GBR 100.00 GBP 28 0**
HKS Hunziker Kalksandstein AG Brugg, CHE 100.00 CHF 10 2**
Holms Sand & Gravel Company (1985) (The) Maidenhead, GBR 100.00 GBP 0 0**
Holms Sand & Gravel Company Limited (The) Maidenhead, GBR 100.00 GBP 0 0**
Homes (East Anglia) Limited Maidenhead, GBR 100.00 GBP 0 0**
Hormigones y Aridos, S.A. Bilbao, ESP 100.00 EUR 7 0**
Housemotor Limited Maidenhead, GBR 100.00 GBP 1,544 0**
Houseprice Limited Maidenhead, GBR 100.00 GBP 586 0**
Houserate Limited Maidenhead, GBR 100.00 GBP 1,070 -1**
HPL Albany House Developments Limited 1) Maidenhead, GBR 50.00 GBP -1 0**
HPL Estates Limited Maidenhead, GBR 100.00 GBP 4 0**
HPL Investments Limited Maidenhead, GBR 100.00 GBP 403 0**
HPL Properties Limited Maidenhead, GBR 100.00 GBP 40 0**
HPL Property Limited Maidenhead, GBR 100.00 GBP 39 0**
HPL West London Developments Limited 1) Maidenhead, GBR 50.00 GBP 0 0**
Hurst and Sandler Limited Maidenhead, GBR 100.00 GBP 5 0**
Imperial Foods Holdings Limited Maidenhead, GBR 100.00 GBP 1 0**
Imperial Group Limited Maidenhead, GBR 100.00 GBP 16 0**
Imperial Potted Shrimps Limited Maidenhead, GBR 100.00 GBP 0 0**
Imperial Seafoods Limited Maidenhead, GBR 100.00 GBP 0 0**
Inter-Beton SA Brussels, BEL 99.82 EUR 7 -1
International Trading and Finance (ITF) B.V. ’s-Hertogenbosch, NLD 100.00 EUR 12 1
Irvine - Whitlock Limited Maidenhead, GBR 100.00 GBP 16 1**
J A Crabtree & Co Limited Maidenhead, GBR 100.00 GBP 0 0**
J. Riera, S.A. Barcelona, ESP 100.00 EUR 1 0**
James Grant & Company (West) Limited Edinburgh, GBR 100.00 GBP 2 0**
Joseph Wones (Holdings) Limited Maidenhead, GBR 100.00 GBP 0 0**
Judkins Limited Maidenhead, GBR 100.00 GBP 0 0**
K.M. Property Development Company Limited Maidenhead, GBR 100.00 GBP 0 0**
KalininCement Holding B.V. ’s-Hertogenbosch, NLD 74.90 EUR 4 0
Kazakhstan Cement Holding B.V. ’s-Hertogenbosch, NLD 100.00 EUR 85 0
Kerpen & Kerpen GmbH & Co. KG * 1) Ochtendung, DEU 30.00 EUR 0 1**
Ketton Cement Limited Maidenhead, GBR 100.00 GBP 0 0**
Kieswerk Maas-Roeloffs GmbH & Co. KG Kalkar, DEU 88.00 EUR 1 -3**
Kieswerk Maas-Roeloffs Verwaltungsgesellschaft mbH Kalkar, DEU 84.48 EUR 0 0**
Kieswerke Andresen GmbH Damsdorf, DEU 100.00 EUR 1 0
Kingston Minerals Limited Maidenhead, GBR 100.00 GBP 0 0**
Kivel Properties Limited Maidenhead, GBR 100.00 GBP 0 0**
Kommanditbolaget Cementen Stockholm, SWE 100.00 SEK 205 1**
Kunda Nordic Cement Corp. Kunda, EST 75.00 EUR 136 5
L.B. (Stewartby) Limited Maidenhead, GBR 100.00 GBP 50 0**
Leamaat Omikron B.V. Amsterdam, NLD 100.00 EUR 12 0
Leca (Great Britain) Limited Maidenhead, GBR 100.00 GBP 1 0**
Ledinge Fastighets AB Stockholm, SWE 100.00 SEK 41 0**
Lehigh B.V. ’s-Hertogenbosch, NLD 100.00 EUR 7,927 0
Lehigh UK Limited Maidenhead, GBR 100.00 GBP 12,322 0**
Lindustries Limited Edinburgh, GBR 100.00 GBP 45 0**
Localdouble Limited Maidenhead, GBR 100.00 GBP 644 0**
London Brick Company Limited Maidenhead, GBR 100.00 GBP 22 0**
London Brick Engineering Limited Maidenhead, GBR 100.00 GBP 2 0**
M E Sub Limited Maidenhead, GBR 100.00 GBP 18 0**
Maatschappij tot Exploitatie van Betoncentrale De Zilvermeeuw MATOZ v.o.f. 1) Rotterdam, NLD 50.00 EUR 10 0**
Magnatool AB Malmö, SWE 75.00 SEK 0 0**
Malmö-Limhamns Järnvägsaktiebolag Stockholm, SWE 100.00 SEK 1 0**
Mantle & Llay Limited Maidenhead, GBR 100.00 GBP 0 0**
Marnee Limited Maidenhead, GBR 100.00 GBP 54 0**
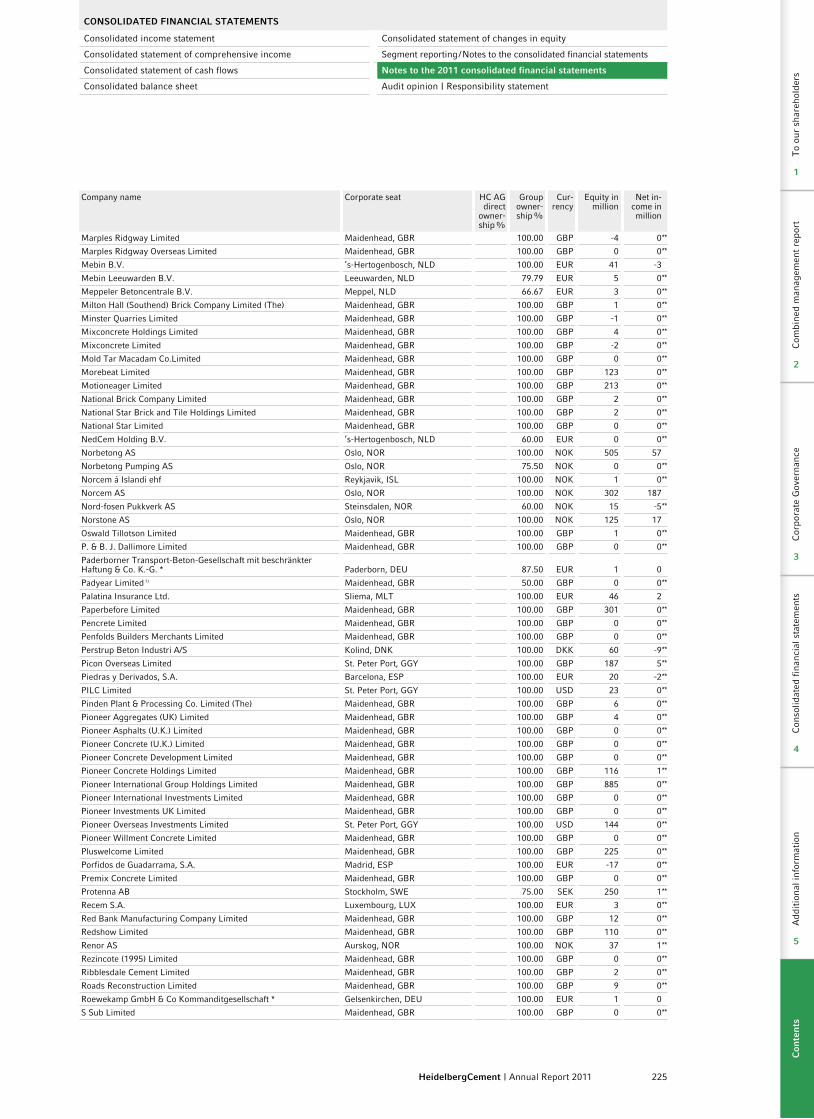
225HeidelbergCement | Annual Report 2011
CoNSoLIDATED FINANCIAL STATEMENTS
Consolidated income statement Consolidated statement of changes in equity
Consolidated statement of comprehensive income Segment reporting / Notes to the consolidated financial statements
Consolidated statement of cash flows Notes to the 2011 consolidated financial statements
Consolidated balance sheet Audit opinion | Responsibility statement
Company name Corporate seat HC AG direct
owner-ship %
Group owner-ship %
Cur-rency
Equity in million
Net in-come in million
Marples Ridgway Limited Maidenhead, GBR 100.00 GBP -4 0**
Marples Ridgway Overseas Limited Maidenhead, GBR 100.00 GBP 0 0**
Mebin B.V. ’s-Hertogenbosch, NLD 100.00 EUR 41 -3
Mebin Leeuwarden B.V. Leeuwarden, NLD 79.79 EUR 5 0**
Meppeler Betoncentrale B.V. Meppel, NLD 66.67 EUR 3 0**
Milton Hall (Southend) Brick Company Limited (The) Maidenhead, GBR 100.00 GBP 1 0**
Minster Quarries Limited Maidenhead, GBR 100.00 GBP -1 0**
Mixconcrete Holdings Limited Maidenhead, GBR 100.00 GBP 4 0**
Mixconcrete Limited Maidenhead, GBR 100.00 GBP -2 0**
Mold Tar Macadam Co.Limited Maidenhead, GBR 100.00 GBP 0 0**
Morebeat Limited Maidenhead, GBR 100.00 GBP 123 0**
Motioneager Limited Maidenhead, GBR 100.00 GBP 213 0**
National Brick Company Limited Maidenhead, GBR 100.00 GBP 2 0**
National Star Brick and Tile Holdings Limited Maidenhead, GBR 100.00 GBP 2 0**
National Star Limited Maidenhead, GBR 100.00 GBP 0 0**
NedCem Holding B.V. ’s-Hertogenbosch, NLD 60.00 EUR 0 0**
Norbetong AS Oslo, NOR 100.00 NOK 505 57
Norbetong Pumping AS Oslo, NOR 75.50 NOK 0 0**
Norcem á Islandi ehf Reykjavik, ISL 100.00 NOK 1 0**
Norcem AS Oslo, NOR 100.00 NOK 302 187
Nord-fosen Pukkverk AS Steinsdalen, NOR 60.00 NOK 15 -5**
Norstone AS Oslo, NOR 100.00 NOK 125 17
Oswald Tillotson Limited Maidenhead, GBR 100.00 GBP 1 0**
P. & B. J. Dallimore Limited Maidenhead, GBR 100.00 GBP 0 0**
Paderborner Transport-Beton-Gesellschaft mit beschränkter Haftung & Co. K.-G. * Paderborn, DEU 87.50 EUR 1 0
Padyear Limited 1) Maidenhead, GBR 50.00 GBP 0 0**
Palatina Insurance Ltd. Sliema, MLT 100.00 EUR 46 2
Paperbefore Limited Maidenhead, GBR 100.00 GBP 301 0**
Pencrete Limited Maidenhead, GBR 100.00 GBP 0 0**
Penfolds Builders Merchants Limited Maidenhead, GBR 100.00 GBP 0 0**
Perstrup Beton Industri A/S Kolind, DNK 100.00 DKK 60 -9**
Picon Overseas Limited St. Peter Port, GGY 100.00 GBP 187 5**
Piedras y Derivados, S.A. Barcelona, ESP 100.00 EUR 20 -2**
PILC Limited St. Peter Port, GGY 100.00 USD 23 0**
Pinden Plant & Processing Co. Limited (The) Maidenhead, GBR 100.00 GBP 6 0**
Pioneer Aggregates (UK) Limited Maidenhead, GBR 100.00 GBP 4 0**
Pioneer Asphalts (U.K.) Limited Maidenhead, GBR 100.00 GBP 0 0**
Pioneer Concrete (U.K.) Limited Maidenhead, GBR 100.00 GBP 0 0**
Pioneer Concrete Development Limited Maidenhead, GBR 100.00 GBP 0 0**
Pioneer Concrete Holdings Limited Maidenhead, GBR 100.00 GBP 116 1**
Pioneer International Group Holdings Limited Maidenhead, GBR 100.00 GBP 885 0**
Pioneer International Investments Limited Maidenhead, GBR 100.00 GBP 0 0**
Pioneer Investments UK Limited Maidenhead, GBR 100.00 GBP 0 0**
Pioneer Overseas Investments Limited St. Peter Port, GGY 100.00 USD 144 0**
Pioneer Willment Concrete Limited Maidenhead, GBR 100.00 GBP 0 0**
Pluswelcome Limited Maidenhead, GBR 100.00 GBP 225 0**
Porfidos de Guadarrama, S.A. Madrid, ESP 100.00 EUR -17 0**
Premix Concrete Limited Maidenhead, GBR 100.00 GBP 0 0**
Protenna AB Stockholm, SWE 75.00 SEK 250 1**
Recem S.A. Luxembourg, LUX 100.00 EUR 3 0**
Red Bank Manufacturing Company Limited Maidenhead, GBR 100.00 GBP 12 0**
Redshow Limited Maidenhead, GBR 100.00 GBP 110 0**
Renor AS Aurskog, NOR 100.00 NOK 37 1**
Rezincote (1995) Limited Maidenhead, GBR 100.00 GBP 0 0**
Ribblesdale Cement Limited Maidenhead, GBR 100.00 GBP 2 0**
Roads Reconstruction Limited Maidenhead, GBR 100.00 GBP 9 0**
Roewekamp GmbH & Co Kommanditgesellschaft * Gelsenkirchen, DEU 100.00 EUR 1 0
S Sub Limited Maidenhead, GBR 100.00 GBP 0 0**
Con
solid
ated
fin
anci
al s
tate
men
tsA
ddit
iona
l inf
orm
atio
n
4
5
Com
bine
d m
anag
emen
t re
port
Cor
pora
te G
over
nanc
eC
onso
lidat
ed f
inan
cial
sta
tem
ents
Add
itio
nal i
nfor
mat
ion
To
our
shar
ehol
ders
2
3
4
5
1
Con
ten
ts
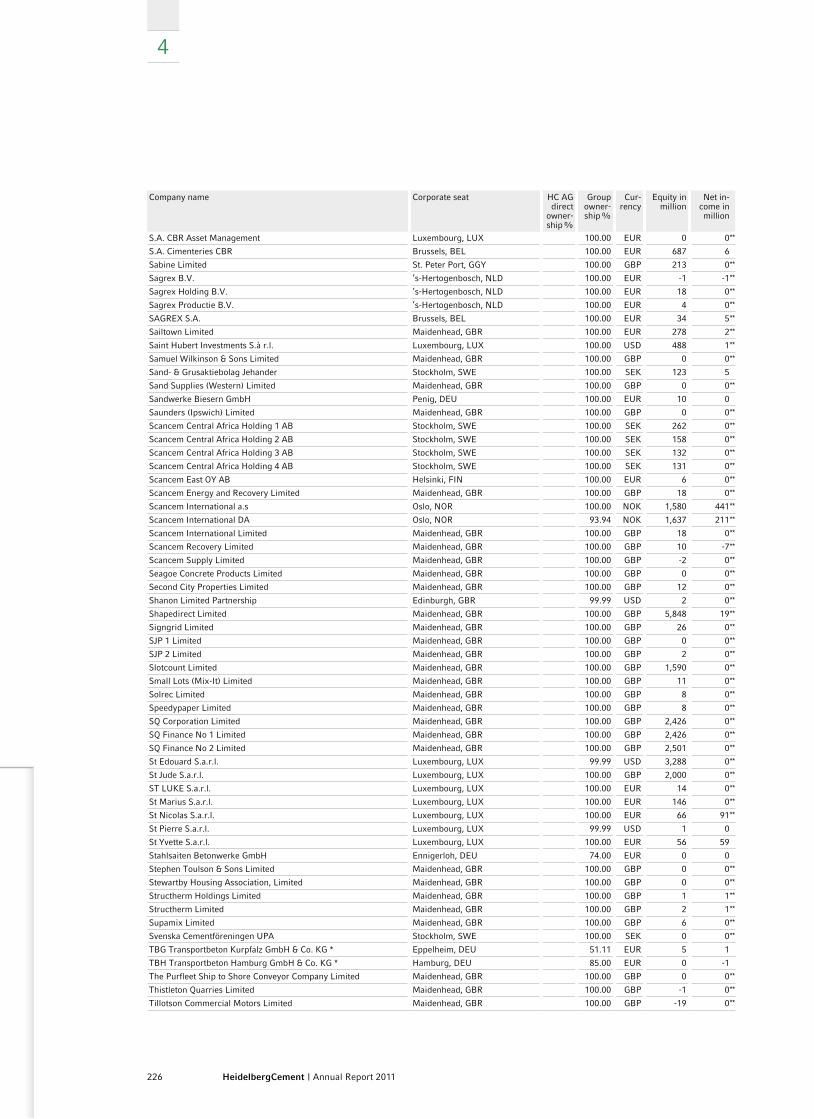
226 HeidelbergCement | Annual Report 2011
4
Company name Corporate seat HC AG direct
owner-ship %
Group owner-ship %
Cur-rency
Equity in million
Net in-come in million
S.A. CBR Asset Management Luxembourg, LUX 100.00 EUR 0 0**
S.A. Cimenteries CBR Brussels, BEL 100.00 EUR 687 6
Sabine Limited St. Peter Port, GGY 100.00 GBP 213 0**
Sagrex B.V. ’s-Hertogenbosch, NLD 100.00 EUR -1 -1**
Sagrex Holding B.V. ’s-Hertogenbosch, NLD 100.00 EUR 18 0**
Sagrex Productie B.V. ’s-Hertogenbosch, NLD 100.00 EUR 4 0**
SAGREX S.A. Brussels, BEL 100.00 EUR 34 5**
Sailtown Limited Maidenhead, GBR 100.00 EUR 278 2**
Saint Hubert Investments S.à r.l. Luxembourg, LUX 100.00 USD 488 1**
Samuel Wilkinson & Sons Limited Maidenhead, GBR 100.00 GBP 0 0**
Sand- & Grusaktiebolag Jehander Stockholm, SWE 100.00 SEK 123 5
Sand Supplies (Western) Limited Maidenhead, GBR 100.00 GBP 0 0**
Sandwerke Biesern GmbH Penig, DEU 100.00 EUR 10 0
Saunders (Ipswich) Limited Maidenhead, GBR 100.00 GBP 0 0**
Scancem Central Africa Holding 1 AB Stockholm, SWE 100.00 SEK 262 0**
Scancem Central Africa Holding 2 AB Stockholm, SWE 100.00 SEK 158 0**
Scancem Central Africa Holding 3 AB Stockholm, SWE 100.00 SEK 132 0**
Scancem Central Africa Holding 4 AB Stockholm, SWE 100.00 SEK 131 0**
Scancem East OY AB Helsinki, FIN 100.00 EUR 6 0**
Scancem Energy and Recovery Limited Maidenhead, GBR 100.00 GBP 18 0**
Scancem International a.s Oslo, NOR 100.00 NOK 1,580 441**
Scancem International DA Oslo, NOR 93.94 NOK 1,637 211**
Scancem International Limited Maidenhead, GBR 100.00 GBP 18 0**
Scancem Recovery Limited Maidenhead, GBR 100.00 GBP 10 -7**
Scancem Supply Limited Maidenhead, GBR 100.00 GBP -2 0**
Seagoe Concrete Products Limited Maidenhead, GBR 100.00 GBP 0 0**
Second City Properties Limited Maidenhead, GBR 100.00 GBP 12 0**
Shanon Limited Partnership Edinburgh, GBR 99.99 USD 2 0**
Shapedirect Limited Maidenhead, GBR 100.00 GBP 5,848 19**
Signgrid Limited Maidenhead, GBR 100.00 GBP 26 0**
SJP 1 Limited Maidenhead, GBR 100.00 GBP 0 0**
SJP 2 Limited Maidenhead, GBR 100.00 GBP 2 0**
Slotcount Limited Maidenhead, GBR 100.00 GBP 1,590 0**
Small Lots (Mix-It) Limited Maidenhead, GBR 100.00 GBP 11 0**
Solrec Limited Maidenhead, GBR 100.00 GBP 8 0**
Speedypaper Limited Maidenhead, GBR 100.00 GBP 8 0**
SQ Corporation Limited Maidenhead, GBR 100.00 GBP 2,426 0**
SQ Finance No 1 Limited Maidenhead, GBR 100.00 GBP 2,426 0**
SQ Finance No 2 Limited Maidenhead, GBR 100.00 GBP 2,501 0**
St Edouard S.a.r.l. Luxembourg, LUX 99.99 USD 3,288 0**
St Jude S.a.r.l. Luxembourg, LUX 100.00 GBP 2,000 0**
ST LUKE S.a.r.l. Luxembourg, LUX 100.00 EUR 14 0**
St Marius S.a.r.l. Luxembourg, LUX 100.00 EUR 146 0**
St Nicolas S.a.r.l. Luxembourg, LUX 100.00 EUR 66 91**
St Pierre S.a.r.l. Luxembourg, LUX 99.99 USD 1 0
St Yvette S.a.r.l. Luxembourg, LUX 100.00 EUR 56 59
Stahlsaiten Betonwerke GmbH Ennigerloh, DEU 74.00 EUR 0 0
Stephen Toulson & Sons Limited Maidenhead, GBR 100.00 GBP 0 0**
Stewartby Housing Association, Limited Maidenhead, GBR 100.00 GBP 0 0**
Structherm Holdings Limited Maidenhead, GBR 100.00 GBP 1 1**
Structherm Limited Maidenhead, GBR 100.00 GBP 2 1**
Supamix Limited Maidenhead, GBR 100.00 GBP 6 0**
Svenska Cementföreningen UPA Stockholm, SWE 100.00 SEK 0 0**
TBG Transportbeton Kurpfalz GmbH & Co. KG * Eppelheim, DEU 51.11 EUR 5 1
TBH Transportbeton Hamburg GmbH & Co. KG * Hamburg, DEU 85.00 EUR 0 -1
The Purfleet Ship to Shore Conveyor Company Limited Maidenhead, GBR 100.00 GBP 0 0**
Thistleton Quarries Limited Maidenhead, GBR 100.00 GBP -1 0**
Tillotson Commercial Motors Limited Maidenhead, GBR 100.00 GBP -19 0**
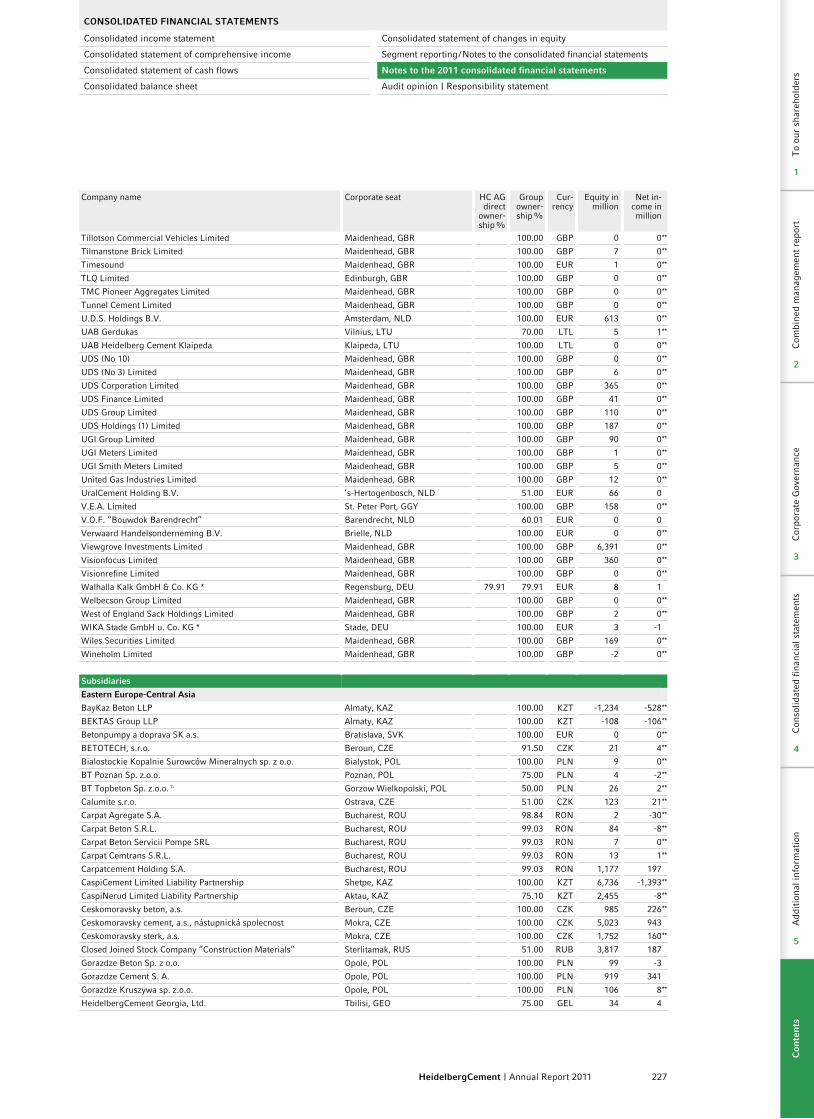
227HeidelbergCement | Annual Report 2011
CoNSoLIDATED FINANCIAL STATEMENTS
Consolidated income statement Consolidated statement of changes in equity
Consolidated statement of comprehensive income Segment reporting / Notes to the consolidated financial statements
Consolidated statement of cash flows Notes to the 2011 consolidated financial statements
Consolidated balance sheet Audit opinion | Responsibility statement
Company name Corporate seat HC AG direct
owner-ship %
Group owner-ship %
Cur-rency
Equity in million
Net in-come in million
Tillotson Commercial Vehicles Limited Maidenhead, GBR 100.00 GBP 0 0**
Tilmanstone Brick Limited Maidenhead, GBR 100.00 GBP 7 0**
Timesound Maidenhead, GBR 100.00 EUR 1 0**
TLQ Limited Edinburgh, GBR 100.00 GBP 0 0**
TMC Pioneer Aggregates Limited Maidenhead, GBR 100.00 GBP 0 0**
Tunnel Cement Limited Maidenhead, GBR 100.00 GBP 0 0**
U.D.S. Holdings B.V. Amsterdam, NLD 100.00 EUR 613 0**
UAB Gerdukas Vilnius, LTU 70.00 LTL 5 1**
UAB Heidelberg Cement Klaipeda Klaipeda, LTU 100.00 LTL 0 0**
UDS (No 10) Maidenhead, GBR 100.00 GBP 0 0**
UDS (No 3) Limited Maidenhead, GBR 100.00 GBP 6 0**
UDS Corporation Limited Maidenhead, GBR 100.00 GBP 365 0**
UDS Finance Limited Maidenhead, GBR 100.00 GBP 41 0**
UDS Group Limited Maidenhead, GBR 100.00 GBP 110 0**
UDS Holdings (1) Limited Maidenhead, GBR 100.00 GBP 187 0**
UGI Group Limited Maidenhead, GBR 100.00 GBP 90 0**
UGI Meters Limited Maidenhead, GBR 100.00 GBP 1 0**
UGI Smith Meters Limited Maidenhead, GBR 100.00 GBP 5 0**
United Gas Industries Limited Maidenhead, GBR 100.00 GBP 12 0**
UralCement Holding B.V. ’s-Hertogenbosch, NLD 51.00 EUR 66 0
V.E.A. Limited St. Peter Port, GGY 100.00 GBP 158 0**
V.O.F. “Bouwdok Barendrecht” Barendrecht, NLD 60.01 EUR 0 0
Verwaard Handelsonderneming B.V. Brielle, NLD 100.00 EUR 0 0**
Viewgrove Investments Limited Maidenhead, GBR 100.00 GBP 6,391 0**
Visionfocus Limited Maidenhead, GBR 100.00 GBP 360 0**
Visionrefine Limited Maidenhead, GBR 100.00 GBP 0 0**
Walhalla Kalk GmbH & Co. KG * Regensburg, DEU 79.91 79.91 EUR 8 1
Welbecson Group Limited Maidenhead, GBR 100.00 GBP 0 0**
West of England Sack Holdings Limited Maidenhead, GBR 100.00 GBP 2 0**
WIKA Stade GmbH u. Co. KG * Stade, DEU 100.00 EUR 3 -1
Wiles Securities Limited Maidenhead, GBR 100.00 GBP 169 0**
Wineholm Limited Maidenhead, GBR 100.00 GBP -2 0**
Subsidiaries
Eastern Europe-Central Asia
BayKaz Beton LLP Almaty, KAZ 100.00 KZT -1,234 -528**
BEKTAS Group LLP Almaty, KAZ 100.00 KZT -108 -106**
Betonpumpy a doprava SK a.s. Bratislava, SVK 100.00 EUR 0 0**
BETOTECH, s.r.o. Beroun, CZE 91.50 CZK 21 4**
Bialostockie Kopalnie Surowców Mineralnych sp. z o.o. Bialystok, POL 100.00 PLN 9 0**
BT Poznan Sp. z.o.o. Poznan, POL 75.00 PLN 4 -2**
BT Topbeton Sp. z.o.o. 1) Gorzow Wielkopolski, POL 50.00 PLN 26 2**
Calumite s.r.o. Ostrava, CZE 51.00 CZK 123 21**
Carpat Agregate S.A. Bucharest, ROU 98.84 RON 2 -30**
Carpat Beton S.R.L. Bucharest, ROU 99.03 RON 84 -8**
Carpat Beton Servicii Pompe SRL Bucharest, ROU 99.03 RON 7 0**
Carpat Cemtrans S.R.L. Bucharest, ROU 99.03 RON 13 1**
Carpatcement Holding S.A. Bucharest, ROU 99.03 RON 1,177 197
CaspiCement Limited Liability Partnership Shetpe, KAZ 100.00 KZT 6,736 -1,393**
CaspiNerud Limited Liability Partnership Aktau, KAZ 75.10 KZT 2,455 -8**
Ceskomoravsky beton, a.s. Beroun, CZE 100.00 CZK 985 226**
Ceskomoravsky cement, a.s., nástupnická spolecnost Mokra, CZE 100.00 CZK 5,023 943
Ceskomoravsky sterk, a.s. Mokra, CZE 100.00 CZK 1,752 160**
Closed Joined Stock Company “Construction Materials” Sterlitamak, RUS 51.00 RUB 3,817 187
Gorazdze Beton Sp. z o.o. Opole, POL 100.00 PLN 99 -3
Gorazdze Cement S. A. Opole, POL 100.00 PLN 919 341
Gorazdze Kruszywa sp. z.o.o. Opole, POL 100.00 PLN 106 8**
HeidelbergCement Georgia, Ltd. Tbilisi, GEO 75.00 GEL 34 4
Con
solid
ated
fin
anci
al s
tate
men
tsA
ddit
iona
l inf
orm
atio
n
4
5
Com
bine
d m
anag
emen
t re
port
Cor
pora
te G
over
nanc
eC
onso
lidat
ed f
inan
cial
sta
tem
ents
Add
itio
nal i
nfor
mat
ion
To
our
shar
ehol
ders
2
3
4
5
1
Con
ten
ts

228 HeidelbergCement | Annual Report 2011
4
Company name Corporate seat HC AG direct
owner-ship %
Group owner-ship %
Cur-rency
Equity in million
Net in-come in million
Joint Stock Company - Bukhtarminskaya Cement Company Oktyabrskiy village, KAZ 100.00 KZT 9,476 522**
Kamenivo Slovakia a.s. Bytca-Hrabové, SVK 100.00 EUR 2 0**
Limited Liability Company “HeidelbergBeton Ukraine” Kryvyi Rih, UKR 99.97 UAH 51 0
Limited Liability Company “KSL” Busheve, UKR 100.00 UAH 50 -3
Limited Liability Company “Rybalsky Quarry” Dnepropetrovsk, UKR 100.00 UAH 14 -8
LLC “HeidelbergGranit Ukraine” Kryvyi Rih, UKR 99.79 UAH 31 1
LLC “HeidelbergBeton Georgia” Tbilisi, GEO 100.00 GEL 4 1
LLC “HeidelbergCement Rus” Podolsk, RUS 100.00 RUB 97 51
LLC “Kartuli Cementi” Tbilisi, GEO 73.00 GEL -16 -4
LLC “Terjola-Quarry” Tbilisi, GEO 100.00 GEL 2 0
OAO Voronezhskoe Rudoupravlenije Strelica, RUS 95.09 RUB 116 7
OOO “Norcem Kola” Murmansk, RUS 100.00 RUB 13 5
OOO KaliningradCement Kaliningrad, RUS 74.90 RUB 193 41
Open Joint Stock Company Gurovo-Beton Novogurovskiy, RUS 100.00 RUB -12 -14
Open Joint-Stock Company Slantsy Cement Plant “Cesla” Slantsy, RUS 97.23 RUB 1,685 64
Precon Polska Sp.z.o.o. Warsaw, POL 100.00 PLN 8 -1**
Public Joint Stock Company “HeidelbergCement Ukraine” Kryvyi Rih, UKR 99.73 UAH 690 -132
Recyfuel SRL Bucharest, ROU 99.03 RON 0 -1**
TBG BAK s.r.o. Trutnov, CZE 70.04 CZK 64 4**
TBG BETONMIX a. s. Brno, CZE 66.00 CZK 330 58**
TBG BETONPUMPY MORAVA s.r.o. Brno, CZE 84.90 CZK 19 -1**
TBG Plzen Transportbeton s.r.o. Beroun, CZE 50.10 CZK 61 13**
TBG SEVEROZAPADNI CECHY s.r.o. Chomutov, CZE 66.00 CZK 107 6**
TBG Vysocina s.r.o. Kozichovice, CZE 59.40 CZK 52 6**
TBG ZNOJMO s. r. o. Dyje, CZE 66.00 CZK 50 0**
“Tulacement” Limited Liability Company Novogurovskiy, RUS 100.00 RUB 2,695 -316
Subsidiaries
North America
Allied Ready Mix Concrete Limited Vancouver, CAN 100.00 CAD 0 -1**
Amangani SA Panama City, PAN 100.00 GBP 0 0**
Amcord, Inc. Dover, USA 100.00 USD 41 0**
Anche Holdings Inc Panama City, PAN 100.00 USD 2,111 0**
Asian Carriers Inc. Panama City, PAN 100.00 USD 0 -1**
Astravance Corp. Panama City, PAN 100.00 GBP 44,027 0**
Beazer East, Inc. Wilmington, USA 100.00 USD -282 -47**
Cadman (Black Diamond), Inc. Olympia, USA 100.00 USD 11 0**
Cadman (Rock), Inc. Olympia, USA 100.00 USD 15 -1**
Cadman (Seattle), Inc. Wilmington, USA 100.00 USD 51 3**
Cadman, Inc. Olympia, USA 100.00 USD 52 -8**
Calaveras Materials Inc. Sacramento, USA 100.00 USD 112 -1
Calaveras-Standard Materials, Inc. Sacramento, USA 100.00 USD 40 -2**
Campbell Concrete & Materials LLC Austin, USA 100.00 USD 40 -25
Cascapedia Corporation Panama City, PAN 100.00 GBP 0 0**
Cavenham Forest Industries LLC Wilmington, USA 100.00 USD 17 -1**
Civil and Marine Inc. Wilmington, USA 100.00 USD 51 -1**
Commercial Aggregates Transportation and Sales LLC Wilmington, USA 100.00 USD 1 0**
Constar LLC Wilmington, USA 100.00 USD 278 3**
Continental Florida Materials Inc. Tallahassee, USA 100.00 USD 116 -11
Cowichan Corporation Panama City, PAN 100.00 GBP 1,997 0**
Essex NA Holdings LLC Wilmington, USA 100.00 USD 53 0**
Ferndale Ready Mix & Gravel, Inc. Olympia, USA 100.00 USD 22 -1**
HACM, Inc. Wilmington, USA 100.00 USD 14 0**
HAMW Minerals, Inc. Wilmington, USA 100.00 USD 9 0**
Hanson Aggregates LLC Wilmington, USA 100.00 USD 1,021 -7
Hanson Aggregates BMC, Inc. Harrisburg, USA 100.00 USD 294 10
Hanson Aggregates Davon LLC Columbus, USA 100.00 USD 134 -4
Hanson Aggregates East LLC Wilmington, USA 100.00 USD 82 0**
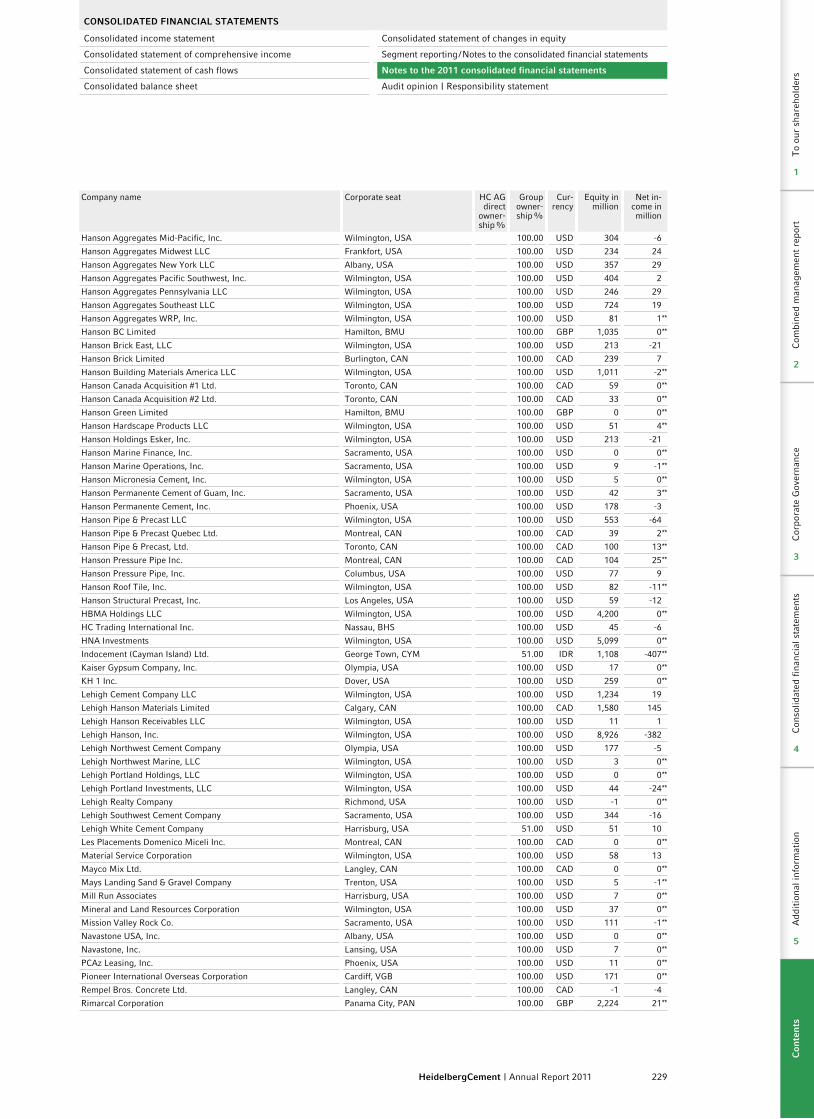
229HeidelbergCement | Annual Report 2011
CoNSoLIDATED FINANCIAL STATEMENTS
Consolidated income statement Consolidated statement of changes in equity
Consolidated statement of comprehensive income Segment reporting / Notes to the consolidated financial statements
Consolidated statement of cash flows Notes to the 2011 consolidated financial statements
Consolidated balance sheet Audit opinion | Responsibility statement
Company name Corporate seat HC AG direct
owner-ship %
Group owner-ship %
Cur-rency
Equity in million
Net in-come in million
Hanson Aggregates Mid-Pacific, Inc. Wilmington, USA 100.00 USD 304 -6
Hanson Aggregates Midwest LLC Frankfort, USA 100.00 USD 234 24
Hanson Aggregates New York LLC Albany, USA 100.00 USD 357 29
Hanson Aggregates Pacific Southwest, Inc. Wilmington, USA 100.00 USD 404 2
Hanson Aggregates Pennsylvania LLC Wilmington, USA 100.00 USD 246 29
Hanson Aggregates Southeast LLC Wilmington, USA 100.00 USD 724 19
Hanson Aggregates WRP, Inc. Wilmington, USA 100.00 USD 81 1**
Hanson BC Limited Hamilton, BMU 100.00 GBP 1,035 0**
Hanson Brick East, LLC Wilmington, USA 100.00 USD 213 -21
Hanson Brick Limited Burlington, CAN 100.00 CAD 239 7
Hanson Building Materials America LLC Wilmington, USA 100.00 USD 1,011 -2**
Hanson Canada Acquisition #1 Ltd. Toronto, CAN 100.00 CAD 59 0**
Hanson Canada Acquisition #2 Ltd. Toronto, CAN 100.00 CAD 33 0**
Hanson Green Limited Hamilton, BMU 100.00 GBP 0 0**
Hanson Hardscape Products LLC Wilmington, USA 100.00 USD 51 4**
Hanson Holdings Esker, Inc. Wilmington, USA 100.00 USD 213 -21
Hanson Marine Finance, Inc. Sacramento, USA 100.00 USD 0 0**
Hanson Marine Operations, Inc. Sacramento, USA 100.00 USD 9 -1**
Hanson Micronesia Cement, Inc. Wilmington, USA 100.00 USD 5 0**
Hanson Permanente Cement of Guam, Inc. Sacramento, USA 100.00 USD 42 3**
Hanson Permanente Cement, Inc. Phoenix, USA 100.00 USD 178 -3
Hanson Pipe & Precast LLC Wilmington, USA 100.00 USD 553 -64
Hanson Pipe & Precast Quebec Ltd. Montreal, CAN 100.00 CAD 39 2**
Hanson Pipe & Precast, Ltd. Toronto, CAN 100.00 CAD 100 13**
Hanson Pressure Pipe Inc. Montreal, CAN 100.00 CAD 104 25**
Hanson Pressure Pipe, Inc. Columbus, USA 100.00 USD 77 9
Hanson Roof Tile, Inc. Wilmington, USA 100.00 USD 82 -11**
Hanson Structural Precast, Inc. Los Angeles, USA 100.00 USD 59 -12
HBMA Holdings LLC Wilmington, USA 100.00 USD 4,200 0**
HC Trading International Inc. Nassau, BHS 100.00 USD 45 -6
HNA Investments Wilmington, USA 100.00 USD 5,099 0**
Indocement (Cayman Island) Ltd. George Town, CYM 51.00 IDR 1,108 -407**
Kaiser Gypsum Company, Inc. Olympia, USA 100.00 USD 17 0**
KH 1 Inc. Dover, USA 100.00 USD 259 0**
Lehigh Cement Company LLC Wilmington, USA 100.00 USD 1,234 19
Lehigh Hanson Materials Limited Calgary, CAN 100.00 CAD 1,580 145
Lehigh Hanson Receivables LLC Wilmington, USA 100.00 USD 11 1
Lehigh Hanson, Inc. Wilmington, USA 100.00 USD 8,926 -382
Lehigh Northwest Cement Company Olympia, USA 100.00 USD 177 -5
Lehigh Northwest Marine, LLC Wilmington, USA 100.00 USD 3 0**
Lehigh Portland Holdings, LLC Wilmington, USA 100.00 USD 0 0**
Lehigh Portland Investments, LLC Wilmington, USA 100.00 USD 44 -24**
Lehigh Realty Company Richmond, USA 100.00 USD -1 0**
Lehigh Southwest Cement Company Sacramento, USA 100.00 USD 344 -16
Lehigh White Cement Company Harrisburg, USA 51.00 USD 51 10
Les Placements Domenico Miceli Inc. Montreal, CAN 100.00 CAD 0 0**
Material Service Corporation Wilmington, USA 100.00 USD 58 13
Mayco Mix Ltd. Langley, CAN 100.00 CAD 0 0**
Mays Landing Sand & Gravel Company Trenton, USA 100.00 USD 5 -1**
Mill Run Associates Harrisburg, USA 100.00 USD 7 0**
Mineral and Land Resources Corporation Wilmington, USA 100.00 USD 37 0**
Mission Valley Rock Co. Sacramento, USA 100.00 USD 111 -1**
Navastone USA, Inc. Albany, USA 100.00 USD 0 0**
Navastone, Inc. Lansing, USA 100.00 USD 7 0**
PCAz Leasing, Inc. Phoenix, USA 100.00 USD 11 0**
Pioneer International Overseas Corporation Cardiff, VGB 100.00 USD 171 0**
Rempel Bros. Concrete Ltd. Langley, CAN 100.00 CAD -1 -4
Rimarcal Corporation Panama City, PAN 100.00 GBP 2,224 21**
Con
solid
ated
fin
anci
al s
tate
men
tsA
ddit
iona
l inf
orm
atio
n
4
5
Com
bine
d m
anag
emen
t re
port
Cor
pora
te G
over
nanc
eC
onso
lidat
ed f
inan
cial
sta
tem
ents
Add
itio
nal i
nfor
mat
ion
To
our
shar
ehol
ders
2
3
4
5
1
Con
ten
ts
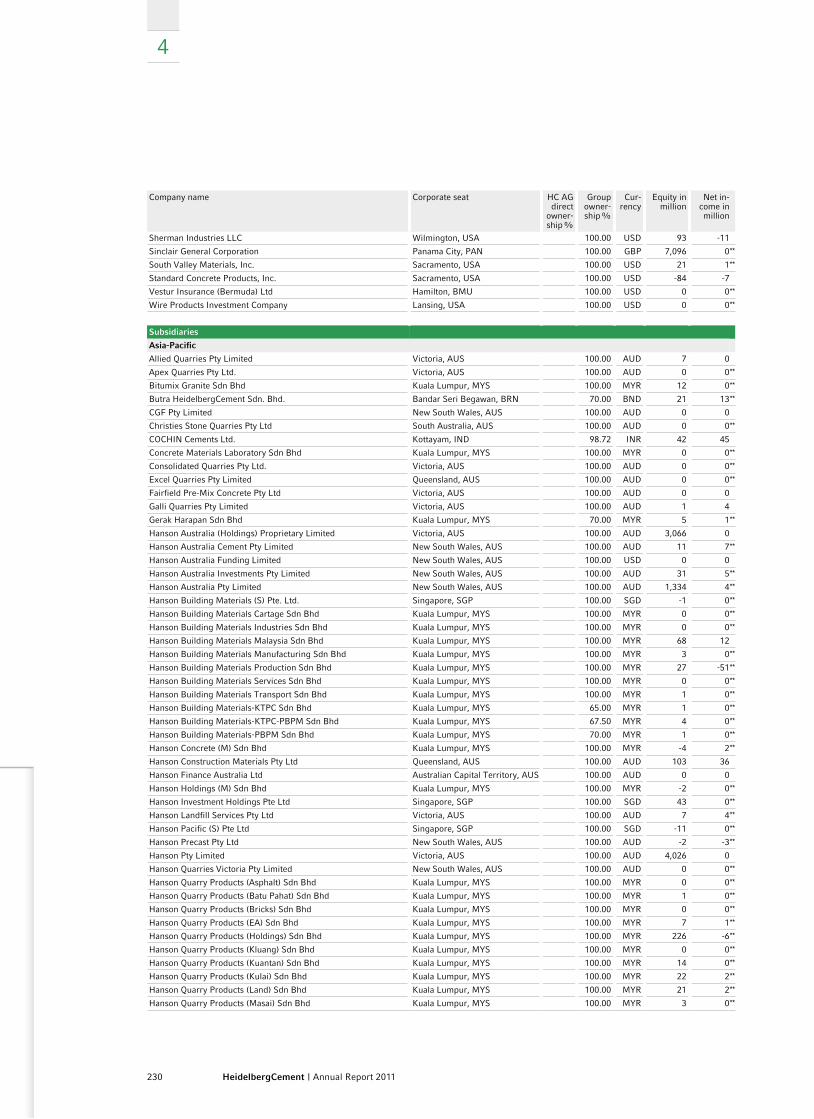
230 HeidelbergCement | Annual Report 2011
4
Company name Corporate seat HC AG direct
owner-ship %
Group owner-ship %
Cur-rency
Equity in million
Net in-come in million
Sherman Industries LLC Wilmington, USA 100.00 USD 93 -11
Sinclair General Corporation Panama City, PAN 100.00 GBP 7,096 0**
South Valley Materials, Inc. Sacramento, USA 100.00 USD 21 1**
Standard Concrete Products, Inc. Sacramento, USA 100.00 USD -84 -7
Vestur Insurance (Bermuda) Ltd Hamilton, BMU 100.00 USD 0 0**
Wire Products Investment Company Lansing, USA 100.00 USD 0 0**
Subsidiaries
Asia-Pacific
Allied Quarries Pty Limited Victoria, AUS 100.00 AUD 7 0
Apex Quarries Pty Ltd. Victoria, AUS 100.00 AUD 0 0**
Bitumix Granite Sdn Bhd Kuala Lumpur, MYS 100.00 MYR 12 0**
Butra HeidelbergCement Sdn. Bhd. Bandar Seri Begawan, BRN 70.00 BND 21 13**
CGF Pty Limited New South Wales, AUS 100.00 AUD 0 0
Christies Stone Quarries Pty Ltd South Australia, AUS 100.00 AUD 0 0**
COCHIN Cements Ltd. Kottayam, IND 98.72 INR 42 45
Concrete Materials Laboratory Sdn Bhd Kuala Lumpur, MYS 100.00 MYR 0 0**
Consolidated Quarries Pty Ltd. Victoria, AUS 100.00 AUD 0 0**
Excel Quarries Pty Limited Queensland, AUS 100.00 AUD 0 0**
Fairfield Pre-Mix Concrete Pty Ltd Victoria, AUS 100.00 AUD 0 0
Galli Quarries Pty Limited Victoria, AUS 100.00 AUD 1 4
Gerak Harapan Sdn Bhd Kuala Lumpur, MYS 70.00 MYR 5 1**
Hanson Australia (Holdings) Proprietary Limited Victoria, AUS 100.00 AUD 3,066 0
Hanson Australia Cement Pty Limited New South Wales, AUS 100.00 AUD 11 7**
Hanson Australia Funding Limited New South Wales, AUS 100.00 USD 0 0
Hanson Australia Investments Pty Limited New South Wales, AUS 100.00 AUD 31 5**
Hanson Australia Pty Limited New South Wales, AUS 100.00 AUD 1,334 4**
Hanson Building Materials (S) Pte. Ltd. Singapore, SGP 100.00 SGD -1 0**
Hanson Building Materials Cartage Sdn Bhd Kuala Lumpur, MYS 100.00 MYR 0 0**
Hanson Building Materials Industries Sdn Bhd Kuala Lumpur, MYS 100.00 MYR 0 0**
Hanson Building Materials Malaysia Sdn Bhd Kuala Lumpur, MYS 100.00 MYR 68 12
Hanson Building Materials Manufacturing Sdn Bhd Kuala Lumpur, MYS 100.00 MYR 3 0**
Hanson Building Materials Production Sdn Bhd Kuala Lumpur, MYS 100.00 MYR 27 -51**
Hanson Building Materials Services Sdn Bhd Kuala Lumpur, MYS 100.00 MYR 0 0**
Hanson Building Materials Transport Sdn Bhd Kuala Lumpur, MYS 100.00 MYR 1 0**
Hanson Building Materials-KTPC Sdn Bhd Kuala Lumpur, MYS 65.00 MYR 1 0**
Hanson Building Materials-KTPC-PBPM Sdn Bhd Kuala Lumpur, MYS 67.50 MYR 4 0**
Hanson Building Materials-PBPM Sdn Bhd Kuala Lumpur, MYS 70.00 MYR 1 0**
Hanson Concrete (M) Sdn Bhd Kuala Lumpur, MYS 100.00 MYR -4 2**
Hanson Construction Materials Pty Ltd Queensland, AUS 100.00 AUD 103 36
Hanson Finance Australia Ltd Australian Capital Territory, AUS 100.00 AUD 0 0
Hanson Holdings (M) Sdn Bhd Kuala Lumpur, MYS 100.00 MYR -2 0**
Hanson Investment Holdings Pte Ltd Singapore, SGP 100.00 SGD 43 0**
Hanson Landfill Services Pty Ltd Victoria, AUS 100.00 AUD 7 4**
Hanson Pacific (S) Pte Ltd Singapore, SGP 100.00 SGD -11 0**
Hanson Precast Pty Ltd New South Wales, AUS 100.00 AUD -2 -3**
Hanson Pty Limited Victoria, AUS 100.00 AUD 4,026 0
Hanson Quarries Victoria Pty Limited New South Wales, AUS 100.00 AUD 0 0**
Hanson Quarry Products (Asphalt) Sdn Bhd Kuala Lumpur, MYS 100.00 MYR 0 0**
Hanson Quarry Products (Batu Pahat) Sdn Bhd Kuala Lumpur, MYS 100.00 MYR 1 0**
Hanson Quarry Products (Bricks) Sdn Bhd Kuala Lumpur, MYS 100.00 MYR 0 0**
Hanson Quarry Products (EA) Sdn Bhd Kuala Lumpur, MYS 100.00 MYR 7 1**
Hanson Quarry Products (Holdings) Sdn Bhd Kuala Lumpur, MYS 100.00 MYR 226 -6**
Hanson Quarry Products (Kluang) Sdn Bhd Kuala Lumpur, MYS 100.00 MYR 0 0**
Hanson Quarry Products (Kuantan) Sdn Bhd Kuala Lumpur, MYS 100.00 MYR 14 0**
Hanson Quarry Products (Kulai) Sdn Bhd Kuala Lumpur, MYS 100.00 MYR 22 2**
Hanson Quarry Products (Land) Sdn Bhd Kuala Lumpur, MYS 100.00 MYR 21 2**
Hanson Quarry Products (Masai) Sdn Bhd Kuala Lumpur, MYS 100.00 MYR 3 0**
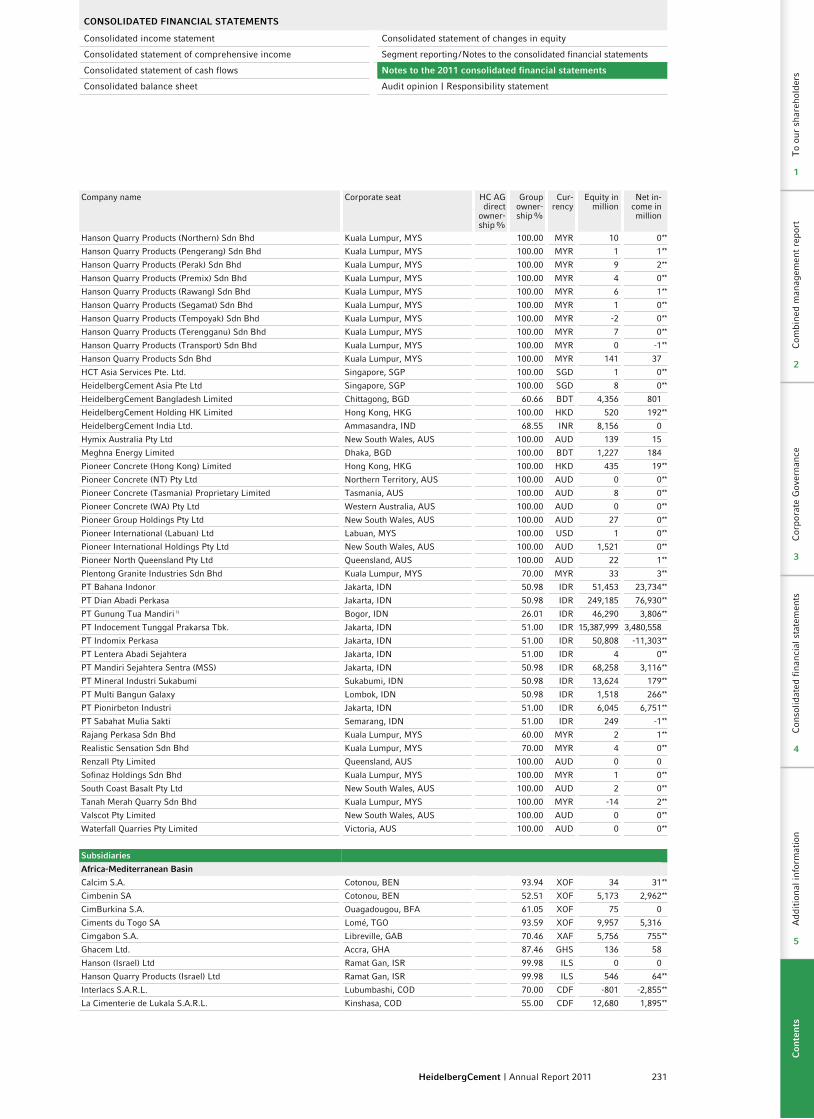
231HeidelbergCement | Annual Report 2011
CoNSoLIDATED FINANCIAL STATEMENTS
Consolidated income statement Consolidated statement of changes in equity
Consolidated statement of comprehensive income Segment reporting / Notes to the consolidated financial statements
Consolidated statement of cash flows Notes to the 2011 consolidated financial statements
Consolidated balance sheet Audit opinion | Responsibility statement
Company name Corporate seat HC AG direct
owner-ship %
Group owner-ship %
Cur-rency
Equity in million
Net in-come in million
Hanson Quarry Products (Northern) Sdn Bhd Kuala Lumpur, MYS 100.00 MYR 10 0**
Hanson Quarry Products (Pengerang) Sdn Bhd Kuala Lumpur, MYS 100.00 MYR 1 1**
Hanson Quarry Products (Perak) Sdn Bhd Kuala Lumpur, MYS 100.00 MYR 9 2**
Hanson Quarry Products (Premix) Sdn Bhd Kuala Lumpur, MYS 100.00 MYR 4 0**
Hanson Quarry Products (Rawang) Sdn Bhd Kuala Lumpur, MYS 100.00 MYR 6 1**
Hanson Quarry Products (Segamat) Sdn Bhd Kuala Lumpur, MYS 100.00 MYR 1 0**
Hanson Quarry Products (Tempoyak) Sdn Bhd Kuala Lumpur, MYS 100.00 MYR -2 0**
Hanson Quarry Products (Terengganu) Sdn Bhd Kuala Lumpur, MYS 100.00 MYR 7 0**
Hanson Quarry Products (Transport) Sdn Bhd Kuala Lumpur, MYS 100.00 MYR 0 -1**
Hanson Quarry Products Sdn Bhd Kuala Lumpur, MYS 100.00 MYR 141 37
HCT Asia Services Pte. Ltd. Singapore, SGP 100.00 SGD 1 0**
HeidelbergCement Asia Pte Ltd Singapore, SGP 100.00 SGD 8 0**
HeidelbergCement Bangladesh Limited Chittagong, BGD 60.66 BDT 4,356 801
HeidelbergCement Holding HK Limited Hong Kong, HKG 100.00 HKD 520 192**
HeidelbergCement India Ltd. Ammasandra, IND 68.55 INR 8,156 0
Hymix Australia Pty Ltd New South Wales, AUS 100.00 AUD 139 15
Meghna Energy Limited Dhaka, BGD 100.00 BDT 1,227 184
Pioneer Concrete (Hong Kong) Limited Hong Kong, HKG 100.00 HKD 435 19**
Pioneer Concrete (NT) Pty Ltd Northern Territory, AUS 100.00 AUD 0 0**
Pioneer Concrete (Tasmania) Proprietary Limited Tasmania, AUS 100.00 AUD 8 0**
Pioneer Concrete (WA) Pty Ltd Western Australia, AUS 100.00 AUD 0 0**
Pioneer Group Holdings Pty Ltd New South Wales, AUS 100.00 AUD 27 0**
Pioneer International (Labuan) Ltd Labuan, MYS 100.00 USD 1 0**
Pioneer International Holdings Pty Ltd New South Wales, AUS 100.00 AUD 1,521 0**
Pioneer North Queensland Pty Ltd Queensland, AUS 100.00 AUD 22 1**
Plentong Granite Industries Sdn Bhd Kuala Lumpur, MYS 70.00 MYR 33 3**
PT Bahana Indonor Jakarta, IDN 50.98 IDR 51,453 23,734**
PT Dian Abadi Perkasa Jakarta, IDN 50.98 IDR 249,185 76,930**
PT Gunung Tua Mandiri 1) Bogor, IDN 26.01 IDR 46,290 3,806**
PT Indocement Tunggal Prakarsa Tbk. Jakarta, IDN 51.00 IDR 15,387,999 3,480,558
PT Indomix Perkasa Jakarta, IDN 51.00 IDR 50,808 -11,303**
PT Lentera Abadi Sejahtera Jakarta, IDN 51.00 IDR 4 0**
PT Mandiri Sejahtera Sentra (MSS) Jakarta, IDN 50.98 IDR 68,258 3,116**
PT Mineral Industri Sukabumi Sukabumi, IDN 50.98 IDR 13,624 179**
PT Multi Bangun Galaxy Lombok, IDN 50.98 IDR 1,518 266**
PT Pionirbeton Industri Jakarta, IDN 51.00 IDR 6,045 6,751**
PT Sabahat Mulia Sakti Semarang, IDN 51.00 IDR 249 -1**
Rajang Perkasa Sdn Bhd Kuala Lumpur, MYS 60.00 MYR 2 1**
Realistic Sensation Sdn Bhd Kuala Lumpur, MYS 70.00 MYR 4 0**
Renzall Pty Limited Queensland, AUS 100.00 AUD 0 0
Sofinaz Holdings Sdn Bhd Kuala Lumpur, MYS 100.00 MYR 1 0**
South Coast Basalt Pty Ltd New South Wales, AUS 100.00 AUD 2 0**
Tanah Merah Quarry Sdn Bhd Kuala Lumpur, MYS 100.00 MYR -14 2**
Valscot Pty Limited New South Wales, AUS 100.00 AUD 0 0**
Waterfall Quarries Pty Limited Victoria, AUS 100.00 AUD 0 0**
Subsidiaries
Africa-Mediterranean Basin
Calcim S.A. Cotonou, BEN 93.94 XOF 34 31**
Cimbenin SA Cotonou, BEN 52.51 XOF 5,173 2,962**
CimBurkina S.A. Ouagadougou, BFA 61.05 XOF 75 0
Ciments du Togo SA Lomé, TGO 93.59 XOF 9,957 5,316
Cimgabon S.A. Libreville, GAB 70.46 XAF 5,756 755**
Ghacem Ltd. Accra, GHA 87.46 GHS 136 58
Hanson (Israel) Ltd Ramat Gan, ISR 99.98 ILS 0 0
Hanson Quarry Products (Israel) Ltd Ramat Gan, ISR 99.98 ILS 546 64**
Interlacs S.A.R.L. Lubumbashi, COD 70.00 CDF -801 -2,855**
La Cimenterie de Lukala S.A.R.L. Kinshasa, COD 55.00 CDF 12,680 1,895**
Con
solid
ated
fin
anci
al s
tate
men
tsA
ddit
iona
l inf
orm
atio
n
4
5
Com
bine
d m
anag
emen
t re
port
Cor
pora
te G
over
nanc
eC
onso
lidat
ed f
inan
cial
sta
tem
ents
Add
itio
nal i
nfor
mat
ion
To
our
shar
ehol
ders
2
3
4
5
1
Con
ten
ts
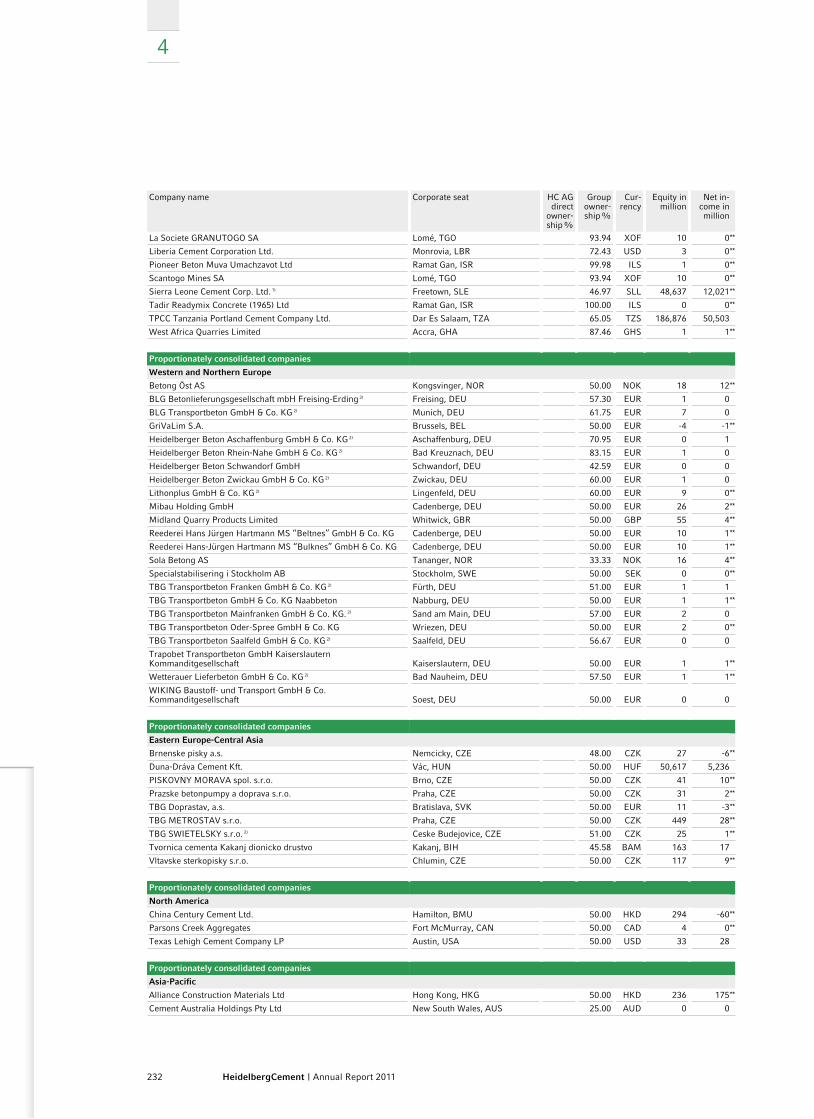
232 HeidelbergCement | Annual Report 2011
4
Company name Corporate seat HC AG direct
owner-ship %
Group owner-ship %
Cur-rency
Equity in million
Net in-come in million
La Societe GRANUTOGO SA Lomé, TGO 93.94 XOF 10 0**
Liberia Cement Corporation Ltd. Monrovia, LBR 72.43 USD 3 0**
Pioneer Beton Muva Umachzavot Ltd Ramat Gan, ISR 99.98 ILS 1 0**
Scantogo Mines SA Lomé, TGO 93.94 XOF 10 0**
Sierra Leone Cement Corp. Ltd. 1) Freetown, SLE 46.97 SLL 48,637 12,021**
Tadir Readymix Concrete (1965) Ltd Ramat Gan, ISR 100.00 ILS 0 0**
TPCC Tanzania Portland Cement Company Ltd. Dar Es Salaam, TZA 65.05 TZS 186,876 50,503
West Africa Quarries Limited Accra, GHA 87.46 GHS 1 1**
Proportionately consolidated companies
Western and Northern Europe
Betong Öst AS Kongsvinger, NOR 50.00 NOK 18 12**
BLG Betonlieferungsgesellschaft mbH Freising-Erding 2) Freising, DEU 57.30 EUR 1 0
BLG Transportbeton GmbH & Co. KG 2) Munich, DEU 61.75 EUR 7 0
GriVaLim S.A. Brussels, BEL 50.00 EUR -4 -1**
Heidelberger Beton Aschaffenburg GmbH & Co. KG 2) Aschaffenburg, DEU 70.95 EUR 0 1
Heidelberger Beton Rhein-Nahe GmbH & Co. KG 2) Bad Kreuznach, DEU 83.15 EUR 1 0
Heidelberger Beton Schwandorf GmbH Schwandorf, DEU 42.59 EUR 0 0
Heidelberger Beton Zwickau GmbH & Co. KG 2) Zwickau, DEU 60.00 EUR 1 0
Lithonplus GmbH & Co. KG 2) Lingenfeld, DEU 60.00 EUR 9 0**
Mibau Holding GmbH Cadenberge, DEU 50.00 EUR 26 2**
Midland Quarry Products Limited Whitwick, GBR 50.00 GBP 55 4**
Reederei Hans Jürgen Hartmann MS “Beltnes” GmbH & Co. KG Cadenberge, DEU 50.00 EUR 10 1**
Reederei Hans-Jürgen Hartmann MS “Bulknes” GmbH & Co. KG Cadenberge, DEU 50.00 EUR 10 1**
Sola Betong AS Tananger, NOR 33.33 NOK 16 4**
Specialstabilisering i Stockholm AB Stockholm, SWE 50.00 SEK 0 0**
TBG Transportbeton Franken GmbH & Co. KG 2) Fürth, DEU 51.00 EUR 1 1
TBG Transportbeton GmbH & Co. KG Naabbeton Nabburg, DEU 50.00 EUR 1 1**
TBG Transportbeton Mainfranken GmbH & Co. KG. 2) Sand am Main, DEU 57.00 EUR 2 0
TBG Transportbeton Oder-Spree GmbH & Co. KG Wriezen, DEU 50.00 EUR 2 0**
TBG Transportbeton Saalfeld GmbH & Co. KG 2) Saalfeld, DEU 56.67 EUR 0 0
Trapobet Transportbeton GmbH Kaiserslautern Kommanditgesellschaft Kaiserslautern, DEU 50.00 EUR 1 1**
Wetterauer Lieferbeton GmbH & Co. KG 2) Bad Nauheim, DEU 57.50 EUR 1 1**
WIKING Baustoff- und Transport GmbH & Co. Kommanditgesellschaft Soest, DEU 50.00 EUR 0 0
Proportionately consolidated companies
Eastern Europe-Central Asia
Brnenske pisky a.s. Nemcicky, CZE 48.00 CZK 27 -6**
Duna-Dráva Cement Kft. Vác, HUN 50.00 HUF 50,617 5,236
PISKOVNY MORAVA spol. s.r.o. Brno, CZE 50.00 CZK 41 10**
Prazske betonpumpy a doprava s.r.o. Praha, CZE 50.00 CZK 31 2**
TBG Doprastav, a.s. Bratislava, SVK 50.00 EUR 11 -3**
TBG METROSTAV s.r.o. Praha, CZE 50.00 CZK 449 28**
TBG SWIETELSKY s.r.o. 2) Ceske Budejovice, CZE 51.00 CZK 25 1**
Tvornica cementa Kakanj dionicko drustvo Kakanj, BIH 45.58 BAM 163 17
Vltavske sterkopisky s.r.o. Chlumin, CZE 50.00 CZK 117 9**
Proportionately consolidated companies
North America
China Century Cement Ltd. Hamilton, BMU 50.00 HKD 294 -60**
Parsons Creek Aggregates Fort McMurray, CAN 50.00 CAD 4 0**
Texas Lehigh Cement Company LP Austin, USA 50.00 USD 33 28
Proportionately consolidated companies
Asia-Pacific
Alliance Construction Materials Ltd Hong Kong, HKG 50.00 HKD 236 175**
Cement Australia Holdings Pty Ltd New South Wales, AUS 25.00 AUD 0 0

233HeidelbergCement | Annual Report 2011
CoNSoLIDATED FINANCIAL STATEMENTS
Consolidated income statement Consolidated statement of changes in equity
Consolidated statement of comprehensive income Segment reporting / Notes to the consolidated financial statements
Consolidated statement of cash flows Notes to the 2011 consolidated financial statements
Consolidated balance sheet Audit opinion | Responsibility statement
Company name Corporate seat HC AG direct
owner-ship %
Group owner-ship %
Cur-rency
Equity in million
Net in-come in million
Cement Australia Partnership New South Wales, AUS 25.00 AUD 45 69**
Cement Australia Pty Limited Victoria, AUS 25.00 AUD 0 0**
Easy Point Industrial Ltd. Hong Kong, HKG 50.00 HKD 2 1**
Jidong Heidelberg (Fufeng) Cement Company Limited Baoji, CHN 48.11 CNY 842 261**
Jidong Heidelberg (Jingyang) Cement Company Limited Xianyang City, CHN 50.00 CNY 964 381**
Lytton Unincorporated Joint Venture Queensland, AUS 50.00 AUD 0 0**
Squareal Cement Ltd Hong Kong, HKG 50.00 HKD 129 4**
Proportionately consolidated companies
Africa-Mediterranean Basin
Akçansa Çimento Sanayi ve Ticaret A.S. Istanbul, TUR 39.72 TRY 838 58**
Hanson Yam Limited Partnership 2) Ramat Gan, ISR 50.99 ILS 6 0**
Associated companies
Western and Northern Europe
BetonMarketing Nord GmbH 3) Hanover, DEU 50.00 50.00 EUR 0 0**
Betonpumpendienst Simonis GmbH & Co. KG 2) Ubstadt-Weiher, DEU 56.74 EUR 3 0**
Betonpumpen-Service Niedersachsen GmbH & Co. KG 3) Hanover, DEU 50.00 EUR 0 0**
Betotech GmbH & Co. KG 2) Heidelberg, DEU 100.00 EUR 0 0**
Betotech GmbH, Baustofftechnisches Labor 2) Eppelheim, DEU 59.31 EUR 0 0**
Betotech GmbH, Baustofftechnisches Labor 2) Nabburg, DEU 60.96 EUR 0 0**
betotech München GmbH & Co. KG 2) Munich, DEU 62.50 EUR 0 0**
BÜG Beton-Überwachung GmbH 2) Leimen, DEU 100.00 EUR 0 0**
BVS Beton-Vertrieb-Südbayern GmbH & Co. KG 2) Rohrdorf, DEU 61.75 EUR 2 1**
Condroz Béton S.A. 2) Brussels, BEL 66.92 EUR 0 0**
Donau Kies GmbH & Co. KG 2) Plattling, DEU 75.00 EUR 7 1**
DONAU MÖRTEL - GmbH & Co. KG 3) Neuburg a. Inn, DEU 50.00 EUR 0 0**
ENCI Zand en Grind B.V. 3) ’s-Hertogenbosch, NLD 50.00 EUR 4 -2**
Ernst Marschall GmbH & Co. KG Kies- und Schotterwerke Kressbronn, DEU 20.50 EUR 4 1**
Fertigbeton (FBU) GmbH & Co Kommanditgesellschaft Unterwittbach 2) Unterwittbach, DEU 57.14 EUR 0 0**
Gebrüder Willersinn Industriesandwerk GmbH & Co. KG Raunheim, DEU 33.33 EUR 1 0**
GENAMO Gesellschaft zur Entwicklung des Naherholungsgebietes Misburg-Ost mbH 3) Hanover, DEU 50.00 50.00 EUR 0 0**
H.H. & D.E. Drew Limited New Milton, GBR 49.00 GBP 11 0**
Hafenbetriebsgesellschaft mbH & Co. KG Stade 3) Stade, DEU 50.00 EUR 1 0**
Heidelberger Beton Donau-Iller GmbH & Co. KG 2) Elchingen, DEU 50.48 EUR 1 0**
Heidelberger Beton GmbH & Co. Stuttgart KG Remseck a. N., DEU 33.33 EUR 0 -1**
Heidelberger Beton Grenzland GmbH & Co. KG 3) Marktredwitz, DEU 50.00 EUR 1 1**
Heidelberger Beton Karlsruhe GmbH &Co. KG Karlsruhe, DEU 41.25 EUR 0 -1**
Heidelberger Fließestrich Südwest GmbH 2) Eppelheim, DEU 59.54 EUR 0 0**
Hessisches Bausteinwerk Dr. Blasberg GmbH & Co. KG Mörfelden-Walldorf, DEU 47.08 EUR 4 0**
Humber Sand and Gravel Limited 3) Egham, GBR 50.00 GBP 0 0**
ID Beton N.V. 3) Zeebrugge, BEL 50.00 EUR 0 0**
ISAR-DONAU MÖRTEL-GmbH & Co. KG Passau, DEU 33.33 EUR 0 0**
Kalksandsteinwerke Birkenmeier Gesellschaft mit beschränkter Haftung Breisach am Rhein, DEU 40.00 EUR 3 1**
KANN Beton GmbH & Co. KG 3) Bendorf, DEU 50.00 EUR 2 1**
Kieswerk Langsdorf GmbH 2) Langsdorf, DEU 62.45 EUR 2 0**
Kieswerke Flemmingen GmbH 2) Penig, DEU 54.00 EUR 1 0**
Kronimus Aktiengesellschaft Iffezheim, DEU 24.90 24.90 EUR 17 -3**
KVB Kies- Vertrieb GmbH & Co. KG Karlsdorf-Neuthard, DEU 22.13 EUR 0 0**
MDB Mörteldienst GmbH & Co. KG Berlin-Brandenburg 2) Berlin, DEU 90.00 EUR 0 0**
MDF Mörtel- und Estrich-Dienst Franken GmbH & Co. KG Nürnberg, DEU 26.52 EUR 0 0**
Mendip Rail Limited 3) Markfield, GBR 50.00 GBP 3 0**
MERMANS BETON N.V. Arendonk, BEL 49.91 EUR 1 -1**
Misburger Hafengesellschaft mit beschränkter Haftung Hanover, DEU 39.66 39.66 EUR 1 0**
Mittelschwäbische Transport- und Frischbeton-Gesellschaft mit beschränkter Haftung & Co. Kommanditgesellschaft Thannhausen, DEU 30.23 EUR 0 0**
MM MAIN-MÖRTEL GmbH & Co. KG 2) Aschaffenburg, DEU 59.74 EUR 0 0**
Con
solid
ated
fin
anci
al s
tate
men
tsA
ddit
iona
l inf
orm
atio
n
4
5
Com
bine
d m
anag
emen
t re
port
Cor
pora
te G
over
nanc
eC
onso
lidat
ed f
inan
cial
sta
tem
ents
Add
itio
nal i
nfor
mat
ion
To
our
shar
ehol
ders
2
3
4
5
1
Con
ten
ts
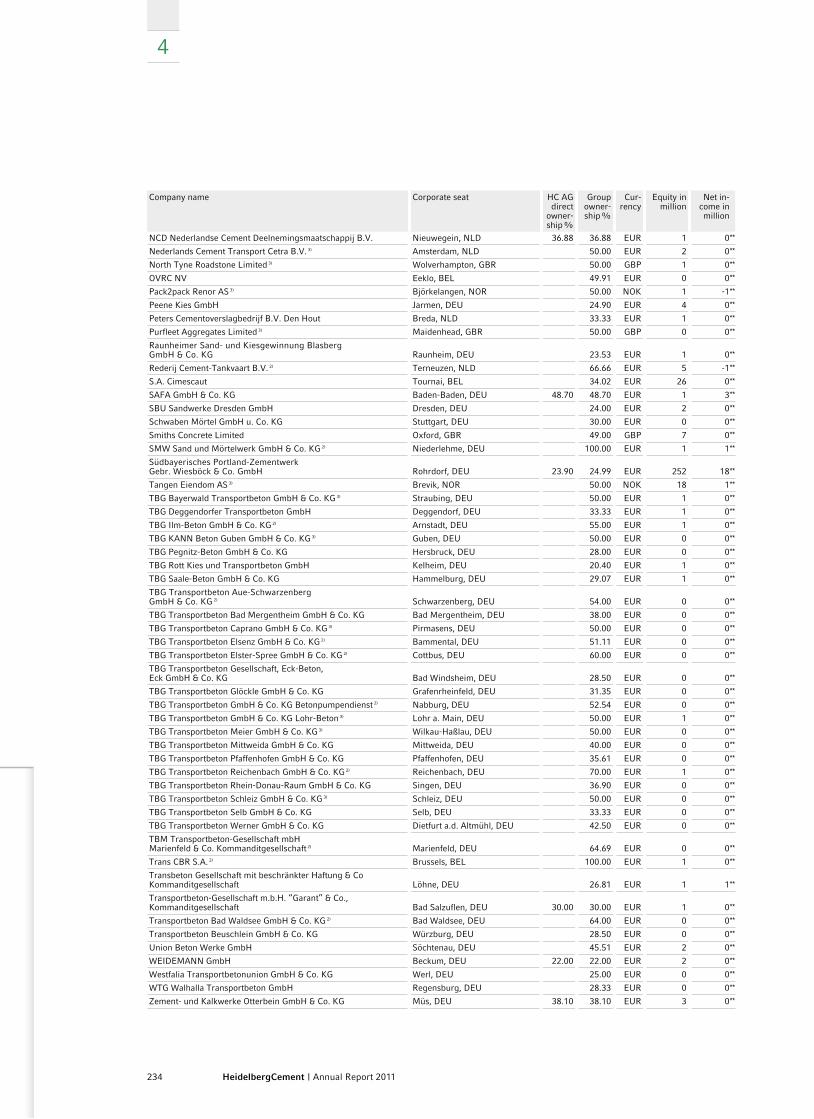
234 HeidelbergCement | Annual Report 2011
4
Company name Corporate seat HC AG direct
owner-ship %
Group owner-ship %
Cur-rency
Equity in million
Net in-come in million
NCD Nederlandse Cement Deelnemingsmaatschappij B.V. Nieuwegein, NLD 36.88 36.88 EUR 1 0**
Nederlands Cement Transport Cetra B.V. 3) Amsterdam, NLD 50.00 EUR 2 0**
North Tyne Roadstone Limited 3) Wolverhampton, GBR 50.00 GBP 1 0**
OVRC NV Eeklo, BEL 49.91 EUR 0 0**
Pack2pack Renor AS 3) Björkelangen, NOR 50.00 NOK 1 -1**
Peene Kies GmbH Jarmen, DEU 24.90 EUR 4 0**
Peters Cementoverslagbedrijf B.V. Den Hout Breda, NLD 33.33 EUR 1 0**
Purfleet Aggregates Limited 3) Maidenhead, GBR 50.00 GBP 0 0**
Raunheimer Sand- und Kiesgewinnung Blasberg GmbH & Co. KG Raunheim, DEU 23.53 EUR 1 0**
Rederij Cement-Tankvaart B.V. 2) Terneuzen, NLD 66.66 EUR 5 -1**
S.A. Cimescaut Tournai, BEL 34.02 EUR 26 0**
SAFA GmbH & Co. KG Baden-Baden, DEU 48.70 48.70 EUR 1 3**
SBU Sandwerke Dresden GmbH Dresden, DEU 24.00 EUR 2 0**
Schwaben Mörtel GmbH u. Co. KG Stuttgart, DEU 30.00 EUR 0 0**
Smiths Concrete Limited Oxford, GBR 49.00 GBP 7 0**
SMW Sand und Mörtelwerk GmbH & Co. KG 2) Niederlehme, DEU 100.00 EUR 1 1**
Südbayerisches Portland-Zementwerk Gebr. Wiesböck & Co. GmbH Rohrdorf, DEU 23.90 24.99 EUR 252 18**
Tangen Eiendom AS 3) Brevik, NOR 50.00 NOK 18 1**
TBG Bayerwald Transportbeton GmbH & Co. KG 3) Straubing, DEU 50.00 EUR 1 0**
TBG Deggendorfer Transportbeton GmbH Deggendorf, DEU 33.33 EUR 1 0**
TBG Ilm-Beton GmbH & Co. KG 2) Arnstadt, DEU 55.00 EUR 1 0**
TBG KANN Beton Guben GmbH & Co. KG 3) Guben, DEU 50.00 EUR 0 0**
TBG Pegnitz-Beton GmbH & Co. KG Hersbruck, DEU 28.00 EUR 0 0**
TBG Rott Kies und Transportbeton GmbH Kelheim, DEU 20.40 EUR 1 0**
TBG Saale-Beton GmbH & Co. KG Hammelburg, DEU 29.07 EUR 1 0**
TBG Transportbeton Aue-Schwarzenberg GmbH & Co. KG 2) Schwarzenberg, DEU 54.00 EUR 0 0**
TBG Transportbeton Bad Mergentheim GmbH & Co. KG Bad Mergentheim, DEU 38.00 EUR 0 0**
TBG Transportbeton Caprano GmbH & Co. KG 3) Pirmasens, DEU 50.00 EUR 0 0**
TBG Transportbeton Elsenz GmbH & Co. KG 2) Bammental, DEU 51.11 EUR 0 0**
TBG Transportbeton Elster-Spree GmbH & Co. KG 2) Cottbus, DEU 60.00 EUR 0 0**
TBG Transportbeton Gesellschaft, Eck-Beton, Eck GmbH & Co. KG Bad Windsheim, DEU 28.50 EUR 0 0**
TBG Transportbeton Glöckle GmbH & Co. KG Grafenrheinfeld, DEU 31.35 EUR 0 0**
TBG Transportbeton GmbH & Co. KG Betonpumpendienst 2) Nabburg, DEU 52.54 EUR 0 0**
TBG Transportbeton GmbH & Co. KG Lohr-Beton 3) Lohr a. Main, DEU 50.00 EUR 1 0**
TBG Transportbeton Meier GmbH & Co. KG 3) Wilkau-Haßlau, DEU 50.00 EUR 0 0**
TBG Transportbeton Mittweida GmbH & Co. KG Mittweida, DEU 40.00 EUR 0 0**
TBG Transportbeton Pfaffenhofen GmbH & Co. KG Pfaffenhofen, DEU 35.61 EUR 0 0**
TBG Transportbeton Reichenbach GmbH & Co. KG 2) Reichenbach, DEU 70.00 EUR 1 0**
TBG Transportbeton Rhein-Donau-Raum GmbH & Co. KG Singen, DEU 36.90 EUR 0 0**
TBG Transportbeton Schleiz GmbH & Co. KG 3) Schleiz, DEU 50.00 EUR 0 0**
TBG Transportbeton Selb GmbH & Co. KG Selb, DEU 33.33 EUR 0 0**
TBG Transportbeton Werner GmbH & Co. KG Dietfurt a.d. Altmühl, DEU 42.50 EUR 0 0**
TBM Transportbeton-Gesellschaft mbH Marienfeld & Co. Kommanditgesellschaft 2) Marienfeld, DEU 64.69 EUR 0 0**
Trans CBR S.A. 2) Brussels, BEL 100.00 EUR 1 0**
Transbeton Gesellschaft mit beschränkter Haftung & Co Kommanditgesellschaft Löhne, DEU 26.81 EUR 1 1**
Transportbeton-Gesellschaft m.b.H. “Garant” & Co., Kommanditgesellschaft Bad Salzuflen, DEU 30.00 30.00 EUR 1 0**
Transportbeton Bad Waldsee GmbH & Co. KG 2) Bad Waldsee, DEU 64.00 EUR 0 0**
Transportbeton Beuschlein GmbH & Co. KG Würzburg, DEU 28.50 EUR 0 0**
Union Beton Werke GmbH Söchtenau, DEU 45.51 EUR 2 0**
WEIDEMANN GmbH Beckum, DEU 22.00 22.00 EUR 2 0**
Westfalia Transportbetonunion GmbH & Co. KG Werl, DEU 25.00 EUR 0 0**
WTG Walhalla Transportbeton GmbH Regensburg, DEU 28.33 EUR 0 0**
Zement- und Kalkwerke Otterbein GmbH & Co. KG Müs, DEU 38.10 38.10 EUR 3 0**

235HeidelbergCement | Annual Report 2011
CoNSoLIDATED FINANCIAL STATEMENTS
Consolidated income statement Consolidated statement of changes in equity
Consolidated statement of comprehensive income Segment reporting / Notes to the consolidated financial statements
Consolidated statement of cash flows Notes to the 2011 consolidated financial statements
Consolidated balance sheet Audit opinion | Responsibility statement
Company name Corporate seat HC AG direct
owner-ship %
Group owner-ship %
Cur-rency
Equity in million
Net in-come in million
Associated companies
Eastern Europe-Central Asia
BETONIKA plus s.r.o. Luzec nad Vltavou, CZE 33.33 CZK 85 9**
CEMET S.A. Warsaw, POL 42.91 PLN 52 13**
Centrum Technologiczne Betotech Sp. z o.o. 2) Katowice, POL 100.00 PLN 4 0**
Gorazdze Trans Sp z o.o. w likwidacji 2) Opole, POL 100.00 PLN 4 0**
Open Joint Stock Company “Mineral Resources Company” Ishimbay, RUS 25.50 RUB 893 58
Podgrodzie Sp. z o.o. 2) Wroclaw, POL 100.00 PLN 14 -1**
PREFA Grygov a.s. 2) Grygov, CZE 53.73 CZK 71 -1**
SP Bohemia, k.s. 2) Kraluv Dvur, CZE 75.00 CZK 172 14**
TBG Betonove stavby Klatovy s.r.o. Beroun, CZE 25.05 CZK 42 2**
TBG Louny s.r.o. Louny, CZE 33.33 CZK 34 3**
TBG PKS a.s. Zdar nad Sazavou, CZE 29.70 CZK 29 1**
TBG Wroclaw Sp. z o.o. 2) Wroclaw, POL 100.00 PLN 7 1**
Associated companies
North America
Allied Cement Company, d/b/a CPC Terminals (Limited Partnership Interest) 3) Austin, USA 50.00 USD 1 -2**
American Stone Company 3) Raleigh, USA 50.00 USD 4 0**
California Commercial Asphalt Company LLC 3) Wilmington, USA 50.00 USD 9 1**
Cemstone Products Company St. Paul, USA 49.45 USD 10 -2**
Cemstone Ready-Mix, Inc. Madison, USA 44.01 USD 4 0**
Chandler Concrete/Piedmont, Inc. Raleigh, USA 33.33 USD 7 0**
Chaney Enterprises Limited Partnership Olympia, USA 25.00 USD 13 0**
KSA Limited Partnership 3) Columbus, USA 50.00 USD 1 0**
Newbury Development Associates, LP 2) Bridgeville, USA 100.00 USD 3 0**
Red Bluff Sand & Gravel, L.L.C. 3) Montgomery, USA 50.00 USD 2 0**
Southstar Limited Partnership Annapolis, USA 25.00 USD 15 0**
Twin City Concrete Products Co. St. Paul, USA 33.63 USD 11 4**
Two Rivers Cement LLC 3) Dover, USA 50.00 USD 23 0**
Upland Ready Mix Ltd. 3) Campbell River, CAN 50.00 CAD 1 0**
Associated companies
Asia-Pacific
M&H Quarries Partnership 3) Victoria, AUS 50.00 AUD -1 0**
Metromix Pty Limited 3) New South Wales, AUS 50.00 AUD 0 -1
Penrith Lakes Development Corporation Limited New South Wales, AUS 20.00 AUD -301 -2
PT Cibinong Center Industrial Estate Jakarta, IDN 25.50 IDR 35,980 8,080**
PT Pama Indo Mining Jakarta, IDN 20.40 IDR 33,449 6,370**
West Australian Landfill Services Pty Ltd 3) Victoria, AUS 50.00 AUD 3 5**
Western Suburbs Concrete Partnership 3) New South Wales, AUS 50.00 AUD 0 2
Associated companies
Africa-Mediterranean Basin
Alrashid Abetong Company Ltd Riyadh, SAU 45.00 SAR 156 107**
Fortia Cement S.A. Lome, TGO 46.97 XAF 7,746 921**
The following companies are reflected in the consolidated financial statements at cost (available for sale at cost) due to their immateriality.
Immaterial subsidiaries
Western and Northern Europe
B.V. Mortel Installatie Assen “M.I.A.” Assen, NLD 66.67 EUR 2 0**
Bausteinwerk Bott - Blasberg G.m.b.H. & Co. Kommanditgesellschaft Heppenheim (Bergstraße), DEU 61.58 EUR 1 0**
Betonpumpendienst Simonis Verwaltungsgesellschaft mbH Ubstadt-Weiher, DEU 56.69 EUR 0 0**
betotech München Verwaltungs GmbH Munich, DEU 62.50 EUR 0 0**
Betotech Verwaltungs-GmbH Heidelberg, DEU 100.00 EUR 0 0**
Con
solid
ated
fin
anci
al s
tate
men
tsA
ddit
iona
l inf
orm
atio
n
4
5
Com
bine
d m
anag
emen
t re
port
Cor
pora
te G
over
nanc
eC
onso
lidat
ed f
inan
cial
sta
tem
ents
Add
itio
nal i
nfor
mat
ion
To
our
shar
ehol
ders
2
3
4
5
1
Con
ten
ts

236 HeidelbergCement | Annual Report 2011
4
Company name Corporate seat HC AG direct
owner-ship %
Group owner-ship %
Cur-rency
Equity in million
Net in-come in million
BLG Beteiligungen GmbH Munich, DEU 61.75 EUR 0 0**
BVS Beton-Vertrieb-Südbayern Verwaltung GmbH Rohrdorf, DEU 61.75 EUR 0 0**
Donau Kies Verwaltungs GmbH Plattling, DEU 75.00 EUR 0 0**
Etablissement F.S. Bivois SARL Strasbourg, FRA 60.00 EUR 0 0**
Fertigbeton (FBU) GmbH Unterwittbach, DEU 57.14 EUR 0 0**
Hanson Aggregates Verwaltungs-GmbH Leinatal, DEU 100.00 EUR 0 0**
HeidelbergCement Baustoffe für Geotechnik Verwaltungs-GmbH Ennigerloh, DEU 100.00 100.00 EUR 0 0**
HeidelbergCement Grundstücksverwaltungsgesellschaft mbH Heidelberg, DEU 100.00 100.00 EUR 0 0
HeidelbergCement Shared Services GmbH Leimen, DEU 100.00 100.00 EUR 0 0**
HeidelbergCement Technology Center GmbH Heidelberg, DEU 100.00 EUR 0 0
Heidelberger Beton Aschaffenburg Verwaltungs-GmbH Aschaffenburg, DEU 70.74 EUR 0 0**
Heidelberger Beton Donau-Iller Verwaltungs-GmbH Unterelchingen, DEU 50.46 EUR 0 0**
Heidelberger Beton Donau-Naab Verwaltungsgesellschaft mbH Burglengenfeld, DEU 85.00 EUR 0 0**
Heidelberger Beton Rhein-Nahe Verwaltungs-GmbH Bad Kreuznach, DEU 83.08 EUR 0 0**
Heidelberger Beton Zwickau Verwaltungs-GmbH Zwickau, DEU 60.00 EUR 0 0**
Heidelberger Betonelemente Verwaltungs-GmbH Chemnitz, DEU 83.00 EUR 0 0**
Heidelberger Betonpumpen Rhein-Main-Nahe Verwaltungs-GmbH Frankfurt/Main, DEU 93.74 EUR 0 0**
Heidelberger Energie GmbH Heidelberg, DEU 100.00 EUR 0 0
Heidelberger Kalksandstein Grundstücks- und Beteiligungs-Verwaltungs-GmbH Durmersheim, DEU 100.00 EUR 0 0**
Heidelberger KS Beteiligungen Deutschland Verwaltungsgesellschaft mbH Heidelberg, DEU 100.00 EUR 0 0**
Heidelberger Sand und Kies Handel & Logistik GmbH Essen, DEU 100.00 EUR -1 0**
Heidelberger Sand und Kies Handels- und Vertriebs-GmbH Heidelberg, DEU 100.00 EUR 0 0**
Heidelberger Weserkies Verwaltungs-GmbH Bremen, DEU 100.00 EUR 0 0**
Kalksandsteinwerk Amberg GmbH & Co. KG Ebermannsdorf, DEU 50.10 EUR 1 0**
Kalksandsteinwerk Amberg Verwaltungs-GmbH Ebermannsdorf, DEU 50.10 EUR 0 0**
Kieswerke Kieser GmbH & Co. KG Gotha, DEU 51.00 EUR 0 0**
Kieswerke Kieser Verwaltungs-GmbH Gotha, DEU 51.00 EUR 0 0**
Lieferbeton Gesellschaft mit beschränkter Haftung Bad Nauheim, DEU 57.60 EUR 0 0**
Lithonplus Verwaltungs-GmbH Lingenfeld, DEU 60.00 EUR 0 0**
Materiaux de Boran S.A. Boran-sur-Oise, FRA 99.84 EUR 0 0**
MDB Mörteldienst Verwaltungs-GmbH Berlin-Brandenburg Berlin, DEU 90.00 EUR 0 0**
MM MAIN-MÖRTEL Verwaltungsgesellschaft mbH Aschaffenburg, DEU 59.74 EUR 0 0**
Paderborner Transport-Beton-Gesellschaft mit beschränkter Haftung Paderborn, DEU 75.00 EUR 0 0**
Quadro Bausysteme GmbH Durmersheim, DEU 80.00 EUR 0 0**
RLG Rohstoffe GmbH & Co. KG Essen, DEU 100.00 EUR 0 0**
RLG Rohstoffe Verwaltungsgesellschaft mbH Mülheim a. d. Ruhr, DEU 100.00 EUR 0 0**
Roewekamp GmbH Gelsenkirchen, DEU 100.00 EUR 0 0**
SBM Systembaumontagen GmbH Chemnitz, DEU 83.00 EUR 0 0**
SCI Bicowal Strasbourg, FRA 60.00 EUR 0 0**
SMW Sand und Mörtelwerk Verwaltungs-GmbH Niederlehme, DEU 100.00 EUR 0 0**
SPRL Ferme de Wisempierre Saint-Maur-Ere, BEL 100.00 EUR 2 0**
SRS Rail Vehicles AB Osby, SWE 100.00 SEK 1 0**
SRS Sjölanders AB Stockholm, SWE 100.00 SEK 4 -3**
Svabo Kaross & Hydraulservice AB Stockholm, SWE 51.00 SEK 1 0**
TBG Ilm-Beton Verwaltungs-GmbH Arnstadt, DEU 55.00 EUR 0 0**
TBG Transportbeton Elsenz Verwaltungsgesellschaft mbH Bammental, DEU 51.11 EUR 0 0**
TBG Transportbeton Elster-Spree Verwaltungs-GmbH Cottbus, DEU 60.00 EUR 0 0**
TBG Transportbeton Franken Geschäftsführung GmbH Fürth, DEU 51.00 EUR 0 0**
TBG Transportbeton Kurpfalz Verwaltungsgesellschaft mbH Eppelheim, DEU 51.11 EUR 0 0**
TBG Transportbeton Mainfranken Geschäftsführungs GmbH Sand am Main, DEU 57.00 EUR 0 0**
TBG Transportbeton Reichenbach Verwaltungs-GmbH Reichenbach, DEU 70.00 EUR 0 0**
TBG Transportbeton Saalfeld Verwaltungs-GmbH Saalfeld, DEU 56.67 EUR 0 0**
TBG Transportbeton Schwarzenberg Verwaltungs-GmbH Schwarzenberg, DEU 60.00 EUR 0 0**
TBG WIKA-Beton Verwaltungs-GmbH Stade, DEU 100.00 EUR 0 0**
TBH Transportbeton Hamburg Verwaltungs-GmbH Hamburg, DEU 85.00 EUR 0 0**
TBM Transportbeton-Gesellschaft mit beschränkter Haftung Marienfeld Harsewinkel, DEU 64.69 EUR 0 0**

237HeidelbergCement | Annual Report 2011
CoNSoLIDATED FINANCIAL STATEMENTS
Consolidated income statement Consolidated statement of changes in equity
Consolidated statement of comprehensive income Segment reporting / Notes to the consolidated financial statements
Consolidated statement of cash flows Notes to the 2011 consolidated financial statements
Consolidated balance sheet Audit opinion | Responsibility statement
Company name Corporate seat HC AG direct
owner-ship %
Group owner-ship %
Cur-rency
Equity in million
Net in-come in million
TopCem Holding B.V. ’s-Hertogenbosch, NLD 100.00 EUR 0 0
Transportbeton Bad Waldsee Geschäftsführungs GmbH Bad Waldsee, DEU 64.00 EUR 0 0**
Transportbeton-Gesellschaft Kressbronn mit beschränkter Haftung Kressbronn, DEU 52.30 EUR 0 0**
Verwaltungsgesellschaft Baustoffwerke Dresden mbH Dresden, DEU 51.00 EUR 0 0**
Walhalla Kalk Verwaltungsgesellschaft mbH Regensburg, DEU 80.00 80.00 EUR 0 0**
Immaterial subsidiaries
Eastern Europe-Central Asia
Bratislavské štrkopiesky, s.r.o. Blatne, SVK 75.00 EUR -1 0**
Budejovicke Sterkopisky, spol. s.r.o. Budweis, CZE 74.93 CZK 0 5**
Bukhtarma TeploEnergo LLP Oktyabrskiy village, KAZ 100.00 KZT -164 -98**
Bukhtarma Vodokanal LLP Oktyabrskiy village, KAZ 100.00 KZT -81 -8**
Center Cement Plus Limited Liability Partnership Astana, KAZ 100.00 KZT 193 36**
Donau Kies Bohemia Verwaltungs, s.r.o. Plzen, CZE 75.00 CZK 0 0**
Geo Nieruchomosci Społka z ograniczona odpowiedzialnoscia Opole, POL 100.00 PLN 0 0**
HeidelbergCement Services - LLP Almaty, KAZ 100.00 KZT 12 9**
Heidelberg Vostok-Cement LLP Almaty, KAZ 100.00 KZT 237 480
Klatovske sterkopisky s.r.o. Plzen, CZE 75.00 CZK -8 0**
Labske sterkopisky a beton s.r.o. Litomerice, CZE 60.00 CZK -4 0**
LLC “HeidelbergCement Caucasus” Tbilisi, GEO 100.00 GEL 0 0
MIXT Sp. z o. o. Opole, POL 100.00 PLN 4 1**
OOO StrelicaCement Strelica, RUS 100.00 RUB 39 -1
Plzenske sterkopisky s.r.o. Plzen, CZE 60.00 CZK -3 0**
Polgrunt Sp. z o. o. Opole, POL 100.00 PLN 1 0**
ROBA sterkovny Nové Sedlo s.r.o. Zatec, CZE 75.00 CZK -11 1**
SABIA spol. s.r.o. Bohusovice nad Ori, CZE 59.40 CZK 9 1**
Severoceske piskovny a sterkovny s.r.o. Zatec, CZE 73.50 CZK 58 3**
TRANS-SERVIS spol. s.r.o. Kraluv Dvur, CZE 100.00 CZK 78 -1**
VAPIS stavební hmoty s.r.o. Praha, CZE 51.00 CZK 2 0**
Immaterial subsidiaries
North America
Gypsum Carrier Inc Panama City, PAN 100.00 GBP 55 0**
Mediterranean Carriers, Inc. Panama City, PAN 100.00 USD 3 0**
Immaterial subsidiaries
Asia-Pacific
PT Bhakti Sari Perkasa Abadi Jakarta, IDN 51.00 IDR 4 0**
PT Makmur Abadi Perkasa Mandiri Jakarta, IDN 51.00 IDR 12 0**
PT Sari Bhakti Sejati Jakarta, IDN 51.00 IDR 4 0**
The following associates and joint ventures are accounted for at cost (available for sale at cost) due to their immateriality
Immaterial associates and joint ventures
Western and Northern Europe
AB Stebo Göteborg, SWE 50.00 SEK 0 0**
AB Strömstadsbetong Göteborg, SWE 33.00 SEK 0 0**
AB Strömstadsbetong & Co Kommanditbolag Göteborg, SWE 33.00 SEK 4 4**
Alzagri NV Brugge, BEL 50.00 EUR 1 0**
B.V. Autotransport Sint Pieter Maastricht, NLD 50.00 EUR 0 0**
B.V. Edese Beton Centrale E.B.C. Arnhem, NLD 12.00 EUR 21 -1**
Baustoff- und Umschlags-GmbH Mosbach, DEU 38.14 EUR 0 0**
BetonCenter Swinkels B.V. Helmond, NLD 50.00 EUR -2 0**
Betonmortel Grevelingen B.V. Zierikzee, NLD 50.00 EUR 1 0**
Betonmortelcentrale De Mark B.V. Breda, NLD 28.57 EUR 1 0**
Betonmortelfabriek Tilburg Bemoti B.V. Tilburg, NLD 38.67 EUR 0 -1**
Betonpumpen-Service Niedersachsen Verwaltungs-GmbH Hanover, DEU 50.00 50.00 EUR 0 0**
Betuwe Beton Holding B.V. Tiel, NLD 50.00 EUR 5 0**
Con
solid
ated
fin
anci
al s
tate
men
tsA
ddit
iona
l inf
orm
atio
n
4
5
Com
bine
d m
anag
emen
t re
port
Cor
pora
te G
over
nanc
eC
onso
lidat
ed f
inan
cial
sta
tem
ents
Add
itio
nal i
nfor
mat
ion
To
our
shar
ehol
ders
2
3
4
5
1
Con
ten
ts
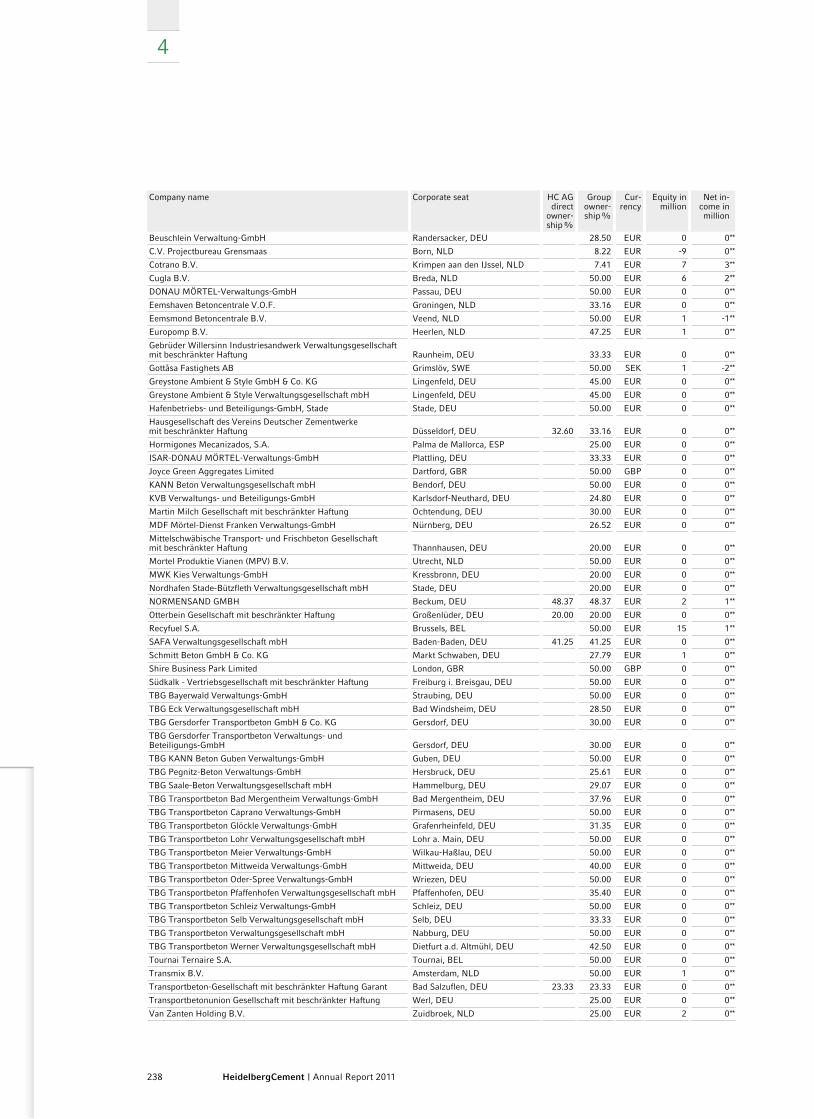
238 HeidelbergCement | Annual Report 2011
4
Company name Corporate seat HC AG direct
owner-ship %
Group owner-ship %
Cur-rency
Equity in million
Net in-come in million
Beuschlein Verwaltung-GmbH Randersacker, DEU 28.50 EUR 0 0**
C.V. Projectbureau Grensmaas Born, NLD 8.22 EUR -9 0**
Cotrano B.V. Krimpen aan den IJssel, NLD 7.41 EUR 7 3**
Cugla B.V. Breda, NLD 50.00 EUR 6 2**
DONAU MÖRTEL-Verwaltungs-GmbH Passau, DEU 50.00 EUR 0 0**
Eemshaven Betoncentrale V.O.F. Groningen, NLD 33.16 EUR 0 0**
Eemsmond Betoncentrale B.V. Veend, NLD 50.00 EUR 1 -1**
Europomp B.V. Heerlen, NLD 47.25 EUR 1 0**
Gebrüder Willersinn Industriesandwerk Verwaltungsgesellschaft mit beschränkter Haftung Raunheim, DEU 33.33 EUR 0 0**
Gottåsa Fastighets AB Grimslöv, SWE 50.00 SEK 1 -2**
Greystone Ambient & Style GmbH & Co. KG Lingenfeld, DEU 45.00 EUR 0 0**
Greystone Ambient & Style Verwaltungsgesellschaft mbH Lingenfeld, DEU 45.00 EUR 0 0**
Hafenbetriebs- und Beteiligungs-GmbH, Stade Stade, DEU 50.00 EUR 0 0**
Hausgesellschaft des Vereins Deutscher Zementwerke mit beschränkter Haftung Düsseldorf, DEU 32.60 33.16 EUR 0 0**
Hormigones Mecanizados, S.A. Palma de Mallorca, ESP 25.00 EUR 0 0**
ISAR-DONAU MÖRTEL-Verwaltungs-GmbH Plattling, DEU 33.33 EUR 0 0**
Joyce Green Aggregates Limited Dartford, GBR 50.00 GBP 0 0**
KANN Beton Verwaltungsgesellschaft mbH Bendorf, DEU 50.00 EUR 0 0**
KVB Verwaltungs- und Beteiligungs-GmbH Karlsdorf-Neuthard, DEU 24.80 EUR 0 0**
Martin Milch Gesellschaft mit beschränkter Haftung Ochtendung, DEU 30.00 EUR 0 0**
MDF Mörtel-Dienst Franken Verwaltungs-GmbH Nürnberg, DEU 26.52 EUR 0 0**
Mittelschwäbische Transport- und Frischbeton Gesellschaft mit beschränkter Haftung Thannhausen, DEU 20.00 EUR 0 0**
Mortel Produktie Vianen (MPV) B.V. Utrecht, NLD 50.00 EUR 0 0**
MWK Kies Verwaltungs-GmbH Kressbronn, DEU 20.00 EUR 0 0**
Nordhafen Stade-Bützfleth Verwaltungsgesellschaft mbH Stade, DEU 20.00 EUR 0 0**
NORMENSAND GMBH Beckum, DEU 48.37 48.37 EUR 2 1**
Otterbein Gesellschaft mit beschränkter Haftung Großenlüder, DEU 20.00 20.00 EUR 0 0**
Recyfuel S.A. Brussels, BEL 50.00 EUR 15 1**
SAFA Verwaltungsgesellschaft mbH Baden-Baden, DEU 41.25 41.25 EUR 0 0**
Schmitt Beton GmbH & Co. KG Markt Schwaben, DEU 27.79 EUR 1 0**
Shire Business Park Limited London, GBR 50.00 GBP 0 0**
Südkalk - Vertriebsgesellschaft mit beschränkter Haftung Freiburg i. Breisgau, DEU 50.00 EUR 0 0**
TBG Bayerwald Verwaltungs-GmbH Straubing, DEU 50.00 EUR 0 0**
TBG Eck Verwaltungsgesellschaft mbH Bad Windsheim, DEU 28.50 EUR 0 0**
TBG Gersdorfer Transportbeton GmbH & Co. KG Gersdorf, DEU 30.00 EUR 0 0**
TBG Gersdorfer Transportbeton Verwaltungs- und Beteiligungs-GmbH Gersdorf, DEU 30.00 EUR 0 0**
TBG KANN Beton Guben Verwaltungs-GmbH Guben, DEU 50.00 EUR 0 0**
TBG Pegnitz-Beton Verwaltungs-GmbH Hersbruck, DEU 25.61 EUR 0 0**
TBG Saale-Beton Verwaltungsgesellschaft mbH Hammelburg, DEU 29.07 EUR 0 0**
TBG Transportbeton Bad Mergentheim Verwaltungs-GmbH Bad Mergentheim, DEU 37.96 EUR 0 0**
TBG Transportbeton Caprano Verwaltungs-GmbH Pirmasens, DEU 50.00 EUR 0 0**
TBG Transportbeton Glöckle Verwaltungs-GmbH Grafenrheinfeld, DEU 31.35 EUR 0 0**
TBG Transportbeton Lohr Verwaltungsgesellschaft mbH Lohr a. Main, DEU 50.00 EUR 0 0**
TBG Transportbeton Meier Verwaltungs-GmbH Wilkau-Haßlau, DEU 50.00 EUR 0 0**
TBG Transportbeton Mittweida Verwaltungs-GmbH Mittweida, DEU 40.00 EUR 0 0**
TBG Transportbeton Oder-Spree Verwaltungs-GmbH Wriezen, DEU 50.00 EUR 0 0**
TBG Transportbeton Pfaffenhofen Verwaltungsgesellschaft mbH Pfaffenhofen, DEU 35.40 EUR 0 0**
TBG Transportbeton Schleiz Verwaltungs-GmbH Schleiz, DEU 50.00 EUR 0 0**
TBG Transportbeton Selb Verwaltungsgesellschaft mbH Selb, DEU 33.33 EUR 0 0**
TBG Transportbeton Verwaltungsgesellschaft mbH Nabburg, DEU 50.00 EUR 0 0**
TBG Transportbeton Werner Verwaltungsgesellschaft mbH Dietfurt a.d. Altmühl, DEU 42.50 EUR 0 0**
Tournai Ternaire S.A. Tournai, BEL 50.00 EUR 0 0**
Transmix B.V. Amsterdam, NLD 50.00 EUR 1 0**
Transportbeton-Gesellschaft mit beschränkter Haftung Garant Bad Salzuflen, DEU 23.33 23.33 EUR 0 0**
Transportbetonunion Gesellschaft mit beschränkter Haftung Werl, DEU 25.00 EUR 0 0**
Van Zanten Holding B.V. Zuidbroek, NLD 25.00 EUR 2 0**
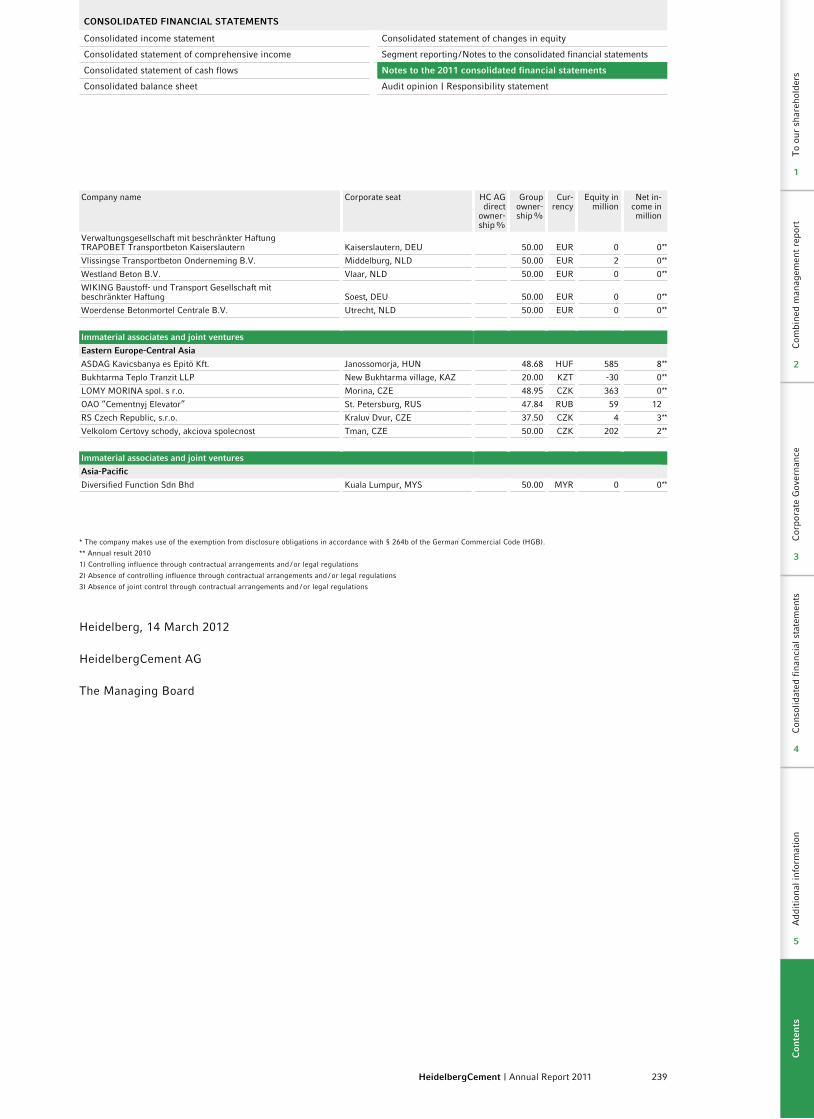
239HeidelbergCement | Annual Report 2011
CoNSoLIDATED FINANCIAL STATEMENTS
Consolidated income statement Consolidated statement of changes in equity
Consolidated statement of comprehensive income Segment reporting / Notes to the consolidated financial statements
Consolidated statement of cash flows Notes to the 2011 consolidated financial statements
Consolidated balance sheet Audit opinion | Responsibility statement
Company name Corporate seat HC AG direct
owner-ship %
Group owner-ship %
Cur-rency
Equity in million
Net in-come in million
Verwaltungsgesellschaft mit beschränkter Haftung TRAPOBET Transportbeton Kaiserslautern Kaiserslautern, DEU 50.00 EUR 0 0**
Vlissingse Transportbeton Onderneming B.V. Middelburg, NLD 50.00 EUR 2 0**
Westland Beton B.V. Vlaar, NLD 50.00 EUR 0 0**
WIKING Baustoff- und Transport Gesellschaft mit beschränkter Haftung Soest, DEU 50.00 EUR 0 0**
Woerdense Betonmortel Centrale B.V. Utrecht, NLD 50.00 EUR 0 0**
Immaterial associates and joint ventures
Eastern Europe-Central Asia
ASDAG Kavicsbanya es Epitö Kft. Janossomorja, HUN 48.68 HUF 585 8**
Bukhtarma Teplo Tranzit LLP New Bukhtarma village, KAZ 20.00 KZT -30 0**
LOMY MORINA spol. s r.o. Morina, CZE 48.95 CZK 363 0**
OAO “Cementnyj Elevator” St. Petersburg, RUS 47.84 RUB 59 12
RS Czech Republic, s.r.o. Kraluv Dvur, CZE 37.50 CZK 4 3**
Velkolom Certovy schody, akciova spolecnost Tman, CZE 50.00 CZK 202 2**
Immaterial associates and joint ventures
Asia-Pacific
Diversified Function Sdn Bhd Kuala Lumpur, MYS 50.00 MYR 0 0**
* The company makes use of the exemption from disclosure obligations in accordance with § 264b of the German Commercial Code (HGB).
** Annual result 2010
1) Controlling influence through contractual arrangements and / or legal regulations
2) Absence of controlling influence through contractual arrangements and / or legal regulations
3) Absence of joint control through contractual arrangements and / or legal regulations
Heidelberg, 14 March 2012
HeidelbergCement AG
The Managing Board
Con
solid
ated
fin
anci
al s
tate
men
tsA
ddit
iona
l inf
orm
atio
n
4
5
Com
bine
d m
anag
emen
t re
port
Cor
pora
te G
over
nanc
eC
onso
lidat
ed f
inan
cial
sta
tem
ents
Add
itio
nal i
nfor
mat
ion
To
our
shar
ehol
ders
2
3
4
5
1
Con
ten
ts
240 HeidelbergCement | Annual Report 2011
4
Audit Opinion
We have issued the following opinion on the consolidated financial statements and the combined management report of HeidelbergCement Group and HeidelbergCement AG:
“We have audited the consolidated financial statements prepared by the HeidelbergCement AG, Heidelberg, comprising the income statement, the statement of comprehensive income, the statement of cash flows, the balance sheet, the statement of changes in equity and the notes to the consolidated financial statements, together with the combined management report of HeidelbergCement Group and HeidelbergCement AG for the fiscal year from 1 January to 31 December 2011. The preparation of the consolidated financial statements and the group management report in accordance with IFRSs as adopted by the EU, and the additional require-ments of German commercial law pursuant to Sec. 315a (1) HGB [“Handelsgesetzbuch”: “German Commercial Code”] and supplementary provisions of the articles of incorporation and bylaws are the responsibility of the parent company’s management. Our responsibility is to express an opinion on the consolidated financial statements and on the group management report based on our audit.
We conducted our audit of the consolidated financial statements in accordance with Sec. 317 HGB and German generally accepted standards for the audit of financial statements promulgated by the Institut der Wirtschaftsprüfer [Institute of Public Auditors in Germany] (IDW). Those standards require that we plan and perform the audit such that misstatements materially affecting the presentation of the net assets, financial position and results of operations in the consolidated financial statements in accordance with the applicable financial reporting framework and in the group management report are detected with reasonable assurance. Knowledge of the business activities and the economic and legal environment of the Group and expectations as to possible misstatements are taken into account in the determination of audit procedures. The effective-ness of the accounting-related internal control system and the evidence supporting the disclosures in the consolidated financial statements and the group management report are examined primarily on a test basis within the framework of the audit. The audit includes assessing the annual financial statements of those enti-ties included in consolidation, the determination of entities to be included in consolidation, the accounting and consolidation principles used and significant estimates made by management, as well as evaluating the overall presentation of the consolidated financial statements and the group management report. We believe that our audit provides a reasonable basis for our opinion.
Our audit has not led to any reservations.
In our opinion, based on the findings of our audit, the consolidated financial statements comply with IFRSs as adopted by the EU, the additional requirements of German commercial law pursuant to Sec. 315a (1) HGB and supplementary provisions of the articles of incorporation and bylaws and give a true and fair view of the net assets, financial position and results of operations of the Group in accordance with these requirements. The group management report is consistent with the consolidated financial statements and as a whole provides a suitable view of the Group’s position and suitably presents the opportunities and risks of future development.”
Stuttgart, 14 March 2012Ernst & Young GmbH Wirtschaftsprüfungsgesellschaft
Prof. Dr. Wollmert SomesWirtschaftsprüfer Wirtschaftsprüferin [German Public Auditor] [German Public Auditor]
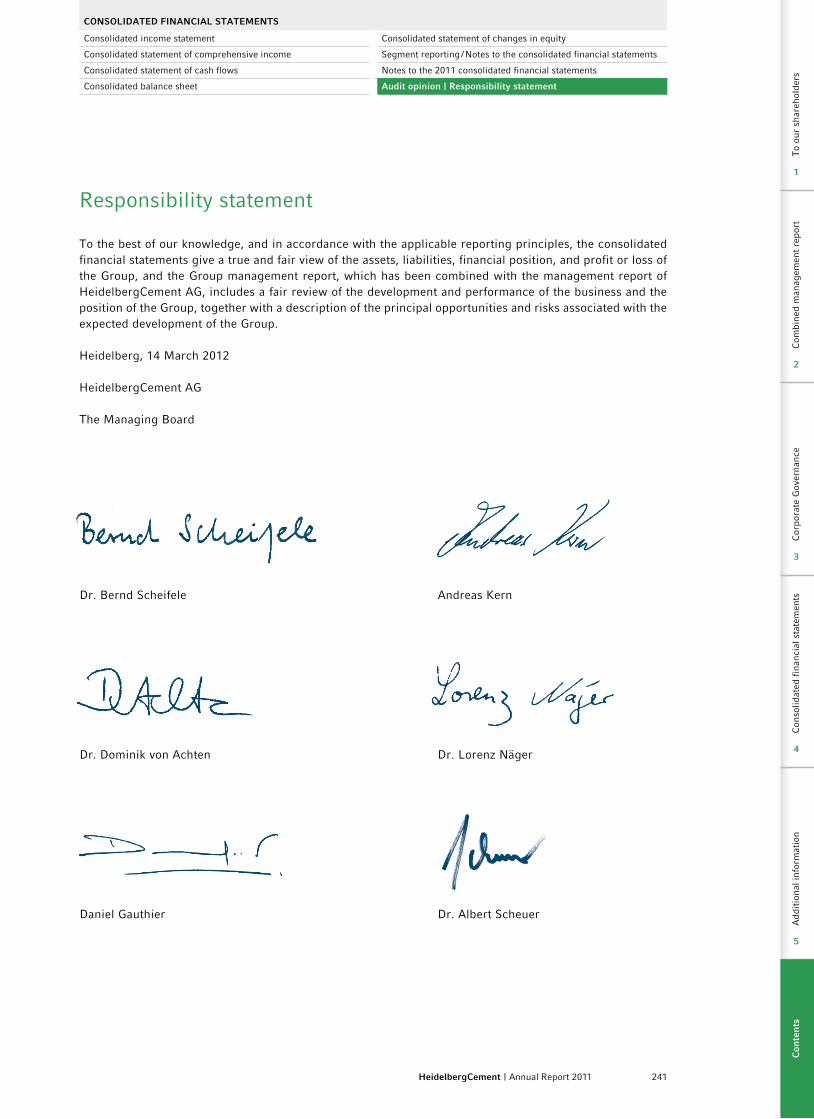
Dr. Bernd Scheifele
Dr. Dominik von Achten
Daniel Gauthier
Andreas Kern
Dr. Lorenz Näger
Dr. Albert Scheuer
241HeidelbergCement | Annual Report 2011
CoNSoLIDATED FINANCIAL STATEMENTS
Consolidated income statement Consolidated statement of changes in equity
Consolidated statement of comprehensive income Segment reporting / Notes to the consolidated financial statements
Consolidated statement of cash flows Notes to the 2011 consolidated financial statements
Consolidated balance sheet Audit opinion | Responsibility statement
Responsibility statement
To the best of our knowledge, and in accordance with the applicable reporting principles, the consolidated financial statements give a true and fair view of the assets, liabilities, financial position, and profit or loss of the Group, and the Group management report, which has been combined with the management report of HeidelbergCement AG, includes a fair review of the development and performance of the business and the position of the Group, together with a description of the principal opportunities and risks associated with the expected development of the Group.
Heidelberg, 14 March 2012
HeidelbergCement AG
The Managing Board
Con
solid
ated
fin
anci
al s
tate
men
tsA
ddit
iona
l inf
orm
atio
n
4
5
Com
bine
d m
anag
emen
t re
port
Cor
pora
te G
over
nanc
eC
onso
lidat
ed f
inan
cial
sta
tem
ents
Add
itio
nal i
nfor
mat
ion
To
our
shar
ehol
ders
2
3
4
5
1
Con
ten
ts
242 HeidelbergCement | Annual Report 2011
Additional information
5
243HeidelbergCement | Annual Report 2011
Global functions and Country Managers 244 Glossary and index 246 Imprint 248 Cement capacities and aggregates reserves back cover
Add
itio
nal i
nfor
mat
ion
5
Com
bine
d m
anag
emen
t re
port
Cor
pora
te G
over
nanc
eC
onso
lidat
ed f
inan
cial
sta
tem
ents
Add
itio
nal i
nfor
mat
ion
To
our
shar
ehol
ders
2
3
4
5
1
Con
ten
ts
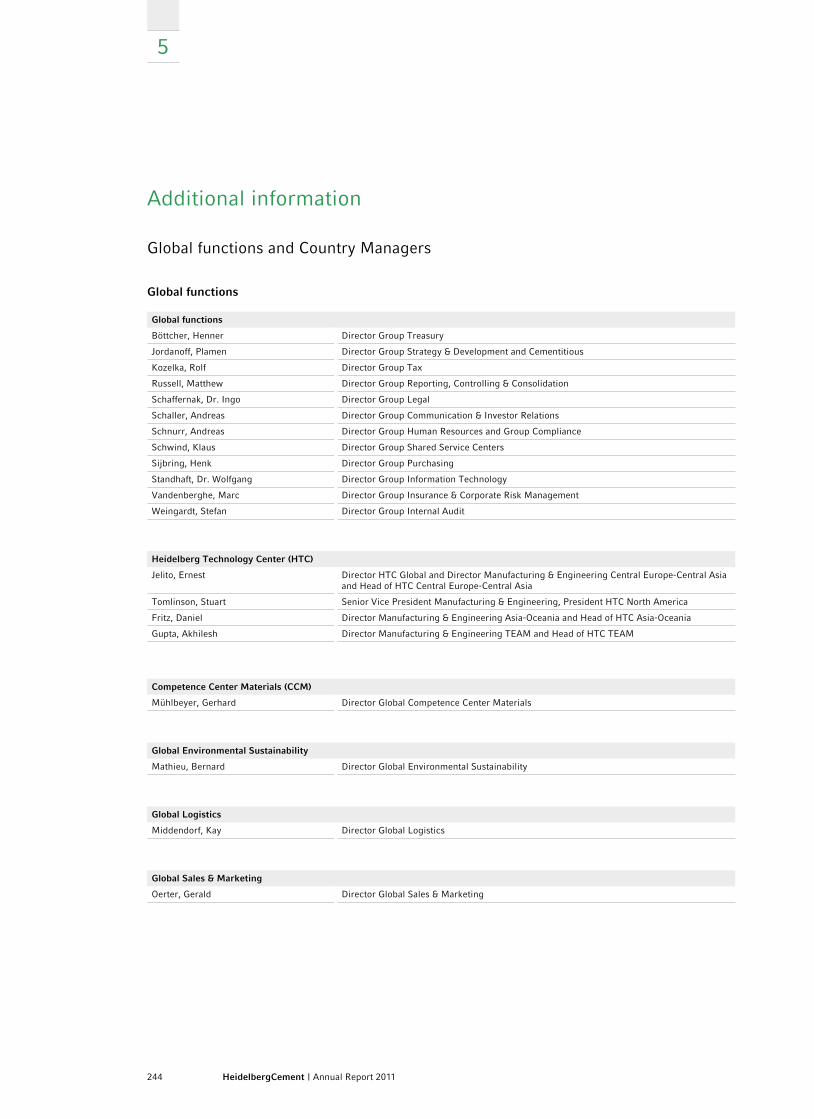
244 HeidelbergCement | Annual Report 2011
5
Additional information
Global functions and Country Managers
Global functions
Global functions
Böttcher, Henner Director Group Treasury
Jordanoff, Plamen Director Group Strategy & Development and Cementitious
Kozelka, Rolf Director Group Tax
Russell, Matthew Director Group Reporting, Controlling & Consolidation
Schaffernak, Dr. Ingo Director Group Legal
Schaller, Andreas Director Group Communication & Investor Relations
Schnurr, Andreas Director Group Human Resources and Group Compliance
Schwind, Klaus Director Group Shared Service Centers
Sijbring, Henk Director Group Purchasing
Standhaft, Dr. Wolfgang Director Group Information Technology
Vandenberghe, Marc Director Group Insurance & Corporate Risk Management
Weingardt, Stefan Director Group Internal Audit
Heidelberg Technology Center (HTC)
Jelito, Ernest Director HTC Global and Director Manufacturing & Engineering Central Europe-Central Asia and Head of HTC Central Europe-Central Asia
Tomlinson, Stuart Senior Vice President Manufacturing & Engineering, President HTC North America
Fritz, Daniel Director Manufacturing & Engineering Asia-Oceania and Head of HTC Asia-Oceania
Gupta, Akhilesh Director Manufacturing & Engineering TEAM and Head of HTC TEAM
Competence Center Materials (CCM)
Mühlbeyer, Gerhard Director Global Competence Center Materials
Global Environmental Sustainability
Mathieu, Bernard Director Global Environmental Sustainability
Global Logistics
Middendorf, Kay Director Global Logistics
Global Sales & Marketing
Oerter, Gerald Director Global Sales & Marketing
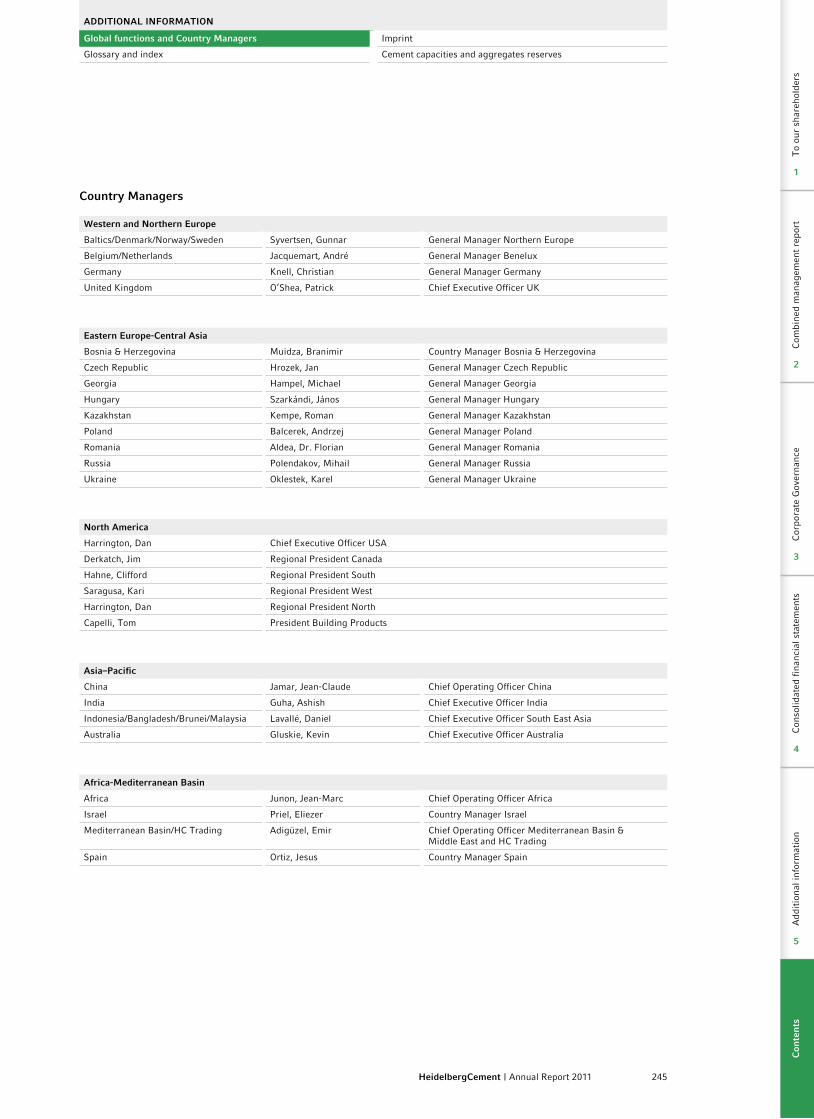
245HeidelbergCement | Annual Report 2011
Country Managers
Western and Northern Europe
Baltics/Denmark/Norway/Sweden Syvertsen, Gunnar General Manager Northern Europe
Belgium/Netherlands Jacquemart, André General Manager Benelux
Germany Knell, Christian General Manager Germany
United Kingdom O’Shea, Patrick Chief Executive Officer UK
Eastern Europe-Central Asia
Bosnia & Herzegovina Muidza, Branimir Country Manager Bosnia & Herzegovina
Czech Republic Hrozek, Jan General Manager Czech Republic
Georgia Hampel, Michael General Manager Georgia
Hungary Szarkándi, János General Manager Hungary
Kazakhstan Kempe, Roman General Manager Kazakhstan
Poland Balcerek, Andrzej General Manager Poland
Romania Aldea, Dr. Florian General Manager Romania
Russia Polendakov, Mihail General Manager Russia
Ukraine Oklestek, Karel General Manager Ukraine
North America
Harrington, Dan Chief Executive Officer USA
Derkatch, Jim Regional President Canada
Hahne, Clifford Regional President South
Saragusa, Kari Regional President West
Harrington, Dan Regional President North
Capelli, Tom President Building Products
Asia–Pacific
China Jamar, Jean-Claude Chief Operating Officer China
India Guha, Ashish Chief Executive Officer India
Indonesia/Bangladesh/Brunei/Malaysia Lavallé, Daniel Chief Executive Officer South East Asia
Australia Gluskie, Kevin Chief Executive Officer Australia
Africa-Mediterranean Basin
Africa Junon, Jean-Marc Chief Operating Officer Africa
Israel Priel, Eliezer Country Manager Israel
Mediterranean Basin/HC Trading Adigüzel, Emir Chief Operating Officer Mediterranean Basin & Middle East and HC Trading
Spain Ortiz, Jesus Country Manager Spain
ADDITIoNAL INFoRMATIoN
Global functions and Country Managers Imprint
Glossary and index Cement capacities and aggregates reserves
Add
itio
nal i
nfor
mat
ion
5
Com
bine
d m
anag
emen
t re
port
Cor
pora
te G
over
nanc
eC
onso
lidat
ed f
inan
cial
sta
tem
ents
Add
itio
nal i
nfor
mat
ion
To
our
shar
ehol
ders
2
3
4
5
1
Con
ten
ts
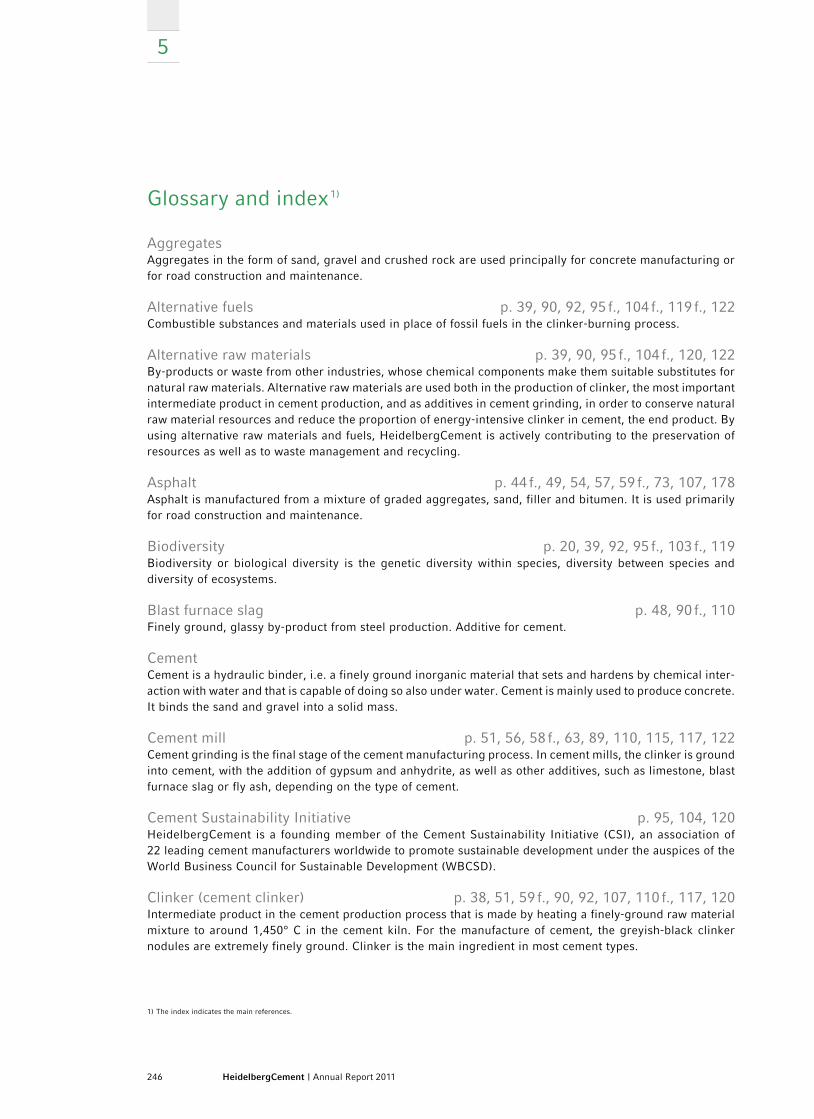
246 HeidelbergCement | Annual Report 2011
5
Glossary and index 1)
Aggregates Aggregates in the form of sand, gravel and crushed rock are used principally for concrete manufacturing or for road construction and maintenance.
Alternative fuels p. 39, 90, 92, 95 f., 104 f., 119 f., 122 Combustible substances and materials used in place of fossil fuels in the clinker-burning process.
Alternative raw materials p. 39, 90, 95 f., 104 f., 120, 122By-products or waste from other industries, whose chemical components make them suitable substitutes for natural raw materials. Alternative raw materials are used both in the production of clinker, the most important intermediate product in cement production, and as additives in cement grinding, in order to conserve natural raw material resources and reduce the proportion of energy-intensive clinker in cement, the end product. By using alternative raw materials and fuels, HeidelbergCement is actively contributing to the preservation of resources as well as to waste management and recycling.
Asphalt p. 44 f., 49, 54, 57, 59 f., 73, 107, 178Asphalt is manufactured from a mixture of graded aggregates, sand, filler and bitumen. It is used primarily for road construction and maintenance.
Biodiversity p. 20, 39, 92, 95 f., 103 f., 119Biodiversity or biological diversity is the genetic diversity within species, diversity between species and diversity of ecosystems.
Blast furnace slag p. 48, 90 f., 110Finely ground, glassy by-product from steel production. Additive for cement.
Cement Cement is a hydraulic binder, i.e. a finely ground inorganic material that sets and hardens by chemical inter-action with water and that is capable of doing so also under water. Cement is mainly used to produce concrete. It binds the sand and gravel into a solid mass.
Cement mill p. 51, 56, 58 f., 63, 89, 110, 115, 117, 122Cement grinding is the final stage of the cement manufacturing process. In cement mills, the clinker is ground into cement, with the addition of gypsum and anhydrite, as well as other additives, such as limestone, blast furnace slag or fly ash, depending on the type of cement.
Cement Sustainability Initiative p. 95, 104, 120HeidelbergCement is a founding member of the Cement Sustainability Initiative (CSI), an association of 22 leading cement manufacturers worldwide to promote sustainable development under the auspices of the World Business Council for Sustainable Development (WBCSD).
Clinker (cement clinker) p. 38, 51, 59 f., 90, 92, 107, 110 f., 117, 120Intermediate product in the cement production process that is made by heating a finely-ground raw material mixture to around 1,450° C in the cement kiln. For the manufacture of cement, the greyish-black clinker nodules are extremely finely ground. Clinker is the main ingredient in most cement types.
1) The index indicates the main references.
247HeidelbergCement | Annual Report 2011
ADDITIoNAL INFoRMATIoN
Global functions and Country Managers Imprint
Glossary and index Cement capacities and aggregates reserves
Commercial Paper p. 69, 118, 190, 205, 213Bearer notes issued by companies within the framework of a Commercial Paper Programme (CP Programme) to meet short-term financing needs.
Composite cement p. 107 f., 110In composite cements, a proportion of the clinker is replaced with alternative raw materials, usually by-products from other industries, such as blast furnace slag or fly ash. Decreasing the proportion of energy-intensive clinker in cement is of critical importance for reducing energy consumption and CO2 emissions as well as for preserving natural raw materials.
ConcreteBuilding material that is manufactured by mixing cement, aggregates (gravel, sand or crushed stone) and water.
Euro Medium Term Note (EMTN) programme p. 33, 66, 69, 79, 118, 190, 205, 218An EMTN programme represents a framework agreement made between the company and the banks appointed to be dealers. HeidelbergCement has the option of issuing debenture bonds up to a total volume of €10 billion under its EMTN programme.
Fly ash p. 110Solid, particulate combustion residue from coal-fired power plants. Additive for cement.
Grinding plant p. 56, 58 f., 63, 70, 110, 117A grinding plant is a cement production facility without clinker-burning process. Delivered clinker and selected additives, depending on the type of cement, are ground into cement. Grinding plants are particularly operated at locations where suitable raw material deposits for cement production are not available.
Net debt p. 18 f., 34, 41, 46, 62, 64 f., 67, 70, 72, 80, 86, 116 f., 215 f.The sum of all non-current and current financial liabilities minus cash and cash equivalents, short-term invest-ments and short-term derivatives
Rating (credit rating) p. 33 f., 41, 66, 69 f., 85, 94, 118, 212 f.Classification of the credit standing of debt instruments and their issuers. Specialised agencies such as Standard & Poor’s, Fitch Ratings and Moody’s produce such ratings. Ratings range from AAA or Aaa as the highest credit standing to C or D as the lowest.
Ready-mixed concrete Concrete that is manufactured in a ready-mixed concrete facility and transported to the building site using ready-mix trucks.
Sustainability p. 39, 92, 95 f., 104 ff., 119Sustainable development signifies a development that fulfils the economic, ecological and social needs of people alive today without endangering the ability of future generations to fulfil their own needs.
Syndicated loan p. 22, 44, 66 f., 71, 73, 76 f., 79 f., 86, 118, 184, 190, 218Large-sized loan which is distributed (“syndicated”) among several lenders for the purpose of risk spreading.
World Business Council for Sustainable Development p. 95, 104 f.HeidelbergCement is a member of the World Business Council for Sustainable Development (WBCSD), a cooperation of around 200 international companies who have made a commitment to the idea of sustainable development on the basis of sustainable growth, ecological equilibrium and social progress.
Add
itio
nal i
nfor
mat
ion
5
Com
bine
d m
anag
emen
t re
port
Cor
pora
te G
over
nanc
eC
onso
lidat
ed f
inan
cial
sta
tem
ents
Add
itio
nal i
nfor
mat
ion
To
our
shar
ehol
ders
2
3
4
5
1
Con
ten
ts
248 HeidelbergCement | Annual Report 2011
5
Imprint
Copyright © 2012HeidelbergCement AGBerliner Strasse 669120 Heidelberg, Germany
Concept and realisationGroup Communication & Investor Relations HeidelbergCementServiceDesign Werbeagentur GmbH, Heidelberg, GermanySignum Communication Werbeagentur GmbH, Mannheim, GermanyTarget Languages GmbH, Dossenheim, Germanyabcdruck GmbH, Heidelberg, Germany
PhotographsHeidelbergCement photo archives Translation of the Annual Report 2011. The German version is binding. Copies of the 2011 financial statements of HeidelbergCement AG and further information are available on request. Kindly find this annual report and further information about HeidelbergCement on the Internet: www.heidelbergcement.com Contact: Group CommunicationPhone: + 49 6221 481- 13227Fax: + 49 6221 481- 13217E-mail: [email protected] Investor RelationsPhone:Institutional investors USA and UK: + 49 6221 481-13925Institutional investors EU and rest of the world: +49 6221 481-39568Private investors: + 49 6221 481-13256Fax: + 49 6221 481-13217E-mail: [email protected]
The Annual Report 2011 was published on 15 March 2012.
Printed on environmentally friendly PEFC certified paper. Promotion of sustainable forest management – more information under www.pefc.org
HeidelbergCement in the world – cement capacities and aggregates reserves
Financial calendar 2012
Interim Financial Report January to March 2012 3 May 2012
Annual General Meeting 3 May 2012
Half-Year Financial Report January to June 2012 31 July 2012
Interim Financial Report January to September 2012 8 November 2012
Com
bine
d m
anag
emen
t re
port
Cor
pora
te G
over
nanc
eC
onso
lidat
ed f
inan
cial
sta
tem
ents
Add
itio
nal i
nfor
mat
ion
To
our
shar
ehol
ders
2
3
4
5
1
Con
ten
ts
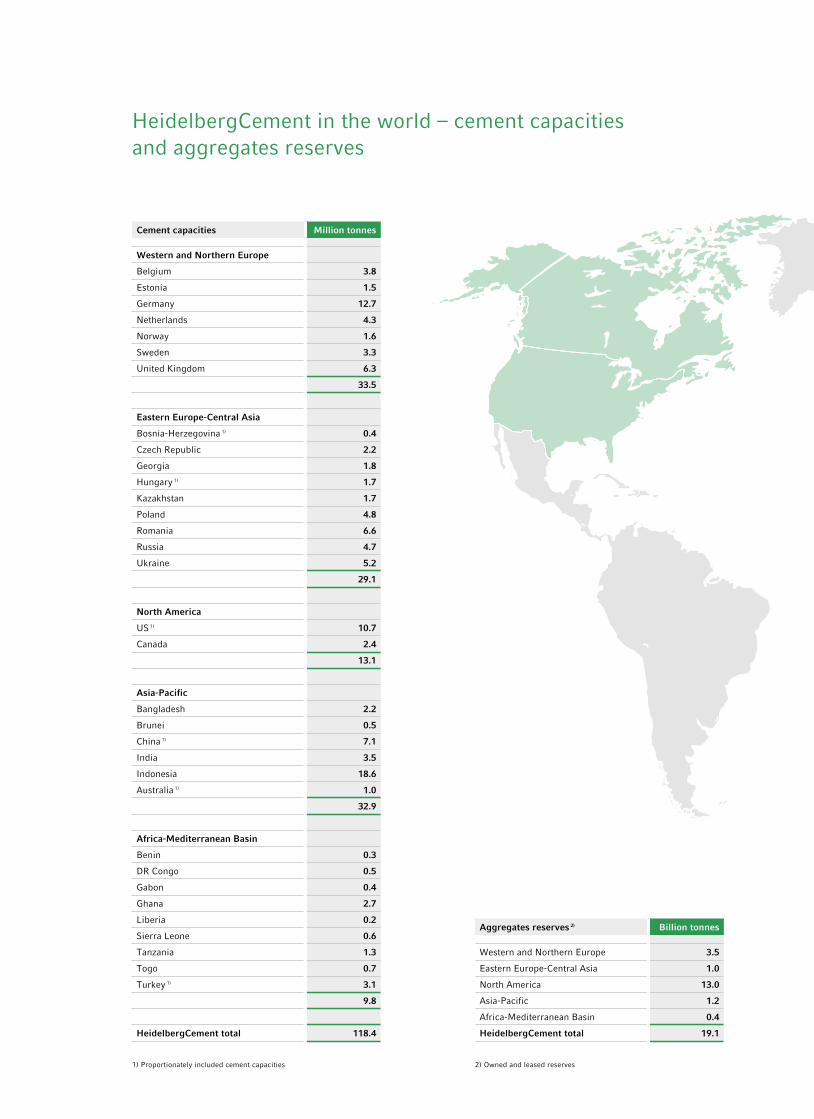
Aggregates reserves 2) Billion tonnes
Western and Northern Europe 3.5
Eastern Europe-Central Asia 1.0
North America 13.0
Asia-Pacific 1.2
Africa-Mediterranean Basin 0.4
HeidelbergCement total 19.1
HeidelbergCement in the world – cement capacities and aggregates reserves
Cement capacities Million tonnes
Western and Northern Europe
Belgium 3.8
Estonia 1.5
Germany 12.7
Netherlands 4.3
Norway 1.6
Sweden 3.3
United Kingdom 6.3
33.5
Eastern Europe-Central Asia
Bosnia-Herzegovina 1) 0.4
Czech Republic 2.2
Georgia 1.8
Hungary 1) 1.7
Kazakhstan 1.7
Poland 4.8
Romania 6.6
Russia 4.7
Ukraine 5.2
29.1
North America
US 1) 10.7
Canada 2.4
13.1
Asia-Pacific
Bangladesh 2.2
Brunei 0.5
China 1) 7.1
India 3.5
Indonesia 18.6
Australia 1) 1.0
32.9
Africa-Mediterranean Basin
Benin 0.3
DR Congo 0.5
Gabon 0.4
Ghana 2.7
Liberia 0.2
Sierra Leone 0.6
Tanzania 1.3
Togo 0.7
Turkey 1) 3.1
9.8
HeidelbergCement total 118.4
1) Proportionately included cement capacities 2) Owned and leased reserves
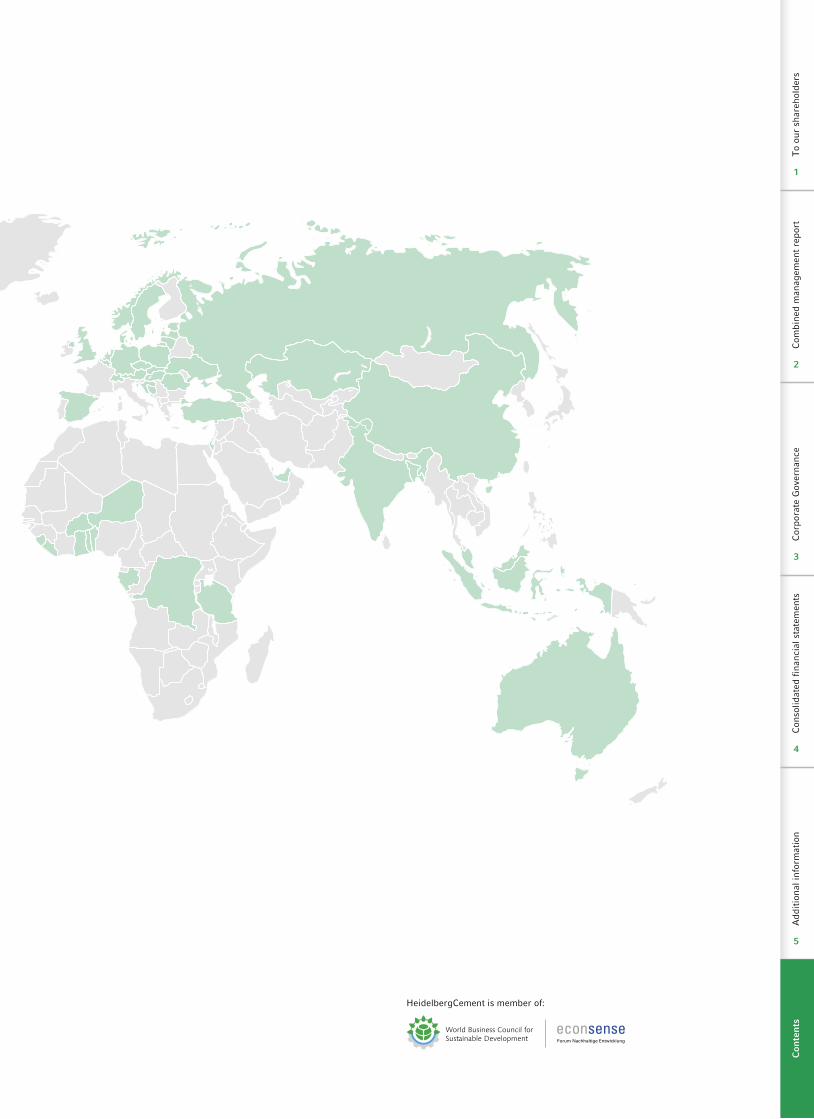
World Business Council forSustainable Development
HeidelbergCement is member of:
Com
bine
d m
anag
emen
t re
port
Cor
pora
te G
over
nanc
eC
onso
lidat
ed f
inan
cial
sta
tem
ents
Add
itio
nal i
nfor
mat
ion
To
our
shar
ehol
ders
2
3
4
5
1
Con
ten
ts

HeidelbergCement AGBerliner Strasse 669120 Heidelberg, Germanywww.heidelbergcement.com