Embed Size (px)
Citation preview

Port of Tacoma 2020 Annual Report
Schedule of Port of Tacoma’s Share of Net Pension Asset/Liability (NPA/NPL)66
Enterprise Fund, 66
Schedule of Changes in Port of Tacoma’s Net OPEB Asset and Related Ratios67
Post-Employment Heath Care Benefits Trust Fund, 67–68
Schedule of Port of Tacoma’s Contributions68 SUPPLEMENTARY INFORMATION69
Information for Bondholders, 70
PORT OF TACOMA LEADERSHIP 03
Enterprise Fund, 28–30
Post-Employment Health Care Benefits Trust Fund, 29
Notes to Financial Statements, 30
FINANCIAL STATEMENTS26REQUIRED SUPPLEMENTARY INFORMATION65
2020 HIGHLIGHTS 06
Statements of Changes in Net Position Statements of Net Position29
Statements of Cash Flows
Statements of Revenues, Expenses and Changes in Net Position29
Statements of Net Position 28
MANAGEMENT’S DISCUSSION AND ANALYSIS16
INDEPENDENT AUDITOR’S REPORT 13
Click to NavigateCONTENTS

PORT OF TACOMA LEADERSHIP

Port of Tacoma 2020 Annual Report Port of Tacoma Leadership4
Letter from the Executive Director
Welcome to the Port of Tacoma’s 2020 Annual Report! We look forward to sharing some highlights of the past year, along with 2020’s financial reports with you.
With a commitment to environmental and fiscal stewardship, the Port of Tacoma drives regional prosperity and contributes to one of our state’s largest economic drivers—the maritime industry. And as the Port moves into its 103rd year, we continue to build on the successful legacy of our past, now and into the future.
The Port of Tacoma’s mission is to make strategic investments in our harbor and community to promote prosperity, trade and jobs, while protecting and enhancing our environment. That means job creation, providing an optimal gateway for trade, high-quality customer service, maintaining a diverse and high-performing workforce, making strategic infrastructure improvements, caring for our environment, and working with and for our community.
The Port’s commitment to promote prosperity for the region requires long-term resiliency, sustainability, and planning for the future by defining what our priorities should be and what projects to pursue. The Port’s recently adopted 2021–2026 Strategic Plan serves as the blueprint to guide those decisions.
Despite the uncertainty and challenges brought on by the COVID-19 pandemic, the Port of Tacoma, and The Northwest Seaport Alliance, worked hard to ensure operations and business activities continued safely and without disruption throughout 2020. Our staff, commissioners, tenants, and community exemplified strength, adaptability, and resiliency over the past year.
This year and beyond, we will continue moving cargo, working with our tenants, and maintaining and investing in critical infrastructure and facilities, and we will continue to prioritize investments to grow our competitive advantages and meet our overall strategic goals.
The Port of Tacoma is a critical link in the local and regional economy and we look forward to continuing to serve the Pierce County community.
Eric Johnson, Executive Director
Eric Johnson Executive Director
“ The Port of Tacoma’s mission is to make strategic investments in our harbor and community to promote prosperity, trade and jobs, while protecting and enhancing our environment.”

Port of Tacoma 2020 Annual Report Port of Tacoma Leadership5
ABOUT THE PORT
For over 100 years, the Port of Tacoma has served greater Pierce County by providing world-class marine and industrial facilities. Today, the combined ports of Tacoma and Seattle, with maritime operations managed by The Northwest Seaport Alliance (NWSA), are a key gateway for Asia-Pacific trade, providing manufacturers and agricultural producers throughout the region and the nation, valuable access to foreign markets.
The Port is committed to strong fiscal stewardship of public funds, active marketing and development of Port assets to promote business growth and jobs, environmental remediation of Port-owned properties, and building stronger relationships with our customers, partners, and the community.
GOVERNANCE
Pierce County voters created the Port of Tacoma in 1918, after the 1911 state legislature authorized publicly owned and managed port districts. More than 100 years later, the Port of Tacoma is a leading container and agricultural port, serving as a “Pacific Gateway” for trade between Asia and the central and eastern United States as well as the Northwest, Alaska and Hawaii.
The Port is governed by five port commissioners, who are elected to four-year terms by the voters of Pierce County to serve as the Port’s board of directors. An independent municipal corporation, the Port operates under Title 53 of the Revised Code of Washington and is classified as a special purpose district.
John McCarthy Pos. 1, Commissioner
Deanna Keller Pos. 3, Commissioner
Commissioners The commission sets policy and strategic direction, authorizes all major expenditures, and hires the executive director. The commission’s regular monthly public meetings are streamed live on the web and archived for on-demand viewing at portoftacoma.com/commission.
Kristin Ang Pos. 5, Commissioner
Dick Marzano Pos. 2, Commissioner
Don Meyer Pos. 4, Commissioner

2020 HIGHLIGHTS

Port of Tacoma 2020 Annual Report 2020 Highlights7
The year 2020 was like no other. We safely navigated a pandemic while continuing operations and providing service for our customers and tenants. We experienced no disruptions and our Port continued to operate efficiently and reliably. Our experiences over the past year have made us stronger and confident that we can handle whatever the future may bring. The Port of Tacoma staff exemplifies teamwork, courage, adaptability and resilience and we’re ready for a great year ahead.
The Port of Tacoma drives economic growth in our region, serving as a key competitive advantage for the state. And in spite of the pandemic, the Port was able to keep several economic development, environmental and infrastructure projects moving forward.
The Northwest Seaport Alliance (NWSA), a marine cargo operating partnership of the ports of Tacoma and Seattle, successfully entered its sixth year. The NWSA manages the container, breakbulk, auto and some bulk terminals in Tacoma and Seattle.
PANDEMIC RESPONSE
In early spring, we began focusing on several efforts to ensure continuity of operations, employee safety, and preparing for an uncertain future. The Port convened a team of employees to make recommendations on maintaining employee and operational safety while navigating the growing public health crisis. With support from our IT and HR departments, we reorganized the way we worked, shifting to a socially-distanced and increasingly online work and meeting environment. Those who could work from home began to do so, and the dedicated employees who needed to be onsite continued their work while adopting all the needed measures to protect themselves and others—together keeping the Port’s operations running efficiently and safely. It was a true team effort whose success was dependent on every department throughout the entire organization.
“ The Port of Tacoma staff exemplifies teamwork, courage, adaptability and resilience and we’re ready for a great year ahead.”
“ The Port convened a team of employees to make recommendations on maintaining employee and operational safety while navigating the growing public health crisis.”
2020 Highlights

Port of Tacoma 2020 Annual Report 2020 Highlights8
ECONOMIC DEVELOPMENT
We welcomed the addition of Volvo cars to our Port! When you see a new Volvo on the road in the Pacific Northwest, it most likely arrived through the Port of Tacoma and processed at Wallenius Wilhelmsen Solutions’ Taylor Way Auto Facility. The addition of Volvo cars emphasizes WWS’ commitment to growing their marine cargo business in our region, and also serves to diversify the Port’s and The Northwest Seaport Alliance’s cargo portfolios.
The Port’s Real Estate business set a new annual record of over $22 million in revenue. Twenty new leases were completed in addition to 11 lease amendments.
The Port purchased a 1.72-acre property with an existing office and warehouse building, located across from two of the Port’s main marine terminals This type of property acquisition helps support our maritime activities and small businesses by providing an ideal location for their operations, currently a drayage trucking company is the tenant at this location.
COMMUNITY CONNECTIONS
Commissioners and staff began work on the Port’s new Strategic Plan in early 2020, with plans to conduct extensive community outreach throughout the year. Due to the pandemic, we quickly pivoted our outreach to exclusively online methods and through a variety of “virtual” channels, including an online open house, our website, remote public and community meetings and other direct communication, we received extensive input and feedback from the community, which was used to help develop the plan.
Unable to conduct our popular in-person bus and boat tours amid the ongoing pandemic, the Port launched an online tour to help stay connected with the community. Visitors to the virtual tour are able to go on a journey exploring 22 sites within the Port’s facility on the Tacoma Tideflats, including Port-owned properties, habitat restoration areas, and several businesses located in the area. In addition, the Port participated in 60 different virtual community events, including speaking engagements at local community group meetings, regular engagement in community councils, and kicking off a new virtual "Coffee with a Commissioner" series.
Ten local non-profit and municipal agencies throughout Pierce County were chosen to receive funding through the Port’s Local Economic Development Investment Fund in 2020, providing assistance for projects ranging from architectural design of a new Asia Pacific Cultural Center to freight corridor road improvements to restoration of a historical lighthouse.
“ The Port’s Real Estate business set a newannual record of over $22 million in revenue.” 2020 Highlights

Port of Tacoma 2020 Annual Report 2020 Highlights9
ENVIRONMENTAL LEADERSHIP
The Lower Wapato Creek mitigation site gained considerable momentum in 2020. The Port worked with the Puyallup Tribe of Indians on important cultural and design issues and is getting closer to starting work on restoring and re-establishing Lower Wapato Creek into a vibrant tidal wetland and stream complex that will support salmon and other wildlife.
The Upper Clear Creek Mitigation is the Port’s first mitigation bank, the first of its kind in the Puyallup River watershed, and only the second joint wetland and fish conservation bank in Washington state. Development of this 40-acre site brings the total acres of habitat the Port has helped to build or preserve to 213 acres. We are committed to sustaining a healthy future for our Port and the surrounding environment in which we live and work.
A vision to phase out emissions from seaport related activities by 2050. The Port of Tacoma, Port of Seattle, The Northwest Seaport Alliance, and Vancouver Fraser Port Authority, worked to update the Northwest Ports Clean Air Strategy in 2020. The Port of Tacoma's implementation actions will focus on cleaning up the existing diesel fleet, improving efficiency, and advancing commercialization and implementation of zero emission technology. Reducing the environmental and health impacts of seaport related operations is one of our top priorities as we continue our work to become one of the most environmentally sustainable ports on the West Coast
“ Reducing theenvironmental and health impacts of seaport related operations is a top priority as we work to become one of the most environmentally sustainable ports on the West Coast.”
2020 Highlights

Port of Tacoma 2020 Annual Report 2020 Highlights10
INFRASTRUCTURE INVESTMENTS
Port retires older cranes at Husky Terminal. We bid farewell to four of our older cranes after decades of service. Our engineering team developed the bid package in-house and managed a contractor to dismantle and scrap four post-Panamax cranes that were too small to service today’s larger container vessels. The Port’s maintenance team assisted with cutting the cranes into pieces that could be fit into trucks and hauled off for recycling.
Feasibility study released for the Blair Waterway deepening project. To remain competitive in the shipping industry, the Port has made major investments through the years, including improving our docks, purchasing larger cranes, and making other terminal improvements. The last piece of this effort is to deepen the Blair Waterway to allow ultra-large container ships to call on the Port. The Army Corps of Engineers released the Tacoma Harbor Draft Feasibility Report and Environmental Assessment for the project, looking at different dredging options to determine the best outcome.
“ To remain competitive in the shippingindustry, the Port has made major investments through the years, including improving our docks, purchasing larger cranes, and making other terminal improvements.”
14,000-18,000+TEUs
8,000TEUs
10,000TEUs
49' 51'*48'
Post-Panamax: 136'
14K - 18K TEU Ships: 193'*14,000 TEU ship draft: 48’*18,000 TEU ship draft: 51’
10K TEU Ships: 150'
57'
10%
51'
2020 Highlights

Port of Tacoma 2020 Annual Report 2020 Highlights11
“ The Port’s StrategicPlan is designed to grow the region’s economy and connect our community to a world of opportunity”
PLANNING FOR THE FUTURE
The Port continued work in partnership with the City of Tacoma, Puyallup Tribe of Indians, City of Fife and Pierce County on a Tideflats Subarea Plan with the goal of establishing a shared, long-term vision, and more coordinated approach to development, environmental review and strategic capital investments in the Tacoma Tideflats.
Work on developing the Port’s new Strategic Plan continued throughout 2020. After adoption by the commission in 2021, Port staff will use this Strategic Plan to determine the use of resources to maintain, improve and grow our operations in a fiscally and environmentally responsible manner — key components of the Port’s business model as we continue to drive prosperity for our stakeholders and community.
Port Commissioners adopted a resolution advancing the values of Diversity, Equity and Inclusion as a core value for the Port and directing the development and implementation of diversity, equity and inclusion initiatives.
2020 Highlights

Port of Tacoma 2020 Annual Report 2020 Highlights12
$3.9M INVESTED INENVIRONMENTAL PROGRAMS
* Port of Tacoma and The Northwest Seaport Alliance. **Combined north/south harbors: The NWSA manages the container, breakbulk, auto and some bulk terminals at the Ports of Tacoma and Seattle.
over
2,300 acresPORT-OWNED LAND
1,169 acresREMEDIATED LANDTO DATE
213 acresHABITAT SITES DEVELOPED TO DATE
291,623metric tons BREAKBULK*
156,205 AUTOMOBILES*
4.9 Mmetric tons GRAIN EXPORTED
876 VESSEL CALLS
3.3 M TEUsCONTAINER VOLUME**
twenty-foot equivalent units
2020 Year in Review
nwseaportalliance.com

INDEPENDENTAUDITOR’S REPORT

Port of Tacoma 2020 Annual Report Independent Auditor’s Report 14
REPORT ON THE FINANCIAL STATEMENTS
We have audited the accompanying financial statements of the Enterprise Fund and the Post-Employment Health Care Benefits Trust Fund of the Port of Tacoma (the Port) as of and for the years ended December 31, 2020 and 2019, and the related notes to the financial statements, which, collectively, comprise the Port’s basic financial statements as listed in the table of contents.
MANAGEMENT’S RESPONSIBILITY FOR THE FINANCIAL STATEMENTS
Management is responsible for the preparation and fair presentation of these financial statements in accordance with accounting principles generally accepted in the United States of America; this includes the design, implementation and maintenance of internal control relevant to the preparation and fair presentation of the financial statements that are free from material misstatement, whether due to fraud or error.
AUDITOR’S RESPONSIBILITY
Our responsibility is to express opinions on these financial statements based on our audits. We conducted our audits in accordance with auditing standards generally accepted in the United States of America and the standards
applicable to financial audits contained in Government Auditing Standards issued by the Comptroller General of the United States. Those standards require that we plan and perform the audit to obtain reasonable assurance about whether the financial statements are free of material misstatement.
An audit involves performing procedures to obtain audit evidence about the amounts and disclosures in the financial statements. The procedures selected depend on the auditor’s judgment, including the assessment of the risks of material misstatement of the financial statements, whether due to fraud or error. In making those risk assessments, the auditor considers internal control relevant to the Port’s preparation and fair presentation of the financial statements in order to design audit procedures that are appropriate in the circumstances but not for the purpose of expressing an opinion on the effectiveness of the Port’s internal control. Accordingly, we express no such opinion. An audit also includes evaluating the appropriateness of accounting policies used and the reasonableness of significant accounting estimates made by management, as well as evaluating the overall presentation of the financial statements.
We believe the audit evidence we have obtained is sufficient and appropriate to provide a basis for our audit opinions.
OPINIONS
In our opinion, the financial statements referred to above present fairly, in all material respects, the respective financial position of the Enterprise Fund and the Post-Employment Health Care Benefits Trust Fund of the Port of Tacoma as of December 31, 2020 and 2019, and the respective changes in financial position and, where applicable, cash flows thereof for the years then ended, in accordance with accounting principles generally accepted in the United States of America.
Independent Auditor’s ReportThe Board of Commissioners Port of Tacoma, Tacoma, Washington
RSM US LLP is the U.S. member firm ofRSM International, a global network ofindependent audit, tax, and consultingfirms. Visit rsmus.com/aboutus formore information regarding RSMUS LLP and RSM International.
Port of Tacoma 2020 Annual Report Independent Auditor’s Report 15
Independent Auditor’s ReportThe Board of Commissioners Port of Tacoma, Tacoma, Washington
Tacoma, Washington April 12, 2021
OTHER MATTERS
Required Supplementary Information Accounting principles generally accepted in the United States of America require that the management’s discussion and analysis and the required supplementary information, as listed in the table of contents, be presented to supplement the basic financial statements. Such information, although not a part of the basic financial statements, is required by the Governmental Accounting Standards Board, who considers it to be an essential part of financial reporting for placing the basic financial statements in an appropriate operational, economic or historical context. We have applied certain limited procedures to the required supplementary information in accordance with auditing standards generally accepted in the United States of America, which consisted of inquiries of management about the methods of preparing the information and comparing the information for consistency with management’s responses to our inquiries, the basic financial statements, and other knowledge we obtained during our audits of the basic financial statements. We do not express an opinion or provide any assurance on the information because the limited procedures do not provide us with sufficient evidence to express an opinion or provide any assurance.
Other Reporting Required by Government Auditing Standards In accordance with Government Auditing Standards, we have also issued our report dated April 12, 2021, on our consideration of the Port’s internal control over financial reporting and on our tests of its compliance with certain provisions of laws, regulations, contracts and grant agreements, and other matters. The purpose of that report is to solely describe the scope of our testing of internal control over financial reporting and compliance and the results of that testing, and not to provide an opinion on the effectiveness of the Port’s internal control over financial reporting or on compliance. That report is an integral part of an audit performed in accordance with Government Auditing Standards in considering the Port’s internal control over financial reporting and compliance.
RSM US LLP is the U.S. member firm ofRSM International, a global network ofindependent audit, tax, and consultingfirms. Visit rsmus.com/aboutus formore information regarding RSMUS LLP and RSM International.

MANAGEMENT’S DISCUSSION AND ANALYSIS

Port of Tacoma 2020 Annual Report Management’s Discussion and Analysis 17
Management’s Discussion and Analysis Years Ended December 31, 2020 and 2019
INTRODUCTION
The Port of Tacoma’s (the Port) Management Discussion and Analysis (MD&A) of financial activities and performance introduces the Port’s 2020 and 2019 financial statements, which include the Enterprise Fund as well as the Post-Employment Health Care Benefits Trust Fund. Port management prepared this MD&A and readers should consider it in conjunction with the financial statements and the notes thereto.
The Enterprise Fund accounts for all activities and operations of the Port except for the activities included within the Post-Employment Health Care Benefits Trust Fund.
The notes are essential to a full understanding of the data contained in the financial statements. This report also presents certain required supplementary information regarding pension and other post-employment benefits.
OVERVIEW OF THE FINANCIAL STATEMENTS
The financial section of this annual report consists of three parts: MD&A, the basic financial statements and the notes to the financial statements. The financial statements include: the statements of net position, the statements of revenues, expenses and changes in net position, and the statements of cash flows of the Enterprise Fund. The report also includes the following two basic financial statements for the Post-Employment Health Care Benefits Trust Fund: statements of net position and statements of changes in net position.
The statements of net position and the statements of revenues, expenses and changes in net position illustrate whether the Port’s financial position has improved as a result of the year’s activities. The statements of net position present information on all of the Port’s assets and deferred outflows, and liabilities and deferred inflows, with the difference reported as net position. Over time, increases or decreases in net position may serve as an indicator of whether the financial position of the Port is improving or deteriorating. The statements of revenues, expenses and changes in net position show how the Port’s net position changed during the year. These changes are reported in the period in which the underlying event occurs, regardless of the timing of related cash flows.
“ The ports of Seattle and Tacoma joined forces in August 2015 to unify management of marine cargo facilities by creating The Northwest Seaport Alliance.”
Fund financial statements: A fund is a grouping of related accounts that is used to maintain control over resources that have been segregated for specific activities or objectives. The Port uses two funds, an Enterprise Fund, which is a type of proprietary fund that reports business-type activities, and the Post-Employment Health Care Benefits Trust Fund.
Formation of The Northwest Seaport Alliance
The ports of Seattle and Tacoma (home ports) joined forces in August 2015 to unify management of marine cargo facilities and business to strengthen the Puget Sound gateway and attract more marine cargo and jobs to the region by creating The Northwest Seaport Alliance (NWSA). The NWSA is a special purpose governmental entity established as a Port Development Authority (PDA), similar to Public Development Authorities formed by cities and counties. The PDA is governed by the two ports as equal members (each a “Managing Member” and, collectively, “Managing Members”) with each port acting through its elected commissioners. As approved, the charter for the NWSA (Charter) may be amended only by mutual agreement of the Managing Members. Each port will remain a separate legal entity, independently governed by its own elected commissioners.
Port of Tacoma 2020 Annual Report Management’s Discussion and Analysis 18
Membership Interests
The home ports made an initial contribution of certain cargo terminals and related marine cargo business activities to the NWSA through license agreements (Licensed Properties). Under these agreements, the NWSA was charged with managing the properties as an agent on behalf of the Managing Members.
The initial contribution of each home port to the NWSA was 50% (based on the value of the contributed facilities using cash flow forecasts for each parcel that went to the NWSA) with a revaluation review that was settled in 2019 by the Managing Members.
The basis of the revaluation review was to determine if material changes in cash flows from the Licensed Properties occurred since the initial valuation. A change in the valuation of the cash flow forecasts of these facilities could result in a change in Membership Interests. The Charter requires Managing Members approve any change in Membership Interest by vote, to include provision for addressing any change to distributions and allocations as a result of the change in Membership Interest. Changes in Membership Interest do not affect a Managing Member’s voting rights under the Charter, as votes are not weighted by or otherwise determined by Membership Interest.
In April 2019, the Managing Members and the Port of Seattle commission completed the one-time Membership Interest Affirmation of 50/50 for each home port in satisfaction of the NWSA Charter. In lieu of completing the required reevaluation of Membership Interest, the Port of Seattle agreed
to an additional contribution of up to $32 million to the NWSA. This additional contribution was in recognition that certain forecasted revenue streams not secured by long-term contractual agreements in the initial valuation may not be achieved without the redevelopment of Terminal 5. This additional contribution by the Port of Seattle will be made to the NWSA in three installments. The first installment of $11 million was made in March 2020, the second installment will be made on or around March 31, 2021, and the final installment will be made in 2024 and may be adjusted if the actual redevelopment costs are less than the program authorization. The 2020 contribution was distributed to the homeports and the subsequent contributions will also be distributed to the home ports.
As part of the Membership Interest Affirmation, the Managing Members also authorized the distribution of these affirmation payments to the home ports equally after the NWSA receives the funds from the Port of Seattle. These transactions do not impact NWSA’s net position but will increase cash and reduce investment in JV for the Port of Tacoma. These distributions will be recorded as they are incurred.
Port of Tacoma 2020 Annual Report Management’s Discussion and Analysis 19
Financial Framework
The NWSA intends to support the credit profiles of both home ports, and its financial framework will preserve both ports’ commitment to financial strength and fiscal stewardship. The NWSA distributes cash to each home port based on cash flow from operations, calculated pursuant to Generally Accepted Accounting Principles, capital grant contributions and interest. Cash distributions based on cash flow from operations and capital grant contributions are to be made no less than quarterly based on each home port’s membership interests and interest income is distributed annually.
The NWSA is responsible for capital investments, including renewal and replacement projects and new development. Such capital investments, or post-formation assets, will be treated as tenant improvements owned by the NWSA. The ports of Seattle and Tacoma work cooperatively with the NWSA to develop an annual capital investment plan for approval by each Managing Member. Funding will be provided by joint contributions from the home ports; cash flow from operations will be distributed to the home ports and not retained by the NWSA for funding capital investments. Each Managing Member must approve its capital contributions.
The NWSA Charter recognizes that each home port’s respective share of revenues received by the NWSA with respect to the Licensed Properties has been, or may be, pledged in connection with the home port’s bond obligations. Under the Charter, the Managing Members instruct the Chief Executive Officer (CEO) to manage the PDA in a prudent and reasonable manner in support of
the home ports’ respective bond covenants. The home ports shall keep the CEO and the NWSA management informed of their respective bond obligations, and each shall notify the other home port of any proposed change to such home port’s governing bond resolutions as soon as practicable before adoption. The Charter does not modify or alter the obligations of each home port with respect to its own bond obligations. The NWSA does not assume any obligations to the home ports’ bond holders.
With respect to bonds of each home port that were outstanding at the time of the formation of the NWSA, the Managing Members shall establish and maintain a requirement for the NWSA to calculate and establish a minimum level of net income from the NWSA equal to the amount required for the home ports to meet their bond rate covenants in effect at the time of formation of the NWSA (Bond Income Calculation). The Managing Members shall require the Bond Income Calculation to be reviewed annually as part of the NWSA budget process and the Managing Members may adjust the Bond Income Calculation so long as it does not cause any home port to fail to comply with its rate covenant in effect at the time of formation of the NWSA. The NWSA may not take any action that reasonably would reduce the NWSA income below the minimum level established by the Bond Income Calculation unless each Managing Member separately votes to approve that action. Such a vote by each Managing Member must occur even if the action is within the CEO’s delegated authority. The Bond Income Calculation is subject to adjustment, including reductions from payment or refunding of bonds outstanding at the time of the formation of the NWSA.
Funding
Working capital cannot be redirected to fund capital construction as defined in the Charter. Future funding needs are evaluated during the annual budget process or if the working capital reserve should decline below a target minimum established by the Managing Members. Managing Members must vote affirmatively to approve additional working capital contributions. The NWSA has generated enough cash from operations to cover its working capital requirements through 2019 and the 2020 NWSA budget did not anticipate additional funding needs.
Further information on the formation and operations of the NWSA can be found in Note 1, Summary of Significant Accounting Policies, and Note 17, Joint Venture.

Port of Tacoma 2020 Annual Report Management’s Discussion and Analysis 20
Current assets $ 205,073 $ 241,813 $ 232,735
Capital and intangible assets, net 913,337 936,166 952,435
Long-term investments 18,227 19,784 30,638
Investment in Joint Venture 219,710 177,197 142,508
Other assets 15,537 15,702 14,862
Total assets $ 1,371,884 $ 1,390,662 $ 1,373,178
Deferred outflows of resources $ 89,032 $ 74,154 $ 60,910
Current liabilities $ 44,211 $ 69,653 $ 68,537
Long-term debt, net 587,449 609,000 626,610
Other long-term liabilities 172,200 156,763 127,326
Total liabilities $ 803,860 $ 835,416 $ 822,473
Deferred inflows of resources $ 3,532 $ 6,086 $ 5,968
Net investment in capital assets $ 316,294 $ 295,714 $ 310,430
Restricted—bond reserves 18,227 17,536 13,251
Unrestricted 319,003 310,064 281,966
Total net position $ 653,524 $ 623,314 $ 605,647
2020 2019 2018
Total Assets: $1,371,884
Total Liabilities: $803,860
Total Net Position: $653,524
Financial Position Summary—Enterprise Fund: The statements of net position present the financial position of the Enterprise Fund of the Port. The statements include all of the Port’s assets and liabilities of the Enterprise Fund. Net position serves as an indicator of the Port’s financial position. The Port’s current assets consist primarily of cash, investments and accounts receivable. A summarized comparison of the Port’s Enterprise Fund assets, deferred outflows of resources, liabilities, deferred inflows of resources and net position at the close of calendar year-end follows (dollars in thousands):
In 2020, the Port’s total net position increased by $30.2 million and 4.8% over the prior year to $653.3 million at December 31, 2020. Of this amount, $316.3 million is the net investment in capital assets, $18.2 million is restricted for bond reserves and $319.0 million is unrestricted and can be used to finance operating activities.
The Port’s net investment in capital assets represents infrastructure and capital assets for Port terminal and real estate facilities. In 2020, the net investment in capital assets increased by $21.7 million as payments for bond principal and commercial paper (short-term debt) of $45.7 million were offset by decrease in net capital assets of $21.7 million and the spend down of the remaining bond proceeds from the 2016 Revenue Bonds of $2.2 million.
The Port’s 2019 total net position of $623.3 million increased by $17.7 million and 2.9% over the prior year. Of this amount, $295.7 million is the net investment in capital assets, $17.5 million is restricted for bond reserves and $310.1 million is unrestricted and can be used to finance operating activities.
2020

Port of Tacoma 2020 Annual Report Management’s Discussion and Analysis 21
Operating income:
Operating revenues $ 27,470 $ 27,372 $ 23,607
Joint Venture income 38,782 47,979 55,992
Total operating revenues $ 66,252 $ 75,351 $ 79,599
Operating expenses 42,017 41,954 44,598
Total operating income $ 24,235 $ 33,397 $ 35,001
Non-operating revenues (expenses):
Ad valorem tax revenues $ 23,132 $ 20,921 $ 18,588
Interest on general obligation bonds (4,674) (4,804) (4,933)
Net ad valorem tax revenues $ 18,458 $ 16,117 $ 13,655
Interest income $ 2,501 $ 5,733 $ 4,789
Net increase (decrease) in the fair value of investments 1,827 2,137 (1,125)
Interest expense (17,716) (20,085) (19,926)
Other non-operating income (expenses), net 80 1,645 3,823
Total non-operating revenues (expenses), net $ 5,150 $ 5,547 $ 1,216
Increase in net position before capital contributions and special item
$ 29,385 $ 38,944 $ 36,217
Capital grant contributions $ 825 $ 700 $ 3,624
Increase in net position before special item $ 30,210 $ 39,644 $ 39,841
Special Item $ - $ (21,977) $ -
Increase in net position $ 30,210 $ 17,667 $ 39,841
Net position, beginning of year, as previously reported $ 623,314 $ 605,647 $ 564,385
Adjustment related to adoption of GASB 75 - - 1,421
Net position, beginning of year as restated 623,314 605,647 565,806
Net position, end of year $ 653,524 $ 623,314 $ 605,647
*2018 net position was adjusted at the time of adoption of GASB 75, Postemployment Benefits
The Port’s net investment in capital assets represents infrastructure and capital assets for Port terminal and real estate facilities. In 2019, the net investment in capital assets decreased by $14.7 million due primarily to a decrease in remaining unspent bond proceeds from the 2016 Revenue Bonds of $15.1 million, and a $16.3 million decrease in net capital assets, offset by a net decrease in outstanding debt of $16.7 million.
At December 31, 2018, the Port’s total net position increased by $41.2 million and 7.3% over the prior year to $605.6 million. Of this amount, $310.4 million is the net investment in capital assets, $13.2 million is restricted for bond reserves and $282.0 million is unrestricted and can be used to finance operating activities.
In 2018, the net investment in capital assets decreased by $16.9 million due primarily to a decrease in remaining unspent bond proceeds from the 2016 Revenue Bonds of $29.3 million, a net decrease in outstanding debt of $15.6 million and a $3.1 million decrease in net capital assets.
Statements of Revenues, Expenses and Changes in Net Position (dollars in thousands) 2020 2019 2018*

Port of Tacoma 2020 Annual Report Management’s Discussion and Analysis 22
2020 Revenues, Expenses and Changes in Net Position versus the Prior Year
Total operating revenues were $66.3 million in 2020 and $75.4 million in the prior year. Port operating revenue for the year ended December 31, 2020 of $27.5 million was comparable to 2019 operating revenue. Industrial real estate revenue was up $0.7 million as increases of $2.3 million from new leases and escalations were offset by reductions of $1.6 million for terminated leases. Auto imports and revenues were down $0.7 million with volume down 47% over the prior year from COVID-19 related plant and retail closures and Nissan’s internal management struggles that hurt customer demand and sales.
NWSA JV income of $38.8 million was down $9.2 million compared to the prior year as the COVID-19 pandemic interrupted cargo operations throughout the supply chain decreasing cargo volume and revenue by $10.7 million (5%). Container volumes were down 12%, non-container volumes also declined with breakbulk tonnage down 20% and auto units down 13%. NWSA JV operating expenses increased $7.1 million primarily from costs to modernize container terminals for ultra-large ships that require larger cranes and associated terminal infrastructure improvements which included costs for the disposition of old cranes at two terminals, paving repairs and costs related to the expected restructuring of a long-term agreement for the development of the second phase of Terminal 5.
Port operating expense of $42.0 million was comparable to the prior year, as the Port initiated cost reduction measures due to COVID-19 to lower outsourced and facilities
maintenance costs, environmental project spending and port labor costs. These reductions were offset by asset disposal costs for building demolitions of $0.6 million.
“ The increase in net position of $30.2 million was $12.5 million and 71.0% more than the prior year.”
Non-operating income and expense: The 2020 net non-operating income was $5.2 million compared to $5.5 million in the prior year.
Ad valorem tax revenue increased by $2.2 million compared to the prior year due to new construction and property valuation increases in Pierce County. The tax revenue increase, paired with lower interest rates on General Obligation debt due to a bond refunding in the prior year, increased net ad valorem tax revenue by $2.3 million.
Interest income and fair market value adjustments on the Port’ investments of $4.3 million were down $3.5 million as interest income was down $3.2 million due to lower interest rates and the non-cash market value increase on investments was $0.3 million less than the prior year. Interest expense of $17.7 million was down $2.4 million due to lower variable rates and bond refundings in prior years that lowered interest rates.
Other non-operating income was $0.1 million compared to $1.6 million in the prior year. Asset disposal costs increased by $2.2 million and the Port committed $0.5 million to the Taylor Way heavy haul corridor construction project. Offsetting these expenses were the gains on the sale of buildings on 2602 and 2608 Port of Tacoma Rd of $2.1 million and proceeds from the Hylebos remediation settlement of $0.7 million.
Capital grant contributions were $0.8 million and $0.1 million more than the prior year. Current year FEMA grants of $0.7 million funded security projects and ecology grants of $0.1 million funded environmental projects at two port parcels on the Blair peninsula. In 2019 the Port recorded a contribution of $22.0 million in the form of cash and land to the State Route 167 (SR-167) Completion Project which is part of the Puget Sound Gateway Program. See below for more information.
As a result of the above activity, the increase in net position of $30.2 million was $12.5 million and 71.0% more than the prior year.

Port of Tacoma 2020 Annual Report Management’s Discussion and Analysis 23
2019 Revenues, Expenses and Changes in Net Position versus the Prior Year
The Port’s 2019 revenue of $75.4 million was $4.2 million and 5.3% less than the prior year.
Port operating revenue of $27.4 million, increased by $3.8 million as revenue from the new auto processing center built on the former Kaiser Aluminum site that generated $2.1 million of new revenue in its first full year of operations and several new leases and annual escalations that resulted in $1.8 million of additional revenues from real estate rentals. The Port also received $0.2 million more than the prior year for infrastructure repairs and terminal security; however, auto storage revenue was down $0.4 million.
The NWSA Joint Venture income of $48.0 million was $8.0 million and 14.3% less than the prior year, as NWSA net income dropped by $16.0 million versus the prior year. Much of this decrease is attributable to higher planned current-year operating expenses for depreciation of $5.0 million and $2.4 million to remove old cranes associated with capital improvement projects, various paving repairs and higher costs to operate four additional cranes. Additionally, there was a prior-year contribution of $3.1 million in stormwater improvements that increased 2018 NWSA net income.
Operating expense in 2019 of $41.9 million was $2.7 million and 5.9% less than the prior year, driven by asset disposals of $4.0 million in the prior year related to the Terminal 4 reconfiguration project, and higher current-year costs for equipment and facility repairs of
$1.1 million, which included repairs for damaged fiber lines along Port of Tacoma road, increased administrative costs for consulting services and IT hardware/software maintenance and data services.
As a result of the above, operating income of $33.4 million was $1.6 million less than the prior year.
Non-operating income and expense: The 2019 net non-operating income was $5.5 million compared to $1.2 million in the prior year.
Ad valorem tax revenue increased by $2.3 million compared to the prior year due to new construction and property valuation increases in Pierce County. The tax revenue increase, paired with lower interest rates on General Obligation
debt due to a bond refunding in the prior year, increased net ad valorem tax revenue by $2.5 million.
Interest income and fair market value adjustments on the Port’s investments were up $4.2 million as the non-cash market value increase on investments was $3.3 million more than the prior year and interest income was up $1.0 million due to rising rates. Interest expense was $0.2 million more than the prior year due to variable interest rates.
Other non-operating income was $2.2 million less than the prior year, primarily due to the prior year receipt of a claim settlement with Thurston County for the Maytown property of $8.6 million that was offset by the $2.1 million Upper Clear Creek settlement and current-year gains on the sale of property of $3.5 million and the current-year expense of $0.5 million for the Tide Flats Subarea plan.
Capital grant contributions were $2.9 million less than the prior year due to the Kaiser Remediation grant of $2.3 million and Security grants of $0.6 million in 2018.
Special item: In December 2019, the Port Commission approved a resolution committing the Port to providing a contribution of up to $22.0 million in the form of cash and land to the State Route 167 (SR-167) Completion Project which is part of the Puget Sound Gateway Program. The SR 167 Completion Project will build the remaining four miles of SR 167 between Meridian Avenue in Puyallup and Interstate 5 (I-5), completing a long-planned connection to I-5 in Fife. Completion of SR-167 provides a direct link from Kent and Puyallup River valleys and helps to

Port of Tacoma 2020 Annual Report Management’s Discussion and Analysis 24
ensure that people and goods move more reliably through the Puget Sound region. The Port has concluded this transaction qualifies for treatment as a special item on the accompanying statements of net position.
As a result of the above, the increase in net position was $17.7 million and $22.2 million less than the prior year.
Capital assets: The Port’s investment in capital assets, net of depreciation, for its business activities as of December 31, 2020, amounted to $913.3 million. This investment in capital assets includes land, buildings, improvements, machinery and equipment, intangible assets and construction in process. The Port’s investment in capital assets, net of depreciation, for its business activities as of December 31, 2019, amounted to $936.2 million. See Note 3, Capital and Intangible Assets, for additional information.
Capital spending for the years ended December 31 are summarized by major project/category in the table below (dollars in thousands):
Description 2020 2019
Facility and building improvements $ 2,864 $ 1,898
Property acquisition 2,006 10
Machinery and equipment 560 714
Information technology infrastructure 533 1,146
Auto terminal development 482 10,422
$ 6,445 $ 14,190
Debt Administration
Long-term debt: At December 31, 2020, the Port’s long-term debt, including current portion outstanding totaled $602.8 million. Of this amount, general obligation bonds outstanding were $159.7 million and revenue bonds outstanding were $443.1 million. At December 31, 2019, the Port’s long-term debt, including current portion outstanding totaled $623.8 million. Of this amount, general obligation bonds outstanding were $165.4 million and revenue bonds outstanding were $458.4 million. In October 2020, the Port issued Revenue Bonds par value $26.1 million with a coupon rate of 1.35% to refund 2014B Revenue Bonds par value of $26.1 million to reduce interest expense. The newly issued Revenue Bonds were issued at par and the net proceeds were $26.1 million. The refunding met the requirements of an in-substance debt defeasance and the Series 2014B Revenue Bonds were removed from the Port’s financial statements. As a result of the refunding of the 2014B Revenue Bonds, the Port reduced its total debt service requirements by $1.4 million which accumulates into an economic gain (difference between the present value of the debt service payments on the old and new debt) of $1.3 million over the life of the bonds. The refunding bonds are described in more detail in Note 5 of this report.
The Port utilizes interest rate payment agreements (derivatives) to manage interest rate risk. The swap agreements synthetically fix or “lock-in” interest rates on variable-rate revenue bond debt by providing cash flows that
are intended to offset the variable-rate bond payments, leaving the Port with the fixed payment identified in each swap agreement. The Port does not hold or issue derivative financial instruments for trading purposes. These instruments are designated as cash-flow hedges on the trade date and are recognized on the statements of net position at fair value.
To reduce interest rate mismatch between the interest rate swaps and the interest paid on the bonds, in September 2019, the Port refunded the 2014A subordinate lien direct borrowings with the bank of $82.1 million by issuing $40.5 million of variable-rate demand obligations on Weekly Interest Rate mode and $41.6 million of fixed-rate bonds for the unhedged portion of the variable debt. The Port also changed the mode on the 2009 and 2008 subordinate lien bonds from Index Interest Rate mode to publicly traded Weekly Interest Rate mode. The refunding bonds are described in more detail in Note 5 of this report.
The Port requests bond ratings prior to issuing debt. Moody’s and Standard & Poor’s rated the Port’s debt as follows:
Description Moody’sStandard & Poor’s
General Obligation (Senior Lien) Aa2 AA
Revenue Bonds (Senior Lien) Aa3 AA-
Revenue Bonds (Subordinate) A1 A+

Port of Tacoma 2020 Annual Report Management’s Discussion and Analysis 25
Post-Employment Health Care Benefits Trust Fund: The Post-Employment Health Care Benefits Trust Fund (the Trust) accounts for the assets of the employee benefit plan held by the Port in a trustee capacity. A summarized comparison of the assets, liabilities and net position of the Trust and changes in net position for the years ended December 31, are as follows (dollars in thousands):
2020 2019 2018
Total assets $ 4,944 $ 4,930 $ 4,986
Total liabilities - - -
Total net position $ 4,944 $ 4,930 $ 4,986
Total additions $ 168 $ 172 $ 85
Total deductions (154) (228) (219)
Increase (decrease) in net position
$ 14 $ (56) $ (134)
Net position— beginning of year
$ 4,930 $ 4,986 $ 5,120
Net position— end of year
$ 4,944 $ 4,930 $ 4,986
COVID-19: On March 11, 2020, the World Health Organization characterized COVID-19 as a global pandemic. A significant portion of the cargo that moves through our gateway is to and from Asia, specifically China. In 2020, the NWSA experienced a decline in cargo as a result of economic shutdowns around the world to limit the spread of the virus which fueled global unemployment and stifled both production and consumer spending. Many retailers postponed or canceled consumer goods orders with overseas suppliers in the spring in response to the COVID-19 outbreak. The latter half of 2020 saw a significant rebound in consumer demand as the U.S. economy re-opened. Inventory replenishment and a surge in e-commerce orders have contributed to the stabilization of container cargo. The outbreak of COVID-19 continues to spread throughout the world supply chain, and we believe that until it is under control, it has the potential to continue to have a negative impact on our operating results and financial condition. The extent of the impact of COVID-19 on our operational and financial performance will depend on the distribution and efficacy of the new vaccines which at this time are uncertain and cannot be predicted. Given these uncertainties, we cannot reasonably estimate the related impact to our business, operating results and financial condition.
“ The latter half of 2020 saw a significant rebound in consumer demand as the U.S. economy reopened.”
REQUEST FOR INFORMATION
The Port of Tacoma designed this financial report to provide our citizens, customers, investors and creditors with an overview of the Port’s finances. If you have questions or need additional information, please visit our website at www.portoftacoma.com or contact:
Chief Financial OfficerP.O. Box 18371 Sitcum WayTacoma, Washington98401-1837
Telephone 253.383.5841Fax 253.597.7573

FINANCIAL STATEMENTS

Port of Tacoma 2020 Annual Report Financial Statements 27
Assets 2020 2019
Current assets:Cash $ 1,112 $ 1,207 Investments, at fair value 188,683 216,020 Trade accounts receivable, net of allowance for doubtful accounts
785 964
Grants receivable 360 -Taxes receivable 601 498 Related party receivables—Joint Venture 6,752 16,308 Prepayments and other current assets 6,780 6,816
Total current assets $ 205,073 $ 241,813
Non-current assets:Long-term investments:
Restricted investments at fair value $ - $ 2,248 Restricted bond reserves at fair value 18,227 17,536
Long-term investments $ 18,227 $ 19,784
Capital and intangible assets:Land $ 573,918 $ 567,120 Buildings 100,289 102,792 Improvements 673,833 683,388 Machinery and equipment 86,623 87,409 Intangible assets 32,264 32,264 Construction in process 7,827 7,313
Total cost $ 1,474,754 $ 1,480,286
Less accumulated depreciation and amortization $ 561,417 $ 544,120 Capital and intangible assets, net $ 913,337 $ 936,166
Investment in Joint Venture $ 219,710 $ 177,197 Assets held for sale 7,840 7,840 Net OPEB asset 1,914 2,079 Other assets 5,783 5,783
Total non-current assets $ 1,166,811 $ 1,148,849
Total assets $ 1,371,884 $ 1,390,662
Deferred outflows of resources: Accumulated decrease in fair value of hedging derivatives $ 80,594 $ 65,717
OPEB deferred outflow 228 305 Pension deferred outflow 2,411 1,997 Advance refunding deferred losses 5,799 6,135
Total deferred outflows of resources $ 89,032 $ 74,154
Enterprise Fund
Statements of Net Position December 31, 2020 and 2019 (dollars in thousands)
Liabilities and Net Position 2020 2019
Current liabilities:Accounts payable and accrued liabilities $ 15,022 $ 14,602 Payroll and taxes payable 5,560 5,423 Accrued interest 1,909 2,039 Related party payables—Joint Venture 6,327 7,754 Commercial paper - 25,000 Current portion of long-term debt 15,393 14,835
Total current liabilities $ 44,211 $ 69,653
Non-current liabilities:Long-term debt:
General obligation bonds, net $ 153,093 $ 161,182 Revenue bonds, net 434,356 447,818
Net long-term debt $ 587,449 $ 609,000
Other long-term liabilities:Interest rate payment agreements $ 80,594 $ 65,717 Net pension liability 7,541 8,176 Environmental liability 28,171 28,312 Other 55,894 54,558
Other long-term liabilities $ 172,200 $ 156,763
Total non-current liabilities $ 759,649 $ 765,763
Total liabilities $ 803,860 $ 835,416
Deferred inflows of resources:Pension deferred inflow $ 3,337 $ 5,590 OPEB deferred inflow 195 496
Total deferred inflows of resources $ 3,532 $ 6,086
Net position:Net investment in capital assets $ 316,294 $ 295,714 Restricted—bond reserves 18,227 17,536 Unrestricted 319,003 310,064
Total net position $ 653,524 $ 623,314 See notes to financial statements.

Port of Tacoma 2020 Annual Report Financial Statements 28
Statements of Revenues, Expenses and Changes in Net Position Years ended in December 31, 2020 and 2019 (dollars in thousands)
2020 2019
Operating revenues:Property rentals $ 27,470 $ 27,372 Joint Venture income 38,782 47,979
Total operating revenues $ 66,252 $ 75,351
Operating expenses:Operations $ 4,508 $ 3,892 Maintenance 3,829 4,677 Administration 4,250 4,021 Security 260 265 Environmental 2,381 2,244
Total operating expenses, before depreciation $ 15,228 $ 15,099
Depreciation $ 26,789 $ 26,855 Total operating expenses $ 42,017 $ 41,954
Operating income $ 24,235 $ 33,397
Non-operating revenues (expenses):Ad valorem tax revenue $ 23,132 $ 20,921 Interest on general obligation bonds (4,674) (4,804)
Net ad valorem tax revenues $ 18,458 $ 16,117
Interest income $ 2,501 $ 5,733 Net increase in the fair value of investments 1,827 2,137 Interest expense (17,716) (20,085) Other non-operating income, net 80 1,645
Total non-operating income (expenses), net $ 5,150 $ 5,547
Increase in net position, before capital grant contributions and special item $ 29,385 $ 38,944
Capital grant contributions $ 825 $ 700 Increase in net position before special item $ 30,210 $ 39,644
Special Item $ - $ (21,977) Increase in net position $ 30,210 $ 17,667
Net position:Net position, beginning of year $ 623,314 $ 605,647
End of year $ 653,524 $ 623,314 See notes to financial statements.
Statements of Cash Flows Years ended in December 31, 2020 and 2019 (dollars in thousands)
2020 2019
Cash flows from operating activities:Cash received from customers $ 27,595 $ 26,529 Cash paid to suppliers for goods and services (9,918) (15,905) Cash paid to employees (6,953) (6,941) Cash received from (paid to) related party—Joint Venture 4,894 (6,544) Cash received (paid) for other operating income (expense) (320) (1,540)
Net cash provided by (used in) operating activities $ 15,298 $ (4,401)
Cash flows from non-capital financing activities:Cash received from operating grants $ 147 $ 485
Net cash provided by non-capital financing activities $ 147 $ 485
Cash flows from capital and related financing activities:Proceeds from sale of property, plant and equipment $ 2,061 $ 6,995 Borrowings on commercial paper 25,000 125,000 Repayments on commercial paper (50,000) (125,000) Principal payments on general obligation and revenue bonds and other debt (17,044) (14,552)
Proceeds from refunding bond issues 26,075 82,120 Repayment of refunded bonds (26,075) (82,120) Acquisition and construction of capital assets (5,527) (14,167) Interest paid on general obligation and revenue bonds and other debt (26,133) (26,722) Cash received from federal and state grants 318 602 Cash received from property taxes for general obligation bonds 23,029 20,856
Net cash used in capital and related financing activities $ (48,296) $ (26,988)
Cash flows from investing activities:Purchases of investments $ (204,459) $ (169,008) Proceeds from sales and maturities of investment securities 235,074 181,450 Cash used to fund investment in NWSA (65,509) (40,737) Cash distributions received from Joint Venture 65,043 52,250 Interest received on investments 2,607 6,065
Net cash provided by investing activities $ 32,756 $ 30,020
Net decrease in cash $ (95) $ (884)
Cash:Beginning of year $ 1,207 $ 2,091
End of year $ 1,112 $ 1,207
Enterprise Fund

Port of Tacoma 2020 Annual Report Financial Statements 29
Enterprise Fund Continued from previous page
Statements of Cash Flows Years ended in December 31, 2020 and 2019 (dollars in thousands)
2020 2019
Reconciliation of operating income to net cash provided by (used in) operating activities:
Operating income $ 24,235 $ 33,397
Adjustments to reconcile operating income to net cash provided by (used in) operating activities:
Depreciation $ 26,789 $ 26,855
Cash paid for non-operating income (expense) (319) (1,540) Cash distributions received from related party—Joint Venture (65,043) (52,250)
Changes in assets and liabilities:
Decrease (increase) in related-party receivable—Joint Venture 4,864 (5,193)
Decrease (increase) in accounts receivable 179 (148)
Increase in other deferred assets - (694)
Decrease (increase) in prepayments 37 (56)
Decrease in investment in Joint Venture 26,261 4,271
Increase (decrease) in accounts payable and accrued liabilities 185 (6,751)
Decrease in environmental reserves (141) (491)
Decrease in payroll and taxes payable (498) (2,174)
Increase in long-term liabilities 1,417 309
Increase (decrease) in net deferred pension inflows/outflows (2,668) 64
Total adjustments and changes $ (8,937) $ (37,798)
Net cash provided by (used in) operating activities $ 15,298 $ (4,401)
Noncash investing and financing activities:
Capital asset additions and other purchases financed with accounts payable
$ 266 $ 2,539
Capital construction payable to related party—Joint Venture $ (1,851) $ (7,754)
Distributions receivable from related party—Joint Venture $ 5,170 $ 9,135
Increase in fair value of investments $ 1,827 $ 2,137
See notes to financial statements.
Post-Employment Health Care Benefits Trust Fund
Statements of Net Position Years ended in December 31, 2020 and 2019 (dollars in thousands)
2020 2019
Assets:
Cash $ 346 $ 134
Fixed income securites, at fair value 4,598 4,796
Total assets $ 4,944 $ 4,930
Plan liabilities:
Net position held in trust for other post-retirement benefits and other purposes
$ 4,944 $ 4,930
See notes to financial statements.
Statements of Changes in Net Position Years ended in December 31, 2020 and 2019 (dollars in thousands)
2020 2019
Additions:
Employer contributions $ - $ -
Net decrease in fair value of investments 85 83
Interest 83 89
Total additions $ 168 $ 172
Deductions:
Benefit payments $ 141 $ 216
Administrative expenses 13 12
Total deductions $ 154 $ 228
Change in net position $ 14 $ (56)
Net position held in trust for other post-retirement benefits and other purposes:
Beginning of year $ 4,930 $ 4,986
End of year $ 4,944 $ 4,930
See notes to financial statements.

Port of Tacoma 2020 Annual Report Financial Statements Notes 30
1NOTEASDF
SUMMARY OF SIGNIFICANT ACCOUNTING POLICIES
Reporting entity: The Port of Tacoma (the Port) is a municipal corporation of the State of Washington created in 1918 under provisions of the Revised Code of Washington (RCW) 53.04.010 et seq. The Port has geographic boundaries coextensive within Pierce County, Washington, and is situated on Commencement Bay in Puget Sound.
The Port is independent from Pierce County government and is administered by a five- member Board of Commissioners elected by Pierce County voters. The Commission delegates administrative authority to an Executive Director and administrative staff to conduct operations of the Port. The County levies and collects taxes on behalf of the Port. Pierce County provides no funding to the Port. Additionally, Pierce County does not hold title to any of the Port’s assets, nor does it have any right to the Port’s surpluses.
In August 2015, the ports of Seattle and Tacoma formed the NWSA, a special purpose governmental entity established as a Port Development Authority (PDA) under provisions of the RCW 53.04.010 et seq. similar to Public Development Authorities formed by cities and counties. Each Port Commission is a Managing Member of the NWSA. The NWSA’s financial activity began effective January 1, 2016.
The Port of Seattle and Port of Tacoma (home ports) made an initial contribution of certain cargo terminals and related marine cargo business activities to the NWSA through license agreements (Licensed Properties).
The State Legislature granted qualifying ports the authority to create a PDA for the management of maritime activities and to allow ports to act cooperatively and use financial resources strategically, while remaining separate entities and complying with federal regulations. Pursuant to the PDA statute, if a PDA is created jointly by more than one port district, the PDA must be managed by each port district as a member, in accordance with the terms of the statute and the Charter. Any port district that creates a PDA must oversee the affairs, operations and funds of the PDA to correct any deficiency, and ensure that the purposes of each program undertaken are reasonably accomplished. The statute permits a PDA, in managing maritime activities of a port district or districts, to own and sell real and personal property; to enter into contracts; to sue and be sued; to loan and borrow funds; to issue bonds, notes and other evidences of indebtedness; to transfer funds, real or personal property, property interests or services; and to perform community services related to maritime activities managed by the PDA. As discussed below, the statute allows, but the Charter prohibits, the NWSA to issue bonds, borrow funds or enter into other debt instruments. By statute, PDAs do not have the power of eminent domain or the power to levy taxes or special assessments. In transferring real property to a PDA, the port district or districts creating the PDA must impose appropriate deed restrictions necessary to ensure the continued use of the property for the public purpose for which the property is transferred.
The NWSA is governed by its Managing Members, with each Managing Member acting pursuant to
the Charter through its elected commissioners. The Managing Members appoint a Chief Executive Officer (CEO) who is responsible for hiring staff and entering into service agreements with the Managing Members as needed. Staff is comprised of certain Port of Tacoma and former Port of Seattle employees assigned either in full or in part to work in roles in the NWSA. In addition, both Managing Members may provide services through shared service agreements with a portion of staff time allocated to, and paid by, the NWSA.
Effective January 1, 2016, the accounting for revenues and expenses associated with Licensed Properties became the responsibility of the NWSA and the ownership of the Managing Members is accounted for as a joint venture by the home ports. Additional information about the formation of the NWSA is presented in the MD&A and Note 17, Joint Venture.
The Port reports all of its activities and operations except for the activities included with the Post-Employment Health Care Benefits Trust Fund in the Enterprise Fund. Enterprise funds are used to account for operations that are financed and operated in a manner similar to private business enterprises with the intent that the cost of providing goods and services to customers is financed or recovered primarily through user charges. The Port tracks activity of the Post-Employment Health Care Benefits Trust in a Fiduciary Fund. Fiduciary Funds are used to accumulate resources to fund pension and other post-employment benefit (OPEB) plans.
Notes to Financial Statements December 31, 2020 and 2019 (dollars in thousands)

Port of Tacoma 2020 Annual Report Financial Statements Notes 31
Nature of business: The Enterprise Fund is used to account for the general operations of the Port, as more fully described below:
The Port is authorized by Washington law to provide and charge rentals, tariffs and other fees for docks, wharves and similar harbor facilities, including associated storage and traffic handling facilities, for waterborne commerce. The Port may also provide freight and passenger terminals, and transfer, as well as storage facilities for other modes of transportation, including air, rail and motor vehicles. The Port may acquire and improve lands for sale or lease for industrial or commercial purposes and may create industrial development districts.
Measurement focus, basis of accounting and presentation: The financial statements of the Port have been prepared in conformity with accounting principles generally accepted in the United States of America, as applied to government units, and the Port is accounted for as a business-type activity. The Government Accounting Standards Board (GASB) is the accepted standard-setting body for establishing governmental accounting and financial reporting principles. The Port accounts for its activities in its Enterprise Fund and Fiduciary Fund on a flow of economic resources measurement focus and the full-accrual basis of accounting where revenues are recognized when earned and expenses are recognized when incurred, regardless of the timing of the related cash flows. Grants are recognized as revenue as soon as all eligibility requirements imposed by the provider have been met.
The accounting records of the Port are maintained in accordance with methods prescribed by the State Auditor under the authority of Chapter 43.09 RCW. The Port also follows the Uniform System of Accounts for Port Districts in the State of Washington.
Use of estimates: The preparation of financial statements in conformity with accounting principles generally accepted in the United States of America requires management to make estimates and assumptions that affect the amounts reported in the financial statements and accompanying notes. Significant estimates also affect the reported amounts of revenues and expenses during the reporting period. Significant estimates made by the Port include estimates surrounding environmental liabilities and estimates associated with pension and OPEB accounting. Actual results could differ from those estimates.
On March 11, 2020, the World Health Organization declared the outbreak of coronavirus (COVID-19) a pandemic. COVID-19 has disrupted economic markets and the impact has been widespread across all industries. The pandemic represents a potential market risk factor due to the uncertainties in operations and therefore values. In response to the pandemic, management has considered whether its estimates should be re-evaluated. The Port has determined that no changes were necessary at this time. The Port will continue to monitor the economic environment and evaluate potential impacts on the financial statements.
Significant risks and uncertainties: The Port is subject to certain business risks that could have a material impact on future operations and financial performance. These risks include economic conditions, collective bargaining disputes, federal, state and local government regulations, and changes in law.
The formation of the NWSA is intended to eliminate pricing competition between the home ports by creating a unified gateway to allow for coordination of customer relationships, to improve capacity utilization between the home ports and to rationalize strategic capital investments. The formation of the NWSA may or may not successfully address these risks, and may create new risks, including the risks associated with undertaking a new joint venture with an outside entity, the risk associated with the operating and financial performance of additional facilities, and exposure to the financial strength of the Port of Seattle to make future capital expenditures.
Under the NWSA Interlocal Agreement and the Charter, the Port has agreed to work cooperatively with the Port of Seattle and, accordingly, has agreed not to act unilaterally with respect to certain matters. Decisions that could have a material effect on the Port, including new business agreements and leases or amendments to existing agreements and leases and future capital contributions to the NWSA, must be approved by each Managing Member and, accordingly, the Port will need to reach agreement with the Port of Seattle on these matters prior to executing any changes.
Port of Tacoma 2020 Annual Report Financial Statements Notes 32
The Charter requires that the NWSA maintain the Bond Income Calculation and not take any action that would reasonably reduce its income below this minimum net operating income level unless each Managing Member votes separately to approve that action. This minimum net operating level is established based on the amount required at formation of the NWSA for the home ports to meet their then-current bond rate covenants and may not always reflect the amount required to meet bond rate covenants on a go-forward basis.
If net income before depreciation of the NWSA is not sufficient for either port to be in compliance with a rate covenant (as described in each home port’s governing bond resolutions in effect as of the effective date), then (i) upon that home port’s request, the NWSA shall hire an independent third-party consultant to perform an analysis and make recommendations for actions needed to achieve bond covenant compliance; (ii) if the consultant recommends an action that the NWSA is unwilling, unable or refuses to undertake, either Managing Member can require dissolution of the NWSA following the dispute resolution process even if within the “Initial Period” (as defined in the Charter, “the expiration of 20 years following the NWSA’s formation”); and (iii) the NWSA shall have at least four months to respond, act and or dissolve following its receipt of the consultant’s recommended action, unless a shorter time is required by the applicable bond covenants.
Cash: Cash represents cash and demand deposits. The Port maintains its cash in bank deposit accounts which are covered by the Public Deposit Protection Commission (PDPC) of the State of Washington.
Trade accounts receivable: Trade accounts receivable are carried at original invoice amount less an estimate made for doubtful accounts based on a review of all outstanding amounts. Management determines the allowance for doubtful accounts by identifying delinquent accounts and by using historical experience applied to an aging of accounts. Trade accounts receivable are written off when deemed uncollectible. Recoveries of receivables previously written off are recorded when received. The allowance for doubtful accounts at December 31, 2020 and 2019, was $25,000 and $23,000, respectively.
Investments: Investments, unrestricted and restricted, are stated at fair value, which is the price that would be received in an orderly transaction between market participants at the measurement date. The Port also has investments in the Washington State Local Government Investment Pool (LGIP). The LGIP is similar to a money market fund recognized by the Securities and Exchange Commission. The LGIP invests in U.S. Agency Securities, Repurchase Agreements, U.S. Treasury Securities, Interest Bearing Bank Deposits and Certificates of Deposit. The investments are limited to high-quality obligations with limited maximum and average maturities. The pool is valued at amortized cost. Interest income on investments is recognized in non-operating revenues as earned. Changes in the fair value of investments are recognized on the statements of revenues, expenses and changes in net position. The Port’s general policy is to not hold more than 20% of its holdings in any one investment. See Note 2 for further information.
Investment in joint venture: The Port adopted joint-venture accounting beginning January 1, 2016, to account for its 50% share in the NWSA. The Port’s investments and the Port’s 50% share of NWSA’s net income and cash distributions will be presented on the statements of net position as investment in Joint Venture. The Port’s 50% of the NWSA’s net income and losses are presented on the statements of revenues, expenses and changes in net position as Joint Venture income. Additional information about the NWSA is presented in the MD&A and Note 17, Joint Venture.
Bond reserves—restricted: Required bond reserves and unspent bond proceeds, if any, are not available for current expenses when constraints placed on their use are legally enforceable due to
1) externally imposed requirements by creditors; 2) laws or regulations of other governments; and 3) constitutional provisions or enabling
legislation are included in this category.
Prepayments and other current assets: Consist of prepaid expenses for various items as well as maintenance supplies. Maintenance supply inventories of $3,381,000 and $3,663,000 at December 31, 2020 and 2019, respectively, are valued at net realizable value, which approximates cost using the weighted-average method.
Capital assets and depreciation and amortization: Capital assets are recorded at cost. Donated assets are recorded at acquisition value on the date donated.

Port of Tacoma 2020 Annual Report Financial Statements Notes 33
The Port’s policy is to capitalize all asset additions greater than $20,000 and with an estimated life of more than three years. Depreciation is computed on the straight-line method. The following lives are used:
Years
Buildings and improvements 10–75
Machinery and equipment 3–20
Preliminary costs incurred for proposed projects are reported as construction in process on the statements of net position during construction of the facility. As projects are constructed, the project costs are transferred to the appropriate capital asset account; charges that relate to abandoned projects are expensed when the project is abandoned.
Intangible assets: Intangible assets consist of assets that lack physical substance, are nonfinancial in nature and whose initial useful life extends beyond one reporting period. Intangible assets primarily consist of a land exchange and right-of-way rights and are classified with capital assets in the accompanying financial statements. Management has determined that there are no factors that would limit the useful life of these assets; therefore, they are considered indefinite lived assets and are not being amortized. Intangible assets totaled approximately $32,264,000 at December 31, 2020 and 2019.
Capitalized interest: During 2020 the Port adopted GASB Statement No. 89, Accounting for Interest Cost Incurred Before the End of a Construction Period, and discontinued capitalizing interest to capital assets. Prior to 2020, the Port
followed the policy of capitalizing interest as a component of the cost of capital assets constructed for projects greater than $300,000 that were not funded by capital grant contributions. Interest incurred on funds used during construction was capitalized as part of the cost of construction. This process was intended to remove the cost of financing construction activity from the statements of revenues, expenses and changes in net position and to treat such cost in the same manner as construction labor and material costs by taking the monthly average of construction in process balance times the average interest rate of the outstanding long-term borrowing.
During 2019, total interest incurred, excluding interest on general obligation bonds, was $20,085,000, net of capitalized interest of $12,000.
Net position: Net position consists of net investment in capital assets, restricted and unrestricted net position. Net investment in capital assets consists of capital assets, net of accumulated depreciation, reduced by the outstanding balances of any borrowings used for the acquisition, construction or improvement of those assets. Deferred outflow of resources and deferred inflows of resources that are attributable to the acquisition, construction or improvement of those assets or related debts should be included in this component of net position. This calculation excludes unspent debt proceeds, if any.
The Port’s net position is reported as restricted when there are limitations imposed on its use either through the enabling legislation adopted by the Port or through external restrictions imposed by creditors, grantors, laws or regulations of other governments.
Net investment in capital assets consists of the following at December 31 (dollars in thousands):
2020 2019
Net investment in capital and intangible assets
$ 913,337 $ 936,166
Revenue bond proceeds restricted for construction
- 2,248
Less:
Net bond premium $ 47,621 $ 51,571
Advance refunding deferred losses
(5,798) (6,135)
Long-term debt, including current portion
555,220 572,264
Commercial paper - 25,000
Net invested in capital and intangible assets, net of related debt, end of year
$ 316,294 $ 295,714
The restricted component of net position was $18,227,000 and $17,536,000 at December 31, 2020 and 2019, respectively, and consisted primarily of bond reserves, as required per certain bond agreements.
The unrestricted component of net position is the net amount of the assets and deferred outflows of resources, less liabilities and deferred inflows of resources that are not included in the determination of net investment in capital assets or the restricted components of net position.
Retentions payable: The Port enters into construction contracts that may include retention provisions such that a certain percentage of the contract amount is held for payment until completion of the contract and acceptance by the Port. The Port’s policy is to pay the retention

Port of Tacoma 2020 Annual Report Financial Statements Notes 34
due only after completion and acceptance have occurred. Retentions payable totaled $28,000 and $89,000 at December 31, 2020 and 2019, respectively. Retentions payable are included in accounts payable and accrued liabilities on the accompanying statements of net position.
Federal and state grants: The Port may receive federal and state grants as reimbursement for construction of facilities, environmental programs and terminal security infrastructure and maintenance. These grants are recognized on a reimbursement basis and included in capital contributions on the accompanying statements of revenues, expenses and changes in net position.
Commercial paper and current portion of long-term debt: Commercial paper includes borrowings with original maturities of less than one year and current portion of long-term debt is the portion of long-term debt payable within 12 months (see Notes 4 and 5).
Interest rate payment agreements: The Port accounts for derivative instruments, including certain derivative instruments embedded in other contracts (collectively referred to as derivatives) on the statements of net position at fair value. The payment instruments were designated as highly effective cash flow hedges at December 31, 2020 and 2019 (see Note 5).
Refunds of debt: Proceeds from bond defeasance are deposited in an irrevocable trust, with an escrow agent to service the debt on the refunded bonds. Accordingly, the defeased bonds and the related Trust, are not recorded on the
Port’s financial statements. The difference between the reacquisition price and the carrying amount of defeased debt results in either a gain or loss that is amortized over the life of the new debt or old debt, whichever is shorter (see Note 5).
Employee benefits: The Port accrues unpaid vacation and sick leave benefit amounts as earned and payable upon termination. These benefits are accrued at current rates of compensation. Accrued vacation and sick leave included in payroll and taxes payable amounted to $1,324,000 and $627,000, respectively, at December 31, 2020, and $1,099,000 and $604,000, respectively, at December 31, 2019.
Vacation and sick leave paid in 2020 were $1,111,000 and $648,000, respectively, and $1,205,000 and $867,000, respectively, in 2019. The estimated total amount of vacation and sick leave expected to be paid in 2021 is $1,144,000 and $667,000, respectively.
The Port provides health care benefits for eligible employees through the HRA VEBA Trust, which is a nonprofit, multiple employer voluntary employees’ beneficiary association (VEBA) authorized under Internal Revenue Code 501(c)(9). The HRA VEBA Trust offers a funded health reimbursement arrangement (HRA) plan available to certain governmental employers in the Northwest (Washington, Oregon and Idaho). The Trust is managed by a Board of Trustees elected by the plan participants, participating employers, or the Board itself, depending on the Trustee position. The Port has two plans, one of which was closed to new employees hired after July 1, 2015 (VEBA5), the second plan is open
to all eligible employees. The Port contributed $462,000 and $479,000 to eligible employee VEBA accounts in 2020 and 2019, respectively.
The Port offers its employees a deferred compensation plan created in accordance with Internal Revenue Code Section 457. The plan, available to all Port employees, permits them to defer a portion of their salary until future years. In accordance with GASB authoritative guidance, accounting and reporting for Internal Revenue Code Section 457 deferred compensation plans, employee assets are not reflected in the Port’s financial statements. This plan is fully funded and held in an external trust.
Post-Employment Health Care Benefits Trust: The Port provides major medical coverage for eligible retired employees through the single-employer Post-Employment Defined Benefit Health plan (the Plan). The Plan is administered through the Port’s self-insured medical plan. The Port established the Port of Tacoma Post-Employment Healthcare Funding Obligation Trust (the Trust) to be used solely for the cost of medical coverage for eligible Plan participants and for the payment of the cost of administering the Plan. The Port is the sole administrator and fiduciary of the Trust.
The net other post-employment benefits (OPEB) other than pensions asset complied with the provisions of GASB Statement Nos. 74 and 75 (see Note 9). The Plan’s audited financial statements for 2020 and 2019 may be found on page 29 of this report.

Port of Tacoma 2020 Annual Report Financial Statements Notes 35
Pensions: The Port participates in the Washington Department of Retirement Systems (the Plan) cost sharing, multiple-employer, defined benefit public employee retirement plans. This Plan covers substantially all of the Port’s full-time and qualifying part-time employees. The Port’s contribution rates are determined by the Plan each year and are based on covered payroll of the qualifying participants.
The net pension liability, deferred outflows of resources and deferred inflows of resources related to pensions, and pension expense, information about the fiduciary net position of the Washington State Department of Retirement Systems Plan (PERS) and additions to/deductions from PERS’s fiduciary net position have been determined on the same basis as they are reported by PERS. For this purpose, benefit payments (including refunds of employee contributions) are recognized when due and payable in accordance with the benefit terms. Investments are reported at fair value (see Note 8).
Environmental remediation costs: The Port environmental remediation policy requires accrual of pollution remediation obligation amounts when (a) one of the following specific obligating events is met and (b) the amount can be reasonably estimated. Obligating events include imminent endangerment to the public; permit violation; Port named as party responsible for sharing costs; Port named in a lawsuit to compel participation in pollution remediation; or commenced or legally obligated to commence pollution remediation. Potential cost recoveries such as insurance proceeds, if any, are evaluated separately from the Port’s pollution remediation obligation. Costs incurred for pollution remediation obligations are
typically recorded as non-operating environmental expenses unless the expenditures relate to the Port’s principal ongoing operations, in which case, they are recorded as operating expenses. Costs incurred for pollution remediation obligations can be capitalized if they meet specific criteria. Capitalization criteria include preparation of property in anticipation of a sale; preparation of property for use if the property was acquired with known or suspected pollution that was expected to be remediated; performance of pollution remediation that restores a pollution-caused decline in service utility that was recognized as an asset impairment; or acquisition of property, plant and equipment that have a future alternative use not associated with pollution remediation efforts. See Note 12 for additional details.
Security deposits: Under the terms of certain Licensed Property lease agreements, the Port’s customers or tenants are required to provide security in the event of delinquencies in rent payment, default, or other events defined in these agreements. The security amounts are determined by lease terms. The Port held $3,485,000 and $2,101,000 in security deposits at December 31, 2020 and 2019, respectively.
Deferred outflow and inflow of resources: Deferred outflow of resources is a consumption of net position that is applicable to a future reporting period(s). The Port reports deferred outflows on the statements of net position for its fair value of hedging derivatives, pension and OPEB plans and for the deferred cost of advance refunded bonds. Deferred inflow of resources is an acquisition of net position that is applicable to a future reporting period(s). The Port records deferred
inflow of resources on the statements of net position for its pension and OPEB plans.
Operating and non-operating revenues and expenses: Property rental revenues are charges for use of the Port’s facilities and are reported as operating revenue. Joint Venture income is the Port’s proportionate share of the NWSA net income earned on licensed home port assets and is reported as operating revenue. Ad valorem tax levy revenues and other revenues generated from non-operating sources are classified as non-operating. Operating expenses are costs primarily related to property rental activities. Interest expense and other expenses incurred not related to the normal operations of the Port’s property rental activities are classified as non-operating.
Recent accounting pronouncements: In June 2017, GASB issued Statement No. 87, Leases. The objective of this statement is to better meet the information needs of financial statement users by improving accounting and financial reporting for leases by governments. The requirements of this statement are effective for reporting periods beginning after December 15, 2019. The Port has elected to postpone the adoption of this standard as allowed by Statement No. 95, Postponement of the Effective Dates of Certain Authoritative Guidance. The Port has evaluated the impact of this standard and is estimating the impact will be an increase in lease receivables and deferred inflows of resources of $227.0 million and a reduction of $8.5 million in operating revenue with an offsetting increase of $8.5 million to non-operating interest revenue.

Port of Tacoma 2020 Annual Report Financial Statements Notes 36
In January 2020, the GASB issued Statement No. 92, Omnibus 2020. The statement addresses a variety of topics, including the effective date of new lease guidance in interim financial reports, reporting intra-entity transfers for defined benefit pension plans or other postemployment benefit plans, reporting assets accumulated for postemployment benefits, certain requirements for postemployment benefit arrangements, measurement of assets and liabilities associated with asset retirement obligations, public entity risk pool reporting, nonrecurring fair value measurements, and terminology used to refer to derivative instruments. The requirements of this statement are effective for reporting periods beginning after December 15, 2020. The Port is currently evaluating the effect of the adoption of this standard on its financial statements and related disclosures.
In March 2020, the GASB issued Statement No. 93, Replacement of Interbank Offered Rates. The statement removes the London Interbank Offered Rate (LIBOR) as an appropriate benchmark interest rate in hedging derivative instruments and leases and addresses accounting and financial reporting implications that result from the replacement of an interbank offered rate. The requirements of this statement are effective for reporting periods beginning after December 31, 2021. The Port is currently evaluating the effect of the adoption of this standard on its financial statements and related disclosures.
In March 2020, the GASB issued Statement No. 94, Public-Private and Public-Public Partnerships and Availability Payment Arrangements. The statement addresses issues related to public-private and
public-public partnership arrangements and provides guidance for accounting and financial reporting for availability payment arrangements. The requirements of this statement are effective for reporting periods beginning after June 15, 2022. The Port is currently evaluating the effect of the adoption of this standard on its financial statements and related disclosures.
In May 2020, the GASB issued Statement No. 95, Postponement of the Effective Dates of Certain Authoritative Guidance, which postponed the effective dates of certain provisions in statements and implementation guides that first became effective or were scheduled to become effective for periods beginning after June 15, 2018. The objective of the statement was to provide temporary relief to governments and other stakeholders in light of the COVID-19 pandemic. The provisions of Statement 95 are effective immediately. The Port has delayed implementation of Statement No. 87, Leases, and Implementation Guide No. 2019-3, Leases, as allowed by Statement No. 95.
In June 2020, the GASB issued Statement No. 96, Subscription-Based Information Technology Arrangements. The statement provides guidance on the accounting and financial reporting for subscription-based information technology arrangements. The requirements of this statement are effective for reporting periods beginning after June 15, 2022. The Port is currently evaluating the effect of the adoption of this standard on its financial statements and related disclosures.
In June 2020, the GASB issued Statement No. 97, Certain Component Unit Criteria, and Accounting and Financial Reporting for Internal Revenue
Code Section 457 Deferred Compensation Plans. The statement amends the criteria for reporting governmental fiduciary component units to improve consistency and comparability in reporting on fiduciary component units and IRS Section 457 plans. The requirements of this statement are effective for reporting periods beginning after June 15, 2021. The Port is in the process of evaluating the effect of the adoption of this standard on its financial statements and related disclosures.
Recent accounting pronouncements, adopted: In June 2018, GASB issued Statement No. 89, Accounting for Interest Cost Incurred Before the End of a Construction Period. This statement establishes accounting requirements for interest cost incurred before the end of a construction period. The requirements of this statement are effective for reporting periods beginning after December 15, 2019. The Port evaluated and adopted this standard and concluded that there was no material impact to the financial statements and related disclosures.
In August 2018, the GASB issued Statement No. 90, Majority Equity Interests—an amendment of GASB Statements No. 14 and No. 61. The statement provides guidance and clarification for the accounting and reporting requirements for a government’s majority equity interest in legally separate organizations. The requirements of this statement are effective for reporting periods beginning after December 15, 2019. The Port evaluated and adopted this standard and concluded that there was no material impact to the financial statements and related disclosures.

Port of Tacoma 2020 Annual Report Financial Statements Notes 37
2 NOTEASDF
DEPOSITS AND INVESTMENTS
Discretionary deposits: The Port’s cash and cash equivalents of $1.1 million and $1.2 million as of December 31, 2020 and 2019, respectively, were deposited in qualified depositories as required by state statute. Deposits in excess of federal depository insurance coverage are covered by the Public Deposit Protection Commission of the State of Washington (PDPC). The PDPC is a statutory authority under Chapter 39.58 RCW. Currently, all well capitalized public depositories with the state are required to collateralize uninsured public deposits at 50%.
Investments: State of Washington statutes authorize the Port to invest in direct obligations of the U.S. Government, certificates of deposit, bankers’ acceptances, repurchase agreements, commercial paper, certain corporate notes, supranationals and municipal bonds. These investments must be placed with or through qualified public depositories of the State of Washington.
RISKS:
Concentration risk: Concentration of credit risk is the risk of loss attributable to the magnitude of an investment in a single issuer. The Port’s investment guidelines require diversification and sets limits on amount of investments by security and by issuer.
Interest rate risk: Interest rate risk is the risk that changes in interest rates will adversely affect the fair value of an investment. The Port’s investment guideline is to maximize investment return while preserving liquidity. To the extent possible, the Port will attempt to match its investments with
anticipated cash flow requirements using the specific-identification method.
Credit risk: Credit risk is the risk that an issuer of an investment will not fulfill its obligation to the holder of the investment. This is measured by the assignment of a rating by a nationally recognized statistical rating organization. The Washington State LGIP is an unrated external investment pool, as defined by the GASB.
Custodial credit risk: Custodial credit risk is the risk that, in the event of the failure of the counterparty, the Port will not be able to recover the value of its investments or collateral securities that are in the possession of the outside party. To minimize this risk, the Port’s policy requires that all security transactions are settled “delivery versus payment.” This means that payment is made simultaneously with the receipt of the security. These securities are delivered to the Port’s safekeeping bank. Except for the Washington State LGIP, the Port’s investment securities are registered, or held by Port of Tacoma or its agent in the Port of Tacoma’s name. The certificates of deposit are covered by the PDPC of the State of Washington. The PDPC is a statutory authority under Chapter 39.58 RCW. The PDPC approves which banks and thrifts can hold state and local government deposits and monitors collateral pledged to secure uninsured public deposits. This secures public treasurers’ deposits when they exceed the amount insured by the Federal Deposit Insurance Corporation (FDIC) by requiring banks and thrifts to pledge securities as collateral.
The LGIP manages a portfolio of securities that meet the maturity, quality, diversification and
liquidity requirements set forth by the GASB for external investment pools that elect to measure, for financial reporting purposes, investments at amortized cost. The funds are limited to high-quality obligations with regulated maximum and average maturities to minimize both market and credit risk.
The LGIP transacts with its participants at a stable net asset value per share of $1.00, the same method used for reporting. LGIP participants may contribute and withdraw funds on a daily basis. Participants must inform the Office of the State Treasurer of any contribution or withdrawal over $1 million no later than 9 a.m. on the same day the transaction is made. Contributions or withdrawals for $1 million or less can be requested at any time prior to 10 a.m. on the day of the transaction. However, participants may complete transactions greater than $1 million when notification is made between 9 a.m. and 10 a.m., at the sole discretion of Office of the State Treasurer. All participants are required to file with the State Treasurer documentation containing the names and titles of the officials authorized to contribute or withdraw funds.
Investments and restricted investments for unspent bond proceeds and revenue bond reserves for the Enterprise Fund on the statements of net position at December 31 are as follows (dollars in thousands):
2020 2019
Investments $ 188,683 $ 216,020
Unspent bond proceeds - 2,248
Bond reserves 18,227 17,536
Total deposits and investments $ 206,910 $ 235,804
See Note 9 for disclosures regarding the fiduciary fund investments.

Port of Tacoma 2020 Annual Report Financial Statements Notes 38
The following tables identify the type of investments, concentration of investments in any one issuer, and maturities of the Port investment portfolio (excluding investments held by the Post-Employment Health Care Benefits Trust Fund, see Note 9 for investment detail for the Trust) as of December 31 (dollars in thousands):
2020 Maturities (in years) Percentage of Total
PortfolioInvestment TypeCarrying
ValueLess
than 11–3
More than 3
Certificate of Deposit $ 340 $ 340 $ - $ - 0.2%
Escrow Deposit with US Bank 55 55 - - 0.0%
Federal Farm Credit Bank 2,015 - 2,015 - 1.0%
Federal Home Loan Bank 1,032 - 1,032 - 0.5%
Federal Home Loan Mortgage Corporation
14,009 - 3,003 11,006 6.8%
Federal National Mortgage Association
7,019 2,026 - 4,993 3.4%
Municipal Bonds 41,934 4,303 798 36,833 20.3%
Supranationals 8,017 - 8,017 - 3.9%
United States Treasury Bonds 5,341 - - 5,341 2.5%
State Local Investment Pool* 127,148 127,148 - - 61.4%
Total investments $206,910 $133,872 $ 14,865 $ 58,173 100.0%
Percentage of total portfolio 64.7% 7.2% 28.1% 100.0%
2019 Maturities (in years) Percentage of Total
PortfolioInvestment TypeCarrying
ValueLess
than 11–3
More than 3
Certificate of Deposit $ 335 $ 335 $ - $ - 0.1%
Escrow Deposit with US Bank 55 55 - - 0.0%
Federal Agricultural Mortgage Corporation
2,006 2,006 - - 0.9%
Federal Farm Credit Bank 6,012 - 4,007 2,005 2.5%
Federal Home Loan Bank 5,014 - 5,014 - 2.1%
Federal Home Loan Mortgage Corporation
5,006 2,006 3,000 - 2.1%
Federal National Mortgage Association
3,981 - 3,981 - 1.7%
Municipal Bonds 50,321 6,123 2,225 41,973 21.3%
Supranationals 6,037 6,037 - - 2.6%
United States Treasury Bonds 2,941 2,009 - 932 1.3%
State Local Investment Pool* 154,096 154,096 - - 65.4%
Total investments $235,804 $172,667 $ 18,227 $ 44,910 100.0%
Percentage of total portfolio 73.2% 7.7% 19.1% 100.0%
* Investments in Washington State Local Government Investment Pool. The investments in the pool are valued at amortized cost of the pool shares.

Port of Tacoma 2020 Annual Report Financial Statements Notes 39
The tables below identify the credit risk of the Port’s investment portfolio as of December 31 (dollars in thousands):
2020 Moody’s Equivalent Credit Ratings
Investment Type Fair value A2 A1 Aa3 Aa2 Aa1 Aaa No Rating
Certificate of Deposit $ 340 $ - $ - $ - $ - $ - $ - $ 340
Escrow Deposit with US Bank 55 - - - - - - 55
Federal Farm Credit Bank 2,015 - - - - - 2,015 -
Federal Home Loan Bank 1,032 - - - - - 1,032 -
Federal Home Loan Mortgage Corporation
14,009 - - - - - 14,009 -
Federal National Mortgage Association
7,019 - - - - - 7,019 -
Municipal Bonds 41,934 2,038 563 4,995 12,942 8,295 13,101 -
Supranationals 8,017 - - - - - 8,017 -
United States Treasury Bonds 5,341 - - - - - - 5,341
State Local Investment Pool* 127,148 - - - - - - 127,148
Total $ 206,910 $ 2,038 $ 563 $ 4,995 $12,942 $ 8,295 $ 45,193 $ 132,884
2019 Moody’s Equivalent Credit Ratings
Investment Type Fair value A2 A1 Aa3 Aa2 Aa1 Aaa No Rating
Certificate of Deposit $ 335 $ - $ - $ - $ - $ - $ - $ 335
Escrow Deposit with US Bank 55 - - - - - - 55
Federal Agricultural Mortgage Corporation
2,006 - - - - - - 2,006
Federal Farm Credit Bank 6,012 - - - - - 6,012 -
Federal Home Loan Bank 5,014 - - - - - 5,014 -
Federal Home Loan Mortgage Corporation
5,006 - - - - - 5,006 -
Federal National Mortgage Association
3,981 - - - - - 3,981 -
Municipal Bonds 50,321 - 2,078 10,783 8,161 18,757 10,542 -
Supranationals 6,037 - - - - - 6,037 -
United States Treasury Bonds 2,941 - - - - - 2,941 -
State Local Investment Pool* 154,096 - - - - - - 154,096
Total $ 235,804 $ - $ 2,078 $ 10,783 $ 8,161 $ 18,757 $ 39,533 $ 156,492
* Investments in Washington State Local Government Investment Pool. The investments in the pool are valued at amortized cost of the pool shares.
See Note 16 for fair value measurement disclosures of the Port’s investments.
“ The Port of Tacoma’s major business areas include container shipping terminals, breakbulk and bulk terminals and real estate.”

Port of Tacoma 2020 Annual Report Financial Statements Notes 40
3 NOTEASDF
CAPITAL AND INTANGIBLE ASSETS
The following activity took place in capital and intangible assets during 2020 (dollars in thousands):
2020Beginning
of YearAdditions Transfers
Retirements and Other
End of Year
Capital and intangble assets not being depreciated:
Land $ 567,120 $ - $ 6,798 $ - $ 573,918
Intangible assets 32,264 - - - 32,264
Construction in process 7,313 5,527 (5,167) 154 7,827
Total capital and intangible assets not being depreciated
$ 606,697 $ 5,527 $ 1,631 $ 154 $ 614,009
Capital assets being depreciated:
Buildings $ 102,792 $ - $ 1,085 $ (3,588) $ 100,289
Improvements 683,388 - (5,680) (3,875) 673,833
Machinery and equipment 87,409 - 2,964 (3,750) 86,623
Total capital assets being depreciated
$ 873,589 - $ (1,631) $ (11,213) $ 860,745
Less accumulated depreciation:
Buildings $ (74,485) $ (2,903) $ - $ 3,127 $ (74,261)
Improvements (396,993) (20,932) - 2,691 (415,234)
Machinery and equipment (72,642) (2,954) - 3,674 (71,922)
Total accumulated depreciation
$(544,120) $ (26,789) - $ 9,492 $(561,417)
Net, capital assets being depreciated
$ 329,469 $ (26,789) $ (1,631) $ (1,721) $ 299,328
Net, capital and intangible assets
$ 936,166 $ (21,262) $ - $ (1,567) $ 913,337
The following activity took place in capital and intangible assets during 2019 (dollars in thousands):
2019Beginning
of YearAdditions Transfers
Retirements and Other
End of Year
Capital and intangble assets not being depreciated:
Land $ 568,289 $ - $ - $ (1,169) $ 567,120
Intangible assets 32,264 - - - 32,264
Construction in process 35,338 14,178 (40,692) (1,511) 7,313
Total capital and intangible assets not being depreciated
$ 635,891 $ 14,178 $(40,692) $ (2,680) $ 606,697
Capital assets being depreciated:
Buildings $ 100,658 $ - $ 2,166 $ (32) $ 102,792
Improvements 649,705 - 35,739 (2,056) 683,388
Machinery and equipment 87,960 - 2,787 (3,338) 87,409
Total capital assets being depreciated
$ 838,323 $ - $ 40,692 $ (5,426) $ 873,589
Less accumulated depreciation:
Buildings $ (71,626) $ (2,891) $ - $ 32 $ (74,485)
Improvements (377,520) (20,617) - 1,144 (396,993)
Machinery and equipment (72,633) (3,347) - 3,338 (72,642)
Total accumulated depreciation
$ (521,779) $ (26,855) $ - $ 4,514 $ (544,120)
Net, capital assets being depreciated
$ 316,544 $ (26,855) $ 40,692 $ (912) $ 329,469
Net, capital and intangible assets
$ 952,435 $ (12,677) $ - $ (3,592) $ 936,166

Port of Tacoma 2020 Annual Report Financial Statements Notes 41
4 NOTEASDF
COMMERCIAL PAPER
The Port is authorized to use Subordinate Lien Revenue Notes (commercial paper) in an amount not to exceed $100 million. The Port issues commercial paper to provide interim financing for capital asset projects. The draws are secured by a bank letter of credit that was renewed in March 2019 extending the expiration date to March 15, 2022.
The term of the commercial paper ranges from 1 to 270 days and the interest rate on the amount outstanding at April 8, 2020, was 1.04%. In April 2020, the Port paid down the Commercial Paper balance. At December 31, 2020, there were no advances outstanding. At December 31, 2019, the interest rate was 1.40% for outstanding advances.
The terms in this agreement are consistent with the Port’s publicly issued variable rate bonds and do not contain unusual clauses for additional events of default or termination events different than the Port’s publicly traded bonds and are not subject to acceleration in the event of default.
Commercial paper activity during 2020 and 2019 was as follows (dollars in thousands):
Beginning balance, January 1, 2019 $ 25,000
Advances 125,000
Repayments (125,000)
Balance, December 31, 2019 $ 25,000
Advances 25,000
Repayments (50,000)
Balance, December 31, 2020 $ -
5 NOTEASDF
LONG-TERM DEBT
The Port’s long-term debt activity by type of debt for 2020 and 2019 is presented in the following tables (dollars in thousands):
2020Description and Date of
Issue
Type ****
Original Coupon Rate
Original True Interest Cost
***
Earliest Year of
Call
Last Year of Maturity
December 31, 2019
IssuanceRefundings/Repayments
December 31, 2020
General Obligation Bonds
02/25/16 DB 1.06–2.36% 1.994% * 2025 $ 21,506 $ - $(3,431) $18,075
09/08/16 A Bonds 3.00–5.00% 2.705% 2026 2038 106,155 - - 106,155
09/06/17 Bonds 2.50–3.40% 3.177% 2027 2038 18,670 - (760) 17,910
$ 146,331 $ - $ (4,191) $ 142,140
Net premium 19,042 17,531
Less current portion 4,191 6,578
Total long-term general obligation bonds, net of current portion $ 161,182 $ 153,093
Revenue Bonds
03/07/08 Bonds Variable Rate Variable Rate * 2036 $ 62,230 $ - $ (3,080) $ 59,150
07/15/09** Bonds Variable Rate Variable Rate * 2044 122,180 - - 122,180
06/04/14 A DB 2.50% 2.536% * 2021 4,368 - (4,368) -
10/24/14 B DB 2.55% 2.550% * 2029 26,075 - (26,075) -
09/08/16 A Bonds 4.00–5.00% 2.552% 2026 2034 36,535 - - 36,535
09/08/16 B Bonds 2.00–5.00% 3.642% 2026 2043 101,800 - (630) 101,170
09/30/19 A Bonds 5.00% 1.822% N/A 2031 34,630 - (2,335) 32,295
09/30/19 A Bonds Variable Rate Variable Rate * 2035 38,115 - - 38,115
10/29/20 A DB 1.35% 1.350% * 2029 - 26,075 (2,440) 23,635
$ 425,933 $ 26,075 $ (38,928) $ 413,080
Net premium 32,529 30,091
Less current portion 10,644 8,815
Total long-term revenue bonds, net of current portion $ 447,818 $ 434,356
* Currently callable by the Port but intent is to pay off in accordance with stated maturity dates.
** This bond issue was originally issued as 2008B and, during 2009, the bonds were reissued to secure a better rate. The new bond issue is still referred to as 2008B in all official documents.
*** Original True Interest Cost (TIC) is the rate necessary to discount the amounts payable on the respective principal and interest payment dates to the purchase price received for the new issue of bonds. TIC considers the time value of money and all costs associated with issuing the bonds.
**** Direct Borrowings (DB) are bonds held by banks.

Port of Tacoma 2020 Annual Report Financial Statements Notes 42
2019Description and Date of
Issue
Type ****
Original Coupon Rate
Original True Interest Cost
***
Earliest Year of
Call
Last Year of Maturity
December 31, 2018
IssuanceRefundings/Repayments
December 31, 2019
General Obligation Bonds
02/25/16 DB 1.06–2.36% 1.994% * 2025 $ 24,893 $ - $ (3,387) $ 21,506
09/08/16 A Bonds 3.00–5.00% 2.705% 2026 2038 106,155 - - 106,155
09/06/17 Bonds 2.50–3.40% 3.177% 2027 2038 19,410 - (740) 18,670
$ 150,458 $ - $ (4,127) $ 146,331
Net premium 20,509 19,042
Less current portion 4,127 4,191
Total long-term general obligation bonds, net of current portion $ 166,840 $ 161,182
Revenue Bonds
03/07/08 Bonds Variable Rate Variable Rate * 2036 $65,190 $ - $ (2,960) $ 62,230
07/15/09** Bonds Variable Rate Variable Rate * 2044 122,180 - - 122,180
06/04/14 A DB 2.50% 2.536% * 2021 6,473 - (2,105) 4,368
06/11/14 A DB Variable Rate Variable Rate * 2035 82,120 - (82,120) -
10/24/14 B DB 2.55% 2.550% * 2029 28,455 - (2,380) 26,075
09/08/16 A Bonds 4.00–5.00% 2.552% 2026 2034 36,535 - - 36,535
09/08/16 B Bonds 2.00–5.00% 3.642% 2026 2043 102,405 - (605) 101,800
09/30/19 A Bonds 5.00% 1.822% N/A 2031 - 34,630 - 34,630
09/30/19 A Bonds Variable Rate Variable Rate * 2035 - 40,490 (2,375) 38,115
$ 443,358 $ 75,120 $ (92,545) $ 425,933
Net premium 26,837 32,529
Less current portion 10,425 10,644
Total long-term revenue bonds, net of current portion $ 459,770 $ 447,818
* Currently callable by the Port but intent is to pay off in accordance with stated maturity dates.
** This bond issue was originally issued as 2008B and, during 2009, the bonds were reissued to secure a better rate. The new bond issue is still referred to as 2008B in all official documents.
*** Original True Interest Cost (TIC) is the rate necessary to discount the amounts payable on the respective principal and interest payment dates to the purchase price received for the new issue of bonds. TIC considers the time value of money and all costs associated with issuing the bonds.
**** Direct Borrowings (DB) are bonds held by banks.
General obligation bonds: General obligation bonds are limited tax general obligations of the Port. The Port has outstanding bonds that are publicly issued or bonds that are direct borrowings held by a bank. The Port uses ad valorem tax revenues to pay the general obligation bond principal and the related interest. Ad valorem tax revenues may not be used to pay revenue bond debt. Per Chapter 53.36 RCW, the Port may incur general obligation bond debt up to 0.25% of the assessed value of the taxable property in the Port district without a vote. At December 31, 2020, the assessed value of the taxable property was $137,747,760,000; therefore, total general obligation bond debt allowable without a vote was $344.4 million. The Port’s outstanding non-voted general obligation bond debt as of December 31, 2020, was $142.1 million, resulting in a remaining non-voted general obligation bond capacity of $202.3 million.
Direct borrowing general obligation bonds: The 2016 general obligation bonds with an outstanding balance at December 31, 2020 and 2019, of $18.1 million and $21.5 million, respectively, are refunding bonds held by a bank that expire in 2025. The bonds are fixed-rate bonds with original coupon rates between 1.06% and 2.36%. The bonds are funded by the Port’s tax levy. The terms in the direct borrowing agreement are consistent with the Port’s publicly issued general obligation bonds and contain similar clauses that address significant default and termination events. In addition, the direct borrowing agreement is not subject to acceleration upon an event of default.
Port of Tacoma 2020 Annual Report Financial Statements Notes 43
Revenue bonds: The revenue bonds are secured by a pledge of the Port’s net operating revenues as defined by bond documents. The outstanding revenue bonds are publicly issued or are held by banks through direct borrowings. Revenue bond proceeds finance acquisition, expansion, improvement and equipping Port terminal and industrial development facilities. The Port has pledged future net operating revenues to repay $533.7 million in bond principal and interest through 2044. In 2020, revenue bond principal and interest were $23.4 million and total revenues were $57.8 million, respectively. During 2019, revenue bond principal and interest were $23.0 million and total revenues were $66.9 million. The revenue bonds contain coverage requirements related to maintaining adequate net revenues to support debt service.
Prior to September 30, 2019, the Port had three subordinate lien revenue bonds in the “Index Interest Rate” mode totaling $269.0 million held by commercial banks (direct borrowings). “Mode” refers to how the interest is calculated for the bonds. Of the $269.0 million of subordinate lien revenue bonds, there are $227.1 million that are “matched” to $227.1 million of interest rate swaps, resulting in “fixed rate” bonds at approximately 4%. The remaining $41.9 million are not matched to the swaps (unhedged portion).
The interest paid to the banks from these bonds is exempt from the Alternative Minimum Tax and provide a tax advantage to the banks. Until late 2018, the interest paid by the Port on subordinate lien revenue bonds in the Index Interest Rate mode and the variable interest received by the Port from the interest rate swaps were an exact match.
However, in 2018, changes to the United States tax code resulted in the tax exemption from the interest paid by the Port being less valuable to the banks. As a result, the banks required that the Index Interest Rate mode agreements be adjusted/renewed such that the interest paid to the banks was more than the interest received from the swap partners.
To reduce the interest rate mismatch between the interest rate swaps and the interest paid on the bonds, in September 2019, the Port refunded all $82.1 million of the 2014A subordinate lien direct borrowings held by the bank by issuing $40.5 million of variable rate demand obligations in Weekly Interest Rate mode and refunding $41.6 million, including bond premiums, into fixed-rate bonds. The Port also changed the mode on the 2008 and 2009 subordinate lien bonds from Index Interest Rate mode to publicly traded Weekly Interest Rate mode. The refunding bonds are described in more detail below:
The fixed rate refunding bonds issued were Senior Lien Revenue Bonds (AMT) with a par value of $34,630,000, a premium of $7,146,000, and an interest rate of 5%. After paying issuance costs of $334,000, the net proceeds were $41,442,000. As a result of the partial refunding of the 2014A Subordinate Lien Revenue Bonds, the Port reduced its total debt service requirements by $1,851,000, which accumulates into an estimated economic gain (difference between the present value of the debt service payments on the old and new debt) of $969,000 over the life of the bonds.
The variable interest rate refunding bonds issued were Subordinate Lien Revenue Bonds (AMT) with
a par value of $40,490,000, with variable interest rates. After paying issuance costs of $106,000 out of current funds, the net proceeds were $40,490,000. As a result of the partial refunding of the 2014A Subordinate Lien Revenue Bonds into the Weekly Interest Rate mode, the Port reduced its total debt service requirements by $1,468,000, which accumulates into an estimated economic gain (difference between the present value of the debt service payments on the old and new debt) of $1,113,000 over the life of the bonds.
The refunding of the 2014A bonds with the fixed and variable bonds met the requirements for an in-substance debt defeasance and $82,120,000 of the Series 2014A Subordinate Lien Revenue Bonds were removed from the Port’s financial statements.
In September 2019, the Port also changed the mode on the 2008 and 2009 subordinate lien bonds from Index Interest Rate mode to publicly traded Weekly Interest Rate Mode. The mode change converted these bonds to publicly issued variable rate demand bonds from variable rate direct borrowings held by banks.
Revenue bond direct borrowings: The Port began the year with two direct borrowing agreements with banks for the Port’s fixed rate bonds. The Port had a direct borrowing agreement with a bank for the 2014A fixed-rate revenue bonds that was set to expire in December 2021 which the Port paid off early during 2020.
In October 2020, the Port issued Revenue Bonds par value $26,075,000 with a coupon rate of 1.35% via direct borrowings with a bank to refund 2014B Revenue Bonds par value of $26,075,000 with a coupon rate of 2.55%.

Port of Tacoma 2020 Annual Report Financial Statements Notes 44
The newly issued Revenue Bonds were issued at par and the net proceeds were $26,075,000. The net proceeds from the issuance of the Revenue Bonds were used to call the old debt in the amount of $26,075,000. Bond issue costs associated with the refunding were $38,000 and paid from Port cash. The refunding met the requirements of an in-substance debt defeasance and the Series 2014B Revenue Bonds were removed from the Port’s financial statements. The terms in these direct borrowing agreements are consistent with the Port’s publicly issued variable-rate bonds and contain similar clauses that address events of default and termination events. In addition, the direct borrowing agreements are not subject to acceleration in the event of default.
As a result of the refunding of the 2014B Revenue Bonds, the Port reduced its total debt service requirements by $1,431,000 which accumulates into an economic gain (difference between the present value of the debt service payments on the old and new debt) of $1,331,000 over the life of the bonds.
Variable-rate servicing agreements: The Port entered into reimbursement agreements with banks to provide Letter of Credit support on its variable-rate bonds. The reimbursement agreements have terms that are between three and two and a half years.
The Port’s existing swap contracts and the outstanding notional amounts at December 31, 2020, are detailed as follows. No cash was paid from the Port to the counterparty when the swaps were created (dollars in thousands):
SWAP Reference
TypeNotional Amount
Notional Amount
Options Start DateEffective
DateMaturity
DateTerms
2Pay-fixed interest
rate swap$ 30,000 $ 20,981 None 9/25/08 9/25/08 12/1/36
Pay 3.320%, receive 70% of LIBOR (1)
3Pay-fixed interest
rate swap 80,000 66,610 None 9/20/07 7/28/11 12/1/40
Pay 4.155%, receive 70% of LIBOR (1)
4Pay-fixed interest
rate swap 130,000 109,580 None 9/20/07 7/26/12 12/1/41
Pay 4.200%, receive 70% of LIBOR (1)
5Pay-fixed interest
rate swap20,000 17,040 None 9/20/07 7/25/13 12/1/42
Pay 4.229%, receive 70% of LIBOR (1)
$ 260,000 $ 214,211
(1) One-month London Interbank Offered Rate.
The following table reflects the outstanding variable-rate debt that is matched to outstanding swap agreements (dollars in thousands):
Variable-Rate DebtOutstanding Principal December 31, 2020
Outstanding Principal December 31, 2019
2008 $ 59,150 $ 62,230
2008B 122,180 122,180
2019A 38,115 38,115
Unhedged debt (5,234) (1,495)
$ 214,211 $ 221,030
Interest rate payment agreements (swaps): The Port entered into four swaps so that it may mitigate interest rate risk associated with the Port’s variable-rate debt. The swaps synthetically fix or “lock-in” interest rates on variable revenue bond debt by requiring the Port to pay a fixed
interest rate on the nominal value of the swap and receive variable interest rate cash flows that are intended to offset the variable-rate bond payments, leaving the Port with the fixed payments identified in each swap agreement.

Port of Tacoma 2020 Annual Report Financial Statements Notes 45
“ As a result of the refunding of the 2014B Revenue Bonds, the Port reduced its total debt service requirements by $1,431,000.”
The following summarizes the change in fair value of the Port’s pay-fixed, receive variable interest rate payment agreements at December 31, 2020 (dollars in thousands):
SWAP Reference2020 Changes in Fair Value Fair Value at 12/31/20 Original Notional
AmountClassification Amount Classification Amount
2 Deferred outflow $ (1,109) Debt $ (5,051) $30,000
3 Deferred outflow (4,551) Debt (25,031) 80,000
4 Deferred outflow (7,936) Debt (43,438) 130,000
5 Deferred outflow (1,281) Debt (7,074) 20,000
$ (14,877) $ (80,594) $260,000
Swap Reference 1 was terminated in 2016.
The following summarizes the change in fair value of the Port’s pay-fixed, receive variable interest rate payment agreements at December 31, 2019 (dollars in thousands):
SWAP Reference2019 Changes in Fair Value Fair Value at 12/31/19 Original Notional
AmountClassification Amount Classification Amount
2 Deferred outflow $ (3,737) Debt $ (3,942) $ 30,000
3 Deferred outflow (6,565) Debt (20,480) 80,000
4 Deferred outflow (2,414) Debt (35,502) 130,000
5 Deferred outflow (1,257) Debt (5,793) 20,000
$ (13,973) $ (65,717) $ 260,000
Swap Reference 1 was terminated in 2016.

Port of Tacoma 2020 Annual Report Financial Statements Notes 46
RISKS: The Port mitigates swap-related risk by following its Payment Agreement Guidelines. These guidelines are published in the Port’s Annual Budget document within its Debt Guidelines. The guidelines manage each of the risks below:
Counterparty or credit risk: The Port’s derivative instruments are held by three separate counterparties. By agreement, the Port requires posting of collateral when the counterparty owes to the Port on the swap termination value (market value). The credit ratings for each of the counterparties are as follows (dollars in thousands):
SWAP Reference Notional Amount Bank CounterpartyCredit Worthiness
Termination ValueMoody's S&P
2 $ 30,000 Goldman Sachs A1 A+ $ (5,051)
3 80,000 Dexia Baa3 BBB (25,031)
4 130,000 Dexia Baa3 BBB (43,438)
5 20,000 Merrill Lynch A2 A- (7,074)
$ 260,000 $ (80,594)
Swap Reference 1 was terminated in 2016.
Termination risk: The Port or its counterparties may terminate a derivative instrument if the other party fails to perform under the terms of the contract. If the swap counterparty’s credit rating deteriorates below A3/A- (Moody’s/Standard & Poor’s), the Port may terminate the swap at market value; however, the Port may, at its option, continue in the swap. The Port requires the posting of collateral and works with financially strong counterparties to help mitigate this risk.
Basis risk: The Port pays a daily interest rate to its bondholders and receives 70% of one-month LIBOR from its swap counterparties. In exchange for the fixed swap rates associated with using the LIBOR index, the Port bears the risk that it could incur a shortfall between the variable rate paid on the bonds and the variable rate received on the swaps.
Rollover risk: The Port matched the term of its existing swap contracts to the term of the underlying debt so that it minimizes its exposure to rollover risk.
Foreign currency risk: The Port’s derivative instruments are denominated in U.S. dollars.
Contingencies: If the Port’s credit rating falls below A3/A- (Moody’s/Standard & Poor’s) for the swap with Goldman Sachs or below Baa2/BBB (Moody’s/Standard & Poor’s) for the other swaps, the Port bears the risk that its counterparties may terminate the agreement. The Port is prohibited by RCW 39.96 from posting collateral. The Port’s subordinate lien credit rating is A1/A+ (Moody’s/Standard & Poor’s) at December 31, 2020.

Port of Tacoma 2020 Annual Report Financial Statements Notes 47
Debt service for fixed- and variable-rate bonds estimated future payments: The debt service requirements for fixed-rate general obligation, revenue bonds and the debt service requirements for the 2008 Subordinate-Lien Variable Rate Revenue Bonds, 2008B Subordinate-Lien Variable Rate Revenue Bonds, 2019A Subordinate-Lien Variable Rate Revenue Bonds and active swaps outstanding as of December 31, 2020, are as follows (dollars in thousands):
Years ending December 31
Fixed-Rate Bonds Variable-Rate BondsTotal
Principal Interest Total Principal Interest Interest Rate Swap, Net (1)2021 $ 12,188 $ 14,498 $ 26,686 $ 3,205 $ 227 $ 8,473 $ 11,905
2022 14,690 14,116 28,806 3,330 224 8,195 11,749
2023 15,211 13,630 28,841 3,465 220 7,905 11,590
2024 15,753 13,112 28,865 3,605 216 7,604 11,425
2025 16,348 12,546 28,894 3,750 212 7,290 11,252
2026–2030 87,660 52,596 140,256 21,115 998 31,288 53,401
2031–2035 71,275 33,745 105,020 58,795 764 21,319 80,878
2036–2040 68,795 17,307 86,102 - 550 9,525 10,075
2041–2045 33,855 3,370 37,225 122,180 440 444 123,064
$ 335,775 $ 174,920 $ 510,695 $ 219,445 $ 3,851 $ 102,043 $ 325,339
(1) This amount represents the cash that is due to the counterparty based on the terms of the pay-fixed interest rate swap. The amounts for the subsequent years are based on the assumption that interest rate conditions that existed during 2020 will remain the same over the term of the derivative contracts.
The fixed and variable debt obligations estimated future payments separated by direct borrowings as of December 31, 2020, are as follows (dollars in thousands):
Years ending December 31
Governmental Activities Business Activities Interest Rate SwapsGO Bonds Direct Borrowing Revenue Bonds Revenue Direct
Borrowing
Principal Interest Principal Interest Principal Interest Principal InterestSwap, Net
(1)
2021 $ 3,095 $ 5,416 $ 3,483 $ 369 $ 6,310 $ 8,621 $ 2,505 $ 319 $ 8,473
2022 3,235 5,281 3,540 311 8,675 8,462 2,570 285 8,195
2023 3,350 5,163 3,606 246 9,085 8,191 2,635 251 7,905
2024 3,495 5,014 3,683 171 9,480 7,928 2,700 215 7,604
2025 3,645 4,860 3,763 89 9,920 7,630 2,770 179 7,290
2026–2030 41,505 19,991 - - 56,815 33,272 10,455 331 31,288
2031–2035 43,435 9,498 - - 86,635 25,011 - - 21,319
2036–2040 22,305 1,761 - - 46,490 16,096 - - 9,525
2041–2045 - - - - 156,035 3,810 - - 444
$ 124,065 $ 56,984 $ 18,075 $ 1,186 $ 389,445 $ 119,021 $ 23,635 $ 1,580 $ 102,043
(1) This amount represents the cash that is due to the counterparty based on the terms of the pay-fixed interest rate swap. The amounts for the subsequent years are based on the assumption that interest rate conditions that existed during 2020 will remain the same over the term of the derivative contracts.
The paying agent for the Port’s bonded debt is:
U.S. Bank Fiscal Agencies - 7 East 101 Barclay Street New York, NY 10286
6 NOTEASDF
RISK MANAGEMENT
The Port is exposed to various risks of loss related to torts; damage to, theft of, and destruction of assets or cargo; natural disasters; and employee injuries. To limit its exposure, the Port purchases a variety of insurance policies. For general liability, the Port purchases $150 million in coverage, subject to a $25,000 deductible. All risk property insurance is purchased on a replacement value basis for most properties, subject to a limit of $500 million and a per occurrence deductible of $250,000. For flood losses a sub-limit of $75 million applies and a per occurrence deductible of $100,000 to $250,000 for all flood zones. For earthquake and business interruption losses, sub-limits of $100 million apply. Insurance coverage for earthquake is subject to a deductible defined as 5% of the value of the damaged property, with a minimum of $100,000.
Except for losses which may arise from employee injuries, earthquakes and/or floods, no deductible exceeds $250,000. The self-insured retention for workers’ compensation coverage is $1,250,000.
Insurance coverage for the past three years has been sufficient to cover all claim settlements.
The Port is self-insured for its regular medical coverage. The liability for unpaid medical claims

Port of Tacoma 2020 Annual Report Financial Statements Notes 48
is included in payroll and taxes payable on the accompanying statements of net position and is expected to be paid in 2021. Excess loss coverage has been purchased through an outside provider to limit individual loss to $135,000. Self-insured claim activity for December 31, were as follows (dollars in thousands):
2020 2019 2018
Claims liability, beginning of year
$ 1,855 $ 1,645 $ 1,030
Claims reserve 5,879 5,684 5,441
Payments on claims (5,785) (5,474) (4,826)
Claims liability, end of year
$ 1,949 $ 1,855 $ 1,645
The Port maintains a self-insurance program for workers’ compensation. The estimated liability for workers’ compensation is included in payroll and taxes payable on the accompanying statements of net position. At December 31, 2020, the estimated self-insurance liability for workers’ compensation was $333,000 and this amount is expected to be paid in 2021. The liability for unpaid claims represents the estimated future indemnity, medical, rehabilitation and legal costs for all open claims.
Workers’ compensation claim activity for December 31, were as follows (dollars in thousands):
2020 2019 2018
Claims liability, beginning of year
$ 578 $ 458 $ 447
Claims incurred during the year
251 238 189
Changes in estimate for prior year claims
179 447 510
Payments on claims (675) (565) (688)
Claims liability, end of year
$ 333 $ 578 $ 458
7 NOTEASDF
LESSOR AND LESSEE ACTIVITIES
The Port leases land, office space and other equipment under operating leases that expire through 2037. Minimum future lease payments under non-cancelable operating leases are as follows (dollars in thousands):
Years ending December 31
2021 $ 302
2022 294
2023 293
2024 293
2025 14
Thereafter 156
Total minimum payments $ 1,352
Total rent expense for the years ended December 31, 2020 and 2019, was $318,000 and $144,000, respectively.
The Port, as a lessor, leases land and facilities under terms of 1 to 50 years. In addition, some properties are rented on a month-to-month basis. Minimum future rental revenue under
noncancelable operating leases and subleases are as follows (dollars in thousands). Leases for NWSA licensed properties are reported by NWSA and not included here.
Years ending December 31
2021 $ 17,812
2022 16,122
2023 15,167
2024 14,425
2025 13,708
Thereafter 321,911
Total minimum future rents $ 399,145
Assets held for rental and leasing purposes as of December 31, 2020, are as follows (dollars in thousands):
Land $ 277,506
Buildings, improvements and equipment, net 49,558
Total, net of accumulated depreciation $ 327,064

Port of Tacoma 2020 Annual Report Financial Statements Notes 49
8 NOTEASDF
PENSION PLANS
Pension plan: The Port’s full-time and qualifying part-time employees participate in one of the statewide local government retirement systems administered by the Washington State Department of Retirement Systems, under cost-sharing, multiple-employer public employee defined benefit retirement plans.
Historical trend and other information regarding each plan are presented in the Washington State Department of Retirement Systems comprehensive annual financial report. A copy of this report may be obtained at:
Department of Retirement Systems Communications Unit P. O. Box 48380 Olympia, WA 98504-8380 Internet Address: www.drs.wa.gov
Plan description and benefits: PERS was established in 1947, and its retirement benefit provisions are contained in chapters 41.34 and 41.40 RCW. PERS is a cost-sharing, multiple-employer retirement system composed of three separate pension plans for membership purposes. PERS Plan 1 and PERS Plan 2 are defined benefit plans, and PERS Plan 3 is a defined benefit plan with a defined contribution component.
PERS members include elected officials; state employees; employees of the Supreme, Appeals and Superior Courts; employees of the Legislature; employees of district and municipal courts; employees of local governments; and higher
education employees not participating in higher education retirement programs.
PERS is composed of and reported as three separate plans for accounting purposes: Plan 1, Plan 2/3 and Plan 3. Plan 1 accounts for the defined benefits of Plan 1 members. Plan 2/3 accounts for the defined benefits of Plan 2 members and the defined benefit portion of benefits for Plan 3 members. Plan 3 accounts for the defined contribution portion of benefits for Plan 3 members.
Although members can only be a member of either Plan 2 or Plan 3, the defined benefits of Plan 2 and Plan 3 are accounted for in the same pension trust fund. All assets of Plan 2/3 may legally be used to pay the defined benefits of any of the Plan 2 or Plan 3 members or beneficiaries, as the terms of the plans define. Therefore, Plan 2/3 is considered a single plan for accounting purposes.
As of June 30, 2020, 269 employers and 831 non-employer contributing entities were participating in PERS Plan 1. The plan is closed to new entrants. PERS 1 members were vested after the completion of five years of eligible service. PERS Plan 1 provides retirement, disability and death benefits. Retirement benefits are calculated using 2% of the member’s Average Final Compensation (AFC) times the member’s years of service. AFC is the average of the member’s 24 consecutive highest-paid service credit months. Members are eligible for retirement from active status at any age with at least 30 years of service, at age 55 with at least 25 years of service, or at age 60 with at least five years of service.
PERS Plan 1 retirement benefits are actuarially reduced to reflect the choice of a survivor benefit. Members retiring from inactive status before the age of 65 may also receive actuarially reduced benefits.
Other benefits include duty and nonduty disability payments, an optional Cost-of-Living Adjustment (COLA), and a one-time, duty-related death benefit, if found eligible by the Washington State Department of Labor & Industries.
The PERS Plan 1 member contribution rate is established by statute at 6%. The employer contribution rate is developed by the Office of the State Actuary (OSA) and includes an administrative expense component that is currently set at 0.18%.
PERS Plan 2 members are vested after completing five years of eligible service. Plan 3 members are vested in the defined benefit portion of their plan after 10 years of service or after five years of service if 12 months of that service are earned after age 44. PERS Plan 2/3 provides retirement, disability and death benefits. Retirement benefits for Plan 2 are calculated using 2% of the member’s AFC times the member’s years of service. Retirement defined benefits for Plan 3 are calculated using 1% of AFC times the member’s years of service. AFC is the monthly average of the member’s 60 consecutive highest-paid service credit months. PERS Plan 2/3 has no cap on years of service credit.
Members are eligible for retirement with a full benefit at age 65 with at least five years of service credit. Retirement before age 65 is considered an early retirement. PERS Plan 2/3 members who have

Port of Tacoma 2020 Annual Report Financial Statements Notes 50
at least 20 years of service credit and are 55 years of age or older are eligible for early retirement with a reduced benefit. The benefit is reduced by a factor that varies according to age for each year before age 65. PERS Plan 2/3 retirement benefits are actuarially reduced to reflect the choice of a survivor benefit. Other PERS Plan 2/3 benefits include duty and nonduty disability payments; a COLA based on the Consumer Price Index, capped at 3% annually; and a one-time, duty-related death benefit, if found eligible by the Washington State Department of Labor & Industries.
The PERS Plan 2/3 employer and employee contribution rates are developed by the OSA to fully fund Plan 2 and the defined benefit portion of Plan 3. The Plan 2/3 employer rates include a component to address the PERS Plan 1 unfunded actuarial accrued liability, currently set at 5.31%, and an administrative expense that is currently set at 0.18%.
PERS Plan 3 members are immediately vested in the defined contribution portion of their plan. PERS Plan 3 defined contribution benefits are totally dependent on employee contributions and investment earnings on those contributions. PERS Plan 3 members choose their contribution rate when joining membership and can change rates only when changing employers. As established by chapter 41.34 RCW, Plan 3 defined contribution rates are set at a minimum of 5% and a maximum of 15%; members have six rate options to choose from. Employers do not contribute to the defined contribution benefits.
Contributions: The required contribution rates, expressed as a percentage of covered payrolls, as of December 31, were:
2020 PERS Plan 1 PERS Plan 2 PERS Plan 3
Employer* 12.86% 12.86% 12.86%**
Employee 6.00% 7.90% ***
2019 PERS Plan 1 PERS Plan 2 PERS Plan 3
Employer* 12.83% 12.83% 12.83%**
Employee 6.00% 7.41% ***
* The employer rates include the employer administrative expense fee of 0.18% for 2020 and 2019
** Plan 3 defined benefit portion only
*** Rate selected by PERS 3 members, 5% minimum to 15% maximum
The Port made contributions of $1,057,000 to PERS 1 and $1,746,000 to PERS 2/3 during 2020 and $1,108,000 to PERS 1 and $1,770,000 to PERS 2/3 during 2019, and the employees made the required contributions. The Port’s required contributions for the years ended December 31 are as follows (dollars in thousands):
Year PERS Plan 1 PERS Plan 2/3 Total
2020 $ 1,012 $ 1,684 $ 2,696
2019 $ 1,189 $ 1,789 $ 2,978
Pension liabilities, pension expense, and deferred inflows and outflows of resources related to pensions: At December 31, 2020 and 2019, the Port reported a liability of $7.5 million and $8.2 million, respectively, for its proportionate share of the net pension liability. The Port’s proportion of the net pension liability was based on a projection of the Port’s long-term share of contributions to the pension plan relative to the projected contributions of all participating agencies, actuarially determined. At June 30, 2020, the Port’s proportionate share of net pension liability and the change in proportionate share from June 30, 2019, are presented in the following tables (dollars in thousands):
PERS 1 PERS 2/3 Total
Port’s proportionate share of the net pension liability:
2020 $ 5,124 $ 2,417 $ 7,541
2019 $ 6,172 $ 2,004 $ 8,176
Port’s proportionate share of the net pension liability:
2020 0.1451% 0.1890%
2019 0.1605% 0.2063%
Change in proportionate share
0.0001% 0.0021%
Port’s proportionate share of the net pension liability:
2020 $ (1,477) $ (1,826) $ (3,303)
2019 $ (784) $ (1,457) $ (2,241)

Port of Tacoma 2020 Annual Report Financial Statements Notes 51
At December 31, 2020 and 2019, the Port reported deferred outflows of resources and deferred inflows of resources related to pensions from the following sources (dollars in thousands):
2020 PERS 1 PERS 2/3 Total
Sources of deferred outflow of resources:Net difference between projected and actual earnings on pension plan investments (2) $ - $ - $ -Changes in assumptions (1) - 34 34 Differences between expected and actual experience (1) - 865 865 Changes in proportionate differences between Port contributions and proportionate share of contributions (1)
- 92 92
Port contributions subsequent to measurement date 538 882 1,420 Total $ 538 $ 1,873 $ 2,411
Sources of deferred inflow of resources:Net difference between projected and actual earnings on pension plan investments (2) $ (29) $ (122) $ (151) Changes in assumptions (1) - (1,651) (1,651) Differences between expected and actual experience (1) - (303) (303) Changes in proportionate differences between Port contributions and proportionate share of contributions (1)
- (1,232) (1,232)
Total $ (29) $ (3,308) $ (3,337)
2019 PERS 1 PERS 2/3 Total
Sources of deferred outflow of resources:Net difference between projected and actual earnings on pension plan investments (2) $ - $ - $ -Changes in assumptions (1) - 51 51 Differences between expected and actual experience (1) - 574 574 Changes in proportionate differences between Port contributions and proportionate share of contributions (1)
- 58 58
Port contributions subsequent to measurement date 493 821 1,314 Total $ 493 $ 1,504 $ 1,997
Sources of deferred inflow of resources:Net difference between projected and actual earnings on pension plan investments (2) $ (412) $ (2,916) $ (3,328) Changes in assumptions (1) - (841) (841) Differences between expected and actual experience (1) - (431) (431) Changes in proportionate differences between Port contributions and proportionate share of contributions (1)
- (990) (990)
Total $ (412) $ (5,178) $ (5,590)
(1) The recognition period for each plan is equal to the average of the expected remaining service lives of all employees provided with pensions through the pension plan, which was determined at the beginning of the measurement date.
(2) The recognition period is a closed, five-year period for all plans.
As of December 31, 2020, deferred outflows of resources related to pensions resulting from the Port’s contributions subsequent to the measurement date were $1.4 million and will be recognized as a reduction of the net pension liability in the year ending December 31, 2021. Other amounts reported as deferred outflows of resources and deferred inflows of resources related to pensions will be recognized in pension expense as follows (dollars in thousands):
Years ending December 31
PERS Plan 1 PERS Plan 2/3 Total
2021 $ (129) $ (1,261) $ (1,390)
2022 (4) (498) (502)
2023 40 (215) (175)
2024 64 12 76
2025 - (168) (168)
Thereafter - (187) (187)
Total $ (29) $ (2,317) $ (2,346)
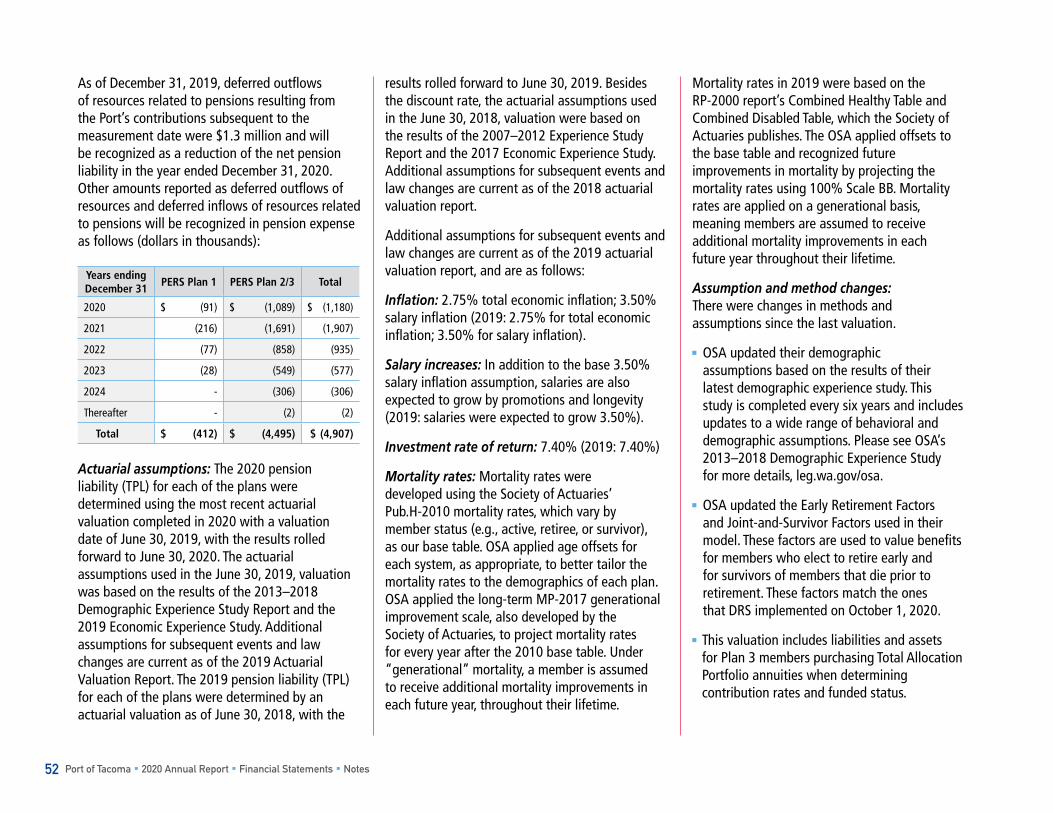
Port of Tacoma 2020 Annual Report Financial Statements Notes 52
As of December 31, 2019, deferred outflows of resources related to pensions resulting from the Port’s contributions subsequent to the measurement date were $1.3 million and will be recognized as a reduction of the net pension liability in the year ended December 31, 2020. Other amounts reported as deferred outflows of resources and deferred inflows of resources related to pensions will be recognized in pension expense as follows (dollars in thousands):
Years ending December 31
PERS Plan 1 PERS Plan 2/3 Total
2020 $ (91) $ (1,089) $ (1,180)
2021 (216) (1,691) (1,907)
2022 (77) (858) (935)
2023 (28) (549) (577)
2024 - (306) (306)
Thereafter - (2) (2)
Total $ (412) $ (4,495) $ (4,907)
Actuarial assumptions: The 2020 pension liability (TPL) for each of the plans were determined using the most recent actuarial valuation completed in 2020 with a valuation date of June 30, 2019, with the results rolled forward to June 30, 2020. The actuarial assumptions used in the June 30, 2019, valuation was based on the results of the 2013–2018 Demographic Experience Study Report and the 2019 Economic Experience Study. Additional assumptions for subsequent events and law changes are current as of the 2019 Actuarial Valuation Report. The 2019 pension liability (TPL) for each of the plans were determined by an actuarial valuation as of June 30, 2018, with the
results rolled forward to June 30, 2019. Besides the discount rate, the actuarial assumptions used in the June 30, 2018, valuation were based on the results of the 2007–2012 Experience Study Report and the 2017 Economic Experience Study. Additional assumptions for subsequent events and law changes are current as of the 2018 actuarial valuation report.
Additional assumptions for subsequent events and law changes are current as of the 2019 actuarial valuation report, and are as follows:
Inflation: 2.75% total economic inflation; 3.50% salary inflation (2019: 2.75% for total economic inflation; 3.50% for salary inflation).
Salary increases: In addition to the base 3.50% salary inflation assumption, salaries are also expected to grow by promotions and longevity (2019: salaries were expected to grow 3.50%).
Investment rate of return: 7.40% (2019: 7.40%)
Mortality rates: Mortality rates were developed using the Society of Actuaries’ Pub.H-2010 mortality rates, which vary by member status (e.g., active, retiree, or survivor), as our base table. OSA applied age offsets for each system, as appropriate, to better tailor the mortality rates to the demographics of each plan. OSA applied the long-term MP-2017 generational improvement scale, also developed by the Society of Actuaries, to project mortality rates for every year after the 2010 base table. Under “generational” mortality, a member is assumed to receive additional mortality improvements in each future year, throughout their lifetime.
Mortality rates in 2019 were based on the RP-2000 report’s Combined Healthy Table and Combined Disabled Table, which the Society of Actuaries publishes. The OSA applied offsets to the base table and recognized future improvements in mortality by projecting the mortality rates using 100% Scale BB. Mortality rates are applied on a generational basis, meaning members are assumed to receive additional mortality improvements in each future year throughout their lifetime.
Assumption and method changes: There were changes in methods and assumptions since the last valuation.
OSA updated their demographic assumptions based on the results of their latest demographic experience study. This study is completed every six years and includes updates to a wide range of behavioral and demographic assumptions. Please see OSA’s 2013–2018 Demographic Experience Study for more details, leg.wa.gov/osa.
OSA updated the Early Retirement Factors and Joint-and-Survivor Factors used in their model. These factors are used to value benefits for members who elect to retire early and for survivors of members that die prior to retirement. These factors match the ones that DRS implemented on October 1, 2020.
This valuation includes liabilities and assets for Plan 3 members purchasing Total Allocation Portfolio annuities when determining contribution rates and funded status.

Port of Tacoma 2020 Annual Report Financial Statements Notes 53
OSA simplified their modeling of medical premium reimbursements for survivors of duty-related deaths in LEOFF 2 and WSPRS (WSPRS is excluded from this publication).
Discount rate: The discount rate used to measure the total pension liability was 7.40% for all plans (2019: 7.40%). To determine that rate, an asset sufficiency test was completed to test whether each pension plan’s fiduciary net position was sufficient to make all projected future benefit payments for current plan members. Based on the assumptions described in OSA’s certification letter within the DRS CAFR, the pension plan’s fiduciary net position was projected to be available to make all projected future benefit payments of current plan members. Therefore, the long-term expected rate of return of 7.40% was used to determine the total liability.
Sensitivity net pension liability to changes in the discount rate: The table below presents the net pension liability of employers, calculated using the discount rate of 7.40% as well as what employers’ net pension liability would be if it were calculated using a discount rate 1 percentage point lower (6.40%) or 1 percentage point higher (8.40%) than the current rate (dollars in thousands):
Pension Trust 1% Decrease Discount Rate 1% Increase
December 31, 2020:
Discount rate 6.40% 7.40% 8.40%
Proportionate share of net pension liability PERS 1 $ 6,418 $ 5,124 $ 3,995
Proportionate share of net pension liability/(asset) PERS 2/3 $ 15,038 $ 2,417 $ (7,977)
December 31, 2019:
Discount rate 6.40% 7.40% 8.40%
Proportionate share of net pension liability PERS 1 $ 7,729 $ 6,172 $ 4,821
Proportionate share of net pension liability/(asset) PERS 2/3 $ 15,368 $ 2,004 $ (8,963)
Long-term expected rate of return: The OSA selected a 7.40% long-term expected rate of return on pension plan investments using a building-block method (2019: 7.4% long-term expected rate of return). In selecting this assumption, OSA reviewed the historical experience data, considered the historical conditions that produced past annual investment returns, and considered Capital Market Assumptions (CMA) and simulated expected investment returns the Workplace Safety & Insurance Board (WSIB) provided.
The CMAs contain three pieces of information for each class of assets WSIB currently invests in:
The CMAs contain three pieces of information for each class of assets WSIB currently invests in: Expected annual return Standard deviation of the annual return Correlations between the annual returns of each asset class with every other asset class
The WSIB uses the CMAs and their target asset allocation to simulate future investment returns over various future time horizons.

Port of Tacoma 2020 Annual Report Financial Statements Notes 54
Estimated rates of return by asset class: Best estimates of arithmetic real rates of return for each major asset class included in the pension plan’s target asset allocation as of June 30, 2020 and 2019, is summarized in the tables below. The inflation component used to create the table is 2.20% for June 30, 2020 and 2019, and represents WSIB’s most recent long-term estimate of broad economic inflation.
Asset ClassTarget
Allocation% Long-Term Expected Real Rate of Return Arithmetic
Fixed income 20% 2.20%
Tangible assets 7% 5.10%
Real estate 18% 5.80%
Global equity 32% 6.30%
Private equity 23% 9.30%
100%
Detailed information about the pension plan’s fiduciary net position is available in the separately issued DRS financial reports. Additional actuarial and pension plan information is included in the DRS 2019 Comprehensive Annual Financial Report, including descriptions of actuarial data, assumptions, methods, and plan provisions relied on for the preparation of GASB No. 67 and GASB No. 68. Additional details regarding this information are included in OSA’s 2018 Actuarial Valuation Report on the OSA website leg.wa.gov/osa.
9NOTEASDF
POST-EMPLOYMENT HEALTH CARE BENEFITS TRUST FUND
The Port provides major medical coverage for eligible retired employees through the Plan. The Plan is administered through the Port of Tacoma’s self-insured medical plan. The Port established the Trust to be used solely for the cost of medical coverage for eligible Plan participants and for payment of the cost of administering the Trust. The Port is the sole administrator and fiduciary of the Trust. Management and funding of the Trust is the responsibility of the Port Treasurer. The Port shall have the right at any time, and from time to time, to modify, alter or amend the Plan in whole or in part effective as of a specified date, pursuant to the laws of the State of Washington.
The Plan’s audited financial statements for December 31, 2020 and 2019, may be found on page 29 of this report.
Plan description: The Plan provides major medical coverage, subject to a deductible, and a maximum benefit limit of $2,000,000 per person for eligible retired employees and qualified dependent spouses. Retirees and their spouses are eligible for Port-paid, post-employment medical benefits upon attainment of age 60 through the age of 69, provided they have completed a minimum of 15 years of service and are eligible to retire under PERS. Employees retiring before the age of 60 are eligible for Port-paid, post-employment medical benefits for up to 10 years, provided they have completed 20 years of service and are eligible to retire under PERS. The Plan is closed to employees hired on or after March 15, 2007. The Plan does not require employee or retiree contributions.
There are 10 active members, 14 inactive members and zero inactive members entitled to, but not yet receiving, benefits in the Plan.
The Port will fund the Plan as necessary (on a pay-as-you go basis) to enable the Plan to pay vested accrued benefits to participants as they become due. However, the Trust was fully funded at its inception and it has not needed additional contributions from the Port.
Summary of accounting policies: The financial statements are prepared using the accrual basis of accounting. Medical benefits that are in accordance with the Plan are recognized when due. Contributions to the Plan, if required, will be recognized in the period that the contributions are made.
The Plan is administered through a qualifying trust per paragraph 4, item (b), of GASB No. 75, Accounting and Financial Reporting for Post-Employment Benefits Other Than Pensions. An actuarial valuation was completed in January 2021 with results based on the December 31, 2020, actuarial valuation date with a measurement date and reporting date of December 31, 2020. For the prior year, the actuarial valuation was completed in January 2020 with results based on the December 31, 2019, actuarial valuation date with a measurement date and reporting date of December 31, 2019.
Rate of return: The long-term expected rate of return on OPEB plan investments was decreased from 3.26% at December 31, 2019, to 1.93% in December 31, 2020 (the December 31, 2020, Municipal Bond 20-Year High Grade Rate Index), to better reflect future expectation.

Port of Tacoma 2020 Annual Report Financial Statements Notes 55
The changes in net OPEB asset were as follows at December 31, 2020 (dollars in thousands):
Total OPEB Liability (a)
Plan Net Position (b)
Net OPEB (Asset) Liability (a–b)
Beginning balance, December 31, 2019 $ 2,851 $ 4,930 $ (2,079)
Service cost 60 - 60
Interest 93 - 93
Changes in benefit terms - - -
Differences between expected and actual experience (46) - (46)
Changes of assumptions 213 - 213
Benefit payments (141) (141) -
Contributions—employer - - -
Net investment income - 168 (168)
Administrative expense - (13) 13
Net changes 179 14 165
Ending balance, December 31, 2020 $ 3,030 $ 4,944 $ (1,914)
OPEB expense for December 31, 2020, is as follows (dollars in thousands):
Service cost $ 60
Interest 93
Net investment income (94)
Administrative expense 13
Deferred (inflows) outflows of resources:
Differences between expected and actual experience
(403)
Net difference between projected and actual earnings on OPEB plan investments
31
Changes in assumptions 241
Contributions—employer -
OPEB expense $ (59)
The changes in net OPEB asset were as follows at December 31, 2019 (dollars in thousands):
Total OPEB Liability (a)
Plan Net Position (b)
Net OPEB (Asset) Liability (a–b)
Beginning balance, December 31, 2018 $ 3,054 $ 4,986 $ (1,932)
Service cost 72 - 72
Interest 103 - 103
Changes in benefit terms - - -
Differences between expected and actual experience (210) - (210)
Changes of assumptions 48 - 48
Benefit payments (216) (216) -
Contributions—employer - - -
Net investment income - 172 (172)
Administrative expense - (12) 12
Net changes (203) (56) (147)
Ending balance, December 31, 2019 $ 2,851 $ 4,930 $ (2,079)
OPEB expense for December 31, 2019, is as follows (dollars in thousands):
Service cost $ 72
Interest 103
Net investment income (159)
Administrative expense 12
Deferred (inflows) outflows of resources:
Differences between expected and actual experience
(380)
Net difference between projected and actual earnings on OPEB plan investments
46
Changes in assumptions 135
Contributions—employer -
OPEB expense $ (171)

Port of Tacoma 2020 Annual Report Financial Statements Notes 56
Actuarial methods and assumptions: Actuarial valuations of an ongoing plan involve estimates of the value of reported amounts and assumptions about the probability of occurrence of events far into the future. Examples include assumptions about future employment, mortality and the health care cost trend. Amounts determined regarding the funded status of the plan and the annual required contributions of the employer are subject to continual revision as actual results are compared with past expectations and new estimates are made about the future.
Projections of benefits for financial reporting purposes are based on the substantive plan (the plan as understood by the employer and the plan members) and include the types of benefits provided at the time of each valuation. The actuarial methods and assumptions used include techniques that are designed to reduce the effects of short-term volatility in actuarial accrued liabilities and the actuarial value of assets, consistent with the long-term perspective of the calculations.
The actuarial present value of accumulated plan benefits is determined by an independent actuary. The results are based on the December 31, 2020, actuarial valuation date with a measurement date and reporting date of December 31, 2020, for the current year. The results of the prior year were based on the December 31, 2019, actuarial valuation date with a measurement date and reporting date of December 31, 2019.
The 2020 actuarial valuation method used was entry age normal; the assumption for salary increases was 3.0%. The Mortality improvement
scale was changed from MP-2019 to MP-2020 to better reflect future expectation. The long-term health care cost trend rate was updated to 6.25% in 2021 grading to 5.75% over two years and following the Getzen model thereafter until reaching an ultimate rate of 4.04% in 2075.
The 2019 actuarial valuation method used was entry age normal; the assumption for salary increases was 3.0%. The Mortality table was changed to PubG-2010 Combined Fully Generational Mortality Table with projected mortality improvements under Projection Scale MP-2019 (male and female scales).The 2019 health care cost trend rate was 6.33% in 2020 graded down to 5.0% in 2022 and applying the SOA Getzen Model with baseline long-run growth factors.
Discount rate: The discount rate was decreased to 1.93% in 2020 and was based on the December 31, 2020 Municipal Bond 20-Year High Grade Rate Index from 3.26% to better reflect future expectation. The discount rate and long-term rate of return for 2019 was 3.26% and was based on the December 31, 2019 Municipal Bond 20-Year High Grade Rate Index. Based on those assumptions, the OPEB plan’s fiduciary net position was projected to be available to make all projected OPEB payments for current active and inactive employees. Therefore, the long-term expected rate of return on OPEB plan investments was applied to all periods of projected benefit payments to determine the total OPEB liability.
Sensitivity of the net OPEB asset to changes in the discount rate: The following presents the net OPEB asset of the Port for December 31, 2020, as well as what the Port’s net OPEB asset would be if it were calculated using a discount rate that is 1 percentage point lower or 1 percentage point higher than the current discount rate:
1% Decrease
Discount Rate
1% Increase
December 31, 20200.93% 1.93% 2.93%
$ 1,788 $ 1,914 $ 2,034
December 31, 20192.26% 3.26% 4.26%
$ 1,961 $ 2,079 $ 2,191
Sensitivity of the net OPEB asset to changes in the health care cost trend rates: The following represents the net OPEB liability calculated using the stated health care cost trend assumption, as well as what the OPEB liability would be if it were calculated using a health care cost trend rate that is 1 percentage-point lower or 1-percentage-point higher than the assumed trend rate (dollars in thousands):
1% Decrease
Health Care Cost Gertzen Model
1% Increase
December 31, 2020 $ 2,069 $ 1,914 $ 1,747
December 31, 2019 $ 2,228 $ 2,079 $ 1,918

Port of Tacoma 2020 Annual Report Financial Statements Notes 57
For the year ended December 31, 2020, the recognized OPEB benefit was $59,000 and deferred outflows of resources and deferred inflows of resources related to OPEB were as follows (dollars in thousands):
2020Deferred
Outflow of Resources
Deferred Inflow of Resources
Net difference between projected and actual earnings on OPEB plan investments
$ 97 $ (67)
Change in assumptions 131 -
Differences between expected and actual experience
- (128)
Total $ 228 $ (195) For the year ended December 31, 2019, the recognized OPEB benefit was $171,000 and deferred outflows of resources and deferred inflows of resources related to OPEB were as follows (dollars in thousands):
2019Deferred
Outflow of Resources
Deferred Inflow of Resources
Net difference between projected and actual earnings on OPEB plan investments
$ 146 $ (11)
Change in assumptions 159 -
Differences between expected and actual experience
- (485)
Total $ 305 $ (496)
At December 31, 2020, differences between expected and actual experience are amortized over the average remaining service lives of all participants which for the current period is two years. Asset gains or losses are amortized over 5 years. Plan amendments are recognized immediately. Changes in actuarial assumptions are amortized over the average remaining service lives of all participants. Net difference between projected and actual earnings on OPEB plan investments are amortized over five years.
Amounts reported as deferred outflows of resources and deferred inflows of resources related to OPEB will be recognized in OPEB expense as follows (dollars in thousands):
Years ending December 31
2021 $ 74
2022 (9)
2023 (17)
2024 (15)
Total $ 33
At December 31, 2019, differences between expected and actual experience are amortized over the average remaining service lives of all participants, which for the current period is three years. Changes in actuarial assumptions are amortized over the average remaining service lives of all participants, three years. Net difference between projected and actual earnings on OPEB plan investments are amortized over five years.
Amounts reported as deferred outflows of resources and deferred inflows of resources related
to OPEB will be recognized in OPEB expense as follows (dollars in thousands):
Years ending December 31
2020 $ (199)
2021 6
2022 6
2023 (4)
Total $ (191)
INVESTMENTS:
Investment policy: As of December 31, 2020 and 2019, the Plan’s investments were deposited in qualified depositories as required by state statutes. Those statutes authorize the Trust to invest in direct obligations of the U.S. Government, certificates of deposit, bankers’ acceptances, repurchase agreements, commercial paper and certain municipal bonds. Investments are valued at fair value. The following is the Plan’s asset allocation at December 31:
Asset ClassTarget Allocation
2020 2019
Fixed income 93% 97%
Cash 7% 3%
100% 100%
Rate of return: The annual money-weighted rate of return on the OPEB plan investments, net of investment expense for December 31, 2020 and 2019, was 3.10% and 3.34%, respectively. The money-weighted rate of return expresses investment performance, net of investment expenses, adjusted for changing amounts actually invested.

Port of Tacoma 2020 Annual Report Financial Statements Notes 58
RISKS:
Interest rate risk: Interest rate risk is the risk that changes in interest rates will adversely affect the fair value of an investment. The Port’s investment guideline is to maximize investment return while preserving liquidity. To the extent possible, the Port will attempt to match its investments with anticipated cash flow requirements using the specific-identification method. The tables below present investment types, durations and amount by issuer.
Credit risk: Credit risk is the risk that an issuer of an investment will not fulfill its obligation to the holder of the investment. This is measured by the assignment of a rating by a nationally recognized statistical rating organization. The tables below present investment types, durations and amount by issuer.
Custodial credit risk: Custodial credit risk is the risk that, in the event of the failure of the counterparty or the Trust, the Port will not be able to recover the value of its investments or collateral securities that are in the possession of the outside party. The deposits are covered by the PDPC of the State of Washington. The PDPC is a statutory authority under Chapter 39.58 RCW. The PDPC approves which banks and thrifts can hold state and local government deposits and monitors collateral pledged to secure uninsured public deposits. This secures public treasurers’ deposits when they exceed the amount insured by the FDIC by requiring banks and thrifts to pledge securities as collateral. The tables below present investment types, durations and amount by issuer.
Concentration risk: Concentration of credit risk is the risk of loss attributable to the magnitude of an investment in a single issuer. The Port’s investment guidelines require diversification and set limits on amount of investments by security and by issuer.
Trust deposits and investments: The Trust’s cash and cash equivalents of $346,000 and $134,000 as of December 31, 2020 and 2019, respectively, were deposited in qualified depositories as required by state statute.
The Trust follows the Port’s investment guidelines as presented in Note 2, Deposits and Investments. The tables below identify the type of investments, concentration of investments in any one issuer and maturities of the Trust portfolio as of December 31 (dollars in thousands):
2020 Maturities (in years) Percentage of Total PortfolioInvestment Type Fair Value Less Than 1 1–3 More Than 3
Federal Home Loan Bank $ 922 $ 612 $ 310 $ - 20.1%
Federal National Mortgage Association 1,014 504 257 253 22.1%
United States Treasury Bonds 2,662 202 1,312 1,148 57.8%
Total investments $ 4,598 $ 1,318 $ 1,879 $ 1,401 100.0%
Percentage of total portfolio 28.7% 40.9% 30.4% 100.0%
2019 Maturities (in years) Percentage of Total PortfolioInvestment Type Fair Value Less Than 1 1–3 More Than 3
Federal Farm Credit Bank $ 253 $ 253 $ - $ - 5.3%
Federal Home Loan Bank 1,214 300 914 - 25.3%
Federal National Mortgage Association 1,203 451 752 - 25.1%
United States Treasury Bonds 2,126 250 504 1,372 44.3%
Total investments $ 4,796 $ 1,254 $ 2,170 $ 1,372 100.0%
Percentage of total portfolio 26.1% 45.3% 28.6% 100.0%

Port of Tacoma 2020 Annual Report Financial Statements Notes 59
The Trust investments are rated AAA by Moody’s equivalent credit rating as of December 31, 2020 and 2019.
The Plan’s investments are measured and reported on a fair value basis classified and disclosed in one of the following three categories:
Level 1: Quoted market prices in active markets for identical assets or liabilities.
Level 2: Observable market based inputs or unobservable inputs that are corroborated by market data
Level 3: Unobservable inputs that are not corroborated by market data.
Additional information about the Port’s application of fair value measurements can be found in Note 16, Fair Value Measurements.
Fair value of Trust investments as of December 31, 2020 (dollars in thousands):
Level 1 Level 2 Total
Federal Home Loan Bank $ 612 $ 310 $ 922
Federal National Mortgage Association 761 253 1,014
United States Treasury Bonds 2,662 - 2,662
Total Post-Employment Health Care Benefits Trust Fund $ 4,035 $ 563 $ 4,598
Fair value of Trust investments as of December 31, 2019 (dollars in thousands):
Level 1 Level 2 Total
Federal Farm Credit Bank $ - $ 253 $ 253
Federal Home Loan Bank 602 612 1,214
Federal National Mortgage Association 1,203 - 1,203
United States Treasury Bonds 2,126 - 2,126
Total Post-Employment Health Care Benefits Trust Fund $ 3,931 $ 865 $ 4,796
10 NOTEASDF
PROPERTY TAXES
The County Treasurer acts as an agent to collect property taxes levied in the county for all taxing authorities. Taxes are levied annually on January 1, on property values listed as of the prior May 31. The lien date is January 1. Assessed values are established by the County Assessor at 100% of fair market value. A revaluation of all property is required every six years.
Taxes are due in two equal installments on April 30 and October 31. Collections are distributed monthly to the Port by the County Treasurer.
The Port is permitted by law to levy up to 45 cents per $1,000 of assessed valuation for general Port purposes. The rate may be adjusted for either of the following reasons:
(a) Washington State law in Revised Code of Washington (RCW) 84.55 limits the growth of regular property taxes, but it allows additional amounts for new construction. The Port is allowed to raise revenues in excess of the limit if approved by a majority of the voters as provided in RCW 84.55.050.
(b) The Port may voluntarily levy taxes at a lower rate.
Special levies approved by the voters are not subject to the above limitations.
In 2020 the Port’s regular tax levy was $0.184 per $1,000 on a total assessed valuation of $125,834,422,000, for a total regular levy amount of $23,158,000. In 2019 the Port’s regular tax levy was $0.183 per $1,000 on total assessed valuation of $114,163,259,000, for a total regular levy amount of $20,939,000.
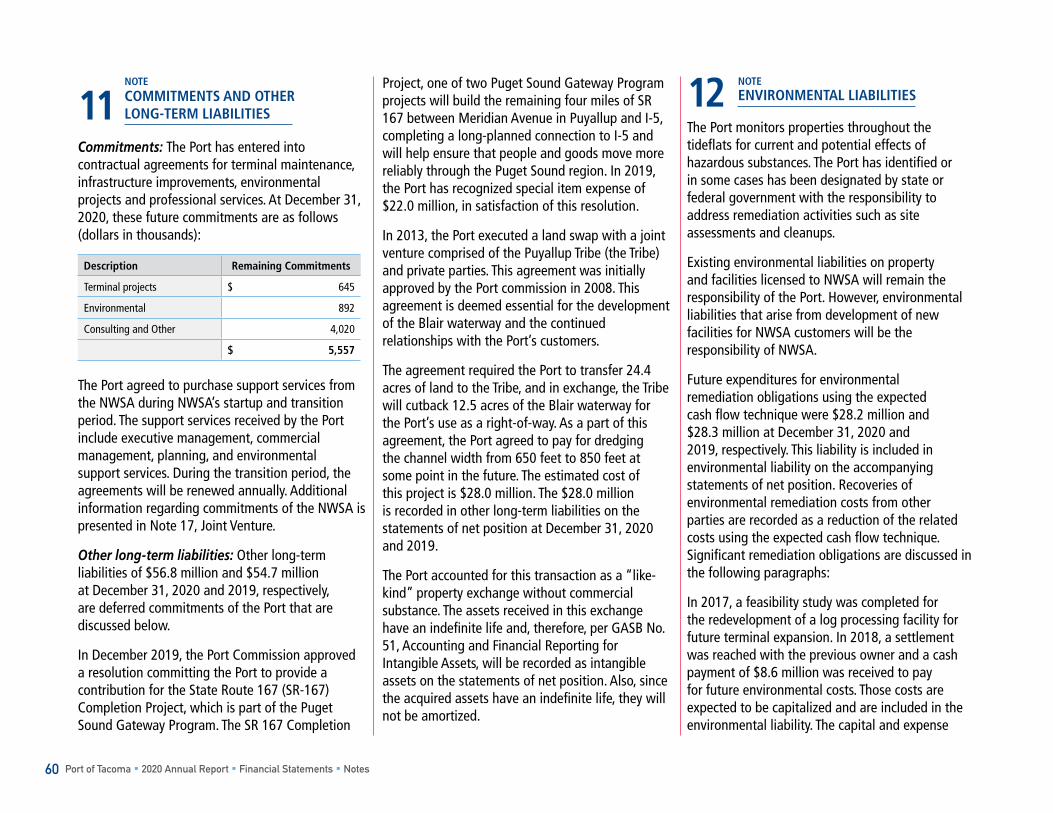
Port of Tacoma 2020 Annual Report Financial Statements Notes 60
11NOTEASDF
COMMITMENTS AND OTHER LONG-TERM LIABILITIES
Commitments: The Port has entered into contractual agreements for terminal maintenance, infrastructure improvements, environmental projects and professional services. At December 31, 2020, these future commitments are as follows (dollars in thousands):
Description Remaining Commitments
Terminal projects $ 645
Environmental 892
Consulting and Other 4,020
$ 5,557
The Port agreed to purchase support services from the NWSA during NWSA’s startup and transition period. The support services received by the Port include executive management, commercial management, planning, and environmental support services. During the transition period, the agreements will be renewed annually. Additional information regarding commitments of the NWSA is presented in Note 17, Joint Venture.
Other long-term liabilities: Other long-term liabilities of $56.8 million and $54.7 million at December 31, 2020 and 2019, respectively, are deferred commitments of the Port that are discussed below.
In December 2019, the Port Commission approved a resolution committing the Port to provide a contribution for the State Route 167 (SR-167) Completion Project, which is part of the Puget Sound Gateway Program. The SR 167 Completion
Project, one of two Puget Sound Gateway Program projects will build the remaining four miles of SR 167 between Meridian Avenue in Puyallup and I-5, completing a long-planned connection to I-5 and will help ensure that people and goods move more reliably through the Puget Sound region. In 2019, the Port has recognized special item expense of $22.0 million, in satisfaction of this resolution.
In 2013, the Port executed a land swap with a joint venture comprised of the Puyallup Tribe (the Tribe) and private parties. This agreement was initially approved by the Port commission in 2008. This agreement is deemed essential for the development of the Blair waterway and the continued relationships with the Port’s customers.
The agreement required the Port to transfer 24.4 acres of land to the Tribe, and in exchange, the Tribe will cutback 12.5 acres of the Blair waterway for the Port’s use as a right-of-way. As a part of this agreement, the Port agreed to pay for dredging the channel width from 650 feet to 850 feet at some point in the future. The estimated cost of this project is $28.0 million. The $28.0 million is recorded in other long-term liabilities on the statements of net position at December 31, 2020 and 2019.
The Port accounted for this transaction as a “like-kind” property exchange without commercial substance. The assets received in this exchange have an indefinite life and, therefore, per GASB No. 51, Accounting and Financial Reporting for Intangible Assets, will be recorded as intangible assets on the statements of net position. Also, since the acquired assets have an indefinite life, they will not be amortized.
12 NOTEASDF
ENVIRONMENTAL LIABILITIES
The Port monitors properties throughout the tideflats for current and potential effects of hazardous substances. The Port has identified or in some cases has been designated by state or federal government with the responsibility to address remediation activities such as site assessments and cleanups.
Existing environmental liabilities on property and facilities licensed to NWSA will remain the responsibility of the Port. However, environmental liabilities that arise from development of new facilities for NWSA customers will be the responsibility of NWSA.
Future expenditures for environmental remediation obligations using the expected cash flow technique were $28.2 million and $28.3 million at December 31, 2020 and 2019, respectively. This liability is included in environmental liability on the accompanying statements of net position. Recoveries of environmental remediation costs from other parties are recorded as a reduction of the related costs using the expected cash flow technique. Significant remediation obligations are discussed in the following paragraphs:
In 2017, a feasibility study was completed for the redevelopment of a log processing facility for future terminal expansion. In 2018, a settlement was reached with the previous owner and a cash payment of $8.6 million was received to pay for future environmental costs. Those costs are expected to be capitalized and are included in the environmental liability. The capital and expense

Port of Tacoma 2020 Annual Report Financial Statements Notes 61
environmental remediation obligation was $11.4 million at December 31, 2020 and 2019.
The Port discovered contamination on the Blair Peninsula on land formally used for a naval shipyard, fuel storage and mineral fiber insulation manufacturing. A portion of these costs are expected to be capitalized. The environmental remediation obligation net of cost recoveries is $10.0 million and $10.3 million at December 31, 2020 and 2019, respectively.
The Port transferred land to the Tribe in 1988 under the 1988 Puyallup Land Settlement Agreement. The terms of the agreement obligated the Port to remediate the property in the event of future development. In April 2008, the parties entered into a land swap agreement for several of the same parcels for the development of marine terminals. The environmental remediation obligation was $5.9 million and $5.3 million at December 31, 2020 and 2019, respectively.
The Port owns land within the boundaries of the Commencement Bay near the Shore Tideflats Superfund Site, for which a Remedial Investigation and Feasibility Study have been performed by the U.S. Environmental Protection Agency and the Washington State Department of Ecology, pursuant to the Federal Comprehensive Environmental Response Compensation and Liability Act and the Model Toxics Control Act. Remedial actions are currently underway or complete at all known sites. The environmental remediation obligation for the Hylebos waterway superfund site was $0.9 million and $1.1 million at December 31, 2020 and 2019, respectively.
At December 31, 2020, the estimated cost of the environmental remediation projects expected to be capitalized in future periods is approximately $13.7 million.
13 NOTEASDF
CONTINGENCIES
The Port owns land within the boundaries of the Commencement Bay near the Shore Tideflats Superfund Site, for which a Remedial Investigation and a Feasibility Study have been performed by the U.S. Environmental Protection Agency and the Washington State Department of Ecology, pursuant to the Federal Comprehensive Environmental Response Compensation and Liability Act and the Model Toxics Control Act. Remedial actions are currently underway or complete at all known sites. The Port will continue to have liability exposure until the cleanup is complete.
The Port is named as a defendant in various other lawsuits incidental to carrying out its function. The Port believes its ultimate liability, if any, will not be material to the financial statements.
14 NOTEASDF
MAJOR CUSTOMERS
Effective January 1, 2016, the accounting for revenues and expenses associated with Licensed Properties became the responsibility of the NWSA and that activity is reflected on the statements of revenues, expenses and changes in net position as Joint Venture income. Joint Venture income in 2020 and 2019 was $38.8 million and $48.0 million, respectively, and 58.5% and 63.7% of total revenue, respectively. Further information on Joint
Venture activity with the NWSA can be found in Note 17, Joint Venture.
15 NOTEASDF
RELATED-PARTY TRANSACTIONS
The commissioners of the Port and the Executive Director also serve as officers and directors of other private and public agencies. The Revised Code of Washington, Section 53, authorizes the Port District to cooperate and invest with such agencies, including trade centers, economic development and other municipal entities. The Port supports such agencies in its normal course of business.
The Port commissioners also govern the NWSA. The NWSA is a separate governmental entity established as a Port Development Authority and is governed by the ports of Tacoma and Seattle as equal members (each a “Managing Member” and, collectively, “Managing Members”) with each port acting through its elected commissioners.
The Port hired an Executive Director in June 2019, replacing the previous CEO that served dual roles as the CEO of the Port and NWSA. Additional information on the formation of NWSA and related-party activities are presented in the MD&A, Note 1, Summary of Significant Accounting Policies, and Note 17, Joint Venture.

Port of Tacoma 2020 Annual Report Financial Statements Notes 62
16 NOTEASDF
FAIR VALUE MEASUREMENTS
The Port’s assets and liabilities that are measured and reported on a fair value basis are classified and disclosed in one of the following three categories:
Level 1: Quoted market prices in active markets for identical assets or liabilities.
Level 2: Observable market-based inputs or unobservable inputs that are corroborated by market data.
Level 3: Unobservable inputs that are not corroborated by market data.
In determining the appropriate levels, the Port performs a detailed analysis of the assets and liabilities that are subject to the guidance. The Port’s fair value measurements are evaluated by an independent third-party vendor. The third-party vendor uses a variety of methods when pricing these securities that incorporate relevant observable market data to arrive at an estimate of what a buyer in the marketplace would pay for a security under current market conditions. Level 1 inputs are quoted prices in active markets for identical assets assessed at the measurement date. An active market for the asset is a principal market in which transactions for the asset are open to many and occur with sufficient frequency and volume. Level 2 inputs include quoted prices for similar assets in active markets, quoted prices for identical or similar assets in markets where there isn’t sufficient activity, and/or where price quotations vary substantially either over time or among market makers (some brokered markets, for example), or in which little information is released publicly. Level 2 investments that do not have
observable trade data are valued using the present value of expected future cash flow model option or the adjusted discounted cash flow model technique. The Port does not have any Level 3 assets or liabilities at December 31, 2020 and 2019.
The Port has four swaps outstanding so that it may mitigate interest rate risk. The swaps synthetically fix or “lock-in” interest rates on variable revenue bond debt by providing cash flows that are intended to offset the variable-rate bond payments, leaving the Port with the fixed payment identified in each swap agreement. The fair value of the interest rate swap agreement (used for purposes other than trading) are the estimated amounts the Port would pay to terminate the swap agreement at the reporting date, taking into account current interest rates for the swap agreement and the creditworthiness of the swap counterparty and the third-party bond insurer.
The tables below present the balances of assets and liabilities measured at fair value by level within the hierarchy at December 31, 2020 and 2019 (dollars in thousands):
Fair value of Trust investments as of December 31, 2020 Level 1 Level 2 Total
Investments—Enterprise Fund:
Federal Farm Credit Bank $ - $ 2,015 $ 2,015
Federal Home Loan Bank - 1,032 1,032
Federal Home Loan Mortgage Corporation - 14,009 14,009
Federal National Mortgage Association 2,025 4,994 7,019
Municipal Bonds 938 40,996 41,934
Supranationals - 8,017 8,017
United States Treasury Bonds - 5,341 5,341
Total investments—Enterprise Fund $ 2,963 $ 76,404 $ 79,367
Long-term debt—interest rate swaps $ - $ 80,594 $ 80,594
Fair value of Trust investments as of December 31, 2019 Level 1 Level 2 Total
Investments—Enterprise Fund:
Federal Agricultural Mortgage Corporation $ - $ 2,006 $ 2,006
Federal Farm Credit Bank 2,005 4,007 6,012
Federal Home Loan Bank - 5,014 5,014
Federal Home Loan Mortgage Corporation - 5,006 5,006
Federal National Mortgage Association 1,999 1,982 3,981
Municipal Bonds 11,410 38,911 50,321
Supranationals - 6,037 6,037
United States Treasury Bonds 2,008 933 2,941
Total investments—Enterprise Fund $ 17,422 $ 63,896 $ 81,318
Long-term debt—interest rate swaps $ - $ 65,717 $ 65,717

Port of Tacoma 2020 Annual Report Financial Statements Notes 63
17 NOTEASDF
JOINT VENTURE
The home ports share net income and cash distributions from the NWSA on a 50/50 basis. The Port’s 50% share of NWSA net income and cash distributions are presented on the statements of net position as investment in Joint Venture. The NWSA Joint Venture income is recorded monthly and the cash distributions from the NWSA are generally received in the following month.
The investment in Joint Venture as of December 31, 2020 and 2019, is presented as follows (dollars in thousands):
Description January 1, 2020 2020 Activity December 31, 2020
Working capital contributions $ 25,500 $ - $ 25,500
Capital construction contributions 148,598 64,809 213,407
Noncash capital work-in-process 8,906 - 8,906
Total contributions $ 183,004 $ 64,809 $ 247,813
Joint Venture income $ 220,480 $ 38,782 $ 259,262
Cash distributions from Joint Venture (226,287) (61,078) (287,365)
End balance $ 177,197 $ 42,513 $ 219,710
Description January 1, 2019 2019 Activity December 31, 2019
Working capital contributions $ 25,500 $ - $ 25,500
Capital construction contributions 104,293 44,305 148,598
Noncash capital work-in-process 8,906 - 8,906
Total contributions $ 138,699 $ 44,305 $ 183,004
Joint Venture income $ 172,501 $ 47,979 $ 220,480
Cash distributions from Joint Venture (168,692) (57,595) (226,287)
End balance $ 142,508 $ 34,689 $ 177,197
The home ports generally fund NWSA’s capital contribution requirements in the following month, after the amount due is determined. During 2020 and 2019, the Port contributed $64.8 million and $44.3 million, respectively, for capital construction projects in accordance with the capital investment plan approved by the Managing Members. At December 31, 2020 and 2019, $6.3 million and $7.8 million, respectively, were payable to the NWSA and are presented on the statements of net position as related-party payable—Joint Venture.
Cash distributions from the NWSA are generally received in the following month. The Port’s receivable for cash distributions earned through December 31, 2020 and 2019, were $5.2 million and $9.1 million, respectively, and are presented on the statements of net position as related-party receivables—Joint Venture.
The Port and the NWSA have entered into agreements to provide support services to each other during NWSA’s start-up and transition period as the NWSA works to set up back office infrastructure and staff positions. The support services provided by the Port to the NWSA include equipment and facilities maintenance, security, facilities development, finance and accounting, procurement, public affairs, information technology, risk management, and office infrastructure. The costs for these services provided by the Port to the NWSA are based on agreed-upon direct charges and allocations. These support services totaled $31.8 million in 2020 and $32.5 million in 2019.
Support services provided by the NWSA to the Port include executive management, commercial management, planning and environmental support services. The costs for these services provided by the NWSA to the Port are based on agreed-upon direct charges and allocations. These support services totaled $1.4 million in 2020 and in 2019.
The Port invoices the net amount of the support services, capital construction spending and operating costs incurred for NWSA operations to the NWSA monthly and payments are typically received in the following month. The net amount of these receivables at December 31, 2020 and

Port of Tacoma 2020 Annual Report Financial Statements Notes 64
2019, was $1.6 million and $7.2 million, respectively, and is included in related-party receivables— Joint Venture on the statements of net position.
A summarized statements of net position and statements of revenues, expenses and changes in net position of the NWSA for the years ended December 31, 2020 and 2019, are as follows (dollars in thousands):
2020 2019
Total assets and deferred outflows $ 505,005 $ 429,308
Total liabilities and deferred inflows 55,603 75,932
Total net position $ 449,402 $ 353,376
Operating revenues $ 184,327 $ 195,022
Total operating expenses (107,605) (100,501)
Non-operating expense, net (1,287) (2,431)
Capital grant contributions 2,129 3,868
Increase in net position before Managing Member contributions and distributions $ 77,564 $ 95,958
Managing Members contributions and distributions, net $ 18,462 $ (26,581)
Increase in net position $ 96,026 $ 69,377
Net position, beginning of year $ 353,376 $ 283,999
Net position, end of year $ 449,402 $ 353,376
The NWSA financial report may be obtained at www.nwseaportalliance.com.
18 NOTEASDF
SUBSEQUENT EVENTS
Asset held for sale: The purchase and sale agreement for the land held for sale in Thurston County was terminated in February 2021. The property has been relisted for sale and has a book value of $7.8 million.
General Obligation Bond Refunding: The commissioners of the Port have authorized the refunding of the 2016 A GO bonds of $18.1 million with original true interest rate of 2.705% to lower interest expenses. The expected closing date is mid-April with Original True Interest of 0.86%.

REQUIREDSUPPLEMENTARYINFORMATION

Port of Tacoma 2020 Annual Report Required Supplementary Information 66
Enterprise Fund
Schedule of Port of Tacoma’s Share of Net Pension Asset/Liability (NPA/NPL) December 31, 2020, 2019, 2018, 2017, 2016 and 2015 (dollars in thousands):
PERS Plan 1 2020 2019 2018 2017 2016 2015 (1)
Port’s proportion of NPL 0.145% 0.161% 0.160% 0.177% 0.190% 0.187%
Port’s proportionate share of NPL $ 5,124 $ 6,172 $ 7,165 $ 8,412 $ 10,213 $ 9,803
Port’s covered payroll (plan year) $ - $ 38 $ 72 $ 70 $ 67 $ 84
Port’s proportionate share of the net pension liability (asset) as a percentage of its covered payroll (plan year)
0.0% 16,391.8% 9,951.4% 12,017.1% 15,243.3% 11,732.9%
Plan fiduciary net pension position as a percentage of the total pension liability
68.6% 67.1% 63.2% 61.2% 57.0% 59.1%
Contractually required contribution $ 1,012 $ 1,189 $ 1,032 $ 1,059 $ 1,136 $ 954
Contributions in relation to the contractually required contribution (1,057) (1,108) (1,118) (963) (1,152) (954)
Contribution deficiency (excess) $ (45) $ 81 $ (86) $ 96 $ (16) $ -
Port’s covered payroll (Port’s fiscal year) $ - $ - $ 72 $ 70 $ 67 $ 84
Contributions as a percentage of covered payroll (Port’s fiscal year) N/A N/A 1,532% 1,376% 1,719% 1,141%
PERS Plan 2/3 2020 2019 2018 2017 2016 2015
Port’s proportion of NPL 0.189% 0.206% 0.2042% 0.2265% 0.2395% 0.2397%
Port’s proportionate share of NPL $ 2,417 $ 2,004 $ 3,487 $ 7,869 $ 12,057 $ 8,565
Port’s covered payroll (plan year) $ 21,269 $ 23,210 $21,200 $20,352 $23,892 $21,554
Port’s proportionate share of the net pension liability (asset) as a percentage of its covered payroll (plan year)
11.4% 8.6% 16.4% 38.7% 50.5% 39.7%
Plan fiduciary net pension position as a percentage of the total pension liability
97.2% 97.8% 95.8% 91.0% 85.8% 89.2%
Contractually required contribution $ 1,684 $ 1,789 $ 1,631 $ 1,479 $ 1,526 $ 1,252
Contributions in relation to the contractually required contribution (1,746) (1,770) (1,641) (1,479) (1,526) (1,252)
Contribution deficiency (excess) $ (62) $ 19 $ (10) $ - $ - $ -
Port’s covered payroll (Port’s fiscal year) $ 22,042 $ 22,405 $ 21,887 $ 20,352 $ 23,892 $ 21,554
Contributions as a percentage of covered payroll (Port’s fiscal year) 7.9% 7.9% 7.5% 7.1% 6.2% 5.8%
(1) Schedule is intented to show information for ten years; however, due to implementation of GASB Statement 68 in 2015, prior years not available.
Notes to Required Supplementary Information: See Note 8 of the financial statements for additional information on the plan.

Port of Tacoma 2020 Annual Report Required Supplementary Information 67
Post-Employment Health Care Benefits Trust Fund
Schedule of Changes in Port of Tacoma’s Net OPEB Asset and Related Ratios December 31, 2020, 2019, 2018 and 2017 (dollars in thousands):
2020 2019 2018 2017
Total OPEB liability:
Service cost $ 60 $ 72 $ 75 $ 89
Interest 93 103 101 111
Change of benefit terms - - - -
Differences between expected and actual experience (46) (210) (983) -
Changes of assumptions 213 48 369 -
Benefit payments (141) (216) (207) (384)
Net change in total OPEB liability $ 179 $ (203) $ (645) $ (184)
Total OPEB liability—beginning $ 2,851 $ 3,054 $ 3,699 $ 3,883
Total OPEB liability—ending (a) $ 3,030 $ 2,851 $ 3,054 $ 3,699
Plan fiduciary net position:
Contributions—employer $ - $ - $ - $ -
Net investment income 168 172 85 44
Benefit payments (141) (216) (207) (418)
Administrative expense (13) (12) (12) (13)
Net change in fiduciary net position 14 (56) (134) (387)
Plan fiduciary net position—beginning $ 4,930 $ 4,986 $ 5,120 $ 5,507
Plan fiduciary net position—ending (b) $ 4,944 $ 4,930 $ 4,986 $ 5,120
Net OPEB asset ending (a)–(b) $ 1,914 $ 2,079 $ 1,932 $ 1,421
Plan fiduciary net position as a percentage of the total OPEB liability 163.2% 172.9% 163.3% 138.4%
Covered-employee payroll $ 1,223 $ 1,440 $ 1,615 $ 1,488
Net OPEB Liability as a percentage of covered-employee payroll 156.5% 144.4% 119.6% 95.5%

Port of Tacoma 2020 Annual Report Required Supplementary Information 68
Post-Employment Health Care Benefits Trust Fund
Schedule of Port of Tacoma’s Contributions December 31, 2020, 2019, 2018 and 2017 (dollars in thousands):
2020 2019 2018 2017
Schedule of contributions:
Actuarially determined contribution $ 90 $ 89 $ 93 $ 106
Contribution in relation to the actuarially determined contribution - - - -
Contribution deficiency $ 90 $ 89 $ 93 $ 106
Contributions as a percentage of covered-employee payroll 0.0% 0.0% 0.0% 0.0%
Schedule of investment returns:
Annual money-weighted rate of return, net of investment expense 3.17% 3.26% 1.49% 0.59%

SUPPLEMENTARYINFORMATION

Port of Tacoma 2020 Annual Report Supplementary Information70
Information for Bondholders This information is provided as a convenience to bondholders and other institutions to assist them in reviewing historical financial information.
Comparative Schedule of Net Revenues Available for Debt Service (dollars in thousands):
Revenues
Total Operating Revenues $ 66,252 $ 75,351 $ 79,600 $ 76,612 $ 85,129 $ 143,897
Joint Venture Cash Adjustments (1) 7,992 5,655 (538) 94 (3,921) -
Non-operating Revenues (2), (3), (4), (5) 2,779 6,154 5,005 3,585 2,206 2,381
Total Revenues Available for Senior Debt Service $ 77,023 $ 87,160 $ 84,067 $ 80,291 $ 83,414 $ 146,278
Expenses
Total Operating Expenses, excluding depreciation (6) $ 17,920 $ 17,237 $ 16,994 $ 18,062 $ 12,944 $ 72,577
Non-operating Expenses (7), (8), (9), (10) 275 1,067 259 345 98 201
Total Expenses, excluding depreciation $ 18,195 $ 18,304 $ 17,253 $ 18,407 $ 13,042 $ 72,778
Less Levy Available for Capital Improvement (7), (11) 13,092 10,880 9,033 4,683 1,641 348
Net Expenses $ 5,104 $ 7,424 $ 8,220 $ 13,724 $ 11,401 $ 72,430
Net Revenues Available for Senior Debt Service $ 71,918 $ 79,736 $ 75,847 $ 66,568 $ 72,012 $ 73,847
Debt Service Senior Lien debt 16,782 13,099 12,802 9,713 5,531 4,399
Debt Service Coverage (Senior Lien Debt) $ 4.29 $ 6.09 $ 5.92 $ 6.85 $ 13.02 $ 16.79
Net Revenues Available for Senior Debt Service $ 71,918 $ 79,735 $ 75,847 $ 66,568 $ 72,012 $ 73,847
Less Subordinate Lien Rate Stabilization (12) (2,000) (5,000) - - (2,000) (6,000)
Less Senior Lien Debt Service (16,782) (13,099) (12,802) (9,713) (5,531) (4,399)
Net Revenues Available for Subordinate Debt Service $ 53,136 $ 61,636 $ 63,045 $ 56,855 $ 64,482 $ 63,448
Debt Service Subordinate Debt (13), (14) 13,810 17,422 18,095 20,135 21,786 22,034
Debt Service Coverage (Subordinate Lien Debt) (13) $ 3.85 $ 3.54 $ 3.48 $ 2.82 $ 2.96 $ 2.88
Net Revenues Available for Senior Debt Service $ 71,918 $ 79,735 $ 75,847 $ 66,568 $ 72,012 $ 73,847
Less Subordinate Lien Rate Stabilization (2,000) (5,000) - - (2,000) (6,000)
Net Revenues Available for fully Diluted Debt Service $ 69,918 $ 74,735 $ 75,847 $ 66,568 $ 70,012 $ 67,847
Debt Service; Senior, Subordinate and lowest lien debt (15) 30,592 30,521 30,897 29,848 27,316 26,432
Debt Service Coverage—Fully Diluted (13), (15) $ 2.29 $ 2.45 $ 2.45 $ 2.23 $ 2.56 $ 2.57
Above schedule does not include levies for general obligation bond issues outstanding.
2019 2018 2017 2016 20152020

Port of Tacoma 2020 Annual Report Supplementary Information71
Comparative Schedule of Net Revenues Available for Debt Service (dollars in thousands):
Footnotes
(1) JV revenues are adjusted for cash flows from revenues or expenditures that would be excluded from debt service coverage if directly applied to the Port financials
(2) Excluded from non-operating revenues is interest earned on investment of:
General Obligation Bonds $ - $ - $ - $ 82 $ 24 $ 7
Construction funds 0 221 534 487 154 -
(3) Excluded from non-operating revenues is capital contribution and other miscellaneous non-operating income
1,792 506 12,753 1,012 7,116 1,690
(4) Excluded from non-operating revenues is gain(loss) on disposal or impairment of property
341 3,511 - - (3,534) (5,846)
(5) Excluded from non-operating revenues is gain(loss) on market value of investments
1,827 2,137 (1,125) 156 47 72
(6) Operating expenses are adjusted to include(exclude) items not attributable to ongoing operations
2,693 2,138 (683) 1,669 287 -
(7) Excluded from non-operating expenses is cost of bond issue, net of discounts, premiums and other debt costs and election expense
(2,438) (322) (859) (34) 124 767
(8) Excluded from non-operating expense is interest expense and interest funded from bond proceeds
19,948 20,096 20,825 20,258 18,516 18,087
(9) Excluded from interest expense is capitalized interest - 12 227 56 85 597
(10) Excluded from non-operating expense are contributions to other agencies and other expenses not attributable to operations
$ 1,456 $ 1,437 $ 5,998 $ 594 $ 1,407 $ 4,813
(11) Washington Port Districts are authorized by statute to levy $0.45 per $1,000 of actual value of taxable property ad valorem tax upon all taxable property within their jurisdiction for operations, maintenance, capital improvements and general Port purposes
(12) Amounts withdrawn from the Rate Stabilization Account shall increase Gross Revenue for the period in which they are withdrawn, and amounts deposited in the Rate Stabilization Account shall reduce Gross Revenue for the period during which they are deposited
(13) The Port is authorized to issue from time to time an aggregate principal amount not to exceed $100,000,000 under the port's Subordinate Lien Commercial Paper Program. Debt service shown in this table for the commercial paper program is based on the actual interest payments only on the amount outstanding under this program during the period of calculation
(14) Included payment made to credit and liquidity providers
(15) Included the debt service of lowest lien
Continued from previous page
2019 2018 2017 2016 20152020

Port of Tacoma 2020 Annual Report Supplementary Information72
Revenue Bond Debt Service Schedule (dollars in thousands):
Bond Series
2008 Subordinate Refunding 2008 Subordinate 2019A Subordinate Refunding 2016A Senior Refunding 2016B Senior 2019A Senior
Original Issue Amount $117,210 Original Issue Amount $133,000 Original Issue Amount $40,490 Original Issue Amount $36,535 Original Issue Amount $103,555 Original Issue Amount $34,630
Payment Date
Principal Interest1 Total Principal Interest1 Total Principal Interest1 Total Principal Interest1 Total Principal Interest1 Total Principal Interest1 Total
2021 $ 3,205 $ 101 $ 3,306 $ 208 $ 208 $ 65 $ 65 $ 1,744 $ 1,744 $ 655 $ 5,035 $ 5,690 $ 2,450 $ 1,615 $ 4,065
2022 3,330 95 3,425 208 208 65 65 2,090 1,744 3,834 685 5,002 5,687 2,570 1,492 4,062
2023 3,465 705 4,170 1,637 1,637 511 511 2,200 1,639 3,839 720 4,968 5,688 2,700 1,364 4,064
2024 3,605 659 4,264 1,637 1,637 511 511 2,285 1,551 3,836 755 4,932 5,687 2,835 1,229 4,064
2025 3,750 610 4,360 1,637 1,637 511 511 2,400 1,437 3,837 795 4,894 5,689 2,975 1,087 4,062
2026 3,900 560 4,460 1,637 1,637 511 511 2,500 1,341 3,841 835 4,855 5,690 3,125 938 4,063
2027 4,055 508 4,563 1,637 1,637 511 511 2,625 1,216 3,841 875 4,813 5,688 3,280 782 4,062
2028 4,215 453 4,668 1,637 1,637 511 511 2,760 1,085 3,845 920 4,769 5,689 3,445 618 4,063
2029 4,385 397 4,782 1,637 1,637 511 511 2,895 947 3,842 965 4,723 5,688 3,620 446 4,066
2030 4,560 338 4,898 1,637 1,637 511 511 3,040 802 3,842 1,015 4,675 5,690 3,800 265 4,065
2031 4,745 277 5,022 1,637 1,637 6,500 511 7,011 3,185 650 3,835 1,065 4,624 5,689 1,495 75 1,570
2032 4,935 214 5,149 1,637 1,637 8,395 424 8,819 3,350 491 3,841 1,120 4,571 5,691
2033 5,130 147 5,277 1,637 1,637 8,815 311 9,126 3,515 323 3,838 1,175 4,515 5,690
2034 5,335 79 5,414 1,637 1,637 9,255 193 9,448 3,690 148 3,838 1,230 4,456 5,686
2035 535 7 542 1,637 1,637 5,150 69 5,219 8,015 4,395 12,410
2036 1,637 1,637 8,415 3,994 12,409
2037 1,637 1,637 8,835 3,573 12,408
2038 1,637 1,637 9,275 3,131 12,406
2039 1,637 1,637 9,740 2,668 12,408
2040 1,637 1,637 10,225 2,181 12,406
2041 1,637 1,637 10,740 1,669 12,409
2042 1,637 1,637 11,275 1,132 12,407
2043 1,637 1,637 11,840 569 12,409
2044 122,180 1,637 123,817
Grand Total*
$ 59,150 $ 5,150 $ 64,300 $ 122,180 $ 36,430 $ 158,614 $ 38,115 $ 5,726 $ 43,841 $ 36,535 $ 15,118 $ 51,653 $ 101,170 $ 90,144 $ 191,314 $ 32,295 $ 9,911 $ 42,206
* Debt outstanding as of the date of the financial report is equal to principal amount shown in the Grand Total line.
(1) Calculated using a SIFMA projection plus an Applicable Spread. (2) Calculated using a weighted swap rate determined annually.

Port of Tacoma 2020 Annual Report Supplementary Information73
Revenue Bond Debt Service Schedule (dollars in thousands):
Bond Series
2019A Senior 2020 Senior RefundingSwaps Total
Original Issue Amount $34,630 Original Issue Amount $23,635
Payment Date
Principal Interest1 Total Principal Interest1 Total Payments2 Receipts1 Net Payments
Principal InterestNet Swap Payments
Total
2021 $ 2,450 $ 1,615 $ 4,065 $ 2,505 $ 319 $ 2,824 $ 8,787 $ -364 $ 8,423 $ 8,815 $ 9,086 $ 8,423 $ 26,324
2022 2,570 1,492 4,062 2,570 285 2,855 8,498 -352 8,146 11,245 8,891 8,146 28,282
2023 2,700 1,364 4,064 2,635 251 2,886 8,198 -340 7,858 11,720 11,075 7,858 30,653
2024 2,835 1,229 4,064 2,700 215 2,915 7,885 -327 7,559 12,180 10,734 7,559 30,473
2025 2,975 1,087 4,062 2,770 179 2,949 7,560 -313 7,248 12,690 10,355 7,248 30,293
2026 3,125 938 4,063 2,840 141 2,981 7,222 -299 6,923 13,200 9,983 6,923 30,106
2027 3,280 782 4,062 2,915 103 3,018 6,870 -284 6,586 13,750 9,569 6,586 29,906
2028 3,445 618 4,063 2,985 63 3,048 6,504 -269 6,235 14,325 9,137 6,235 29,697
2029 3,620 446 4,066 1,715 23 1,738 6,123 -253 5,871 13,580 8,684 5,871 28,135
2030 3,800 265 4,065 5,727 -236 5,491 12,415 8,228 5,491 26,134
2031 1,495 75 1,570 5,315 -219 5,096 16,990 7,774 5,096 29,860
2032 4,886 -201 4,685 17,800 7,336 4,685 29,821
2033 4,440 -182 4,257 18,635 6,934 4,257 29,826
2034 3,976 -163 3,813 19,510 6,513 3,813 29,835
2035 3,493 -143 3,350 13,700 6,108 3,350 23,158
2036 2,990 -122 2,868 8,415 5,631 2,868 16,914
2037 2,468 -100 2,367 8,835 5,210 2,367 16,413
2038 1,983 -80 1,903 9,275 4,769 1,903 15,946
2039 1,480 -60 1,420 9,740 4,305 1,420 15,465
2040 956 -39 917 10,225 3,818 917 14,960
2041 411 -17 395 10,740 3,307 395 14,441
2042 48 -2 46 11,275 2,770 46 14,091
2043 11,840 2,206 0 14,046
2044 122,180 1,637 0 123,817
Grand Total*
$ 32,295 $ 9,911 $ 42,206 $ 23,635 $ 1,579 $ 25,214 $ 105,822 $ (4,365) $ 101,457 $ 413,080 $ 164,058 $ 101,457 $ 678,596
* Debt outstanding as of the date of the financial report is equal to principal amount shown in the Grand Total line.
(1) Calculated using a SIFMA projection plus an Applicable Spread. (2) Calculated using a weighted swap rate determined annually.
Continued from previous page

Port of Tacoma 2020 Annual Report Supplementary Information74
Tax Collection Information (dollars in thousands):
Amount of Tax Levy
Tax Collected as of 12/31/20
% Collected
2020 $ 23,163 $ 22,712 98.05%
2019 20,938 20,840 99.53%
2018 18,623 18,578 99.76%
2017 16,660 16,656 99.98%
2016 15,013 15,012 99.99%
2015 $ 14,206 $ 14,206 100.00%
Property Tax Levy Available for Capital Improvements (dollars in thousands):
2020 2019 2018 2017 2016
Total Levy $ 23,163 $ 20,938 $ 18,623 $ 16,660 $ 15,013
Less Designation for G.O. Debt Service 10,041 10,041 9,556 11,948 13,332
Subtotal $ 13,122 $ 10,897 $ 9,067 $ 4,712 $ 1,681
Supplements, Cancellations, Refunds-Net (31) (17) (35) (29) (41)
Levy Available for Capital Improvement $ 13,092 $ 10,880 $ 9,032 $ 4,683 $ 1,640
Current Bond Ratings
Description Moody’sStandard & Poor’s
Senior Revenue Bonds Aa3 AA
Subordinate Revenue Bonds A1 AA-
General Obligation Bonds Aa2 AA
(1) Ugraded on 3/31/2021 after financial statements were finalized.
Port Taxing District Assessed Valuation
2021 $ 137,859,221,328
2020 126,096,129,224
2019 114,011,707,624
2018 101,406,430,390
2017 $ 90,713,390,689
“ In 2020, the Port culminated its centennial celebration with the installation of a public art piece in downtown Tacoma. The artwork, titled Swell, is shaped like the bow of a ship, with art and poetry embedded throughout, telling the story of the energy and opportunity that trade, transportation and the Port create for our region—past, present, and future.”

The 2020 Annual Report was produced by the Port of Tacoma.
Port of Tacoma P.O. Box 1837 Tacoma, WA 98401-1837
253-383-5841
Portoftacoma.com
2020 ANNUAL REPORT


![Welcome! [s3-us-west-2.amazonaws.com]](https://img.pdfslide.net/doc/110x75/615c3df67bc9571ffd6c3854/welcome-s3-us-west-2-.jpg)


![WELCOME [s3-eu-west-1.amazonaws.com]](https://img.pdfslide.net/doc/110x75/6197e65214be102af82b7c9c/welcome-s3-eu-west-1-.jpg)

![Index [s3-us-west-2.amazonaws.com]](https://img.pdfslide.net/doc/110x75/615c9f45047f3c6b1407fa10/index-s3-us-west-2-.jpg)