Embed Size (px)
Citation preview
Annual Report2017Local Money for Local Good.

Local Money for Local Good.Local money for local good… it’s present in everything we do. It means improving our communities with local investments, loans, knowledge and Member Rewards. It’s about understanding local needs because we live, work and play here too. It’s about global access to accounts with all the online services our members may need and a team of experts ready to help with knowledge and support right here at home. Best of all, local money means investing in our members. Money may make the world go round but local money makes our communities buzz!

ValuesIntegrity Being fair, honest, and trustworthy.
Responsibility Being accountable to members, employees, colleagues, and our communities; making good business decisions; and conducting operations in a fiscally responsible manner.
Respect Encouraging openness, mutual respect, and individual development.
Excellence Striving for excellence in innovative work practices, products, and relationships.
Workplace Creating a workplace environment that is diverse, stimulating, and rewarding while recognizing and celebrating individual, work group, and organizational success.
ContentsCorporate Overview CEO/Chair Report Board and Management Report 2017 Management Discussion and Analysis 2017 Financial Performance Financial Statements
Independent Auditors’ Report Consolidated Statement of Financial Position Consolidated Statement of Income Consolidated Statement of Comprehensive Income (Loss) Consolidated Statement of Changes in Members’ Equity Consolidated Statement of Cash Flows Notes to Consolidated Financial Statements
MissionWe are a member-owned credit union dedicated to understanding and meeting the financial and related needs of our members with quality products and services.
We have excellent employees who are committed to developing enduring, mutually beneficial relationships with our members and our communities.
We share the success of our credit union with our members and our communities. Vision
To be the best in the communities we serve.
1
2
4
6
8
16
17
18
19
20
21
22

Corporate OverviewWe’re a financial institution offering a wide range of services. From day-to-day banking and lending to Wealth Management and Insurance Services, we have it all. With total assets of $2.5 billion, Interior Savings continues to be the largest credit union located in the Interior of British Columbia. Our members have access to a network of 21 branches and 16 insurance offices, two specialized Commercial Services Centres in Kamloops and Kelowna, and a Member Service Centre providing expanded service to members throughout our region. But that’s only part of the picture. We’re proudly a cooperative where our customers are our members, our members are our owners, and our success begins and ends with them. Our job is to be there with the right financial supports so our members can succeed – in whatever way they may define success for themselves and their families.
It’s also our job to be a community champion and give back to help our communities thrive. When community is at the heart of everything that you do, day-to-day business becomes so much more: an account with us supports a neighbour’s mortgage, a loan to a business down the street, insurance for a nearby family’s future, bursaries for children at the local school, a sponsorship, a community centre, and many more local causes, events and programs.
Our success is our members’ success and we owe it all to them!
32
Local money for local good. It’s our story. It’s who we are and what’s kept us in business since 1939. In 2017, we continued to deliver financial products and services that helped members buy their first home, start a new business, save for their child’s education and even put something away for retirement. We made an impact not only through the service we offer to our members, or the half a million dollars we gave to local community programs and services, but also by rolling up our sleeves and giving back over 10,000 volunteer hours to help build strong, vibrant communities.
In 2017, our asset base grew to $2.5 billion with earnings from operations of $11.7 million. We returned 20% of our 2017 pre-tax earnings to our members and communities through our Member Rewards and community giving programs. This included nearly $1.5 million in patronage rewards and dividends to members and an estimated $750,000 in bursaries through our Million Dollar Bursary program, to be awarded this September.
This year’s annual report highlights what local money for local good is doing for our members and our communities.
EMPOWERING OUR EMPLOYEESOur employees are our greatest asset. In 2017, we continued to invest in our employees by providing personalized development opportunities through education and hands-on training. We introduced a number of training programs including ‘Balanced Leadership’, designed to help our leaders confidently guide and mentor and ‘Our Potential’, a program designed to help employees identify and reach their career aspirations.
THE COOPERATIVE WAYCredit unions aren’t just about financial well-being, but about people helping people. Interior Savings employees and members were impacted and displaced by the 2017 wildfires. We truly care about the safety and well-being of our members and we were there to provide support in a very difficult time in their lives. That support extended to other credit unions and their members, demonstrating the importance and commitment we place on our cooperative values.
2017 saw a media frenzy alleging that banks were not acting in their customers’ best interests. This allowed us to share our story, that we are a financial cooperative whose purpose is to serve our members rather than maximize profit. This philosophy allows us to put the best interests of our members first, providing the right advice, the right products and the right services our members need to succeed.
INNOVATIVE PRODUCTS AND SERVICES We are always looking to meet our members’ needs with new and improved products and services. In 2017, we introduced Open Anywhere, a software solution which simplified and reduced the time it takes to open a new membership. We launched Personal Financial
A message from Board Chair Elmer Epp and CEO Kathy Conway
Management, an online tool that helps members budget and organize all their finances in one place. We introduced the Family First Mortgage Plan, a product focused on members helping family members get into a home of their own. And we launched the One Grand Plan, a product designed to help our members save to purchase a home.
OUR COMMUNITIESOn October 19, 2017, we celebrated our 4th annual Day of Difference. Once again, our communities saw 500+ employees enthusiastically making a difference and through our Employee Volunteer program we gave back over 10,000 volunteer hours throughout our communities. Working with Do Some Good (formerly Volinspire) we are able to share our stories and make more connections with those in our communities than ever before.
LIVING LEAN 2017 saw us move into year two of our commitment to continuous improvement. The Lean philosophy has created a cultural shift in the way we think and approach problem solving. Since introducing Lean, we have improved processes, making things easier for members and freeing up more than 15,000 hours of time that can now be spent serving and supporting our members in more meaningful ways. For instance, our commercial members now receive approval on loan requests 33% more quickly; members can now convert RSPs to RIFs online, without having to come into the branch (convenient If you happen to be in Arizona when the conversion deadline arrives); we can now upload all of your documentation and receipts to online banking for easy access anytime; and we’ve improved our wire transfer process resulting in a better experience for members and a 90% reduction in error rates.
YOUTH ARE THE FUTUREThe Million Dollar Bursary program is one of the ways we support our young members in furthering their education. Since launching the bursary program in 2013, we have awarded over $2,000,000 in bursaries to Interior Savings members and we’ve seen over 1,000 new young adult members join our Credit Union, many of them learning for the first time what it means to be a credit union member. We have made a commitment to continue the Million Dollar Bursary program for another three years, that’s another $3 million invested in helping our young members get a jump start on their future.
LOOKING FORWARDLocal money for local good matters. It means your money stays where you live for the betterment of the community. It means supporting the local economy, sharing our profits and making a positive difference in people’s lives. Thank you for making all of this possible and allowing us to be part of something meaningful right here at home. We look forward to a new year and what we can accomplish together.

54
Board of DirectorsIn the 2017 election, the Central/North Okanagan Region saw the election of Aniela Florczynski and re-election of Rolli Cacchioni, each for three-year terms. The Thompson/South Okanagan Region saw the re-election by acclamation of Liza Curran and Elmer Epp, each for three-year terms. A special resolution to amend the credit union rules was also approved. Information on the Rules of the Credit Union can be found on our website, interiorsavings.com under About Us/The News Room/Corporate Reports. Following the election, Mr. Elmer Epp of Kamloops was re-elected as Chair of the Board of Directors.
The Board of Directors is responsible for overseeing the strategic direction of the Credit Union. In practice, the Board of Directors delegates responsibility for the management of the Credit Union to the President and Chief Executive Officer while retaining oversight responsibility.
The Board of Directors is expected to act in a manner that protects and enhances the value of the Credit Union in the interest of all members. While adhering to the Credit Union’s policies and procedures, and to statutory and regulatory requirements, the Board of Directors is required to exercise independent judgement with utmost honesty and integrity. The Board of Directors takes these responsibilities seriously and stands proudly behind the Credit Union and each and every one of its employees.
For information on Board responsibilities and activities, please refer to the 2017 Interior Savings Corporate Governance Report which can be found on our website, interiorsavings.com under About Us/The News Room/Corporate Reports.
Senior ManagementOur senior management team works with the Board of Directors to position the Credit Union’s strategic direction and develop the annual strategic plan. They monitor every aspect of the plan to ensure progress is being maintained and the organization is on track. They are responsible for a team of managers, and are committed to ongoing personal and professional development, and involvement in their communities.
Kathy Conway, President and Chief Executive Officer Ted Schisler, Senior Vice President and Chief Operating Officer Trevor Tremblay, Senior Vice President and Chief Financial Officer Gene Creelman, Senior Vice President, Member and Community Engagement Dave Cronquist, Senior Vice President, Strategy and Organizational Efficiency Karen Hawes, Senior Vice President, Culture and Technology
Board and Management Report
Elmer EppChair Kamloops
Rolli CacchioniKelowna
Don GrantPeachland
Daphane Nelson Kamloops
Stacey FenwickVice Chair Kelowna
Jeff HolmKamloops
Liza CurranAshcroft
Pat RyanKelowna
Shelly SandersMerritt
Ken ChristianKamloops
Aniela Florcynzski Kelowna
Caroline GroverKelowna

2017 Management Discussion and AnalysisThis MD&A section is presented to provide an overview of the credit union’s financial and operating performance. It is prepared in conjunction with the audited consolidated financial statements.
98
2017 Financial Performance
SummaryInterior Savings experienced strong financial performance in 2017 amidst a growing local economy. Consolidated total assets of Interior Savings reached $2.5 billion at December 31, 2017. Asset growth was $81.7 million or 3.4% with the significant areas of growth being loans and investments.
Loans accounted for 78.3% of total assets. Loan balances include both loan interest receivable and the allowance for impaired loans, the latter of which reduces the overall loan portfolio. Impaired loan totals and write-offs decreased during 2017.
Member deposit balances increased in 2017, up $76.0 million to just over $2.1 billion. Consolidated retained earnings strengthened further in 2017 to reach $192.7 million. Retained earnings represents the strongest source of regulatory capital.
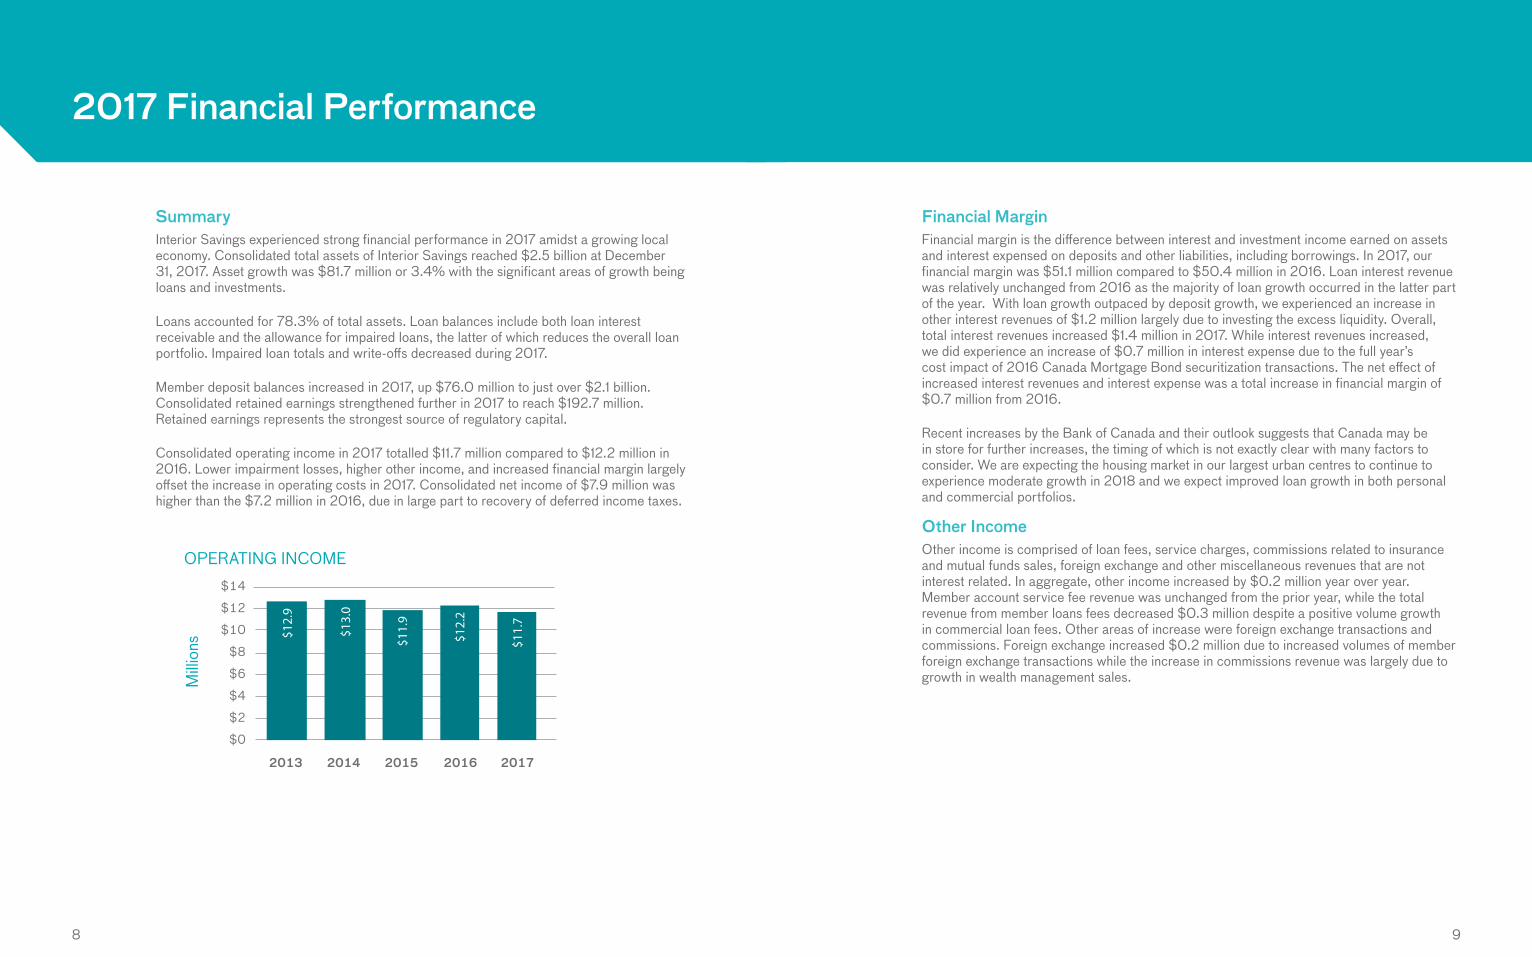
Consolidated operating income in 2017 totalled $11.7 million compared to $12.2 million in 2016. Lower impairment losses, higher other income, and increased financial margin largely offset the increase in operating costs in 2017. Consolidated net income of $7.9 million was higher than the $7.2 million in 2016, due in large part to recovery of deferred income taxes.
Financial MarginFinancial margin is the difference between interest and investment income earned on assets and interest expensed on deposits and other liabilities, including borrowings. In 2017, our financial margin was $51.1 million compared to $50.4 million in 2016. Loan interest revenue was relatively unchanged from 2016 as the majority of loan growth occurred in the latter part of the year. With loan growth outpaced by deposit growth, we experienced an increase in other interest revenues of $1.2 million largely due to investing the excess liquidity. Overall, total interest revenues increased $1.4 million in 2017. While interest revenues increased, we did experience an increase of $0.7 million in interest expense due to the full year’s cost impact of 2016 Canada Mortgage Bond securitization transactions. The net effect of increased interest revenues and interest expense was a total increase in financial margin of $0.7 million from 2016.
Recent increases by the Bank of Canada and their outlook suggests that Canada may be in store for further increases, the timing of which is not exactly clear with many factors to consider. We are expecting the housing market in our largest urban centres to continue to experience moderate growth in 2018 and we expect improved loan growth in both personal and commercial portfolios.
Other IncomeOther income is comprised of loan fees, service charges, commissions related to insurance and mutual funds sales, foreign exchange and other miscellaneous revenues that are not interest related. In aggregate, other income increased by $0.2 million year over year. Member account service fee revenue was unchanged from the prior year, while the total revenue from member loans fees decreased $0.3 million despite a positive volume growth in commercial loan fees. Other areas of increase were foreign exchange transactions and commissions. Foreign exchange increased $0.2 million due to increased volumes of member foreign exchange transactions while the increase in commissions revenue was largely due to growth in wealth management sales.
$14
$12
$10
$8
$6
$4
$2
$0
2013
$12.
9
$13.
0
2014 2015 2016 2017
OPERATING INCOME
Milli
ons $1
1.9
$12.
2
$11.
7
10 11
Distributions to MembersWe have had a long-standing tradition of sharing our profits with our members. For 2017, we are sharing $2.4 million an amount which includes $1.5 million in patronage distributions, based on usage of services, $0.1 million in dividends on equity shares and $0.8 million for the current year’s commitment for the bursary program. All distributions are approved annually by the Board of Directors. To line up with our fiscal year-end, payments to members are made in March every year, after the completion of the annual audit. Since 2002, members have received over $58.7 million in the form of patronage and dividend distributions.
Comprehensive IncomeComprehensive income is comprised of net income and other comprehensive income (OCI). Elements of net income have been described above. Interior’s OCI includes 1) unrealized gains and losses on available for sale investments and 2) changes in cash flow hedges including the unrealized gains from fair valuation changes and the flow of those gains to net income when realized. In 2017, other comprehensive loss was $4.9 million compared to $8.5 million in 2016. This change in OCI for 2017 was largely due to the valuation of underlying cash flow hedges.
LoansTotal loan growth for 2017 was less than expected. This year, member and other loans, net of accrued interest, increased by $8.5 million in 2017. The commercial lending category increased by 8.9%, which amounted to $30.8 million largely attributed to commercial residential project financing throughout the year. Interior Savings continued to focus on business development efforts in 2017 which resulted in a significant increase in new commercial and small business loan authorizations, reinforcing our commitment to supporting local money for local good. As a proportion of loans at year-end, commercial lending represented 19.2% of the loan portfolio. Personal member loans increased a total of $21.5 million which was overshadowed by a decrease in non-member loans of $42.4 million due to regular principal balance payments and payouts. Improved residential mortgage growth in the second half of 2017 continues into the early part of 2018.
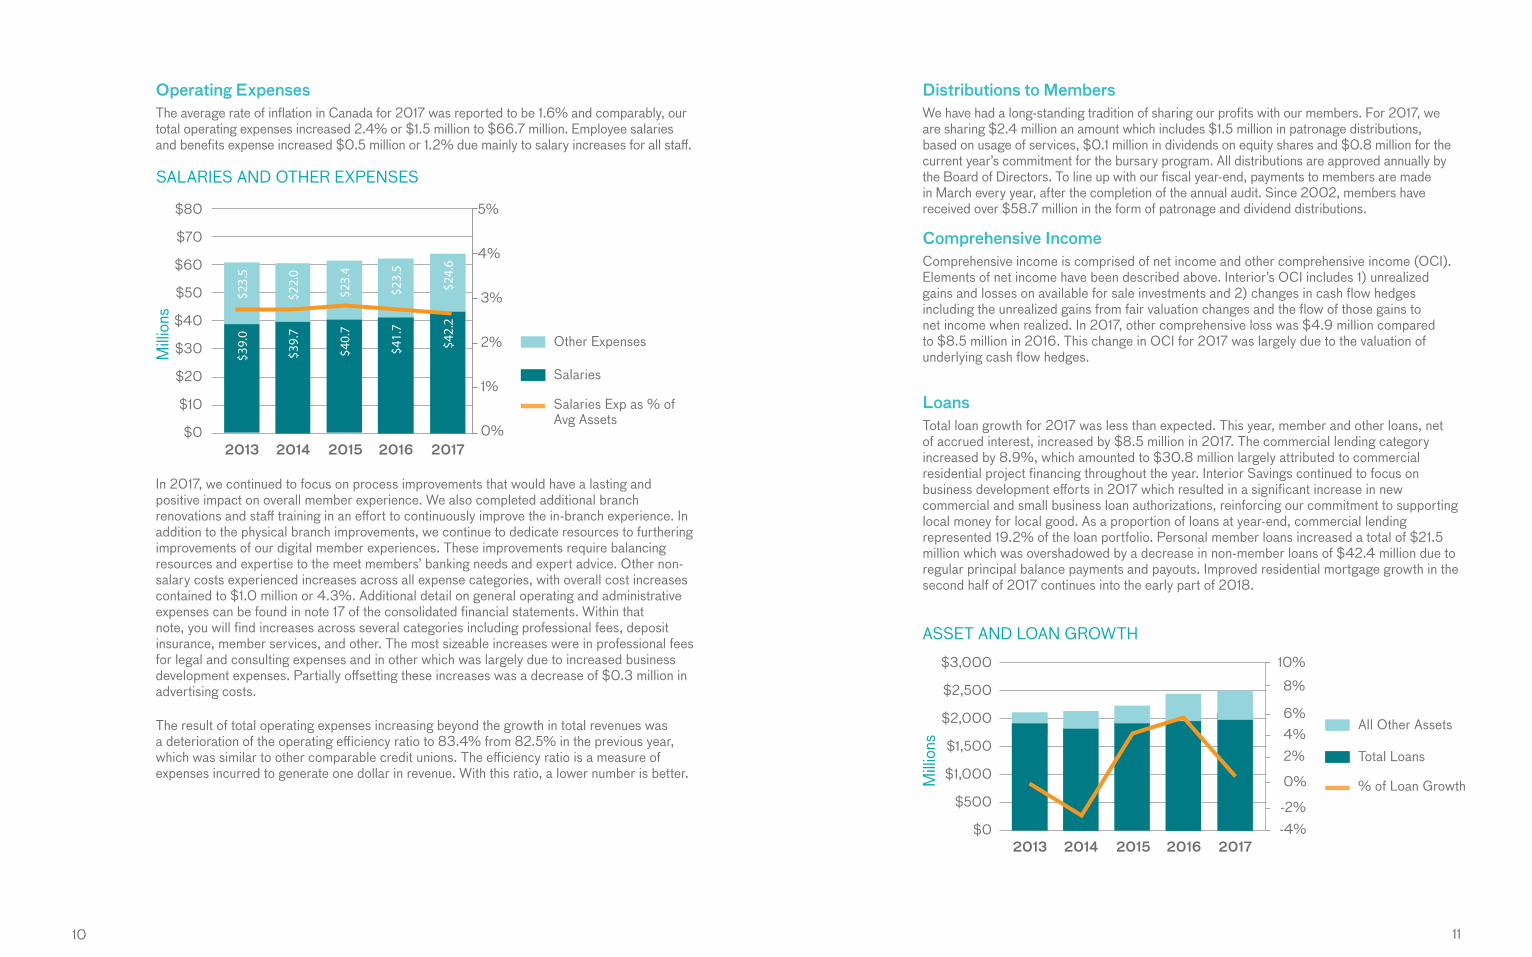
Operating ExpensesThe average rate of inflation in Canada for 2017 was reported to be 1.6% and comparably, our total operating expenses increased 2.4% or $1.5 million to $66.7 million. Employee salaries and benefits expense increased $0.5 million or 1.2% due mainly to salary increases for all staff.
In 2017, we continued to focus on process improvements that would have a lasting and positive impact on overall member experience. We also completed additional branch renovations and staff training in an effort to continuously improve the in-branch experience. In addition to the physical branch improvements, we continue to dedicate resources to furthering improvements of our digital member experiences. These improvements require balancing resources and expertise to the meet members’ banking needs and expert advice. Other non-salary costs experienced increases across all expense categories, with overall cost increases contained to $1.0 million or 4.3%. Additional detail on general operating and administrative expenses can be found in note 17 of the consolidated financial statements. Within that note, you will find increases across several categories including professional fees, deposit insurance, member services, and other. The most sizeable increases were in professional fees for legal and consulting expenses and in other which was largely due to increased business development expenses. Partially offsetting these increases was a decrease of $0.3 million in advertising costs.
The result of total operating expenses increasing beyond the growth in total revenues was a deterioration of the operating efficiency ratio to 83.4% from 82.5% in the previous year, which was similar to other comparable credit unions. The efficiency ratio is a measure of expenses incurred to generate one dollar in revenue. With this ratio, a lower number is better.
$80
$70
$60
$50
$40
$30
$20
$10
$0$2
4.6
$23.
5
$22.
0
$23.
4
$23.
5
2013 2014 2015 2016 2017
SALARIES AND OTHER EXPENSES
$42.
2
$39.
0
$39.
7
$40.
7
$41.
7
Salaries
Salaries Exp as % of Avg Assets
Other Expenses
Milli
ons
0%
1%
2%
3%
4%
5%
Total Loans
% of Loan Growth
All Other Assets
$3,000
$2,500
$2,000
$1,500
$1,000
$500
$0 -2% -4%
2013 2014 2015 2016 2017
ASSET AND LOAN GROWTH
0%
2%4%6%
8%
10%
Milli
ons
12 13
Members’ Equity and CapitalTotal members’ equity increased to $189.7 million at the end of 2017. Retained earnings grew by $7.9 million which was offset by a $4.9 million reduction in accumulated other comprehensive income. Interior Savings continues to have one of strongest capital positions, relative to other BC credit unions of similar size, which builds long-term membership value and enables us to invest for future growth. At year end, our regulatory capital position reduced slightly to 22.15%. Our regulators, the Financial Institutions Commission of BC (FICOM), monitor our capital, which under current requirements for regulatory capital and supervisory capital must be maintained at a minimum of 8% and 10%, respectively, of risk-weighted assets. Management regularly monitors our capital position. More information on capital management can be found in note 21 of the financial statements.
Risk ManagementAs a financial institution, we are exposed to a variety of risks. Our risk governance framework starts with the Board of Directors and its Committees which provide overall strategic direction, oversight of risk management and approved risk policies, and set risk tolerance levels for key areas of potential risk. Our executive management is responsible for implementing strategies and policies approved by the Board and for developing processes that identify, measure, monitor and mitigate risks. In addition to risks identified in note 20 to the financial statements, the credit union is also exposed to strategic, operational and regulatory risks, for which planning, policies and procedures, controls and monitoring are in place. To support our risk management, we have internal and external audit functions, which are independent of management and report to the Audit & Finance Committee of the Board. In addition, the Board of Directors has established a Risk Appetite framework and management has implemented an Enterprise Risk Management system to effectively monitor and manage key business risks including emerging risks.
Outlook for 2018Looking ahead to 2018, we expect the interest rate environment to be relatively stable with some further moderate increases expected in mortgage rates as the cost of funding increases. We also expect a continuation of our renewed growth in new members. While the financial services space is highly competitive, we are confident that our comprehensive and competitive product and service offering will result in strong growth in retail and commercial member loans, deposits, insurance services and wealth management. That is Local Money for Local Good.
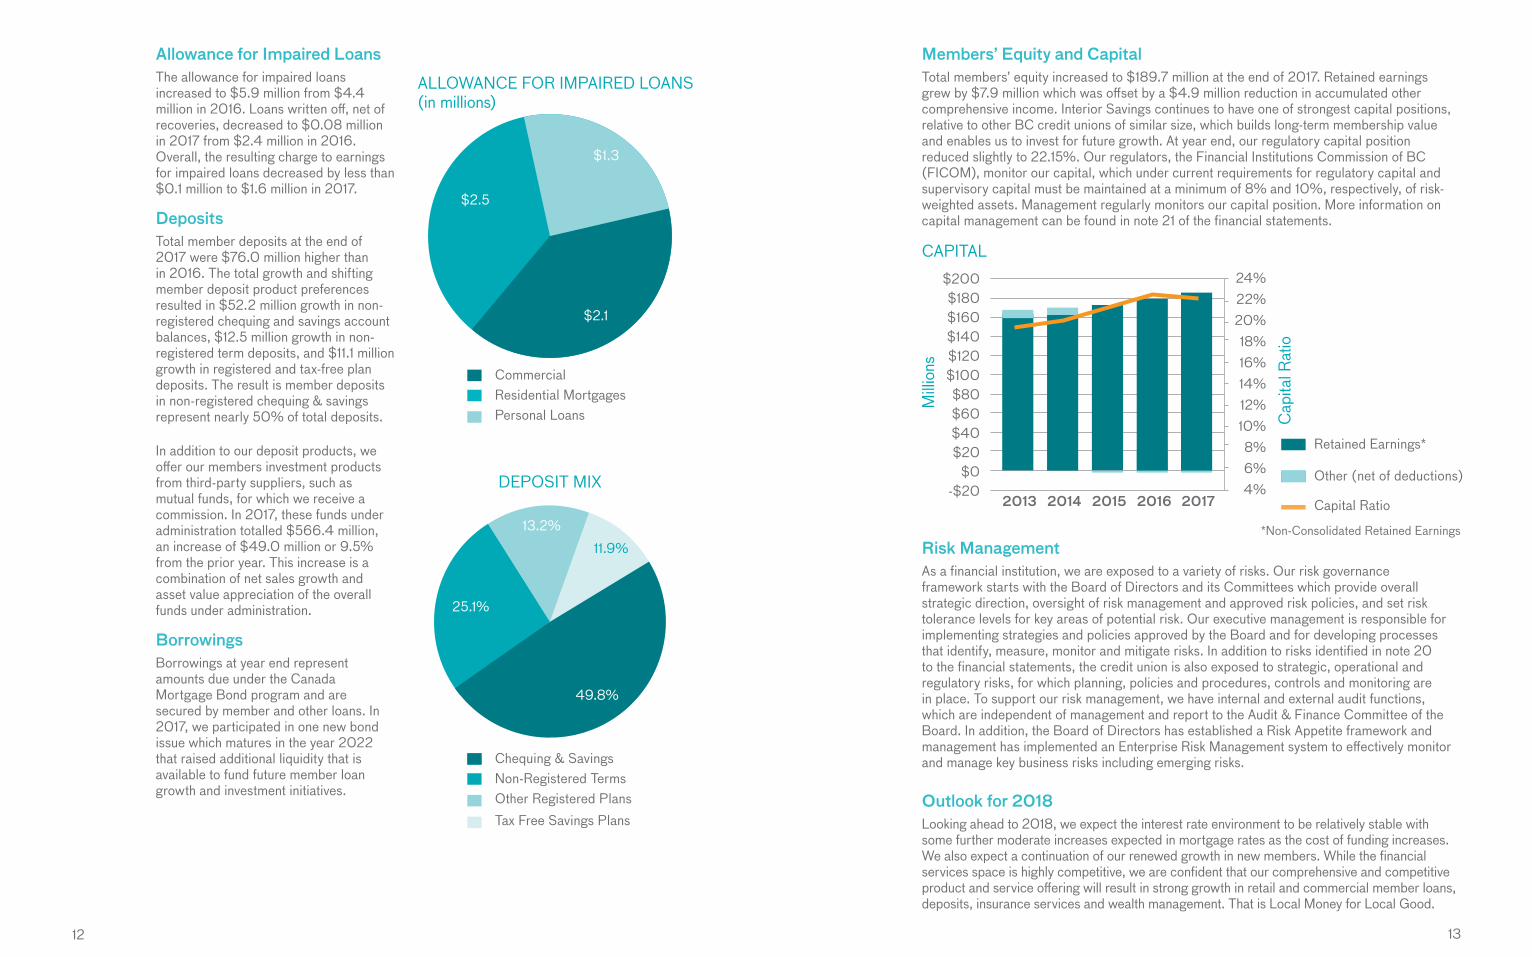
Allowance for Impaired LoansThe allowance for impaired loans increased to $5.9 million from $4.4 million in 2016. Loans written off, net of recoveries, decreased to $0.08 million in 2017 from $2.4 million in 2016. Overall, the resulting charge to earnings for impaired loans decreased by less than $0.1 million to $1.6 million in 2017.
DepositsTotal member deposits at the end of 2017 were $76.0 million higher than in 2016. The total growth and shifting member deposit product preferences resulted in $52.2 million growth in non-registered chequing and savings account balances, $12.5 million growth in non-registered term deposits, and $11.1 million growth in registered and tax-free plan deposits. The result is member deposits in non-registered chequing & savings represent nearly 50% of total deposits.
In addition to our deposit products, we offer our members investment products from third-party suppliers, such as mutual funds, for which we receive a commission. In 2017, these funds under administration totalled $566.4 million, an increase of $49.0 million or 9.5% from the prior year. This increase is a combination of net sales growth and asset value appreciation of the overall funds under administration.
BorrowingsBorrowings at year end represent amounts due under the Canada Mortgage Bond program and are secured by member and other loans. In 2017, we participated in one new bond issue which matures in the year 2022 that raised additional liquidity that is available to fund future member loan growth and investment initiatives.
49.8%
13.2%
11.9%
25.1%
$2.1
$1.3
$2.5
Other (net of deductions)
*Non-Consolidated Retained Earnings
Capital Ratio
Retained Earnings*
$200$180$160 $140 $120$100$80$60$40$20
$0-$20 4%
2013 2014 2015 2016 2017
CAPITAL
Cap
ital R
atio
8%6%
10%12%14%16%18%
20%22%24%
Milli
ons
ALLOWANCE FOR IMPAIRED LOANS (in millions)
Commercial
Personal LoansResidential Mortgages
DEPOSIT MIX
Chequing & Savings
Other Registered PlansTax Free Savings Plans
Non-Registered Terms
Consolidated Financial Statements
ConsolidatedFinancial StatementsIndependent Auditors’ Report
Consolidated Statement of Financial Position
Consolidated Statement of Income
Consolidated Statement of Comprehensive Income (Loss)
Consolidated Statement of Changes in Members’ Equity
Consolidated Statement of Cash Flows
Notes to the Consolidated Financial Statements
16
17
18
19
20
21
22
16 17
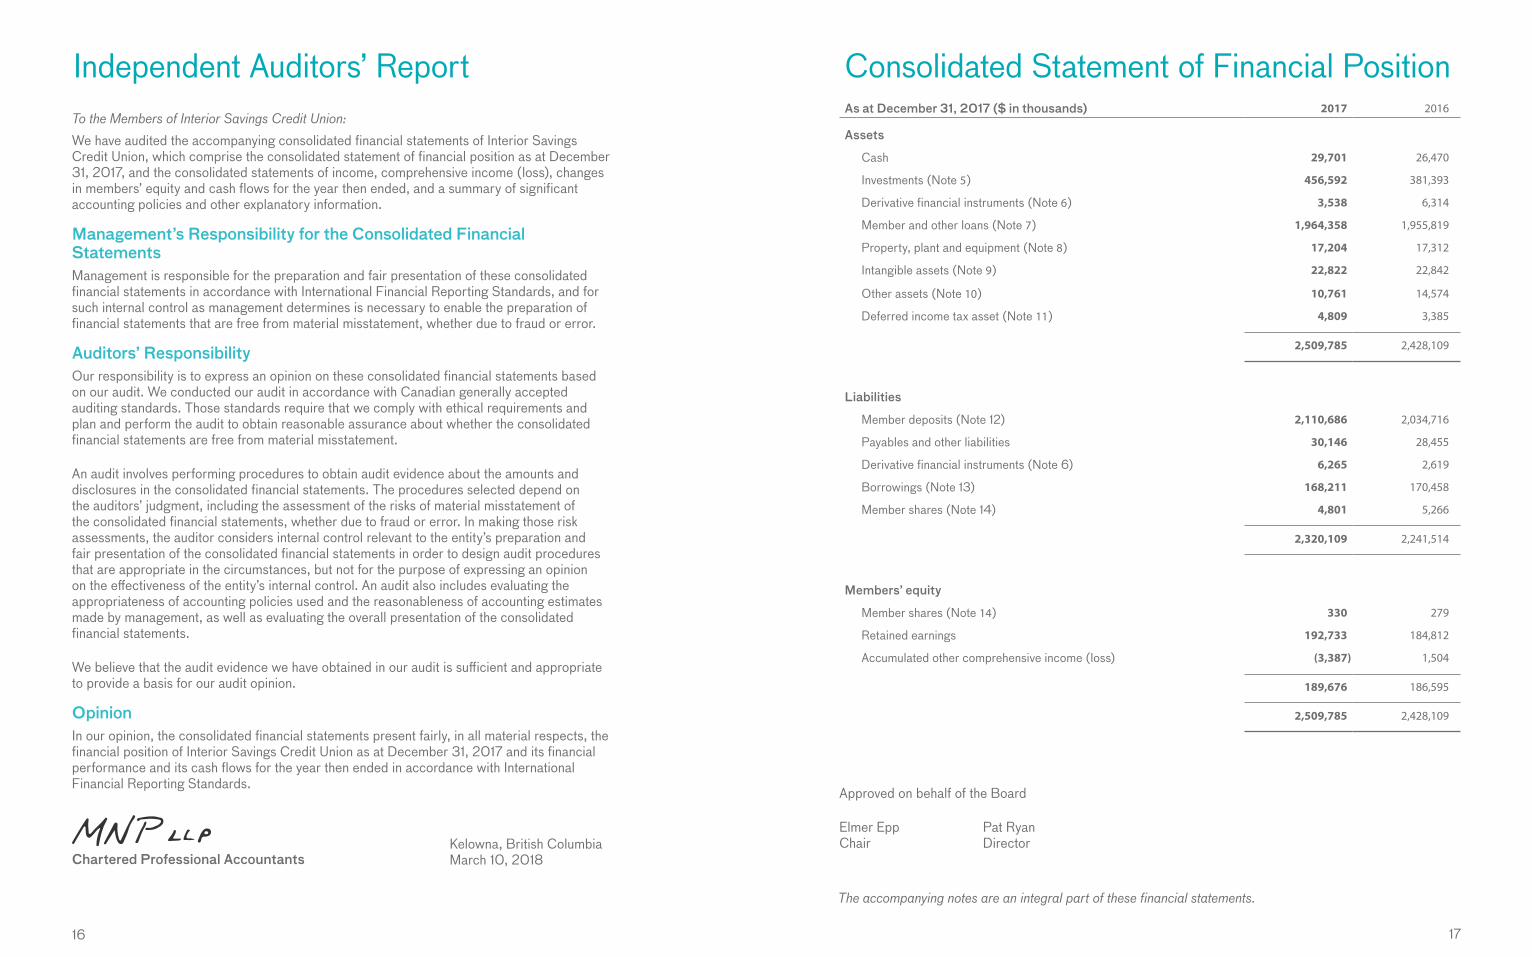
To the Members of Interior Savings Credit Union:We have audited the accompanying consolidated financial statements of Interior Savings Credit Union, which comprise the consolidated statement of financial position as at December 31, 2017, and the consolidated statements of income, comprehensive income (loss), changes in members’ equity and cash flows for the year then ended, and a summary of significant accounting policies and other explanatory information.
Management’s Responsibility for the Consolidated Financial StatementsManagement is responsible for the preparation and fair presentation of these consolidated financial statements in accordance with International Financial Reporting Standards, and for such internal control as management determines is necessary to enable the preparation of financial statements that are free from material misstatement, whether due to fraud or error.
Auditors’ ResponsibilityOur responsibility is to express an opinion on these consolidated financial statements based on our audit. We conducted our audit in accordance with Canadian generally accepted auditing standards. Those standards require that we comply with ethical requirements and plan and perform the audit to obtain reasonable assurance about whether the consolidated financial statements are free from material misstatement.
An audit involves performing procedures to obtain audit evidence about the amounts and disclosures in the consolidated financial statements. The procedures selected depend on the auditors’ judgment, including the assessment of the risks of material misstatement of the consolidated financial statements, whether due to fraud or error. In making those risk assessments, the auditor considers internal control relevant to the entity’s preparation and fair presentation of the consolidated financial statements in order to design audit procedures that are appropriate in the circumstances, but not for the purpose of expressing an opinion on the effectiveness of the entity’s internal control. An audit also includes evaluating the appropriateness of accounting policies used and the reasonableness of accounting estimates made by management, as well as evaluating the overall presentation of the consolidated financial statements.
We believe that the audit evidence we have obtained in our audit is sufficient and appropriate to provide a basis for our audit opinion.
OpinionIn our opinion, the consolidated financial statements present fairly, in all material respects, the financial position of Interior Savings Credit Union as at December 31, 2017 and its financial performance and its cash flows for the year then ended in accordance with International Financial Reporting Standards.
Chartered Professional Accountants
Independent Auditors’ Report
Kelowna, British Columbia March 10, 2018
Approved on behalf of the Board
Elmer Epp Pat Ryan Chair Director
The accompanying notes are an integral part of these financial statements.
Consolidated Statement of Financial Position As at December 31, 2017 ($ in thousands) 2017 2016
Assets
Cash 29,701 26,470
Investments (Note 5) 456,592 381,393
Derivative financial instruments (Note 6) 3,538 6,314
Member and other loans (Note 7) 1,964,358 1,955,819
Property, plant and equipment (Note 8) 17,204 17,312
Intangible assets (Note 9) 22,822 22,842
Other assets (Note 10) 10,761 14,574
Deferred income tax asset (Note 11) 4,809 3,385
2,509,785 2,428,109
Liabilities
Member deposits (Note 12) 2,110,686 2,034,716
Payables and other liabilities 30,146 28,455
Derivative financial instruments (Note 6) 6,265 2,619
Borrowings (Note 13) 168,211 170,458
Member shares (Note 14) 4,801 5,266
2,320,109 2,241,514
Members’ equity
Member shares (Note 14) 330 279
Retained earnings 192,733 184,812
Accumulated other comprehensive income (loss) (3,387) 1,504
189,676 186,595
2,509,785 2,428,109
18 19
The accompanying notes are an integral part of these financial statements. The accompanying notes are an integral part of these financial statements.
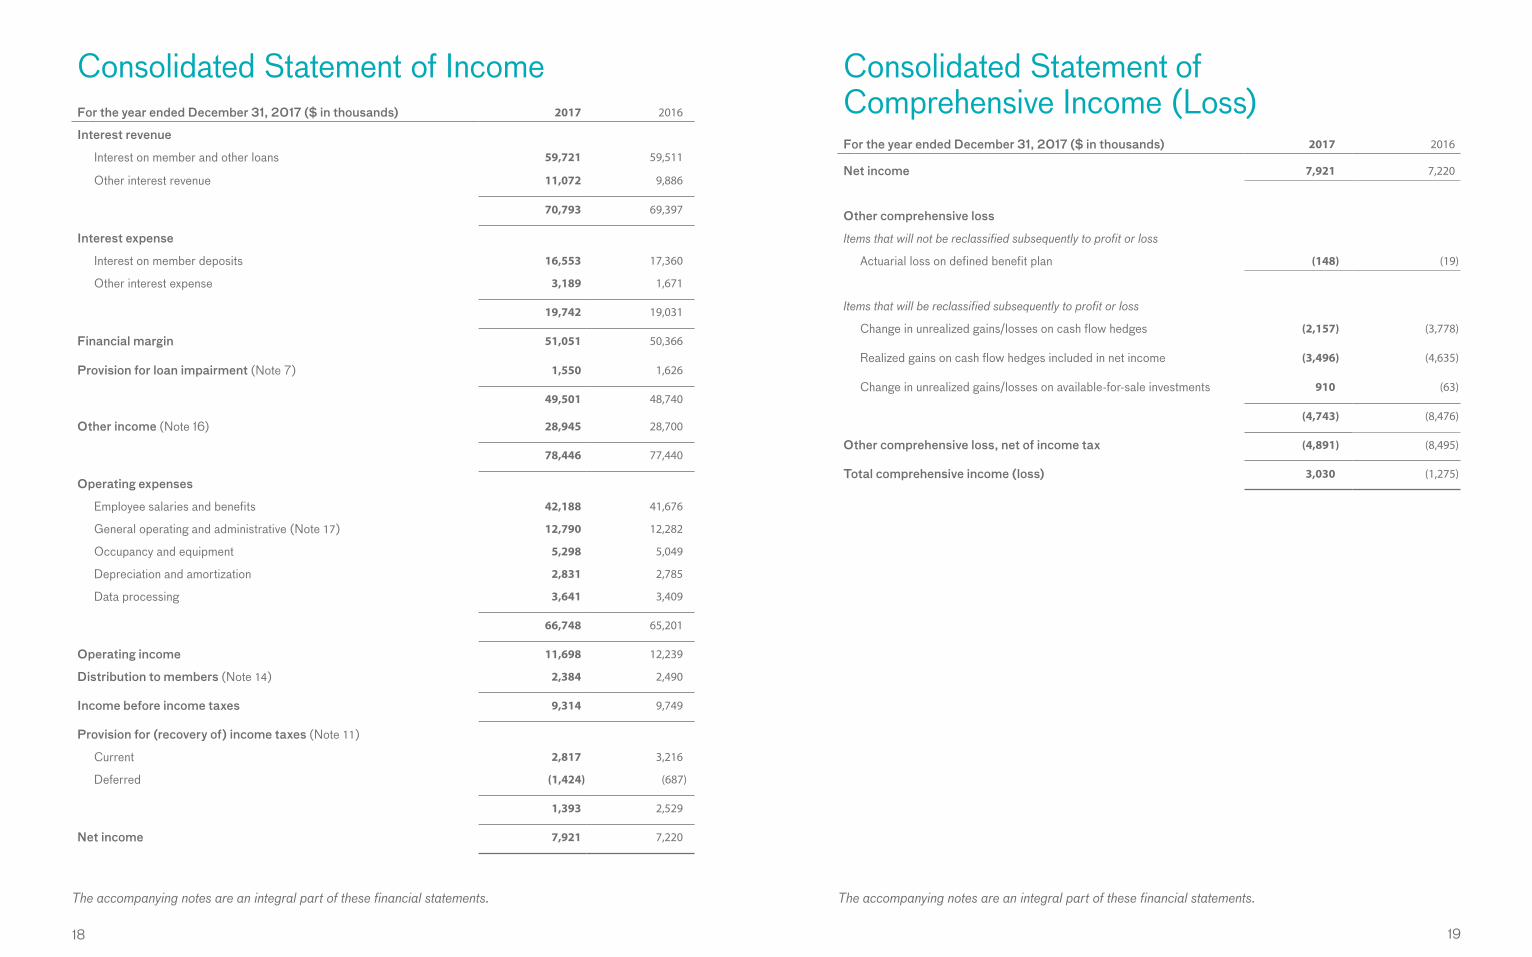
Consolidated Statement of Income For the year ended December 31, 2017 ($ in thousands) 2017 2016
Interest revenue
Interest on member and other loans 59,721 59,511
Other interest revenue 11,072 9,886
70,793 69,397
Interest expense
Interest on member deposits 16,553 17,360
Other interest expense 3,189 1,671
19,742 19,031
Financial margin 51,051 50,366
Provision for loan impairment (Note 7) 1,550 1,626
49,501 48,740
Other income (Note 16) 28,945 28,700
78,446 77,440
Operating expenses
Employee salaries and benefits 42,188 41,676
General operating and administrative (Note 17) 12,790 12,282
Occupancy and equipment 5,298 5,049
Depreciation and amortization 2,831 2,785
Data processing 3,641 3,409
66,748 65,201
Operating income 11,698 12,239
Distribution to members (Note 14) 2,384 2,490
Income before income taxes 9,314 9,749
Provision for (recovery of) income taxes (Note 11)
Current 2,817 3,216
Deferred (1,424) (687)
1,393 2,529
Net income 7,921 7,220
Consolidated Statement of Comprehensive Income (Loss)For the year ended December 31, 2017 ($ in thousands) 2017 2016
Net income 7,921 7,220
Other comprehensive loss
Items that will not be reclassified subsequently to profit or loss
Actuarial loss on defined benefit plan (148) (19)
Items that will be reclassified subsequently to profit or loss
Change in unrealized gains/losses on cash flow hedges (2,157) (3,778)
Realized gains on cash flow hedges included in net income (3,496) (4,635)
Change in unrealized gains/losses on available-for-sale investments 910 (63)
(4,743) (8,476)
Other comprehensive loss, net of income tax (4,891) (8,495)
Total comprehensive income (loss) 3,030 (1,275)
20 21
The accompanying notes are an integral part of these financial statements. The accompanying notes are an integral part of these financial statements.
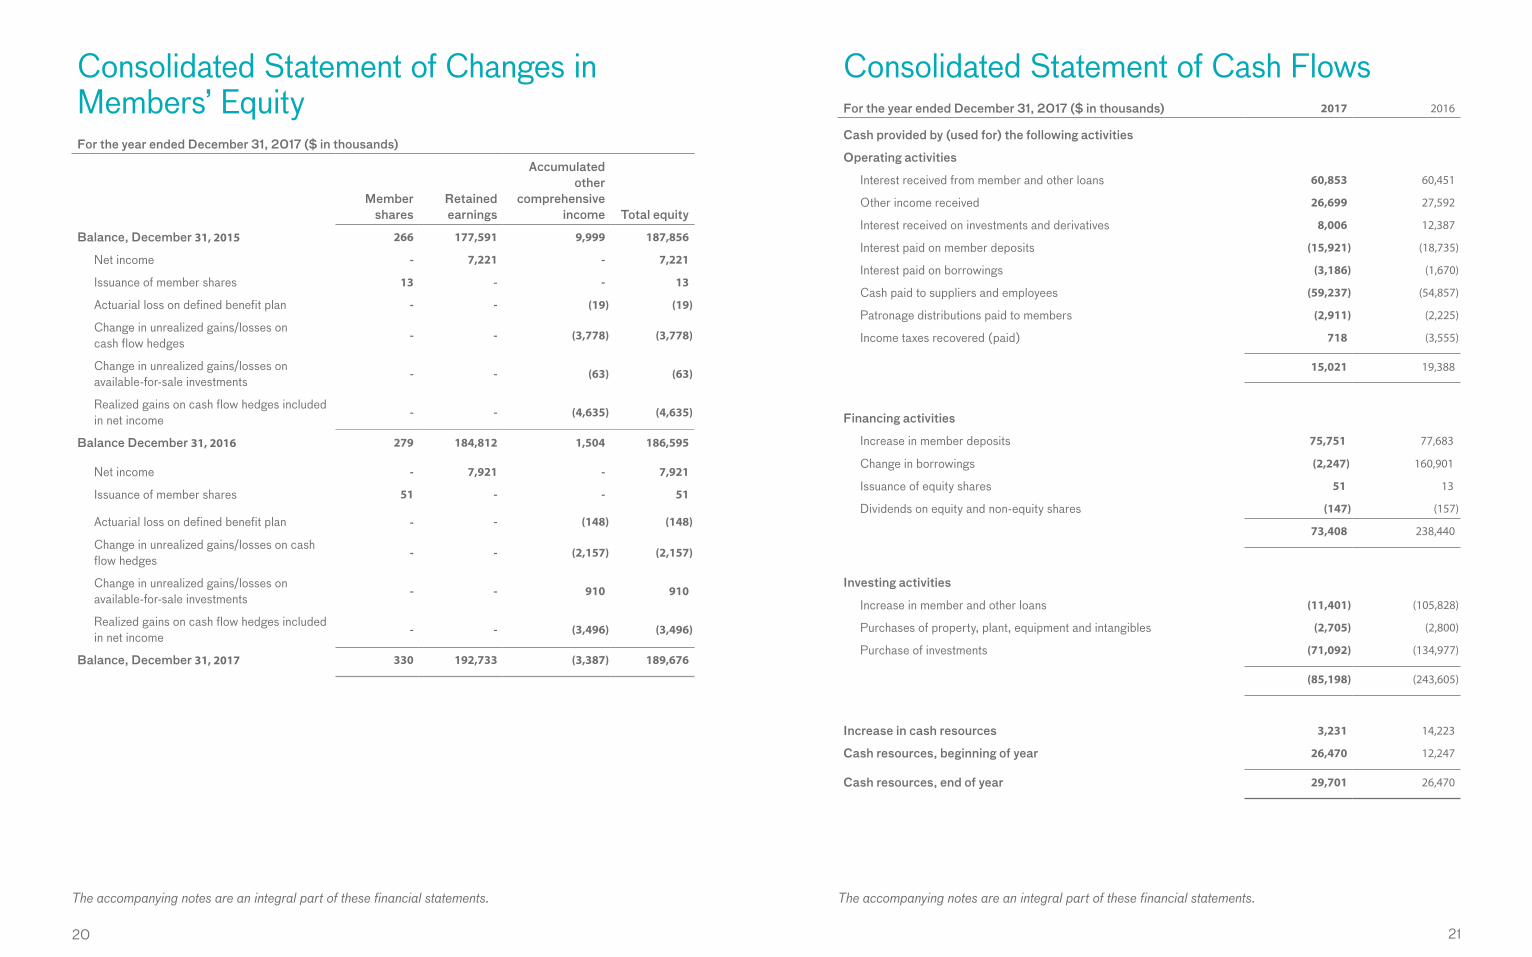
Consolidated Statement of Changes in Members’ EquityFor the year ended December 31, 2017 ($ in thousands)
Member shares
Retained earnings
Accumulated other
comprehensive income Total equity
Balance, December 31, 2015 266 177,591 9,999 187,856
Net income - 7,221 - 7,221
Issuance of member shares 13 - - 13
Actuarial loss on defined benefit plan - - (19) (19)
Change in unrealized gains/losses on cash flow hedges
- - (3,778) (3,778)
Change in unrealized gains/losses on available-for-sale investments
- - (63) (63)
Realized gains on cash flow hedges included in net income
- - (4,635) (4,635)
Balance December 31, 2016 279 184,812 1,504 186,595
Net income - 7,921 - 7,921
Issuance of member shares 51 - - 51
Actuarial loss on defined benefit plan - - (148) (148)
Change in unrealized gains/losses on cash flow hedges
- - (2,157) (2,157)
Change in unrealized gains/losses on available-for-sale investments
- - 910 910
Realized gains on cash flow hedges included in net income
- - (3,496) (3,496)
Balance, December 31, 2017 330 192,733 (3,387) 189,676
Consolidated Statement of Cash FlowsFor the year ended December 31, 2017 ($ in thousands) 2017 2016
Cash provided by (used for) the following activities
Operating activities
Interest received from member and other loans 60,853 60,451
Other income received 26,699 27,592
Interest received on investments and derivatives 8,006 12,387
Interest paid on member deposits (15,921) (18,735)
Interest paid on borrowings (3,186) (1,670)
Cash paid to suppliers and employees (59,237) (54,857)
Patronage distributions paid to members (2,911) (2,225)
Income taxes recovered (paid) 718 (3,555)
15,021 19,388
Financing activities
Increase in member deposits 75,751 77,683
Change in borrowings (2,247) 160,901
Issuance of equity shares 51 13
Dividends on equity and non-equity shares (147) (157)
73,408 238,440
Investing activities
Increase in member and other loans (11,401) (105,828)
Purchases of property, plant, equipment and intangibles (2,705) (2,800)
Purchase of investments (71,092) (134,977)
(85,198) (243,605)
Increase in cash resources 3,231 14,223
Cash resources, beginning of year 26,470 12,247
Cash resources, end of year 29,701 26,470
2322
Notes to the Consolidated Financial Statements
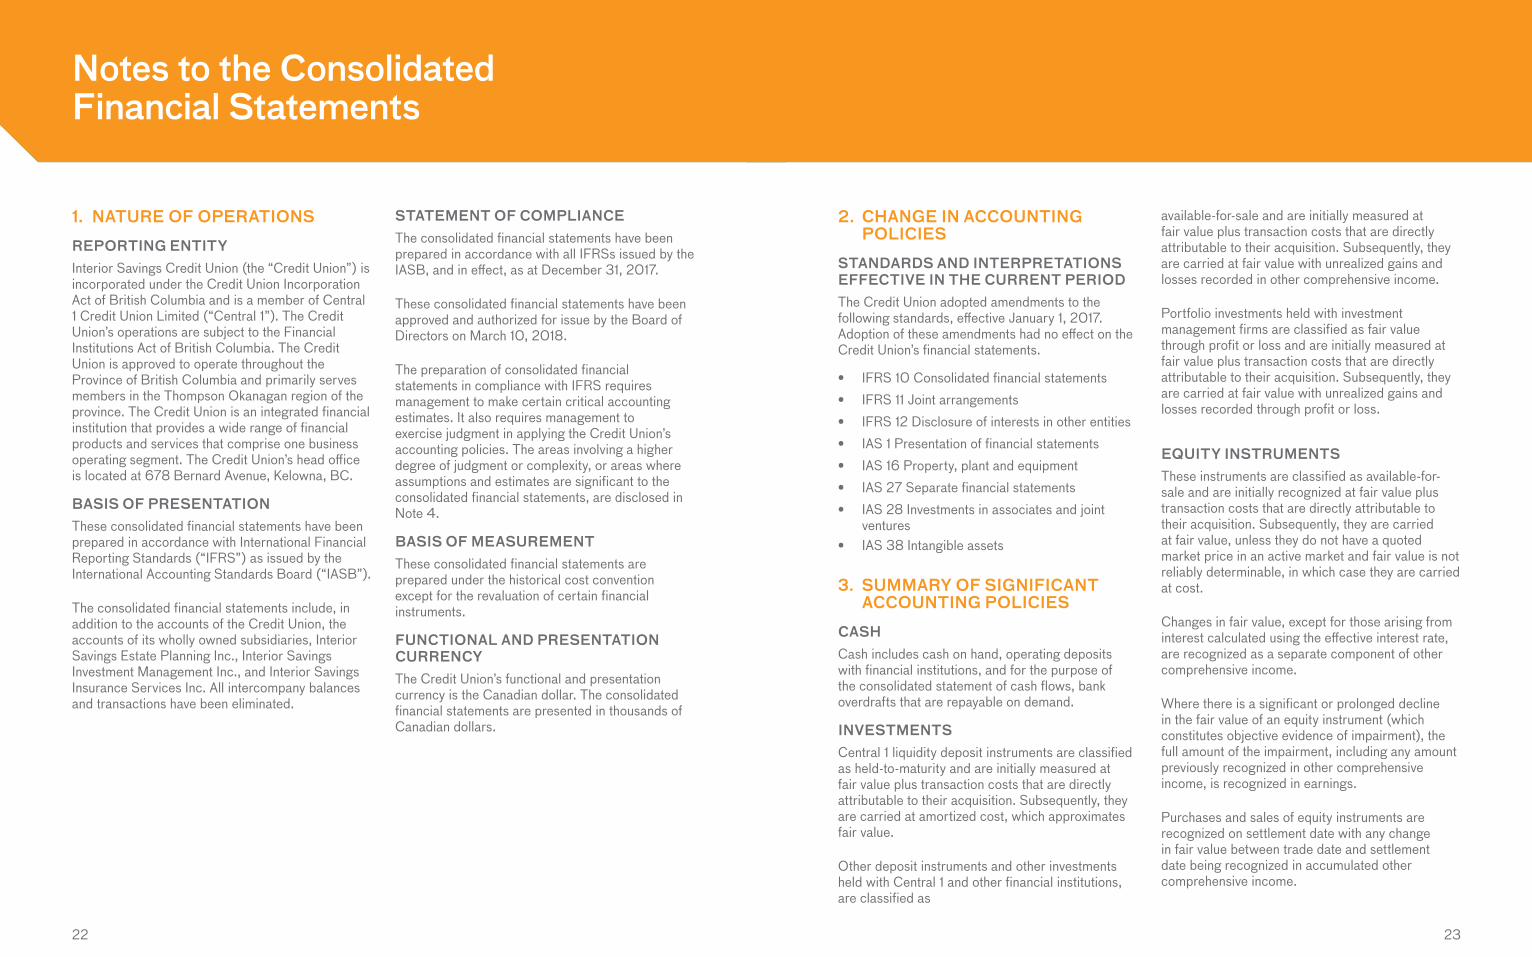
1. NATURE OF OPERATIONS
REPORTING ENTITYInterior Savings Credit Union (the “Credit Union”) is incorporated under the Credit Union Incorporation Act of British Columbia and is a member of Central 1 Credit Union Limited (“Central 1”). The Credit Union’s operations are subject to the Financial Institutions Act of British Columbia. The Credit Union is approved to operate throughout the Province of British Columbia and primarily serves members in the Thompson Okanagan region of the province. The Credit Union is an integrated financial institution that provides a wide range of financial products and services that comprise one business operating segment. The Credit Union’s head office is located at 678 Bernard Avenue, Kelowna, BC.
BASIS OF PRESENTATIONThese consolidated financial statements have been prepared in accordance with International Financial Reporting Standards (“IFRS”) as issued by the International Accounting Standards Board (“IASB”).
The consolidated financial statements include, in addition to the accounts of the Credit Union, the accounts of its wholly owned subsidiaries, Interior Savings Estate Planning Inc., Interior Savings Investment Management Inc., and Interior Savings Insurance Services Inc. All intercompany balances and transactions have been eliminated.
STATEMENT OF COMPLIANCEThe consolidated financial statements have been prepared in accordance with all IFRSs issued by the IASB, and in effect, as at December 31, 2017.
These consolidated financial statements have been approved and authorized for issue by the Board of Directors on March 10, 2018.
The preparation of consolidated financial statements in compliance with IFRS requires management to make certain critical accounting estimates. It also requires management to exercise judgment in applying the Credit Union’s accounting policies. The areas involving a higher degree of judgment or complexity, or areas where assumptions and estimates are significant to the consolidated financial statements, are disclosed in Note 4.
BASIS OF MEASUREMENTThese consolidated financial statements are prepared under the historical cost convention except for the revaluation of certain financial instruments.
FUNCTIONAL AND PRESENTATION CURRENCYThe Credit Union’s functional and presentation currency is the Canadian dollar. The consolidated financial statements are presented in thousands of Canadian dollars.
2. CHANGE IN ACCOUNTING POLICIES
STANDARDS AND INTERPRETATIONS EFFECTIVE IN THE CURRENT PERIODThe Credit Union adopted amendments to the following standards, effective January 1, 2017. Adoption of these amendments had no effect on the Credit Union’s financial statements.
• IFRS 10 Consolidated financial statements• IFRS 11 Joint arrangements• IFRS 12 Disclosure of interests in other entities• IAS 1 Presentation of financial statements• IAS 16 Property, plant and equipment• IAS 27 Separate financial statements• IAS 28 Investments in associates and joint
ventures• IAS 38 Intangible assets
3. SUMMARY OF SIGNIFICANT ACCOUNTING POLICIES
CASHCash includes cash on hand, operating deposits with financial institutions, and for the purpose of the consolidated statement of cash flows, bank overdrafts that are repayable on demand.
INVESTMENTSCentral 1 liquidity deposit instruments are classified as held-to-maturity and are initially measured at fair value plus transaction costs that are directly attributable to their acquisition. Subsequently, they are carried at amortized cost, which approximates fair value.
Other deposit instruments and other investments held with Central 1 and other financial institutions, are classified as
available-for-sale and are initially measured at fair value plus transaction costs that are directly attributable to their acquisition. Subsequently, they are carried at fair value with unrealized gains and losses recorded in other comprehensive income.
Portfolio investments held with investment management firms are classified as fair value through profit or loss and are initially measured at fair value plus transaction costs that are directly attributable to their acquisition. Subsequently, they are carried at fair value with unrealized gains and losses recorded through profit or loss.
EQUITY INSTRUMENTSThese instruments are classified as available-for-sale and are initially recognized at fair value plus transaction costs that are directly attributable to their acquisition. Subsequently, they are carried at fair value, unless they do not have a quoted market price in an active market and fair value is not reliably determinable, in which case they are carried at cost.
Changes in fair value, except for those arising from interest calculated using the effective interest rate, are recognized as a separate component of other comprehensive income.
Where there is a significant or prolonged decline in the fair value of an equity instrument (which constitutes objective evidence of impairment), the full amount of the impairment, including any amount previously recognized in other comprehensive income, is recognized in earnings.
Purchases and sales of equity instruments are recognized on settlement date with any change in fair value between trade date and settlement date being recognized in accumulated other comprehensive income.
24 25
On sale, the amount held in accumulated other comprehensive income associated with that instrument is removed from equity and recognized in earnings.
DERIVATIVE FINANCIAL INSTRUMENTS AND HEDGING ACTIVITIESDerivative financial instruments are financial contracts whose value is derived from an underlying interest rate, foreign exchange rate, equity instrument or index. In the ordinary course of business, the Credit Union enters into derivative transactions for asset/liability management. Derivatives are reported on the consolidated statement of financial position at their fair value.
HedgesThe Credit Union, in accordance with its risk management strategies, manages interest rate risk through interest rate swaps.
Hedge accounting is applied to financial assets and financial liabilities only where all of the following criteria are met:
• At the inception of the hedge there is formal designation and documentation of the hedging relationship and the Credit Union’s risk management objective and strategy for undertaking the hedge;
• For cash flow hedges, the hedged item in a forecast transaction is highly probable and presents an exposure to variations in cash flows that could ultimately affect profit or loss;
• The effectiveness of the hedge can be reliably measured; and
• The hedge is expected to be highly effective at inception and remains highly effective on each date it is tested. The Credit Union tests the effectiveness of its hedges on an annual basis.
The swap contracts can be designated as fair value hedge instruments or cash flow hedge instruments. The Credit Union has not entered into any fair value hedges at this time.
Cash flow hedges modify exposure to variability in cash flows for variable rate interest bearing instruments or the forecasted assurance of fixed rate liabilities. The Credit Union’s cash flow hedges
include hedges of floating rate loans, embedded derivatives, other derivatives related to index-linked deposits and certain foreign exchange positions.
For cash flow hedges that meet the hedging documentation criteria, gains and losses resulting from changes in the fair value of the effective portion of the derivative instrument are recorded in other comprehensive income until the hedged item is recognized in income, at which time such change is recognized as interest income. The ineffective portion is recognized immediately in income as other interest revenue/expense.
If the Credit Union closes out its hedge position early, the cumulative gains and losses recognized in other comprehensive income are frozen and reclassified from the cash flow hedge reserve to profit or loss using the effective interest method. The ineffective portion of gains and losses on derivatives used to manage cash flow interest rate risk are recognized in earnings within interest expense or interest revenue.
Non-qualifying derivative financial instrumentsDerivative financial instruments that do not qualify for hedge accounting, or are not designated under IAS 39 as hedges, are carried at fair value. Changes in fair value are reported in current period earnings.
MEMBER AND OTHER LOANSAll member and other loans are non-derivative financial assets with fixed or determinable payments that are not quoted in an active market and have been classified as loans and receivables. Member and other loans are initially measured at fair value, net of loan origination fees and inclusive of transaction costs incurred. Member and other loans are subsequently measured at amortized cost, using the effective interest rate method, less any impairment losses.
Loans to members and others are reported at their recoverable amount representing the aggregate amount of principal, less any allowance or provision for impaired loans plus accrued interest. Interest is accounted for on the accrual basis for all loans.
If there is objective evidence that an impairment loss on member and other loans carried at amortized cost has been incurred, the amount of the loss is measured as the difference between the loans carrying amount and the present value of expected cash flows discounted at the loans original effective interest rate, short term balances are not discounted.
MEMBER AND OTHER LOAN LOSSESBad debts are written off from time to time as determined by management and approved by the Board of Directors when it is reasonable to expect that the recovery of the debt is unlikely. Bad debts are written off against the provisions for impairment, if a provision for impairment had previously been recognized. If no provision had been recognized, the write offs are recognized an expense in earnings.
IMPAIRMENT OF FINANCIAL ASSETSFor financial assets carried at amortized cost, the Credit Union first assesses whether objective evidence of impairment exists individually for financial assets that are individually significant. If it is determined that no objective evidence of impairment exists for an individually assessed financial asset, whether significant or not, it includes the financial asset in a group of financial assets with similar credit risk characteristics and that group of financial assets is collectively assessed for impairment. Financial assets that are individually assessed for impairment and for which an impairment loss is, or continues to be, recognized are not included in a collective assessment for impairment. The expected future cash outflows for a group of financial assets with similar credit risk characteristics are estimated based on historical loss experience.
If, in a subsequent period, the amount of the impairment loss decreases and the decrease can be related objectively to an event occurring after the impairment was recognized, the previously recognized impairment loss is reversed. Any such reversal of an impairment loss is recognized in earnings.
PROPERTY, PLANT AND EQUIPMENTProperty, plant and equipment is initially recorded at cost and subsequently measured at cost less accumulated depreciation and any accumulated impairment losses, with the exception of land which is not depreciated. Depreciation is recognized in earnings and is provided on a straight-line basis over the estimated useful life of the assets as follows:
RateBuildings 20 or 40 yearsComputer equipment 3 yearsLeasehold improvements Lease term to a
maximum of 10 yearsFurniture, fixtures and other
5 or 10 years
Branch improvements 10 years
Depreciation methods, useful lives and residual values are reviewed annually and adjusted if necessary.
INTANGIBLE ASSETSIntangible assets consist of Insurance Corporation of British Columbia (“ICBC”) licenses which are determined to have an indefinite useful life and are not being amortized. Any impairment in the value of the intangible asset is written off against earnings.
The customer lists determined to have a definite useful life are amortized based on the estimated useful life of 10 years, straight-line basis. Any impairment in the value of the intangible asset is written off against earnings.
Goodwill, being the excess of cost over assigned values of net assets acquired, is stated at cost less any write-down for impairment in value. The fair value of goodwill is regularly evaluated by reviewing the returns of the related business, taking into account the risk associated with the investment. Any impairment in the value of the goodwill is written off against earnings in the year in which impairment is determined.
26 27
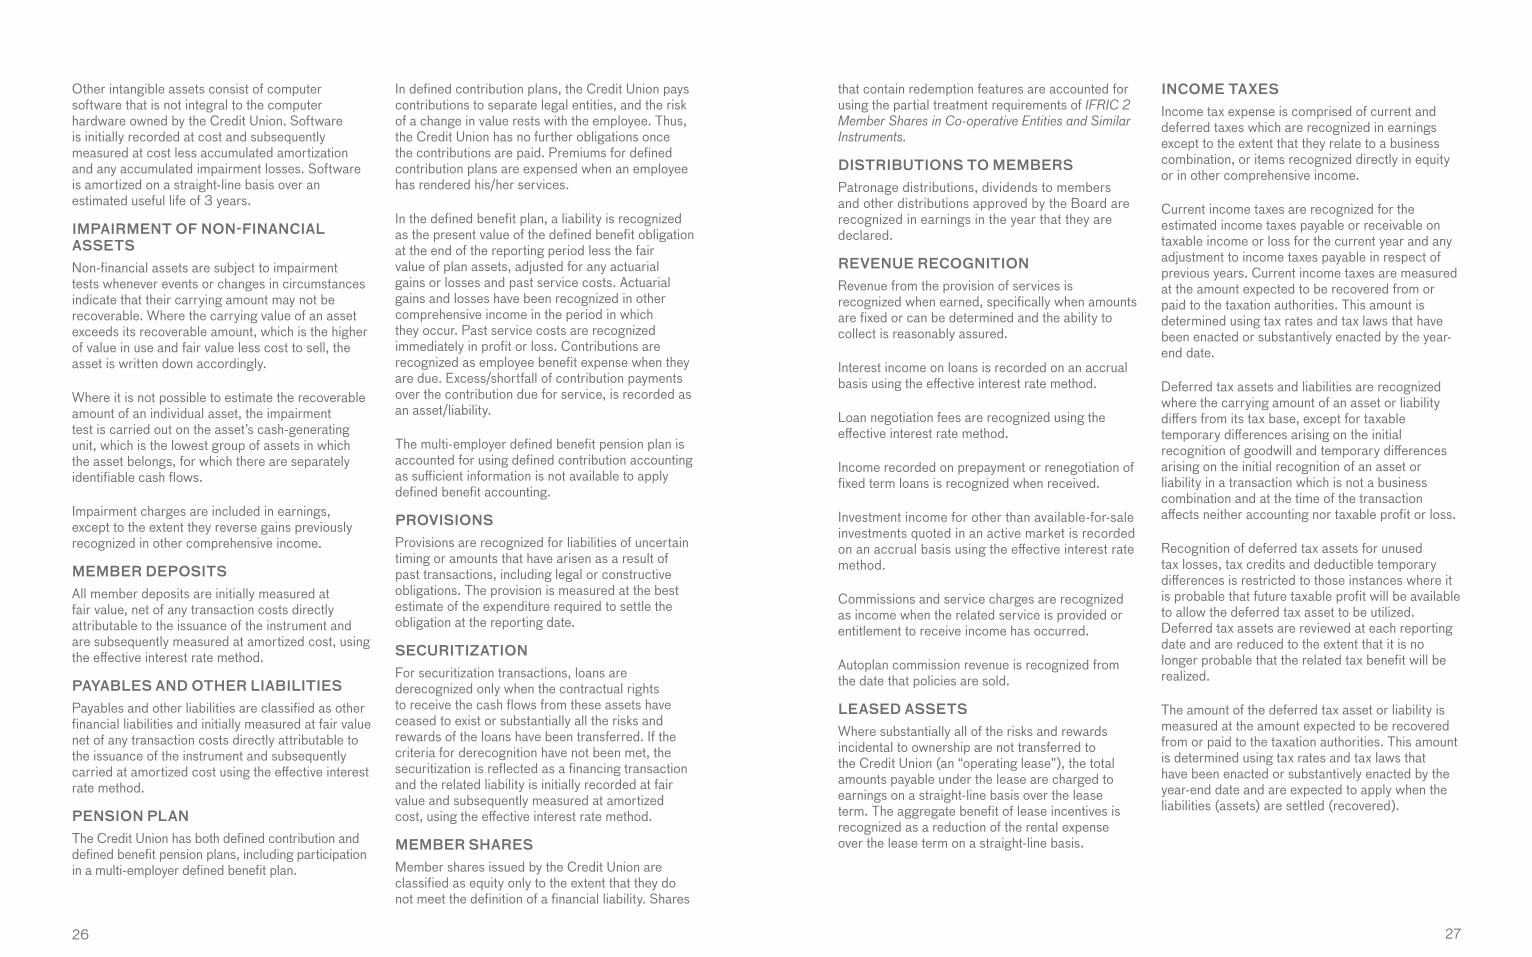
Other intangible assets consist of computer software that is not integral to the computer hardware owned by the Credit Union. Software is initially recorded at cost and subsequently measured at cost less accumulated amortization and any accumulated impairment losses. Software is amortized on a straight-line basis over an estimated useful life of 3 years.
IMPAIRMENT OF NON-FINANCIAL ASSETSNon-financial assets are subject to impairment tests whenever events or changes in circumstances indicate that their carrying amount may not be recoverable. Where the carrying value of an asset exceeds its recoverable amount, which is the higher of value in use and fair value less cost to sell, the asset is written down accordingly.
Where it is not possible to estimate the recoverable amount of an individual asset, the impairment test is carried out on the asset’s cash-generating unit, which is the lowest group of assets in which the asset belongs, for which there are separately identifiable cash flows.
Impairment charges are included in earnings, except to the extent they reverse gains previously recognized in other comprehensive income.
MEMBER DEPOSITSAll member deposits are initially measured at fair value, net of any transaction costs directly attributable to the issuance of the instrument and are subsequently measured at amortized cost, using the effective interest rate method.
PAYABLES AND OTHER LIABILITIESPayables and other liabilities are classified as other financial liabilities and initially measured at fair value net of any transaction costs directly attributable to the issuance of the instrument and subsequently carried at amortized cost using the effective interest rate method.
PENSION PLANThe Credit Union has both defined contribution and defined benefit pension plans, including participation in a multi-employer defined benefit plan.
In defined contribution plans, the Credit Union pays contributions to separate legal entities, and the risk of a change in value rests with the employee. Thus, the Credit Union has no further obligations once the contributions are paid. Premiums for defined contribution plans are expensed when an employee has rendered his/her services.
In the defined benefit plan, a liability is recognized as the present value of the defined benefit obligation at the end of the reporting period less the fair value of plan assets, adjusted for any actuarial gains or losses and past service costs. Actuarial gains and losses have been recognized in other comprehensive income in the period in which they occur. Past service costs are recognized immediately in profit or loss. Contributions are recognized as employee benefit expense when they are due. Excess/shortfall of contribution payments over the contribution due for service, is recorded as an asset/liability.
The multi-employer defined benefit pension plan is accounted for using defined contribution accounting as sufficient information is not available to apply defined benefit accounting.
PROVISIONSProvisions are recognized for liabilities of uncertain timing or amounts that have arisen as a result of past transactions, including legal or constructive obligations. The provision is measured at the best estimate of the expenditure required to settle the obligation at the reporting date.
SECURITIZATIONFor securitization transactions, loans are derecognized only when the contractual rights to receive the cash flows from these assets have ceased to exist or substantially all the risks and rewards of the loans have been transferred. If the criteria for derecognition have not been met, the securitization is reflected as a financing transaction and the related liability is initially recorded at fair value and subsequently measured at amortized cost, using the effective interest rate method.
MEMBER SHARESMember shares issued by the Credit Union are classified as equity only to the extent that they do not meet the definition of a financial liability. Shares
that contain redemption features are accounted for using the partial treatment requirements of IFRIC 2 Member Shares in Co-operative Entities and Similar Instruments.
DISTRIBUTIONS TO MEMBERSPatronage distributions, dividends to members and other distributions approved by the Board are recognized in earnings in the year that they are declared.
REVENUE RECOGNITIONRevenue from the provision of services is recognized when earned, specifically when amounts are fixed or can be determined and the ability to collect is reasonably assured.
Interest income on loans is recorded on an accrual basis using the effective interest rate method.
Loan negotiation fees are recognized using the effective interest rate method.
Income recorded on prepayment or renegotiation of fixed term loans is recognized when received.
Investment income for other than available-for-sale investments quoted in an active market is recorded on an accrual basis using the effective interest rate method.
Commissions and service charges are recognized as income when the related service is provided or entitlement to receive income has occurred.
Autoplan commission revenue is recognized from the date that policies are sold.
LEASED ASSETSWhere substantially all of the risks and rewards incidental to ownership are not transferred to the Credit Union (an “operating lease”), the total amounts payable under the lease are charged to earnings on a straight-line basis over the lease term. The aggregate benefit of lease incentives is recognized as a reduction of the rental expense over the lease term on a straight-line basis.
INCOME TAXESIncome tax expense is comprised of current and deferred taxes which are recognized in earnings except to the extent that they relate to a business combination, or items recognized directly in equity or in other comprehensive income.
Current income taxes are recognized for the estimated income taxes payable or receivable on taxable income or loss for the current year and any adjustment to income taxes payable in respect of previous years. Current income taxes are measured at the amount expected to be recovered from or paid to the taxation authorities. This amount is determined using tax rates and tax laws that have been enacted or substantively enacted by the year-end date.
Deferred tax assets and liabilities are recognized where the carrying amount of an asset or liability differs from its tax base, except for taxable temporary differences arising on the initial recognition of goodwill and temporary differences arising on the initial recognition of an asset or liability in a transaction which is not a business combination and at the time of the transaction affects neither accounting nor taxable profit or loss.
Recognition of deferred tax assets for unused tax losses, tax credits and deductible temporary differences is restricted to those instances where it is probable that future taxable profit will be available to allow the deferred tax asset to be utilized. Deferred tax assets are reviewed at each reporting date and are reduced to the extent that it is no longer probable that the related tax benefit will be realized.
The amount of the deferred tax asset or liability is measured at the amount expected to be recovered from or paid to the taxation authorities. This amount is determined using tax rates and tax laws that have been enacted or substantively enacted by the year-end date and are expected to apply when the liabilities (assets) are settled (recovered).
28 29
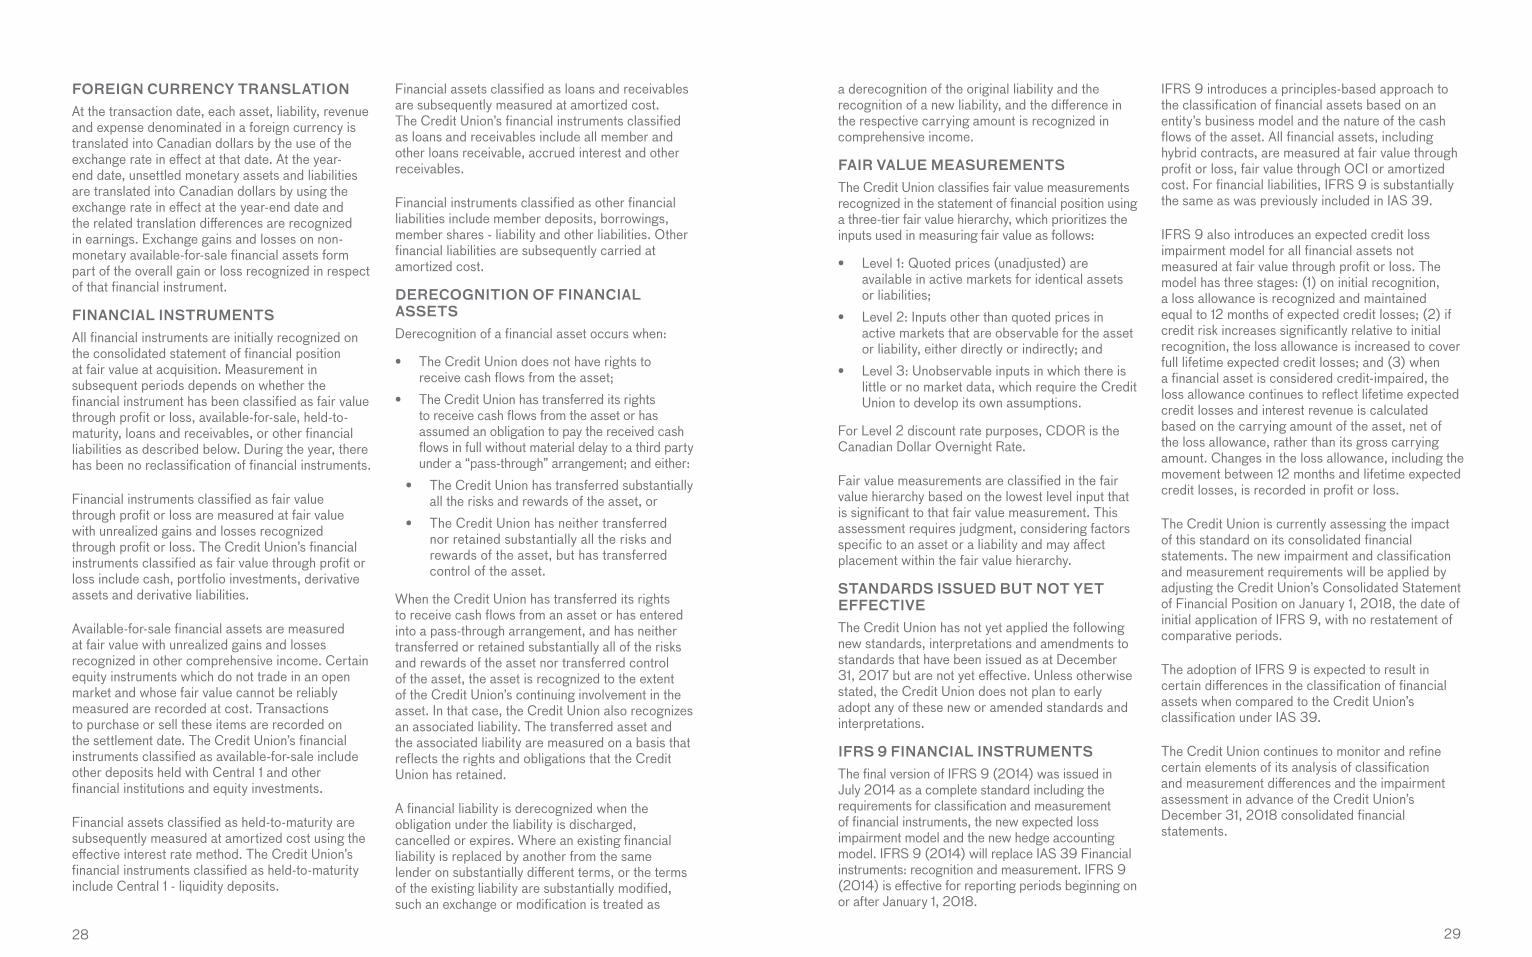
FOREIGN CURRENCY TRANSLATIONAt the transaction date, each asset, liability, revenue and expense denominated in a foreign currency is translated into Canadian dollars by the use of the exchange rate in effect at that date. At the year-end date, unsettled monetary assets and liabilities are translated into Canadian dollars by using the exchange rate in effect at the year-end date and the related translation differences are recognized in earnings. Exchange gains and losses on non-monetary available-for-sale financial assets form part of the overall gain or loss recognized in respect of that financial instrument.
FINANCIAL INSTRUMENTSAll financial instruments are initially recognized on the consolidated statement of financial position at fair value at acquisition. Measurement in subsequent periods depends on whether the financial instrument has been classified as fair value through profit or loss, available-for-sale, held-to-maturity, loans and receivables, or other financial liabilities as described below. During the year, there has been no reclassification of financial instruments.
Financial instruments classified as fair value through profit or loss are measured at fair value with unrealized gains and losses recognized through profit or loss. The Credit Union’s financial instruments classified as fair value through profit or loss include cash, portfolio investments, derivative assets and derivative liabilities.
Available-for-sale financial assets are measured at fair value with unrealized gains and losses recognized in other comprehensive income. Certain equity instruments which do not trade in an open market and whose fair value cannot be reliably measured are recorded at cost. Transactions to purchase or sell these items are recorded on the settlement date. The Credit Union’s financial instruments classified as available-for-sale include other deposits held with Central 1 and other financial institutions and equity investments.
Financial assets classified as held-to-maturity are subsequently measured at amortized cost using the effective interest rate method. The Credit Union’s financial instruments classified as held-to-maturity include Central 1 - liquidity deposits.
Financial assets classified as loans and receivables are subsequently measured at amortized cost. The Credit Union’s financial instruments classified as loans and receivables include all member and other loans receivable, accrued interest and other receivables.
Financial instruments classified as other financial liabilities include member deposits, borrowings, member shares - liability and other liabilities. Other financial liabilities are subsequently carried at amortized cost.
DERECOGNITION OF FINANCIAL ASSETSDerecognition of a financial asset occurs when:
• The Credit Union does not have rights to receive cash flows from the asset;
• The Credit Union has transferred its rights to receive cash flows from the asset or has assumed an obligation to pay the received cash flows in full without material delay to a third party under a “pass-through” arrangement; and either:
• The Credit Union has transferred substantially all the risks and rewards of the asset, or
• The Credit Union has neither transferred nor retained substantially all the risks and rewards of the asset, but has transferred control of the asset.
When the Credit Union has transferred its rights to receive cash flows from an asset or has entered into a pass-through arrangement, and has neither transferred or retained substantially all of the risks and rewards of the asset nor transferred control of the asset, the asset is recognized to the extent of the Credit Union’s continuing involvement in the asset. In that case, the Credit Union also recognizes an associated liability. The transferred asset and the associated liability are measured on a basis that reflects the rights and obligations that the Credit Union has retained.
A financial liability is derecognized when the obligation under the liability is discharged, cancelled or expires. Where an existing financial liability is replaced by another from the same lender on substantially different terms, or the terms of the existing liability are substantially modified, such an exchange or modification is treated as
a derecognition of the original liability and the recognition of a new liability, and the difference in the respective carrying amount is recognized in comprehensive income.
FAIR VALUE MEASUREMENTSThe Credit Union classifies fair value measurements recognized in the statement of financial position using a three-tier fair value hierarchy, which prioritizes the inputs used in measuring fair value as follows:
• Level 1: Quoted prices (unadjusted) are available in active markets for identical assets or liabilities;
• Level 2: Inputs other than quoted prices in active markets that are observable for the asset or liability, either directly or indirectly; and
• Level 3: Unobservable inputs in which there is little or no market data, which require the Credit Union to develop its own assumptions.
For Level 2 discount rate purposes, CDOR is the Canadian Dollar Overnight Rate.
Fair value measurements are classified in the fair value hierarchy based on the lowest level input that is significant to that fair value measurement. This assessment requires judgment, considering factors specific to an asset or a liability and may affect placement within the fair value hierarchy.
STANDARDS ISSUED BUT NOT YET EFFECTIVEThe Credit Union has not yet applied the following new standards, interpretations and amendments to standards that have been issued as at December 31, 2017 but are not yet effective. Unless otherwise stated, the Credit Union does not plan to early adopt any of these new or amended standards and interpretations.
IFRS 9 FINANCIAL INSTRUMENTSThe final version of IFRS 9 (2014) was issued in July 2014 as a complete standard including the requirements for classification and measurement of financial instruments, the new expected loss impairment model and the new hedge accounting model. IFRS 9 (2014) will replace IAS 39 Financial instruments: recognition and measurement. IFRS 9 (2014) is effective for reporting periods beginning on or after January 1, 2018.
IFRS 9 introduces a principles-based approach to the classification of financial assets based on an entity’s business model and the nature of the cash flows of the asset. All financial assets, including hybrid contracts, are measured at fair value through profit or loss, fair value through OCI or amortized cost. For financial liabilities, IFRS 9 is substantially the same as was previously included in IAS 39.
IFRS 9 also introduces an expected credit loss impairment model for all financial assets not measured at fair value through profit or loss. The model has three stages: (1) on initial recognition, a loss allowance is recognized and maintained equal to 12 months of expected credit losses; (2) if credit risk increases significantly relative to initial recognition, the loss allowance is increased to cover full lifetime expected credit losses; and (3) when a financial asset is considered credit-impaired, the loss allowance continues to reflect lifetime expected credit losses and interest revenue is calculated based on the carrying amount of the asset, net of the loss allowance, rather than its gross carrying amount. Changes in the loss allowance, including the movement between 12 months and lifetime expected credit losses, is recorded in profit or loss.
The Credit Union is currently assessing the impact of this standard on its consolidated financial statements. The new impairment and classification and measurement requirements will be applied by adjusting the Credit Union’s Consolidated Statement of Financial Position on January 1, 2018, the date of initial application of IFRS 9, with no restatement of comparative periods.
The adoption of IFRS 9 is expected to result in certain differences in the classification of financial assets when compared to the Credit Union’s classification under IAS 39.
The Credit Union continues to monitor and refine certain elements of its analysis of classification and measurement differences and the impairment assessment in advance of the Credit Union’s December 31, 2018 consolidated financial statements.
30 31
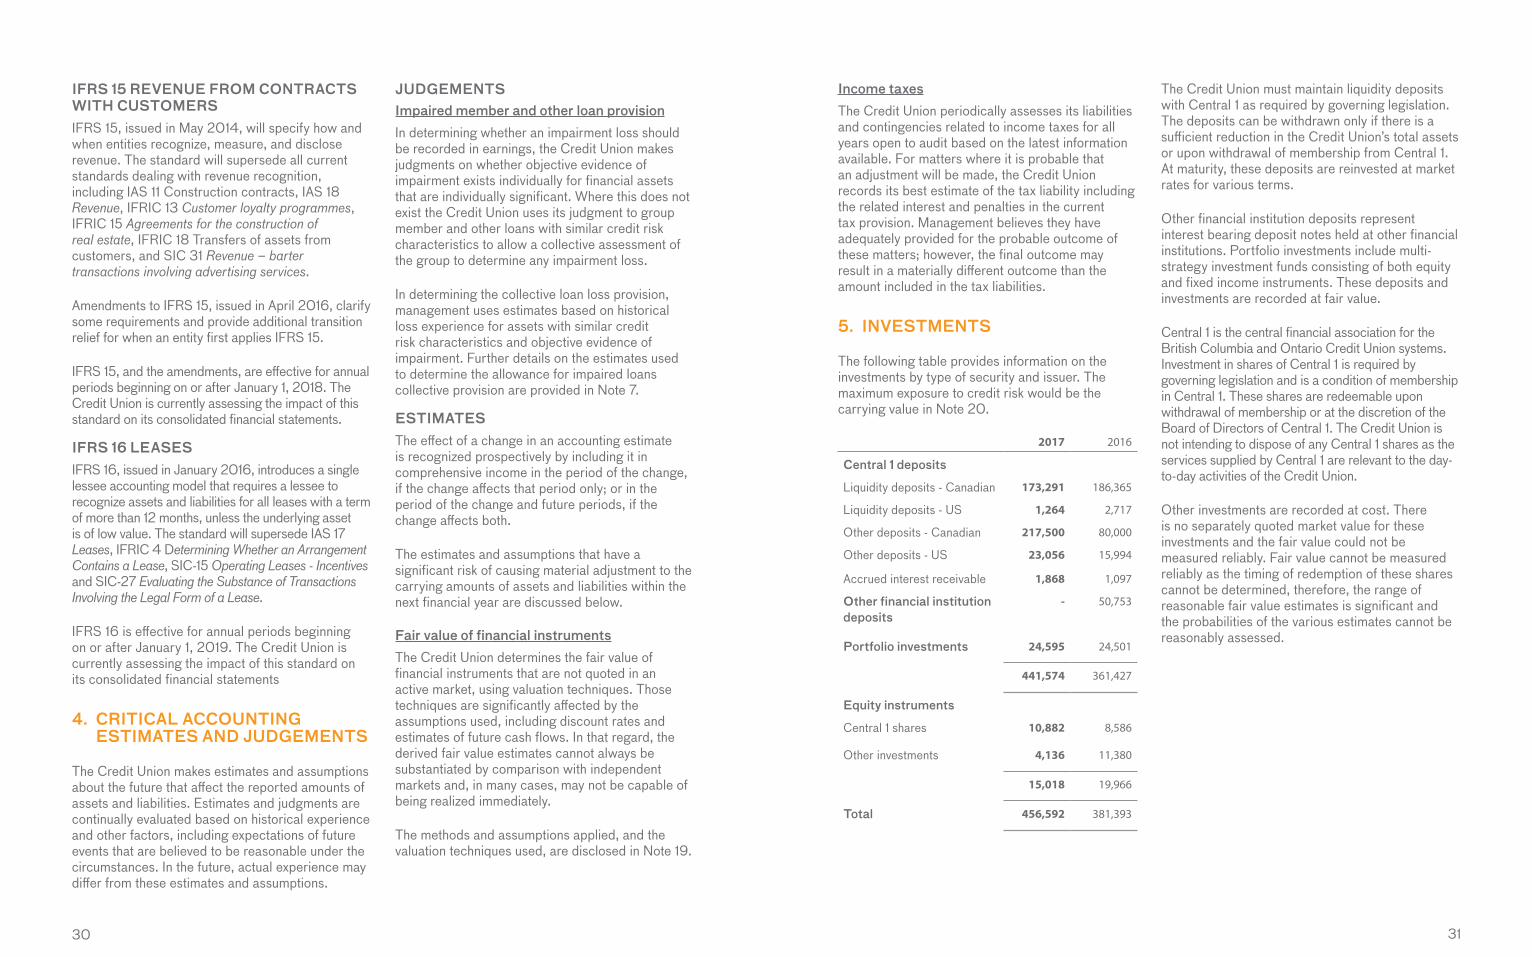
IFRS 15 REVENUE FROM CONTRACTS WITH CUSTOMERSIFRS 15, issued in May 2014, will specify how and when entities recognize, measure, and disclose revenue. The standard will supersede all current standards dealing with revenue recognition, including IAS 11 Construction contracts, IAS 18 Revenue, IFRIC 13 Customer loyalty programmes, IFRIC 15 Agreements for the construction of real estate, IFRIC 18 Transfers of assets from customers, and SIC 31 Revenue – barter transactions involving advertising services.
Amendments to IFRS 15, issued in April 2016, clarify some requirements and provide additional transition relief for when an entity first applies IFRS 15.
IFRS 15, and the amendments, are effective for annual periods beginning on or after January 1, 2018. The Credit Union is currently assessing the impact of this standard on its consolidated financial statements.
IFRS 16 LEASESIFRS 16, issued in January 2016, introduces a single lessee accounting model that requires a lessee to recognize assets and liabilities for all leases with a term of more than 12 months, unless the underlying asset is of low value. The standard will supersede IAS 17 Leases, IFRIC 4 Determining Whether an Arrangement Contains a Lease, SIC-15 Operating Leases - Incentives and SIC-27 Evaluating the Substance of Transactions Involving the Legal Form of a Lease.
IFRS 16 is effective for annual periods beginning on or after January 1, 2019. The Credit Union is currently assessing the impact of this standard on its consolidated financial statements
4. CRITICAL ACCOUNTING ESTIMATES AND JUDGEMENTS
The Credit Union makes estimates and assumptions about the future that affect the reported amounts of assets and liabilities. Estimates and judgments are continually evaluated based on historical experience and other factors, including expectations of future events that are believed to be reasonable under the circumstances. In the future, actual experience may differ from these estimates and assumptions.
JUDGEMENTSImpaired member and other loan provisionIn determining whether an impairment loss should be recorded in earnings, the Credit Union makes judgments on whether objective evidence of impairment exists individually for financial assets that are individually significant. Where this does not exist the Credit Union uses its judgment to group member and other loans with similar credit risk characteristics to allow a collective assessment of the group to determine any impairment loss.
In determining the collective loan loss provision, management uses estimates based on historical loss experience for assets with similar credit risk characteristics and objective evidence of impairment. Further details on the estimates used to determine the allowance for impaired loans collective provision are provided in Note 7.
ESTIMATESThe effect of a change in an accounting estimate is recognized prospectively by including it in comprehensive income in the period of the change, if the change affects that period only; or in the period of the change and future periods, if the change affects both.
The estimates and assumptions that have a significant risk of causing material adjustment to the carrying amounts of assets and liabilities within the next financial year are discussed below.
Fair value of financial instrumentsThe Credit Union determines the fair value of financial instruments that are not quoted in an active market, using valuation techniques. Those techniques are significantly affected by the assumptions used, including discount rates and estimates of future cash flows. In that regard, the derived fair value estimates cannot always be substantiated by comparison with independent markets and, in many cases, may not be capable of being realized immediately.
The methods and assumptions applied, and the valuation techniques used, are disclosed in Note 19.
Income taxesThe Credit Union periodically assesses its liabilities and contingencies related to income taxes for all years open to audit based on the latest information available. For matters where it is probable that an adjustment will be made, the Credit Union records its best estimate of the tax liability including the related interest and penalties in the current tax provision. Management believes they have adequately provided for the probable outcome of these matters; however, the final outcome may result in a materially different outcome than the amount included in the tax liabilities.
5. INVESTMENTS
The following table provides information on the investments by type of security and issuer. The maximum exposure to credit risk would be the carrying value in Note 20.
2017 2016
Central 1 deposits
Liquidity deposits - Canadian 173,291 186,365
Liquidity deposits - US 1,264 2,717
Other deposits - Canadian 217,500 80,000
Other deposits - US 23,056 15,994
Accrued interest receivable 1,868 1,097
Other financial institution deposits
- 50,753
Portfolio investments 24,595 24,501
441,574 361,427
Equity instruments
Central 1 shares 10,882 8,586
Other investments 4,136 11,380
15,018 19,966
Total 456,592 381,393
The Credit Union must maintain liquidity deposits with Central 1 as required by governing legislation. The deposits can be withdrawn only if there is a sufficient reduction in the Credit Union’s total assets or upon withdrawal of membership from Central 1. At maturity, these deposits are reinvested at market rates for various terms.
Other financial institution deposits represent interest bearing deposit notes held at other financial institutions. Portfolio investments include multi-strategy investment funds consisting of both equity and fixed income instruments. These deposits and investments are recorded at fair value.
Central 1 is the central financial association for the British Columbia and Ontario Credit Union systems. Investment in shares of Central 1 is required by governing legislation and is a condition of membership in Central 1. These shares are redeemable upon withdrawal of membership or at the discretion of the Board of Directors of Central 1. The Credit Union is not intending to dispose of any Central 1 shares as the services supplied by Central 1 are relevant to the day-to-day activities of the Credit Union.
Other investments are recorded at cost. There is no separately quoted market value for these investments and the fair value could not be measured reliably. Fair value cannot be measured reliably as the timing of redemption of these shares cannot be determined, therefore, the range of reasonable fair value estimates is significant and the probabilities of the various estimates cannot be reasonably assessed.
32 33
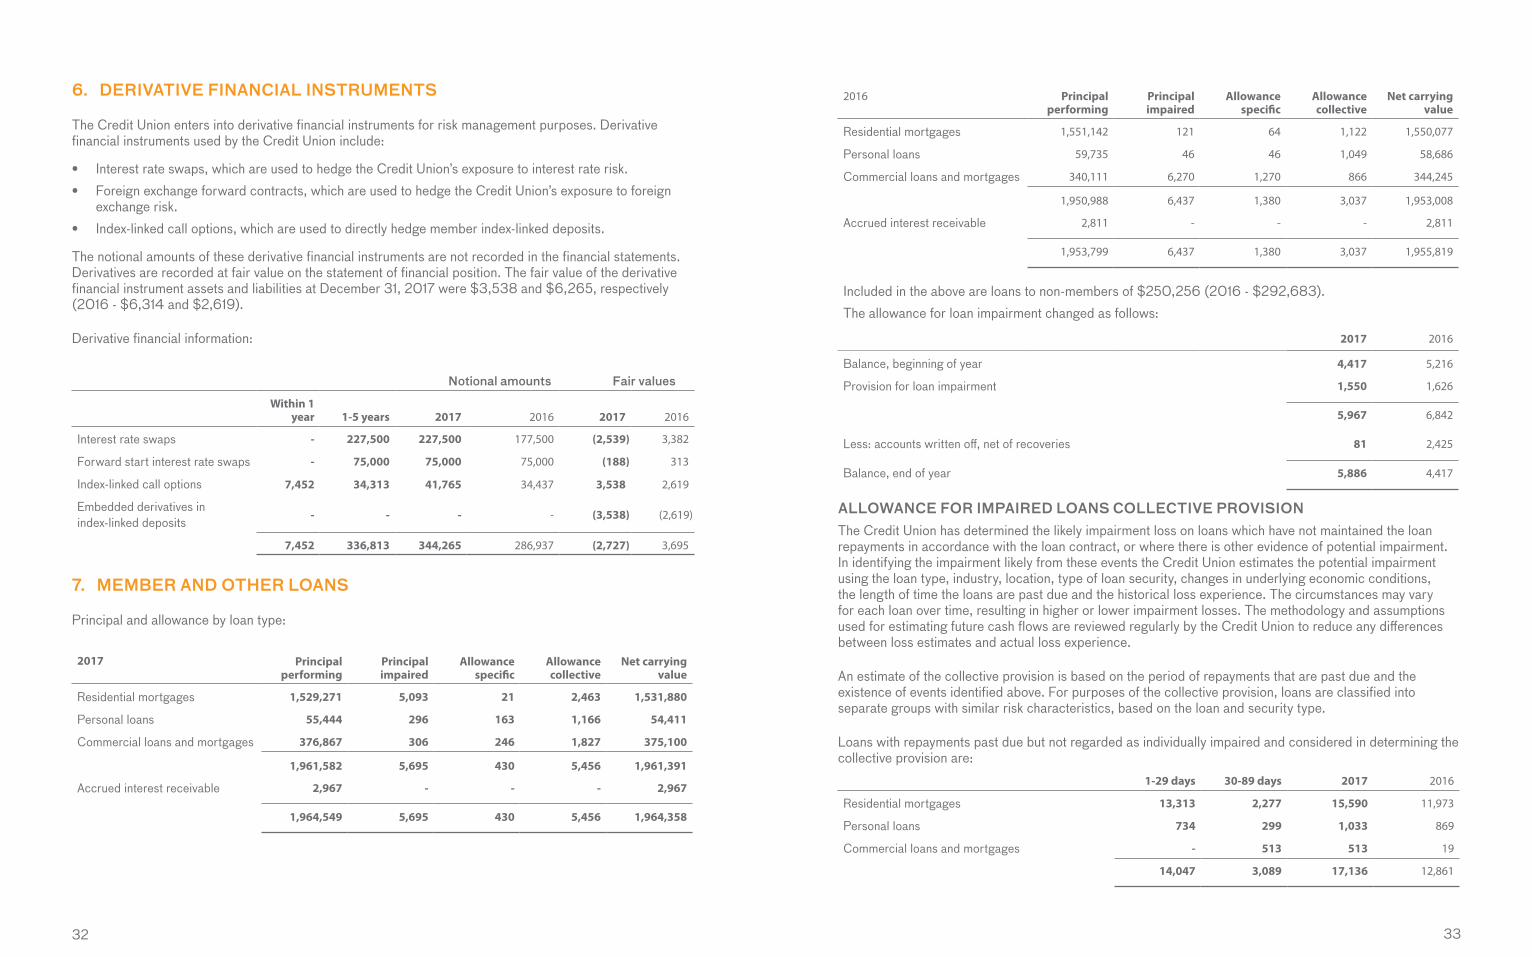
2016 Principal performing
Principal impaired
Allowance specific
Allowance collective
Net carrying value
Residential mortgages 1,551,142 121 64 1,122 1,550,077
Personal loans 59,735 46 46 1,049 58,686
Commercial loans and mortgages 340,111 6,270 1,270 866 344,245
1,950,988 6,437 1,380 3,037 1,953,008
Accrued interest receivable 2,811 - - - 2,811
1,953,799 6,437 1,380 3,037 1,955,819
Included in the above are loans to non-members of $250,256 (2016 - $292,683).The allowance for loan impairment changed as follows:
2017 2016
Balance, beginning of year 4,417 5,216
Provision for loan impairment 1,550 1,626
5,967 6,842
Less: accounts written off, net of recoveries 81 2,425
Balance, end of year 5,886 4,417
ALLOWANCE FOR IMPAIRED LOANS COLLECTIVE PROVISIONThe Credit Union has determined the likely impairment loss on loans which have not maintained the loan repayments in accordance with the loan contract, or where there is other evidence of potential impairment. In identifying the impairment likely from these events the Credit Union estimates the potential impairment using the loan type, industry, location, type of loan security, changes in underlying economic conditions, the length of time the loans are past due and the historical loss experience. The circumstances may vary for each loan over time, resulting in higher or lower impairment losses. The methodology and assumptions used for estimating future cash flows are reviewed regularly by the Credit Union to reduce any differences between loss estimates and actual loss experience.
An estimate of the collective provision is based on the period of repayments that are past due and the existence of events identified above. For purposes of the collective provision, loans are classified into separate groups with similar risk characteristics, based on the loan and security type.
Loans with repayments past due but not regarded as individually impaired and considered in determining the collective provision are:
1-29 days 30-89 days 2017 2016
Residential mortgages 13,313 2,277 15,590 11,973
Personal loans 734 299 1,033 869
Commercial loans and mortgages - 513 513 19
14,047 3,089 17,136 12,861
6. DERIVATIVE FINANCIAL INSTRUMENTS
The Credit Union enters into derivative financial instruments for risk management purposes. Derivative financial instruments used by the Credit Union include:
• Interest rate swaps, which are used to hedge the Credit Union’s exposure to interest rate risk.• Foreign exchange forward contracts, which are used to hedge the Credit Union’s exposure to foreign
exchange risk.• Index-linked call options, which are used to directly hedge member index-linked deposits.
The notional amounts of these derivative financial instruments are not recorded in the financial statements. Derivatives are recorded at fair value on the statement of financial position. The fair value of the derivative financial instrument assets and liabilities at December 31, 2017 were $3,538 and $6,265, respectively (2016 - $6,314 and $2,619).
Derivative financial information:
Notional amounts Fair values
Within 1 year 1-5 years 2017 2016 2017 2016
Interest rate swaps - 227,500 227,500 177,500 (2,539) 3,382
Forward start interest rate swaps - 75,000 75,000 75,000 (188) 313
Index-linked call options 7,452 34,313 41,765 34,437 3,538 2,619
Embedded derivatives in index-linked deposits
- - - - (3,538) (2,619)
7,452 336,813 344,265 286,937 (2,727) 3,695
7. MEMBER AND OTHER LOANS
Principal and allowance by loan type:
2017 Principal performing
Principal impaired
Allowance specific
Allowance collective
Net carrying value
Residential mortgages 1,529,271 5,093 21 2,463 1,531,880
Personal loans 55,444 296 163 1,166 54,411
Commercial loans and mortgages 376,867 306 246 1,827 375,100
1,961,582 5,695 430 5,456 1,961,391
Accrued interest receivable 2,967 - - - 2,967
1,964,549 5,695 430 5,456 1,964,358
34 35
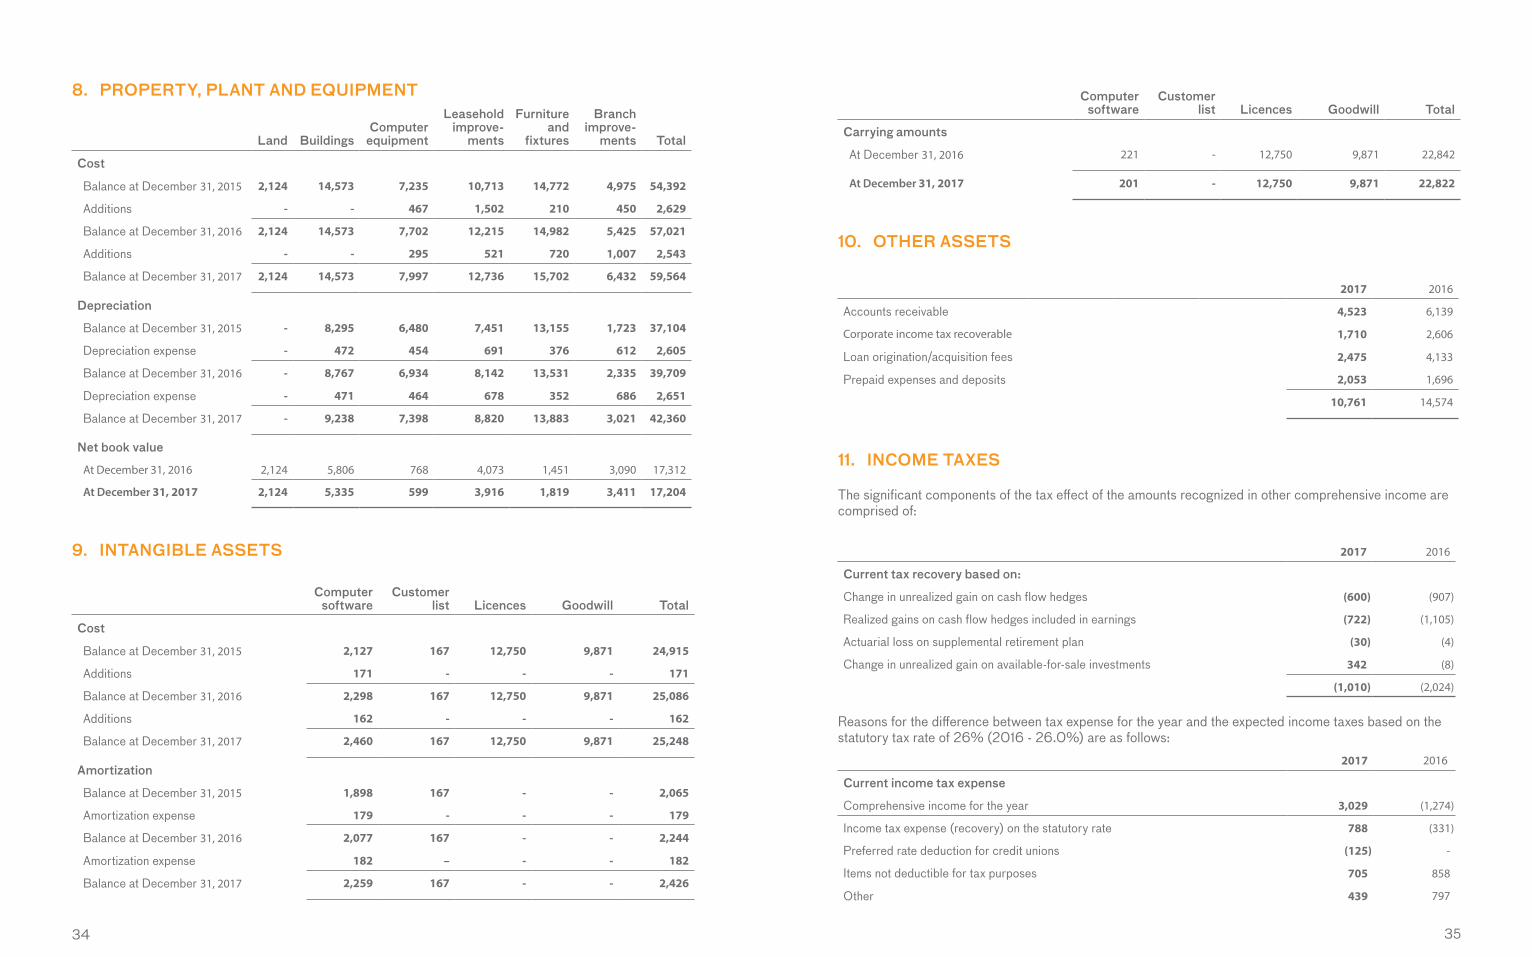
8. PROPERTY, PLANT AND EQUIPMENT
Land BuildingsComputer
equipment
Leasehold improve-
ments
Furniture and
fixtures
Branch improve-
ments Total
Cost
Balance at December 31, 2015 2,124 14,573 7,235 10,713 14,772 4,975 54,392
Additions - - 467 1,502 210 450 2,629
Balance at December 31, 2016 2,124 14,573 7,702 12,215 14,982 5,425 57,021
Additions - - 295 521 720 1,007 2,543
Balance at December 31, 2017 2,124 14,573 7,997 12,736 15,702 6,432 59,564
Depreciation
Balance at December 31, 2015 - 8,295 6,480 7,451 13,155 1,723 37,104
Depreciation expense - 472 454 691 376 612 2,605
Balance at December 31, 2016 - 8,767 6,934 8,142 13,531 2,335 39,709
Depreciation expense - 471 464 678 352 686 2,651
Balance at December 31, 2017 - 9,238 7,398 8,820 13,883 3,021 42,360
Net book value
At December 31, 2016 2,124 5,806 768 4,073 1,451 3,090 17,312
At December 31, 2017 2,124 5,335 599 3,916 1,819 3,411 17,204
9. INTANGIBLE ASSETS
Computer software
Customer list Licences Goodwill Total
Cost
Balance at December 31, 2015 2,127 167 12,750 9,871 24,915
Additions 171 - - - 171
Balance at December 31, 2016 2,298 167 12,750 9,871 25,086
Additions 162 - - - 162
Balance at December 31, 2017 2,460 167 12,750 9,871 25,248
Amortization
Balance at December 31, 2015 1,898 167 - - 2,065
Amortization expense 179 - - - 179
Balance at December 31, 2016 2,077 167 - - 2,244
Amortization expense 182 – - - 182
Balance at December 31, 2017 2,259 167 - - 2,426
Computer software
Customer list Licences Goodwill Total
Carrying amounts
At December 31, 2016 221 - 12,750 9,871 22,842
At December 31, 2017 201 - 12,750 9,871 22,822
10. OTHER ASSETS
2017 2016
Accounts receivable 4,523 6,139
Corporate income tax recoverable 1,710 2,606
Loan origination/acquisition fees 2,475 4,133
Prepaid expenses and deposits 2,053 1,696
10,761 14,574
11. INCOME TAXES
The significant components of the tax effect of the amounts recognized in other comprehensive income are comprised of:
2017 2016
Current tax recovery based on:
Change in unrealized gain on cash flow hedges (600) (907)
Realized gains on cash flow hedges included in earnings (722) (1,105)
Actuarial loss on supplemental retirement plan (30) (4)
Change in unrealized gain on available-for-sale investments 342 (8)
(1,010) (2,024)
Reasons for the difference between tax expense for the year and the expected income taxes based on the statutory tax rate of 26% (2016 - 26.0%) are as follows:
2017 2016
Current income tax expense
Comprehensive income for the year 3,029 (1,274)
Income tax expense (recovery) on the statutory rate 788 (331)
Preferred rate deduction for credit unions (125) -
Items not deductible for tax purposes 705 858
Other 439 797
36 37
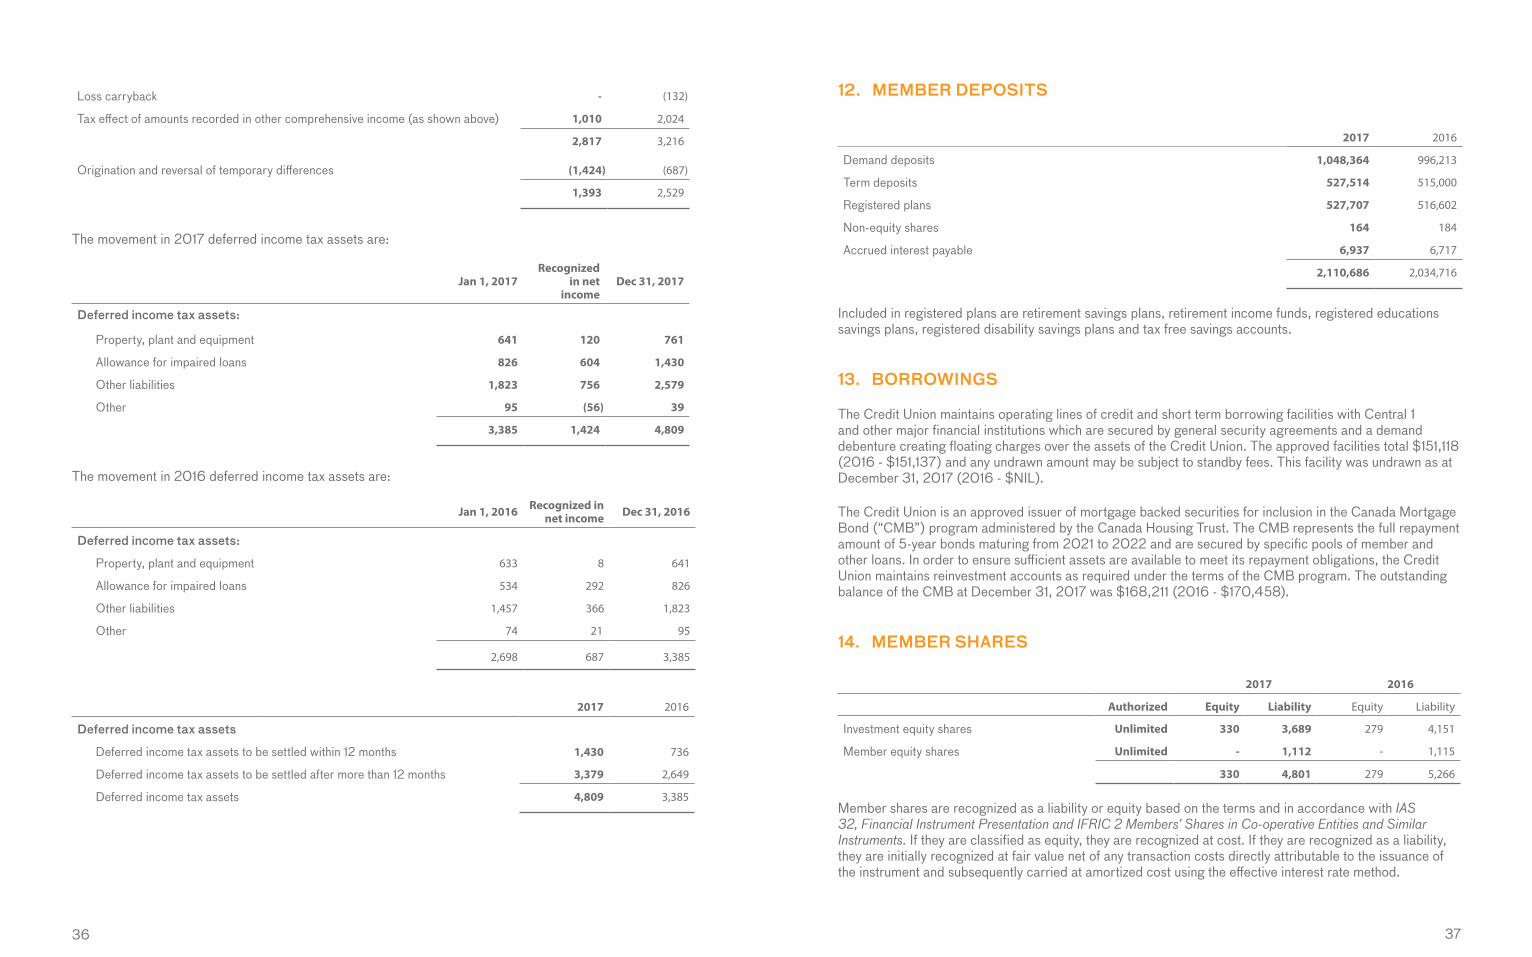
Loss carryback - (132)
Tax effect of amounts recorded in other comprehensive income (as shown above) 1,010 2,024
2,817 3,216
Origination and reversal of temporary differences (1,424) (687)
1,393 2,529
The movement in 2017 deferred income tax assets are:
Jan 1, 2017Recognized
in net income
Dec 31, 2017
Deferred income tax assets:
Property, plant and equipment 641 120 761
Allowance for impaired loans 826 604 1,430
Other liabilities 1,823 756 2,579
Other 95 (56) 39
3,385 1,424 4,809
The movement in 2016 deferred income tax assets are:
Jan 1, 2016 Recognized in net income Dec 31, 2016
Deferred income tax assets:
Property, plant and equipment 633 8 641
Allowance for impaired loans 534 292 826
Other liabilities 1,457 366 1,823
Other 74 21 95
2,698 687 3,385
2017 2016
Deferred income tax assets
Deferred income tax assets to be settled within 12 months 1,430 736
Deferred income tax assets to be settled after more than 12 months 3,379 2,649
Deferred income tax assets 4,809 3,385
12. MEMBER DEPOSITS
2017 2016
Demand deposits 1,048,364 996,213
Term deposits 527,514 515,000
Registered plans 527,707 516,602
Non-equity shares 164 184
Accrued interest payable 6,937 6,717
2,110,686 2,034,716
Included in registered plans are retirement savings plans, retirement income funds, registered educations savings plans, registered disability savings plans and tax free savings accounts.
13. BORROWINGS
The Credit Union maintains operating lines of credit and short term borrowing facilities with Central 1 and other major financial institutions which are secured by general security agreements and a demand debenture creating floating charges over the assets of the Credit Union. The approved facilities total $151,118 (2016 - $151,137) and any undrawn amount may be subject to standby fees. This facility was undrawn as at December 31, 2017 (2016 - $NIL).
The Credit Union is an approved issuer of mortgage backed securities for inclusion in the Canada Mortgage Bond (“CMB”) program administered by the Canada Housing Trust. The CMB represents the full repayment amount of 5-year bonds maturing from 2021 to 2022 and are secured by specific pools of member and other loans. In order to ensure sufficient assets are available to meet its repayment obligations, the Credit Union maintains reinvestment accounts as required under the terms of the CMB program. The outstanding balance of the CMB at December 31, 2017 was $168,211 (2016 - $170,458).
14. MEMBER SHARES
2017 2016
Authorized Equity Liability Equity Liability
Investment equity shares Unlimited 330 3,689 279 4,151
Member equity shares Unlimited - 1,112 - 1,115
330 4,801 279 5,266
Member shares are recognized as a liability or equity based on the terms and in accordance with IAS 32, Financial Instrument Presentation and IFRIC 2 Members’ Shares in Co-operative Entities and Similar Instruments. If they are classified as equity, they are recognized at cost. If they are recognized as a liability, they are initially recognized at fair value net of any transaction costs directly attributable to the issuance of the instrument and subsequently carried at amortized cost using the effective interest rate method.
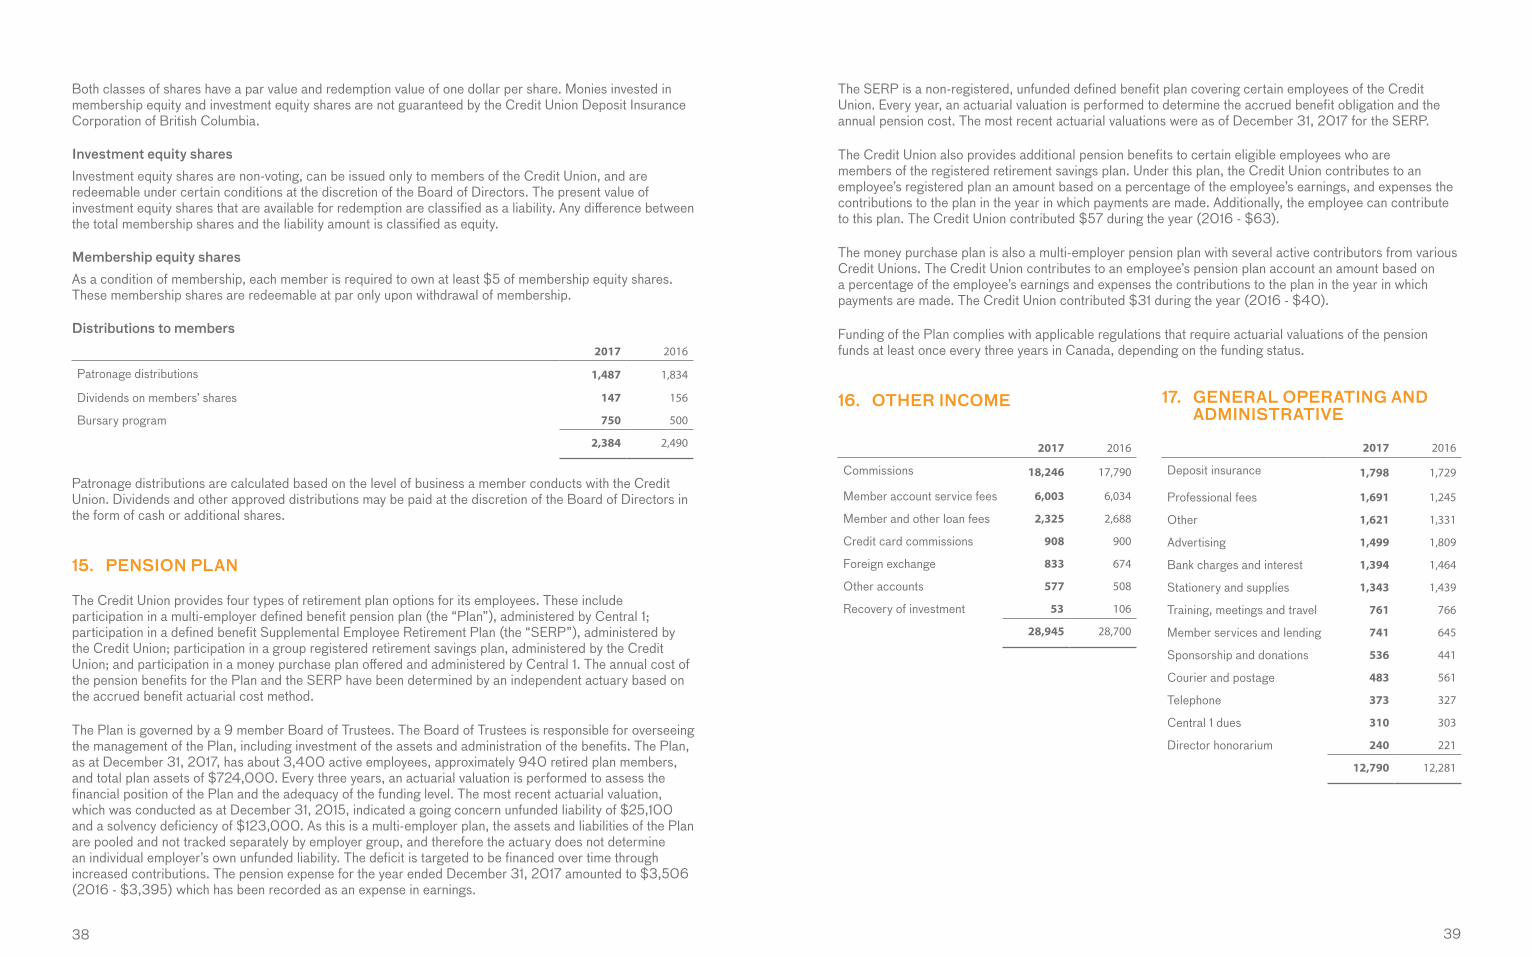
38 39
Both classes of shares have a par value and redemption value of one dollar per share. Monies invested in membership equity and investment equity shares are not guaranteed by the Credit Union Deposit Insurance Corporation of British Columbia.
Investment equity sharesInvestment equity shares are non-voting, can be issued only to members of the Credit Union, and are redeemable under certain conditions at the discretion of the Board of Directors. The present value of investment equity shares that are available for redemption are classified as a liability. Any difference between the total membership shares and the liability amount is classified as equity.
Membership equity sharesAs a condition of membership, each member is required to own at least $5 of membership equity shares. These membership shares are redeemable at par only upon withdrawal of membership.
Distributions to members2017 2016
Patronage distributions 1,487 1,834
Dividends on members’ shares 147 156
Bursary program 750 500
2,384 2,490
Patronage distributions are calculated based on the level of business a member conducts with the Credit Union. Dividends and other approved distributions may be paid at the discretion of the Board of Directors in the form of cash or additional shares.
15. PENSION PLAN
The Credit Union provides four types of retirement plan options for its employees. These include participation in a multi-employer defined benefit pension plan (the “Plan”), administered by Central 1; participation in a defined benefit Supplemental Employee Retirement Plan (the “SERP”), administered by the Credit Union; participation in a group registered retirement savings plan, administered by the Credit Union; and participation in a money purchase plan offered and administered by Central 1. The annual cost of the pension benefits for the Plan and the SERP have been determined by an independent actuary based on the accrued benefit actuarial cost method.
The Plan is governed by a 9 member Board of Trustees. The Board of Trustees is responsible for overseeing the management of the Plan, including investment of the assets and administration of the benefits. The Plan, as at December 31, 2017, has about 3,400 active employees, approximately 940 retired plan members, and total plan assets of $724,000. Every three years, an actuarial valuation is performed to assess the financial position of the Plan and the adequacy of the funding level. The most recent actuarial valuation, which was conducted as at December 31, 2015, indicated a going concern unfunded liability of $25,100 and a solvency deficiency of $123,000. As this is a multi-employer plan, the assets and liabilities of the Plan are pooled and not tracked separately by employer group, and therefore the actuary does not determine an individual employer’s own unfunded liability. The deficit is targeted to be financed over time through increased contributions. The pension expense for the year ended December 31, 2017 amounted to $3,506 (2016 - $3,395) which has been recorded as an expense in earnings.
The SERP is a non-registered, unfunded defined benefit plan covering certain employees of the Credit Union. Every year, an actuarial valuation is performed to determine the accrued benefit obligation and the annual pension cost. The most recent actuarial valuations were as of December 31, 2017 for the SERP.
The Credit Union also provides additional pension benefits to certain eligible employees who are members of the registered retirement savings plan. Under this plan, the Credit Union contributes to an employee’s registered plan an amount based on a percentage of the employee’s earnings, and expenses the contributions to the plan in the year in which payments are made. Additionally, the employee can contribute to this plan. The Credit Union contributed $57 during the year (2016 - $63).
The money purchase plan is also a multi-employer pension plan with several active contributors from various Credit Unions. The Credit Union contributes to an employee’s pension plan account an amount based on a percentage of the employee’s earnings and expenses the contributions to the plan in the year in which payments are made. The Credit Union contributed $31 during the year (2016 - $40).
Funding of the Plan complies with applicable regulations that require actuarial valuations of the pension funds at least once every three years in Canada, depending on the funding status.
16. OTHER INCOME
2017 2016
Commissions 18,246 17,790
Member account service fees 6,003 6,034
Member and other loan fees 2,325 2,688
Credit card commissions 908 900
Foreign exchange 833 674
Other accounts 577 508
Recovery of investment 53 106
28,945 28,700
17. GENERAL OPERATING AND ADMINISTRATIVE
2017 2016
Deposit insurance 1,798 1,729
Professional fees 1,691 1,245
Other 1,621 1,331
Advertising 1,499 1,809
Bank charges and interest 1,394 1,464
Stationery and supplies 1,343 1,439
Training, meetings and travel 761 766
Member services and lending 741 645
Sponsorship and donations 536 441
Courier and postage 483 561
Telephone 373 327
Central 1 dues 310 303
Director honorarium 240 221
12,790 12,281
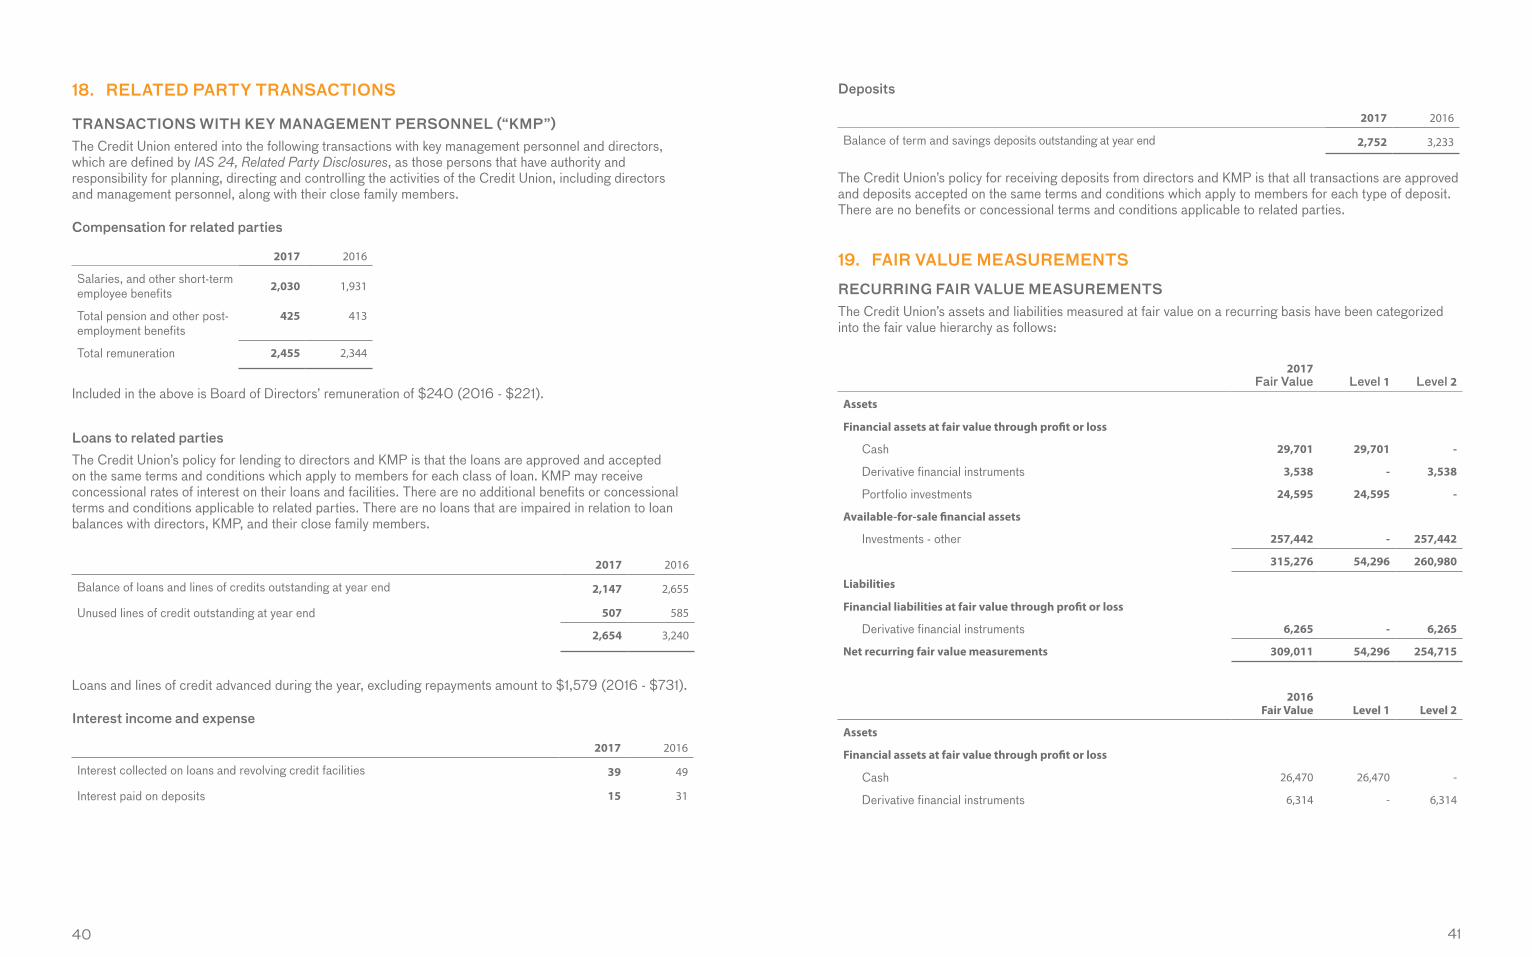
40 41
18. RELATED PARTY TRANSACTIONS
TRANSACTIONS WITH KEY MANAGEMENT PERSONNEL (“KMP”)The Credit Union entered into the following transactions with key management personnel and directors, which are defined by IAS 24, Related Party Disclosures, as those persons that have authority and responsibility for planning, directing and controlling the activities of the Credit Union, including directors and management personnel, along with their close family members.
Compensation for related parties
2017 2016
Salaries, and other short-term employee benefits 2,030 1,931
Total pension and other post-employment benefits
425 413
Total remuneration 2,455 2,344
Included in the above is Board of Directors’ remuneration of $240 (2016 - $221).
Deposits
2017 2016
Balance of term and savings deposits outstanding at year end 2,752 3,233
The Credit Union’s policy for receiving deposits from directors and KMP is that all transactions are approved and deposits accepted on the same terms and conditions which apply to members for each type of deposit. There are no benefits or concessional terms and conditions applicable to related parties.
19. FAIR VALUE MEASUREMENTS
RECURRING FAIR VALUE MEASUREMENTSThe Credit Union’s assets and liabilities measured at fair value on a recurring basis have been categorized into the fair value hierarchy as follows:
2017 Fair Value Level 1 Level 2
Assets
Financial assets at fair value through profit or loss
Cash 29,701 29,701 -
Derivative financial instruments 3,538 - 3,538
Portfolio investments 24,595 24,595 -
Available-for-sale financial assets
Investments - other 257,442 - 257,442
315,276 54,296 260,980
Liabilities
Financial liabilities at fair value through profit or loss
Derivative financial instruments 6,265 - 6,265
Net recurring fair value measurements 309,011 54,296 254,715
2016 Fair Value Level 1 Level 2
Assets
Financial assets at fair value through profit or loss
Cash 26,470 26,470 -
Derivative financial instruments 6,314 - 6,314
Loans to related partiesThe Credit Union’s policy for lending to directors and KMP is that the loans are approved and accepted on the same terms and conditions which apply to members for each class of loan. KMP may receive concessional rates of interest on their loans and facilities. There are no additional benefits or concessional terms and conditions applicable to related parties. There are no loans that are impaired in relation to loan balances with directors, KMP, and their close family members.
2017 2016
Balance of loans and lines of credits outstanding at year end 2,147 2,655
Unused lines of credit outstanding at year end 507 585
2,654 3,240
Loans and lines of credit advanced during the year, excluding repayments amount to $1,579 (2016 - $731).
Interest income and expense
2017 2016
Interest collected on loans and revolving credit facilities 39 49
Interest paid on deposits 15 31
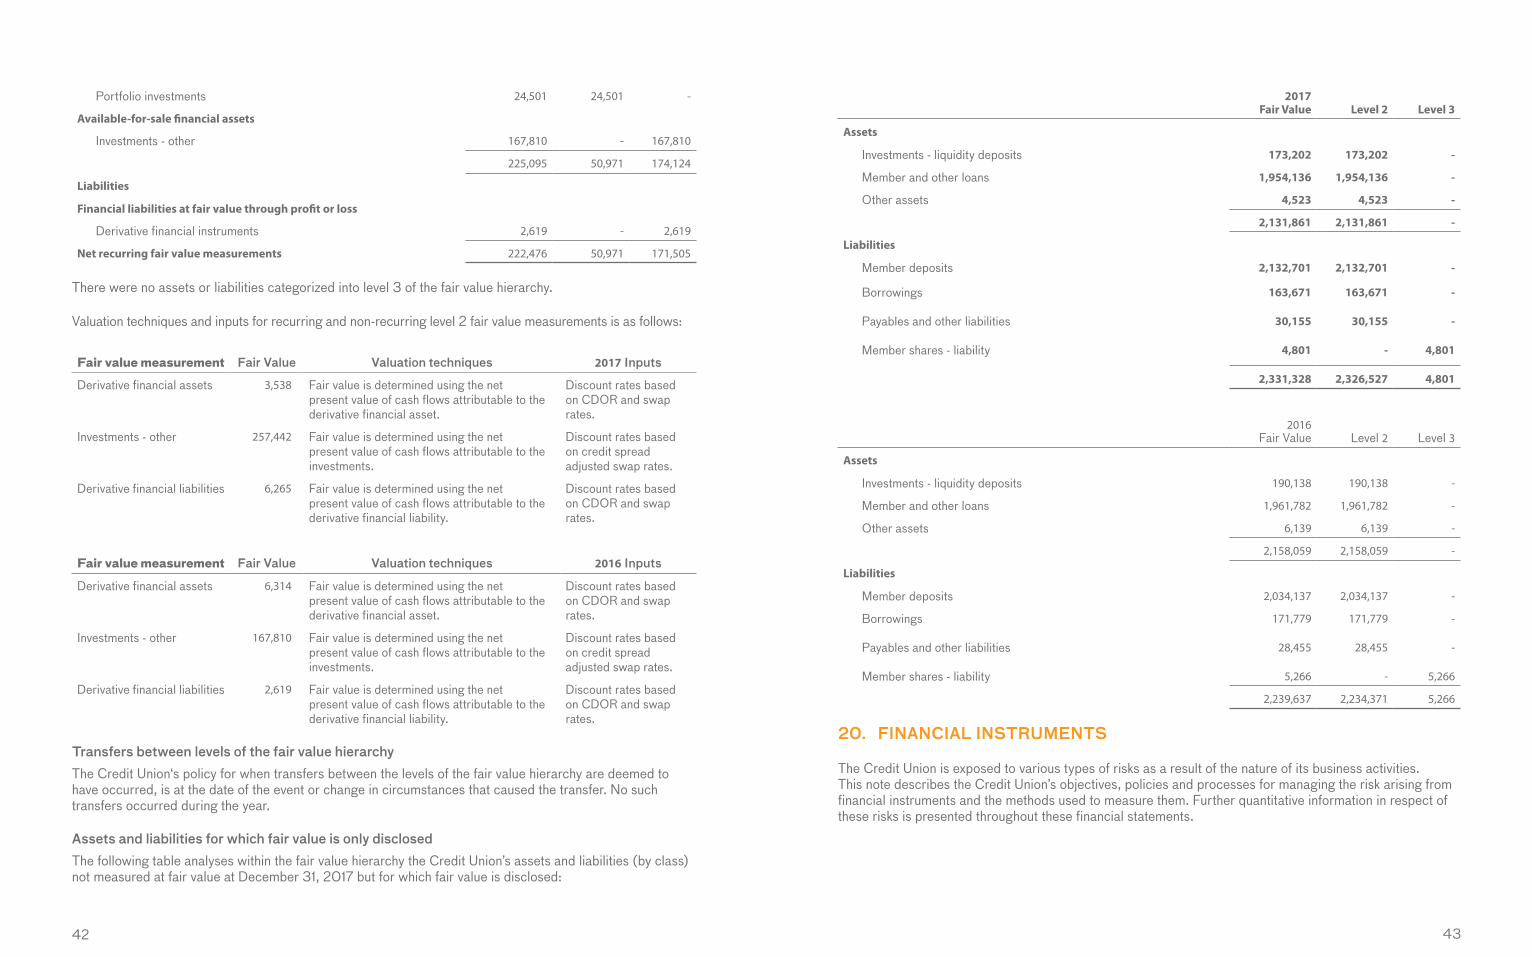
42 43
Portfolio investments 24,501 24,501 -
Available-for-sale financial assets
Investments - other 167,810 - 167,810
225,095 50,971 174,124
Liabilities
Financial liabilities at fair value through profit or loss
Derivative financial instruments 2,619 - 2,619
Net recurring fair value measurements 222,476 50,971 171,505
There were no assets or liabilities categorized into level 3 of the fair value hierarchy.
Valuation techniques and inputs for recurring and non-recurring level 2 fair value measurements is as follows:
Fair value measurement Fair Value Valuation techniques 2017 Inputs
Derivative financial assets 3,538 Fair value is determined using the net present value of cash flows attributable to the derivative financial asset.
Discount rates based on CDOR and swap rates.
Investments - other 257,442 Fair value is determined using the net present value of cash flows attributable to the investments.
Discount rates based on credit spread adjusted swap rates.
Derivative financial liabilities 6,265 Fair value is determined using the net present value of cash flows attributable to the derivative financial liability.
Discount rates based on CDOR and swap rates.
Fair value measurement Fair Value Valuation techniques 2016 Inputs
Derivative financial assets 6,314 Fair value is determined using the net present value of cash flows attributable to the derivative financial asset.
Discount rates based on CDOR and swap rates.
Investments - other 167,810 Fair value is determined using the net present value of cash flows attributable to the investments.
Discount rates based on credit spread adjusted swap rates.
Derivative financial liabilities 2,619 Fair value is determined using the net present value of cash flows attributable to the derivative financial liability.
Discount rates based on CDOR and swap rates.
Transfers between levels of the fair value hierarchyThe Credit Union‘s policy for when transfers between the levels of the fair value hierarchy are deemed to have occurred, is at the date of the event or change in circumstances that caused the transfer. No such transfers occurred during the year.
Assets and liabilities for which fair value is only disclosedThe following table analyses within the fair value hierarchy the Credit Union’s assets and liabilities (by class) not measured at fair value at December 31, 2017 but for which fair value is disclosed:
2017 Fair Value Level 2 Level 3
Assets
Investments - liquidity deposits 173,202 173,202 -
Member and other loans 1,954,136 1,954,136 -
Other assets 4,523 4,523 -
2,131,861 2,131,861 -
Liabilities
Member deposits 2,132,701 2,132,701 -
Borrowings 163,671 163,671 -
Payables and other liabilities 30,155 30,155 -
Member shares - liability 4,801 - 4,801
2,331,328 2,326,527 4,801
2016 Fair Value Level 2 Level 3
Assets
Investments - liquidity deposits 190,138 190,138 -
Member and other loans 1,961,782 1,961,782 -
Other assets 6,139 6,139 -
2,158,059 2,158,059 -
Liabilities
Member deposits 2,034,137 2,034,137 -
Borrowings 171,779 171,779 -
Payables and other liabilities 28,455 28,455 -
Member shares - liability 5,266 - 5,266
2,239,637 2,234,371 5,266
20. FINANCIAL INSTRUMENTS
The Credit Union is exposed to various types of risks as a result of the nature of its business activities. This note describes the Credit Union’s objectives, policies and processes for managing the risk arising from financial instruments and the methods used to measure them. Further quantitative information in respect of these risks is presented throughout these financial statements.
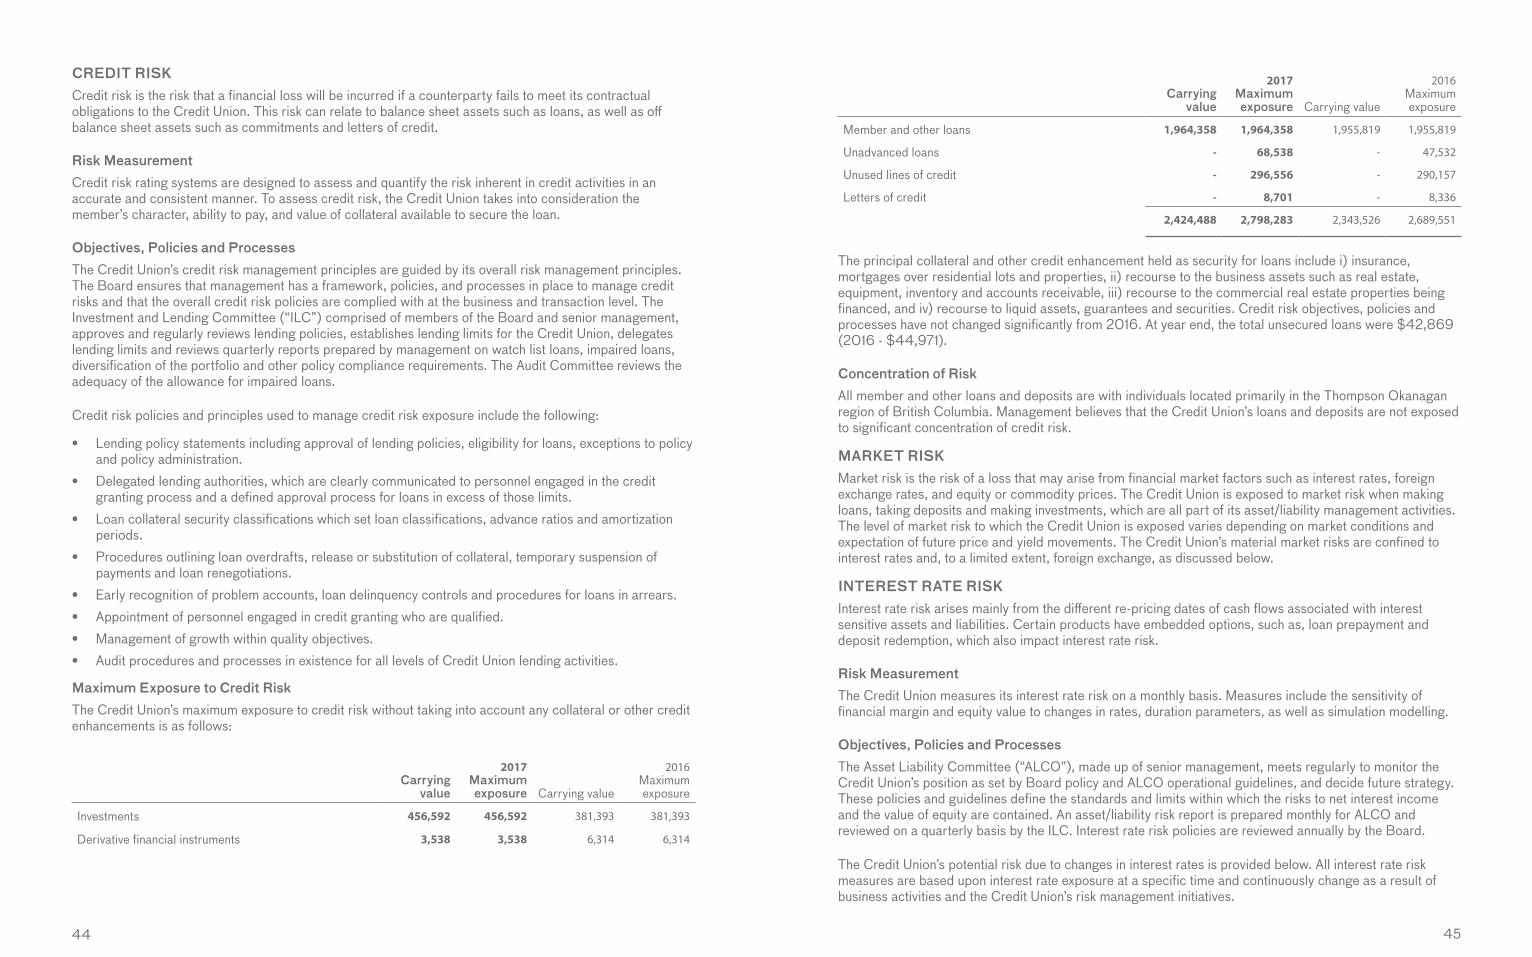
44 45
CREDIT RISKCredit risk is the risk that a financial loss will be incurred if a counterparty fails to meet its contractual obligations to the Credit Union. This risk can relate to balance sheet assets such as loans, as well as off balance sheet assets such as commitments and letters of credit.
Risk MeasurementCredit risk rating systems are designed to assess and quantify the risk inherent in credit activities in an accurate and consistent manner. To assess credit risk, the Credit Union takes into consideration the member’s character, ability to pay, and value of collateral available to secure the loan.
Objectives, Policies and ProcessesThe Credit Union’s credit risk management principles are guided by its overall risk management principles. The Board ensures that management has a framework, policies, and processes in place to manage credit risks and that the overall credit risk policies are complied with at the business and transaction level. The Investment and Lending Committee (“ILC”) comprised of members of the Board and senior management, approves and regularly reviews lending policies, establishes lending limits for the Credit Union, delegates lending limits and reviews quarterly reports prepared by management on watch list loans, impaired loans, diversification of the portfolio and other policy compliance requirements. The Audit Committee reviews the adequacy of the allowance for impaired loans.
Credit risk policies and principles used to manage credit risk exposure include the following:
• Lending policy statements including approval of lending policies, eligibility for loans, exceptions to policy and policy administration.
• Delegated lending authorities, which are clearly communicated to personnel engaged in the credit granting process and a defined approval process for loans in excess of those limits.
• Loan collateral security classifications which set loan classifications, advance ratios and amortization periods.
• Procedures outlining loan overdrafts, release or substitution of collateral, temporary suspension of payments and loan renegotiations.
• Early recognition of problem accounts, loan delinquency controls and procedures for loans in arrears.• Appointment of personnel engaged in credit granting who are qualified.• Management of growth within quality objectives.• Audit procedures and processes in existence for all levels of Credit Union lending activities.
Maximum Exposure to Credit RiskThe Credit Union’s maximum exposure to credit risk without taking into account any collateral or other credit enhancements is as follows:
Carrying value
2017 Maximum exposure Carrying value
2016 Maximum exposure
Investments 456,592 456,592 381,393 381,393
Derivative financial instruments 3,538 3,538 6,314 6,314
Carrying value
2017 Maximum exposure Carrying value
2016 Maximum exposure
Member and other loans 1,964,358 1,964,358 1,955,819 1,955,819
Unadvanced loans - 68,538 - 47,532
Unused lines of credit - 296,556 - 290,157
Letters of credit - 8,701 - 8,336
2,424,488 2,798,283 2,343,526 2,689,551
The principal collateral and other credit enhancement held as security for loans include i) insurance, mortgages over residential lots and properties, ii) recourse to the business assets such as real estate, equipment, inventory and accounts receivable, iii) recourse to the commercial real estate properties being financed, and iv) recourse to liquid assets, guarantees and securities. Credit risk objectives, policies and processes have not changed significantly from 2016. At year end, the total unsecured loans were $42,869 (2016 - $44,971).
Concentration of RiskAll member and other loans and deposits are with individuals located primarily in the Thompson Okanagan region of British Columbia. Management believes that the Credit Union’s loans and deposits are not exposed to significant concentration of credit risk.
MARKET RISKMarket risk is the risk of a loss that may arise from financial market factors such as interest rates, foreign exchange rates, and equity or commodity prices. The Credit Union is exposed to market risk when making loans, taking deposits and making investments, which are all part of its asset/liability management activities. The level of market risk to which the Credit Union is exposed varies depending on market conditions and expectation of future price and yield movements. The Credit Union’s material market risks are confined to interest rates and, to a limited extent, foreign exchange, as discussed below.
INTEREST RATE RISKInterest rate risk arises mainly from the different re-pricing dates of cash flows associated with interest sensitive assets and liabilities. Certain products have embedded options, such as, loan prepayment and deposit redemption, which also impact interest rate risk.
Risk MeasurementThe Credit Union measures its interest rate risk on a monthly basis. Measures include the sensitivity of financial margin and equity value to changes in rates, duration parameters, as well as simulation modelling.
Objectives, Policies and ProcessesThe Asset Liability Committee (“ALCO”), made up of senior management, meets regularly to monitor the Credit Union’s position as set by Board policy and ALCO operational guidelines, and decide future strategy. These policies and guidelines define the standards and limits within which the risks to net interest income and the value of equity are contained. An asset/liability risk report is prepared monthly for ALCO and reviewed on a quarterly basis by the ILC. Interest rate risk policies are reviewed annually by the Board.
The Credit Union’s potential risk due to changes in interest rates is provided below. All interest rate risk measures are based upon interest rate exposure at a specific time and continuously change as a result of business activities and the Credit Union’s risk management initiatives.
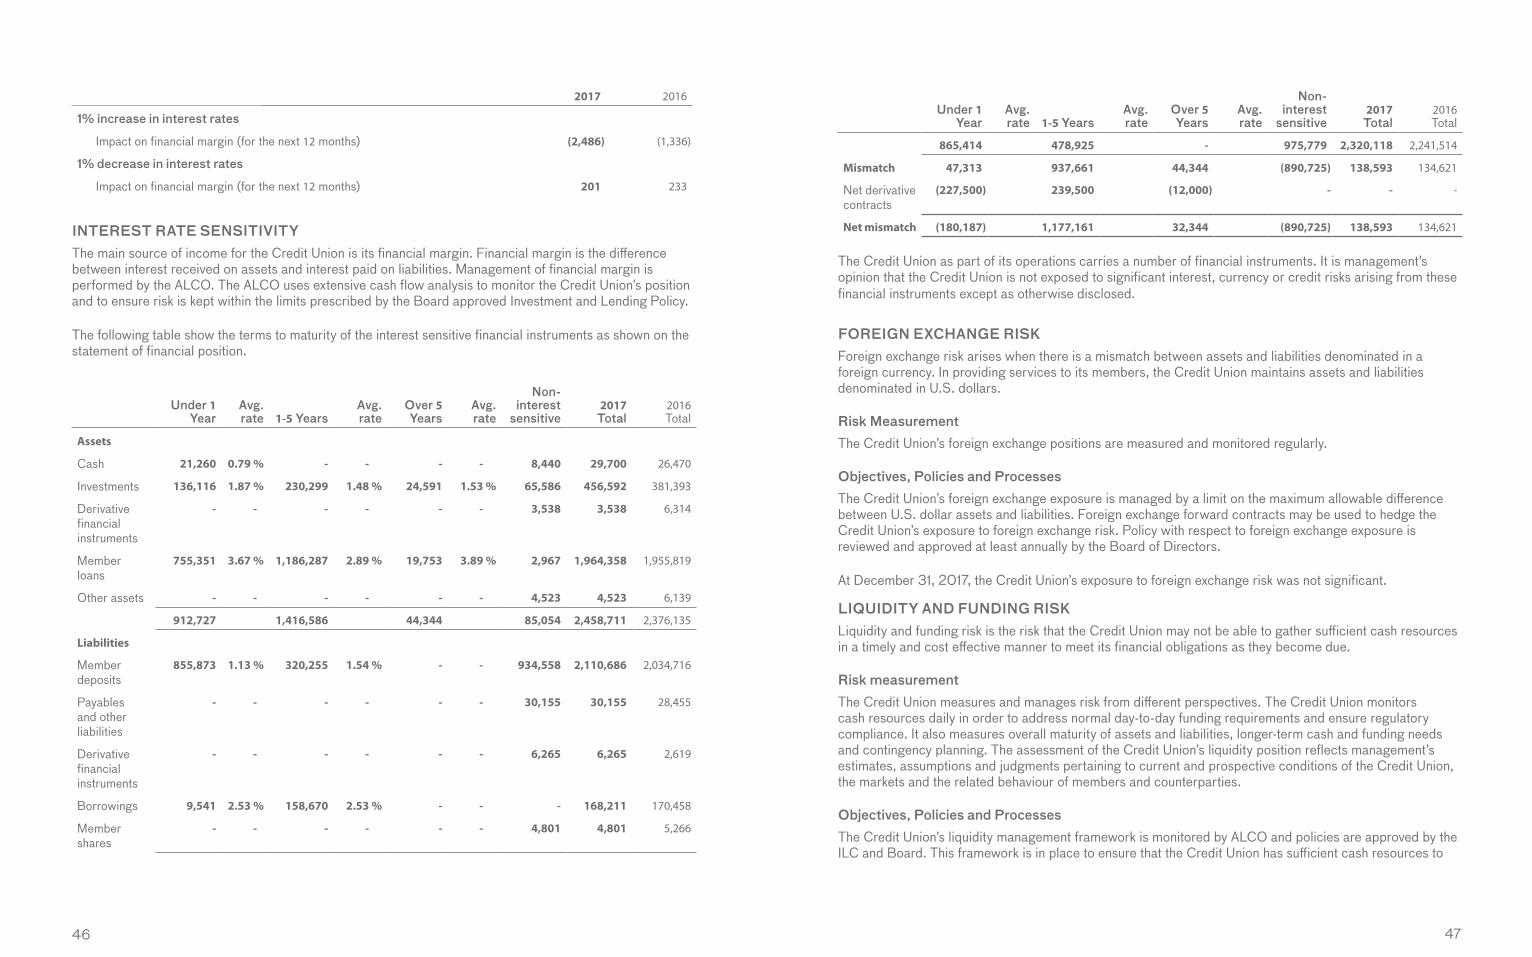
46 47
2017 2016
1% increase in interest rates
Impact on financial margin (for the next 12 months) (2,486) (1,336)
1% decrease in interest rates
Impact on financial margin (for the next 12 months) 201 233
INTEREST RATE SENSITIVITYThe main source of income for the Credit Union is its financial margin. Financial margin is the difference between interest received on assets and interest paid on liabilities. Management of financial margin is performed by the ALCO. The ALCO uses extensive cash flow analysis to monitor the Credit Union’s position and to ensure risk is kept within the limits prescribed by the Board approved Investment and Lending Policy.
The following table show the terms to maturity of the interest sensitive financial instruments as shown on the statement of financial position.
Under 1 Year
Avg. rate 1-5 Years
Avg. rate
Over 5 Years
Avg. rate
Non-interest
sensitive2017
Total2016 Total
Assets
Cash 21,260 0.79 % - - - - 8,440 29,700 26,470
Investments 136,116 1.87 % 230,299 1.48 % 24,591 1.53 % 65,586 456,592 381,393
Derivative financial instruments
- - - - - - 3,538 3,538 6,314
Member loans
755,351 3.67 % 1,186,287 2.89 % 19,753 3.89 % 2,967 1,964,358 1,955,819
Other assets - - - - - - 4,523 4,523 6,139
912,727 1,416,586 44,344 85,054 2,458,711 2,376,135
Liabilities
Member deposits
855,873 1.13 % 320,255 1.54 % - - 934,558 2,110,686 2,034,716
Payables and other liabilities
- - - - - - 30,155 30,155 28,455
Derivative financial instruments
- - - - - - 6,265 6,265 2,619
Borrowings 9,541 2.53 % 158,670 2.53 % - - - 168,211 170,458
Member shares
- - - - - - 4,801 4,801 5,266
Under 1 Year
Avg. rate 1-5 Years
Avg. rate
Over 5 Years
Avg. rate
Non-interest
sensitive2017
Total2016 Total
865,414 478,925 - 975,779 2,320,118 2,241,514
Mismatch 47,313 937,661 44,344 (890,725) 138,593 134,621
Net derivative contracts
(227,500) 239,500 (12,000) - - -
Net mismatch (180,187) 1,177,161 32,344 (890,725) 138,593 134,621
The Credit Union as part of its operations carries a number of financial instruments. It is management’s opinion that the Credit Union is not exposed to significant interest, currency or credit risks arising from these financial instruments except as otherwise disclosed.
FOREIGN EXCHANGE RISKForeign exchange risk arises when there is a mismatch between assets and liabilities denominated in a foreign currency. In providing services to its members, the Credit Union maintains assets and liabilities denominated in U.S. dollars.
Risk MeasurementThe Credit Union’s foreign exchange positions are measured and monitored regularly.
Objectives, Policies and ProcessesThe Credit Union’s foreign exchange exposure is managed by a limit on the maximum allowable difference between U.S. dollar assets and liabilities. Foreign exchange forward contracts may be used to hedge the Credit Union’s exposure to foreign exchange risk. Policy with respect to foreign exchange exposure is reviewed and approved at least annually by the Board of Directors.
At December 31, 2017, the Credit Union’s exposure to foreign exchange risk was not significant.
LIQUIDITY AND FUNDING RISKLiquidity and funding risk is the risk that the Credit Union may not be able to gather sufficient cash resources in a timely and cost effective manner to meet its financial obligations as they become due.
Risk measurementThe Credit Union measures and manages risk from different perspectives. The Credit Union monitors cash resources daily in order to address normal day-to-day funding requirements and ensure regulatory compliance. It also measures overall maturity of assets and liabilities, longer-term cash and funding needs and contingency planning. The assessment of the Credit Union’s liquidity position reflects management’s estimates, assumptions and judgments pertaining to current and prospective conditions of the Credit Union, the markets and the related behaviour of members and counterparties.
Objectives, Policies and ProcessesThe Credit Union’s liquidity management framework is monitored by ALCO and policies are approved by the ILC and Board. This framework is in place to ensure that the Credit Union has sufficient cash resources to
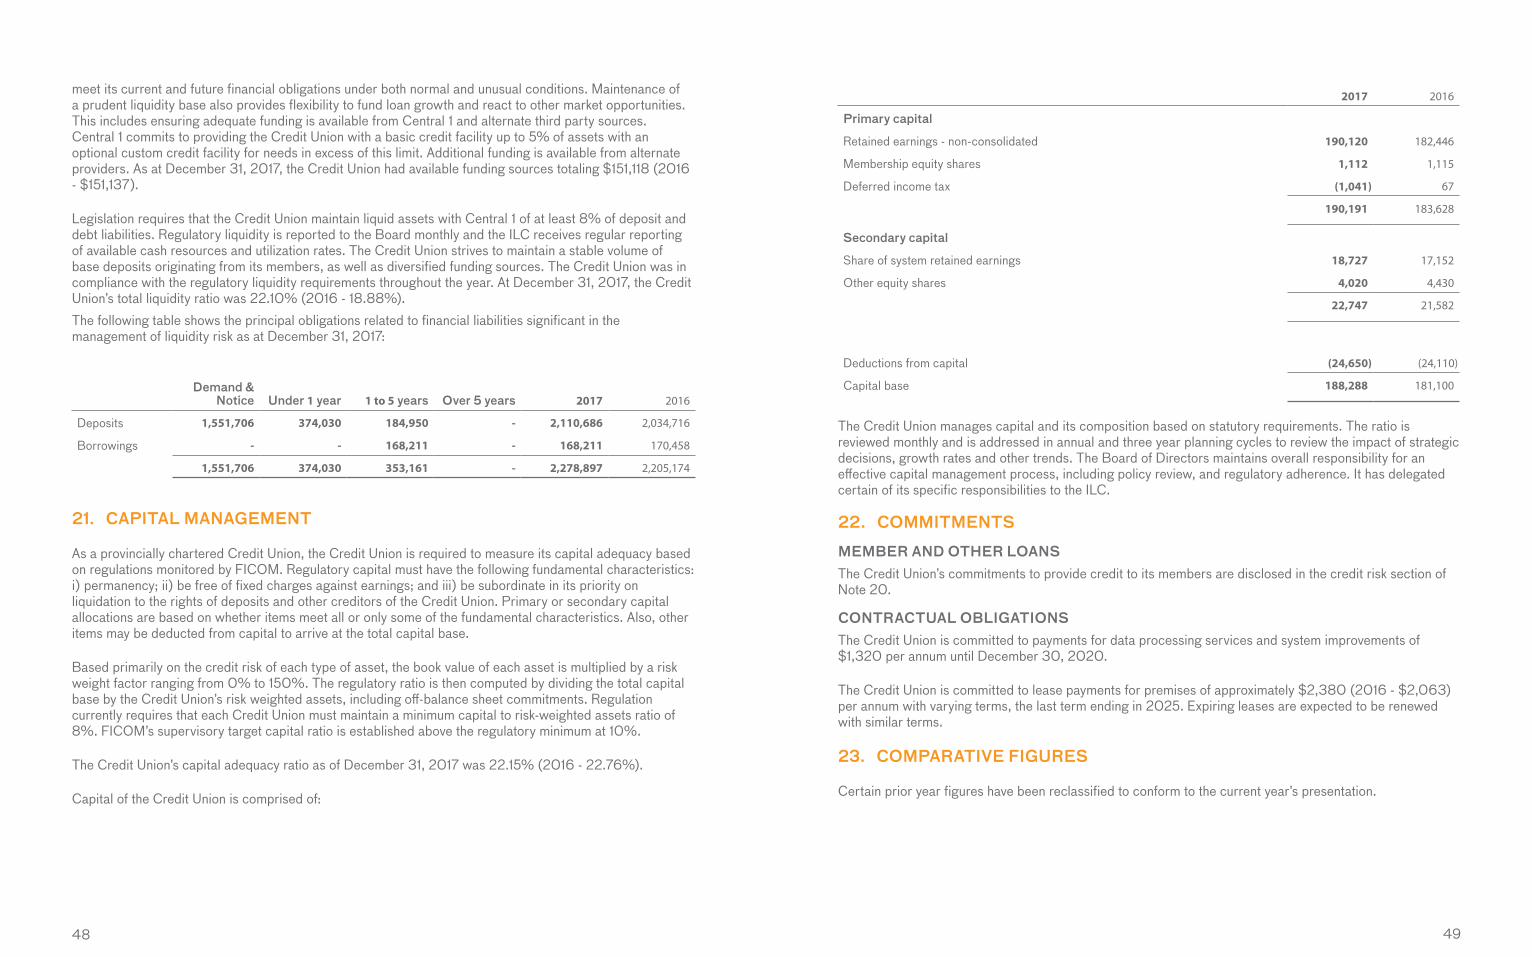
48 49
meet its current and future financial obligations under both normal and unusual conditions. Maintenance of a prudent liquidity base also provides flexibility to fund loan growth and react to other market opportunities. This includes ensuring adequate funding is available from Central 1 and alternate third party sources. Central 1 commits to providing the Credit Union with a basic credit facility up to 5% of assets with an optional custom credit facility for needs in excess of this limit. Additional funding is available from alternate providers. As at December 31, 2017, the Credit Union had available funding sources totaling $151,118 (2016 - $151,137).
Legislation requires that the Credit Union maintain liquid assets with Central 1 of at least 8% of deposit and debt liabilities. Regulatory liquidity is reported to the Board monthly and the ILC receives regular reporting of available cash resources and utilization rates. The Credit Union strives to maintain a stable volume of base deposits originating from its members, as well as diversified funding sources. The Credit Union was in compliance with the regulatory liquidity requirements throughout the year. At December 31, 2017, the Credit Union’s total liquidity ratio was 22.10% (2016 - 18.88%).The following table shows the principal obligations related to financial liabilities significant in the management of liquidity risk as at December 31, 2017:
Demand & Notice Under 1 year 1 to 5 years Over 5 years 2017 2016
Deposits 1,551,706 374,030 184,950 - 2,110,686 2,034,716
Borrowings - - 168,211 - 168,211 170,458
1,551,706 374,030 353,161 - 2,278,897 2,205,174
21. CAPITAL MANAGEMENT
As a provincially chartered Credit Union, the Credit Union is required to measure its capital adequacy based on regulations monitored by FICOM. Regulatory capital must have the following fundamental characteristics: i) permanency; ii) be free of fixed charges against earnings; and iii) be subordinate in its priority on liquidation to the rights of deposits and other creditors of the Credit Union. Primary or secondary capital allocations are based on whether items meet all or only some of the fundamental characteristics. Also, other items may be deducted from capital to arrive at the total capital base.
Based primarily on the credit risk of each type of asset, the book value of each asset is multiplied by a risk weight factor ranging from 0% to 150%. The regulatory ratio is then computed by dividing the total capital base by the Credit Union’s risk weighted assets, including off-balance sheet commitments. Regulation currently requires that each Credit Union must maintain a minimum capital to risk-weighted assets ratio of 8%. FICOM’s supervisory target capital ratio is established above the regulatory minimum at 10%.
The Credit Union’s capital adequacy ratio as of December 31, 2017 was 22.15% (2016 - 22.76%).
Capital of the Credit Union is comprised of:
2017 2016
Primary capital
Retained earnings - non-consolidated 190,120 182,446
Membership equity shares 1,112 1,115
Deferred income tax (1,041) 67
190,191 183,628
Secondary capital
Share of system retained earnings 18,727 17,152
Other equity shares 4,020 4,430
22,747 21,582
Deductions from capital (24,650) (24,110)
Capital base 188,288 181,100
The Credit Union manages capital and its composition based on statutory requirements. The ratio is reviewed monthly and is addressed in annual and three year planning cycles to review the impact of strategic decisions, growth rates and other trends. The Board of Directors maintains overall responsibility for an effective capital management process, including policy review, and regulatory adherence. It has delegated certain of its specific responsibilities to the ILC. 22. COMMITMENTS
MEMBER AND OTHER LOANSThe Credit Union’s commitments to provide credit to its members are disclosed in the credit risk section of Note 20.
CONTRACTUAL OBLIGATIONSThe Credit Union is committed to payments for data processing services and system improvements of $1,320 per annum until December 30, 2020.
The Credit Union is committed to lease payments for premises of approximately $2,380 (2016 - $2,063) per annum with varying terms, the last term ending in 2025. Expiring leases are expected to be renewed with similar terms.
23. COMPARATIVE FIGURES
Certain prior year figures have been reclassified to conform to the current year’s presentation.

50 51
Notes
52
NotesAshcroft 201 Railway Avenue 250-453-2219 Insurance 250-453-9133
Barriere4621 Barriere Town Road 250-672-9736 Insurance 250-672-9634
Chase814 Shuswap Avenue 250-679-8831 Insurance 810 Shuswap Avenue 250-679-3248
Clearwater401-365 Murtle Crescent 250-674-3111 Insurance 250-674-3151
KamloopsLansdowne200-350 Lansdowne St 250-374-3361 Insurance 201-350 Lansdowne St 250-374-3536
CREDIT UNION AND INSURANCE LOCATIONS
Glenmore500-1982 Kane Road 250-762-2262 Insurance 250-980-4570
Mission101-595 K.L.O Road 250-763-8144 Insurance 250-868-2251
Orchard Centre2071 Harvey Avenue 250-860-7400
Rutland185 Rutland Road South 250-469-6575 Insurance 250-765-4898
Lake Country30-9522 Main Street 250-766-3663
Lillooet674 Main Street 250-256-4238
Summit370-1210 Summit Drive 250-314-1210Columbia Insurance 370C-1210 Summit Drive 250-372-8118
Tranquille100-430 Tranquille Road 250-376-5544 Insurance 101-430 Tranquille Road 250-376-6255
North Hills Insurance 19-700 Tranquille Road 250-376-8881
Valleyview1-2101 Trans Canada Hwy, East 250-374-6676 Insurance 9-2121 Trans Canada Hwy, East 250-374-7552
KelownaBernard101-678 Bernard Avenue 250-869-8300 Insurance 102-678 Bernard Avenue 250-712-4045
Merritt1959 Voght Street 250-378-5181 Insurance 2001B Voght Street 250-378-4234
Oliver 6287 Main Street 250-498-3457 Insurance 6283 Main Street 250-498-5610
Okanagan Falls4929 9th Avenue 250-497-8204
Osoyoos9145 Main Street 250-495-8027
Vernon4301 32nd Street 250-545-1234
West Kelowna3718 Elliott Road 250-469-6550 Insurance 250-768-2176
ADDITIONAL SERVICES
Commercial ServicesKelowna 654 Bernard Avenue 250-469-6500 Kamloops 202-350 Lansdowne Street 250-851-2814 Commercial Insurance 201-350 Lansdowne Street 250-374-3536
Wealth ManagementKelowna 200-2071 Harvey Ave 250-869-8336 Kamloops 203-350 Lansdowne Street 250-377-4937
Member Service Centre1-855-220-2580
Telephone Banking1-877-861-ISCU (4728)
Insurance 24 Hr Claims Reporting1-877-912-2271
www.interiorsavings.com

54