Embed Size (px)
Citation preview

Wynnum State High School
2016 ANNUAL REPORT
Queensland State School Reporting
Inspiring minds. Creating opportunities. Shaping Queensland’s future. Every student succeeding. State Schools Strategy 2016-2020
Department of Education and Training
1

Contact Information
Postal address: PO Box 797 Wynnum 4178
Phone: (07) 3906 7333
Fax: (07) 3906 7300
Email: [email protected]
Webpages: Additional reporting information pertaining to Queensland state schools is located on the My School website and the Queensland Government data website.
Contact Person: Catherine Pfingst.(Principal)
2

School Overview
Wynnum State High School has been proudly serving its community since 1942. Our
curriculum is organised to allow for the study of core and electives in Years 7 to 10, with Years 11 and 12 students able to specialise and prepare for future careers and further education. A particular feature is the variety of alternatives in academic, vocational education and sport pathways. This program allows our senior students to access tutorials, independent study, enterprise programs, sports programs or part-time employment. Years 11 and 12 students also have the opportunity to undertake a school-based apprenticeship or traineeship, allowing them to work towards a nationally-recognised qualification while still completing their senior studies. Our students are keen participants in many extra-curricular activities and the school is recognised for its performing arts program with many different bands and ensembles. Other activities include public speaking, debating, sport and dance groups. The school is committed to promoting a culture of caring for the individual needs of students with a support team comprising year level (PROUD) coordinators, guidance officer, chaplain, learning support, work placement officer, youth health nurse and youth support coordinator.
We’re Wynnum, We’re PROUD
Principal’s Foreword
Introduction
The report provides an overview of the 2016 year at Wynnum SHS. The outcomes
demonstrated are a result of the ongoing commitment to improving student outcomes. Through this process the school has continued to reflect and refine programs, subject offerings and experiences for the students to ensure they may succeed in their chosen direction.
School Progress towards its goals in 2016
By having clear strategic direction in 2016 the school has seen an improvement across all 9 domains of the national school improvement tool. The school also continued to focus on literacy and numeracy improvements across all year levels with a particular focus on the junior years. The outcome of this has seen points of celebration in the 2016 NAPLAN outcomes. Wynnum SHS continues to offer a well-rounded program. In 2017 the school will capitalise on the improvements made to date to maximise student outcomes and continue to focus on improving in those areas previously identified. Initiatives of 2016 will continue to be embedded in teacher and learning practices of Wynnum.
3

Future Outlook
High Expectations - Cycles of Planning and Feedback Actions Targets Timelines Monitor and refine Junior Secondary unit and assessment plans as well as Year 10 assessment
100% of current assessment adjusted
Term 1 Ongoing
Refine assessment task sheets and exemplars
100% of current assessment adjusted Ongoing
Explicit teaching of R2L to support students literacy capability including collaborative planning and implementation of strategies with a distinct focus on U2B
100% staff participation 2017
All teachers will be involved in moderation processes in the curriculum cycle– ‘before, during and after’ planning
100% staff participation 2017
Using formative assessment to inform teaching and learning for summative assessment
20% improvement in A-C in all subjects and year levels 2017
Quality Teaching and Learning - Coaching Actions Targets Timelines
Lead professional development on coaching, peer observation and feedback
Greater than 90% total agreement with regard to PD access as indicated in SOS
Ongoing
Consolidate the culture of support for coaching, peer observation and feedback
An initial uptake of 25% of staff followed by at least an additional in 15% each term
2017
Use Professional Standards of Teachers to further increase teacher knowledge and expertise
100% staff participate in PD focussed on Professional standards of teaching
Ongoing through
PD sessions
Collaboratively build a faculty process for coaching, peer observation and feedback and actively participate.
All HODs meeting their observation targets (each designated staff member at least twice a term)
Term 1 Ongoing
Tracking Students for Success - Attendance Actions Targets Timelines
Use a ‘traffic light system’ to show students their attendance percentages
95% attendance for all students Reduce <85% attendance to <20%
Term 1 Ongoing
Use the school ‘House’ system as the vehicle for the tracking student attendance and do this on a weekly basis. Term 1
Develop a rewards system to encourage student attendance
Term 1
All teachers will monitor student daily attendance through electronic roll marking each lesson using ID Attend
Ongoing
Heads of House will work with the Administration team to monitor attendance data
Ongoing
4

Our School at a Glance
School Profile
Coeducational or single sex: Coeducational
Independent Public School: No
Year levels offered in 2016: Year 7 - Year 12
Student enrolments for this school:
Total Girls Boys Indigenous Enrolment Continuity
(Feb – Nov) 2014 631 289 342 38 89%
2015* 747 349 398 49 93%
2016 821 390 431 56 93%
Student counts are based on the Census (August) enrolment collection. *From 2015, data for all state high schools include Year 7 students. Prior to 2015, only state high schools offering Year 7 had these students included in their counts.
In 2016, there were no students enrolled in a pre-Prep** program. ** pre-Prep is a kindergarten program for Aboriginal and Torres Strait Islander children, living across 35 Aboriginal and Torres Strait Islander communities, in the year before school (http://deta.qld.gov.au/earlychildhood/families/pre-prep-indigenous.html).
Characteristics of the Student Body
Overview Wynnum State High School has a diverse community. In 2016, our enrolments reflected over
25 different cultural backgrounds with approximately 7% of the student population identifying as Aboriginal or Torres Strait Islander. We recognise and celebrate our diverse community at events such as Harmony Day each year. Our families represent a range of diverse occupations with the highest employment fields including Administration, Health, Trades, Retails and Public Service. Approximately 35% of our students aspire towards university entrance whilst the remaining students seek prevocational training or employment. Average Class Sizes The following table shows the average class size information for each phase of schooling.
AVERAGE CLASS SIZES
Phase 2014 2015* 2016
Prep – Year 3
Year 4 – Year 7
Year 8 – Year 10 24 22 24
Year 11 – Year 12 15 18 17
*From 2015, data for all state high schools include Year 7 students. Prior to 2015, only state high schools offering Year 7 had these students included in their counts.
5

Curriculum Delivery Our Approach to Curriculum Delivery Our distinctive curriculum offerings include:
• Academic excellence program in math, science, English and History for years 7 to 10 • Sports enhancement program • An extensive vocational pathway for senior students • A strong academic tradition and authority choices for tertiary bound students • A personalised and unique service delivery
Co-curricular Activities
• Academic competitions including STEM program • Cultural activities and acknowledgements • Representatives in district, regional and state teams • Performing Arts events which included band tour, local performances • Instrumental music program supported by parents and community. There is a symphonic
band, concert band and stage band • Work experience program
How Information and Communication Technologies are used to Assist Learning
Wynnum State High School recognizes the needs of the new generation of digital learners. All classrooms and student and community spaces at Wynnum State High School have wireless coverage. All students have the opportunity to access the laptop program. This enables them to access the virtual learning classroom to extend their learning to 24/7. All other students have access to laptops during class time through classroom allocation and PCs are available in many classrooms across the school and in the library. The staff incorporate digital pedagogies into lessons. Additionally, mathletics, Cogmed and Jungle Memory (on line testing) are used to develop students working memories and inform future planning.
Social Climate Overview
Wynnum SHS community is PROUD of the safe and caring environment it provides. Through the programs provided students are taught resilience, ambition and general health and wellbeing that supports their academic programs and aids in the production of a holistic education. The school utilises heads of house, youth support coordinators, school based youth health nurse, chaplain, indigenous support staff and a guidance officer to provide guidance for decision making, careers and general health and wellbeing. Programs within the curriculum and additional to it are designed to be relevant to our students and their personal needs. The staff at Wynnum are highly committed to the students and go above and beyond in providing a range of extracurricular activities as well as other additional activities. Students participate across disciplines and encourage and support each other in their endeavours. The skill level of the staff both in and out of the classroom ensure that program delivery and extracurricular opportunities are delivered in a well informed and nurturing landscape. Students feel valued and supported as indicated in their SOS responses and this is felt within the school as students are friendly, welcoming and tolerant Parent, Student and Staff Satisfaction
In 2016, 100% of students and 96% of the parents of Wynnum agreed that teachers expected their child to their best. Similarly, parents felt this was a good school and a safe environment for their child. Additionally, 98% of students agreed that teachers motivated them to learn and the school looks for ways to improve. Similar numbers of teachers also identified motivation and expectation to do their best. Teacher responses also identified they enjoyed working at Wynnum, it is a safe work environment and students are treated fairly.
6

Parent opinion survey
Performance measure Percentage of parents/caregivers who agree# that: 2014 2015 2016 their child is getting a good education at school (S2016) 83% 88% 90%
this is a good school (S2035) 91% 88% 96%
their child likes being at this school* (S2001) 88% 96% 96%
their child feels safe at this school* (S2002) 92% 96% 94%
their child's learning needs are being met at this school* (S2003) 81% 81% 92%
their child is making good progress at this school* (S2004) 85% 85% 94%
teachers at this school expect their child to do his or her best* (S2005) 92% 85% 96%
teachers at this school provide their child with useful feedback about his or her school work* (S2006) 87% 81% 90%
teachers at this school motivate their child to learn* (S2007) 87% 85% 91%
teachers at this school treat students fairly* (S2008) 87% 80% 86%
they can talk to their child's teachers about their concerns* (S2009) 94% 92% 92%
this school works with them to support their child's learning* (S2010) 84% 81% 92%
this school takes parents' opinions seriously* (S2011) 84% 80% 96%
student behaviour is well managed at this school* (S2012) 80% 76% 86%
this school looks for ways to improve* (S2013) 89% 88% 88%
this school is well maintained* (S2014) 98% 100% 96%
Student opinion survey
Performance measure Percentage of students who agree# that: 2014 2015 2016
they are getting a good education at school (S2048) 95% 90% 96%
they like being at their school* (S2036) 96% 90% 93%
they feel safe at their school* (S2037) 95% 91% 95%
their teachers motivate them to learn* (S2038) 93% 88% 98%
their teachers expect them to do their best* (S2039) 98% 95% 100%
their teachers provide them with useful feedback about their school work* (S2040) 93% 86% 94%
teachers treat students fairly at their school* (S2041) 88% 78% 91%
they can talk to their teachers about their concerns* (S2042) 87% 73% 89%
their school takes students' opinions seriously* (S2043) 88% 76% 87%
student behaviour is well managed at their school* (S2044) 77% 72% 79%
their school looks for ways to improve* (S2045) 98% 95% 98%
their school is well maintained* (S2046) 96% 89% 94%
their school gives them opportunities to do interesting things* (S2047) 93% 91% 97%
7

Staff opinion survey
Performance measure Percentage of school staff who agree# that: 2014 2015 2016
they enjoy working at their school (S2069) 97% 97% 92%
they feel that their school is a safe place in which to work (S2070) 97% 94% 95%
they receive useful feedback about their work at their school (S2071) 86% 81% 84%
they feel confident embedding Aboriginal and Torres Strait Islander perspectives across the learning areas (S2114)
89% 83% 82%
students are encouraged to do their best at their school (S2072) 99% 94% 96%
students are treated fairly at their school (S2073) 99% 93% 95%
student behaviour is well managed at their school (S2074) 90% 88% 90%
staff are well supported at their school (S2075) 93% 89% 88%
their school takes staff opinions seriously (S2076) 92% 86% 88%
their school looks for ways to improve (S2077) 97% 96% 95%
their school is well maintained (S2078) 97% 90% 94%
their school gives them opportunities to do interesting things (S2079) 90% 94% 88%
* Nationally agreed student and parent/caregiver items # ‘Agree’ represents the percentage of respondents who Somewhat Agree, Agree or Strongly Agree with the statement. DW = Data withheld to ensure confidentiality.
Parent and community engagement
We encourage the active participation of all of our families. The key area of community support stems from our Parents’ and Citizens’ Association that meets monthly as does the Instrumental Music Parents’ Support group. Parents use these meetings to provide support to the school and to also share thoughts and strategies in order to contribute to ongoing improvements. Parent-Teacher evenings are held twice yearly to discuss student academic progress and achievement.
All Year 12 students and their parents are interviewed at the beginning of Year 12 and students are asked to reflect on their previous SET Plan. They use this meeting to develop a new action plan in order to bring about strategies to generate success in their final year at school.
All Year 10 students entering the senior school are interviewed in September each year. Parents accompany their children to the interviews and a SET Plan is prepared for the senior school. All students entering Years 7, 8 and Year 11 were interviewed with their parents in the year before their enrolment begins.
Subject selection nights are held for Year 8, Year 9 and Year 10 students and these nights are compulsory information evenings for students and their parents. Parents receive either a hardcopy or electronic monthly newsletter called the “Wynnum Wire”. We maintain an up-to-date website which allows parents to know what is going on at Wynnum High. Parent-friendly reports in plain English are produced each term and these are mailed home. Tours for new and prospective students and their parents are held regularly.
In 2016 families had the opportunity to participate in Meet the Principal sessions, school tours, information evenings and community forums. Parents have access to staff email addresses through the website and we encourage parents to contact us and talk to us about their child’s progress at all times.
8

Respectful relationships programs The school has developed and implemented a program or programs that focus on appropriate, respectful and healthy relationships. As a PBL school, explicit lessons are delivered on the school’s values PROUD (Positive, Respectful, On Task, Unified, Determined). These lessons are targeted to teach and reinforce expectations of school and society in general. They are planned, reviewed and presented consistently for all students to access. In addition, pastoral care lessons are timetabled into the school week. These lessons target relationships and positive personal safety amongst other topics. The student diary provides a snapshot of information that supports the lessons taught and acts as an easy reference point. Student support personnel are available for one on one conversations, small group work and delivering relevant personal relationship programs. They support students both proactively and reactively so that the best possible outcome for all involved can be attained. School Disciplinary Absences The following table shows the count of incidents for students recommended for each type of school disciplinary absence reported at the school.
SCHOOL DISCIPLINARY ABSENCES
Type 2014* 2015** 2016
Short Suspensions – 1 to 5 days 133 176 140
Long Suspensions – 6 to 20 days 11 10 8
Exclusions 5 6 8
Cancellations of Enrolment 5 6 5
* Caution should be used when comparing post 2013 SDA data as amendments to EGPA disciplinary provisions and changes in methodology created time series breaks in 2014 and 2015. **From 2015, Exclusion represents principal decisions to exclude rather than recommendations for exclusion. From 2015 where a principal decided not to exclude, a small number of recommendations for exclusions have been counted as a long suspension. Exclusions, Cancellations and Long & Charge Suspensions may be upheld or set aside through an appeals process.
Environmental Footprint Reducing the school’s environmental footprint
Data is sourced from school's annual utilities return and is reliant on the accuracy of these returns. 2016 has seen a further reduction in water use. This has been the result of significant infrastructural changes including new facilities and water tanks. The use of environmental infrastructure has led to decrease in the environmental footprint categories particularly electricity. We will continue to review our data and put strategies in place to address key areas.
ENVIRONMENTAL FOOTPRINT INDICATORS
Years Electricity kWh
Water kL
2013-2014 452,517 3,428
2014-2015 467,127 2,980
2015-2016 467,877 3,692
The consumption data is compiled from sources including ERM, Ergon reports and utilities data entered into OneSchool by each school. The data provides an indication of the consumption trend in each of the utility categories which impact on the school’s environmental footprint.
9

School Funding School income broken down by funding source School income, reported by financial year accounting cycle using standardized national methodologies and broken down by funding source is available via the My School website at http://www.myschool.edu.au/.
To access our income details, click on the My School link above. You will then be taken to the My School website with the following ‘Find a school’ text box.
Where it states ‘School name’, type in the name of the school you wish to view, select the school from the drop-down list and select <GO>. Read and follow the instructions on the next screen; you will be asked to confirm that you are not a robot then by clicking continue, you acknowledge that you have read, accepted and agree to the Terms of Use and Privacy Policy before being given access to the school’s profile webpage.
School financial information is available by selecting ‘School finances’ in the menu box in the top left corner of the school’s profile webpage. If you are unable to access the internet, please contact the school for a paper copy of income by funding source.
Our Staff Profile
Workforce Composition
Staff composition, including Indigenous staff
2016 WORKFORCE COMPOSITION
Description Teaching Staff Non-Teaching Staff Indigenous Staff
Headcounts 68 29 <5
Full-time Equivalents 65 22 <5
10

Qualification of all teachers
TEACHER* QUALIFICATIONS
Highest level of qualification Number of classroom teachers and school leaders at the school
Doctorate
Masters
Graduate Diploma etc.** Bachelor degree
Diploma
Certificate
*Teaching staff includes School Leaders **Graduate Diploma etc. includes Graduate Diploma, Bachelor Honours Degree, and Graduate Certificate.
Professional Development
Expenditure On and Teacher Participation in Professional Development
The total funds expended on teacher professional development in 2016 were $21946.28.
The major professional development initiatives are as follows: • Asbestos awareness • Code of conduct • PBL • QCAA • Reading to Learn
The proportion of the teaching staff involved in professional development activities during 2016 was 100%.
Staff Attendance and Retention Staff attendance
AVERAGE STAFF ATTENDANCE (%)
Description 2014 2015 2016
Staff attendance for permanent and temporary staff and school leaders. 97% 96% 97%
Proportion of Staff Retained from the Previous School Year From the end of the previous school year, 97% of staff was retained by the school for the entire 2016.
11

Performance of Our Students
Key Student Outcomes
Student Attendance Student attendance The table below shows the attendance information for all students at this school:
STUDENT ATTENDANCE 2016
Description 2014 2015 2016
The overall attendance rate* for the students at this school (shown as a percentage). 89% 89% 89%
The attendance rate for Indigenous students at this school (shown as a percentage). 83% 79% 82%
*The student attendance rate is generated by dividing the total of full-days and part-days that students attended, and comparing this to the total of all possible days for students to attend, expressed as a percentage.
The overall student attendance rate in 2016 for all Queensland Secondary schools was 90%.
AVERAGE STUDENT ATTENDANCE RATE* (%) FOR EACH YEAR LEVEL Year Level Prep Year
1 Year
2 Year
3 Year
4 Year
5 Year
6 Year
7 Year
8 Year
9 Year 10
Year 11
Year 12
2014 92% 89% 89% 87% 90%
2015 92% 91% 89% 86% 88% 86%
2016 92% 90% 87% 88% 88% 87%
*Attendance rates effectively count attendance for every student for every day of attendance in Semester 1. The student attendance rate is generated by dividing the total of full-days and part-days that students attended, and comparing this to the total of all possible days for students to attend, expressed as a percentage. DW = Data withheld to ensure confidentiality.
Student Attendance Distribution The proportions of students by attendance range:
Description of how non-attendance is managed by the school Non-attendance is managed in state schools in line with the DET procedures, Managing Student Absences and Enforcing Enrolment and Attendance at State Schools and Roll Marking in State Schools, which outline processes for managing and recording student attendance and absenteeism.
23
24
22
11
14
13
25
25
28
41
37
37
0% 20% 40% 60% 80% 100%
2016
2015
2014
Proportion of Students
Attendance Rate: 0% to <85% 85% to <90% 90% to <95% 95% to 100%
12

In 2016 at Wynnum State High School, a dedicated rolls administration officer managed the recording and following up of absences with the support of PROUD Coordinators and the Administration Team. In 2016, rolls were marked each lesson using the ID Attend online system. Follow up occurred daily when a student had an unexplained absence. A text message alert system was used to notify parents. The introduction of PROUD Coordinators has impacted positively on school attendance as they will closely monitor attendance and directly notify parents of any extended unexplained lateness or absence.
NAPLAN Our reading, writing, spelling, grammar and punctuation, and numeracy results for the Years 3, 5, 7 and 9 are available via the My School website at http://www.myschool.edu.au/.
To access our NAPLAN results, click on the My School link above. You will then be taken to the My School website with the following ‘Find a school’ text box.
Where it states ‘School name’, type in the name of the school you wish to view, select the school from the drop-down list and select <GO>. Read and follow the instructions on the next screen; you will be asked to confirm that you are not a robot then by clicking continue, you acknowledge that you have read, accepted and agree to the Terms of Use and Privacy Policy before being given access to the school’s profile webpage.
School NAPLAN information is available by selecting ‘NAPLAN’ in the menu box in the top left corner of the school’s profile webpage. If you are unable to access the internet, please contact the school for a paper copy of our school’s NAPLAN results.
13

Year 12 Outcomes
OUTCOMES FOR OUR YEAR 12 COHORTS
Description 2014 2015 2016
Number of students receiving a Senior Statement 84 70 122
Number of students awarded a Queensland Certificate of Individual Achievement. 0 0 0
Number of students receiving an Overall Position (OP) 48 31 63
Percentage of Indigenous students receiving an Overall Position (OP) 0% 33% 20%
Number of students who are completing/continuing a School-based Apprenticeship or Traineeship (SAT). 24 18 21
Number of students awarded one or more Vocational Educational Training (VET) qualifications (incl. SAT).
63 54 88
Number of students awarded an Australian Qualification Framework Certificate II or above.
59 47 71
Number of students awarded a Queensland Certificate of Education (QCE) at the end of Year 12.
81 69 121
Percentage of Indigenous students awarded a Queensland Certificate of Education (QCE) at the end of Year 12.
100% 100% 100%
Number of students awarded an International Baccalaureate Diploma (IBD). 0 0 0
Percentage of OP/IBD eligible students with OP 1-15 or an IBD. 67% 81% 75%
Percentage of Year 12 students who are completing or completed a SAT or were awarded one or more of the following: QCE, IBD, VET qualification. 100% 100% 100%
Percentage of Queensland Tertiary Admissions Centre (QTAC) applicants receiving an offer. 98% 96% 100%
As at 3rd February 2017. The above values exclude VISA students.
OVERALL POSITION BANDS (OP)
Number of students in each band for OP 1 - 25 Years OP 1-5 OP 6-10 OP 11-15 OP 16-20 OP 21-25 2014 5 13 14 14 2
2015 3 10 12 6 0
2016 5 28 14 15 1 As at 3rd February 2017. The above values exclude VISA students.
VOCATIONAL EDUCATIONAL TRAINING QUALIFICATION (VET)
Number of students awarded certificates under the Australian Qualification Framework (AQF)
Years Certificate I Certificate II Certificate III or above
2014 32 52 25
2015 34 45 13
2016 50 67 26 As at 3rd February 2017. The above values exclude VISA students.
Wynnum State High offered the following Certificate Courses: Certificate 1 Engineering and Certificate 1 in Construction; Certificate 2 in Hospitality; Certificate 2 in Horticulture; Certificate 1 and 2 in Info Digital Media and Technology; Certificate 2 in Tourism; Certificate 2 in Business; Certificate 2
14
in Sport and Recreation and Certificate 2 in Visual Arts; Certificate 3 in Aquatics; Certificate 1 in Furnishing
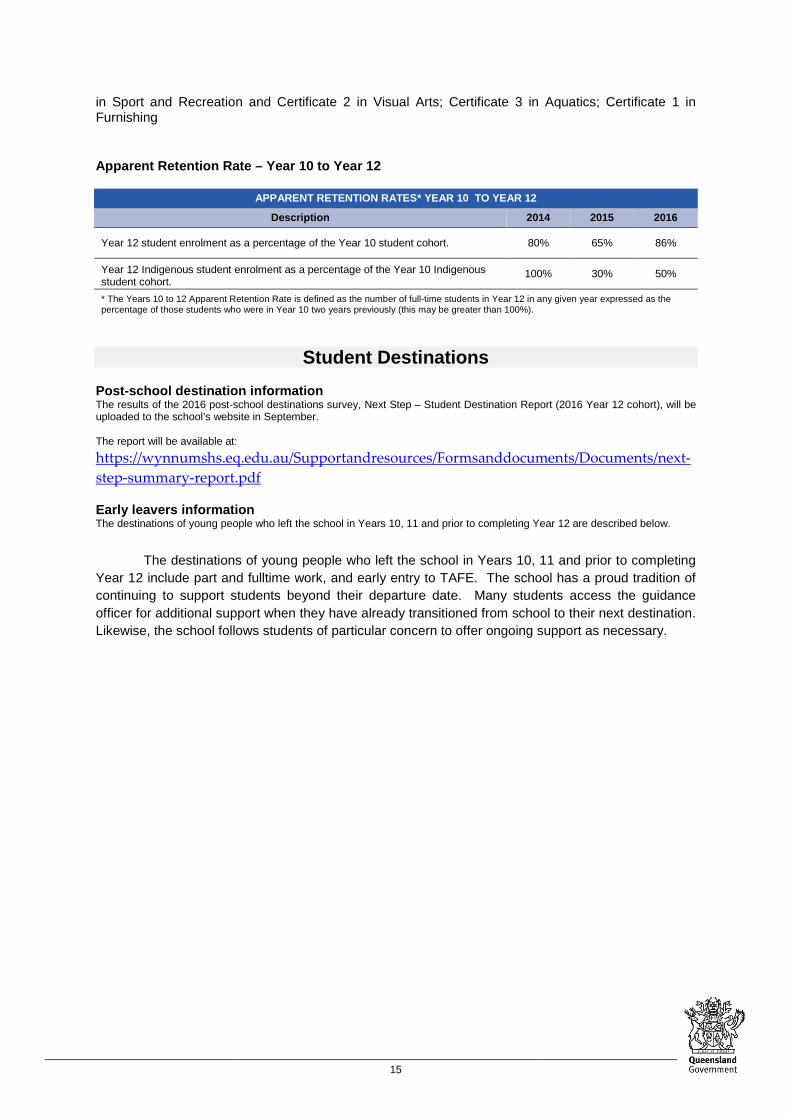
Apparent Retention Rate – Year 10 to Year 12
APPARENT RETENTION RATES* YEAR 10 TO YEAR 12
Description 2014 2015 2016
Year 12 student enrolment as a percentage of the Year 10 student cohort. 80% 65% 86%
Year 12 Indigenous student enrolment as a percentage of the Year 10 Indigenous student cohort.
100% 30% 50%
* The Years 10 to 12 Apparent Retention Rate is defined as the number of full-time students in Year 12 in any given year expressed as the percentage of those students who were in Year 10 two years previously (this may be greater than 100%).
Student Destinations
Post-school destination information The results of the 2016 post-school destinations survey, Next Step – Student Destination Report (2016 Year 12 cohort), will be uploaded to the school’s website in September. The report will be available at: https://wynnumshs.eq.edu.au/Supportandresources/Formsanddocuments/Documents/next-step-summary-report.pdf Early leavers information The destinations of young people who left the school in Years 10, 11 and prior to completing Year 12 are described below.
The destinations of young people who left the school in Years 10, 11 and prior to completing
Year 12 include part and fulltime work, and early entry to TAFE. The school has a proud tradition of continuing to support students beyond their departure date. Many students access the guidance officer for additional support when they have already transitioned from school to their next destination. Likewise, the school follows students of particular concern to offer ongoing support as necessary.
15

16