Embed Size (px)
DESCRIPTION
Reports
Citation preview
The Extent of Disclosure on Intangibles in Annual Reports
by
Susanne Arvidsson Paper presented at the 4th annual SNEE congress in Mölle, 20-23 May, 2003.
Department of Business Administration Lund University
PO Box 7080 220 07 Lund, Sweden
Phoneno. +46-46-222 79 81 E-mail: [email protected]
May not be copied, reproduced or quoted without permission from the author
2
Abstract
The purpose of this paper is to analyse the extent of disclosure on intangibles in annual reports and to identify company related factors, which explain the extent of disclosure. The focus is both on the extent of overall disclosure on intangibles and on the extent of disclosure related to five categories of intangibles, i.e. Human, Relational, Organisational, R&D and Environ/Social. The methodology underlying this study is a comprehensive analysis of the extent of disclosure on intangibles in annual reports. The disclosure study focuses on 36 annual reports made by Danish, Finnish, Norwegian and Swedish companies belonging to the pharmaceutical, biotechnology or health care equipment & supplies industries during 1999. The present study provides evidence that the management teams use the opportunity to voluntarily supply outsiders with information on intangibles. The extent of disclosure on intangibles in annual reports is, however, not overwhelming. Only half of the items in the checklist is on average disclosed in the annual reports. R&D is the category, which the knowledge-intense companies disclose most information on. Like R&D, information related to relationships with suppliers, customers and partners also appears to be deemed highly relevant when the management teams design their disclosures on intangibles. Social and environmental disclosure does not appear to be prioritised. The disclosure scores also reveal that the management teams do not seem to follow up the old adage “the employees are our most valuable asset” with information related to this high-valued asset. Four hypotheses were posed to test the relationship between company related factors and the extent of disclosure on intangibles. Company size was found to be positively related to the extent of disclosure on intangibles. The regression result did not lend support to the hypothesis that high leveraged companies disclose

3
more information on intangibles than low leveraged companies do. The hypothesis that Swedish companies disclose more on intangibles than companies from the other Nordic countries do was confirmed in the regression. Inconsistent with earlier disclosure studies, internationally listed companies were not found to disclose more information on intangibles than only-domestically listed companies.

4
The Extent of Disclosure on Intangibles in Annual Reports
1.1 Introduction During the last decades the number of knowledge-intense companies, e.g. biotechnology, informationtechnology and telecommunication companies, have increased. The most striking difference between these companies and traditional companies, e.g. manufacturing and forest companies, is that the knowledge-intense companies to a greater extent base their competitive strength and, thus, their value creation on intangibles (Holland, 2002; Lev, 2001; Sullivan and Sullivan, 2000; Sveiby, 1997; Wallman, 1996). According to a study conducted by the Brookings Institution (Blair and Kochan, 2000) 83 percent of corporate value was in 1978 due to tangible assets and 17 percent was due to intangible assets. In 1998 the proportions were almost reversed, i.e. 69 percent of corporate value stemmed from intangible assets and only 31 percent was associated with tangible assets. Considering the nature of today’s corporate value-creation process an important task for a management team is to communicate information related to intangibles and their role in the company’s value-creation process. Holland (2002) concludes that the major changes in the corporate value-creation process have resulted in both companies and actors on the capital market acknowledging the relevance of disclosures on intangibles. Several studies have confirmed that actors on the capital market in addition to financial information require more information on intangibles (Holland, 2001; Ernst and Young Center for Business Innovation, 1997; Mavrinac and Siesfeld, 1997; Eccles and Mavrinac, 1995). Bukh, Gormsen, Mouritsen and Nielsen (2002) conclude after analysing the information content in IPO prospectuses that the disclosure on intangibles has increased substantially between 1990 and 2001. There is, however, an oft-stated concern that the disclosure on intangibles has not kept pace with the capital market’s demand for increased information (Johanson, Mårtensson and Skoog, 2001; Hoegh-Krohn and Knivsflå, 2000; Wallman, 1995). Consequently, the shift in the nature of value creation is argued to render difficulties for the valuation of knowledge-intense companies (Lev, 2001; Sullivan and Sullivan, 2000; Chan, Lakonishok and Sougiannis, 1999). More informative disclosures are found to result in an overall more effective allocation of capital due to reduced information asymmetry, decreased bid-ask
5
spreads, increased stock liquidity, a lower average cost of both equity and debt capital and, consequently, better investment decisions (Botosan and Plumlee, 2002; Richardson and Welker, 2001; Healy, Hutton and Palepu, 1999; Sengupta, 1998; Botosan, 1997; Lang and Lundholm, 1996; Welker, 1995). These findings along with the rising demand, from the users of financial statements, for more information on intangibles have resulted in an intense activity in accounting bodies, at both national and international level, directed at examining if and how the boundaries of financial statements can be extended to also incorporate information on intangibles (see, e.g. FASB, 2001a,b, IAS No. 38; AICPA, 1994). Although more or less meritorious efforts, the problems with defining, classifying and valuing intangibles prolong the process. Even though accounting methods do not explicitly prescribe companies to disclose information on intangibles, the management team can compensate the lack of information on intangibles in financial statements by voluntarily disclose this type of information (FASB, 2001a). IAS No. 1 (Presentation of Financial Statements. rev. 1997) paragraph 8c implicitly encourages companies to include information on intangibles, which are paramount to the value creation but unrecognised in the balance sheet. The purpose of this paper is to analyse the extent of disclosure on intangibles in annual reports and to identify company related factors, which explain the extent of disclosure. The focus is both on the extent of overall disclosure on intangibles and on the extent of disclosure related to five categories of intangibles, i.e. Human, Relational, Organisational, R&D and Environ/Social. Thus, the present study aims at making a contribution to the research frontier focused at understanding how information suppliers (i.e. management teams) communicate intangibles in annual reports. A secondary purpose is to determine if the five categories measure a common entity, i.e. intangibles. Therefore, the structure of the disclosure scores is also examined in the paper. The study is motivated for four reasons. First, due to the importance intangibles are emphasised to play in the value-creation process (Holland, 2002; Sullivan and Sullivan, 2000) and the findings of reduced information asymmetry and a lower cost of capital following more informative disclosures (e.g. Richardson and Welker, 2001; Sengupta, 1998; Botosan, 1997), it is relevant to examine if and how the management teams use the opportunity to voluntarily supply outsiders with information on intangibles, in order to pave the way for a better understanding of what creates value in the company. Although there is a body of empirical studies examining the disclosure in annual reports (see, e.g. Ahmed and Courtis, 1999; Marston and Shrives, 1991), there is a lack of studies focused on the disclosure on intangibles. Second, the information process surrounding the valuation of companies involves a demand side, i.e. the actors on the capital market and a supply side, i.e. the management teams. The present study provides us with useful information concerning the emphasis the supply-side places on intangibles. Third, establishing the extent of overall disclosure on intangibles in annual reports, as well as which categories of intangibles the disclosure is focused on, should be relevant input for management teams when they design their disclosure on intangibles. Fourth, the result of the study should be valuable in the
6
accounting society’s current work with preparing rules and policies concerning how soft information related to intangibles should be disclosed in financial statements. The methodology underlying this study is a comprehensive analysis of the extent of disclosure on intangibles in annual reports. The disclosure study focuses on 36 annual reports made by Danish, Finnish, Norwegian and Swedish companies belonging to the pharmaceutical, biotechnology or health care equipment & supplies industries during 1999. The reason to focus on annual reports is motivated by the argument that this document is a good proxy for the level of voluntary disclosure a company provides across all different forms of disclosure (Botosan, 1997).1 The argument is supported by Gelb (2002) and Lang and Lundholm (1993) who find the disclosure level in annual reports to be positively correlated with the extent of disclosure provided via other types of communication. The reason to focus on knowledge-intense companies is motivated by these companies’ heavy reliance on intangibles in their value-creation process (see, e.g. Holland, 2002). The choice to include companies from all the Nordic countries enables an analysis of the potential existence of country specific disclosure styles (see discussion related to hypothesis 3 in section 3.3). The paper has the following disposition: The next section provides the reader with the theoretical and empirical foundation upon which the study rests. The hypotheses to be tested in the study are posed in section 1.3 along with a discussion on their theoretical and empirical basis. Thereafter, in section 1.4, the reader is presented with a detailed report on the research design and empirical methodology. In section 1.5, the empirical results from the analyses of the annual reports are presented. The paper ends with a discussion on the results and some concluding remarks along with suggestions for future research.
1.2 Theoretical and empirical foundation
1.2.1 Information asymmetry Since information asymmetry exists between the insiders of a company, i.e. the management team and the outsiders of a company, i.e. the shareholders, voluntary disclosure can be seen as originated from a principal-agent problem (Jensen and Meckling, 1976). Thus, to reduce the information asymmetry a company can choose to disclose voluntary information that exceeds mandatory disclosure regulations (Tasker, 1998).2 The information gap between insiders and outsiders is argued to be especially wide when knowledge-intense companies are involved (Aboody and Lev,
1 Considering the adoption by the Securities and Exchange Commission of new rules (SEC, 2000,
Regulation, FD, effective as of October 2000) against selective disclosure of significant information, it can be expected that the importance of the annual report as a disclosure medium is going to increase.
2 See Marston and Shrives (1991) for a discussion on the differences between voluntary and required (i.e. mandatory) disclosure.
7
1999; Barth, Kasznik and McNichols, 1999). This is due to the importance intangibles play for the value creation in knowledge-intense companies combined with the difficulties outsiders are faced with trying to acquire and interpret information on intangibles. Barth, Kasznik and McNichols (1999) conclude that analyst coverage is much higher for knowledge-intense companies than for traditional companies. They explain their findings with the difficulties financial analysts encounter when they try to acquire and interpret information related to intangibles. These difficulties result in more time having to be spent on covering knowledge-intense companies. Analogous with these findings, Amir, Lev and Sougiannis (1999) find that financial analysts’ contribution to valuation is largest in high-tech industries characterised by a large proportion of intangibles. These findings are explained by the fact that the informativeness of financial statements is especially low in these industries and that financial analysts, therefore, play an important role in acquiring the information needed for valuation directly from these companies’ management teams. Several studies have confirmed a decreased value relevance of financial statements (Brown, Lo and Lys, 1999; Lev and Zarowin, 1999). The results of these studies are often taken as an evidence of an inadequacy of today’s accounting methods to capture the whole value of knowledge-intense companies (Hall, 2001; Barth, Kasznik and McNichols, 1999; Hall, 1993). Sullivan and Sullivan (2000:328) argue that:
“Traditional accounting methods, which were created to account for tangible assets, are inadequate for valuing companies whose assets are largely intangible.”
Thus, the presence of information asymmetry between the insiders and outsiders of a company – especially significant for knowledge-intense companies – risks impairing the efficient allocation of capital due to larger bid-ask spreads, higher average cost of capital and more illiquid capital markets (FASB, 2001a; Diamond and Verrecchia, 1991).
1.2.2 Cost-benefit analysis Although more informative disclosures are found to result in a more effective allocation of capital due to reduced information asymmetry (see, e.g. Botosan and Plumlee, 2002; Sengupta, 1998; Welker, 1995) perfectly informative disclosures will probably never be achieved. There is a non-negligible trade-off between supplying and withholding information, i.e. the choice between exceeding mandatory disclosure regulations by disclosing voluntary information or only disclosing mandatory information. Thus, designing a disclosure strategy calls for performing a cost-benefit analysis.3 Considering the company and its owners, a lower average cost of capital, more liquid capital markets with smaller bid-ask spreads resulting in smoother valuation, better investment decisions, enhanced credibility and improved investor relations are argued to be the prime benefits stemming from enhanced disclosure (see,
3 See Elliott and Jacobson (1994) for a comprehensive discussion on costs and benefits related to
business information disclosure.
8
e.g. FASB, 2001a; Holland, 1997; Lang and Lundholm, 1996; Elliott and Jacobson, 1994). ‘Proprietary costs’ is put forward as the chief factor on the cost side (Wallman, 1996; Gray, Meek and Roberts, 1995). Proprietary costs arise when a company discloses information, which is sensitive and may result in competitive disadvantage due to increased competition or government regulations. Johanson, Mårtensson and Skoog (2001) find that companies emphasise that their extent of disclosure on intangibles is decided by their business-protection policy. According to Elliott and Jacobson (1994) there are three types of information, which might create competitive disadvantage: (1) information about technological and managerial innovations, (2) strategies, plans and tactics and (3) information about operations. Holland (1997) concludes from his case study that companies regard information on corporate innovations to be particularly sensitive in a disadvantage perspective. Analogous with Holland’s (1997) findings, Meek, Roberts and Gray (1995) argue that companies with substantial R&D activities (e.g. chemical companies) are likely to be more sensitive about disclosing information than companies in other industries are. Besides proprietary costs, information production costs associated with gathering, processing and disseminating information appear on the cost side.
1.2.3 Earlier empirical studies There is a body of empirical studies analysing the disclosure in annual reports (see, e.g. Ahmed and Courtis, 1999; Marston and Shrives, 1991). The focus in these disclosure studies varies from only considering voluntary information (Adrem, 1999; Gray, Meek and Roberts, 1995; Chow and Wong-Boren, 1987) to wider perspective where both voluntary and mandatory information are considered (Inchausti, 1997; Choi, 1973; Singhvi and Desai, 1971). Some studies examine the extent of disclosure in one specific country (Bukh, Gormsen, Mouritsen and Nielsen, 2002; Inchausti, 1997; Hossain, Perera and Rahman, 1995; Cooke, 1989b), while other studies compare the extent of disclosure in different countries (Gray, Meek and Roberts, 1995; Barrett, 1976). In common to all disclosure studies is that they share the notion that informative disclosures are useful for the investment-decision process (Inchausti, 1997) – a notion, which the present study also rests upon. Following Cooke’s (1989b) argument it is assumed in the present study that a company has found the benefits to exceed the costs when voluntary disclosure on intangibles are made. Although disclosure studies usually focus on the extent of voluntary disclosure (e.g. Gray, Meek and Roberts, 1995; Hossain, Perera and Rahman, 1995; Cooke, 1989b), there is a lack of studies, which have used a checklist consisting of items exclusively related to intangibles. In an analysis of IPO prospectuses, Bukh, Gormsen, Mourtisen and Nielsen (2002) conclude that the disclosure on intangibles has increased substantially between 1990 and 2000. Williams (2001:201)4 arrives at the same conclusion when he analyses annual reports
4 Williams (2001:192) analyses annual reports over the period 1996-2000.
9
from 31 U.K. companies listed on FTSE 100. In Bukh, Gormsen, Mourtisen and Nielsen’s (2002) study the most comprehensive disclosures on intangibles are found in the IPO prospectuses of knowledge-intense companies. This is argued to support the notion that companies with a large proportion of intangibles, as compared to companies with a small proportion of intangibles, are more prone to disclose information on intangibles in order to reduce the information gap and, thus, decrease the information asymmetry present between insiders and outsiders. This notion is empirically supported by Gelb (2002) who finds that companies with higher levels of intangibles are the ones, which to a greater extent rely on voluntary disclosure. Thus, the present study differs from prior disclosure studies in that: firstly, it examines the extent of disclosure on intangibles, instead of, as usually, examining the overall extent of voluntary disclosure, secondly, the disclosure on intangibles is broken down into five different categories of intangibles, thirdly, the potential existence of country specific disclosure styles is examined by including companies from all the Nordic countries, fourthly, instead of including companies from miscellaneous industries the study exclusively focuses on companies belonging to knowledge-intense industries.
1.3 Determinants of the extent of disclosure on intangibles
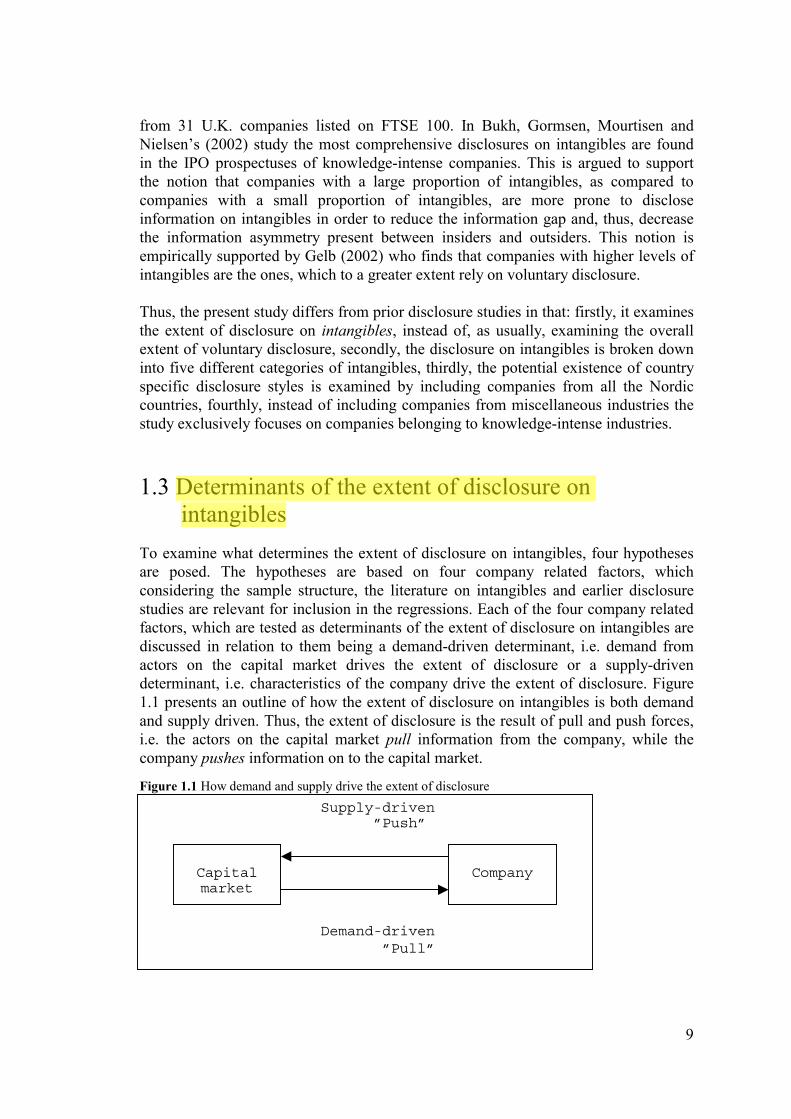
To examine what determines the extent of disclosure on intangibles, four hypotheses are posed. The hypotheses are based on four company related factors, which considering the sample structure, the literature on intangibles and earlier disclosure studies are relevant for inclusion in the regressions. Each of the four company related factors, which are tested as determinants of the extent of disclosure on intangibles are discussed in relation to them being a demand-driven determinant, i.e. demand from actors on the capital market drives the extent of disclosure or a supply-driven determinant, i.e. characteristics of the company drive the extent of disclosure. Figure 1.1 presents an outline of how the extent of disclosure on intangibles is both demand and supply driven. Thus, the extent of disclosure is the result of pull and push forces, i.e. the actors on the capital market pull information from the company, while the company pushes information on to the capital market.
Figure 1.1 How demand and supply drive the extent of disclosure
Supply-driven ”Push” Demand-driven ”Pull”
Capital market
Company
10
Company related factor 1: Company size Many different arguments have been proposed as reasons for why company size is found to be positively related to the extent of disclosure. Agency theory (Jensen and Meckling, 1976) is probably the most commonly used approach for deriving the size hypothesis. The underlying notion is that agency costs increase with company size and that more extensive disclosures is a way to reduce information asymmetry between the management team and the company’s owners and, thereby, reduce agency costs (see Marston and Shrives, 1996). Cooke (1989b) can be seen to elaborate further on the ‘reduced information asymmetry’-approach when he argues that larger companies have more complex business structures (e.g. a large number of business divisions, several product lines and global sales) and that this explains why they are prone to have extensive disclosures. Thus, companies with complex structures simply have more information to disclose. Meek, Roberts and Gray (1995) put forward ‘lower information production costs’ as yet another potential explanation to why larger companies disclose more information in their annual reports than smaller companies do. Considering the theoretical origin of the size hypothesis, size could be argued to be both a demand- and a supply-driven determinant. While the objective to reduce agency costs and information asymmetry primarily is demand driven, the complexity of a company’s business structure, as well as its information-production costs are supply driven. In view of the theoretical arguments underlying the size hypothesis, the following hypothesis is posed:
Hypothesis 1: Larger companies disclose more on intangibles than smaller companies do.
Considering earlier disclosure studies, company size5 appears to be the most frequently tested determinant of the extent of disclosure. Williams (2001) did not find a relationship between size and the extent of disclosure on intangibles. The results of studies where the extent of overall6 disclosure has been examined do, however, strongly suggest that size is positively related to disclosure extent (see, e.g. Inchausti, 1997; Hossain, Perera and Rahman, 1995; Cooke, 1989b, 1989c; Chow and Wong-Boren, 1987; Singhvi and Desai, 1971).7
Company related factor 2: Leverage Following the argument that agency costs increase with leverage (Jensen and Meckling, 1976), companies with high leverage are expected to disclose more
5 ‘Company size’ has been operationalised in several different ways, e.g. total assets (Cooke, 1989c;
Singhvi and Desai, 1971), logarithm of assets (Inchausti, 1997; Hossain, Perera and Rahman, 1995), total sales (Adrem, 1999; Meek, Roberts and Gray, 1995), logarithm of sales (Inchausti, 1997), market value of equity plus book value of debt (Chow and Wang-Boren, 1987) and number of shareholders (Cooke, 1989c).
6 The term ‘overall disclosure’ is used to define disclosure, which is not exclusively focused on intangibles.
7 See Ahmed and Courtis (1999) and Marston and Shrives (1996) for comprehensive reviews of the results of studies, which have tested company size as a determinant of the extent of disclosure.

11
information than companies with low leverage. Their propensity to increase their disclosure is driven by a wish to reduce information asymmetry and, thereby, reduce agency costs. Due to increased financial risk, the demand from e.g. lenders, shareholders, authorities and employees, for disclosure increases with a company’s leverage. All of these parties have some sort of claim on the company, e.g. a loan, invested capital or salaries/pensions. With high leverage, the probability of the company getting into financial distress increases, which risks the value of the claims. Demanding more extensive disclosures is a way for external parties to assess a company’s financial risk. Thus, leverage could be argued to primarily be a demand-driven determinant. The theoretical arguments underlying the leverage hypothesis are relevant to test and the following hypothesis is posed:
Hypothesis 2: High leveraged companies disclose more on intangibles than low leveraged companies do.
Considering earlier disclosure studies the support for a positive relationship between the extent of disclosure and leverage is weak. While Inchausti (1997) and Chow and Wong-Boren, (1987) find no relationship between leverage and the extent of overall disclosure, Hossain, Perera and Rahman (1995) find a weak positive relationship. A weak positive relationship has also been found between leverage and the extent of disclosure on intangibles (Williams, 2001).
Company related factor 3: Country affiliation Swedish companies are regarded as precursors when it comes to disclose information on intangibles (Bukh, Larsen and Mourtisen, 2001; FASB, 2001b). The relatively long tradition Swedish companies have with disclosing information on intangibles in annual reports could mean that their disclosures, with respect to intangibles, are more extensive than the disclosures made by companies in the other Nordic countries are. Since the focus on intangibles has a relatively long tradition in Sweden, Swedish companies could be expected to have been exposed to a large demand for disclosure on intangibles, which has influenced the emphasis they place on intangibles in their disclosures. Thus, country affiliation could be argued to primarily be a demand-driven determinant. Following the above line of reasoning, the following hypothesis is posed:
Hypothesis 3: Swedish companies disclose more on intangibles than companies from the other Nordic countries do.
The relationship between country affiliation Sweden and the extent of disclosure on intangibles has not been tested in earlier disclosure studies.
Company related factor 4: Listing status Like the size and leverage hypotheses, the listing-status hypothesis is often derived from agency theory (Jensen and Meckling, 1976). For example, Cooke (1989c) argues that monitoring costs are higher for companies with multiple quotations due to the fact that these companies usually have a greater number of shareholders and that increased
12
disclosure is one way to reduce monitoring costs and, thus, minimise agency problems. The notions that internationally listed companies, as compared to only-domestically listed, are exposed to more extensive listing requirements (Cooke, 1989c; Singhvi and Desai, 1971) and additional capital-market pressure (Meek, Roberts and Gray, 1995; Cooke, 1989b) have also been used as support for the listing-status hypothesis. It could be argued that a company does not have to be internationally listed to be exposed to extensive capital-market pressure. A company with a large share of foreign owners could be expected to be equally exposed to capital-market pressure. Testing ‘listing status’ as a determinant does, however, include the disclosure pressure stemming from listing requirements.8 Taken together, listing status could be argued to primarily be a demand-driven determinant. The listing-status hypothesis originates from listing requirements and capital-market pressure, which both exercise a demand for disclosure. Since the sample included in the present study consists of both internationally and only-domestically listed companies, the following hypothesis is posed:
Hypothesis 4: Internationally listed companies disclose more on intangibles than only-domestically listed companies do.
Reviewing the results of earlier studies reveals that international listing is positively related to the extent of overall disclosure (see, e.g. Inchausti, 1997; Hossain, Perera and Rahman, 1995; Cooke9, 1989b; 1989c). A positive, however, inconclusive relationship is found between listing status and the extent of disclosure on intangibles (Williams, 2001).
1.4 Research design and empirical methodology
1.4.1 Selection criteria for companies The disclosure study focuses on annual reports made by Nordic companies belonging to knowledge-intense industries. In order for a company to be included in the study, the following selection criteria had to be fulfilled: • Danish, Finnish, Icelandic, Norwegian or Swedish companies belonging to the
pharmaceutical, biotechnology or health care equipment & supplies industries.10 11
8 Reviewing my sample shows that companies, which are internationally listed have a larger share of
foreign owners than companies only-domestically listed have. Thus, since the two determinants are positively correlated, testing ‘share of foreign owners’ as a determinant of extent of disclosure on intangibles would probably yield similar results as testing ‘listing status’.
9 In Cooke (1989b; 1989c) both listed and unlisted companies have been included in the samples. His findings show that companies, which are internationally listed have more extensive disclosures than only-domestically listed companies have. Furthermore, only-domestically listed companies have more extensive disclosures than unlisted companies have.
10 Annual reports from four sub-Nordic companies have been included in the study.
13
• Listed on either of the Nordic countries’ Stock Exchanges during 199912. The selection process resulted in 36 companies (19 Swedish, 11 Danish, 4 Norwegian and 2 Finnish). There were no Icelandic companies, which fulfilled the imposed selection criteria. See Appendix 1 for a list of the 36 companies from which annual reports13 were included in the study.
1.4.2 Disclosure checklist When it comes to analyse the extent of voluntary disclosure, previous research has shown that a disclosure index is a useful research instrument (Marston and Shrives, 1991). A disclosure index is based on a disclosure checklist, which includes a number of different items. The number of items included in a disclosure checklist varies substantially from one study to another. For example, Barret (1976) used a checklist of 17 items, while Cooke (1989a) included 224 items in his checklist. To develop the checklist used in the present study an explorative qualitative approach was applied. A review of the literature on intangibles was conducted to examine, which different categories of intangibles are most frequently discussed (see Arvidsson, 2002). Then, in order to distinguish all of the different categories of intangibles, briefly or elaborately, discussed in the annual reports, the annual reports were read and re-read twice. The analysis identified that the annual reports disclosed information related to 5 categories of intangibles. The analysis also distinguished a number of different items, which were discussed in relation to each of the 5 categories. The next step in developing the checklist, involved a review of checklists used in earlier disclosure studies.14 The checklists, which were most influential on the design of the checklist used in the present study were the ones used in Bukh, Gormsen, Mouritsen and Nielsen (2002), Adrem (1999) and Gray, Meek and Roberts (1995). The final version of the disclosure checklist includes 81 items related to intangibles, which are categorised into 5 categories (see Appendix 2). Thus, by
11 The companies’ industry codes have been collected either from the Stock Exchanges’ GICS codes or
the Stock Exchanges’ own coding systems. The Copenhagen Stock Exchange, the Oslo Stock Exchange and the Stockholm Stock Exchange all use GICS (i.e. Global Industry Classification Standard) codes to classify stocks into different industries. The GICS coding system is developed by Morgan Stanley Capital International Inc. and Standard & Poor’s. The Helsinki Stock Exchange and the Reykjavik Stock Exchange use their own coding systems.
12 At the time of data collection, the latest annual reports available were the once covering the financial year 1999. Four of the included annual reports cover the split financial year 1998/1999.
13 The analysis primarily focused on the English language version of the 1999 annual reports. However, 2 of the 36 analysed annual reports were only published in a non-English language version (i.e. two annual reports were only published in Swedish). The choice to focus on the English language version of the reports was intentional since it reduces the potential of a conceptual confusion originated from an analysis including reports written in different languages. A conceptual confusion would risk affecting the stringency of the results from the analysis.
14 The following studies were reviewed in the process of designing the checklist: Bukh, Gormsen, Mouritsen and Nielsen, 2002; Adrem, 1999; Inchausti, 1997; Gray, Meek and Roberts, 1995; Hossain, Perera and Rahman, 1995; Meek, Roberts and Gray, 1995; Cooke, 1989a; 1989b; Chow and Wong-Boren, 1987; Barrett, 1976; Choi, 1973; Singhvi and Desai, 1971.
14
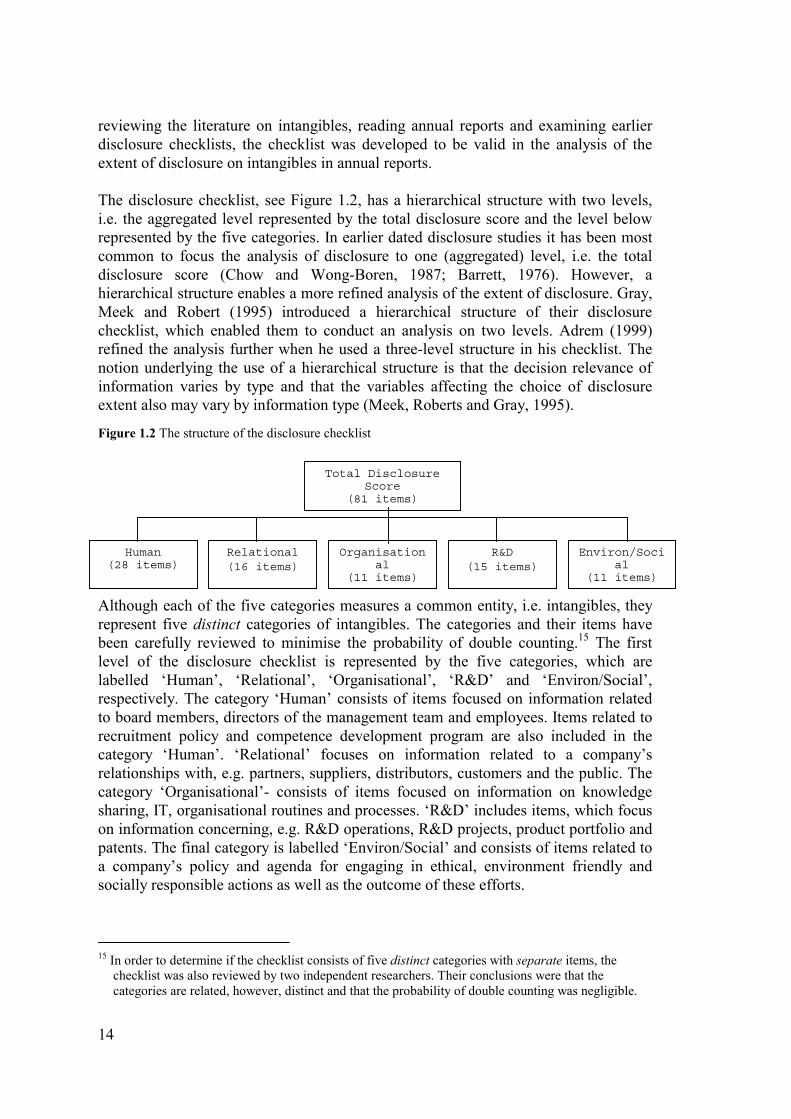
reviewing the literature on intangibles, reading annual reports and examining earlier disclosure checklists, the checklist was developed to be valid in the analysis of the extent of disclosure on intangibles in annual reports. The disclosure checklist, see Figure 1.2, has a hierarchical structure with two levels, i.e. the aggregated level represented by the total disclosure score and the level below represented by the five categories. In earlier dated disclosure studies it has been most common to focus the analysis of disclosure to one (aggregated) level, i.e. the total disclosure score (Chow and Wong-Boren, 1987; Barrett, 1976). However, a hierarchical structure enables a more refined analysis of the extent of disclosure. Gray, Meek and Robert (1995) introduced a hierarchical structure of their disclosure checklist, which enabled them to conduct an analysis on two levels. Adrem (1999) refined the analysis further when he used a three-level structure in his checklist. The notion underlying the use of a hierarchical structure is that the decision relevance of information varies by type and that the variables affecting the choice of disclosure extent also may vary by information type (Meek, Roberts and Gray, 1995).
Figure 1.2 The structure of the disclosure checklist
Although each of the five categories measures a common entity, i.e. intangibles, they represent five distinct categories of intangibles. The categories and their items have been carefully reviewed to minimise the probability of double counting.15 The first level of the disclosure checklist is represented by the five categories, which are labelled ‘Human’, ‘Relational’, ‘Organisational’, ‘R&D’ and ‘Environ/Social’, respectively. The category ‘Human’ consists of items focused on information related to board members, directors of the management team and employees. Items related to recruitment policy and competence development program are also included in the category ‘Human’. ‘Relational’ focuses on information related to a company’s relationships with, e.g. partners, suppliers, distributors, customers and the public. The category ‘Organisational’- consists of items focused on information on knowledge sharing, IT, organisational routines and processes. ‘R&D’ includes items, which focus on information concerning, e.g. R&D operations, R&D projects, product portfolio and patents. The final category is labelled ‘Environ/Social’ and consists of items related to a company’s policy and agenda for engaging in ethical, environment friendly and socially responsible actions as well as the outcome of these efforts.
15 In order to determine if the checklist consists of five distinct categories with separate items, the
checklist was also reviewed by two independent researchers. Their conclusions were that the categories are related, however, distinct and that the probability of double counting was negligible.
Total Disclosure Score
(81 items)
Human (28 items)
Relational (16 items)
Organisational
(11 items)
R&D (15 items)
Environ/Social
(11 items)
15
On the second level of the disclosure checklist, all disclosure items originated from the five categories are aggregated to a total disclosure score. Thus, the total disclosure score is a measure of the extent of overall disclosure on intangibles in each of the annual reports.
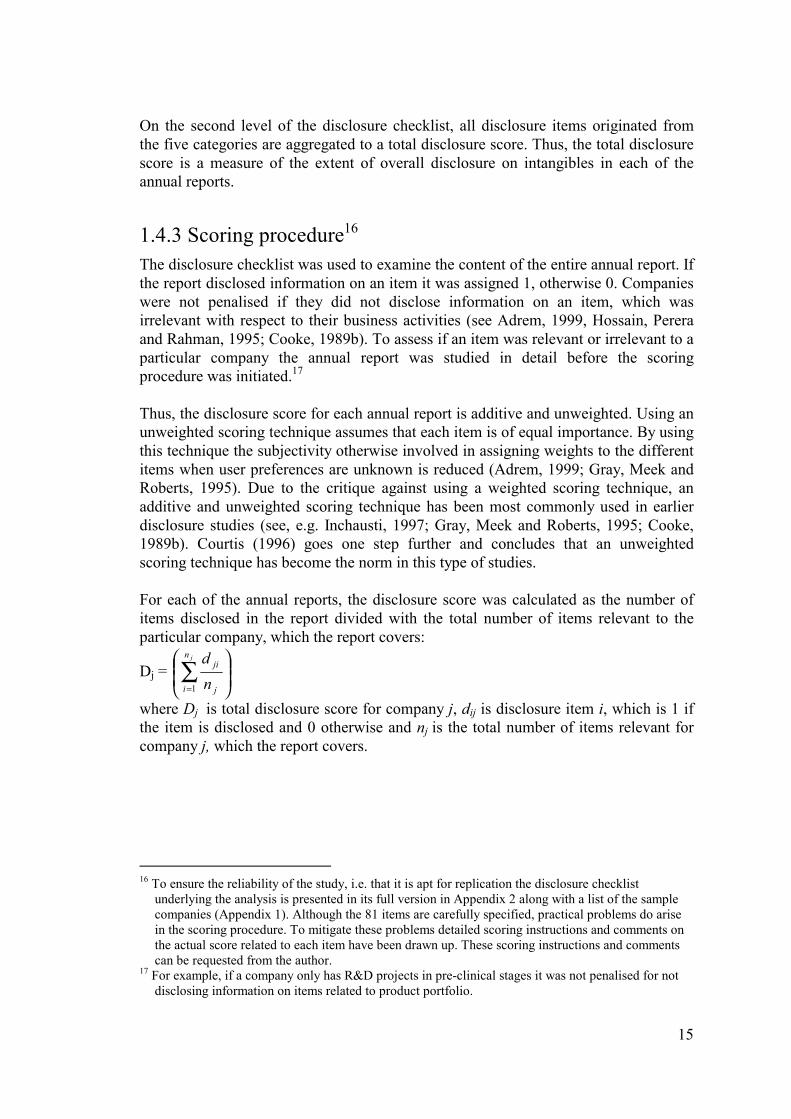
1.4.3 Scoring procedure16 The disclosure checklist was used to examine the content of the entire annual report. If the report disclosed information on an item it was assigned 1, otherwise 0. Companies were not penalised if they did not disclose information on an item, which was irrelevant with respect to their business activities (see Adrem, 1999, Hossain, Perera and Rahman, 1995; Cooke, 1989b). To assess if an item was relevant or irrelevant to a particular company the annual report was studied in detail before the scoring procedure was initiated.17 Thus, the disclosure score for each annual report is additive and unweighted. Using an unweighted scoring technique assumes that each item is of equal importance. By using this technique the subjectivity otherwise involved in assigning weights to the different items when user preferences are unknown is reduced (Adrem, 1999; Gray, Meek and Roberts, 1995). Due to the critique against using a weighted scoring technique, an additive and unweighted scoring technique has been most commonly used in earlier disclosure studies (see, e.g. Inchausti, 1997; Gray, Meek and Roberts, 1995; Cooke, 1989b). Courtis (1996) goes one step further and concludes that an unweighted scoring technique has become the norm in this type of studies. For each of the annual reports, the disclosure score was calculated as the number of items disclosed in the report divided with the total number of items relevant to the particular company, which the report covers:
Dj =
∑
=
jn
i j
ji
nd
1
where Dj is total disclosure score for company j, dij is disclosure item i, which is 1 if the item is disclosed and 0 otherwise and nj is the total number of items relevant for company j, which the report covers.
16 To ensure the reliability of the study, i.e. that it is apt for replication the disclosure checklist
underlying the analysis is presented in its full version in Appendix 2 along with a list of the sample companies (Appendix 1). Although the 81 items are carefully specified, practical problems do arise in the scoring procedure. To mitigate these problems detailed scoring instructions and comments on the actual score related to each item have been drawn up. These scoring instructions and comments can be requested from the author.
17 For example, if a company only has R&D projects in pre-clinical stages it was not penalised for not disclosing information on items related to product portfolio.
16
1.4.4. Analysis of reliability and structure of the disclosure scores
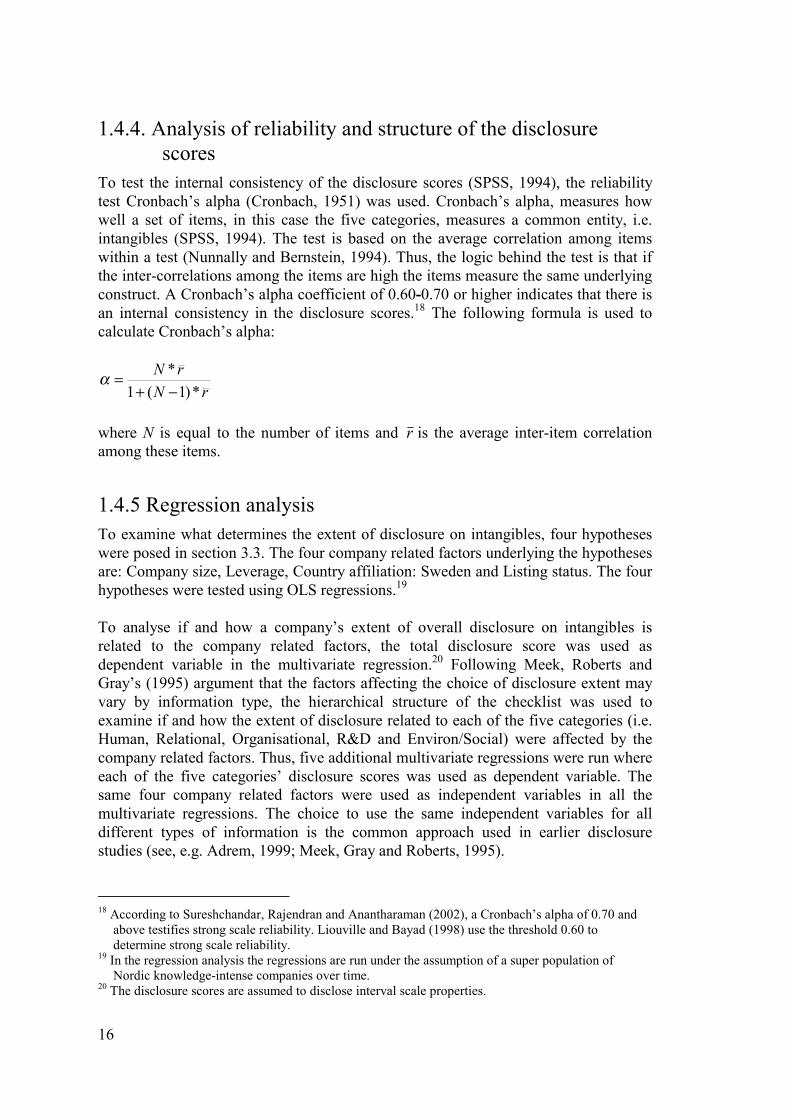
To test the internal consistency of the disclosure scores (SPSS, 1994), the reliability test Cronbach’s alpha (Cronbach, 1951) was used. Cronbach’s alpha, measures how well a set of items, in this case the five categories, measures a common entity, i.e. intangibles (SPSS, 1994). The test is based on the average correlation among items within a test (Nunnally and Bernstein, 1994). Thus, the logic behind the test is that if the inter-correlations among the items are high the items measure the same underlying construct. A Cronbach’s alpha coefficient of 0.60-0.70 or higher indicates that there is an internal consistency in the disclosure scores.18 The following formula is used to calculate Cronbach’s alpha:
rNrN
*)1(1*−+
=α
where N is equal to the number of items and r is the average inter-item correlation among these items.
1.4.5 Regression analysis To examine what determines the extent of disclosure on intangibles, four hypotheses were posed in section 3.3. The four company related factors underlying the hypotheses are: Company size, Leverage, Country affiliation: Sweden and Listing status. The four hypotheses were tested using OLS regressions.19 To analyse if and how a company’s extent of overall disclosure on intangibles is related to the company related factors, the total disclosure score was used as dependent variable in the multivariate regression.20 Following Meek, Roberts and Gray’s (1995) argument that the factors affecting the choice of disclosure extent may vary by information type, the hierarchical structure of the checklist was used to examine if and how the extent of disclosure related to each of the five categories (i.e. Human, Relational, Organisational, R&D and Environ/Social) were affected by the company related factors. Thus, five additional multivariate regressions were run where each of the five categories’ disclosure scores was used as dependent variable. The same four company related factors were used as independent variables in all the multivariate regressions. The choice to use the same independent variables for all different types of information is the common approach used in earlier disclosure studies (see, e.g. Adrem, 1999; Meek, Gray and Roberts, 1995).
18 According to Sureshchandar, Rajendran and Anantharaman (2002), a Cronbach’s alpha of 0.70 and
above testifies strong scale reliability. Liouville and Bayad (1998) use the threshold 0.60 to determine strong scale reliability.
19 In the regression analysis the regressions are run under the assumption of a super population of Nordic knowledge-intense companies over time.
20 The disclosure scores are assumed to disclose interval scale properties.

17
1.4.6 Operationalisation of company related factors The company related factors, which were used as independent variables in the regressions, were operationalised as follows: Company size (SIZE) was operationalised as the logarithm of total assets in 1999.21 Leverage (LEV) was measured as the ratio of total liabilities to equity in 1999.22 Country affiliation: Sweden (D1Country) was indicated by a dummy variable, which took the value 1 if the company was Swedish and 0 otherwise. Listing status (D2Listing) was indicated by a dummy variable, which took the value 1 if the company was internationally listed and 0 if it was only listed on the domestic market.
1.5 Empirical results In this section, the empirical results from the analyses of the annual reports are presented. The section starts with a presentation of the results from the disclosure scoring. Then the reliability and structure of the disclosure scores are examined. Finally, the disclosure scores are analysed with OLS regressions in order to test the four hypotheses.
1.5.1 Disclosure scores Table 1.1 summarises the results of the disclosure scores for the full sample and for the four sub-samples Swedish companies, Danish companies, Norwegian companies and Finnish companies, respectively.
21 The logarithm of total sales was also tested as a size variable. There was, however, no significant
difference in the results of the regressions when the logarithm of total assets was replaced with the logarithm of total sales.
22 Considering that securitiesed debt normally involves stricter information requirements than regular debt, securitiesed debt, e.g. bond issues could be expected to be more related to the extent of disclosure on intangibles than leverage operationalised as total liabilities to equity. Reviewing my sample, however, shows that very few of the companies have securitiesed debt, why such an analysis would be of no consequence.
18
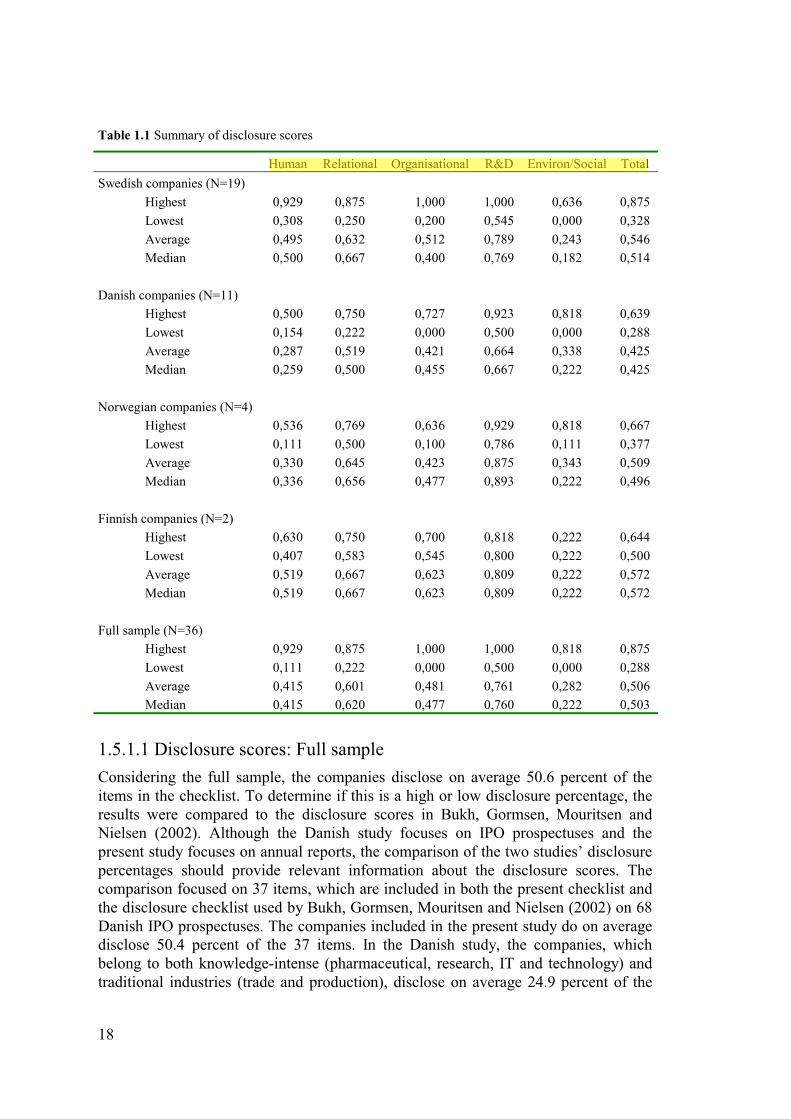
Table 1.1 Summary of disclosure scores
Human Relational Organisational R&D Environ/Social Total Swedish companies (N=19)
Highest 0,929 0,875 1,000 1,000 0,636 0,875 Lowest 0,308 0,250 0,200 0,545 0,000 0,328 Average 0,495 0,632 0,512 0,789 0,243 0,546 Median 0,500 0,667 0,400 0,769 0,182 0,514
Danish companies (N=11)
Highest 0,500 0,750 0,727 0,923 0,818 0,639 Lowest 0,154 0,222 0,000 0,500 0,000 0,288 Average 0,287 0,519 0,421 0,664 0,338 0,425 Median 0,259 0,500 0,455 0,667 0,222 0,425
Norwegian companies (N=4)
Highest 0,536 0,769 0,636 0,929 0,818 0,667 Lowest 0,111 0,500 0,100 0,786 0,111 0,377 Average 0,330 0,645 0,423 0,875 0,343 0,509 Median 0,336 0,656 0,477 0,893 0,222 0,496
Finnish companies (N=2)
Highest 0,630 0,750 0,700 0,818 0,222 0,644 Lowest 0,407 0,583 0,545 0,800 0,222 0,500 Average 0,519 0,667 0,623 0,809 0,222 0,572 Median 0,519 0,667 0,623 0,809 0,222 0,572
Full sample (N=36)
Highest 0,929 0,875 1,000 1,000 0,818 0,875 Lowest 0,111 0,222 0,000 0,500 0,000 0,288 Average 0,415 0,601 0,481 0,761 0,282 0,506 Median 0,415 0,620 0,477 0,760 0,222 0,503
1.5.1.1 Disclosure scores: Full sample Considering the full sample, the companies disclose on average 50.6 percent of the items in the checklist. To determine if this is a high or low disclosure percentage, the results were compared to the disclosure scores in Bukh, Gormsen, Mouritsen and Nielsen (2002). Although the Danish study focuses on IPO prospectuses and the present study focuses on annual reports, the comparison of the two studies’ disclosure percentages should provide relevant information about the disclosure scores. The comparison focused on 37 items, which are included in both the present checklist and the disclosure checklist used by Bukh, Gormsen, Mouritsen and Nielsen (2002) on 68 Danish IPO prospectuses. The companies included in the present study do on average disclose 50.4 percent of the 37 items. In the Danish study, the companies, which belong to both knowledge-intense (pharmaceutical, research, IT and technology) and traditional industries (trade and production), disclose on average 24.9 percent of the
19
37 items. Separating out companies in the Danish study, which belong to the pharmaceutical and research23 industries, gives a disclosure percentage of 35.9. The comparison shows that the disclosure percentage for the present sample is significantly higher than the percentages reported in Bukh, Gormsen, Mouritsen and Nielsen (2002). Thus, the comparison results in to indications. First, knowledge-intense companies appear to disclose more on intangibles than traditional companies do. Second, Danish knowledge-intense companies appear to disclose less on intangibles relative Nordic knowledge-intense companies do. The category, which the companies disclose definitely most information on is R&D where 76.1 percent of the items on average is accounted for in the annual reports. This result is predictable since the companies have their affiliation in knowledge-intense industries where R&D is the predominant business activity. The result is in line with the study conducted by Bukh, Gormsen, Mouritsen and Nielsen (2002) in which they found pharmaceutical and research companies to be the ones, which are best at disclosing information related to R&D. Relational is the category, which the companies disclose second most information on. Reviewing the disclosure scores in Table 1.1 shows that 60.1 percent of the items related to a company’s relationships with, e.g. other companies, suppliers and customers on average is accounted for in the annual reports. The companies do not appear to prioritise disclosure on items related to the Organisational category. Neither does employee-related information appear to be high up on the management teams’ disclosure agenda. Thus, the scoring results indicate that companies are not very good at following up the old adage “the employees are our most valuable asset” with disclosure related to their employees. The results of the disclosure scores reveal that the companies disclose least information on items related to environmental and social responsibility. Considering the environmental trend, which resulted in an increase in companies’ environmental reporting in the beginning of the 1990th (see, e.g. Ljungdahl, 1999), the result is somewhat unexpected. The result is, however, consistent with Gray, Javad, Power and Sinclair (2001) who conclude, after analysing the content in annual reports from 31 U.K. companies listed on FTSE 100, that the extent of social and environmental disclosure is relatively small.
1.5.1.2 Disclosure scores: Sub-samples Both in the full sample and in the Swedish and Finnish sub-samples are R&D the category with the highest disclosure scores followed by Relational, Organisational, Human and Environ/Social. The ordering is the same in the Danish and Norwegian sub-samples except for Human being the category with the lowest average disclosure
23 The research category in Bukh, Gormsen, Mouritsen and Nielsen (2002) includes companies with
businesses in biotechnology and health care.
20
scores and Environ/Social being the category with the second lowest average disclosure scores. It should be noted that the Finnish sub-sample only consists of two companies.24 These two companies are large in size and one of them is foreign-listed, which following the accuracy of the hypotheses should imply that they are good at disclosing information on intangibles. Thus, the interpretation of the results of the Finnish sub-sample should take this into consideration. Reviewing Table 1.1 reveals that the Finnish sub-sample is exhibiting the highest total average disclosure scores followed by the Swedish, Norwegian and Danish sub-samples. Also in the categories Human, Relational and Organisational do the Finnish companies disclose most information. Although they appear to master the disclosure technique, they are the ones with the lowest scores in the Environ/Social category. The Danish sub-sample is not only the one, which has the lowest total average score but it also positions itself as the sub-sample, which discloses least information related to the Human, Relational, Organisational and R&D categories. These results contradict the argument that Danish companies should have informative disclosures on intangibles (see Bukh, Rosenkrands Johansen, García Meca and Mourtisen, 2002).
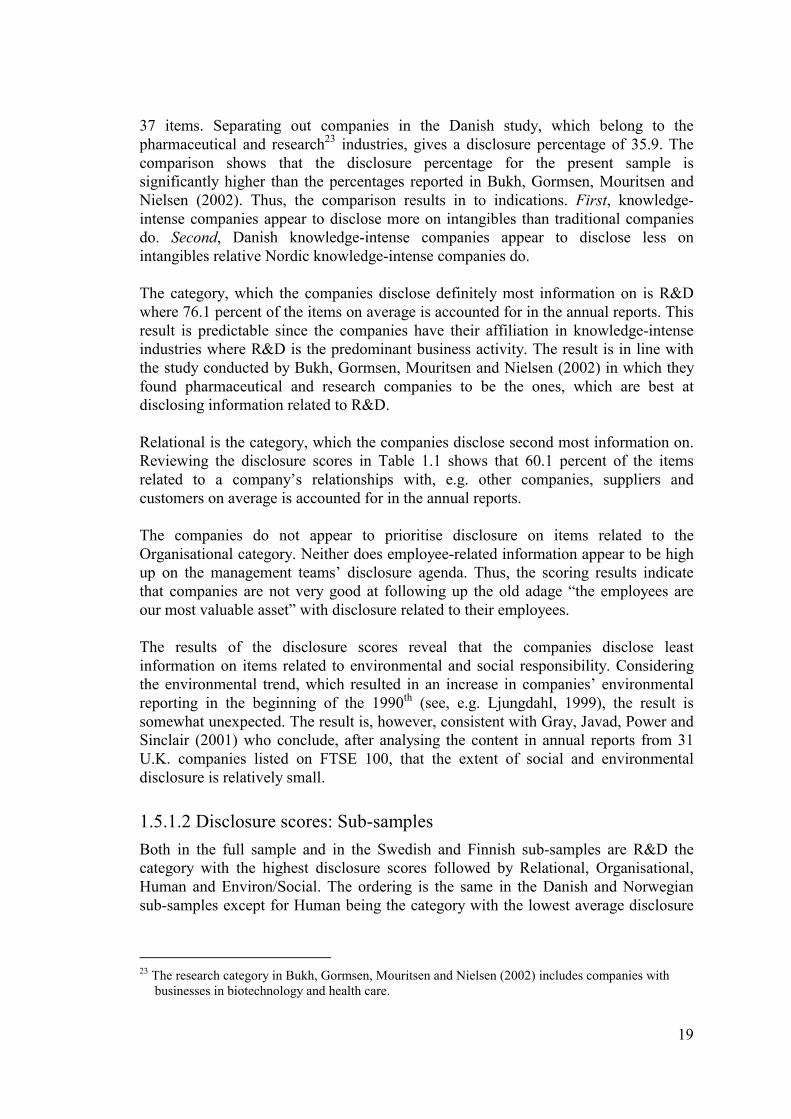
1.5.2 Reliability and structure of the disclosure scores A calculation of Cronbach’s alpha for all the five categories resulted in a coefficient of 0.68. Considering the rule of 0.60-0.70 or higher, the result is somewhat inconclusive and the coefficient might indicate that the disclosure scores have a mild tendency towards a multidimensional structure. To examine the structure of the disclosure score a factor analysis was conducted. The Kaiser-Meyer-Olkin measure (KMO) was calculated to determine how adequate the sample is for a factor analysis. For the present sample the value of KMO is 0.60, which indicates a mediocre sampling adequacy (SPSS, 1993). Thus, the KMO suggests that the results of the factor analysis might be indistinct. Considering the value of the Cronbach’s alpha-coefficient it is, however, relevant to proceed with the analysis of the disclosure scores.
Table 1.2 Correlation matrix
Human Relational Organisational R&D Environ/Social Human 1,000 Relational 0,416 1,000 Organisational 0,483 0,566 1,000 R&D 0,335 0,348 -0,025 1,000 Environ/Social 0,189 0,330 0,543 -0,090 1,000
24 The choice to include the two Finnish companies in the study is motivated by the fact that they are
contributing with valuable information related to the company factors (i.e. company size, leverage, country affiliation and listing status), which are analysed in the regressions.
21
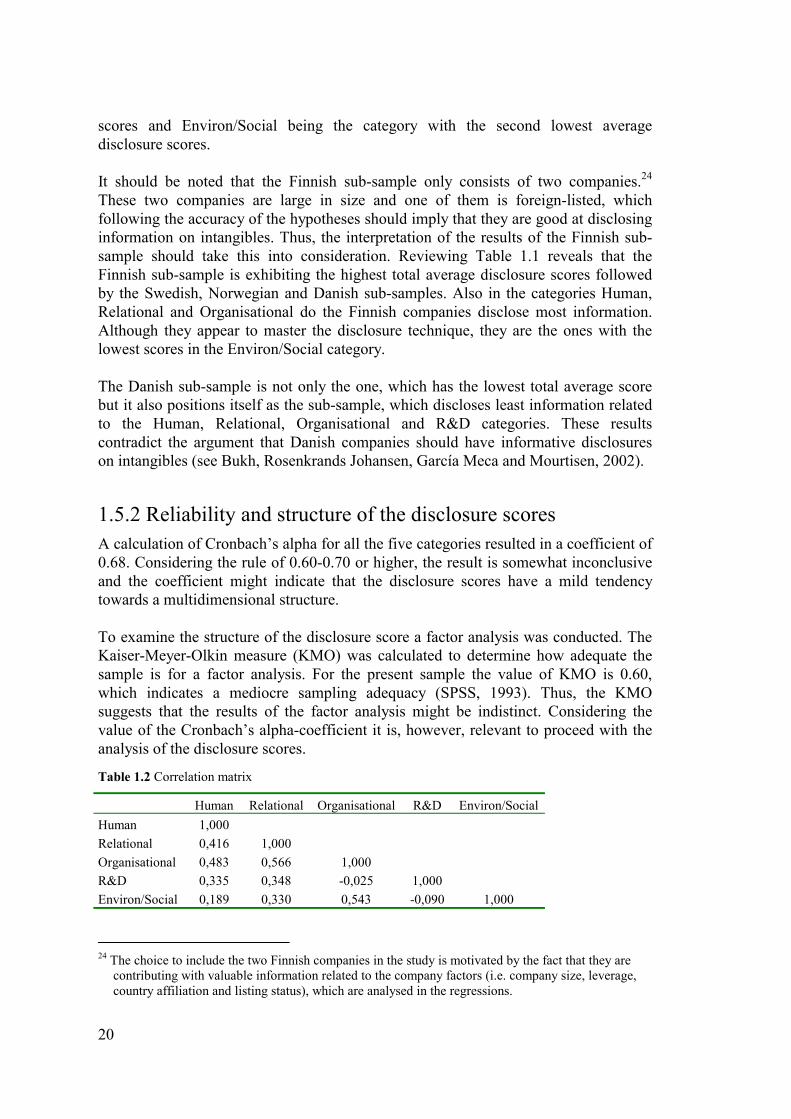
Table 1.3 Unrotated and rotated factor matrix
Unrotateda Rotateda,b Factor Factor Cummunalities
1 2 1 2 Human 0,716 0,307 0,391 0,674 0,607 Relational 0,807 0,163 0,550 0,613 0,678 Organisational 0,836 -0,337 0,872 0,229 0,813 R&D 0,330 0,840 -0,238 0,871 0,815 Environ/Social 0,613 -0,565 -0,829 -0,086 0,695 Eigenvalue 2,349 1,260 1,960 1,649 % of variance 47,0 25,2 39,2 33,0 a) Extraction method: Principal component analysis b) Rotation method: Varimax with Kaiser normalisation The factor analysis on the disclosure scores of the five categories resulted in two factors25, which together explain 72.2 percent of total variance. The unrotated factor matrix (see Table 1.3) reveals that the four categories Human, Relational, Organisational and Environ/Social are strongly correlated to factor 1, while R&D only exhibits a weak correlation with factor 1. Instead, R&D is the category, which exhibits the strongest correlation with factor 2. The results are a bit blurred when a rotated factor analysis is run (see Table 1.3). R&D is still the category with the strongest correlation with factor 2. Organisational and Environ/Social exhibits a stronger correlation with factor 1 and a weaker correlation with factor 2. However, in the rotated factor analysis Human and Relational both exhibit a weaker correlation with factor 1 and a stronger correlation with factor 2, which makes the results less distinct. Although the results of the factor analysis are somewhat indistinct there is an underlying trend in the results implying that the R&D category is causing the mild tendency towards a multidimensional structure in the disclosure scores. Thus, to further examine the structure in the results of the disclosure scores a cluster analysis, based on Ward’s method, was conducted. The analysis reveals that there are three distinct clusters. The clusters are neither country-specific nor is their distinctiveness related to company related factors. Instead the distinctiveness of the clusters is related to disclosure styles. A prediction value of 92 percent was obtained when a step-wise discriminant analysis was run. When prior probabilities were computed from group sizes, 13 of the 15 companies in cluster 1 were correctly classified, 7 of the 8 companies in cluster 2 were correctly classified and all of the companies in cluster 3 were correctly classified. Table 1.4 presents the descriptive data for the three clusters regarding their disclosure scores in the five categories.
25 The number of factors was chosen according to the Kaiser-Guttman rule, which states that a factor
should have an eigenvalue exceeding 1 (see Nunnally and Bernstein, 1994).
22
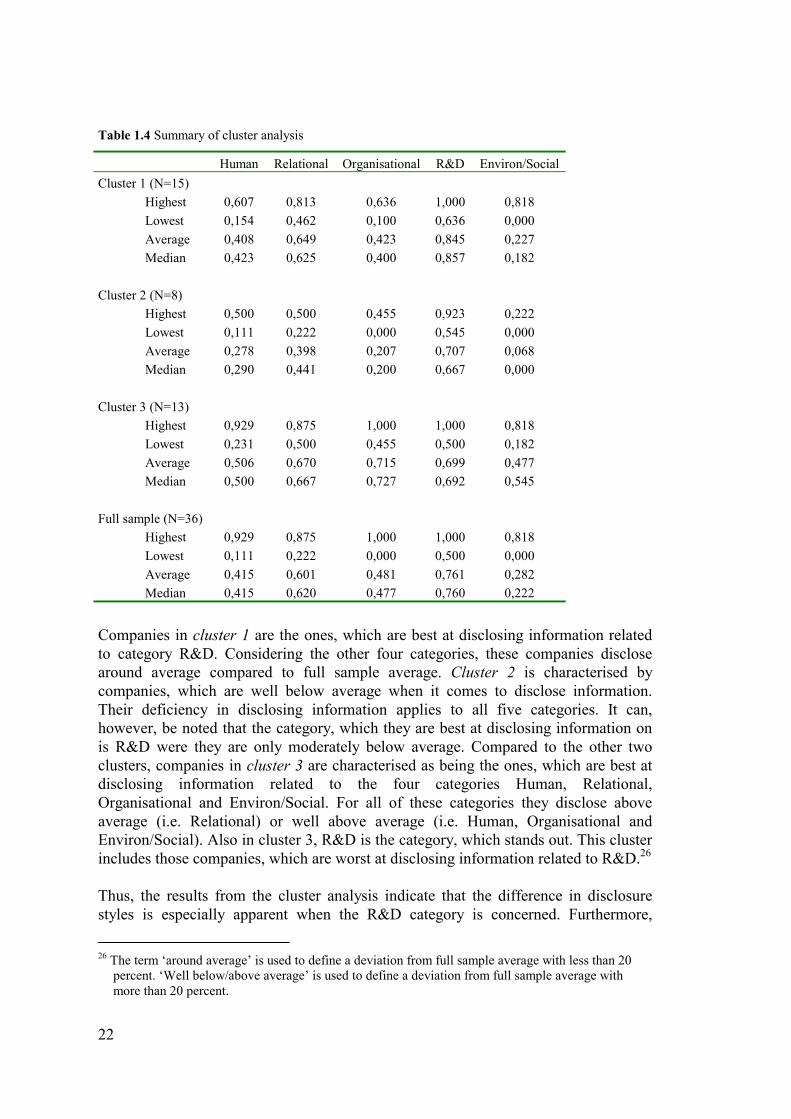
Table 1.4 Summary of cluster analysis
Human Relational Organisational R&D Environ/Social Cluster 1 (N=15)
Highest 0,607 0,813 0,636 1,000 0,818 Lowest 0,154 0,462 0,100 0,636 0,000 Average 0,408 0,649 0,423 0,845 0,227 Median 0,423 0,625 0,400 0,857 0,182
Cluster 2 (N=8)
Highest 0,500 0,500 0,455 0,923 0,222 Lowest 0,111 0,222 0,000 0,545 0,000 Average 0,278 0,398 0,207 0,707 0,068 Median 0,290 0,441 0,200 0,667 0,000
Cluster 3 (N=13)
Highest 0,929 0,875 1,000 1,000 0,818 Lowest 0,231 0,500 0,455 0,500 0,182 Average 0,506 0,670 0,715 0,699 0,477 Median 0,500 0,667 0,727 0,692 0,545
Full sample (N=36)
Highest 0,929 0,875 1,000 1,000 0,818 Lowest 0,111 0,222 0,000 0,500 0,000 Average 0,415 0,601 0,481 0,761 0,282 Median 0,415 0,620 0,477 0,760 0,222
Companies in cluster 1 are the ones, which are best at disclosing information related to category R&D. Considering the other four categories, these companies disclose around average compared to full sample average. Cluster 2 is characterised by companies, which are well below average when it comes to disclose information. Their deficiency in disclosing information applies to all five categories. It can, however, be noted that the category, which they are best at disclosing information on is R&D were they are only moderately below average. Compared to the other two clusters, companies in cluster 3 are characterised as being the ones, which are best at disclosing information related to the four categories Human, Relational, Organisational and Environ/Social. For all of these categories they disclose above average (i.e. Relational) or well above average (i.e. Human, Organisational and Environ/Social). Also in cluster 3, R&D is the category, which stands out. This cluster includes those companies, which are worst at disclosing information related to R&D.26 Thus, the results from the cluster analysis indicate that the difference in disclosure styles is especially apparent when the R&D category is concerned. Furthermore,
26 The term ‘around average’ is used to define a deviation from full sample average with less than 20
percent. ‘Well below/above average’ is used to define a deviation from full sample average with more than 20 percent.
23
Cronbach’s alpha is improved from 0.68 to 0.73 when it is calculated for all categories except R&D. This further strengthens the notion that the R&D category might be causing the mild tendency of a multidimensional structure in the disclosure scores.
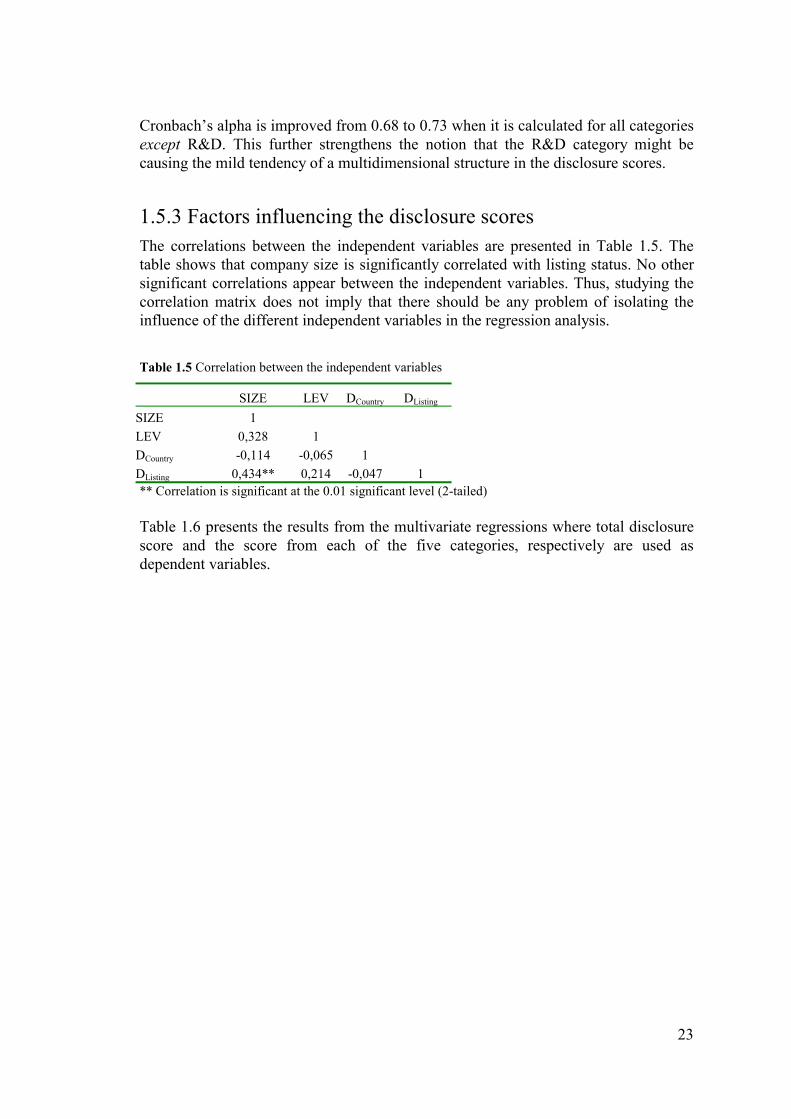
1.5.3 Factors influencing the disclosure scores The correlations between the independent variables are presented in Table 1.5. The table shows that company size is significantly correlated with listing status. No other significant correlations appear between the independent variables. Thus, studying the correlation matrix does not imply that there should be any problem of isolating the influence of the different independent variables in the regression analysis.
Table 1.5 Correlation between the independent variables
SIZE LEV DCountry DListing
SIZE 1 LEV 0,328 1 DCountry -0,114 -0,065 1 DListing 0,434** 0,214 -0,047 1 ** Correlation is significant at the 0.01 significant level (2-tailed) Table 1.6 presents the results from the multivariate regressions where total disclosure score and the score from each of the five categories, respectively are used as dependent variables.
24
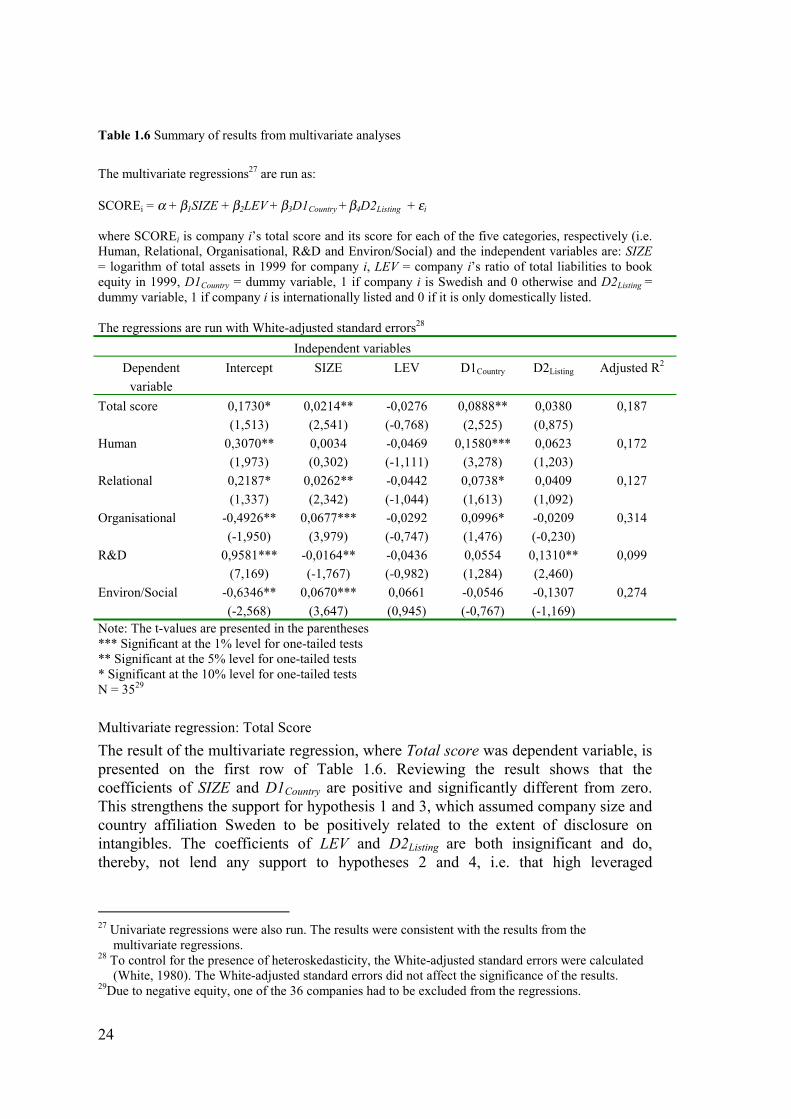
Table 1.6 Summary of results from multivariate analyses
The multivariate regressions27 are run as: SCOREi = α + β1SIZE + β2LEV + β3D1Country + β4D2Listing + εi where SCOREi is company i’s total score and its score for each of the five categories, respectively (i.e. Human, Relational, Organisational, R&D and Environ/Social) and the independent variables are: SIZE = logarithm of total assets in 1999 for company i, LEV = company i’s ratio of total liabilities to book equity in 1999, D1Country = dummy variable, 1 if company i is Swedish and 0 otherwise and D2Listing = dummy variable, 1 if company i is internationally listed and 0 if it is only domestically listed. The regressions are run with White-adjusted standard errors28 Independent variables
Dependent variable
Intercept SIZE LEV D1Country D2Listing Adjusted R2
Total score 0,1730* (1,513)
0,0214** (2,541)
-0,0276 (-0,768)
0,0888** (2,525)
0,0380 (0,875)
0,187
Human 0,3070** (1,973)
0,0034 (0,302)
-0,0469 (-1,111)
0,1580*** (3,278)
0,0623 (1,203)
0,172
Relational 0,2187* (1,337)
0,0262** (2,342)
-0,0442 (-1,044)
0,0738* (1,613)
0,0409 (1,092)
0,127
Organisational -0,4926** (-1,950)
0,0677*** (3,979)
-0,0292 (-0,747)
0,0996* (1,476)
-0,0209 (-0,230)
0,314
R&D 0,9581*** (7,169)
-0,0164** (-1,767)
-0,0436 (-0,982)
0,0554 (1,284)
0,1310** (2,460)
0,099
Environ/Social -0,6346** (-2,568)
0,0670*** (3,647)
0,0661 (0,945)
-0,0546 (-0,767)
-0,1307 (-1,169)
0,274
Note: The t-values are presented in the parentheses *** Significant at the 1% level for one-tailed tests ** Significant at the 5% level for one-tailed tests * Significant at the 10% level for one-tailed tests N = 3529
Multivariate regression: Total Score The result of the multivariate regression, where Total score was dependent variable, is presented on the first row of Table 1.6. Reviewing the result shows that the coefficients of SIZE and D1Country are positive and significantly different from zero. This strengthens the support for hypothesis 1 and 3, which assumed company size and country affiliation Sweden to be positively related to the extent of disclosure on intangibles. The coefficients of LEV and D2Listing are both insignificant and do, thereby, not lend any support to hypotheses 2 and 4, i.e. that high leveraged
27 Univariate regressions were also run. The results were consistent with the results from the
multivariate regressions. 28 To control for the presence of heteroskedasticity, the White-adjusted standard errors were calculated
(White, 1980). The White-adjusted standard errors did not affect the significance of the results. 29Due to negative equity, one of the 36 companies had to be excluded from the regressions.
25
companies and internationally listed companies disclose more on intangibles than low leveraged and only-domestically listed companies do. The evidence that larger companies disclose more on intangibles than smaller companies do is not consistent with the result in Williams’s (2001) study on intangibles where no relationship was found. The result is, however, consistent with earlier disclosure studies, which have examined the effect size has on the extent of overall disclosure (Hossain, Perera and Rahman, 1995; Cooke, 1989b;1989c; Chow and Wong-Boren, 1987). For some of the years in the period 1996-2000, Williams (2001) found leverage to be positively related to the extent of disclosure on intangibles. In the present study, leverage does not appear to be influential. Also this result is, however, in line with earlier studies, where the relationship between leverage and overall disclosure extent has been non-existent or weak (Inchausti, 1997; Hossain, Perera and Rahman, 1995; Chow and Wong-Boren, 1987). The argument that Swedish companies are precursors when it comes to disclose information on intangibles (Bukh, Larsen and Mourtisen, 2001; FASB, 2001b) is confirmed in the present study. Although listing status is found to be positively related both to the extent of disclosure on intangibles (Williams, 2001) and to the extent of overall disclosure (Inchausti, 1997; Hoasain, Perera and Rahman, 1995; Cooke, 1989b;1989c), the result from the multivariate regression does not indicate that there is a relationship between listing status and the extent of disclosure on intangibles. Considering that Sweden is argued to be the place where disclosures on intangibles are originated from, a possible explanation could be that the demand for disclosures on intangibles is greater in the Nordic countries than in the U.K. and in the U.S. and that this makes the listing-status hypothesis less relevant when Nordic countries and disclosures on intangibles are concerned.
Multivariate regression: Human D1Country is the only coefficient, which is significantly different from zero when the multivariate regression is run with Human as dependent variable. The coefficient is positive and significant on the 1% significant level. Thus, the result suggests that Swedish companies disclose more information on items related to board members, the management team and employees than companies in the other Nordic countries do. An explanation to the result might be that human resource costing and accounting (Gröjer and Johanson, 1996), has a long tradition in Sweden and that this has influenced companies to place a greater emphasis on employee-related disclosure.
Multivariate regression: Relational The result of the multivariate regression run with Relational as dependent variable (row 3 of Table 1.6) is similar to the result when Total score was dependent variable, i.e. the coefficients of SIZE and D1Country are positive and significantly different from
26
zero. D1Country is, however, only significant on the 10% significant level as compared to the 5% level in the ‘total score regression’. Thus, large companies and Swedish companies appear to have more extensive disclosures on items related to a company’s relationships with its, e.g. owners, partners, suppliers and customers than smaller companies and non-Swedish companies have. The size effect might be explained by larger companies having more ongoing projects, collaboration agreements and alliances with external parties than smaller companies have. Consequently, they have more information to disclose on items related to the Relational category.
Multivariate regression: Organisational The SIZE-coefficient is significantly positive on the 1% significant level when the multivariate regression is run with Organisational as dependent variable. D1Country is the only other coefficient, which is significantly different from zero. The dummy variable is, however, only significant on the 10% significant level. Thus, like with the regressions run with Total score and Relational, respectively as dependent variable, SIZE and D1Country are the only two coefficients significantly different from zero. The result suggests that large companies disclose more on items in the Organisational category than smaller companies do. This result could probably be expected since large companies tend to have a complex organisational structure with many different divisions located in different countries or even on different continents. To be able to run this type of company it is vital to have clear policies on organisational routines and processes as well as systems for communication and knowledge sharing. Thus, larger companies may disclose more on items in the Organisational category simply because organisational routines, processes and systems are more developed than they are in smaller companies with organisational structures less complex.
Multivariate regression: R&D Considering the regression result, the extent of disclosure on R&D appears to be positively related to a company’s listing status. The coefficient D2Listing, which is significant on the 5% significant level, indicates that an internationally listed company discloses more information related to R&D than a company only listed on its domestic stock exchange does. The result also suggests that there is a significant and negative relationship between company size and disclosure on R&D.30 The listing effect might be explained by the fact that companies, which are internationally listed are likely to issue informative disclosures on their R&D-activities since they are not so well known in the country where they are foreign-listed as they are in their home country. Smaller companies might have informative disclosures on their R&D-activities for the same reason, i.e. a small company’s business activities are usually not so well known as the business activities of a large company, which is more visible in the media. Thus, this might explain why smaller companies are more prone to disclose information on their R&D activities in annual reports.
30 To check the robustness of the results a univariate regression was run with R&D as the dependent
variable and SIZE as the independent variable. There was no significant difference in the results, which implies that the results are robust.

27
Multivariate regression: Environ/Social The multivariate regression shows that the extent of disclosure on items related to the Environ/Social category is positively related to company size. The size coefficient, which is the only coefficient significantly different from zero, is significant on the 1% significant level. This result is consistent with earlier studies, which have found company size to be positively related to the extent of social and environmental disclosure (Gray, Javad, Power and Sinclair, 2001; Adams, Hill and Roberts, 1998; Hackston and Milne, 1996; Trotman and Bradley, 1981). The result can be explained with larger companies being more scrutinised and watched by the media, the government and pressure groups than smaller companies are. The annual report might be regarded an important media to use for communicating that they are conducting businesses in compliance with the society’s environmental, social and ethical code. Thus, Environ/Social disclosure might be seen as a way for large companies to achieve an environmental, social and ethical certificate.
1.6 Discussion and concluding remarks The present study provides evidence that the management teams use the opportunity to voluntarily supply outsiders with information on intangibles. The extent of disclosure on intangibles in annual reports is, however, not overwhelming. Although the value-creation process in knowledge-intense companies is argued to rely heavily on intangibles only half of the items (50.6 percent) in the checklist is on average disclosed in the annual reports. To determine if the disclosure percentage was high or low, the results were compared to the disclosure scores in Bukh, Gormsen, Mouritsen and Nielsen (2002). The comparison focused on 37 items, which were included in both studies’ checklists. The results of the comparison showed that the disclosure percentage for the present sample (50.4) is significantly higher than the percentages reported in Bukh, Gormsen, Mouritsen and Nielsen (2002). The disclosure percentage (50.4) was not only higher than the disclosure percentage for the Danish total sample (24.9), which includes both knowledge-intense and traditional companies, but also higher than the Danish sub-sample (35.9), which exclusively includes companies belonging to the pharmaceutical and research industries. Thus, the results of the comparison indicate that the disclosure percentage in the present study is relatively high. Furthermore, the results lend credence to the notion that companies belonging to knowledge-intense industries disclose more on intangibles than traditional companies do. Four hypotheses were posed to test the relationship between company related factors, i.e. size, leverage, country affiliation and listing-status, and the extent of disclosure on intangibles.31 Consistent with the hypothesis, company size was found to be positively related to the extent of disclosure on intangibles. This result is not consistent with Williams (2001:200) who found no relationship between size and extent of disclosure
31 The present section refers to the results of the multivariate regression, which were run with Total
score as dependent variable.

28
on intangibles. The result is, however, in line with earlier studies, which have examined the size effect on the extent of overall disclosure (Hossain, Perera and Rahman, 1995; Cooke, 1989b;1989c; Chow and Wong-Boren, 1987). The regression result did not lend support to the hypothesis that high leveraged companies disclose more information on intangibles than low leveraged companies do. Also this result is inconsistent with Williams’s (2001) findings and consistent with the findings in earlier studies on the extent of overall disclosure (Inchausti, 1997; Hossain, Perera and Rahman, 1995; Chow and Wong-Boren, 1987). The hypothesis that Swedish companies disclose more on intangibles than companies from the other Nordic countries do was confirmed in the regression. This may in part be explained by Sweden’s relatively long tradition with disclosing voluntary information on intangibles. A tradition, which with justice it seems has earned them the epithet ‘precursors’. Inconsistent with both the hypothesis and with earlier disclosure studies, internationally listed companies were not found to disclose more information on intangibles than only-domestically listed companies. Following the notion that disclosures on intangibles are originated from Sweden, a possible explanation could be that the demand for disclosures on intangibles is greater in the Nordic countries than in the U.K. and in the U.S. Thus, the listing-status hypothesis might be less relevant when Nordic countries and disclosures on intangibles are concerned. Also in the regressions, which were run with each of the five categories’ disclosure scores as dependent variable, did size and country affiliation Sweden appear to be the two independent variables, which are most related to the extent of disclosure in the five categories of intangibles. This lends further support to the hypotheses stating that larger companies and companies from Sweden disclose more on intangibles than smaller and non-Swedish companies do – irrespective of if the overall disclosure on intangibles or a specific category of intangibles is at focus. The disclosure scores revealed that R&D is the category, which the knowledge-intense companies disclose most information on in their annual reports. Considering that R&D is the predominant business activity in companies belonging to high-tech industries, the result lends support to the notion that industry membership exerts an influence on a company’s disclosure focus (Meek, Roberts and Gray, 1995). Their argument that companies with substantial R&D activities are likely to be more sensitive about disclosing information than companies in other industries are is, however, refuted in the present study. Instead the result is in line with Lang and Lundholm’s (1993) argument that R&D-intense companies are prone to disclose information on R&D to reduce the information asymmetry between the management team and the investors. Like R&D, information related to relationships with suppliers, customers and partners also appears to be deemed highly relevant when the management teams design their disclosures on intangibles. The result is probably a direct outcome of the increasing trend in knowledge-intense industries towards engaging in collaboration agreements with, e.g. other companies, suppliers and customers. Thus, with the increasing prevalence of collaborative activities comes a motive for companies to supply more information related to their collaborations, e.g. choice of partners, purpose and effect of the collaboration. This motive is likely to be intensified by a greater demand from the actors on the capital market for detailed
29
information on the companies’ collaboration activities. Social and environmental disclosure does not appear to be prioritised. Although the result is consistent with earlier studies (Gray, Javad, Power and Sinclair, 2001) it is somewhat unexpected considering the prevailing social and environmental trend. The disclosure scores also reveal that the management teams do not seem to follow up the old adage “the employees are our most valuable asset” with information related to this high-valued asset. The descriptive analysis of the disclosure scores indicates that there are differences, both in type and extent of disclosure on intangibles, between the companies in the four Nordic countries. The Finnish companies have the most extensive disclosures on intangibles followed by the Swedish, Norwegian and Danish companies. While the Finnish companies are the ones with the highest average scores in the categories Human, Relational and Organisational, the Danish companies are the ones with the lowest average scores in all categories except Environ/Social. The disclosure scores revealed that all of the four Nordic sub-samples disclose most information related to the R&D category followed by the categories Relational and Organisational. Human and Environ/Social appear to be the less prioritised disclosure categories. When the internal consistency of the disclosure scores was tested there appeared to be a mild tendency towards a multidimensional structure. Further analyses indicated that the R&D category might be causing the mild tendency of a multidimensional structure in the disclosure scores. This pattern was also present in the results of the cluster analysis. The cluster analysis revealed that the companies position themselves in three distinct clusters, which exhibit different disclosure styles. The clusters are neither country-specific nor is their distinctiveness related to company related factors. Companies in cluster 1 are the ones, which are best at disclosing information on R&D. Considering the other four categories of intangibles they disclose about average compared to full sample. Cluster 2 is characterised by companies, which are well below average when it comes to disclose information on intangibles. Their deficiency applies to all categories. Their disclosure on R&D is, though, only moderately below average. Companies in cluster 3 are the ones, which are best at disclosing information related to the categories Human, Relational, Organisational and Environ/Social. They are, however, the ones with the worst disclosures on R&D. After conducting the present study, some suggestions concerning the design of future studies have arisen. First, considering that the interest in intangibles has gradually increased since the beginning of the 1990th, it would be relvant to conduct a longitudinal study to examine if and how the extent of disclosure on intangibles in annual reports has changed over time. Second, to determine if a company’s extent and style of disclosure are industry specific, the present checklist could be used on companies belonging to other industries than knowledge-intense. Third, the checklist could be used on other types of documents. Since the information process surrounding the valuation of companies involves both a demand side, i.e. the actors on the capital market and a supply side, i.e. the management teams, it would be relevant to also examine the emphasis the demand side places on intangibles. Especially relevant would be to examine if the disclosure in analyst reports focuses on the same categories
30
of intangibles as the annual reports were found do. This would give a clue to which categories of intangibles financial analysts regard as important when they make company valuations. Besides being relevant for deciding if there is an information gap between the demand side and the supply side concerning intangibles, the result of this type of study could be useful to management teams when they design their disclosures on intangibles. Fourth, although the choice to use the same independent variables for all different types of information is the common approach used in earlier disclosure studies, it would be relevant for future studies to include additional factors, which could be thought of as explaining the extent of disclosure in each of the five categories. For example, number of collaborations to explain disclosure extent in Relational and number of ISO-certificate to explain disclosure extent in Environ/Social.
31
References Abbody, D., and Lev, B. 1999. R&D and Insider Gains. Working Paper: New York
University. Adams, C. A., Hill, W-Y., and Roberts, C. B. 1998. Corporate Social Reporting
Practises in Western Europe: Legitimating Corporate Behaviour? British Accounting Review, 30: 1-21.
Adrem, A. H. 1999. Essays on Disclosure Practices in Sweden – Causes and Effects. PhD dissertation, Department of Business Administration, Lund University: Lund University Press.
Ahmed, K., and Courtis, J. K. 1999. Associations Between Corporate Characteristics and Disclosure Levels in Annual Reports: A Meta-Analysis. British Accounting Review, 31: 35-61.
AICPA (American Institute of Certified Public Accountants). 1994. Improving Business Reporting – A Customer Focus (a.k.a The Jenkins Report). New York: AICPA.
Amir, E., Lev, B., and Sougiannis, T. 1999. What Value analysts? Working Paper: New York University, 1-41.
Arvidsson, S. 2002. Classifications of Intangibles and Intangibles’ Impact on a Company’s Value-Creation Potential: A Review. Mimeo, Department of Business Administration, Lund University.
Barrett, M. E. 1976. Financial Reporting Practices: Disclosure and Comprehensiveness in an International Setting. Journal of Accounting Research, 14(1): 10-26.
Barth, M.E., Kasznik, R., and McNichols, M. F. 1999. Analyst Coverage and Intangible Assets. Working Paper: Stanford University, 1-47.
Blair, M. M., and Kochan, T. A. 2000. The New Relationship Human Capital in the American Corporation. Brookings Institution.
Botosan, C. A., and Plumlee, M. A. 2002. A Re-examination of Disclosure Level and the Expected Cost of Equity Capital. Journal of Accounting Research, 40(1): 21-40.
Botosan, C. A. 1997. Disclosure Level and the Cost of Equity Capital, Accounting Review, 72(3): 323-349.
Brown, S., Lo, K., and Lys, T. 1999. Use of R2 in Accounting Research: Measuring Changes in Value Relevance over the Last Four Decades. Journal of Accounting and Economics, 28 (2): 83-115.
Bukh, P. N., Gormsen, P., Mouritsen, J., and Nielsen, C. 2002. Disclosure of Intellectual Capital Indicators in Danish IPO Prospectuses. Working Paper: The Aarhus School of Business, 1-24.
Bukh, P. N., Rosenkrands Johansen, M., García Meca, E., and Mourtisen, J. 2002. IPO Prospectuses as Intellectual Capital Reports: A Comparison of Danish and Spanish Reporting Practices. Paper presented at the European Accounting Association’s Annual Conference, Copenhagen 2002.
32
Bukh, P. N., Larsen, H. T., and Mouritsen, J. 2001. Constructing Intellectual Capital Statements. Scandinavian Journal of Management, 17: 87-108.
Chan, L. K. C., Lakanishok, J., and Sougiannis, T. 1999. The Stock Market Valuation of Research and Development Expenditures. Working Paper 7223, Cambridge Mass.: National Bureau of Economic Research.
Choi, F. D. S. 1973. Financial Disclosure and Entry to the European Capital Market. Journal of Accounting Research, 11(2): 159-175.
Chow, C. W., and Wong-Boren, A. 1987. Voluntary Financial Disclosure by Mexican Corporations. The Accounting Review, 62(3): 533-541.
Cooke, T. E. 1989a. An Empirical Study of Financial Disclosure by Swedish Companies. (PhD dissertation). Exeter: University of Exeter
Cooke, T. E. 1989b. Voluntary Corporate Disclosure by Swedish Companies. Journal of International Financial Management and Accounting, 1(2): 171-195.
Cooke, T. E. 1989c. Disclosure in the Corporate Annual Reports of Swedish Companies. Accounting and Business Research, 19(74): 113-124.
Courtis, J. K. 1996. Disclosure Redundancy in Annual Reports. Accountability and Performance, 2(3): 1-16.
Cronbach, L. J. 1951. Coefficient Alpha and the Internal Structure of Tests. Psychometrika, Vol. 16(3): 297-334.
Diamond, D. W., and Verrecchia, R. E. 1991. Disclosure, Liquidity, and the Cost of Capital. Journal of Finance, 46(4): 1325-1359.
Eccles, R. G., and Mavrinac, S. C. 1995. Improving the Corporate Disclosure Process. Sloan Management Review, 36(4): 11-26.
Elliott, R. K., and Jacobson, P. D. 1994. Costs and Benefits of Business Information Disclosure. Accounting Horizons, 8(4): 80-96.
Ernst and Young Center for Business Innovation. 1997. Measures that Matter. Cambridge Mass.: Ernst & Young LLP.
FASB (Financial Accounting Standards Board). 2001a. Improving Business Reporting: Insights into Enhancing Voluntary Disclosures (Steering Committee Report). New York: FASB.
FASB (Financial Accounting Standards Board). 2001b. Business and Financial Reporting, Challenges from the New Economy (Special Report). New York: FASB.
Gelb, D. S. 2002. Intangible Assets and Firms’ Disclosures: An Empirical Investigation. Journal of Business Finance & Accounting, 29(3 & 4): 457-476.
Gray, R., Javad, M., Power, D. M., and Sinclair, C. D. 2001. Social and Environmental Disclosure and Corporate Characteristics: A Research Note and Extension. Journal of Business, Finance & Accounting, 28(3 & 4): 327-356.
Gray, S. J., Meek, G. K., and Roberts, C. B. 1995. International Capital Market Pressures and Voluntary Annual Report Disclosures by U.S. and U.K. Multinationals. Journal of International Financial Management and Accounting, 6(1): 43-68.
Gröjer, J-E., and Johanson, U. 1996. Human Resource Costing and Accounting. (2ed). Stockholm: Joint Industrial Safety Council.
33
Hackston, D., and Milne, M. J. 1996. Some Determinants of Social and Environmental Disclosures in New Zealand Companies. Accounting, Auditing & Accountability Journal, 9(1): 77-108.
Hall, R. E. 2001. The Stock Market and Capital Accumulation. American Economic Review, 91: 1185-1202.
Hall, R. 1993. A Framework Linking Intangible Resources and Capabilities to Sustainable Competitive Advantage. Strategic Management Journal, 14: 607-618.
Healy, P. M., Hutton, A. P., and Palepu, K. G. 1999. Stock Performance and Intermediation Changes Surrounding Sustained Increases in Disclosure. Contemporary Accounting Research, 16(3): 485-520.
Hoegh-Krohn, N. E. J., and Knivsflå, K. H. 2000. Accounting for Intangible Assets in Scandinavia, the UK, the US, and by the IASC: Challanges and a Solution. The International Accounting Journal, 35(2): 243-265.
Holland, J. 2002. Corporate Value Creation, Intangibles, and Disclosure. Paper presented at the Centenary Celebration Conference, 25th October 2002 at Bocconi University (Milan), Italy.
Holland, J. 2001. Financial Institutions, Intangibles and Corporate Governance. Accounting, Auditing & Accountability Journal, 14(4): 497-529.
Holland, J. 1997. Corporate Communications with Institutional Shareholders: Private Disclosures and Financial Reporting. Edinburgh: The Institute of Chartered Accountants of Scotland.
Hossain, M., Perera, M. H. B., and Rahman, A. R. 1995. Voluntary Disclosure in the Annual Reports of New Zealand Companies. Journal of International Financial Management and Accounting, 6(1): 69-87.
IASC (International Accounting Standard Committee). 1998. IAS No. 38: Intangible Assets. London: IASC.
IASC (International Accounting Standard Committee). 1997. IAS No. 1: Presentation of Financial Statements. London: IASC.
Inchausti, B. G. 1997. The Influence of Company Characteristics and Accounting Regulation on Information Disclosed by Spanish Firms. The European Accounting Review, 6(1): 45-68.
Jensen, M. C., and Meckling, W. H. 1976. Theory of the Firm: Managerial Behavior, Agency Costs and Ownership Structure. Journal of Financial Economics, 3(4): 305-360.
Johanson, U., Mårtensson, M., and Skoog, M. 2001. Measuring to Understand Intangible Performance Drivers. The European Accounting Review, 10(3): 407-437.
Lang, M. H., and Lundholm, R. J. 1996. Corporate Disclosure Policy and Analyst Behavior. The Accounting Review, 71(4): 467-492.
Lang, M., and Lundholm, R. 1993. Cross-Sectional Determinants of Analyst Ratings of Corporate Disclosures. Journal of Accounting Research, 31(2): 246-271.
Lev, B. 2001. Intangibles – Management, Measurement, and Reporting. Wasington: Brookings Institution Press.
Lev, B., and Zarowin, P. 1999. The Boundaries of Financial Reporting and How to Extend Them. Journal of Accounting Research, 37(2): 353-385.
34
Liouville, J., and Bayad, M. 1998. Human Resource Management and Performances: Proposition and Test of a Casual Model. Human Systems Management, 17(3):183-193.
Ljungdahl, F. 1999. Utveckling av svensk miljöredovisning i svenska börsbolag – praxis, begrepp, orsaker. (The Development of Environmental Reporting in Swedish Listed Companies - Practice, Concepts, Causes). PhD dissertation, Department of Business Administration, Lund University: Lund University Press.
Marston, C. L., and Shrives, P. J. 1996. A Review of Empirical Research into Financial Disclosure. Paper presented at the International Accounting Research Conference IAAER, May 1996 at Warwick Business School, Great Britain.
Marston, C. L., and Shrives, P. J. 1991. The Use of Disclosure Indices in Accounting Research: A Review Article. British Accounting Review, 23: 195-210.
Mavrinac, S., and Siesfeld, T. 1997. Measures that Matter: An Explanatory Investigation of Investors’ Information Needs and Value Priorities. Working Paper: Richard Ivey School of Business, 1- 31.
Meek, G. K., Roberts, C. B., and Gray, S. J. 1995. Factors Influencing Voluntary Annual Report Disclosures by U.S., U.K. and Continental European Multinational Corporations. Journal of International Business Studies, 26: 555-572.
Nunnally, J. C., and Bernstein, I. H. 1994. Psychometric Theory (3rd ed). New York: McGraw-Hill, Inc.
Richardson, A. J., and Welker, M. 2001. Social Disclosure, Financial Disclosure and the Cost of Equity Capital. Accounting, Organizations and Society, 26:597-616.
SEC (Securities and Exchange Commission). 2000. Regulation FD, Selective Disclosure and Insider Training. Washington.
Sengupta, P. 1998. Corporate Disclosure Quality and the Cost of Debt. The Accounting Review, 73(4): 459-474.
Singhvi, S. S., and Desai, H. B. 1971. An Empirical Analysis of the Quality of Corporate Financial Disclosure. The Accounting Review, 46(1): 129-139.
SPSS. 1994. SPSS Professional Statistics™ 6.1. Illinois: SPSS Inc. SPSS. 1993. SPSS® for Windows™ Professional Statistics™ Release 6.0. Illinois: SPSS
Inc. Sullivan, P. H. Jr., and Sullivan, P. H. Sr. 2000. Valuing intangibles companies – An
intellectual capital approach. Journal of Intellectual Capital, 1(4): 328-340. Sureshchandar, G. S., Rajendran, C., and Anantharaman, R. N. 2002. Determinants of
Customer-perceived Service Quality: A Confirmatory Factor Analysis Approach. Journal of Services Marketing, 16(1): 9-34.
Sveiby, K-E. 1997. The New Organizational Wealth – Managing & Measuring Knowledge-Based Assets. San Francisco: Berret-Kohler Publishers, Inc.
Tasker, S. C. 1998. Bridging the Information Gap: Quarterly Conference Calls as a Medium for Voluntary Disclosure. Review of Accounting Studies, 3: 137-167.
Trotman, K. T., and Bradley, G. W. 1981. Associations Between Social Responsibility Disclosure and Characteristics of Companies. Accounting, Organizations and Society, 6(4): 355-362.
35
Wallman, S. M. H. 1996. The future of accounting and financial reporting part II: The colorized approach. Accounting Horizons, 10(2): 138-149.
Wallman, S. M. H. 1995. The future of accounting and disclosure in an evolving world: The need for dramatic change. Accounting Horizons, 9(3): 81-91.
Welker, M. 1995. Disclosure Policy, Information Asymmetry and Liquidity in Equity Markets. Contemporary Accounting Research, 11(2): 801-827.
White, H. 1980. A Heteroscedasticity-Consistent Covariance Matrix Estimator and A Direct Test for Heteroscedasticity. Econometrica, 48: 817-838.
Williams, S. M. 2001. Is Intellectual Capital Performance and Disclosure Practices Related? Journal of Intellectual Capital, 2(3): 192-203.
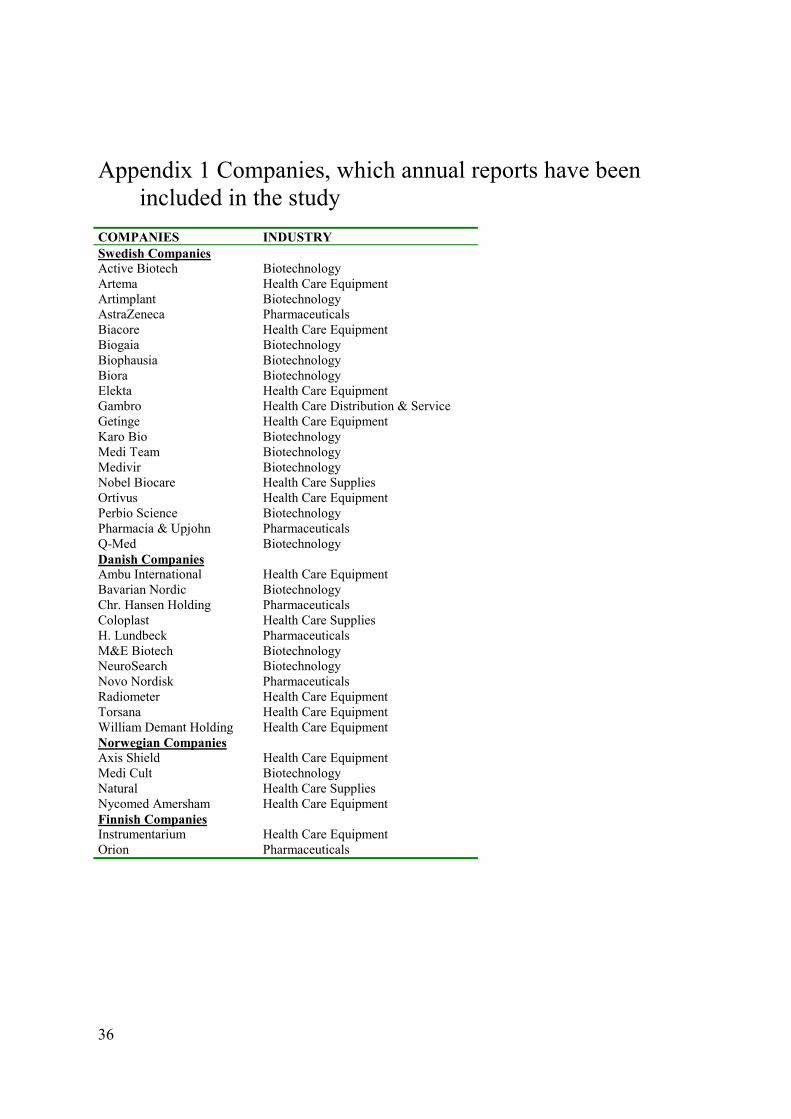
36
Appendix 1 Companies, which annual reports have been included in the study
COMPANIES INDUSTRY Swedish Companies Active Biotech Biotechnology Artema Health Care Equipment Artimplant Biotechnology AstraZeneca Pharmaceuticals Biacore Health Care Equipment Biogaia Biotechnology Biophausia Biotechnology Biora Biotechnology Elekta Health Care Equipment Gambro Health Care Distribution & Service Getinge Health Care Equipment Karo Bio Biotechnology Medi Team Biotechnology Medivir Biotechnology Nobel Biocare Health Care Supplies Ortivus Health Care Equipment Perbio Science Biotechnology Pharmacia & Upjohn Pharmaceuticals Q-Med Biotechnology Danish Companies Ambu International Health Care Equipment Bavarian Nordic Biotechnology Chr. Hansen Holding Pharmaceuticals Coloplast Health Care Supplies H. Lundbeck Pharmaceuticals M&E Biotech Biotechnology NeuroSearch Biotechnology Novo Nordisk Pharmaceuticals Radiometer Health Care Equipment Torsana Health Care Equipment William Demant Holding Health Care Equipment Norwegian Companies Axis Shield Health Care Equipment Medi Cult Biotechnology Natural Health Care Supplies Nycomed Amersham Health Care Equipment Finnish Companies Instrumentarium Health Care Equipment Orion Pharmaceuticals
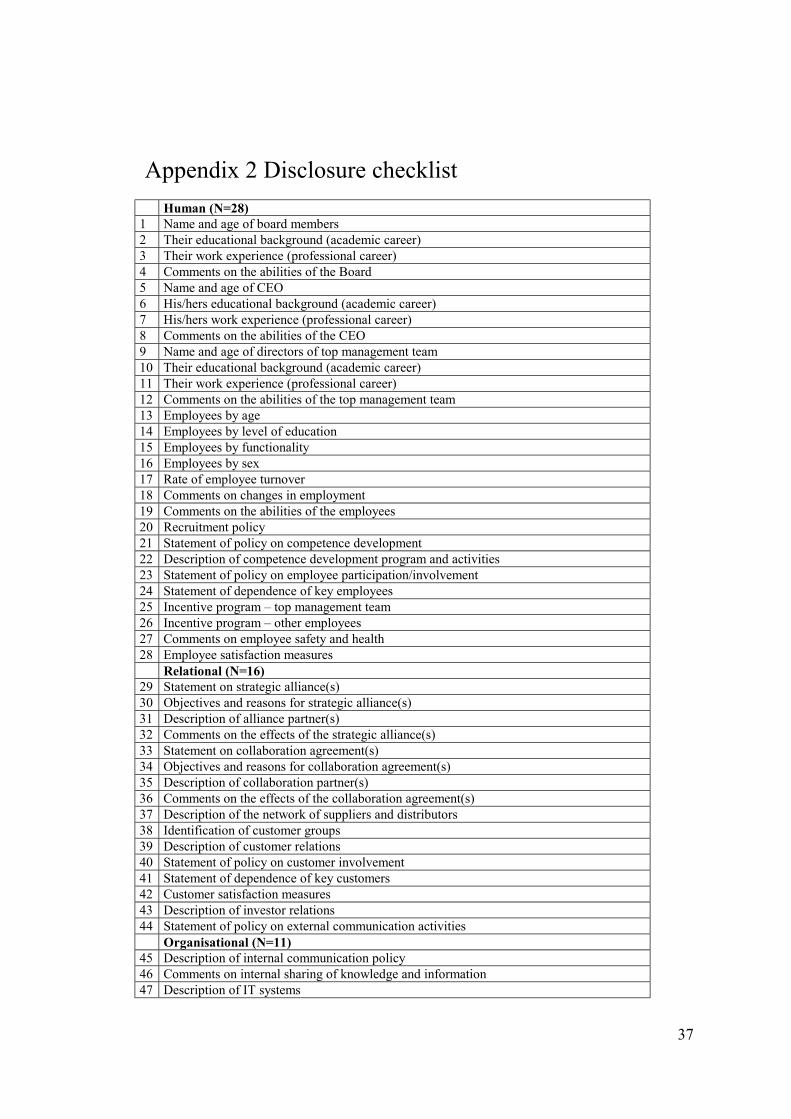
37
Appendix 2 Disclosure checklist Human (N=28) 1 Name and age of board members 2 Their educational background (academic career) 3 Their work experience (professional career) 4 Comments on the abilities of the Board 5 Name and age of CEO 6 His/hers educational background (academic career) 7 His/hers work experience (professional career) 8 Comments on the abilities of the CEO 9 Name and age of directors of top management team 10 Their educational background (academic career) 11 Their work experience (professional career) 12 Comments on the abilities of the top management team 13 Employees by age 14 Employees by level of education 15 Employees by functionality 16 Employees by sex 17 Rate of employee turnover 18 Comments on changes in employment 19 Comments on the abilities of the employees 20 Recruitment policy 21 Statement of policy on competence development 22 Description of competence development program and activities 23 Statement of policy on employee participation/involvement 24 Statement of dependence of key employees 25 Incentive program – top management team 26 Incentive program – other employees 27 Comments on employee safety and health 28 Employee satisfaction measures Relational (N=16) 29 Statement on strategic alliance(s) 30 Objectives and reasons for strategic alliance(s) 31 Description of alliance partner(s) 32 Comments on the effects of the strategic alliance(s) 33 Statement on collaboration agreement(s) 34 Objectives and reasons for collaboration agreement(s) 35 Description of collaboration partner(s) 36 Comments on the effects of the collaboration agreement(s) 37 Description of the network of suppliers and distributors 38 Identification of customer groups 39 Description of customer relations 40 Statement of policy on customer involvement 41 Statement of dependence of key customers 42 Customer satisfaction measures 43 Description of investor relations 44 Statement of policy on external communication activities Organisational (N=11) 45 Description of internal communication policy 46 Comments on internal sharing of knowledge and information 47 Description of IT systems
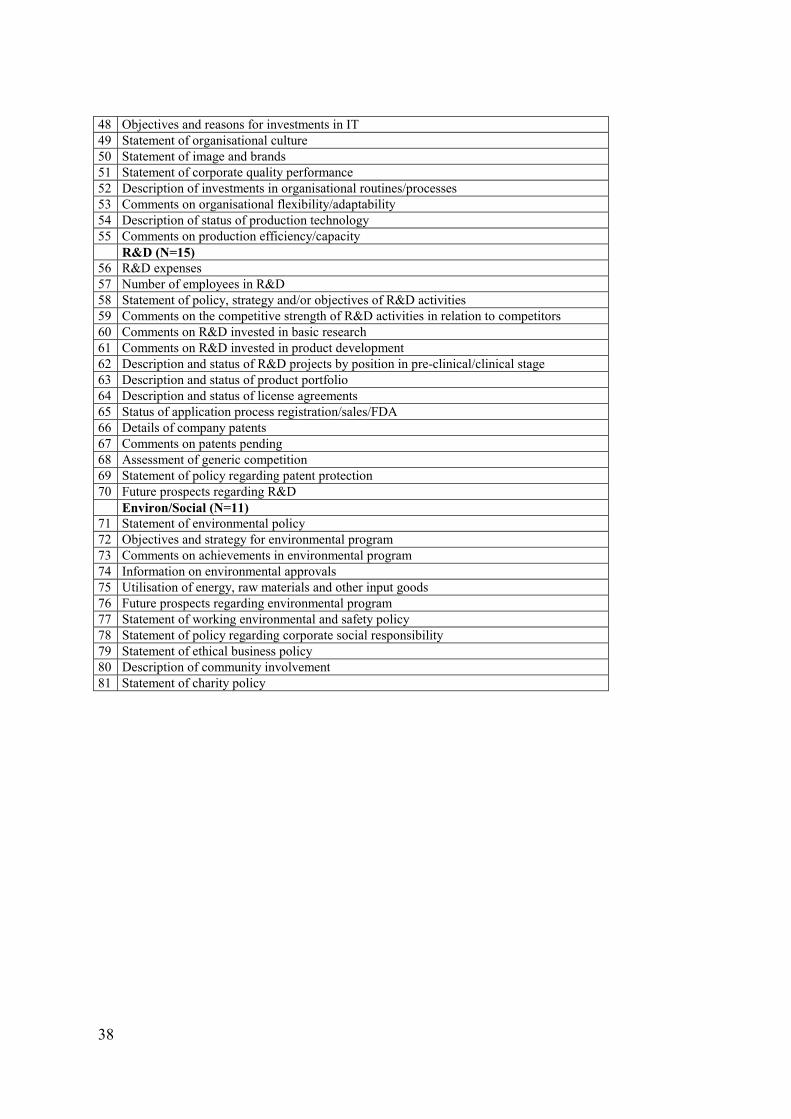
38
48 Objectives and reasons for investments in IT 49 Statement of organisational culture 50 Statement of image and brands 51 Statement of corporate quality performance 52 Description of investments in organisational routines/processes 53 Comments on organisational flexibility/adaptability 54 Description of status of production technology 55 Comments on production efficiency/capacity R&D (N=15) 56 R&D expenses 57 Number of employees in R&D 58 Statement of policy, strategy and/or objectives of R&D activities 59 Comments on the competitive strength of R&D activities in relation to competitors 60 Comments on R&D invested in basic research 61 Comments on R&D invested in product development 62 Description and status of R&D projects by position in pre-clinical/clinical stage 63 Description and status of product portfolio 64 Description and status of license agreements 65 Status of application process registration/sales/FDA 66 Details of company patents 67 Comments on patents pending 68 Assessment of generic competition 69 Statement of policy regarding patent protection 70 Future prospects regarding R&D Environ/Social (N=11) 71 Statement of environmental policy 72 Objectives and strategy for environmental program 73 Comments on achievements in environmental program 74 Information on environmental approvals 75 Utilisation of energy, raw materials and other input goods 76 Future prospects regarding environmental program 77 Statement of working environmental and safety policy 78 Statement of policy regarding corporate social responsibility 79 Statement of ethical business policy 80 Description of community involvement 81 Statement of charity policy