Embed Size (px)
Citation preview

Executive Board Annual Session
Rome, 4-8 June 2012
ANNUAL REPORTS
Agenda item 4
Distribution: GENERAL
WFP/EB.A/2012/4* 23 May 2012
ORIGINAL: ENGLISH
* Reissued for technical reasons
ANNUAL PERFORMANCE
REPORT FOR 2011
This document is printed in a limited number of copies. Executive Board documents are available on WFP’s Website (http://executiveboard.wfp.org).
E
For approval

ANNUAL PERFORMANCE REPORT FOR 2011 | WFP/EB.A/2012/4*
WORLD FOOD PROGRAMME | 3
NOTE TO THE EXECUTIVE BOARD
This document is submitted for approval by the Executive Board
The Secretariat invites members of the Board who may have questions of a technical nature with
regard to this document to contact the WFP staff focal points indicated below, preferably well in
advance of the Board’s meeting.
Deputy Executive Director, ER1 and
Chief Operating Officer
Mr A. Abdulla tel.: 066513–2401
Deputy Executive Director, HS2 Ms S. Sisulu tel.: 066513–2005
Deputy Executive Director, OD3 Mr R. Lopes da Silva tel.: 066513–2200
Officer-in-Charge and Chief
Financial Officer, RM4
Mr S. O’Brien tel.: 066513–2682
Director, RMP5 Mr C. Kaye tel.: 066513–2197
Programme Adviser, RMP Ms K. Oppusunggu tel.: 066513–3068
1 External Relations Department 2 Office of Hunger Solutions 3 Operations Department 4 Resource Management and Accountability Department 5 Performance and Accountability Management Division
Should you have any questions regarding matters of dispatch of documentation for the
Executive Board, please contact Ms I. Carpitella, Senior Administrative Assistant, Conference
Servicing Unit (tel.: 066513–2645).

ANNUAL PERFORMANCE REPORT FOR 2011 | WFP/EB.A/2012/4*
WORLD FOOD PROGRAMME | 4
ANNUAL PERFORMANCE REPORT FOR 2011 | WFP/EB.A/2012/4*
WORLD FOOD PROGRAMME | 5
DRAFT DECISION
The Board approves the Annual Performance Report for 2011 (WFP/EB.A/2012/4*),
noting that it provides a comprehensive record of WFP’s performance for the year.
ANNUAL PERFORMANCE REPORT FOR 2011 | WFP/EB.A/2012/4*
WORLD FOOD PROGRAMME | 6
Table of Contents
Page
Draft Decision 5
Foreword by the Executive Director 9
Executive Summary 11
PART I: Introduction 19
Strategic Context 21
WFP’s Response 24
PART II: Performance Results by Strategic Objective 33
Overview 33
Results by Strategic Objective 35
Lessons Learned 48
PART III: Organizational Performance by Management Result Dimension 49
Overview 49
Results by Management Result Dimension 50
Lessons Learned 75
PART IV: Looking Forward
77
ANNUAL PERFORMANCE REPORT FOR 2011 | WFP/EB.A/2012/4*
WORLD FOOD PROGRAMME | 7
Page
ANNEXES
I. WFP’S CONTRIBUTION TO THE MILLENNIUM DEVELOPMENT GOALS 85
II. A – WFP STRATEGIC RESULTS FRAMEWORK
(STRATEGIC PLAN 2008–2013)
87
B – OUTCOME PERFORMANCE REPORTING 96
C – METHODOLOGY – ASSESSMENT OF STRATEGIC OBJECTIVES 99
D – LESSONS LEARNED – 2011 REPORTING 102
III. PERFORMANCE INDICATORS 2011 103
IV. ETHICS REPORT 105
V. WFP EMPLOYEES WITH CONTRACTS OF ONE YEAR OR LONGER 113
VI. GLOBAL FOOD AID PROFILE 114
VII. WFP FOOD PROCUREMENT IN 2011 115
VIII. TOTAL CONFIRMED CONTRIBUTIONS IN 2011 119
IX. A – DIRECT EXPENSES BY REGION AND CATEGORY, 2008–2011 123
B – DIRECT EXPENSES BY COUNTRY, REGION AND PROGRAMME
CATEGORY, 2008–2011
125
C – DIRECT EXPENSES BY COUNTRY, SPECIAL STATUS CATEGORY AND
REGION, 2008–2011
128
X. A – UNITED NATIONS AND INTERNATIONAL ORGANIZATION
PARTNERSHIPS
129
B – NON-GOVERNMENTAL ORGANIZATIONS PER SECTOR OF
COLLABORATION
130
XI. END-NOTES 131
ACRONYMS USED IN THE DOCUMENT 132
ANNUAL PERFORMANCE REPORT FOR 2011 | WFP/EB.A/2012/4*
WORLD FOOD PROGRAMME | 8
HOW TO USE THIS REPORT This year’s Annual Performance Report (APR) is in the format established in 2011. It provides an analysis of WFP’s
achievements in accordance with the Strategic Plan (2008–2013) in four parts:
I: Introduction – the context within which WFP’s activities were undertaken.
II: Performance Results by Strategic Objective – the achievements of WFP’s operations at the output and outcome
levels in terms of each Strategic Objective.
III: Organizational Performance by Management Result Dimension – the work done to support the
Strategic Objectives.
IV: Looking Forward – future challenges and opportunities.
Annexes – detailed statistics and performance information.
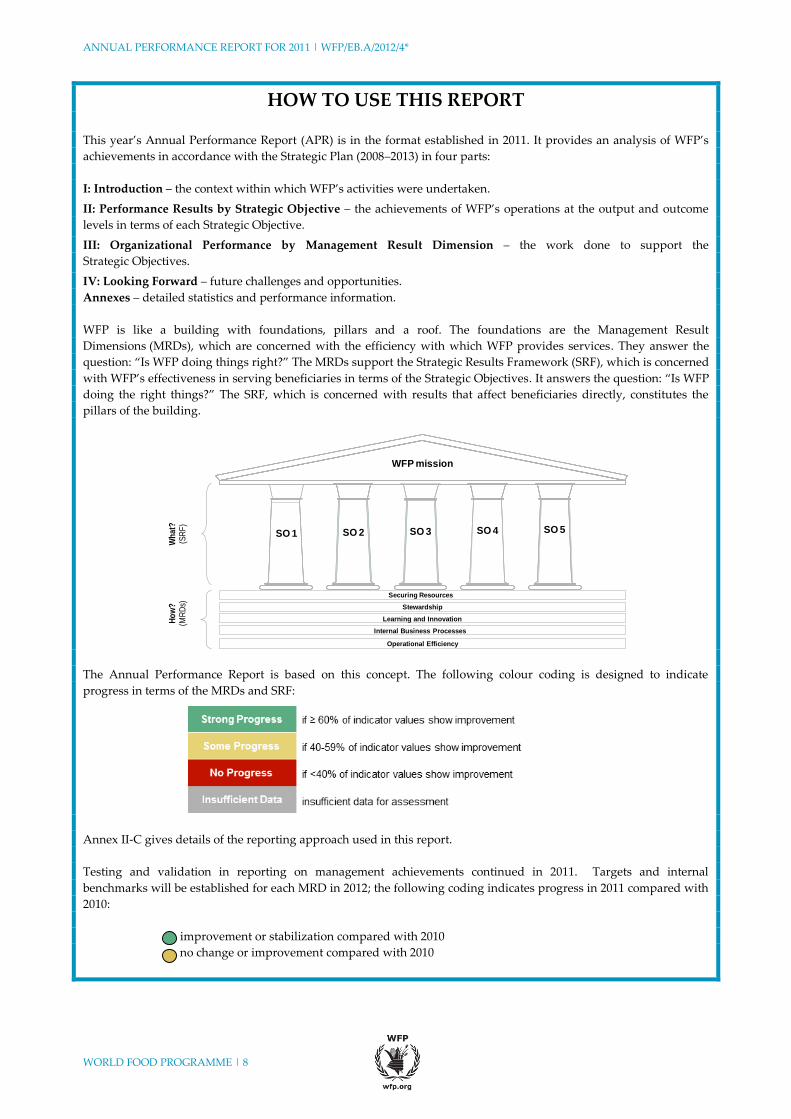
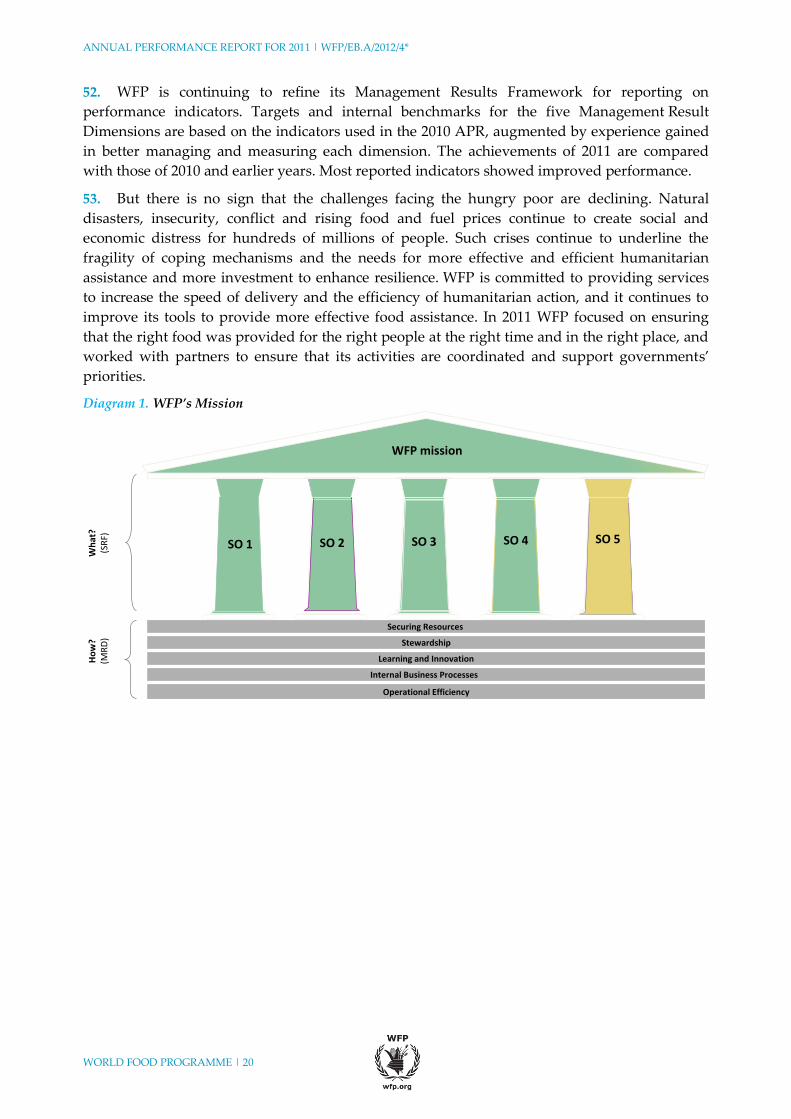
WFP is like a building with foundations, pillars and a roof. The foundations are the Management Result
Dimensions (MRDs), which are concerned with the efficiency with which WFP provides services. They answer the
question: “Is WFP doing things right?” The MRDs support the Strategic Results Framework (SRF), which is concerned
with WFP’s effectiveness in serving beneficiaries in terms of the Strategic Objectives. It answers the question: “Is WFP
doing the right things?” The SRF, which is concerned with results that affect beneficiaries directly, constitutes the
pillars of the building.
The Annual Performance Report is based on this concept. The following colour coding is designed to indicate
progress in terms of the MRDs and SRF:
Annex II-C gives details of the reporting approach used in this report.
Testing and validation in reporting on management achievements continued in 2011. Targets and internal
benchmarks will be established for each MRD in 2012; the following coding indicates progress in 2011 compared with
2010:
improvement or stabilization compared with 2010
no change or improvement compared with 2010
Ho
w?
(MR
Ds)
Wh
at?
(SR
F)
Securing Resources
Stewardship
Learning and Innovation
Internal Business Processes
Operational Efficiency
WFP mission
SO 2SO 1 SO 3 SO 4 SO 5
ANNUAL PERFORMANCE REPORT FOR 2011 | WFP/EB.A/2012/4*
WORLD FOOD PROGRAMME | 9
FOREWORD BY THE EXECUTIVE DIRECTOR
Political instability, escalating conflict, continued food price volatility and increasing numbers of
people affected by weather-related disasters characterized 2011 and reinforced the need to find
the most appropriate ways to support the most vulnerable people. WFP implemented new
mechanisms in 2011, in response to the worst drought in 60 years in the Horn of Africa and the
crisis in Libya. These responses included the use of the forward purchase facility as well as
scaled up use of new tools such as cash and vouchers. This enables us to provide food assistance
using the right tools in the right place at the right time. Just as important, WFP was able to
maintain its funding levels at a time of financial austerity. We believe that management
improvements and commitment to demonstrate value for money have enhanced the confidence
of our donors.
The 50th anniversary of WFP’s founding was commemorated in 2011, a year in which we
responded to unprecedented challenges that had us working in new areas and new roles. We
also benefited from the management reforms and programmatic improvements of the last few
years that made WFP more effective, efficient and transparent and promoted best practices
throughout the United Nations system.
A major story from 2011 is WFP’s enhancement of its corporate governance structure and its
commitment to institutional accountability and transparency. As part of this the
Executive Management Council was established to identify risks and mitigating actions at the
highest level. WFP has never been stronger: this was validated by the Joint Inspection Unit’s
report on accountability frameworks, which commended WFP’s internal control framework as
one of the best in the United Nations system.
At the recommendation of the External Auditor and the Audit Committee, WFP adopted the
Internal Control system of the Committee of Sponsoring Organizations of the Treadway
Commission, a recognized global best practice. WFP now has a framework in place that outlines
the principles of internal control, and will issue in 2012 – for the first time – a Statement on
Internal Control that assesses its position in relation to the principles and its work to improve.
The Management Plan (2012–2014) is the first to integrate WFP’s new performance management
framework. This will provide clearer links with the Strategic Plan and the performance
indicators for all activities, and will enable more accurate benchmarking across projects.
WFP is building on the reforms enacted in the past five years to promote best public practice –
leveraging institutional strengths to carry out our humanitarian mission and maximize
entrepreneurship. I am heartened to see these pace-setting reforms becoming established in the
United Nations system. Today, WFP is guiding other agencies in adopting International Public
Sector Accounting Standards and in enterprise resource planning.
ANNUAL PERFORMANCE REPORT FOR 2011 | WFP/EB.A/2012/4*
WORLD FOOD PROGRAMME | 10
WFP has increased the reach of its cash and voucher interventions from very small numbers to
3 million beneficiaries in just two years. The food purchased today is more nutritious, packaged
in emergency-ready materials and targeted to particular groups in line with recent scientific
findings on nutrition. Interventions have been scaled up, but it will take time, dedication and a
continued willingness to learn and adopt new ideas to mainstream the changes into WFP’s
responses and programmes. It will also require new skills, which means retraining current staff
or hiring staff with the skills needed. Some institutional constraints remain: these include the
need to monitor and evaluate processes and outputs and outcomes over time in a way that is
cost-effective and uniform across country offices.
WFP will not rest on its laurels. We recognize that we cannot transform the lives of the hungry if
we cannot first transform the way we do business. Over the last 50 years WFP’s reputation – the
first to respond in an emergency, the provider of food for the most vulnerable people, a partner
for communities and nations in the fight against hunger, and increasingly a good steward of
investments – has been enhanced with each life-saving intervention. I cannot say with any
certainty what challenges lie ahead in 2012, but I am certain that WFP will rise to the occasion.
Josette Sheeran
Executive Director
ANNUAL PERFORMANCE REPORT FOR 2011 | WFP/EB.A/2012/4*
WORLD FOOD PROGRAMME | 11
EXECUTIVE SUMMARY
1. Today’s world has many risks for those least able to cope with them. Food and oil prices
are at an all-time high, 2011 was the costliest year ever in terms of damage caused by natural
disasters, 1.5 billion people live amid political and criminal insecurity, and safe humanitarian
space is shrinking.
2. The earthquake and tsunami in Japan showed that risks can affect rich and poor alike – but
they have a disproportionate impact on vulnerable people. With one person in seven of the
world’s population undernourished, the safety margins are wafer thin, and for those struggling
to survive on less than US$1.25 a day the margins are easily breached. To meet these challenges,
WFP applies an expanding range of food-assistance tools to provide the right food for the right
people at the right time and in the right place.
3. In 2011, WFP provided food assistance for 99.1 million beneficiaries in 75 countries.
Children remained the focus of WFP’s support, accounting for 64 percent of beneficiaries;
women and children together accounted for 84 percent.
4. This Annual Performance Report is an assessment of WFP’s performance during 2011 in
achieving the objectives of the Strategic Plan (2008–2013). It considers what WFP did and how it
supported its achievements; it also demonstrates WFP’s contribution to addressing the needs of
the most vulnerable hungry poor and the extent to which it has done so economically,
effectively and efficiently.
5. The analysis is based on information drawn from the standard project reports produced for
each operation which track projects on selected output and outcome indicators. It is also derived
from the annual Financial Statements and the individual reports of the Office of Evaluation,
which draw conclusions about performance at the corporate level.
6. WFP made strong progress in 2011 in Strategic Objectives 1 – Save lives and protect
livelihoods in emergencies; 2 – Prevent acute hunger and invest in disaster preparedness and
mitigation measures; 3 – Restore and rebuild lives and livelihoods in post-conflict, post-disaster
or transition situations; and 4 – Reduce chronic hunger and undernutrition.
7. This is the first year in which WFP has reported significant progress against
Strategic Objective 4. In 2011, WFP projects reported on enough indicators to show that progress
is also being made in enhancing countries’ capacity to reduce hunger under Strategic Objective 5
– Strengthen the capacities of countries to reduce hunger, including through hand-over
strategies and local purchase.
WFP’s Response – Common Features of WFP Work in 2011
8. WFP’s response to emergencies in 2011 underlined the importance of its global reach. The
“Arab spring” and the earthquake in Japan required WFP to respond in countries where it had
limited presence before the emergencies. WFP’s regional presence enabled it to respond quickly
to the conflict in Libya; and its global expertise in the logistics and emergency
telecommunications clusters and in the United Nations humanitarian response depots enabled it
to contribute effectively to the Japanese Government’s response to the earthquake and tsunami.
ANNUAL PERFORMANCE REPORT FOR 2011 | WFP/EB.A/2012/4*
WORLD FOOD PROGRAMME | 12
9. New technology remains crucial in the fight against hunger. WFP’s use of new technology
in 2011, which ranged from mapping to mobile banking, helped to increase the efficiency and
effectiveness of its response to emergency and development challenges.
10. The past year demonstrated again the value of partnerships in humanitarian responses.
WFP’s partnerships in 2011 were more extensive than ever before; their effectiveness is evident
in the cluster approach to emergency telecommunications, logistics, food security and nutrition.
WFP also established new partnerships for research and the development of best practices in
nutrition, Purchase for Progress and school feeding. A milestone in 2011 was the launch in
March of the centre of excellence on hunger under a partnership between WFP and the
Government of Brazil.
WFP’s Response – New Hunger Solutions
11. WFP continues to seek and use innovative approaches to food assistance, with a focus on
providing the right tools and the right food for effective food assistance.
In terms of providing the right food, WFP continued to scale up the use of new nutritious
products to respond to specific needs. It continued to integrate food and nutrition into its
HIV response, it engaged at the policy level with governments to ensure that
undernutrition remained central in the fight against hunger, and it refocused its nutrition
interventions on the first 1,000 days1 “window of opportunity” to reduce mortality and
avert the long-term consequences of stunting. Nutrition interventions showed positive
outcome trends in 2011: acute malnutrition rates were reduced in 60 percent of projects
reporting on this indicator, and supplementary feeding performance rates showed good
progress in targeted feeding programmes.
In terms of utilizing the right tools, the number of WFP’s cash-based interventions
continued to rise in 2011: there was a five-fold increase in approved budgets compared
with 2009 levels. WFP expects cash-based programming to continue to expand over the
next three to four years. Purchase for Progress accounted for 13 percent of WFP’s food
purchases in 21 pilot countries; 207,000 mt of food had been contracted by the end of
2011, of which 130,000 mt had been delivered to WFP.
WFP’s Response – Emergency Operations
12. In 2011, emergency relief and early recovery operations accounted for two thirds of the
food distributed and associated direct expenses, supporting 60 million beneficiaries. WFP used
its new tools and worked with stabilization, development and human rights actors to facilitate
the transition from relief to recovery and rehabilitation.
13. One of the most robust donor responses in recent years occurred in the Horn of Africa
crisis: by the end of December 2011, 45 donors had provided US$650 million for WFP’s
emergency response. WFP overcame logistics problems, establishing new overland corridors
and creating staging areas along the Somali border; 100 airlifts carried 2,300 mt of food
assistance to beneficiaries in need of special supplementary food. Advanced technology was
crucial: WFP used the geographic information system for daily updates on ports, airports, hubs,
logistics routes, camps and food security, and created maps showing the locations of small
settlements to support emergency relief.
1 Refers to a child’s development from conception to 2 years of age.
ANNUAL PERFORMANCE REPORT FOR 2011 | WFP/EB.A/2012/4*
WORLD FOOD PROGRAMME | 13
14. The uprising in Libya led to conflict and political upheaval. The main obstacles were lack
of access to areas deemed unsafe, which limited overland transport, and the establishment of a
no-fly zone for commercial aircraft. In its response, WFP chartered a ship to transport cargo and
aid workers – the first passenger ferry service for humanitarian partners. WFP used the
United Nations Humanitarian Air Service to substitute commercial aircraft, and enlisted local
partners and communities to help to deliver food to conflict and post-conflict zones.
15. In Pakistan, an estimated 5.8 million people were affected by floods in Sindh and
Balochistan provinces. Life-saving support focused on households headed by women, and by
the end of the year WFP had reached 3.5 million victims. In response to the many logistics
challenges – damaged roads and infrastructure, insecurity and significant flooding in remote
areas – WFP established ten hubs in the affected areas and deployed 14 boats to support
operations in areas inaccessible by road. Special weather forecasts indicating the spread of the
floods enabled effective planning and the diversion of helicopters to places most in need, and
hence saved lives, time and money.
16. WFP strives to balance the principles of humanity, neutrality and impartiality. The
interventions in Libya and Somalia were testing, but they reaffirmed that mutual understanding,
communication and capacity development are central to meeting WFP’s humanitarian
imperative.
17. Indicators reported by projects under Strategic Objective 1 in 2011 showed an overall
weighted improvement of 64 percent, reconfirming WFP’s strength in responding rapidly to
crises. This indicates good progress in reducing the number of food-insecure people in
WFP-assisted communities: 56 percent of projects that reported on the indicator “household
food consumption score” in acute emergencies showed improvement, which means that the
consumption of 17 million crisis-affected beneficiaries had improved.
18. A number of large WFP operations reported negative trends in food consumption,
however, reflecting a deterioration in the food security situation as a result of factors such as
increased conflict and displacement, food price increases and poor harvests. This highlights the
inherent risks and fragility in many of WFP’s operating environments: food assistance can
alleviate acute hunger at the onset of emergencies, but it is more difficult to address chronic
problems. The focus on risk management is helping WFP to mitigate the impact of such
contextual risks, but experience shows that residual risks remain an impediment to achieving
objectives.
19. Indicators reported by projects under Strategic Objective 2 showed an overall weighted
improvement of 68 percent during 2011. Two thirds of the projects that reported on the indicator
“household food consumption score” showed improvement, which means that consumption
improved for 1.9 million people. Five projects reported an increase in the number of productive
assets used by communities due to WFP’s intervention.
WFP’s Response – Transition
20. Transition settings are characterized by hope for the future and high expectations of
improved living conditions as a result of interventions in the aftermath of crisis. WFP’s extensive
field presence, its ability to mobilize resources rapidly, its technical and logistics capacity, and
its information and assessment systems give it a comparative advantage in promoting recovery
and development initiatives while meeting basic humanitarian needs after a crisis. WFP’s
presence and its food assistance constitute a “peace dividend” in immediate post-conflict
ANNUAL PERFORMANCE REPORT FOR 2011 | WFP/EB.A/2012/4*
WORLD FOOD PROGRAMME | 14
environments; in cases such as South Sudan and Kyrgyzstan, support for peacebuilding is an
objective of the WFP programme of work.
21. Performance in transition settings may be measured under Strategic Objectives 3 and 4.
Indicators reported by projects under Strategic Objective 3 showed a weighted improvement of
80 percent during 2011. Of the projects that reported on the indicator “household food
consumption score”, 80 percent showed improvement, which means that the consumption of
2.6 million people was improved.
22. Indicators reported by projects under Strategic Objective 4 showed a weighted
improvement of 62 percent during 2011, indicating progress in reducing chronic hunger and
undernutrition.
Management Issues
Securing resources
23. WFP’s revenue fell by US$530 million – 12 percent – in 2011 to US$3.74 billion. The decline
in contribution revenue can be attributed in part to a reduction in the scale of emergencies: in
2010, WFP responded to large-scale emergencies in Haiti, Pakistan and the Sahel compared with
one large-scale emergency in 2011 in the Horn of Africa. Contribution revenue covered
60 percent of WFP’s estimated needs of US$6 billion in 2011, down from 62 percent in 2010 and
65 percent in 2009. To ensure adequate financial support, WFP continues to engage governments
and the private sector in developing multi-year flexible contributions, new funding channels
and twinning arrangements.
24. There was a greater diversity of funding sources in 2011. WFP received contributions from
93 funding sources, including 87 government donors; 31 host governments – six more than in
2010 – contributed US$60 million – 2 percent – of 2011 contributions. Emerging economies
increased their contributions by 26 percent from 2010, totalling US$228 million. WFP received
US$196 million from multi-donor sources in 2011: the United Nations Central Emergency
Response Fund alone was the seventh largest donor, with US$126 million in funding.
25. WFP repositioned itself to promote private-sector partnerships during 2011 with a view to
developing innovative partnerships in the markets with the greatest opportunities. Donations
from the private sector reached US$93.7 million, making it WFP’s tenth-largest donor. WFP’s
global online donation is also growing rapidly: US$7 million was raised in 2011. WFP’s e-mail
supporter base grew 178 percent in 2011; Facebook and Twitter followers increased three-fold.
Stewardship
26. WFP continues to implement optimum standards of internal control under the
Strengthening Managerial Control and Accountability initiative. In March 2012, WFP became
one of the few United Nations organizations to provide a formal statement on the effectiveness
of internal control with its annual accounts.
27. WFP’s performance and risk management processes are firmly established, but they need
time to mature. WFP has refined the Management Results Framework for use in 2012 and
beyond and improved capacities for performance and risk management at all levels. It is now in
a position to implement more rigorous results-based management and to address the related
risks.
ANNUAL PERFORMANCE REPORT FOR 2011 | WFP/EB.A/2012/4*
WORLD FOOD PROGRAMME | 15
28. Challenges remain in terms of ensuring the safety and well-being of WFP staff. In 2011,
four WFP national staff members lost their lives in the line of duty as a result of armed attacks in
Ethiopia, Somalia and South Sudan, two of which occurred on roads and one at a programme
site. WFP’s staff work in operational environments with significant health and psycho-social
risks: the medical services and the Staff Counselling Unit continue to help staff deal with these
risks.
Learning and innovation
29. The 2011 annual report of the Office of Evaluation highlights WFP’s “can do” attitude, its
committed staff and its capacity for innovation. Work to improve knowledge management and
learning from innovations include the use of lessons-learned reviews at the end of any corporate
emergency, enhancing disaster-preparedness capabilities through simulations and establishing
focal points to analyse and follow up oversight recommendations.
30. Enrolment rates in WFP’s management training and assessment centres are high; WFP has
also expanded its on-line learning management system to cover 300 e-learning courses and
460 video simulations.
31. Investment in information technology increased significantly in 2011 to 9.7 percent of
corporate expenditure, returning to the investment levels of 2007/08, when WINGS II was
established. WFP continued the four information technology initiatives reported in the 2010
Annual Performance Report: i) Foodlink, which is improving WFP’s telecommunications;
ii) Connect, which integrates e-mail, voice and video into one service; iii) the
Emergency Preparedness Integration Centre, which increases operational response capability;
and iv) One Truth, which increases transparency and management capability through an
easy-to-use consolidated record of operational information. WFP started to develop an
invoice-tracking system in 2011 with a view to eliminating paper-based processes and
improving efficiency.
Internal business processes
32. WFP continues to allocate resources in response to identified needs: 83 percent of its
resources were allocated to countries that accounted for four fifths of total requirements, a minor
decrease from 85 percent in 2010. In line with the Board’s decision that at least 90 percent of
multilateral funds for development should be allocated to the poorest countries, 96 percent of
such resources were allocated to these countries in 2011.
33. In 2011, WFP procured 2.4 million mt of food valued at US$1.23 billion in 87 countries, of
which 71 percent was purchased in developing countries. WFP continues to apply its import
parity approach2 with a view to purchasing food as efficiently as possible: this led to savings of
between 17 percent and 28 percent of the cost of purchasing food in 2011, totalling
US$55 million.
34. WFP procured 400,000 mt of assorted foods worth US$200 million in 2011, for example by
purchasing nutritious products through the Forward Purchase Facility. WFP also started to
implement a new approach to forward planning and purchasing that focuses on commonly used
2 This compares local and international sourcing costs and delivery times for food. Each purchase request is evaluated
with reference to cost and delivery time to determine whether local or international procurement is preferable,
provided quality is maintained. Where time is not an issue, the source with the lowest costs is chosen for major
purchases.
ANNUAL PERFORMANCE REPORT FOR 2011 | WFP/EB.A/2012/4*
WORLD FOOD PROGRAMME | 16
logistics corridors: in the first six months, 21 projects benefited from deliveries that arrived on
average 52 days earlier than under conventional processes.
35. Humanitarian personnel must have access to information technology and communications
facilities at all times. A measure of the effectiveness of WFP’s information technology systems is
that full services were available in 99.8 percent of WFP offices in 2011, as in 2010.
36. Resource shortfalls caused problems for several WFP operations. Most country offices
facing significant shortfalls continued to support targeted beneficiaries by reducing the amount
of food provided for individuals. Actual food distributions were 68 percent of planned levels,
but WFP nonetheless managed to provide food for 106 percent of the planned beneficiaries.
Resource shortfalls and pipeline breaks were associated with deteriorations in food security, and
in some countries food shortages resulted in a decline in the “household food consumption
score” indicator.
Operational efficiency
37. The average cost per beneficiary has remained stable over the past four years. Minor
fluctuations from year to year are caused by changing project requirements; the slight increase
in 2011 is consistent with the goal of providing more nutritious and therefore more costly foods.
38. Driving down costs and increasing efficiency can best be tackled by looking for savings in
all aspects of WFP’s operations in a particular environment. An example cost saving and
enhanced efficiency in this Annual Performance Report is the Sudan regional bureau. Between
2009 and 2011, the bureau reduced its emergency operation budget by 34 percent from
US$869 million to US$572 million and cut the cost per beneficiary by 44 percent from US$140 to
US$78 by rationalizing beneficiary caseloads and reducing or eliminating costs in all its
operations.
39. The Country Strategy process continues to drive planning at the country level: 26 countries
are involved, and the number of approved documents doubled in 2011. A review concluded that
the process contributes significantly to enhanced collaboration between WFP and its
stakeholders.
40. A measure of operational efficiency is WFP’s capacity to work with partners to leverage its
expertise in support of development actors. Collaboration among the Rome-based agencies
increased during 2011 and is reflected in the joint leadership by WFP and the Food and
Agriculture Organization of the United Nations of the food security cluster; the two
organizations also collaborated in 86 projects in 50 countries in agriculture, education, food
security thematic groups and assessments. WFP and the International Fund for Agricultural
Development collaborated in 11 projects in nine countries in food-for-work, food-for-training
and micro-credit programmes.
Looking Forward
41. By far the most significant challenge facing WFP and its beneficiaries is the likelihood of
sustained high food and oil prices. WFP’s purchasing power declined by 25 percent in 2011; and
the fact remains that without a significant increase in funding its purchasing power in 2012 will
be significantly less than it was in 2010 and 2011 if prices remain high.
ANNUAL PERFORMANCE REPORT FOR 2011 | WFP/EB.A/2012/4*
WORLD FOOD PROGRAMME | 17
42. Innovative strategies are needed to generate more predictable funding. WFP must
demonstrate more clearly how its work meets donor priorities: a visibility enhancement project
is under way to demonstrate WFP’s strengths in thematic areas such as nutrition, school feeding,
Purchase for Progress, cash and vouchers, capacity development and climate change adaptation.
43. There is widespread acceptance that WFP is putting in place the right tools to make the
transformation from food aid to food assistance. The process of scaling them up, however, is
linked to WFP’s ability to develop high quality programmes that use the right mix of food-aid
and food-assistance tools. Work is under way to address this issue through improved
monitoring and enhanced self-evaluation and training for programme staff.
44. Five themes will guide WFP’s work from 2012. WFP must:
continue to increase its efficiency and effectiveness and provide better value for money,
and demonstrate that it is doing so;
make risks more visible and seek stakeholders’ support by sharing information about
contextual, programmatic and operational risks;
enhance its emergency preparedness and response capacity under the Preparedness and
Response Enhancement Programme;
review workforce skills to ensure that the rights skills are available in the right places for
making the transition to a food-assistance approach; and
increase transparency and accountability by improving reporting on performance and
developing the Strategic Plan (2014–2017).
45. The challenges for WFP are to continue to help countries to achieve Millennium
Development Goal 1; to contribute effectively to alleviating hunger; and to adequately respond
to emergencies in the Horn of Africa, the Sahel, Afghanistan and Pakistan despite resource
constraints. WFP’s commitment to improved performance and risk reporting highlights the need
to enhance its preparedness, efficiency and effectiveness. WFP will strive to meet such
challenges with its characteristic determination.

ANNUAL PERFORMANCE REPORT FOR 2011 | WFP/EB.A/2012/4*
WORLD FOOD PROGRAMME | 18
ANNUAL PERFORMANCE REPORT FOR 2011 | WFP/EB.A/2012/4*
WORLD FOOD PROGRAMME | 19
PART I – INTRODUCTION
46. The Annual Performance Report (APR) is an accountability document. It assesses WFP’s
performance in 2011 in terms of effectiveness and efficiency in meeting the needs of the most
vulnerable people, and progress towards the objectives of the Strategic Plan (2008–2013). It looks
at what WFP did and how it supported its achievements, as shown in Diagram 1.
47. Determining humanitarian outcomes and impacts is not the sole domain of WFP; it also
involves governments and partners. Outcomes and impacts are shared by United Nations
agencies, other humanitarian actors and governments, and the results reported in this APR
should be understood in that context.
48. In 2011/12 the Secretariat carried out a mid-term review of the Strategic Plan (2008–2013)
and will report the results to the Board’s 2012 Annual Session. The report and this APR draw on
similar data, but like its predecessors the APR reports on progress during 2011 in terms of the
Strategic Objectives and the Management Result Dimensions.
49. The fourth High Level Forum on Aid Effectiveness in Busan in December 2011 called for
development partners to “strengthen [their] efforts to achieve concrete results”, noting that this
“involves better managing for results, monitoring, evaluating and communicating progress”.
The discussions were informed by the results of a study by WFP and the United Nations
Development Programme (UNDP) under the auspices of the High-Level Committee on
Management (HLCM), with support from The Boston Consulting Group (BCG). The team
worked with United Nations agencies, private-sector organizations, non-governmental
organizations (NGOs), the Organisation for Economic Co-operation and Development (OECD)
and donors to assess various approaches for alignment with United Nations results reporting
requirements. The four principles of results reporting defined by the team – mutual
accountability, transparency, efficient use of resources and effectiveness – which were endorsed
by the HLCM. WFP will apply these principles in its performance-management systems with a
view to more comprehensive analysis of outcomes and impacts to supplement its reporting on
inputs and outputs. Even though progress has been made, developing a robust
performance-management system in 75 countries and 212 projects is a continuing challenge that
requires time and resources.
50. WFP reported significant progress in 2011 against four Strategic Objectives: 1 – Save lives
and protect livelihoods in emergencies; 2 – Prevent acute hunger and invest in disaster
preparedness and mitigation measures; 3 – Restore and rebuild lives and livelihoods in
post-conflict and post-disaster or transition situations; and 4 – Reduce chronic hunger and
undernutrition. These accounted for 98 percent of 2011 expenses.
51. This is the first year in which WFP has been able to report significant progress against
Strategic Objective 4 and in which its projects have enough indicators to report that progress is
also being made in Strategic Objective 5 – Strengthen the capacities of countries to reduce
hunger, including through hand-over strategies and local purchase.
ANNUAL PERFORMANCE REPORT FOR 2011 | WFP/EB.A/2012/4*
WORLD FOOD PROGRAMME | 20
52. WFP is continuing to refine its Management Results Framework for reporting on
performance indicators. Targets and internal benchmarks for the five Management Result
Dimensions are based on the indicators used in the 2010 APR, augmented by experience gained
in better managing and measuring each dimension. The achievements of 2011 are compared
with those of 2010 and earlier years. Most reported indicators showed improved performance.
53. But there is no sign that the challenges facing the hungry poor are declining. Natural
disasters, insecurity, conflict and rising food and fuel prices continue to create social and
economic distress for hundreds of millions of people. Such crises continue to underline the
fragility of coping mechanisms and the needs for more effective and efficient humanitarian
assistance and more investment to enhance resilience. WFP is committed to providing services
to increase the speed of delivery and the efficiency of humanitarian action, and it continues to
improve its tools to provide more effective food assistance. In 2011 WFP focused on ensuring
that the right food was provided for the right people at the right time and in the right place, and
worked with partners to ensure that its activities are coordinated and support governments’
priorities.
Diagram 1. WFP’s Mission
Ho
w?
(MR
D)
Wh
at?
(SR
F)
Securing Resources
Stewardship
Learning and Innovation
Internal Business Processes
Operational Efficiency
WFP mission
SO 2SO 1 SO 3 SO 4 SO 5
ANNUAL PERFORMANCE REPORT FOR 2011 | WFP/EB.A/2012/4*
WORLD FOOD PROGRAMME | 21
Strategic Context
54. Today’s world has many risks affecting those least able to handle them:
food prices were at an all-time high during 2011, with no sign of any significant
reduction;
209 million people were affected by natural disasters of immense economic cost in 2011;
the global economy is struggling to emerge from recession;
1.5 billion people live in countries affected by repeated cycles of political instability; and
safe humanitarian space is shrinking.
55. Some of these risks affect rich and poor people alike – but they have a disproportionate
impact on vulnerable groups. One person in seven of the world’s population is undernourished3
and a high proportion of women and children are malnourished. Safety margins are narrow and
easily breached for those struggling to survive on less than US$1.25 a day.
56. This is the environment in which WFP operates and in which its performance must be
understood.
Food prices remain at an all-time high.
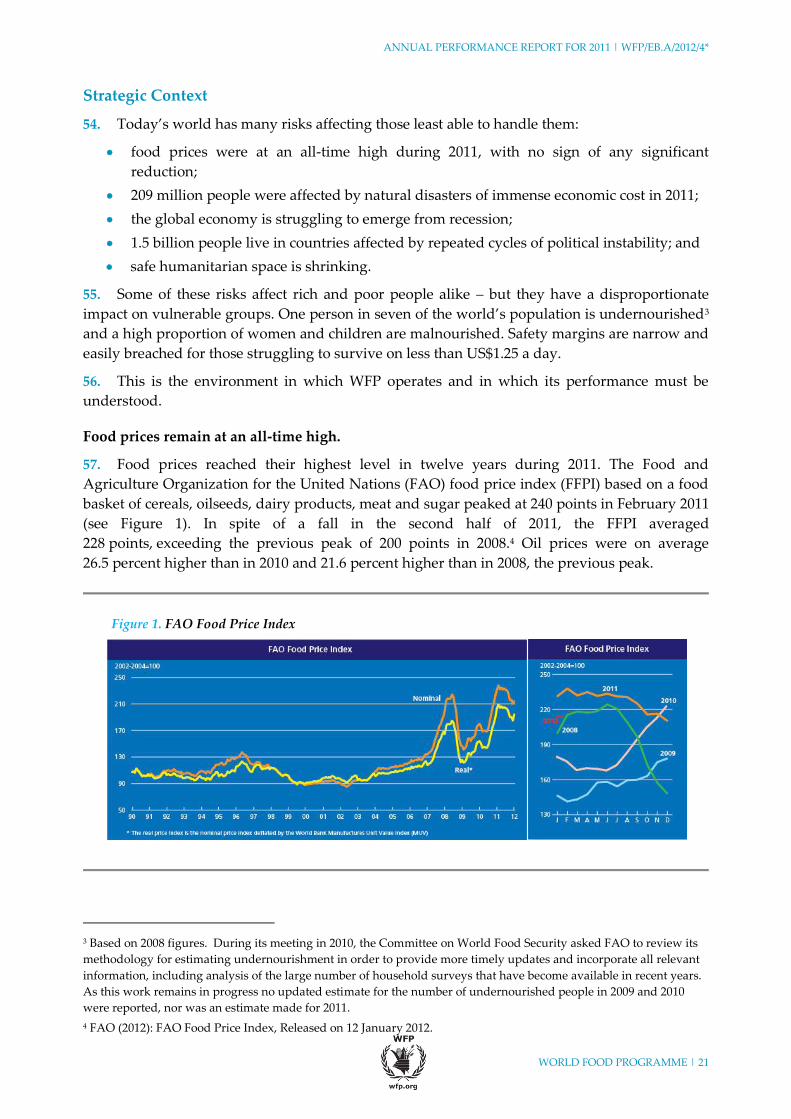
57. Food prices reached their highest level in twelve years during 2011. The Food and
Agriculture Organization for the United Nations (FAO) food price index (FFPI) based on a food
basket of cereals, oilseeds, dairy products, meat and sugar peaked at 240 points in February 2011
(see Figure 1). In spite of a fall in the second half of 2011, the FFPI averaged
228 points, exceeding the previous peak of 200 points in 2008.4 Oil prices were on average
26.5 percent higher than in 2010 and 21.6 percent higher than in 2008, the previous peak.
Figure 1. FAO Food Price Index
3 Based on 2008 figures. During its meeting in 2010, the Committee on World Food Security asked FAO to review its
methodology for estimating undernourishment in order to provide more timely updates and incorporate all relevant
information, including analysis of the large number of household surveys that have become available in recent years.
As this work remains in progress no updated estimate for the number of undernourished people in 2009 and 2010
were reported, nor was an estimate made for 2011.
4 FAO (2012): FAO Food Price Index, Released on 12 January 2012.
ANNUAL PERFORMANCE REPORT FOR 2011 | WFP/EB.A/2012/4*
WORLD FOOD PROGRAMME | 22
58. Increases in global food prices reduced WFP’s purchasing power in 2011. WFP spent
US$1.23 billion on food in 2011 compared with US$1.25 billion in 20105 – but the volume of food
purchased fell by 25 percent from 3.2 million mt to 2.4 million mt. The following points should
be borne in mind:
Food prices have increased sharply in some countries and affected vulnerable people in
different ways. A review of the 2006–2008 global food price crisis in terms of the number
of undernourished people showed variations across regions and countries; small
import-dependent countries, especially in Africa, were affected most. Some countries
insulated themselves through restrictive trade policies, but such policies increased price
volatility worldwide.
The impact of high and volatile food prices on household food security and nutrition
varies according to type of food, policies that affect the way price is transmitted from
world to domestic markets and the demographic and production characteristics of
different households.6
59. Changes in food prices have the biggest effect on the poor, who either spend most of their
income on food or derive much of their income from engaging in new economic activities,
selling assets or borrowing. This affects in particular small-scale farmers, agricultural labourers
and net food buyers such as landless or land-poor people.
60. Whenever possible, WFP provides light nutritious foods with less pronounced flavour and
sources food locally or from nearby regions to minimize environmental and transport costs and
benefit local and regional economies. Special nutritious foods are used to treat a specific
problem in well-defined target groups such as young children. The proportion of these foods in
the total purchased increased from 9.9 percent in 2010 to 12.8 percent in 2011. This is expected to
increase in future with better planning and forward purchasing.
2011 was the costliest year in history in terms of damage caused by natural disasters.
61. The United Nations International Strategy for Disaster Reduction recorded
302 human-impact disasters in 2011 that affected 206 million people and caused 29,500 deaths
and damage estimated at US$366 billion.7 The earthquake and tsunami in Japan in March was
the biggest disaster, causing 24,000 deaths and damage worth US$210 billion. Flooding was
significant for the second year running, affecting 106 million people; 63 million people were
affected by drought and 34 million people by tropical storms.
62. WFP provided 600,000 mt of relief assistance valued at US$610 million for victims of
natural disasters – 18 percent of total 2011 assistance. The largest disaster responses were to the
drought in the Horn of Africa and to flooding in Pakistan and Cambodia. WFP also
supplemented the Government’s relief work following the Japan earthquake by providing
logistics and coordination support.
5 These figures are in line with the scenario presented during the first quarterly operational briefing to the Board in
February 2011.
6 FAO. 2011. The State of Food Insecurity, 2011. Rome.
7 The Office of United States Foreign Disaster Assistance/Centre for Research on the Epidemiology of Disasters
International Disaster Database www.em-dat.net and the Université Catholique de Louvain, Belgium. The data
include complex disasters, droughts, earthquakes, extreme temperatures, floods, landslides, storms, volcanoes and
wildfires.
ANNUAL PERFORMANCE REPORT FOR 2011 | WFP/EB.A/2012/4*
WORLD FOOD PROGRAMME | 23
The world economic outlook provides little encouragement for the hungry poor.
63. The global financial crisis is causing losses and dislocation in industrialized countries, but
in many developing countries it is pushing people deeper into poverty. The crisis is being
transmitted to the poorer countries through declining exports and shrinking remittances from
citizens working overseas.
Repeated cycles of political instability cause human misery and disrupt development.
64. The World Bank estimates that 1.5 billion people live in countries affected by repeated
cycles of political instability. This results in human misery and disrupts development: a civil
unrest costs the average developing country 30 years of GDP8 growth. Countries often face
repeated waves of instability: 90 percent of conflicts in the last decade occurred in countries that
had previously endured a civil war. A crucial factor in breaking these vicious cycles is the
enhancement of governance and legitimate national institutions to provide security and alleviate
international stresses, which increase the risk of conflict.
65. Socio-political developments during 2011 included the uprising in Tunisia that spread to
other countries in North Africa and the Middle East, resulting in regime change in Egypt and
conflict in Libya, with serious implications for the Maghreb region. The Syrian Arab Republic
and Yemen were also involved in protracted crises related to high levels of insecurity. The
electoral stalemate in Côte d’Ivoire culminated in a civil war; South Sudan became an
independent state with its own insecurity problems and rebellions, and conflict increased in
Afghanistan, Pakistan and Somalia and were exacerbated by climatic shocks.
Safe humanitarian space is shrinking.
66. Four WFP staff were killed and seven injured in the line of duty in 2011 as a result of
violence. WFP’s response strategies included: i) hiring security staff; ii) more security training
and crisis management; iii) development of security protocols; iv) improved context-related
equipment for staff; and v) basing field-level decisions on risk-management methods and tools.
8 Gross domestic product
ANNUAL PERFORMANCE REPORT FOR 2011 | WFP/EB.A/2012/4*
WORLD FOOD PROGRAMME | 24
WFP’s Response
WFP continues to reach millions of people in need with a wider range of food-assistance
tools.
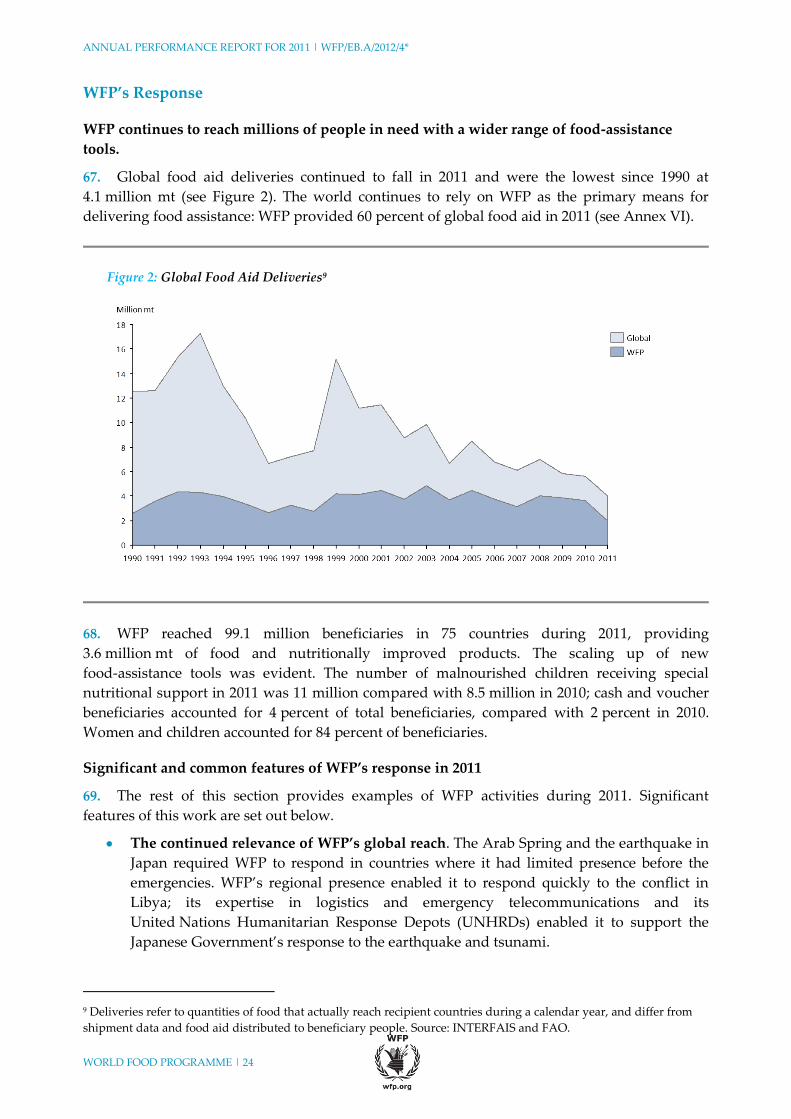
67. Global food aid deliveries continued to fall in 2011 and were the lowest since 1990 at
4.1 million mt (see Figure 2). The world continues to rely on WFP as the primary means for
delivering food assistance: WFP provided 60 percent of global food aid in 2011 (see Annex VI).
Figure 2: Global Food Aid Deliveries9
68. WFP reached 99.1 million beneficiaries in 75 countries during 2011, providing
3.6 million mt of food and nutritionally improved products. The scaling up of new
food-assistance tools was evident. The number of malnourished children receiving special
nutritional support in 2011 was 11 million compared with 8.5 million in 2010; cash and voucher
beneficiaries accounted for 4 percent of total beneficiaries, compared with 2 percent in 2010.
Women and children accounted for 84 percent of beneficiaries.
Significant and common features of WFP’s response in 2011
69. The rest of this section provides examples of WFP activities during 2011. Significant
features of this work are set out below.
The continued relevance of WFP’s global reach. The Arab Spring and the earthquake in
Japan required WFP to respond in countries where it had limited presence before the
emergencies. WFP’s regional presence enabled it to respond quickly to the conflict in
Libya; its expertise in logistics and emergency telecommunications and its
United Nations Humanitarian Response Depots (UNHRDs) enabled it to support the
Japanese Government’s response to the earthquake and tsunami.
9 Deliveries refer to quantities of food that actually reach recipient countries during a calendar year, and differ from
shipment data and food aid distributed to beneficiary people. Source: INTERFAIS and FAO.
ANNUAL PERFORMANCE REPORT FOR 2011 | WFP/EB.A/2012/4*
WORLD FOOD PROGRAMME | 25
The importance of new technology in the fight against hunger. WFP used several new
technologies in 2011, from geographic information system mapping to mobile banking,
which helped it to increase the efficiency and effectiveness of its responses to emergency
and development challenges.
The crucial role of partnerships. The past year demonstrated once again the value of
effective partnerships in humanitarian work. WFP’s partnerships were more extensive
than ever before in a context of volatile food prices, emergencies and persistent hunger.
The culture of working with others is now ingrained in WFP: the first question in an
emergency is often “Who can WFP work with to respond effectively?” The effectiveness
of partnerships is evident in the cluster approach to emergency telecommunications,
logistics and food security, where WFP shares the lead with FAO. WFP has also
established new partnerships for research and the development of best practices in
nutrition, Purchase for Progress (P4P) and school feeding. A notable event in March 2011
was the launch of a centre of excellence on hunger as a joint partnership between WFP
and the Government of Brazil.
The importance of rigorous needs assessment. In 2011 WFP completed 11 nationwide
food security assessments, 29 emergency assessments, 20 market assessments,
20 multi-agency assessments, and 30 country food security monitoring reports. These
were used to develop 50 programme operations, inform responses and target
food insecure households. The August 2011 evaluation report Enhancing Capacities in
Food Security and Response Analysis Project (ENCAP) found that most operations were
adequately based on assessment and analysis and that programme activities were
generally relevant to identified needs.
The need for more systematic consideration of risk. The evaluation of the
Paris Declaration10 concluded that risk aversion was an obstacle to progress, particularly
in fragile states. Principles for addressing this issue established at the High Level Forum
on Aid Effectiveness in Busan highlight the need for organizations to be “smart risk
takers, weighing risks against desired outcomes, and the risk of not engaging” and to
“confront and manage risks jointly with all partners”. Organizations should also be more
transparent in communicating risks and benefits. During 2011, WFP shared its
risk-management practices with stakeholders and worked with others on harmonization,
in line with the Busan principles.
The drive for innovation. WFP continues to develop innovative approaches to food
assistance and to adapt its practices to achieve optimum results. Learning opportunities
in 2011 included: i) a mid-term evaluation of P4P that concluded that it should continue
in its pilot form until 2013; and ii) an evaluation of the extent to which school feeding
programmes respond to the Strategic Plan (2008–2013), the international context and aid
effectiveness issues.
Humanitarian principles at the forefront of WFP operations. WFP seeks to apply the
principles of humanity, neutrality and impartiality. The interventions in Libya and
Somalia tested these, but also reaffirmed that mutual understanding, communication and
capacity development are central to achieving WFP’s humanitarian aims.
10 Oxford Policy Management/IDL (2008). Evaluation of the Implementation of the Paris Declaration: Thematic Study
available at http://www.dfid.gov.uk/aboutdfid/evaluation.asp and http://www.oecd.org/dac/evaluationnetwork
ANNUAL PERFORMANCE REPORT FOR 2011 | WFP/EB.A/2012/4*
WORLD FOOD PROGRAMME | 26
Drought and famine in the Horn of Africa
70. The Horn of Africa crisis witnessed one of the most robust donor responses in WFP's recent
history. By the end of December 2011, 45 donors had provided US$650 million towards WFP's
emergency responses in Djibouti, Ethiopia, Kenya, Somalia and Uganda. Traditional donors
increased their funding, governments in the region stepped up support and others provided
their first-ever contributions to the region. Most support was in the form of cash, but many
donors also provided in-kind contributions and services that supported WFP's supply lines and
capacity to deliver. The private sector provided flexible funding and timely surge capacity in
logistics and food production. To translate donors’ support into timely action, WFP made
extensive use of its advance financing mechanisms and the new Forward Purchase
Facility (FPF). In Ethiopia, WFP borrowed cereals from the Emergency Food Security Reserve
and non-cereals from NGO partners.
71. WFP’s operational response was significant and immediate, mobilizing 130 staff from other
locations to expand operations quickly and assume leadership of the emergency cluster. This
surge capacity was provided for nutrition, pipeline management, programming, procurement,
logistics, information management and administration. New field offices were opened in
Ethiopia and Kenya to respond to the influx of refugees.
72. WFP had to surmount logistics obstacles such as lack of access to famine-affected areas in
Somalia by establishing new overland corridors and creating staging areas along the
Somalia border; 2,300 mt of special supplementary food were transported in 100 airlifts, which
included air services provided by UPS, TNT Worldwide Courier Delivery Service and Korean
Air. To ensure regular and predictable food deliveries and to reduce costs, 32 ships were
chartered between July and December.
73. WFP worked with a number of humanitarian partners. Ships of the European Union
Naval Force escorted vessels chartered by WFP to Somali ports, and WFP operated passenger
flights to support the refugee operation in Dolo Ado in Ethiopia. As the logistics cluster lead,
WFP made its time-chartered vessel used between Mogadishu and Bossaso available to the
humanitarian community and provided common transport services. WFP transported 1,100 mt
of urgent humanitarian cargo to Somalia in 2011 for eight international NGOs and five United
Nations agencies.
74. Communications technology was crucial: effective emergency responses depend on reliable
communications with the many organizations involved. In the Horn of Africa emergency:
WFP sent regular early-warning alerts during the ten months before the declaration of
the emergency in the region.
WFP used the geographic information system (GIS) for daily updates on logistics routes,
camps and food security. WFP created maps of small settlements to support emergency
relief and a set of maps based on remotely sensed data using the Normalized Difference
Vegetation Index (NDVI)11 to enable users to monitor the development of the drought
and source food locally where possible.
11 NDVI increases during wet seasons and decreases during dry seasons but gives an image representing the 20-year
average. This indicator is used as a proxy for agricultural productivity.

ANNUAL PERFORMANCE REPORT FOR 2011 | WFP/EB.A/2012/4*
WORLD FOOD PROGRAMME | 27
The emergency telecommunications cluster (ETC) was activated to ensure that
communications services were in place when relief workers arrived. The cluster
provided wireless internet connectivity in remote areas, expanded the areas covered by
very high frequency radio, secured additional radio frequencies to relieve network
congestion, installed additional very-small-aperture terminals and obtained permission
from the authorities to share bandwidth in Ethiopia.
75. WFP expanded its operations to support 8.7 million people affected by drought and
conflict, 1.3 million of whom were in Somalia.12 It targeted 10.9 million people of the estimated
13 million in the region affected by the drought; governments and other partners supported the
remainder. WFP provided life-saving nutritional support for 556,000 refugees in Kenya and
280,000 refugees in Ethiopia, mainly Somalis. Targeted supplementary feeding (TSF) and
blanket supplementary feeding (BSF) were used where necessary to save lives in line with the
first 1,000 days approach. Initial airlifts of ready-to-use supplementary foods and high-energy
biscuits saved lives, especially among the mobile population in Somalia.
North Africa uprisings
76. The political changes in North Africa were a challenge to WFP and the humanitarian
community. The uprising in Libya led to a humanitarian crisis in which WFP had to contend
with a shortage of international partners and limited national capacity to respond to the needs
that emerged. As a result WFP’s operation was a mix of saving lives and building capacity.
WFP’s leadership in the food security and logistics clusters focused on building the capacity of
the Libyan Red Crescent and coordination with LibAid and local councils, an approach that
enabled it to alleviate gaps in the food supply and meet the food needs of people displaced or
otherwise affected by the conflict.
77. WFP mobilized resources quickly to meet emerging needs: US$49.3 million was raised for
regional food security activities and US$10.8 million for logistics, including UNHAS and ETC
activities in Libya. The funds were raised through regular inter-agency donor appeals and
bilateral meetings. Donors attended most of WFP’s cluster meetings on food security,
livelihoods, logistics and ETC; in combination with regular external reporting and donor briefs,
this ensured that donors were kept informed on WFP activities.
78. WFP rapidly reinforced its presence in Benghazi and placed teams at the borders with
Egypt and Tunisia to meet the needs of individuals leaving Libya; it also distributed food
throughout Libya. A regional emergency project provided support to the end of February 2012.
By the end of 2011, WFP had reached 1.4 million beneficiaries in Egypt, Libya and Tunisia with
31,563 mt of food.
79. WFP had to overcome operational constraints such as lack of access to areas deemed unsafe
for a field presence, which limited overland operations to cities west of Benghazi. A no-fly zone
was established for commercial aircraft. In response, WFP:
chartered a ship to transport humanitarian cargo and aid workers, linking Malta and
Tunisia with Libyan ports for four months, shipping 18,100 mt of goods for
34 organizations and securing storage space in Libya for the humanitarian community;
12 In 2011, WFP supported 3.5 million drought-affected people and 280,000 refugees in Ethiopia; 2.2 million drought-
affected people and 556,000 refugees in Kenya; 130,000 drought-affected people and refugees in Djibouti; and
700,000 drought-affected people in Uganda.
ANNUAL PERFORMANCE REPORT FOR 2011 | WFP/EB.A/2012/4*
WORLD FOOD PROGRAMME | 28
utilized UNHAS to fill the gap caused by a lack of commercial aircraft, transporting
4,785 people from 153 agencies between Malta, Cairo and five Libyan cities; and
enlisted local partners such as the Libyan Red Crescent, the Boy Scouts and LibAid to
help to deliver food to conflict and post-conflict zones.
80. The need for humanitarian support in Libya declined with the formation of the interim
government. WFP and other agencies are phasing out relief activities and shifting to recovery
and development support for the Government. WFP will also work with Libyan organizations
to ensure a functional system for providing basic foods and cash and vouchers.
The Emergency Preparedness and Response Package (EPRP)
Emergency preparedness is a crucial investment against disasters: it buys time, reduces the risk of a bad situation
becoming worse and enables WFP to use its resources efficiently. As operational contexts become more hazardous
and demanding, EPRP offers solutions and guides country offices as they step up emergency preparedness and
response capabilities from risk identification to the crisis itself.
By the end of 2011, EPRP had been tested and rolled out in twenty country offices, where it received an
overwhelmingly positive reception. Field staff welcomed the change to a practical, action-oriented approach with
clear tasks, roles and responsibilities.
For the crises in Libya, the Syrian Arab Republic and the Horn of Africa, a new concept of operations (CONOPS) was
developed as part of EPRP. This is useful as a concise communication to WFP staff and humanitarian actors of WFP’s
response to emergencies, and it enables rapid and coherent action as the situation evolves.
Pakistan flooding
81. A year after the 2010 floods, Sindh and Balochistan provinces again experienced extensive
monsoon-related flooding. An estimated 5.8 million people were affected, 3 million of whom
were in need of immediate food assistance.
82. WFP began providing life-saving monthly food rations in September 2011, targeting
households headed by women. By the end of the year it had reached 3.5 million people,
exceeding the original target as the flooding continued. In cooperation with the humanitarian
community, the Government and partners, WFP responded rapidly and efficiently and
distributed 57,000 mt of food per month.
83. The logistics challenges included badly damaged roads and infrastructure, insecurity and
limited access to remote areas. WFP deployed specialist logistics officers to the field and
established ten logistics hubs in the affected areas; it also deployed 14 boats to support
operations in areas inaccessible by road. Ten large, strategically placed warehouses were
established, and storage and transport were offered to the humanitarian community free of
charge.
84. WFP’s advance financing mechanisms bridged the gaps between the pledging of
commitments and actual receipt of funds, preventing breaks in the food pipeline and enabling
WFP to be among the first to respond.
85. Of the food procured for the 2011 EMOP, 66 percent was purchased from local or regional
suppliers. This helped to reduce delivery times and costs and contributed to the national
economy. Investments in national food processing industries will help to develop local
capacities to produce special supplementary foods for preventing and treating malnutrition
among children.
ANNUAL PERFORMANCE REPORT FOR 2011 | WFP/EB.A/2012/4*
WORLD FOOD PROGRAMME | 29
Flooding in Cambodia
86. In 2011, Cambodia experienced its worst flooding in ten years: 1.6 million people were
affected, of whom 250 were killed and 240,000 were forced from their homes. The rice crop was
seriously affected, with 265,000 ha of cropland damaged and 10 percent of the crop destroyed,
leading to a sharp rise in the price of rice. The situation will continue to be monitored.
87. WFP provided food assistance for 125,000 vulnerable people in 11 of the most severely
affected provinces. A 12-month EMOP was launched to deliver food assistance for up to
150,000 vulnerable people in the flood zone, initially for emergency needs and later to assist with
reconstruction and recovery.
WFP response to the Japan earthquake
On 11 March 2011 a magnitude 9.0 earthquake off the north-eastern coast of Japan created a tsunami that caused
many deaths and extensive damage. Thousands of people were injured, evacuated or missing, and millions were
affected by lack of electricity, water and transport. Tsunami warnings were broadcast to countries around the Pacific.
The Japanese Government swiftly mobilized its disaster, health and safety organizations and requested WFP to
provide logistics and coordination support for the four-month relief effort. Supplementary rations were distributed to
70,000 people in evacuation centres for a week after the earthquake.
WFP’s response had some novel features: i) the operation was fully funded by the private sector, with the
Japan Association for WFP leading the fundraising; ii) WFP deployed Japanese staff from several locations to provide
operational, logistics, capacity development and management support.
WFP benefited from the technical expertise of its strategic partners: the logistics emergency team supported by TNT,
UPS, Damco and Maersk facilitated worldwide shipping and transport and augmented WFP’s capacity to deliver
relief items to the affected areas.
Use of cash and voucher transfers in WFP projects
88. WFP’s cash-based interventions increased five-fold in 2011 from 2009 levels. At the end of
the year 36 projects with a combined transfer value of US$213 million targeted 8 million
beneficiaries, compared with approved budgets of US$138 million in 2010 and US$41 million in
2009. WFP expects cash-based programming to continue to expand over the next two to
three years. WFP also began to achieve scale in its interventions supported by cash and
vouchers: in Kenya, cash transfers were a significant feature of drought relief operations, with
almost half a million beneficiaries benefitting in 2011. Other large operations supported by cash
and vouchers were in the Sudan and Haiti.
Nutrition interventions in WFP projects
89. The Nutrition Improvement Approach approved in September of 2009 supports WFP in
providing the right food at the right time and in prioritizing programmes that focus on the first
1,000 days of life. Distribution of new nutritious products is being scaled up on the basis of
needs, with procurement doubling between 2010 and 2011.13 In 2011 treatment of moderate
acute malnutrition expanded in Pakistan, where a growing proportion of nutritious products
provided for malnourished children are locally produced. These products are also being used in
Niger, where 50 percent more malnourished children were treated in 2011, and in the Horn of
Africa emergency response and refugee camps in Kenya and in Somalia.
13 Ready-to-use foods such as Plumpy’sup, Plumpy’doz and Supercereal Plus

ANNUAL PERFORMANCE REPORT FOR 2011 | WFP/EB.A/2012/4*
WORLD FOOD PROGRAMME | 30
90. WFP continued to scale up the use of new nutritious products in 2011 to respond to
particular needs by:
integrating food and nutrition into its AIDS response to improve beneficiaries’
nutritional status and adherence to treatment to improve cost-effectiveness and reduce
mortality; and
engaged with government policy-makers to ensure that undernutrition – wasting,
stunting and micronutrient deficiencies – remains a priority in the fight against hunger.
91. Micronutrient deficiencies affect 2 billion people. WFP has been instrumental in creating
momentum in the fortification of rice in Asia using new technologies in partnership with the
Dutch manufacturing company DSM’s Nutrition Improvement Programme. The aim is to
ensure that most of the rice procured and distributed in the region can be fortified with a view to
filling gaps in WFP’s fortification work. WFP is also advocating with governments on policies
and practical issues related to the fortification of rice.
92. The REACH “dashboard” enables ministries of health, agriculture, education, women’s
affairs, development and disaster preparedness to see nutrition information in a single graphic.
The dashboard has been used in Bangladesh, the Lao People’s Democratic Republic, Mauritania,
Sierra Leone and the United Republic of Tanzania.
93. WFP and its REACH partners14 researched linkages between agricultural development and
health and nutrition programming and investigated ways in which smallholder farmers could
benefit from food-supply chains generated by scaling up nutrition interventions. The resulting
model will be operationalized in Sierra Leone through the REACH facilitation mechanism.
Challenges include expanding nutrition-sensitive actions at the policy and implementation
levels and helping governments to prioritize resources.
New nutritional approaches and products
Malawi, Mozambique and Zambia are examples of countries in which WFP has worked with partners to tackle
undernutrition more effectively. WFP has helped governments to provide nutrient-dense supplements for young
children, investigate the potential for enhancing production capacity and raising awareness to ensure long-term
demand for these products.
WFP began work with private-sector and academic partners in 2011 to develop a product for treating malnutrition
among adults with HIV or tuberculosis (TB), initially to find out about their preferences for various textures and
flavours. On the basis of this research the partners will develop one or two nutritious products for treating wasting
among adults.
WFP operations in transition settings
94. Transition settings are often characterized by people’s hope for the future and their
expectation of improved living conditions following a crisis. WFP’s field presence, its ability to
mobilize resources rapidly and its technical and logistics capacities give it a comparative
advantage in promoting recovery and development. WFP’s food assistance constitutes a “peace
dividend” in supporting stability in post-conflict environments. In Kyrgyzstan and South Sudan,
for example, support for peacebuilding is an objective of its work.
14
Wageningen University and Research Centre, Njala University, P4P and the Sierra Leone Agriculture Research
Institute.
ANNUAL PERFORMANCE REPORT FOR 2011 | WFP/EB.A/2012/4*
WORLD FOOD PROGRAMME | 31
Somalia
95. Somalia is a major challenge for WFP in terms of programming, particularly with regard to
persuading the various official and unofficial authorities to buy in to its programmes. In 2011
the country office organized meetings to explain WFP’s shift away from general food
distribution to programmes targeting nutrition and livelihoods. Five authorities engaged with
WFP’s programme staff to develop a food-assistance strategy and a seasonal response analysis,15
which led to significant improvements in WFP’s coordination in Somalia. The dialogue is
continuing in 2012 to finalize the response plan for the next six months and to review
complementarities with United Nations and NGO partners.
South Sudan
96. The Government of South Sudan has declared food security as its third-highest priority.
WFP is assisting the Government by supporting the establishment of grain reserves at five
storage compounds and 20 satellites and training government staff to manage the system. The
reserves will reduce food delivery times in a crisis, thereby increasing the Government’s ability
to restore stability in communities, protect its citizens and build trust with the population.16 The
project addresses one of the causes of conflict – South Sudan’s underdevelopment; it will also
support state legitimacy by building government capacity.
Côte d’Ivoire
97. In the Côte d’Ivoire post-electoral crisis 700,000 people were displaced in-country and
150,000 thousand in Liberia. Ghana and Togo were also affected. At the peak of the crisis the
port of Abidjan was closed and alternative access routes had to be opened. In April 2011
UNHAS transported passengers and relief cargoes between Abidjan, western Côte d’Ivoire and
carried out medical evacuations. WFP had to focus on life-saving and school feeding had to be
re-oriented as an emergency response.
Community consultations in the Central African Republic, Kyrgyzstan and Uganda on food
security and peacebuilding
98. Access to food was a condition for peace in the Central African Republic, Kyrgyzstan and
Uganda. Conflict had a negative impact on food security in all the communities consulted.
Insecurity restricted access to farmland and inputs. Harvests were lost in all three countries;
food prices increased and market access was restricted. Displacement and destruction disrupted
farming in the Central African Republic and Uganda, and malnutrition rates were reported to be
high during times of conflict. Communities in Kyrgyzstan suffered violence and discrimination
even after the conflict, outlets for agricultural products were restricted and incomes fell. Many
families are still in debt and rely on loans from relatives and friends to get them through the
crisis.
99. Farming communities in all three countries felt that the Government should prioritize the
distribution of seeds, tools and other inputs, and water for human consumption and irrigation.
Other food-security needs are livelihood interventions, income-generating activities and
employment schemes, particularly for young people.
15
The five authorities included those in Somaliland and Puntland, and Galmudug, Himan, Heeb and Ahlu Sunna Wal
Jamaa’a in central Somalia.
16 Brinkman, H-J. and Hendrix, C.S. 2010. Food Insecurity and Conflict: Applying the WDR Framework. World
Development Report background paper, p. 36. Washington DC, World Bank.
ANNUAL PERFORMANCE REPORT FOR 2011 | WFP/EB.A/2012/4*
WORLD FOOD PROGRAMME | 32
100. After inter-ethnic violence in southern Kyrgyzstan in 2010, WFP provided food assistance
to enable displaced populations to return home and rebuild their livelihoods. WFP subsequently
launched a recovery programme with FAO to repair infrastructure and promote reconciliation
by addressing two of the causes of conflict – inequality in access to services, and high
unemployment. Repairing the Uvam irrigation canal, part of the main water system in Kara-Suu
district, had a particularly positive impact on recovery as communities worked on a common
project and demonstrated their willingness to overcome past differences. The canal now serves
8,000 farming households and 40,000 residents of ten ethnicities.

ANNUAL PERFORMANCE REPORT FOR 2011 | WFP/EB.A/2012/4*
WORLD FOOD PROGRAMME | 33
PART II – PERFORMANCE RESULTS BY STRATEGIC OBJECTIVE
Overview
101. Part II reports the achievements of WFP operations in 2011 at the output and outcome
levels against each Strategic Objective in the Strategic Plan (2008–2013). It draws on three
sources of information:
corporate-level data available for the indicators in the SRF;
the results of independent evaluations of WFP projects; and
examples that demonstrate successes and challenges.
102. Corporate-level data are drawn from the results in the SPRs prepared at the end of each
year. WFP projects reported against one or more of the 21 SRF indicators, as endorsed by the
Board in February 2009. The SRF was adjusted during 2011 to focus on outcome indicators
measured and reported at the beneficiary and community levels,17 reflecting lessons learned in
the 2010 reporting cycle and the Programme Category Review (WFP/EB.A/2010/11/Rev.1). The
results reported by projects are based on the revised SRF.18
103. There were 212 active projects19 in 2011: 49 EMOPs20, 66 protracted relief and recovery
operations (PRROs), 32 country programmes (CPs), 27 development projects (DEVs) and
38 special operations (SOs).
104. WFP took part in 83 joint United Nations programmes21 in 47 countries during 2011,
compared with 71 joint programmes in 46 countries in 2010. The top five partners were the
United Nations Children’s Fund (UNICEF), FAO, UNDP, the World Health
Organization (WHO) and the Office of the United Nations High Commissioner for
Refugees (UNHCR). WFP collaborated with 2,100 NGOs, of which 90 percent were local NGOs
or community-based organizations (CBOs), and with 30 organizations from the Red Cross and
Red Crescent movements. These partners distributed 1.9 million mt of food on behalf of WFP,
52 percent of its food distribution in 2011.
17 WFP is committed to demonstrating change or impact by linking its performance to the MDGs through national
MDG progress reports, UNDAF mid-term reviews and evaluations carried out by WFP, the United Nations, NGOs
and stakeholders.
18 Not all WFP projects reported results for the different indicators, and not all reported results are fully comparable
because data sources may be inconsistent or because only single values were reported. Annex II-B contains discussion
of 2011 performance and experience in reporting SRF indicators.
19 “Active” signifies projects with food distribution or an operational activity such as an SO during the reporting
period.
20 Includes immediate response emergency operations (IR-EMOPs)
21 In a joint programme or project two or more agencies carry out assessments and design of interventions with shared
objectives, actions, timeframes and resource requirements, and with clear delineation of responsibilities. A
programme should be outlined in a single document, which also describes the linkages among the parties and their
responsibilities.
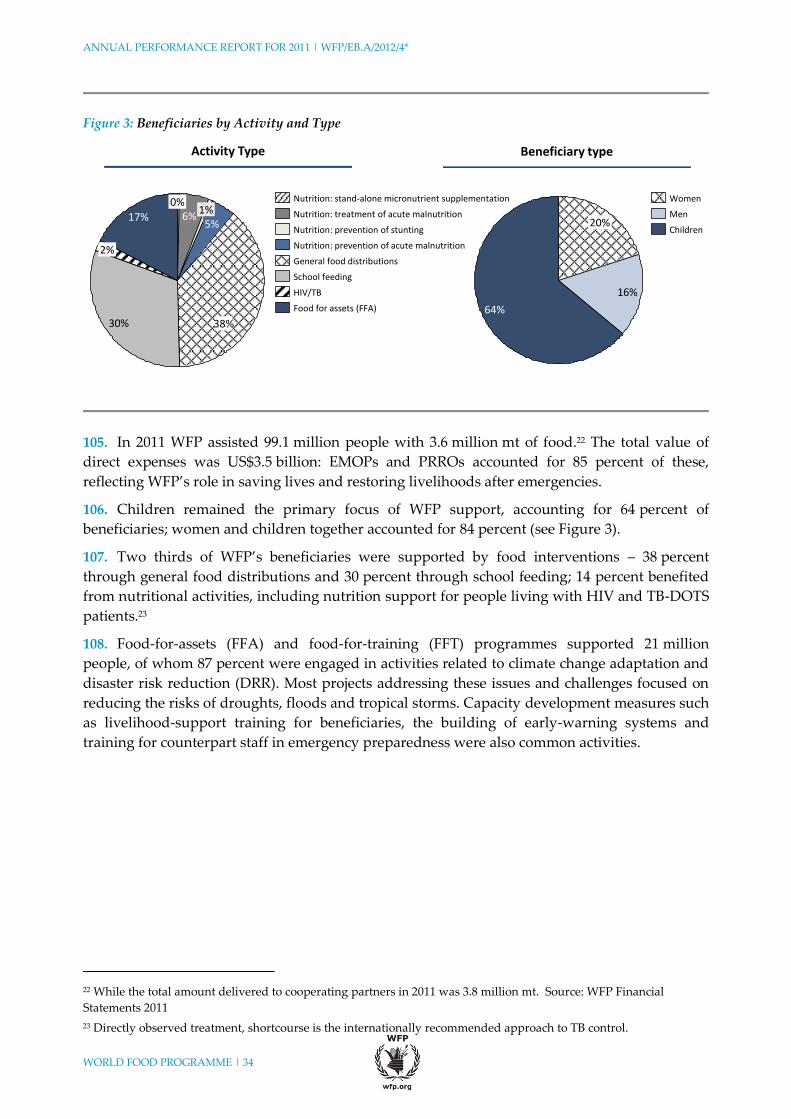
ANNUAL PERFORMANCE REPORT FOR 2011 | WFP/EB.A/2012/4*
WORLD FOOD PROGRAMME | 34
Figure 3: Beneficiaries by Activity and Type
105. In 2011 WFP assisted 99.1 million people with 3.6 million mt of food.22 The total value of
direct expenses was US$3.5 billion: EMOPs and PRROs accounted for 85 percent of these,
reflecting WFP’s role in saving lives and restoring livelihoods after emergencies.
106. Children remained the primary focus of WFP support, accounting for 64 percent of
beneficiaries; women and children together accounted for 84 percent (see Figure 3).
107. Two thirds of WFP’s beneficiaries were supported by food interventions – 38 percent
through general food distributions and 30 percent through school feeding; 14 percent benefited
from nutritional activities, including nutrition support for people living with HIV and TB-DOTS
patients.23
108. Food-for-assets (FFA) and food-for-training (FFT) programmes supported 21 million
people, of whom 87 percent were engaged in activities related to climate change adaptation and
disaster risk reduction (DRR). Most projects addressing these issues and challenges focused on
reducing the risks of droughts, floods and tropical storms. Capacity development measures such
as livelihood-support training for beneficiaries, the building of early-warning systems and
training for counterpart staff in emergency preparedness were also common activities.
22 While the total amount delivered to cooperating partners in 2011 was 3.8 million mt. Source: WFP Financial
Statements 2011
23 Directly observed treatment, shortcourse is the internationally recommended approach to TB control.
30%
6%0%
2%
17%1%
5%
16%
64%
20%Nutrition: treatment of acute malnutrition
Nutrition: stand-alone micronutrient supplementation
Food for assets (FFA)
HIV/TB
School feeding
General food distributions
Nutrition: prevention of acute malnutrition
Nutrition: prevention of stunting Children
Men
Women
Activity Type Beneficiary type
38%

ANNUAL PERFORMANCE REPORT FOR 2011 | WFP/EB.A/2012/4*
WORLD FOOD PROGRAMME | 35
Results by Strategic Objective
Output Results24
109. Emergency relief and early-recovery operations in 2011 accounted for two thirds of the
total food distributed and two thirds of direct expenses; these figures are comparable with 2009
and 2010. In relief operations WFP aims to meet almost all of beneficiaries’ food needs for a set
period of time: as a result, more food is distributed under Strategic Objective 1. In other
interventions, WFP’s assistance covers only part of beneficiaries’ food needs – it “fills the food
gap” – and so reaches more beneficiaries (see Figure 4).
Figure 4: Outputs by Strategic Objective
110. The proportion of activities under Strategic Objective 3 – 12 percent of total food
distributed and 15 percent of total expenses – was higher than in 2010. But activities under
Strategic Objective 4 declined in terms of the proportion of food distributed, which accounted
for 9 percent, and expenses, which accounted for 8 percent (see Figure 5).
Figure 5: Expenses by Strategic Objective (2009–2011)
24 Beneficiaries by Strategic Objective are accounted at the project level.
15%
SO 5
2%SO 4
8%
SO 3
SO 2 6%
SO 169%
Expenses BeneficiariesFood Distribution
12%
SO 5
0%
SO 4
9%SO 3
7%
SO 1
72%
20%
SO 5
0%SO 4
16%
SO 3
SO 2
5%
SO 159%
SO 2
3%
11%15%
2%
15%
8%
2%
20102009
61%
2011
9%
66%
6% 6%
69%
4%
23%
Strategic Objective 1
Strategic Objective 2
Strategic Objective 3
Strategic Objective 4
Strategic Objective 5
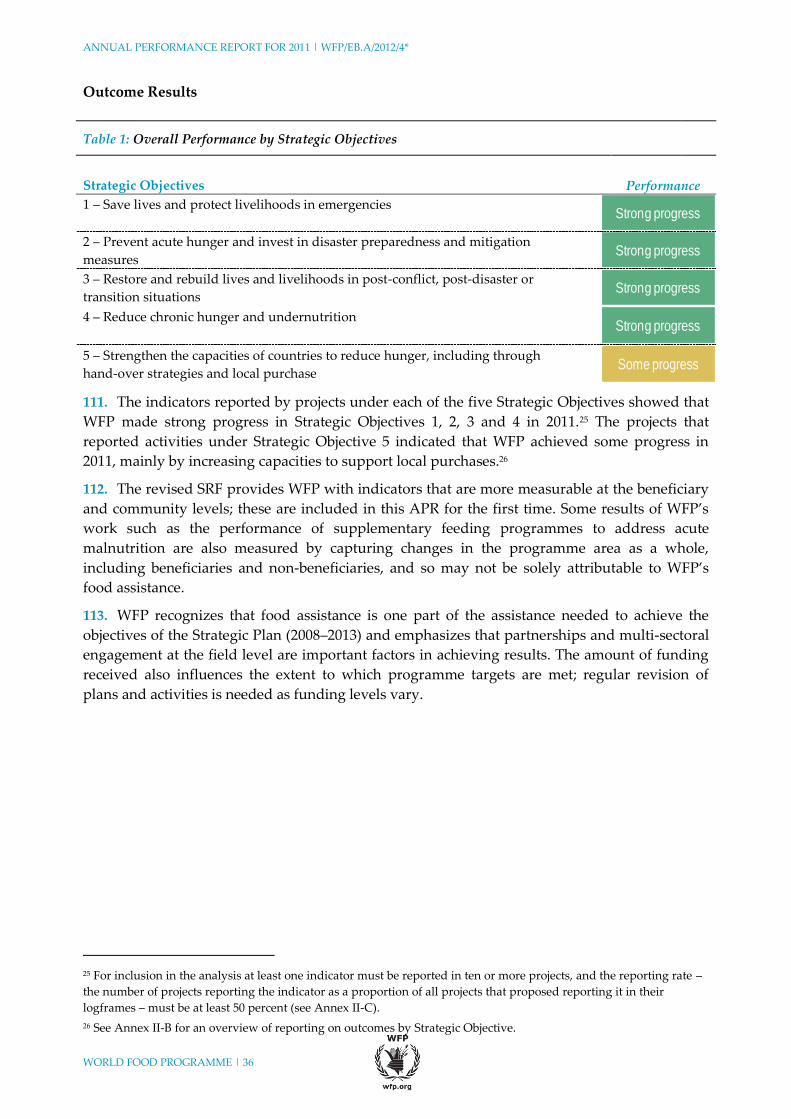
ANNUAL PERFORMANCE REPORT FOR 2011 | WFP/EB.A/2012/4*
WORLD FOOD PROGRAMME | 36
Outcome Results
111. The indicators reported by projects under each of the five Strategic Objectives showed that
WFP made strong progress in Strategic Objectives 1, 2, 3 and 4 in 2011.25 The projects that
reported activities under Strategic Objective 5 indicated that WFP achieved some progress in
2011, mainly by increasing capacities to support local purchases.26
112. The revised SRF provides WFP with indicators that are more measurable at the beneficiary
and community levels; these are included in this APR for the first time. Some results of WFP’s
work such as the performance of supplementary feeding programmes to address acute
malnutrition are also measured by capturing changes in the programme area as a whole,
including beneficiaries and non-beneficiaries, and so may not be solely attributable to WFP’s
food assistance.
113. WFP recognizes that food assistance is one part of the assistance needed to achieve the
objectives of the Strategic Plan (2008–2013) and emphasizes that partnerships and multi-sectoral
engagement at the field level are important factors in achieving results. The amount of funding
received also influences the extent to which programme targets are met; regular revision of
plans and activities is needed as funding levels vary.
25 For inclusion in the analysis at least one indicator must be reported in ten or more projects, and the reporting rate –
the number of projects reporting the indicator as a proportion of all projects that proposed reporting it in their
logframes – must be at least 50 percent (see Annex II-C).
26 See Annex II-B for an overview of reporting on outcomes by Strategic Objective.
Table 1: Overall Performance by Strategic Objectives
Strategic Objectives Performance
1 – Save lives and protect livelihoods in emergencies
2 – Prevent acute hunger and invest in disaster preparedness and mitigation
measures 3 – Restore and rebuild lives and livelihoods in post-conflict, post-disaster or
transition situations 4 – Reduce chronic hunger and undernutrition
5 – Strengthen the capacities of countries to reduce hunger, including through
hand-over strategies and local purchase
Strong progress
Strong progress
Strong progress
Strong progress
Some progress
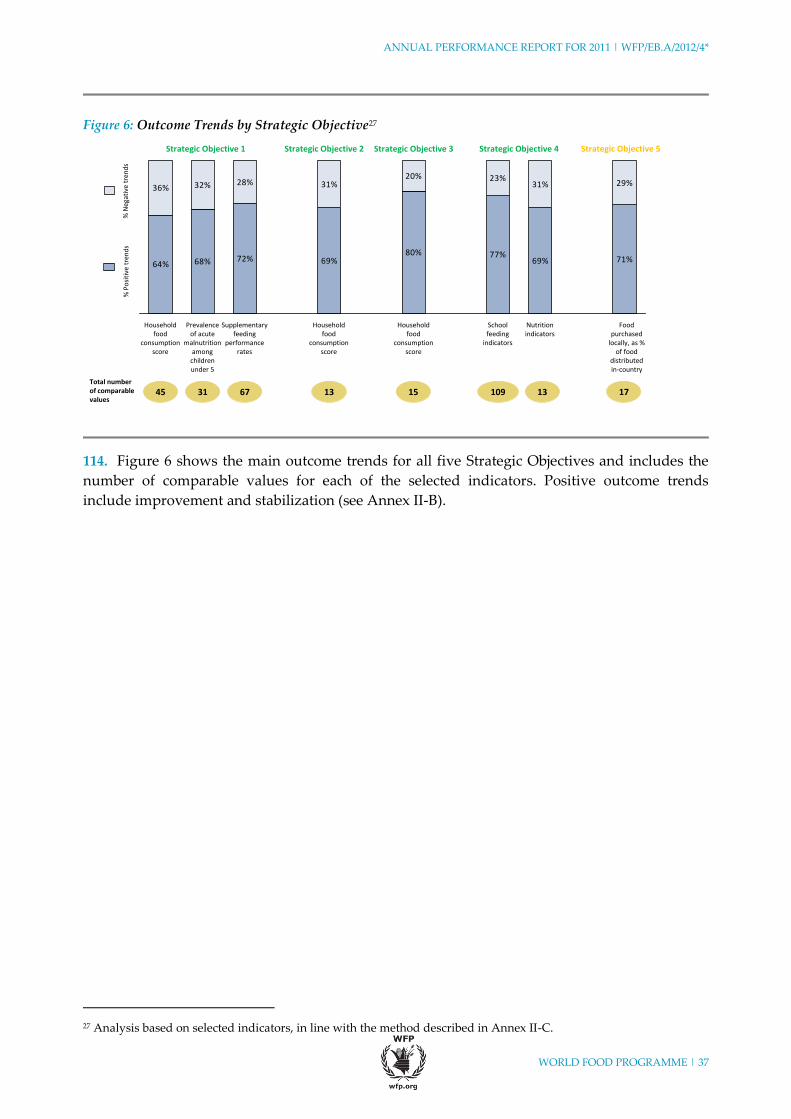
ANNUAL PERFORMANCE REPORT FOR 2011 | WFP/EB.A/2012/4*
WORLD FOOD PROGRAMME | 37
Figure 6: Outcome Trends by Strategic Objective27
114. Figure 6 shows the main outcome trends for all five Strategic Objectives and includes the
number of comparable values for each of the selected indicators. Positive outcome trends
include improvement and stabilization (see Annex II-B).
27 Analysis based on selected indicators, in line with the method described in Annex II-C.
64% 68% 72% 69%80% 77%
69% 71%
36% 32% 28% 31%20% 23%
31% 29%
Household food
consumption score
Food purchased
locally, as % of food
distributed in-country
Prevalence of acute
malnutrition among children under 5
Supplementary feeding
performance rates
Household food
consumption score
School feeding
indicators
Household food
consumption score
Nutrition indicators
% N
egat
ive
tren
ds
% P
osi
tive
tre
nd
s
45 31 109151367 1713Total number of comparable values
Strategic Objective 1 Strategic Objective 2 Strategic Objective 3 Strategic Objective 4 Strategic Objective 5
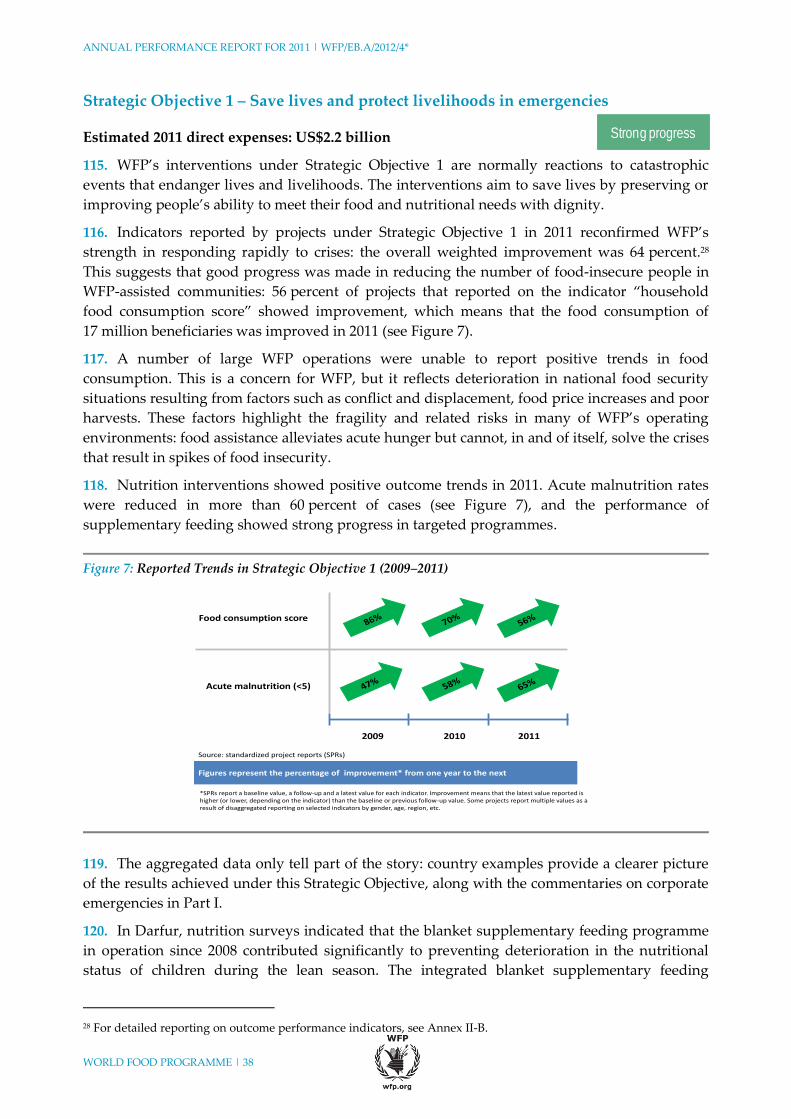
ANNUAL PERFORMANCE REPORT FOR 2011 | WFP/EB.A/2012/4*
WORLD FOOD PROGRAMME | 38
Strong progress
Strategic Objective 1 – Save lives and protect livelihoods in emergencies
Estimated 2011 direct expenses: US$2.2 billion
115. WFP’s interventions under Strategic Objective 1 are normally reactions to catastrophic
events that endanger lives and livelihoods. The interventions aim to save lives by preserving or
improving people’s ability to meet their food and nutritional needs with dignity.
116. Indicators reported by projects under Strategic Objective 1 in 2011 reconfirmed WFP’s
strength in responding rapidly to crises: the overall weighted improvement was 64 percent.28
This suggests that good progress was made in reducing the number of food-insecure people in
WFP-assisted communities: 56 percent of projects that reported on the indicator “household
food consumption score” showed improvement, which means that the food consumption of
17 million beneficiaries was improved in 2011 (see Figure 7).
117. A number of large WFP operations were unable to report positive trends in food
consumption. This is a concern for WFP, but it reflects deterioration in national food security
situations resulting from factors such as conflict and displacement, food price increases and poor
harvests. These factors highlight the fragility and related risks in many of WFP’s operating
environments: food assistance alleviates acute hunger but cannot, in and of itself, solve the crises
that result in spikes of food insecurity.
118. Nutrition interventions showed positive outcome trends in 2011. Acute malnutrition rates
were reduced in more than 60 percent of cases (see Figure 7), and the performance of
supplementary feeding showed strong progress in targeted programmes.
Figure 7: Reported Trends in Strategic Objective 1 (2009–2011)
119. The aggregated data only tell part of the story: country examples provide a clearer picture
of the results achieved under this Strategic Objective, along with the commentaries on corporate
emergencies in Part I.
120. In Darfur, nutrition surveys indicated that the blanket supplementary feeding programme
in operation since 2008 contributed significantly to preventing deterioration in the nutritional
status of children during the lean season. The integrated blanket supplementary feeding
28 For detailed reporting on outcome performance indicators, see Annex II-B.
*SPRs report a baseline value, a follow-up and a latest value for each indicator. Improvement means that the latest value reported is higher (or lower, depending on the indicator) than the baseline or previous follow-up value. Some projects report multiple values as a result of disaggregated reporting on selected indicators by gender, age, region, etc.
2009 2010 2011
Acute malnutrition (<5)
Food consumption score
Figures represent the percentage of improvement* from one year to the next
Source: standardized project reports (SPRs)
ANNUAL PERFORMANCE REPORT FOR 2011 | WFP/EB.A/2012/4*
WORLD FOOD PROGRAMME | 39
programme reduced malnutrition rates considerably in the programme pilot areas in
eastern Sudan.
121. In Kakuma refugee camp in Kenya, acute malnutrition rates declined in 2011. This was
attributed to effective partnerships among agencies that enhanced the complementarity of
inputs. WFP provided Nutributter for children under 2 and ensured a full food basket. Partners
such as the UNHCR and NGOs improved infant and young child feeding practices through
“mother-to-mother” and “father-to-father” support groups, ensured increased access to
micronutrients through improved fortified blended food, Nutributter for children under 2 and
kitchen gardening; and provided firewood, which together reduced food sales.
122. In the targeted supplementary feeding programme in Ethiopia, WFP provided fortified
blended food and vegetable oil for acutely malnourished children under 5 and pregnant and
lactating women identified through nutrition screenings. The results in 2011 followed the
patterns of 2010: supplementary feeding default and death rates were well within SPHERE29
standards and recovery rates improved steadily during the year.
123. In Pakistan, WFP’s assistance was critical in saving lives and maintaining adequate food
consumption among people affected by flooding. An independent study at the end of the year
concluded that 83 percent of flood-affected families in Sindh had an adequate food consumption
score, compared with 51 percent observed in an assessment by the Government and the
United Nations at the start of the flooding.
124. A feasibility study in Côte d’Ivoire concluded that cash transfers were the best means of
assisting vulnerable households affected by the post-election crisis, because markets in the areas
concerned were still operating. The objectives were to provide resources for households to buy
food and improve their consumption, and to reduce negative coping mechanisms such as
prostitution and child labour. Post-distribution monitoring at the end of 2011 showed an
increase in the number of daily meals in the targeted households, an increase in the food
consumption score and a reduction of negative coping strategies as measured by the coping
strategy index. The success of the project was a result of a partnership with mobile telephone
provider MTN, Action contre la faim (ACF) and communities.
125. In the Democratic Republic of the Congo (DRC), nutritious food provided for
malnourished anti-retroviral therapy (ART) patients ensured regular attendance at clinics and
contributed to nutritional rehabilitation. WFP’s assistance was a significant factor in keeping the
percentage of defaulters below the target of 15 percent or less.
Beneficiary verification in the Sudan
A major component of WFP’s programme in the Sudan in 2011 was the verification exercise. This entailed updating
beneficiary lists using biometric data, identifying beneficiaries such as babies who may not have been registered in
camps, and de-registering individuals who had left. WFP increased its sensitization work with community leaders in
camps that refused verification, and by the end of 2011 had verified 1.1 million internally displaced persons (IDPs)
among the caseload of 1.7 million in Darfur. The process will continue until all IDP camps have been verified.
29 The Sphere Project sets minimum standards in core areas of humanitarian assistance; see www.sphereproject.org
ANNUAL PERFORMANCE REPORT FOR 2011 | WFP/EB.A/2012/4*
WORLD FOOD PROGRAMME | 40
Strong progressStrategic Objective 2 – Prevent acute hunger and invest in
disaster preparedness and mitigation measures
Estimated 2011 direct expenses: US$181 million
126. Indicators reported by projects under Strategic Objective 2 showed a weighted
improvement of 68 percent in 2011. Two thirds of the projects that reported on the indicator
“household food consumption score” showed improvement,30 which means that food
consumption improved for 1.9 million people. Projects that reported trends in the number of
productive assets used by communities recorded an increase.
127. WFP’s support for the Government of Afghanistan included financial and technical
assistance in risk and vulnerability assessment and food-security monitoring. The 2011 analysis
of the disaster preparedness index, which is composed of contingency planning, food-security
monitoring and early warning systems, indicated: i) that the Government has the capacity to
lead the development of national contingency plans but needs external support to develop
contingency planning at the sub-national level; and ii) that the food-security monitoring system
and the early warning system can be managed by the Government with support from WFP and
partners. WFP’s assistance will continue in 2012.
128. WFP's disaster preparedness pilot in the Philippines is intended to enhance the
Government’s capacity to prepare for and respond to natural disasters in vulnerable
municipalities. The results included: i) construction of an emergency food and seed storage
facility; ii) implementation of community-based projects to mitigate the effects of landslides and
floods; iii) construction of a centre for coordinated emergency response; iv) enhancement of
early-warning and communication capacities in units for disaster risk reduction and
management; v) enhancement of technical capacities in local governments through training in
contingency planning and emergency management, which included facilitation of a response
simulation for the Philippines National Disaster Risk Reduction and Management
Council (NDRRMC) and its partners; and vi) enhancement of the Government’s logistics
capacity for disaster response through training in warehouse management and improvements to
food-tracking systems. In view of these positive results, NDRRMC asked WFP to replicate the
projects in other vulnerable communities and allocated US$3 million to match WFP’s
commitments.
129. During the drought in the Horn of Africa household food consumption in Ethiopia
improved in comparison with 2008 levels, when conditions were similar. This is probably the
result of continuous support by the productive safety net programme (PSNP) in 2011, whose
distributions – of full rations – were more timely and predictable than in 2008.
130. A promotional cash-based safety-net project in Bangladesh, which targeted extremely poor
women in disaster-prone areas, led to a threefold increase in the value of productive assets
owned by women and doubled average household incomes. Household food consumption
improved by 52 percent, and women reported increased control over household finances and
greater mobility to visit markets. Incident committees were established to review cases of loss of
productive assets and awards of cash compensation. The project is based on a 24-month cycle
and includes an asset grant, a monthly allowance and training to enable participants to purchase
and manage livelihood assets. It has provided insights into ways in which WFP can help the
Government to design and manage its own safety-net programmes.
30 For detailed reporting on outcome performance indicators see Annex II-B.
ANNUAL PERFORMANCE REPORT FOR 2011 | WFP/EB.A/2012/4*
WORLD FOOD PROGRAMME | 41
131. In Kenya, WFP helped families to meet their immediate food needs, safeguard their
livelihoods and create productive assets with a view to withstanding the effects of erratic
weather patterns. The project focused on harvesting rainwater, managing water resources such
as ponds, dams and irrigation systems, planting tree seedlings and improving roads linking
communities to markets. A 2011 impact evaluation reported that the outputs enhanced resilience
and transformed pastoral communities that had for years relied on relief assistance: 55 percent
of the communities and 29 percent of households increased the number of assets owned.
Rehabilitation and preparedness training for beneficiaries
In Nicaragua WFP adopted a comprehensive approach to DRR in consultation with local governments, identifying
training approaches relevant to vulnerable populations. Beneficiaries were trained and engaged in rehabilitation and
preparedness activities in exchange for food. Training focused on agriculture, livelihood support, early warning
systems and community preparedness. To support recovery from crop losses and improve resilience to drought, WFP
and local governments supported land rehabilitation, reforestation and water and soil conservation.

ANNUAL PERFORMANCE REPORT FOR 2011 | WFP/EB.A/2012/4*
WORLD FOOD PROGRAMME | 42
Strong progressStrategic Objective 3 – Restore and rebuild lives and livelihoods in
post-conflict, post-disaster or transition situations
Estimated 2011 direct expenses: US$474 million
132. Indicators reported by projects under Strategic Objective 3 showed a weighted
improvement of 80 percent during 2011. Of the projects that reported on the indicator
“household food consumption score” 80 percent showed improvement,31 which means that food
consumption improved for 2.6 million people. While only three projects reported on the
“community asset score” indicator, 100 percent of these showed improvements.
133. The FFA programme in Afghanistan contributed to social, economic and environmental
improvements in terms of building resilience, reducing disaster risk and improving
communities’ access to productive assets. WFP assisted several flood-mitigation projects in 2011
that were building protection walls, dams and terraces. Of the 58 communities sampled,
55 showed increased community asset scores at the end of the year; the average community
asset score increased from 27 in 2010 to 48 in 2011. WFP was also involved in water-
management schemes to enhance the efficiency of irrigation, increase vegetation cover to control
erosion and improve water movement into the soil layer.
134. With rising food insecurity and declining socio-economic opportunities in Pakistan, WFP
aimed to promote household food security and recovery from shocks in vulnerable areas. At the
end of 2011, 61 percent of the households assisted had an acceptable food consumption score
against a baseline of 53 percent; consumption was significantly lower in groups that were not
assisted. Livelihood-restoration activities planned and implemented in consultation with
beneficiaries aimed to create assets that would help communities to withstand disasters. An
independent assessment found that access to community assets among WFP beneficiaries
increased by 50 percent, and that 67 percent of households regularly used the assets.
135. A nutrition and food security assessment in Zambia in the last quarter of 2011 recorded
marked improvement in most outcome results compared with 2010. Food assistance contributed
to an improvement in the percentage of households with an acceptable food consumption score;
the crude mortality rate and the prevalence of acute malnutrition among children under 5 were
also less than in 2010. One reason for the improvement was a reduction in the number of people
in Meheba and Mayukwayukwa refugee camps after the voluntary repatriations in recent years:
the remaining refugees had improved access to land for farming and greater benefits from
resources such as agricultural inputs and health services.
136. In Iraq, the school feeding programme is implemented jointly by WFP and the Ministry of
Education in collaboration with communities. After roll-out in three governorates early in 2011
there was an 11 percent increase in enrolment compared with 2010 – 14 percent for girls and
10 percent for boys – and retention rates were high. The main reasons for dropouts were
poverty, illness, distance from schools and low awareness of the benefits of education. National
ownership and leadership were critical factors in the encouraging initial findings and the
sustainability of the programme, which was fully rolled out in September 2011 and primarily
funded by the Government. WFP continues to support the programme and to build institutional
capacities with a view to hand-over in 2012.
31 For detailed reporting on outcome performance indicators, see Annex II-B.
ANNUAL PERFORMANCE REPORT FOR 2011 | WFP/EB.A/2012/4*
WORLD FOOD PROGRAMME | 43
137. Throughout 2011 the recovery of the earthquake-affected population in Haiti was
undermined by high food prices and decreasing humanitarian assistance. WFP therefore
decided to concentrate the available resources to maintain its caseload of 1.1 million children in
the school meals programme. This made it possible to continue daily meals in WFP-assisted
schools, where retention rates were 58 percent for girls and 61 percent for boys – well above the
national average of 50 percent. Support from private-sector donors enabled delivery to schools
of half of the planned number of fuel-efficient stoves. WFP continues to work with the
Government and donors to promote a nationally owned sustainable school meals programme
with links to small farms.
138. The objective of WFP’s assistance for malnourished ART and TB-DOTS patients in
Zimbabwe is to improve the nutritional well-being of chronically ill adults by increasing
adherence to treatment with a view to lasting recovery. Beneficiaries are given fortified blended
foods to assist nutritional recovery; a household transfer is provided to minimize the
vulnerability of patients’ families. An outbreak of diarrhoeal diseases challenged the success of
the programme in 2011: the nutritional recovery rate among adults exceeded 60 percent but was
still below the 80 percent target set by WFP and the Ministry of Health and Child Welfare.
Nutrition support also helped with adherence to treatment: 95 percent of patients receiving food
assistance continued their courses of medication.32
32 For standard analysis the threshold for acceptable adherence is 80 percent.
ANNUAL PERFORMANCE REPORT FOR 2011 | WFP/EB.A/2012/4*
WORLD FOOD PROGRAMME | 44
Strong progressStrategic Objective 4 – Reduce chronic hunger and undernutrition
Estimated 2011 direct expenses: US$238 million
139. Indicators reported by projects under Strategic Objective 4 showed a weighted
improvement of 62 percent during 2011, indicating strong progress in reducing chronic hunger
and undernutrition.33
School feeding
140. School feeding was the primary intervention under Strategic Objective 4. Of projects that
reported on enrolment rates, 85 percent reported improvement. Reported pass rates for boys
and girls, which reflect the effectiveness of school feeding in ensuring that the education cycle is
completed, showed improvement in 66 percent of projects, compared with 46 percent in 2010.
The trends in attendance rates and gender ratios show that it is difficult to maintain progress
when interventions have already achieved positive rates.
141. A 2010 impact evaluation of school feeding in Cambodia encouraged WFP to expand the
scholarship component in line with national priorities because the high value and strict targeting
associated with scholarships makes them an effective social-protection tool; WFP was also urged
to provide school meals to address micronutrient deficiencies. In response, WFP allocated a
higher proportion of resources to scholarships: in the 2011/12 school year, scholarship
programmes have been scaled up from 20,000 to 70,000 poor students. The new cash scholarship
pilot is accompanied by an impact evaluation to determine ways in which different transfer
modalities can achieve objectives in education, value transfer, health and nutrition. The school
meals programme, on the other hand, focused on areas with poor food security and education
indicators. End-of-year results showed that the school feeding programme had: i) helped to
promote food security and access to education; and ii) supported the Government in promoting
early childhood development and right-age enrolment, reducing drop-out rates and
encouraging completion of primary education. Food or cash scholarship programmes provided
high-impact safety nets for children from vulnerable households in food-insecure areas. WFP
and its research partners have received funding for a study in the coming school year to assess
whether fortified rice in school meals could be used to address micronutrient deficiencies.
142. In the Gambia, WFP’s school feeding programme helped to increase enrolment and
maintain the attendance and nutritional status of primary and pre-school children by providing
daily cooked rations of rice, peas, salt, oil and garden produce. The annual rate of change in
enrolment for 2011 increased by 4 percent, somewhat below the 6 percent target, because of a
disparity between the resources available for urban schools compared with rural schools, which
in turn affected the number of beneficiaries. WFP will have to find additional resources for
regular school feeding with simultaneous capacity development and the development of a
hand-over strategy.
33 For detailed reporting on outcome performance indicators, see Annex II-B.
ANNUAL PERFORMANCE REPORT FOR 2011 | WFP/EB.A/2012/4*
WORLD FOOD PROGRAMME | 45
Nutrition
143. Improvements were registered in two thirds of the projects reporting on stunting
among targeted children under 5 and in 80 percent of projects reporting on iron-deficiency
anaemia in 2011.34
144. The Great Start campaign led by the Government of Uganda and WFP is a nutrition
sensitization initiative in south-western region conceived in response to high regional stunting
rates that reached 45 percent in Bundibugyo district. It is not food-based but it aims to promote a
balanced diet among pregnant and lactating women and children aged 6–24 months – the
window of opportunity for reducing stunting. Activities include: i) cookery demonstrations at
antenatal, post-natal and child clinics; ii) distribution of menu cards for pregnant and lactating
women and young children at health centres; iii) radio programmes for sensitization on proper
nutrition for groups at risk; and iv) sensitization and training for market vendors. WFP’s role in
this initiative is to build on the work that all United Nations agencies are mandated to do to
achieve the MDGs. Preliminary results from the Ministry of Health show that the rate of low
birthweight fell from 9 percent in 2010 to 7 percent in 2011 at health facilities implementing
Great Start. In 2012 the campaign will aim to integrate nutrition information and education into
local government services with a view to ensuring ownership and developing a hand-over
strategy.
145. WFP and the Government of the Democratic People’s Republic of Korea (DPRK) are
producing Super-Cereal and biscuits enriched with vitamins and micronutrients to combat
undernutrition among 2.3 million children and their mothers. Challenges remain, however, in
that: i) production of nutritious foods was hampered by pipeline breaks, forcing WFP to
prioritize certain areas and the most vulnerable groups; and ii) scarcity of ingredients, vitamin
and mineral mixes and packaging. Additional resources will be needed to ensure adequate
assistance for the targeted beneficiaries.
Mitigation, safety nets and care and treatment for people affected by HIV and TB
146. WFP reached 2.3 million people affected by HIV and TB in 2011 through food assistance,
vouchers and nutritional support programmes. The target for TB treatment success was met in
75 percent of projects; 73 percent of projects reporting ART adherence reported rates of over
80 percent.
147. WFP’s assistance in Tajikistan helped to maintain treatment completion rates among
TB patients and their families under the DOTS programme. Assistance is conditional on
adherence, so food is an enabler for clients to complete their treatment and avoid the risks from
disease strains that are resistant to multiple medications. By preventing the depletion of assets
and enabling beneficiaries to use their limited incomes to meet other needs, WFP’s programme
also helped to improve food security.
148. In Zimbabwe, WFP provided nutrition support to 580,000 beneficiaries, including
malnourished ART clients, and households affected by HIV or supporting orphans and other
vulnerable children. The 2011 country portfolio evaluation highlighted the critical role of
nutrition in boosting adherence to ART and weight gain among chronically ill people,
contributing to their capacity to lead productive lives and their willingness to undergo
voluntary testing.
34 In 2010 both indicators showed improved values in 50 percent of cases.
ANNUAL PERFORMANCE REPORT FOR 2011 | WFP/EB.A/2012/4*
WORLD FOOD PROGRAMME | 46
Some progressStrategic Objective 5 – Strengthen the capacities of countries to reduce
hunger, including through hand-over strategies and local purchase
Estimated 2011 direct expenses: US$78 million
149. WFP has two indicators to measure outcome-level results for Strategic Objective 5 at the
corporate level. For local purchases, WFP measures the proportion of food procured locally as a
percentage of the food distributed to WFP beneficiaries. For capacity development WFP
introduced a new indicator, the national capacity index (see Box after paragraph 154), late in
2011 and will seek to report against this indicator during 2012.
150. The 17 projects reporting on the local purchase indicator showed a weighted improvement
of 53 percent during 2011.
151. Most projects reporting on capacity development and hand-over focused on outputs,
providing qualitative descriptions of support given with a view to handing WFP-assisted
programmes over to national ownership and enhancing capacities in national programmes.
Examples of such activities are given below.
152. In Lesotho, WFP’s strategy for handing over the school feeding programme to the
Government had three elements: i) scaling up the quality of the programme by exploring a
home-grown approach; ii) research and capacity development to increase national capacities to
run the programme; and iii) advocacy to increase the budget assigned to the programme.
Significant results were achieved in all three areas in 2011. WFP’s support paved the way for a
continuous supply of locally produced food to schools, even those in remote areas, through
production schemes set up with farmers and enhancement of access to markets in smallholder
farmers’ trade associations. Research enabled WFP and the Government to address gaps in the
logistics capacity of the national food management unit through a capacity development plan;
WFP also purchased information technology and other equipment for the food management
unit's ten district warehouses to enhance their efficiency and effectiveness. WFP’s advocacy
resulted in the allocation of 25 percent of the government budget for the programme in 2011.
The Government is committed to increasing its financing of operational expenses to 100 percent
by 2013.
153. WFP’s regional capacity development programme for school feeding in Latin America and
the Caribbean responds to regional needs by offering technical support to foster government
ownership. The first phase was implemented in countries interested in technical assistance with
earmarked resources for evaluating a national school feeding programme. At the request of the
Government of the Dominican Republic, an evaluation of the national school feeding
programme was carried out in 2011 with UNDP, UNICEF and FAO, supported by the
Government and other stakeholders. The Government endorsed WFP’s tool for measuring
programme quality standards, which was used to identify areas for improvement. Partnerships
with UNDP, UNICEF, the Nutrinet Foundation and Tetra Pak helped to demonstrate the
relevance of United Nations technical assistance for host governments.
154. Most school feeding projects in the region are nationally supported and sustainable.
Previous achievements and capacity development can be exploited to improve programmes and
provide guidance for governments in the early stages of transition to national ownership.
Advocacy and South-South cooperation to utilize each country’s expertise will move the project
forward.

ANNUAL PERFORMANCE REPORT FOR 2011 | WFP/EB.A/2012/4*
WORLD FOOD PROGRAMME | 47
National capacity index
In 2011, WFP developed the national capacity index (NCI) to measure progress towards nationally owned hunger
solutions against five quality standards: i) strong policy frameworks; ii) strong institutional structure and
coordination; iii) stable funding and budgeting; iv) sound programme design and implementation, including
evaluation; and v) strong community participation and ownership. Armenia, Cape Verde and Tajikistan calculated a
baseline value for NCI in 2011 and established a framework for planning and designing capacity development
initiatives. The NCI will be integrated into country office progress reports from 2012.
Progress on gender
155. Half of the projects implementing general food distributions showed an increase in the
proportion of women in leadership positions on food management committees in 2011,
particularly under Strategic Objectives 1 and 3. This reflects WFP’s priority of facilitating
women’s participation and decision-making in household and community affairs.
156. Many WFP projects use innovative and context-based approaches to mainstreaming
gender. Examples include sensitization and awareness-raising activities, the introduction of
child-care facilities for FFW, the involvement of women in leadership positions in economic
activities and the engagement of men in nutrition activities.
157. The Gender Innovations Fund was established in 2010 to mainstream gender in WFP in
line with the gender policy. The fund supports country offices in establishing partnerships with
governments, NGOs and communities to design and implement context-based interventions
promoting positive gender relations and the empowerment of women in food and nutrition
security issues. The fund has to date allocated US$2 million to support 31 projects at the policy
and community levels; five projects were completed in 2011.
158. An impact assessment of four of the five completed projects observed that they led to new
partnerships and funding opportunities and enhanced the profile of WFP in the promotion of
food security and gender equality among national partners.
ANNUAL PERFORMANCE REPORT FOR 2011 | WFP/EB.A/2012/4*
WORLD FOOD PROGRAMME | 48
Lessons Learned
159. WFP’s implementation of food-assistance programmes in 2011 identified lessons that apply
across all five Strategic Objectives:
WFP works in fragile operating environments where long-term progress is difficult and
influenced by contextual risks. WFP must continue to work with its stakeholders to
improve risk assessment and use it to set realistic medium-term and long-term objectives
for addressing inherent risks.
Working to reduce food insecurity involves recognition of the multi-dimensional nature
of the MDGs and commitment to more inter-sectoral interventions in health, nutrition,
food production and emergency preparedness and environmental and other issues .
Negative trends in beneficiaries’ food security are often associated with resource
constraints and pipeline breaks. In some cases the “seasonality” of donor responses
resulted in last-minute deliveries of food; this resulted in hunger risks when contextual
factors prevented WFP from reaching beneficiaries for prolonged periods. In other cases
WFP operations faced pipeline shortfalls and shortages of special nutrition products.
WFP’s work to enhance the accuracy of forward planning and increase food purchases
for delivery through common corridors is increasingly significant in ensuring timely
deliveries of food to people who need it.
More effective monitoring and evaluation (M&E) is central to improving WFP’s
performance. Resources permitting, WFP will begin in 2012 to implement its three-year
M&E Strategy which seeks to enhance performance measurement through improved
M&E processes and systems at country office, regional bureau and Headquarters levels.
Better resource forecasting and operational planning are crucial in increasing the flow of
nutritious products to WFP projects. Greater certainty with regard to future demand
reduces the risks to suppliers and generates incentives for advance production with long
lead times.
More effective mechanisms such as rights and complaints systems are needed to promote
accountability to beneficiaries and generate feedback for monitoring WFP’s performance.
Dedicated WFP complaints desks have helped to enhance operational transparency and
accountability by hearing and resolving issues raised by beneficiaries.
160. It is essential to harness local capacities to maximize the impact of WFP’s interventions and
government involvement at the central and district levels at every stage of a project cycle. Where
such capacity is low, WFP must facilitate more comprehensive training and institutional
strengthening. The development of capacities in food management, monitoring and information
management were critical in responding efficiently to humanitarian needs in 2011.

ANNUAL PERFORMANCE REPORT FOR 2011 | WFP/EB.A/2012/4*
WORLD FOOD PROGRAMME | 49
PART III – ORGANIZATIONAL PERFORMANCE BY MANAGEMENT
RESULT DIMENSION
Overview
161. This part of the APR focuses on WFP’s performance against each of the five
Management Result Dimensions established in 2009. These help managers to identify and
respond to challenges in a structured way and measure the effectiveness of WFP’s management
and financial and resource structures in supporting the Strategic Objectives.
162. The Management Result Dimensions are not expected to change from one year to another.
Individual management results will change, however, as WFP faces new challenges. WFP
reviewed its performance indicators during 2011 and refined the Management Results
Framework for 2012 onwards on the basis of lessons learned during the 2010 reporting cycle.
163. The achievements of 2011 are presented according to indicators used in the 2009 and 2010
APRs to reveal trends in organizational performance. Management results are discussed under
each dimension on the basis of selected indicators and analyses of progress during the year.
Elements of the 2012 framework are highlighted where appropriate.
164. In accordance with the Board’s request to enhance reporting on efficiency improvements, 35
this APR highlights WFP initiatives related to efficiency under the relevant Management Result
Dimensions.
35 WFP/EB.2/2011/5-E/1.
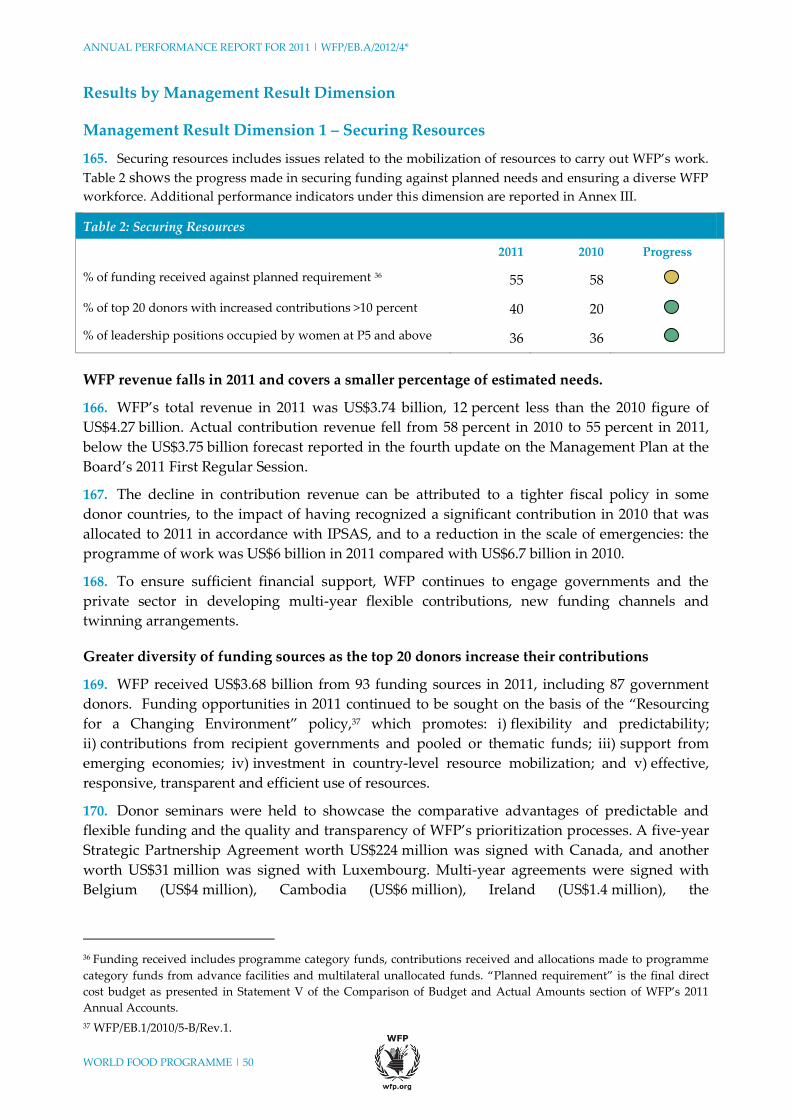
ANNUAL PERFORMANCE REPORT FOR 2011 | WFP/EB.A/2012/4*
WORLD FOOD PROGRAMME | 50
Results by Management Result Dimension
Management Result Dimension 1 – Securing Resources
165. Securing resources includes issues related to the mobilization of resources to carry out WFP’s work.
Table 2 shows the progress made in securing funding against planned needs and ensuring a diverse WFP
workforce. Additional performance indicators under this dimension are reported in Annex III.
Table 2: Securing Resources
2011 2010 Progress
% of funding received against planned requirement 36 55 58
% of top 20 donors with increased contributions >10 percent 40 20
% of leadership positions occupied by women at P5 and above 36 36
WFP revenue falls in 2011 and covers a smaller percentage of estimated needs.
166. WFP’s total revenue in 2011 was US$3.74 billion, 12 percent less than the 2010 figure of
US$4.27 billion. Actual contribution revenue fell from 58 percent in 2010 to 55 percent in 2011,
below the US$3.75 billion forecast reported in the fourth update on the Management Plan at the
Board’s 2011 First Regular Session.
167. The decline in contribution revenue can be attributed to a tighter fiscal policy in some
donor countries, to the impact of having recognized a significant contribution in 2010 that was
allocated to 2011 in accordance with IPSAS, and to a reduction in the scale of emergencies: the
programme of work was US$6 billion in 2011 compared with US$6.7 billion in 2010.
168. To ensure sufficient financial support, WFP continues to engage governments and the
private sector in developing multi-year flexible contributions, new funding channels and
twinning arrangements.
Greater diversity of funding sources as the top 20 donors increase their contributions
169. WFP received US$3.68 billion from 93 funding sources in 2011, including 87 government
donors. Funding opportunities in 2011 continued to be sought on the basis of the “Resourcing
for a Changing Environment” policy,37 which promotes: i) flexibility and predictability;
ii) contributions from recipient governments and pooled or thematic funds; iii) support from
emerging economies; iv) investment in country-level resource mobilization; and v) effective,
responsive, transparent and efficient use of resources.
170. Donor seminars were held to showcase the comparative advantages of predictable and
flexible funding and the quality and transparency of WFP’s prioritization processes. A five-year
Strategic Partnership Agreement worth US$224 million was signed with Canada, and another
worth US$31 million was signed with Luxembourg. Multi-year agreements were signed with
Belgium (US$4 million), Cambodia (US$6 million), Ireland (US$1.4 million), the
36 Funding received includes programme category funds, contributions received and allocations made to programme
category funds from advance facilities and multilateral unallocated funds. “Planned requirement” is the final direct
cost budget as presented in Statement V of the Comparison of Budget and Actual Amounts section of WFP’s 2011
Annual Accounts.
37 WFP/EB.1/2010/5-B/Rev.1.
ANNUAL PERFORMANCE REPORT FOR 2011 | WFP/EB.A/2012/4*
WORLD FOOD PROGRAMME | 51
Russian Federation (US$90 million), the United Kingdom (US$184 million) and the United States
(US$205 million).
171. The strong relationships with Brazil and with developing economies are founded on
innovative funding: the value of twinning arrangements doubled in 2011, providing
opportunities for South–South cooperation and leveraging cash contributions from traditional
donors.
172. In 2011, US$60 million was contributed by 31 host governments – six more than in 2010 –
accounting for 2 percent of contributions. Afghanistan, DRC, Ethiopia, Namibia and
São Tomé and Principe became donors for the first time. Reductions in contributions from host
governments were partially offset by significant donations made for the first time by DRC,
Ethiopia, the Philippines and Sri Lanka.
173. Contributions from emerging economies continued to grow in 2011, increasing by
26 percent to US$228 million. Brazil’s in-kind contribution of 710,000 mt of food was a record;
China, Israel, Mexico, Morocco, the Russian Federation and the United Arab Emirates also made
record contributions.
174. WFP received US$196 million from multi-donor funds in 2011, mainly from
country-specific common humanitarian funds (CHFs) and the United Nations Central
Emergency Response Fund (CERF), which was WFP’s seventh largest donor in 2011 with
US$126 million in allocations to meet needs in Côte d'Ivoire, Ethiopia, Kenya, DPRK, Niger,
Pakistan, Somalia, Sri Lanka and the Sudan.
175. In spite of the global financial crisis, six OECD-DAC donors – Australia, Canada, Germany,
Japan, Sweden and Switzerland – made record contributions in 2011. Canada was ranked
second for the first time, and Germany doubled its 2010 contributions.
176. Significant benefits were derived from twinning arrangements,38 the value of which
doubled with US$112 million of cash contributions for twinning with 249,000 mt of in-kind
contributions from 19 countries.
177. WFP repositioned itself in 2011 to promote private-sector partnerships with a view to
working in markets with the greatest opportunities. Contributions from the private sector
reached US$93.7 million, making it WFP’s tenth-largest donor. Since the Board’s approval of the
private partnerships and fundraising strategy in 2008, US$488 million has been raised. The
private sector contributed US$24 million to the Horn of Africa response; WFP’s response to the
earthquake in Japan was totally funded from the private sector. The online donation system is
growing rapidly, raising US$7 million in 2011; the e-mail support base grew by 178 percent and
Facebook and Twitter followers increased three-fold.
178. Two private-sector partnerships stood out in 2011: i) WFP’s partnership with PepsiCo and
the United States Agency for International Development (USAID) promotes long-term nutrition
and economic security in Ethiopia by increasing the production and marketing of chickpeas;
WFP will develop a locally sourced ready-to-use supplementary food based on chickpeas to
combat malnutrition; and ii) WFP and LG Electronics launched a TV application that enables
users to participate directly in the fight against hunger by donating to WFP and learning
interactively about its work; it also has an “emergency mode” that enables users to donate to
particular emergencies.
38 Twinning means matching cash contributions to in-kind contributions from some developing countries.
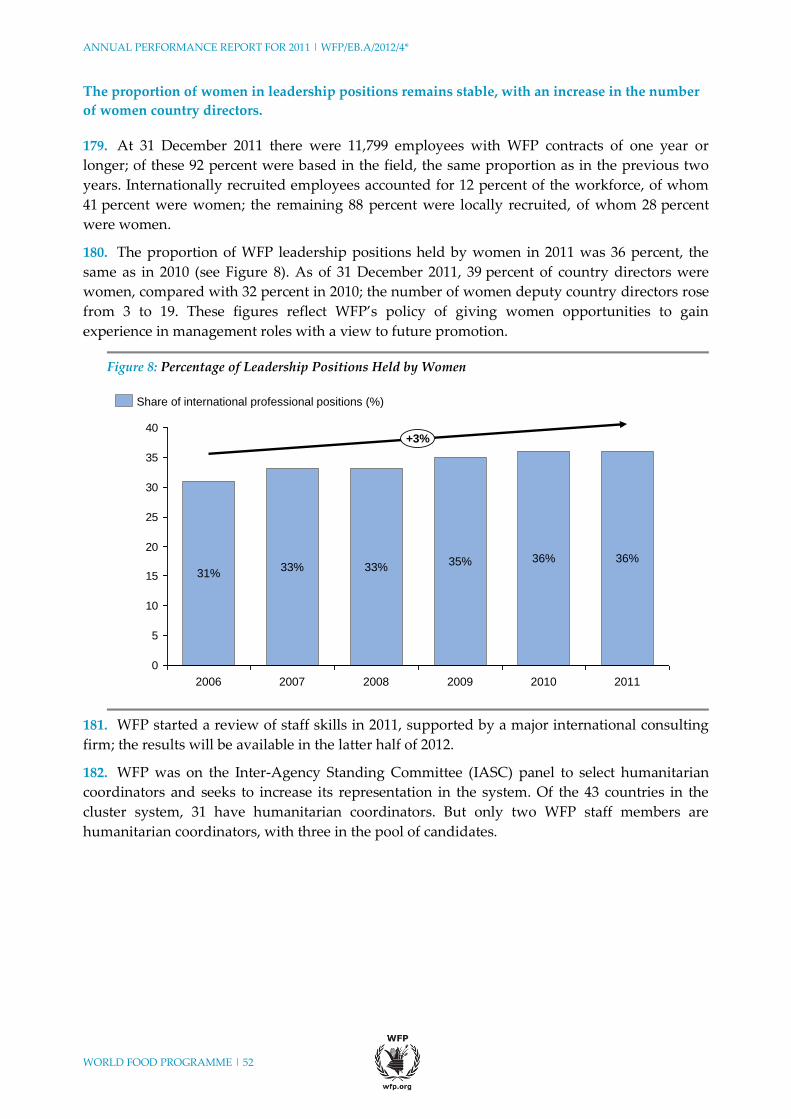
ANNUAL PERFORMANCE REPORT FOR 2011 | WFP/EB.A/2012/4*
WORLD FOOD PROGRAMME | 52
The proportion of women in leadership positions remains stable, with an increase in the number
of women country directors.
179. At 31 December 2011 there were 11,799 employees with WFP contracts of one year or
longer; of these 92 percent were based in the field, the same proportion as in the previous two
years. Internationally recruited employees accounted for 12 percent of the workforce, of whom
41 percent were women; the remaining 88 percent were locally recruited, of whom 28 percent
were women.
180. The proportion of WFP leadership positions held by women in 2011 was 36 percent, the
same as in 2010 (see Figure 8). As of 31 December 2011, 39 percent of country directors were
women, compared with 32 percent in 2010; the number of women deputy country directors rose
from 3 to 19. These figures reflect WFP’s policy of giving women opportunities to gain
experience in management roles with a view to future promotion.
Figure 8: Percentage of Leadership Positions Held by Women
181. WFP started a review of staff skills in 2011, supported by a major international consulting
firm; the results will be available in the latter half of 2012.
182. WFP was on the Inter-Agency Standing Committee (IASC) panel to select humanitarian
coordinators and seeks to increase its representation in the system. Of the 43 countries in the
cluster system, 31 have humanitarian coordinators. But only two WFP staff members are
humanitarian coordinators, with three in the pool of candidates.
0
5
10
15
20
25
30
35
40
2011
36%
2010
36%
2009
35%
2008
33%
2007
33%
2006
31%
+3%
Share of international professional positions (%)

ANNUAL PERFORMANCE REPORT FOR 2011 | WFP/EB.A/2012/4*
WORLD FOOD PROGRAMME | 53
Improving career management and the staffing review process in country offices (efficiency example)
In 2011, WFP established a new career model for international professional staff to reflect the growing complexity of
its work and the needs of its workforce and to enhance its ability to attract and retain staff. The aim is to improve
transparency and consistency in recruitment, promotion and reassignment. Mobility is a major feature of this career
model, but a small number of positions will be designated “non-rotational” because of the specialized nature of the
work involved.
WFP developed a structure and staffing review toolkit to enhance transparency in workforce planning and to
provides a roadmap for country directors and Human Resources Division (HR) staff to enable them to align
organizational structures and positions with operational needs and the resources available.
The Colombia country office used the toolkit to review its staffing structure in 2011 to prepare for a new PRRO that
involved a shift from food-based activities to technical support to promote national ownership: the toolkit promoted
collaboration among staff at the country, regional and Headquarters levels to ensure that optimum staffing levels
were achieved.

ANNUAL PERFORMANCE REPORT FOR 2011 | WFP/EB.A/2012/4*
WORLD FOOD PROGRAMME | 54
Management Result Dimension 2 – Stewardship
183. Stewardship refers to effective management of the resources under WFP’s control. Table 3
shows progress made in utilizing funds according to plan, establishing improved management
controls and ensuring the safety and well-being of staff. Additional performance indicators
under this dimension are reported in Annex III.
Table 3: Stewardship
2011 2010 Progress
% of expenditures on food
Actual versus planned 63 57
Number of high-risk oversight recommendations outstanding 15 22
% post-delivery losses 0.45 0.31
Security incidents 786 785
MOSS compliance rate (%) 60 92
WFP’s expenses fall as operational activity declines.
184. In 2011, WFP spent US$4.02 billion – 5 percent less than in 2010. The tonnage of food
delivered fell by 17 percent, from 4.6 million mt in 2010 to 3.8 million mt in 2011;39 this is
reflected in reduced expenses and an increase in the use of assistance tools such as cash and
vouchers. Of the total food budget, 63 percent was expended.
185. In 2011, the average time elapsing before contributions were collected was 6.3 months; this
is less than in 2010 but similar to earlier years. Prompt collection of contributions gives WFP the
flexibility to use them to improve the delivery times, for example by using advance financing
mechanisms or by pre-positioning food. Increases in the use of nutritious products with longer
lead times and shelf life explain the increase from 3.7 months to 4.1 months in the time taken to
turn inventories over.
Table 4: Financial Ratios (months)
2011 2010
Average collection period for contributions receivable 6.3 7.6
Inventory balances held 4.1 3.7
186. The overall deficit over expenses in 2011 was US$280.7 million, compared with a surplus of
US$28.5 million in 2010. This is primarily a result of:
a decrease in contribution revenue of US$533.3 million, from US$4,129.8 million in
2010 to US$3.6 billion in 2011; and
a decrease in spending of US$220.9 million, from US$4.24 billion in 2010 to
US$4.02 billion in 2011.
39 The total amount actually distributed to beneficiaries in 2011 was 3.6 million mt. Source: SPRs.
ANNUAL PERFORMANCE REPORT FOR 2011 | WFP/EB.A/2012/4*
WORLD FOOD PROGRAMME | 55
187. The deficit is a natural consequence of a lower level of programme activities and income in
2011. WFP’s financial position continues to be healthy.40
More effective managerial controls resulted in a Statement on Internal Control in the
2011 Financial Statements.
188. WFP continues to implement the Strengthening Managerial Control and
Accountability (SMCA) initiative. In March 2012 WFP became one of the few United Nations
organizations to provide a formal statement on the effectiveness of internal controls in its annual
accounts.
189. WFP has provided managers with better tools to enhance internal controls such as
self-assessment checklists and individualized guidance and is sharing its SMCA experience with
the other Rome-based agencies. A new process for collecting internal control statements from all
WFP Directors achieved a 100 percent response rate against tight deadlines, which reflects the
importance attached to internal control. Further improvements in 2012 will include the issue of
an expanded Financial Resources Management Manual and a new WFP-specific HR manual.
190. A proxy indicator of the effectiveness of internal control is the volume of internal audit
recommendations that have not been implemented. A new process established in 2010 as part of
SMCA for more rigorous follow-up of internal audit recommendations has identified issues
requiring attention and increased managers’ awareness of the importance of internal controls.
191. It takes time to respond to oversight recommendations, and there will always be
recommendations outstanding. The number of high-risk recommendations outstanding at the
end of December 2011 fell from 22 to 15. A similar level of attention must be given to the more
numerous medium-risk internal audit recommendations, and the performance indicator must
reflect the time lapse between recommendation and resolution. In 2012, WFP will use a more
rigorous indicator that covers high-risk and medium-risk recommendations and reports on all
recommendations outstanding for more than a year. This will give a more robust analysis of the
effectiveness of WFP’s work on improving managerial controls.
Performance and risk management processes are firmly established, but need time to mature.
192. Performance and risk management processes improved in 2011 following the issue of the
“wheel for performance” in 2010. WFP has enhanced the corporate Management Results
Framework (MRF) for use from 2012 and has improved organizational capacities for
performance and risk management at all levels. WFP is now positioned for more rigorous
results-based management and response to implementation risks.
193. The Management Plan (2012–2014) sets out for the first time priorities and resource
requirements on the basis of the Strategic Objectives and the Management Result Dimensions.
Most WFP offices are engaged in performance planning and monitoring; they conduct regular
risk assessments and maintain risk registers. But performance and risk-management gaps still
exist. The challenge for the year ahead is to accelerate decision-making, for which WFP is
establishing a new IT system for performance and risk management information using an SAP
platform like WINGS II. It will replace the variety of tools currently used, and will reduce data
input costs and the management of performance and risk information, thereby increasing
transparency and enhancing decision-making.
40 See WFP’s audited annual accounts.

ANNUAL PERFORMANCE REPORT FOR 2011 | WFP/EB.A/2012/4*
WORLD FOOD PROGRAMME | 56
Post-delivery losses increased in 2011, but the trend in past years has been downward.
194. In spite of a downward trend in recent years, post-delivery losses in 2011 were higher than
in 2010 at 0.45 percent of total food handled (see Figure 9). This reflects the flooding in Pakistan,
transport losses in the Sudan and thefts during the conflict in Côte d’Ivoire.
Figure 9: Post-Delivery Losses
Challenges remain in ensuring the safety and well-being of WFP employees.
195. In 2011, four WFP national staff members lost their lives in the line of duty as a result of
armed attacks in Ethiopia, Somalia and South Sudan. There were no fatalities from armed
attacks in 2010, but there had been nine in 2009.
196. There were 786 security incidents involving WFP staff and assets in 2011, of which
491 occurred in the line of duty – 12 percent less than the 553 incidents in 2010. These figures
reflect the increase in incident reporting in recent years and the effectiveness of WFP’s security
risk management measures.
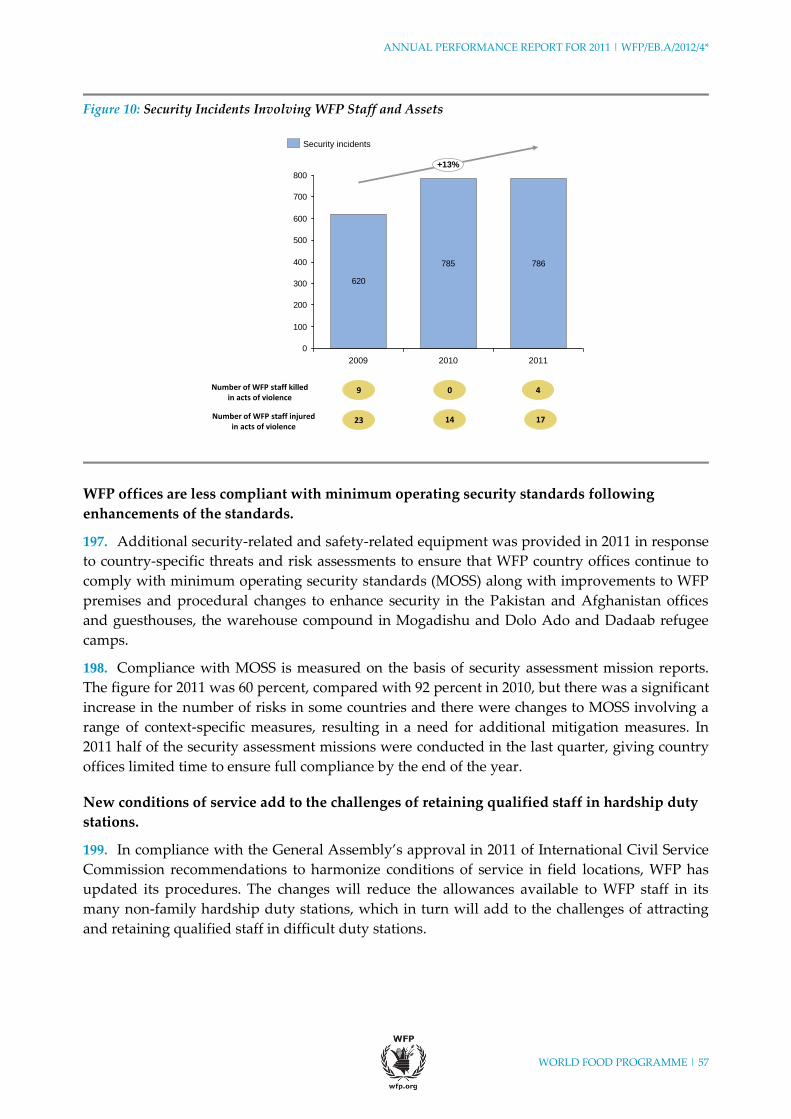
ANNUAL PERFORMANCE REPORT FOR 2011 | WFP/EB.A/2012/4*
WORLD FOOD PROGRAMME | 57
Figure 10: Security Incidents Involving WFP Staff and Assets
WFP offices are less compliant with minimum operating security standards following
enhancements of the standards.
197. Additional security-related and safety-related equipment was provided in 2011 in response
to country-specific threats and risk assessments to ensure that WFP country offices continue to
comply with minimum operating security standards (MOSS) along with improvements to WFP
premises and procedural changes to enhance security in the Pakistan and Afghanistan offices
and guesthouses, the warehouse compound in Mogadishu and Dolo Ado and Dadaab refugee
camps.
198. Compliance with MOSS is measured on the basis of security assessment mission reports.
The figure for 2011 was 60 percent, compared with 92 percent in 2010, but there was a significant
increase in the number of risks in some countries and there were changes to MOSS involving a
range of context-specific measures, resulting in a need for additional mitigation measures. In
2011 half of the security assessment missions were conducted in the last quarter, giving country
offices limited time to ensure full compliance by the end of the year.
New conditions of service add to the challenges of retaining qualified staff in hardship duty
stations.
199. In compliance with the General Assembly’s approval in 2011 of International Civil Service
Commission recommendations to harmonize conditions of service in field locations, WFP has
updated its procedures. The changes will reduce the allowances available to WFP staff in its
many non-family hardship duty stations, which in turn will add to the challenges of attracting
and retaining qualified staff in difficult duty stations.
620
785 786
0
100
200
300
400
500
600
700
800
+13%
201120102009
Number of WFP staff killed in acts of violence
9 0 4
Security incidents
Number of WFP staff injured in acts of violence
23 14 17
ANNUAL PERFORMANCE REPORT FOR 2011 | WFP/EB.A/2012/4*
WORLD FOOD PROGRAMME | 58
WFP staff work in operational environments with significant health and psycho-social risks.
200. WFP’s medical services protect staff exposed to communicable diseases such as polio,
yellow fever and cholera and address staff health and occupational safety issues. Preventive
support such as information on health and safety measures was provided for staff in the Japan
liaison office during the relief operation following the nuclear emergency in Fukushima; this
material was used by the United Nations Department of Safety and Security (UNDSS) to brief
United Nations staff deployed to Japan.
201. The Staff Counselling Unit supports WFP staff in mitigating the impact of daily and
traumatic stress and helps them to maintain healthy lifestyles and a positive outlook in spite of
difficult and hazardous conditions. Professional staff counsellors in each region made regular
visits to country offices to provide post-trauma debriefings in countries affected by natural
disasters and violence: these included Burkina Faso, Côte d’Ivoire, Ethiopia, Kenya, Nepal,
Pakistan and Somalia. In country offices undergoing downsizing, staff counsellors conducted
workshops and provided support to ease the process and helped with team-building retreats.
The staff counsellors continued to select, train and supervise 300 peer-support volunteers to
promote access to counselling at all WFP duty stations.
Ethics Office and Ombudsman activities in 2011
202. WFP’s Ethics Office was established in January 2008 to assist the Executive Director in
ensuring that all staff carry out their functions with the highest standards of integrity, as
required by the United Nations Charter and the Standards of Conduct for international civil
servants. The Ethics Office: i) develops ethical standards and training; ii) administers WFP’s
policy on protection against retaliation for reporting misconduct – “whistle-blower protection”;
iii) administers a confidential on-line financial disclosure programme; and iv) provides
confidential advice for managers and staff on real or potential conflicts of interest and other
ethics issues.
203. In 2011, the Ethics Office collaborated with the WFP Ombudsman to train “ethics
ambassadors” in Asia and provided extended person-to-person ethics awareness training for
country directors in southern Africa; it also collaborated with HR to brief new staff on standards
of integrity. In the 2011 financial disclosure programme, the Ethics Office reviewed statements
by 1,500 staff for potential conflicts of interest; it also registered 107 requests for advice on issues
unrelated to financial disclosure compared with 67 in 2010, reflecting the expansion of its
advisory and guidance functions. Advice was sought on common conflicts of interest such as
outside activities, gifts, awards, hospitality, code of conduct issues and employment.
204. The Director of the Ethics Office participated in two meetings of the Ethics Network of
Multilateral Organizations in 2011 and in all nine meetings of the United Nations Ethics
Committee, which continues to be an excellent forum for establishing best practices and for
harmonizing ethical standards.

ANNUAL PERFORMANCE REPORT FOR 2011 | WFP/EB.A/2012/4*
WORLD FOOD PROGRAMME | 59
205. WFP appointed a new Ombudsman in 2011, whose services were utilized by
252 employees, 67 percent of whom were field-based. The issue most frequently raised was
“respect”, which accounted for 25 percent of visits to the Ombudsman’s office; 14 percent of
visitors were affected by funding and programmatic adjustments resulting in the abolition of
posts or re-classification to a lower grade. As in previous years, concerns were raised as to the
way in which the reviews were managed and communicated, the criteria used and the
transparency of the process. New guidance issued by HR should help to reduce such concerns in
future. Service contract holders in particular were concerned about career progression and
development.
WFP continues to manage its brand and reputation and to increase positive visibility.
206. In 2011, WFP increased its engagement with relevant groups, using traditional and new
media such as internet platforms to make itself more accessible. Guidance was provided to raise
the profile of WFP operations and to mitigate the reputational risk related to its presence in
remote and insecure areas in 70 countries.
207. WFP’s work was referred to in 79,000 news clips in 2011 in Australia, Canada, Denmark,
Finland, France, Germany, Ireland, Italy, Japan, Norway, Sweden, the Netherlands, the
United Kingdom and the United States, a 37 percent increase from the 57,534 in 2010. Combined
with free exposure through pro-bono advertising, this coverage was worth millions of dollars.
The known value of donated television spots and print advertising was US$84.8 million in 2011,
during which WFP engaged entertainers and celebrities from cinema, television, sports and
music in advocacy and on-line fundraising initiatives.
208. WFP used the internet and social media in innovative ways for advocacy and fundraising.
Traffic to wfp.org in its various language versions increased by 73 percent to 5.3 million visits
compared with 3.9 million in 2010. WFP increased its presence in Facebook, Twitter, YouTube
and Freerice by 124 percent, generating 756,000 subscribers compared with 337,000 in 2010.
Climate-Neutral Implementation (efficiency example)
WFP is among the first United Nations agencies to commit to a reduction in greenhouse gas emissions. Its target is a
10 percent reduction by 2013 from 2008 to save 8,657 mt in annual emissions, equivalent to US$3.3 million in energy
and fuel costs. The climate-neutral strategy was developed during 2011 in consultation with stakeholders and
endorsed by the Executive Management Council in January 2012. Progress is monitored annually. The strategy gives
WFP opportunities to reduce costs significantly while setting an example on environmental management.
The strategy identifies potential environmental efficiencies, sets targets and measures performance, as advocated
by WFP's Value for Money Task Force.
Successful implementation will require the commitment of staff at all levels. The focus will be on the ten largest
country operations which account for 60 percent of WFP's carbon footprint. WFP will support implementation with
advice, tools, supplementary funding and materials to facilitate change provided from an energy-efficiency fund.
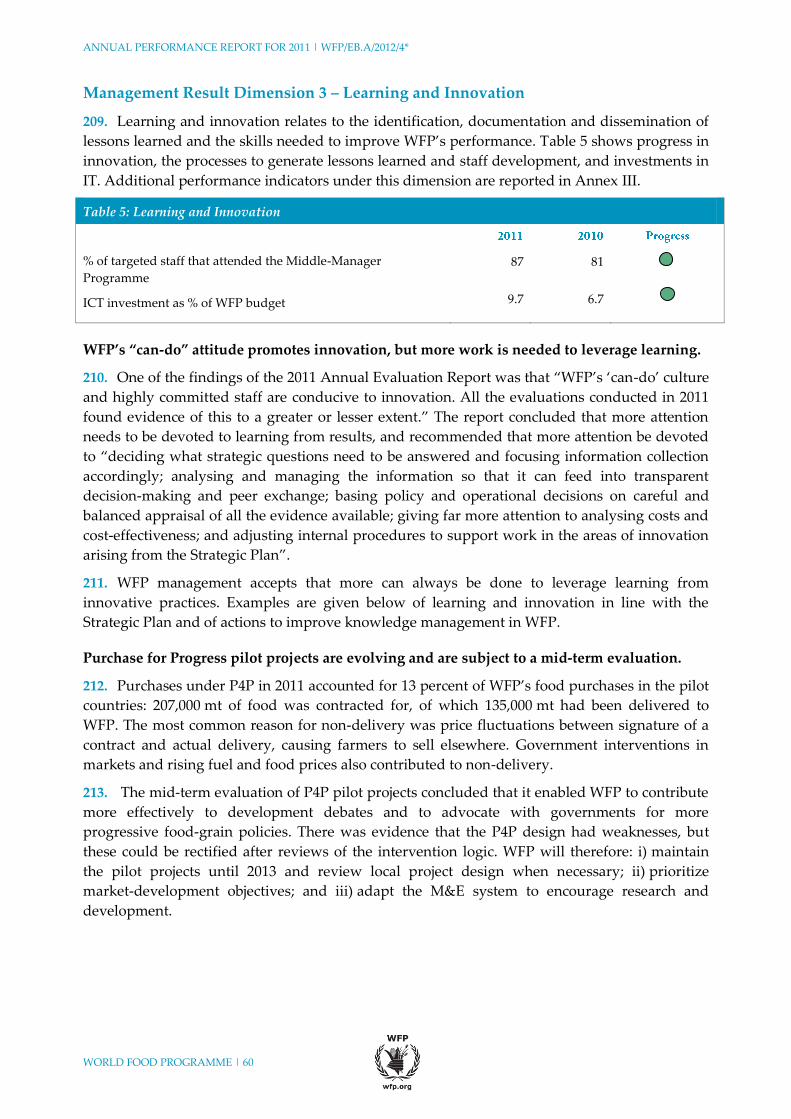
ANNUAL PERFORMANCE REPORT FOR 2011 | WFP/EB.A/2012/4*
WORLD FOOD PROGRAMME | 60
Management Result Dimension 3 – Learning and Innovation
209. Learning and innovation relates to the identification, documentation and dissemination of
lessons learned and the skills needed to improve WFP’s performance. Table 5 shows progress in
innovation, the processes to generate lessons learned and staff development, and investments in
IT. Additional performance indicators under this dimension are reported in Annex III.
Table 5: Learning and Innovation
% of targeted staff that attended the Middle-Manager
Programme
87 81
ICT investment as % of WFP budget 9.7 6.7
WFP’s “can-do” attitude promotes innovation, but more work is needed to leverage learning.
210. One of the findings of the 2011 Annual Evaluation Report was that “WFP’s ‘can-do’ culture
and highly committed staff are conducive to innovation. All the evaluations conducted in 2011
found evidence of this to a greater or lesser extent.” The report concluded that more attention
needs to be devoted to learning from results, and recommended that more attention be devoted
to “deciding what strategic questions need to be answered and focusing information collection
accordingly; analysing and managing the information so that it can feed into transparent
decision-making and peer exchange; basing policy and operational decisions on careful and
balanced appraisal of all the evidence available; giving far more attention to analysing costs and
cost-effectiveness; and adjusting internal procedures to support work in the areas of innovation
arising from the Strategic Plan”.
211. WFP management accepts that more can always be done to leverage learning from
innovative practices. Examples are given below of learning and innovation in line with the
Strategic Plan and of actions to improve knowledge management in WFP.
Purchase for Progress pilot projects are evolving and are subject to a mid-term evaluation.
212. Purchases under P4P in 2011 accounted for 13 percent of WFP’s food purchases in the pilot
countries: 207,000 mt of food was contracted for, of which 135,000 mt had been delivered to
WFP. The most common reason for non-delivery was price fluctuations between signature of a
contract and actual delivery, causing farmers to sell elsewhere. Government interventions in
markets and rising fuel and food prices also contributed to non-delivery.
213. The mid-term evaluation of P4P pilot projects concluded that it enabled WFP to contribute
more effectively to development debates and to advocate with governments for more
progressive food-grain policies. There was evidence that the P4P design had weaknesses, but
these could be rectified after reviews of the intervention logic. WFP will therefore: i) maintain
the pilot projects until 2013 and review local project design when necessary; ii) prioritize
market-development objectives; and iii) adapt the M&E system to encourage research and
development.
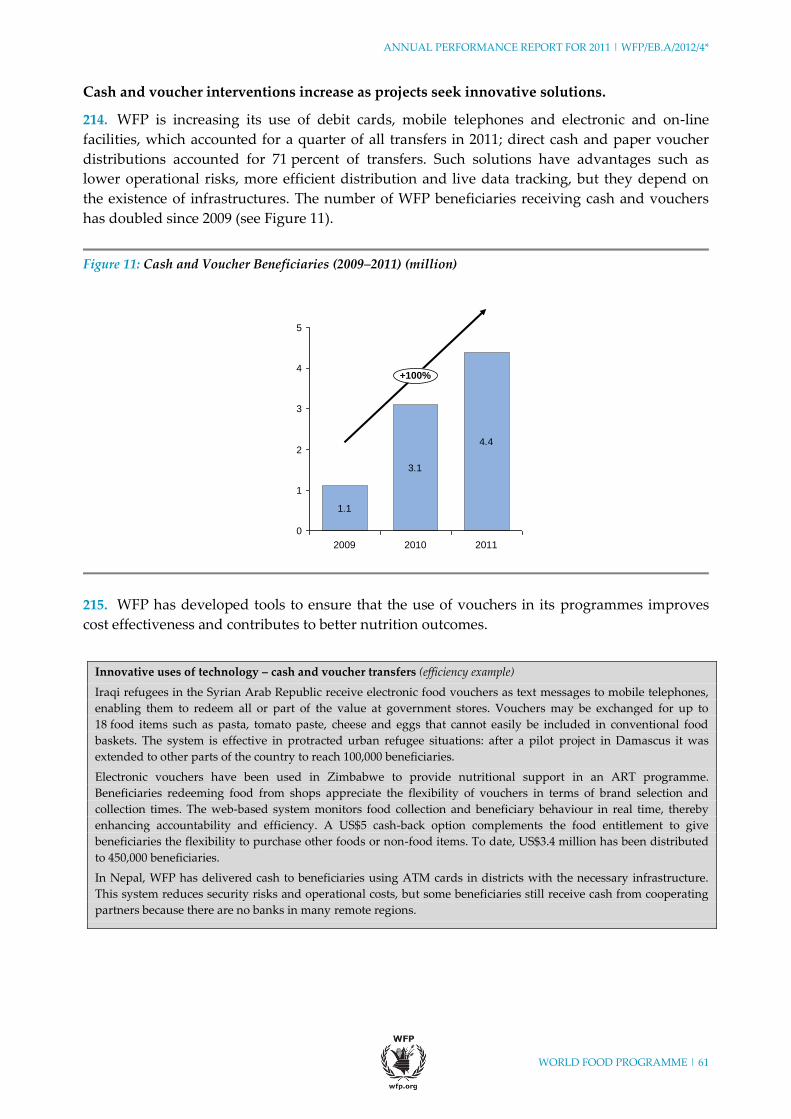
ANNUAL PERFORMANCE REPORT FOR 2011 | WFP/EB.A/2012/4*
WORLD FOOD PROGRAMME | 61
Cash and voucher interventions increase as projects seek innovative solutions.
214. WFP is increasing its use of debit cards, mobile telephones and electronic and on-line
facilities, which accounted for a quarter of all transfers in 2011; direct cash and paper voucher
distributions accounted for 71 percent of transfers. Such solutions have advantages such as
lower operational risks, more efficient distribution and live data tracking, but they depend on
the existence of infrastructures. The number of WFP beneficiaries receiving cash and vouchers
has doubled since 2009 (see Figure 11).
Figure 11: Cash and Voucher Beneficiaries (2009–2011) (million)
215. WFP has developed tools to ensure that the use of vouchers in its programmes improves
cost effectiveness and contributes to better nutrition outcomes.
Innovative uses of technology – cash and voucher transfers (efficiency example)
Iraqi refugees in the Syrian Arab Republic receive electronic food vouchers as text messages to mobile telephones,
enabling them to redeem all or part of the value at government stores. Vouchers may be exchanged for up to
18 food items such as pasta, tomato paste, cheese and eggs that cannot easily be included in conventional food
baskets. The system is effective in protracted urban refugee situations: after a pilot project in Damascus it was
extended to other parts of the country to reach 100,000 beneficiaries.
Electronic vouchers have been used in Zimbabwe to provide nutritional support in an ART programme.
Beneficiaries redeeming food from shops appreciate the flexibility of vouchers in terms of brand selection and
collection times. The web-based system monitors food collection and beneficiary behaviour in real time, thereby
enhancing accountability and efficiency. A US$5 cash-back option complements the food entitlement to give
beneficiaries the flexibility to purchase other foods or non-food items. To date, US$3.4 million has been distributed
to 450,000 beneficiaries.
In Nepal, WFP has delivered cash to beneficiaries using ATM cards in districts with the necessary infrastructure.
This system reduces security risks and operational costs, but some beneficiaries still receive cash from cooperating
partners because there are no banks in many remote regions.
1.1
3.1
4.4
0
1
2
3
4
5
+100%
201120102009
Cash and Vouchers Beneficiaries (million)

ANNUAL PERFORMANCE REPORT FOR 2011 | WFP/EB.A/2012/4*
WORLD FOOD PROGRAMME | 62
Innovation and learning needs to be built or drawn from results.
216. The following paragraphs outline actions in 2011 to improve knowledge management.
Lessons learned reviews after corporate emergencies
217. WFP has introduced an assessment of lessons learned after all corporate emergencies. The
recommendations are available at epweb.wfp.org and can be searched by operation and
function to enable managers to review and adopt recommendations for improvement.
Enhancing disaster-preparedness capabilities through simulations
218. WFP partnered civil and military disaster-response planners from 25 countries in 2011 to
enhance national disaster-preparedness and response-management capabilities through
simulations, exercises and technical assistance packages:
In July, a readiness-and-response exercise was carried out with partners to validate national
and regional systems in West Africa. It addressed cross-cutting themes such as supply-chain
management, food security and the scaling up of humanitarian operations, and highlighted
best practices and opportunities for improving humanitarian operations in poor urban areas.
In September, WFP and the United Nations influenza coordinator co-chaired a conference in
Rome with national disaster-response planners, humanitarian partners and private-sector
organizations to highlight public health best practices that can be integrated into
emergency-preparedness mechanisms.
Establishing focal points for following up oversight recommendations
219. WFP has established protocols for the consideration of all oversight reports and
recommendations. These involve the appointment of focal points to interact with oversight
teams and to follow up recommendations; corporate focal points are in the
Resource Management and Accountability Department. The Executive Director has assigned
responsibility for evaluating internal control challenges to the Chief Financial Officer with a
view to improving knowledge management in relation to accountability and governance issues.
Learning is enhanced through implementation of evaluation recommendations.
220. WFP has addressed 339 recommendations from 40 evaluation reports issued between 2008
and 2011 – 80 percent of the agreed actions; 87 actions are pending and will be addressed in
2012; accountable managers and timelines for action have been identified. Implementation
reports are shared with the Board. Reliable benchmarks are not available, but the Secretariat
considers that the 80 percent implementation rate reflects its commitment to learning from
results.
ANNUAL PERFORMANCE REPORT FOR 2011 | WFP/EB.A/2012/4*
WORLD FOOD PROGRAMME | 63
Using a country portfolio evaluation to make positive changes in strategy and programming
In 2009, the country office in the Lao People’s Democratic Republic faced a challenge: it had a variety of programme
activities in different provinces but was not sure if they were achieving optimum impact. It therefore asked the Office
of Evaluation for a country portfolio evaluation and recommendations as to the way forward. The evaluation mission
consulted 100 people from the Government, communities, donors, United Nations agencies and NGOs, confirming
that many of the activities were in line with government policies. Its main recommendation, however, was that the
country office establish a unifying goal for its work.
This was addressed through a new country strategy. Undernutrition was identified as the most pressing hunger issue:
the Government was committed to addressing it with a view to achieving the MDGs and graduating from LDC status.
In previous years WFP had drawn attention to critical undernutrition in a comprehensive food security and
vulnerability assessment and had contributed to the development of the national nutrition strategy. The reduction of
undernutrition was hence the natural goal to unify the country strategy.
The country office identified three priorities: reduce wasting, stunting and micronutrient deficiencies, with
measurable targets. This led to a country programme with activities that complemented each other for maximum
impact in particular areas such as mother-and-child health and nutrition, school meals, and livelihood initiatives for
nutrition. Implemented together in a life-cycle approach, they could help to break the inter-generational transmission
of stunting. The country office is increasingly viewed as a leader in nutrition: its activities are now being implemented
and, thanks to the country portfolio evaluation and the country strategy, they are more focused and more likely to
achieve optimum impacts than they were two years ago.
Developing comparative measures of output enhances WFP projects.
221. Output measures are management tools for increased efficiency. As WFP moves from food
aid to food assistance, it requires a measure of output covering food-based and non-food-based
interventions. WFP is therefore developing a comparative standardized proxy for its food
outputs that measures the nutritional value of the food delivered, rather than tonnage or
kilocalories, and enables comparison of changes in outputs over time or in similar contexts or in
different types of intervention. There are, of course, certain inherent limitations because of the
diversity of WFP operations.
222. WFP has developed an initial measure called “nutritional rations delivered” that integrates
several output variables: the number of days on which a beneficiary receives assistance, the
amount of food received and the nutritional value of the food. It will continue to develop such
robust output measures.
Staff development continues.
223. WFP continued to train staff in leadership and management skills in 2011: 340 participants
– 50 percent of the target of P4s, P5s and D1s – have participated in the Management
Assessment Centre since 2008, and 200 staff have completed the middle-manager programme,
which targets P3 and P4 staff and national officers at equivalent grades with supervisory and
managerial duties. The aim is to establish a pipeline of future WFP managers.
224. WFP’s online learning management system was expanded to include 300 e-learning
courses and 460 video simulations. It is accessible to 91 percent of employees; nine countries do
not yet have high-speed communication links. This issue is being addressed under the
Foodlink IT project with a view to giving all staff access to all of WFP’s systems.
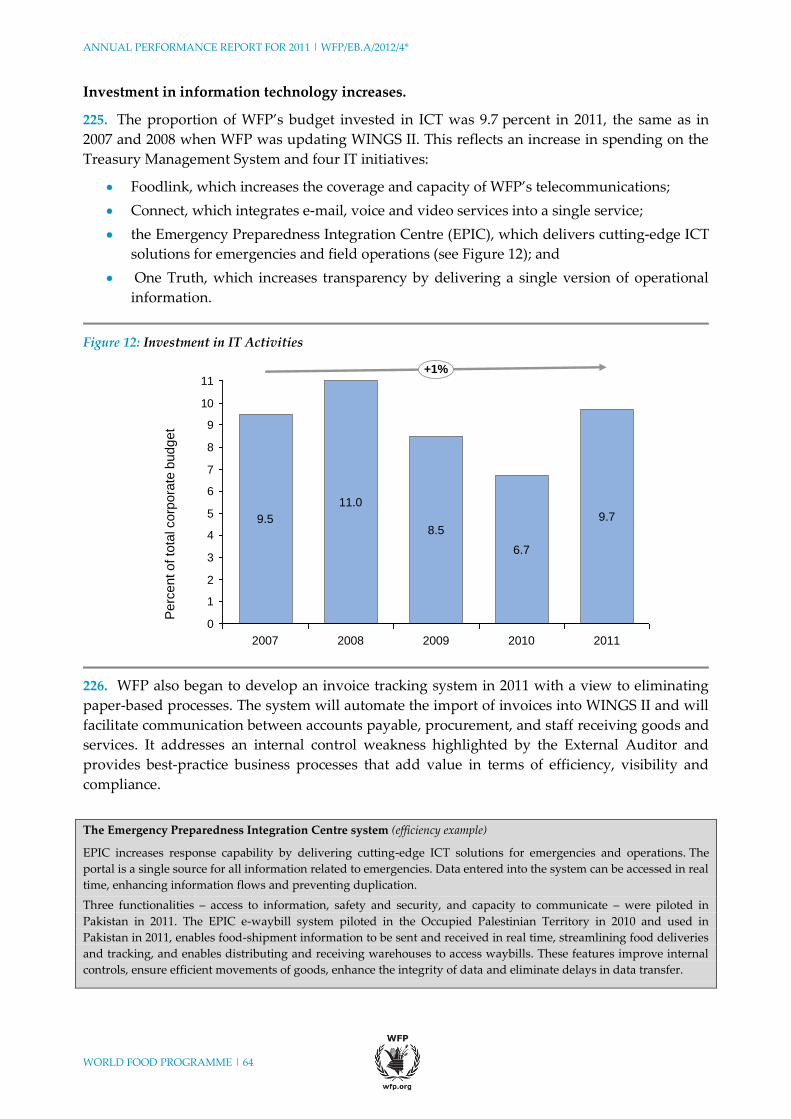
ANNUAL PERFORMANCE REPORT FOR 2011 | WFP/EB.A/2012/4*
WORLD FOOD PROGRAMME | 64
Investment in information technology increases.
225. The proportion of WFP’s budget invested in ICT was 9.7 percent in 2011, the same as in
2007 and 2008 when WFP was updating WINGS II. This reflects an increase in spending on the
Treasury Management System and four IT initiatives:
Foodlink, which increases the coverage and capacity of WFP’s telecommunications;
Connect, which integrates e-mail, voice and video services into a single service;
the Emergency Preparedness Integration Centre (EPIC), which delivers cutting-edge ICT
solutions for emergencies and field operations (see Figure 12); and
One Truth, which increases transparency by delivering a single version of operational
information.
Figure 12: Investment in IT Activities
226. WFP also began to develop an invoice tracking system in 2011 with a view to eliminating
paper-based processes. The system will automate the import of invoices into WINGS II and will
facilitate communication between accounts payable, procurement, and staff receiving goods and
services. It addresses an internal control weakness highlighted by the External Auditor and
provides best-practice business processes that add value in terms of efficiency, visibility and
compliance.
The Emergency Preparedness Integration Centre system (efficiency example)
EPIC increases response capability by delivering cutting-edge ICT solutions for emergencies and operations. The
portal is a single source for all information related to emergencies. Data entered into the system can be accessed in real
time, enhancing information flows and preventing duplication.
Three functionalities – access to information, safety and security, and capacity to communicate – were piloted in
Pakistan in 2011. The EPIC e-waybill system piloted in the Occupied Palestinian Territory in 2010 and used in
Pakistan in 2011, enables food-shipment information to be sent and received in real time, streamlining food deliveries
and tracking, and enables distributing and receiving warehouses to access waybills. These features improve internal
controls, ensure efficient movements of goods, enhance the integrity of data and eliminate delays in data transfer.
0
1
2
3
4
5
6
7
8
9
10
11
2010
+1%
2011
9.7
6.7
2009
8.5
2008
11.0
2007
9.5
Perc
ent of to
tal corp
ora
te b
udg
et
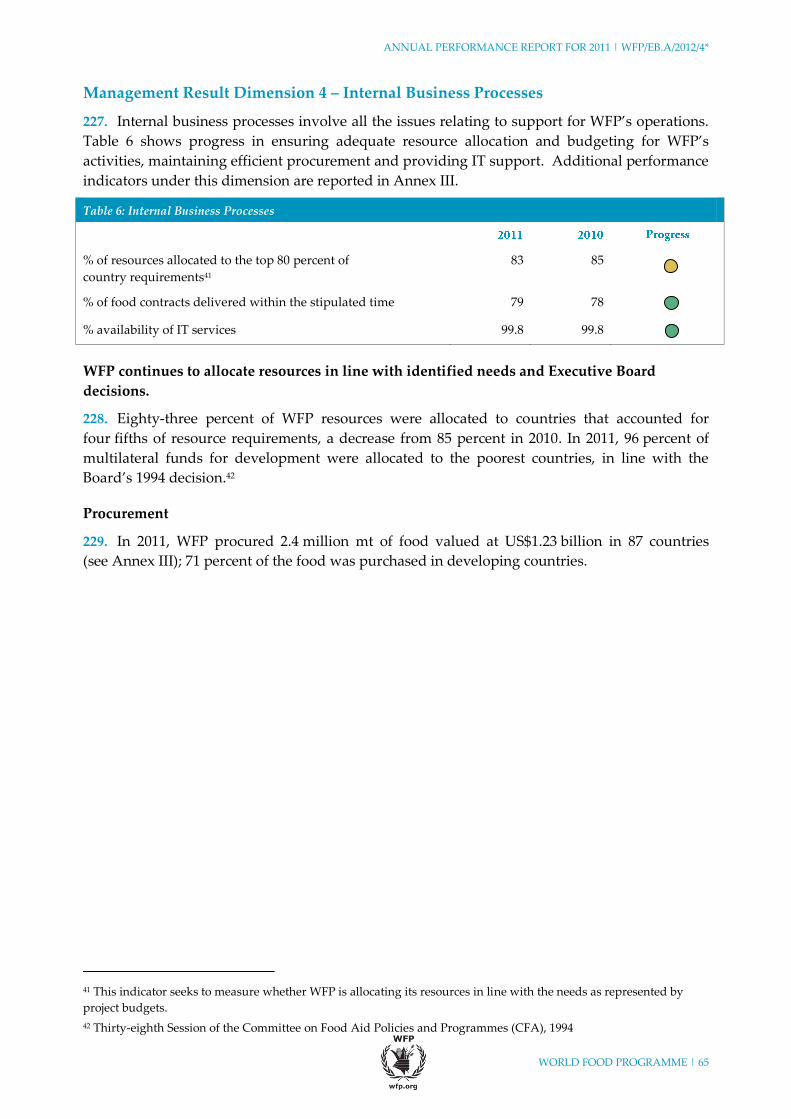
ANNUAL PERFORMANCE REPORT FOR 2011 | WFP/EB.A/2012/4*
WORLD FOOD PROGRAMME | 65
Management Result Dimension 4 – Internal Business Processes
227. Internal business processes involve all the issues relating to support for WFP’s operations.
Table 6 shows progress in ensuring adequate resource allocation and budgeting for WFP’s
activities, maintaining efficient procurement and providing IT support. Additional performance
indicators under this dimension are reported in Annex III.
Table 6: Internal Business Processes
% of resources allocated to the top 80 percent of
country requirements41
83 85
% of food contracts delivered within the stipulated time 79 78
% availability of IT services 99.8 99.8
WFP continues to allocate resources in line with identified needs and Executive Board
decisions.
228. Eighty-three percent of WFP resources were allocated to countries that accounted for
four fifths of resource requirements, a decrease from 85 percent in 2010. In 2011, 96 percent of
multilateral funds for development were allocated to the poorest countries, in line with the
Board’s 1994 decision.42
Procurement
229. In 2011, WFP procured 2.4 million mt of food valued at US$1.23 billion in 87 countries
(see Annex III); 71 percent of the food was purchased in developing countries.
41 This indicator seeks to measure whether WFP is allocating its resources in line with the needs as represented by
project budgets.
42 Thirty-eighth Session of the Committee on Food Aid Policies and Programmes (CFA), 1994
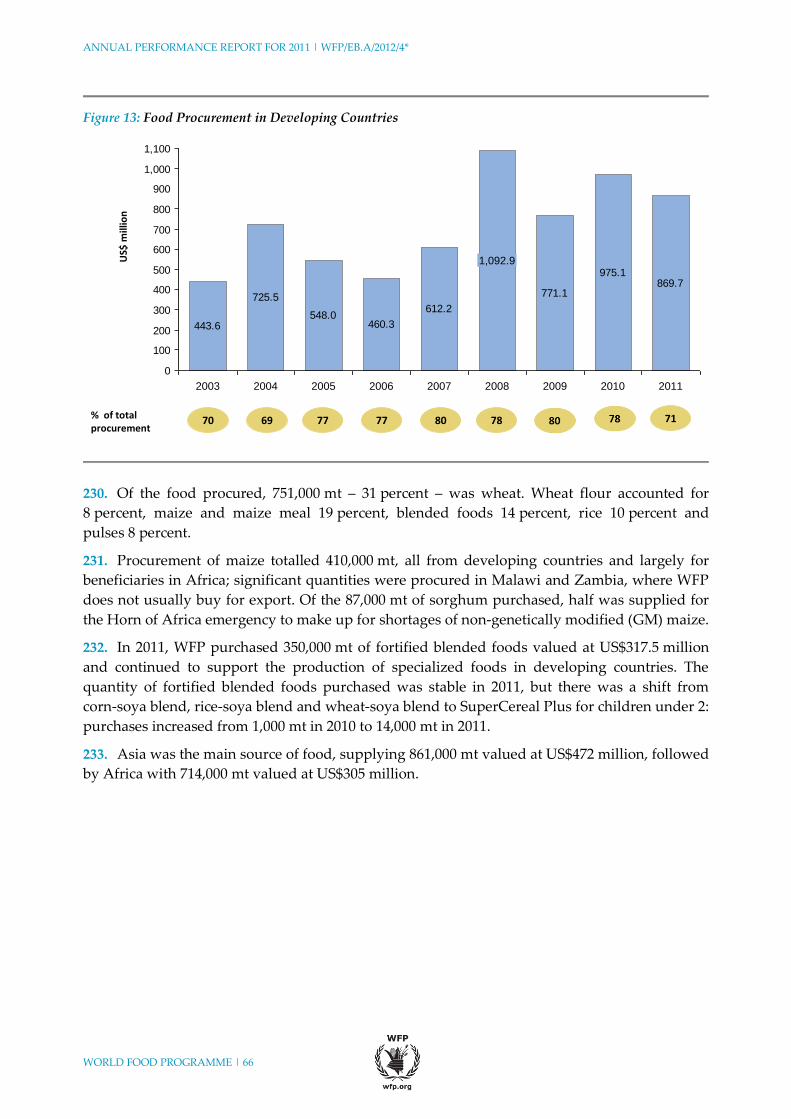
ANNUAL PERFORMANCE REPORT FOR 2011 | WFP/EB.A/2012/4*
WORLD FOOD PROGRAMME | 66
Figure 13: Food Procurement in Developing Countries
230. Of the food procured, 751,000 mt – 31 percent – was wheat. Wheat flour accounted for
8 percent, maize and maize meal 19 percent, blended foods 14 percent, rice 10 percent and
pulses 8 percent.
231. Procurement of maize totalled 410,000 mt, all from developing countries and largely for
beneficiaries in Africa; significant quantities were procured in Malawi and Zambia, where WFP
does not usually buy for export. Of the 87,000 mt of sorghum purchased, half was supplied for
the Horn of Africa emergency to make up for shortages of non-genetically modified (GM) maize.
232. In 2011, WFP purchased 350,000 mt of fortified blended foods valued at US$317.5 million
and continued to support the production of specialized foods in developing countries. The
quantity of fortified blended foods purchased was stable in 2011, but there was a shift from
corn-soya blend, rice-soya blend and wheat-soya blend to SuperCereal Plus for children under 2:
purchases increased from 1,000 mt in 2010 to 14,000 mt in 2011.
233. Asia was the main source of food, supplying 861,000 mt valued at US$472 million, followed
by Africa with 714,000 mt valued at US$305 million.
443.6
725.5
548.0460.3
612.2
771.1
975.1869.7
0
100
200
300
400
500
600
700
800
900
1,000
1,100
US$
mill
ion
20042003 20092008
1,092.9
2007 2011201020062005
70 69 77 77 80 78 71% of total procurement
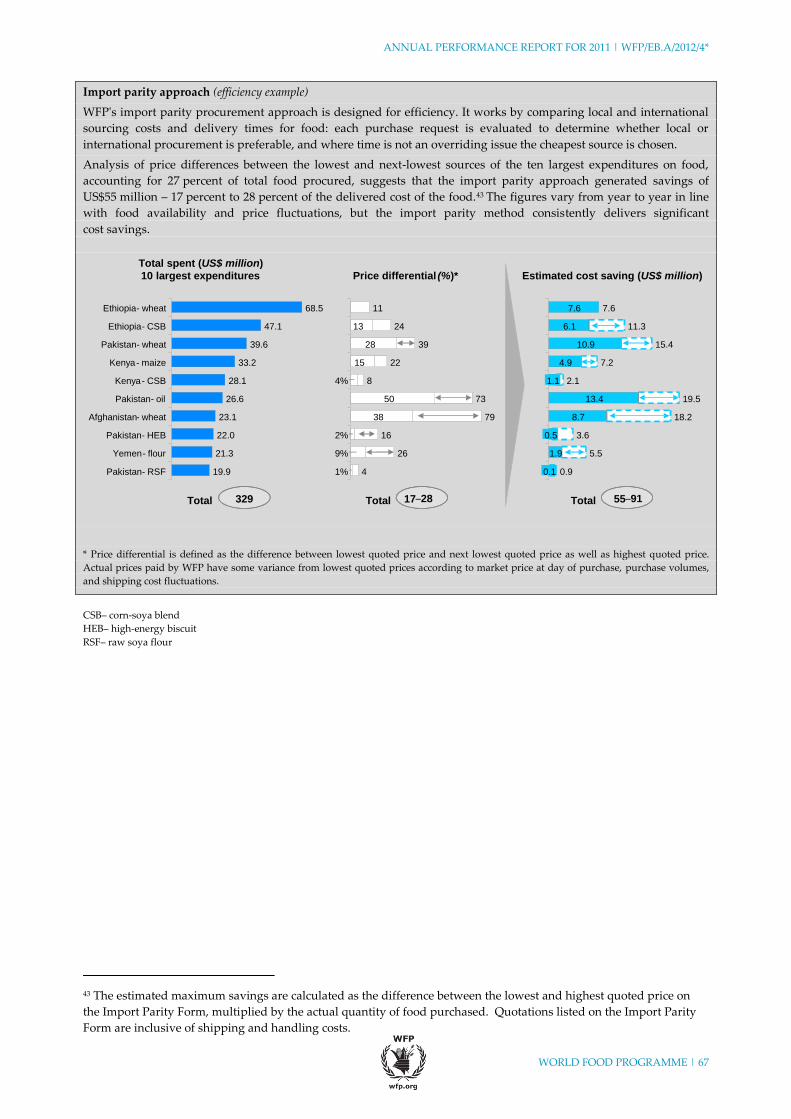
ANNUAL PERFORMANCE REPORT FOR 2011 | WFP/EB.A/2012/4*
WORLD FOOD PROGRAMME | 67
Import parity approach (efficiency example)
WFP's import parity procurement approach is designed for efficiency. It works by comparing local and international
sourcing costs and delivery times for food: each purchase request is evaluated to determine whether local or
international procurement is preferable, and where time is not an overriding issue the cheapest source is chosen.
Analysis of price differences between the lowest and next-lowest sources of the ten largest expenditures on food,
accounting for 27 percent of total food procured, suggests that the import parity approach generated savings of
US$55 million – 17 percent to 28 percent of the delivered cost of the food.43 The figures vary from year to year in line
with food availability and price fluctuations, but the import parity method consistently delivers significant
cost savings.
* Price differential is defined as the difference between lowest quoted price and next lowest quoted price as well as highest quoted price.
Actual prices paid by WFP have some variance from lowest quoted prices according to market price at day of purchase, purchase volumes,
and shipping cost fluctuations.
CSB– corn-soya blend
HEB– high-energy biscuit
RSF– raw soya flour
43 The estimated maximum savings are calculated as the difference between the lowest and highest quoted price on
the Import Parity Form, multiplied by the actual quantity of food purchased. Quotations listed on the Import Parity
Form are inclusive of shipping and handling costs.
Pakistan - RSF 19.9
Yemen - flour 21.3
Pakistan - HEB 22.0
Afghanistan - wheat 23.1
Pakistan - oil 26.6
Kenya - CSB 28.1
Kenya - maize 33.2
Pakistan - wheat 39.6
Ethiopia - CSB 47.1
Ethiopia - wheat 68.5
Total spent (US$ million)
10 largest expenditures Price differential (%)* Estimated cost saving (US$ million)
41%
269%
162%
7938
7350
84%
2215
3928
2413
11
0.90.1
5.51.9
3.60.5
18.28.7
19.513.4
1.1
7.24.9
15.410.9
11.36.1
7.67.6
2.1
Total Total Total329 17–28 55–91
ANNUAL PERFORMANCE REPORT FOR 2011 | WFP/EB.A/2012/4*
WORLD FOOD PROGRAMME | 68
234. WFP purchased 400,000 mt of food through the FPF on the basis of aggregate forecast
needs rather than project-specific needs, mostly for beneficiaries affected by drought in the
Horn of Africa and the Sahel.
Forward Purchase Facility (efficiency example)
In November 2010 the Board authorized an increase in the FPF special account from US$60 million to US$150 million,
and an advisory group was established to advise the Chief Financial Officer on the expansion of FPF. WFP is now
moving from a focus on one-off purchases to a demand-driven approach to purchase food ahead of individual project
requests.
After mid-year reviews and consultations WFP expanded the forward purchasing approach, starting with corridors in
eastern Africa and a team of experts reviewed systems and processes with a view to designing the platform needed to
mainstream forward purchasing.
By the end of 2011, FPF had enabled WFP to establish regular pipelines and improve the predictability of supply. The
launch of supply lines to eastern Africa and later to western Africa was critical in WFP’s response to the crises in the
Horn of Africa and the Sahel.
In 2011, WFP procured 400,000 mt of food worth US$200 million, including purchases of nutritious products through
FPF. In the first six months, 21 projects benefited from reductions averaging 52 days in delivery lead times.
Shipping cost savings were achieved.
235. WFP shipped 320,000 mt of food in 2011, a scale that enables it to make savings by
negotiating favourable prices and by handling shipping arrangements separately rather than
requesting suppliers to bundle shipping costs and food prices. These approaches have saved
US$10 million in expenditure compared with the cost of contracting shipping services through
food suppliers. WFP’s unloading and bagging arrangements yielded estimated savings of
US$600,000 in 2011.
Standby partners contributed to fast, cost-efficient response.
236. WFP’s standby partners are government agencies, NGOs and commercial companies that
have agreed to maintain a roster of rapidly deployable staff, services and equipment to support
EMOPs. These arrangements enable WFP to scale up EMOPs rapidly, deploy skills outside its
core competencies and reduce direct costs. In 2011, the value of contributions by standby
partners was estimated at US$17 million.
WFP operations are fully supported by ICT.
237. WFP policy is that humanitarian personnel must have access to communications facilities
at all times. Full ICT services were available in 99.8 percent of WFP offices in 2011, the same as in
2010: this reflects the establishment of WFP’s minimum security telecommunications
standards (MISTS) for its operations, which include minimum levels of equipment, maintenance
and network-security staff.
ANNUAL PERFORMANCE REPORT FOR 2011 | WFP/EB.A/2012/4*
WORLD FOOD PROGRAMME | 69
Facilities management improves.
238. In 2011, facilities management continued to improve internal processes and project
management to ensure that WFP has safe, functional, cost-effective and sustainable
buildings. The work included: i) development of a manual to ensure that risks are managed and
that WFP obtains value for money; ii) completion of the pilot phase of the corporate facilities
management system to be launched in 2012 to track WFP’s 1,500 buildings, which have an
annual rental value of US$40 million; iii) establishment of targets for greenhouse gas emissions;
and iv) improved engineering and management support for 87 projects in 51 countries for the
construction or renovation of warehouses, accommodation and roads. Field projects include the
construction of warehouses in Ethiopia and Pakistan and the UNHRD in Djibouti, which has a
budget of US$20 million. Renovation of the Red Tower enabled WFP to locate its Headquarters
offices in a single building, resulting in enhanced security and reduced running costs.
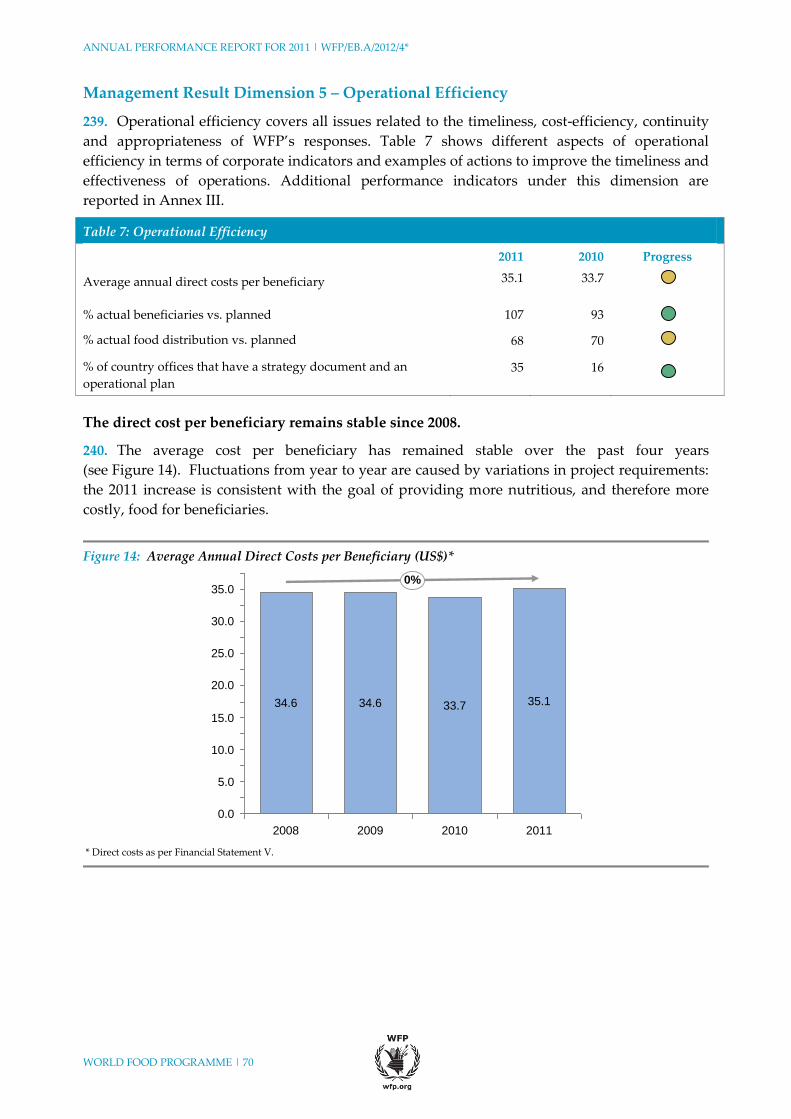
ANNUAL PERFORMANCE REPORT FOR 2011 | WFP/EB.A/2012/4*
WORLD FOOD PROGRAMME | 70
Management Result Dimension 5 – Operational Efficiency
239. Operational efficiency covers all issues related to the timeliness, cost-efficiency, continuity
and appropriateness of WFP’s responses. Table 7 shows different aspects of operational
efficiency in terms of corporate indicators and examples of actions to improve the timeliness and
effectiveness of operations. Additional performance indicators under this dimension are
reported in Annex III.
Table 7: Operational Efficiency
2011 2010 Progress
Average annual direct costs per beneficiary 35.1 33.7
% actual beneficiaries vs. planned 107 93
% actual food distribution vs. planned 68 70
% of country offices that have a strategy document and an
operational plan
35 16
The direct cost per beneficiary remains stable since 2008.
240. The average cost per beneficiary has remained stable over the past four years
(see Figure 14). Fluctuations from year to year are caused by variations in project requirements:
the 2011 increase is consistent with the goal of providing more nutritious, and therefore more
costly, food for beneficiaries.
Figure 14: Average Annual Direct Costs per Beneficiary (US$)*
35.0
30.0
25.0
20.0
15.0
10.0
5.0
0.0
0%
2011
35.1
2010
33.7
2009
34.6
2008
34.6
* Direct costs as per Financial Statement V.
ANNUAL PERFORMANCE REPORT FOR 2011 | WFP/EB.A/2012/4*
WORLD FOOD PROGRAMME | 71
Driving forward cost and efficiency savings in the Sudan (efficiency example)
Between 2009 and 2011, WFP Sudan reduced its EMOP budget by 34 percent from US$869 million to US$572 million
and the cost per beneficiary by 44 percent from US$140 to US$78. These savings were made by rationalizing
beneficiary caseloads and reducing or eliminating operational costs.
- Rationalizing beneficiary caseloads. Beneficiary caseloads were reduced on the basis of comprehensive food security
monitoring data and WFP’s food-assistance strategy: 1.2 million beneficiaries were graduated from food assistance
and a further 1 million were shifted from general food distribution to seasonal or targeted interventions. WFP Sudan
is using a verification system involving up-to-date beneficiary lists based on biometric data to achieve a further
reduction in its caseload.
- Reducing or eliminating costs across operations. Direct support costs fell by 46 percent between 2010 and 2011 as a
result of handing programmes over to the Government, merging and closing sub-offices, optimizing the workforce
through outsourcing and terminations, and reducing overhead costs by freezing capital investments and
administrative costs.
- Reducing other direct operating costs. WFP has reduced the average tonnage rate paid to partners by 15 percent and
worked with them to rationalize their operating costs and increase cost sharing by the Government.
- Reducing landside transport, shipping and handling costs. The cost per ton has fallen by an average of 23 percent as
a result of negotiating more favourable transport contracts, timely pre-positioning of food to avoid expensive airlifts,
workforce restructuring to reduce staff costs by 63 percent, and improved fleet management.
- Reducing the air service subsidy. The UNHAS budget fell by US$30 million – 33 percent – between 2009 and 2011 as
a result of long-term contracting of aircraft at improved rates and more efficient use of aircraft to reduce the number
in the fleet.
The country office has pursued these cost reductions in the context of its operational plan: these are lasting
improvements to efficiency and effectiveness rather than one-off cost savings.
WFP’s cost structure continues to evolve as Strategic Plan implementation continues.
241. Rising prices in 2011 resulted in a high proportion of expenditure on food, in spite of the
increasing number of cash and voucher projects. The increased proportion of other direct
operational costs and direct support costs reflected the increased number of high-risk security
environments in which WFP operates, the cost of unforeseen emergencies, the increase in
non-food projects and the move from food aid to food assistance. Transport and handling costs
continue to be lower than usual.

ANNUAL PERFORMANCE REPORT FOR 2011 | WFP/EB.A/2012/4*
WORLD FOOD PROGRAMME | 72
Figure 15: Direct Expenses by Cost Component (US$ million)
WFP responds rapidly to sudden emergencies.
242. WFP responded rapidly to sudden emergencies in 2011: half of its emergency responses
started on time, but some delays were experienced – for example in Syria – because of unrest
and insecurity.
Increasing emergency responsiveness – the role of UNHRDs (efficiency example)
The UNHRDs in Dubai, Italy, Ghana, Panama and Malaysia stockpile equipment to enable United Nations agencies
and NGOs to provide relief within 24 to 48 hours of an emergency anywhere in the world.
One advantage of the network is the aggregation of humanitarian and emergency storage needs, a service provided at
no cost to users. The UNHRDs are also staging areas where cargoes can be accumulated to optimize shipping
arrangements, decongest entry points and exploit economies of scale.
This integration of response stocks is a way of improving WFP’s emergency responsiveness, for example through
rapid deployment of non-food items and high-energy biscuits. In 2011, WFP began a review to optimize the type and
quantity of items to be pre-positioned. The 48 users of the network are harmonizing their stocks and eliminating the
use of their own markings so that stocks can be loaned to any user; this will also facilitate joint procurement of
non-food items at competitive prices.
The Country Strategy process continues to drive WFP strategic planning at the country level.
243. The Strategic Review Committee approved 14 country strategy documents44 in 2011,
compared with 12 in the previous two years. By March 2012, nine of the 14 countries had started
to implement their strategies; implementation in the remaining countries will commence in 2013.
244. An independent review by the Inspector General in 2011 concluded that the country
strategy approach is valuable for repositioning WFP at the country level, and that
institutionalizing the process would reinforce WFP’s role in national development agendas.
WFP is considering whether to establish the country strategy as a governance tool.
44 Bangladesh, Colombia, Ecuador, El Salvador, Ethiopia, Guinea, the Lao People’s Democratic Republic, Lesotho,
Liberia, Malawi, Mali, Mozambique, Peru and Swaziland.
4.500
4.000
3.500
3.000
2.500
2.000
1.000
500
0
1.500
Food
LTSH
DSC
ODOC
Transport
2011
3.483
52%
17%
15%
10%
6%
2010
3.676
48%
22%
14%
10%
6%
2009
3.519
47%
26%
12%
8%
7%
2008
4.197
56%
19%
9%
7%
9%
ANNUAL PERFORMANCE REPORT FOR 2011 | WFP/EB.A/2012/4*
WORLD FOOD PROGRAMME | 73
Collaboration among the Rome-based agencies leads to better advocacy and policy
development.
245. Collaboration among WFP, FAO and IFAD at the policy, operational and administrative
levels featured in the G20, Rio+20, the Istanbul Programme of Action for Least-Developed
Countries and South-South cooperation. Notable events included publication of the first State of
Food Insecurity report on food price volatility, the signing of the Statement of Intent of the
European Union and the Rome-based agencies in June 2011, and the joint emergency responses
in Haiti, Pakistan and the Horn of Africa. WFP and FAO continued as co-leaders of the
food-security cluster.
246. As members of the reformed Committee on World Food Security (CFS), the Rome-based
agencies participated in the formulation of the Global Strategic Framework for Food Security
and Nutrition and the High-Level Forum on Food Insecurity in Protracted Crises; they also
collaborated in mapping food security and nutrition actions at the country level.
247. WFP and FAO continued to collaborate in 86 projects in 50 countries These involved
agriculture, education, food security and assessments. WFP and IFAD collaborated in 11 projects
in nine countries, mainly in FFW, FFT and micro-credit programmes.
WFP continues to expand its work with the United Nations Delivering as One agenda.
248. WFP continued to work with United Nations agencies in line with General Assembly
Resolution A/RES/63/311, participating in the United Nations Chief Executives Board for
Coordination, the High-Level Committee on Programmes (HLCP), the United Nations
Development Group, and the 2012 Quadrennial Comprehensive Policy Review.
249. WFP continued its engagement in Delivering as One pilots in Cape Verde, Mozambique,
Pakistan, Rwanda and the United Republic of Tanzania; it also supported Benin, DRC, Ethiopia,
Lesotho, Liberia, Malawi, Mali, Namibia, Sierra Leone and Uganda. Delivering as One has
streamlined procurement, communications, human resources and logistics services; the
United Nations ICT network has reduced transaction costs for agencies. WFP signed logistics
agreements with UNFPA, the United Nations Environment Programme, UNHCR and UNICEF.
250. As Chair of the HLCM, WFP worked to optimize efficiency, effectiveness and business
practices through: i) a WFP-led ICT platform; ii) a study of common reporting principles to
reduce transaction costs and increase transparency; and iii) a new security management system,
which became operational on 1 January 2011. Projects from the Plan of Action for the
Harmonization of Business Practices included the common framework for vendor eligibility, a
feasibility study for common treasury services and a review of HR management at the country
level.
251. With regard to common premises, WFP and the UNDG developed construction guidelines
based on the International Building Code and looked into public-private partnerships to fund
the capital investments required; projects are under consideration in 20 countries. WFP shared
60 premises with other United Nations agencies between 2009 and 2011 with a view to reducing
costs and promoting efficiency.
252. WFP co-chairs the UNDG and Executive Committee on Humanitarian Affairs (ECHA)
working group on transition issues, which coordinated the United Nations response to the
International Network on Conflict and Fragility and G7+ work on fragile states.

ANNUAL PERFORMANCE REPORT FOR 2011 | WFP/EB.A/2012/4*
WORLD FOOD PROGRAMME | 74
WFP takes on increasing cluster responsibilities during 2011.
253. The food security cluster, led jointly by WFP and FAO, became operational in April 2011,
with support from the International Federation of Red Cross and Red Crescent Societies, the
IASC Gender Standby Capacity Project and NGOs. The cluster is establishing links with the
International Red Cross and Red Crescent Movement and other clusters with a view to
addressing IASC cross-cutting themes. Scoping missions and support for country-led
food-security clusters were deployed in Afghanistan, Côte d’Ivoire, Haiti, the Horn of Africa,
Libya and Nepal.
254. WFP assumed the leadership of the emergency telecommunications cluster in 2011. A
review of its operations led to a new catalogue of services, clarification of roles, a new
preparedness strategy and improved M&E.
255. During 2011 the WFP-led logistics cluster sought to increase its efficiency and the quality of
its services, focusing on sharing resources, managing partnerships and developing capacities in
Haiti, the Horn of Africa and Pakistan.
ANNUAL PERFORMANCE REPORT FOR 2011 | WFP/EB.A/2012/4*
WORLD FOOD PROGRAMME | 75
Lessons Learned
256. Consistent application of the Management Results Framework has demonstrated the
importance of measuring and reporting on business practices. WFP must continue to refine its
corporate performance indicators to enhance the efficiency, effectiveness and transparency of its
programmes.
257. Improved systems for monitoring and evaluating results must support WFP’s innovative
“can-do” approach. The significant investment in independent evaluation in the past few years
must now be matched by further investment in monitoring and self-evaluation procedures.
258. Partnerships are ingrained in the WFP operational approach, and the search for approaches
involving other humanitarian actors must continue. Leadership of the food security and logistics
clusters is an essential feature of WFP’s future work.
259. Emergency preparedness saves lives. WFP is therefore testing its systems under the
Preparedness and Response Enhancement Programme (PREP) initiative with a view to
improving its preparedness and response capabilities.
260. The increased diversity of funding sources is a welcome feature of 2011. WFP’s overall
revenue fell in 2011, however, and met a smaller percentage of needs than in 2010. It must
continue to promote the needs of the poor and hungry to a wider range of donors if the
downward trend is to be reversed.
261. Addressing gender balance requires a long-term approach to give women opportunities to
gain experience with a view to promotion. WFP must continue to increase these opportunities,
particularly at the field level.
262. The Statement of Internal Control in the 2011 Financial Statements is an indication of
WFP’s commitment to transparency and accountability in line with IPSAS. Internal control is an
ongoing activity, however, and WFP must continue to assess the cost-effectiveness of its
administrative and operational systems.
263. This APR provides many examples of initiatives to increase efficiency. These must be
continued with the establishment of baselines against which to measure improvements.
264. Security risks are constantly evolving. WFP must ensure that they are addressed to provide
the safe humanitarian space required for helping people in need.

ANNUAL PERFORMANCE REPORT FOR 2011 | WFP/EB.A/2012/4*
WORLD FOOD PROGRAMME | 76
ANNUAL PERFORMANCE REPORT FOR 2011 | WFP/EB.A/2012/4*
WORLD FOOD PROGRAMME | 77
PART IV – LOOKING FORWARD
High food and fuel prices will continue to affect the poorest people and restrict WFP’s
ability to address hunger.
265. The most significant challenge facing WFP and its beneficiaries is the likelihood of
sustained high food and oil prices. The 2010 APR drew attention to the risk that high food prices
would erode WFP’s purchasing power: in the event there was a 25 percent reduction in the
quantity of food purchased in 2011 for similar expenditure. Food prices show no sign of falling
in 2012; and in the first two months there were significant rises in the price of oil from the 2011
average of US$95 per barrel, which indicates that predictions by the United States Energy
Department of a rise to US$98 per barrel are optimistic.
266. High food prices lead to increased demand for WFP assistance as people are unable to
meet their food requirements; at the same time they limit WFP’s ability to buy food to support
those in need. Rising oil prices have three effects: i) the costs of shipping and transport go up, so
WFP spends more to reach the same beneficiaries; ii) the budgets of host governments are
affected, constraining their ability to support WFP’s activities; and iii) the cost of agricultural
inputs goes up resulting in higher costs for farmers in developed countries, who raise their
prices accordingly.
267. In 2011, WFP countered the effects of rising food prices on its budget and operations
by procuring more food from local markets and by forward purchasing. But such one-time
benefits cannot be realized indefinitely: high global prices will eventually affect local markets.
WFP will continue to evaluate local and international market options and purchase on the basis
of optimum value – but the fact remains that its purchasing power in 2012 will remain
significantly less than it was in 2011 unless there is an increase in funding if prices remain high.
A global economic slowdown will put pressure on fundraising.
268. The voluntary funding model means that WFP’s ability to raise funds is directly influenced
by global economic conditions. The latest forecasts are not optimistic: the World Bank reports
that the world economy has entered a dangerous period as financial recession in Europe spreads
to hitherto unaffected countries, capital flows into developing countries fall sharply and growth
in some developing countries slows.45
269. This could have major effects in countries such as Bangladesh, El Salvador, Guatemala,
India, Mexico and the Philippines that provide large numbers of migrant workers. The decline
in tax revenues caused by the economic slowdown is increasing competition for national budget
funding and affecting the ability of governments to finance programmes for social services,
poverty reduction and healthcare.
45 International Bank for Reconstruction and Development and World Bank. 2012. Global Economic Prospects:
Uncertainties and Vulnerabilities. Vol. 4. Washington DC.
ANNUAL PERFORMANCE REPORT FOR 2011 | WFP/EB.A/2012/4*
WORLD FOOD PROGRAMME | 78
270. The Conference Board Global Economic Outlook 201246 predicts that global growth will
slow to an average 3 percent per year until the middle of the next decade and notes that the
main risk for the global economy is a slowdown in average output per capita, which will
determine the rate at which living standards can be raised, particularly in emerging economies.
Safe humanitarian space is essential for WFP’s operations and remains at risk.
271. The World Bank estimates that 1.5 billion people live in countries with high levels of
political and criminal violence, which suggests that there is no immediate prospect of a
significant reduction in the security risks faced by WFP staff. At the beginning of 2012,
40 percent of WFP’s international professional staff were working in non-family duty stations.
272. WFP’s new career development model and its mobility policy aim to ensure fair
distribution of the immense load this places on staff. WFP will continue to review the risks faced
by its staff and maintain a balance between humanitarian requirements and levels of personal
risk.
WFP has the right tools in place but must scale them up.
273. WFP is putting in place the tools to make the transformation from food aid to food
assistance. The process of scaling them up, however, is linked to the capacity to develop
programmes that improve results by using the right mix of food aid and food assistance.
274. Ensuring that programmes can be implemented in the various contexts in which WFP
works requires credible assessments leading to sound design incorporating appropriate
activities, tools and partnerships, and results-based monitoring to track progress and enable
real-time adjustments.
275. Work in 2012 and 2013 to improve programme quality includes: i) joint implementation
with FAO of integrated food-security and nutrition information systems at the country and
global levels, particular through capacity development and technical support for governments;
ii) enhanced programme monitoring through COMET; iii) enhancing the skills of WFP and
partner staff to collect, analyse and use output and outcome data; and iv) establishment of a
dedicated monitoring unit in Headquarters.
276. Challenges and actions for 2012 include:
completing the development of electronic cash and voucher systems to scale up transfers,
improving analysis tools and training WFP and partner staff;
improving nutrition interventions by increasing the number of WFP nutritionists,
fostering those WFP staff and senior managers with nutrition knowledge, enhancing the
evidence base for nutrition programmes, and partnering with agencies providing health,
water and sanitation services; and
training to enable programme staff to use WFP’s food assistance tools for their
operational needs.
46 http://www.conference-board.org/data/globaloutlook.cfm
ANNUAL PERFORMANCE REPORT FOR 2011 | WFP/EB.A/2012/4*
WORLD FOOD PROGRAMME | 79
Innovative strategies are needed to generate more predictable funding.
277. Funding strategies will be developed in 2012 with a view to raising the profile of WFP’s
programmes in particular contexts; where appropriate they will be adapted to the thematic
interests of donors. WFP’s visibility enhancement project will demonstrate results and ensure
that donors’ contributions are recognized; it will also demonstrate WFP’s strengths in nutrition,
school feeding, P4P, cash and vouchers, capacity development and climate change adaptation.
278. Continued engagement with the G20 and G8. WFP’s engagement with the G20 in 2011
generated political support for global food security and enhanced food-supply systems,
following the addition of food security issues to its agenda in 2010. Continued engagement is a
priority and will continue under the Mexican G20 Presidency in 2012. WFP continues to be
engaged in the G8 follow-up to the L'Aquila commitment of US$20 billion for food security.
279. Improving dialogue with donors and increasing funding predictability. WFP will
continue its policy dialogue with donors to ensure that food security is on the agenda at donor
meetings; it will also continue its lead in seeking value for money, and will engage with donors
in multilateral aid reviews. WFP will sign at least five multi-year Strategic Partnership
Agreements with donors in 2012 with a view to enhancing the predictability and flexibility of
funding for its resource needs. The Strategic Resource Allocation Committee (SRAC) will ensure
that donors’ contributions match WFP’s priorities.
280. Promoting WFP to a broader range of private-sector donors. WFP will portray hunger in
2012 as “the world’s greatest solvable problem” and will work with industry leaders to focus on
hunger as a social responsibility. It will maximize engagement with the United States market
and will focus more on Asia to leverage private-sector resources and expertise. WFP will expand
its online support, for example by establishing a platform that will allow it to engage with
potential donors in culturally and financially diverse contexts.
WFP will continue to improve its efficiency and effectiveness and provide value for
money.
281. WFP strives to maximize the value of every donation: every dollar saved means that it can
reach more hungry people with food assistance. WFP is improving its ability to achieve value
for money and is developing measures to improve its efficiency and effectiveness.
Better supply-chain management
282. Logistics operations are becoming increasingly complicated in response to constraints such
as limited access, damaged infrastructure and insecurity: WFP must therefore manage its
food-supply chain more efficiently from initial planning to final delivery and adopt holistic
approaches to offset the effects of high food prices and increasing transport costs. The significant
increase of special nutritious products in WFP’s supply chain requires more sophisticated
inventory management to prolong shelf life and monitor transport and storage from
manufacture to delivery.
283. To meet these challenges, WFP piloted the SAP-based logistics execution support
system (LESS) in late 2011. The system standardizes business practices and increases the
transparency and consistency of real-time data. It will enable WFP to manage its inventories
more effectively by tracking logistics movements in WFP’s Information Network and Global
System II (WINGS II) and will improve operational efficiency and supply-chain management by
making information more consistent and accessible.

ANNUAL PERFORMANCE REPORT FOR 2011 | WFP/EB.A/2012/4*
WORLD FOOD PROGRAMME | 80
284. WFP country offices will continue to adapt to the changing operational environment by
planning capacity development and hand-overs through national partnerships with a local focus
and by working with governments to improve their programmes and nurture political will.
WFP will make risks more visible and will seek stakeholders’ support for its risk
appetite.
285. WFP will continue to identify and share with stakeholders its contextual, programmatic
and operational risks: greater transparency is in the interests of donors, beneficiaries, staff and
partners, who should share in identifying and responding to risks that affect common goals.
Many risks, particularly in fragile operating environments, cannot be addressed by WFP alone:
concerted responses by humanitarian and governmental actors are needed.
The right security at the right time and in the right place.
286. In line with the recent shift in United Nations security philosophy from “when to leave” to
“how to stay”, WFP will continue to work with the United Nations Department of Safety and
Security (UNDSS) to develop a United Nations security policy and standards for safety and
security. WFP’s security measures acknowledge that risk is an inevitable part of operations and
aim to: i) enhance the security of personnel; and ii) manage rather than avoid security risks as
one of the challenges WFP faces in implementing its programmes.
287. WFP will continue to mitigate security risks with a view to facilitating rather than limiting
its activities, and will continue to provide technical expertise, technologies and security
leadership to enable WFP managers to understand the risk environment and make informed
risk-management decisions.
Risk-informed programming
288. WFP aims to ensure that risks are addressed holistically in all phases of planning and
programming. The United Nations Security Management System, which has shifted to a
targeted model for high-risk situations, helps to determine the required deployments of staff
and the programme activities to be implemented. As part of this process WFP is working with
the Programme Criticality Working Group to develop a framework for prioritization in
high-risk environments.
WFP will enhance its emergency preparedness and response capacity.
289. Timeliness and efficiency are crucial to saving lives in emergencies. WFP will continue to
enhance its capability to respond effectively and efficiently to emergencies under the three-year
Preparedness and Response Enhancement Programme (PREP), which focuses on accountability,
partnerships and capacity development to enable governments to respond to emergencies.
290. In 2012 WFP will:
develop an emergency preparedness and response framework;
roll out to country offices an emergency preparedness and response package (EPRP) that
incorporates WFP’s risk analysis, contingency planning and business continuity
processes;
review systems and emergency procedures to facilitate mobilization in large-scale
emergencies;
carry out the first annual corporate response exercise to test systems and procedures;
ANNUAL PERFORMANCE REPORT FOR 2011 | WFP/EB.A/2012/4*
WORLD FOOD PROGRAMME | 81
implement an emergency preparedness and response training and development strategy,
which includes a corporate response roster for rapid deployment of experienced staff;
enhance internal and external information management platforms to provide
decision-makers with more real-time data from large-scale operations; and
ensure that the rights skills are in the right place to scale up the transition to food
assistance.
291. In 2012, WFP will finalize the review of workforce planning that started in 2011 to ensure
that appropriate skills are in place and to develop a strategy that increases skills in critical
functions, enhances leadership capacities, improves the gender balance and establishes the
technical expertise to generate sustainable hunger solutions in partnership with others.
WFP will increase transparency and accountability.
Better performance monitoring
292. WFP will continue to refine its performance indicators and roll out software tools such as
the Performance and Risk Operational Management Information System (PROMIS) and COMET
to enable more effective performance management. It will continue to work with other
United Nations agencies to develop common approaches to reporting and to improve standards
of accountability and transparency.
A new Strategic Plan for 2014–2017 developed in parallel with other United Nations agencies
293. WFP will continue to develop the Strategic Plan (2014–2017), taking into account the
Board’s consideration of the mid-term review of the 2008–2013 plan and consultations with
other United Nations agencies, which are for the first time preparing their strategies
concurrently. WFP will coordinate its responses with these agencies, particularly on issues
related to results measurement and the post-MDG agenda.
294. During 2012 WFP will seek opportunities for innovation under agreements with
non-United Nations partners. The Rio +20 declaration is expected to set the post-MDG agenda
and define the objectives for sustainable development. WFP’s climate change policy to be
submitted for Board approval in November 2012 will reflect the Rio +20 deliberations.

ANNUAL PERFORMANCE REPORT FOR 2011 | WFP/EB.A/2012/4*
WORLD FOOD PROGRAMME | 82
ANNUAL PERFORMANCE REPORT FOR 2011 | WFP/EB.A/2012/4*
WORLD FOOD PROGRAMME | 83
ANNEXES page
I. WFP’S CONTRIBUTION TO THE MILLENNIUM DEVELOPMENT GOALS 85
II. A – WFP STRATEGIC RESULTS FRAMEWORK
(STRATEGIC PLAN 2008–2013)
87
B – OUTCOME PERFORMANCE REPORTING 96
C – METHODOLOGY – ASSESSMENT OF STRATEGIC OBJECTIVES 99
D – LESSONS LEARNED – 2011 REPORTING 102
III. PERFORMANCE INDICATORS 2011 103
IV. ETHICS REPORT 105
V. WFP EMPLOYEES WITH CONTRACTS OF ONE YEAR OR LONGER 113
VI. GLOBAL FOOD AID PROFILE 114
VII. WFP FOOD PROCUREMENT IN 2011 115
VIII. TOTAL CONFIRMED CONTRIBUTIONS IN 2011 119
IX. A – DIRECT EXPENSES BY REGION AND CATEGORY, 2008–2011 123
B – DIRECT EXPENSES BY COUNTRY, REGION AND
PROGRAMME CATEGORY, 2008–2011
125
C – DIRECT EXPENSES BY COUNTRY, SPECIAL STATUS CATEGORY AND
REGION, 2008–2011
128
X. A – UNITED NATIONS AND INTERNATIONAL ORGANIZATION
PARTNERSHIPS
129
B – NON-GOVERNMENTAL ORGANIZATIONS PER SECTOR OF
COLLABORATION
130
XI. END-NOTES 131
ACRONYMS USED IN THE DOCUMENT 132

ANNUAL PERFORMANCE REPORT FOR 2011 | WFP/EB.A/2012/4*
WORLD FOOD PROGRAMME | 84
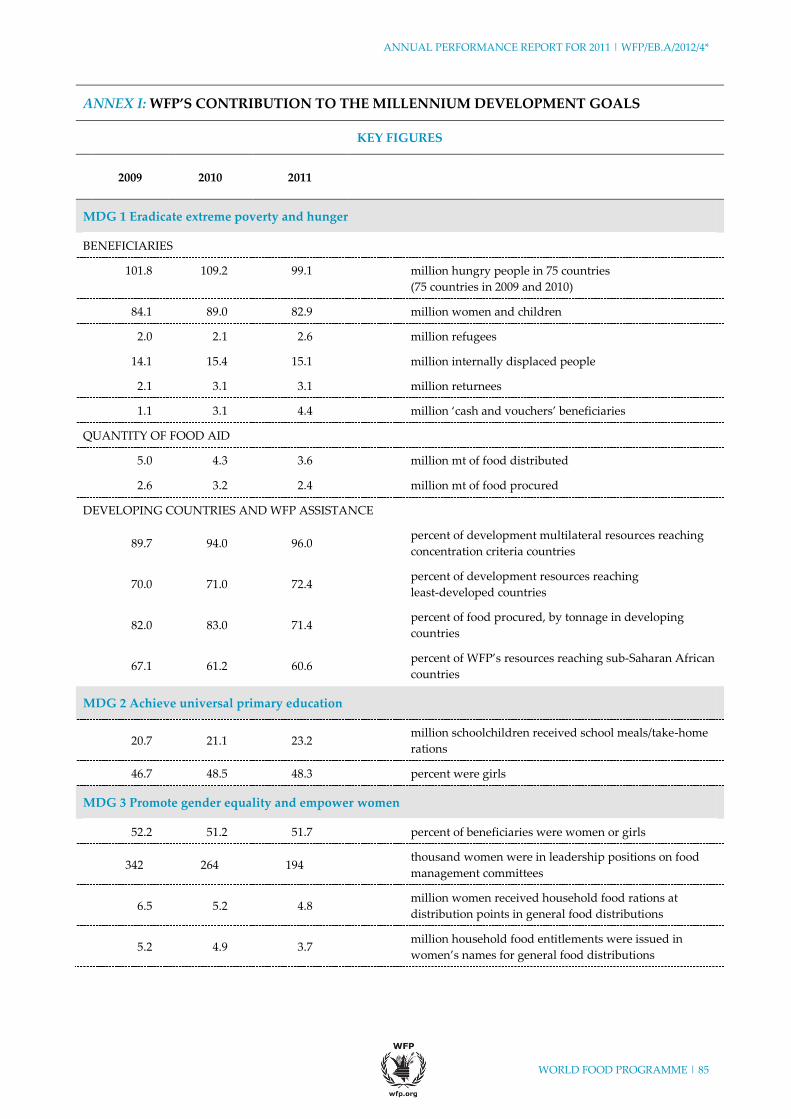
ANNUAL PERFORMANCE REPORT FOR 2011 | WFP/EB.A/2012/4*
WORLD FOOD PROGRAMME | 85
ANNEX I: WFP’S CONTRIBUTION TO THE MILLENNIUM DEVELOPMENT GOALS
KEY FIGURES
2009 2010 2011
MDG 1 Eradicate extreme poverty and hunger
BENEFICIARIES
101.8 109.2 99.1 million hungry people in 75 countries
(75 countries in 2009 and 2010)
84.1 89.0 82.9 million women and children
2.0 2.1 2.6 million refugees
14.1 15.4 15.1 million internally displaced people
2.1 3.1 3.1 million returnees
1.1 3.1 4.4 million ‘cash and vouchers’ beneficiaries
QUANTITY OF FOOD AID
5.0 4.3 3.6 million mt of food distributed
2.6 3.2 2.4 million mt of food procured
DEVELOPING COUNTRIES AND WFP ASSISTANCE
89.7 94.0 96.0 percent of development multilateral resources reaching
concentration criteria countries
70.0 71.0 72.4 percent of development resources reaching
least-developed countries
82.0 83.0 71.4 percent of food procured, by tonnage in developing
countries
67.1 61.2 60.6 percent of WFP’s resources reaching sub-Saharan African
countries
MDG 2 Achieve universal primary education
20.7 21.1 23.2 million schoolchildren received school meals/take-home
rations
46.7 48.5 48.3 percent were girls
MDG 3 Promote gender equality and empower women
52.2 51.2 51.7 percent of beneficiaries were women or girls
342 264 194 thousand women were in leadership positions on food
management committees
6.5 5.2 4.8 million women received household food rations at
distribution points in general food distributions
5.2 4.9 3.7 million household food entitlements were issued in
women’s names for general food distributions
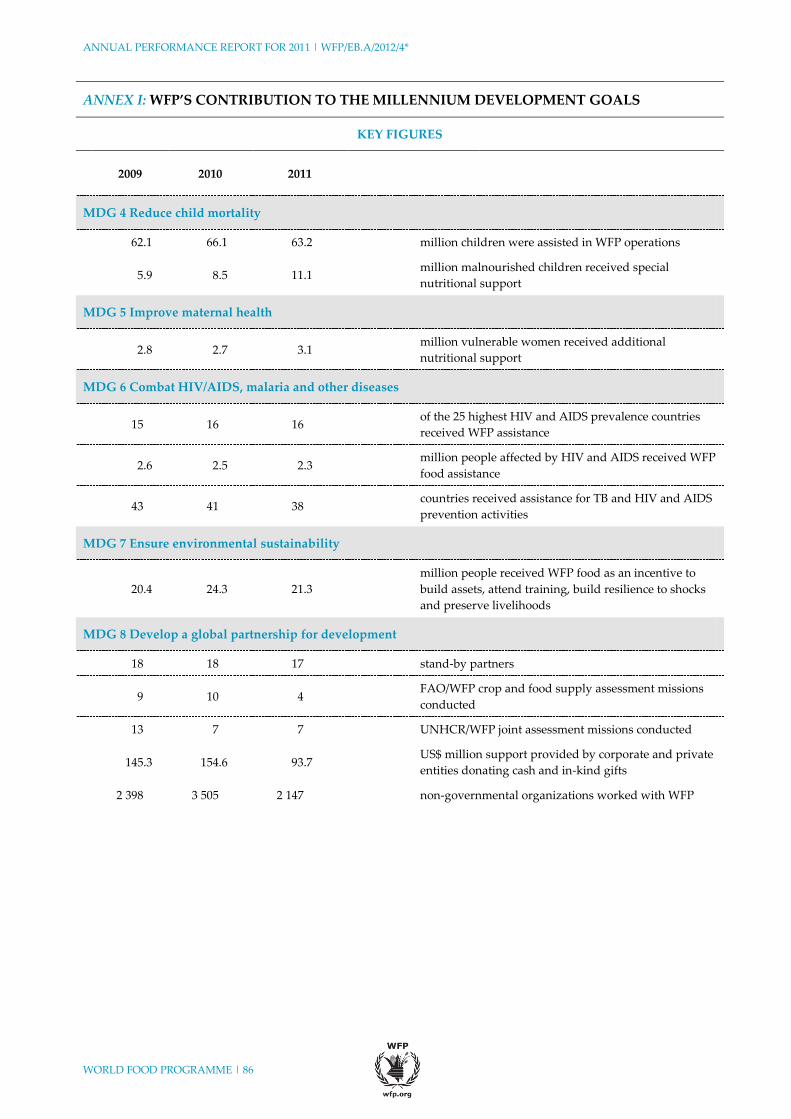
ANNUAL PERFORMANCE REPORT FOR 2011 | WFP/EB.A/2012/4*
WORLD FOOD PROGRAMME | 86
ANNEX I: WFP’S CONTRIBUTION TO THE MILLENNIUM DEVELOPMENT GOALS
KEY FIGURES
2009 2010 2011
MDG 4 Reduce child mortality
62.1 66.1 63.2 million children were assisted in WFP operations
5.9 8.5 11.1 million malnourished children received special
nutritional support
MDG 5 Improve maternal health
2.8 2.7 3.1 million vulnerable women received additional
nutritional support
MDG 6 Combat HIV/AIDS, malaria and other diseases
15 16 16 of the 25 highest HIV and AIDS prevalence countries
received WFP assistance
2.6 2.5 2.3 million people affected by HIV and AIDS received WFP
food assistance
43 41 38 countries received assistance for TB and HIV and AIDS
prevention activities
MDG 7 Ensure environmental sustainability
20.4 24.3 21.3
million people received WFP food as an incentive to
build assets, attend training, build resilience to shocks
and preserve livelihoods
MDG 8 Develop a global partnership for development
18 18 17 stand-by partners
9 10 4 FAO/WFP crop and food supply assessment missions
conducted
13 7 7 UNHCR/WFP joint assessment missions conducted
145.3 154.6 93.7 US$ million support provided by corporate and private
entities donating cash and in-kind gifts
2 398 3 505 2 147 non-governmental organizations worked with WFP

ANNUAL PERFORMANCE REPORT FOR 2011 | WFP/EB.A/2012/4*
WORLD FOOD PROGRAMME | 87
ANNEX II-A: WFP STRATEGIC RESULTS FRAMEWORK (STRATEGIC PLAN 2008–2013)
Please note:
The framework pertains to all results obtained with WFP assistance and support (for
households, communities, governments and other entities such as schools).
Indicators are distinguished in the framework by font type as follows:
Regular text: Internationally recognized indicators, based on agreed standards and
used by United Nations agencies
Bold: Developed in cooperation with WFP’s operational partners
Italic: WFP-specific methodological standards
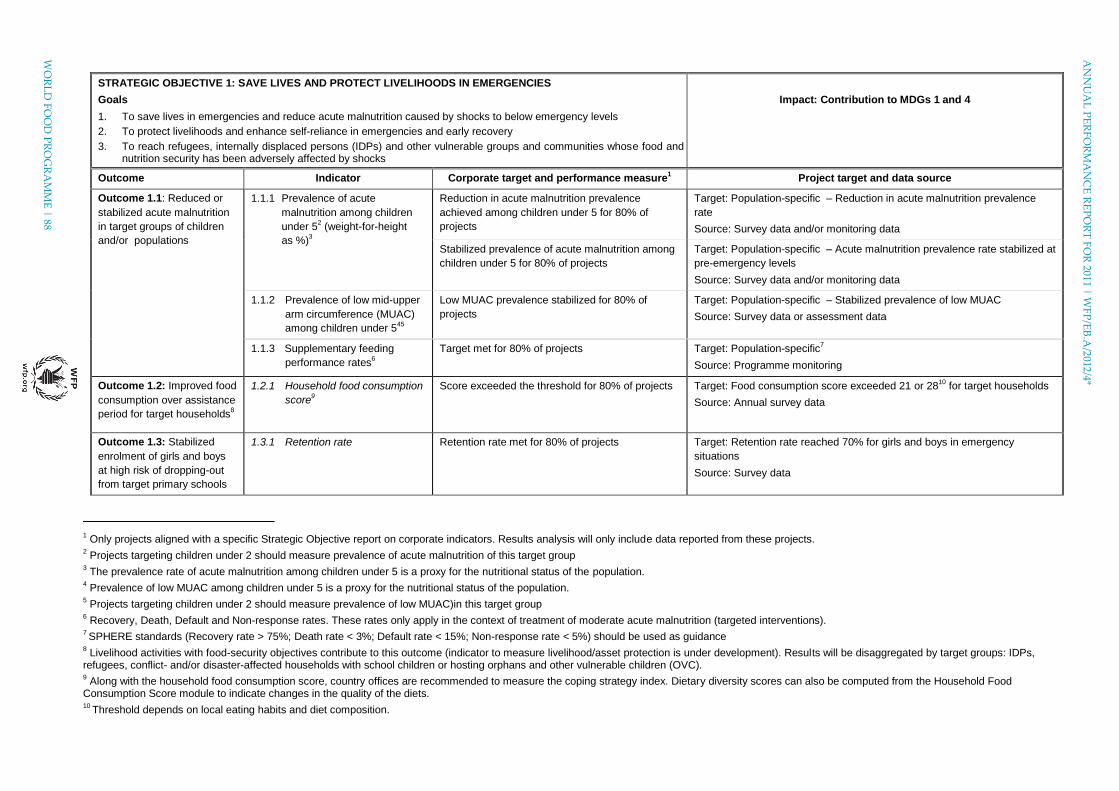
WO
RL
D F
OO
D P
RO
GR
AM
ME
| 88
AN
NU
AL
PE
RF
OR
MA
NC
E R
EP
OR
T F
OR
2011 | WF
P/E
B.A
/2012/4*
STRATEGIC OBJECTIVE 1: SAVE LIVES AND PROTECT LIVELIHOODS IN EMERGENCIES
Goals
1. To save lives in emergencies and reduce acute malnutrition caused by shocks to below emergency levels
2. To protect livelihoods and enhance self-reliance in emergencies and early recovery
3. To reach refugees, internally displaced persons (IDPs) and other vulnerable groups and communities whose food and nutrition security has been adversely affected by shocks
Impact: Contribution to MDGs 1 and 4
Outcome Indicator Corporate target and performance measure1 Project target and data source
Outcome 1.1: Reduced or
stabilized acute malnutrition
in target groups of children
and/or populations
1.1.1 Prevalence of acute
malnutrition among children
under 52 (weight-for-height
as %)3
Reduction in acute malnutrition prevalence
achieved among children under 5 for 80% of
projects
Target: Population-specific – Reduction in acute malnutrition prevalence
rate
Source: Survey data and/or monitoring data
Stabilized prevalence of acute malnutrition among
children under 5 for 80% of projects
Target: Population-specific – Acute malnutrition prevalence rate stabilized at
pre-emergency levels
Source: Survey data and/or monitoring data
1.1.2 Prevalence of low mid-upper
arm circumference (MUAC)
among children under 545
Low MUAC prevalence stabilized for 80% of
projects
Target: Population-specific – Stabilized prevalence of low MUAC
Source: Survey data or assessment data
1.1.3 Supplementary feeding
performance rates6
Target met for 80% of projects Target: Population-specific7
Source: Programme monitoring
Outcome 1.2: Improved food
consumption over assistance
period for target households8
1.2.1 Household food consumption
score9
Score exceeded the threshold for 80% of projects
Target: Food consumption score exceeded 21 or 2810
for target households
Source: Annual survey data
Outcome 1.3: Stabilized
enrolment of girls and boys
at high risk of dropping-out
from target primary schools
1.3.1 Retention rate
Retention rate met for 80% of projects
Target: Retention rate reached 70% for girls and boys in emergency
situations
Source: Survey data
1 Only projects aligned with a specific Strategic Objective report on corporate indicators. Results analysis will only include data reported from these projects.
2 Projects targeting children under 2 should measure prevalence of acute malnutrition of this target group
3 The prevalence rate of acute malnutrition among children under 5 is a proxy for the nutritional status of the population.
4 Prevalence of low MUAC among children under 5 is a proxy for the nutritional status of the population.
5 Projects targeting children under 2 should measure prevalence of low MUAC)in this target group
6 Recovery, Death, Default and Non-response rates. These rates only apply in the context of treatment of moderate acute malnutrition (targeted interventions).
7 SPHERE standards (Recovery rate > 75%; Death rate < 3%; Default rate < 15%; Non-response rate < 5%) should be used as guidance
8 Livelihood activities with food-security objectives contribute to this outcome (indicator to measure livelihood/asset protection is under development). Results will be disaggregated by target groups: IDPs,
refugees, conflict- and/or disaster-affected households with school children or hosting orphans and other vulnerable children (OVC). 9 Along with the household food consumption score, country offices are recommended to measure the coping strategy index. Dietary diversity scores can also be computed from the Household Food
Consumption Score module to indicate changes in the quality of the diets. 10
Threshold depends on local eating habits and diet composition.
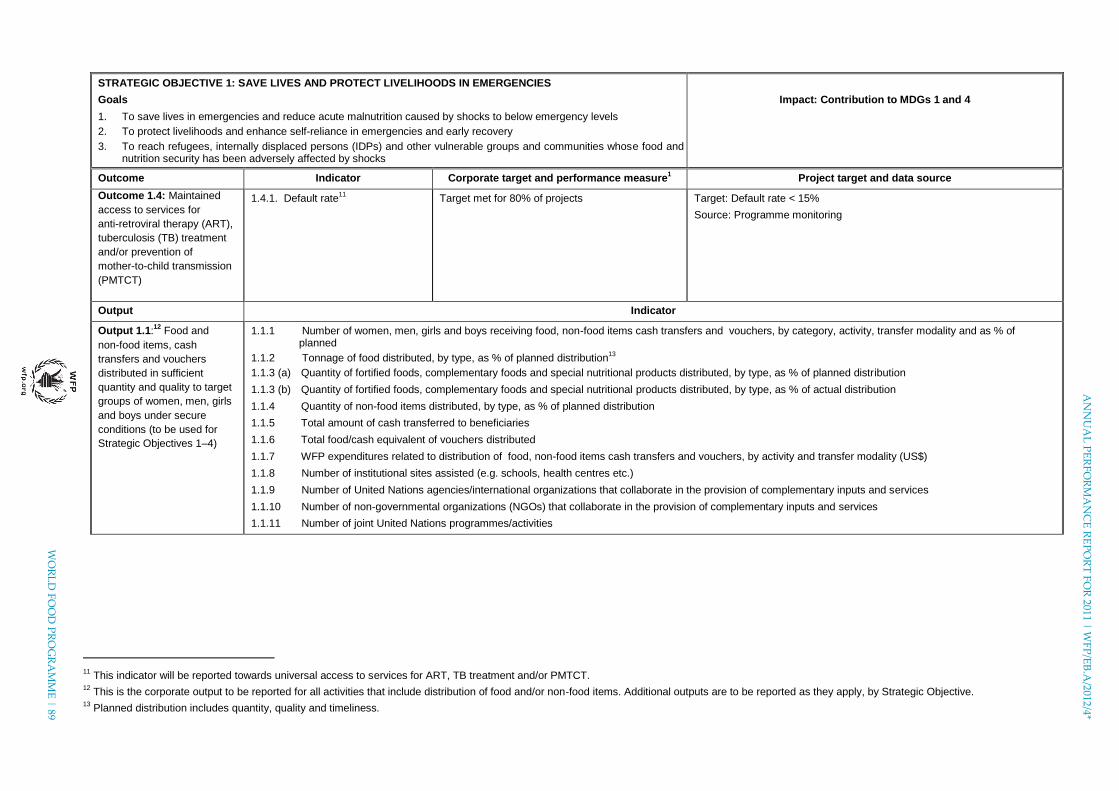
AN
NU
AL
PE
RF
OR
MA
NC
E R
EP
OR
T F
OR
2011 | WF
P/E
B.A
/2012/4*
WO
RL
D F
OO
D P
RO
GR
AM
ME
| 89
STRATEGIC OBJECTIVE 1: SAVE LIVES AND PROTECT LIVELIHOODS IN EMERGENCIES
Goals
1. To save lives in emergencies and reduce acute malnutrition caused by shocks to below emergency levels
2. To protect livelihoods and enhance self-reliance in emergencies and early recovery
3. To reach refugees, internally displaced persons (IDPs) and other vulnerable groups and communities whose food and nutrition security has been adversely affected by shocks
Impact: Contribution to MDGs 1 and 4
Outcome Indicator Corporate target and performance measure1 Project target and data source
Outcome 1.4: Maintained
access to services for
anti-retroviral therapy (ART),
tuberculosis (TB) treatment
and/or prevention of
mother-to-child transmission
(PMTCT)
1.4.1. Default rate11
Target met for 80% of projects Target: Default rate < 15%
Source: Programme monitoring
Output Indicator
Output 1.1:12
Food and
non-food items, cash
transfers and vouchers
distributed in sufficient
quantity and quality to target
groups of women, men, girls
and boys under secure
conditions (to be used for
Strategic Objectives 1–4)
1.1.1 Number of women, men, girls and boys receiving food, non-food items cash transfers and vouchers, by category, activity, transfer modality and as % of planned
1.1.2 Tonnage of food distributed, by type, as % of planned distribution13
1.1.3 (a) Quantity of fortified foods, complementary foods and special nutritional products distributed, by type, as % of planned distribution
1.1.3 (b) Quantity of fortified foods, complementary foods and special nutritional products distributed, by type, as % of actual distribution
1.1.4 Quantity of non-food items distributed, by type, as % of planned distribution
1.1.5 Total amount of cash transferred to beneficiaries
1.1.6 Total food/cash equivalent of vouchers distributed
1.1.7 WFP expenditures related to distribution of food, non-food items cash transfers and vouchers, by activity and transfer modality (US$)
1.1.8 Number of institutional sites assisted (e.g. schools, health centres etc.)
1.1.9 Number of United Nations agencies/international organizations that collaborate in the provision of complementary inputs and services
1.1.10 Number of non-governmental organizations (NGOs) that collaborate in the provision of complementary inputs and services
1.1.11 Number of joint United Nations programmes/activities
11
This indicator will be reported towards universal access to services for ART, TB treatment and/or PMTCT. 12
This is the corporate output to be reported for all activities that include distribution of food and/or non-food items. Additional outputs are to be reported as they apply, by Strategic Objective. 13
Planned distribution includes quantity, quality and timeliness.
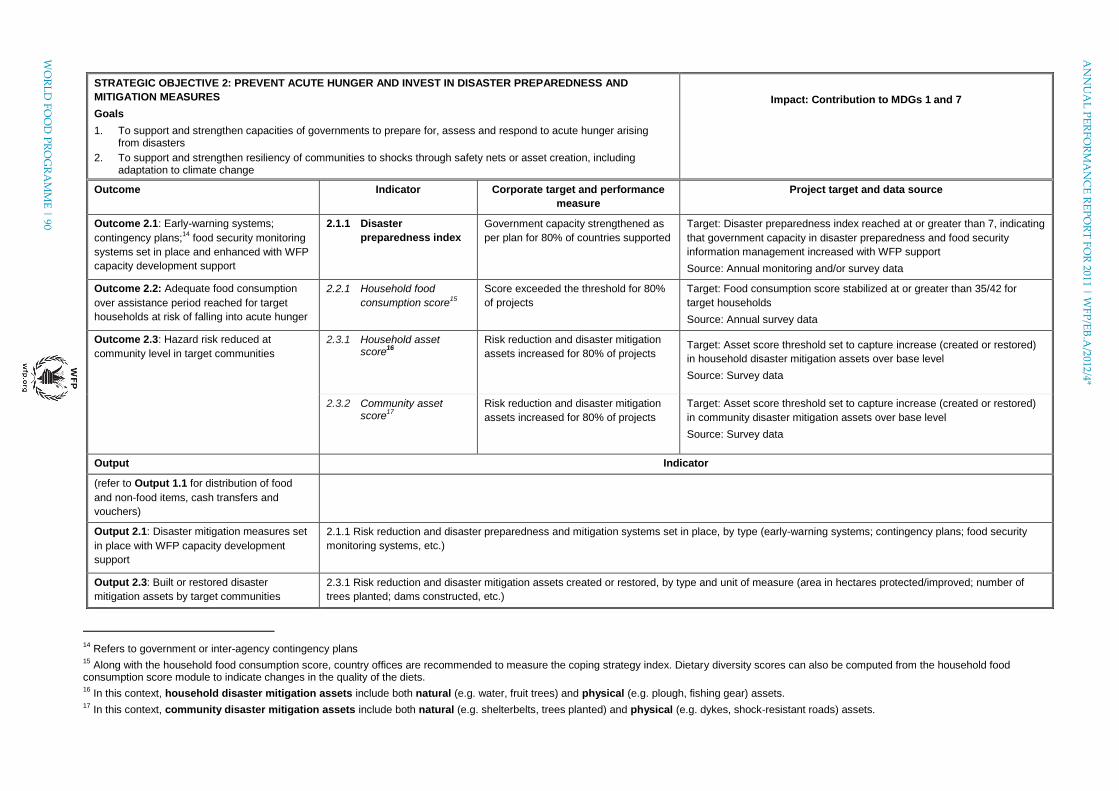
WO
RL
D F
OO
D P
RO
GR
AM
ME
| 90
AN
NU
AL
PE
RF
OR
MA
NC
E R
EP
OR
T F
OR
2011 | WF
P/E
B.A
/2012/4*
STRATEGIC OBJECTIVE 2: PREVENT ACUTE HUNGER AND INVEST IN DISASTER PREPAREDNESS AND
MITIGATION MEASURES
Goals
1. To support and strengthen capacities of governments to prepare for, assess and respond to acute hunger arising from disasters
2. To support and strengthen resiliency of communities to shocks through safety nets or asset creation, including adaptation to climate change
Impact: Contribution to MDGs 1 and 7
Outcome Indicator Corporate target and performance
measure
Project target and data source
Outcome 2.1: Early-warning systems;
contingency plans;14
food security monitoring
systems set in place and enhanced with WFP
capacity development support
2.1.1 Disaster
preparedness index
Government capacity strengthened as
per plan for 80% of countries supported
Target: Disaster preparedness index reached at or greater than 7, indicating
that government capacity in disaster preparedness and food security
information management increased with WFP support
Source: Annual monitoring and/or survey data
Outcome 2.2: Adequate food consumption
over assistance period reached for target
households at risk of falling into acute hunger
2.2.1 Household food
consumption score15
Score exceeded the threshold for 80%
of projects
Target: Food consumption score stabilized at or greater than 35/42 for
target households
Source: Annual survey data
Outcome 2.3: Hazard risk reduced at
community level in target communities
2.3.1 Household asset score
16
Risk reduction and disaster mitigation
assets increased for 80% of projects Target: Asset score threshold set to capture increase (created or restored)
in household disaster mitigation assets over base level
Source: Survey data
2.3.2 Community asset score
17
Risk reduction and disaster mitigation
assets increased for 80% of projects
Target: Asset score threshold set to capture increase (created or restored)
in community disaster mitigation assets over base level
Source: Survey data
Output Indicator
(refer to Output 1.1 for distribution of food
and non-food items, cash transfers and
vouchers)
Output 2.1: Disaster mitigation measures set
in place with WFP capacity development
support
2.1.1 Risk reduction and disaster preparedness and mitigation systems set in place, by type (early-warning systems; contingency plans; food security
monitoring systems, etc.)
Output 2.3: Built or restored disaster
mitigation assets by target communities
2.3.1 Risk reduction and disaster mitigation assets created or restored, by type and unit of measure (area in hectares protected/improved; number of
trees planted; dams constructed, etc.)
14
Refers to government or inter-agency contingency plans 15
Along with the household food consumption score, country offices are recommended to measure the coping strategy index. Dietary diversity scores can also be computed from the household food consumption score module to indicate changes in the quality of the diets. 16
In this context, household disaster mitigation assets include both natural (e.g. water, fruit trees) and physical (e.g. plough, fishing gear) assets. 17
In this context, community disaster mitigation assets include both natural (e.g. shelterbelts, trees planted) and physical (e.g. dykes, shock-resistant roads) assets.
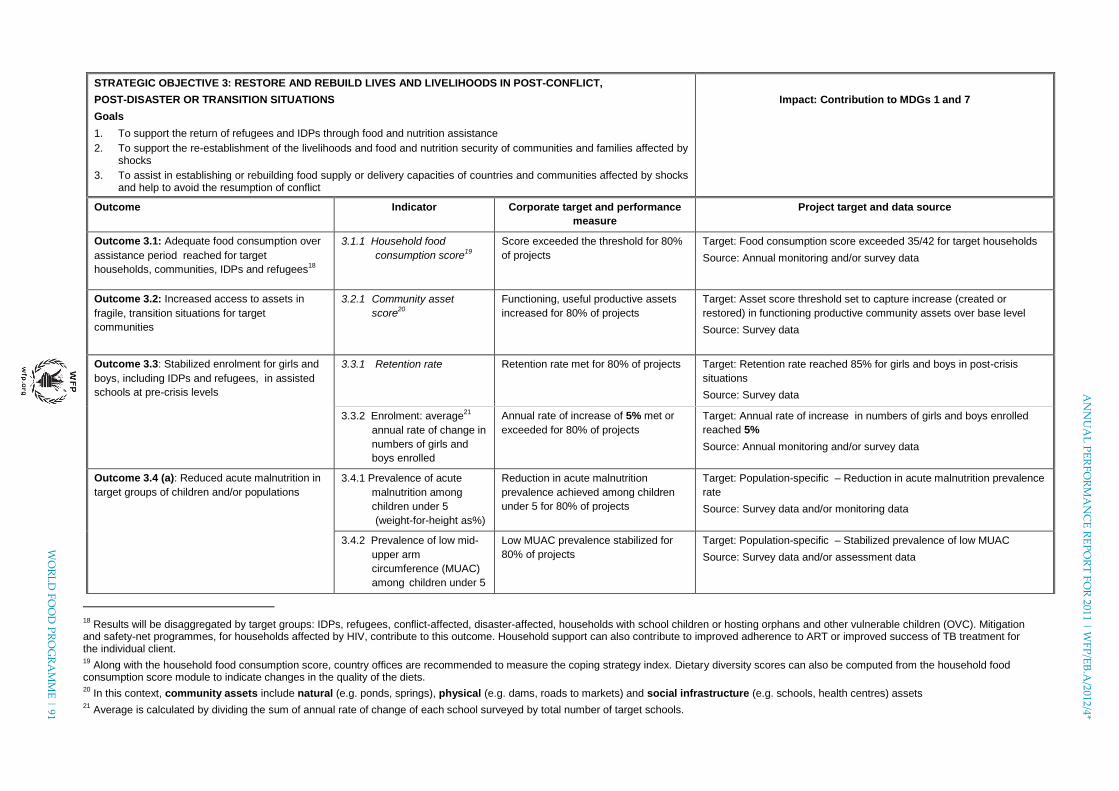
AN
NU
AL
PE
RF
OR
MA
NC
E R
EP
OR
T F
OR
2011 | WF
P/E
B.A
/2012/4*
WO
RL
D F
OO
D P
RO
GR
AM
ME
| 91
STRATEGIC OBJECTIVE 3: RESTORE AND REBUILD LIVES AND LIVELIHOODS IN POST-CONFLICT,
POST-DISASTER OR TRANSITION SITUATIONS
Goals
1. To support the return of refugees and IDPs through food and nutrition assistance
2. To support the re-establishment of the livelihoods and food and nutrition security of communities and families affected by shocks
3. To assist in establishing or rebuilding food supply or delivery capacities of countries and communities affected by shocks and help to avoid the resumption of conflict
Impact: Contribution to MDGs 1 and 7
Outcome Indicator Corporate target and performance
measure
Project target and data source
Outcome 3.1: Adequate food consumption over
assistance period reached for target
households, communities, IDPs and refugees18
3.1.1 Household food
consumption score19
Score exceeded the threshold for 80%
of projects
Target: Food consumption score exceeded 35/42 for target households
Source: Annual monitoring and/or survey data
Outcome 3.2: Increased access to assets in
fragile, transition situations for target
communities
3.2.1 Community asset
score20
Functioning, useful productive assets
increased for 80% of projects
Target: Asset score threshold set to capture increase (created or
restored) in functioning productive community assets over base level
Source: Survey data
Outcome 3.3: Stabilized enrolment for girls and
boys, including IDPs and refugees, in assisted
schools at pre-crisis levels
3.3.1 Retention rate
Retention rate met for 80% of projects
Target: Retention rate reached 85% for girls and boys in post-crisis
situations
Source: Survey data
3.3.2 Enrolment: average21
annual rate of change in
numbers of girls and
boys enrolled
Annual rate of increase of 5% met or
exceeded for 80% of projects
Target: Annual rate of increase in numbers of girls and boys enrolled
reached 5%
Source: Annual monitoring and/or survey data
Outcome 3.4 (a): Reduced acute malnutrition in
target groups of children and/or populations
3.4.1 Prevalence of acute
malnutrition among
children under 5
(weight-for-height as%)
Reduction in acute malnutrition
prevalence achieved among children
under 5 for 80% of projects
Target: Population-specific – Reduction in acute malnutrition prevalence
rate
Source: Survey data and/or monitoring data
3.4.2 Prevalence of low mid-
upper arm
circumference (MUAC)
among children under 5
Low MUAC prevalence stabilized for
80% of projects
Target: Population-specific – Stabilized prevalence of low MUAC
Source: Survey data and/or assessment data
18
Results will be disaggregated by target groups: IDPs, refugees, conflict-affected, disaster-affected, households with school children or hosting orphans and other vulnerable children (OVC). Mitigation and safety-net programmes, for households affected by HIV, contribute to this outcome. Household support can also contribute to improved adherence to ART or improved success of TB treatment for the individual client. 19
Along with the household food consumption score, country offices are recommended to measure the coping strategy index. Dietary diversity scores can also be computed from the household food consumption score module to indicate changes in the quality of the diets. 20
In this context, community assets include natural (e.g. ponds, springs), physical (e.g. dams, roads to markets) and social infrastructure (e.g. schools, health centres) assets 21
Average is calculated by dividing the sum of annual rate of change of each school surveyed by total number of target schools.
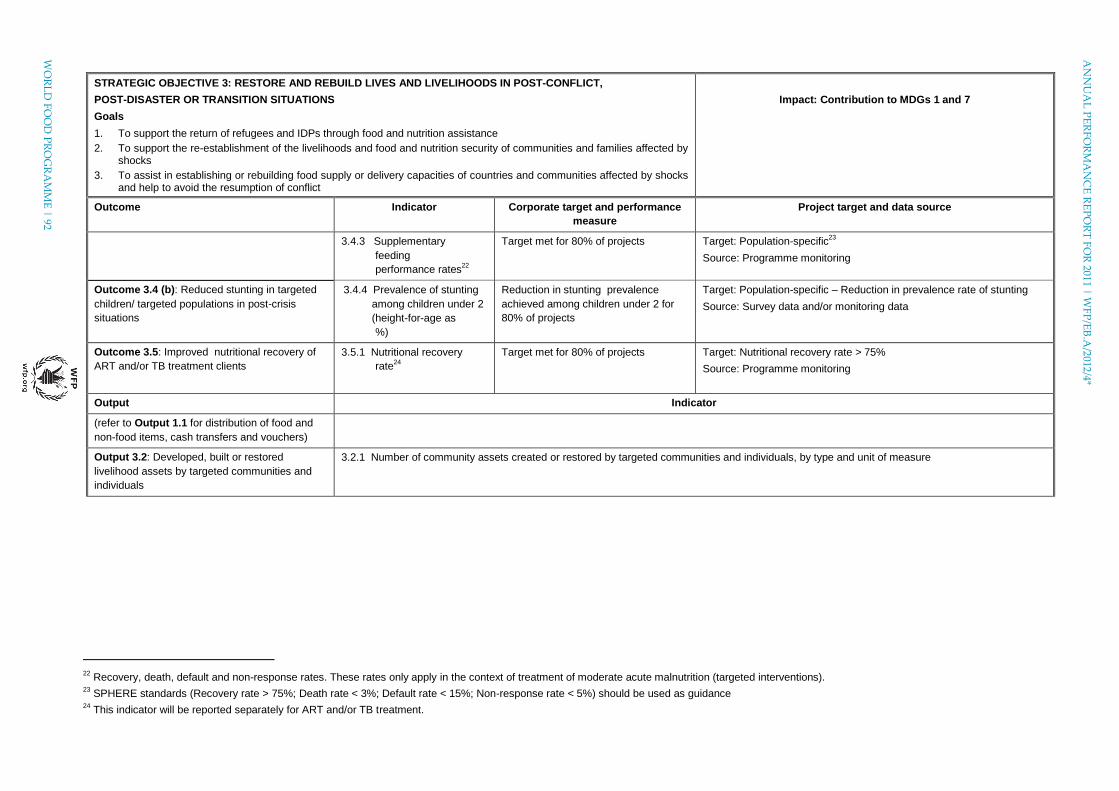
WO
RL
D F
OO
D P
RO
GR
AM
ME
| 92
AN
NU
AL
PE
RF
OR
MA
NC
E R
EP
OR
T F
OR
2011 | WF
P/E
B.A
/2012/4*
STRATEGIC OBJECTIVE 3: RESTORE AND REBUILD LIVES AND LIVELIHOODS IN POST-CONFLICT,
POST-DISASTER OR TRANSITION SITUATIONS
Goals
1. To support the return of refugees and IDPs through food and nutrition assistance
2. To support the re-establishment of the livelihoods and food and nutrition security of communities and families affected by shocks
3. To assist in establishing or rebuilding food supply or delivery capacities of countries and communities affected by shocks and help to avoid the resumption of conflict
Impact: Contribution to MDGs 1 and 7
Outcome Indicator Corporate target and performance
measure
Project target and data source
3.4.3 Supplementary
feeding
performance rates22
Target met for 80% of projects Target: Population-specific23
Source: Programme monitoring
Outcome 3.4 (b): Reduced stunting in targeted
children/ targeted populations in post-crisis
situations
3.4.4 Prevalence of stunting
among children under 2
(height-for-age as
%)
Reduction in stunting prevalence
achieved among children under 2 for
80% of projects
Target: Population-specific – Reduction in prevalence rate of stunting
Source: Survey data and/or monitoring data
Outcome 3.5: Improved nutritional recovery of
ART and/or TB treatment clients
3.5.1 Nutritional recovery
rate24
Target met for 80% of projects Target: Nutritional recovery rate > 75%
Source: Programme monitoring
Output Indicator
(refer to Output 1.1 for distribution of food and
non-food items, cash transfers and vouchers)
Output 3.2: Developed, built or restored
livelihood assets by targeted communities and
individuals
3.2.1 Number of community assets created or restored by targeted communities and individuals, by type and unit of measure
22
Recovery, death, default and non-response rates. These rates only apply in the context of treatment of moderate acute malnutrition (targeted interventions). 23
SPHERE standards (Recovery rate > 75%; Death rate < 3%; Default rate < 15%; Non-response rate < 5%) should be used as guidance 24
This indicator will be reported separately for ART and/or TB treatment.
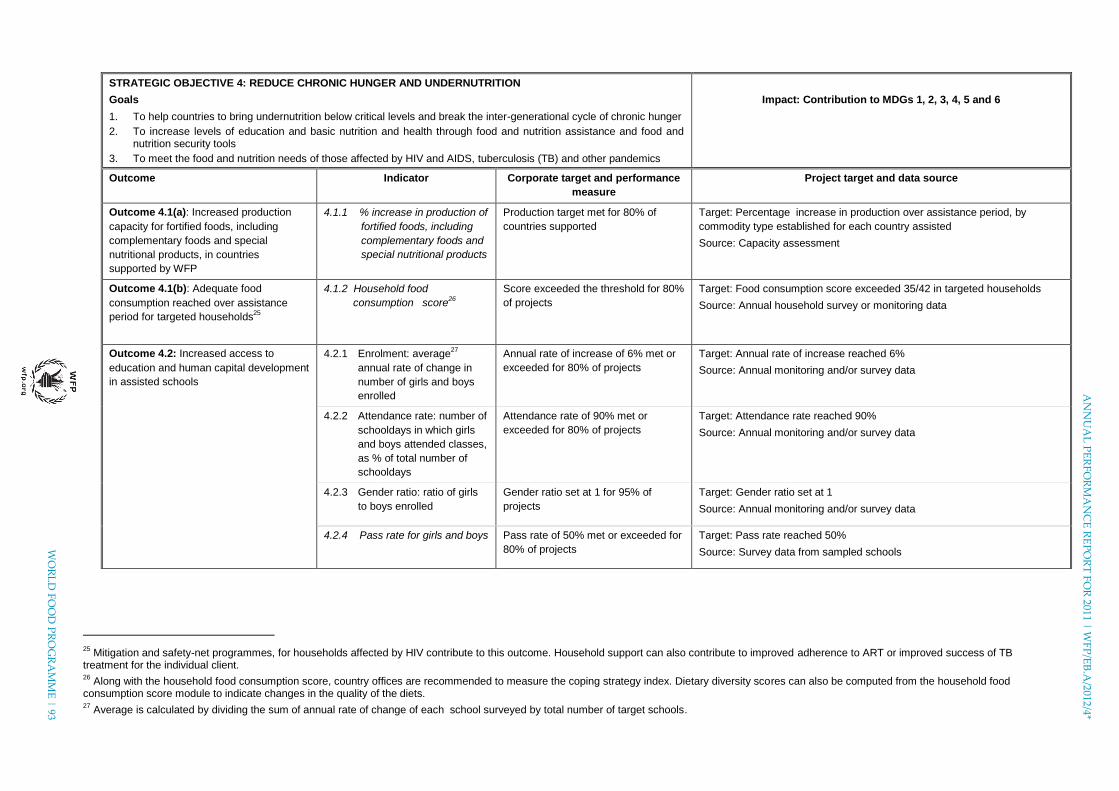
AN
NU
AL
PE
RF
OR
MA
NC
E R
EP
OR
T F
OR
2011 | WF
P/E
B.A
/2012/4*
WO
RL
D F
OO
D P
RO
GR
AM
ME
| 93
STRATEGIC OBJECTIVE 4: REDUCE CHRONIC HUNGER AND UNDERNUTRITION
Goals
1. To help countries to bring undernutrition below critical levels and break the inter-generational cycle of chronic hunger
2. To increase levels of education and basic nutrition and health through food and nutrition assistance and food and nutrition security tools
3. To meet the food and nutrition needs of those affected by HIV and AIDS, tuberculosis (TB) and other pandemics
Impact: Contribution to MDGs 1, 2, 3, 4, 5 and 6
Outcome Indicator Corporate target and performance
measure
Project target and data source
Outcome 4.1(a): Increased production
capacity for fortified foods, including
complementary foods and special
nutritional products, in countries
supported by WFP
4.1.1 % increase in production of
fortified foods, including
complementary foods and
special nutritional products
Production target met for 80% of
countries supported
Target: Percentage increase in production over assistance period, by
commodity type established for each country assisted
Source: Capacity assessment
Outcome 4.1(b): Adequate food
consumption reached over assistance
period for targeted households25
4.1.2 Household food
consumption score26
Score exceeded the threshold for 80%
of projects
Target: Food consumption score exceeded 35/42 in targeted households
Source: Annual household survey or monitoring data
Outcome 4.2: Increased access to
education and human capital development
in assisted schools
4.2.1 Enrolment: average27
annual rate of change in
number of girls and boys
enrolled
Annual rate of increase of 6% met or
exceeded for 80% of projects
Target: Annual rate of increase reached 6%
Source: Annual monitoring and/or survey data
4.2.2 Attendance rate: number of
schooldays in which girls
and boys attended classes,
as % of total number of
schooldays
Attendance rate of 90% met or
exceeded for 80% of projects
Target: Attendance rate reached 90%
Source: Annual monitoring and/or survey data
4.2.3 Gender ratio: ratio of girls
to boys enrolled
Gender ratio set at 1 for 95% of
projects
Target: Gender ratio set at 1
Source: Annual monitoring and/or survey data
4.2.4 Pass rate for girls and boys Pass rate of 50% met or exceeded for
80% of projects
Target: Pass rate reached 50%
Source: Survey data from sampled schools
25
Mitigation and safety-net programmes, for households affected by HIV contribute to this outcome. Household support can also contribute to improved adherence to ART or improved success of TB treatment for the individual client. 26
Along with the household food consumption score, country offices are recommended to measure the coping strategy index. Dietary diversity scores can also be computed from the household food consumption score module to indicate changes in the quality of the diets. 27
Average is calculated by dividing the sum of annual rate of change of each school surveyed by total number of target schools.
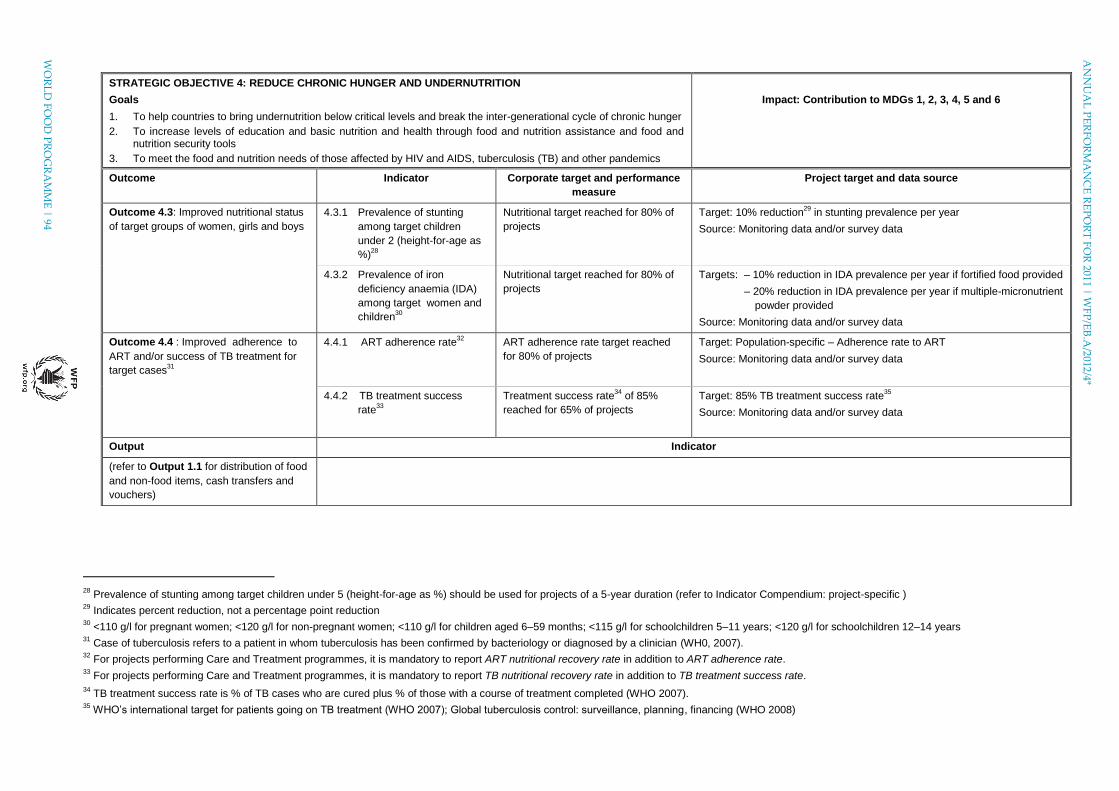
WO
RL
D F
OO
D P
RO
GR
AM
ME
| 94
AN
NU
AL
PE
RF
OR
MA
NC
E R
EP
OR
T F
OR
2011 | WF
P/E
B.A
/2012/4*
STRATEGIC OBJECTIVE 4: REDUCE CHRONIC HUNGER AND UNDERNUTRITION
Goals
1. To help countries to bring undernutrition below critical levels and break the inter-generational cycle of chronic hunger
2. To increase levels of education and basic nutrition and health through food and nutrition assistance and food and nutrition security tools
3. To meet the food and nutrition needs of those affected by HIV and AIDS, tuberculosis (TB) and other pandemics
Impact: Contribution to MDGs 1, 2, 3, 4, 5 and 6
Outcome Indicator Corporate target and performance
measure
Project target and data source
Outcome 4.3: Improved nutritional status
of target groups of women, girls and boys
4.3.1 Prevalence of stunting
among target children
under 2 (height-for-age as
%)28
Nutritional target reached for 80% of
projects
Target: 10% reduction29
in stunting prevalence per year
Source: Monitoring data and/or survey data
4.3.2 Prevalence of iron
deficiency anaemia (IDA)
among target women and
children30
Nutritional target reached for 80% of
projects
Targets: – 10% reduction in IDA prevalence per year if fortified food provided
– 20% reduction in IDA prevalence per year if multiple-micronutrient
powder provided
Source: Monitoring data and/or survey data
Outcome 4.4 : Improved adherence to
ART and/or success of TB treatment for
target cases31
4.4.1 ART adherence rate32
ART adherence rate target reached
for 80% of projects
Target: Population-specific – Adherence rate to ART
Source: Monitoring data and/or survey data
4.4.2 TB treatment success
rate33
Treatment success rate34
of 85%
reached for 65% of projects
Target: 85% TB treatment success rate35
Source: Monitoring data and/or survey data
Output Indicator
(refer to Output 1.1 for distribution of food
and non-food items, cash transfers and
vouchers)
28
Prevalence of stunting among target children under 5 (height-for-age as %) should be used for projects of a 5-year duration (refer to Indicator Compendium: project-specific ) 29
Indicates percent reduction, not a percentage point reduction 30
<110 g/l for pregnant women; <120 g/l for non-pregnant women; <110 g/l for children aged 6–59 months; <115 g/l for schoolchildren 5–11 years; <120 g/l for schoolchildren 12–14 years 31
Case of tuberculosis refers to a patient in whom tuberculosis has been confirmed by bacteriology or diagnosed by a clinician (WH0, 2007). 32
For projects performing Care and Treatment programmes, it is mandatory to report ART nutritional recovery rate in addition to ART adherence rate. 33
For projects performing Care and Treatment programmes, it is mandatory to report TB nutritional recovery rate in addition to TB treatment success rate.
34 TB treatment success rate is % of TB cases who are cured plus % of those with a course of treatment completed (WHO 2007).
35 WHO’s international target for patients going on TB treatment (WHO 2007); Global tuberculosis control: surveillance, planning, financing (WHO 2008)

AN
NU
AL
PE
RF
OR
MA
NC
E R
EP
OR
T F
OR
2011 | WF
P/E
B.A
/2012/4*
WO
RL
D F
OO
D P
RO
GR
AM
ME
| 95
STRATEGIC OBJECTIVE 5: STRENGTHEN THE CAPACITIES OF COUNTRIES TO REDUCE HUNGER,
INCLUDING THROUGH HAND-OVER STRATEGIES AND LOCAL PURCHASE
Goals
1. To use purchasing power to support the sustainable development of food and nutrition security systems, and transform food and nutrition assistance into a productive investment in local communities
2. To develop clear hand-over strategies to enhance nationally owned hunger solutions
3. To strengthen the capacities of countries to design, manage and implement tools, policies and programmes to predict and reduce hunger
Impact: Contribution to MDGs 1 and 8
Outcome Indicator Corporate target and performance
measure
Project target and data source
Outcome 5.1:
Increased marketing
opportunities at
national level with
cost- effective WFP
local purchases
5.1.1 Food purchased locally, as %
of food distributed in-country
Target met for food purchased locally in 80%
of countries supported
Target: Set for country – % increase in food purchased locally and cost- effectively
Source: Annual monitoring data and cost-effectiveness analysis
Outcome 5.2:
Progress made
towards nationally
owned hunger
solutions36
5.2.1 National capacity index (NCI),
by hunger solution
Target met for 80% of projects Target: Set for country – Threshold set to capture increase in national capacity (based
on initial assessment, by hunger solution)
Source: Capacity assessment exercise
Output Indicator
Output 5.1: Food
purchased locally
5.1.1 Tonnage of food purchased locally, by type and country classification
Output 5.2: Capacity
and awareness
developed through
WFP-led activities
5.2.1 Number of people trained in programme design and planning, implementation procedures and practices, disaggregated by category (national government and partner staff)
5.2.2 Number of technical assistance projects conducted by WFP to strengthen the national capacity
5.2.3 WFP expenditures for technical assistance to strengthen national capacity (US$)
5.2.4 Number of WFP-managed hunger solutions, systems and tools37
handed over to the national government
36
Hunger solutions are about investing in people through effective, targeted social protection programmes, including sustainable home-grown and country-led responses to the urgent challenges of hunger and malnutrition facing the most vulnerable and poor people. Hunger solutions include purchase for progress (P4P) activities, targeted productive and social safety net programmes, home-grown school feeding, nutrition programmes, enhancing the resilience of vulnerable people through community-level disaster risk reduction, risk transfer and insurance schemes, natural resources management, asset creation, livelihoods diversification and infrastructure development programmes. 37
WFP's supporting analysis tools to implement hunger solutions are tailored, together with the required targeting and monitoring institutional tools - vulnerability and food security analysis, comprehensive food security and vulnerability analysis, early warning systems, needs assessment, contingency planning, market analysis – to the needs of the most vulnerable countries and communities. Operational tools used are as follows: Local and international tendering processes, modalities (like food, cash and vouchers), food, cash or vouchers distribution mechanisms, food processing, food management, food ration calculation, cash/voucher entitlement calculation, general food distribution methodology, beneficiary registration, etc.

WO
RL
D F
OO
D P
RO
GR
AM
ME
| 96
AN
NU
AL
PE
RF
OR
MA
NC
E R
EP
OR
T F
OR
2011 | WF
P/E
B.A
/2012/4*
ANNEX II-B: OUTCOME PERFORMANCE REPORTING
INDICATOR Reporting rate
(%)1
No. of projects
reported on
indicators
No. of values2 No. of
comparable
values3
Improvement
no. (%)
Stabilization
no. (%)
Weighted
improvement
(%)
Strategic Objective 1
Prevalence of acute malnutrition among
children under 5 (weight-for-height as %)4 63 42 84 31 20 (65) 1 (3)
64
Prevalence of low mid-upper arm
circumference (MUAC)5 38 6 6 0 0 (0) 0 (0)
Supplementary feeding recovery rate new indicator 33 38 30 20 (67) 2 (7)
Supplementary feeding death rate new indicator 14 14 10 9 (90) 0 (0)
Supplementary feeding default rate new indicator 25 27 21 13 (62) 0 (0)
Supplementary feeding non-response rate new indicator 7 8 6 4 (67) 0 (0)
Household food consumption score 87 45 52 45 25 (56) 4 (9)
Retention rate 67 4 4 2 2 (100) 0 (0)
ART/TB/PMTCT default rate 57 4 4 3 1 (33) 2 (67)
Strategic Objective 2
Disaster preparedness index 20 2 2 2 1 (50) 0 (0)
68
Household food consumption score 71 15 15 13 9 (69) 0 (0)
Households asset score 71 5 5 2 1 (50) 0 (0)
Community asset score 50 7 7 5 5 (100) 0 (0)
1 The reporting rate is calculated as the number of projects reported on corporate indicators in SPRs divided by the total number of projects that have included these indicator(s) in the log frames.
2 For the majority of indicators, 1 project reports 1 indicator value, with the exception of nutrition indicators (which may be disaggregated based on locations e.g. more refugee camps and 1 project may
have more than 1 value for the same indicator). 3 Excludes non-comparable (if and when there are no baselines or previous or later follow-up) or single values
4 Projects targeting children under 2 to measure the prevalence of acute malnutrition among children under 2
5 Includes prevalence of MUAC for children under 5 and under 2, depending on project targeting
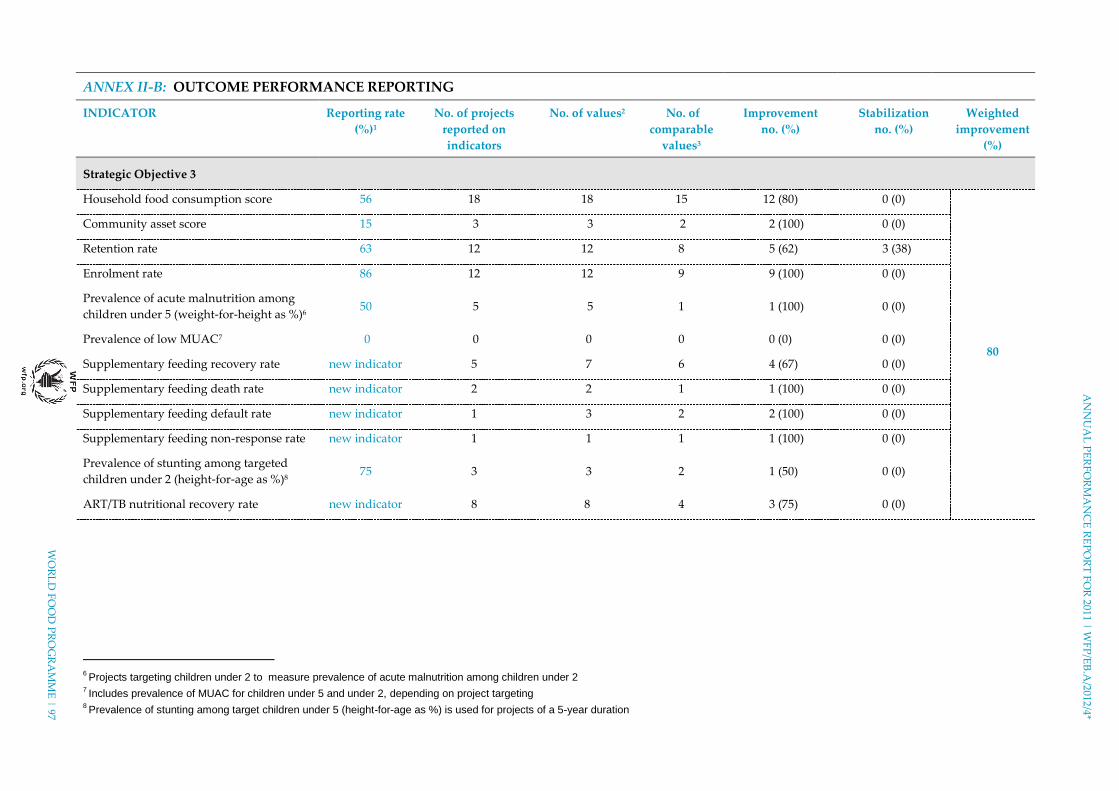
AN
NU
AL
PE
RF
OR
MA
NC
E R
EP
OR
T F
OR
2011 | WF
P/E
B.A
/2012/4*
WO
RL
D F
OO
D P
RO
GR
AM
ME
| 97
ANNEX II-B: OUTCOME PERFORMANCE REPORTING
INDICATOR Reporting rate
(%)1
No. of projects
reported on
indicators
No. of values2 No. of
comparable
values3
Improvement
no. (%)
Stabilization
no. (%)
Weighted
improvement
(%)
Strategic Objective 3
Household food consumption score 56 18 18 15 12 (80) 0 (0)
80
Community asset score 15 3 3 2 2 (100) 0 (0)
Retention rate 63 12 12 8 5 (62) 3 (38)
Enrolment rate 86 12 12 9 9 (100) 0 (0)
Prevalence of acute malnutrition among
children under 5 (weight-for-height as %)6 50 5 5 1 1 (100) 0 (0)
Prevalence of low MUAC7 0 0 0 0 0 (0) 0 (0)
Supplementary feeding recovery rate new indicator 5 7 6 4 (67) 0 (0)
Supplementary feeding death rate new indicator 2 2 1 1 (100) 0 (0)
Supplementary feeding default rate new indicator 1 3 2 2 (100) 0 (0)
Supplementary feeding non-response rate new indicator 1 1 1 1 (100) 0 (0)
Prevalence of stunting among targeted
children under 2 (height-for-age as %)8 75 3 3 2 1 (50) 0 (0)
ART/TB nutritional recovery rate new indicator 8 8 4 3 (75) 0 (0)
6 Projects targeting children under 2 to measure prevalence of acute malnutrition among children under 2
7 Includes prevalence of MUAC for children under 5 and under 2, depending on project targeting
8 Prevalence of stunting among target children under 5 (height-for-age as %) is used for projects of a 5-year duration
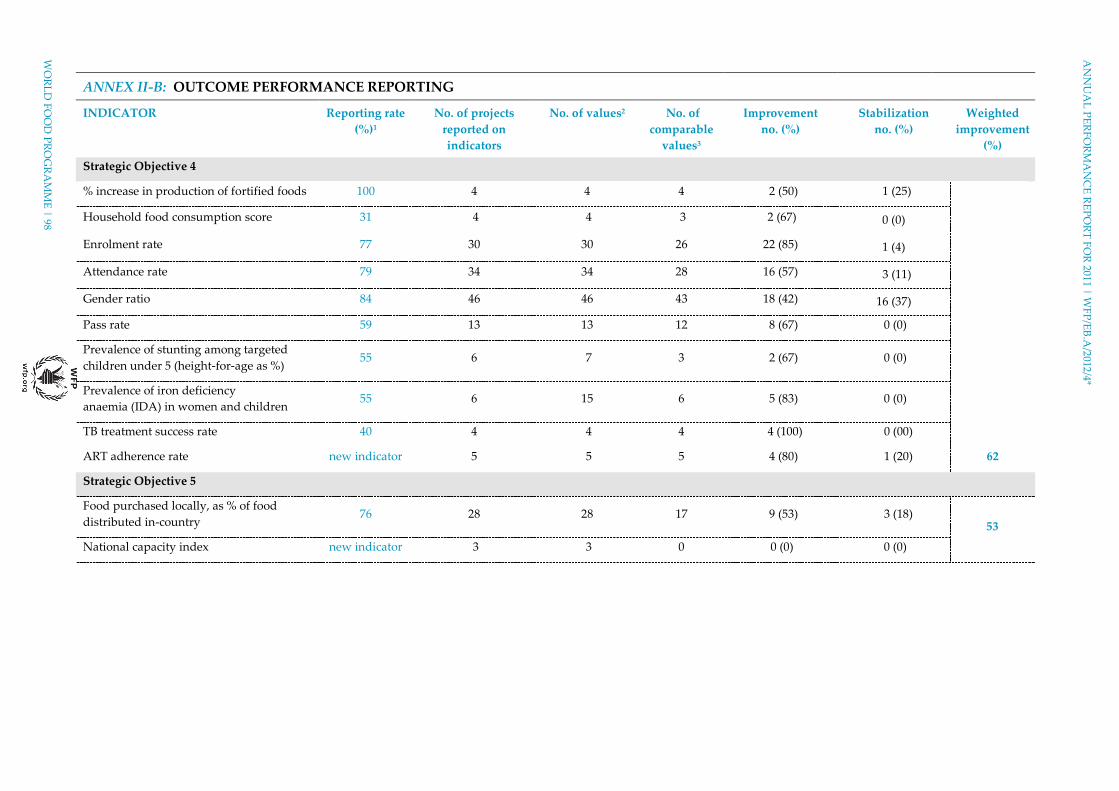
WO
RL
D F
OO
D P
RO
GR
AM
ME
| 98
AN
NU
AL
PE
RF
OR
MA
NC
E R
EP
OR
T F
OR
2011 | WF
P/E
B.A
/2012/4*
ANNEX II-B: OUTCOME PERFORMANCE REPORTING
INDICATOR Reporting rate
(%)1
No. of projects
reported on
indicators
No. of values2 No. of
comparable
values3
Improvement
no. (%)
Stabilization
no. (%)
Weighted
improvement
(%)
Strategic Objective 4
% increase in production of fortified foods 100 4 4 4 2 (50) 1 (25)
62
Household food consumption score 31 4 4 3 2 (67) 0 (0)
Enrolment rate 77 30 30 26 22 (85) 1 (4)
Attendance rate 79 34 34 28 16 (57) 3 (11)
Gender ratio 84 46 46 43 18 (42) 16 (37)
Pass rate 59 13 13 12 8 (67) 0 (0)
Prevalence of stunting among targeted
children under 5 (height-for-age as %) 55 6 7 3 2 (67) 0 (0)
Prevalence of iron deficiency
anaemia (IDA) in women and children 55 6 15 6 5 (83) 0 (0)
TB treatment success rate 40 4 4 4 4 (100) 0 (00)
ART adherence rate new indicator 5 5 5 4 (80) 1 (20)
Strategic Objective 5
Food purchased locally, as % of food
distributed in-country 76 28 28 17 9 (53) 3 (18)
53
National capacity index new indicator 3 3 0 0 (0) 0 (0)
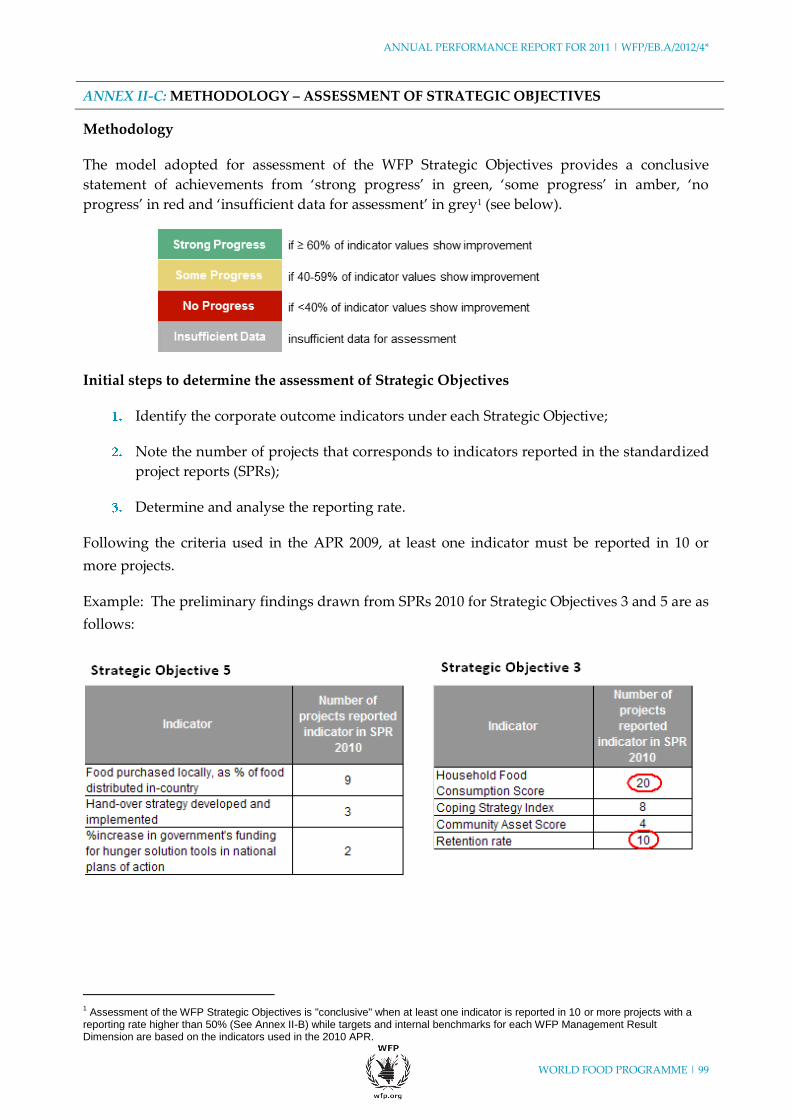
ANNUAL PERFORMANCE REPORT FOR 2011 | WFP/EB.A/2012/4*
WORLD FOOD PROGRAMME | 99
AN
NU
AL
PE
RF
OR
MA
NC
E R
EP
OR
T F
OR
2011 | WF
P/E
B.A
/2012/4
ANNEX II-C: METHODOLOGY – ASSESSMENT OF STRATEGIC OBJECTIVES
Methodology
The model adopted for assessment of the WFP Strategic Objectives provides a conclusive
statement of achievements from ‘strong progress’ in green, ‘some progress’ in amber, ‘no
progress’ in red and ‘insufficient data for assessment’ in grey1 (see below).
Initial steps to determine the assessment of Strategic Objectives
Identify the corporate outcome indicators under each Strategic Objective;
Note the number of projects that corresponds to indicators reported in the standardized
project reports (SPRs);
Determine and analyse the reporting rate.
Following the criteria used in the APR 2009, at least one indicator must be reported in 10 or
more projects.
Example: The preliminary findings drawn from SPRs 2010 for Strategic Objectives 3 and 5 are as
follows:
1 Assessment of the WFP Strategic Objectives is "conclusive" when at least one indicator is reported in 10 or more projects with a
reporting rate higher than 50% (See Annex II-B) while targets and internal benchmarks for each WFP Management Result Dimension are based on the indicators used in the 2010 APR.

ANNUAL PERFORMANCE REPORT FOR 2011 | WFP/EB.A/2012/4*
WORLD FOOD PROGRAMME | 100
AN
NU
AL
PE
RF
OR
MA
NC
E R
EP
OR
T F
OR
2011 | WF
P/E
B.A
/2012/4
ANNEX II-C: METHODOLOGY – ASSESSMENT OF STRATEGIC OBJECTIVES
Analysis:
All indicators reported under Strategic Objective 5 are in less than 10 projects. For this reason,
they are not to be assessed. Detailed information can be found in the Annex II-B. Under
Strategic Objective 3, there are two indicators reported in 10 or more projects, namely
“household food consumption score” and “retention rate”.
The overall performance of Strategic Objective 3 must be assessed on the relative
importance of 20 projects reporting on household food consumption score and
10 projects reporting on retention rate – known as the reporting rate: the number of
projects reported on corporate indicators in SPRs divided by the total number of projects
that have included these indicator(s) in the log frames.
The second criteria analyses whether the reporting rate is equal to or higher than 50% in
at least one of the indicators.
Example: Note the number of projects that have included the indicator reported in the log
frames and the number of projects that corresponds to the indicator reported in SPRs.
Household food consumption score with a 51% reporting rate fully meets the second criteria.
The Strategic Objective 3 is now ready to be assessed.
Final steps to the assessment of Strategic Objectives
The indicator values2 reported in the SPRs provide the status of project achievements or results:
improvement, stabilization or decline.
STEP 1: Delete total number of values with only ‘1’ or incomparable sources for trend analysis.
Example: This specific assessment of Strategic Objective 3 is based on 1 indicator value equals to
1 project. The total numbers of comparable values allow ‘readiness’ to proceed with trend
analysis for all indicators.
2 The majority of indicators have 1 indicator value equals to 1 project, with the exception of nutrition indicators. They are
disaggregated based on locations (e.g. more refugee camps) 1 project may have more than 1 indicator value for the same indicator.

ANNUAL PERFORMANCE REPORT FOR 2011 | WFP/EB.A/2012/4*
WORLD FOOD PROGRAMME | 101
AN
NU
AL
PE
RF
OR
MA
NC
E R
EP
OR
T F
OR
2011 | WF
P/E
B.A
/2012/4
ANNEX II-C: METHODOLOGY – ASSESSMENT OF STRATEGIC OBJECTIVES
STEP 2: Analyse the above indicators using total number of comparable values and giving
weight to the performance achievements/results relative to the reporting frequency.
Example: The preliminary findings drawn from SPRs 2010 showed greater percentage of
‘improvement’ values:
Analysis:
A, B, C and D represent the total number of comparable values reported to allow trend analysis.
1, 2, 3 and 4 represent the results reported in SPRs 2010. Out of 18 projects, 94% reported an
improvement in household food consumption score.
To give weight to the performance results of this specific Strategic Objective, A, B, C and D are
designated as weights. The overall 80% weighted improvement for Strategic Objective 3 is
calculated on this basis:
(A*1 + B*2 + C*3 + D*4)/sum (A+B+C+D).
Conclusion: In 2010 WFP’s result for Strategic Objective 3 was STRONG PROGRESS.

ANNUAL PERFORMANCE REPORT FOR 2011 | WFP/EB.A/2012/4*
WORLD FOOD PROGRAMME | 102
AN
NU
AL
PE
RF
OR
MA
NC
E R
EP
OR
T F
OR
2011 | WF
P/E
B.A
/2012/4
ANNEX II-D: LESSONS LEARNED — 2011 REPORTING
There were 212 active WFP projects in 2011: 49 EMOPs,1 66 PRROs, 32 CPs, 27 DEVs and 38 SOs.
The reporting of corporate outcome indicators improved to 66 percent, the highest level since
the SRF (2008–2013) was approved. The most frequently reported indicator was “household
food consumption score”, reported by 79 projects.
Nutrition
The most frequently reported nutrition indicators were “prevalence of acute malnutrition
among children under 5” in 46 projects and “supplementary feeding performance rates” in
40 projects, under Strategic Objectives 1 and 3.
There was a good deal of non-comparable data or indicators reporting only one value for
“prevalence of acute malnutrition among children under 5”. In some cases this was because of
changing country circumstances or development contexts, which hindered the collection of data;
in others data collection at different times of year made comparison difficult because of seasonal
changes in nutritional status. Guidance materials for collecting and analysing anthropometric
data will be made available before future SPR cycles. With regard to supplementary feeding, all
four indicators must be jointly accounted for in each project to enable improved interpretation of
the results.
School Feeding
All indicators – “retention rate”, “enrolment rate”, “attendance rate”, “gender ratio” and
“pass rate” – had reporting rates of more than 50 percent under Strategic Objectives 1, 3 and 4.
Livelihoods
Of projects with livelihood activities under Strategic Objective 2, 70 percent reported on
corporate outcome indicators. Seven country offices in 2011, compared with five in 2010,
reported on “household asset score” and “community asset score” indicators.
Of projects with livelihood activities under Strategic Objective 3, 66 percent reported on one or
two corporate outcome indicators compared with 59 percent in 2010. There was, however, an
increase in the number of projects not reporting on the indicators as a result of late start dates,
short duration or a livelihood component that was small compared with other activities.
Mitigation, Safety Nets, Care and Treatment for People Affected by HIV and TB
The most frequently reported HIV and TB indicators were “ART adherence rate” in 11 projects
and “TB treatment success rate” in 4 projects, under Strategic Objectives 3 and 4.
Although the indicator was only introduced in November 2011, eight projects were able to
report on “nutritional recovery rates” under Strategic Objectives 3 and 4.
1 Includes immediate response emergency operations (IR-EMOPs).
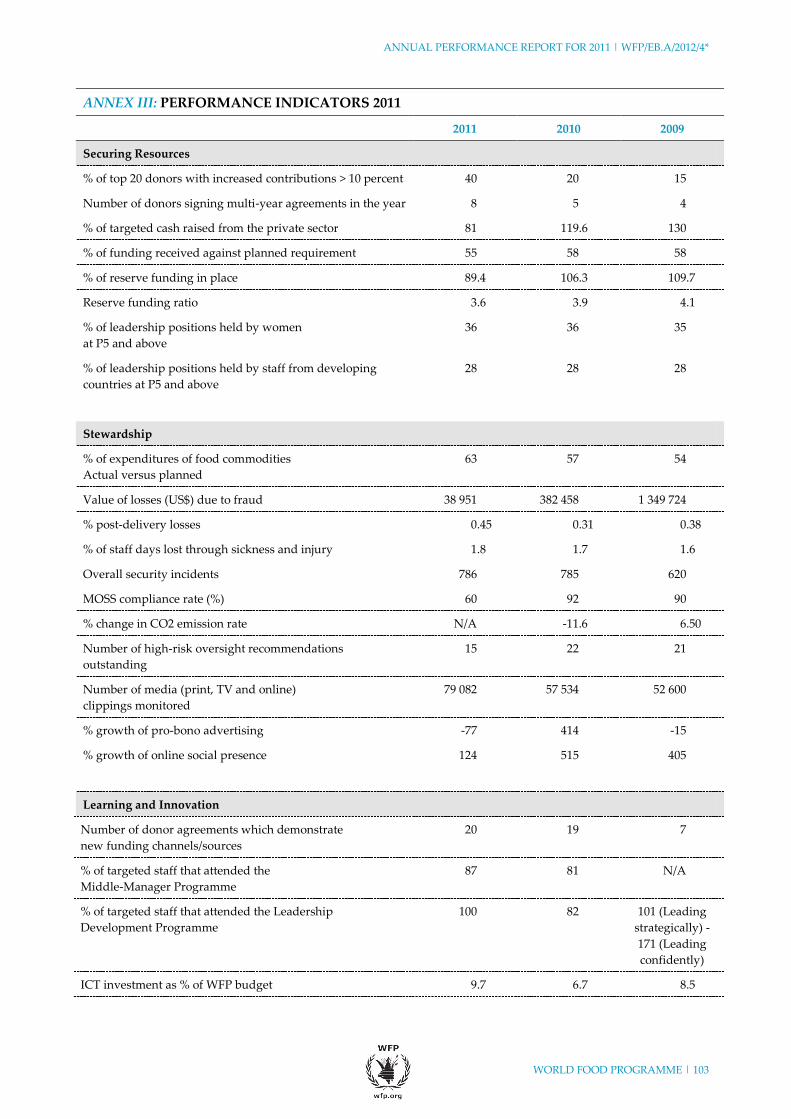
ANNUAL PERFORMANCE REPORT FOR 2011 | WFP/EB.A/2012/4*
WORLD FOOD PROGRAMME | 103
AN
NU
AL
PE
RF
OR
MA
NC
E R
EP
OR
T F
OR
2011 | WF
P/E
B.A
/2012/4
ANNEX III: PERFORMANCE INDICATORS 2011
2011 2010 2009
Securing Resources
% of top 20 donors with increased contributions > 10 percent 40 20 15
Number of donors signing multi-year agreements in the year 8 5 4
% of targeted cash raised from the private sector 81 119.6 130
% of funding received against planned requirement 55 58 58
% of reserve funding in place 89.4 106.3 109.7
Reserve funding ratio 3.6 3.9 4.1
% of leadership positions held by women
at P5 and above
36 36 35
% of leadership positions held by staff from developing
countries at P5 and above
28 28 28
Stewardship
% of expenditures of food commodities
Actual versus planned
63 57 54
Value of losses (US$) due to fraud 38 951 382 458 1 349 724
% post-delivery losses 0.45 0.31 0.38
% of staff days lost through sickness and injury 1.8 1.7 1.6
Overall security incidents 786 785 620
MOSS compliance rate (%) 60 92 90
% change in CO2 emission rate N/A -11.6 6.50
Number of high-risk oversight recommendations
outstanding
15 22 21
Number of media (print, TV and online)
clippings monitored
79 082 57 534 52 600
% growth of pro-bono advertising -77 414 -15
% growth of online social presence 124 515 405
Learning and Innovation
Number of donor agreements which demonstrate
new funding channels/sources
20 19 7
% of targeted staff that attended the
Middle-Manager Programme
87 81 N/A
% of targeted staff that attended the Leadership
Development Programme
100 82 101 (Leading
strategically) -
171 (Leading
confidently)
ICT investment as % of WFP budget 9.7 6.7 8.5
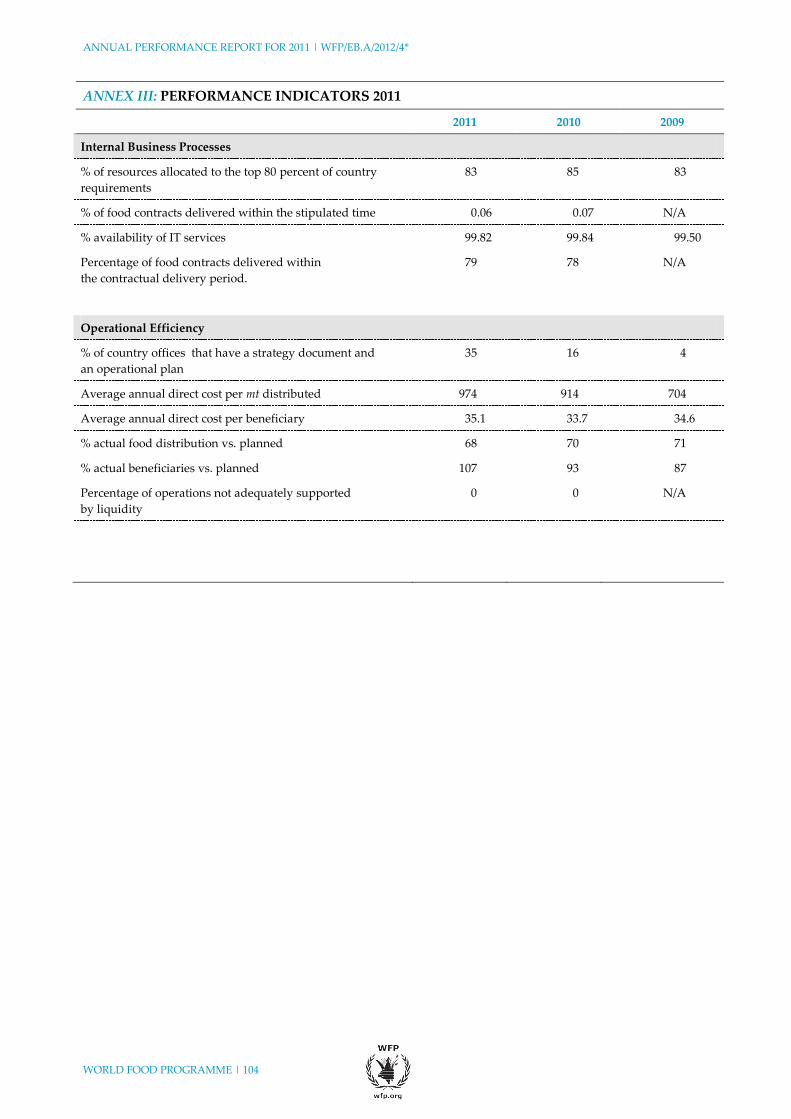
ANNUAL PERFORMANCE REPORT FOR 2011 | WFP/EB.A/2012/4*
WORLD FOOD PROGRAMME | 104
AN
NU
AL
PE
RF
OR
MA
NC
E R
EP
OR
T F
OR
2011 | WF
P/E
B.A
/2012/4
ANNEX III: PERFORMANCE INDICATORS 2011
2011 2010 2009
Internal Business Processes
% of resources allocated to the top 80 percent of country
requirements
83 85 83
% of food contracts delivered within the stipulated time 0.06 0.07 N/A
% availability of IT services 99.82 99.84 99.50
Percentage of food contracts delivered within
the contractual delivery period.
79 78 N/A
Operational Efficiency
% of country offices that have a strategy document and
an operational plan
35 16 4
Average annual direct cost per mt distributed 974 914 704
Average annual direct cost per beneficiary 35.1 33.7 34.6
% actual food distribution vs. planned 68 70 71
% actual beneficiaries vs. planned 107 93 87
Percentage of operations not adequately supported
by liquidity
0 0 N/A
ANNUAL PERFORMANCE REPORT FOR 2011 | WFP/EB.A/2012/4*
WORLD FOOD PROGRAMME | 105
AN
NU
AL
PE
RF
OR
MA
NC
E R
EP
OR
T F
OR
2011 | WF
P/E
B.A
/2012/4
ANNEX IV: ETHICS REPORT
I. INTRODUCTION AND BACKGROUND
1. The WFP Ethics Office was established in January 2008 pursuant to the Secretary-General’s
Bulletin ST/SGB/2007/11 “United Nations system-wide application of ethics: separately
administered organs and programmes”. The primary objective of the Ethics Office is to ensure that
all staff members of the organization observe and perform their functions consistent with the
highest standards of integrity required by the Charter of the United Nations, and in accordance
with the Standards of Conduct for the International Civil Service. The strategy for achieving this
goal is to foster a culture of ethics, transparency and accountability. The principal responsibilities
of the Ethics Office include implementation of the following policies or activities:
A. Financial Disclosure (ref. ED Circular 2008/004)
B. Protection Against Retaliation (ref. ED Circular 2008/003)
C. Confidential Advice (ref. ED Circular 2008/002)
D. Training, Education and Outreach (ref. ED Circular 2008/002)
E. Participation in United Nations Ethics Committee and Network
(ref. ED Circular 2008/002; ST/SGB/2007/11)
2. This report of the WFP Ethics Office has been prepared pursuant to Section 5.4 of
ST/SGB/2007/11 which requires the Ethics Offices in the United Nations Secretariat and the
separately administered organs and programmes to prepare annual reports for review by the
United Nations Ethics Committee (UNEC).
3. The present report provides an assessment of the activities undertaken by the WFP Ethics Office
during the period 1 January–31 December 2011.
Summary
The present report is submitted pursuant to Executive Director’s Circular ED 2008/002 entitled
“Establishment of Ethics Office in WFP” in which the Ethics Office is requested to report annually
on the activities of the Ethics Office and the implementation of ethics policies. The report also
includes information on the activities of the United Nations Ethics Committee of which the WFP
Ethics Office is a member.
The current report covers the period 1 January–31 December 2011.

ANNUAL PERFORMANCE REPORT FOR 2011 | WFP/EB.A/2012/4*
WORLD FOOD PROGRAMME | 106
AN
NU
AL
PE
RF
OR
MA
NC
E R
EP
OR
T F
OR
2011 | WF
P/E
B.A
/2012/4
II. ACTIVITIES OF THE WFP ETHICS OFFICE
Financial and Conflict of Interest Disclosure Programme
4. WFP’s policy on financial disclosure was adopted in April 2008 pursuant to Executive Director’s
Circular 2008/004 and was first implemented in 2009. The financial disclosure policy is a key
component of the Programme’s commitment to transparency and public confidence-building
measures. The Financial Disclosure Programme (FDP) acts as a safeguard and risk management
tool for both staff members and the organization as a whole. The Ethics Office is mandated to
administer the financial disclosure programme of the organization as a means of identifying,
managing and mitigating conflict of interest risks in pursuit of strengthening public trust in the
integrity of the organization. The financial disclosure statements are jointly reviewed by the
WFP Ethics Office and an outsourced external party.
5. In 2011, the Ethics Office implemented its third annual financial disclosure exercise for the 2010
transaction year and completed the review of statements from the 2010 exercise. Eligible staff
members include staff at the D-1 level or above, procurement officers, staff members who have
procurement or investment responsibilities as their principle terms of reference, staff whose
principal occupational duties relate to the procurement of goods and services, and those whose
direct access to confidential procurement or investment information warrants the filing of a
financial disclosure statement. For the 2011 FDP exercise, 1491 WFP employees – representing
9.9 percent of the total staff population - were identified by senior unit or country office managers
for completion of a disclosure statement or a Conflict of Interest questionnaire. This total represents
a 38 percent increase over the previous year as indicated in Figure 1, and can be attributed on the
one hand to greater awareness of the programme as well as to a tendency on the part of some
managers to expand the list of eligible staff on the other.
Figure 1: Financial Disclosure Participation by Calendar Year (2009–2011)
6. For the 2011 FDP exercise, the Ethics Office piloted a new Conflict of Interest (CoI) questionnaire
as part of the annual exercise. The enlarged questionnaire is essentially an expansion of the
follow-up questions included in the standard financial disclosure form, and consists of a series of
questions revolving around the most common conflicts of interest confronting WFP employees as
identified from an in-depth analysis of the two previous exercises in 2009 and 2010. The conflict of
interest questionnaire requests staff to provide information on any relationships they or their
dependent family members may have had with any WFP vendors or partners or governments, and
to report any outside activities, receipt of gifts or awards, family relations in the United Nations,
landlord/renter relations, etc. Completion of the questionnaire is designed to elicit or uncover any
550
1083
1491
0
500
1000
1500
2000
2009 2010 2011
Number of filers
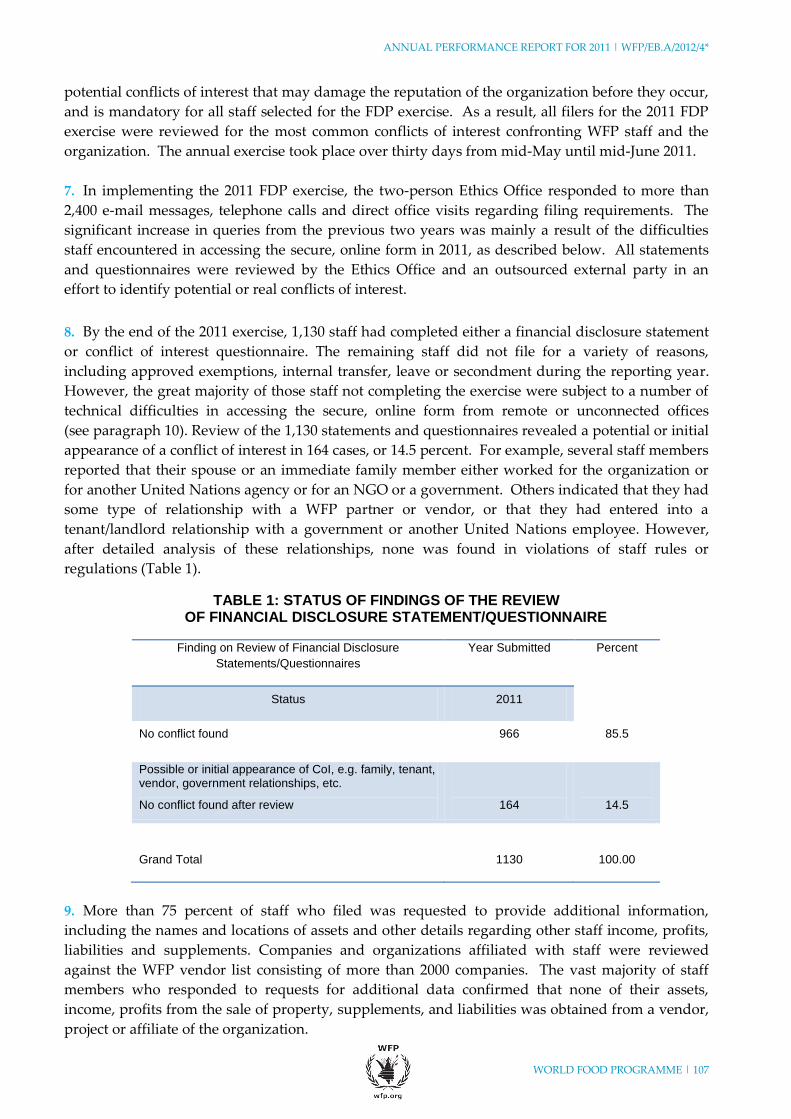
ANNUAL PERFORMANCE REPORT FOR 2011 | WFP/EB.A/2012/4*
WORLD FOOD PROGRAMME | 107
AN
NU
AL
PE
RF
OR
MA
NC
E R
EP
OR
T F
OR
2011 | WF
P/E
B.A
/2012/4
potential conflicts of interest that may damage the reputation of the organization before they occur,
and is mandatory for all staff selected for the FDP exercise. As a result, all filers for the 2011 FDP
exercise were reviewed for the most common conflicts of interest confronting WFP staff and the
organization. The annual exercise took place over thirty days from mid-May until mid-June 2011.
7. In implementing the 2011 FDP exercise, the two-person Ethics Office responded to more than
2,400 e-mail messages, telephone calls and direct office visits regarding filing requirements. The
significant increase in queries from the previous two years was mainly a result of the difficulties
staff encountered in accessing the secure, online form in 2011, as described below. All statements
and questionnaires were reviewed by the Ethics Office and an outsourced external party in an
effort to identify potential or real conflicts of interest.
8. By the end of the 2011 exercise, 1,130 staff had completed either a financial disclosure statement
or conflict of interest questionnaire. The remaining staff did not file for a variety of reasons,
including approved exemptions, internal transfer, leave or secondment during the reporting year.
However, the great majority of those staff not completing the exercise were subject to a number of
technical difficulties in accessing the secure, online form from remote or unconnected offices
(see paragraph 10). Review of the 1,130 statements and questionnaires revealed a potential or initial
appearance of a conflict of interest in 164 cases, or 14.5 percent. For example, several staff members
reported that their spouse or an immediate family member either worked for the organization or
for another United Nations agency or for an NGO or a government. Others indicated that they had
some type of relationship with a WFP partner or vendor, or that they had entered into a
tenant/landlord relationship with a government or another United Nations employee. However,
after detailed analysis of these relationships, none was found in violations of staff rules or
regulations (Table 1).
TABLE 1: STATUS OF FINDINGS OF THE REVIEW OF FINANCIAL DISCLOSURE STATEMENT/QUESTIONNAIRE
Finding on Review of Financial Disclosure
Statements/Questionnaires
Year Submitted Percent
Status 2011
No conflict found 966 85.5
Possible or initial appearance of CoI, e.g. family, tenant, vendor, government relationships, etc.
No conflict found after review
164
14.5
Grand Total
1130
100.00
9. More than 75 percent of staff who filed was requested to provide additional information,
including the names and locations of assets and other details regarding other staff income, profits,
liabilities and supplements. Companies and organizations affiliated with staff were reviewed
against the WFP vendor list consisting of more than 2000 companies. The vast majority of staff
members who responded to requests for additional data confirmed that none of their assets,
income, profits from the sale of property, supplements, and liabilities was obtained from a vendor,
project or affiliate of the organization.
ANNUAL PERFORMANCE REPORT FOR 2011 | WFP/EB.A/2012/4*
WORLD FOOD PROGRAMME | 108
AN
NU
AL
PE
RF
OR
MA
NC
E R
EP
OR
T F
OR
2011 | WF
P/E
B.A
/2012/4
10. In 2011, the Programme continued its transition from the Lotus Notes email platform to
MS Outlook as part of the “Connect” project, a strategic objective of the Information and
Technology Division. As a result, all Headquarters units and a number of regional bureaux and
country offices were able to access the online filing application via MS Outlook in a secure, one-step
process. However, most country offices and several regional bureaux continued to use the Lotus
Notes platform during the course of 2011. Those offices relying on access to the online application
through Lotus Notes experienced a number of exceptional difficulties in accessing the secure online
form as a result of changes introduced during the transition to MS Outlook. In most cases, filers
attempting to access the online forms were obliged to employ procedures which required new or
revised passwords for secure access, and were subject in many cases to security blocks requiring
additional assistance from the IT service desk. While the security of both email systems was
maintained as the highest priority, a significant number of staff attempting to file through
Lotus Notes was ultimately unable to access the form after numerous attempts. The IT department
has since resolved the problem of access for all eligible staff for the 2012 exercise.
Protection of staff against retaliation for reporting misconduct and for cooperation with duly
authorized audits or investigations
11. It is the duty of all employees to report any breach of WFP’s regulations and rules to officials
whose responsibility is to take appropriate action and to cooperate with WFP’s oversight functions.
An individual who makes such a report in good faith has the right to be protected against
retaliation. Among the key responsibilities of WFP’s Ethics Office is to enhance protection against
retaliation for individuals who report misconduct, provide information in good faith on
wrongdoing by one or more employees, or cooperate with a duly authorized audit or investigation.
The main objective of the policy is to ensure that staff who has a duty to report misconduct and
cooperate with audits and investigations will not be prevented from doing so out of fear of
retaliation.
12. The Ethics Office is charged with receiving complaints of retaliation and conducting an initial
“prima facie” review to determine if the complainant should be protected under the policy
(ED Circular 2008/003). If no prima facie case is established, the complainant is advised of the most
appropriate internal mechanism for resolving the issues raised. Where a prima facie case is
established, the complaint is referred by the Ethics Office in writing to the Inspector General and
Oversight Office (OS) for investigation.
13. Pending the completion of a referred investigation, the Ethics Office may recommend to the
Executive Director that interim protection measures be implemented to safeguard the interests of
the complainant. The Ethics Office will make a final determination subsequent to receipt and
assessment of the completed investigation report and evidential materials.
14. During the 2011 reporting period, the Ethics Office received six inquiries related to protection
against retaliation as compared to one each in 2009 and 2010. Preliminary review assessments were
deemed to be warranted in four of the six inquiries but only one of these four was referred for
investigation subsequent to a prima facie finding of retaliation. The others did not qualify under
the criteria after initial review and were dismissed or referred to other offices. Of the two remaining

ANNUAL PERFORMANCE REPORT FOR 2011 | WFP/EB.A/2012/4*
WORLD FOOD PROGRAMME | 109
AN
NU
AL
PE
RF
OR
MA
NC
E R
EP
OR
T F
OR
2011 | WF
P/E
B.A
/2012/4
inquiries, one was voluntarily withdrawn and one initiated in late 2011 is still pending additional
information.
Confidential Advice
15. The Ethics Office is mandated to provide advice to staff and management in a confidential
setting in an effort to prevent, identify or manage actual or potential conflicts of interest. This
activity not only helps staff maintain high professional and ethical standards but also helps to
avoid or manage situations that could give rise to a conflict of interest. The Office is also
responsible for formulating, reviewing and disseminating policies, standard-setting, training and
guidance to both management and staff related to all ethical issues, including advice on issues of
independence, neutrality, political activity, loyalty to the organization and its principal goals, and
status as international civil servants.
16. During the reporting period, the Ethics Office registered 107 requests for advice on issues
unrelated to financial disclosure, up from 67 in 2010 and 38 in 2009, illustrating the growing
significance of its guidance function. The nature of these requests (Figure 2) included advice on
conflicts of interest - outside activities (43 percent), the United Nations Code of Conduct or
harassment, (43 percent), the acceptance of gifts or favours (11 percent) and employment related
(3 percent).
Figure 2: Requests for Advice – Categories
Training, Education and Outreach
17. Training, education and outreach activities are key functions of the WFP Ethics Office and
efforts designed to reinforce staff and management compliance with the highest ethical standards
continued in 2011 through a variety of activities.
18. The WFP Ethics Office has made two United Nations online ethics training courses available for
all staff on its website since its establishment in 2008 and has issued periodic notices encouraging
staff to complete the online courses. The Office has also collaborated with the Human Resources
Division (Learning and Performance Branch) and other oversight offices in the design of
mandatory training courses for all staff on the United Nations Standards of Conduct, anti-fraud,
anti-corruption practices, ethics awareness and harassment.
Outside activities: 43%
Code of conduct, harassment,other complaints: 43%
Gifts, awards and hospitality:11%
Employment related: 3%
ANNUAL PERFORMANCE REPORT FOR 2011 | WFP/EB.A/2012/4*
WORLD FOOD PROGRAMME | 110
AN
NU
AL
PE
RF
OR
MA
NC
E R
EP
OR
T F
OR
2011 | WF
P/E
B.A
/2012/4
19. Following the Executive Board approval of an anti-fraud, anti-corruption policy in late 2010, the
Ethics Office collaborated with the OS in a joint presentation of awareness training on
anti-Fraud/anti-Corruption as well as on Ethics and Harassment, Sexual Harassment, and Abuse of
Power (HSHAP) policies in early 2011. WFP’s senior management staff was separately briefed on
ethical issues as were other Headquarters units, including in particular the Procurement and
Logistics Divisions. A booklet prepared jointly with the Procurement Division entitled “A Guide to
Ethics in Procurement” was subsequently disseminated throughout the division in 2011 through its
internal website.
20. The Ethics Office also collaborated with the offices of the WFP and UNHCR Ombudsmen as
well as with the UNHCR Ethics Office to jointly train WFP and UNHCR Respectful Workplace
Advisors (RWAs) as “Ethics Ambassadors” in the Asia region (September 2011). The training of
RWAs as “Ethics Ambassadors” is a new initiative begun in 2011, and is scheduled for extension to
the Sudan, Latin America and Caribbean and West Africa Regional Bureaux in 2012. Newly
trained Ethics Ambassadors will act as focal points in Country Offices for ethics issues and will
provide colleagues with a confidential, neutral contact point and source of information and support
when experiencing a workplace conflict or ethical challenge. They will refer to the Ethics Office in
Headquarters for advice and consultation, and the Ethics Office, along with the Office of the
Ombudsman, will be responsible for updating the Ethics Ambassadors on the latest relevant
policies and practices.
21. The Ethics Office also extended person-to-person ethics awareness training to all
Country Directors in the Southern Africa region (December 2011), and continued its three-year
collaboration with the Division of Human Resources in 2011 to brief all newly-recruited WFP
personnel on ethical standards of integrity. Pamphlets summarizing the principal functions and
policies of the Ethics Office were produced and distributed to all participants in all the awareness
training sessions. Additional awareness training in other Headquarters units is scheduled for 2012.
Standard-setting and policy support
22. Fostering a corporate culture of ethics, transparency and accountability requires frequent and
consistent advocacy and is another critical responsibility of the WFP Ethics Office. Over the course
of 2011, the Ethics Office continued to provide guidance to management on the incorporation of
ethical standards in organizational practices and processes.
23. As ex-officio member of the Expanded Senior Management Group Meeting (ESMGM)
chaired by the Executive Director, the Director of the Ethics Office participates in weekly senior
staff meetings to provide updates on the latest Ethics Office practices and policies. The Ethics Office
is also invited on a regular basis by the Policy, Planning and Strategy Division to review any new
corporate policy initiatives, and the Human Resources Division continued to request the advice of
the Ethic Office on a regular basis. The Office also played an important advisory role to
management for WFP participation in the review of the Standards of Conduct undertaken in 2011
by the International Civil Service Commission (ICSC).
24. In 2011, the Ethics Office also drafted and disseminated new questionnaire forms related to
protection against retaliation and outside activities which facilitated requests from staff seeking
advice on these two important policies.
ANNUAL PERFORMANCE REPORT FOR 2011 | WFP/EB.A/2012/4*
WORLD FOOD PROGRAMME | 111
AN
NU
AL
PE
RF
OR
MA
NC
E R
EP
OR
T F
OR
2011 | WF
P/E
B.A
/2012/4
United Nations Ethics Committee and Network
25. The United Nations Ethics Committee (UNEC) was established by the Office of the
Secretary-General pursuant to bulletin ST/SGB/2007/11 which entered into force on
1 December 2007. The Committee is mandated to establish a unified set of ethical standards and
policies of the United Nations Secretariat and of the separately administered organs and
programmes, and to consult on certain important and particularly complex cases and issues having
United Nations system-wide implications. In 2011, for example, the WFP Ethics Office provided
advice to WFP management on, inter alia, the ICSC review of the Standards of Conduct, reflecting
the consensus of the Committee.
26. The membership of the United Nations Ethics Committee is comprised of the heads of the
Ethics Offices of the separately administered organs and programmes of the United Nations and
the Ethics Office of the United Nations Secretariat. As of 31 December 2011, the Committee
consisted of the following members: the Ethics Office of the United Nations Secretariat (chair),
UNDP, UNICEF, United Nations Population Fund (UNFPA), United Nations Office for Project
Services (UNOPS), WFP, United Nations Relief and Works Agency for Palestine Refugees in the
Near East (UNRWA) and UNHCR.
27. In support of the Secretary-General’s promotion of system-wide collaboration on ethics-related
issues within the United Nations family, an Ethics Network was established on 21 June 2010.
Members of the Network include ethics officers and related professionals from the United Nations
Secretariat, United Nations Funds, Programmes and Specialized Agencies, international financial
institutions, including the World Bank, the International Monetary Fund and other multilateral
entities. Having held three meetings since its establishment, one of which occurred during the
reporting period, the Network has thus far focused its collaborative efforts on the development of a
compendium of practices in relation to the functions of an ethics office and on the exchange of
experience and materials in the areas of surveys, ethics training, financial disclosure and ethics
advisory services. The Ethics Network has since been renamed the Ethics Network of Multilateral
Organizations (ENMO).
28. As per the provision of the Secretary-General’s Bulletin on United Nations system-wide
application of Ethics, the WFP Director of Ethics Office participates in the United Nations
Ethics Committee meetings. As a member of the UNEC, the Director of the Ethics Office
participated in all nine United Nations Ethics Committee meetings as well as the Ethics Network
meeting held in Vienna, Austria in July 2011. During the reporting period, the UNEC addressed a
number of issues of common interest including harmonization and coherence on ethics advice,
implementation of financial disclosure programmes, E-learning and ethics, review of the annual
reports of UNEC members, induction briefing for senior managers, a review of the ICSC Standards
of Conduct, anti-corruption/anti-fraud projects and proposals, and a workshop on protection
against retaliation policies and practices amongst UNEC members. The work of the United Nations
Ethics Committee is reflected in the Report of the Secretary-General to the 66th Session of the
General Assembly “Activities of the Ethics Office” (doc. A/66/319).

ANNUAL PERFORMANCE REPORT FOR 2011 | WFP/EB.A/2012/4*
WORLD FOOD PROGRAMME | 112
AN
NU
AL
PE
RF
OR
MA
NC
E R
EP
OR
T F
OR
2011 | WF
P/E
B.A
/2012/4
III. CONCLUSION
29. After four years of operation, the Ethics Office continued to assert its relevance and its role in
fostering a culture of ethics, integrity and accountability within the organization while fulfilling its
growing mandated responsibilities and overcoming staff constraints. Given the exponential
growth each year in the number of queries or requests for advice addressed to the Ethics Office, it
will be necessary to expand the WFP Ethics Office beyond the current Director and administrative
assistant. Such an expansion will also ensure that historical precedents and continuity are
maintained.
30. The United Nations Ethics Committee has proved itself to be a useful mechanism for ensuring a
coherent application of ethics standards and for enhancing synergy within the United Nations, as
demonstrated in the process of developing the system-wide Code of Ethics for United Nations
personnel and the harmonization of key ethics-related policies and practices during the reporting
period.

ANNUAL PERFORMANCE REPORT FOR 2011 | WFP/EB.A/2012/4*
WORLD FOOD PROGRAMME | 113
AN
NU
AL
PE
RF
OR
MA
NC
E R
EP
OR
T F
OR
2011 | WF
P/E
B.A
/2012/4
ANNEX V: WFP EMPLOYEES WITH CONTRACTS OF ONE YEAR OR LONGER1
CATEGORY TOTAL
NUMBER
OF WOMEN
PERCENTAGE
OF WOMEN
Higher categories (D-2 and above) 50 13 26
International professionals (P-1 to D-1) 1 375 557 41
Junior professional officers 49 36 73
TOTAL INTERNATIONALLY RECRUITED 1 474 606 41
National professional officers 619 223 36
General service 2 895 1 140 39
Service contracts 6 811 1 554 23
TOTAL LOCALLY RECRUITED 10 325 2 917 28
TOTAL WFP EMPLOYEES2 11 799 3 523 30
1 Excludes temporary contracts of 11 months or less such as those for short-term international professionals, consultants, short-term
general service, special service agreements, interns, author's contract, fellowship, United Nations and WFP volunteers and casual labourers. 2 Data extracted on 12 January 2012 from WINGS II.

ANNUAL PERFORMANCE REPORT FOR 2011 | WFP/EB.A/2012/4*
WORLD FOOD PROGRAMME | 114
AN
NU
AL
PE
RF
OR
MA
NC
E R
EP
OR
T F
OR
2011 | WF
P/E
B.A
/2012/4
ANNEX VI: GLOBAL FOOD AID PROFILE
2007 2008 2009 2010 2011
Total food aid deliveries (million mt)
Global food aid deliveries 6.0 6.5 6.1 5.9 4.1
Of which by WFP 3.1 4.0 3.8 3.3 2.4
Food aid deliveries by commodity
Cereals 5.2 5.6 5.2 5.5 3.8
Non-cereals 0.9 0.9 0.9 0.3 0.3
Global food aid deliveries (%)
Procurement in developing countries 39 32 31 32 34
Deliveries by channel
Bilateral 22 11 6 5 4
Multilateral 54 64 64 57 62
Non-governmental organizations (NGOs) 24 25 30 37 34
Food aid deliveries by category
Emergency 62 76 74 74 67
Project 23 19 22 22 30
Programme 15 5 4 4 3
Food aid deliveries by region
Sub-Saharan Africa 53 63 63 58 62
Asia 30 24 23 29 21
Eastern Europe and Commonwealth of
Independent States (CIS)
5 2 2 1 0
Latin America and the Caribbean 6 5 5 8 7
Middle East and North Africa 6 6 5 4 10
Deliveries to
Developing countries 97.7 98.3 97.9 98.4 95.8
Least developed countries (LDCs) 56.5 68.8 66.9 66.5 64.2
Low-income food-deficit countries (LIFDCs) 92.0 91.9 92.0 94.5 87.2
Total food aid deliveries as % of
World cereal production 0.2 0.2 0.2 0.2 0.2
World cereal imports 1.6 1.8 1.7 1.8 1.2
Total food aid deliveries as % of
LIFDC cereal production 0.4 0.5 0.4 0.5 0.3
LIFDC cereal imports 5.2 6.4 5.6 5.9 3.7
Note: Data are provisional. Sources: WFP/INTERFAIS, 2 May 2012
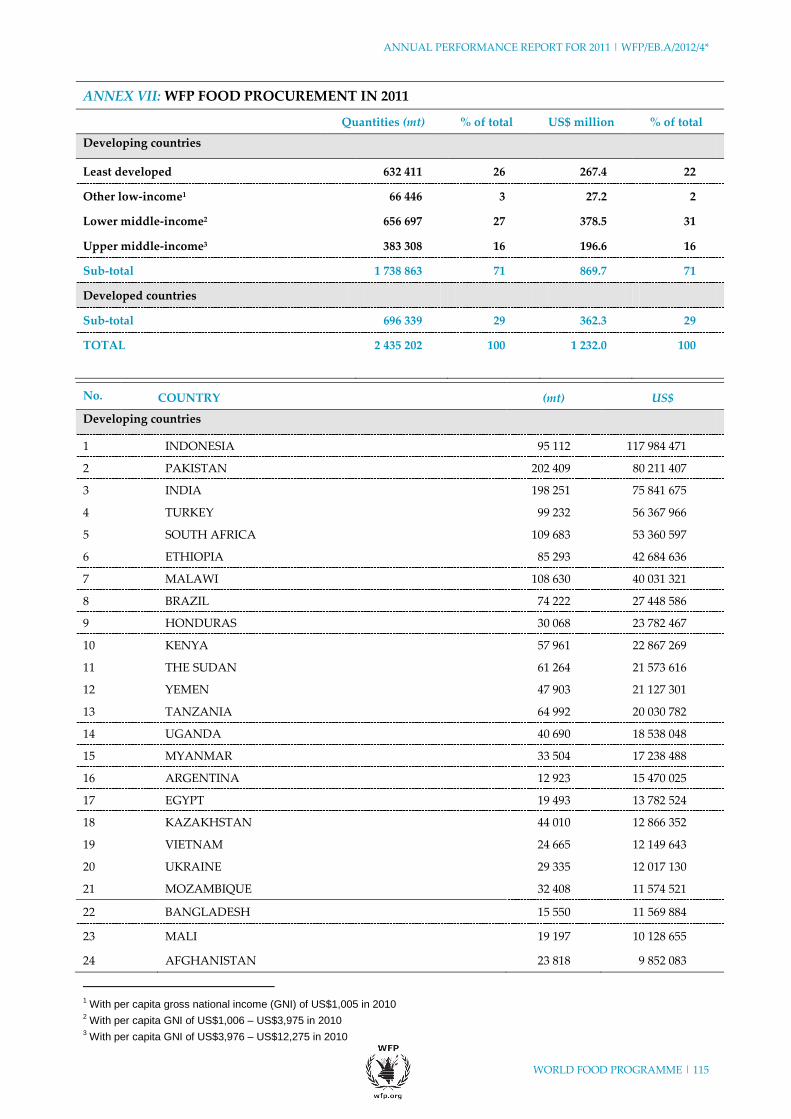
ANNUAL PERFORMANCE REPORT FOR 2011 | WFP/EB.A/2012/4*
WORLD FOOD PROGRAMME | 115
AN
NU
AL
PE
RF
OR
MA
NC
E R
EP
OR
T F
OR
2011 | WF
P/E
B.A
/2012/4
ANNEX VII: WFP FOOD PROCUREMENT IN 2011
Quantities (mt) % of total US$ million % of total
Developing countries
Least developed 632 411 26 267.4 22
Other low-income1 66 446 3 27.2 2
Lower middle-income2 656 697 27 378.5 31
Upper middle-income3 383 308 16 196.6 16
Sub-total 1 738 863 71 869.7 71
Developed countries
Sub-total 696 339 29 362.3 29
TOTAL 2 435 202 100 1 232.0 100
No. COUNTRY (mt) US$
Developing countries
1 INDONESIA 95 112 117 984 471
2 PAKISTAN 202 409 80 211 407
3 INDIA 198 251 75 841 675
4 TURKEY 99 232 56 367 966
5 SOUTH AFRICA 109 683 53 360 597
6 ETHIOPIA 85 293 42 684 636
7 MALAWI 108 630 40 031 321
8 BRAZIL 74 222 27 448 586
9 HONDURAS 30 068 23 782 467
10 KENYA 57 961 22 867 269
11 THE SUDAN 61 264 21 573 616
12 YEMEN 47 903 21 127 301
13 TANZANIA 64 992 20 030 782
14 UGANDA 40 690 18 538 048
15 MYANMAR 33 504 17 238 488
16 ARGENTINA 12 923 15 470 025
17 EGYPT 19 493 13 782 524
18 KAZAKHSTAN 44 010 12 866 352
19 VIETNAM 24 665 12 149 643
20 UKRAINE 29 335 12 017 130
21 MOZAMBIQUE 32 408 11 574 521
22 BANGLADESH 15 550 11 569 884
23 MALI 19 197 10 128 655
24 AFGHANISTAN 23 818 9 852 083
1 With per capita gross national income (GNI) of US$1,005 in 2010
2 With per capita GNI of US$1,006 – US$3,975 in 2010
3 With per capita GNI of US$3,976 – US$12,275 in 2010
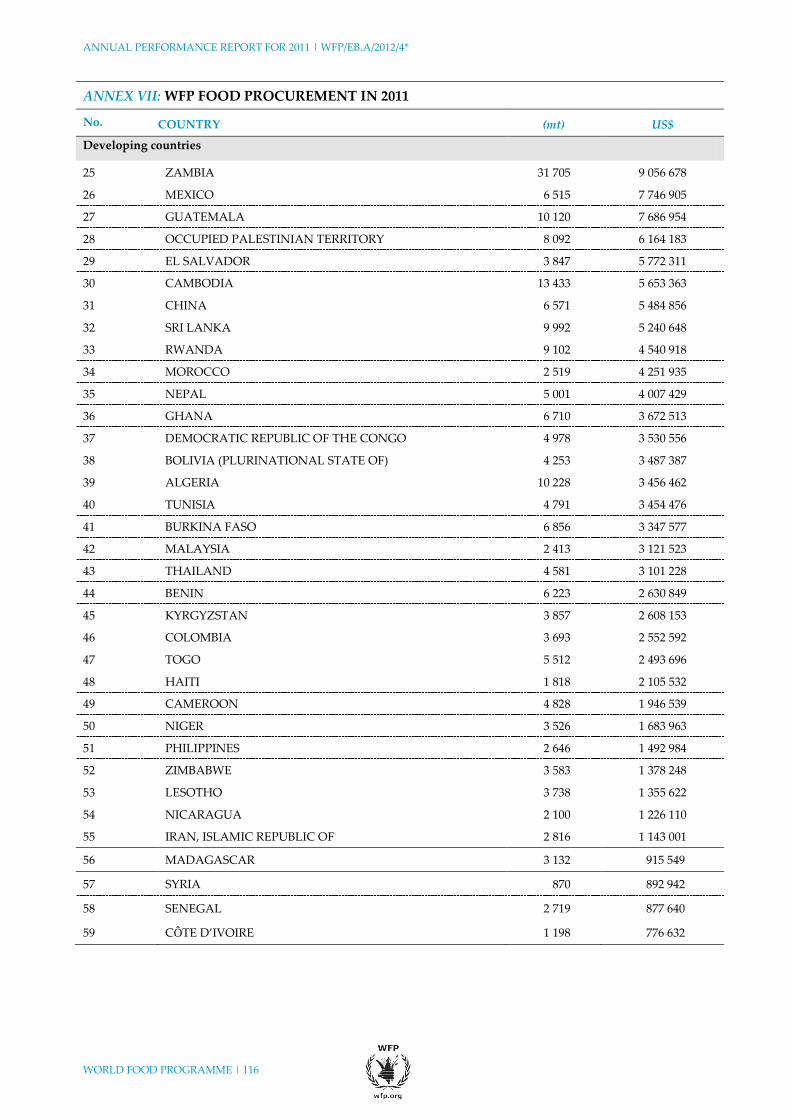
ANNUAL PERFORMANCE REPORT FOR 2011 | WFP/EB.A/2012/4*
WORLD FOOD PROGRAMME | 116
AN
NU
AL
PE
RF
OR
MA
NC
E R
EP
OR
T F
OR
2011 | WF
P/E
B.A
/2012/4
ANNEX VII: WFP FOOD PROCUREMENT IN 2011
No. COUNTRY (mt) US$
Developing countries
25 ZAMBIA 31 705 9 056 678
26 MEXICO 6 515 7 746 905
27 GUATEMALA 10 120 7 686 954
28 OCCUPIED PALESTINIAN TERRITORY 8 092 6 164 183
29 EL SALVADOR 3 847 5 772 311
30 CAMBODIA 13 433 5 653 363
31 CHINA 6 571 5 484 856
32 SRI LANKA 9 992 5 240 648
33 RWANDA 9 102 4 540 918
34 MOROCCO 2 519 4 251 935
35 NEPAL 5 001 4 007 429
36 GHANA 6 710 3 672 513
37 DEMOCRATIC REPUBLIC OF THE CONGO 4 978 3 530 556
38 BOLIVIA (PLURINATIONAL STATE OF) 4 253 3 487 387
39 ALGERIA 10 228 3 456 462
40 TUNISIA 4 791 3 454 476
41 BURKINA FASO 6 856 3 347 577
42 MALAYSIA 2 413 3 121 523
43 THAILAND 4 581 3 101 228
44 BENIN 6 223 2 630 849
45 KYRGYZSTAN 3 857 2 608 153
46 COLOMBIA 3 693 2 552 592
47 TOGO 5 512 2 493 696
48 HAITI 1 818 2 105 532
49 CAMEROON 4 828 1 946 539
50 NIGER 3 526 1 683 963
51 PHILIPPINES 2 646 1 492 984
52 ZIMBABWE 3 583 1 378 248
53 LESOTHO 3 738 1 355 622
54 NICARAGUA 2 100 1 226 110
55 IRAN, ISLAMIC REPUBLIC OF 2 816 1 143 001
56 MADAGASCAR 3 132 915 549
57 SYRIA 870 892 942
58 SENEGAL 2 719 877 640
59 CÔTE D’IVOIRE 1 198 776 632
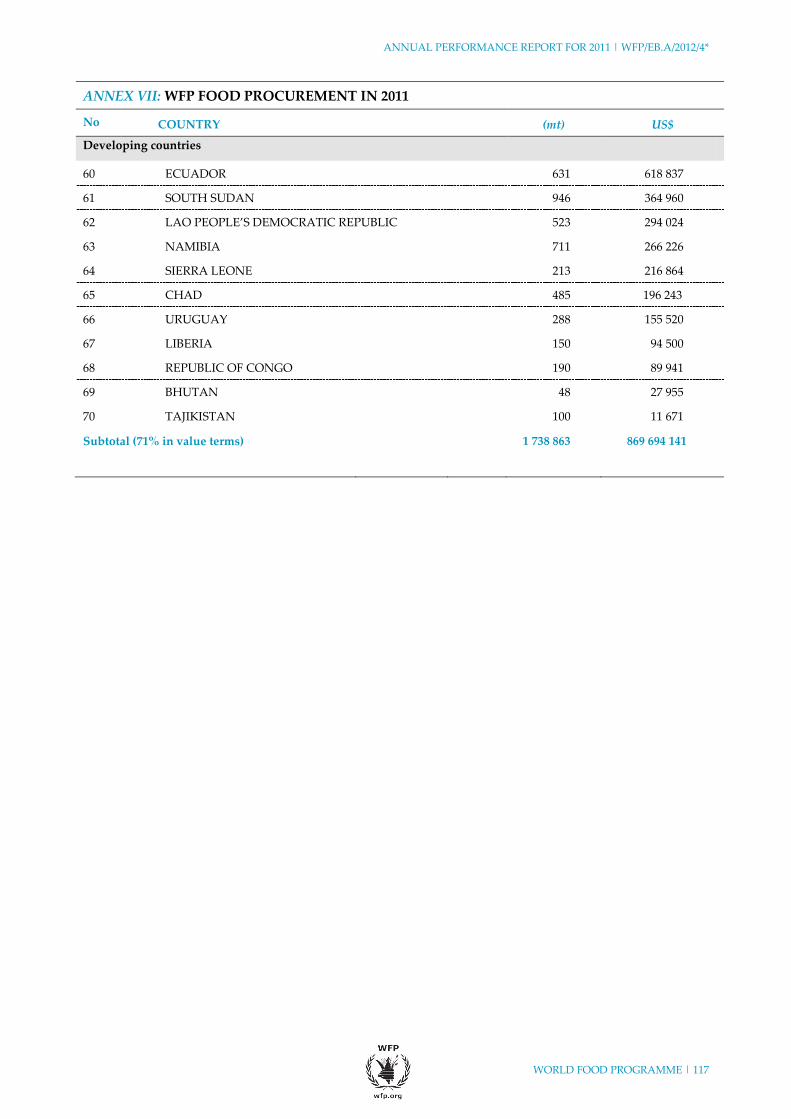
ANNUAL PERFORMANCE REPORT FOR 2011 | WFP/EB.A/2012/4*
WORLD FOOD PROGRAMME | 117
AN
NU
AL
PE
RF
OR
MA
NC
E R
EP
OR
T F
OR
2011 | WF
P/E
B.A
/2012/4
ANNEX VII: WFP FOOD PROCUREMENT IN 2011
No COUNTRY (mt) US$
Developing countries
60 ECUADOR 631 618 837
61 SOUTH SUDAN 946 364 960
62 LAO PEOPLE’S DEMOCRATIC REPUBLIC 523 294 024
63 NAMIBIA 711 266 226
64 SIERRA LEONE 213 216 864
65 CHAD 485 196 243
66 URUGUAY 288 155 520
67 LIBERIA 150 94 500
68 REPUBLIC OF CONGO 190 89 941
69 BHUTAN 48 27 955
70 TAJIKISTAN 100 11 671
Subtotal (71% in value terms) 1 738 863 869 694 141
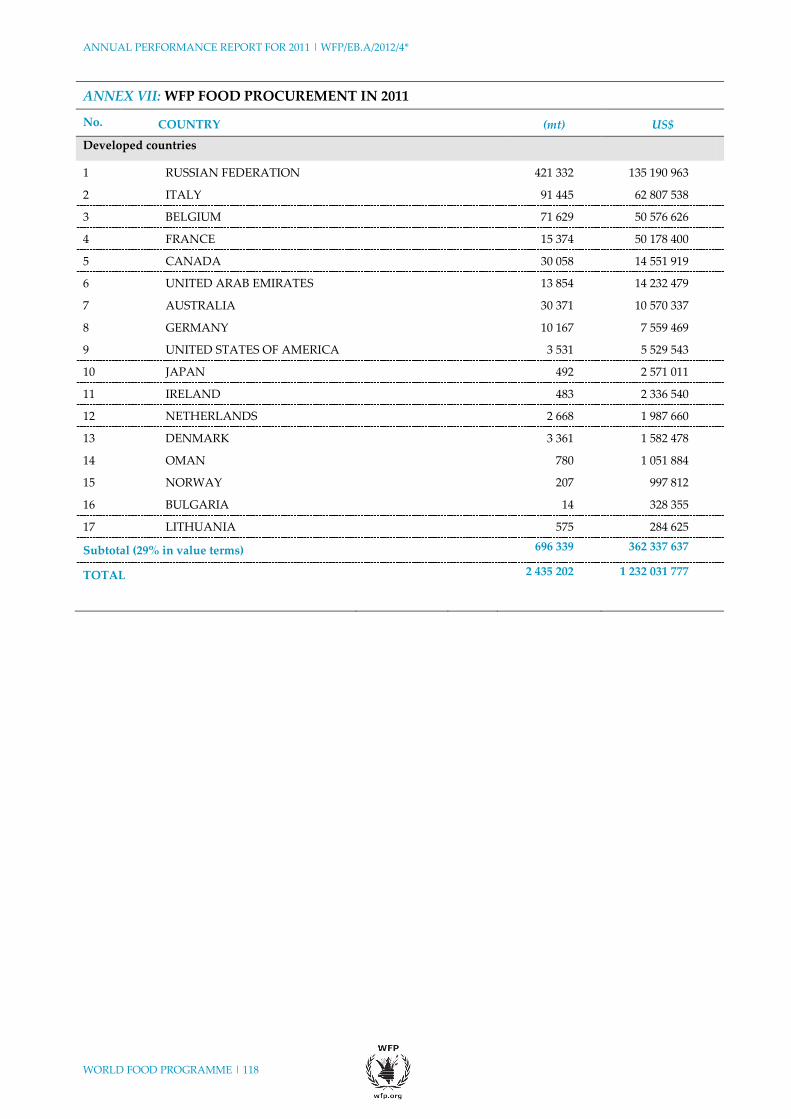
ANNUAL PERFORMANCE REPORT FOR 2011 | WFP/EB.A/2012/4*
WORLD FOOD PROGRAMME | 118
AN
NU
AL
PE
RF
OR
MA
NC
E R
EP
OR
T F
OR
2011 | WF
P/E
B.A
/2012/4
ANNEX VII: WFP FOOD PROCUREMENT IN 2011
No. COUNTRY (mt) US$
Developed countries
1 RUSSIAN FEDERATION 421 332 135 190 963
2 ITALY 91 445 62 807 538
3 BELGIUM 71 629 50 576 626
4 FRANCE 15 374 50 178 400
5 CANADA 30 058 14 551 919
6 UNITED ARAB EMIRATES 13 854 14 232 479
7 AUSTRALIA 30 371 10 570 337
8 GERMANY 10 167 7 559 469
9 UNITED STATES OF AMERICA 3 531 5 529 543
10 JAPAN 492 2 571 011
11 IRELAND 483 2 336 540
12 NETHERLANDS 2 668 1 987 660
13 DENMARK 3 361 1 582 478
14 OMAN 780 1 051 884
15 NORWAY 207 997 812
16 BULGARIA 14 328 355
17 LITHUANIA 575 284 625
Subtotal (29% in value terms) 696 339 362 337 637
TOTAL 2 435 202 1 232 031 777
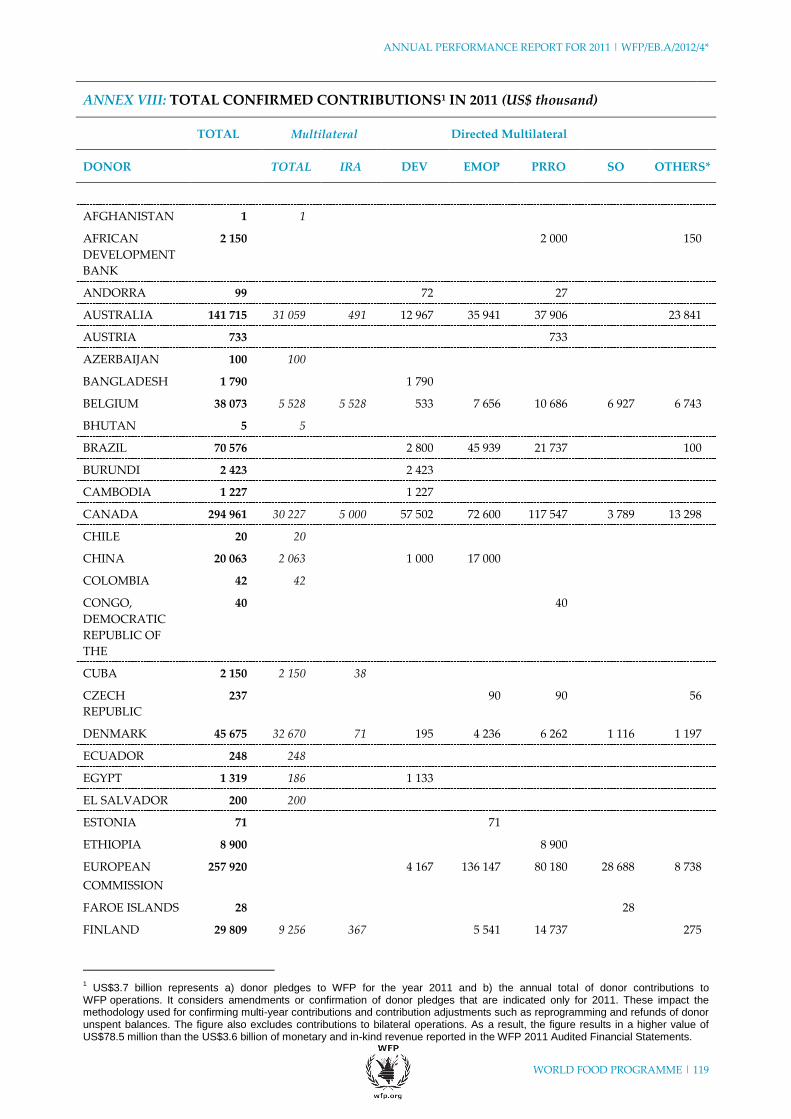
ANNUAL PERFORMANCE REPORT FOR 2011 | WFP/EB.A/2012/4*
WORLD FOOD PROGRAMME | 119
AN
NU
AL
PE
RF
OR
MA
NC
E R
EP
OR
T F
OR
2011 | WF
P/E
B.A
/2012/4
ANNEX VIII: TOTAL CONFIRMED CONTRIBUTIONS1 IN 2011 (US$ thousand)
TOTAL Multilateral Directed Multilateral
DONOR TOTAL IRA DEV EMOP PRRO SO OTHERS*
AFGHANISTAN 1 1
AFRICAN
DEVELOPMENT
BANK
2 150 2 000 150
ANDORRA 99 72 27
AUSTRALIA 141 715 31 059 491 12 967 35 941 37 906 23 841
AUSTRIA 733 733
AZERBAIJAN 100 100
BANGLADESH 1 790 1 790
BELGIUM 38 073 5 528 5 528 533 7 656 10 686 6 927 6 743
BHUTAN 5 5
BRAZIL 70 576 2 800 45 939 21 737 100
BURUNDI 2 423 2 423
CAMBODIA 1 227 1 227
CANADA 294 961 30 227 5 000 57 502 72 600 117 547 3 789 13 298
CHILE 20 20
CHINA 20 063 2 063 1 000 17 000
COLOMBIA 42 42
CONGO,
DEMOCRATIC
REPUBLIC OF
THE
40 40
CUBA 2 150 2 150 38
CZECH
REPUBLIC
237 90 90 56
DENMARK 45 675 32 670 71 195 4 236 6 262 1 116 1 197
ECUADOR 248 248
EGYPT 1 319 186 1 133
EL SALVADOR 200 200
ESTONIA 71 71
ETHIOPIA 8 900 8 900
EUROPEAN
COMMISSION
257 920 4 167 136 147 80 180 28 688 8 738
FAROE ISLANDS 28 28
FINLAND 29 809 9 256 367 5 541 14 737 275
1 US$3.7 billion represents a) donor pledges to WFP for the year 2011 and b) the annual total of donor contributions to
WFP operations. It considers amendments or confirmation of donor pledges that are indicated only for 2011. These impact the methodology used for confirming multi-year contributions and contribution adjustments such as reprogramming and refunds of donor unspent balances. The figure also excludes contributions to bilateral operations. As a result, the figure results in a higher value of US$78.5 million than the US$3.6 billion of monetary and in-kind revenue reported in the WFP 2011 Audited Financial Statements.

ANNUAL PERFORMANCE REPORT FOR 2011 | WFP/EB.A/2012/4*
WORLD FOOD PROGRAMME | 120
AN
NU
AL
PE
RF
OR
MA
NC
E R
EP
OR
T F
OR
2011 | WF
P/E
B.A
/2012/4
ANNEX VIII: TOTAL CONFIRMED CONTRIBUTIONS1 IN 2011 (US$ thousand)
TOTAL Multilateral Directed Multilateral
DONOR TOTAL IRA DEV EMOP PRRO SO OTHERS*
FRANCE 38 956 1 794 8 042 27 288 1 831
GEORGIA 20 20
GERMANY 194 673 31 594 3 047 6 285 22 220 127 452 3 832 3 289
GREECE 127 127
GUATEMALA 75 75
HOLY SEE 10 10
ICELAND 293 10 10 153 78 52
INDIA 14 565 66 2 260 1 000 11 239
INTERNATIONAL
ORGANIZATION
FOR MIGRATION
10 10
IRAQ 14 14
IRELAND 27 010 14 756 2 533 2 857 1 674 6 469 704 549
ISRAEL 165 15 150
ITALY 27 353 14 696 8 663 286 545 3 163
JAPAN 281 863 4 681 672 32 370 76 169 141 481 26 000 1 161
JORDAN 66 66
KAZAKHSTAN 20
KENYA 407
KUWAIT 250
LESOTHO 601
LIECHTENSTEIN 438 115 115 198 125
LUXEMBOURG 11 575 1 480 617 3 056 2 059 2 810 123 2 047
MALAYSIA 1 000 1 000
MAURITANIA 2 078 1 940 138
MEXICO 1 000 50 950
MONACO 211 29 89 93
MOROCCO 633 633
NAMIBIA 1 727 1 727
NETHERLANDS 72 802 54 945 1 047 7 584 7 799 1 427
NEW ZEALAND 8 474 4 580 1 153 1 923 818
NICARAGUA 19 18 1
NORWAY 49 036 34 113 14 036 930 4 711 2 629 6 097 556
OPEC FUND 1 250 850 400
PAKISTAN 2 360 27 2 333
PANAMA 68 68
PERU 483 483
PHILIPPINES 3 548 3 548
POLAND 465 155 310
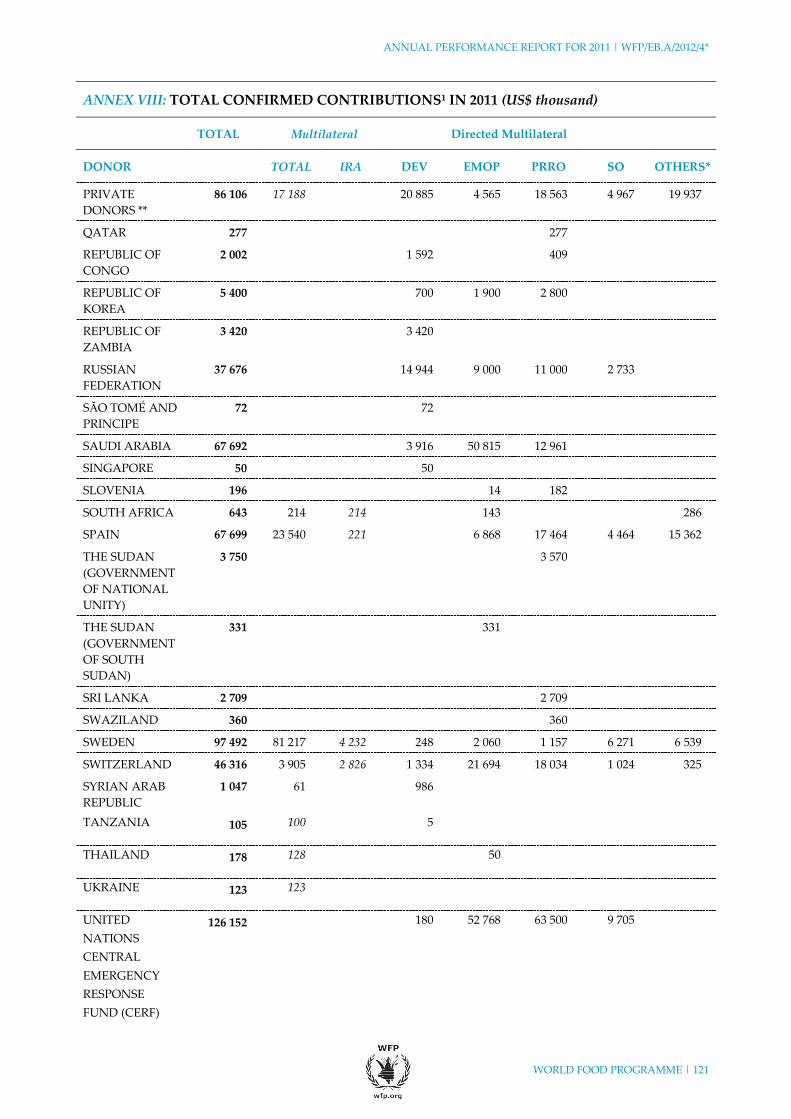
ANNUAL PERFORMANCE REPORT FOR 2011 | WFP/EB.A/2012/4*
WORLD FOOD PROGRAMME | 121
AN
NU
AL
PE
RF
OR
MA
NC
E R
EP
OR
T F
OR
2011 | WF
P/E
B.A
/2012/4
ANNEX VIII: TOTAL CONFIRMED CONTRIBUTIONS1 IN 2011 (US$ thousand)
TOTAL Multilateral Directed Multilateral
DONOR TOTAL IRA DEV EMOP PRRO SO OTHERS*
PRIVATE
DONORS **
86 106 17 188 20 885 4 565 18 563 4 967 19 937
QATAR 277 277
REPUBLIC OF
CONGO
2 002 1 592 409
REPUBLIC OF
KOREA
5 400 700 1 900 2 800
REPUBLIC OF
ZAMBIA
3 420 3 420
RUSSIAN
FEDERATION
37 676 14 944 9 000 11 000 2 733
SĂO TOMÉ AND
PRINCIPE
72 72
SAUDI ARABIA 67 692 3 916 50 815 12 961
SINGAPORE 50 50
SLOVENIA 196 14 182
SOUTH AFRICA 643 214 214 143 286
SPAIN 67 699 23 540 221 6 868 17 464 4 464 15 362
THE SUDAN
(GOVERNMENT
OF NATIONAL
UNITY)
3 750 3 570
THE SUDAN
(GOVERNMENT
OF SOUTH
SUDAN)
331 331
SRI LANKA 2 709 2 709
SWAZILAND 360 360
SWEDEN 97 492 81 217 4 232 248 2 060 1 157 6 271 6 539
SWITZERLAND 46 316 3 905 2 826 1 334 21 694 18 034 1 024 325
SYRIAN ARAB
REPUBLIC
1 047 61 986
TANZANIA 105 100 5
THAILAND 178 128 50
UKRAINE 123 123
UNITED
NATIONS
CENTRAL
EMERGENCY
RESPONSE
FUND (CERF)
126 152 180 52 768 63 500 9 705

ANNUAL PERFORMANCE REPORT FOR 2011 | WFP/EB.A/2012/4*
WORLD FOOD PROGRAMME | 122
AN
NU
AL
PE
RF
OR
MA
NC
E R
EP
OR
T F
OR
2011 | WF
P/E
B.A
/2012/4
ANNEX VIII: TOTAL CONFIRMED CONTRIBUTIONS1 IN 2011 (US$ thousand)
TOTAL Multilateral Directed Multilateral
DONOR TOTAL IRA DEV EMOP PRRO SO OTHERS*
UNITED
NATIONS
COMMON
FUNDS AND
AGENCIES (Excl.
CERF)
67 263 15 234 6 128 10 863 22 625 12 413
UNITED ARAB
EMIRATES
6 228 1 000 5 228
UNITED
KINGDOM
143 877 33 233 10 721 3 221 17 537 88 426 1 461
UNITED STATES
OF AMERICA
1 240 594 9 923 57 077 424 509 720 148 22 697 6 240
VENEZUELA
(BOLIVARIAN
REPUBLIC OF)
275 275
GRAND TOTAL 3 675 254 445 186 50 739 262 842 1 064 593 1 617 296 154 666 130 672
Bilateral Contributions 78 672
* Others: contributions to Trust Funds, Special Accounts, and General Fund
** Private contributions do not include extraordinary gifts-in-kind such as advertising

AN
NU
AL
PE
RF
OR
MA
NC
E R
EP
OR
T F
OR
2011 | WF
P/E
B.A
/2012/4*
WO
RL
D F
OO
D P
RO
GR
AM
ME
| 123
US$ thousand % US$ thousand % US$ thousand % US$ thousand %
GRAND TOTAL 3 535 746 100 3 985 613 100 4 000 330 100 3 768 990 100
DEVELOPMENT 292 112 8 275 906 7 287 842 7 315 986 8
RELIEF 2 733 744 77 3 239 887 81 3 220 081 80 2 925 212 78
Emergency 944 581 1 418 385 1 660 195 1 367 243
PRRO 1 789 163 1 821 502 1 559 885 1 557 969
SPECIAL OPERATIONS 200 252 6 176 364 4 221 510 6 217 619 6
BILATERALS, TRUST FUNDS AND OTHERS 2
309 639 9 293 457 7 270 898 7 310 173 8
SUB-SAHARAN AFRICA 2 214 246 100 2 519 433 100 2 340 804 100 2 180 900 100
Percentage of all regions 63 63 59 58
DEVELOPMENT 165 351 7 187 950 7 169 819 7 200 771 9
RELIEF 1 892 447 85 2 171 822 86 1 978 477 85 1 762 579 81
Emergency 719 838 927 054 890 118 794 411
PRRO 1 172 609 1 244 768 1 088 359 968 168
SPECIAL OPERATIONS 141 532 6 130 703 5 131 967 6 148 010 7
BILATERALS AND TRUST FUNDS 14 916 1 28 958 1 60 540 3 69 540 3
ASIA 690 747 100 763 435 100 895 743 100 796 289 100
Percentage of all regions 20 19 22 21
DEVELOPMENT 83 631 12 77 256 10 84 286 9 62 301 8
RELIEF 551 548 80 650 793 85 769 909 86 695 828 87
Emergency 124 197 321 789 440 383 279 982
PRRO 427 352 329 004 329 525 415 846
SPECIAL OPERATIONS 44 522 6 27 036 4 35 622 4 24 529 3
BILATERALS AND TRUST FUNDS 11 046 2 8 349 1 5 927 1 13 631 2
1 Excludes programme support and administrative costs.
2 Operational Expenses includes General Fund, Special Accounts and Trust Funds that cannot be apportioned by project/operation.
Negative figures represent financial adjustments.
20092008 2010 2011
ANNEX IX-A: DIRECT EXPENSES1 BY REGION AND CATEGORY, 2008–2011
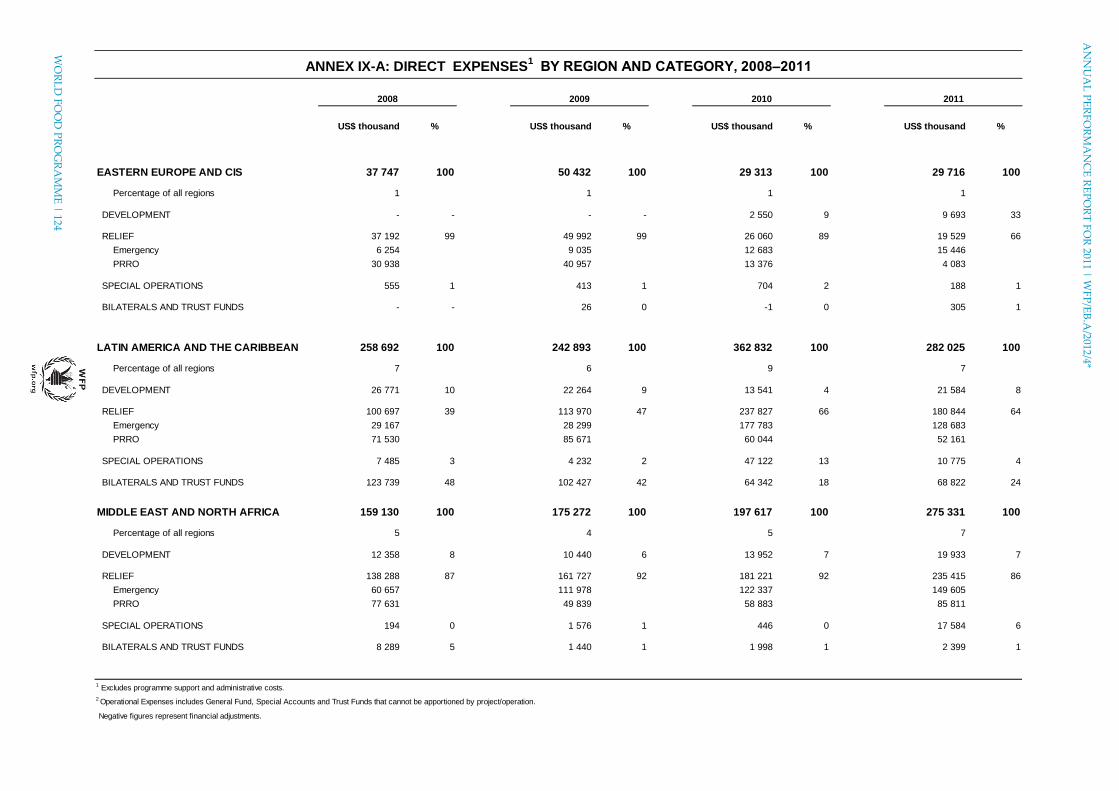
WO
RL
D F
OO
D P
RO
GR
AM
ME
| 124
AN
NU
AL
PE
RF
OR
MA
NC
E R
EP
OR
T F
OR
2011 | WF
P/E
B.A
/2012/4*
US$ thousand % US$ thousand % US$ thousand % US$ thousand %
EASTERN EUROPE AND CIS 37 747 100 50 432 100 29 313 100 29 716 100
Percentage of all regions 1 1 1 1
DEVELOPMENT - - - - 2 550 9 9 693 33
RELIEF 37 192 99 49 992 99 26 060 89 19 529 66
Emergency 6 254 9 035 12 683 15 446
PRRO 30 938 40 957 13 376 4 083
SPECIAL OPERATIONS 555 1 413 1 704 2 188 1
BILATERALS AND TRUST FUNDS - - 26 0 -1 0 305 1
LATIN AMERICA AND THE CARIBBEAN 258 692 100 242 893 100 362 832 100 282 025 100
Percentage of all regions 7 6 9 7
DEVELOPMENT 26 771 10 22 264 9 13 541 4 21 584 8
RELIEF 100 697 39 113 970 47 237 827 66 180 844 64
Emergency 29 167 28 299 177 783 128 683
PRRO 71 530 85 671 60 044 52 161
SPECIAL OPERATIONS 7 485 3 4 232 2 47 122 13 10 775 4
BILATERALS AND TRUST FUNDS 123 739 48 102 427 42 64 342 18 68 822 24
MIDDLE EAST AND NORTH AFRICA 159 130 100 175 272 100 197 617 100 275 331 100
Percentage of all regions 5 4 5 7
DEVELOPMENT 12 358 8 10 440 6 13 952 7 19 933 7
RELIEF 138 288 87 161 727 92 181 221 92 235 415 86
Emergency 60 657 111 978 122 337 149 605
PRRO 77 631 49 839 58 883 85 811
SPECIAL OPERATIONS 194 0 1 576 1 446 0 17 584 6
BILATERALS AND TRUST FUNDS 8 289 5 1 440 1 1 998 1 2 399 1
1 Excludes programme support and administrative costs.
2 Operational Expenses includes General Fund, Special Accounts and Trust Funds that cannot be apportioned by project/operation.
Negative figures represent financial adjustments.
ANNEX IX-A: DIRECT EXPENSES1 BY REGION AND CATEGORY, 2008–2011
2008 2009 2010 2011
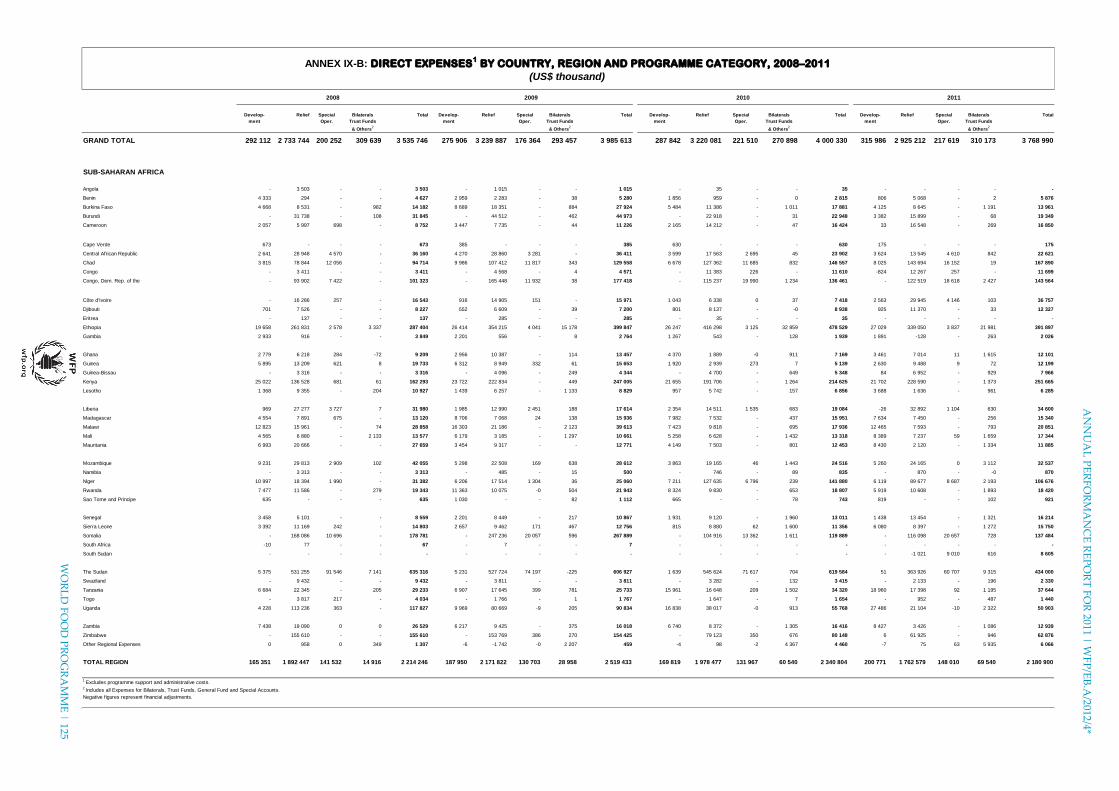
AN
NU
AL
PE
RF
OR
MA
NC
E R
EP
OR
T F
OR
2011 | WF
P/E
B.A
/2012/4*
WO
RL
D F
OO
D P
RO
GR
AM
ME
| 125
Develop- Relief Special Bilaterals Total Develop- Relief Special Bilaterals Total Develop- Relief Special Bilaterals Total Develop- Relief Special Bilaterals Total
ment Oper. Trust Funds ment Oper. Trust Funds ment Oper. Trust Funds ment Oper. Trust Funds
& Others2
& Others2
& Others2
& Others2
GRAND TOTAL 292 112 2 733 744 200 252 309 639 3 535 746 275 906 3 239 887 176 364 293 457 3 985 613 287 842 3 220 081 221 510 270 898 4 000 330 315 986 2 925 212 217 619 310 173 3 768 990
SUB-SAHARAN AFRICA
Angola - 3 503 - - 3 503 - 1 015 - - 1 015 - 35 - - 35 - - - - -
Benin 4 333 294 - - 4 627 2 959 2 283 - 38 5 280 1 856 959 - 0 2 815 806 5 068 - 2 5 876
Burkina Faso 4 668 8 531 - 982 14 182 8 689 18 351 - 884 27 924 5 484 11 386 - 1 011 17 881 4 125 8 645 - 1 191 13 961
Burundi - 31 738 - 108 31 845 - 44 512 - 462 44 973 - 22 918 - 31 22 948 3 382 15 899 - 68 19 349
Cameroon 2 057 5 997 698 - 8 752 3 447 7 735 - 44 11 226 2 165 14 212 - 47 16 424 33 16 548 - 269 16 850
Cape Verde 673 - - - 673 385 - - - 385 630 - - - 630 175 - - - 175
Central African Republic 2 641 28 948 4 570 - 36 160 4 270 28 860 3 281 - 36 411 3 599 17 563 2 695 45 23 902 3 624 13 545 4 610 842 22 621
Chad 3 815 78 844 12 056 - 94 714 9 986 107 412 11 817 343 129 558 6 678 127 362 11 685 832 146 557 8 025 143 694 16 152 19 167 890
Congo - 3 411 - - 3 411 - 4 568 - 4 4 571 - 11 383 226 - 11 610 -824 12 267 257 - 11 699
Congo, Dem. Rep. of the - 93 902 7 422 - 101 323 - 165 448 11 932 38 177 418 - 115 237 19 990 1 234 136 461 - 122 519 18 618 2 427 143 564
Côte d'Ivoire - 16 286 257 - 16 543 916 14 905 151 - 15 971 1 043 6 338 0 37 7 418 2 563 29 945 4 146 103 36 757
Djibouti 701 7 526 - - 8 227 552 6 609 - 39 7 200 801 8 137 - -0 8 938 925 11 370 - 33 12 327
Eritrea - 137 - - 137 - 285 - - 285 - 35 - - 35 - - - - -
Ethiopia 19 658 261 831 2 578 3 337 287 404 26 414 354 215 4 041 15 178 399 847 26 247 416 298 3 125 32 859 478 529 27 029 339 050 3 837 21 981 391 897
Gambia 2 933 916 - - 3 849 2 201 556 - 8 2 764 1 267 543 - 128 1 939 1 891 -128 - 263 2 026
Ghana 2 779 6 218 284 -72 9 209 2 956 10 387 - 114 13 457 4 370 1 889 -0 911 7 169 3 461 7 014 11 1 615 12 101
Guinea 5 895 13 209 621 8 19 733 6 312 8 949 332 61 15 653 1 920 2 939 273 7 5 139 2 630 9 488 9 72 12 199
Guinea-Bissau - 3 316 - - 3 316 - 4 096 - 249 4 344 - 4 700 - 649 5 348 84 6 952 - 929 7 966
Kenya 25 022 136 528 681 61 162 293 23 722 222 834 - 449 247 005 21 655 191 706 - 1 264 214 625 21 702 228 590 - 1 373 251 665
Lesotho 1 368 9 355 - 204 10 927 1 439 6 257 - 1 133 8 829 957 5 742 - 157 6 856 3 688 1 636 - 961 6 285
Liberia 969 27 277 3 727 7 31 980 1 985 12 990 2 451 188 17 614 2 354 14 511 1 535 683 19 084 -26 32 892 1 104 630 34 600
Madagascar 4 554 7 891 675 - 13 120 8 706 7 068 24 138 15 936 7 982 7 532 - 437 15 951 7 634 7 450 - 256 15 340
Malawi 12 823 15 961 - 74 28 858 16 303 21 186 - 2 123 39 613 7 423 9 818 - 695 17 936 12 465 7 593 - 793 20 851
Mali 4 565 6 880 - 2 133 13 577 6 179 3 185 - 1 297 10 661 5 258 6 628 - 1 432 13 318 8 389 7 237 59 1 659 17 344
Mauritania 6 993 20 666 - - 27 659 3 454 9 317 - - 12 771 4 149 7 503 - 801 12 453 8 430 2 120 - 1 334 11 885
Mozambique 9 231 29 813 2 909 102 42 055 5 298 22 508 169 638 28 612 3 863 19 165 46 1 443 24 516 5 260 24 165 0 3 112 32 537
Namibia - 3 313 - - 3 313 - 485 - 15 500 - 746 - 89 835 - 870 - -0 870
Niger 10 997 18 394 1 990 - 31 382 6 206 17 514 1 304 36 25 060 7 211 127 635 6 796 239 141 880 6 119 89 677 8 687 2 193 106 676
Rwanda 7 477 11 586 - 279 19 343 11 363 10 075 -0 504 21 943 8 324 9 830 - 653 18 807 5 919 10 608 - 1 893 18 420
Sao Tome and Principe 635 - - - 635 1 030 - - 82 1 112 665 - - 78 743 819 - - 102 921
Senegal 3 458 5 101 - - 8 559 2 201 8 449 - 217 10 867 1 931 9 120 - 1 960 13 011 1 438 13 454 - 1 321 16 214
Sierra Leone 3 392 11 169 242 - 14 803 2 657 9 462 171 467 12 756 815 8 880 62 1 600 11 356 6 080 8 397 - 1 272 15 750
Somalia - 168 086 10 696 - 178 781 - 247 236 20 057 596 267 889 - 104 916 13 362 1 611 119 889 - 116 098 20 657 728 137 484
South Africa -10 77 - - 67 - 7 - - 7 - - - - - - - - - -
South Sudan - - - - - - - - - - - - - - - - -1 021 9 010 616 8 605
The Sudan 5 375 531 255 91 546 7 141 635 316 5 231 527 724 74 197 -225 606 927 1 639 545 624 71 617 704 619 584 51 363 926 60 707 9 315 434 000
Swaziland - 9 432 - - 9 432 - 3 811 - - 3 811 - 3 282 - 132 3 415 - 2 133 - 196 2 330
Tanzania 6 684 22 345 - 205 29 233 6 907 17 645 399 781 25 733 15 961 16 648 209 1 502 34 320 18 960 17 398 92 1 195 37 644
Togo - 3 817 217 - 4 034 - 1 766 - 1 1 767 - 1 647 - 7 1 654 - 952 - 487 1 440
Uganda 4 228 113 236 363 - 117 827 9 969 80 669 -9 205 90 834 16 838 38 017 -0 913 55 768 27 486 21 104 -10 2 322 50 903
Zambia 7 438 19 090 0 0 26 529 6 217 9 425 - 375 16 018 6 740 8 372 - 1 305 16 416 8 427 3 426 - 1 086 12 939
Zimbabwe - 155 610 - - 155 610 - 153 769 386 270 154 425 - 79 123 350 676 80 148 6 61 925 - 946 62 876
Other Regional Expenses 0 958 0 349 1 307 -6 -1 742 -0 2 207 459 -4 98 -2 4 367 4 460 -7 75 63 5 935 6 066
TOTAL REGION 165 351 1 892 447 141 532 14 916 2 214 246 187 950 2 171 822 130 703 28 958 2 519 433 169 819 1 978 477 131 967 60 540 2 340 804 200 771 1 762 579 148 010 69 540 2 180 900
1 Excludes programme support and administrative costs.
2 Includes all Expenses for Bilaterals, Trust Funds, General Fund and Special Accounts.
Negative figures represent financial adjustments.
2008 2009 2010 2011
ANNEX IX-B: DIRECT EXPENSES1 BY COUNTRY, REGION AND PROGRAMME CATEGORY, 2008–2011
(US$ thousand)
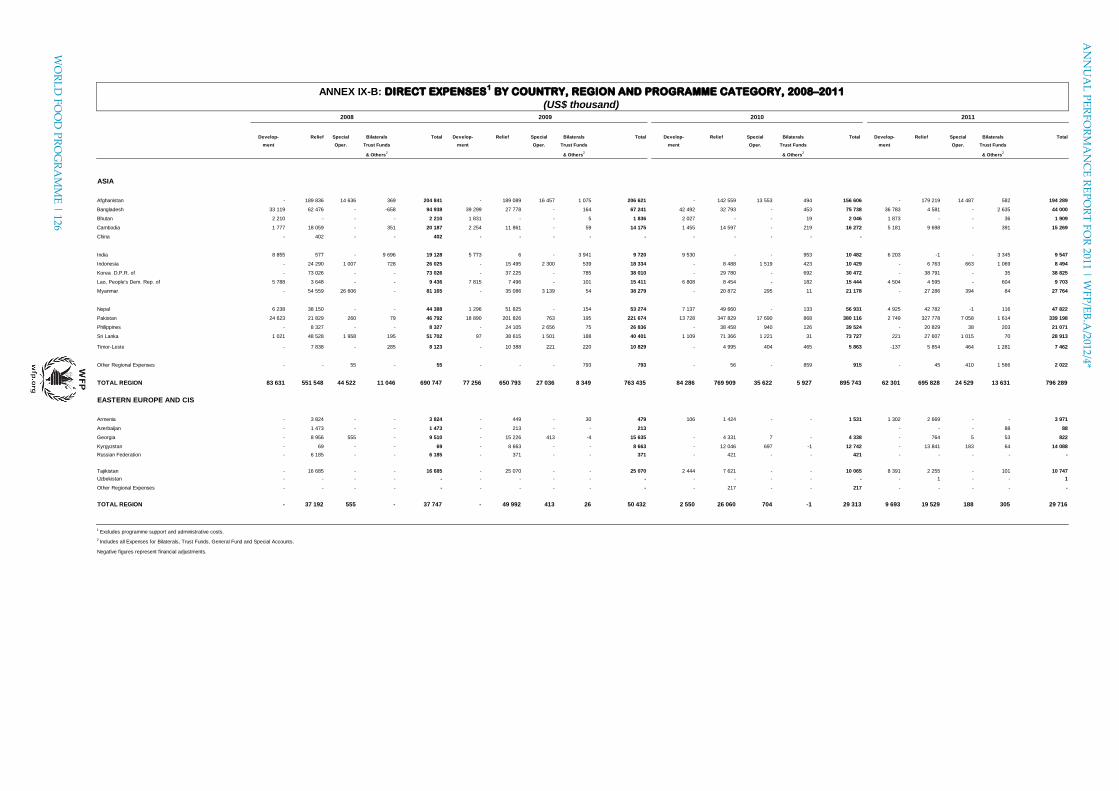
WO
RL
D F
OO
D P
RO
GR
AM
ME
| 126
AN
NU
AL
PE
RF
OR
MA
NC
E R
EP
OR
T F
OR
2011 | WF
P/E
B.A
/2012/4*
Develop- Relief Special Bilaterals Total Develop- Relief Special Bilaterals Total Develop- Relief Special Bilaterals Total Develop- Relief Special Bilaterals Total
ment Oper. Trust Funds ment Oper. Trust Funds ment Oper. Trust Funds ment Oper. Trust Funds
& Others2
& Others2
& Others2
& Others2
ASIA
Afghanistan - 189 836 14 636 369 204 841 - 189 089 16 457 1 075 206 621 - 142 559 13 553 494 156 606 - 179 219 14 487 582 194 289
Bangladesh 33 119 62 476 - -658 94 938 39 299 27 778 - 164 67 241 42 492 32 793 - 453 75 738 36 783 4 581 - 2 635 44 000
Bhutan 2 210 - - - 2 210 1 831 - - 5 1 836 2 027 - - 19 2 046 1 873 - - 36 1 909
Cambodia 1 777 18 059 - 351 20 187 2 254 11 861 - 59 14 175 1 455 14 597 - 219 16 272 5 181 9 698 - 391 15 269
China - 402 - - 402 - - - - - - - - - -
India 8 855 577 - 9 696 19 128 5 773 6 - 3 941 9 720 9 530 - - 953 10 482 6 203 -1 - 3 345 9 547
Indonesia - 24 290 1 007 728 26 025 - 15 495 2 300 539 18 334 - 8 488 1 519 423 10 429 - 6 763 663 1 069 8 494
Korea D.P.R. of - 73 026 - - 73 026 - 37 225 - 785 38 010 - 29 780 - 692 30 472 - 38 791 - 35 38 825
Lao, People's Dem. Rep. of 5 788 3 648 - - 9 436 7 815 7 496 - 101 15 411 6 808 8 454 - 182 15 444 4 504 4 595 - 604 9 703
Myanmar - 54 559 26 606 - 81 165 - 35 086 3 139 54 38 279 - 20 872 295 11 21 178 - 27 286 394 84 27 764
Nepal 6 238 38 150 - - 44 388 1 296 51 825 - 154 53 274 7 137 49 660 - 133 56 931 4 925 42 782 -1 116 47 822
Pakistan 24 623 21 829 260 79 46 792 18 890 201 826 763 195 221 674 13 728 347 829 17 690 868 380 116 2 749 327 778 7 058 1 614 339 198
Philippines - 8 327 - - 8 327 - 24 105 2 656 75 26 836 - 38 458 940 126 39 524 - 20 829 38 203 21 071
Sri Lanka 1 021 48 528 1 958 195 51 702 97 38 615 1 501 188 40 401 1 109 71 366 1 221 31 73 727 221 27 607 1 015 70 28 913
Timor-Leste - 7 838 - 285 8 123 - 10 388 221 220 10 829 - 4 995 404 465 5 863 -137 5 854 464 1 281 7 462
Other Regional Expenses - - 55 - 55 - - - 793 793 - 56 - 859 915 - 45 410 1 566 2 022
TOTAL REGION 83 631 551 548 44 522 11 046 690 747 77 256 650 793 27 036 8 349 763 435 84 286 769 909 35 622 5 927 895 743 62 301 695 828 24 529 13 631 796 289
EASTERN EUROPE AND CIS
Armenia - 3 824 - - 3 824 - 449 - 30 479 106 1 424 - - 1 531 1 302 2 669 - - 3 971
Azerbaijan - 1 473 - - 1 473 - 213 - - 213 - - - 88 88
Georgia - 8 956 555 - 9 510 - 15 226 413 -4 15 635 - 4 331 7 - 4 338 - 764 5 53 822
Kyrgyzstan - 69 - - 69 - 8 663 - - 8 663 - 12 046 697 -1 12 742 - 13 841 183 64 14 088
Russian Federation - 6 185 - - 6 185 - 371 - - 371 - 421 - - 421 - - - - -
Tajikistan - 16 685 - - 16 685 - 25 070 - - 25 070 2 444 7 621 - - 10 065 8 391 2 255 - 101 10 747
Uzbekistan - - - - - - - - - - - - - - - - 1 - - 1
Other Regional Expenses - - - - - - - - - - - 217 - - 217 - - - - -
TOTAL REGION - 37 192 555 - 37 747 - 49 992 413 26 50 432 2 550 26 060 704 -1 29 313 9 693 19 529 188 305 29 716
1 Excludes programme support and administrative costs.
2 Includes all Expenses for Bilaterals, Trust Funds, General Fund and Special Accounts.
Negative figures represent financial adjustments.
ANNEX IX-B: DIRECT EXPENSES1 BY COUNTRY, REGION AND PROGRAMME CATEGORY, 2008–2011
(US$ thousand)2008 2009 2010 2011
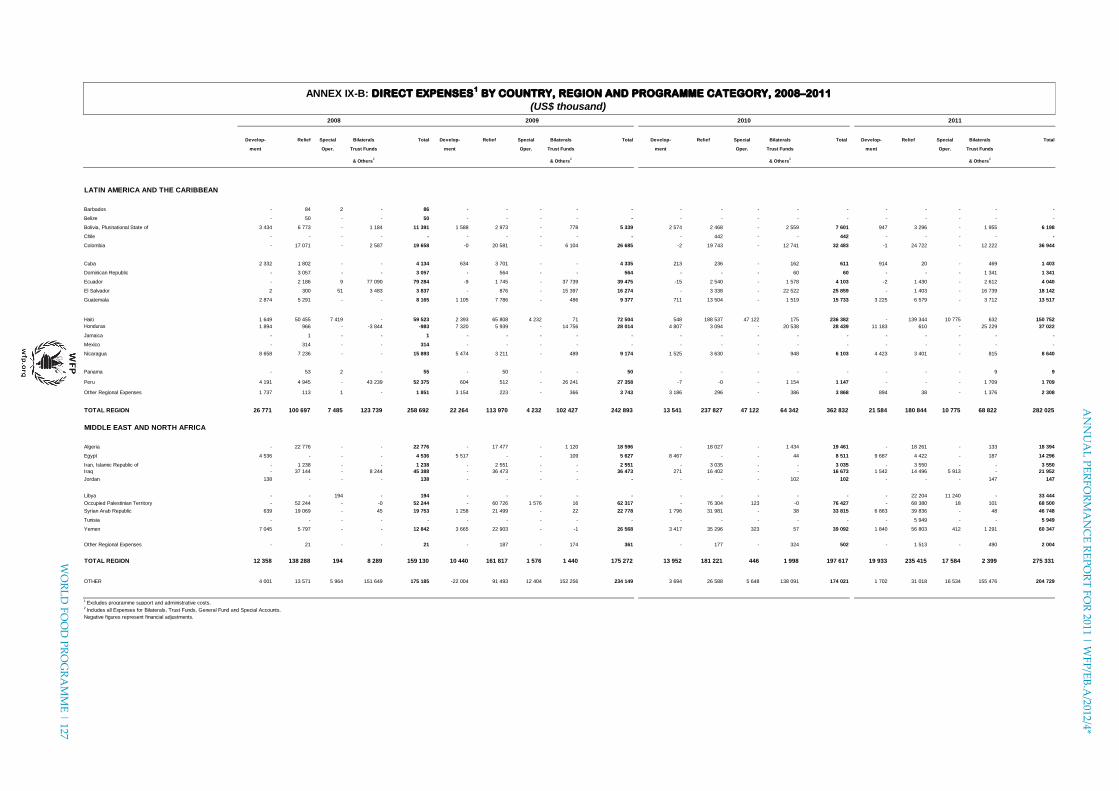
AN
NU
AL
PE
RF
OR
MA
NC
E R
EP
OR
T F
OR
2011 | WF
P/E
B.A
/2012/4*
WO
RL
D F
OO
D P
RO
GR
AM
ME
| 127
Develop- Relief Special Bilaterals Total Develop- Relief Special Bilaterals Total Develop- Relief Special Bilaterals Total Develop- Relief Special Bilaterals Total
ment Oper. Trust Funds ment Oper. Trust Funds ment Oper. Trust Funds ment Oper. Trust Funds
& Others2
& Others2
& Others2
& Others2
LATIN AMERICA AND THE CARIBBEAN
Barbados - 84 2 - 86 - - - - - - - - - - - - - - -
Belize - 50 - - 50 - - - - - - - - - - - - - - -
Bolivia, Plurinational State of 3 434 6 773 - 1 184 11 391 1 588 2 973 - 778 5 339 2 574 2 468 - 2 559 7 601 947 3 296 - 1 955 6 198
Chile - - - - - - - - - - - 442 - - 442 - - - - -
Colombia - 17 071 - 2 587 19 658 -0 20 581 - 6 104 26 685 -2 19 743 - 12 741 32 483 -1 24 722 - 12 222 36 944
Cuba 2 332 1 802 - - 4 134 634 3 701 - - 4 335 213 236 - 162 611 914 20 - 469 1 403
Dominican Republic - 3 057 - - 3 057 - 564 - - 564 - - - 60 60 - - - 1 341 1 341
Ecuador - 2 186 9 77 090 79 284 -9 1 745 - 37 739 39 475 -15 2 540 - 1 578 4 103 -2 1 430 - 2 612 4 040
El Salvador 2 300 51 3 483 3 837 - 876 - 15 397 16 274 - 3 338 - 22 522 25 859 - 1 403 - 16 739 18 142
Guatemala 2 874 5 291 - - 8 165 1 105 7 786 - 486 9 377 711 13 504 - 1 519 15 733 3 225 6 579 - 3 712 13 517
Haiti 1 649 50 455 7 419 - 59 523 2 393 65 808 4 232 71 72 504 548 188 537 47 122 175 236 382 - 139 344 10 775 632 150 752
Honduras 1 894 966 - -3 844 -983 7 320 5 939 - 14 756 28 014 4 807 3 094 - 20 538 28 439 11 183 610 - 25 229 37 022
Jamaica - 1 - - 1 - - - - - - - - - - - - - - -
Mexico - 314 - - 314 - - - - - - - - - - - - - - -
Nicaragua 8 658 7 236 - - 15 893 5 474 3 211 - 489 9 174 1 525 3 630 - 948 6 103 4 423 3 401 - 815 8 640
Panama - 53 2 - 55 - 50 - - 50 - - - - - - - - 9 9
Peru 4 191 4 945 - 43 239 52 375 604 512 - 26 241 27 358 -7 -0 - 1 154 1 147 - - - 1 709 1 709
Other Regional Expenses 1 737 113 1 - 1 851 3 154 223 - 366 3 743 3 186 296 - 386 3 868 894 38 - 1 376 2 308
TOTAL REGION 26 771 100 697 7 485 123 739 258 692 22 264 113 970 4 232 102 427 242 893 13 541 237 827 47 122 64 342 362 832 21 584 180 844 10 775 68 822 282 025
MIDDLE EAST AND NORTH AFRICA
Algeria - 22 776 - - 22 776 - 17 477 - 1 120 18 596 - 18 027 - 1 434 19 461 - 18 261 - 133 18 394
Egypt 4 536 - - - 4 536 5 517 - - 109 5 627 8 467 - - 44 8 511 9 687 4 422 - 187 14 296
Iran, Islamic Republic of - 1 238 - - 1 238 - 2 551 - - 2 551 - 3 035 - - 3 035 - 3 550 - - 3 550
Iraq - 37 144 - 8 244 45 388 - 36 473 - - 36 473 271 16 402 - - 16 673 1 542 14 496 5 913 - 21 952
Jordan 138 - - - 138 - - - - - - - - 102 102 - - - 147 147
Libya - - 194 - 194 - - - - - - - - - - - 22 204 11 240 - 33 444
Occupied Palestinian Territory - 52 244 - -0 52 244 - 60 726 1 576 16 62 317 - 76 304 123 -0 76 427 - 68 380 18 101 68 500
Syrian Arab Republic 639 19 069 - 45 19 753 1 258 21 499 - 22 22 778 1 796 31 981 - 38 33 815 6 863 39 836 - 48 46 748
Tunisia - - - - - - - - - - - - - - - - 5 949 - - 5 949
Yemen 7 045 5 797 - - 12 842 3 665 22 903 - -1 26 568 3 417 35 296 323 57 39 092 1 840 56 803 412 1 291 60 347
Other Regional Expenses - 21 - - 21 - 187 - 174 361 - 177 - 324 502 - 1 513 - 490 2 004
TOTAL REGION 12 358 138 288 194 8 289 159 130 10 440 161 817 1 576 1 440 175 272 13 952 181 221 446 1 998 197 617 19 933 235 415 17 584 2 399 275 331
OTHER 4 001 13 571 5 964 151 649 175 185 -22 004 91 493 12 404 152 256 234 149 3 694 26 588 5 648 138 091 174 021 1 702 31 018 16 534 155 476 204 729
1 Excludes programme support and administrative costs.
2 Includes all Expenses for Bilaterals, Trust Funds, General Fund and Special Accounts.
Negative figures represent financial adjustments.
ANNEX IX-B: DIRECT EXPENSES1 BY COUNTRY, REGION AND PROGRAMME CATEGORY, 2008–2011
(US$ thousand)
2008 2009 2010 2011
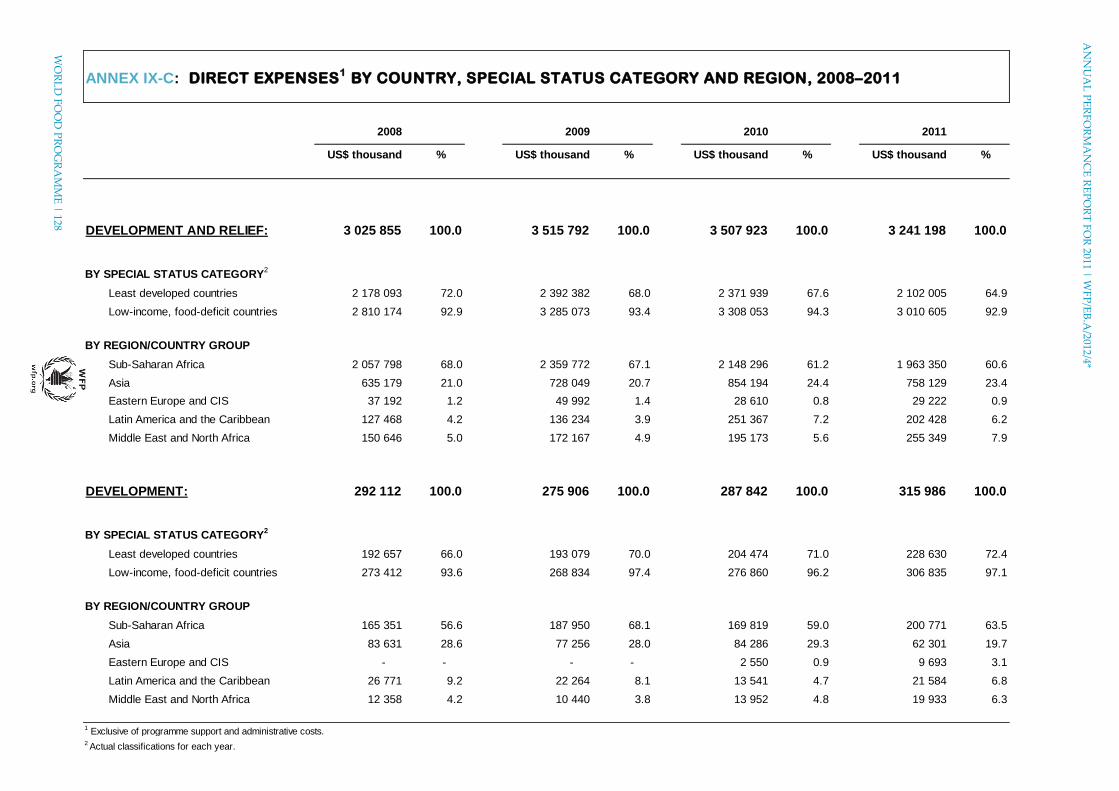
WO
RL
D F
OO
D P
RO
GR
AM
ME
| 128
AN
NU
AL
PE
RF
OR
MA
NC
E R
EP
OR
T F
OR
2011 | WF
P/E
B.A
/2012/4*
ANNEX IX-C: DIRECT EXPENSES1 BY COUNTRY, SPECIAL STATUS CATEGORY AND REGION, 2008–2011
2008 2009 2010 2011
US$ thousand % US$ thousand % US$ thousand % US$ thousand %
DEVELOPMENT AND RELIEF: 3 025 855 100.0 3 515 792 100.0 3 507 923 100.0 3 241 198 100.0
BY SPECIAL STATUS CATEGORY2
Least developed countries 2 178 093 72.0 2 392 382 68.0 2 371 939 67.6 2 102 005 64.9
Low-income, food-deficit countries 2 810 174 92.9 3 285 073 93.4 3 308 053 94.3 3 010 605 92.9
BY REGION/COUNTRY GROUP
Sub-Saharan Africa 2 057 798 68.0 2 359 772 67.1 2 148 296 61.2 1 963 350 60.6
Asia 635 179 21.0 728 049 20.7 854 194 24.4 758 129 23.4
Eastern Europe and CIS 37 192 1.2 49 992 1.4 28 610 0.8 29 222 0.9
Latin America and the Caribbean 127 468 4.2 136 234 3.9 251 367 7.2 202 428 6.2
Middle East and North Africa 150 646 5.0 172 167 4.9 195 173 5.6 255 349 7.9
DEVELOPMENT: 292 112 100.0 275 906 100.0 287 842 100.0 315 986 100.0
BY SPECIAL STATUS CATEGORY2
Least developed countries 192 657 66.0 193 079 70.0 204 474 71.0 228 630 72.4
Low-income, food-deficit countries 273 412 93.6 268 834 97.4 276 860 96.2 306 835 97.1
BY REGION/COUNTRY GROUP
Sub-Saharan Africa 165 351 56.6 187 950 68.1 169 819 59.0 200 771 63.5
Asia 83 631 28.6 77 256 28.0 84 286 29.3 62 301 19.7
Eastern Europe and CIS - - - - 2 550 0.9 9 693 3.1
Latin America and the Caribbean 26 771 9.2 22 264 8.1 13 541 4.7 21 584 6.8
Middle East and North Africa 12 358 4.2 10 440 3.8 13 952 4.8 19 933 6.3
1 Exclusive of programme support and administrative costs.
2 Actual classifications for each year.
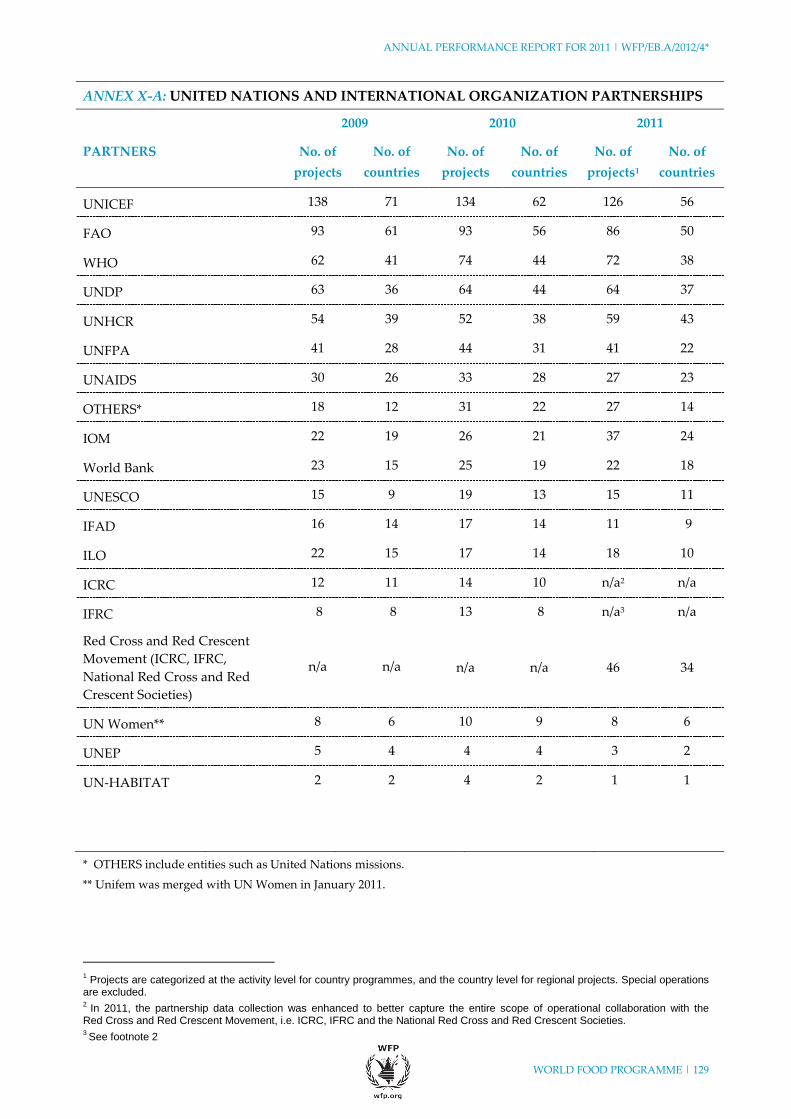
ANNUAL PERFORMANCE REPORT FOR 2011 | WFP/EB.A/2012/4*
WORLD FOOD PROGRAMME | 129
AN
NU
AL
PE
RF
OR
MA
NC
E R
EP
OR
T F
OR
2011 | WF
P/E
B.A
/2012/4
ANNEX X-A: UNITED NATIONS AND INTERNATIONAL ORGANIZATION PARTNERSHIPS
2009 2010 2011
PARTNERS No. of
projects
No. of
countries
No. of
projects
No. of
countries
No. of
projects1
No. of
countries
UNICEF 138 71 134 62 126 56
FAO 93 61 93 56 86 50
WHO 62 41 74 44 72 38
UNDP 63 36 64 44 64 37
UNHCR 54 39 52 38 59 43
UNFPA 41 28 44 31 41 22
UNAIDS 30 26 33 28 27 23
OTHERS* 18 12 31 22 27 14
IOM 22 19 26 21 37 24
World Bank 23 15 25 19 22 18
UNESCO 15 9 19 13 15 11
IFAD 16 14 17 14 11 9
ILO 22 15 17 14 18 10
ICRC 12 11 14 10 n/a2 n/a
IFRC 8 8 13 8 n/a3 n/a
Red Cross and Red Crescent
Movement (ICRC, IFRC,
National Red Cross and Red
Crescent Societies)
n/a n/a n/a
n/a
46
34
UN Women** 8 6 10 9 8 6
UNEP 5 4 4 4 3 2
UN-HABITAT 2 2 4 2 1 1
* OTHERS include entities such as United Nations missions.
** Unifem was merged with UN Women in January 2011.
1 Projects are categorized at the activity level for country programmes, and the country level for regional projects. Special operations
are excluded. 2
In 2011, the partnership data collection was enhanced to better capture the entire scope of operational collaboration with the Red Cross and Red Crescent Movement, i.e. ICRC, IFRC and the National Red Cross and Red Crescent Societies. 3 See footnote 2
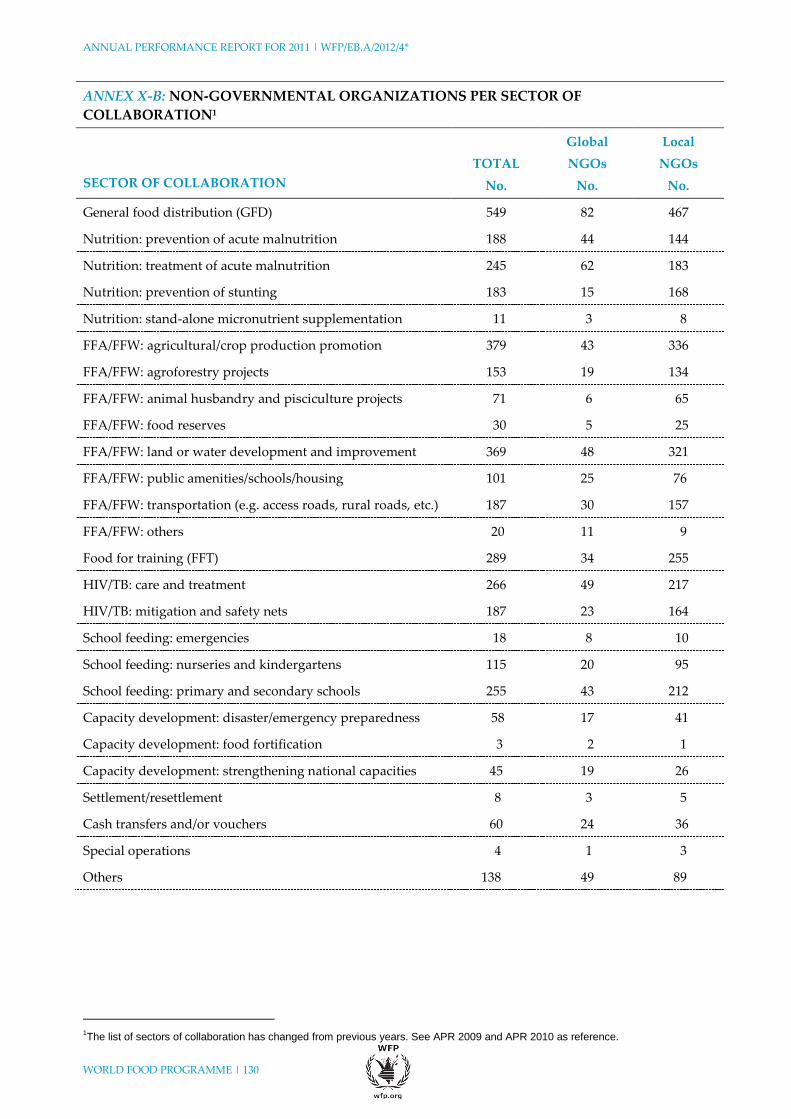
ANNUAL PERFORMANCE REPORT FOR 2011 | WFP/EB.A/2012/4*
WORLD FOOD PROGRAMME | 130
AN
NU
AL
PE
RF
OR
MA
NC
E R
EP
OR
T F
OR
2011 | WF
P/E
B.A
/2012/4 A
NN
UA
L P
ER
FO
RM
AN
CE
RE
PO
RT
FO
R 2011 | W
FP
/EB
.A/2012/4
ANNEX X-B: NON-GOVERNMENTAL ORGANIZATIONS PER SECTOR OF
COLLABORATION1
SECTOR OF COLLABORATION
TOTAL
No.
Global
NGOs
No.
Local
NGOs
No.
General food distribution (GFD) 549 82 467
Nutrition: prevention of acute malnutrition 188 44 144
Nutrition: treatment of acute malnutrition 245 62 183
Nutrition: prevention of stunting 183 15 168
Nutrition: stand-alone micronutrient supplementation 11 3 8
FFA/FFW: agricultural/crop production promotion 379 43 336
FFA/FFW: agroforestry projects 153 19 134
FFA/FFW: animal husbandry and pisciculture projects 71 6 65
FFA/FFW: food reserves 30 5 25
FFA/FFW: land or water development and improvement 369 48 321
FFA/FFW: public amenities/schools/housing 101 25 76
FFA/FFW: transportation (e.g. access roads, rural roads, etc.) 187 30 157
FFA/FFW: others 20 11 9
Food for training (FFT) 289 34 255
HIV/TB: care and treatment 266 49 217
HIV/TB: mitigation and safety nets 187 23 164
School feeding: emergencies 18 8 10
School feeding: nurseries and kindergartens 115 20 95
School feeding: primary and secondary schools 255 43 212
Capacity development: disaster/emergency preparedness 58 17 41
Capacity development: food fortification 3 2 1
Capacity development: strengthening national capacities 45 19 26
Settlement/resettlement 8 3 5
Cash transfers and/or vouchers 60 24 36
Special operations 4 1 3
Others 138 49 89
1The list of sectors of collaboration has changed from previous years. See APR 2009 and APR 2010 as reference.
ANNUAL PERFORMANCE REPORT FOR 2011 | WFP/EB.A/2012/4*
WORLD FOOD PROGRAMME | 131
AN
NU
AL
PE
RF
OR
MA
NC
E R
EP
OR
T F
OR
2011 | WF
P/E
B.A
/2012/4
ANNEX XI: END-NOTES
All monetary values are in United States dollars (US$), unless otherwise stated.
One billion equals 1,000 million.
All quantities of food are in metric tons (mt), unless otherwise specified.
Direct expenditures include food, external transport, landside transport, storage and
handling (LTSH), direct support costs (DSC) and other direct operating costs (ODOC)
components, but exclude indirect support costs (ISC) and programme support and
administrative (PSA) budget costs.
Totals reported in this document may not add up exactly as a result of rounding.
Low-income, food-deficit countries (LIFDCs) include net food-importing countries with
per capita income below the level used by the World Bank to determine eligibility for
International Development Association (IDA) assistance and for 20-year
International Bank for Reconstruction and Development (IBRD) terms; these are applied
to countries in World Bank categories I and II. The historical ceiling of per capita gross
national income (GNI) for 2008, based on the World Bank Atlas method, is US$1,855. In
2011, 70 countries were classified by FAO as LIFDCs.
Three criteria are used for the identification of least developed countries (LDCs), as
reviewed every three years by the Economic and Social Council of the
United Nations (ECOSOC): (i) low income as measured by gross domestic product
(GDP) per capita; (ii) weak human resources, as measured by the composite
Augmented Physical Quality of Life Index (APQLI), which is based on indicators of life
expectancy at birth, per capita calories supply, combined primary and secondary school
enrolment ratio, and adult literacy rate; and (iii) low level of economic diversification, as
measured by the composite Economic Diversification Index (EDI), which is based on the
share of manufacturing in GDP, the share of the labour force in industry, annual per
capita commercial energy consumption and the United Nations Conference on Trade
and Development’s (UNCTAD) merchandise export concentration index. In 2011,
48 countries were included as LDCs.
From 2007 onwards, WFP must meet the Board’s guidelines of allocating at least
90 percent of development multilateral funds to countries that meet the concentration
criteria:
- are least developed or have equally low income;1 and
- face a problem of chronic malnutrition measured as a rate of under 5 child stunting
greater than 25 percent.2
1 Gross national income (GNI) per capita US$503.1 in 2009
2 See data from UNICEF http://www.unicef.org/protection/Progress_for_Children-No.9_EN_081710.pdf
ANNUAL PERFORMANCE REPORT FOR 2011 | WFP/EB.A/2012/4*
WORLD FOOD PROGRAMME | 132
AN
NU
AL
PE
RF
OR
MA
NC
E R
EP
OR
T F
OR
2011 | WF
P/E
B.A
/2012/4 A
NN
UA
L P
ER
FO
RM
AN
CE
RE
PO
RT
FO
R 2011 | W
FP
/EB
.A/2012/4
ACRONYMS USED IN THE DOCUMENT
APR Annual Performance Report
ART anti-retroviral therapy
ASMR-U5 Age-specific mortality rate for children under 5
BCG The Boston Consulting Group
CAR Central African Republic
CERF Central Emergency Response Fund
CFS Committee on World Food Security
CFW cash for work
CHF Common Humanitarian Fund
CIS Commonwealth of Independent States
CMR crude mortality rate
CoI Conflict of Interest
COMET Corporate M&E Tool
CONOPS concept of operations
CP country programme
CSI coping strategies index
DAC Development Assistance Committee
DDR disarmament, demobilization and reintegration
DEV development project
DOTS directly observed treatment, short course
DPI disaster preparedness index
DPRK Democratic People’s Republic of Korea
DRC Democratic Republic of the Congo
DRR disaster risk reduction
DSC direct support costs
EB Executive Board
EC European Commission
ANNUAL PERFORMANCE REPORT FOR 2011 | WFP/EB.A/2012/4*
WORLD FOOD PROGRAMME | 133
AN
NU
AL
PE
RF
OR
MA
NC
E R
EP
OR
T F
OR
2011 | WF
P/E
B.A
/2012/4
EMOP emergency operation
ENCAP Enhancing Capacities in Food Security and Response Analysis
EPIC Emergency Preparedness Integration Centre
EPRP emergency preparedness and response package
ETC emergency telecommunications cluster
EUNAVFOR European Union Naval Force
FAO Food and Agriculture Organization of the United Nations
FDP Financial Disclosure Programme
FFA food for assets
FFPI FAO Food Price Index
FFT food for training
FFW food for work
FMU food management unit
FPF Forward Purchase Facility
GAIN Global Alliance for Improved Nutrition
GAM global acute malnutrition
GDP gross domestic product
GFD general food distribution
GNI gross national income
GoSS Government of South Sudan
GVLP Global Vehicle Leasing Programme
HACT harmonized approach to cash transfers
HIV and AIDS human immunodeficiency virus and acquired immune deficiency
syndrome
HLCM High-Level Committee on Management
HLCP High-Level Committee on Programmes
HR Human Resources Division
IASC Inter-Agency Standing Committee
ICRC International Committee of the Red Cross
ICSC International Civil Service Commission
ANNUAL PERFORMANCE REPORT FOR 2011 | WFP/EB.A/2012/4*
WORLD FOOD PROGRAMME | 134
AN
NU
AL
PE
RF
OR
MA
NC
E R
EP
OR
T F
OR
2011 | WF
P/E
B.A
/2012/4 A
NN
UA
L P
ER
FO
RM
AN
CE
RE
PO
RT
FO
R 2011 | W
FP
/EB
.A/2012/4
ICT information and communications technology
IDA iron deficiency anaemia
IDP internally displaced person
IFAD International Fund for Agricultural Development
IFRC International Federation of Red Cross and Red Crescent Societies
ILO International Labour Organization
INTERFAIS WFP International Food Aid Information System
IOM International Organization for Migration
IPSAS International Public Sector Accounting Standards
IRA Immediate Response Account
ISC indirect support costs
IT information technology
LDC least developed country
LESS logistics execution support system
LET logistics emergency team
LIFDC low-income, food-deficit country
LTSH landside transport, storage and handling
M&E monitoring and evaluation
MCHN mother-and-child health and nutrition
MDG Millennium Development Goal
MOSS minimum operating security standards
MOU memorandum of understanding
MRD Management Result Dimension
MRF Management Results Framework
MUAC mid-upper arm circumference
NCI national capacity index
NDRRMC National Disaster Risk Reduction and Management Council
NGO non-governmental organization
NSFP national school feeding programme
OCHA Office for the Coordination of Humanitarian Affairs
ANNUAL PERFORMANCE REPORT FOR 2011 | WFP/EB.A/2012/4*
WORLD FOOD PROGRAMME | 135
AN
NU
AL
PE
RF
OR
MA
NC
E R
EP
OR
T F
OR
2011 | WF
P/E
B.A
/2012/4
ODOC other direct operational costs
OECD Organisation for Economic Co-operation and Development
OS Inspector General and Oversight Office
OVC orphans and other vulnerable children
P4P Purchase for Progress
PMTCT prevention of mother-to-child transmission
PROMIS Performance and Risk Operational Management Information System
PRRO protracted relief and recovery operation
PSA Programme Support and Administrative (budget)
REACH Ending Child Hunger and Undernutrition
RUSF ready-to-use supplementary food
RWA Respectful Workplace Advisor
SMCA Strengthening Managerial Control and Accountability
SO special operation
SO Strategic Objective
SPR standardized project report
SRAC Strategic Resource Allocation Committee
SRF Strategic Results Framework
SRM security risk management
SSR Structure and Staffing Review
TB tuberculosis
UN Women United Nations Women (merged with UNFPA)
UNCT United Nations country team
UNDAF United Nations Development Assistance Framework
UNDG United Nations Development Group
UNDP United Nations Development Programme
UNEP United Nations Environment Programme
UNESCO United Nations Educational, Scientific and Cultural Organization
UNFPA United Nations Population Fund
UN-HABITAT United Nations Human Settlements Programme
ANNUAL PERFORMANCE REPORT FOR 2011 | WFP/EB.A/2012/4*
WORLD FOOD PROGRAMME | 136
AN
NU
AL
PE
RF
OR
MA
NC
E R
EP
OR
T F
OR
2011 | WF
P/E
B.A
/2012/4 A
NN
UA
L P
ER
FO
RM
AN
CE
RE
PO
RT
FO
R 2011 | W
FP
/EB
.A/2012/4
UNHAS United Nations Humanitarian Air Service
UNHCR Office of the United Nations High Commissioner for Refugees
UNHRD United Nations Humanitarian Response Depot
UNICEF United Nations Children's Fund
WHO World Health Organization
WINGS II WFP’s Information Network and Global System II
AR-EBA2012-11043E-RTR-11335.docx