Embed Size (px)
Citation preview

ANNUAL RESEARCH REPORTU.S. WATER CONSERVATION LABORATORY
2001
USDA - AGRICULTURAL RESEARCH SERVICEPhoenix, Arizona
i
ANNUAL RESEARCH REPORT
2001
U.S. WATER CONSERVATION LABORATORYU.S. Department of AgricultureAgricultural Research Service
4331 E. Broadway RoadPhoenix, Arizona 85040
Telephone: (602) 437-1702FAX: (602) 437-5291
E-mail: [email protected]: www.uswcl.ars.ag.gov
This report contains published and unpublished information concerning work in progress. The unpublished contents ofthis report may not be published or reproduced in any form without the prior consent of the scientific research staffinvolved.
Trade names and company names are included for the benefit of the reader and do not constitute an endorsement by theU.S. Department of Agriculture.

ii
TABLE OF CONTENTS
1. Director’s Message . . . . . . . . . . . . . . . . . . . . . . . . . . . . . . . . . . . . . . . . . . . . . . . . . . . . . . . iii
2. Dedication . . . . . . . . . . . . . . . . . . . . . . . . . . . . . . . . . . . . . . . . . . . . . . . . . . . . . . . . . . . . . . iv
3. Laboratory ProgramOrganizational Structure . . . . . . . . . . . . . . . . . . . . . . . . . . . . . . . . . . . . . . . . . . . . . . . . . 1Mission . . . . . . . . . . . . . . . . . . . . . . . . . . . . . . . . . . . . . . . . . . . . . . . . . . . . . . . . . . . . . . 1Laboratory Management . . . . . . . . . . . . . . . . . . . . . . . . . . . . . . . . . . . . . . . . . . . . . . . . . 2Laboratory Support Services (facilities and staff) . . . . . . . . . . . . . . . . . . . . . . . . . . . . . 3Outreach Program . . . . . . . . . . . . . . . . . . . . . . . . . . . . . . . . . . . . . . . . . . . . . . . . . . . . . . 6Safety . . . . . . . . . . . . . . . . . . . . . . . . . . . . . . . . . . . . . . . . . . . . . . . . . . . . . . . . . . . . . . . 9Students at USWCL . . . . . . . . . . . . . . . . . . . . . . . . . . . . . . . . . . . . . . . . . . . . . . . . . . . 10
4. Irrigation & Water Quality (I&WQ) Management UnitOrganization . . . . . . . . . . . . . . . . . . . . . . . . . . . . . . . . . . . . . . . . . . . . . . . . . . . . . . . . . 11Mission . . . . . . . . . . . . . . . . . . . . . . . . . . . . . . . . . . . . . . . . . . . . . . . . . . . . . . . . . . . . . 11Professional Staff . . . . . . . . . . . . . . . . . . . . . . . . . . . . . . . . . . . . . . . . . . . . . . . . . . . . . 12Management of Water Supplies for Irrigation . . . . . . . . . . . . . . . . . . . . . . . . . . . . . . . 14Assessment and Control of Pathogens in Municipal Wastewater
Used for Irrigation to Protect Crops and Groundwater . . . . . . . . . . . . . . . . . . . . 38Wastewater Irrigation and Groundwater Recharge . . . . . . . . . . . . . . . . . . . . . . . . . . . 54Surface Irrigation Water Quality and Management . . . . . . . . . . . . . . . . . . . . . . . . . . . 72
5. Environmental & Plant Dynamics (E&PD) Management UnitOrganization . . . . . . . . . . . . . . . . . . . . . . . . . . . . . . . . . . . . . . . . . . . . . . . . . . . . . . . . 106Mission . . . . . . . . . . . . . . . . . . . . . . . . . . . . . . . . . . . . . . . . . . . . . . . . . . . . . . . . . . . . 106Professional Staff . . . . . . . . . . . . . . . . . . . . . . . . . . . . . . . . . . . . . . . . . . . . . . . . . . . . 107Agricultural Productivity and Water Use: Effects of Global Change . . . . . . . . . . . . 109Irrigated Crop Management Utilizing Remote Sensing . . . . . . . . . . . . . . . . . . . . . . . 152Germplasm Improvement and Agronomic Development of NewAlternative Industrial Crops . . . . . . . . . . . . . . . . . . . . . . . . . . . . . . . . . . . . . . . . . . . . 190
6. AccomplishmentsPublications . . . . . . . . . . . . . . . . . . . . . . . . . . . . . . . . . . . . . . . . . . . . . . . . . . . . . . . . . . . . 213
Technology Transfer . . . . . . . . . . . . . . . . . . . . . . . . . . . . . . . . . . . . . . . . . . . . . . . . . . . . . 220 ARS Weekly Activity Reports . . . . . . . . . . . . . . . . . . . . . . . . . . . . . . . . . . . . . . . . . . . . . 222
7. StaffSupport Staff . . . . . . . . . . . . . . . . . . . . . . . . . . . . . . . . . . . . . . . . . . . . . . . . . . . . . . . . . . . 226
Cooperators . . . . . . . . . . . . . . . . . . . . . . . . . . . . . . . . . . . . . . . . . . . . . . . . . . . . . . . . . . . . 229

iii
Director’s Message
2001 was a year of planning. Six of the seven major research projects at the laboratory were invarious stages of ARS’s new peer review process by the Office of Scientific Quality and Review(OSQR). Five were approved during 2001, and one is still under review. The remaining researchproject will be reviewed during 2002. Because of the amount of effort devoted to developingthese research plans, we thought it would be useful to provide them in our Annual ResearchReport. These plans will inform the audience for this report what we intend to do over the nextfive years. The research staff is excited about their new plans, and we look forward to makingpositive contributions to science and agriculture.
Over the past several years, we have been trying to bring together the remote sensing and theirrigated farm management teams to build on each other’s strengths. Such a merger happenedthis year as we organized our research plans. As a result, Doug Hunsaker (70%) and FloydAdamsen (30%) joined a new project entitled “Irrigated crop management utilizing remotesensing.” Doug will lead the effort to determine crop coefficients from remote sensing data.Floyd will assist the group with development of nitrogen management recommendations basedon remote sensing data. This shift resulted in Doug’s being moved from the Irrigation and WaterQuality Research Unit to the Environmental and Plant Dynamics Research Unit. Besides thepast remote sensors [(Paul Pinter, lead scientist (70%); Ed Barnes (100%), Glenn Fitzgerald(100%)], Bruce Kimball (20%) and Gary Wall (10%) also will bring additional micro-meteorological and plant physiological expertise to the new project. We expect this new level ofcooperation to provide useful farm management tools based on remote sensing.
We welcomed two new staff members to the lab in 2001: Fedja Strelkoff and Glenn Fitzgerald.Fedja had worked at the lab since 1991, but most of that time was as an employee of theUniversity of Arizona. He is now lead scientist for the new research project “Surface irrigationwater quality and management.” He has been instrumental in development of our surfaceirrigation models and now will take a more leading role in both development and application ofthe models. Glenn comes to us from Shafter, California, where he worked for ARS conductingresearch on remote sensing with hyperspectral radiometers. He joins the remote sensing team atthe laboratory on their new project “Irrigated crop management utilizing remote sensing.” Glennwill continue his work with hyperspectral radiometers to detect various forms of plant stress.Welcome Fedja and Glenn.
Sherwood Idso retired from the lab after 34 years. He spent his entire, very productive career atthe laboratory. A dedication is included in this report. We wish Sherwood well in his newventures.
The laboratory program looks strong and healthy in the near term. In the long term, we need tofocus on developing technology that will help growers and water-resource managers toeffectively utilize water for the good of the community. This will require increased cooperationwith users and additional resources. Leveraging our current resources and strong researchprogram will be needed to bring this about.
Bert ClemmensLaboratory Director

iv
Dedication
Sherwood B. Idso’s career began at the U.S. Water Conservation Laboratory in June of 1967 as aresearch physicist. He had just come from the University of Minnesota, where hereceived his B.S. in physics, his M.S. in soil science with a minor in physics, and hisPh.D. in soil science with minors in meteorology and mechanical engineering.
In the early part of his career, Sherwood developed severalmethods for measuring and estimating (1) net, solar and thermalradiation fluxes, (2) near-surface water contents of bare andvegetated soils, and (3) daily evaporative water losses from bare
and vegetated surfaces. He determined how water vapor and airborneparticulates affect the solar and thermal radiation balances at the Earth’ssurface. The latter led to an interest in studying dust devils and also haboobs,the huge dust storms that roll in from the desert.
Sherwood and other USWCL colleagues developed remote sensingtechniques for measuring several important plant and soil properties. This led to the use of infraredthemometry and the concept of the crop water stress index, whereby foliage temperatures could beused to schedule irrigations.
Sherwood became interested in the debate regarding thedegree to which Earth’s temperature may rise due to theincreasing atmospheric CO2 concentration. He argued that anyglobal warming would be much less than predicted by climatemodelers. However, an elevated concentration of CO2 alsoaffects plant growth, and together with colleagues, Sherwoodalso conducted many experiments to determine the directeffects of elevated CO2 on agricultural productivity and wateruse. Started in 1987, the experiment with orange trees is thelongest ever conducted, and Sherwood
continues to collaborate on it while in retirement.
Sherwood was one of the USWCL’s most productive scientists, authoring more than480 publications as part of his official duties and 88 more on his own time, includinga pair of influential books on carbon dioxide and global change. His papers havebeen cited in the scientific literature in excess of 6500 times, which is more than anorder of magnitude above the norm for all scientists.
Sherwood retired to a new career reviewing literature about CO2 and writingeditorials for the Center for the Study of Carbon Dioxide and Global Change, whichare published weekly on the Web (www.co2science.org). We dedicate this2001Annual Research Report to him, and we wish him well in his new endeavor --unfettered by reviews, approvals, and Form 115s!


1
Laboratory Organization
Mission
The mission of the U. S. Water Conservation Laboratory (USWCL) is to conserve water and protectwater quality in systems involving soil, aquifers, plants, and the atmosphere. Research thrustsinvolve developing more efficient irrigation systems, improving the management of irrigationsystems, developing better methods for scheduling irrigations, developing the use of remote sensingtechniques and technology, protecting groundwater from agricultural chemicals, commercializingnew industrial crops, and predicting the effect of future increases of atmospheric CO2 on climate andon yields and water requirements of agricultural crops.

2
LABORATORY MANAGEMENT
ALBERT J. CLEMMENS, B.S., M.S., Ph.D., P.E., Laboratory Director,Research Leader for Irrigation and Water Quality, and SupervisoryResearch Hydraulic Engineer Surface irrigation system modeling, design, evaluation, and operations; flowmeasurement in irrigation canals; irrigation water delivery system structures,operations management, and automation.
HERMAN BOUWER, B.S., M.S., Ph.D., P.E., Chief Engineer andResearch Hydraulic Engineer Water reuse; artificial recharge of groundwater; soil-aquifer treatment ofsewage effluent for underground storage and water reuse; effect ofgroundwater pumping on stream-flow; surface and groundwater relations.
JOHN A. REPLOGLE, B.S., M.S., Ph.D., P.E., Chief Scientist andResearch Hydraulic Engineer Flow measurement in open channels and pipelines for irrigation; irrigationwater delivery system structures, operations, and management.
BRUCE A. KIMBALL, B.S., M.S., Ph.D., Research Leader forEnvironmental and Plant Dynamics and Supervisory Soil Scientist Effects of increasing atmospheric CO2 and changing climate variables oncrop growth and water use; free-air CO2 enrichment (FACE) and CO2
open-top chambers and greenhouses; micrometeorology and energy balance;plant growth modeling.

3
LABORATORY SUPPORT SERVICES
ELECTRONICS ENGINEERING LABORATORYD.E. Pettit, Electronics Engineer
The electronics engineering laboratory is staffed by an electronics engineer whose duties includedesign, development, evaluation, and calibration of electronic prototypes in support of U.S. WaterConservation Laboratory research projects. Other responsibilities include repairing and modifyingelectronic equipment and advising staff scientists and engineers in the selection, purchase, andupgrade of electronic equipment. Following are examples of work performed in 2001:
• Completed designing and implemented use of the software for the Generation II(GEN II)probes which measure flood irrigation water advance and recession dates and times.
• Designed the GEN III probe utilizing a surface-mount microcontroller that is flashprogrammable and interfaceable to a new 24-cm variable water detection transducer.
• Wrote new software programming to accommodate new advances in the microcontrollerhardware being implemented in the new GEN III probe.
• Designed a 24-cm low-power optics source/detector transducer using surface mounttechnologies to interface to the GEN III probe. Designed, constructed, and experimentedwith several optic transducers for variable water level detection.
• Designed and assisted in the construction of the mold for a 24-cm multiple optic transducerfor the Gen III probe and also constructed several 24-cm transducers.
• Designed and constructed several visual test displays to control and read the 24-cmtransducers.
• Continued designing schematic capture parts and circuit board footprints for the appropriateORCAD libraries.
• Repaired LPKF circuit board mill machine and updated the hardware.• Continued performing multiple tests of the 10 fiber optic sensing GEN II probes with
acceptable results.
LIBRARY AND PUBLICATIONSLisa DeGraw, Publications Clerk, and Thelma Lou Draper, EPD Secretary
Library and publications functions, performed by one publications clerk, include maintenance ofrecords and files for publications authored by the Laboratory Research Staff, and publications co-authored with outside researchers, as well as holdings of professional journals and other incomingmedia. Support includes searches for requested publications and materials for the staff. Libraryholdings include approximately 2600 volumes in various scientific fields related to agriculture.Holdings of some professional journals extend back to 1959. The U.S. Water Conservation Laboratory List of Publications, containing over 2300 entries, ismaintained on ProCite, an automated bibliographic program. The automated system provides for

4
sorting and printing selected lists of Laboratory publications and is now accessible on LAN by theResearch Staff and on the USWCL home page (www.uswcl.ars.ag.gov) by the public. Publicationslists and most of the publications listed therein are available on request.
We are in the process of converting publications into pdf files which will allow easy access to ourlab publications through our home page on the web. There are currently approximately 200publications available for public use.
COMPUTER FACILITYT.A. Mills, Computer Specialist
The computer facility is staffed by one full-time Computer Specialist and one full-time ComputerAssistant. Support is provided to the ARS Phoenix Location, including the U.S. Water ConservationLaboratory (USWCL), the Phoenix Location Administration Office, and the Western CottonResearch Center (WCRL).
The facility is responsible for designing, recommending, purchasing, installing, configuring,upgrading, and maintaining the Phoenix Location’s Local and Wide Area Networks (LAN, WAN),computers, and peripherals. The USWCL LAN consist of multiple segments of 10 Base-T, 100Base-T, 1 Gigabit hubs and switches. The LAN is segmented using a high speed switches. Segmentsare made up of fiber optics, CAT 5 and standard Ethernet. This configuration currently providesover 200 ports to six USWCL buildings plus those at WCRL. Internet service is provided byArizona State University (ASU) via a Point-to-Point T-1 line. The facility maintains two Internetdomains uswcl.ars.ag.gov, and wcrl.ars.usda.gov. The Laboratory LAN is comprised of severalservers operating under Windows NT 4.0. End users operate mainly under Windows 95, 98, 2000,and Windows NT 4.0 with a few OS/2 workstations. Security is currently being provided throughthe USWCL router. A Cisco PIX firewall is in the process of being implemented.
Services such as print, file, remote access, and backup are provided by the USWCL LAN. Otherservices such as DNS and E-Mail are provided to both the USWCL and WCRL. The USWCLmaintains Web Servers for both USWCL (www.uswcl.ars.ag.gov) and WCRL(www.wcrl.ars.usda.gov). Currently FTP access is restricted to local accounts. This policy may berelaxed during the coming year.
MACHINE SHOPC.L. Lewis, Machinist
The machine shop, staffed by one machinist, provides facilities to fabricate, assemble, modify, andreplace experimental equipment in support of U.S. Water Conservation Laboratory researchprojects. The following are examples of work orders completed in 2001:
• Constructed mold for a 24-cm multiple optic transducer for the GEN III probe, as describedin the electronics section above, and adjusted specification where necessary.

5
• Constructed an adapter which fits on an automatic polishing machine arm for polishing theends of a 3-mm fiber optic light pipe.
• Manufactured multiple sample cup and cap for ball grinding of plants and soil samples.• Manufactured a catch release tool for removing rubber hoses from bulkhead fittings.

6
USWCL OUTREACH ACTIVITIES The USWCL staff participates in numerous activities to inform the public about ARS and USWCL research, to solicit input to help guide the USWCL research program, to foster cooperative research, and to promote careers in science. “Experiments for the Classroom.” The USWCL web site (www.uswcl.ars.ag.gov/events/exper/ exper.htm) contains experiments suitable for high school science classes. Support for Minority Graduate Student. The Irrigation and Water Quality MU supports an Hispanic graduate student in an assistantship at the Agricultural and Bio Engineering Department, University of Arizona. Program for Moroccan Visitors, February 9. USWCL and Western Cotton Research Laboratory staff presented and discussed their respective research, focusing on cooperation with universities, with Mohamed Kamal and Mohamed Moussaoui from the Moroccan Institut National de la Recherche Agronomique and Recherche Agronomique de Meknes, respectively. Martin Luther King Day Celebration, January 21, 2003. Kathy Johnson, Stephanie Johnson, and Michelle Worthen volunteered to assist with the celebration. 6th Annual Vegetable Crops Field Day, February 13. Ed Barnes gave a presentation on using remote sensing to monitor irrigation, fertility, and pest incidence levels in crops. The event was hosted by the University of Arizona Cooperative Extension. Arizona Science Bowl, March 2, 2003. Kathy Johnson, Mike Wiggett, and Gail Dahlquist participated in the Arizona Science Bowl at Glendale Community College. Students visit from De la Universidad Autonoma Chapingo, Chapingo, Mexico, March 12, 2003. Thirty students from the seventh-year irrigation class of the De la Universidad Autonoma Chapingo visited the laboratory. Ujohn Replogle hosted them and presented the overall laboratory history and current programs along with a hydraulics laboratory tour feautirng recent inovations involving flumes, Venturi meters, pitot tubes, flap-gate studies and the modification of velocity profiles in pipes to improve flow meter performance and accuracy. John Replogle’s former graduate, Dr. Mauricio Carrillo-Garcia, accompanied the group. Talk given to researchers and students from The University of Arizona, March 29, 2003. Glenn Fitzgerald gave a talk titled “Hyperspectral remote sensing and spectral mixture analysis for agirculture” to approximately 25 researchers and students interested in remote sensing applications to agriculture. Arizona’s Governor’s Advisory Committee, December 13, 2003. Bert clemmens attended meetings of the Governor’s Adivosry Committee on Agirulcutral Best Management Practices. This committee was set up by Governor Hull to provide guidance on implementing an interim practice for

7
the Third Management Plans for the state’s Groundwater Active Management Areas. "Water & Science Ag-Ventures," February 15 & 16. USWCL, in cooperation with the University of Arizona Maricopa Agricultural Center (MAC) and the Natural Resource Education Center of the Natural Resources Conservation Service, sponsored "Water & Science Ag-Ventures," an annual educational program for junior and high school students, held at MAC, near Maricopa, Arizona. The USWCL staff provided hands-on demonstrations based on USWCL research programs, with an accompanying brochure to be pursued further in the classroom. The students also received information on careers in science, specifically in ARS. USWCL's partners in the event provided hands-on experience with an actual irrigation event and a tour of the MAC aquaculture ponds. Arizona Ag Day, February 28. The USWCL continued its participation in the annual Arizona Agricultural Day (Ag Day) in downtown Phoenix. The purpose of Ag Day is to inform the public of the importance of agriculture in their daily lives. The theme is "Arizona Agriculture, Something You Should Know About." The exhibit featured an ARS backdrop depicting a variety of ARS research areas; handout materials such as "Science in Your Shopping Cart," Agricultural Research magazine; and displays and materials on USWCL research. The exhibit also included educational and career materials for teachers and students. Several thousand people attended the event, and the ARS exhibit was well attended. Bring-Your-Child-to-Work Day, April 26. Twenty-one children, ages 6 to 16, participated in "Bring-Your-Child-to-Work Day" at the U.S. Water Conservation Laboratory and Western Cotton Research Laboratory in Phoenix. The staffs of the two laboratories provided a full morning's participatory program that related the science to the children's day-to-day lives. In addition to the planned program, the children also spent time at their parent's work site. The Location Administrative Office coordinated and assisted with the day's activities that included a festive outdoor picnic lunch. Planning Workshop for Joint Chinese-Japanese CO2 Project, March 5-8. Bruce Kimball participated in a workshop at Nanjing and Wuxi, China, to plan a joint Chinese-Japanese Free-Air CO2 Enrichment (FACE) project on rice and wheat. Visit by Mexican Students, March 6. Eduardo Bautista, Fedja Strelkoff, and John Replogle provided a program on USWCL research on irrigation for students from the University of Chapingo, Mexico. Visitors from India, March 14. Sherwood Idso met with visitors from India who were seeking information on carbon sequestration and other areas related to global climate change. Training for South African Student, March 18-24. Terry Coffelt provided a one-week training session for a South African graduate student working on an MS degree in South Africa. The student was sponsored by international affiliates to study the production and seed harvesting of the Guayule plant. He hopes to duplicate the success of this plant’s resources in his home country. Summer Agricultural Institute for Teachers, June 22. Ed Barnes and Shirley Rish provided an ARS and USWCL exhibit at the week-long Summer Agricultural Institute for 32 elementary and junior high teachers. The program encourages teachers to incorporate agricultural information into school curricula._ Materials distributed at the USWCL exhibit included information on careers in

8
science and ARS and experiments that can be done in the classroom. Minority Technician Recruited, July. The Environmental & Plant Dynamics MU recruited a minority technician for a two-year term appointment. Attendance at EEO Conference, September 4-7. Rich Lee, Location Administrative Office ; and Skip Eshelman and Carl Arterberry attended the EEO Quad Conference in Concord, California. Annual Conference to Advance Chicanos/Latinos and Native Americans in Science, September 27-30. Representatives of the USWCL, Western Cotton Research Laboratory, and Phoenix Location Administrative Office participated in the annual conference of the Society for the Advancement of Chicanos/Latinos and Native Americans in Science (SACNAS), which was held in Phoenix, Arizona. ARS scientists spoke at symposia detailing career opportunities with ARS and hosted a field tour of the Phoenix location with demonstrations of ongoing research projects. Phoenix location representatives also helped staff the ARS exhibit booth at the conference. ARS Irrigation and Drainage Exhibit at the International Irrigation Show, November 2-4. Shirley Rish coordinated an exhibit on irrigation and drainage research at the annual Irrigation Association International Show in San Antonio, Texas. John Replogle provided display materials and helped staff the exhibit. ARS scientists from Florence, South Carolina; Bushland, Texas; Baton Rouge, Louisana; Ft. Collins, Colorado; Stoneville, Mississippi; and the National Program Staff also assisted. The exhibit was supported by Dale Bucks, ARS National Program Leader for Water Quality and Management. The Irrigation Association provided complimentary exhibit space. Registered attendance was more than 6000, and the ARS exhibit was well attended. Seminar at Grand Canyon University, November 16. Bert Clemmens gave a seminar, "Finding your Way Through the Fog--Expanding the Frontiers of Engineering and Science," to a group of 30 students and faculty in the College of Science at Grand Canyon University. Visitors from Central Asian Countries, Nov. 30. Representatives of government ministries for natural resources, water, environment, and foreign affairs from Kazakhstan, Kyrgystan, Tajikistan, Turkmenistan, and Uzbekistan visited USWCL on a tour under the International Visitor Program of the U.S. Department of State. These governments are seeking the most efficient ways to manage their water resources. Presentations and discussions focused on integrated water management and included global perspectives, climate change, dams, artificial recharge of aquifers for underground storage of water, water banking, water reuse, virtual water, efficient irrigation, and water measurement. Training and Learning Opportunities for Minority Students. USWCL continued to provide training and learning experiences for part-time minority student employees from Arizona State University.

9
SAFETYT. Steele
The Laboratory Safety Committee enjoys well-deserved respect from the employees. It is a time-consuming commitment and requires judicious management of time and work priorities. Servingon the safety committee, however, is gratifying in terms of its record of accomplishments. A fewexamples of our accomplishments follow:
a. A program for the installation and use of Automatic External Defibrillators (AED)was developed and implemented. The AED has been installed and is available foruse. A first responder team has been identified, and they are in the process offinalizing notification and response procedures. The City of Phoenix FireDepartment Emergency Access Services Department has been notified of theinstallation.
b. The Safety Committee’s project of gathering information for inclusion into adatabase that the Phoenix Fire Department uses in a emergency response data basein ongoing.
c. Increased security measures have been implemented, and additional measures tocontrol access to the facility buildings and grounds are being considered.
d. Employees are still encouraged to report all safety concerns, even those that mightseem trivial.
e. The committee takes its duties seriously and has worked diligently to insurecompliance with all EPA and OSHA regulations and radiological safety protocols.
The location staff thanks the committee for their good work on our behalf and looks forward toanother year of safety awareness and exemplary records.

10
STUDENTS AT USWCL J. Askins
The USWCL has enjoyed a mutually beneficial relationship with students from nearby Arizona StateUniversity over the years. Students come under work-study agreements and student federalappointments. They perform a variety of tasks from collecting samples to solving computerproblems, from numbering vials to writing protocols, from weighing soil to processing and analyzingnon-soil data. Students who work in the clerical/administrative area have worked in personnel andsafety areas as well as doing general clerical work such as filing and copying. Operation of ARSautomated systems, publication clerk duties, and literature searches are also performed.
The students benefit from the income and experience, and we benefit from their enthusiasm,up-to-date expertise, and energy. Some have stayed on after graduation, even earning Ph.Ds. underARS assistance programs.


11
I&WQ Organization
Mission
The mission of the Irrigation and Water Quality (I&WQ) Research Unit is to develop managementstrategies for the efficient use of water and the protection of groundwater quality in irrigatedagriculture. The unit addresses high priority research needs for ARS’s National Programs in the areaof Natural Resources & Sustainable Agricultural Systems. The unit primarily addresses the WaterQuality and Management National Program. It also addresses the application of advancedtechnology to irrigated agriculture.

12
I&WQ RESEARCH STAFF
FLOYD J. ADAMSEN, B.S., M.S., Ph.D., Soil Scientist Management practices that reduce nitrate contamination of groundwater whilemaintaining crop productivity; application of 100% irrigation efficiency; wintercrops for the irrigated Southwest that can be double-cropped with cotton;contributions of natural and urban systems to nitrate in groundwater.
EDUARDO BAUTISTA, B.S., M.S., Ph.D., Research Hydraulic EngineerOn-farm irrigation system hydraulic modeling; hydraulic modeling ofirrigation delivery and distribution systems; control systems for delivery anddistribution systems; effect of the performance of water delivery anddistribution systems on-farm water management practices and water-useefficiency; integrated resource management and organizational developmentfor irrigated agricultural systems.
HERMAN BOUWER, B.S., M.S., Ph.D., P.E., Chief Engineer andResearch Hydraulic Engineer Water reuse; artificial recharge of groundwater; soil-aquifer treatment ofsewage effluent for underground storage and water reuse; effect ofgroundwater pumping on stream-flow, surface water-groundwater relations.
ALBERT J. CLEMMENS, B.S., M.S., Ph.D., P.E., Laboratory Director,Research Leader for Irrigation and Water Quality, and SupervisoryResearch Hydraulic Engineer Surface irrigation system modeling, design, evaluation, and operations; flowmeasurement in irrigation canals; irrigation water delivery system structures,operations management, and automation.
NORMA L. DURAN, B.S., Ph.D., MicrobiologistWastewater irrigation; molecular detection of waterborne pathogens;pathogen regrowth and disinfectant by-product formation in distributionsystems; fate and transport of pathogens in the subsurface environment.

13
JOHN A. REPLOGLE, B.S., M.S., Ph.D., P.E., Chief Scientist andResearch Hydraulic Engineer Flow measurement in open channels and pipelines for irrigation; irrigationwater delivery system structures, operations, and management.
ROBERT J. STRAND, B.S., Electrical EngineerAutomatic control of irrigation delivery systems; development andintegration of field sensors, intelligent field hardware, USWCL feedbackand feedforward control software, and commercial supervisory controlsoftware to create a plug-and-play control system.
THEODOR S. STRELKOFF, B.C.E., M.S., Ph.D., Research HydraulicEngineer Surface-irrigation modeling: borders, furrows, two-dimensional basins;erosion and deposition; design and management of surface-irrigation systems;canal-control hydraulics; flood-routing methodologies; dam-breakfloodwaves; flow in hydraulic structures.
BRIAN T. WAHLIN, B.S., M.S., Civil Engineer Flow measurement in open channels and pipelines for irrigation; irrigationwater delivery system structures, operations, and management.


14
PROJECT SUMMARY
Water supplies are limited in many areas of the country, particularly in the arid west where irrigatedagriculture is the largest user of fresh water. Expanding urban populations and environmental waterneeds will potentially reduce water available for irrigation in the future. Water users are faced withrequirements to more accurately document water uses and return flows. Water measurement andcontrol in irrigated agriculture has experienced significant advances over the last two decades, yetfurther advancement is both possible and needed. Under this research project, we intend to developimproved water measurement technology, improved water accounting methods, and improved watercontrol technology. New measurement methods will be developed for steep, sediment ladenchannels, channels with little or no head available, low-head pipelines (culverts), and submergedradial gates. A new canal automation system will be released to a CRADA partner to provide greaterwater control and operational flexibility to meet user needs. Water balance methods will be furtherdeveloped to assist water purveyors with documenting water use, including methods to determinesources of error, which indicate where measurement effort should be focused.
OBJECTIVES
1. Flow Measurement and Accounting: We will develop a series of improvements to existingmethods for measuring water flow rates and volumes in rivers, streams, canals, and culverts (lowpressure or not flowing full). A series of laboratory studies is planned for currently identifiedwater measurement problems (see research approach). We will continue to support softwaredeveloped for design and calibration of long-throated flumes, will cooperate with customers toevaluate their water measurement and accounting methods, and will work toward solutions totheir flow measurement problems.
2. Water Control: We will develop a series of methods, hardware, and software for improving thecontrol of water in open-channel distribution systems typical of irrigation projects or large watersupply projects. A new canal automation system currently under development will be turnedover to our CRADA partner. The mechanical/hydraulic controller (DACL), used to maintainconstant flow rates at canal offtakes, will be improved to make it more usable in remote sites.
NEED FOR RESEARCH
Description of Problem to be Solved
Competition for limited water resources among various users is increasing in many areas of thecountry, but particularly in the arid west. Irrigated agriculture is the largest user of fresh waterresources and, thus, it needs to improve its water management (CAST 1996, National ResearchCouncil 1996). Important elements for improving agricultural water management are improvedmeasurement, control, and ultimately, accountability of water resources at the irrigation projectlevel. Water uses at the project or hydrologic unit scale are often poorly documented makingmeaningful management of water supplies difficult. Also, water supplies for agriculture from largeirrigation projects are often not controlled well, resulting in over-delivery to individual users andineffective use at the farm level. As water moves downstream through various projects and uses, its

15
quality degrades as salts, trace metals, and other contaminants are concentrated, often to the pointof being unusable or having a negative impact on the environment. The objectives of this project areto develop tools for improving the management of water supplies, particularly for irrigation.
Relevance to ARS National Program Action Plan
The research is part of National Program 201, Water Quality and Management. The project fallsunder Component 2, Irrigation and Drainage Management. Both objectives deal with agriculturalwater conservation and fit under Problem Area 2.3 (Water Conservation Management), Goal 2.3.1(Water Conservation Technologies). The research also supports Goal 2.3.3 (Agricultural WaterConservation and Environmental Quality).
Potential benefits expected from attaining objectives
Large-scale water supplies will be better managed in arid regions with the tools developed here.Water measurement, accounting, and control will be improved in irrigated agriculture, supportingmore rational analysis of the impact of irrigated agriculture on the environment and allowing morerational decisions by society about water allocation and use.
Anticipated Products
New technology is provided for improving the operation and management of water projects,including canal automation/control and water measurement/accounting technology.
Customers of the research and their involvement
Based on past successful technology transfer and the anticipated products, customers will includethe U.S. Bureau of Reclamation (USBR), Natural Resources Conservation Service, U.S. GeologicalSurvey, Army Corp of Engineers, Bureau of Indian Affairs, State Departments of Water Resources(particularly Arizona and California), land-grant universities, civil and agricultural consultingengineers, and water purveyors (water conservancy districts, irrigation districts, municipalities, etc.).We have cooperated with NRCS staff on the application of flow measurement technology andrelated research needs at all levels (field office to national) and in states across all regions of thecountry. Our main point of contact is Tom Spofford, Water and Climate Center, Portland OR (letterattached), who disseminates information widely within NRCS. With USBR, cooperation on watermeasurement and control has been mainly with the Water Resources Research Lab, Denver CO(Cliff Pugh, letter attached). They transfer our technology to regional and area offices throughmanuals and technical assistance programs. Research on water-balance methods has primarily beenwith the Lower Colorado Region of USBR (Steve Jones), who along with other regions aretransferring this technology to water purveyors through their water conservation plans. Furtherplanned activities with Paul Matuska (letter attached) are expected to have additional impact onwater conservation plans. Several water purveyors (e.g., Salt River Project, Maricopa Stanfield I&DDistrict, Imperial Irrigation District) have been directly involved in various studies and technologytransfer activities since much of this research must be conducted within real, full-size water systems.Water meter, remote monitoring, and hydrologic instrumentation manufacturers have been

16
customers, which is expected to continue with this project (e.g., Automata, Global Water,Micrometer, Nu-Way Flume Co., Plastifab, etc.). Individual water users also will be customers,particularly for the water measurement devices.
SCIENTIFIC BACKGROUND
Water demands by a growing urban population, concern over protection of water quality and naturalhabitats, decreasing political support for subsidies to the agricultural sector, and Native Americanwater claims are key factors that are forcing state and federal governments to examine morecarefully how water is allocated and distributed in irrigated agricultural regions. This hasimplications for water measurement, control, and accounting. Policies and programs to promotebetter water management are constrained by incomplete understanding of the hydrology of irrigatedregions and inadequate or insufficient data on water use.
The Central Valley Project Improvement Act (CVPIA) of 1992 is a recent example of legislationthat potentially reallocates water supplies within a basin. CVPIA requires water users to developwater management plans (USBR 1999). Within these plans, all water diverted must be measured andaccounted for. Guidelines for formulating the conservation plans did not exist when CVPIA wasenacted and have gradually evolved over the last decade. Not surprisingly, irrigation districts in theCentral Valley are struggling to develop accurate water budgets, even though improved watermeasurement and water control are required under these plans. The Bureau of Reclamation is in theprocess of instituting these requirements for water users in other regions, as well. The ability tomeasure and control water supplies and to properly account for the disposition of water is paramountto achieving the required level of management, as highlighted at a recent USCID conference“Benchmarking Irrigation System Performance Using Water Measurement and Water Balances”(Davids and Anderson, 1999).
A large percentage of agricultural water users receive their water supplies through networks of openchannels. Most of these systems were originally built to deliver water at a fixed rate and fixedtiming. Providing flexible and accurate water deliveries, so that users can match crop and on-farmirrigation demands, represents a significant water conservation opportunity (Cross 2000). In recentyears, many U.S. irrigation districts have modernized their canal physical infrastructure andoperational procedures in an effort to provide greater delivery flexibility and accuracy (Burt andStyles 2000). Although most open-channel distribution systems still cannot offer the flexibilityneeded for farmers to convert to pressurized farm irrigation systems, increasing flexibility withoutalso improving control of the delivery system can result in an increase in water that is “unaccounted-for.” One district in central Arizona (unofficially) reported unaccounted-for water as 30-35% ofdiversions. With an intensive water measurement program where several dozen water measurementdevices were installed, unaccounted-for water was reduced to 10-15%. This district still has a policyof delivering 10% more water than ordered so that when fluctuations occur, they will still deliverat least the requested rate. The Arizona Department of Water Resources limits water duties toindividual farmers. However, for those served from irrigation districts, they allow 10% more waterto be diverted (ADWR 1999). Cost-effective technology is strongly needed for improving projectwater control.

17
Performance indicators for irrigation and drainage projects proposed over the last several decadeswere summarized by an ICID working group (Bos 1997). That group is currently preparing a manualon performance assessment (ICID 2000). Three groups of performance indicators are given, dealingwith 1) water balance and operational issues (e.g., related to water measurement, accounting andcontrol), 2) economic and social issues, and 3) drainage and sustainability issues. Completelydifferent indicators are used for each specific purpose (i.e., there is no crossover). There are twodozen parameters to choose from, and many of these vary over a project spatially and temporally.No single performance parameter fully addresses water control or delivery service issues. For poorlyoperated schemes, deliveries to users are grossly inequitable . As operations improve, the focusshifts to proper timing of water deliveries, then to proper flow rate, then to ability to vary duration,then to ability to maintain a constant flow rate, and then to the ability of the irrigator to vary shutoff and/or flow rate with short notice. As operations improve, the type of demands placed on thesystem shift. The result is a continuously moving and more refined target. As a result, theperformance indicators needed to define adequate service change. Since the quantitative values ofthe various performance indicators also vary with the physical limitations imposed by the canalsystem, no one has been able to set target quantitative values for any of these performanceindicators. Further, the link between operational and economic or sustainability performanceindicators is site specific and thus not generally quantifiable.
In a complementary effort, Burt et al. (1997) suggest a new paradigm for evaluation of traditionalperformance parameters such as irrigation efficiency, including accurate geographic boundaries, adefined time period, and an accurate water balance. Clemmens and Burt (1997) show that theaccuracy of project performance measures can be determined based on the accuracy of individualvolume estimates. This provides information on which quantities have the most influence on theoverall accuracy and therefore demand more attention. These methods have been applied to theImperial and Coachella Valleys in several studies (TWG 1994 and WST 1998). Unfortunately thesereports are not routinely available because of the political sensitivity involved. Poor understandingof the hydrology of irrigated areas and improper interpretation of terms such as irrigation efficiency(IE) has lead to the unfounded expectation that improved efficiency will provide additional watersupplies (Burt et al. 1997), when often irrigation return flows are used downstream. Solomon andDavidoff (1999) describe the differences between field and project IE based on the amount of reusethat occurs within a project. Difficulties in accounting for water exacerbate this problem.
Flow Measurement and Accounting
A key obstacle to improved water measurement and accounting is the cost of measurement programs(e.g., instrumentation, data collection, maintenance, data analysis). Many irrigation districts measureand continuously monitor water diversions at key control points, but do not do so for delivery toindividual users. In one study, Palmer et al. (1991) showed that water accounting was poor (17%of deliveries not billed) and water metering was inaccurate when flow rates were measured onlyonce per day (average rate varied by 20%). Accuracy of volumetric estimates depends on theaccuracy and frequency of individual measurements (Wahlin et al. 1997, and Thoreson et al. 1999).Reliable and inexpensive data collection and communication technologies are needed to overcomethis financial barrier. There are also hydraulic difficulties; i.e., field conditions under whichmeasurement is difficult, uncertain, and/or costly.

18
Many existing primary flow measurement devices have accuracy (±2 standard deviations) underideal conditions that vary from ±0.1% to ±2% (primarily systematic errors). Under field conditions,with the addition of secondary devices (e.g. transducers that provide readout of primary device),accuracy degrades to ±3% to ±5% for an instantaneous reading. Repeated readings over time reducethe random errors, but the systematic errors remain. Non-ideal field installations often causeadditional systematic errors. Each measurement site within a project will have a different systematicerror, part of which can be considered random from site to site. Thus the overall accuracy of totalvolume from many measurement sites will be better than the individual sites. The ArizonaDepartment of Water Resources requires that annual reporting of groundwater pumping have anaccuracy of ±10%. This may give a total volume accuracy on the order of ±5 to ±10%. This issimilar to the water balance accuracy for the Imperial Valley reported by WST (1998). The cost formeasurement devices for small flows (up to 15 cfs) range from a few hundred dollars for flumes andweirs (up to $1000 when a transducer and logger or totalizer are added) to $500 to $1000 forcommon pipe meters.
On the Lower Colorado River, water used by individual users along the river is determined by aDecree Accounting Method (USBR 1998). Under this method, unmeasured return flows to the river(i.e., ungauged surface drains, subsurface flow, etc.) are determined as a percentage of diversion.This percentage of return flows is essentially a negotiated value. The Bureau of Reclamation istrying to develop a more scientifically-based method (LCRAS) to determine water use based onremote sensing, weather-based ET estimates, and river flows. There is currently no information onthe accuracy of either the current or proposed accounting method.
While significant strides have been made over the last two decades in measuring open-channel flowswith flumes and weirs, there are open-channel flow conditions where existing measurement devicesare not adequate (Replogle 2000). Of particular concern are open channels where little head loss isavailable for measurement, but channels that are too steep and sediment laden will also be studied,subject to support from cooperators. Most of these measurement problems are for relatively smallflows (particularly 10 cfs and below). A variety of critical-depth and super-critical-depth flumeshave been developed for steep channels. Super-critical flumes pass sediment, but are difficult tocalibrate. Critical depth flumes can be designed to pass normal bed-load sediment, but sedimentdunes can bury them. Flow measurement in low-head situations generally requires measurement ofvelocities, the trick being finding ways to infer the “average” velocity from the “measured”velocity(s), and doing it at low cost and high accuracy (Replogle 2000). This applies also to low-head pipes and culverts. A CRIS search on water measurement and flow measurement (and not insoil, plants, etc.) identified only one related project, other than those from this management unit.This project was on cut-throat flumes, which we consider an inappropriate technology anddiscourage their use (USBR 1997). We know of no other research projects working on improvingwater measurement technologies.
Water Control
The state-of-the-art in canal automation and control was summarized through a special issue of theJournal of Irrigation and Drainage Engineering (vol. 124, no. 1, 1998), An International Workshopon Regulation of Irrigation Canals in Morocco (RIC 1997) and a recent USCID Workshop on

19
Modernization of Irrigation Water Delivery Systems (Clemmens and Anderson 1999). Various canalcontrol theories have been proposed, some have been tested to a limited degree with simulationmodels, but few have been tested in the field. Automatic controls have been applied mostly toindividual gate structures.
Most canals are currently operated under manual upstream water-level control. Under this scheme,water released from the headgate is routed downstream through a series of gates, each passing theflow through to keep it’s upstream water level constant. The disadvantage of such systems is thatany errors in flow settings end up at the tail of the canal. Improved routing (feedforward control)schemes are needed to improve this type of operation; e.g., gate stroking (Bautista et al. 1997). Evenwith improved routing, imprecise measurements and unknown disturbances can cause flowmismatches (spills or shortages) downstream. Such mismatches need to be corrected throughfeedback control (typically based on the downstream water levels). Remote control from a centrallocation with Supervisory Control And Data Acquisition (SCADA) systems is becoming more andmore common. Supervisory control allows operators to see what is happening throughout the systemat once. However, such systems are based on the skill of the operator and the information availableto him/her, and results have been mixed.
We have attempted to improve on existing open-loop (feedforward) routing schemes (Bautista etal., 1997; Bautista and Clemmens, 1999). We concluded that the gate-stroking method is not feasiblein many situations since it causes excessive flow changes, sometimes exceeding canal capacity,sometimes requiring negative inflows. Simple routing based on volume changes and delay timescan produce satisfactory water level control without excessive flow changes (Bautista andClemmens, 1999). These procedures have only been tested with simulation and still require fieldtesting.
Downstream water-level feedback control strategies adjust canal inflow upstream to eliminate flowmismatches. A variety of downstream control schemes have been proposed (Malaterre et al. 1998).The main ones of practical interest are simple proportional integral (PI) controllers, linear quadraticregulators (LQR and related LQG and similar optimal control methods), model predictive control(MPC), and neural network/fuzzy controllers. Currently, we are focusing only on PI, LQR, and MPCsystems. A special class of LQR controllers allows for flexible design and simple tuning without theappearance of being a “black box” (Clemmens and Schuurmans 1999). In fact, this control theorycan be used to design a series of simple PI controllers as well. We have used this method to designcontrollers for several canals, which have worked well under simulation testing (Clemmens andWahlin 1999 and Clemmens et al. 1997). Limited field trials also suggest that these will worksuccessfully (Strand et al. 1999).
Strelkoff et al. (1998) and Bautista et al. (1996) studied the influence of canal physicalcharacteristics on canal controllability. These studies demonstrate that different canals responddifferently to control actions. Thus, the performance of canal control methods is site specific.Because of this, the ASCE Task Committee on Canal Automation Algorithms developed a set ofstandard test cases with standard performance measures so that various algorithms could be directlycompared (Clemmens et al. 1998). Because of the wide variety of performance parameters possibleto describe water delivery performance and the varied requirement of different project, the task

20
committee chose to use water level control in the canal (rather than variations in delivery flow rate,etc.) as the basis for comparing different algorithms. Three performance parameters for thedownstream water level in each canal pool were recommended: 1) the maximum absolute deviation;2) the integrated absolute deviation (a measure of the effort required to reject a system disturbance);3) the steady-state error over the last two hours of each test. A fourth parameter was recommendedto penalize unnecessary flow changes: 4) the integrated absolute discharge change. For a given test,the maximum of any pool and the average value for all pools were to be compared for both the firstand last 12 hours of each test. These tests had both scheduled and unscheduled flow changes.Tradeoffs between water level deviations and amount of flow changes were expected, particularlyas a result of individual choices during the tuning of each controller (Clemmens and Wahlin 1999).
There are many situations where electrical power is not available to operate motorized gates.Hydraulic/mechanical automatic gate controllers have been in use in the arid southwest for nearlya century (Clemmens and Replogle 1987). These controlled-leak controllers have the disadvantageof a large decrement where the water level changes significantly for different gate flow rates. Animprovement on this gate was developed by Clemmens and Replogle (1987), the so-called dual-acting controlled-leak (DACL) controller. These have not been adopted, partially because of theircomplexity. However, several recent improvements in gate designs may make them more useful(e.g., Langemann gates by Aqua Systems 2000 Inc.).
A CRIS search of active projects on canal automation showed no projects other than those of thisresearch unit. Those currently conducting canal automation research are typically not part of theCRIS system; however, we are aware of several complementary research efforts in this area,including Irrigation Training and Research Center, Cal Poly, San Luis Obispo; Water ResourcesResearch Lab, USBR, Denver; the Water Management Group at Delft Technical University, Delft,The Netherlands, and the canal automation group at CEMAGREF, Montpellier, France. In the areaof water delivery, we identified two related projects: one at Colorado State University dealing withmanagement issues (as opposed to physical control) and one at U. of Hawaii dealing withreallocation of supply. Several other projects dealing with project performance were found and willbe discussed in the next section. A CRIS search of active projects on water project or water deliveryand irrigation identified nine related research projects on project performance. Two are ARS projects(Riverside CA and Ft. Pierce FL), 3 are from Colorado State Univ., one is from Univ. California,Berkeley, 2 are from Univ Nevada, Reno, and one is from Texas A&M. Several of these deal withfield-scale rather than project-scale issues. Several of these are complementary to the researchproposed here. None duplicate the research proposed here. Results from those projects could haveimplications for the research conducted under this project, although indirectly.
NATIONAL COLLABORATION
This research project contributes to the ARS initiative on Drought and Water Scarcity. This initiativewill provide a series of tools to assist farmers, water districts, cities, water resource managers, andgovernment agencies in managing both periodic water shortages due to drought and the long-termdecline in available water resources. Research under this initiative will develop drought mitigationand forecasting methods, water conservation and reuse technologies, and tools for water managersto plan effectively for the future. This research will examine water availability and use at watershed

21
and larger scales over both short and long time periods. The result will be specific tools to providemore effective use of the Nation’s water supplies.
The objectives contribute to the initiative deliverable on improved water conservation technologies.No other ARS locations are conducting similar research, although many use the water measurementtechnology developed here. Other locations cooperating with this research include Riverside CA,Parlier CA, Kimberly ID, and Bushland TX.
APPROACH AND RESEARCH PROCEDURES
The research conducted under this project falls primarily in the area of “Technology Development”rather than “Experimental Observation,” and thus is not driven by hypothesis testing. Even whereobservational studies (e.g., hydraulics lab studies) are performed, they are oriented toward defininguseful relationship rather than confirming hypotheses.
Objective 1 - Flow Measurement and Accounting
Experimental Design
The intent of this research is to develop new flow measurement technology and extend the range ofusefulness of existing technology. Our target is better than ±10% accuracy for an individual reading(random and systematic) and better than ±5% systematic errors, with costs that are similar toexisting devices for the range of flows to be measured.
Correcting unreliable velocity distributions in short culverts: Upstream elbows, the pump head, orother pipe fittings that may produce a distorted flow profile that is detrimental to the properinstallation and operation of commonly available pipe meters. In open channels, flumes mustsometimes be installed closer to upstream disturbances than specified by standard installationrecommendations. Methods to condition flows to present proper profiles to meters over a shortdistance, have been successful on some field trials. Examples include a large diameter orifice(opening 90% of pipe diameter) to control wall jets and surface skimmer to settle the water surfaceupstream from flumes. Such ad hoc “fixes” cannot be generally recommended or reliably repeatedwithout further study. An existing 30 inch diameter concrete pipe in the hydraulics laboratory willbe used to test various methods to overcome a variety of introduced disturbances (e.g., twisting flow,jet from partial open gate, etc.). These methods (orifices, wall fins, etc.) will be evaluated bymeasuring downstream velocity distributions. A pitot-tube array has been constructed to measureall velocity heads simultaneously so that swirling flow will not distort the results.
Debris-shedding propeller meter for continuous monitoring in culverts: Propeller meters have longbeen used in pipe flows. Low-head pipelines and culverts often contain debris and trash that thwartthe use of propeller meters for all but intermittent use. We have tested a nose-hung propeller meterthat appears to shed almost all debris when located in the center of the pipe. Commercially availablepropeller blades are usually on the order of 6 in. diameter or less. Use of these small propellers inlarge culverts facilitates debris shedding, but compromise the measurement because they aresensitive to the velocity distribution which is a function of roughness and other effects. Replogle and

22
0.866 R0.5 R
Coincentric centers of equalcoincentric areas
0.0060.005 0.004 0.0030.0020.0010.0000.70
0.75
0.80
0.85
0.90
Kr/Rh
Vr
Figure 2. Relationship between the ratio of maximum surfacevelocity and the average channel velocity (Vr on the y-axis),and the ratio of the absolute roughness, Kr, and the hydraulicradius Rh (Kr/Rh on the x-axis).
Figure 1. Two velocity measurements representing the centers oftwo concentric areas give a reasonable estimate of averagevelocity.
Wahlin (2000) showed that anaverage velocity could beaccurately estimated (within 3%)with two velocity measurementmade at the centers of the twoconcentric areas of equal size (i.e.,center ½ of center area andconcentric ½ area, as shown inFigure 1). We plan to explorewhether we can obtain accuratemeasurements with a smallpropeller meter in a large piperegardless of velocity profile. Canone propeller be located toaccomplish this? How large does itneed to be? Are two propellersneeded? and where should they beplaced?
Surface-Velocity-Based Method: Measuring flows in flat sluggish canals is usually expensive whenstructural changes are required, for example raising the canal banks upstream. One of the oldestmethods available is to measure the surface velocity with a single float. This has proven inaccurate(e.g., ±50%) and unreliable since the velocity of a single float cannot be related to average cross-section velocity. Historical work of Bazin (1865) and Replogle and Chow (1964) and applicationof turbulent velocity distribution models, such as the Seventh-Power Law and secondary currents(Schlichting, 1960), indicate that the location of the maximum velocity in a channel is influencedby the shape of the boundary and the boundary roughness and is located somewhat below the watersurface. These references also indicate that this submerged maximum velocity may be reliablyrelated to the average flow velocity, if the boundary roughness and channel shape can becharacterized. A reliable indicator of the maximum velocity is needed to make this a viable flowmeasurement technique. The hypothesis is that if numerous floating particles are dumpedsimultaneously across a stream of interest, some of the particles statistically are likely to define themaximum surface flow element and thatthis maximum surface velocity can berelated to the true maximum and hencethe average velocity in the channel.Preliminary studies of a series of floatingparticles (e.g., sawdust, popcorn, or icecubes) suggests that the average velocityis between 0.7 and 0.9 times the fastestparticle velocity. This relationship shouldbe a function of channel roughness.Preliminary data is shown in Figure 2.The spread in the particle velocities isalso related to channel roughness. Thus

23
by measuring the distribution of particle velocities, a more accurate estimate of average velocitymay be possible. We propose to test these relationships in a series of small canals in Arizona withdifferent relative roughness conditions, where accurate flow rates are available by other methods.Travel time for the fastest and slowest particles will be measured over a distance of 30 m. Relativechannel roughness will be estimated by measuring the water surface gradient, cross sectional flowarea, and discharge. This is intended for simple flow survey work, where ±10% accuracy isacceptable, since it might not be convenient for continuous monitoring.
Submerged Radial Gates: Gates and weirs are commonly used to control flows in irrigation canals;however, flow measurement with such devices is often inaccurate. There are a variety of ways tomodify gate structures to make them more accurate measuring devices. We have developedcalibrations for broad-crested weirs, leaf gates, etc. (Bos et al. 1984 and Wahlin and Replogle 1994).Radial gates pose an interesting challenge since their (unsubmerged) discharge coefficient tends tochange with gate position. Submerged radial gates have proven even more difficult. Publishedsubmerged-gate calibration equations are insensitive and lead to large errors (e.g., ±50%).Furthermore, all calibration studies published on radial gates were conducted with a single gate andwith the upstream and downstream channels of the same width as the gate. The calibration equationsreflect this physical condition and are essentially not applicable under typical field conditions wherethe radial gate structure is placed in a much wider channel. Further, many large canals have banksof radial gates as check structures. If all gates are in the same position, then the published calibrationequations have the best chance of being appropriate. However, for operational reasons, many suchstructures are operated with one or more gates closed and the others more fully open, particularlyat low flows to avoid trapping debris.
We have conducted preliminary laboratory studies on a radial gate with a width less than half thatof the approach and tailwater channels (Tel 2000). Free-flow studies confirmed prior relationshipsdeveloped for the contraction coefficient (ratio of vena contracta depth to gate opening). We alsofound a useful relationship for the energy loss based on jet velocity head and Reynolds number.Then the energy (Bernouli) equation is sufficient to determine flow rate with no additionalcoefficients. Submerged calibration has proven more difficult. Because of the large energy lossdownstream from the gate, as with a hydraulic jump, the momentum equation is more appropriateon the downstream side of the structure. Use of the momentum equation from the upstream to thedownstream side requires estimates of all the forces (in the direction of flow) on the gate and walls.We chose to use the energy equation on the upstream side, since we have a useful relationship underfree flow, and the momentum equation on the downstream side, since energy losses there are toodifficult to estimate accurately. The equations are matched at the vena contracta, where we assumethat the jet thickness, yj, is the same under free and submerged flow. This approach proved to workvery well when the gates were highly submerged, but not during initial submergence. The problemwas with the energy equation on the upstream side of the structure, where assumption of the free-flow jet thickness gave the appearance of an increase in energy. We found that during initialsubmergence, the increase in pressure (water depth) was almost entirely offset by a decrease in jetvelocity head. At higher submergence, an increase in downstream depth translated directly into anincrease in upstream energy head. For a single gate opening at four discharges, we found a commonrelationship for the amount of energy adjustment needed, as shown in Figure 3. Combining theenergy equation upstream, with the relationship in Figure 3 included, with the momentum equation

24
Figure 3. Energy adjustment (relative to y2-yjet) required for simpleenergy equation based on free flow to balance under submerged flow.
downstream results in twoequations with two unknowns;the flow rate and the waterdepth at the vena contracta, y2.Solution of these two equationsassumes that we can estimatethe water depth (and thus force)on the downstream wall of thestructure based on thedownstream depths (y2 and thedepth in the downstreamchannel), which could beproblematic in some situations.Even so, if the relationship inFigure 3 proves to beconsistent, it would provide ameans of calibrating submerged radial gates right though the transition zone, from free to submergedflow.
We intend to continue these studies by running tests at several gates openings, at least three. We alsoplan to add a J-seal, as used in the field, to the model gate to determine its effects on theserelationships. We expect the J-seal to change the contraction coefficient, which makes the aboverelationships less general and more difficult to apply. We also plan to modify the lip of the radialgate model in the hydraulics laboratory so that the contraction coefficient remains more constantwith gate angle. If this does not alter the energy loss significantly, it may provide more constantconditions for calibration. We also plan to compare this method with data from the literature.
Support to Flume and Weir Design and Calibration Software: The Bureau of Reclamation took ourexisting software for long-throated flumes (Clemmens et al. 1993) and put it in a windowsenvironment. It is now called WinFlume (Wahl and Clemmens 1998). The program is widely usedand we continue to assist the Bureau with unforeseen technical problems, enhancements, etc. Weexpect this to continue indefinitely, as long as the program is still widely used. A book on theseflumes and weirs that includes the WinFlume software has been written and should be published inearly FY02.
Steep Channels/Natural Channels: A prototype self-calibrating flume for sediment-laden flows wasdesigned and installed in northern California for the California Water Quality Control Board. Theobjective was to develop a self-calibrating flume system and to determine its operational limitations.The design was based on estimated hydraulic behavior of a chute outlet attached to a "computable"trapezoidal long-throated flume. Two stilling wells, one on the main flume and one on the chute,provided field calibration for the chute after the main flume no longer functioned because ofsediment deposits. Carrillo-Garcia (1999) subsequently conducted studies on a laboratory model ofthis flume, under our direction, to determine the limits of sediment handling, the best slope for thechute, and whether the calibration of the chute remains stable after the sediment fills the main flume.The sediment altered the upstream (sub-critical) stilling well as predicted. The model indicated that

25
Figure 4. Distribution of error variance for estimation of netevapotranspiration of water from land area within the Imperial Valleybased on a water balance. Larger wedge contribute more error toestimate. (WST 1998).
the head detection in the chute will provide discharge rates with systematic errors on the order of±5% for a given storm, compared to ±2% for the critical-depth flume. Total errors (random andsystematic) for a single head measurement exceeded ±10% due to fluctuating water levels, comparedto ±3% to ±5% for the critical-depth flume. The downstream stilling well in the chute (super-critical) has about the same response with and without sand, as postulated. Findings include thatthe midpoint of the chute is a more reliable point of depth detection than points near the downstreamend of the chute. This may be related to the non-symmetric entry due to dune formation. If outsidesupport is available, we plan to place obstructions upstream from the flume (vanes, low weir,vertical elements, etc.) to force more symmetric entry into the flume and see whether we can reducewater level fluctuations and obtain ±5% total accuracy for a single head measurement. These studieswill be conducted in the hydraulics lab, and possibly other flumes in the field that have experiencedsimilar problems (e.g., several flumes of the Salt River Project and the one in California discussedabove).
Water balance and its accuracy: We have cooperated with the Lower Colorado Region of the Bureauof Reclamation on conducting water balances for various projects (e.g., Imperial and CoachellaValleys) (TWG 1994 and WST 1998). An analysis of errors was used to determine which factorscontributed the most to the water balance uncertainty (Figure 4). They have requested our assistancein comparing the accuracy of(a) their decree accountingmethod for assigning water usesalong the main stem of theLower Colorado River (HooverDam to the Mexican Border)and (b) their proposed LCRASmethod; however, collaborativearrangements have not beenfinalized (USBR 2000). Theyare using some of ourpreliminary work (developed incooperation with others) toassist water users with defininga water balance and itsassociated accuracy. USGS iscooperating with them to definethe accuracy of volumes for theriver measurements and themajor diversions and surfacedrains. Large diversions alsohave relatively accuratemeasurement (e.g., Central Arizona Project, California Aqueduct, All American Canal). It’s the 70or more other measurement sites plus the unmeasured return flow that pose the most problems withthe water balance. We have not surveyed these sites, so we don’t know what problems(opportunities) will be encountered. At this point, all we have is agreement to cooperate with USBRon this project. Our specific role in their ongoing programs is still being negotiated.

26
Contingencies
Other laboratory facilities could be contracted if ours are insufficient for a particular study. We havea strong track record at solving water measurement problems and expect these studies to provideuseful measurement methods. In a few cases, it is not known whether or not the methods that we aretesting will prove useful in the long run. If not, we will explore other user-defined measurementproblems. These problems are continuously being brought to our attention by cooperators. Ifcooperation on the Lower Colorado River main stem does not materialize, we have several othercontacts with which to pursue this research.
Collaborations
Necessary (within ARS) – None.
Necessary (external to ARS) – No cooperation is required to conduct laboratory studies. For fieldapplication we rely on the Natural Resources Conservation Service (NRCS, Tom Spofford) and theBureau of Reclamation (USBR, Cliff Pugh and Paul Matuska).
Objective 2 - Water Control
Experimental Design
The intent of this research is to develop a complete control system for canals that is adaptable to awide range of canal physical configurations and subject to a wide range of demands. Because thereare no specific performance standards with which to judge the impact of improved water control onthe performance of irrigation projects, application has been slow. Adoption is based on the desireby the water delivery agency for incremental improvement in control, improved reliability (e.g.,from remote monitoring), and cost savings in labor and vehicle travel (e.g., from remote control).The proposed simulation and field studies can be used to compare various control methods andsuggest which ones might be preferred in various applications as part of this control package.However, adoption of the overall control technology developed here is based on the acceptance ofthe users and the expectation of improved operations. For this reason, studies on the application ofthe technology are conducted in parallel with the more scientific controller comparison studies.
Canal control logic: Our USWCL canal control scheme consists of three component: 1) downstreamwater level feedback control, 2) open-loop or feedforward control (routing) of scheduled waterdelivery changes, and 3) flow rate control of check structures, based on flow changes from 1) and2). We currently use a downstream feedback control scheme based on a variation of LinearQuadratic Regulator theory which allows us to develop both centralized controllers that include timedelays and a series of local proportional-integral (PI) controllers (Clemmens and Schuurmans 1999).Our scheme also includes routing of scheduled water delivery changes (i.e., a modified form of gatestroking) (Bautista and Clemmens 1999). The flow controller adjusts gate position based on the gatehead-discharge equations. Some testing of this system has been done through simulation (Clemmenset al. 1997, Clemmens and Wahlin 1999, and Walhlin and Clemmens 1999) under ideal conditionsbut also by subjecting the control system to unscheduled disturbances and system noise. Field

27
testing is needed to verify that the robustness and effectiveness of the system (logic and software)with given actual perturbations, system noise, and possible hardware limitations. Tuning of thefeedback controllers relies on weighting coefficients in the optimization procedure that describe thetradeoff between water level errors and gate movements. To date, selection of these weightingcoefficients is based on subjective judgement about controller performance. Additional simulationtesting is needed to provide recommendation on these weighting coefficients. Simulation tests willbe run with CanalCAD (Holly and Parrish 1992). Controllers for these and all tests discussed belowwill be compared with the evaluation criteria determined by the ASCE task committee on canalcontrol algorithms (Clemmens et al. 1998). Those tests will allow to identify those controllerconfigurations more likely to perform well under a wide range of conditions, and also controllerconfigurations that would work best for particularly difficult situations.
We have been working with the Irrigation Training and Research Center (ITRC at Cal Poly, SanLuis Obispo) on upstream control where a series of individual controllers each tries to maintainwater levels upstream from a check structure. This can create oscillations in flow rates that growin the downstream direction. ITRC has been using modified versions of our controller designprograms (in MATLAB) to develop controllers for upstream control for several of their clients. Weplan to conduct more general studies on upstream controller design to provide a more solidtheoretical foundation. These studies are not planned for several years and details will likely bebased on the results from ITRC’s efforts and results of our field studies discussed below.
Our preliminary results suggest that sending control signals from one water level to more than oneupstream gate improves the responsiveness of the controller. Current LQR controller design methodsonly consider a single canal with no branches. Thus our control scheme does not allow downstreamcontrol signals to influence gates upstream from a branch point. We have modified the standardLQR technique to design controllers for a branching canal network. We intend to test the resultingcontrollers through unsteady-flow simulation with SOBEK (Delft Hydraulics 2000). Initialsimulation testing will be performed with ASCE test canal 1, with several downstream poolsconnected in the middle of the canal. If successful, we will test the branching controller withsimulation of canals within the Salt River Project.
Another limitation of the proposed controllers is that they are “static,” that is they are design for oneset of flow conditions. If control is not robust and stable over the full range of conditions, thecontroller must be tuned for different ranges of conditions (i.e., gain scheduling). Model PredictiveControl (MPC) has the advantage that the controller is tuned for the current conditions, however thisrequires on-line optimization. With the current state-of-the-art in canal control, we are notcomfortable with on-line optimization. However, we will test MPC for the branching canal testsdiscussed above.
Canal automation software: The research unit has developed a canal automation software systemthat controls canals remotely through a commercial Supervisory Control and Data Acquisition(SCADA) System using commercially available hardware in the Windows NT environment. Wehave entered into a Cooperative Research and Development Agreement with Automata Inc. todevelop a canal automation product line. Our automation software runs in parallel with the SCADAsoftware (Fix Dynamics, by Intellution Inc.) and accesses the SCADA database to determine the

28
Figure 5. FIX SCADA screen showing results of test on October 19,1999. Red lines are water levelset points and green lines are overflow weirs.
current status and to cause actions to take place (e.g., change in gate position). Automata’s remoteterminal unit (RTU) provides sensing and control functions. Preliminary field testing in the fall of1999 was successful (Strand et al. 1999). Figure 5 shows a sample SCADA screen with water leveloutput. We are in the process of adding fail-safe routines so that the controller does not actinappropriately when data are missing or sensors malfunction (as for WM-5 in Figure 5). Morerigorous field testing of this system will start in mid 2001 and continue through at least 2002. Thesystem should be turned over to the CRADA partner within FY02. Continued software upgradingis planned through FY03. We plan to support the CRADA partner’s efforts through 2004.
Field testing on WM canal: The field testing of the canal automation system will be performed onthe WM canal of the Maricopa Stanfield Irrigation and Drainage District (MSIDD), which has a 2.5m3/s capacity. This canal is at one extreme of hydraulic conditions (small, steep, with little storage).Groundwater wells are available that pump water directly into the canal (roughly 0.1 m3/s). Thesecan be turned off or on to simulate demand changes. The district allows us to operate the canal,either manually or automatically, while their normal deliveries are taking place. The main focus willbe on downstream water-level feedback control methods, both centralized and local. We will startby testing a series of simple PI controllers on only the upstream half of the canal. Initially, we willtest only downstream feedback control with pseudo-demand changes, generated by turning pumpson or off. Then we will route these pseudo-demand changes down the canal with our routingprogram as if they were scheduled, and with the feedback system still on. Performance will bemeasured with the ASCE Task Comimittee performancee indicators under a variety of flowconditions. If successful, we will expand to control of the entire canal and eventually route theactual demand changes down the canal and operate it automatically during normal delivery changes.We also will test downstream controllers that include lag-time predictions and the fully centralized

29
LQR controllers and several intermediate controllers as discussed in Clemmens and Wahlin (1999).We will attempt to run these various controllers under different flow and demand conditions. Furthertesting on canals with different properties, for example where backwater effects as significant, isplaned for later stages of this project. Possible sites include lateral E12 at MSIDD and one of thelateral off the East Highline Canal in the Imperial Valley. However, we will not pursue these sites(or collaboration at Imperial) until testing is competed at MSIDD and the system can bedemonstrated.
SRP pilot study: We are currently completing studies on one of the larger canals of the Salt RiverProject (SRP) to test the feasibility of applying this technology within SRP’s operating environment.We are also using this cooperation to test the acceptability of such control methods to their operatingstaff. We conducted simulation studies with the unsteady-flow simulation software program Mike11 (DHI 1992) to demonstrate the technical feasibility of the feedback and feedforward (routing)scheme (Clemmens et al. 1997). Example simulation results are shown in Figure 6. We have alsoexamined various practical issues, including: (1) comparison of water level deviations for realdemand conditions under (a) simulated automation and (b) actual manual control (Brouwer 1997);(2) use of identification techniques to estimate canal hydraulic parameters for controller design(Silvis 1997 & Silvis et al. 1998), (3) analysis of the limitations imposed by the limit storage at thediversion structure which supplies water to the canal (This suggested the need to control a sectionof the river between the storage and diversion dams (Visser 1998), and the need for control ofbranching systems.); (4) analysis of start-up procedures for the feedback system (Bautista et al.1999); (5) analysis of performance for alternative controller designs (Wahlin and Clemmens 1999);and (6) calibration of the head-discharge relationship for radial gates (Tel, 2000). Several of thesestudies were conducted in collaboration with graduate students from Delft Technical University.
We are currently testing the routing procedures in cooperation with Salt River Project by comparingthe program’s and the operator’s schedules of flow changes. The objective is to identify possibleproblems with the control algorithm given the range of operational conditions experienced in thereal canal. Furthermore, these tests should help reassure operators that the computed schedules arereasonable and would not endanger the canal. We plan to complete these tests by September 2001.Depending on the outcome of these tests, we propose to conduct off-line tests in FY02. With thesetests, we plan to demonstrate that the proposed open-loop control algorithm can improve water levelcontrol relative to the heuristic approach currently employed by the operators. If the off-line testingis successful, we will request SRP’s approval to automate the execution of the computed schedules,in real time. This will require our routing software to be implemented within SRP’s computeroperating systems and, thus, will serve to identify practical implementation problems. If this issuccessful, we will propose implementation of the feedback control system. (SRP is alreadyimplementing their own flow-control function).

30
Figure 6. Difference between actual and target forebay waterlevel under simulated automated control in four Upper ArizonaCanal pools for Test 5 from SRP Canal Automation Pilot Project.(Clemmens et al. 1997). (Inside band is acceptable or “green”zone, shaded is “yellow warning zone, outside figure is “red”zone).
Dual-acting controlled leak: For situations where communication and remote power are notavailable, mechanical/hydraulic automatic control devices are needed. The research unit developedsuch devices in the late 1980s and proposes to do additional development and testing of thesedevices (Clemmens and Replogle 1987). The DACL controllers have two limitations: (1) the twovalues have to be carefully adjusted relative to one another and (2) the gate controls were done withvery large counter balanced floats on radial gates. We propose to develop a single valve with therequired dual action and to useinflatable bladders to do awaywith the current float/counterweight system. Thiswill make such devices muchmore easy to retrofit to existinggate structures, including sluicegates. Two prototype valueshave been built, but not yettested under operationalconditions. Several bladdersystems have been tried, butfinding the right combinationof materials has provedchallenging.
Contingencies
Field studies rely on cooperationwith irrigation districts and aCRADA partner to test thesesystems in real time on operatingcanals. If the current collaborations were to end, new collaborators would be found to continue theresearch. We are just ending a canal automation research project with the Salt River Project.Implementation was postponed, but they are a potential alternative site if cooperation with MSIDDdoesn’t work out. We also have had close cooperation with Imperial Irrigation district in the past,so they are another potential candidate for cooperation. If the controller design methods beingused/developed do not work for a particular canal, there are a number of other control methods thatcan be used (e.g.. Model Predictive Control). Some of these other controllers will be examinedthrough simulation so that we gain familiarity with them.
Collaborations
Necessary (within ARS) – None.
Necessary (external to ARS) – Maricopa Stanfield Irrigation and Drainage District (Gary Sloan),Salt River Project (Bob Gooch), Automata, Inc. (Lenny Feuer), Irrigation Training and ResearchCenter (Charles Burt), and USBR Water Resources Research Laboratory (Cliff Pugh).

31
Physical and Human Resources:
This research project includes three category I research scientists (1.79 SY), two category IIIresearch scientists (1.4 FTE), and an engineering technician (1.0 FTE, GS-9 on temporary termappointment). We will hire additional temporary personnel as needed. This labor force is sufficientto carry out the needed work.
The research is conducted at the U.S. Water Conservation Lab which has office and laboratory spaceavailable for a wide variety of studies. Employees utilize the 372 m2 hydraulics lab for small-scalestudies on flow measurement and canal automation. However, these are currently utilized primarilyfor another project. The hydraulics lab includes 5 pumps (30, 20, 20, 15 and 15 Hp), two largesumps, a constant head tank, 25 ton hanging weigh tank, 15.2 m long glass lined flume (1.2 m wideby 0.6 m high), and a 760 mm diameter concrete pipe section 12 m long. The system has a capacityof 450 l/s, depending on which experimental apparatus is being used. The weight tank system canmeasure flow rates to within 0.1%. A soils lab is available to conduct soil particle size analysis. Anelectronics shop is available for development and repair of electronic instruments as needed. Waterchemistry labs, primarily associated with other projects, are available for testing soil and water forconstituents if needed. The laboratory has an internet connection (T1 line), a local area network, andnumerous personal computers for the staff. Much of the research of this group is conducted withcustomers and cooperators on their sites to assure relevance.
MILESTONES AND EXPECTED OUTCOMES
Expected outcomes include: (1) improved water measurement devices, (2) new canal automationtechnology, and (3) improved water use assessment methods and performance indicators.

32
Milestone TimelineResearch
Componentend of year 1 end of year 2 end of year 3 end of year 4 end of year 5
WaterMeasurementandAccounting
Lab study on flowconditioning forpipes/culvertscompleted (Replogle)
Lab study on debris-shedding propellermeter completed(Replogle)
Field studies onsurface-velocity-based methodcompleted (Replogle)
Lab study on highsediment loadflume completed(Replogle)
Laboratory studies onsubmerged radialgates completed(Clemmens)
Verification ofradial gatecalibration methodcompleted(Clemmens)
Field study onwater balanceaccuracy completed(Clemmens)
Water Control Initial version of canalautomation systemturned over toCRADA partner(Clemmens)
Improved interface forcanal automationsystem provided toCRADA partner(Clemmens/Bautista)
Final version ofcanal automationtechnology given toCRADA partner(Clemmens)
New DACL controlsystem developedand lab testingcompleted(Replogle)
Field studies of canalautomation on steepcanal (WM atMSIDD) completed(Clemmens)
Field application offeedforward routingmethod completed(Bautista)
Field studies ofcanal automationon canal with mildslope complete(Clemmens)
Feedback controlmethod for branchingcanals developed andsimulation testingcompleted(Clemmens)
Simulation testing ofModel PredictiveControl for branchingcanal completed (Clemmens)
Upstream controlmethod developedand simulationtesting completed(Clemmens)
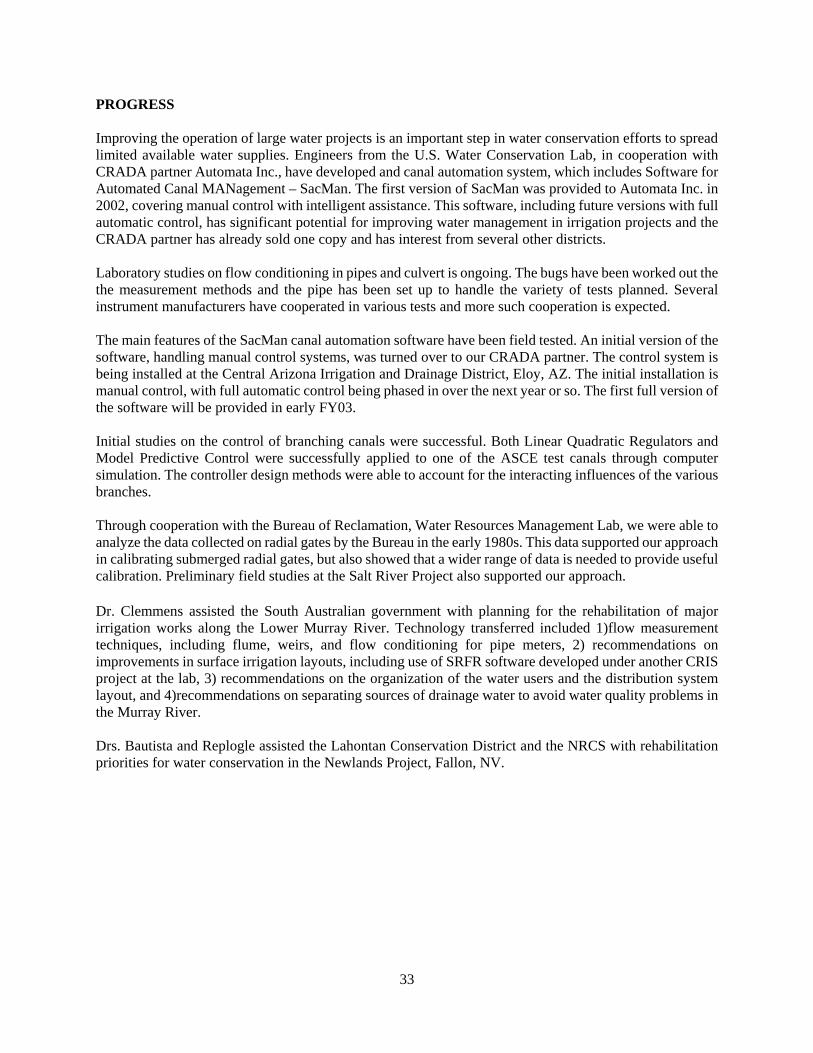
33
PROGRESS
Improving the operation of large water projects is an important step in water conservation efforts to spreadlimited available water supplies. Engineers from the U.S. Water Conservation Lab, in cooperation withCRADA partner Automata Inc., have developed and canal automation system, which includes Software forAutomated Canal MANagement – SacMan. The first version of SacMan was provided to Automata Inc. in2002, covering manual control with intelligent assistance. This software, including future versions with fullautomatic control, has significant potential for improving water management in irrigation projects and theCRADA partner has already sold one copy and has interest from several other districts.
Laboratory studies on flow conditioning in pipes and culvert is ongoing. The bugs have been worked out thethe measurement methods and the pipe has been set up to handle the variety of tests planned. Severalinstrument manufacturers have cooperated in various tests and more such cooperation is expected.
The main features of the SacMan canal automation software have been field tested. An initial version of thesoftware, handling manual control systems, was turned over to our CRADA partner. The control system isbeing installed at the Central Arizona Irrigation and Drainage District, Eloy, AZ. The initial installation ismanual control, with full automatic control being phased in over the next year or so. The first full version ofthe software will be provided in early FY03.
Initial studies on the control of branching canals were successful. Both Linear Quadratic Regulators andModel Predictive Control were successfully applied to one of the ASCE test canals through computersimulation. The controller design methods were able to account for the interacting influences of the variousbranches.
Through cooperation with the Bureau of Reclamation, Water Resources Management Lab, we were able toanalyze the data collected on radial gates by the Bureau in the early 1980s. This data supported our approachin calibrating submerged radial gates, but also showed that a wider range of data is needed to provide usefulcalibration. Preliminary field studies at the Salt River Project also supported our approach.
Dr. Clemmens assisted the South Australian government with planning for the rehabilitation of majorirrigation works along the Lower Murray River. Technology transferred included 1)flow measurementtechniques, including flume, weirs, and flow conditioning for pipe meters, 2) recommendations onimprovements in surface irrigation layouts, including use of SRFR software developed under another CRISproject at the lab, 3) recommendations on the organization of the water users and the distribution systemlayout, and 4)recommendations on separating sources of drainage water to avoid water quality problems inthe Murray River.
Drs. Bautista and Replogle assisted the Lahontan Conservation District and the NRCS with rehabilitationpriorities for water conservation in the Newlands Project, Fallon, NV.

38
PROJECT SUMMARY
Population growth and water shortages will increase the need to use treated wastewater effluent forirrigation, particularly in areas where fresh water resources are limited. However, there are seriousconcerns about the transmission of pathogens and toxic chemicals from municipal and animalwastewater to agricultural land and crops and thus to human food and to groundwater. An increasein foodborne disease in the US has been attributed in part to the transmission of pathogens in thewater used for irrigation of edible crops. Furthermore, there is limited knowledge on the long-termeffects of irrigation with sewage effluent on soil and underlying groundwater. Thus, the aim of thisresearch project is to assess the microbiological safety of wastewater irrigation of food crops andpotential environmental hazards in order to protect the public health and our future groundwaterresources. Molecular biology techniques will be used to evaluate pathogen survival, regrowth, andtransport in vegetated and non-vegetated soil columns, water distribution systems, and field siteswith a long history of wastewater application for crop irrigation. Studies will determine themovement of pathogens through the soil column as well as the factors affecting their survival andtransport. This could lead to the development of management strategies that would minimize theintroduction of pathogens into the environment and thus reduce the risk to human health.
OBJECTIVES
1. Determine the fate and transport of pathogens present in treated sewage using vegetated (grassand alfalfa) and non-vegetated soil columns irrigated at various efficiencies or flooded tosimulate artificial groundwater recharge conditions with chlorinated secondary sewage effluent.The columns will also be used to determine the fate of organic compounds, such aspharmaceuticals and pharmaceutically active chemicals and disinfection by products under acompanion project under National Program 201, Water Quality and Management (WastewaterIrrigation and Groundwater Recharge).
2. Determine if wastewater irrigation has an effect on groundwater quality by analyzing uppergroundwater samples below agricultural fields, urban irrigated areas (golf courses, parks,landscaping), and/or groundwater recharge areas with a long history of municipal wastewaterapplication for emerging microbial pathogens including but not limited to Escherichia coliO157:H7, Salmonella, and Campylobacter. The samples will also be analyzed forpharmaceuticals and other chemicals under a companion project.
3. Determine if bacterial pathogens present in treated sewage can regrow in conveyance systemsused to transport wastewater to fields for irrigation of fresh fruits and vegetables and conductlaboratory studies using a model system to determine the physical and chemical factors thatpromote/inhibit pathogen regrowth so that cost effective prevention strategies can be developed.
NEED FOR RESEARCH
Description of the problem to be solved
Increasing populations, finite water resources and increasingly stringent treatment requirements fordischarge of sewage effluent into surface water is increasing the need for water reuse practices in

39
the United States. However, due to recent foodborne outbreaks, public concern about the potentialhuman health risks and environmental consequences of water reuse in agriculture is increasing.Thus, research is needed to increase our current knowledge on the long-term effects of wastewaterirrigation on food, soil and underlying groundwater. In addition, the potential for pathogen regrowthin conveyance systems used to transport treated wastewater over long distances to the irrigated areasalso deserves attention. Furthermore, proper assessment of water reuse practices will requiremicrobial detection methods that are fast, sensitive and specific for pathogens of concern.Addressing these research needs will help assess the environmental and public health risksassociated with wastewater irrigation so that future problems of food, soil and groundwatercontamination can be anticipated or avoided.
Relevance to ARS National Program Action Plan
The research directly addresses national and global problems dealing with safety of food producedin fields that have been irrigated with treated sewage effluent or with effluent contaminated water.This project falls under National Program 108, Food Safety, Microbial Pathogens Component. Thereduction of microbial pathogens in food products also relates to reducing environmentalcontamination from animal (and human) waste. This project is related to objective 1.6.1.1 "Identifysources and reservoirs of pathogens relative to on-farm and environmental situations" bydetermining the fate of pathogens in wastewater applied as irrigation to crops.
Potential benefits expected from attaining objectives
Benefits from attaining the objectives include safe use of sewage effluents for irrigation from thestandpoint of food safety and groundwater protection. Water reuse will be more common and thepractices will be safer for public health.
Anticipated products of the research
Anticipated products of the research include (1) improved techniques of sewage treatment andsystem management for safe and sustainable water reuse with minimum adverse health effects andin environmentally acceptable ways, and (2) new guidelines for irrigation with wastewater toprotect groundwater and surface water quality and for control measures of pathogen regrowth inwater distribution systems.
Customers of the research and their involvement
Customers of the research include the public, farmers and farm workers, water planners andmanagers, government regulators, consulting engineers, water districts and municipalities,wastewater treatment plant operators and water managers.
SCIENTIFIC BACKGROUND
Municipal sewage effluent is becoming an increasingly significant water supply for irrigatedagriculture all over the world and could help reduce groundwater pumping as well as conserve waterin arid areas. In the United States, increasing demands on the nation’s water supplies have led to

40
reuse of wastewater following treatment (largely for nonpotable uses such as irrigation) particularlyin areas with limited water resources. For example, in the Northern Monterey County portion of theSalinas Valley, over 11,850 acres are being irrigated with tertiary wastewater effluent for theproduction of various crops including artichokes, head lettuce, celery, broccoli, and cauliflower(Israel, 2000). Many of these crops are washed and bagged for raw consumption in many parts ofthe country. In Bakersfield, California, approximately 5,100 acres of corn, alfalfa, cotton, barleyand sugar beets are being irrigated with more than 16.9 million gallons per day of primary andsecondary wastewater effluents. In Tallahassee, Florida, approximately 18 million gallons per dayof secondary effluent are being pumped through 8.5 miles of pipeline to irrigate 1,729 acres of foodcrops by spray irrigation. Although the use of wastewater for irrigation is increasing, the risks topublic health and the long-term effects on groundwater quality are largely unknown and deserveattention.
New foodborne pathogens are emerging in the U.S. and irrigation water has been identified as asource of contamination (Mead, 1997). During 1999, thirty three percent of the foodborne outbreaksreported were caused by fruits and vegetables such as apple cider, cantaloupe, lettuce and alfalfasprouts (Prier and Solnick, 2000) that had been irrigated with wastewater or water that had becomecontaminated. Recent outbreaks of foodborne illness have been associated with produce, includingE. coli O157:H7 in lettuce (Hilborn et al., 1999) and Cyclospora in imported raspberries. Theseoutbreaks together with the increase in wastewater irrigation practices have raised public concernregarding the safety of fresh fruits and vegetables (Meng and Doyle, 1997). In addition, there isgrowing concern about the long-term effects of wastewater irrigation on groundwater quality.Groundwater contamination with bacterial pathogens can occur by several routes including leakingsewer lines and land discharge by passage through soils and fissures. Groundwater supplies half ofthe nation’s drinking water and accounts for 37% of agricultural irrigation supporting many billionsof dollars worth of food production (USEPA, 1999). Thus, it is important to protect ourgroundwater resources from possible contamination through wastewater irrigation practices andartificial recharge of groundwater. This project will evaluate the safety of these practices to reducehuman health risks and ensure groundwater quality.
Municipal wastewater contains a variety of viral and bacterial pathogens (Table 1) that have beenexcreted in the feces of infected individuals. Some of the most common pathogens found in rawwastewater include Salmonella (Asano, 1998), Mycobacterium, Escherichia coli (Tsai et al., 1993;Grant et al., 1996), and Campylobacter jejuni (Jones, 2001). Hence, the use of reclaimed water forcrop irrigation requires pretreatment followed by disinfection in order to minimize the risk ofdisease transmission. However, wastewater treatment only reduces the amounts of pathogens infinished water and does not eradicate the disease agent (Asano, 1998). For example, it has beenreported that even though Campylobacter can be reduced during treatment to 99.9%, there are 1010
Campylobacters left in the treated effluent (Arimi et al., 1988). This is of great concern since theinfective dose of Campylobacter in humans is low (~500 cells). In fact, Campylobacter infectionsexceed those of previously most commonly reported enteric bacterial infections in the U.S. and itis the number one cause of all domestic foodborne illness (Okum, 2000). In addition,Campylobacters have been found in vegetables such as spinach, lettuce, and parsley (Kumar et al.,2001). Thus, the potential transmission of infectious disease by pathogenic agents is the mostcommon concern associated with nonpotable reuse of treated municipal wastewater.

41
Table 1. Some pathogens of concern in municipal wastewater and sewage sludge (U.S. EPA, 1989) Bacteria Viruses ProtozoaSalmonella spp. Hepatitis A CryptosporidiumShigella spp. Rotavirus Giardia lambliaCampylobacter jejuni Norwalk Agents Entamoeba histolyticaEscherichia coli Coxsackievirus Balantidium coliYersenia Echovirus Taxoplasma gondiiVibrio cholerae Reovirus
Wastewater containing pathogens can contaminate crops directly by contact during irrigation orindirectly as a result of soil contact. Therefore, it is essential that we understand the factors affectingthe quality of irrigation water as it leaves the treatment plant and during its transport to the fields.Current guidelines for unrestricted irrigation with effluents apply only to the effluent as it isdischarged from the sewage treatment plant and not as it leaves the distribution system. Studieshave shown that although the water may leave the treatment plant with a uniform level of quality,it has the potential to exhibit a highly variable pattern of water age and quality throughout adistribution system (LeChevallier et al., 1996; Volk et al., 1999). Clogging problems due tomicrobial growth have been reported for sprinkler and drip irrigation systems using reclaimedwastewater (Asano, 1998). Long residence times of water in a distribution system can have thefollowing negative effects; loss of disinfectant residual, formation of disinfection by-products,growth of biofilm colonies along pipe walls, and the protection and subsequent release of nuisanceand pathogenic microorganisms from the biofilm over time (Volk et al., 1999). Thus, there isgrowing concern about the potential for pathogen regrowth in the water distribution systemsparticularly where the effluent is transported over long distances to the irrigated areas (mostly withpipelines). A better understanding of the physical, chemical, and biological activities that occur indistribution systems will help minimize the health risks associated with the reuse of wastewater infood production (Raucher, 1996). The USDA’s food safety initiative calls for the development ofcost effective prevention strategies to reduce the incidence of foodborne illness. Hence, part of thisproject will involve the study of operational factors affecting pathogen regrowth in conveyancesystems to ensure that the quality of reclaimed water is not degraded prior to its use.
Proper assessment of water quality and reuse practices requires microbial detection methods that arefast, sensitive and specific for pathogens of concern since indicator microorganism are not adequatepredictors of treatment resistant pathogens. Chlorination is the disinfectant most commonly usedin wastewater treatment. It is now known that there are chlorine resistant microorganisms such asviruses (Metcalf et al., 1995) and protozoans (Steiner et al., 1997) that are not killed or inactivatedduring disinfection. In addition, chlorination can elicit a nutrient starvation and a reversible non-culturable (VBNC) state of coliform bacteria and other pathogens (Rockabrand et al., 1999). Thisaggravates the limitations posed by conventional cultivation techniques since VBNC pathogens willnot grow in laboratory media. Therefore, culture-based methods underestimate the fecal coliformcontent and do not possess the sensitivity required to detect low numbers of pathogens that exist inthe presence of high numbers of indigenous microorganisms in complex environmental samplessuch as water, manure or biofilms. Also, it is known that less than 1% of the bacterial population

42
from oligotrophic systems can be cultivated in the laboratory. Staley and Konopka (1985) havedescribed this phenomenon as “the great plate count anomaly”. Bacterial pathogens that are notdestroyed during treatment have the potential to multiply and become infective when the conditionsbecome favorable and should not go undetected.
Recent advances in recombinant DNA technology provide new tools to rapidly detect specificpathogens in the environment and thus, overcome the limitations of culture-based methods (Metcalfet al., 1995; Relman, 1998). Molecular techniques allow the direct identification of targetedfoodborne pathogens such as Escherichia coli O157:H7 (Meng and Doyle, 1997) fromenvironmental samples and can detect bacteria that are in a viable but non-culturable (VBNC) state.These methods have superior sensitivity to that of cell cultivation. PCR methods have the abilityto detect up to one bacterial cell in a sample, they can detect the VBNC bacteria, and whenamplifying mRNA (by an RNA PCR), they can distinguish live cells from dead cells. However, theability to detect specific pathogens of concern from environmental samples presents a challenge toenvironmental microbiologists because of low DNA recovery rates and the presence of inhibitorysubstances such as humic acids in environmental matrices. The lead scientist has successfullystudied environmental microbial communities using PCR and gene probes. In a study conductedin collaboration with New Mexico State University and the U.S. Environmental Protection Agency(ORD/NRMRL/SPRD), shifts in microbial communities were detected in samples taken from acontaminated aquifer. The data demonstrated that the aquifer contained a diverse microbialcommunity, which had not been previously identified using conventional cultivation methods(Duran, submitted). Two of the organisms that were identified by molecular methods were laterisolated in pure culture. However, the organism identified as archaeabacteria could not grow onlaboratory media possibly because this is a novel organism and not much is known about itsmetabolism to allow synthesis of proper growth media. Another possible explanation is that thisorganism is a synthrophic archeabacteria meaning that it cannot grow without the association ofother bacteria and thereby cannot be isolated nor identified by culture-based techniques. The leadscientist also conducted a project in collaboration with the U.S. Environmental Protection Agencyand the U.S. Department of Agriculture, Forest Service, to study the effectiveness of a restoredriparian buffer zone to attenuate nitrogen inputs from agricultural practices using molecularmethodology. Soil samples were collected from the restoration site and DNA was extracted andpurified. Denitrifying bacteria were then identified through the detection of the nirS and nirU typenitrite reductase genes using the PCR technique (Duran, 2001). Thus, once the challenges of DNAisolation and recovery are overcome, PCR techniques and gene probe methodologies can providea powerful and sensitive option for detection of microorganisms in environmental samples and willbe the method of choice for this project.
Other related CRIS projects:
A CRIS search of active projects on animal manure and wastewater irrigation identified 22 projects,of which two are from this research unit. CRIS projects of relevance to this research include aproject by the Western Regional Research Center in Albany, CA (#5325-42-000-023-00D) dealingwith treatment of animal manure to prevent pathogen transmission and to gain a better understandingof pathogen ecology in agricultural settings. Another related project is being conducted by the U.S.Meat Animal Research Center in Clay Center, NE (#5438-42000-006-00D) dealing with theprevention of zoonotic pathogen transmission from animal manure to human food. Both of these

43
research projects are similar to my proposed research in that they use a molecular biology approachfor the detection and identification of specific pathogens including Campylobacter fromenvironmental samples; however, they are addressing potential contamination through animal wasterather than municipal waste used for agriculture. Another related project is being conducted by ARSin Athens, Georgia (#6612-13610-002-09R, “Subsurface transport of Cryptosporidium and Giardiafrom grazing lands to drinking water supplies”) to help understand the transport of pathogens in thesubsurface to a stream, however it uses polystyrene microsphere in place of the pathogens. Aproject by the University of California, Riverside, (CRIS #5310-42000-001-02S) includes the fateand transport of pathogenic microorganisms in surface water, groundwater and the atmosphere fromanimal waste (beef or poultry) products. Also, a CRIS project (5344-42000-013-00D) is beingconducted in my research unit as a companion study to my proposed project. This study addressesthe fate and transport of organic chemical present in wastewater used for irrigation includingendocrine disruptors. In addition, CRIS #4344-42000-13-01S by Arizona State University is beingconducted within my laboratory to see if pharmaceutically-active compounds present in wastewatercan pose a threat to groundwater quality.
Several CSREES projects were identified that are considered complimentary to the researchproposed herein. However, some of these projects may no longer be active. CSREES # 96-35102-3839 “Role of subsurface drainage in transport of Cryptosporidium parvum oocysts” conducted byCornell University, Ithaca, NY addresses the transport of Cryptosporidium in the subsurface throughpreferential flow paths in the soil. CSREES #ARZT-319650-G-21-512 “Role of irrigation water incontamination of imported and domestic fresh food” is a project using wastewater irrigationconducted by the University of Arizona, Tucson. The irrigation waters from canals used for cropirrigation were assessed for the presence of pathogens, however the impact of irrigation ongroundwater quality was not addressed. CSREES #PEN03571 “Wastewater irrigated forests fortimber and wildlife” conducted by Pennsylvania State University uses municipal wastewater asirrigation to study abundance and distribution of plant communities.
APPROACH AND PROCEDURES
Experimental Design
Objective 1 - Soil Column Studies
The main purpose of this study is to assess the safety of water reuse practices, mostly for urban andagricultural irrigation, so that the risk to human health and groundwater contamination areminimized. Ten soil columns in 8 ft long x 1 ft wide stainless steel pipes were set up in a greenhouseat the U.S. Water Conservation Laboratory to study the movement of pathogens in systemsinvolving irrigation with sewage effluent, artificial recharge with sewage effluent, and recharge andirrigation with Colorado River water. The columns were filled with a sandy loam from theMcMicken Flood Control reservoir northwest of the City of Surprise. This is a desert soil in theMohall-Laveen Association that has had no agricultural use. The hydraulic conductivity of the soilwas determined with a laboratory permeameter test as 280 mm/day, using a disturbed sample. Toavoid particle segregation, the soil was placed in the columns in air-dry condition followed bycompaction with a rod. The effects of different infiltration rates and recharge conditions on thesurvival and transport of pathogens and effects on groundwater quality will be determined in the soil

44
columns. Because of space and other physical limitations, only ten columns could be set up. Thus,the schedule in Table 2 was developed so as to include as many different treatments as possible,including different crop and soil conditions (legume, non-legume, and bare soil), different modesof water application (irrigation and recharge), different irrigation efficiencies, and different sourcesof water (effluent and Colorado River water). Initially, there will be no replications since variabilityissues theoretically do not exist in these engineered columns. In addition, this orientation-type studywill permit us to maximize the use of the columns and obtain the maximum information that willallow the observation of trends, particularly with regard to the different irrigation efficiencies, whichhave not been previously published. However, depending on the results, replicate treatments maybe used in the future to firm up some of the conclusions. The irrigation efficiencies in Table 2 willbe determined as ET divided by amount of water applied and expressed as a percentage. ET willbe calculated from the weight loss of the column as measured with load cells on which the columnsare resting. Estimates of irrigation efficiency will also be obtained from EC values of irrigationwater and leachate. Table 2. Schedule of irrigation and recharge studies for soil columns in the greenhouse Column # Cover Irrigation Efficiency Water Source1 grass 50% Effluent2 grass 70% Effluent3 grass 90% Effluent4 alfalfa 50% Effluent5 alfalfa 70% Effluent6 alfalfa 90% Effluent7 bare soil 70% Effluent8 grass 70% Colorado River Water9 bare soil recharge mode Effluent10 bare soil recharge mode Colorado River Water
The sewage effluent to be used in the column studies will be representative of typical wastewatertreatment for non-potable uses such as irrigation of crops, parks, playgrounds, golf courses andresidential yards. The effluent should have, as a minimum, primary and secondary treatmentfollowed by chlorination. Also the effluent should primarily be of residential origin with not muchindustrial input. The Goodyear and Tolleson wastewater treatment plants in Arizona meet theserequirements. However, since the soil columns will also be used in a companion project to studythe transport of organic chemicals including pharmaceuticals, sewage effluents from bothwastewater treatment plants were collected and sent to Dr. David L. Sedlak’s laboratory of the Civiland Environmental Engineering Department at the University of California at Berkeley for analysisof pharmaceuticals. The results demonstrated that very low concentrations of pharmaceuticals werepresent in the Goodyear effluent while the Tolleson effluent contained concentrations that weremore in line with typical values (Table 3). Hence, sewage effluent from the Tolleson wastewatertreatment plant will be used in the column studies. Colorado River water will also be used as acomparison to wastewater irrigation.

45
Table 3. Concentrations of selected pharmaceuticals in the Goodyear and Tolleson effluent Pharmaceuticals Concentrations
Goodyear TollesonIbuprofen 17 ng/L 247 ng/LNaproxen 22 ng/L 699 ng/LIndomethacine <3 ng/L 55 ng/LMetoprolol 20 ng/L 133 ng/L
The sewage effluent and drainage water from the columns will be analyzed for selected pathogensincluding but not limited to E. coli O157:H7, Campylobacter, and Salmonella. Once we determinewhich pathogens present the greatest risk to groundwater, the columns will be sampled at differentdepths including the root zone of vegetated columns to obtain detailed pathogen transport data. Allmicrobiological analysis will be carried out by polymerase chain reaction (PCR) technology and/orgene probe methodology using published detection sequences specific for the pathogens of concern.
Sampling of sewage effluent and DNA extraction will be carried out using a protocol by Smalla(1995) with minor modifications. All water samples will be concentrated in Sterivex filters(Millipore) and DNA extraction will take place inside the filters followed by ethanol precipitation.Preliminary results for wastewater sampling and DNA recovery have resulted in good yield of highquality DNA as determined by spectral analysis (Table 4). DNA extraction from soil and rootsamples will be carried out using a modified bead-mill procedure (More et al., 1994; Van Elsas andSmalla, 1995). All community DNA will be purified using a glass milk purification kit (Bio 101)and will be subjected to PCR tests to assess the presence of specific pathogens using publishedprimer sequences (Table 5). Real-time PCR will be performed using a GeneAmp 5700 (PerkinElmer) and should allow for the enumeration of pathogens originally present in the sample. Thisinformation together with the infective dose (Kowal, 1985) of the organisms can be valuable fordetermining if the pathogens are present in significant numbers to cause a human health risk. Allprocedures will be optimized in the laboratory using DNA from stock organisms that will bepurchased from the American Type Culture Collection (ATCC). Positive and negative controls willbe included in each sample analysis. The positive control will contain DNA from the ATCC stockorganisms and the negative control will contain distilled water. General PCR practices will befollowed to avoid contamination of the samples and non-specific amplification (Griffin and Griffin,1994). Separate areas in the laboratory will be devoted to sample processing, nucleic acidpurification, PCR mixture preparation, and examination of PCR products. All laboratory surfacesand equipment will be cleaned with 90% ethanol and/or 10% bleach. In addition, aerosol filterpipette tips will be used. If non-specific amplifications (false positives) are observed through thedissociation profiles or upon agarose gel electrophoresis, the AmpErase uracil-N-glycosylase (UNG)(Applied Biosystems) will be used to remove previously amplified copies and preventreamplification of carryover PCR products. When gene probes are used, the Southern blotprocedure will be followed as detailed in Ausubel et al. (1999). Southern blotting is a technique foridentifying a DNA sequence by providing a chemiluminescent complimentary probe that binds toit. Thus, hybridization and colorimetric detection of bound probe will be performed using the DIGNucleic Acid Detection Kit (Roche).

46
Table 4. DNA yield from wastewater effluent samples and soil column drainage Sample DNA concentration Tolleson effluent 58.5 µg/mlSewage effluent from top of the column 24.9 µg/mlSewage effluent from bottom of the column 34.9 µg/ml
Table 5. List of pathogens and their PCR-target sites Pathogens PCR-Target sites ReferencesE. coli O157:H7 Shiga-like toxin gene (sltI-sltII) Gannon et al., 1997
eaeA gene Oberst et al., 1998
Campylobacter jejuni Flagellin gene (flaA-flaB) Kirk and Rowe, 199416S rRNA gene Waage et al., 1999
Salmonella phoP, H-li and Hin genes Way et al., 1993Wang, et al., 1997
Contingencies
This research relies on cooperation with the City of Tolleson to obtain wastewater. If this fallsthrough, another source of wastewater can easily be found. Arrangements were made with theCentral Arizona Water Conservation District to obtain Colorado River water from the CentralArizona Project (CAP) Aqueduct at a point where the canal has 100% Colorado River water througha companion project, if this falls through, we can collect water from the Colorado River or changeto a different water source.
Collaborations
Necessary (within ARS); collaboration with research hydraulic engineer, Herman Bouwer, at theU.S. Water Conservation Laboratory is required for the set up and operation of the columns, asdescribed in his Project Plan under National Program 201.
Objective 2 - Field Studies
Studies to investigate the potential detrimental effects of animal wastes released into theenvironment on groundwater quality have recently been conducted. However, the effects ofmunicipal wastewater irrigation on underlying groundwater quality have not been addressed anddeserve attention. For example, Cho and Kim (2000) have studied the effects of livestockwastewater on underlying groundwater quality and found that the increase in bacterial-communitydiversity in the contaminated aquifer was probably due to the infiltration of livestock wastewater.

47
Also, Chee-Sanford et al. (2001) examined two swine farm lagoons and found the presence oftetracycline resistance determinants in the underlying groundwater, which could be detected as faras 250 meters downstream from the lagoons. Thus, the purpose of this objective will be to evaluatelaboratory-derived results under natural field conditions in order to better understand microbialtransport behavior in the subsurface and evaluate the effects of wastewater irrigation on groundwaterquality. It is imperative that we combine both laboratory and field studies because although columnstudies provide a greater degree of control, they cannot account for the many factors that controlmicrobial mobility in situ such as hydrological characteristics of the aquifer, preferential flow,predation, motility, lysis, changes in cell size in response to alterations in nutrient conditions, sporeformation, and attachment to soil surfaces. Sites will be selected on the basis of depth togroundwater (preferably shallow), availability of wells that pump primarily upper groundwater, andcooperation with farmers, irrigation districts, and municipalities. Two potential field sites inPhoenix, Arizona, are currently being evaluated based on the criteria described above. One of thesesites is the Buckeye Irrigation District, which uses approximately 30,000 acre-feet per year of treatedsewage effluent produced by the 91st Avenue Wastewater Treatment Plant for the irrigation of crops.The other site is the Roosevelt Irrigation District, which uses 33,000 acre-feet per year of treatedsewage effluent produced by the 23rd Avenue Wastewater Treatment Plant for the irrigation of ediblefood crops such as vegetables and melons. Experiments will be designed to determine if there aresignificant differences in the microbiological quality of groundwater at existing groundwaterrecharge sites and below agricultural fields where wastewater irrigation has been conducted overlong periods of time compared to selected control sites. Monitoring wells previously installed bythe USGS to sample for pesticides and industrial chemicals will be evaluated for the use ofmicrobiological sampling. At least two to three well volumes will be flushed prior to collectinggroundwater samples (in duplicate) for microbiological and geochemical analysis. Care will betaken to conserve the integrity of the samples collected and to prevent microbial contaminationduring sampling. Autoclaved glass bottles will be used and filled all the way to the top to avoid anyheadspace. The groundwater samples will be chilled immediately after collection and will betransported to the laboratory on ice where they will undergo analysis for microbial pathogens usingprocedures described for sewage effluent in objective 1. Geochemical measurements will also beconducted. In the event that we require concentration of bacteria prior to nucleic acid analyses, wewill use a hollow-fiber, tangential-flow filtration system described by Kuwabara and Harvey (1990).
Contingencies
Arrangements will be made with irrigation districts, municipalities, and landowners to permitsampling water from existing wells. There is enough interest in the effect of sewage irrigation ongroundwater quality that adequate cooperation should not be a problem.
Collaboration
S Necessary (within ARS); collaboration with research hydraulic engineer, Herman Bouwer, atthe U.S. Water Conservation Laboratory is required for site characterization and selection offield sites.

48
S Necessary (external to ARS); collaboration with the U.S. Geological Survey (USGS) is beingdeveloped to use their existing monitoring wells at various field sites through a companionproject.
Objective 3 - Pathogen Regrowth
Research projects on pathogen regrowth have been conducted primarily for drinking waterdistribution systems (Le Chavallier et al, 1996). However, the potential for pathogen regrowth inconveyance systems used to transport sewage effluent from wastewater treatment plants toagricultural fields has not been addressed, possibly because this is a growing practice and it has notbeen given much thought. Thus, our objective will be to conduct field and laboratory experimentsto study pathogen regrowth in wastewater distribution systems and to evaluate the factors that leadto deterioration of water quality during its transport. In addition, recommendations for the controlof wastewater quality in the distribution systems will be made in order to avoid possible directcontamination of crops. Initially, we will examine only one field site but we are hopeful that thisproject will generate interest among the research community and regulatory agencies to expand thisproject in the future to evaluate other sites. Several factors will be considered in the selection of ourfield site, including the length of the conveyance system (>5 miles), types of crops produced(preferably fresh vegetables), and accessibility of monitoring data and sampling sites. Field datawill be collected and recorded at the time of each sampling (once a week) and will include theplant’s effluent production, water temperature, turbidity, pH, and disinfectant residual. Watersamples (in triplicate) will also be collected from three different locations, at the plant effluent, atmidpoint in the distribution system, and at the end of the distribution system. The water sampleswill be transported on ice to the laboratory where they will be subjected to molecularcharacterization of bacterial pathogens following DNA extraction and PCR procedures describedin objective 1. In addition, total coliform and E. coli enumerations will be performed using themembrane filter method with m-Endo media following standard procedures (AWWA, 1999). Datafrom this study will be used to evaluate whether the number of bacteria (pathogens) in the effluentincreases as it is transported from the treatment plant to the irrigated fields and to examine if thereis a relationship between pathogen regrowth and any chemical, physical or biological parameters.
The purpose of the laboratory studies will be to investigate the chemical, physical and operationalfactors that influence the regrowth of pathogens in a distribution system through use of a bench scalemodel (annular reactor, BioSurface Technologies Corp.). We have chosen to use of an annularreactor as a model because it is a simple and economic simulated distribution system that hasbecome the system of choice for monitoring biological fouling, regrowth, and biocorrosion indrinking water systems at bench scale (Camper et al., 1998; Characklis et al, 1998). In addition, itsoperational controls will allow us to model parameters observed in our real-time distribution systemwhile carrying out experiments under controlled conditions that are difficult to control in the field.The annular reactor contains an inner cylinder whose rotational speed can be adjusted to provideliquid/surface shear and transport conditions similar to that of real-time water distribution systems.It also permits the control of temperature and residence time of the water and is suitable for workwith pathogenic microorganisms. In this study, we will monitor water quality and bacterial regrowthby sampling the annular reactor’s influent and effluent using sterile tubes. Sampling will take placeweekly for approximately 8 weeks to allow for biofilm formation. The samples collected willundergo the same type of analysis as for the field samples. In addition, the annular reactor contains

49
detachable coupons (slides), which will permit the monitoring of coliforms and selected pathogensthat may be present in the biofilms throughout the experiment. Two slides will be removed fromthe reactor and replaced with sterile slides to determine reproducibility of results. A series ofexperiments will be carried out to test the effects of temperature, nutrient levels (carbon andphosphorus availability), and/or disinfection residual on water quality. Information from this studywill be used to make recommendations for sewage treatment and conveyance strategies that useparameters observed in the field so that they can be applicable to the real-time distribution systemunder study. Overall, this research will help ensure the absence of pathogens in irrigation water andhence, safety of the food produced.
Contingencies
The research relies on cooperation with local municipalities to obtain wastewater. Arrangementswill be made with wastewater irrigation projects to permit sampling water from conveyance systemsand provide treatment plant monitoring data.
Collaborations
Necessary (within ARS): collaboration with research hydraulic engineer, Herman Bouwer, at theU.S. Water Conservation Laboratory is required for site characterization and selection of field sites.
Necessary (external to ARS): none
Physical and Human Resources:
The wastewater irrigation group addressing the microbial aspects of the study consists of amicrobiologist (100%) and one technician. Physical resources include 300 sq feet of lab space forthe microbiologist and a dedicated greenhouse for the soil columns. The microbiology laboratoryis equipped with a 5700 GeneAmp (PE Appliedbiosystems) for real-time PCR and an imagingsystem (Biorad) for chemiluminescent detection of gene probe hybridizations. There is also generallaboratory support including a water quality chemistry lab, a soils lab, and a machine shop. Supportfor the column studies is also provided by a research hydraulic engineer in a related project andadditional labor through a cooperative agreement with Arizona State University. Field facilitiesinclude municipal sewage treatment plants and sewage irrigated fields in Arizona and California inaddition to shallow wells for sampling the upper groundwater in sewage irrigated areas west ofPhoenix, Arizona.
MILESTONES AND OUTCOMES
By the end of FY2002, the initial screening of pathogens in sewage and column effluents will becompleted and should determine the presence of specific pathogens of highest concern togroundwater contamination. By the end of FY2003, we expect results regarding the fate andtransport of pathogens from field studies as well as the completion of pathogen regrowth assessmentin distribution systems. Studies on the effects of irrigation and groundwater recharge with sewageeffluent will continue until dynamic equilibrium or end conditions are reached. If adverse effectsare observed, procedures for mitigating these effects will be developed and tested on the columnsby FY2004 (Table 5).
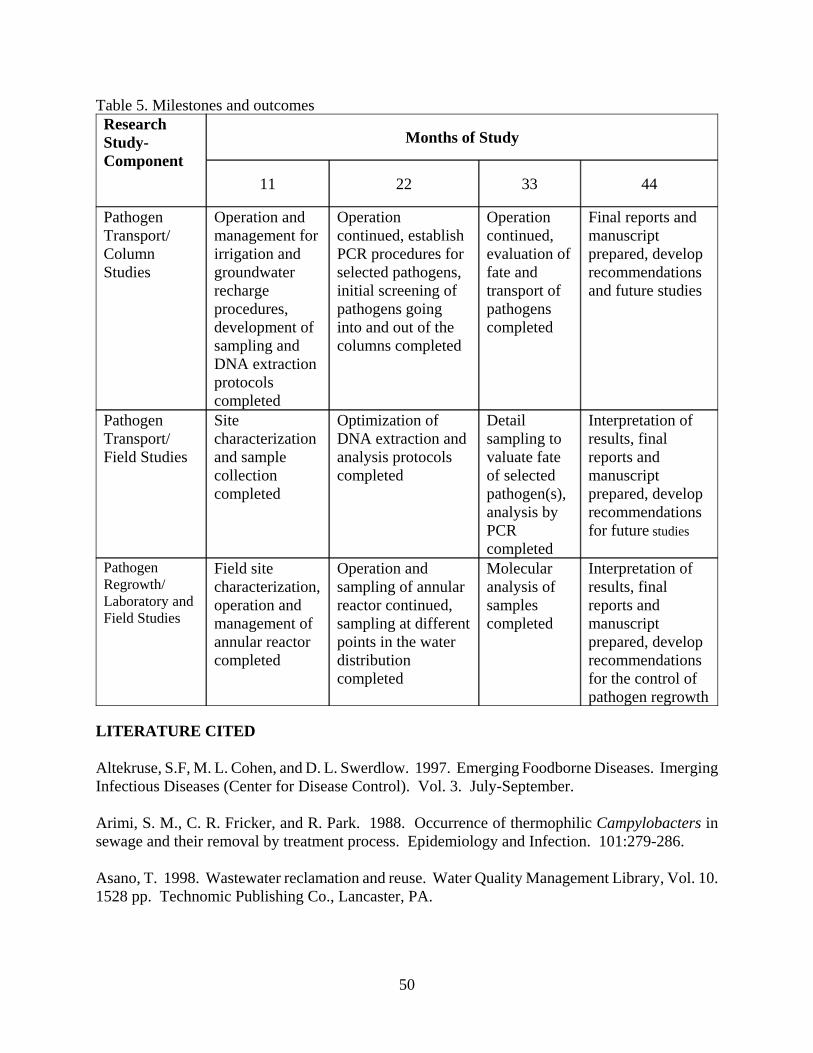
50
Table 5. Milestones and outcomes ResearchStudy-Component
Months of Study
11 22 33 44
PathogenTransport/ColumnStudies
Operation andmanagement forirrigation andgroundwaterrechargeprocedures,development ofsampling andDNA extractionprotocolscompleted
Operationcontinued, establishPCR procedures forselected pathogens,initial screening ofpathogens goinginto and out of thecolumns completed
Operationcontinued,evaluation offate andtransport ofpathogenscompleted
Final reports andmanuscriptprepared, developrecommendationsand future studies
PathogenTransport/Field Studies
Sitecharacterizationand samplecollectioncompleted
Optimization ofDNA extraction andanalysis protocolscompleted
Detailsampling tovaluate fateof selectedpathogen(s),analysis byPCRcompleted
Interpretation ofresults, finalreports andmanuscriptprepared, developrecommendationsfor future studies
PathogenRegrowth/Laboratory andField Studies
Field sitecharacterization,operation andmanagement ofannular reactorcompleted
Operation andsampling of annularreactor continued,sampling at differentpoints in the waterdistributioncompleted
Molecularanalysis ofsamplescompleted
Interpretation ofresults, finalreports andmanuscriptprepared, developrecommendationsfor the control ofpathogen regrowth
LITERATURE CITED
Altekruse, S.F, M. L. Cohen, and D. L. Swerdlow. 1997. Emerging Foodborne Diseases. ImergingInfectious Diseases (Center for Disease Control). Vol. 3. July-September.
Arimi, S. M., C. R. Fricker, and R. Park. 1988. Occurrence of thermophilic Campylobacters insewage and their removal by treatment process. Epidemiology and Infection. 101:279-286.
Asano, T. 1998. Wastewater reclamation and reuse. Water Quality Management Library, Vol. 10.1528 pp. Technomic Publishing Co., Lancaster, PA.

51
Ausubel, F, ed et al. Short protocols in molecular biology. 1999. Fourth edition, John Wiley, NewYork.
Camper, A. K., M. Warnecke, W. L. Jones, and G. A. McFeters. 1998. Pathogens in ModelDistribution System Biofilms. American Water Works Association, Research Foundation(AWWARF), Research News, Project #936.
Characklis, W. G. 1998. Bacterial Regrowth in Distribution Systems. American Water WorksAssociation, Research Foundation (AWWARF), Research News, Order #90532.
Chee-Sanford, J. C., R. I. Aminov, I. J. Krapac, N. Garrigues-Jeanjean, and R. I. Mackei. 2001.Occurrence and diversity of tetracycline resistance genes in lagoons and groundwater underlyingtwo swine production facilities. Appl. Environ. Microbiol. 67:1494-1502.
Cho, J. and S. Kim. 2000. Increase in bacterial community diversity in subsurface aquifersreceiving livestock wastewater input. Appl. Environ. Microbiol. 66:956-965.
Duran, N. L., K. A. Urich, and G.W. Sewell. 2001. Effects of aldicarb and atrazine on microbialcommunity structure and denitrification potential of soils from a riparian buffer restoration site.Proceedings of the 101st American Society for Microbiology. Abstract 174/Q.
Duran, N. L., T. May, and G. B. Smith, G. W. Sewell. 2001. Community structure analyses andeffects of metabolic inhibitors of CFC-11 degrading subsurface enrichment cultures. Submitted toApplied and Environmental Microbiology.
Gannon, V. P., S. D’souza, T. Graham, and R. K. King. 1997. Specific identification of Escherichiacoli O157:H7 using a multiplex PCR assay. Adv. Exp. Med. Biol. 412:81-82.
Grant, S. B., C. P. Pendroy, C. L. Mayer, J. K. Bellin, and C. J. Palmer. 1996. Prevalence ofEnterohemorrhagic Escherichia coli in Raw and Treated Municipal Sewage. Appl. Environ.Microbiol. 62:3466-3469.
Griffin, H. G. and A. M. Griffin (Ed). 1994. PCR Technology: Current Innovations. CRC Press,New York.
Hilborn, D. H. et al. 1999. A multistate outbreak of Escherichia coli O157:H7 infections associatedwith consumption of mesclun lettuce. Arch Intern Med. 159:1758-1764.
Israel, Kieth. 2000. Monterey County Water Recycling Projects – over 27 Gigalitres sold! WaterRecycling Australia. PJ. Dillon (ed.) CSIRO & AWA ISBN 0643060839.
Jones, K. 2001. Campylobacters in water, sewage and the environment. Journal of AppliedMicrobiology. 90:68S-79S.
Kirk, R., and M. T. Rowe. 1994. A PCR assay for the detection of Campylobacter jejuni andCampylobacter coli in water. Lett. Appl. Microbiol. 19:301-303.

52
Kowal, N. E. 1985. Health effects of land application of municipal sludge. Health Effects ResearchLaboratory, US EPA, Cincinnati, OH. EPA/600/1-85/015.
Kumar, A., R. K. Agarwal, K. N. Bhilegaonkar, B. R. Shome, and V. N. Bachhil. 2001. Occurrenceof Campylobacter jejuni in vegetables. Inter. J. of Food Microbiol. 67:153-155.
Kuwabara, J. S., and R. W. Harvey. 1990. Application of a hollow-fiber, tangential-flow devicefor sampling suspended bacteria and particles from natural waters. J. Environ. Qual. 19:625-629.
LeChevallier, M. W., N. J. Welch, and D.B. Smith. 1996. Full-scale studies of factors related tocoliform regrowth in drinking water. Appl. Envir. Microbiol. 62: 2201-2211
Lim, R., S. Gale, C. Doyle, B. Lesjean, and M. Gibert. 2000. Endocrine disrupting compounds insewage treatment plant (STP) effluent reused in agriculture – is there a concern? P. 23-28. P.J.Dillon (Ed). Proc.1st Symposium, Water Recycling Australia.
McDonaough, P. L., C. A. Rossiter, R. B. Rebhun et al. 2000. Prevalence of Escherichia coliO157:H7 from Cull Dairy Cows in New York State and Comparison of Culture Methods Usedduring Preharvest Food Safety Investigations. J. Clinical Microbiol. 38:318-322.
Mead, P.S., et al. 1997. Food-Related Illness and Death in the United States. Emerging InfectiousDiseases (Center for Disease Control). Vol.5 No.5.
Meng, J. and M. P. Doyle. 1997. Emerging issues in microbiological food safety. Annu. Rev. Nutr.17:255-275.
Metcalf, T. G., J. L. Melnick, and M. K. Estes. 1995. Environmental Virology: From detection ofVirus in sewage and water by isolation to identification by molecular biology- A trip of over 50years. Annu. Rev. Microbiol. 49:461-487.
More, M. I, J. B. Herrick, M. C. Silva, W. C. Ghiorse, and E. L. Madsen. 1994. Quantitative CellLysis of Indigenous Microorganisms and Rapid Extraction of Microbial DNA from Sediment. Appl.Environ. Microbiol. 60:1572-1580.
Okun, D. A. 2000. Water reclamation and unrestricted nonpotable reuse: A new tool in urbanwater management. Annu. Rev. Public Health. 21:223-45.
Prier, R. and J.V. Solnick. 2000. Foodborne and waterborne infectious diseases. Postgrad Med.107(4):245-255.
Raucher, R. S. 1996. Public health and regulatory considerations of the safe drinking water act.Annu. Rev. Public Health 17:179-202.
Relman, D. A. 1998. Detection and identification of previously unrecognized microbial pathogens.Emerging Infectious Diseases, Special Issue. 4:July-September.

53
Rockabrand, D., T. Austin, R. Kaiser, and P. Blum. 1999. Bacterial growth state distinguished bysingle-cell protein profiling: Does chlorination kill coliforms in municipal effluent? Appl. Environ.Microbiol. 65:4181-4188.
Smalla, K. 1995. Extraction of microbial DNA from sewage and manure slurries. In. Akkermans,A. D. L., J. D. van Elsas, F. J. de Bruijn. Kluwer (eds.), Molecular Microbial Ecology Manual1.5.1:1-17. Academic Publisher, Boston MA.
Staley, J. T., and A. Konopka. 1985. Measurement of in situ activities of nonphotosyntheticmicroorganisms in aquatic and terrestrial habitats. Annu. Rev. Microbiol. 39:321-346.
Standard Methods for the Examination of Water and Wastewater. 1999. 20th Edition, AWWA.
Steiner, T. S., N. M. Theilman, and R. L. Guerrant. 1997. Protozoal Agents: What are the dangersof public water supply. Annu. Rev. Med. 48:329-40.
Tsai, Y., C. J. Palmer, and L. R. Sangermano. 1993. Detection of Escherichia coli in Sewage andSludge by Polymerase Chain Reaction. Appl. Environ. Microbiol. 59:353-357.
US EPA, 1989. Environmental regulations and technology-control of pathogens in municipalwastewater sludge, EPA Pub. No. 625/10-89/006, Center for Environmental Research Information,Cincinnati, OH 45268.
US EPA. 1999. Safe Drinking Water Act Section 1429 Groundwater Report to Congress. EPA-816-R-99-016. Office of Water (4606), Washington, D.C.
Van Elsas, J.D. and K. Smalla. 1995. Extraction of microbial community DNA from soils. In.Akkermans, A. D. L., J. D. van Elsas, F. J. de Bruijn. Kluwer (eds.), Molecular Microbial EcologyManual 1.5.1:1-17. Academic Publisher, Boston MA.
Volk, Christian J. and Mark W. LeChevallier. 1999. Impacts of the Reduction of Nutrient Levelson Bacterial Water Quality in Distribution Systems. Appl. Envir. Microbiol. 65: 4957-4966.
Waage, A. S., T. Vardund, V. Lund, and G. Kapperud. 1999. Detection of small numbers ofCampylobacter jejuni and Campylobacter coli cells in environmental water, sewage and foodsamples by a seminested PCR assay.
Wang, R., W. Cao, and C. Cerniglia. 1997. Universal protocol for PCR detection of 13 species offoodborne pathogens in foods. J. App. Micro. 83:727-736.
Way, J. S., K. L. Josephson, S. D. Pillai, M. Abbaszadegan, C. P. Gerba and I.L. Pepper. 1993.Specific detection of Salmonella spp. by multiplex polymerase chain reaction. Appl. Environ.Microbiol. 59:1473-1479.


54
PROJECT SUMMARY
Using wastewater for groundwater recharge is an attractive way for seasonal storage and additionalwater quality improvement through soil-aquifer treatment. The efficacy of soil-aquifer treatmentfor removal of organic carbon including pharmaceutically active compounds will be studied withsoil columns in a greenhouse. Soil columns will also be used to study the fate of organic compoundsin soil where crops are irrigated with sewage effluent. Additionally, samples of the uppergroundwater below fields and urban areas (parks, golf courses, landscaping) with a long history ofsewage irrigation will be taken and tested for organic agricultural compounds and pathogens.
Long-term storage of water via artificial recharge of groundwater (water banking) in times of watersurplus provides a valuable source of water for use in times of water shortage. We plan to expandthe potential of this technology, which is now pretty well restricted to permeable soils, to finer-textured “challenging” soils that need to be managed to minimize reductions in infiltration rates dueto clogging.
OBJECTIVES
1. termine the fate of organic compounds, such as pharmaceuticals and pharmaceutically activechemicals and disinfection byproducts, in vegetated soil columns (grass and alfalfa) in agreenhouse irrigated at various efficiencies with chlorinated secondary sewage effluent. Thecolumns will also be used to determine fate of pathogens in sewage irrigated soil under acompanion project under National Program 208, Food Safety (Protecting Groundwater QualityBelow Waste-Water Irrigated Fields).
2. Analyze samples of the upper groundwater below agricultural fields and urban irrigated areas(golf courses, parks, landscaping) with a long history of sewage irrigation for pharmaceuticals,disinfection byproducts and other chemicals to evaluate effects of sewage irrigation ongroundwater quality. The samples will also be analyzed for pathogens under a companionproject.
3. Carry out field and laboratory research to develop optimum management procedures for basinsthat infiltrate secondary or tertiary sewage effluent for recharge of groundwater and waterquality improvement through soil-aquifer treatment. Focus will be on relatively fine-texturedsoils where clogging, crusting, and fine-particle movement can seriously reduce infiltrationrates, and hence, recharge capacities.
NEED FOR RESEARCH
Description of the Problem to be Solved
Increasing populations and finite water resources necessitate more water reuse (Asano, 1998;Bouwer, 1993 and 1999). Also, increasingly stringent treatment requirements for discharge ofsewage effluent into surface water make water reuse more attractive. The present focus in the U.S.is on sustainability of irrigation with sewage effluent and of soil-aquifer treatment, particularly the
55
long-term fate of synthetic organic compounds (including pharmaceutically active chemicals anddisinfection byproducts) in the underground environment (Lim et al., 2000; Bouwer, 2000; Drewesand Shore, 2001). The fate of pathogens and nitrogen also needs to be better understood. In ThirdWorld countries, simple, low-tech methods must be used to treat sewage for reuse. These methodsinclude lagooning, groundwater recharge, and intermittent sand filtration (Bouwer, 1993). Whilemost standards or guidelines for irrigation with sewage effluent focus on indicator organisms andpathogens, other water quality aspects must also be considered (Bouwer and Idelovitch, 1987).
Long-term effects of irrigation with sewage effluent on soil and underlying groundwater must bebetter understood so that future problems of soil and groundwater contamination can be avoided.Potential problems include accumulation of phosphate, metals, and strongly adsorbed organiccompounds to the soil matrix, and of salts, nitrate, toxic refractory organic compounds, andpathogenic microorganisms in groundwater. Water reuse for irrigation is a good practice, however,care should be taken to prevent deterioration of groundwater quality (Bouwer et al., 1999; Bouwer,2000). Typical concentrations of some potentially endocrine disrupting chemicals in sewage effluentare shown in Table 1, taken from Lim et al., (2000). Other pharmaceuticals such as lipid regulators,antiepileptics, analgesic/anti-inflammatory drugs, and antibiotics can also be present. Themicrobiological safety of water reuse is also an important issue, particularly when wastewater isused for the irrigation of fruits and vegetables that are eaten raw or brought raw into the kitchen, asdiscussed in a companion project under National Program 108. It is of utmost importance tounderstand the risks associated with wastewater used for irrigation and the factors affecting thedeterioration of wastewater effluent after it leaves the treatment plant. There is growing concernabout the potential for microbial regrowth in the conveyance /distribution systems where the effluentis transported over long distances to the irrigated areas (mostly with pipelines). The aim of thisresearch is to develop technology for optimum water reuse, to evaluate the role that groundwaterrecharge and soil-aquifer treatment can play in the potable and nonpotable use of sewage effluent(Bouwer, 1985) and to determine the safety of tertiary effluent used for irrigation of foods,particularly where effluent is transported for relatively long distances in pipes or open channelswhere regrowth of pathogens and other processes can occur.
Relevance to ARS National Program Action Plan
This research directly addresses national and global problems dealing with safety of food producedin fields that have been irrigated with sewage effluent or with effluent contaminated water. It alsoaddresses water conservation and integrated water management through water reuse. These issuesoccur or emerge in many parts of the U.S. and the rest of the world wherever there is not enoughwater to meet all demands for municipal, industrial, and agricultural (irrigation) purposes. Allobjectives fall under National Program 201, Water Quality and Management. Objectives 1 and 2fall under Problem Area 2.5 (Waste Water Reuse), Goal 2.5.3 (Waste Water Standards). Theyaddress water conservation and integrated water management through water reuse. Objective 3addresses Problem Area 2.3 (Water Conservation Management), Goal 2.3.1 (Water ConservationTechnologies).

56
Table 1. Typical concentrations of some EDCs in treated sewage effluent (Lim et al., 2000).
Secondary TertiaryCompound Treatment treatment
Estrogen (ng/L) 38 3
Testosterone (ng/L) 50 2
Estrone (ng/L) 1.4 - 76 1.8 - 3.6
17$-estradiol (ng/L) <5 - 10 2.7 - 6.3
Estriol (ng/L) <10 - 37
Ethyinylestradiol (ng/L) <0.2 <0.2
Nonyl-phenol (µg/L) <0.02 - 330
2,4-dichlorophenol (µg/L) 0.061 - 0.16
Alkylphenols (total)(µg/L) 27 - 98
Bisphenol A (µg/L) 0.02 - 0.05
Arsenic (µg/L) 1.3 - 23
Cadmium (µg/L) <0.02 - 150
Lead (µg/L) 0.1 - 44Sources: Shore et al. 1993a, Desbrow et al. 1998, Lee & Peart 1998, Blackburn & Waldock 1995, Rudel etal. 1998, Johns & McConchie 1995, Feigin et al. 1991, Bahri 1998.
Potential Benefits
Benefits from attaining the objectives include safe reuse of sewage effluents for irrigation from thestandpoint of food safety and groundwater quality protection. Control measures and actions oractivities that can be used to prevent, reduce, or eliminate the microbial and chemical food safetyhazard will be developed. Water reuse will be more common and the practices will be safer forpublic health. Such reuse will help in production of adequate food and fiber for growingpopulations.
Anticipated Products
1. Improved techniques of sewage treatment and system management for safe and sustainablewater reuse with minimum adverse effects and in environmentally acceptable ways.
2. New guidelines for irrigation with wastewater to protect groundwater and surface water quality.

57
3. New procedures for managing groundwater recharge basins to improve their effectiveness,especially where soils are relatively fine-textured.
Customers
Customers of the research include the public, farmers and farm workers, water planners andmanagers, government regulators, consulting engineers, water districts and municipalities,wastewater treatment plant operators and managers, and the turf, landscape, and golf-courseindustries.
SCIENTIFIC BACKGROUND
In groundwater recharge, the quality improvements obtained as the effluent water moves downwardthrough the vadose zone to underlying aquifers, and then through the aquifer to recovery wells forirrigation and/or potable use of the water are very important, as are the aesthetic aspects and publicacceptance of water reuse. The lead scientist has been at the U.S. Water Conservation Laboratoryfor more than 41 years where a greater part of his research has been devoted to artificial rechargeof groundwater, especially with sewage effluent. Field studies (Flushing Meadows and 23rd Avenueprojects), supported by EPA grants, were conducted in the period 1967-1985, as well as numerouslaboratory studies on soil columns, focusing on nitrogen transformations and virus transport. At thattime, the effluent recharge team consisted of two engineers, a soil chemist, a microbiologist, and fora short period a soil physicist. This work has been published in numerous articles in peer-reviewedjournals and book chapters (Bouwer et al., 1980; Bouwer et al., 1984; Bouwer and Rice; 1984) andhas put the U.S. Water Conservation at the forefront of institutions in artificial recharge ofgroundwater and water reuse. However, new concerns have risen over the years, includingsustainability issues, food safety issues involving the presence of pathogens in effluent directly usedfor irrigation, artificial recharge and soil aquifer treatment, trace organic compounds, andgroundwater quality issues (Lim et al., 2000; Drewes and Shore, 2001; Bouwer, 2000).
Concern is growing with regard to the refractory natural and synthetic organic materials present inthe sewage effluent, both for irrigation and potable use of the reclaimed water. Potable use normallyinvolves release and dilution in natural streams and rivers or a groundwater recharge cycle afterconventional primary and secondary sewage treatment. This is done for aesthetic and publicacceptance aspects (indirect potable use without toilet-to-tap connection) and for additional qualityimprovements of the water through soil-aquifer treatment (removal or reduction of suspended solids,nitrogen, phosphorus, synthetic and natural organic carbon compounds, metals, and pathogenicmicroorganisms). However, not all organic compounds are biodegradable or adsorbed, leaving aresidual or refractory total organic carbon concentration (TOC) of 2 to 5 mg/L (Bouwer, 1985).California guidelines for potable use of the water without additional treatments require that thisconcentration be reduced to less than 1 mg/L. This concentration can be achieved by treating theeffluent with activated carbon or membrane filtration before infiltration for groundwater recharge,or by blending with natural groundwater in the aquifer so that the wells yield a water with not morethan 1 mg/L of effluent TOC. Several studies have been conducted to identify the composition ofthe residual TOC (Bouwer et al., 1984; Drewes and Fox, 1999 and 2000; Schoenheinz et al., 2000).Typically, these show a wide spectrum of aliphatic and aromatic, halogenated and non-halogenated
58
compounds, almost all at about the parts per billion (ppb) level. In one study the pharmaceuticalclofibric acid was also found (Bouwer et al., 1982). However, perhaps less than 10% of the TOChas been characterized, and there is more concern about what is not known about the residual TOCthan what is known about it, even though two major health effects studies in California have notshown adverse health effects in populations where well water with less than 1 mg/L sewage TOCwas used for municipal water supply (Nellor et al., 1984; Sloss et al., 1996).
When effluent is used for irrigation, all the chemicals in the effluent, not taken up by the plants andnot biodegraded adsorbed or otherwise attenuated or immobilized in the root zone, are leached outof the root zone with the deep percolation water that is necessary to keep a salt balance in the rootzone (Bouwer, 2000). This deep percolation water can be produced by irrigation applications inexcess of evapotranspiration, or by natural rainfall. In dry climates, the volume of deep percolationwater will be considerably less than the irrigation water applied, so that the concentration of saltsand other chemicals not attenuated in the root zone will be higher than in the irrigation water. Indry climates, an irrigation efficiency of 80% would produce a deep percolation water with salts andother unattenuated chemicals concentrations that are five times those in the irrigation water. Forirrigation with sewage effluent the sewage chemicals of concern are salts and nitrates, natural andsynthetic organic compounds (including pharmaceutically active compounds), disinfection by-products (DBPs) including the potent carcinogen nitrosodimethyl amine (NDMA), and humic andfulvic acids that can act as DBP precursors when affected groundwater is pumped up again andchlorinated for potable use. Thus, it is important to study more about chemicals in deep percolationwater below sewage irrigated fields so that the potential long-term effects on groundwater can bebetter predicted and the sustainability of water reuse for irrigation can be better assessed. Membranefiltration of the effluent before irrigation, or of the underlying groundwater where needed for potableuse, may eventually become necessary. Irrigation efficiency may play a role in this because whilehigher concentrations of organic compounds in the deep percolation water may be undesirable, theycan also be an advantage if the concentrations become high enough to trigger enzyme expressionrequired for biodegradation by indigenous microorganisms. However, when sewage effluent is usedfor groundwater recharge, evaporation normally is negligible compared to infiltration, so thatconcentrations of refractory organic compounds are not increased which may keep them belowthreshold concentrations for enzyme expression and biodegradation by bacteria.
Where soils are fine-textured and limit the rate of recharge to groundwater, larger infiltration areasthat can be combined with wetlands or stream channels may be used to recharge the groundwater.This approach, however results in additional freshwater losses to evaporation and transpiration.Maintaining maximum recharge rates may help to improve the effectiveness of these systems andcould extend the benefits of artificial recharge of groundwater and long-term underground storage(water banking) to desert and agricultural areas where sands and other permeable soils are notavailable (Bouwer 1998). In general, groundwater recharge and soil-aquifer treatment (SAT)systems are fairly robust. From a practical standpoint, we want to avoid very tight soils, very coarsesoils, very shallow or very deep groundwater tables, low transmissivity aquifers, geochemicalincompatability between infiltrated water and aquifer, and situations with vadose zone orgroundwater pollution problems, or where the recharge will cause “unreasonable” harm to other landowners or users, such as land subsidence or damaging high groundwater levels.

59
A CRIS search of active projects on groundwater recharge identified 22 projects, of which 2 arefrom this research unit. A majority of the rest deal with natural recharge or return flows fromirrigation, and not with artificial recharge systems. Several project dealing with conjunctive use,primarily in the Great Plains, deal with issues that are closely related to this project. Of particularinterest is recharge along the South Platte River in Colorado. Conjunctive use is being studied thereby Colorado State University. Their results would likely have an impact on our assessment of thevalue of groundwater recharge. There are 9 CRIS projects on irrigation with wastewater, 2 of whichare at the U.S. Water Conservation Laboratory. The project at Mississippi State University withswine effluent is of interest to the microbiologist aspects, including survival of pathogens in the soil.Foliar damage to tree species is studied in Reno, Nevada (2 projects). Effects of irrigation withpaper mill effluents on soil are studied in Flagstaff, Arizona. Enhanced pesticide transport in soilsirrigated with sewage effluent is studied at Purdue University. Swine waste treatment is studied atHonolulu, while the group at Fresno develops management practices to minimize adverse effectsof irrigation with normal water on soils and groundwater. These are all considered complementaryto the research proposed herein.
APPROACH AND RESEARCH PROCEDURES
Objective 1 - Fate of Organic Compounds
Experimental Design
Technologies based on previous research at the U.S. Water Conservation Laboratory (USWCL) andother more recent research will be applied to new and existing groundwater recharge and water reuseprinciples and projects here and abroad. Main purposes of the reuse projects range from protectingwater quality and aquatic life in surface water to reuse of sewage effluent for nonpotable (mostlyurban and agricultural irrigation) and potable purposes. Ten soil columns in 2.4m x 0.3m stainlesssteel pipes have been set up in a greenhouse at the USWCL to study movement of pathogens andchemicals (including trace organics) in systems involving irrigation with sewage effluent, artificialrecharge with sewage effluent, and recharge and irrigation with Colorado River water. The columnswere filled with a sandy loam from the McMicken Flood Control reservoir northwest of the City ofSurprise. This is a desert soil in the Mohall-Laveen Association that has had no agricultural use.The hydraulic conductivity of the soil was determined with a laboratory permeameter test as 280mm/day, using a disturbed sample. To avoid particle segregation, the soil was placed in the columnsin air-dry condition, lowering it in a container and tipping the container when it rested on the bottomof the pipe and then on the top of the soil as the column was filled. The new soil was thencompacted with a rod.
The sewage effluent to be used in the column studies should be representative of typical treatmentfor irrigation. As a minimum, the effluent should have had primary and secondary treatmentfollowed by chlorination. Coagulation and granular medium filtration before chlorination shouldmakes this so-called tertiary effluent suitable for unrestricted irrigation. This includes irrigation oflettuce and other crops consumed raw or brought raw into the kitchen, and of parks, playgrounds,golf courses and residential yards. Also the effluent should primarily be of residential origin withnot much industrial input. Proposed irrigation and recharge studies of the 10 columns are shown

60
in Table 2 (Columns 9 and 10 are discussed under Objective 3). Initially, there will be noreplications since variability issues theoretically do not exist. Because of space and other physicallimitations, only ten columns could be set up. Thus, the schedule in Table 2 was developed so as toinclude as many different treatments as possible, including different crop and soil conditions(legume, non-legume, and bare soil), different modes of water application (irrigation and recharge,different irrigation efficiencies, and different sources of water (effluent and Colorado River water).The irrigation efficiencies in Table 2 will be determined as ET divided by amount of water appliedand expressed as a percentage. ET will be calculated from the weight loss of the column asmeasured with load cells on which the columns are resting. Estimates of irrigation efficiency willalso be obtained from EC values of irrigation water and leachate. Depending on the results,however, some replicated treatments may be used in the future to firm up some of the conclusions.
Table 2. Schedule of irrigation and recharge studies for soil columns in greenhouse.
Irrigation
COLUMN COVER IRRIGATION
EFFICIENCY
WATER
SOURCE1 grass 50% effluent2 grass 70% effluent3 grass 90% effluent4 alfalfa 50% effluent5 alfalfa 70% effluent6 alfalfa 90% effluent7 bare soil 70% effluent8 grass 70% Colorado River
Groundwater Recharge
9 bare soil maximumloading
effluent
10 bare soil maximumloading
Colorado River
Since U.S. Water Conservation Laboratory and ARS do not have analytical capability for thedetection of trace amounts at the part per trillion (ppt) levels of synthetic organics such aspharmaceuticals and pharmaceutically active chemicals contributed to the effluent by human andindustrial waste, preliminary tests have been conducted by the Civil and Environmental EngineeringDepartment at the University of California at Berkeley, California, where Dr. David L. Sedlak hasan active research program on pharmaceuticals in sewage effluent. The first sample was taken fromthe Goodyear treatment plant because the effluent there was also used for landscape irrigation andartificial recharge of groundwater. The treatment process consisted of primary and secondary
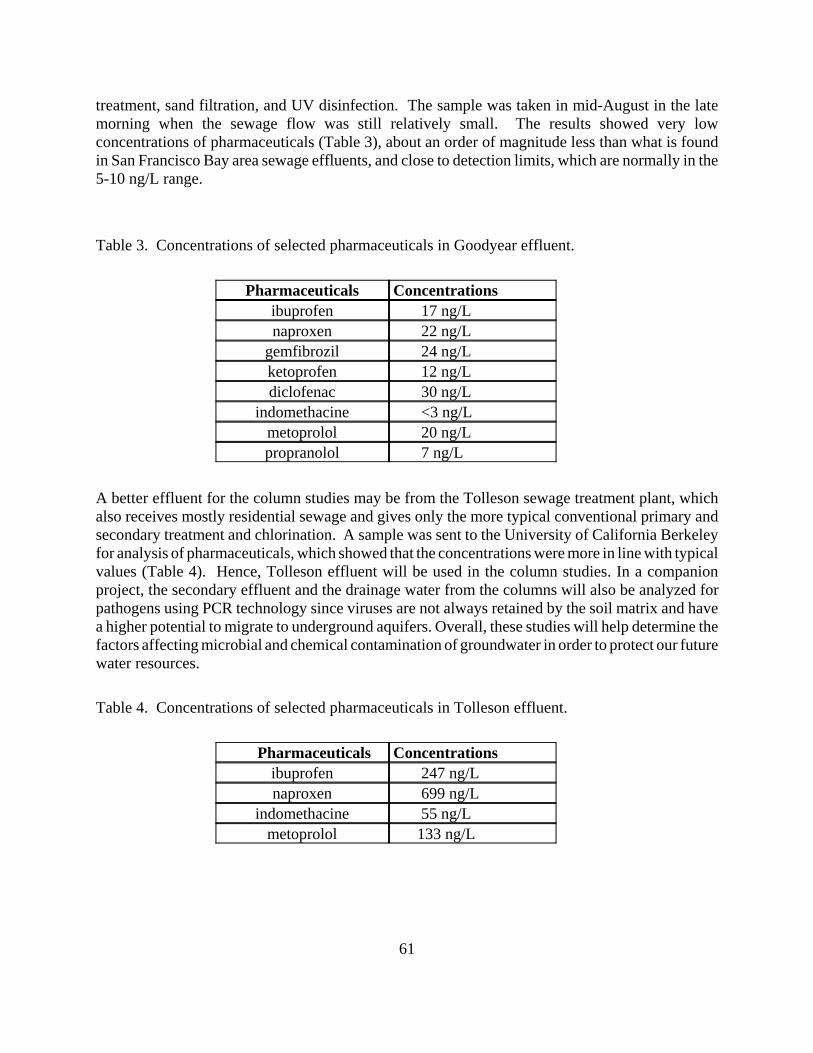
61
treatment, sand filtration, and UV disinfection. The sample was taken in mid-August in the latemorning when the sewage flow was still relatively small. The results showed very lowconcentrations of pharmaceuticals (Table 3), about an order of magnitude less than what is foundin San Francisco Bay area sewage effluents, and close to detection limits, which are normally in the5-10 ng/L range.
Table 3. Concentrations of selected pharmaceuticals in Goodyear effluent.
Pharmaceuticals Concentrationsibuprofen 17 ng/Lnaproxen 22 ng/L
gemfibrozil 24 ng/Lketoprofen 12 ng/Ldiclofenac 30 ng/L
indomethacine <3 ng/Lmetoprolol 20 ng/Lpropranolol 7 ng/L
A better effluent for the column studies may be from the Tolleson sewage treatment plant, whichalso receives mostly residential sewage and gives only the more typical conventional primary andsecondary treatment and chlorination. A sample was sent to the University of California Berkeleyfor analysis of pharmaceuticals, which showed that the concentrations were more in line with typicalvalues (Table 4). Hence, Tolleson effluent will be used in the column studies. In a companionproject, the secondary effluent and the drainage water from the columns will also be analyzed forpathogens using PCR technology since viruses are not always retained by the soil matrix and havea higher potential to migrate to underground aquifers. Overall, these studies will help determine thefactors affecting microbial and chemical contamination of groundwater in order to protect our futurewater resources.
Table 4. Concentrations of selected pharmaceuticals in Tolleson effluent.
Pharmaceuticals Concentrationsibuprofen 247 ng/Lnaproxen 699 ng/L
indomethacine 55 ng/Lmetoprolol 133 ng/L

62
Contingencies
Arrangements were made with the Central Arizona Water Conservation District to obtain ColoradoRiver water from the Central Arizona Project (CAP) Aqueduct at a point where the canal has 100%Colorado River water. The CAP water has been applied in a recharge mode to one column, startingFebruary 10, 2000. This research also relies on cooperation with local municipalities to obtainwastewater and with various collaborators to conduct some chemical analyses. Studies ongroundwater recharge rely on field sites of water purveyors. Alternative collaborators may be easilybe found.
Collaborations
- Necessary (within ARS); collaboration with microbiologist, Norma Duran, at the U.S. WaterConservation Laboratory is required for the study of pathogens, as described in her Project Planunder National Program 108.
- Necessary (external to ARS); Collaboration with the U.S. Geological Survey is being developedto analyze the water samples for the column and field studies for pharmaceuticals. The USGShas several laboratories and analytical equipment (GC with MS-MS in tandem) for detectionlevels of 1 to 100 part per trillion (ppt). The USGS has applied for a District Special InitiativeFund to help pay for the analyses, which will also be partly funded by ARS. The analyses willcover a wide spectrum of chemicals, including pharmaceuticals, antibiotics, hormones andhormonally active compounds, disinfection byproducts, and synthetic organic compounds (Table5). General collaboration will be established with the National Center for Sustainable WaterSupplies in the Civil and Environmental Engineering Department of Arizona State University,Tempe, Arizona.

63
Table 5. Target compounds for USGS National Reconnaissance of Emerging Contaminant USstreams
Veterinary and Human AntibioticsTetracyclines Sulfonamides
Chlortetracycline SulfachlorpyridazineDoxyclycline SulfamerazineOxytetracycline SulfamethazineTetracycline Sulfathiazole
Flouroquinolones SulfadimethoxineCiprofloxacin SulfamethiazoleEnrofloxacin SulfamethoxazoleNorfloxacin OthersSarafloxacin Lincomycin
Macrolides TrimethoprimErthromycin CarbadoxErthromycin-H20 (metabolite) VirginiamycinTylosin AmoxicillinRoxithromycin Spectinomycin
IvermectinRoxarsone
Human DrugsPrescription Non-Prescription
Metformin (antidiabetic agent) Acetaminophen (analgesic)Cimetidine (antacid) Ibuprofen (anti-inflammatory, analgesic)Ranitidine (antacid) Codeine (analgesic)Enalaprilat (antihypertensive) Caffeine (stimulant)Diltiazem (antihypertensive) Paraxanthine (caffeine metabolite)Fluoxetine (antidepressant) Cotinine (nicotine matabolite)Paroxetine (antidipressant, antianxiety)Furosemide (diuretic)Warfarin (anticoagulant)Salbutamol (antiasthmatic)Gemfibrozil (antihyperlipidemic)Dehydronifedipine (antianginal metabolite)

64
Industrial and Household Wastewater ProductsInsecticides Polycyclic aromatic hydrocarbons
Diazinon (fossil fuel and fuel combusionCarbaryl indicators)Chlorpvrifos Napthalenecis-Chlordane PhenanthreneN,N-diethyltoluamide (DEET) AnthraceneLindane FluorantheneMethyl parathion PyreneDieldrin Benzo(a)pyrene
Plasticizers Antioxidantsbis(2-Ethylhexyl)adipate 2,6-di-tert-ButylphenolEthanol-2-butoxy-phosphate 5-Methyl-1H-benzotriazolebis(2-Ethylhexy)phthalate Butylatedhydroxyanisole (BHA)Diethylphthalate Butylatedhydroxytoluene (BHT)Triphenyl phosphate 2,6-di-tert-Butyl-p-benzoquinone
Detergent metabolites Othersp-Nonylphenol Tetrachloroethylene (solvent)Nonylphenol monoethoxylate (NPEO1) Phenol (disinfectant)Nonylphenol diethoxylate (NPEO2) 1,4-Dichlorobenzene (fumigant)Octylphenol monoethoxylate (OPEO1) Acetophenone (fragrance)Octylphenol diethoxylate (OPEO2) p-Cresol (wood preservative)
Fire retardants Phthalic anhydride (used in plastics)Tri(2-chloroethyl)phosphate Bisphenol A (used in polymers)Tri(dichlorisopropyl)phosphate Triclosan (antimicrobial disinfectant)
Sex and Steroidal HormonesBiogenics Pharmaceuticals
17b-Estradiol 17a-Ethynylestradiol (ovulation inhibitor)17a-Estradiol Mestranol (ovulation inhibitor)Estrone 19-Norethisterone (ovulation inhibitor)Estriol Equilenin (hormone replacement therapy)Testosterone Equilin (hormone replacement therapy)Progesterone Sterolscis-Androsterone Cholesterol (fecal indicator)
3b-Coprostanol (carnivor fecal indicator)Stigmastanol (plant sterol)
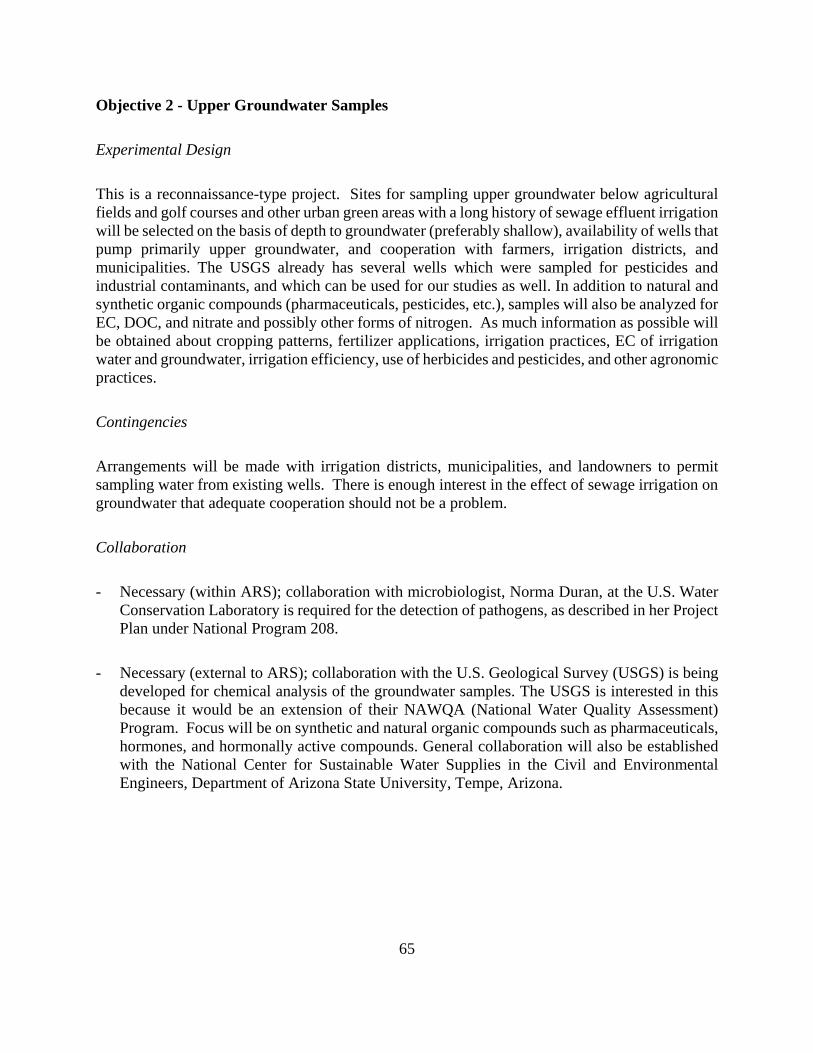
65
Objective 2 - Upper Groundwater Samples
Experimental Design
This is a reconnaissance-type project. Sites for sampling upper groundwater below agriculturalfields and golf courses and other urban green areas with a long history of sewage effluent irrigationwill be selected on the basis of depth to groundwater (preferably shallow), availability of wells thatpump primarily upper groundwater, and cooperation with farmers, irrigation districts, andmunicipalities. The USGS already has several wells which were sampled for pesticides andindustrial contaminants, and which can be used for our studies as well. In addition to natural andsynthetic organic compounds (pharmaceuticals, pesticides, etc.), samples will also be analyzed forEC, DOC, and nitrate and possibly other forms of nitrogen. As much information as possible willbe obtained about cropping patterns, fertilizer applications, irrigation practices, EC of irrigationwater and groundwater, irrigation efficiency, use of herbicides and pesticides, and other agronomicpractices.
Contingencies
Arrangements will be made with irrigation districts, municipalities, and landowners to permitsampling water from existing wells. There is enough interest in the effect of sewage irrigation ongroundwater that adequate cooperation should not be a problem.
Collaboration
- Necessary (within ARS); collaboration with microbiologist, Norma Duran, at the U.S. WaterConservation Laboratory is required for the detection of pathogens, as described in her ProjectPlan under National Program 208.
- Necessary (external to ARS); collaboration with the U.S. Geological Survey (USGS) is beingdeveloped for chemical analysis of the groundwater samples. The USGS is interested in thisbecause it would be an extension of their NAWQA (National Water Quality Assessment)Program. Focus will be on synthetic and natural organic compounds such as pharmaceuticals,hormones, and hormonally active compounds. General collaboration will also be establishedwith the National Center for Sustainable Water Supplies in the Civil and EnvironmentalEngineers, Department of Arizona State University, Tempe, Arizona.

66
Objective 3 - Optimum Management Procedures
Experimental Design
Management of groundwater recharge basins: Groundwater recharge of surplus waters (excess riverflows, municipal wastewater, etc.) provides an alternative to surface reservoirs for storing water andalso provide a mechanism for treating water. A number of unanswered questions are faced withprojects that artificially recharge groundwater, including; How much of the recharged groundwatercan be recovered? What reduction in quality of the reclaimed water results from the rechargeproject? Does the recharge water degrade existing groundwater supplies?
Laboratory and field studies will be initiated to develop best management practices for groundwaterrecharge basins in relatively fine-textured soil where reductions in infiltration rates must beminimized. Emphasis will be on crusting and fine-particle movement (wash out-wash in) in theupper soil profile. Laboratory studies will use 10-cm diameter columns to study basic aspects ofwash out-wash in processes such as fine particle movement and accumulation for different soil typesand different simulated soil management practices (drying, disking, rolling, etc.). Studies will alsobe done on small field plots ranging in size from 1 m2 to about 10 m2, and on small experimentalbasins (about 10 x 100 m) which are to be installed as part of a larger recharge system for theeffluent of the City of Surprise South Wastewater Treatment plant. The City of Surprise receiveda research grant from the Arizona Department of Water Resources for this project, with our researchunit as a cooperator. Various tillage and management practices will be tested to see how fine particlemovement occurs, how it can be minimized, and how infiltration rates can be maximized. Thestandard practice is to have roughly 30 cm water on the basins for 5 days (wet) followed by 3 to 4days dry and disking the basins every 8 to 12 months. Modified practices include; extending orreducing the wet period, extending the dry period, varying the water depth, disking more or lessoften, ripping, scraping, and rolling. The number of basins and treatments will be decided as theproject unfolds. The basins will be narrow and long to allow disking and other managementpractices with regular farm equipment. About 10 such basins will be constructed. The basins willbe calibrated as to their infiltration potential, so that results of various treatments can be expressedrelative to the original infiltration rates. Infiltration rates will be determined from inflow rates oras fall of the water level at zero inflows, corrected for evaporation. Hydraulic gradients in the soilto indicate surface or deeper clogging of the soil will be measured with tensiometers at differentdepths. The work will be cooperative with City of Surprise personnel. Construction is expected tobegin in August 2001. This is essentially a two-year project (which has been delayed a year and ahalf because of water rights issues). Depending on the results of this study, we will pursue furtherprojects of this kind.
Water quality improvement through infiltration of sewage effluent for groundwater recharge andsoil-aquifer treatment will be studied on 2 large soil columns in the greenhouse (columns 9 and 10in Table 2). The Colorado River water column will primarily be used to study underground fate oforganic carbon analyzed as total organic carbon in the water and its potential for disinfectionbyproduct formation (tribalomethanes, haloacetic acids, NDMA) when the water after soil-aquifer

67
treatment is chlorinated or otherwise disinfected for potable use. The sewage-effluent column willbe used to study the fate of pharmaceuticals in the vadose zone where sewage effluent is used forartificial recharge of groundwater.
Contingencies
Studies on groundwater recharge rely on field sites of water purveyors. Alternative collaboratorsmay easily be found.
Collaborations
- Necessary (within ARS); No necessary collaborators.- Necessary (external to ARS); City of Surprise AZ. (Letter of intent attached).
Physical and Human Resources
The wastewater irrigation group consists of a research engineer (LS) (100%) and a part-timetechnician support. Support for the column studies is also provided by a microbiologist and physicalscience technician on a related research project specifically studying pathogens. There is alsogeneral laboratory support including a water quality chemistry lab, a soils lab, and a machine shop.Field facilities include sewage treatment plants and sewage irrigated fields in Arizona andCalifornia, and shallow wells for sampling the upper groundwater in a sewage irrigated area westof Phoenix. Additional labor for the column studies is provided through a cooperative agreementwith Arizona State University.
MILESTONES AND EXPECTED OUTCOMES
Milestone Time Line: Publication and presentation of results as significant outcomes arise.Demonstration and training programs will be held with potential users as required (Table 6).
Information should be available on the underground fate of sewage chemicals like synthetic andnatural organic compounds below sewage irrigated fields and their potential effect on groundwaterbelow sewage irrigated fields or infiltration basins used for artificial recharge of groundwater withsewage effluent. Depending on the results, these outcomes should have a significant effect on waterreuse practices around the world, either giving them the green light or a warning about potentialadverse effects on human health and underlying groundwater. If the latter is true, best managementpractices will be developed and tested. The pathogen aspects will be the responsibility of themicrobiologist on a related project. The organic chemical aspects of recharge and soil-aquifertreatment systems, as well as principles and practices of water reuse and groundwater recharge ingeneral will be the responsibility of the engineer and chemist.

68
Since the research addresses practical and real-world problems, it should not be difficult to translatethe results into useful concepts. Additional investigations are needed and will be added to theproject as funds become available.
National Collaboration
Depending on the results of the column studies and local field studies, the project will be expandedto other field sites in the U.S. and other countries. Preliminary contracts have already beenestablished. This project is also relevant to projects within ARS that focus on manure handling andutilization and could lead to collaboration with other ARS laboratories such as the Natural ResourcesInstitute, Beltsville Area.
ARS is in the process of establishing an initiative on the use of wastewater for irrigation, which issupported by the Irrigation Association. The initiative intends to establish related research projectsat Bushland, TX and Florence, SC.

69
Table 6.
Research StudyComponents end of year 1 end of year 2 end of year 3 end of year 4 end of year 5
Greenhouse soilcolumns
operation, management andsampling forirrigation andgroundwaterrechargeprocedures,chemical analyses,program completed
operation, continuedresults of chemicalanalysis interpretedchanges in columnmanagement asindicated, considerapplying animal manureand analyze inflow andoutflow forpharmaceuticals
operation continued,manuscripts prepared,spiking infiltration waterwith tracers and specificchemicals
final reports andmanuscript prepared,plan and performfuture studies
final reports andmanuscript prepared,plan and perform future studies
Fieldreconnaissance
select sites ofwastewater irrigatedfields and urbanareas and samplewater andgroundwater forwastewaterchemicals
include more sites inother parts of the U.S.
expand sampling programto other countries
prepare final reportsfor presentation andpublication of papers,plan and performfuture studies
prepare final reports forpresentation andpublication of papers,plan and perform futurestudies
Clogging research set up laboratoryand field studies forsoil clogging andmitigation inrecharge basins,study crusting andfine particlemovement
continue laboratory andfield studies formaximizing infiltrationrates in fine-texturedsoils
continue laboratory andfield studies formaximizing infiltrationrates in fine-textured soils
write papers on bestmanagement practices,plan and performfuture studies
write papers on bestmanagement practices,plan and perform futurestudies

70
LITERATURE CITED
Asano, T. 1998. Wastewater reclamation and reuse. Water Quality Management Library, Vol. 10.1528 pp. Technomic Publishing Co., Lancaster PA.
Bouwer, E.J., M. Reinhard, P.L. Mc Carty, H. Bouwer and R.C. Rice. 1982. Organic contaminantbehavior during rapid infiltration of secondary wastewater at the Phoenix 23rd Avenue Project.Technical Report No. 264, Standford University, Department of Civil Engineering.
Bouwer, E.J., P.L. McCarty, H. Bouwer, and R.C. Rice. 1984. Organic contaminant behaviorduring rapid infiltration of secondary wastewater at the Phoenix 23rd Avenue Project. Water Res.18(4):463-472.
Bouwer, H., R.C. Rice, J.C. Lance, and R.G. Gilbert. 1980. Rapid-infiltration research at FlushingMeadows Project, Arizona. J. Water Pollut. Contr. Fed. 52(10)2457-2470.
Bouwer, H. and R.C. Rice. 1984. Renovation of wastewater at the 23rd Avenue Rapid-InfiltrationProject, Phoenix, AZ. J. Water Pollut. Control. Fed. 56(1)76-83.
Bouwer, H. 1985. Renovation of wastewater with rapid-infiltration land treatment systems. T.Asano (ed.) In artificial Recharge of Groundwater. Butterworth Publishers, Boston MA, p. 249-282.
Bouwer, H. and E. Idelovitch. 1987. Quality requirements for irrigation with sewage effluent. J.Irrig. And Drain. Div. ASCE 113(4)516-535.
Bouwer, H. 1993. From sewage farm to zero discharge. European Water Pollution Control 3 (1)9-16.
Bouwer, H. 1998. Predicting infiltration and mounding, and managing problem soils. p. 149-154.In Proceedings Third Internat. Symp. on Artificial Recharge of Ground Water, Amsterdam, TheNetherlands.
Bouwer, H. 1999. Artificial recharge of groundwater: Systems, design and management, Chapter24. p. 24.1-24.44. In ed. McGraw-Hill N. Y. NY Larry W. Mays (ed.) Hydraulic Design Handbook.
Bouwer, H., P. Fox, P. Westerhoff, and J. Drewes. 1999. Integrating water management and re-usecauses of concern? Water Quality International Jan-Feb. p. 19-22.

71
Bouwer, H. 2000. Groundwater problems caused by irrigation with sewage effluent. Environmental Health 63(5):17-20.
Drewes, J.E. and P. Fox. 1999. Fate of natural organic matter (NOM) during groundwater rechargeusing reclaimed water. Water Sci. Techn. 40(9):241-248.
Drewes, J.E. and P. Fox. 2000. Effect of drinking water sources and reclaimed water quality inwater reuse systems. Water Env. Res. 72(3):353-362.
Drewes, J.E., and L.S. Shore, 2001. Concerns about pharmaceuticals in water reuse, groundwaterrecharge and animal waste. In Pharmaceuticals and Personal Care Products in the Environment:Scientific and Regulatory Issues. C. G. Daughton and T. Jones-Lepp, eds. Symposium Series 791,American Chemical Society, Washington DC (in press).
Lim, R., S. Gale, C. Doyle, B. Lesjean, and M. Gibert. 2000. Endocrine disrupting compounds insewage treatment plant (STP) effluent reused in agriculture – is there a concern? P. 23-28. P.J.Dillon (Ed). Proc.1st Symposium, Water Recycling Australia.
Nellor, M.H., R.B. Baird, and J.R. Smith, 1984. Summary of health effects study: Final report.County Sanitation District of Los Angeles County, Whittier CA.
Schoenheinz, D., J.E. Drewes, T. Grischek, and P. Fox. 2000. Proc. Water Reuse Association,Annual Conference, Phoenix AZ 29-30 March, 11pp.
Sloss, E.M., S.A., Geschwind, D.F. Mc Caffrey, and B.R. Ritz. 1996. Groundwater recharge withreclaimed water. In Epidemilogic Assessment in Los Angeles County 1987-1991, RAND Corp.Santa Monica CA.


72
PROJECT SUMMARY
Surface irrigation is the most widely used irrigation method in the world. In the US, over 50% ofirrigated land is watered by surface means. It is the most inexpensive method, in terms of capitaloutlay, power requirements, and maintenance costs. Traditional surface methods are labor intensive.Poor uniformity of application, and excessive runoff and deep percolation, often carrying agriculturalchemicals into the environment, are common. The complexity of the hydraulics of surface systemshas, until recently, made rational design very difficult. Accordingly, many surface systems are builtand operated without the benefit of any technical design. The proliferation of computers has nowmade numerical solutions of the hydraulic equations easily attainable, and is putting design of surfaceirrigation systems and their operation on a par with other engineering disciplines -- with reliance onmultiple analyses (simulations) with trial values of the design variables in the search for an optimum.
The proposed research is intended ultimately to provide guidance in the design and operation ofsurface systems, both traditional and innovative. The investigators will collaborate with several ARSsites addressing all four of the NP201 research initiatives. Intermediate goals are (1)simulation ofthe transport and fate of water, sediments, and nutrients such as phosphorus and nitrogen by irrigationin furrows, border strips, and basins of various types, along with attendant field studies,( 2) softwarefor presenting overviews of simulations to aid in the search for an optimum, (3) software to assist inevaluating extant field conditions on which irrigation performance depends.
OBJECTIVES
1. Develop validated software (a) for simulating surface-irrigation hydraulics, (b) for assisting indesign and management of such systems, and (c) for estimating the field parameters that bearupon system behavior.
2. Develop guidelines for design and operation of drain-back and other surface-drained level basinsto improve water use in surface irrigation, while maintaining farm profitability andsustainability.
3. Develop validated surface-irrigation models incorporating the fate and transport of sediments,phosphorus, and nitrogen, including their ultimate off-site discharge.
4. Develop guidelines for water and nutrient management under surface irrigation for minimizingintroduction of nitrogen into surface and ground waters while maintaining soil fertility, cropyields, and farm profitability and sustainability.
NEED FOR RESEARCH
Description of the Problem to be Solved
Surface irrigation accounts for half of the irrigated land area in the U.S. and over 90% worldwide.Many systems are built and operated without adequate technical input, with consequent lowuniformity and efficiency of water application. Yet, water supplies for irrigation are limited and likelyto decline due to competition from environmental and urban water demands. Improved managementand conservation will be required to maintain current levels of crop production; at the same time,demand for food is expected to grow. Science-based criteria for design and management of surface

73
systems can often improve surface irrigation performance to levels commensurate with pressurizedsystems at substantial savings in capital costs and energy. Irrigated agriculture also contributes to non-point source pollution of groundwater and surface waters with nitrogen and phosphorus. Applicationof nitrogen fertilizer in the irrigation water is widely practiced but often leads to nonuniform,excessive application and contributes to nitrogen contamination of the groundwater. Tailwater runoffcan carry sediments, nitrogen, and phosphorus to surface streams. Improved design and operation ofsurface irrigation systems and improved nitrogen application practices should improve agriculture’sutilization of water and reduce its adverse effects on the environment.
Relevance to ARS National Program Action Plan
The research is part of NP201, Water Quality and Management. The project falls under Component2, Irrigation and Drainage Management. Objectives 1 and 2 deal with agricultural water conservation,while 3 and 4 deal with the effects of irrigated agricultural on the environment. All fit under ProblemArea 2.3 (Water Conservation Management), Goal 2.3.3 (Agricultural Water Conservation andEnvironmental Quality). Objective 3 concerns also Problem Area 2.6 (Erosion on Irrigated Land),Goal 2.6.2 (Irrigation/Erosion Model).
Potential Benefits
Process-based predictive tools can be effectively used to examine the consequences of various systemdesigns and management practices on the utilization of water and nutrients by the crop and on thecontamination of surface water and groundwater by irrigated agriculture. These tools can become thebasis for improving practices that conserve water, minimize fertilizer costs, and protect theenvironment, while maintaining yields of crops under irrigation, particularly with surface methods.
Anticipated Products
1. A process-based model of surface irrigation, including water flow, sediment movement, and themovement over the field surface of chemicals, both dissolved in the water and attached to sedimentparticles. For studies on fate and transport of nitrogen, the model is to be linked with other models,developed at collaborating laboratories, simulating soil physical and chemical processes.
2. Design and management-aid software, integrated with the simulation model. 3. Guidelines and recommendations, grounded in contemporary scientific and engineering principles,
for improving surface irrigation performance and for reducing the impact of irrigation on theenvironment, while maintaining or improving crop production and quality.
Customers
The NRCS (Natural Resources Conservation Service, particularly through the National Water andClimate Center and Thomas L. Spofford, Irrigation Engineer) has supported our development ofsurface-irrigation design and management tools and has promoted these for use at its field offices. Wethus expect our main customers to be the NRCS, as well as agricultural consultants, mobile field labs,

74
and extension agents, with farmers as the ultimate beneficiaries (particularly in the case of software).We plan to have these groups review the software and predictive tools throughout the developmentprocess, as well as the ultimate recommended practices.
SCIENTIFIC BACKGROUND
Objective 1 - Irrigation Software
Simulation models are used to aid system design and management. The most widely disseminated,covering all of the phases of an irrigation and forming a basis for constituent transport, are the one-dimensional SIRMOD (Utah State University, 1989) and SRFR (Strelkoff et al, 1990). An uncountednumber of additional, ad-hoc constructions are built for specific applications (e.g., Fernandez, 1997).One-dimensional models are those in which the pertinent variables are considered functions of aprimary (longitudinal) direction, such as distance down a furrow or border strip, and time (in contrast,a typical two-dimensional problem might deal with a large basin with a point inlet, the inflowspreading out in all possible directions). SRFR accommodates spatially and temporally varying slopes,cross sections, infiltration and roughness, as well as a variety of inflow-management strategies --cutback, surges, cablegation, and drainback. A selection of infiltration, roughness, and plant-dragformulations are available. Irrigation-stream responses to field and inflow conditions such as front-end recession and re-advance are accommodated. In 1998, a mouse/menu-driven version withgraphical user interface was released (Strelkoff et al, 1998).
For given field conditions (topography, infiltration, roughness) and water availability at the site,performance (which includes efficiency, uniformity, water cost per hectare, etc.) is a function of thedesign variables. That functionality, which can be imagined for each performance variable as aresponse surface, can be explored informally, by trial and error. The engineer tries differentcombinations of the design variables and calculates simulated performance level for each. In a moredirect, inverse, procedure (BASIN, Clemmens et al., 1995), the engineer specifies a desiredperformance level, and the program, interpolating within a database of previously run simulations,quickly calculates the values of the design variables which achieve that level. In another approach,the engineer specifically seeks the maximum point of the response surface. Then, in a formaloptimization procedure (e.g., Wallender et al., 1990), a simulation model is called repeatedly in anautomated search for the maximum. A more recent development (BORDER -- Strelkoff et al, 1996)provides performance overviews, which present the response surface itself to the viewer, as contours,again, obtained by interpolation within a massive database of simulation results. These are intendedto span the practical range of field and design variables of interest, and are “hardwired” into theprogram. Such a static database is limited by the specifics under which the simulations were run (evenwith the enormous generality afforded by use of dimensionless representations).
Estimation of Field Parameters
Infiltration and hydraulic drag are essential soil-boundary conditions on the irrigation stream andconstitute inputs to simulation and design/management software.

75
Infiltration: Surface-irrigation modelers and evaluators have mostly relied upon the wholly empiricalKostiakov power law in time, for cumulative infiltration (volume per unit infiltrating area), oftenmodified (Lewis, 1937) by a long-time, basic rate, and sometimes a constant, to account for soilcracks. The Kostiakov-Clemmens branch function (Kostiakov, 1932; Clemmens, 1981) is the simplepower law at small times, but crosses to a constant final rate at the time the power-law rate matchesthe long-term rate. It fits some soils better than the Kostiakov-Lewis formula. With these formulas,great flexibility in matching observed infiltration is provided by as many as 3 independent empiricalparameters, but selecting 3 values also presents a challenge.
The SCS (now, NRCS – USDA, 1974) proposed a set of infiltration families for all soils to fit, eachmember with a specified coefficient and exponent in the Kostiakov power law. The families provedeasy to use, and many engineers learned to associate the soils in their region to specific families. Notsurprisingly, many soils fail to fit any of the families, and in response, Merriam and Clemmens (1985)introduced the Time Rated Intake Families for non-cracking soils. These families were based on anempirical correlation (fitted with an algebraic equation) between the time to infiltrate just 100 mm andthe Kostiakov exponent. A single measurement, of the time required to infiltrate the 100 mm, providesa Kostiakov cumulative infiltration function.
In simulating furrow flow, the fundamental infiltration boundary condition required as a function oftime is the volume infiltrated per unit length, Az, rather than volume per unit infiltrating area, z. In atheoretical (Richards, or Green and Ampt) approach to furrow infiltration the obvious directdependence of Az upon wetted perimeter comes out as part of the solution (Enciso et al, 1991; Peckand Talsma, 1968; Talsma, 1969; Youngs, 1972; Freyberg, 1983; Philip, 1984; Schmitz, 1993a,b,).In one popular empirical approach (Elliot and Walker, 1982; Walker and Humpherys,1983), Az isdirectly determined for a series of time values by dividing the corresponding measured infiltratedvolumes Vz in a furrow test section by its length. For a flow depth other than in the test, the necessarymodification is not clear. The SCS, on the other hand, identifying a soil by its family, calculates theeffect of furrowing on infiltration by multiplying the family z by an “empirical” wetted perimeter,whose value can be as much as 2 or 3 times the actual furrow wetted perimeter (USDA, 1985;Strelkoff, 1992). In SRFR, infiltration is approximately characterized by empirical z parameters, andin a time step of simulation, the increase in z is multiplied by the extant wetted perimeter to computethe corresponding increase in Az. The theoretical implications of this practical device are unclear.
Point measurements of infiltration seldom identify representative field values suitable for simulatingan entire event. There are two basic approaches to estimating field infiltration and roughness fromirrigation-stream observation. In one, inflow and outflow are measured, along with enough time-varying stream geometry to apply mass balances and determine the time rate of infiltration into thesoil (Finkel and Nir, 1960; Maheshwari et al, 1988; Gilley, 1968; Roth et al, 1975; Fangmeier andRamsey, 1978, Strelkoff et al, 1999). In the other, only selected features of stream behavior, e.g.,inflow and advance and possibly a stream-flow depth, are measured and compared with simulatedstream behavior, to deduce the field parameters (Shepard et al, 1993; Elliott and Walker, 1982;Clemmens, 1991; Walker and Busman, 1990; Bautista and Wallender, 1993; Clemmens and Keats,1992; Clemmens, 1992, Scaloppi et al, 1995; Clemmens, 1981; Monserrat and Barragan, 1998;Valiantzas, 1994; Yost and Katopodes, 1998; Katopodes et al, 1990, Playan and Garcia-Navarro,

76
1997). The basic problem with the first method is the intensive field work required. The problem withthe second is the uncertainty over whether the deduced field parameter values are at all correct. Anerror in estimating infiltration from measured advance can be compensated, in a particular event, byadjusting the roughness. With what certainty does an automatic optimization technique lead to aglobal minimum of errors, rather than a local depression (Katopodes, 1990; Katopodes et al, 1990)?How does actual spatial variability influence an assumed spatially uniform deduced value? Theultimate practical question is: what are the most advantageous measurements to obtain sufficientlyaccurate estimates of field properties with minimum effort.
Hydraulic Drag/Roughness: Many of the same considerations apply to estimation of surfaceroughness and plant drag, with the general understanding that it is not quite as important an issue asinfiltration, partly because it does not vary as much as infiltration, and partly because in some cases(sloping border strips) errors in estimation partially cancel (Fangmeier and Strelkoff, 1979).
SRFR Suite: Many of the problems associated with collecting simulation, design/management, andfield-parameter estimation into a single Windows-based suite with data crossing easily betweencomponents have been anticipated by the U.S. Corps of Engineers’ Hydrologic Engineering Center,which is in a program of updating its software (NexGen project) to integrated, multiplatform, object-oriented status. An alternative to recoding hundreds of thousands of lines of Fortran legacy code iswrapping sections of such code in, e.g., Java so they can be treated as objects by the integrated shell(Davis, 2000). An amalgamation of soil-erosion models into an integrated package is found inMOSES (Meyer et al, 2001). Interactive data entry permits consideration of small watersheds, largerthan the field/farm scales associated with earlier versions of its component modules. An integratedpackage of hydrologic and erosion models is also described in Ascough II et al, 2001.
Objective 2 - Surface-Drained Level Basins
The advantages of laser-graded level basins in improving water-distribution uniformity, applicationefficiency, and crop yields are documented (Dedrick, 1984; Clemmens, 2000), and software to aid intheir design has been released (Clemmens et al, 1995). The relatively high costs of conversion, thelarge depths that must sometimes be applied to achieve high uniformity, and the danger of cropdamage from undrained precipitation are all mitigated by a modification, drainback, which providesboth inflow and outflow through a single broad, shallow ditch running down the prevailing slope,alongside a series of benched level basins, each irrigated and drained in turn. In this way, a portionof the applied water is returned to the supply channel before excessive infiltration has occurred(Dedrick, 1983; Dedrick and Clemmens, 1988). Such systems, developed at the USWCL in the 1980s,are expanding rapidly in central Arizona. The flow in a level-basin with drainback is essentially onedimensional, and its simulation has been programmed into SRFR. Some field studies have beenconducted, but no general design and operational guidelines are available.
A further modification, developed in northern Louisiana where surface drainage is essential, ischaracterized by a square grid of shallow spin ditches, so called because the excavated material is spunout over the surrounding land to avoid berms on the banks, facilitating both water supply to theinteriors of the grids and drainage (Clemmens, 2000). Thus, both supply and drainage occur

77
Figure 1. Simulated (broad line) and measured(fine line) water-surface elevation hydrographs atselected points in basin (Clemmens andStrelkoff, 2001)
throughout the basin. The effectiveness of these spin ditches, required spacing, etc., have not beenstudied. As a result, NRCS is reluctant to endorse them, even though farmers are pleased and acreageis expanding.
The flows in grid-supplied and drained level basins are essentially two-dimensional. A two-dimensional treatment of a dambreak flood on irregular topography was presented by Xanthopoulosand Koutitas (1976). The zero-inertia formulation therein, described by a parabolic partial differentialequation, precludes true wave dynamics, but allows theoretically correct inclusion of both wet and dryareas into the calculation. Their work, however, incorrectly treats the vector components of hydraulicresistance. The first two-dimensional fully hydrodynamic model explicitly considering advance ona dry bed was the characteristics-based dam-break-flood model of Katopodes and Strelkoff (1978,1979). Dam-break models were built by Hromadka and Yen (zero-inertia,1986), Akanbi andKatopodes (finite elements, 1988), and Bellos et al (finite-difference MacCormack scheme appliedto irregular quadrilaterals transformed to rectangles, 1991). The full hydrodynamic leapfrog solutionof Playan et al (1994), extended to irregular topography (1996), requires postulation of a small deptheverywhere initially with the tacit assumption thatthe surge of irrigation water advances as a hydraulicbore over this small depth. The authors expressedsome concern about the theoretical satisfaction ofboundary conditions, in view of the neglect of amomentum-conservation relation there.
Strelkoff et al ( 2001) utilized the zero-inertiaapproximation to avoid both the fictitious initialfilm of water and characteristics-based equations atthe boundary. Furthermore, to permit large timesteps, they developed an implicit numerical schemewith an alternating-direction solver for the resultingsystem of simultaneous linear algebraic equations.However, despite theoretical determinations ofunconditional stability, computational experienceshows that to avoid growing oscillations, especially in the neighborhood of deep depressions in thesoil surface, time steps must be small, especially with fine spatial grids. Nonetheless the schemeprovides useful simulations. Figure 1 shows a comparison of simulated and measured depthhydrographs at selected points in a 4 hectare basin (Clemmens et al (2001). Of note, computationalpoints #4 and #4downstream straddle the field depth sensor which supplied the measured hydrographplotted between them.
Objectives 3 - Fate and transport of sediment, phosphorus, and nitrogen
Sediment: The Water Erosion Prediction Project (WEPP – USDA, 1995) is a process-based modelprimarily of rainfall-induced soil erosion. It appears not very well suited to surface-irrigation-inducederosion. The NRCS, while planning implementation of the hydrologic-erosion WEPP model in itswatershed program, has found WEPP’s surface irrigation component unvalidated and unacceptable

78
Average of measurements(Trout beans)
1/2
1/43/4
Tail
Simulation: TJTBN71.015File: TJTBn71L.cdr
Calculated with:Laursen formulaDs = 0.05 mmKr = 0.001 s/m
Figure 3 Comparison of simulated sedimenttransport hydrographs at furrow quarterpoints with averages from measured Troutbean data of Julky 1, 1994. Site specificKr=0.001 s/m, Jc=1.2 Pa, Laursen (1958)transport formula. (Strelkoff and Bjorneberg,1999)
SURFACE STREAM
INFILTRATION PROFILE
SEDIMENT TRANSPORTTransport capacity
Sediment load
Figure 2. Frame of animated output ofSRFR simulation – profiles of surfacestream depth, sediment load and transportcapacity, and infiltrated depths; time=61min
(Spofford, NRCS, 1995, 1998). Bjorneberg et al., 1999, and Strelkoff and Bjorneberg, 1999 detailsome of the deficiencies of hydrologic – and specifically, WEPP – modeling of the erosion/transportprocess when applied to furrow irrigation. In contrast to the hydrodynamic components of surface-irrigation models, sediment detachment and transport research is almost fundamentally empirical, anddeterminations suitable for hydrologic watershed models are sometimes not at all satisfactory in thesurface-irrigation context. Typical hydrologic factors which impact on erosion-prediction capabilities,for example, include raindrop energy, flow rates which increase with distance downstream, lateralsediment influx from interrill flow, and, typically, concave landforms. In furrow irrigation, raindropsdo not influence either entrainment or transport, flow rates decrease in the downstream direction,encouraging redeposition in downstream portions of a furrow; typically, there is no lateral influx ofsediment, and the flow channels are essentially
straight. Fernandez (1997), utilizing some of WEPP’s basic premises, developed a complex model,tracking several size fractions through the phenomena of entrainment, transport and deposition,and documented satisfactory agreement with several Spanish soils. At USWCL, a simple erosioncomponent was incorporated into SRFR, based on a single particle size representative of the mixin the furrow-bed, and with empirically determined critical shear and erodibility (Laflen et al,1987; Elliot et al, 1988). Figure 2, drawn from a frame of the animation displayed by SRFRduring a simulation (Strelkoff and Bjorneberg, 1999), illustrates a typical profile of the transport-capacity function and resultant sediment loads at one instant of time (61 minutes into theirrigation). The long region downstream, behind the stream front, in which the transport capacity
and detachment are zero, testifies to the low flows there; boundary shear lies below theentrainment threshold. Upstream, the sediment load grows the fastest at the clear-water inflow,where transport capacity is a maximum and the existing sediment load zero. In the given instance,transport capacity is eventually exceeded, initiating deposition back onto the bed. Strelkoff andBjorneberg (1999), utilizing the Laursen (1958) transport-capacity formula, and with the

79
0.01.02.03.04.05.06.07.08.0
0 50 100 150 200 250 300 350 400
Tota
l-P C
onc.
(mg/
L)
0.0
2.0
4.0
6.0
8.0
10.0
12.0
0 50 100 150 200 250 300 350 400
Sedi
men
t Con
c. (g
/L)
0.00
0.05
0.10
0.15
0.20
0.25
0 50 100 150 200 250 300 350 400
Elapsed Irrigation Time (min)
Ort
ho-P
Con
c. (m
g/L)
42 m 84 m 126 m 168 m inflow
Figure 4. Sediment, total-P andortho-P concentration at fourlocations in an irrigation furrow (preliminary data – unpublished)
representative particle size midrange in the field-measured mix, compared the simulation withfield data obtained by Trout (1996) -- Fig. 3. In comparing several transport formulas, they foundthat the Yang (1973) and Yalin (1963) formulas greatly overestimated the capacity of furrow flowto carry sediment; consequently, deposition back to the lower reaches of the furrow is under-predicted. The Yalin formula provided the poorer predictions, corroborating the WEPPexperiences of Bjorneberg et al. (1999). It is noteworthy that both the Laursen and Yang formulaswere recognized by Alonso et al. (1981) as superior to that of Yalin, in predicting transportcapacity in long channels, both in flumes and in the field. The Yalin formula, however, wasselected for WEPP because it best predicted erosion in the very shallow rain-fed overland flow onconcave hillsides (Foster, 1982).
While the agreement of SRFR simulations withmeasurements can be satisfactory, preliminarydata shows that calculation with a singlerepresentative particle size is too sensitive to itsselection. Furthermore, the most likelyexplanation for observed decreases in sedimentflux across a section with time is a decrease inthe supply from upstream due to armoring --protection of smaller particles from entrainmentby a gradually developing layer of larger onesabove (Fernandez, 1997). Suggestions fortreating the phenomenon were made by Borah(1982) and Borah and Bordoloi (1989), while Wuand Meyer (1979) suggested a reasonable way ofapportioning total transport capacity amongst thesize classes.
Phosphorus (P): When furrow erosion issignificant, affinity between P and soil-particle/aggregate surfaces ties the fate andtransport of P in an irrigation stream to thesediments in transport. Several preliminary datasets on Portneuf silt loam (Durinodic XericHaplocalcid) have been collected at the NWISRL
(ARS, Kimberly) for model development. Sediment, total-P and ortho-P concentrations along withwater flow rate were measured with time and distance in a furrow (Fig. 4). Total-P concentrationsclosely follow sediment concentrations, while ortho-P concentrations are unrelated. Ortho-Pconcentrations decrease with time at a particular distance, but increase with distance at a giventime.
Amongst the existing hydrologic/chemistry models, e.g., CREAMS (USDA, 1980), Opus (Smith,1992), GLEAMS (Knisel, 1993), two approaches to modeling chemical constituents of runoff,Storm et al. (1988) and Ashraf and Borah (1992), appear the most promising for the purposes ofthe proposed study. In the first approach, the model of Storm et al. (1988) deals with uniform

80
P Desorption10 g soil/L
0.00
0.05
0.10
0.15
0.20
0.25
0.30
0.35
0 250 500 750 1000 1250 1500
Elapsed Time, min.
Ort
ho-P
, mg/
L
Soil-B2
Soil-C10
0 T = 0.010mg/L
Figure 5. Phosphorus desorption for twosoils (preliminary data from batch studies --unpublished)
(lumped) field units and was designed forestimating rain-induced P transport from a field;in this case, the kinetic energy of the fallingdrops plays a role in P desorption (byinfluencing the thickness of the soil layercontributing P to solution). Storm et al.recognized a dynamic equilibrium in the runoffbetween soluble P and soil-bound P. In thetransport of sediment-bound P, it is assumed thatthe distribution of P amongst the size classes ofsediment is in proportion to their surface areas(confirming the need for a sediment transportmodel that tracks particle-size fractions in theflow). An empirical expression (Sharpley et al,1981a, b, 1983), a power law in time, models the
desorption of soluble P by the irrigation stream. The adsorption of P, on the other hand, can inmany cases be assumed instantaneous. A common description of the equilibrium conditions ofP reactions is the Langmuir isotherm (Tchobanoglous and Shroeder, 1985), which exhibits alimited adsorption capability, unlike, e.g., the Freundlich isotherm. A potentially significant factorin the chemical sub-models is the assumption of equilibrium isotherms in predicting reactions.Preliminary data collected at the NWISR Laboratory on reaction kinetics (Fig 5) may prove usefulin judging the significance of those assumptions. NWISRL findings on the influence of soilchemistry on P in irrigation tailwater can be found in Westermann et al (2001).
The second hydrologic approach, the chemical component of the Ashraf and Borah (1992) model,is perhaps the most adaptable to the chemical aspects of furrow-water P modeling. This is adeterministic simulation of the entrainment (by rainwater) of P initially in the soil, partly in solution,and partly adsorbed to flow-entrained sediment, with the consequent P loading of the irrigation streamrouted as kinematic waves to the field end and into the runoff. In this model, rainwater mixes witha mixing soil layer at the surface of the soil matrix, the degrees of interaction depending upon depth(non-uniform mixing -- Ahuja, 1982; Heathman et al., 1985). Simulation of this interaction is basedon the following assumptions: -- (1) the mixing layer can be divided into depth increments, eachincrement homogeneous; (2) initial water content, porosity, and concentration in each soil incrementare known; (3) all rainwater infiltrates into the soil during the early part of the rainfall event; (4) allpores participate, sequentially, in solute and water movement; (5) water entering the soil matrix mixeswith soil water initially present in each increment and displaces it to the next increment, below; (6)except for adsorption and desorption, other chemical reactions are negligible; (7) dissolved andadsorbed phases in the furrow stream are in equilibrium, governed by a linear adsorption isotherm,simply a proportionality between concentration of solute and concentration of adsorbate, i.e., anempirical partition coefficient.
Thus, the result is a pair of advection equations in the respective concentrations in the furrow flow,one for dissolved P, and the other for adsorbed P, the two related by the partition coefficient.Source/sink terms for the first are described by the interchange of P between the pore water and theactive soil bed layer, and between that layer and an assumed layer of the surface stream that

81
0.0
20.0
40.0
60.0
80.0
100.0
120.0
0 50 100 150 200
Distance (m)
Dep
th (m
m)
100%75%50%25%Deep percolation
Last
50%
Firs
t 50%
Figure 6. Cumulative infiltrated depth withdistance, as contributed by the first 25%,50%, 75%, and 100% of the applied water,and deep percolation with distance for a levelbasin irrigation system (preliminary simulationdata -- unpublished).
experiences complete mixing with the pore water. The second depends on the net entrainment of eachparticle-size class and the preference of P to adsorb to that class.
Objectives 3(c) and 4
Nitrogen -- Field work, modeling, and guidelines: Applying fertilizer through irrigation water(fertigation) can be a highly effective fertilizer management practice which offers certain advantagescompared to conventional field spreading or soil-injection techniques -- reduced energy, labor, andmachinery costs (Beth and Filters, 1981). A nitrogen management scheme of multiple fertigationapplications with smaller amounts of N would reduce the need for large preseason or early-season
applications, often associated with heavy N losses(Silvertooth et al., 1992; Watts et al., 1993).Fertigation is also more compatible withmanagement tools such as residual soil nitrateassessment and in-season plant-tissue tests(Adamsen and Rice, 1995). In many cases,fertigation may be the only practical andeconomical method to apply additional nitrogen tosurface-irrigated crops once the development of thecrop precludes the use of machinery fertilizerapplications. However, comprehensive guidelinesfor surface irrigation systems have not yet beenadequately developed (Watts and Schepers, 1995).
Burt et al. (1995) provide a few general guidelinesfor fertigation in furrow and border-strip systemswith tailwater runoff. One suggestion was to injectthe fertilizer at a constant rate during the entire
irrigation event. This recommendation assumes that the N-laden tailwater runoff will be blended withother water and reused in another field. Preliminary modeling studies have indicated that the timingand duration of fertigation applications during a surface-irrigation event play a critical role indetermining the distribution of fertilizer in the field and the potential for nitrate movement to thegroundwater (Watts et al., 1993; Playan and Faci, 1997). Deeper leaching of nitrogen can occur whenusing fertigation because the nitrogen, as NO3, is already dissolved and moves with the water morereadily than soil-applied fertilizer (Jaynes et al., 1992). The most effective fertigation practice appearsto be strongly tied to the specific field conditions for the irrigation system, as demonstrated by themodels of Playan and Faci (1997), Watts et al. (1993), and Boldt et al. (1994).
Santos et al. (1997), used simulation and field measurements to characterize nitrate movement underlevel-basin irrigation/fertigation. They established, for a particular sandy loam soil in SouthernPortugal, that the transport and fate of NO3-N was highly dependent on soil water movement, i.e.,advection was governing the solute transport processes and dispersion was not important. If theirrigation uniformity is poor and if water freely flows off the end of the field, a large portion of the

82
applied N can be either leached below the root zone in the areas with excessive infiltration ortransported in solution with tailwater runoff.
The importance in adjusting the timing and duration of a fertigation application during the irrigationevent is illustrated theoretically for a level basin irrigation system (Fig. 6). Three options wereconsidered -- injecting the fertilizer during the first 50% of the irrigation, the last 50%, or over theentire duration of the irrigation. To illustrate the problem, the curves identifying the source ofinfiltrated water in the basin were generated by a very simple advection model with zero longitudinalmixing. Furthermore, it was assumed that all water which enters the soil first is displaced downwardby subsequent infiltration (in fact, some of the early infiltration can remain bound to the soil particlesnear the surface, while later infiltration flows around it, downward, through the remaining pore space).Consequently, the model shows that any deep percolation must contain the first water infiltrated.
The figure shows a relatively uniform infiltrated depth distribution following an irrigation; but waterwhich enters the field in the early part of the irrigation, if not infiltrated en route, is pushed to the endof the field by later inflow and disproportionately infiltrates into the far end of the basin. This exampleillustrates a situation (closed basin) in which applying fertilizer during 100% of the irrigation eventmay be the best fertigation option. Injecting fertilizer during just the first 50% of the irrigation mayresult in poor N distribution uniformity throughout the basin, as suggested by the rather largedifferences between the infiltrated depths at the far end versus other areas of the basin after the first50% of the irrigation water has infiltrated. Also, deep percolation N losses would be proportionatelyhigh, since all of the water in deep percolation is contributed by just the first 25% of the irrigation. Incontrast, adding fertilizer during just the last half of the irrigation would result in too much N at thefront end of the basin and too little at the far end, although there would be no N lost due to deeppercolation. Applying fertilizer during 100% of the irrigation would result in a relatively evendistribution of N in the root zone with a small portion of the total N leached with deep percolation (asrepresented by the area underneath the deep percolation curve). Quite different conclusions emergewith the same kind of simulation applied to sloping-border irrigation with tailwater runoff; in this casethe smallest N losses are incurred with fertigation during the middle 50% of the irrigation. All of theseconclusions are based on the aforementioned simple advection model, assuming, moreover, no spatialvariability in soil properties; field verification is required.
We conducted a few fertigation experiments in level basins cropped to cotton, applying potassiumbromide, a mobile tracer, during the whole 100%, the first 50%, and the last 50% of an irrigationevent. The data have not yet been completely analyzed, but notable differences that appear in post-irrigation bromide distributions resulting from the different treatments suggest that significant progresscan be made towards defining best fertigation management strategies in surface irrigation systems.

83
Results of CSREES-CRIS Search
A search of current and recent CRIS projects shows no research related to Objectives 1 and 2.
The sediment aspects of Objective 3 are addressed by research in ARS laboratories in West Lafayette,Indiana, (Implementation of Water Erosion Prediction Project, with L.D. Norton and D.C. Flanagan),Oxford, Mississippi (Evaluation of soil erosion and sediment transport processes on support of theDEC project with M.J. Romkens and C.V. Alonso ), as well as Kimberly ID, with D.L. Bjornebergand others. Nutrient constituents of irrigation water are addressed at Utah State University, Logan(Chemical application strategies for surface irrigation systems, with W.R. Walker and G.P. Merkley),and Univ Nebraska, Lincoln (Agrichemical control in irrigation runoff water from surface irrigatedfields, with C.D. Yonts, R.G. Wilson).
Objective 4 is supported by three active non-ARS projects, two at Yuma AZ and one at Logan UT thatare conducting research on fertigation in surface irrigation systems and one project completed in 1997at Lincoln NE. We currently cooperate with the projects at Yuma AZ. In addition to the abovefertigation projects, we also found two active CRIS projects and two inactive projects dealing withsurface irrigation and nitrogen management. Our project is unique in that we are developing guidelinesfor injecting fertilizer into the water during operation of surface irrigation systems. This work willencompass a wide range of field conditions including a variety of soil types, irrigation inflows, andlength of run and other aspects of irrigation system design.
APPROACH AND RESEARCH PROCEDURES
Objective 1 - Irrigation Software
Experimental Design
(a) Our current suite of stand-alone OS-based software products for one-dimensional surface-irrigationsimulation (SRFR) and system design and management aids (BORDER, BASIN) will be reconfiguredwithin a single shell, facilitating sharing of information. Bautista, Adamsen and Strelkoff willinvestigate alternative software development platforms on which to build this new software. Initialdevelopment will be Microsoft Windows but maximum portability to new PC operating systems isintended as these develop. Any such software needs to be object oriented. Appropriate ways will besought for dealing with FORTRAN legacy code comprising the simulation and (interpolation-based)design engines. In addition, we will modify the SRFR simulation engine, as necessary, to allow it tointerface with routines for erosion, sedimentation, and chemical transport. Whether the overallsoftware shell development will be done in-house with current programmers or contracted out is yetto be determined.
In addition, Strelkoff and Clemmens will explore the possibility of linking the infiltration routines witha subsurface water and chemical transport model HYDRUS or UNSATCHEM (ARS, Riverside). Thiswould allow use of soil physical data in determining infiltration rather than the current empiricalapproach. At a minimum, we will investigate SRFR’s current options for treating the effect of furrowwetted perimeter on infiltration by comparing them with the more fundamental approach afforded by

84
800
CONTOUR INTERVAL: 5%
INFLOWRATE (l/s)
FURROW LENGTH (m)
1
2
3
4
5
200 400 600
20%
40%
40%
60% 60%
60%
Figure 7. Potential ApplicationEfficiency based on minimum depthequal to required depth (k = 30.1 mm/hra,a = 0.51, n = 0.05, W = 1 m, S0 = 0.002,dreq = 80 mm)
the subsurface models which accept time-varying depths in a furrow as a boundary condition. A rangeof soil textures from sandy loam to clay loam will be used for several representative furrow shapes.
Initially, these simulations will be run with a constantwater level. Then, we will input varying water surfacehydrographs that are representative of different surfaceirrigation conditions (e.g., different locations along thefurrow, different flow rates, etc.). Field tests (Hunsaker,Adamsen) will be run at the Maricopa AgriculturalCenter to compare model and field results inconjunction with experiments described in Objective 3,below.
(b) Our current design software, based on a staticdatabase of previously run simulations, is limited in itsrange of applicability (even though expressing theresults in non-dimensional form requires orders ofmagnitude less data). Simply extending this rangewould not be worthwhile because the designs would stillbe limited by the currently assumed border-stripgeometry and two-parameter Kostiakov infiltrationequation; and simulation and search procedures havenot proven to be robust enough for novice users. Soeven with the ever increasing speed of personalcomputers, they still do not provide an adequate designapproach. We recently developed a new approach that
combines a very simple design approach with a limited number of simulations (Clemmens et al, 1998).This new approach mimics the approach in BORDER, where the performance parameters such asapplication efficiency are displayed as contours on a two-dimensional graph of two unknown designparameters (e.g., flow rate and field length). Under this approach, a single simulation is run at whatwe call an anchor point. The simulation results are used to tune the parameters of a simple designprocedure which uses continuity, an assumed surface shape factor and a simplified recession relationship(Clemmens et al. 1998). This simplified design approach, with the tuned parameters, is used tocalculate the performance parameters of interest (e.g., potential application efficiency) on a grid withinthe two-dimensional graph – through which the performance contours are drawn. An example isshown in Fig. 7 for furrow irrigation. The accuracy of the results varies with distance from the anchorpoint. Simulation at another point (perhaps as many as four) will be used to judge the accuracy ofextrapolation or to allow interpolation. Further studies will determine the range over whichextrapolation is acceptable. Within the software (Clemmens, Strelkoff, Bautista), the user will be ableto execute a simulation at any point on the grid to determine the actual conditions there and note howfar they deviate from the design solution presented. This new approach should be more robust thansimulation-based search procedures and more accurate than the simplified design approach withouttuning. It also has the advantage of allowing a wide variety of infiltration and roughness functions inaddition to the full range of possible conditions for other input variables.

85
(c) A difficulty with the current software is selecting appropriate values for field infiltration androughness coefficients needed as input to both simulation and design programs. A new softwarecomponent for the SRFR suite will be generated to help users estimate these parameters frommeasured irrigation data (Bautista, Strelkoff, and Clemmens). It will be geared toward handling spatialand temporal variability. In addition, the measured irrigation data will be used, to the extent possible,to provide an evaluation of the irrigation event (e.g., application efficiency, distribution uniformity)based both on the measured data and on simulation with the estimated parameters.
The difficulty in developing such software comes from the variation in the type and amount of fielddata available. With research-level data, such parameters can be determined with good accuracy.However, typical surface irrigation evaluations by NRCS, mobile field labs, etc. provide a limitedamount of data. Then assumptions have to be made, making the results potentially less accurate.Inaccurate parameter estimates can lead to inaccurate recommendations from the simulation anddesign programs. The proposed software will include routines for making parameter estimates that usethe best available method (or methods) for the available data -- ranging from a minimum of data(inflow rate and advance times) to comprehensive research data (e.g., including water surfacehydrographs). We have grouped the methods into four main categories, shown below. We are beingassisted in evaluating these methods by the ASCE Task Committee on Soil and Crop HydraulicProperties (chaired by Strelkoff). This group plans to publish guidelines for selection of methodsbased on the data-collection requirements of each method and on the expected accuracy.
Methods that measure only advance:• Shepard et al, 1993 (one-point method)• Elliott and Walker, 1982; Smerdon et al,
1988 (two-point method)• Clemmens, 1991 (direct inversion of ZI
solution)• Walker and Busman, 1990 (simplex
method minimizes differences betweenmeasured and simulated advance)
• Bautista and Wallender, 1993 (Marquardtmethod minimizes differences betweenmeasured and simulated advance)
• Clemmens and Keats, 1992; Clemmens,1992 (Baysian estimation)
Methods that measure advance, recessionand enough water depths, y(x,t), to estimatethe volume of surface water, Vy(t) (volume-balance methods):• Finkel and Nir (unstable); Maheshwari et
al, 1988 (stable)• Gilley, 1968 (underestimates k, a for a
complete irrigation)• Roth et al, 1974 (Fangmeier’s method);
Fangmeier and Ramsey (1978)• Strelkoff et al, 1999 (EVALUE, interactive
selection of infiltration parameters;roughness follows)
Methods that measure advance and/orrecession:• Clemmens, 1981• Scaloppi et al, 1995• Monserrat and Baragan, 1998
Methods that measure advance and somewater depths:• Katopodes et al. 1990• Valiantzas, 1994• Playan and Garcia-Navarro, 1997• Yost and Katopodes, 1998

86
-20
-15
-10
-5
0
5
10
15
0
200
400
600
800
Time (min)
Flow
Rat
e (c
fs)
MeasuredComputed
Figure 8. Measured and computed flow rateinto and out of a 2.5 ha level basin withdrainback. Eloy, AZ 9/3/98
Contingencies
The difficulty in filling vacancies for computer programmers is currently a significant problem.Student programmers often do not have the training and experience needed. We are consideringcontracting out portions of the software development as a necessity, although that can lack thedesirable characteristics of long-term association with the project and retention of control by thescientists. If HYDRUS or UNSATCHEM is unable to adequately model soil infiltration or we areunable to link it with SRFR, we will explore other models. If simulation at a single point is notadequate for our design method, we will use more simulations to avoid extrapolation. There are sucha wide variety of parameter estimation techniques available that we should be able to find appropriatemethods for our software.
Collaborations
Necessary (within ARS) – Don Suarez, Rien van Genuchten, U.S. Salinity Laboratory on USSL soilwater/chemistry flow models. Necessary (external to ARS) – Tom Spofford, National Water andClimate Center, NRCS, on relevance of research to NRCS field offices.
Objective 2 - Surface-Drained Level Basins
Experimental Design
Adoption of level basins with surface drainage by farmers is well ahead of our ability to providedesign and operating recommendations. We have added the ability to remove applied irrigation water
by surface drainage to the one-dimensional SRFRsimulation software (Strelkoff et al 1998). A fewfield studies also have been conducted to providepreliminary data about the drain-back level basinsystems, as used in the southwestern U.S.(Arizona, Colorado, Utah). Figure 8 shows apreliminary comparison between simulated andmeasured hydrographs with drainback for 2.5 haflat-planted level basin (i.e., no furrows).Evaluation procedures followed the methods ofMerriam and Keller (1978). In this example, thegross application depth (volume over field area)was 112 mm, while a volume representing 57 mmover the field surface drained off -- slightly morethan half! While the fit of the data in Fig. 8 isgood, the difference between the measured andsimulated hydrographs represents 13 mm ofapplied water; 52 mm and 65 mm, respectively,remained on the field as measured and as
modeled. We observed channeling of the flow that drained off the field surface, allowing more water

87
to drain off than if flow had remained one-dimensional. Prior research had all been done under furrowirrigation, in which undulations in the furrow bottom elevation can be expected to reduce the predictedsurface drainage (Dedrick and Clemmens 1988). We intend to conduct additional field studies on thesedrain-back level basins to further test our one-dimensional model and to determine its limitations.
Extensive field testing conducted in the late 1980s on drainage from irrigated furrows will be used totest the SRFR model routines for drainback (Clemmens, Strelkoff). Several dozen test furrows wererun on two different soil textures; however, this preceded the addition of the drainback routines inSRFR (Strelkoff 1990). If necessary, we will conduct addition field tests on drain-back level basinswith furrows (Hunsaker). We have half a dozen potential cooperators and will contact them as theneed arises.
Once validated, we will conduct studies with the SRFR model to develop recommendations for (1)design and (2) operations. Initial design recommendations will be based on comparison to designsbased on level basins without drainback according to the BASIN software. In particular, we will tryto determine how to adjust the input to BASIN to give reasonable recommendations for drainbackdesign, for example, increasing the depth of application entered as design input, since some fractionwill drain off. Second, we will examine current operating criteria on when to cut off the water and startdrainback or whether to hold water on the basin by allowing only partial drainback for a period of time(i.e, by holding a constant water level in the ditch and letting the inflow pass through to the nextbasin).
Clearly, even with the drain-back level basins, there is a need to model the two-dimensional natureof the flow to capture the influence of an undulating surface topography on drainage. With the gridof surface drainage channels (spin ditches) used in Louisiana, a two dimensional model is essentialfor modeling not only the irrigation and its drainage but also the drainage following significant rainfallevents. Bautista and Clemmens will conduct field tests of irrigation events on these systems inLouisiana, both to evaluate their performance and to provide field data. Such evaluation will requiremore extensive data on field and water surface elevations than more traditional irrigation evaluations(Clemmens et al, 2001). In order to model this phenomenon (Strelkoff, Clemmens, Bautista), we willstart with our existing two-dimensional model (Strelkoff et al, 2001) and assume that these spinditches are one cell wide and just give them a lower elevation. This either creates a huge number ofuniformly sized cells, or requires us to modify our computational routines to allow a non-uniform gridspacing. Another alternative is to model the spin ditches as a one-dimensional grid with side inflowand outflow. If these methods don’t produce useful results, we will consider other models such asdeveloped by Playan (1994) or Khanna (2000). Two-dimensional river flooding models are notadequate since they do not handle advance on a dry-bed, and they ignore flow over and throughsurface depressions because of computational difficulties (personal communication, Gary Feeman,West Consultants, Inc.).
Once a validated two-dimensional model is developed, Bautista and Clemmens will use it initially toassist farmers with proposed designs. They will conduct studies to provide preliminary designguidance, for example, spin-ditch spacing. For Louisiana and other areas in the humid South, this maybe constrained more by the requirement for draining off rainfall than by irrigation concerns. We plan

88
to observe these basins during rainfall events to determine how long it takes for them to drain. Thenature of the microtopography is expected to have a significant effect on drainage and thus on themodeling. Understanding the limits of this technology is important for avoiding failures that wouldslow adoption.
To date, information on the economic advantages of level basins, drainback level basins (Arizona) andgrid-drained level basins (Louisiana) is all anecdotal (e.g., Clemmens 2000). Results in Arizonagenerally suggest conversion to level basins is economical only if water costs are high or yieldsincrease by at least 10%. Such yield increases have been reported in several studies (Bathurst 1988,Galusha 1986). Conversions to drainback level basins are less expensive and have shown payback inone to two years. In Louisiana, yield increases of 20 to 40% have been reported over traditional furrowirrigation perhaps due to land leveling. Data on the systems in Louisiana have been insufficient eitherto determine the cause of the yield changes or to conduct an economic analysis of the new systems.Bautista will collect sufficient information on the costs and benefits of systems which have beenconverted so that an economic analysis can be performed. Interviews with growers and irrigators willensure that the recommendations are compatible with farming practice and will be viewed as leadingto effective, safe approaches to farm profitability and sustainability. As these studies unfold, we willcontact appropriate extension personnel in Louisiana and neighboring states to assist us in theanalyses. We also plan to establish links with the ARS station in Stoneville, Mississippi, which iscurrently hiring an irrigation engineer.
Contingencies
Development of a useful two-dimensional model could fail due to scale problems (i.e., 0.2 m-widedrainage channel versus a 50 m-wide field surface). In this case we may explore a multiple furrowmodel partially developed but on hold. Field evaluations rely on farm cooperators. We have severalin Arizona and Louisiana and can find alternates if current cooperation does not continue.
Collaborations
Necessary (ARS) – New hire irrigation engineer, Stoneville MS. Necessary (external) – Farm owner, manager of test fields; Tom Spofford, NWCC, Mike Sullivan,NRCS National Water Management Center, Little Rock AR on local needs and practical applications;distribution and training.
Objective 3 - Fate and transport of sediment, phosphorus, and nitrogen
Experimental Design:
MODELING
Erosion: Strelkoff will expand the current single particle-size erosion component of our surfaceirrigation simulation model (SRFR) to accommodate mixes of particle sizes, in the furrow bed and inthe flow. These are not the same, with the mix in the flow typically finer than the mix in the bed(hence, phosphorus enrichment in the irrigation tailwater). The mix of particle sizes in the furrow bed

89
will be measured with relatively coarse subdivisions, either three (% sand, silt, and clay) or five, inwhich fine sands and fine silts are separated out, depending on measurement capabilities of acooperating project at Kimberly, ID (discussed below, under the Field Studies subheading). Withmean, standard deviation, and skew of the distributions measured, we can replace the coarsesubdivisions by a continuous distribution with the same characteristics to enter into the model. Weplan to apply the Borah et al (1982) concept of selective entrainment to each location along a furrowbed of assumed well-mixed particles: the smallest go first, and then larger, and so on, until thetransport capacity at that section is filled. The largest particles may well stay behind, shielding smallerones beneath from detachment. We will apportion the total transport capacity amongst the entrainedsize fractions in accord with Wu and Meyer (1989). Here, the fraction of total transport capacityallocated to a particular particle size in the mixture is governed by a weighting factor, namely, thetransport capacity for a homogeneous soil composed of the given size, relative to the sum of suchtransport capacities for all the fractions carried by the flow. When transport capacity for any size isexceeded, the deposition rate will be based on the pertinent fall velocities, using the Rubey formula(Simons and Senturk, 1992). From these processes, the sediment loads and concentrations at selectedpoints along the furrow will be output, as tables and graphs, as will the profiles of erosion anddepositions along the furrow length. This output can be used to judge the relative merits of one designor management procedure over another.
Phosphorus: Strelkoff and Clemmens will add a component to SRFR to simulate fate and transportof phosphorous (P). P transport is primarily through sorption to soil surfaces with more sorption perunit mass of soil on smaller soil particles. Thus the planned full particle size-distribution erosioncomponent in SRFR is essential. In addition, P desorbs from the soil and can be transported in theliquid phase. Initial studies of this desorption process will be used to develop relationships formodeling the advection and dispersion of ortho-P in the flowing water. Batch studies from acooperating project at Kimberly ID ( Field Studies subheading, below) will be used to developdesorption relationships. We plan to fit a first-order reaction formula to the measured data in whichthe rate of desorption is dependent upon the difference in concentrations, replacing Sharpley’s et al(1981a,b) power law for cumulative desorption with time. This desorption rate is required in thesimulation algorithm.
When the soil is eroded from the soil surface, we will assume P in equilibrium between the solid andliquid phases, i.e. an equilibrium version of Ashraf and Borah (1992). We will evaluate the suitabilityof this approach relative to that used for P desorption from the surface so that they are compatible.If necessary we will implement fully non-linear or time-dependent desorption of P from the entrainedsediment. Furthermore, the transport in the irrigation stream of dissolved and adsorbed P will beassumed by advection alone in a kinematic wave-like formulation. Longitudinal dispersion arisingfrom the interplay of vertical turbulent diffusion and the mean-velocity distribution in the vertical willbe ignored, in keeping with standard practice in modeling sediment transport. To ensure as littlenumerical dispersion as possible, numerical solution of the advection equations will be undertakenby the piecewise method of characteristics on SRFR’s rectangular net in the x-t plane with cubic-spline interpolation along the known time line (Komatsu et al, 1997). This maintains compatibilitywith the SRFR grid used for surface hydraulics and avoids dissipative effects that are strictlynumerical stemming from use of a rectangular grid as commonly used for kinematic-wave solutions.

90
The suitability of the above modeling approach will be evaluated with data from the field studiesconducted by a cooperating project at Kimberly ID (Field Studies subheading below).
The simulations will lead to SRFR output tables and graphs of concentrations and total P-loadhydrographs at selected points along the irrigation furrow, in particular the loading in the tailwater.This output is designed to help guide development of design and management practices that take totalP loading into account.
Nitrogen: Nitrogen (N) transport will be added to SRFR after sediment and P transport have beenverified (Strelkoff, Adamsen, Clemmens). In this case, the N is applied in the irrigation water(fertigation). Initially, N will be considered completely nonreactive with the soil and move only withthe water flow. Complete transverse mixing in the irrigation stream will be assumed whilelongitudinal advection and dispersion will be modeled. Dispersion coefficients will initially be basedon values from the literature. We will investigate ARS software (HYDRUS and UNSATCHEM)developed at other locations for modeling the subsurface transport and fate in response to theconcentration and water-depth histories at the surface. Field studies of N fertigation practices,described below, will be carried out to develop an understanding of various practices on the fate ofapplied N under different application regimes and different surface irrigation systems. These studieswill provide both a basis for preliminary recommendation and data for model validation. Specificsof the modeling approach will depend on results from the P modeling described above.
FIELD STUDIES Erosion, Phosphorus: Field measurements of irrigation water flows and sediment and phosphorusconcentrations, as well as laboratory batch studies of P/soil/water reactions, will be undertaken byour cooperating institution, ARS, Kimberly, ID., under (old) CRIS Project Numbers, 5368-13000-004-00D (Irrigation Management to Reduce Erosion and Improve Water Use Efficiency) and 5368-12130-007-00D (Water Quality Protection in Irrigated Cropping Practices and Systems).
Nitrogen: A series of field experiments will be conducted by Hunsaker and Adamsen to determinethe distribution and potential leaching of nitrogen applied in the irrigation water. Initially, theseexperiments will be conducted at each of 10 proposed field sites as listed in Table 1, which representseveral types of surface irrigation systems and a range of soil types. Each fertigation experiment willinclude four treatments and three replications for a total of 12 field plots per site. Plots will be at least6.5 m wide and as long as the length of run of the field. The four fertigation treatments proposed are(1) fertilizer injection over 100% of the irrigation, (2) just the first half, (3) just the middle half, and(4) just the last half of the irrigation.

91
Table 1. Proposed field sites for fertilizer application studies.
System type Soil types Location CropLevel basin, unfurrowed sandy loam Maricopa, AZ wheat
clay loam Maricopa, AZ wheatLevel basin, furrowed sandy loam Maricopa, AZ cotton
clay loam Maricopa, AZ cottonSloping border without runoff,run less than 275 m
sandy loam Coachella Valley, CA small grain
Sloping border without runoff,run greater than 360 m
sandy loam Coachella Valley, CA small grain
Sloping border with runoff silt loam Coachella Valley, CA small graincracking clay Imperial Valley, CA small grain
Sloping furrows with runoff sandy loam Casa Grande, AZ cottonsilt loam Coachella Valley, CA corn
Preliminary data will be collected at each site to determine field conditions – field geometry,infiltration and roughness, and soil texture. SRFR will be used to determine the application time andflow rate needed for the border width used to achieve the best water application uniformity. Thesewill be used for each irrigation event at the site and adjusted as needed for specific conditions at thetime of irrigation.
During experiments, nitrogen fertigation will be simulated by injecting potassium or calcium bromideinto the irrigation water stream. Bromide was selected because it simulates nitrate well and is presentin low concentrations in the environment, making it detectable as a tracer. In addition, bromide isconserved biologically so that a mass balance can be calculated. While the most common form offertilizer used for injection is urea ammonium nitrate solution, it is the nitrate dissolved in theirrigation water that poses the greatest immediate threat to the environment.
Prior to each simulated fertigation event, soil samples will be taken from the field. Samples will betaken in the non-cropped turn around area at the head of the field if one exists, at the beginning of thecropped area, and then at five evenly spaced locations between the top of the field and the end of therun, resulting in a maximum of seven sample locations in each plot. When the experimental site isfurrowed, a sample will be taken from two adjacent beds and from a wheel and non-wheel furrowbottom at each sampling location. When the site is flat, unfurrowed, two samples will be taken froman area not affected by wheel compaction and two samples from wheel tracks at each samplinglocation. Soil samples will be taken to a depth of 1.2 m and divided into 5 depths, 0 to 0.15, 0.15 to0.30, 0.30 to 0.60, 0.60 to 0.90 and 0.90 to 1.2 m. A complimentary set of samples will be taken assoon after the irrigation event as possible. Plant samples also will be taken after the irrigation foranalysis of bromine. This data should amply show the spatial variability of fertilizer distribution.
Basic irrigation performance data also will be collected for each event (Merriam and Keller 1978). Inaddition, water depths will be measured directly with rulers placed in the field at selected locations.

92
Water samples will be taken every 15 minutes from the input water stream below the injection pointand when runoff occurs from the runoff stream.
Soil samples will be analyzed for bromide and gravimetric water content and nitrate. Samples will bekept in a field-moist condition from sampling until gravimetric water content measurements can bemade. During transport from the field to the laboratory, samples will be stored on ice to preventnitrification. Sub-samples will be taken for soil moisture contents. Nitrate and bromide will beextracted from the samples with a 1:1 weight to volume water extraction. Plants will be analyzed forbromine after acid digestion of the plant material. Nitrate determinations of soil extracts and watersamples will be made with an autoanalyzer using cadmium reduction (Adamsen et al., 1985) andbromide determinations on soil extracts, water samples, and plant digestions will be made with anautoanalyzer using a fluorescein dye method (Marti and Arozarena, 1981).
Distribution of bromide will be compared to the infiltrated water depth distribution from each fractionof the irrigation to determine the degree of mixing that occurred between fractions and the degree ofvariability that exists. The estimates of mixing between fractions will be used to help validate the Nfate and transport component for SRFR, proposed above. Additional field studies will be conductedas needed to validate this aspect of the model.
Contingencies
In the event the proposed computational algorithms fail to yield satisfactory predictions, the programof field and laboratory measurements of sediment movement and chemical exchanges will provide anempirical basis for alternate algorithms. The proposed project does not deal with the movement ofwater and chemicals below the soil surface, and the results could be limited by not properly modelingthis aspect. However, other scientists, both within and outside ARS, have such capabilities (e.g., asnoted at ARS Riverside) that can be used to significantly enhance this project. Field heterogeneity andpreferential flow can often cause significant differences in infiltration rates during irrigation, whichmay produce misleading results of bromide distributions and irrigation uniformity during some of ourexperiments. Results may be inconclusive due to excessive heterogeneity.
Collaborations
Necessary (within ARS) – Dale Westermann and David Bjorneberg (ARS Kimberly) to collectsediment samples in the field and analyze for physical and chemical-exchange properties. Don Suarezand Rien van Genuchten (ARS Riverside) on modeling water and chemical movement below the soilsurface. Necessary (external to ARS) – T. Spofford, NWCC (NRCS).
Objective 4 - Guidelines for water and fertilizer application
Experimental Design
Hypothesis: Timing and duration of fertilizer injection during surface irrigation events affects the fateand uniformity of nitrogen fertilizer. The appropriate timing and duration of fertilizer injection isaffected in predictable ways by many factors including irrigation system design, infiltration rates
93
which are in turn affected by soil type, tillage, frequency of irrigations, and sealing of the soil surfaceas a result of previous irrigations. The investigations will be performed primarily by Hunsaker,Adamsen, and Clemmens.
The results of the field experiments should provide an estimate of the uniformity of fertilizerapplications in surface irrigation system when the fertilizer is added to the irrigation water duringdifferent periods of the irrigation. The experimental design encompasses a range of soil types andcommon designs of surface irrigation systems. The preliminary data set will be robust enough toprovide basic guidance to farm managers and consultants for BMPs for fertigation with surfaceirrigation systems. These guidelines will be disseminated to Cooperative Extension and NRCS fieldoffices as they become available as well as published in refereed scientific journal articles.
The simulation model will be used to conduct a more systematic study of the preliminaryrecommendation developed from the field studies. This will allow us to examine tradeoffs in thedesign and operation of surface irrigation systems, including chemigation, and to developrecommendations, taking into account prevalent farmer attitudes and practices. The scope of thesestudies depends on the results of the field studies and the capabilities of the simulation model toreproduce those results.
Contingencies
The development of comprehensive fertigation recommendations relies on our being able to modelthe movement of nitrogen under surface irrigation. Recommendations can be made without this, butwill be less generally applicable.
Collaborations
Necessary (within ARS) – None. Necessary (external to ARS) – T. Spofford, NRCS.
NATIONAL COLLABORATION
All four NP201 Water Quality and Management Policy Initiatives are supported by this research.USWCL’s contribution to the Initiatives on TMDL Monitoring and Research and Coastal WaterQuality Protection relates to the edge of field and other offsite contributions of surface irrigation tosediment, phosphorus, and nitrogen in the watershed (Problem Areas 2.6, 3.1, 3.4, 3.7). The initiativeon Drought and Water Scarcity is addressed in connection with Problem Area 2.3. The WaterResources Models, Decision Support Tools and Information Databases National Initiative, issupported by USWCL’s development of surface irrigation software. ARS laboratories outsidePhoenix address these initiatives primarily at the watershed scale and in connection with irrigationsprinkling and microirrigation systems. Deliverables stemming primarily from the Phoenix locationare validated models, software assisting in design and management of surface irrigation systems, andrecommendations on water and nutrient applications in surface irrigation, as detailed in the abovesections. Collaborative efforts are currently ongoing with Spofford, NRCS Water and Climate Center,Portland OR to ensure the relevance of our program to NRCS field applications, and withWestermann and Bjorneberg, ARS Kimberly ID on soil erosion and P transport under surface

94
irrigation. We anticipate expanded cooperation with Suarez and van Genuchten, ARS Riverside CAon modeling water and nitrogen movement in soils under surface irrigation. We hope to establishcooperative relationships regarding level basins in humid areas with the irrigation engineer to behired at ARS Stoneville MS to complement those established with Sullivan and Carman at the NRCSNational Water Management Center in Little Rock AR.
PHYSICAL AND HUMAN RESOURCES
The USWCL has full time staff and laboratory facilities to conduct a wide variety of agriculturalresearch. In addition to high speed LAN and Internet connections, the Lab’s PCs are well-equippedwith current word-processing, spreadsheet, graphics, presentations, and development software. Asoils laboratory is available to conduct, e.g., soil particle size analysis. Soil samplers, neutronscattering, and TDR equipment is available for field analyses. An analytic chemistry lab is availablefor analyses of water and soil samples. An electronics shop, staffed with an electronics engineer, isavailable for development and repair of electronic instruments as needed. The Maricopa AgriculturalCenter, The University of Arizona, is available for nitrogen field work. Field and laboratory batchstudies on phosphorus will be conducted by a collaborating facility, the ARS NWISRL, at KimberlyID.
In addition to the named category I scientists, three Physical Science Technicians (2.8 FTE), atemporary Computer Specialist and Computer Assistant will be employed in this research. Inaddition, a temporary category II (Post-Doctoral Research Scientist, 1.0 FTE, GS-12 termappointment) position is in the process of being filled. Though the position is funded extramurally,much of the incumbent’s responsibilities will lie within the purview of this project.
MILESTONES AND EXPECTED OUTCOMES
Expected outcomes include an extended surface-irrigation-simulation model (SRFR) with fate andtransport of water, sediment, phosphorus, and nitrogen in the irrigation stream. The simulation modelis to be part of an integrated user-friendly suite, SRFRSuite, including design/management aids andfield-evaluation components. We expect to publish guidelines for the design and management ofsurface-drained level basins and for fertigation management in surface irrigation.

95
Milestone Timeline
ResearchComponent End of year 1 End of year 2 End of year 3 End of year 4 End of year 5
SRFRSuite:hydraulics
Selectplatformlanguages
Completefield-evaluationcomponent
Completefurrow-designcomponent
CompleteSRFR Suite
Surface-drainedlevel basins
Completefield studiesof GSDLB(grid-supplied& drainedlevel basins)
Guidelinesfor DBLB(drainbacklevel basins)
Completemodeling ofGSDLB
Guidelinesfor design andmanagementof GSDLB
SRFRconstituentsimulation
Completesedimenttransportcomponent
Completephosphorusfate andtransport
Validate andcalibratesediment andphosphorusmodels
Complete Ntransport in theirrigationstreamCouple to soil-water/chemistry model
Validate andcalibratenitrogenmodel
Nitrogenfertigationmanagement
Field studiesof nitrogenuniformityand efficiencycompleted
Preliminaryguidelines onfertigationwith surfaceirrigationissued
Finalguidelines onN fertigationwith surfaceirrigation
LITERATURE CITED
Abbott, M.B. 1979. Computational Hydraulics. Pitman Publishing, Ltd. London, England
Adamsen, F.J. and R. C. Rice. 1995. Nitrate and water transport as affected by fertilizer andirrigation management. In Clean Water - Clean Environment - 21st Century Conf. Proc., Volume II:Nutrients, 1-4. Kansas City MO, March 5-8, 1995. St. Joseph MI: ASAE.Ahuja, L.R. 1982. Release of a soluble chemical from soil to runoff. ASAE Trans 25(4):948-956,960.

96
Akanbi, A.A. and N.D. Katopodes. 1988. Model for flood propagation on initially dry land. Journalof Hydraulic Engineering, ASCE, 114(7):689-706.
Alonso, C.V., W.H. Neibling, and G.R. Foster. 1981. Estimating sediment transport capacity inwatershed modeling. Trans. ASAE 24, 1211-1226.
Ascough II, J.C., D.C. Flanagan, G.H. Leavesley, L.R. Ahuja, and O. David. 2001. Naturalresources and erosion modeling using a modular systems approach. Proceedings of the InternationalSymposium, Soil Erosion Research for the 21st Century, Sponsored by the ASAE, 3-5 January, 2001,Honolulu HI, pp. 83-86.
Ashraf, M.S. and D.K. Borah. 1992. Modeling pollutant transport in runoff and sediment. Trans.ASAE 35(6), 1789-1797. (Rutgers University, New Brunswick NJ)
Bathurst, V.M. 1988. Wellton-Mohawk On-Farm Irrigation Improvement Program Post-EvaluationReport. U.S.D.A., Soil Conservation Service, Phoenix AZ. 40 p.
Bautista, E. and W.W. Wallender. 1993. Identification of furrow intake parameters from advancetimes and rates, Journal of Irrigation and Drainage Engineering, ASCE, 119(2): 295-311.
Bellos, C.V., J.V. Soulis, and Sakkas. 1991. Computation of two-dimensional dam-break inducedflows. Adv. in Water Resources, 14(1):31-41.
Beth, F. and A. Filters. 1981. Fertigation gains increasing acceptance. Irrigation Farmer 8(3):2.
Bjorneberg, D.L., T.J. Trout, R.E. Sojka, and J.K. Aase. 1999. Evaluating WEPP-predictedinfiltration, runoff, and soil erosion for furrow irrigation. Trans. ASAE 42(6):1733-1741.
Blair, A.W., E.T. Smerdon, and J. Rutledge. 1984. An Infiltration Model for Surge Flow Irrigation.Proceedings of the Specialty Conference of the Irrigation and Drainage Division ASCE, Flagstaff AZ.pp. 691-700.
Boldt, A.L., D.G. Watts, D.E. Eisenhauer. and J.S. Schepers. 1994. Simulation of water appliednitrogen distribution under surge irrigation. Trans. ASAE 37(4):1157-1165.
Borah, D.K., C.V. Alonso, and S.N. Prasad. 1982. Routing graded sediments in streams:Formulations, Journal of Hydraulic Engineering, ASCE, 108:1486-1503.
Borah, D.K. and P.K. Bordoloi. 1989. Nonuniform sediment transport model, Trans. ASAE,32:1631-1636.
Burt, C., K. O’Connor, and T. Ruehr. 1995. Fertigation. San Luis Obispo, Calif.: Irrigation Trainingand Research Center, Calif. Polytechnic State Univ.

97
Clemmens, A.J. 1981. Evaluation of Infiltration Measurements for Border Irrigation. AgriculturalWater Management, 3. pp. 251-267.
Clemmens, A.J. 1991. Direct solution to surface irrigation advance inverse problem, Journal ofIrrigation and Drainage Engineering, ASCE, 117(4): 578-594.
Clemmens, A.J. 1992. Feedback control of basin-irrigation system, Journal of Irrig and DrainageEngr, ASCE, 118(3):480-496.
Clemmens, A.J. and J.B. Keats. 1992. Baysian inference for feedback control. I. Theory. Journalof Irrig and Drainage Engr, ASCE, 118(3):397-415.
Clemmens, A.J. and J.B. Keats. 1992. Baysian inference for feedback control. II. Surface irrigationexample. Journal of Irrig and Drainage Engr, ASCE, 118(3):416-432.
Clemmens, A.J., A.R. Dedrick, and R.J. Strand. 1995. Basin 2.0 -- A computer program for thedesign of level-basin irrigation systems. WCL report No. 19, U.S. Water Cons. Lab., Phoenix AZ.
Clemmens, A.J., E. Camacho, and T.S. Strelkoff. 1998. Furrow irrigation design with simulation.Proceedings, 1998 International Water Resources Engineering Conference, ASCE, Memphis, TN,August 3-7. 1135-1140.
Clemmens, A.J. 2000. Level-basin irrigation systems: adoption, practices, and the resultingperformance. In: 4th Decennial Irrigation Symposium. Phoenix AZ, USA. November 14-16. AmericanSociety of Agricultural Engineers. St. Joseph MI, pp.273-282.
Clemmens, A.J., T.S. Strelkoff, and E. Playan. 2001. Field verification of two-dimensional surfaceirrigation model . Journal of Irrigation and Drainage Engineering, ASCE (tentatively accepted).
Davis, D.D. 2000. HEC Next-Generation Software. Minutes of the Interagency HydrologicProcesses Modeling Workshop, Subcommittee on Hydrology, Sheraton Tucson Hotel, Tucson AZ,November 8-9, 2000.
Dedrick, A.R. 1983. Light irrigations with level basins - - a novel approach. Proceedings, 13th CA-AZ Alfalfa Symposium, 7-8 December, 1983, pp. 89-92.
Dedrick, A.R. 1984. Water delivery and distribution to level basins. Water Today and Tomorrow.Proc. Irrigation and Drainage Division Specialty Conference, ASCE, Flagstaff AZ, 24-26 July, pp.1-8.
Dedrick, A.R. and A.J. Clemmens. 1988. Hydraulic studies of surface drainage from level basins.Proc. Irrig. and Drainage Specialty Conf., ASCE, 18-21 July, Lincoln NE. pp. 125-132.

98
Eddebbarh, A.A. and T.H. Podmore. 1988. D.R. Hey (ed.) Planning Now for Irrigation andDrainage in the 21st Century, Proceedings of the Irrigation and Drainage Division Conference,ASCE, Lincoln, NE. 18-21 July. pp. 116-124.
Eisenhauer, D.E., D.F. Heerman, and A. Klute. 1992. Surface sealing effects on infiltration withsurface irrigation. Trans ASAE, 35(6): 1799-1807,
Elliot, W.J., K.D. Kohl, and J.M. Laflen. 1988. Methods of collecting WEPP soil erodibility data.ASAE paper No. MCR 88-138. St. Joseph MI.
Elliott, R.L. and W.R. Walker. 1982. Field Evaluation of Furrow Infiltration and AdvanceFunctions, Transactions of the ASAE, Vol 25: 396-400.
Enciso, J., D.L. Martin, D.E. Eisenhauer, and N.L. Klocke. 1991. Predicting Furrow InfiltrationRates Under Water Limiting Conditions, Paper No. 91-2101, written for presentation at the 1991International Summer Meeting sponsored by the ASAE, Albuquerque Convention Center,Albuquerque NM, June 23-26. pp. 1-32.
Fangmeier, D.D. and M.K. Ramsey. 1978. Intake characteristics of irrigation furrows, Transactions,American Society of Agricultural Engineers, 21(5): 671-674.
Fangmeier, D.D. and T.S. Strelkoff. 1979. Mathematical models and border-irrigation design.Transactions of the American Society of Agricultural Engineers. 22(1): 93-99.
Fernandez Gomez, R. 1997. La erosion del suelo en el riego por surcos, PhD Dissertation,Universidad de Cordoba, Cordoba, Spain.
Finkel, H.J. and D. Nir. 1960. Determining infiltration rates in irrigation borders. Journal ofGeophysical Research, 65:2125-2131.
Flanagan, D.C. and M.A. Nearing, eds. 1995. USDA-Water Erosion Prediction Project: TechnicalDocumentation. NSERL Report No. 10. West Lafayette IN:USDA-ARS-NSERL.
Foster, G.R. 1982. Modeling the erosion process. Ch. 8 in Hydrologic Modeling of SmallWatersheds, Haan, C.T., Johnson, H.P. and Brakensiek, D.L., editors, ASAE Monograph, St. JosephMI 49085.
Freyberg, D.L. 1983. Modeling the Effects of a Time-Dependent Wetted Perimeter on Infiltrationfrom Ephemeral Channels, Water Resources Research, Vol. 19, No. 2. April. pp. 559-566.
Freyberg, D.L., J.W. Reeder, J.B. Franzini, and I. Remson. 1980. Application of the Green-AmptModel to Infiltration Under Time-Dependent Surface Water Depths, Water Resources Research, Vol.16, No.3. June. pp. 517-528.

99
Galusha, D. 1986. Determination of Benchmark Field Irrigation System Efficiencies for the CentralBasin AMA'a, Technical Report for the Second Management Plan, Arizona Department of WaterResources, Phoenix AZ.
Gilley, J.R. 1968. Intake function and border irrigation, M.Sc. Thesis, Colorado State University,Fort Collins CO. 130 pp.
Green, W.H. and G. Ampt. 1911. Studies of Soil Physics, Part I -- The Flow of Air and Waterthrough Soils, Journal of Agricultural Science, 4. pp. 1-24.
Haverkamp, R., J.Y. Parlange, J.L. Starr, G.H. Schmitz, and C. Fuentes. 1990. Infiltration underponded conditions: a predictive equation based on physical parameters. Journ. Soil Sci. 149(5) 292-300.
Heathman, G.C., L.R. Ahuja, and O.R. Lehman. 1985. The transfer of soil applied chemicals torunoff. Trans ASAE 28(6):1909-1915, 1920.
Hromadka, T.V. and C.C. Yen. 1986. A diffusion hydrodynamic model (DHM), Adv. WaterResources, 9(3): 118-170.
Izadi, B., D.F. Heerman, and A. Klute. 1990. Trans. ASAE, 33(3):799-806.
Izuno, F.T. and T.H. Podmore. 1985. Kinematic Wave Model for Surge Irrigation Research inFurrows. Transactions of the ASAE, 28(4):July-August pp.1145-1150.
Jaynes, D.B., R.C. Rice. and D.J. Hunsaker. 1992. Solute Transport during chemigation of a levelbasin. Trans. ASAE, 35(6):1809-1815.
Katopodes, N.D. and T.S. Strelkoff. 1978. Computing two-dimensional dam-break flood waves.Journal of the Hydraulics Division, American Society of Civil Engineers, 104(HY9): 1269-1288.
Katopodes, N.D. and T.S. Strelkoff. 1979. Two-dimensional shallow- water wave models. Journalof the Engineering Mechanics Division, American Society of Civil Engineers, 105(EM2):317-334.
Katapodes, N.D. 1990. Observability of surface irrigation advance, Journal of Irrigation andDrainage Engineering, ASCE, 116(5): 656-675.
Katopodes, N.D., J.H. Tang. and A.J. Clemmens. 1990. Estimation of surface irrigation parameters,Journal of Irrigation and Drainage Engineering, ASCE, 116(5): 676-695.
Khanna, M., J.D. Fenton, H.M. Malano, and H. Turral. 2000. Two-dimensional simulation modelfor contour basin layouts in South East Australia. Proceedings of the Watershed Management 2000Conference, Sponsored by the ASCE, June 21-24, 2000, Colorado State University, Ft. Collins CO(on CD-ROM).

100
Killen, M.A. and D.C. Slack. 1987. Green-Ampt -- Model to Predict Surge Irrigation Phenomena. Journal of Irrigation and Drainage Engineering, ASCE. Vol 113, No.4, November:575-584.
Knisel, W.G. 1993 GLEAMS, Version 2.10 (University of Georgia, Tifton, in cooperation withUSDA/ARS Southeast Watershed Research Lab, Tifton) UGA-CPES-BAED Publication No. 5.
Komatsu, T., K. Ohgushi, and K. Asai. 1997. Refined numerical scheme for advective transport indiffusion simulation. Journ. Hyd. Eng., ASCE 123(1):41-50.
Kostiakov, A.N. 1932. On the dynamics of the coefficient of water percolation in soils and on thenecessity for studying it from a dynamic point of view for purposes of amelioration, Trans., 6th
Comm., Int’l. Soc. of Soil Sci., Moscow. In Russian, Part A:17-21, ISSS, Moscow, RussianFederation.
Laflen, J.M., A.W. Thomas. and R. Welch. 1987. Cropland experiments for the WEPP project.ASAE paper No. 87-2544. St Joseph MI.
Laursen, E..M. 1958. The total sediment load of streams. J. Hydr. Div. ASCE 84, 1530-1 – 1530-36.
Maheshwari, B.L., A.K. Turner, T.A. McMahon. and B.J. Campbell. 1988. An optimizationtechnique for estimating infiltration characteristics in border irrigation, Agricultural WaterManagement 13(1):13-24.
Merriam, J.L. and A.J. Clemmens. 1985. Time Rated Infiltrated Depth Families. pp. 67-74 inDevelopment and Management Aspects of Irrigation and Drainage, Specialty ConferenceProceedings, Irrigation and Drainage Division, ASCE, San Antonio TX, July.
Merriam, J.L. and J. Keller. 1978. Farm Irrigation System Evaluation: A Guide for Management,Agricultural and Irrigation Engineering Department, Utah State University, Logan UT, 271 pp.
Meyer, C.R., L.E. Wagner, D.C. Yoder, and D.C. Flanagan, 2001. The modular soil erosion system(MOSES), Proceedings of the International Symposium, Soil Erosion Research for the 21st Century,Sponsored by the ASAE, 3-5 January, 2001, Honolulu HI, pp. 358-361.
Monserrat, J. and J. Barragan. 1998. Estimation of the surface volume in hydrological models forborder irrigation, Journal of Irrigation and Drainage Engineering, ASCE, 124(5):238-247 .
Palomo, M.J., N.A. Oyonarte, L. Mateos. and J. Roldan. 1996. Infiltracion en Riego por SurcosMediante Pulsaciones Intermitentes, XIV Congreso Nacional de Riegos. Aguadulce (Almeria). 11-13June (in Spanish) pp. 235-243.
Peck, A.J. and T. Talsma. 1968. Some Aspects of Two-Dimensional Infiltration, Trans. 9th int.Congr, Soil Sci., Adelaide, Vol. I, pp. 11-21.

101
Philip, J.R. 1957. The theory of infiltration:4. Sorptivity and algebraic infiltration equations. SoilScience, 84:257-264.
Philip, J.R. 1984. Steady Infiltration from Circular Cylindrical Cavitites. Soil Science of AmericaJournal Vol. 48 pp. 270-278.
Playan, E., W.R. Walker, and G.P. Merkeley. 1994. Two-dimensional simulation of basin irrigation.I. Theory. Journal of Irrigation and Drainage Engineering, ASCE, 120(5):837-855.
Playan, E., J.M. Faci, and A. Serreta. 1996. "Modeling Microtopography in Basin Irrigation," Journal of Irrigation and Drainage Engineering, ASCE, 122(6): 339-347.
Playan, E. and J.M. Faci. 1997. Border fertigation: field experiments and a simple model. IrrigationScience, 17(4):163-171.
Playan, E. and P. Garcia-Navarro. 1997 Radial flow modeling for estimating level-basin infiltrationparameters, Journal of Irrigation and Drainage Engineering, ASCE, 123(4):229-237.
Purkey, D.R. and W.W. Wallender. 1989. Surge flow infiltration variability. Trans. ASAE32(3):894-900.
Renard, K.G., G.R. Foster, G.A. Weesies,. D.K. McCool, and D.C. Yoder. (Coordinators) 1997Predicting soil erosion by water: A guide to conservation planning with the Revised Universal SoilLoss Equation (RUSLE). U.S. Dept of Agric, Agricultural Handbook 703, 404 pp.
Roth, R.L., D.W. Fonken, D.D. Fangmeier, and K.T. Atchison. 1974. Data for Border irrigationModels. Transactions of the ASAE 17(1), pp. 157-161.
Santos, D.V., P.L. Sousa. and R.E. Smith. 1997. Model simulation of water and nitrate movementsin a level-basin under fertigation treatments. Agricultural Water Management, 32:293-306.
Scallopi, Merkeley, and Willardson 1995. Intake parameters from advance and wetting phases ofsurface irrigation, Journal of Irrigation and Drainage Engineering, ASCE, 121(1):57-70.
Schmitz, G.H. 1993a. Transient infiltration from cavities. I: Theory. Journal of Irrigation andDrainage Engineering, ASCE, 119(3):443-457.
Schmitz, G.H. 1993b. Transient infiltration from cavities. II: Analysis and application. Journal ofIrrigation and Drainage Engineering, ASCE, 119(3):458-470.
Schohl, G.A. and F.M. Holly Jr. 1991. Cubic spline interpolation in Lagrangian advectioncomputation. Journal of Hydraulic Engineering, ASCE 117(2):248-253.

102
Sharpley, A.N., L.R. Ahuja, M. Yamamoto, and R.G. Menzel. 1981a. The kinetics of phosphorusdesorption from soil, Soil Science of America Journal, 45(3):493-496 May-June.
Sharpley, A.N., L.R. Ahuja, and R.G. Menzel 1981b. The release of soil phosphorus to runoff inrelation to the kinetics of desorption, Journal of Environmental Quality, 10(3):386-391 July-September.
Sharpley, A.N., 1983. Effect of soil properties on the kinetics of desorption, Soil Science Society ofAmerica Journal, 47:462-467.
Shepard, J.S., W.W. Wallender. and J.W. Hopmans. 1993. One-point method for estimating furrowinfiltration, Transactions, American Society of Agricultural Engineers, 36(2): 395-404.
Silvertooth, J.C., J.E. Watson, J.E. Malcuit. and T.A. Doerge. 1992. Bromide and nitrate movementin an irrigated cotton production system. Soil Sci. Soc. Am. J. 56(2):548-555.
Simons D.B. and F. Senturk. 1992. Sediment transport technology. 2nd Ed. Water ResourcesPublications. Littleton CO.
Simunek, J., M. Sejna, and M. Th van Genuchten. 1999. HYDRUS-2D, a MS Windows program forsimulating water flow and solute transport in two-dimensional variably saturated media with full-color, high- resolution graphics user interface. U.S. Salinity Laboratory, USDA/ARS, Riverside CA.
Singh, V. S.M. and Bhallamudi. 1997. Hydrodynamic modeling of basin irrigation. Journal ofIrrigation and Drainage Engineering, ASCE, 123(6):407-414.
Slack, D.C. and M.A. Killen. 1989. Closure to: Green-Ampt – Model to Predict Surge IrrigationPhenomena. Journal of Irrigation and Drainage Engineering, ASCE. 115(4), August: 761-765.
Smith, R.E. 1992. Opus, an integrated simulation model for transport of nonpoint-source pollutantsat the field scale. USDA-ARS-NPA, Water Management Research Unit, AERC, CSU, Fort CollinsCO.
Spofford, T.L., Irrigation Engineer, Natural Resources Conservation Service, USDA, 1995. Personalcommunication to Ron Marlow, Water Management Engineer, NRCS, Washington, DC May 3,1995.
Spofford, T.L., Irrigation Engineer, Natural Resources Conservation Service, USDA, 1998. Personalcommunication: memo to ARS, FS, NRCS following interagency WEPP meeting in Orlando FL,July 31, 1998.
Storm, D.E., T.A. Dillaha, III, S. Mostaghimi, and V.O. Shanholtz. 1988. Modeling phosphorustransport in surface runoff, Trans. ASAE 31(1), 117-127 (Virginia Polytechnic Institute and StateUniversity, Blacksburg, VA).

103
Strelkoff, T.S. Theodor. 1990. SRFR. A computer program for simulating flow in surface irrigation.Furrows - Basins - Borders. U.S. Water Conservation Laboratory, 4331 East Broadway, Phoenix AZ.WCL Report #17. 75 pp. December.
Strelkoff, T.S. 1992. Computer simulations and SCS furrow design. Paper No. 92-2521, presentedat 1992 International Winter Meeting sponsored by American Society of Agricultural Engineers.Nashville TN, December 15-18. pp. 1-14.
Strelkoff. T.S., A.J. Clemmens, B.V. Schmidt, and E.J. Slosky. 1996. Border – A design andmanagement aid for sloping border irrigation systems. Model and Computer Program SoftwareDocumentation WCL Report #21, June 13, 1996. 44 pp.; computer program.
Strelkoff, T.S., A.J. Clemmens, and B.V. Schmidt. 1998. SRFR, Version 3.31 – A model forsimulating surface irrigation in borders, basins and furrows, USWCL, USDA/ARS, 4331 E.Broadway, Phoenix, AZ.
Strelkoff, T.S. and D.L. Borneberg. 1999. Hydraulic modeling of irrigation-induced soil erosion. Proceedings 10th International Soil Conservation Organization Conference, Sustaining the GlobalFarm, May23-28, Purdue University, West Lafayette IN.
Strelkoff, T.S., A.J. Clemmens, M. El-Ansary. and M. Awad. 1999. Surface-irrigation evaluationmodels: application to level basins in Egypt, Transactions, American Society of AgriculturalEngineers, 42(4): in press.
Strelkoff, T.S. and A.J. Clemmens. 2000. Approximating wetted perimeter in a power-law crosssection. Journal of Irrigation and Drainage Engineering, ASCE, 126(2):98-109.
Strelkoff, T.S., A.J. Clemmens, and E. Bautista, E. 2000a. Field-parameter estimation for surfaceirrigation management and design. Proceedings of the watershed Management 2000 Conference,Sponsored by the ASCE, June 21-24, 2000, Colorado State University, Ft. Collins, CO (on CD-ROM)pp. 1-10.
Strelkoff, T.S., A.J. Clemmens, and B.V. Schmidt. 2000b. ARS software for simulation and designof surface irrigation, National Irrigation Symposium: Proceedings of the 4th Decennial Symposium.Phoenix, Arizona, USA. November 14-16, 2000. American Society of Agricultural Engineers. St.Joseph MI. pp.290-297.
Strelkoff, T.S., A.H. Al-Tamimi, and A.J. Clemmens. 2001. Two-dimensional basin flow withirregular bottom configuration. Journal of Irrigation and Drainage Engineering, ASCE (tentativelyaccepted).
Talsma, T. 1969. Infiltration from Semi-Circular Furrows in the Field. Australian Journal of SoilResearch. 7. pp.277-284.

104
Tchobanoglous, G. and I.D. Schroeder. 1985. Water Quality Management, Addison-WesleyPublishing Company, Reading, MA
Trout, T.J. 1996. Furrow irrigation erosion and sedimentation: On-field distribution. Trans. ASAE39(5):1717-1723.
USDA (U.S. Department of Agriculture, Soil Conservation Service) 1974. National EngineeringHandbook, Section 15, Chapter 4. Border Irrigation.
USDA (U.S. Department of Agriculture, Soil Conservation Service) 1985. National EngineeringHandbook, Section 15, Chapter 5. Furrow Irrigation.
USDA. 1980. CREAMS: A field scale model for chemicals, runoff, and erosion from agriculturalmanagement systems. U.S. Department of Agriculture, Conservation Research Report No. 26, 640pp.
USDA, 1995. WEPP. User Summary. NSERL Report #11. USDA/ARS 1196 Soil Bldg. WestLafayette IN 47907.
Utah State University. 1989. SIRMOD -- Surface Irrigation Simulation Software. Copyright byUtah State University, Logan UT.
Valiantzas, J.D. 1994. Simple method for identification of border infiltration and roughnesscharacteristics, Journal of Irrigation and Drainage Engineering, ASCE, 120(2):233-249.
van Genuchten, M.Th. 1980. A closed-form equation for predicting the hydraulic conductivity ofunsaturated soils. Soil Sci. Soc. Amer .J. 44(5):892-898.
van Genuchten, M.Th. 1981. Analytical solutions for chemical transport with simultaneousadsorption, zero-order production and first-order decay. J. Hydrol.49:213-233.
Vogel, T. and M. Cislerova. 1988. On the reliability of unsaturated hydraulic conductivity calculatedfrom the moisture retention curve. Transport in Porous Media 3:1-15.
Walker, W.R. and A.S. Humpherys. 1983. Kinematic-wave furrow irrigation model. Journal ofIrrigation and Drainage, ASCE, 109(IR4):377-392.
Walker, W.R. and J.D. Busman. 1990. Real-time estimation of furrow infiltration. Journ of Irrigand Drainage Engr, ASCE, 116(3):299-318.
Wallender, W.W., S. Ardila, and M. Rayej. 1990. Irrigation optimization with variable water qualityand nonuniform soil. Trans. ASAE, 33(5):1605-1611.

105
Watts, D.G., K.A. Ostermeier, D.E. Eisenhauer. and J.S. Schepers. 1993. Fertigation by surgeirrigation on blocked-end furrows. In Conference Proceedings on Agricultural Research to ProtectWater Quality, 523-526. Minneapolis MN, February 21-24, 1993.
Watts, D.G. and J.S. Schepers. 1995. Fertigation to reduce nitrate contamination of groundwater. InClean Water - Clean Environment - 21st Century Conf. Proc., Volume II: Nutrients, 239-242. KansasCity MO, March 5-8, 1995. St. Joseph MI: ASAE.
Weesies, G.A., G.L. Tibke, and D.L. Schertz. 2001. Application of erosion prediction models bya user agency on private lands in the United States, Proceedings of the International Symposium, SoilErosion Research for the 21st Century, Sponsored by the ASAE, 3-5 January, 2001, Honolulu HI, pp.384-387.
Westermann, D.T., D.L. Bjorneberg, J.K. Aase, and C.W. Robbins. 2001. Phosphorus losses infurrow irrigation runoff. Journal of Environmental Quality (In press).
Wischmeier, W.H. and D.D. Smith. 1978 Predicting rainfall-erosion losses A guide to conservationplanning. AH-537. U.S. Dept of Agr, Washington, DC 58 pp.
Wu, C.C. and L.D. Meyer. 1989. Simulating transport of nonuniform sediment along flatlandfurrows. Trans. ASAE 32:1651-1661.
Xanthopoulos, Th. and Ch. Koutitas. 1976. "Numerical Simulation of a Two-Dimensional FloodWave Propagation due to Dam Failure," Journal of Hydraulic Research 14/4. pp. 321-331.
Yalin, M.S. 1963. An expression for bed-load transportation. J. Hydr. Div. ASCE 89, 221-250.
Yanenko, N.N. 1968. Methode a Pas Fractionnaires, P.A. Nepomiastchy, translator, Armand Colin,Paris, France (in French).
Yang, C.T. 1973. Incipient motion and sediment transport. J. Hydr. Div. ASCE 99, 1679-1704.
Yost, S.A. and N.D. Katopodes. 1998. Global identification of surface irrigation parameters. Journalof Irrigation and Drainage Engineering 124(3):131-139.
Youngs, E.G. 1972. Two and Three-Dimensional Infiltration: Seepage from irrigation Channels andInfiltrometer Rings. Journal of Hydrology, 15. pp.301-315.


106
E&PD Organization
MissionThe Environmental and Plant Dynamics (E&PD) Research Group seeks to develop optimumresource management strategies for meeting national agricultural product requirements within thecontext of possible changes in the global environment. There are three main research thrusts: Thefirst is predicting the effects of the increasing atmospheric CO2 concentration and climate changeon the yield and water use of crops in the future. The second thrust seeks to improve agriculturalwater management utilizing remote sensing approaches for observing plant conditions andbiophysical processes which are amenable to large scale resource monitoring using aircraft- andsatellite-based sensor systems. The third research thrust is to develop new industrial crops withunique high value products and lower water requirements for commercial production within thecontext of changing environments.

107
E&PD RESEARCH STAFF
NEAL R. ADAM, B.S., M.S., Ph.D., Plant PhysiologistResearch regarding physiological, biochemical and molecular responses of wheatto CO2 enrichment in FACE crop canopy experiment. Establish protocol forenzyme activity assays, SDS-PAGE and other biochemical procedures on leafsamples. Design and implement data collection and processing tools.
EDWARD M. BARNES, B.S., M.S., Ph.D., Agricultural Engineer Remote sensing applications for farm management; consideration of approachesthat integrate remotely-sensed measurements with crop growth models anddecision support systems.
THOMAS R. CLARKE, B.A., Physical Scientist Remote sensing for farm management, thermal and optical radiometry, andinstrument calibration.
TERRY A. COFFELT, B.S., M.S., Ph.D., Research Geneticist-Plants Breeding, genetics, and germplasm evaluation of new crops--guayule,lesquerella, and vernonia; development of acceptable production practices.
DAVID A. DIERIG, B.S., M.S., Ph.D., Research Geneticist-Plants Breeding, genetics, germplasm collection and evaluation of new industrial cropswith unique, high-value products, including lesquerella, vernonia, and guayule.
GLENN J. FITZGERALD, B.A., M.S., Ph.D., Research AgronomistApplication of geospatial technologies to site specific farming, multispectral andhyperspectral remote sensing for detection and identification of plant stress andanomalies.

108
DOUGLAS J. HUNSAKER, B.S., M.S., Ph.D., Agricultural Engineer Effects of soil and irrigation spatial variability on crop water use and yield in largeirrigated fields; level basin irrigation design and management procedures forapplying light, frequent water applications to cotton; CO2 effects, in particular, ofevapotranspiration in the free-air CO2 enrichment (FACE) environment;evaluation of water requirements and irrigation management of new industrialcrops--lesquerella and vernonia.
SHERWOOD B. IDSO, B.S., M.S., Ph.D., Research PhysicistEffects of atmospheric CO2 enrichment on biospheric and climatic processes.
BRUCE A. KIMBALL, B.S., M.S., Ph.D., ResearchLeader for E&PD and Supervisory Soil Scientist Effects of increasing atmospheric CO2 and changing climate variables on cropgrowth and water use; free-air CO2 enrichment (FACE), and CO2 open-topchambers and greenhouses; micrometeorology and energy balance; plant growthmodeling.
FRANCIS S. NAKAYAMA, B.S., M.S., Ph.D., Research Chemist New crops such as guayule (for latex rubber and resin), lesquerella (hydroxyfatty acid) and vernonia (epoxy fatty acid); including extraction and analyticaltechniques and by-product uses for the various components; Editor-in-Chief ofIndustrial Crops and Products, an International Journal.
PAUL J. PINTER, JR., B.S., M.S., Ph.D., Research Biologist Applications of remote sensing technology to management of agriculturalresources and research in plant sciences; effects of elevated CO2 on biophysicalproperties of plants.
GERARD W. WALL, B.S., M.S., Ph.D., PlantPhysiologist Derivation of experimental databases to quantify growth, development, andphysiological response of agronomic crops to full-season CO2 enrichment;development of deterministic and stochastic digital simulation models of thesoil-plant-atmosphere continuum in response to a CO2 enriched environment.


109
PROJECT SUMMARY
We propose to conduct global change research over the next three years with the followingobjectives: (1) Determine the long-term effects of elevated CO2 on the physiology, growth, woodproduction, fruit yield, fruit nutritional quality, and water use efficiency of sour orange trees, as wellas its effects on soil structure and carbon. This is a continuation of an ongoing open-top chamberexperiment started in 1987, which is the longest such continuous CO2-enrichment experiment everconducted. (2) Assess likely impacts of global change on the productivity of agricultural crops viasynthesis and integration of existing large accumulated experimental data base plus additional cropgrowth modeling. (3) Determine effects of elevated CO2 on the physiology, growth, yield, N2-fixation, persistence, and soil carbon sequestration of alfalfa using the free-air CO2 enrichment(FACE) approach. This experiment is the logical follow-on to prior such FACE experiments oncotton, wheat, and sorghum conducted at Maricopa, AZ. (4) Determine effects of elevated CO2,water supply, and grazing pressure on productivity, shrub-grass competition, carbon sequestration,and water relations of the piñon-juniper rangeland ecosystem, also using the FACE approach. Thisnew project, called Carbon Exchange and Sequestration in Arid Regions (CESAR), would utilizeCO2 from a huge geologic source within this ecosystem, and it would involve a large consortium ofuniversities, ARS, private industry, and others. Achieving Objectives 3 and 4 is contingent uponobtaining outside funding.
OBJECTIVES
1. Determine the long-term effects of elevated CO2 on the physiology, growth, wood production,fruit yield, fruit nutritional quality, and water use efficiency of sour orange trees, as well as itseffects on soil structure and carbon sequestration beneath the trees.
2. Assess likely impacts of potential global change on productivity of agricultural crops viasynthesis and integration of large accumulated experimental data bases.
[Note: Objectives 3 and 4 are contingency plans dependent upon obtaining outside funding.]
3. Determine effects of elevated CO2 on the physiology, growth, yield, N2-fixation, persistence, andsoil carbon sequestration of alfalfa.
4. Determine effects of elevated CO2, water supply and grazing pressure on the productivity, shrub-grass competition, carbon sequestration, and water relations of the piñon-juniper rangelandecosystem.

110
NEED FOR RESEARCH
Description of the Problem to be Solved
1. Sour orange: Whether enough carbon can be sequestered in the boles of tress and in the soilbeneath them to significantly slow the rate of rise of atmospheric CO2 concentration is animportant question facing global change research, as are the implications of the ongoing CO2rise for human nutrition. Sour orange represents such long-lived woody species, which is beingstudied to determine (1) whether an initial CO2-induced enhancement in wood and fruitproduction will be maintained over a tree’s life span, (2) whether quality of wood and fruit willchange, and (3) whether increases will occur in soil carbon storage beneath the trees.
2. Synthesis and Integration: Policymakers often have difficulty perceiving principles from the vastarray of facts before them, so a common refrain is that the products of scientific research are“data rich and knowledge poor.” Currently, about 2 papers are being published every 3 daysabout the effects of CO2 and other environmental variables on agricultural crops, from whichmore definitive knowledge about global change effects on agriculture needs to be synthesized.Furthermore, available assessments may be suspect. The Inter-governmental Panel for ClimateChange is now writing its third major assessment of likely impacts of global change onagriculture (as well as many other facets of world society), but most of the predictions are basedon simple plant growth models which ignore some important plant processes (IPCC, 2001).
Four simple models (Tubiello et al., 1999; Jamieson et al., 2001) were able to simulate theresponses of wheat to elevated CO2 interacting with soil water and soil nitrogen supplies asobserved in our free-air CO2 enrichment (FACE) wheat experiments. Nevertheless, such simplemodels as tabulated by the IPCC (2001) cannot address some important aspects of plant growthresponses to elevated CO2. For example, they “grow” the crops at air temperature rather than atthe crop’s own temperature; yet, we have shown that elevated CO2 causes wheat canopies towarm 0.6 to 1.2°C above air temperature due to the direct effects of the elevated CO2 on theplants’ stomatal apertures (Kimball et al., 1992, 1995, 1999). Such warming would be inaddition to any global warming of air temperature, and it could cause similar consequences,such as changes in yield and major shifts in optimal production regions of crops. A second effectthat is not adequately addressed by simple daily-time-step models is that plants make theirphotosynthate during daytime, yet they continue to translocate material and grow at night.Therefore, daily temperature patterns may be very important in determining plant responses toelevated CO2. One prediction of general circulation models is that night temperatures are likelyto warm more in the future than daytime temperatures (Collatz et al., 2000; Easterling et al.,1997; Hansen et al., 1995). Therefore, another generation of assessments needs to be done --with detailed process-oriented models capable of simulating all known effects of elevated CO2,as well as of other interacting environmental variables, on crop physiology, growth, yield,carbon sequestration, and water relations.

111
3. Alfalfa: Alfalfa is a perennial deep-rooted legume crop that has the potential to respond toelevated CO2 with deep sequestration of soil carbon, even at low soil nitrogen and thereby slowthe rate of rise of the atmospheric CO2 concentration. It is an important forage crop in the U.S.(24 million acres; 4th in acreage behind corn, wheat, and soybeans; USDA, 2000) that grows wellin Arizona. Specific scientific reasons to focus on alfalfa are: (1) being deep-rooted, alfalfa cansequester carbon at deeper depths below the plow layer where it may be able to be stored formuch longer periods, (2) being perennial, alfalfa grows the year around, so the interactionbetween elevated CO2 and temperature can be studied, and (3) being a legume, the effects ofelevated CO2 on nitrogen fixation can be examined, as can the importance of nitrogen for Csequestration.
4. Piñon-juniper: Piñon-juniper is an expansive ecosystem whose character may be changed byglobal change. This vast mid-elevation ecosystem serves as rangeland for substantial cattleproduction and watershed catchment for much of the Western U.S. It contains more than a dozenNational Parks and Monuments, is home to numerous Native American groups, has a history ofvaried natural resource management (fire suppression, logging, grazing), and is under greatdevelopment pressure from surrounding regions (Wilkinson 1998). Little research has addressedbiosphere-atmosphere interactions of this region, yet paleoecological studies and climate changemodels indicate this region may be highly sensitive to global change (Cole,1985; Nielson, 1995;Grissino-Mayer et al., 1997). Land use (fire suppression, grazing) has had widespread impactson this region (Fleischner, 1994; Brown and McDonald, 1995; Moore et al., 1999), yet we donot understand the implications of these activities for C exchange and sequestration, nor thenature of their interaction with atmospheric and climatic change. Insect outbreaks associatedwith climate change appear to be increasing (Walker et al., 1998). Their impacts on ecosystemC fluxes and sequestration can be significant but are little understood in arid regions. Of theregion’s major vegetation types, the piñon–juniper woodland is the third most extensive in thecontinental U.S. Therefore, there are several reasons to determine the effects of elevated CO2and other interacting environmental variables on this important ecosystem.
Relevance to ARS National Program Action Plan
The project is relevant to all components. While the primary emphasis is on determining andassessing the impact of global change on agricultural ecosystems and to develop strategies foradaptation, this research inherently involves studying all aspects of carbon cycling fromphotosynthetic carbon assimilation to soil carbon sequestration, the latter of which can mitigate therate of global change. Production of trace gases, such as N2O, will also be addressed. In addition,the influences on surface energy balance and evapotranspiration will be assessed, therebycontributing to the water cycle component.
Potential Benefits
The main benefit will be an enhanced ability to prepare for potential global change. Knowing theprobable impacts of global change on crop production and water use in each region will giveresearchers and growers the incentive to develop strategies for coping with problems and maximizing
112
benefits, as well as for sequestering carbon to mitigate the rate of global change. The growth modelsdeveloped as part of this research should prove to be useful tools for developing such strategies.
Anticipated Products
Scientific publications will be produced that describe, as well as synthesize and integrate, the effectsof elevated CO2 and interacting environmental variables on plant physiology, growth, yield, light useefficiency, carbon sequestration, and water use of crops and rangeland for various regions and globalchange scenarios. Process-based plant growth models that have been more perfected and validatedthan currently exist will also be products of this research.
Customers
Other agencies, such as the Department of Energy and Environmental Protection Agency, need theinformation to set policy regarding carbon storage credits, energy sources (i.e., coal versus nuclear),CO2 emissions (whether to tax or not), and land use (reforestation). Agricultural policymakers willalso use the information to formulate resource conservation plans for the next Farm Bill, especiallyif there is a "green payments" program that encourages carbon sequestration. And, of course, farmerseventually will use the information.
SCIENTIFIC BACKGROUND
1. Sour orange trees:
A search of the CRIS system for “global change” or “CO2" or “carbon dioxide” revealed that 198projects are coded for work on these topics within ARS and that another 547 are also outside of ARS.However, only about 40 pertain to assessing the impact of global change, especially of elevated CO2,on agricultural ecosystems. CO2 enrichment research is being conducted at the ARS Gainsville,Beltsville, Auburn, Temple, Raleigh, and Ft. Collins locations. Some of the non-ARS projects werefree-air CO2 enrichment (FACE) projects on desert in Nevada and on trees in Wisconsin and NorthCarolina, and the latter will be discussed shortly. However, our long-term study on sour orange treesappears to be unique.
Beyond the CRIS system, there have been many reports of the growth responses of trees toatmospheric CO2 enrichment; however, the vast majority of them have been of relatively shortduration. In a recent review of the literature, for example, Idso (1999) evaluated the results of 180such experiments, finding that only two of them extended beyond four years duration. In addition,all of the short-term studies (three years or less) dealt with trees growing in different types of rootingmedia in containers located in growth chambers or greenhouses, as opposed to the undisturbed soilof the natural environment. Because of these protocol deficiencies, these latter studies are clearlyincapable of answering important questions related to carbon sequestration in trees and soils.
Some newer studies are beginning to address these deficiencies. The free-air CO2 enrichment(FACE) experiment at Duke University, for example, as well as a similar study at Oak Ridge National

113
1
1.5
2
2.5
3
3.5
0 20 40 60 80 100 120 140 160
Duration of Differential CO2 Exposure (Months)
Enric
hed
/ Am
bien
t W
ood
Vol
ume
Rat
io
Figure 1. Ratio of volume of sour orange tree wood in CO2-enriched chambers (700 :mol mol-1) tothat in ambient chambers (400 :mol mol-1) versus duration of exposure to elevated CO2.
Laboratory, are being conducted on trees growing in their natural habitat. However, in both of theseexperiments the trees were already at least a decade old before the CO2 treatments were established.FACE experiments on aspen and on poplar have begun in Wisconsin and Italy, respectively, onplantation saplings, but it will be several years before results are available. Open-top chamberexperiments have also been initiated on scrub oak in Florida and on longleaf pine in Alabama.However, these studies are generally only projected to last about ten years. Although much importantinformation will unquestionably be obtained from these experiments, what is learned may not berepresentative of the long-term equilibrium responses of the trees.

114
To illustrate this latter point, we present a 13-year history of the relative above-ground (trunk +branch) wood volume of our sour orange trees (Figure 1). These data were obtained from arelationship between trunk circumference and trunk and branch volume that we determinedspecifically for our trees at the ends of the second and third years of the experiment (Idso andKimball, 1992). As can be seen from the results, the CO2-enriched trees experienced a large initialCO2-induced growth enhancement that increased their wood volume relative to that of the ambient-treatment trees by a factor of 3.0 at the 23-month point of the experiment. Thereafter, this ratiodeclined, rapidly at first – as has been observed in other studies (Idso, 1999) – but then more slowly.At the end of nine full years, however, the enriched/ambient wood volume ratio leveled off; and forthe past 50 months, it has remained essentially constant at a mean value of 1.69 (which has also beenthe ratio for fruit yield).
Clearly, an experiment of only ten years’ duration could well miss the important fact that the relativegrowth advantage enjoyed by CO2-enriched trees early in their history may not be totally lost overthe long haul, as some have supposed, but may continue indefinitely at a very significant, albeitreduced, level. In addition, it is unclear what different results might have been obtained if our sourorange trees had not been very small (30 cm tall) and very young (on the order of six months old)when the experiment was begun. This point, too, is extremely important; for the effects ofatmospheric CO2 enrichment very early in a plant’s life cycle may be of great importance to how itresponds to continued CO2 enrichment later in life (Van Der Kooij et al., 1996; Jitla et al., 1997;Miller et al., 1997; Farage et al., 1998). Hence, experiments begun at the ten-year point of a tree’sexistence may also fail to reveal its true equilibrium response.
2. Synthesis and Integration:
That elevated CO2 affects plant growth has been known for more than two centuries. Starting at aboutthe beginning of the last century, specific studies to exploit the greater growth at higher CO2, andthereby obtain higher agricultural yields, were conducted. Although impractical for open-fieldagriculture, CO2 enrichment became a standard recommended horticultural practice in greenhousesduring the 1960's wherever the greenhouses were closed and unventilated. In the late 1970s there wasincreasing concern about the rapid increase in atmospheric levels of CO2 and what that might do toopen-field agriculture and to natural ecosystems. This concern motivated Kimball (1983a) to reviewthe prior work in this area, and he assembled some 430 of the early observations. He analyzed thesedata and concluded, i.e., synthesized, that a doubling of atmospheric CO2 concentration wouldincrease yields about 30%, on average, if global warming was minimal. Several similar synthesispapers have been written since, which include more recent literature and/or which examine particularclasses of plants and/or particular plant processes or responses (Kimball, 1983b, 1986, 1993; Cure,1985; Cure and Acock, 1986; Kimball and Idso, 1983; Poorter, 1993; Idso and Idso, 1994; Ceulemansand Mousseau, 1994; Morison, 1995; Wullschleger et al., 1997; Cotrufo et al., 1998; Curtis andWang, 1998; Wand et al., 1999; Norby et al., 1999; Nakagawa and Horie, 2000; Reddy and Hodges,2000).

115
Since the 1960s when computers first became widely available, plant scientists have developedmodels to simulate plant growth and yield. Because experiments cannot be conducted on every soiltype and in every local climate, these models are an extremely valuable tool for encoding knowledgegained in relatively few experiments conducted under particular conditions and then providing themeans to predict what will happen in other locations. They are especially useful for forecasting whatmay happen over wide regions under various scenarios of global change. Therefore, several suchintegrative studies have been done to predict the likely effects of global change on the agriculturalproductivity of various regions of the U.S. and of the world, as tabulated by the recent thirdassessment of the IPCC (2001). However, as discussed under the “Need for Research,” we areconcerned that the relatively simple models that have been used in such integrative studies are notable to simulate some plant responses to elevated CO2, which may be important in determiningoverall crop responses.
In the past, we have developed models for guayule growth (Kimball, 1981), for energy relations ofgreenhouse crops (Kimball, 1986b), and for cotton growth (Wall et al., 1994; COTCO2 Model). Inall three cases, after initial progress, work stopped in order to devote more time to experiments oneffects of elevated CO2 on plant growth. With the onset of the FACE wheat experiments in 1992-3,we became active in the GCTE (Global Change Terrestrial Ecosystems, a division of the IGBP orInternational Geosphere-Biosphere Programme) Wheat Network, a world-wide group of wheatmodelers and experimentalists who are developing the capability to predict likely effects of globalchange on future wheat productivity. We contributed our data from two FACE x water and twoFACE x N experiments to the effort. These data were desired by the group because they were neededfor validating CO2 response aspects, because they were of high quality and obtained at frequentintervals, and because there were many ancillary data. To date, at least ten modeling papers haveutilized our FACE wheat data for validation (Grant et al., 1995a,b, 1999, 2001; Grossman et al.,1995, 1999; Kartschall et al., 1995; Barnes et al., 1997; Tubiello et al., 1999: Jamieson et al., 2001).For the first 5 months of 2000, we supported a Ph.D. graduate student, Mr. Talbot Brooks, to workwith Dr. Robert Grant, author of the ecosys model, at the University of Alberta, in developing a C4photosynthesis sub-model suitable for simulating the effects of elevated CO2 and other environmentalvariables on sorghum photosynthesis. Thus, we have been at the periphery of plant growth modelingfor some time.
In the aforementioned CRIS search, projects on modeling effects of global change appeared from theARS Ft. Collins and Beltsville locations. The RZWQM root zone water quality model from Ft.Collins is a promising farm management tool, but questionable for the detailed physiologicalquestions addressed herein. At Beltsville, the GLYCIM soybean model and the CPM cotton modelappear to have the necessary physiological process detail, but they were written largely by BasilAcock who has recently retired, and we understand the group is being reorganized, so theopportunities for collaboration appear to be in limbo.

116
3. Alfalfa FACE Project:
Starting in 1983, researchers from the U.S. Water Conservation Laboratory (USWCL) and theadjacent Western Cotton Research Laboratory (WCRL) studied the effects of increased CO2 at ampleand limiting levels of water and nitrogen on cotton using open-top chambers (e.g., Kimball et. al.,1992; Kimball and Mauney, 1993). Recognizing limitations of the open-top chamber approach, theUSWCL and WCRL scientists participated with other researchers, especially some from BrookhavenNational Laboratory (BNL), in the design and implementation of a free-air CO2 enrichment (FACE)project to conduct open-field CO2 enrichment experiments. The first successful biological experimentwas conducted in 1989 (Hendrey, 1993), followed by more cotton experiments in 1990 and 1991 withan additional water stress treatment. The results of these experiments are reported in 21 papers in aspecial issue of Agricultural and Forest Meteorology (Dugas and Pinter, 1994). In 1992 the FACEeffort shifted from cotton to wheat, and two FACE experiments incorporating ample and limitingsupplies of water were conducted from 1992-1994 and two more with ample and limiting suppliesof soil nitrogen from 1995-1997. About 100 scientists from 43 different research organizations ineight countries participated in the cotton and wheat experiments (Wall and Kimball, 1993; Pinter etal., 1996). About 54 papers have resulted from the wheat experiments (see Curriculum Vitae forKimball, Wall, and Pinter for lists), and several more are in preparation. Next the focus shifted tosorghum, a C4 crop, and two FACE experiments at ample and limiting water were conducted in1998and 1999. Three papers (Rillig et al., 2001; Ottman et al., 2001; Cousins et al., 2001) have beenaccepted for publication from the sorghum experiments, and several more are in preparation orsubmitted.
A few experiments have been done to determine the response of alfalfa to elevated CO2, but theirresults have not been very consistent. Daley et al. (1988) grew alfalfa in open-top chambers at CO2concentrations of ambient +0, +75, +150, and +300 :mol mol-1, and they found that photosynthesisof young leaves was stimulated +40% by the +150 treatment. However, significant enhancement ofyield, i.e. above-ground biomass, only occurred in 3 of 9 harvests, suggesting that much of theenhanced photosynthate was going to the large root system. In a similar study, Bunce (1993, 1995)grew alfalfa in CO2-enriched open-top chambers, which had about as many weeds as alfalfa plants.The alfalfa biomass was altered +302, -31, and +47% and the combined alfalfa plus weed biomasswas altered +56, -9, and +38% by enrichment to 700 :mol mol-1 over each of three years of theexperiment, respectively. In the Swiss FACE experiment, in which the main species are ryegrass andwhite clover, Lücher et al. (2000) grew alfalfa in sub-plots within the FACE rings. The alfalfa hadbeen inoculated with effective or ineffective nodulating strains of Rhizobium. They observedincreases in growth of about +49% for the alfalfa with the effective strain of Rhizobium and elevatedCO2 at 600 :mol mol-1. On the other hand, the alfalfa with the ineffective strain averaged only abouta 12% growth increase when ample N fertilizer was applied, and surprisingly decreased about 25%in growth with elevated CO2 and low levels of N. We should also note that white clover (Trifoliumrepens), which is also a legume, increased above-ground growth by about 25% averaged over severalyears due to the elevated CO2 (Hebeisen et al., 1997), but similar to Bunce (1993, 1995), they alsofound large year-to-year variation in the CO2 response. Sgherri et al. (1998, 2000) recently described

117
another CO2-enriched open-top chamber experiment on alfalfa that was also subjected to a short (5day) drought. They examined several biochemical compounds related to photosynthesis and oxidativestress, but apparently have not yet reported on any agronomic aspects. We conclude from these worksthat there can be substantial variability in the response of alfalfa to elevated CO2, and it is likely that,besides the effectiveness of the symbiotic Rhizobium, the partitioning between above- andbelow-ground organs may be very important. Above-ground agricultural yield may be enhanced atthe expense of the below-ground root system with carbon-sequestration potential or vice versa.
For the reasons presented under the "Expected Significance" section, alfalfa is a crop whose responseto CO2 deserves more study especially in view of its potential for carbon sequestration andN2-fixation. Following our demonstration that the FACE approach is the method of choice forconducting such research, about 28 FACE projects are now in operation or planned for variousecosystems around the world (http://cdiac.esd.ornl.gov/programs/FACE/whereisface.html). However,except for the small ancillary experiment in the Swiss FACE Project (Lücher et al., 2000), none hasyet studied alfalfa; therefore, we are proposing to study it as the next logical continuation of theMaricopa FACE Project. However, it is contingent upon obtaining additional outside funding, anda proposal to obtain such funding is pending with NASA.
4. Piñon-juniper Rangeland CESAR-FACE Project:
As discussed in the “Need for Research,” the piñon-juniper (PJ) ecosystem covers extensive mid-elevation areas in the Western U.S., and, because of its importance, additional research should bedone to ascertain its response to elevated CO2 and other interacting environmental variables. Free-airCO2 enrichment (FACE) is the logical approach. However, unlike prior agricultural crop experimentsat Maricopa AZ, the PJ ecosystem will have to be studied the year around; and because it is moreheterogenous with larger vegetation, we will have to use larger diameter FACE rings. Therefore, theannual CO2 requirement for conducting the research will be substantially larger than at Maricopa. Ifthe price for CO2 were the same as at Maricopa, the expense could be extremely prohibitive.Fortunately, however, an enormous geologic pool of CO2 has been discovered within the PJecosystem near Springerville AZ, which is east-northeast of Phoenix near the New Mexico border,and the companies developing the CO2 well field have offered CO2 for a FACE project at a smallfraction of the price paid in the prior Maricopa experiments. Moreover, the gas is quite pure with notoxins, and it is at favorable pressures for easy incorporation into a plastic pipe FACE distributionsystem. The presence of this CO2 source greatly increases the feasibility for conducting such a piñon-juniper rangeland FACE project.
Led by Dr. George Koch from Northern Arizona University, Flagstaff AZ, a consortium ofinstitutions and private companies has proposed to create a Science and Technology Center nearSpringerville AZ, for the study of Carbon Exchange and Sequestration in Arid Regions (CESAR).Besides utilizing the cheap CO2 for FACE experiments, the Center would also feature flux towersto measure the present-day carbon, water, and energy fluxes, and it would also have a strong trainingand education component. Consortium members would include Northern Arizona University, ArizonaState University, The University of Arizona, Ridgeway Industries (the company with the CO2development rights), Tucson Electric Power (an electric power company whose holdings within the

118
well field include excess buildings and land they are willing to donate to the project), as well as ARSscientists from the U.S. Water Conservation Laboratory and several rangeland research groups.Additional scientists from other institutions around the world are likely to become involved as well.
The CESAR Project is not yet fully organized, but outside funding is being sought. If it becomes areality, we USWCL scientists would expect to contribute our expertise about operation of FACEexperiments. We likely would also participate in the measurement of water and energy relations andin the development of techniques for remote sensing of the CO2 and other treatment effects.
If the CESAR Project gets underway on rangeland, then at some point in the future it likely wouldbecome advantageous to move the agricultural crop FACE operations from Maricopa toSpringerville. The much lower CO2 cost would enable agricultural crops to be studied at much higherCO2 concentrations than have heretofore been possible.
APPROACH AND RESEARCH PROCEDURES
Objective 1 - Sour Orange Trees
Experimental Design
To date, this experiment is the longest of its type ever conducted, and therefore, it has becomeextremely valuable. It began in July of 1987 by planting eight sour orange tree (Citrus aurantium,L.) seedlings directly into the ground at Phoenix AZ and enclosing pairs in four clear-plastic-wallopen-top chambers. The trees have been maintained under optimum conditions of water and nutrientsupply; and since mid-November 1987, half have been continuously exposed to ambient air ofapproximately 400 ppm CO2 and the other half to air enriched with an additional 300 ppm CO2 to aconcentration of approximately 700 ppm. Details of the study are given in Idso and Kimball (1997),where we present results obtained over the first eight years of the experiment.
We are now in the 14th year of the study, and we estimate we will need to monitor the growth of thetrees for about five more years in order to convincingly demonstrate that, after a large initial growthstimulation followed by a slow decline, the growth response to elevated CO2 of the trees levels outat a constant value (Figure 1), i.e., we need to show that this value is maintained for a sufficientlylong time that it we are confident it will be maintained over the remainder of the trees’ life span.
While obtaining these important long-term growth data, as described by Idso and Kimball (1993,1997), we also continue to observe yearly fruit production (numbers and fresh and dry weights) andfruit vitamin C and folic acid concentrations (via yearly determinations made by collaborators - Drs.Kevin Goodner and Wilbur Widmer - who are expert in these techniques). We also makenear-weekly determinations of new branch lengths and fresh and dry weights, as described by Idsoet al. (2000), new leaf numbers, areas and fresh and dry weights, as well as leaf fall-rates and leafstarch and chlorophyll concentrations, as described by Idso et al. (1993, 1996). In conjunction withother collaborators, we have additionally embarked upon some exploratory programs to determine

119
what we can learn about CO2 effects on tree water use efficiency (via carbon isotope analyses ofcores removed from the trees' trunks, in which Dr. Steve Leavitt is expert) and wood density (viax-ray densitometry analyses of the same cores, in which Dr. James Burns is expert). Likewise, wehave launched an exploratory study into what we can learn about the effects of atmospheric CO2enrichment on the production of the glycoprotein glomalin, which is produced by fungi that live insymbiotic association with the orange tree roots, as well as the impact of CO2-induced variations inthis substance on soil aggregation, via techniques in which our collaborator, Dr. Matthias Rillig, isexpert (Rillig et al., 1999).
Eventually, at the end of the experiment, we plan to conduct a detailed above- and below-groundbiomass inventory of the leaves, branches of various size classes, trunks, and roots of various sizeclasses and depths. Concentrations of C and N in the tree organs will be determined as well as thoseof the soil beneath the trees, radiating outward from the trees in concentric circles and downward tothe bottom of the root zone. We will also enlist the help of our collaborators in studying the glomalindistribution in the soil at that time, as well as the distributions of other organic compounds that mightbe present; and we will investigate mycorrhizal characteristics and components of the soil food-webswe encounter beneath the trees.
For the sour orange tree experiment, Idso is responsible for the biological measurements, and Kimballis responsible for maintaining the CO2 treatments.
Contingencies
We have already had much experience in all aspects of the studies we are currently conducting onthe sour orange trees, and we feel confident we shall be able to successfully achieve the severalgoals.
Collaborations
Achievement of our primary objective – determining the long-term effect of atmospheric CO2enrichment on the growth and fruit production – can be done without outside collaboration. All ofour collaborations deal with ancillary goals, such as medicinal attributes (Idso et al., 2000b) andvitamin C (Idso et al., 2001). Others in the data analysis stage include bulk wood density and wateruse efficiency from carbon isotopic analyses, as well as glomalin production from arbuscularmycorrhizal fungi.
Necessary (w/i ARS): Dr. Kevin Goodner, Citrus & Subtropical Products Lab., Winter Haven FLNecessary (external to ARS): Drs. Steven Leavitt and Jim Burns, University of Arizona; Dr. MatthiasRillig, University of Montana;

120
Objective 2 - Synthesis and Integration
Experimental Design
One approach will be to assemble and analyze data reported in the literature from experiments aroundthe world on the effects of elevated CO2 and other interacting variables on plants, similar to pastefforts by Kimball and by Idso (e.g., Kimball 1983a,b, 1985, 1986a, 1993; Kimball and Idso, 1983;Enoch and Kimball, 1986; Idso et al., 1997, 1988a,b; Idso, 1988, 1989, 1990, 1991a,b, 1992, 1993,1995, 1997, 1999, 2000a,b; Rosenberg et al., 1990; Kimball et al., 1990, 1993a,b, 1997; Idso andKimball, 1993; Idso and Idso, 1994). Generally, we plan to extract response values from theliterature, organize them into logical subgroups, and then calculate means and confidence intervals(usually with necessary log transformations of ratio-type data, e.g. Kimball, 1983a)
An initial project will be to extract published data from free-air CO2 enrichment (FACE) experimentsconducted over the last decade. Several topics will be examined, including the effects of elevatedCO2 on: photosynthesis, stomatal conductance, canopy temperature, water use, plant water potential,leaf area index, shoot and root biomass accumulation, agricultural yield, radiation use efficiency,specific leaf area, tissue nitrogen concentration, nitrogen yield, tissue carbohydrate and other carbon-based compound concentrations, phenology, soil microbiology, soil respiration, trace gasemission/consumption, and soil carbon sequestration. Data will also be aggregated from specieswithin functional groups (e.g., grape and cotton are both woody perennials and therefore might beexpected to have similar responses, and if they do, then it is likely other woody perennials wouldbehave similarly). Differences in responses of the various crops and functional groups will also beexamined with regard to other interacting variables such as water supply, soil nutrient levels,temperature, etc. Comparisons will also be made between responses observed in the FACEexperiments and those reported in prior reviews of chamber-based experiments.
A second synthesis and integration project will be a review of global warming and atmospheric CO2enrichment effects on carbon sequestration in soils and vegetation. This subject currently hasworldwide attention. The recent (sixth) Conference of Parties (COP) of the Framework Conventionon Climate Change (FCCC) meeting in The Hague deadlocked on this issue. Until the diverse arrayof scientific findings related to this topic can be harmonized within a robust conceptual frameworkin which all parties can have confidence, progress in developing rational domestic and internationalenergy policies will be severely limited. In reviewing this subject, we will deal with both agriculturallands and natural ecosystems, such as grasslands and forests. We will look at both biomassproduction and decomposition, evaluating how these processes are affected by increasing temperatureand atmospheric CO2 concentration, singly and in combination; and we will determine how potentialglobal change-induced alterations in these processes might increase or decrease terrestrial carbonstorage in agricultural and natural settings. We anticipate this literature review will also tell ussomething about the current 'missing carbon' sink.
Many of the simple plant growth models use the concept of “radiation use efficiency” to calculatecarbon fixed per unit of photosynthetically active radiation absorbed by the green vegetation. To

121
simulate growth under elevated CO2 , the modelers simply use a larger value for this efficiency, buteach one appears to be getting his/her values from particular experiments. Therefore, we plan toconduct a systematic review of the literature on the topic and then to synthesize a more generalrelationship between radiation use efficiency and atmospheric CO2 concentration.
Another approach will be to utilize plant growth models, particularly ecosys, to assess the likelyimpacts of global change on the productivity and water requirements of agricultural crops, startingwith wheat and sorghum. In nonspecies-specific ecosys, all simulation are performed at the plant/soilbiochemistry scale, and integrated to provide organ, organism, soil layer, and landscape scale output.Specifically, ecosys uses components of the Farquhar model for determination of C3 and C4photosynthesis, numerical solutions for soil chemistry (including N and C cyling) and energybalances, and explicit C allocation routines for growth and development, as well as sequestration. Theecosys model has been well validated for wheat (Grant et al., 1995a,b, 1999b, 2001b), and we expectit soon will be also for sorghum. It has also been validated with respect to several non-agriculturalspecies, such as aspen, black spruce, and moss (Grant et al., 1999a; 2001a). Thus, using variousscenarios of rising CO2 and changing climate and scaling methodologies employed by the IPCC(2001), we propose to obtain more robust estimates of the impacts of global change on agriculturalcrops than obtained previously with simple models, such as cited in the third assessment by the IPCC(2001). The results will also be compared to those obtained previously with the simple models.
We also propose to conduct such impact studies for cotton with a sophisticated hourly-time-stepmodel, but more work will have to be done with regard to model selection and development. Norequisite species characteristic files have been written for ecosys nor has any validation work beendone with it for cotton. Similarly, Wall et al. (1994) developed an initial working version of COTCO2specifically to simulate the effects of elevated CO2 and other climate variables on cotton, but it toohas not been validated. It is also our understanding that a “cotton production model” (CPM) hasrecently been completed by the ARS Remote Sensing and Modeling Laboratory, Beltsville MD (V.R.Reddy, personal communication), which also has an hourly time step. However, its author has retiredand it too has not been validated. Therefore, it is anticipated more model development work will haveto be done for at least one of the cotton models before assessments can be made. However, such willnot be undertaken until the wheat and sorghum works are completed, and by that time the situationwith cotton may have changed.
Kimball, Idso, Wall, and Pinter are all responsible for synthesis work, and Kimball and Wall will dothe modeling work.
Contingencies
If funding is obtained for Objectives 3 and/or 4, the Synthesis and Integration work will lower inpriority but not be abandoned. This strategy is justified because we are in a unique position to pursueObjectives 3 and 4. We have teams of interested multidisciplinary collaborators capable of collectingnear comprehensive sets of data, and we have the expertise to do the free-air CO2 enrichment. Thus,

122
we should try to achieve these objectives before team members become too engaged in other projectsand disperse.
Collaborations
Necessary (outside ARS): Dr. Robert Grant, Univ. of Alberta; Mr. Talbot Brooks, Ariz. State Univ.
Objective 3 - Afalfa FACE Project (Contingent on obtaining outside funding)
Experimental Design
We propose to conduct a FACE experiment on alfalfa (Medicago sativa L.) at ample and limitingsupplies of water for at least 3 years using a similar experimental design as that described previouslywith cotton, wheat, and sorghum (Figure 2; Wall and Kimball, 1993; Hunsaker et al., 1996; Kimballet al., 1999; Ottman et al., 2001).
A general objective is to determine the interacting effects of elevated CO2 (FACE), soil water supply,and temperature on an alfalfa (Medicago sativa L.) ecosystem. Specific objectives and hypothesesare as follows:
1. Determine effects of elevated CO2, water supply, and temperature on biomass (net primaryproductivity) and leaf area production, forage yield, and plant phenological development.
Hypothesis 1a. There will be a significant growth response (~30%) at 200 :mol/molof CO2 above ambient under well-watered (Wet) conditions.
Hypothesis 1b. There will be a somewhat larger growth response to 200 :mol/mol ofCO2 above ambient under the water-stress (Dry) treatment.
Hypothesis 1c. There will be a larger relative response to elevated CO2 under hotsummer conditions than under cool winter temperatures.
Hypothesis 1d. Phenology will not be significantly affected by elevated CO2.
Hypothesis 1e. Elevated CO2 will have a positive effect on stand persistence.
2. Determine effects on sequestration of carbon in soil organic matter, soil CO2 concentration,and soil respiration.
Hypothesis 2a. There will be a significant increase in soil organic carbon due toelevated CO2, especially at deeper depths.

123
Hypothesis 2b. There will be significant increases in the emissions of soil CO2 inproportion to the biomass responses.
3. Determine effects on stomatal conductance, canopy temperature, energy fluxes,evapotranspiration, and soil water contents.
Hypothesis 3a. At times of minimal water stress, in the FACE plots there will bereduced stomatal conductances.
Hypothesis 3b. Elevated CO2 will increase (make less negative) plant water potentials,more so under the water-stress than the well-watered treatment.
Hypothesis 3c. At times of minimal water stress, in the FACE plots there will behigher canopy temperatures (due to reduced stomatal conductances;accept 3a),
Hypothesis 3d. And higher sensible heat fluxes with reduced evapotranspiration.
Hypothesis 3e. And net radiation will be slightly reduced due to slightly moreup-going long-wave radiation from warmer canopy temperature.
Hypothesis 3f. For a few days following irrigations, soil water contents in the rootedzone will be higher in the FACE plots for both Wet and Drytreatments.
Hypothesis 3g. Because of water conservation while soil water is not limiting, the soilwater contents in the Wet plots at the end of each cutting cycle andgrowing season will be wetter under FACE,
Hypothesis 3h. And because of greater root ramification in the FACE-Dry plots, thesoil water contents in the Dry plots will be drier under FACE.
4. Determine effects on photosynthetic biochemistry and net leaf and canopy photosynthesis.
Hypothesis 4a. Carbohydrates will accumulate in the FACE-grown alfalfa leaves andC3 pathway photosynthetic processes will be somewhat inhibited,particularly regeneration of RuBP,
Hypothesis 4b. But nitrogen will be non-limiting in legume alfalfa, so there will be asubstantial increase in photosynthesis at elevated CO2.

124
5. Determine effects on nitrogen fixation.
Hypothesis There will be significant effects on the amounts of N2 fixed that parallel theeffects on biomass accumulation, as listed for Hypothesis 1.
6. Determine impacts on soil C and N mineralization and total microbial activity.
Hypothesis Rates of mineralization and total microbial activity will be significantlyincreased by elevated CO2.
7. Develop techniques for remote detection of net primary productivity of the alfalfa ecosystemsubjected to varying levels of CO2, water supply, and seasonal temperature.
Hypothesis 7a. A functional relationship exists between the fraction of absorbedphotosynthetically active radiation (fAPAR) captured by the plants forpotential use in photosynthesis and multispectral vegetation indices(e.g. normalized difference vegetation index, NDVI) that can be usedto predict potential carbon accumulation in the alfalfa ecosystem.
Hypothesis 7b. The relationship developed in 6a will not be significantly affecteddirectly by elevated CO2, thereby implying that relationships betweenremotely detected signals and plant biophysical parameters will notchange with time as the atmospheric CO2 concentration increases inthe future.
8. Determine impacts on herbivorous insects and consequent plant damage.
Hypothesis There will be greater plant damage due to insect herbivory underelevated CO2 while at the same time rates of insect development willbe slowed.
Equally important objectives include assembling a database of the above measurements anddeveloping and validating plant growth models (Holt et al., 1975; Denison and Loomis, 1989; Grantet al., 1995a,b) capable of predicting the effects of the increasing atmospheric CO2 concentration andany concomitant climate change on the alfalfa ecosystem.
CO2 treatment: A FACE apparatus will be used to enrich 25-m diameter circular plots by 200 µmolmol-1 CO2 above ambient during the daylit period year-round (cutoff threshold will be an airtemperature # 5 °C) (Figure 2). Enrichment will occur from 50% emergence, through standestablishment, and for each successive cutting over the 3-year study. To account for any effect ofthe blowers, the Control rings at ambient CO2 will have air flow like the FACE rings (Pinter et al.,2000). However, because we do not plan to operate at night, blower effects should be non-significant.We plan to stop enrichment at night because (1) studies on the effects of elevated CO2 on dark

125
respiration have been inconclusive, (2) the blower effect on the microclimate at night (Pinter et al.,2000) introduces unnatural temperature and humidity effects which somewhat compromise directuse of the data for model validation, and (3) the savings in CO2 costs can be better spent on additionalmeasurement activities.
Irrigation treatment: We plan to impose our water supply treatments using a flood irrigation system,as done previously in our sorghum experiments (Ottman et al., 2001: Conley et al., 2001; Wall et al.,2001), by using a strip-split-plot design similar to that in Figure 2 with either side of each ringreceiving a Wet or Dry treatment. Ideally, irrigations for the Wet (amply water supply) treatmentwould be initiated after 30% of the available water in the root zone is depleted, and they would beirrigated with an amount calculated to replace 100% of the potential evapotranspiration since the lastirrigation (Fox et al., 1992). Practically, however, the irrigations and cuttings have to be coordinatedin order to be able to operate machinery in the field without damaging the soil. Therefore, the Wettreatment will receive two or three irrigations per cutting, while the Dry treatment will receive oneirrigation per cutting. The irrigations for the Wet treatment will be applied after the hay has beenremoved from the field and again at about half the interval of time to the next cutting. The irrigationfor the Dry treatment will be applied after the hay has been removed from the field. In a studyconducted in the San Joaquin Valley (Frate et al., 1988), irrigating once per cutting at the beginningof the growth cycle resulted in 87% of the yield of twice per cutting. Alfalfa is most susceptible toyield loss from water stress at the beginning of the regrowth cycle (Doorenbos and Pruitt, 1977;Brown and Tanner, 1983).
Adjustments will be made for any rainfall; but because the seasonal consumptive water use istypically over 2030 mm (Erie et al, 1982), while seasonal rainfall averages only about 150 mm, thisadjustment is minor; and excellent control of the water supply is anticipated in this semi-arid desertregion, as evidenced by the wide range in volumetric water content obtained in the prior FACE xwater wheat and sorghum experiments (Hunsaker et al., 1996; Conley et al., 2001).
Crop culture: The alfalfa will be grown similar to commercial crops in the area using recommendedagronomic practices. The cultivar CUF 101 was selected because it is a well-adapted to the lowelevation deserts of Arizona and is the most widely grown cultivar in this area. It will be sown inOctober at a rate of 25 kg seed ha-1. The seeds will be inoculated with an effective strain ofRhizobium bacteria. The soil will be sampled before sowing and analyzed for phosphorusconcentration as a guide for pre-plant phosphorus fertilization. The soil will also be sampled in thefall of each year and analyzed for phosphorus as a guide for annual phosphorus fertilizer applicationin the winter. Phosphorus is the only plant nutrient that we expect to apply as fertilizer. Becausealfalfa is a legume, we do not plan to fertilize with N, and indeed the effects of elevated CO2 on N2-fixation will be an important aspect of this experiment. Weeds will be controlled as needed followingrecommendations.
Biomass production and other agronomic measurements: Forage yield will be determined by cuttingthe main plots eight times per year at early flowering. More detailed measures of alfalfa growth willbe recorded from sub-plots at each of the eight harvests and on weekly intervals for at least three

126
cutting cycles each year (spring, summer, and fall). These more detailed measures of plant growthinclude leaf biomass, stem biomass, plant height, and green leaf area index. Besides the main effectsof elevated CO2 on alfalfa growth at ample and limited water supply, after the 3 years of study overa wide range of summer to winter temperature extremes, the interactive effects between CO2 andtemperature will be examined, as will the effects of solar radiation. Because the annual pattern ofsolar radiation change leads that of temperature by a month or more, we anticipate being able toseparate the effects of these two important environmental variables.
Soil carbon sequestration: Sequestration of carbon in the soil may be significantly increased byelevated CO2, especially at deeper depths. We have gained experience examining soil organic carbon(SOC) change through repeated application of isotopic tracer techniques in FACE cotton (Leavitt etal., 1994), wheat CO2xH2O (Leavitt et al., 1996), wheat CO2xN (Leavitt et al., 2001), and sorghum(mss. in preparation). This method depends on the plant having or acquiring a carbon isotopecomposition that is sufficiently different from soil organic carbon that new carbon from theexperiment entering the soil will alter SOC isotopic composition. The larger the difference in isotopiccomposition between SOC and inputs, the more sensitive the tool. In this study, we will dominantlyemploy a commercial CO2 gas from geologic deposits which is most economical in our area. It hasa *13C= -5‰ for enriching FACE plots. By itself, it will result in FACE alfalfa plants with *13C=-26‰, providing a tracer about 4.5 to 5‰ 13C-depleted relative to SOC measured as -21 to -21.5‰at the end of the previous sorghum experiments. In Control plots, the tracer will be a little strongeras the plants will have *13C= -27‰, about 5.5 to 6‰ 13C-depleted relative to the original SOC. Otherstudies have found this isotopic separation was sufficient to estimate carbon inputs. However, astronger label would increase the power of this isotopic method to detect differences. Therefore, weplan to strengthen the isotopic tracer signal in the FACE plots by blending the main geologic CO2with at least 15% petroleum-derived CO2 (*13C= -40‰), which is somewhat more expensive. Thiswill produce alfalfa plants of at least -27‰ if not even more 13C-depleted. Extensive soil core sampleswill be taken before and after the experiment. Then, with estimates of new carbon from both FACEand Control plots, the difference will indicate net effect of CO2 enrichment. Besides determinationof new C from isotopes, we also will measure total C using standard chemical analyses, but thismeasure is less sensitive because of the large amount of C already present in soil. In addition,collection and *13C analysis of soil CO2 at 2 depths will provide results for additional comparisonbetween FACE and Control for belowground processes.
Photosynthesis and plant water relations: Leaf photosynthesis, conductance, and transpiration rateswill be surveyed with a portable closed-exchange (transient) leaf gas (CO2, H2O) exchange systemwith a 250 cm3 transparent cuvette (LI-COR, Inc., Model LI-6200, Lincoln, Nebraska, U.S.A.).Additional measurements of gas exchange rates will be made at solar noon (maximum photosyntheticrates) from the beginning of a soil dehydration cycle to just prior to rehydration (immediatelyfollowing an irrigation until just prior to the subsequent one). We will monitor the leaf relative watercontent gravimetrically, and, with thermocouple psychrometers, we will measure total leaf waterpotential and its osmotic and turgor components.
127
Carbohydrate levels in the leaves of alfalfa vary with time during cutting cycles, and they arepredicted by at least 3 alfalfa models (Holt et al., 1975; Denison and Looms, 1989; Grant et al.,1995a,b). We observed them to increase dramatically in leaves of wheat grown in elevated CO2,particularly fructans (Nie et al., 1995b), and such accumulation has been shown to inhibitphotosynthesis (Azcon-Bieto, 1983). Therefore, we will sample alfalfa leaves and stems, as well asroots whenever possible, when photosynthetic measurements are made. The samples will be flashfrozen in liquid nitrogen and stored in a -80oC freezer. The samples will be freeze-dried, ground topass a 20-mesh screen, and assayed for soluble sugars (sucrose, glucose fructose) and low and highmolecular weight fructans and starch (Hendrix, 1992, 1993; Hendrix and Peelen, 1987). Keyelements in the biochemical regulation of sucrose synthesis include bisphosphate (F2, 6bP) andsucrose phosphate synthase (SPS) (Stitt, 1991). For leaves stored at -80oC we will monitor levels forsucrose, FbP, F2-6bP, SPS, and cytosolic FbPase in conjunction with measurements ofphotosynthesis. Because carbohydrate accumulation in leaves will change with CO2 and water-stress,these studies may also provide insight into how carbohydrates may serve as feed-back inhibitors ofphotosynthetic gene expression in the field, as proposed from laboratory studies (Krapp, 1991,1993;Sheen, 1990, 1992).
Biochemical assessment of the dark reactions of the photosynthetic apparatus will be performedconcurrently with the survey of leaf photosynthesis and A/Ci curves. Leaves will be sampled, quick-frozen in liquid nitrogen, and stored at -80oC. These frozen leaf samples will be analyzed for solubleand total proteins, and enzyme assays will be conducted to evaluate Rubisco activities, activationstates, and concentrations of active centers. Proteins will be extracted from an equal area of thefrozen leaf samples. The extracted proteins will then be size-fractionated by polyacrylamide gelelectrophoresis and either transferred to nitrocellulose membrane or stained with coomassie blue. Theamount of protein in the individual lanes will be quantified by densitometric scanning of the stainedprotein bands. Rubisco, LHCII and the a and b subunits of the chloroplast ATPase are very abundantproteins and can be quantified easily with this procedure. We have antisera to Rubisco, PEPCase,and the b-subunit of the ATPase. We will use these to probe the proteins immobilized on thenitrocellulose filters, which will provide accurate identification and quantification of the proteins.Results from the western blots will help confirm those from the densitometric scans.
Biochemical assessment of light reactions of the photosynthetic apparatus, the quantum yield of PSIIand any changes in photochemical and non-photochemical quenching will be monitored with aportable fluorometer (Model PAM-2000, Heinz Walz GmbH, Germany). Interpretation offluorescence measurements will be used to determine how elevated CO2 affects apparent electrontransport and quantum yield in water-stressed compared with well-watered leaves. As was done inFACE wheat, thylakoid membranes will be isolated from the frozen leaf samples, with a modificationof the protocol described by Nie et al. (1995a,b), to determine how additional thylakoid membraneproteins, particularly those associated with electron transfer complexes (PSI, PSII, cyt b6/f), areeffected by elevated CO2 and water stress. Thylakoid membrane proteins will be size fractionatedby SDS-PAGE and either transferred to nitrocellulose membrane or stained with coomassie blue.Proteins will again be quantified by western blotting using antigens to key polypeptides of eachcomplex. We have antisera to PSI and PSII reaction center proteins as well as cyt b6/f. We will use

128
these to probe the proteins immobilized on the nitrocellulose filters, which will provide accurateidentification and quantitation of the proteins.
We propose to seek a molecular explanation for any observed down-regulation of photosyntheticproteins. We will examine the expression of genes encoding the proteins assayed above by thesteady-state level of mRNA using northern blots. The leaves from each treatment will be wrappedin aluminum foil and immediately frozen in liquid nitrogen and stored in a -80 oC freezer. Totalcellular RNA will be isolated from the frozen leaf samples using buffers containing guanidinehydrochloride followed by precipitation with lithium chloride (Hird et al., 1991). Equal quantitiesof glyoxal denatured RNA will be size fractionated by agarose gel electrophoresis and either stainedor transferred to nylon membrane. The immobilized mRNA will then be probed with radiolabeledDNA fragments specific for a number of chloroplast and nuclear genes. In particular, we will lookat steady-state levels of mRNA from psaA/B, psbA, psbD, atpB, rbcL, representative of chloroplastgenes and nuclear from genes encoding LHCII, RbcS, FbPase, and SbPase.
From the perspective of the ecosystem, it is necessary to integrate individual leaf carbon exchangerates to the whole-plant, canopy and community levels. Therefore, eight steady-state whole-canopygas exchange systems (Garcia et al. 1990; Brooks et al., 2001) will be used to monitor CO2 and H2Ovapor exchange rates for all treatment combinations for two replications. All eight chambers will berun simultaneously and controlled from a central control trailer located on site. In addition, at bi-weekly intervals we intend to measure canopy carbon exchange rates across a broad range ofatmospheric CO2 concentrations (ambient to 1800 :mol mol-1) and to monitor any changes in canopyarchitecture due to CO2 or water level with a portable canopy analysis system (Model LI-6000, Li-COR, Lincoln, NE).
Energy and soil water balances and evapotranspiration: Canopy temperatures will be measuredusing carefully calibrated infrared thermometers that are switched between FACE and Control plotsweekly (Kimball et al., 1994, 1995, 1999). Net radiation, soil heat flux, and sensible heat flux willbe measured, and latent heat flux (i.e. evapotranspiration) will be determined using a residual energybalance approach (Kimball et al., 1994, 1995, 1999). Soil water contents will be measured usingneutron scattering equipment and time domain reflectometry, similar to the methods used previouslyby Hunsaker et al. (1994, 1996, 2000) and Conley et al. (2001). Utilizing irrigation and rainfallamounts along with the soil water content data, a second estimate of evapotranspiration will becalculated as a residual in the soil water balance. N2 fixation: The fixing of inorganic atmospheric N2 to organic forms of N is an important aspect ofthe alfalfa ecosystem. We will determine the overall effects of elevated CO2 on nitrogen yield frommeasurements of biomass production, as described previously, and of the nitrogen concentrations ofthe tissues. In addition, we will determine the effects of elevated CO2 on the symbiotic N2 fixation in2m x 2m sub-plots within the main plots. In half of each of these sub-plots, non-N-fixing plants willgrown, but the entire sub-plot area will be fertilized with a small amount of fertilizer that has beenhighly enriched with 15N. Following Lüscher et al.(2000), the percentage of N derived from symbiosiswill be calculated from {%N = [1-(15N atom excess fixing crop)(15N atom percentage excess reference crop)]

129
* 100} for both Control and CO2 enriched plants (McAuliffe et al., 1958; Witty, 1983; Boller andHeichel, 1983). The reference non-N2-fixing plants will be a near-isogenic non-fixing line of alfalfagermplasm (< 2% or less N2-fixing activity; Barnes et al., 1990) and/or other non-fixing plants suchas Taraxacum officinale L. (a species with deep tap root) or Lolium perenne L. (a species withshallow fine roots; Lüscher et al., 2000). A non-fixing alfalfa line would be preferred for the referencecrop because then there would be more homogeneity in the crop canopy and few differences in rootingpatterns and non-symbiotic N uptake. In addition, the number of nodules formed per plant will bedetermined by counting the number of nodules formed under both FACE and ambient CO2 conditions.The effectiveness of the formed nodules and N2 (C2H2) fixation activity of the nodules will bedetermined by the acetylene reduction technique (Havelka et al., 1982).
Soil N2O and CO2 emissions and soil CO2 concentrations: We also propose to measure CO2 and N2Oemissions throughout the growing season. Soil CO2 will be collected at depths of 15, 30 and 50 cmin situ by means of permanently installed standpipes open at those depths. CO2 from samples takenevery 3 weeks will be cryogenically separated and isotopically analyzed. For surface soil efflux,PVC collars (ca. 20 cm diameter) will be partially pushed into the soil, and CO2 flux will be measuredusing a LI-COR gas analyzer after placement of a cover over the open top of the collars. CO2samples will also be drawn into evacuated flasks, and they too will be cryogenically separated andanalyzed isotopically. These collections and analyses should provide information about relative ratesat which CO2 is escaping from the soils of the FACE and Control plots, and the isotopic compositionshould reveal the relative contributions from different sources, especially in FACE plots where plantrespired CO2 should be very 13C depleted relative to the SOC originally present in the soil. Nitrous oxide emissions will be measured at about monthly intervals throughout the season within1 m x 1 m soil subplots. Two subplots will be located in each FACE and Control ring for a total of16 subplots. Measurements will also be made on a diurnal basis on selected days. Nitrous oxide fluxwill be measured using a non-steady-state (closed) chamber method (Matthias et al., 1980; Livingstonand Hutchinson, 1995). We will analyze N2O in air samples using a gas chromatograph equipped withan electron capture detector. Each chamber is made of opaque corrugated plastic and is temporarilydeployed for 30 minutes on a 0.5 by 0.5 m base permanently inserted in the center of each soilsubplot. Plastic syringes (50 mL) are used to sample air within each chamber at the time ofdeployment and 30 minutes later. Air samples are then immediately transferred from syringe toevacuated 10 mL Wheaton bottles for subsequent N2O analysis in the laboratory. Gas samples fromknown standards are injected into evacuated Wheaton bottles in the field in order to assess potentiallosses of N2O from the bottles during transport to Tucson. N2O emission rate (g m-2 day-1) iscomputed from the measured rate of increase of N2O concentration in the chamber and the knownheight of the chamber. Chamber height is adjusted during the season in order to accommodateincreased plant canopy height. In addition to sampling N2O emissions, denitrification rate will be evaluated using the acetyleneinhibition method (Ryden et al., 1987; Terry et al., 1986) in undisturbed soil cores collected fromeach subplot. Simultaneously, microbial respiration will be evaluated as the amount of CO2 evolvedfrom soil in 1-L incubation jars using a CO2 trap-titrimetric method (van Kessel et al., 1993). After

130
incubation and sampling, the soil cores (ca. 15 cm long by 5 cm diameter) will be dried to measurethe water content, bulk density, and inorganic nitrogen (Keeney and Nelson, 1982). The N2O fluxand denitrification rate measurements should give important information about the relative loss offertilizer N due to elevated CO2 under water stress and well-watered conditions.
Remote sensing measurements: Measurements of solar reflectance and thermal emittance will beused to characterize dynamic agronomic and biophysical parameters of the alfalfa canopy on acontinuous basis throughout the 3 year duration of the experiment. Data will be acquired severaltimes a week at the whole canopy scale using ground based, wide band sensor systems having visibleand near-infrared capabilities. Observations will be made at a time corresponding to a standardizedsolar zenith angle of 57° to minimize bi-directional reflectance factor complications that caused bywidely varying illumination angles at different times of the year. Commonly used multispectralvegetation indices (VIs), such as the normalized difference vegetation index (NDVI), will be usedto develop predictive relationships with percent cover, plant height, green leaf area index, andbiomass of the alfalfa crop. These non-invasive, repeated measures of plant growth are expected tohave less variation associated with them compared to traditional biomass samples. They will thusbe of considerable value in differentiating treatment effects on regrowth of alfalfa after each harvestevent. Multispectral VIs will also be used to estimate the fraction of absorbed photosyntheticallyactive radiation (fAPAR) captured by the canopy for potential use in photosynthesis (Pinter, 1993;Pinter et al 1994). This is an important biophysical parameter required for determining the effect ofelevated CO2 on radiation use efficiency (RUE, the amount of biomass produced per unit of absorbedPAR). Temporal derivatives of VIs will also be examined for their utility in detecting alfalfa growthrates and in further quantifying differences between experimental CO2 and irrigation treatments.
Fundamental questions regarding the direct effects of elevated CO2 on spectral properties of alfalfawill be addressed using field portable spectroradiometers capable of measuring hyperspectral features(wavelength regions 3 to 10nm in width) in the visible, near-infrared, and short wave infraredportions of the spectrum. Canopy measurements will be taken at a standardized solar zenith angleof 57°. Single leaf data will be obtained using an external integrating sphere. Depending upon ratesof plant growth and size of individual leaflets, these data will be acquired as often as weekly intervalsduring the height of the growing season. Data analysis will investigate treatment effects on narrowspectral features, spectral derivatives, overall spectral shape, and red edge position using traditionalregression techniques.
The temporal course of plant water status between irrigations will be characterized non-destructivelyusing several thermal indices that have been developed by USWCL scientists. Infrared thermometerswill be used to obtain canopy surface temperatures from all replicates and treatment combinationsabout 1 hour after solar noon when plants are exposed to maximum atmospheric evaporative demand.The data will be used to compute the crop water stress index (CWSI) and estimate the ratio of actualto potential canopy evapotranspiration (Jackson et al., 1981; Idso et al., 1981). The water deficitindex (WDI) which utilizes the thermal infrared plus an estimate of plant cover derived from VIs isexpected to provide an accurate estimate of plant water status early in the regrowth period whenplants are small and canopy cover is incomplete (Moran et al., 1994). These remote indices of plant

131
water status will be compared with less frequent measures of physiological water stress to providea functional rationale for their use. Spatial variability within the FACE experimental field will beassessed periodically from a light aircraft or helicopter equipped with a thermal scanning radiometer.
Herbivorous insects: Elevated-CO2-grown plants can affect the growth of herbivorous insects, as wehave shown previously on cotton (Butler et al., 1985; Akey et al., 1988, 1989), and Awmack andHarrington (2000) have shown for alfalfa aphids on faba bean. However, alfalfa is especiallynoteworthy for attracting herbivorous insects, which attack during various times of the year and havedifferent modes of feeding. Normally little active control is done, and at the time of cutting, theinsects' food supply is removed and there is an abrupt change in microclimate (Pinter et al. 1975),which more or less resets the clock for the next cycle. We anticipate that this situation will provideopportunities for study of the effects of the elevated CO2 and water stress treatments on these insects.Much of the work will be serendipitous, i.e., taking advantage of naturally occurring infestations.However, the initial infestations may be unevenly distributed, which would make interpretation ofthe data difficult. Therefore, we plan to augment the natural populations with infestations usinginsects in cages in some sub-plot areas. In particular, we will study the response of Lygus bugs, aserious pest complex on several crops in the U.S. and the world, and a foliage-feeding moth or leafminer.
Plant growth modeling: We plan to utilize the data from the FACE alfalfa experiment to validateseveral aspects of ecosys, a mechanistic plant growth model with regard to several plant processes,namely the effects of CO2, water supply, and seasonal weather on: biomass and leaf area production;sequestration of soil carbon; N2-fixation, leaf photosynthesis, stomatal conductance, and plant waterstatus; and canopy temperature, energy fluxes, and soil water content. Thus, the results from ourspecific experiments conducted at one place for a short time can be applied to future global changescenarios useful for exploring the policy implications of C sequestration and agricultural productivityin wider regions. At the same time, we expect that ecosys will provide a theoretical framework,which likely will help interpret the experimental data.
The names of the scientists on the FACE Alfalfa Project Team and their areas of responsibility formeasurements are listed in the following table.
Investigator Measurement responsibiltiy
Bruce A. Kimball Overall management and energy and water balance measurements
Paul J. Pinter, Jr. Remote sensing measurements
Gerard W. Wall Plant water relations and photosynthesis measurements
Michael Ottman Above-ground biomass production and other agronomicmeasurements
Steven W. Leavitt Soil carbon sequestration and soil atmosphere measurements
Allan D. Matthias Soil respiration and N2O emissions measurements
Andrew N. Webber Biochemical compounds involved with photosynthesis

132
George W. Koch Mechanistic modeling of stomatal response to elevated CO2
Dean Martens N2-fixation and other soil microbiological measurements
Bruce Hungate Nitrogen cycling as related to elevated CO2 and hydrology
Stephen Prior, Brett Runion& Allen Torbert
Carbon and nitrogen mineralization. And possibly root biomass.
David H. Akey andJacquelyn L. Blackmer
Responses of herbivorous insects
Robert F. Grant & Talbot J.Brooks
Plant growth and soil process modeling
Contingencies
Conduction of the alfalfa FACE project is contingent upon obtaining additional outside funding. Iffunding cannot be obtained, we will do more of the Objective 2 synthesis and integration.
Collaborations
Necessary (within ARS); – Dr. Dean Martens, Soil Microbiologist, Tucson, AZ; Drs. David Akeyand Jacquelyn Blackmer, Entomologists, Phoenix, AZ.; Drs. Stephen Prior and Allen Torbert,Auburn, AL and Allen Torbert, Temple, TX.
Necessary (external to ARS); – Dr. Michael Ottman, Department of Plant Sciences, University ofArizona; Dr. Steven Leavitt, Tree Ring Laboratory, University of Arizona; Dr. Robert Grant,University of Alberta; Mr. Talbot Brooks, Department of Geography, Arizona State University; Dr.Andrew Webber, Department of Plant Biology, Arizona State University; Drs. George Koch andBruce Hungate, Department of Biological Sciences, Northern Arizona University, Flagstaff, AZ.
Objective 4 - Piñon-juniper Rangeland FACE Project (Contingent on obtaining outsidefunding)
Experimental Design
Final details of the experimental design have not been decided, but a design under consideration isto build nine large (24-m diameter) FACE rings [using general methodology described in Hendrey(1993) and Miglietta et al. (1997)], with three rings at current ambient CO2 concentration, three ringsat 550 :mol mol-1, and three rings at 750 :mol mol-1. Because of the critical role of water inregulating ecosystem processes in the arid southwest, each ring (ambient, 550, and 750) will be splitinto two halves, one receiving 50% more than naturally occurring precipitation. Sub-plots will beclipped periodically at different frequencies to simulate varying grazing pressure.

133
Choosing an experimental design with adequate statistical power to discern ecologically importantdifferences in the face of the heterogeneity of the piñon-juniper ecosystem is a concern. Rather thanutilize a grid lay-out like we have in our Maricopa FACE field, it is likely that matched trio areaswould be identified for each replicate block that wouldn’t be a specified distance apart. The areaswould be matched according to similar gross vegetation structure, slope, aspect, and soil properties.Probably a full growing season’s worth of measurements will be done to establish a baselinecondition for each plot before the CO2 and other treatments are imposed.
The design with three CO2 concentration levels, in contrast to most other elevated CO2 experiments(and all FACE experiments), will allow us to test whether the effects of elevated CO2 on C exchangeand sequestration are linear over this range of CO2 concentrations, spanning most of the projectedincreases in atmospheric CO2 concentrations through the next century (IPCC, 2001). Some of thehypotheses to be tested and approaches used in these experiments include:
Hypothesis 1: Elevated CO2 will increase rates of CO2 uptake by ecosystems from the atmosphere,but (1) these increases will be larger in woody species (dominated by the more responsive “C3”photosynthetic pathway) than grasses (dominated by the less-responsive “C4” photosyntheticpathway) , and (2) partitioning of the extra C taken up in elevated CO2 among ecosystemcompartments varying in turnover time will strongly influence the way rates of C exchange translateto long-term C sequestration in wood and soils.
We will measure rates of net ecosystem C exchange in ambient and elevated CO2 concentrationsusing open gas exchange systems (Garcia et al., 1990; Brooks et al., 2001). The geological sourceof CO2 is ‘dead’, containing undetectable amounts of 14C (this CO2 differs only slightly fromatmospheric CO2 in stable C isotope [13C] composition). We will use this depletion in 14C to tracecarbon flow to pools of varying turnover times, including soil fractions and wood. Collaborators andPIs include experts in radiocarbon tracing (Leavitt) and soil C analysis, including fungal pools.Measurements of natural abundance of 14C will be made on the accelerator mass spectrometer in theLaboratory of Isotope Geochemistry at the University of Arizona. Because our design includes twolevels of elevated CO2, we will be able to quantitatively assess the effects of increased CO2 (550 to750 :mol mol-1) on carbon partitioning and the implications for long-term C sequestration.Additionally, we will use 13C labeling techniques to track rates of C uptake and incorporation intosoil by different plant growth forms (see below).
Hypothesis 2: Elevated CO2 will favor shrub encroachment into grasslands, and the increase in Cuptake and sequestration caused by invading deep-rooted shrubs will be greater than the direct effectof elevated CO2 on rates of C exchange and sequestration in the grassland ecosystems.
Sampling for biomass production of the grasses will be done, whereas the wood volume increase ofthe shrubs will be made from dimensional measurements and allometric relationships. Numbers ofplants of each species will be tabulated. In addition, the dominant woodland (piñon, juniper,rabbitbrush) and grassland species differ in stable isotope composition from each other due to theirdifferent photosynthetic metabolisms, and the differences are reflected in the soils developed under

134
these different plant groups. This provides a powerful C isotope tracer which we will use to documentthe incorporation into grassland soil (*13C = - 15 ‰) of C from the deeply rooted shrubs (*13C = -23to -27 ‰), and how this process is affected by elevated atmospheric CO2.
Hypothesis 3: Elevated CO2 will cause partial stomatal closure during times when there is sufficientmoisture, which will decrease transpiration per unit of leaf area of both C3 shrubs and C4 grasses.Consequently, canopy temperatures of both shrubs and grasses will increase. Water use efficiencywill increase under elevated CO2 for both. However, there will be a CO2 growth response of the C4grasses only drier conditions, whereas the C3 shrubs will respond under moist conditions as well. Anancillary hypothesis is that the elevated CO2 will enable the grasses to withstand greater grazingpressure only under the drier conditions.
Soil water content will be monitored by TDR or neutron scattering, and water use determined fromchanges using a soil water balance (e.g. Hunsaker, et al., 1996). Net radiation, canopy temperatures,air temperatures, and soil heat fluxes will be measured components of the energy balance, whilewater use will be determined as the residual (e.g. Kimball et al., 1999). Plant water potential will bedetermined occasionally using sampled leaves in pressure bombs and psychrometers (e.g. Wall et al.,2001).
Not all responsibilities have been defined for the Piñon-Juniper FACE Project Team, and severalmore members will be added in the future. However, it is likely the following scientists will haveareas of responsibility as listed in the following table.
Investigator Measurement responsibility
George W. Koch Overall management and mechanistic modeling of stomatalresponse to elevated CO2
Bruce A. Kimball Initial establishment of FACE apparatus and energy and waterbalance measurements
Paul J. Pinter, Jr. Remote sensing measurements
Gerard W. Wall Plant water relations and photosynthesis measurements
Jack Morgan Biomass productivity and photosynthesis
Steven W. Leavitt Soil carbon sequestration and soil atmosphere measurements
Bruce Hungate Nitrogen cycling as related to elevated CO2 and hydrology
Robert F. Grant &Talbot J. Brooks
Plant growth and soil process modeling

135
Contingencies
Contingent upon obtaining outside funding. If such funding is not obtained, we will focus more onObjective 2 synthesis and integration.
Collaborations
Necessary (within ARS) – Dr. Jack Morgan, Ft. Collins, CO
Necessary (external to ARS) – Drs. George Koch (Leader of CESAR Project) and Bruce Hungate,Ecologists, Northern Arizona University, Flagstaff, AZ; Dr. Steven Leavitt, Tree Ring Laboratory,University; Dr. Robert Grant, Plant Growth Modeler, University of Alberta; Mr. Talbot Brooks,Modeler, Arizona State University.
PHYSICAL AND HUMAN RESOURCES
1. Sour orange trees: The physical and human resources available and necessary to accomplish ourresearch objectives over the next three years are basically the same as they have been since thebeginning of this very-long-term project. We have the needed equipment, and about 1.0 FTE oftechnician time will be directed to the project.
2. Synthesis and integration: We have the requisite PC computers and access to higher speed Unixcomputers at Arizona State University (ASU). We have a small library at the USWCL and accessto the library at ASU. We also utilize the resources of the National Agricultural Library. TwoFTE of technician time will be directed to the project. However, as mentioned at the outset, thisactivity will have lower priority than FACE experiments on alfalfa and/or piñon-juniper if theyget funded. In the latter case, the two FTE of technician time would be mostly directed there.
3. Alfalfa FACE Project: The USWCL has the requisite FACE apparatus, as used in the 1998 and1999 FACE sorghum expeiments, for maintaining controlled elevated CO2 concentrations overopen-field plots, although a CO2 storage tank would need to be leased or purchased. TheUniversity of Maricopa, Maricopa Agricultural Center, has the land and necessary farmingequipment. They also can supply irrigation water, and a Specific Cooperative Agreement or otherarrangement would be made with them to conduct the experiment. The USWCL also has thenecessary balances and drying ovens for biomass measurements; the data loggers and micro-meteorological instruments for energy balance measurements; the pressure bombs, leafpsychrometers, and other sensors for determining plant water status; and the infraredthermometers, black-body calibrator, hyperspectral radiometer, and other sensors for remotesensing aspects. Two FTE of permanent technician time would be directed to the project, but thiswill not be enough. Outside funding is being sought for more temporary technical assistance andalso for an engineer to be responsible for installation and maintenance of the FACE and irrigationtreatments. Our collaborative partners also require more technicians (or graduate students).

136
4. Piñon-juniper FACE Project: This will be a new project, so considerable equipment will haveto be purchased and installed. Fortunately, Tucson Electric Power has a generating station withexcess buildings and land within the CO2-well field whose use they have offered to the project.Power, water, and communication connections can also be made at their facility, so it is likelythat no installation of long cable or pipe lines will be needed. Nevertheless, in spite of the TEPinfrastructure, FACE apparatus will have to be be built and installed.
If the Alfalfa FACE Project gets funded and is in operation at Maricopa, many USWCL instrumentsand the technicians listed above will not be available for the Piñon-Juniper FACE Project atSpringerville. Therefore, additional instruments and technical help will have to be obtained. On theother hand, if the Alfalfa FACE Project does not get funded, the USWCL resources can be directedto Springerville.

137
MILESTONES AND EXPECTED OUTCOMESResearch Objective or Area of Study
Date 1. Sour Orange Trees(Idso, Kimball)
2. Synthesis & Integration(Kimball, Idso, Wall, Pinter)
3. FACE Alfalfa Expt. (Kimball,Wall, Pinter)
4. FACE Piñon-JuniperRangeland Expt. (Kimball, Wall,Pinter)
Jan. 2001
Harvest fruit & tabulate monthlygrowth increments for 2000.
Review of free-air CO2 enrichment(FACE) effects on agricultural cropscompleted.
Proposal submitted to NASA forfunding.
Rough plan and pre-proposal com-pleted.
Jan.2002
Ditto for 2001 + folic acid produc-tion + soil fungal growth & glomalin& soil structure.
Above FACE review published, andreview of carbon sequestration com-pleted. Paper on elevated CO2 ef-fects on canopy temperature andcrop production areas written.
If selected for NASA funding, willinstall FACE apparatus and plantalfalfa in fall 2001. If not, thentimetable will pushed forward ac-cordingly until funding finallyachieved.
Second stage planning completed,and proposal prepared and submittedto funding agency.
Jan.2003
Ditto for 2002 + wood density &strength + water use efficiency.
First regional study with ecosys onwheat completed. Paper written onrelationship between radiatio useefficiency and CO2 concentration.
Tabulation and review of first year’sgrowth, remote sensing, energy andwater balance, photosynthesis andwater relations, and other data.
If selected for funding, initiate ex-periment in spring of 2002. If not,timetable will be delayed accord-ingly until funding finally achieved.
Jan.2004
Ditto for 2003 + differing sunlit &shaded growth & fruit & antioxidant+ history of leaf starch & sugar pro-duction + leaf senescence & fall his-tory.
First regional study with ecosys onsorghum completed. Cotton modelselected and regional study intiated.
Tabulation and review of secondyear’s growth, remote sensing, en-ergy and water balance, photosyn-thesis and water relations, and otherdata.
Tabulate and review of initialseason’s baseline measurements atambient CO2.
Mar.2004
End of time for this proposed project plan.
Jan.2005
Ditto for 2004. This marks the mini-mum length of time to be sure thatthe CO2-enriched trees have achiev-ed a constant relative growth advan-tage over the ambient-treatmenttrees (Figure 1) that can reasonablybe expected to continue throughoutthe remaining life of the trees.
Tabulation and review of thirdyear’s growth, remote sensing, en-ergy and water balance, photosyn-thesis and water relations, and otherdata. Papers written on these topics.
FACE treatment starts spring of2004.Tabulation and review of firstseason’s growth, remote sensing,energy and water balance, photosyn-thesis and water relations, and otherdata.
138
LITERATURE CITED
Akey, D.H.; B.A. Kimball, and J.R. Mauney. 1988. Growth and development of the pink bollworm,Pectinophora gossypiella (Lepidopter: Gelechiidae), on bolls of cotton grown in enriched carbondioxide atmospheres. Environ. Entomol. 17:452-455.
Akey, D.H. and B.A. Kimball. 1989. Growth and development of the beet armyworm on cottongrown in an enriched carbon dioxide atmosphere. Southwestern Entomologist 14: 255-260.
Awmack, C.S. and R. Harrington. 2000. Elevated CO2 affects the interactions between aphid pestsand host plant flowering. Agricultural and Forest Entomology 2:5-61.
Azcon-Bieto, J. 1983. Inhibition of photosynthesis by carbohydrates in wheat leaves. PlantPhysiology 78:681-686.
Barnes, D.K,; G.H. Heichel, C.P. Vance, D.R. Viands, and G. Hardarson. 1981. Successes andproblems encountered while breeding for enhanced N2 fixation in alfalfa. p. 233-248. In JM Lyons,RC Valentine, DA Phillips, DW Rains, RC Huffaker (ed.) Genetic engineering of symbiotic nitrogenfixation and conservation of fixed nitrogen. Plenum Publishing Corp. New York, NY.
Barnes, E.M.; P.J. Pinter Jr., B.A. Kimball, G.W. Wall, R.L. LaMorte, D.J. Hunsaker, F.J. Adamsen,S.W. Leavitt, T. Thompson, and J. Mathius. 1997. Modification of CERES-wheat to accept leaf areaindex as an input variable. Paper No. 973016. ASAE Annual International Meeting. ASAE, 2950Niles Road, St. Joseph, MI 49085-9659.
Boller, B.C. and G.H. Heichel. 1983. Photosynthate partitioning in relation to N2-fixation capacityof alfalfa. Crop Science 23, 655-659.
Brooks, T. J., G.W. Wall,P.J. Pinter Jr., B.A. Kimball, R.L. LaMorte, S.W. Leavitt, A.D. Mathias,F.J, Adamsen, D.J. Hunsaker, and A.N. Webber. 2001. Acclimation response of spring wheat in afree-air CO2 enrichment (FACE) atmosphere with variable soil nitrogen regimes. 3. Canopyarchitecture and gas exchange. Photosynthesis Research (in press).
Brown, P.W. and C.B. Tanner. 1983. Alfalfa stem and leaf growth during water stress. Agron. J.75:799-805.
Brown, J.H., and W. McDonald. 1995. Livestock grazing and conservation on southwesternrangelands. Conservation Biology 9:1644-1647.
Bunce, J.A. 1993. Growth, survival, competition, and canopy carbon dioxide and water vaporexchange of first year alfalfa at an elevated CO2 concentration. Photosynthetica 29:557-565.

139
Bunce, J.A. 1995. Long-term growth of alfalfa and orchard grass plots at elevated carbon dioxide.J. Biogeography 22:341-348.
Butler Jr., G.D., B.A. Kimball, and J.R. Mauney. 1985. Populations of sweet potato whitefly oncotton grown in open-top field carbon dioxide-enrichment chambers. Cotton, Series P-63, Collegeof Agriculture Report, University of Arizona, Tucson AZ. 176-176.
Ceulemans, R. and M. Mousseau. 1994. Effects of elevated atmospheric CO2 on woody plants. NewPhytologist 127:425-446.
Cole, K. 1985. Past rates of change, species richness, and a model of vegetational inertia in theGrand Canyon, AZ. The American Naturalist 125:289-303.
Collatz, G.J., L. Bounoua, S.O. Los, D.A. Randall, I.Y. Fung, and P.J. Sellers. 2000. A mechanismfor the influence of vegetation on the response of the diurnal temperature range to changing climate.Geophysical Research Letters 27: 3381-3384.
Conley, M.M., B.A. Kimball, T.J. Brooks, P.J. Pinter Jr., D.J. Hunsaker, G.W. Wall, N.R. Adam,R.L. LaMorte, A.D. Matthias, T.L. Thompson, S.W. Leavitt, M.J. Ottman, A.B. Cousins, and J.M.Triggs. 2001. Free-air carbon dioxide enrichment (FACE) effects on sorghum evapotranspiration inwell-watered and water-stressed treatments. New Phytologist (submitted & in revision).
Cotrufo, M.F., P. Ineson, and A. Scott. 1998. Elevated CO2 reduces the nitrogen concentration ofplant tissues. Global Change Biology 4:43-54.
Cousins, A.B., N.R. Adam, G.W. Wall, B.A. Kimball, P.J. Pinter Jr., S.W. Leavitt, R.L. LaMorte,A.D. Matthias, M.J. Ottman, T.L. Thompson, and A.N. Webber. 2001. Response of C4photosynthesis in sorghum to growth under free air carbon dioxide enrichment (FACE): youngleaves exhibit higher rates of photorespiration and decreaased energy use efficiency. NewPhytologist. (in press).
Cure, J.D. and B. Acock. 1986. Crop responses to carbon dioxide doubling: A literature survey.Agricultural and Forest Meteorology 38:127-145.
Cure, J.D. 1985. Carbon dioxide doubling responses: a crop survey. In: Strain BR, Cure JD, eds.Direct Effects of Increasing Carbon Dioxide on Vegetation, DOE/ER-0238, Washington DC, USA:United States Department of Energy, 99-116.
Curtis, P.S. and X. Wang. 1998. A meta-analysis of elevated CO2 effects on woody plant mass, form,and physiology. Oecologia 113:299-313.

140
Daley, P.F., K.A. Surano, and J.H. Shinn. 1988. Long-term Eexposure of Alfalfa (Medicago sativaL.) to Elevated Atmospheric Carbon Dioxide. I. Photosynthesis, Yield, and Growth Analysis. ReportUCRL-98576, Lawrence Livermore National Laboratory, Livermore, CA.
Denison, R.F. and R.S. Loomis. 1989. An Integrative Physiological Model of Alfalfa Growth andDevelopment, Publication 1926, University of California, Oakland, CA.
Doorenbos, J. and W.H. Pruitt. 1977. Crop water requirements. FAO Irrigation and Drainage Paper24. Food and Agriculture Organization of the United Nations. Rome.
Dugas, W.A. and P.J. Pinter Jr.. (eds.). 1994. The free-air carbon dioxide enrichment (FACE) cottonproject: A new field approach to assess the biological consequences of global change. Agric. For.Meteorol. 70:1-342.
Easterling, D.R.; Horton, B.; Jones, P.D.; Peterson, T.C.; Karl, T.R.; Parker, D.E.; Salinger, M.J.;Razuvayev, V.; Plummer, N.; Jamason, P.; and Folland, C.K. 1997. Maximum and minimumtemperature trends for the globe. Science 277: 364-367.
Enoch, H.Z. and B.A. Kimball. (eds.). 1986. Carbon Dioxide Enrichment of Greenhouse Crops:Volume I, Status and CO2 Sources and Volume II, Physiology, Yield, and Economics. CRC Press,Boca Raton, FL, 181 pp. and 230 pp., respectively.
Erie, L.J., O.F. French, D.A. Bucks, and K. Harris. 1982. Consumptive use of water by major cropsin the Southwestern United States. Conservation Research Report 29, USDA, Agricultural ResearchService, Washington, DC.
Farage, P.K., I.F. McKee, and S.P. Long. 1998. Does a low nitrogen supply necessarily lead toacclimation of photosynthesis to elevated CO2? Plant Physiol. 118: 573-580.
Fleischner, T. 1994. Ecological costs of livestock grazing in western North America. ConservationBiology 8:629-644.
Fox Jr., F.A., T. Scherer, D.C. Slack, and L.J. Clark. 1992. AriZona Irrigation SCHEDuling User'sManual. Cooperative Extension, Agricultural and Biosystems Engineering, University of Arizona,Tucson AZ, 36 pp.
Frate, C., B. Roberts, and R. Sheesley. 1988. Managing alfalfa production with limited irrigationwater. P. 7-13. In 18th Calif. Alfalfa Symp., Modesto, CA, 7-8 December 1988. Univ. Calif., Davis.
Garcia, R.L., J.M. Norman, and D.K. McDermitt. 1990. Measurements of canopy gas exchangeusing an open chamber system. Remote Sensing Reviews 5:141-162.

141
Grant, R.F., R.L. Garcia, P.J. Pinter Jr., D.J. Hunsaker, G.W. Wall, B.A. Kimball, and R.L. LaMorte.1995a. Interaction between atmospheric CO2 concentration and water deficit on gas exchange andcrop growth: Testing of ecosys with data from a free-air CO2 enrichment (FACE) experiment. GlobalChange Biology 1:443-454.
Grant, R.F., B.A. Kimball, P.J. Pinter Jr., G.W. Wall, R.L. Garcia, R.L. LaMorte, and D.J. Hunsaker.1995b. Carbon dioxide effects on crop energy balance: testing ecosys with a free-air CO2 enrichment(FACE) experiment. Agron. J. 87:446-457.
Grant, R.F., T.A. Black, G. den Hartog, J.A. Berry, S.T. Gower, H.H. Neumann, P.D. Blanken, P.C.Yang, and C. Russell. 1999a. Diurnal and annual exchanges of mass and energy between anaspen-hazelnut forest and the atmosphere: testing the mathematical model ecosys with data from theBOREAS experiment. J. Geophys. Res. 104: 27,699-27,717.
Grant, R.F., G.W. Wall, B.A. Kimball, K.F.A. Frumau, P.J. Pinter Jr., D.J. Hunsaker, and R.L.LaMorte. 1999b. Crop water relations under different CO2 and irrigation: Testing ecosys with thefree-air CO2 enrichment (FACE) experiment. Agric. For. Meteorol. 95:27-51.
Grant, R.F., M.L. Goulden, S.C. Wofsy, and J.A. Berry. 2001a. Carbon and energy exchange by ablack spruce - moss ecosystem under changing climate: testing the mathematical model ecosys withdata from the BOREAS experiment. J. Geophys. Res. (in press).
Grant, R.F., B.A. Kimball, T.J. Brooks, G.W. Wall, P.J. Pinter Jr., D.J. Hunsaker, F.J. Adamsen, R.L.LaMorte, S.W. Leavitt, T.L. Thompson, and A.D. Matthias. 2001b. Interaction among CO2 N andclimate on energy exchange of wheat model theory and testing with a free air CO2 enrichment(FACE) experiment. Agronomy J. (in press).
Grissino-Mayer, H. D., T.W. Swetnam, and R.K. Adams. 1997. The rare, old-aged conifers of ElMalpais-Their role in understanding climatic change in the American Southwest. Pages 155-161 inNatural history of El Malpais National Monument (compiled by K. Mabery). Bulletin 156, NewMexico Bureau of Mines & Mineral Resources, Socorro, NM 87801.
Grossman, S., Th. Kartschall, B.A. Kimball, D.J. Hunsaker, R.L. LaMorte, R.L. Garcia, G.W. Wall,and P.J. Pinter Jr. 1995. Simulated responses of energy and water fluxes to ambient atmosphere andfree-air carbon dioxide enrichment in wheat. J. Biogeography 22:601-610.
Grossman-Clarke, S., B.A. Kimball, D.J. Hunsaker, S.P. Long, R.L. Garcia, Th. Kartschall, G.W.Wall, P.J. Pinter Jr., F. Wechsung, and R.L. LaMorte. 1999. Effects of elevated atmospheric CO2 oncanopy transpiration in senescent spring wheat. Agric. For. Meteorol. 93:95-109.
Hansen, J., M. Sato, and R. Ruedy. 1995. Long-term changes of the diurnal temperature cycle:Implications about mechanisms of global climate change. Atmospheric Research 37: 175-209.

142
Hebeisen, T., A. Lüscher, S. Zanetti, B.U. Fischer, U.A. Hartwig, M. Frehner, G.R. Hendrey, H.Blum, and J. Nösberger. 1997. Growth response of Trifolium repens L. and Lolium perenne L. asmonocultures and bi-species mixture to free-air CO2 enrichment and management. Global ChangeBiology 3:149-160.
Hendrey, G.R. (ed). 1993. FACE: Free-Air CO2 Enrichment for Plant Research in the Field. C. K.Smoley, Boca Raton FL, 308 pp.
Hendrix, D.L. and K.K. Peelen. 1987. Artifacts in the analuysis of plant tissue for solublecarbohydrates. Crop Science 27:710-715.
Hendrix, D.L. 1992. Influence of elevated CO2 on leaf starch of field-grown cotton. In: G.R. Hendrey(Editor), Free-Air CO2 Enrichment for Plant Research in the Field, CRC Press, Boca Raton, FL. pp223-226.
Hendrix, D.L. 1993. Rapid extraction and analysis of nonstructural carbohydrates in plant tissue.Crop Science. 33:1306-1311.
Hird, S.M., A.N. Webber, T.A. Dyer, and J.C. Gray. 1991. Differential expression of thechloroplast genes for the 47kDa chlorophyll a-protein and the 10kDa phosphorprotein duringchloroplast development in wheat. Current Genetics 19:199-206.
Holt, D.A., R.J. Bula, G.E. Miles, M.M. Schreiber, and R.M. Peart. 1975. Environmental Physiology,Modeling and Simulation of Alfalfa Growth: I. Conceptual Development of SIMED, ResearchBulletin 907, Agricultural Experiment Station, Purdue University, West Lafayette IN, and USDA,Agricultural Research Service.
Hunsaker, D.J., B.A. Kimball, P.J. Pinter Jr., R.L. LaMorte, and G.W. Wall. 1996. Carbon dioxideenrichment and irrigation effects on wheat evapotranspiration and water use efficiency. Trans. of theASAE 39:1345-1355.
Idso, S. B. 1988. Three phases of plant response to atmospheric CO2 enrichment. Plant Physiol.87:5-7.
Idso, S. B. 1990. Interactive effects of CO2 and climate variables on plant growth. p. 61-69. InProc. Symp. ASA Mtg. Anaheim, CA. 27 Nov-2 Dec. 1988. B. A. Kimball, N. J. Rosenberg L. H.Allen Jr. (ed.) In Impact of CO2, Trace Gases, and Climate Change on Global Agriculture. ASASpecial Publication No. 53 ASA, CSSA, SSSA, Madison WI.
Idso, S. B. 1991a. The aerial fertilization effect of CO2 and its implications for global carbon cyclingand maximum greenhouse warming. Bull. Am. Met. Soc. 72(7):962-965.
Idso, S. B. 1991b. Carbon dioxide and the fate of Earth. Global Environ. Change 1(3):178-182.

143
Idso, S. B. 1992. Carbon dioxide and global change: end of nature or rebirth of the biosphere? p.414-433. H. H. Lehr (ed.) In Rational Readings in Environmental Concerns. Van Nostrand ReinholdNY.
Idso, S. B. 1995. CO2 and the biosphere: The incredible legacy of the industrial revolution. p. 1-31.Special Publication of The Department of Soil, Water, & Climate, University of Minnesota, St. PaulMN. 12 October 1995.
Idso, S.B. 1997a. The poor man’s biosphere, including simple techniques for conducting CO2enrichment and depletion experiments on aquatic and terrestrial plants. Environ. Exp. Bot. 38: 15-38.
Idso, S. B. 1997b. Biological Consequences of Atmospheric CO2 Enrichment. p. 141-180. InGlobal Warming: The science and the politics. The Fraser Institute, Vancouver, British Columbia,Canada.
Idso, S.B. 1999. The long-term response of trees to atmospheric CO2 enrichment. Global ChangeBiol. 5: 493-495.
Idso, S.B. and B.A. Kimball. 1992. Aboveground inventory of sour orange trees exposed to differentatmospheric CO2 concentrations for 3 full years. Agric. Forest Meteorol. 60: 145-151.
Idso, S. B. and B.A. Kimball. 1993. Tree growth in carbon dioxide enriched air and its implicationsfor global carbon cycling and maximum levels of atmospheric CO2. Global Biogeochemical Cycles7(3):537-555.
Idso, K.E. and S.B. Idso. 1994. Plant responses to atmospheric CO2 enrichment in the face ofenvironmental constraints: a review of the past 10 years’ research. Agric. For. Meteorol. 69:153-203.
Idso, S.B. and B.A. Kimball. 1997. Effects of long-term atmospheric CO2 enrichment on the growthand fruit production of sour orange trees. Global Change Biol. 3: 89-96.
Idso, S. B., B.A. Kimball, and J.R. Mauney. 1988a. Atmospheric CO2 enrichment and plant drymatter content. Agric. & Forest Meteorol. 43:171-181.
Idso, S. B., B.A. Kimball, and J.R. Mauney. 1988b. Effects of atmospheric CO2 enrichment on root:shoot ratios of carrot, radish, cotton and soybean. Agric. Ecosystem & Environ. 21:293-299.
Idso, S.B., B.A. Kimball, and D.L. Hendrix. 1993. Air temperature modifies the size-enhancingeffects of atmospheric CO2 enrichment on sour orange tree leaves. Environmental and ExperimentalBotany 33: 293-299.

144
Idso, S.B., B.A. Kimball, and D.L. Hendrix. 1996. Effects of atmospheric CO2 enrichment onchlorophyll and nitrogen concentrations of sour orange tree leaves. Environmental and ExperimentalBotany 36: 323-331.
Idso, S.B., C.D. Idso, and K.E. Idso. 2000a. CO2 global warming and coral reefs: prospects for thefuture. Technology 7S:71-94.
Idso, K.E., C.D. Idso, and S.B. Idso. 2000b. Atmospheric CO2 enrichment: implications forecosystem biodiversity. Technology 7S:57-69.
Idso, S. B., B.A. Kimball, M.G. Anderson, and J.R. Mauney. 1987. Effects of atmospheric CO2enrichment on plant growth: The interactive role of air temperature. Agric. Ecosystem & Environ.20:1-10.
Idso, S. B., B.A. Kimball, D.E. Akin, and J. Krindler. 1993. A general relationship between CO2-induced reductions in stomatal conductance and concomitant increases in foliage temperatures. Environ. & Exp. Bot. 33(3):443-446.
Idso, S.B., R.D. Jackson, P.J. Pinter Jr., R.J. Reginato, and J.L. Hatfield. 1981. Normalizing thestress-degree-day parameter for environmental variability. Agric. Meteorol. 24:45-55.
Idso, C.D., S.B. Idso, B.A. Kimball, H.-S. Park, J.K. Hoober, and R.C. Balling Jr. 2000a. Ultra-enhanced spring branch growth in CO2-enriched trees: Can it alter the phase of the atmosphere’sseasonal CO2 cycle? Environ. Exp. Bot. 43: 91-100.
Idso, S.B., B.A. Kimball, G.R. Pettit III, L.C. Garner, G.R. Pettit, and R.A. Backhaus. 2000b. Effectsof atmospheric CO2 enrichment on the growth and development of Hymenocallis littoralis(Amaryllidaceae) and the concentrations of several antineoplastic and antiviral constituents of itsbulbs. Amer. J. Bot. 87: 769-773.
Idso, S.B., B.A. Kimball, P.E. Shaw, W. Widmer, J.T. Vanderslice, D.J. Higgs, A. Montanari, andW.D. Clark. 2001. The effect of elevated atmospheric CO2 on the vitamin C concentration of (sour)orange juice. J. Expt. Bot. (submitted).
IPCC (Intergovernmental Panel on Climate Change, Working Group II). 2001. Climate Change:Impacts, Adaptation, and Vulnerability, IPCC Third Assessment Report, IPCC Secretariat, WMO,Geneva, Switzerland.
Jackson, R.D., S.B. Idso, R.J. Reginato, and P.J. Pinter Jr. 1981. Canopy temperature as a crop waterstress indicator. Water Resources Research 17:1133-1138.

145
Jamieson, P.D, J. Berntsen, F. Ewert, B.A. Kimball, J.F. Olesen, P.J. Pinter Jr., J.R. Porter, and M.A.Semenov. 2001. Modelling CO2 effects on wheat with varying nitrogen supplies. AgricultureEcosystems and the Environment. (in press).
Jitla, D.S., G.S. Rogers, S.P. Seneweera, A.S. Basra, R.J. Oldfield, and J.P. Conroy. 1997.Accelerated early growth of rice at elevated CO2: Is it related to developmental changes in the shootapex? Plant Physiol. 115: 15-22.
Kartschall, T., S. Grossman, P.J. Pinter Jr., R.L. Garcia, B.A. Kimball, G.W. Wall, D.J. Hunsaker,and R.L. LaMorte. 1995. A simulation of phenology, growth, carbon dioxide exchange and yieldsunder ambient atmosphere and free-air carbon dioxide enrichment (FACE) Maricopa AZ for wheat.J. Biogeography 22:611-622.
Keeney, D.R. and D.W. Nelson. 1982. Nitrogen-Inorganic forms. p. 643-698. In A.L. Page et al. (ed.)Methods of soil analysis. Part 2. 2nd ed. Agron. Monogr. 9. ASA and SSSA, Madison, WI.
Kimball, B.A. 1981. A computer model of guayule. Annual Report, U.S. Water ConservationLaboratory, USDA-ARS, Phoenix AZ. 81-108.
Kimball, B.A. 1983a. Carbon dioxide and agricultural yield: An assemblage and analysis of 430prior observations. Agronomy Journal 75:779-788.
Kimball, B.A. 1983b. Carbon Dioxide and Agricultural Yield: An Assemblage and Analysis of 770Prior Observations. WCL Report 14, U. S. Water Conservation Laboratory, Phoenix AZ, 71 pp.
Kimball, B.A. 1985. Adaptation of vegetation and management practices to a higher carbon dioxideworld. In B. R. Strain and J. D. Cure, (eds.), Direct Effects of Increasing Carbon Dioxide onVegetation. U. S. Dept. of Energy, Carbon Dioxide Research Division, Washington, DC. 185-204.
Kimball, B.A. 1986a. Influence of elevated CO2 on crop yield. In H. Z. Enoch and B. A. Kimball(eds), CO2 Enrichment of Greenhouse Crops Vol. II Physiology, Yield, and Economics. CRC Press,Boca Raton FL, 105-115.
Kimball, B.A. 1986b. A modular energy balance program including subroutines for greenhousesand other latent heat devices. U. S. Department of Agriculture, Agric. Res. Ser., ARS-33, 360 pp.
Kimball, B.A. 1993. Ecology of crops in changing CO2 concentration. J. Agricultural Meteorology48:559-566.
Kimball, B.A. and S.B. Idso. 1983. Increasing atmospheric CO2: Effects on crop yield, water useand climate. Agricultural Water Management 7:55-72.
146
Kimball, B.A. and J.R. Mauney. 1993. Response of cotton to varying CO2, irrigation, and nitrogen:yield and growth. Agronomy J. 85:706-712.
Kimball, B.A., P.J. Pinter Jr. and J.R. Mauney. 1992. Cotton leaf and boll temperatures in the 1989FACE experiment. Critical Reviews in Plant Sciences 11:233-240.
Kimball, B.A., N.J. Rosenberg, and L.H. Allen, Jr. (eds.) 1990. Impact of Carbon Dioxide, TraceGases, and Climate Change on Global Agriculture. ASA Special Pub. No. 53, American Society ofAgronomy, Crop Science Society of America, and Soil Science Society of America, Madison WI.
Kimball, B.A., J.R. Mauney, F.S. Nakayama, and S.B. Idso. 1993a. Effects of elevated CO2 andclimate variables on plants. J. Soil and Water Conservation 48:9-14.
Kimball, B.A., J.R. Mauney, F.S. Nakayama, and S.B., Idso. 1993b. Effects of increasingatmospheric CO2 on vegetation. Vegetatio 104/105:65-75.
Kimball, B.A., P.J. Pinter Jr., G.W. Wall, R.L. Garcia, R.L. LaMorte, P.M. Jak, K.F.A. Frumau, andH.F. Vugts. 1997. Comparisons of responses of vegetation to elevated carbon dioxide in free-air andopen-top chamber facilities. In. L.H. Allen, Jr., M.B. Kirkham, D.M. Olszyk, and C.E. Whitman(eds.), Advances in Carbon Dioxide Research, ASA Special Publication No. 61, American Societyof Agronomy, Crop Science Society of American, and Soil Science Society of America, Madison WI.p. 113-130.
Kimball, B.A., P.J. Pinter Jr., R.L. Garcia, R.L. LaMorte, G.W. Wall, D.J. Hunsaker, G. Wechsung,F. Wechsung, and Th. Kartschall. 1995. Productivity and water use of wheat under free-air CO2enrichment. Global Change Biology 1:429-442.
Kimball, B.A., R.L. LaMorte, P.J. Pinter Jr., G.W. Wall, D.J. Hunsaker, F.J. Adamsen, S.W. Leavitt,T.L. Thompson, A.D. Matthias, and T.J. Brooks. 1999. Free-air CO2 enrichment (FACE) and soilnitrogen effects on energy balance and evapotranspiration of wheat. Water Resources Research35:1179-1190.
Kimball, B.A., J.R. Mauney, R.L. LaMorte, G. Guinn, F.S. Nakayama, J.W. Radin, E.A. Lakatos,S.T. Mitchell, L.L. Parker, G.J. Peresta, P.E. Nixon III, B. Savoy, S.M. Harris, R. MacDonald, H.Pros, and J. Martinez. 1992. Carbon dioxide enrichment: Data on the response of cotton to varyingCO2, irrigation, and nitrogen. ORNL/CDIAC-44, NDP-037, Oak Ridge National Laboratory, OakRidge TN. 592 pp.
Krapp, A., B. Hoffmann, C. Fer, and M. Stitt. 1993. Regulation of the expression of rbcS and otherphotosynthetic genes by carbohydrates: a mechanism for the “sink regulation” of photosynthesis?Plant J. 3:817-828.

147
Krapp, A., W.P. Quick, and M. Stitt. 1991. Ribulose-1, 5-bisphosphate carboxylase oxygenase,other Calvin enzymes, and chlorophyll decrease when glucose is supplied to mature spinach leavesvia the transpiration stream. Planta 186:58-69.
Leavitt, S.W., E.A. Paul, B.A. Kimball, G.R. Hendrey, J. Mauney, R. Rauschkolb, H. Rogers, K.F.Lewin, P.J. Pinter Jr., and H.B. Johnson. 1994. Carbon isotope dynamics of CO2-enriched FACEcotton and soils. Agric. For. Meteorol. 70:87-102.
Leavitt, S.W., E.A. Paul, A. Galadima, F.S. Nakayama, S.R. Danzer, H. Johnson, and B.A. Kimball.1996. Carbon isotopes and carbon turnover in cotton and wheat FACE experiments. Plant and Soil187:147-155.
Leavitt, S.W., E. Pendall, E.A. Paul, T. Brooks, B.A. Kimball, P.J. Pinter Jr., H.B. Johnson, A.Matthias, G.W. Wall, and RL. LaMorte. 2001. Stable-carbon isotopes and soil organic carbon in the1996 and 1998 FACE wheat experiments. New Phytologist (in press).
Livingston, G.P. and G.L. Hutchinson. 1995. Enclosure-based measurement of trace gas exchange:Applications and sources of errors. pp. 15-51. In P.A. Matson and R.C. Harriss (eds.), Biogenic TraceGases: Measuring Emissions from Soil and Water, Blackwell Sci. Publishing, London.
Lüscher, A., U.A. Hartwig, D. Suter, and J. Nösberger. 2000. Direct evidence that symbiotic N2fixation in fertile grassland is an important trait for a strong response of plants to elevatedatmospheric CO2. Global Change Biology 6:655-662.
Matthias, A.D. A.M. Blackmer, and J.M. Bremner. 1980. A simple chamber technique for fieldmeasurement of emissions of nitrous oxide from soils. J. Environ. Qual. 9:251-256.
McAuliffe, C., D.S. Chamblee, H. Uribe-Arango, and W.W. Woodhouse Jr. 1958. Influence ofinorganic nitrogen on nitrogen fixation by legumes as revealed by 15N. Agronomy Journal 50:334-337.
Miglietta, F., et al. 1997. Free-air CO2 enrichment of potato (Solanum tuberosum L.): Design andperformance of the CO2-fumigation system. Global Change Biology 3:417-425.
Miller, A., C.-H. Tsai, D. Hemphill, M. Endres, S. Rodermel, and M. Spalding. 1997. Elevated CO2effects during leaf ontogeny: A new perspective on acclimation. Plant Physiol. 115: 1195-1200.
Moore, M.M.; W.W. Covington, and P.Z. Fule. 1999. Evolutionary, environmental, referenceconditions, and ecological restoration: a southwestern ponderosa pine perspective. EcologicalApplications 9:1266-1277.

148
Moran, M.S., T.R. Clarke, Y. Inoue, and A. Vidal. 1994. Estimating crop water deficit using therelation between surface-air temperature and spectral vegetation index. Remote Sensing Environ.49:246-263.
Morison, J.I.L. 1985. Sensitivity of stomata and water use efficiency to high CO2. Plant, Cell andEnvironment 8:467-474.
Nakagawa, H. and T. Horie. 2000. Rice responses to elevated CO2 and temperature. GlobalEnvironmental Research 3:101-113.
Neilson, R. P. 1995. A model for predicting continental-scale vegetation distribution and waterbalance. Ecological Applications 5(2):362-385.
Nie, G.-Y., B.A. Kimball, P.J. Pinter Jr., G.W. Wall, R.L. Garcia, R.L. LaMorte, R.L.; A.N. Webber,and S.P. Long. 1995a. Free-air CO2 enrichment effects on the development of the photosyntheticapparatus in wheat, as affected by changes in leaf proteins. Plant, Cell, and Environ. 18:855-864.
Nie, G.-Y., D.L. Hendrix, A.N. Webber, B.A. Kimball, and S.P. Long. 1995b. Increasedaccumulation of carbohydrates and decreased photosynthetic gene transcript levels in wheat grownat an elevated CO2 concentration in the field. Plant Physiol. 108:975-983.
Norby, R.J., S.D. Wullschleger, C.A. Gunderson, D.W. Johnson, and R. Ceulemans. 1999. Treeresponses to rising CO2 in field experiments: implications for the future forest. Plant, Cell andEnvironment 22:683-714.
Ottman, M.J., B.A. Kimball, P.J. Pinter Jr., G.W. Wall, R.L. Vanderlip, S.W. Leavitt, R.L. LaMorte,A.C. Matthias, and T.J. Brooks. 2001. Elevated CO2 Effects on Sorghum Growth and Yield at Highand Low Soil Water Content. New Phytologist. (In press)
Pinter Jr, P.J., N.F. Hadley, and J.H. Lindsay. 1975. Alfalfa crop micrometeorology and its relationto insect pest biology and control. Envir. Entomology 4:153-162.
Pinter Jr., P.J., R.J. Anderson, B.A. Kimball, and J.R. Mauney. 1992. Evaluating cotton responseto free-air carbon dioxide enrichment with canopy reflectance observations. Critical Reviews in PlantSciences 11:241-249.
Pinter Jr., P.J., B.A. Kimball, J.R. Mauney, G.R. Hendrey, K.F. Lewin, and J. Nagy. Effects of free-air CO2 enrichment on PAR absorption and conversion efficiency by cotton. Agric. For. Meteorol.70:209-230. 1994.
Pinter Jr., P.J., B.A. Kimball, R.R. Rokey, G.W. Wall, R.L. LaMorte, R.L. Garcia, and D.J. Hunsaker.1995. Seasonal dynamics of PAR absorption and conversion efficiency by spring wheat. AnnualResearch Report, U.S. Water Conservation Laboratory, USDA-ARS, Phoenix AZ. 83-86.

149
Pinter Jr., P.J., B.A. Kimball, R.R. Rokey, G.W. Wall, R.L. LaMorte, N.R. Adam, and T.J. Brooks.1998. NDVI, fAPAR, and plant area index in the 1998 FACE sorghum experiment. Annual ResearchReport, U.S. Water Conservation Laboratory, USDA-ARS, Phoenix AZ. 98-101.
Pinter Jr., P.J., B.A. Kimball, R.L. LaMorte, G.W. Wall, D.J. Hunsaker, F.J. Adamsen, K.F.A.Frumau, H.F. Vugts, G.R. Hendrey, K.R. Lewin, J. Nagy, H.B. Johnson, S.W. Leavitt, T.L.Thompson, A.D. Matthias, and T.J. Brooks. 2000. Free-air CO2 enrichment (FACE): Blower effectson wheat canopy microclimate and plant development. Agric. For. Meteorol. 103/4:319-332.
Poorter, H. 1993. Interspecific variation in the growth response of plants to an elevated ambient CO2concentration. In: Rozema J, Lambers H, Van de Geijn SC, Cambridge ML. eds. CO2 and Biosphere,Dordrecht, Netherlands: Kluwer Acacemic Publishers, p.77-97.
Reddy, K.R. and H.F. Hodges. (eds.). 2000. Climate Change and Global Crop Productivity, CABIPublishing, NY.
Rillig, M.C., S.F. Wright, M.F. Allen, and C.B. Field. 1999. Rise in carbon dioxide changes soilstructure. Nature 400: 628.
Rillig, M.C.; S.F. Wright, B.A. Kimball, P.J. Pinter Jr., G.W. Wall, M.J. Ottman, and S.W. Leavitt.2001. Elevated carbon dioxide (free-air CO2 enrichment, FACE) and irrigation effects on water stableaggregates in a Sorghum field: a possible role for arbuscular mycorrhizal fungi. Global ChangeBiology (in press).
Rosenberg, N.J., B.A. Kimball, P. Martin, and C.F. Cooper. 1990. From climate and CO2 enrichmentto evapotranspiration. p. 151-175. In P. E. Waggoner (ed.), Climate Change and U. S. WaterResources, John Wiley & Sons, NY.
Ryden, J.C., J.H. Skinner, and D.J. Nixon. 1987. Soil core incubation system for the fieldmeasurement of denitrification using acetylene-inhibition. Soil Biol. Biochem. 19:753-757.
Sgherri, C.L.M., M.F. Quartacci, M. Menconi, A. Raschi, and F. Navari-Izzo. 1998. Interactionsbetween drought and elevated CO2 on alfalfa plants. J. Plant Physiology. 152:118-124.
Sgherri, C.L.M.; P. Aalvateci, M. Menconi, A. Raschi, and F. Navari-Izzo. 2000. Interaction betweendrought and elevated CO2 in the response of alfalfa plants to oxidative stress. J. Plant Physiology.156:360-366.
Sheen, J., H. Huang, A.R. Schaefner, P. Leon, and J-C. Janag. 1992. Sugars, fatty acids, andphotosynthetic gene expression. Photosynthesis Research 34:107.
Sheen, J. 1990. Metabolic repression of transcription in higher plants. Plant Cell 2:1027-1038.

150
Stitt, M. 1991. Rising CO2 levels and their potential significance for carbon flow in photosyntheticcells. Plant, Cell, and Environ. 14:741-762.
Terry, R.E., E.N. Jellen, and D.P. Breakwell. 1986. Effect of irrigation method and acetyleneexposure on field denitrification measurements. Soil Sci. Soc. Am. J. 50:115-120.
Tubiello, F.N., C. Rosenzweig, B.A. Kimball, P.J. Pinter Jr., G.W. Wall, D.J. Hunsaker, R.L.LaMorte, and R.L. Garcia. 1999. Testing CERES-Wheat with free-air carbon dioxide enrichmentdata: CO2 and water interactions. Agronomy J. 91:247-255.
USDA (United States Department of Agriculture). 2000. Agricultural Statistics 1999, U.S.Government Printing Office, Washington, DC.
Van Kessel, C., D.J. Pennock, and R.E. Farrell. 1993. Seasonal variation in denitrification and nitrousoxide evolution at the landscape scale. Soil Sci. Soc. Am. J. 57:988-995.
Walker, B.H., W.L. Steffen, J. Canadell, and J.S.I. Ingram. 1998. Implications of Global Changefor Natural and Managed Ecosystems: A Synthesis of GCTE and Related Research. IGBP BookSeries No. 4, Cambridge University Press, UK.
Wall, G.W. and B.A. Kimball. 1993. Biological databases derived from free-air carbon dioxideenrichment experiments. 329-348. In E.-D. Schulze and H.A. Mooney (eds.) Design and Executionof Experiments on CO2 Enrichment. Ecosystems Report 6, Environmental Research Programme,Commission of the European Communities, Brussels.
Wall, G.W. J.S. Amthor, and B.A. Kimball. 1994. COTCO2: A cotton growth simulation model forglobal change. Agric. For. Meteorol. 70:289-342.
Wall, G.W., T.J. Brooks, N.R. Adam, A. Cousins, J. Triggs, B.A. Kimball, P.J. Pinter Jr., R.L.LaMorte, M.J. Ottman, M.M. Conley, S.W. Leavitt, A.D. Matthias, D.G. Williams, and A.N.Webber. 2001. Leaf photosynthesis and water relations of grain sorghum grown in Free-air CO2enrichment (FACE) and water stress. New Phytologist. (in press).
Wand, S.J.E., G.F. Midgley, M.H. Jones, and P.S. Curtis. 1999. Responses of wild C4 and C3grasses (Poaceae) species to elevated atmospheric CO2 concentration: a meta-analytic test of currenttheories and perceptions. Global Change Biology 5:723-741.
Wilkinson, C.R. 1998. Fire on the Plateau: Conflict and Endurance on the Colorado Plateau, IslandPress, 416 pp.
Witty, J.F. 1983. Estimating N2-fixing in the field using 15N- labelled fertilizer: some problems andsolutions. Soil Biology and Biochemistry. 15:631-639.

151
Wullschleger, S.D., R.J. Norby, and C.A. Gunderson. 1997. Forest trees and their response toatmospheric carbon dioxide enrichment: A compilation of results. In: Allen LHJr, Kirkham MB,Olszyk DM, Whitman CE. eds. Advances in Carbon Dioxide Research, Madison WI, USA: AmericanSociety of Agronomy, Crop Science Society of America, and Soil Science Society of America, p.79-100.

152
PROJECT SUMMARY
We propose to conduct agricultural water management research using remote sensingapproaches with the following objectives: (1) Develop and critically assess methods for usingreflected solar and emitted thermal energy to quantify temporal and spatial variations in cropresponse to water, nutrients, and pests. Special emphasis will be placed on developingalgorithms that perform reliably regardless of plant phenology and biomass, and thus can be usedfor crop management purposes throughout the entire growing season. (2) Develop and improveirrigation scheduling methodologies that are responsive to actual crop evapotranspiration (ET)and irrigation requirements. Multispectral vegetation indices will be used to develop and testreal time, basal crop evapotranspiration coefficients (Kcb) which are expected to providesignificant improvements of actual crop ET prediction for use with irrigation schedulingprocedures for cotton and wheat. (3) Develop methods for using remotely sensed observationsin precision management of water, nutrients, and pests in irrigated crops. Remote data will betested as a means to direct an efficient sampling routine. It will also be used in conjunction withsimple and process-oriented crop growth and management models to provide spatial informationneeded to run the models with a minimum amount of input. Research accomplished during thisproject will result in improved methods for quantifying actual crop water and nutrient needs, aswell as methods to detect water, nutrient, and pest related stresses. This will enable growers tomake better informed, within-season management decisions about the need to irrigate, fertilize,or control pests on an “as needed” basis within their farms or fields and particularly in situationswhere variable rate technology is in use.
OBJECTIVES
1. Develop and critically assess methods for using reflected solar and emitted thermal energy toquantify temporal and spatial variations in crop response to water, nutrients, and pests.
Spectral reflectance and thermal emittance properties of soils and plants will be used todetect environmental stresses that limit productivity of agricultural crops. Traditionalvegetation indices such as the NDVI will be combined with other spectral information that isless sensitive to canopy biomass in order to reduce problems associated with partial canopyconditions and enable identification of water and nutrient related stresses throughout theentire growing season.
2. Develop and improve irrigation scheduling methodologies that are responsive to actual cropevapotranspiration and irrigation requirements.
Basal crop coefficients (Kcb) will be derived from multispectral vegetation indices thenrefined to provide improved water management capabilities within the framework ofaccepted FAO-56 irrigation scheduling procedures. A two-dimensional Crop Water StressIndex (CWSI) which accounts for partial canopy conditions will be used to more accuratelyquantify real-time crop water use and map its spatial variability throughout the entiregrowing season.

153
3. Develop methods for using remotely sensed observations in precision management of water,nutrients, and pests in irrigated crops.
Statistical and image analysis procedures will be used with multispectral reflectance andthermal emittance imagery of agricultural fields to guide efficient sampling groundprocedures, define management zones, and generate maps of crop density and conditionsrelated to water, nutrient, and pest stresses. Indices related to crop nutrient status,transpirational potential (i.e. Kcb), and water stress (CWSI) will be integrated into process-oriented crop models to predict spatial and temporal variability in plant response across afield and provide a framework for precision management of water and nutrients.
NEED FOR RESEARCH
Description of the Problem to be Solved
Industrialized nations are poised on the threshold of dramatic changes in the way naturalresources are surveyed, monitored, and managed. Growers are being encouraged to increasetheir productivity per unit of land and water in order to feed a hungry world. Agriculturalresource managers are recognizing within-field variability in potential productivity and seekingways to customize their growing practices to exploit that variability (National Research Council,1997). Environmental guidelines mandate more efficient and safer use of agricultural chemicals.As a result, today’s farmers require an increasing amount of information on field and plantconditions to manage their crops in a sustainable and environmentally sensitive manner and stillmake a profit. Not only does this information need to be accurate and consistent, but it alsoneeds to be available at temporal and spatial scales that match the farmer’s capability to varywater and agrochemical inputs (i.e., precision crop management).
A large body of research spanning the past three decades has demonstrated the potential forremote sensing (RS) to deliver this type of spatial and temporal information on soil and cropresponse to dynamic environmental conditions and management. Now, when combined withextraordinary advances in precise global positioning satellite (GPS) devices, microcomputers,geographic information systems (GIS), and enhanced crop simulation models, farmers can useremote sensing from ground, aircraft, and satellite platforms to monitor and manage their cropson a routine, cost-effective basis. The successful application of RS technology to agriculturalresource management requires a basic understanding of how changes in plant growth, form, andfunction affect spectral reflectance and thermal emittance properties of crops in the field.
Beyond this fundamental requirement however, a number of significant problems still need to beovercome before RS will be able to deliver on promises made to consumers and agriculturetowards the end of the last century. How, for example, can signals associated with plant water-,nutrient-, and pest stress conditions be discerned for certain when scenes are composed ofvarying amounts of plant and soil components? What is the best way for RS to provideadditional spatial and temporal information needed to improve the performance of existingirrigation scheduling and crop growth simulation algorithms? These are research issues that arebecoming more important as precision agriculture assumes a greater role in producing America’s
154
food and fiber. They are also examples of the problems that we propose to explore in thisproject’s research plan. One has only to look at the somewhat disappointing failure rate amongof commercial remote sensing ventures to recognize that this is high risk research that is bestaddressed through a long-term national research program.
Relevance to ARS National Program Action Plan
This project relates broadly to several components within the National Program for WaterQuality and Management by providing approaches for monitoring the response of soils and cropsto management practices and environmental conditions, for detecting the occurrence of growth-limiting plant stresses, and for quantifying biophysical processes such as evapotranspiration (ET)and absorption of solar energy used in photosynthetic pathways.
Objective 1 relates to the Irrigation and Drainage Management Component, Problem Area (PA)2.1, Economical Irrigated Crop Production, Goal 1 - Develop water, pest, and nutrientmanagement practices and technologies that protect the environment and improve the economicbenefits of irrigation and drainage. Objective 1 also has linkages with National Program (NP)204 Global Climate Change, and NP 305 Crop Production.
Objective 2 relates to PA 2.3, Water Conservation Management, Goal 1 - Develop technologiesto quantify and control a broad range of water supplies and uses, and Goal 2 - Develop culturaland management practices for agriculture, turf, and urban landscape plantings that maximize thereturn for irrigation water used.
Objective 3 relates to PA 2.2, Precision Irrigated Agriculture, Goal 1 - Develop precisionagricultural irrigation systems that incorporate water management strategies and remote sensingtechnologies into site-specific management for the production of agronomic and high-valuecrops, and PA 2.3, Water Conservation Management, Goal 3 – Develop improved agriculturalpractices and systems that mitigate the adverse effects of irrigation on water quality and theenvironment. Objective 3 also has links to NP 207, Integrated Agricultural Systems.
Potential Benefits
Research conducted in this project will result in improved methods for quantifying crop water,nutrient, and pest related stresses and actual irrigation water requirements. This will enablegrowers to make better informed, within-season management decisions regarding irrigationtiming and delivery volumes, fertilizer needs and pest control on an “as needed” basis withintheir farms or fields. Farmers will be able to initiate remedial actions that will maximizeeconomic benefits and minimize detrimental environmental impacts. Incorporating RS soil andplant information into crop irrigation, growth simulation, and management models will providespatial information that is needed to use these models on a finer spatial scale for describingwithin field variability and will increase their utility for precision agriculture approaches such asgenerating variable rate fertilizer application maps. In addition, the enhanced models will addpredictive capabilities to somewhat less frequent remote observations, an important benefit in

155
regions where cloud cover interferes with regular satellite or aircraft coverage.
Anticipated Products
This project will result in new and improved RS approaches for identifying different types ofplant stress and quantifying their intensity, regardless of plant biomass or phenological stage.Products for scheduling the timing and amounts of irrigation and fertilizer applications are alsoanticipated. Multispectral, real time crop coefficients for determining the seasonal course ofactual crop ET will be developed for cotton, wheat, and alfalfa. The project will also lead to newmethods for combining the spatial information from RS and the predictive capabilities of cropmanagement models, and provide specific approaches for utilizing RS capabilities in theemerging field of precision agriculture.
Customers
Stakeholders who will benefit from the research include growers; crop, soil, and irrigationconsultants; cooperative state extension personnel; commercial providers of RS products; andcommercial entities and governmental agencies that control or regulate water supplies.Algorithms developed during the course of this research will have a direct bearing on yieldprediction, and thus have potential use for agencies such as NASS or FAS who forecast yieldsover broad geographic regions. NASA and commercial RS providers will be active partners indeveloping practical farm management and regulatory applications of RS imagery.
SCIENTIFIC BACKGROUND
Objective 1 – Crop Response
The theoretical basis for using RS in agricultural resource monitoring has been established innumerous laboratory and field investigations over the past four decades (Monteith, 1959; Gateset al. 1965; Knipling, 1970; Gausman and Allen, 1973; Bauer, 1975; Jackson, 1982; Asrar et al.1989). These studies have shown vegetation to be rich in spectral features that might be used foridentification and stress assessment purposes (Gates et al., 1965; Gausman and Allen, 1973).Healthy, green vegetation has low reflectance and transmittance in the visible regions of thespectrum (400 to 700 nm) due to strong absorptance by plant pigments. However, a number ofdifferent types of stress often cause chlorophylls to decline, allowing expression of otherpigments (e.g. carotenes and xanthophylls), broadening the green reflectance peak (~550 nm)towards the red, and producing a characteristic chlorotic appearance (Adams et al. 1999). In thenear-infrared (NIR, 700 to 1300 nm), green leaves typically display high reflectance andtransmittance, since there is very little absorptance by photosynthetic pigments and considerablescattering by mesophyll cells. When plants are stressed, NIR reflectance decreases, albeitproportionately less than the visible increases. The abrupt “red edge” transition normally seenbetween visible and NIR in vigorous vegetation shifts towards shorter wavelengths and thendisappears entirely in senescent vegetation. Optical properties of leaves in a third region of thesolar spectrum, the middle- or short wave-infrared (SWIR, 1300 to 2500 nm), are strongly

156
absorbed by water but reports in the literature suggest there is insufficient variation overbiologically significant ranges of plant water content for the practical use of the SWIR as adiagnostic tool (Bowman, 1989). Energy in the thermal infrared (TIR) atmospheric “window”(~8 to 14 :m) has proven very useful in assessing water status. It is controlled primarily bylatent and sensible energy fluxes at the surface of soils and plants and is somewhat decoupledfrom their optical properties (Jackson, 1982). Physical and biological stresses that interfere withtranspiration result in elevated plant temperatures.
Compared with plants, spectral signatures of most agricultural soils are relatively simple.Nevertheless, the reflectance of soils contributes significantly to the total surface reflectance,especially early in the season when plants are small. Agricultural soils generally exhibit gradualincreases in reflectance throughout the visible and NIR (Condit, 1971; Stoner and Baumgardner,1981). High moisture and organic matter contents cause lower reflectances while smoothsurfaced soils tend to be brighter. Occurrence of specific minerals in the soil have beenassociated with unique spectral features (e.g., higher red reflectance in the presence of ironoxides). The SWIR spectra of soils display more structure than those observed in shorterwavelengths but seem dominated by moisture content and litter amounts.
From a RS perspective, crops represent a complex mixture of soil and vegetation componentsthat vary dynamically over the season. It is readily observable that overall scene reflectance andemittance change markedly as the vegetation component increases from planting to harvest.Less obvious, but not less important, spectral properties of underlying soils vary with moisturecontent, tillage, and litter fall and decomposition. Spectra of plant components change with ageof tissues, stage of growth, and architectural arrangement of organs. Apparent spectralproperties are also strongly affected by illumination and viewing angles, row orientation,topography, meteorological phenomena, and other factors that are not directly related to theplants (Jackson et al., 1979; Pinter et al., 1983, 1985, 1987; Qi et al.,1995). The real challengefor agricultural RS is to be able to separate spectral signals originating with a plant response to aparticular stress from normal plant biomass or the background “noise” that is introduced byexogenous non-plant factors.
Estimating Green Biomass, fAPAR, and Kcb: When the goal is simply to determine how muchgreen plant material is present, vegetation indices (VIs) computed as differences, ratios, or linearcombinations of reflected light in visible or NIR wavebands usually provide very good, season longperformance (Tucker, 1979; Richardson and Wiegand, 1977; Jackson and Huete, 1991). The simpleratio (NIR/Red) and normalized difference vegetation index [NDVI=(NIR-Red)/(NIR+Red)] havegained wide acceptance for estimating plant cover, green plant biomass, and leaf area index. Soiladjusted VIs such as SAVI and modified SAVI have been developed that minimize variation in soilreflectance (Huete, 1988; Qi et al., 1994). Of particular interest, VIs can also provide a remoteestimate of the fractional amount of solar energy captured by the canopy for potential use inphotosynthesis (fAPAR) for use in plant modeling studies (see scientific background in Objective 3)as well as a basal crop coefficient (Kcb) used in irrigation scheduling algorithms (Bausch and Neale,1989; Choudhury et al., 1994; also refer to Objective 2 below).

157
Detecting Crop Stress: Wideband VIs are often used in a relative sense to provide maps of “cropvigor” for management purposes (Blackmer et al., 1996). For the most part, however, VIs lackdiagnostic capability for determining why biomass is at a certain level or for identifying aparticular type of stress. Inadequate nitrogen fertilizer, for example, can result in the sameNDVI as that from a sparse canopy caused by low seeding rate or drought. To a certain extent,diagnostic ambiguity can be reduced by including reference strips that are known to havesufficient N supplies within the field (Blackmer et al., 1995). But in practice, such comparisonsare expensive to implement and difficult to achieve without incurring a cumulative bias in thesignal from the reference strip. A definitive solution that uses an absolute measure instead of arelative comparison is more desirable and practicable.
There are a number of different strategies for accomplishing this goal. One is to look forspectral features that are uniquely associated with a particular stress. Those that alter the ratiobetween chlorophyll and accessory pigments should be clearly detectable with high resolutionspectroradiometry (viz. Maas and Dunlap, 1989; Buschman and Nagel, 1993). Many indicesbased on narrow band spectral features sensitive to pigment concentrations have been proposedto identify specific nutrient and water stresses (Gamon et al., 1990, 1992, 1997; Fernandez et al.1994; Filella et al. 1995; Yoder et al., 1995; Gao, 1996; Peñuelas et al., 1997a, b, c; Peñuelas andFilella, 1998; Blackburn, 1998; Adams et al., 1999, 2000). Usually these techniques comparethe reflectance or absorptance signal at a pigment-sensitive wavelength with that in a region thatis less affected by the stress. Many of these indices are also correlated with green biomass and,thus, cannot be applied uniformly throughout the entire growing season. At present, quantitativeresearch on plant stress effects on narrow band features is still in its early stages - detailedspectral signatures of major crops grown on different soils and exposed to various managementregimes and environmental conditions have not been thoroughly investigated. It is, however,expected to lead towards new approaches for using spectral signatures to unambiguously identifydifferent types of plant stress throughout the entire growing season. In fact, the SPAD meter(Minolta Corporation) and The Observer (Spectrum Technologies, Inc.) are commercialexamples of handheld devices that are used to infer N concentration in single leaves or canopiesbased on the differential absorption of light in relatively narrow far red and NIR wavelengthintervals (Wood et al 1993; Blackmer and Schepers, 1995; Whaley, 2001). New NASA satellitesensors such as MODIS and ASTER and aircraft sensors (e.g. AVIRIS, HYDICE) have beendeployed to exploit the expanded source of information in narrower wavebands.
In addition to traditional remote sensing methods, advances in consumer electronics and themerging of photography and videography with computer technology have produced low costcamera systems that produce high quality digital images. Adamsen et al. (1999) and Kawashimaand Nakatani (1998) have developed methods to assess the greenness of plants using imagesfrom digital camera equipment. Methods of estimating flower numbers have been developedusing digital images (Adamsen et. al. 2000). Advances in low light video cameras have beenachieved by increasing the sensitivity of the cameras in the NIR region of the spectrum. Alongwith tight integration of the cameras to computers, this opens the way for inexpensive devicesthat can produce images with good resolution in the NIR region when coupled with appropriatefilters.

158
0
20
40
60
80
100
15 5 5 15 25
Perc
ent C
rop
Cov
er
1: Well-Watered Crop
2: Water-Stressed Crop
4: Dry Bare Soil
BA
C: Measured
3: Wet Bare Soil
Figure 1. Diagrammatic representation of a 2-dimensionalCrop Water Stress Index that compensates for varyingamounts of plant cover.
Hyperspectral reflectance data offer additional strategies for identifying and quantifying plantstress. Red edge position, peak characteristics, and spectral derivatives have been proposed andtested with varying degrees of success to monitor nutrient stress in plant canopies (Horler et al.,1980, 1983; Demetriades-Shah et al., 1990; Masoni et al., 1996). Neural net analysis, fuzzyanalysis, and partial least squares regression analysis are powerful approaches for capturingcomplex functional relationships between spectra and plant properties that cannot be envisionedvia usual regression techniques (Kimes et al., 1998; Jones et al., 2000). In theory, a library ofspectral features could be used to make predictions regarding plant vigor, nutrient content, orpest infestations. In still another approach, linear unmixing techniques (McGwire et al. 2000)use a spectral reference library of predetermined “pure” spectral signatures (endmembers), todecompose multispectral and hyperspectral images into their component features (e.g. sunlit andshaded soil, healthy and stressed plant areas). Such models can be inverted to extract the amountof the whole scene that is associated with a particular stress signature. If the images aregeoreferenced, the stressed area can be precisely located in the field for directed sampling,traditional pest scouting, or variable rate fertilizer applications. Spectral mixing models alsoprovide insight into how spectral properties of soils and individual plant components (leaves,stem, fruiting structures, etc.) measured with an integrating sphere or handheldspectroradiometer in the field can be scaled up to full canopy or field levels and realistically becompared with imagery acquired from aircraft or satellite sensor systems.
Crop Water Stress: Functional relationships between the TIR and plant water status have beenused to define a crop water stress index (CWSI) based on canopy temperature andmeteorological conditions (Idso et al., 1981; Jackson et al. 1981). One limitation of thistechnique is that actual plant temperature is needed, and thermal influence of the background soilcan result in an erroneous estimate of water stress. Moran et al. (1994) and Clarke (1997)refined the CWSI for use under partial canopy conditions by including an estimate of percentcrop cover from a vegetation index (Fig 1). In this 2-dimensional planar domain approach, themethod of Idso et al. (1981) is used to predict crop canopy temperature under well-watered andwater-stressed, full cover conditions (points 1 and 2, respectively in Fig. 1) and predictiveequations or actual surface temperatures of a dry bare soil are used to determine point 4.Fractional vegetative cover is estimated from theNDVI using reflectance (D) of a 10 nm wide,NIR (790nm) and red (670nm) band:
. (1)nmnm
nmnmNDVI670790
670790
ρρρρ
+−
=
Based on the points labeled A, B, and C in fig. 1,the CWSI for a particular percent cover wascalculated as:
. (2)ABACCWSI
−−
=

159
0
20
40
60
80
100
0.00 0.10 0.20 0.30 0.40 0.50 0.60
NDRE
Perc
ent C
rop
Cov
er
Maximum [Chl] line for a given percent cover (non-stressed condition).
Minimum [Chl] line for a given percent cover (stressed condition).
AB
C: Measured
Figure 2. Diagrammatic representation of a 2-dimensional Canopy Chlorophyll Concentration Index (CCCI) that compensates for varying amounts of plant cover.
Where points A and B represent the surface minus air temperature difference at a particularpercent cover for a non-stressed and completely stressed crop, respectively, with a dry soilbackground. Points to the left of the line formed between points 1 and 4 represent a moist soilbackground. Since this would likely indicate a recent irrigation, no water stress is assumedunder these conditions. Point C was determined based on the measured NDVI and surface – airtemperature difference. From eqn. 2, a CWSI of 0 corresponds to a well-watered crop with a drysoil background, while 1 represents a water-stressed crop. The 2 dimensional CWSI has not yetbeen validated for quantifying plant stress during stand establishment and maturity. Establishingit as a reliable water stress index that works throughout the entire season will pave the way forits acceptance as an irrigation scheduling practice in production agriculture.
Crop Nutrient Stress: An analogous 2-dimensional index, the Canopy Chlorophyll Content Indes(CCI) that compensates for partial canopy conditions has been developed by the USWCL teamfor assessing the nutrient status of a cotton canopy (Fig. 2). The NDVI (eqn. 1) is used toestimate percent cover and a normalized difference red edge index (NDRE)
(3)nmnm
nmnmNDRE720790
720790
ρρρρ
+−
=
represents a spectral signal sensitive to chlorophyllpigments. Maximum and minimum chlorophyll-content limits of NDRE were defined as linearfunctions of NDVI and shown as solid and dashedlines on Fig 2. The CCCI was then derived using thesame form as the CWSI (eqn. 2). Note that unlike theCWSI, a CCCI of 0 will typically represent acondition of crop stress (low chlorophyll content) and1 will correspond to high chlorophyll, low stressconditions. Further testing is expected to confirm thatthe CCCI will be positively correlated withchlorophyll content and independent of green plantbiomass during a significant portion of the growingseason. Data sets will also be examined to determineif the CCCI is sensitive to the amounts of N presentin storage organs of plants.
Search for Related CRIS Projects
A search of the CRIS database for “remote sensing” revealed 105 active projects within ARS andanother 292 outside of ARS. Narrowing the search further to include only those projectsresearching areas of plant stress (i.e.,. drought, water stress, nitrogen, nutrient management, pest,insect, arthropod, weed, or disease) revealed 63 ARS and 125 non-ARS projects. A substantialamount of ARS RS research on plant response is being conducted at laboratories identified under

160
the Water Resource Remote Sensing Applications Initiative mentioned above. Our research isunique in that we recognize the confounding effects of plant biomass and phenology on remotesensing techniques and to a large extent, strive for approaches that will be useful throughout theentire growing season.
Objective 2 – Irrigation Scheduling
A fundamental requirement for accurate irrigation scheduling is the determination of the actualcrop evapotranspiration (ETc) for each day during the growing period. Past and present researchof ETc is abundant and has provided a wealth of sound theoretical knowledge, as well as majoradvancements in methods for estimating daily crop evapotranspiration (Doorenbos and Pruitt,1977; Jensen et al., 1990; Allen et al., 1998). Although a number of techniques are available forestimating daily ETc for irrigation scheduling, the crop coefficient (Kc) approach has emerged asthe most widely used method (Jensen and Allen, 2000). The Kc is an empirical ratio of ETc to areference crop evapotranspiration (either grass or alfalfa). Standardized equation forms forcomputing reference ET with meteorological data have been developed, which are now highlyrecommended (Allen et al., 1994, Allen et al., 1998; Walter et al., 2000). A Kc curve,constructed for a crop growing period, attempts to relate the daily water use patterns of a specificcrop to that of the reference crop. The Kc curve can be susceptible to inaccurate predictions oftotal daily ETc, particularly for days following wetting events when the soil is not completelyshaded by the crop canopy. This is because the Kc curve attempts to account for the time-averaged contributions of both crop basal ETc (primarily transpiration) and soil evaporationfollowing wetting events. The effects of soil evaporation on total ETc can be calculated moreaccurately by using a dual crop coefficient procedure (Wright, 1982). In the dual procedure, Kc ispartitioned into a separate coefficient to predict evaporation from wet soil (Ke) and a separate Kcbto predict the basal component of ETc under a dry surface soil condition. Information on cropcoefficients for important agricultural crops is abundant in the literature. The recently publishedFood and Agriculture, Paper No. 56, (FAO-56) on Crop Evapotranspiration (Allen et al., 1998)presents comprehensive procedures for constructing either the single Kc or dual (Kcb) daily cropcoefficient curves, for use with the recommended standardized grass referenceevapotranspiration (ETo), for a large number of common agricultural crops. Two recent studieshave shown that the FAO-56 dual crop coefficient procedures can adequately predict crop ETc ofcotton and grain sorghum grown in small research plots (Hunsaker, 1999; Tolk and Howell,2000).
However, the crop coefficient curves presented in FAO-56, and generally those included withmost state-of-art irrigation scheduling programs, are time-based and therefore lack the flexibilityrequired to capture abnormal crop development and water use patterns caused by weatheranomalies, insect damage, disease, or other influences (Bausch and Neale, 1989). Furthermore,using crop coefficient curves from the literature will usually require some form of localityadjustment, unless specifically developed for the particular location. Determination of actual ETcunder conditions when limitations (e.g., water, nutrient, crop density, and pest) on crop growthare encountered is particularly difficult using conventional crop coefficient procedures. Within agiven irrigated cropping system, occurrences of spatially and temporally variable crop water

161
fluxes are often created by a variety of factors, for example, non-uniformities of waterapplication, soil water holding characteristics, nutrient availability, stand density, and microclimatic conditions. Because a crop coefficient curve is designed to estimate the ETc underoptimum agronomic conditions, the effects of spatial and temporal variations of water use withina field or area cannot be adequately accounted for in irrigation scheduling decisions.
Remote sensing techniques offer a means to overcome many of the shortcomings ofconventional crop ET estimation by providing real-time feedback of daily crop water use asinfluenced by actual crop developmental patterns, local atmospheric conditions, and field spatialvariability. Such information when obtained on a timely basis could enable growers to moreadequately assess whether changes in irrigation management strategies are warranted; e.g.,changing irrigation frequency to avoid critical soil water deficits or improving irrigation systemuniformities to provide sufficient water at lower ends of fields. A technique for determiningtotal daily ETc directly using one time-of-day RS measurements was introduced by the USWCLin 1983 (Jackson et al., 1983). Later, Inoue et al. (1994) developed a new concept for applyingthe technique for estimating actual transpiration and demonstrated that the method may givereliable transpiration estimates. The one-time-of day RS technique for estimating water useappeared promising at the time. However, development of the method for irrigation schedulingpurposes has not been practical due to the requirement of daily ground and RS measurementsand the inability to obtain reliable ET estimates on cloudy days. Recognizing that the seasonal trajectory of multispectral VIs was very similar to the time courseof wheat crop coefficients, USWCL RS scientists proposed their potential use for this purposemore than 20 years ago (Jackson et al. 1980). Implementing VI-based crop coefficients withinirrigation scheduling procedures could potentially be more successful and far-reaching than otherRS methods, because of the widespread familiarity and use of the crop coefficient methodology.In addition, VI data can be routinely measured either on the ground, in the air, or by spacecraft.Determining daily crop ET with VI-based crop coefficients would require frequent, but not daily,VI measurements, since the smooth general shape of the crop coefficient curve over a growingseason would allow data to be extrapolated over a short period of perhaps two or three days. TheVI-based crop coefficient concept of Jackson et al. (1980) later was proven a viable approach forcorn in Colorado by Bausch and Neale (1987) and Neale et al. (1989). Bausch and Neale (1989)and Bausch (1995) then incorporated VI-based crop coefficients for use in existing irrigationscheduling algorithms for corn and reported improvements due to better estimation of water useand more appropriate timing of irrigations. Only limited research has been conducted to expandthe development of VI-based crop coefficients for other crops, although simulation studiessuggest that VIs could be used to obtain crop coefficients for several other important agriculturalcrops (Choudhury et al., 1994).
Search for Related CRIS Projects
A search of the CRIS system for “remote sensing” and “evapotranspiration” or “evaporation”revealed 32 active projects coded under these topics, twenty of which are within ARS. Of the32, about 12 projects (6 within ARS) address the application of RS and ET technologies forirrigated crop water management. Only two projects pertain specifically to the development and

162
use of multispectral crop coefficients for improving on-farm irrigation scheduling, althoughseveral projects are attempting RS approaches for assessing temporal and spatial differences inevapotranspiration. Research on multispectral VI crop coefficients for orchard and vegetablecrops are being planned by the ARS facility in Parlier, California. There is also continuedresearch of VI-based crop coefficients by ARS in Fort Collins for crops grown in Colorado.Development of VI-based crop coefficients for use in the FAO-56 dual crop coefficientprocedures is unique to this project, as is the development and application of the 2-dimensionalCWSI as reliable tools for assessing crop water stress and guiding irrigation schedulingdecisions.
Objective 3 – Precision Agriculture
Three levels of complexity will be pursued in adapting remotely sensed data for use in precisionfarm management: (1) directed sampling (i.e., use of a single image to spatially interpolate cropattributes measured at locations identified by analysis of the image); (2) combination of simpleempirical models (e.g., based on growing degree-days) and remotely sensed data to estimatecrop water and nutrient status; (3) integration of remotely sensed data with process-orientedgrowth models. Note that in this section the background information for levels 2 and 3 arecombined under the sections on growth models and approaches to integrate remotely sensed datawith these models.
Directed Sampling
Rather than relying on a specific spectral response to a particular soil property, the concept of"directed soil sampling" has been developed (Pocknee et al., 1996). The idea is to first acquireimagery of a bare soil field and then take soil samples from areas in the image with distinctspectral features. Correlations or classification schemes are then developed between the spectralclasses or reflectance levels and soil properties of interest. Pocknee et al. (1996) found thismethod worked well for mapping soil phosphorus, but performed poorly for soil pH. Directedsoil sampling can often provide soil maps of similar or better accuracy than those derived frominterpolation techniques such as kriging or distance-weighted interpolation with even fewer soilsamples (Thompson and Robert, 1995; Barnes and Baker, 2000). A similar approach can beused over fields with a crop present by collecting soil samples and plant material for analysisover areas with similar spectral classes (Yang and Anderson, 1996; Barnes and Baker, 2000).Statistical methods have been developed to assist in the process of selecting sample sites basedon the observed spatial variability in soil electrical conductivity within a field to allow the mostaccurate interpolation (Lesch et al., 1995); however, these methods have not been tested withmultispectral data. While directed sampling has been found useful in mapping variations in soiland crop properties, Barnes and Baker (2000) found that a number of interfering factors cancompromise such an approach.
Crop Growth Models
Crop growth models have been developed with various levels of sophistication (Penning deVries et al., 1989). First level models only respond to variations in temperature and radiation.

163
Level 2 models include some type of soil water balance to integrate moisture stress into thegrowth predictions. Level 3 models add simulation of the effects of nitrogen availability, whilelevel 4 models address additional stresses such as weed pressure and insect infestations. Allgrowth models require some level of calibration before they can be applied with confidence(Kenig et al., 1993) because a purely deterministic model has yet to be developed. Mostprocess-oriented growth models predict the level of photosynthesis based on weather conditions,photosynthetically active biomass and the availability of resources such as water and nitrogen.Photosynthesis is then partitioned between maintenance and growth respiration based on thecrop’s predicted development stage (see reviews by Jones and Ritchie,1990; and Hoogenboom etal., 1992). The output from several models have been incorporated with economic and decisionsupport tools in order to enhance their use in farm management decisions. For example, aDecision Support System for Agrotechnology Transfer (DSSAT) has been developed toautomatically search for agricultural management optimization strategies based on variousobjective functions (Tsuji et al., 1994). DSSAT incorporates models of cereal, legume and rootcrops into a common system and uses an internationally standardized format for data input andpredictive output (IBSNAT, 1986). Linkage with GIS has allowed crop models to be applied toregional studies (Lal et al., 1993).
With the increased use of geospatial tools in farm management, efforts began to adapt cropmodels to predict within field production variability. The earliest efforts, as reviewed by Sadlerand Russell (1997), focused on running the models at grid points or management zones within afield. The results for this approach has had mixed success in adequately describing spatialvariability in crop development and the input data requirements were dramatically increased.Another approach has been to form a hypothesis as to the parameters in the model most closelyassociated with the major source of yield variability. The model is then run and used to identifyparameters until the error between simulated and observed yields are minimized (Paz et al.,1998). If the major source of yield variability is temporally constant, this procedure thenprovides a set of spatially associated input parameters for use in future growing seasons.
Integration of Remotely-Sensed Data and Growth Models
Limitations to the use of yield maps for model calibration are that they do not provide a means toassess a model's performance or supply inputs during the growing season and all sources ofvariability are integrated in the yield response. For example, from a yield map alone it is notpossible to determine if a relative decrease in production is related to insect damage, soilproperties or weeds. Remotely-sensed data have the advantage of determining spatial variabilityin crop canopy density during the season. While it may not always be possible to determine thesource of variability solely from imagery, field scouting can reveal the source near the time itoccurs.
The potential for the integration of remotely sensed data with growth models was suggested over20 years ago (Wiegand et al., 1979). Maas (1988) identified four approaches for the integrationof models and remotely sensed data that can further be reduced to two basic methods: (1) input aremotely estimated state variable (e.g., LAI) directly into the model at each time step or forcingagreement at selected times during the season, and (2) adjustment of the model’s initial

164
conditions and/or parameters until the model’s predictions are in agreement with remotelysensed estimates. Moulin et al. (1998) provided a review of several of the integrationapproaches that have been recently developed. Such approaches have been adapted for simple,empirical models (Potdar, 1993; Raun et al., 2001) to the integration with more process-orientedmodels. Raun et al. (2001) developed a yield forecast model based on early season NDVI andgrowing degree-days for real-time application of nitrogen. Moran et al. (1995) used remotelysensed estimates of ET and LAI in the real-time calibration of a simple alfalfa and water balancemodel. This is a unique approach, in that the alfalfa model’s predictions are compared to theremotely-sensed estimates and then the model is iteratively adjusted until both estimates are inagreement. Lo Seen et al. (1995) investigated methods to integrate remotely sensedmeasurements into a grassland production model. The grass production model is a simple level2 model, modeling growth and the water budget. The analysis of several vegetative indicesderived from AVHRR data found that the NDVI and Soil Adjusted Vegetation Index (SAVI)were capable of tracking vegetation development. Barnes et al. (1997) demonstrated thefeasibility of inputting remotely sensed estimates of LAI at select times during the season toallow the CERES-Wheat model to predicted nitrogen limited conditions when data was notprovided to the model to indicate N deficiency. Similarly, Barnes et al. (2000) also found thatthe CWSI has potential to adjust the soil-water content predictions of CERES-Wheat to accountfor water limited conditions. Jones and Barnes (2000) adjusted the soil water holding capacityparameters in the cotton model CALGOS until the model was able to correctly predict LAIduring the season for two soil types.
Search of Related CRIS Projects
There is a large number of CRIS projects coded for “remote sensing” and crop modeling – 23ARS and 18 non-ARS. Of these 41 projects, 26 were not related directly to crop management(i.e., they were focused on prediction of large area yields, water quality parameters, or climatechange). The remaining 15 that did have a similar scope to this objective were primarily projectsin the Midwest and Eastern United States in non-irrigated conditions and for usually directedtowards different crops (primarily corn and soybeans).
National Collaboration
All objectives for this project relate directly to the Water Resource Remote Sensing ApplicationsInitiative in NP201 which will develop cost-effective methods to assess soil, water, and plantconditions and technologies for improved management at field, farm, and watershed scales. TheInitiative’s research is geared towards providing timely RS solutions to water quantity andquality problems impacting production agriculture, ecology and the environment. We envisionall aspects of our research as being complementary to ARS research at Beltsville MD, BushlandTX, El Reno OK, Florence SC, Fort Collins CO, Parlier CA, Kimberly ID, Lubbock TX, ShafterCA, Tucson AZ, and Weslaco TX. Although collaboration with these research groups is notessential in order to complete the research described herein, collaborative interactions will serveto accelerate development, broaden regional applicability, and improve robustness of methodsthat are useful for major US cropping systems. Under the coordination of National ProgramLeadership, ARS scientists doing remote sensing research are expected to convene biennially to

165
discuss methods, problems, and research findings of mutual interest.
APPROACH AND RESEARCH PROCEDURES
The overall goal of this project is to develop and test remote sensing approaches that will proveuseful in short- and long-term management of agriculture resources. As stated above, theproposed research is organized into three objectives, crop response, irrigation scheduling, andprecision agriculture, each of which are described below:
Objective 1 - Crop Response
Develop and critically assess methods for using reflected solar and emitted thermal energy toquantify temporal and spatial variations in crop response to water, nutrients, and pests.
Hypotheses for Objective 1:
1. Environmental stresses that limit productivity of agricultural crops can be detected andquantified by means of observable changes in their spectral properties.
2. Identification of water and nutrient related stresses during periods when plants do notcompletely cover the soil surface can be improved by combining traditional vegetationindices such as the NDVI with spectral information that does not vary as much with canopybiomass.
Experimental Design
During the initial phase of this project, we plan to develop and refine remote approaches formonitoring crop response using full-season data of numerous RS, soil, and agronomicmeasurements acquired during previous USWCL experiments in alfalfa, cotton, wheat, andvegetables (e.g., Barnes et al 1996, 2000; Moran et al., 1989,1995; Hunsaker et. al., 1994, 2000;Kimball et. al., 1994, 1999; Pinter et al. 1994, 2000). We will develop a detailed knowledge base ofplant spectral reflectance and emittance characteristics for crops growing under optimum water andnutrient conditions. The RS data will be transformed into wide- and narrowband reflectancefactors, multispectral vegetation indices, physiological reflectance indices, and other spectralfeatures which, based on RS team experience and reports in the literature, appear most sensitiveto plant growth and stress parameters. Correlations between these spectral indicators willidentify those which contain redundant information and those which contain unique information.Regression techniques will be used to identify functional relationships between RS signals andproperties related to normal and stressed vegetation properties. Emphasis will be placed on furthertesting and validation of 2-dimensional CWSI and CCCI indices for estimating water and nutrientstress in cotton and wheat throughout the entire growing season, including the stand establishmentphase when early detection of stress can have a large influence on a grower’s ability to achievemaximum economic yield. Hyperspectral approaches for identifying stress will be explored usingneural net, fuzzy analysis, partial least squares regression, and linear mixture modeling techniques.

166
New experimental data will be obtained from a series of intensive, season-long, interdisciplinaryfield plot experiments in cotton and wheat. Data from these experiments will serve as amechanism for evaluation, refinement, and validation of RS irrigation scheduling and cropmodeling techniques. Recognizing the limited human resources for this project, theseexperiments will be coordinated and conducted by the entire RS team in a concerted effort tomeet many of the various goals sought under each of the three primary project objectives. Wealso plan to be opportunistic in our research. For example, if a proposed Free Air CO2Enrichment (FACE) experiment in alfalfa is funded by NASA, we intend to make regular RSobservations on alfalfa exposed to different CO2 and water stress treatments, while cooperatorsobtain agronomic, physiological, and other measurements.
Small Plot Procedures: Upland cotton (Gossypium hirsutum L.) and spring wheat (Triticumaestivum L.) will each be grown for two seasons in small (1.5 ha), level basin fields at TheUniversity of Arizona Maricopa Agricultural Center (MAC) during 2002 and 2003 (cotton) and2003-04 and 2004-05 (wheat). Each experiment will include a two by three factorial consistingof two nitrogen levels (high and low) and three plant population densities (standard practice,high, and low). The experiments will also include two additional treatments both managed athigh nitrogen and standard plant density. The latter two treatments, as well as irrigationscheduling procedures for all treatments, will be described later in the Approach and Proceduressection under Objective 2. All treatments will be replicated four times in plots approximately 15by 30 m. For the cotton studies, seed from a full season, commercial cultivar will be sown onraised, east-west oriented beds spaced 1.02m apart during the normal April planting window.For wheat, seed from a locally adapted cultivar will be sown on the flat during the normalDecember planting window. The three plant populations will be achieved using precisionplanting equipment and seeding rates corresponding to 2x, 1x, and 0.5x the recommended ratesfor each crop. The high N treatment will be managed according to recommended MAC farmnitrogen practices for the crop to achieve full yield potential while the low N treatment willreceive an amount calculated to reduce yield by about one-third.
Meteorological Data: Hourly and daily weather data are available from the automated ArizonaMeteorological Network (AZMET). The AZMET weather station at MAC is located over awell-irrigated grass plot, less than 1 km away from the small plot basins. Data from this stationwill be used to calculate the FAO-56 reference ETo needed for irrigation scheduling as describedin Objective 2, Goal 2. Portable weather stations will provide backup weather data in the field.Micrometeorological sensors (e.g., thermocouples, psychrometers, pyranometers, netradiometers, IRTs, etc.) will be deployed in specific plots as needed to achieve specificobjectives and for comparison with AZMET station data. Soil Measurements: The concentrations of nitrate and ammonium throughout the rooting zonewill be determined in 300 mm increments before and after the cropping cycle and as neededduring the growing season. All plots will receive sufficient N and P to meet recommendedpreplant requirements. Neutron scattering access tubes and time domain reflectometry (TDR)probes will be installed in each plot to measure soil water status during the season. Irrigation toplots will be provided through a metered, gated-pipe irrigation system (see Approach Objective

167
2). A salinity map of the field will be made using a tractor-mounted EM-38 system. Data fromthis map will be used to guide soil sampling. Soil will be analyzed for salinity, moisture andtexture as well as other soil properties that may have contributed to variability of EM-38 data.
Plant Measurements: Relevant agronomic parameters (e.g., stand density, phenologicaldevelopment, biomass, leaf area index, and final yield) will be evaluated from destructivesampling at appropriate intervals throughout the season. The nitrate content of the petioles ofcotton and the lower 50 mm of stem tissue from wheat will be determined and compared withSPAD readings throughout the growing season. Plant water status will be assayed periodicallyusing pressure bomb, porometry, and stem flow techniques. Plant area index will be monitoredat 1-2 week intervals with a LAI-2000. Estimates of fAPAR will be determined using a linequantum sensor or inferred from VI-based relationships developed in previous experiments(Pinter et al., 1994). Remote sensing: Measurements will be made at the whole canopy level from planting untilharvest using (1) wideband radiometers (visible and NIR), (2) high resolution spectroradiometers(visible, NIR, SWIR) region (~350 to 2500nm), and (3) infrared radiometers (10-12 :m).Reflectance and transmittance measurements will be made at the single leaf level using anartificial light source, an external integrating sphere, and high resolution spectroradiometers.Temporal trends in broad-band reflectance factors, multispectral vegetation indices,hyperspectral features (e.g. spectral derivatives, red edge position), and canopy temperatures willbe critically examined at the single leaf and canopy level for information that can be used toquantify plant water, nutrient, and pest stress. Advances in sensor technology and emergence ofnew techniques (e.g. appropriately filtered, 3-CCD digital cameras) may provide additionalopportunities for obtaining spectral data.
Team Responsibilities
Research conducted under Objective 1 (Crop Response) will be under the direction of PaulPinter. Each scientist will assume responsibility for measurement and analysis of one or moreunique aspects of the experiment in which he has expertise. Integration of the various parts andcollaboration between team members will be necessary to achieve the stated goals. Paul Pinterfor example, will coordinate biological measurements and be responsible for developingrelationships between wide- and narrow-band spectral reflectances and various agronomic,biophysical, and stress-related responses of the plant canopy. Ed Barnes and Tom Clarke willfocus their attention on measuring necessary parameters and refining and validating the2-dimensional CWSI and CCCI indices described earlier. Glenn Fitzgerald brings special skillsin mixture modeling and image analysis to bear on analyzing the high resolution image andradiometric data obtain from the field experiments and correlating them with specific plantstresses. Doug Hunsaker will be responsible for measuring soil moisture levels and along withBruce Kimball will evaluate evapotranspiration by various methods. Floyd Adamsen contributesexpertise in analysis of digital imagery plus broad experience in managing nutrients inagricultural systems. Gary Wall will be responsible for measuring and interpreting whole plantwater relations within the context of irrigation treatments.

168
Contingencies
As in most scientific research, both positive and negative findings will be useful in delineatingrealistic opportunities and limitations for using RS in crop management. We recognize that anumber of exogenous factors affect remotely acquired reflectance and emittance data althoughthey are not related to soil or crop properties of interest. (e.g., illumination and sensor viewingdirection, clouds, droplets of precipitation on vegetation, etc.). Bidirectional models of canopyreflectance will be examined to determine their utility for normalizing data to standardconditions. Thermal indices for evaluating soil water content are likely not to provide usefulinformation when evaporative demand is low, and the CCCI might not be sensitive to plant-stored N. Thus special attention will be paid to defining conditions under which the indices donot perform as expected and guidelines will be developed to minimize their impact. If simplereflectance-based indices of crop vigor do not provide sufficient detection resolution for aparticular plant stress or distinguish between different stresses, multivariate analysisincorporating hyperspectral reflectance or wideband thermal data will be used to improveperformance.
Collaborations
Necessary (within ARS) - Susan Moran at Tucson AZ (Remote estimates of ET, instrumentation,and calibration). Scientists at a number of ARS locations are actively pursuing spectralreflectance techniques for detecting nutrient stress (Beltsville MD, Fort Collins CO, LincolnNB), water stress (Bushland TX, Florence SC, Lubbock TX) and salinity stress (Riverside CA).Project scientists anticipate discussing research approaches, comparing techniques, andcontinued interaction with these related projects. As mentioned above under NationalCollaboration, ARS also recently brought together these and other ARS scientists who areinvolved in various aspects of remote sensing research. Bi-annual meetings, workshops, sharedresources, and joint publications with this group will increase awareness of other projects andnew avenues of cooperation will evolve.
Necessary (external to ARS) - Jiaguo Qi with Michigan State University (BRDF and calibrationissues)
Objective 2 – Irrigation Scheduling
Develop and improve irrigation scheduling methodologies that are responsive to actual cropevapotranspiration and irrigation requirements.
Hypotheses
1. Multispectral crop coefficients will provide improved irrigation scheduling and watermanagement capabilities as compared to more traditional crop coefficients that are usuallybased on time or thermal units after planting.

169
2. Multispectral crop coefficient models used in conjunction with the 2-dimensional CWSI,can accurately quantify real-time crop water use and its spatial variability.
Experimental Design
Research under Objective 2 is expected to expand the development of remote sensingmeasurement tools and procedures for guiding irrigation scheduling so that they match actualcrop and environmental conditions more closely. We have divided this research into three goals.Goal 1 will be to develop working basal crop coefficient models based on multispectral VIs forprimary crops grown in the region - alfalfa, cotton, wheat, and grain sorghum. For Goal 2,small-plot field studies will be undertaken to examine and validate the VI-based crop coefficientmodels for scheduling proper irrigation amounts to cotton and wheat. In conjunction with theVI-based crop coefficients for irrigation scheduling, we will refine and validate use of the 2-dimensional CWSI for determining appropriate irrigation timing for cotton and wheat. Thesmall-plot experiments will also be designed to include the necessary data for field validation ofthe one time-of-day direct RS technique for determining actual crop evapotranspiration. Goal 3will be to evaluate the use of multispectral crop coefficients and thermal indices to providedetailed information about spatial variations of crop water use within large surface-irrigatedfields. Such information would ultimately allow growers a means to more adequately appraisethe water needs and irrigation requirements within their fields.
Goal 1. During the first year of the project (2001 to 2002), we will analyze and develop initialmultispectral basal crop coefficient models and related algorithms using data from pastexperiments conducted by the USWCL, in which both ET and reflectance measurements weremade for crops grown under well-watered and well-fertilized conditions (e.g., data fromHunsaker et al., 1994; Kimball et al. 1994; and Pinter et al., 1992, 1994, for cotton: and fromHunsaker et al., 1996, 2000; Kimball et al. 1999; and Pinter et al., 2000, for wheat). The Kcbvalues for these initial models will be derived following procedures similar to those developedby Hunsaker (1999).
Goal 2. Field demonstration and validation of the VI-based Kcb models for irrigation schedulingwill take place during the two-year, small-plot experiments planned for cotton (2002 and 2003)and for wheat (2003-2004 and 2004-2005). General experimental design procedures, treatments,and description of field measurements for these studies are described above in Objective 1. Allexperiments will include six treatments used to test VI-based Kcb under three plant densities(high, standard, and low) and two soil nitrogen levels (high and low). These experiments willalso include a control treatment, grown under a standard plant density and a high nitrogenapplication, in which irrigation scheduling will be determined using the dual crop coefficientprocedures recommended by FAO-56 including the daily basal crop coefficient curve for thecrop recommended in FAO-56. A final treatment (water-stressed), also grown under a standardplant density and a high nitrogen application, will be included in each experiment to provide dataneeded for assessing the suitability of the 2-dimensional CWSI as a reliable indicator of theeffects of water stress on actual ETc reductions, and as a practical irrigation timing tool.Irrigation scheduling for the water-stressed treatment will follow the same procedures as that forthe control treatment, with the exception that three irrigations during the season will be delayed

170
to impose greater soil water depletion and water stress on the crop. Irrigation for the six VI-based Kcb treatments will be scheduled using the dual crop coefficient procedures of FAO-56.However, for these six treatments, the multispectral Kcb model will be used to determine thedaily Kcb of each treatment using reflectance field measurements. For determining the irrigationamounts for all treatments, the soil evaporation component of total crop ET will be estimatedusing the explicit procedures of FAO-56, including their recommended soil evaporation dryingparameters for the specific soil type used in the field studies. Plots within several treatments willbe monitored to effectively evaluate the direct measurement of ETc using the one time-of-day RStechnique.
Irrigation scheduling based on remote vegetation indices may be less successful early in theseason when plants are small, during cloudy weather, or when the water holding capacity in therooting zone is limited. Thus, during the first-year experiment for each crop, we may find itnecessary to periodically update the Kcb for some treatments if the initial VI-based Kcb model isdetermined to be performing poorly. Such adjustments would be made on the basis of actual ETcdetermined by frequent soil water content measurements. The second-year experiment for eachcrop will serve to confirm whether or not the original Kcb model, or perhaps a refined Kcb model -i.e., a model based on data from the past experiments combined with additional findings fromthe first-year experiment of this study, accurately predicts ETc under all conditions imposed ontreatments. Performance evaluation of the Kcb models will be primarily based on comparison ofthe model-predicted ETc against actual ETc determined by detailed soil water contentmeasurements, but will also include evaluations based on actual crop performance as determinedfrom measurements of crop growth during the growing period and final yields. In allexperiments, performance of the multispectral Kcb model for the treatment under standard plantdensity and high nitrogen will be compared to that of the control treatment to assess whether themultispectral crop coefficient model provides significant improvement over the FAO-56 Kcbcurve for irrigation scheduling.
Although not necessary to complete the research outlined here, mutual exchange of multispectralKcb development techniques and/or data is expected to occur with the ARS investigators in FortCollins (D. Heermann, W. Bausch), Kimberly (J. Wright), and Parlier (T. Trout), who havecompleted or are planning to conduct similar research. If the FACE alfalfa field experiment isfunded by NASA during this project’s time-span, we plan to utilize the experiment as a means tofield-test the alfalfa Kcb model that will be developed in Goal 1 of this objective.
Goal 3. Evaluation of VI-based crop coefficients and thermal indices as tools to detect andquantify field-scale spatial variability of crop water use will be undertaken in 2002 duringstudies planned on a large, production-size cotton field, described below in more detail inobjective 3. After the first aerial image (figure 3) of the field is made at about 35-50% cropcover, the directed sampling approach described in objective 3 will be used to identify threedistinct areas within the field at which ETc rates are potentially different (e.g., high, medium, andlow rates). Neutron access tubes and TDR probes will then be installed within each of the threeidentified areas to measure soil water content. During the course of the season, additional aerialimages of the field will be obtained at the end of each irrigation cycle, just before the nextirrigation is applied. Thus, measurements of VI and thermal indices will be provided during the
171
course of the growing season at the three identified areas. Predicted cumulative ETc over eachirrigation cycle during the remainder of the season will be calculated using measured VI data todevelop a time-averaged Kcb curve over each irrigation cycle for each area. The Kcb modeldeveloped in the small-plot studies for cotton will be used to determine the Kcb values. Thermalindices obtained from the images will also be used to detect differences in crop water status.Measurements of soil water made during irrigation cycles will provide data to quantifydifferences in actual crop water use among the areas, as well as information on the actual soilwater status within the areas.
Team Responsibilities
Research under Objective 2 will be largely under the direction of Doug Hunsaker. He will beresponsible for detailed elements of experimental design; measuring, and analyzing soil watercontents; estimating ET; and scheduling specific irrigation events. Doug Hunsaker and PaulPinter will be responsible for developing multispectral Kcb values for cotton, wheat, and alfalfafrom historic USWCL data sets. Floyd Adamsen will measure and analyze soil and plantnitrogen concentrations. Tom Clarke will handle micrometeorological measurements. EdBarnes and Glenn Fitzgerald will provide support in image collection and analysis. BruceKimball and Gary Wall will provide expertise in determining ET and measuring plant waterrelations, respectively.
Contingencies
The initial multispectral Kcb models developed in goal 1 will be tested during the cotton andwheat small-plot irrigation scheduling experiments. As mentioned under goal 2, these initial Kcbmodels may not perform well under certain conditions during the season and it may be necessaryto occasionally adjust the Kcb for some treatments during the season. Furthermore, the initialspectral Kcb models for cotton and wheat will be developed from past studies in which the cropswere grown under sub-surface drip irrigation. Thus, there may be transferability problemsassociated the models when applied to surface irrigated systems. In the event that the initial Kcbmodels for either or both crops are deemed to be completely inappropriate, we would plan toconduct the second-year experiment with a redeveloped model. In this event, the model would behighly dependent upon the data obtained from the first-year experiment. For the field plotexperiments, there is a slight possibility that abundant rainfall may preclude the development ofa highly water-stressed treatment.
Collaborations
ARS locations presently engaged in research activities related to irrigation scheduling and thedevelopment of crop coefficients include Bushland TX, Fort Collins CO, Kimberly ID, ParlierCA. While formal collaboration is not essential for conducting research under this objective, weinteract with the scientists at these locations via the ARS Remote Sensing Workshops. We alsowork closely with national scientists involved in this area through representation (D. Hunsaker)on the ASCE Committee on Evapotranspiration in Irrigation and Hydrology.

172
Objective 3 – Precision Management
Develop methods for using remotely sensed observations in precision management of water,nutrients, and pests in irrigated crops.
Hypotheses
1. The statistical sampling approach developed by Lesch et al. (1995) for EM-38 salinity mapscan be adapted for multispectral and TIR imagery to generate maps of crop density andconditions related to water, nutrient, and pest stresses.
2. The spatial extent and location of management zones identified from RS imagery will not beconsistent during the growing season.
3. Techniques developed under Objectives 1 and 2 (i.e., VI-based crop coefficients,improvements in the 2-dimensional CWSI, and estimation of nitrogen status from the CCCI)can be used to quantify natural variability in crop condition in a production field.
4. The combination of a growing degree day parameter with the CCCI will allow accuratedetermination of crop nitrogen status throughout the growing season with a single set ofcalibration coefficients.
5. Integration of the CCCI, multispectral Kcb, and 2-dimensional CWSI will provide acomprehensive water and nitrogen management method for crop management purposes.
6. RS estimates of crop water condition, nitrogen status, and fAPAR can improve the ability ofprocess-oriented crop models to predict spatial variability across a field or farm.
Experimental Design
Directed Sampling
At the same time as the cotton field plot studies in 2002 (Objective 2, Goal 2), a separateexperiment will be conducted in a commercial sized cotton field to develop methods for usingremote imagery to optimize field sampling. Aerial imagery will be acquired at planting and thenat approximately two-week intervals once the crop has reached ~35 to 50% cover. We intend touse an imaging system having visible, NIR, and thermal capabilities that was designed andassembled by RS Team scientists and deployed successfully over MAC fields during early June2001 when cotton plant cover was <10%. Examples of imagery obtained with this system areshown in figure 3.
Consistent spatial and temporal performance of RS approaches to directed sampling or precisionagriculture requires careful calibration of imagery. Our protocol therefore, includes coincidentground-based radiometric observations of 8 by 8 m canvas calibration tarps (fig. 3b and Moran

173
Figure 3. Images acquired at MAC with the USWCLsensor system at ~1045h on 6 June 2001 showing: a)cotton field with fixed- and statistically-selected (ESAP)sampling locations, b) color image from a Nikon digitalcamera, c) radiometric surface temperatures (grayscale)from an Inframetrics Model 760 thermal scanner, and d)color-enhanced NDVI from a Dycam Agricultural DigitalCamera. All images were georeferenced with ERDASImagine using ground control points (fig. 3b). Thermaland NDVI data were calibrated using coincident radianttemperature and reflectance factors, respectively,measured with ground-based radiometers overcalibration tarps and field targets.
et al. 2001) and other specific areas with thefield. These observations are used to convertred and NIR images to reflectances fromwhich a meaningful vegetation index such asthe NDVI (fig. 3d) can be calculated.Thermal scanner performance is verified in asimilar fashion using calibrated handheldinfrared thermometers. The day followingimage acquisition, sample locations withinthe fields (i.e. ESAP points in fig. 3a) will beidentified from the imagery using statisticalprocedures developed by Lesch et al. (1995).These procedures were originally developedfor use with ground-based soil conductivitysensor data, but we have adapted them foruse with a vegetation index derived from thered and NIR data. In this sampling approach,a minimum set of calibration samples areselected based on the observed magnitudesand spatial locations of the data, with theexplicit goal of optimizing the estimation ofa regression model (i.e., minimizing themean square prediction errors produced bythe calibration function). The regressionmodel is then used to extrapolate predictionsat all remaining (i.e., non-sampled) areas.Once the sampling points have beenidentified, plant and soil samples will becollected at each location using differentiallycorrected GPS receivers. Gravimetricmoisture content and particle sizedistribution will be determined from the soilsamples and petiole nitrate levels, LAI,biomass, growth stage, insect damage, etc.will be identified from the plant samples. Additional locations will be randomly sampled forlater comparison with the methods used to classify the imagery. Two Bowen ratio stations willbe installed in the large cotton field to measure ETc continuously during the experiment. Thesedata will be used to (1) determine what crop characteristics can be accurately interpolated usingNIR, red and thermal data, (2) examine the temporal dynamics of spatial variability during agrowing season, and test other approaches developed for the field plot studies identified inobjectives 1 and 2 in a production-sized agricultural field.

174
Empirical Model Development
Secondly, procedures to integrate a simple growing degree-day parameter with the CCCI will beinvestigated to determine if this approach can yield acceptable predictions of nitrogen levelsthroughout the growing season with one set of calibration parameters. Data from previouscotton (Barnes et al., 2001) and wheat experiments (Kimball et al., 1999) will be used toformulate the calibration relationship, and then data from the small plots studies proposed underobjective one will be used for validation and refinement. The next step will be to integrate thismodel with the water use estimates described in objective 2 to formulate a simple nitrogen andwater management model driven by RS data. Additionally, for the data sets collected underobjective 3, linear mixing models will be used to determine whether for additional components(e.g., shaded and sunlit soil) improves the 2-dimensional CWSI and CCCI approach.
Integration with Process-Oriented Models
Three cotton models will be investigated for integration with remotely sensed data: CALGOS(Marani et al., 1995); GOSSYM (Baker et al. 1983); and CPM (Cotton Production Model, V.R.Reddy, ARS, Beltsville MD). CALGOS was developed specifically for arid conditions;however, only limited calibration of the model for different varieties has been accomplished.GOSSYM has undergone much development in humid regions. CPM offers more mechanistichandling of energy and water relations, but it is still early in the development stages, and as withCALGOS only has parameters for a limited number of cotton varieties. The primary model foruse with wheat will be the generic CERES distributed with DSSAT 3.5 (Tsuji et al., 1994). Thismodel is chosen as it is a member of the DSSAT family and has undergone extensive validationaround the world. It also contains the ability to simulate both water and nitrogen use.
For both crops, similar approaches will be used to integrate multi-spectral data obtained duringthe course of the growing season to provide “mid-course” corrections to the predictions of thegrowth models. Previous studies by the investigators have found RS estimates of leaf area index(LAI) to be useful in model adjustments (wheat, Barnes et al., 1997; cotton, Jones and Barnes,2000). In addition to LAI, remotely sensed estimates of fAPAR will be used in the adjustmentprocedures, as this estimate has been found to be more robust than LAI for different solar zenithangles and crop conditions (Pinter et al., 1994). Further study will also be given to the use of theCWSI to evaluate the model’s estimate of crop water status (Barnes et al., 2000).
The first procedures to be developed will be based on the assumption that the resources limitinggrowth below potential after accounting for climatic conditions are known (e.g., water andnitrogen). Once identified, the model’s initial conditions and parameters related to the limitingresources will be adjusted iteratively in order to provide a match between the model’s predictionand remotely sensed estimate. Rather than assuming the model is “wrong” and the remotelysensed estimate “right,” uncertainties will be assigned to both estimates. In the case of remotelysensed data derived from empirical relationships, the prediction interval could be used. Ideally,the model’s prediction interval can be established if previous year’s data is available with fieldobservations; however, in an actual application to farm management, such data may not alwaysbe available. Therefore, other numeric techniques such as fuzzy number theory will be

175
evaluated to describe uncertainties and define approaches to weight these uncertainties so thatthe best estimate of actual conditions is determined using information from both the model andRS estimates.
The application of these procedures to cotton will begin by evaluating the three models tosimulate existing cotton data sets collected at MAC. A total of seven seasons of growth data arecurrently available for this site (Pinter et al., 1994 - 3 seasons; Barnes et al., 2001 - 2 seasons andtwo years of unpublished data). Data collected during the experiments discussed in objective 2will be critical for validation of the procedures. For wheat, four seasons of data are available(Kimball et al., 1999) for evaluation of the integration procedures as will be the data collectedunder objective one in the wheat experiments.
Team Responsibilities
The field and modeling research conducted under Precision Agriculture - Objective 3 will becarried out under the direction of Ed Barnes who will be responsible for day to day operation andcoordination of the project, scheduling the field cultural activities, image analysis, GPSgeoreferencing observations, and model integration. Glenn Fitzgerald and Tom Clarke will beresponsible for preparing the sensor package used in the aircraft, collecting, and downloadingand analyzing image data. Glenn Fitzgerald will provide expertise in spectral modelingapproaches used to scale single leaf and canopy component spectral properties up forcomparison with larger scale aircraft and satellite imagery. Tom Clarke and Paul Pinter willcoordinate the vicarious ground calibrations at time of overpass. Paul Pinter will provide andinterpret RS data sets from previous USWCL experiments that will be used in model integration,and coordinate biological observations during the experiments. During the directed samplingexperiment, Doug Hunsaker will quantify soil texture and soil moisture parameters while FloydAdamsen will be responsible for measuring and analyzing soil and plant nutrient concentrations.
Contingencies
In the event that the statistical sampling procedures developed by Lesch et al. (1995) for use withEM-38 derived salinity maps do not provide satisfactory results when adapted for use with avegetation index, unsupervised classification techniques will be used with a maximum likelihooddecision rule to define spectral classes in the field. Samples will then be taken from areasrepresenting each spectral class similar to the procedures used by Yang and Anderson (1996). Incertain situations, such as early season nutrient stress detection mentioned in Objective 1,remotely sensed data may not be able to improve a model's performance. When reliabletechniques cannot be developed using RS data for within season adjustment of crop models,efforts will focus on characterizing the input information needed by the models (e.g., spatialextent of soil types, zones having similar crop response from previous seasons’ imagery, etc.).In the event other scientists at the USWCL decide to continue development of the COTCO2model (Wall et al., 1994), this model will be added to the suite of cotton models evaluated forpotential integration with RS data. In the event NASA funds an alfalfa study, further refinementof the PROBE model (Moran et al., 1995) will take place.

176
Project scientists are mindful of scaling issues encountered when quantitative techniques basedon ground measurements are implemented at the field and farm level using aircraft or satellitedata. Recent addition of a new team member (G. Fitzgerald) and his specialized skills in spectralmixing models are expected to provide additional insight into how spectral properties of soilsand individual plant components (leaves, stem, fruiting structures, etc.) measured with anintegrating sphere or handheld spectroradiometer can be scaled up to full canopy or field levelsand realistically compared with imagery acquired from aircraft or satellite sensor systems.Spectral unmixing techniques can be used to address the disaggregation approach. We have alsospecified the technical requirements and recently contracted for the purchase of a hyperspectralimaging system utilizing liquid crystal tunable filters which is expected to provide an additionalinvestigative approach for this research.
Remotely acquired data are also inherently discontinuous in time. Simple averages of occasionalcanopy reflectance factors or midday temperatures are not likely to be the best approach for cropmanagement. It is for this reason that we believe the combination remote sensing and modelingapproach mentioned in Objective 3 will be so powerful. Mechanistic models, governed byphysical processes, driven by more or less continuous meteorological parameters, andoccasionally given a reality check, tune-up, or re-parameterization with remote observations willlikely provide an effective way to use remotely sensed data for management purposes.
Collaborations
Necessary (within ARS) - Scott Lesch (ARS, Riverside CA) will provide assistance in efforts toadapt his statistical methods to determine within field sample locations with electricalconductivity data to reflectance-based indices.
Necessary (outside ARS) - The integration of RS and crop simulation models will beinvestigated in cooperation with Dr. J. Alex Thomasson, University of Mississippi with ARS inStoneville MS. Dr. Thomasson has compiled a team of scientist engineers, an economist andextension specialist to assist in development of these approaches for cotton, including Dr. JamesMcKinnon with ARS who was one of the original developers of GOSSYM. Shared data setsbetween the two locations will allow evaluation of the techniques under diverse growingconditions. David Jones, University of Nebraska, Lincoln will provide technical expertise on theapplication of fuzzy number theory to describe uncertainties.
Project scientists recognize that official involvement with the regional committee - NCR 180“Precision Agriculture” would also be very beneficial to our program. There are a number ofparticipating states that have a large irrigated agriculture component and thus are dealing withmany of the same precision agriculture management issues. In particular, NCR 180 isaddressing the need for quality, timely, and readily available remote images for scouting fieldproblems, predicting yields, monitoring crop quality, making management decisions, andidentifying crop management zones. We presently interact with several of the active members ofthis committee, and plan to participate in their annual meetings. Another potential point forcooperation involves the Ag 20/20 Project which is a partnership between NASA, CSREES, and
177
various national commodity groups. We have used their listing of top management requirementsfor cotton and wheat to help focus our research on areas that commodity groups think are mostimportant. Our current projects do not meet the criteria for formal involvement in Ag 20/20 (e.g.commercially available imagery, large scale fields, yield monitors), but their objectives andgoals are very similar to our own and we intend to remain peripherally involved with thatproject.
Physical and Human Resources
The USWCL in Phoenix has adequate laboratory, calibration, and office spaces for conductingthis research. In addition to high speed internet and network connections, personal computersare well-equipped with up-to-date word processing, spreadsheet, graphics, and presentationsoftware. Scientists have ready access to SAS statistical analysis software and imageprocessing/analysis packages from ESRI (ARC INFO and ARC View), ERDAS, and ENVI.Specific RS equipment consists of handheld, fixed-mount, and imaging infrared thermometers;an extended-area, black body IRT calibration device; wide- and narrowband radiometers; twoportable, high resolution fiber optic spectroradiometers with dedicated field computers and anexternal integrating sphere; BaSO4 and Spectralon field calibration panels; and digital cameraswith visible (Nikon) and red and NIR (Agricultural Digital Camera, Dycam, Inc.) capabilities.The lab shares 4%, 8%, 48%, and 64% canvas calibration tarps with the ARS, SouthwestWatershed Research Center in Tucson. The RS team has two differentially corrected GPS unitsand an Agricultural Irrigation Imaging System (AgIIS, Barnes et al. 2001) on a linear moveirrigation boom. The USWCL also has the necessary neutron scattering and TDR equipment formonitoring soil water contents, EM-38 for remote estimates of soil texture and conductivity, andGiddings tractor-mounted hydraulic soil sampler with rotary head, flow meters, and flumes forirrigation measurements. There are leaf area meters, balances, refrigerated spaces, and dryingovens for agronomic measurements, SPAD chlorophyll meters, a plant canopy analyzer andlinear PAR sensor for characterizing canopy properties, and pressure bombs, leaf psychrometers,and stem flow gages for determining plant water status. We also have standardmicrometeorological instrumentation, 2 Bowen ratio towers, and data loggers for use in thisproject. A soil mechanics and analytical chemistry lab are available at the USWCL fordetermining chemical and physical properties of soil and plant samples.
The USWCL maintains an ongoing research support agreement with the Maricopa AgriculturalCenter (MAC), 30 miles south of Phoenix, which is an 1800-acre agricultural research anddemonstration facility of The University of Arizona. The MAC facility is fully equipped andstaffed for managing a variety of crops simultaneously. It has ready access to irrigation waterfrom the local Irrigation and Drainage District. Field plot experiments will be conducted on theresearch portion of the facility, whereas large-scale experiments will be conducted oncommercial-sized fields available on the demonstration portion. Pending funding approval, allof the USWCL facilities will be relocated to MAC on or about 2005.
The experiments we propose to satisfy goals in each of the three objectives will be planned andexecuted by the entire RS team consisting of 4.0 Category 1 SYs, 1.0 Category 3 SY, and 3.7technicians. Dr. Pinter will take the lead role in the Crop Response Objective, assisted by Drs.

178
Fitzgerald, Barnes, and Wall, Support Scientist Tom Clarke (0.4), and 1.5 FTE technicians. TheIrrigation Scheduling Objective will be lead by Dr. Hunsaker with assistance from Drs. Pinter,Barnes, and Fitzgerald, and Kimball, Support Scientist Tom Clarke (0.3), and 1.3 FTEtechnicians. Leadership in the Precision Agriculture Objective will rest with Dr. Barnes, withhelp from Drs. Pinter, Fitzgerald, Kimball, Adamsen, Support Scientist Tom Clarke (0.3) and 0.9FTE technicians. Technical assistance will be supplemented during the field season bytemporary employees.

179
Milestones and Expected Outcomes
Date Research Objective or Area of Study1. Crop Response 2. Irrigation Scheduling 3. Precision Agriculture
Oct. 2001 Scheduled Starting Time for Project
Jan. 2002
· Concept paper on two dimensionalindices (CCCI, WDI) written andsubmitted to journal (Clarke, Barnes,Pinter)
· Manuscript on fAPAR and spectrafrom prev. FACE Expts. written andsubmitted to journal (Pinter)
· Data from 2001 LiMIE Broccoliexperiment used to confirm CCCIapproach for detecting N stress invegetable crop (Barnes, Clarke,Pinter)
· Contingent on NASA funding toFACE Alfalfa CO2 by H2Oexperiment, crop planted (fall 2001),RS measurements underway. (Pinter,Kimball)
· Review and analyze spectral cropcoefficient and ETa/ETo data from1985-86 WCL Alfalfa Lysimeter Study. (Hunsaker, Pinter)
· Ditto for FACE Cotton with goal ofobtaining working spectral Kcbalgorithms (Hunsaker, Pinter, Kimball,Wall)
· Finalize experimental strategy for fieldtests of FAO-56 WDI and Kcbscheduling in cotton (All)
· Develop and field test backpackradiometer/micromet pkg coupled withGPS for collecting ground-basedgeoreferenced crop coef and WDIdata. (Clarke)
· Journal paper incorporating CWSIindex into CERES Wheat modelwritten. (Barnes Pinter)
· Cooperative research withMississippi underway, preliminaryresults from 2001 LiMIE CottonExperiments tabulated. (Barnes)
· Select cotton model amenable toincorporating RS data. (Barnes,Kimball)
· Explore approaches for obtainingaerial imagery in Prec Ag (Fitzgerald,Barnes, Clarke, Adamsen)
· Test spatial interpolation techniqueson existing images.
Jan. 2003
· Complete cotton experimentdesigned to validate WDI and CCCI. Tabulate, reduce, and analyze data.(All)
· Analyze hyperspectral and CCCIdata from FACE Wheat CO2 byNitrogen experiment (Pinter, Clarke)
· Plan field plot study to answerspecific questions in using spectral orthermal indices to detect water,nutrient, or pest stress
· Paper(s) summarizing cropcoefficient findings for alfalfa &cotton written and submitted tojournal (Hunsaker, Pinter)
· 1st cotton irrigation experimentcompleted (Oct 2002), data tabulatedand reduced (All)
· Refine protocol as needed for 2nd
cotton irrigation experiment
· Growth, yield, and water contentfrom cotton field experiment used tovalidate prec ag approach usingcotton model.

180
Jan. 2004
· Paper on use of CCCI or comparableindex for monitoring N stress inwheat written and submitted toJournal. (Clarke, Pinter)
· 2nd cotton irrigation experimentcompleted, Oct 2003) data tabulatedand reduced. (All)
· Finalize experimental strategy forfield tests of FAO-56 WDI and Kcbscheduling in wheat (All)
· 1st wheat irrigation schedulingexperiment begun (Nov 2003) (All)
· Growth, yield, and water contentfrom wheat field experiment used tovalidate prec ag approach usingCERES model.
· Manuscript on “directed” samplingmethods using RS data written.(Barnes et al.)
Jan 2005
· Paper validating CCCI or comparableindex for monitoring N stress incotton written and submitted toJournal. (All)
· Data analysis, publication, andpresentation of results as significantoutcomes arise. (All)
· 1st wheat experiment completed (May2004), data reduced, tabulated, andanalyzed (All)
· Refine protocol as needed for 2nd
wheat irrigation experiment· 2nd wheat irrigation experiment begun
(Nov 2004) (All)
· Paper on techniques forincorporating RS into cotton growthmodel written and submitted tojournal. (Barnes, et al.)
Jan 2006
· Data analysis, publication, andpresentation of results as significantoutcomes arise. (All)
· 2nd wheat experiment completed (May2005), data reduced, tabulated, andanalyzed (All)
· Publication and presentation ofresults (All)
· Data analysis, publication, andpresentation of results as significantoutcomes arise.
Sept. 2006 End of Proposed Project Plan

181
LITERATURE CITED
Adams, M.L., W.D. Philpot, and W.A. Norvell. 1999. Yellowness index: an application ofspectral second derivatives to estimate chlorosis of leaves in stressed vegetation. Int. J. RemoteSensing. 20:3663-3675.
Adams, M.L., W.A. Norvell, W.D. Philpot, and J.H. Peverly. 2000. Towards the discriminationof manganese, zinc, copper, and iron deficiency in 'Bragg' soybean using spectral detectionmethods. Agronomy J. 92:268-274.
Adamsen, F. J., P. J. Pinter Jr., E. M. Barnes, G. W. Wall, and B. A. Kimball. 1999. Measuringwheat senescence using a digital camera. Crop Sci. 39:719-724.
Adamsen, F. J., T. A. Coffelt, J. A. Nelson, E. M. Barnes, and R. C. Rice. 2000. A method forusing images from a color digital camera to estimate flower number. Crop Sci. 40:704-709.
Allen, R.G., L.S. Pereira, D. Raes, and M. Smith. 1998. Crop evapotranspiration. Irrig. andDrain. Paper No. 56, Food and Agric. Organization of the United Nations, Rome, Italy. 300 pp.
Allen, R.G., M. Smith, L.S. Pereira, and A. Perrier. 1994. An update for the calculation ofreference evapotranspiration. ICID Bull. 43(2):35-92.
Asrar, G., R.B. Myneni, and E.T. Kanemasu. 1989. Estimation of plant-canopy attributes fromspectral reflectance measurements. Pages 252-296 In Theory and Applications of OpticalRemote Sensing (G. Asrar, Ed).
Baker, D.N., J.R. Lambert and J.M. McKinion. 1983. GOSSYM: a simulation of cotton growthand yield. S.C. Agricultural Experiment Station Technical Bulletin 1908.
Barnes, E. M., P. J. Pinter, B. A. Kimball, G. W. Wall, R. L. LaMorte, D. J. Hunsaker, F.Adamsen, S. Leavitt, T. Thompson, and J. Mathius. 1997. Modification of CERES-Wheat toaccept leaf area index as an input variable. ASAE Paper No. 973016. St. Joseph MI: ASAE.
Barnes, E.M., and M.G. Baker. 2000. Multispectral data for mapping soil texture: possibilitiesand limitations. Applied Engineering in Agriculture 16(6):731-741.
Barnes, E. M., M. S. Moran, P. J. Pinter Jr., and T. R. Clarke. 1996. Multispectral remotesensing and site-specific agriculture: Examples of current technology and future possibilities. p.845-854. In Proc. Int. Conf. on Precision Agriculture, Minneapolis, MN, 23-26 June 1996.
Barnes, E.M., P.J. Pinter, Jr., B.A. Kimball, D.J. Hunsaker, G.W. Wall, and R.L. LaMorte. 2000.Precision irrigation management using modeling and remote sensing approaches. pp. 332-337 InProceedings of the 4th Decennial National Irrigation Symposium, November 14-16, Phoenix AZ(R.G. Evans, B.L. Benham, and T. Trooien, editors). American Society of AgriculturalEngineers, 2950 Niles Rd., St. Joseph, MI 49085.

182
Barnes, E.M., T.R. Clarke, P. Colaizzi, J. Haberland, M. Kostrzewski, E. Riley, S. Moran, P.Waller, C. Choi, T. Thompson, S. Richards, R. Lascano, and H. Li. 2001. Coincident detectionof crop water stress, nitrogen status and canopy density using ground-based multispectral data.In P.C. Robert et al. (ed.) Precision agriculture. Proc. 5th Intern. Conf. 16-19 July 2000,Bloomington, MN. ASA-CSSA-SSSAJ, Madison WI (in press).
Bauer, M.E. 1975. The role of remote sensing in determining the distribution and yield of crops.Advances in Agronomy. 27:271-304.
Bausch, W.C. 1995. Remote sensing of crop coefficients for improving the irrigation schedulingof corn. Agric. Water Management 27:55-68.
Bausch, W.C., and C.M.U. Neale. 1987. Crop coefficients derived from reflected canopyradiation: A concept. TRANS of ASAE 30(3):703-709.
Bausch, W.C., and C.M.U. Neale. 1989. Spectral inputs improve corn crop coefficients andirrigation scheduling. TRANS of ASAE 32(6):1901-1908.
Blackburn, G.A. 1998. Spectral indices for estimating photosynthetic pigment concentrations: atest using senescent tree leaves. Internation Journal of Remote Sensing. 19:657-675.
Blackmer, T.M. and J.S. Schepers. 1995. Use of a chlorophyll meter to monitor nitrogen statusand schedule fertigation for corn. J. Prod. Agric. 8:56-60.
Blackmer, T.M., J.S. Schepers, G.E. Varvel, and G.E. Meyer. 1996. Analysis of aerialphotography for nitrogen stress within corn fields. Agronomy Journal 88:729-733.
Bowman, W.D. 1989. The relationship between leaf water status, gas exchange, and spectralreflectance in cotton leaves. Remote Sensing of Environment. 30:249-255.
Buschman, C. and Nagel E. 1993. In vivo spectroscopy and internal optics of leaves as basis forremote sensing of vegetation. Int. J. Rem. Sensing. 14:711-722.
Choudhury, B.J., N.U. Ahmed, S.B. Idso, R.J. Reginato, and C.S.T. Daughtry. 1994. Relationsbetween evaporation coefficients and vegetation indices studied by model simulations. RemoteSens. Environ. 50:1-17.
Clarke, T. R. 1997. An empirical approach for detecting crop water stress using multispectralairborne sensors. Hortechnology 7(1):9-16.
Condit, H.R. 1970. The spectral reflectance of American Soils. Photogrammetric Engineering.36:955-966.
Demetriades-Shah, T.H., M.D. Steven, and J.A. Clarke. 1990. High resolution derivative spectra

183
in remote sensing. Remote Sensing Environ. 33:55-64.
Doorenbos, J., and W.O. Pruitt. 1977. Crop water requirements. Irrig. and Drain. Paper No. 24,Food and Agric. Organization of the United Nations, Rome, Italy. 144 pp.
Fernandez, S., D. Vidal, E. Simon, and L. Sole-Sugranes. 1994. Radiometric characteristics ofTriticum aestivum cv Astral under water and nitrogen stress. Int. J. Remote Sensing. 15:1867-1884.
Filella, I., L. Serrano, J. Serra, and J. Peñuelas. 1995. Evaluating wheat nitrogen status withcanopy reflectance indices and discriminant analysis. Crop Science. 35:1400-1405.
Gamon, J.A., C.B. Field, W. Bilger, O. Bjorkman, A.L. Fredeen, and J. Peñuelas. 1990. Remotesensing of the xanthophyll cycle and chlorophyll fluorescence in sunflower leaves and canopies.Oecologia. 85:1-7.
Gamon, J.A., J. Peñuelas, and C.B. Field. 1992. A narrow-waveband spectral index that tracksdiurnal changes in photosynthetic efficiency. Remote Sensing of Environment. 41:35-44.
Gamon, J.A., L. Serrano, and J.S. Surfus. 1997. The photochemical reflectance index: an opticalindicator of photosynthetic radiation use efficience across species, functional types, and nutrientlevels. Oecologia. 112:492-501.
Gao, B.-C. 1996. NDWI - A Normalized difference water index for remote sensing of vegetationliquid water from space. Remote Sensing Environ. 58:257-266.
Gates, D.M., H.J. Keegan, J.C. Schleter, and V.R. Weidner. 1965. Spectral properties of plants.Applied Optics. 4:11-20.
Gausman, H.W. and W.A. Allen. 1973. Optical Parameters of Leaves of 30 Plant Species. PlantPhysiology. 52:57-62.
Hoogenboom, G., J.W. Jones and K.J. Boote. 1992. Modeling growth, development and yieldof grain legumes using SOYGRO, PNUTGRO, and BEANGRO: A review. Transactions of theASAE 35(6):2043-2056.
Horler, D.N.H., J. Barber, and A.R. Barringer. 1980. Effects of heavy metals on the absorbanceand reflectance spectra of plants. Int. J. Remote Sensing. 1:121-136.
Horler, D.N.H., M. Dockray, and J. Barber. 1983. The red edge of plant leaf reflectance. Int. J.Remote Sensing. 4:273-288.
Huete, A.R. 1988. A soil adjusted vegetation index (SAVI). Remote Sensing Environment. 25:295-309.

184
Hunsaker, D.J. 1999. Basal crop coefficients and water use for early maturity cotton. TRANS ofASAE 42(4):927-936.
Hunsaker, D.J., B.A. Kimball, P.J. Pinter Jr., G.W. Wall, R.L. LaMorte, F.J. Adamsen, S.W.Leavitt, T.L. Thompson, A.D. Matthias, and T.J. Brooks. 2000. CO2 enrichment and soilnitrogen effects on wheat evapotranspiration and water use efficiency. Agric.& Forest Meteorol.104: 85-105.
Hunsaker, D.J., G.R. Hendrey, B.A. Kimball, K.F. Lewin, J.R. Mauney, and J. Nagy. 1994.Cotton evapotranspiration under field conditions with CO2 enrichment and variable soil moistureregimes. Agric. & For. Meteorol. 70:247-258.
Hunsaker, D.J., B.A. Kimball, P.J. Pinter Jr., R.L. LaMorte, and G.W. Wall. 1996. CO2enrichment and irrigation effects on wheat evapotranspiration and water use efficiency. TRANSof ASAE 39(4)1345-1355. 1996.
Idso, S. B., R. D. Jackson, P. J. Pinter Jr., R. J. Reginato, and J. L. Hatfield. 1981. Normalizingthe stress-degree-day parameter for environmental variability. Agric. & Forest Meteorol. 24:45-55.
IBSNAT, 1986. Decision support system for agrotechnology transfer (DSSAT) TechnicalReport 5: Documentation for IBSNAT Crop Model Input and Output Files, Version 1.0.International sites network for agrotechnology transfer project, University of Hawaii, HonoluluHI.
Inoue, Y., M.S. Moran, and P.J. Pinter Jr. Estimating potential and actual daily transpiration ofcrop canopies from remotely sensed spectral data and basic meteorological data -theory andinitial test. P. 1061-1068. In Proc. 6th Int. symp. Physical Measurements and signatures inRemote sensing. Val D’Isere, France. 17-21 January 1994.
Jackson, R.D. 1982. Canopy temperatures and crop water stress. pp. 43-85 In, Hillel, D.E., Ed.Advances in Irrigation. Academic Press, NY. Vol 1.
Jackson, R.D. 1984. Remote sensing of vegetation characteristics for farm management. 75:81-96.
Jackson, R.D., J.L. Hatfield, R.J. Reginato, S.B. Idso, and P.J. Pinter Jr. Estimation of dailyevapotranspiration from one time-of-day measurements. Agric. Water Mgmt 7:351-362. 1983.
Jackson, R.D. and A.R. Huete. 1991. Interpreting vegetation indices. Preventative VeterinaryMedicine. 11:185-200.
Jackson, R.D., S.B. Idso, R.J. Reginato, and P.J. Pinter, Jr. 1980. Remotely sensed croptemperatures and reflectances as inputs to irrigation scheduling. Proc. ASCE Irrig. and drain.Div. Specialty Conf., Boise ID, 23-25 July, pp. 390-397.

185
Jackson, R. D., S. B. Idso, R. J. Reginato, and P. J. Pinter Jr. 1981. Canopy temperature as acrop water stress indicator. Water Resour. Res. 17(4):1133-1138.
Jackson, R. D., P. J. Pinter Jr., S. B. Idso, and R. J. Reginato. 1979. Wheat spectral reflectance:Interaction between crop configuration sun elevation, and azimuth angle. Appl. Optics18(22):3730-37.
Jensen, M.E., and R.G. Allen. 2000. Evolution of practical ET estimating methods. Proceedingsof the 4th National Irrigation Symposium, pp. 52-65, ASAE, Phoenix AZ, Nov.14-16.
Jensen, M.E., R.D. Burman, and R.G. Allen. 1990. Evapotranspiration and Irrigation WaterRequirements. ASCE Manuals and Reports on Engineering Practices No. 70, Am. Soc. of CivilEngineers, NY. 332 pp.
Jones, D. D., and E. M. Barnes. 2000. Fuzzy composite programming to combine remotesensing and crop models for decision support in precision crop management. Agric. Systems65:137-158.
Jones, J.W. and J.T. Ritchie. 1990. Chapter 4: Crop growth models. In Management of FarmIrrigation Systems, Hoffman, G.J., T.A. Howell and K.H. Soloman editors. ASAE, 2950 NilesRd., St. Joseph, MI 49085.
Kawashima, S. and M. Nakatani. 1998. An alogithm for estimating chlorophyll content in leavesusing a video camera. Annals of Botany. 81:49-54.
Kenig, A., J.W. Mishoe, K.J. Boote, P.W. Cook, D.C. Reicosky, W.T. Pettigrew and H.F.Hodges. 1993. Development of soybean fresh and dry weight relationships for real time modelcalibration. Agronomy Journal 84:140-146.
Kimball, B.A., R.L. LaMorte, R.S. Seay, P.J. Pinter Jr., R. Rokey, D.J. Hunsaker, W.A. Dugas,M.L. Heuer, J.R. Mauney, and G.R. Hendrey. 1994. Effects of free-air CO2 enrichment onenergy balance and evapotranspiration of cotton. Agric. & Forest Meteorol. 70:259-278.
Kimball, B.A., R.L. LaMorte, P.J. Pinter Jr., G.W. Wall, D.J. Hunsaker, F.J. Adamsen, S.W.Leavitt, T.L. Thompson, A.D. Matthias, and T.J. Brooks. 1999. Free-air CO2 enrichment(FACE) and soil nitrogen effects on energy balance and evapotranspiration of wheat. WaterResources Research, 35(4): 1179-1190.
Kimes, D.S., R.F. Nelson, M.T. Manry, and A.K. Fung. 1998. Attributes of neural networks forextracting continuous vegetation parameters from optical and radar measurements. Int. J. RemoteSensing. 19:2639-2663.
Knipling, E.B. 1970. Physical and physiological basis for the reflectance of visible and near-infrared radiation from vegetation. Remote Sensing of Environment. 1:155-159.

186
Lal, H., G. Hoogenboom, J.P. Calixte, J.W. Jones and F.H. Beinroth. 1993. Using crop simulationmodels and GIS for regional productivity analysis. Transactions of the ASAE 36:175-184.
Lesch, S.M., D.J. Strauss and J.D. Rhoades. 1995. Spatial prediction of soil salinity usingelectromagnetic induction techniques: 2. An efficient spatial sampling algorithm suitable formultiple linear regression model identification and estimation. Water Resour. Res. 31:387-398.
Lo Seen, D.E. Mougin, S. Rambal, A. Gaston and P. Hiernaux. 1995. A regional Saheliangrassland model to be coupled with multispectral data. II: Toward the Control of its simulationsby remotely sensed indices. Remote Sensing of Environment 52(3):194-206.
Maas, S.J. 1988. Using satellite data to improve model estimates of crop yield. Agron. J. 80:655-662.
Maas, S.J. and J.R. Dunlap. 1989. Reflectance, Transmittance, and absorptance of light bynormal, etiolated, and albino corn leaves. Agron. J. 81:105-110.
Marani, A. 1995. CALGOS: A modification of GOSSYM-COMAX for irrigated agriculture.USDA/ARS/WMRL 2021 S. Peach Ave., Fresno, CA 93727.
Masoni, A., L. Ercoli, and M. Mariotti. 1996. Spectral properties of leaves deficient in iron,sulfur, magnesium, and manganese. J. Agron. 88:937-943.
McGwire K, T. Minor, and L. Fenstermaker. Hyperspectral Mixture Modeling for QuantifyingSparse Vegetation Cover in Arid Environments. Remote Sensing of Environment. 2000;72:360-374.
Monteith, J.L. 1959. The reflection of short-wave radiation by vegetation. Quarterly Journal of theRoyal Meteorological Society. 85:386-392.
Moran M.S., R.B. Bryant, T.R. Clarke, and J.G. Qi. Deployment and Calibration of ReferenceReflectance Tarps for Use With Airborne Imaging Sensors. Photogrammetric Engineering andRemote Sensing. 2001;67:273-286
Moran, M.S., T.R. Clarke, Y. Inoue, and A. Vidal. 1994. Estimating crop water deficit using therelation between surface-air temperature and spectral vegetation index. Remote Sensing Environ.49:246-263.
Moran, M.S., S.J. Maas and P.J. Pinter. 1995. Combining remote sensing and modeling forestimating surface evaporation and biomass production. Remote Sensing Reviews 12:335-353.
Moran, M.S., P.J. Pinter Jr., B.E. Clothier, and S.G. Allen. 1989. Effect of water stress on thecanopy architecture and spectral indices of irrigated alfalfa. Remote Sensing Environ. 29:251-261.

187
Moulin, S., A. Bondeau, and R. Delecolle. 1998. Combining agricultural crop models and satelliteobservations from field to regional scales. International Journal of Remote Sensing 19(6):1021-1036.
National Research Council, 1997. Precision Agriculture in the 21st Century. National AcademyPress, Washington, D.C. 149 pp.
Neale, C.M.U., W.C. Bausch, and D.F. Heerman. 1989. Development of reflectance-based cropcoefficients for corn. TRANS of ASAE 32(6):1891-1899.
Paz, J.O., W.D. Batchelor, T.S. Colvin, S.D. Logsdon, T.C. Kaspar, and D.L. Karlen. 1998.Calibration of a crop growth model to predict spatial yield variability. Transactions of the ASAE41(5): 1527-1534.
Penning de Vries, F.W.T., D.M. Jansen, H.F.M. ten Berge and A. Bakema. 1989. Simulation ofecophysiological processes of growth several annual crops. PUDOC, Wageningen, TheNetherlands.
Peñuelas, J. and I. Filella. 1998. Visible and near-infrared reflectance techniques for diagnosingplant physiological status. Trends in Plant Science. 3:151-156.
Peñuelas, J., R. Isla, I. Filella, and J.L. Araus. 1997a. Visible and near-infrared reflectanceassessment of salinity effects on barley. Crop Science. 37:198-202.
Peñuelas, J., J. Llusia, R. Ogaya, and I. Filella. 1997b. Estimation of plant water concentration bythe reflectance Water Index WI (R900/R970). Int. J. Remote Sensing. 18:2869-2875.
Peñuelas, J., J. Llusia, J. Pinol, and I. Filella. 1997c. Photochemical reflectance index and leafphotosynthetic radiation-use-efficiency assessment in Mediterranean trees. Int. J. Remote Sensing.18:2863-2868.
Pinter Jr., P.J., R.J. Anderson, B.A. Kimball, and J.R. Mauney. 1992. Evaluating cotton response tofree air carbon dioxide enrichment with canopy reflectance observations. Critical Reviews in PlantSciences 11(2-3):241-250.
Pinter, Jr, P.J., B.A. Kimball, J.R. Mauney, G.R. Hendrey, K.F. Lewin and J. Nagy. 1994. Effectsof free-air carbon dioxide enrichment on PAR absorption and conversion efficiency by cotton.Agricultural and Forest Meteorology 70: 209-230.
Pinter Jr., P.J., B.A. Kimball, G.W. Wall, R.L. LaMorte, D.J. Hunsaker, F.J. Adamsen, K.F.A.Frumau, H.F. Vugts, G.R. Hendrey, K.F. Lewin, J. Nagy, H.B. Johnson, F. Wechsung, S.W.Leavitt, T.L. Thompson, A.D. Matthias, and T.J. Brooks. 2000. Free-air CO2 enrichment (FACE):blower effects on wheat canopy microclimate and plant development. Agricultural and ForestMeteorology 103(4):319-332.
188
Pinter Jr., P.J., R.D. Jackson, and S.B. Idso. 1983. Diurnal patterns of wheat spectral reflectances. IEEE Trans. on GeoSci. and Remote Sensing GE-21(2):156-163.
Pinter Jr., P.J., R.D. Jackson, C.E. Ezra, and H.W. Gausman. 1985. Sun angle and canopyarchitecture effects on the reflectance of six wheat cultivars. Int. J. Remote Sensing 6:1813-1825.
Pinter Jr., P.J., G. Zipoli, G. Maracchi, and R.J. Reginato. 1987. Influence of topography andsensor view angles on NIR/red ratio and greenness vegetation indices of wheat. Int. J. RemoteSensing 8(6):953-957.
Pocknee, S., B.C. Boydell, H.M. Green, D.J. Waters, and C.K. Kvien. 1996. Directed soil sampling.In Proc. 3rd Int. Conf. on Precision Agriculture, P.C. Robert, R.H. Rust, and W.E. Larson, eds. 159-168. Madison, WI: ASA.
Potdar, M.B. 1993. Sorghum yield modeling based on crop growth parameters determined fromvisible and near-IR channel NOAA AVHRR data. International Journal of Remote Sensing14(5):895-905.
Qi, J., A. Cheboouni, A.R. Huete, Y.H. Kerr, and S. Sorooshian (1994) A modified soil adjustedvegetation index. Remote Sensing of Environment 48:119-126.
Qi, J., M.S. Moran, F. Cabot, and G. Dedieu. 1995. Normalization of sun\view angle effects onvegetation indices with bidirectional reflectance function models. Remote Sensing Environ.52:207-217.
Raun, W.R., J.B. Solie, G.V. Johnson, M.L. Stone, E.V. Lukina, W.E. Thomason, and J.S.Schepers. 2001. In-season prediction of potential grain yield in winter wheat using canopyreflectance. Agron. J. 93(1):131-138.
Richardson, A.J. and C.L. Wiegand. 1977. Distinguishing vegetation from soil backgroundinformation. PERS. 43:1541-1552.
Sadler, E.J., and G. Russell. 1997. Modeling crop yield for site-specific management. pp. 69-79.In Pierce, F. J., and Sadler, E. J. (eds.) The State of Site-Specific Management for Agriculture.ASA, Madison, WI.
Stoner, E.R. and M.F. Baumgardner. 1981. Characteristic variations in reflectance of surfacesoils. Soil Sci. Soc. Amer. J. 45:1161-1165.
Thompson, W.H., and P.C. Robert. 1995. Evaluation of mapping strategies for variable rateapplications. In Site-Specific Management for Agricultural Systems, eds. P.C. Robert, R.H.Rust, and W.E. Larson, 303-323. Madison, WI: ASA.
Tolk, J.A., and T.A. Howell. 2000. Measured and predicted evapotranspiration of grain sorghum

189
grown with full and limited irrigation in three high plains soils. Proceedings of the 4th NationalIrrigation Symposium, pp. 554-560, ASAE, Phoenix AZ, November14-16.
Tsuji, G.Y., J.W. Jones, and S. Balas (eds). 1994. DSSAT v3. University of Hawaii, HonoluluHI.
Tucker, C.J. 1979. Red and photographic infrared linear combinations for monitoring vegetation.RSE. 8:127-150.
Wall, G.W., J.S. Amthor and B.A. Kimball. 1994. COTCO2: a cotton growth simulation modelfor global change. Agricultural and Forest Meteorology 70:289-342.
Walter, I.A., R.G. Allen, R. Elliott, M.E. Jensen, D. Itenfisu, B. Mecham, T.A. Howell, R.Synder, P. Brown, S. Echings, T. Spofford, M. Hattendorf, R.H. Cuenca, J.L. Wright, and D.Martin. 2000. ASCE’s standardized reference evapotranspiration equation. Proceedings of the 4th
National Irrigation Symposium, pp. 209-215, ASAE, Phoenix AZ, November.14-16.
Whaley, E. 2001. Space tool fills universal void. Resource. 13-14.Wiegand, C.L., A.J.Richardson, and E.T. Kanemasu. 1979. Leaf area index estimates for Wheat from LANDSATand their implications for evapotranspiration and crop modeling. Agronomy Journal 71:336-342.
Wood, C.W., Reeves D.W., and Himelrick D.G. 1993. Relationships between chlorophyll meterreadings and leaf chlorophyll concentration, N status, and crop yield: A review. ProceedingsAgronomy Soc. of New Zealand. 23:1-9.
Wright, J.L. 1982. New evapotranspiration crop coefficients. J. of the Irrig. and Drain. Div.,Am. Soc. Civil Eng. 108(1):57-74.
Yang, C. and G.L. Anderson. 1996. Determining within-field management zones for grainsorghum using aerial videography. In Proc. of the 26th Symposium on Remote Sens. Environ.,606-611. Vancouver, BC, 25-29 March.
Yoder, B.J. and R.E. Pettigrew-Crosby. 1995. Predicting both nitrogen and chlorophyll contentand concentrations from reflectance spectra (400-2500nm) at leaf and canopy scales. RemoteSensing of Environment. 53:199-211.


190
PROJECT SUMMARY
Agricultural diversification is important for achieving economic stability and future growth ofagriculture. One way to achieve diversification is the development of new crops. New/alternativecrops must complement instead of compete with existing traditional crops. In addition, the newcrops must be able to conserve water and nutrients and help in improving the environment. Theobjectives of this project are to (1) acquire and characterize germplasm of promising new/alternativecrops; (2) evaluate and enhance new crop germplasm for industrial materials; (3) develop basicknowledge of floral biology, seed production, and plant responses to environmental stresses; (4)develop economical production systems for new crops under various environmental andmanagement conditions; and (5) develop methods for efficient guayule latex extraction and seed oilanalyses for characterizing latex, resin, and oil properties. This research will result in scientific andpopular publications on the basic biology, characteristics, production systems, and methodology forevaluating, enhancing, and growing new crops. The long-term goal is to provide high yieldinggermplasm of new crops that is adaptable to a variety of environments and has materials needed forindustrial uses. This CRIS is the lead USDA-ARS project for breeding, genetics, germplasmcollection, germplasm evaluation, and germplasm enhancement of new crops, and is the majorsource of the raw materials needed for pursuing related work on product development andutilization. The development of guayule as a new crop would provide relief to the 6 % of the USpopulation with allergies to Hevea latex products. This includes 40 % of the medical workers and60 % of multiple surgery cases. It would also develop a domestic source of latex, reducing ourdependence on imported rubber. Development of additional products from the bagasse could resultin additional products such as insulation, termite and wood rot resistant wood products, and a newnatural gum base to use in chewing gums. Development of lesquerella as a new crop would resultin a domestic source of hydroxy fatty acid, replacing castor oil imports that cost over $100 millionannually. The oil would serve as base for renewable based lubricating oils.
OBJECTIVES
1. Acquire and characterize germplasm of guayule, lesquerella, vernonia, and other promisingnew/alternative crops.
2. Evaluate and enhance germplasm of new crops for industrial materials.
3. Develop basic knowledge of floral biology, seed production and plant responses toenvironmental stresses.
4. Develop economical production systems for new crops under various environmental andmanagement conditions.
5. Develop methods for efficient guayule latex extraction and seed oil analyses forcharacterizing latex, resin, and oil properties.

191
NEED FOR RESEARCH
Description of the Problem to be Solved
The need exists for improving the economic status of the U.S. farmer and reducing the costsassociated with surplus crops. In addition, improving this country’s balance of payment anddecreasing its vulnerability to imports of strategic industrial raw materials cannot be readilydismissed. Successful commercialization of the new crops may even lead to the export of the rawand finished products. Agricultural diversification is important for achieving economic stability andfuture growth of agriculture. New/alternative crops must complement instead of compete withexisting traditional crops. In addition, the new crops must be able to conserve water and nutrientsand help in improving the environment.
The U.S. spends over one billion dollars annually importing Hevea rubber - the only source ofnatural rubber for use in industry and commerce. More recently, it was discovered that a largeportion of the world population has become allergic to the Hevea rubber hygienic products. Theseallergies can sometimes be life-threatening. Guayule (Parthenium argentatum) synthesizes latexrubber, which has been found to be hypoallergenic and offers an alternative to Hevea latex. Sincethe plant is native to the southwestern United States, cultivation of this crop could mean additionaleconomic sources for the farmers in this region. Successful commercialization of guayule, however,depends on the identification and development of acceptable production practices and processingmethods. While much is presently known about maximizing solid rubber production, little is knownabout maximizing latex production.
The U.S. imports over 40 million dollars of castor oil, a strategic raw material, annually for use inlubricants, cosmetics, plasticizers, protective coatings, surfactants, and pharmaceuticals. Productionof castor in the U.S. is restricted because of its high level of allergic reactions and seed toxicity.Lesquerella (Lesquerella fendleri), a plant native to the U.S., produces a hydroxy fatty acid, whichis an acceptable alternative to castor oil. Successful commercialization of lesquerella depends onthe identification and development of enhanced germplasm with high seed yields, high oil content,high lesquerolic acid content, autofertility, and acceptable production practices. A large germplasmcollection is being developed and evaluated for desirable characteristics at the U.S. WaterConservation Laboratory. Much work remains to be done to finish the evaluation of the collectionand to transfer the desired traits into commercially acceptable lines. Information is also needed onoptimizing production practices.
The oil-based paint and pesticide industries are looking for ways to reduce emissions of volatileorganic compounds (VOC), which contribute to the pollution of the atmosphere. One alternativeto correct this problem is to use vegetable oils high in epoxy fatty acids. Vernonia (Vernoniagalamansis) is one of the few plants that naturally synthesizes an epoxy fatty acid, which has lowvolatility and good solvent properties needed in paints. Other industrial uses for the oil are in epoxy-alkyd paints, toughened epoxy resins, dibasic acids, lubricants, pesticides, and adhesives. Successful

192
commercialization of vernonia depends on the development of germplasm with high yield and oilcontent, high vernolic acid content, good seed retention, uniform maturity, day neutral flowerinduction as well as acceptable crop production features.
Information available on the cultural management of these new crops is incomplete. Thus,additional work must be done to obtain answers before wide-scale commercial production ispossible. Some examples of areas needing work are dates of planting for maximum standestablishment and yield,seeding rates that are economical, seed treatments to ensure stands and break dormancy, plantingmethods that result in acceptable stands and result in maximum yields, dates of harvest for maximumyield and quality, harvesting methods that result in minimum losses, water use data for schedulingirrigations, nutrient requirements that minimize pollution and result in high yields, pest controlmeasures for insect, disease, and weed problems, post-harvest and preprocessing studies tomaximize yields and quality.
Relevance to ARS National Program Action Plan
This research involves collecting, evaluating, and enhancing germplasm of new crops, whiledeveloping planting, growing, and harvesting systems for producing a profitable crop, whichcontributes to the Plant Germplasm Conservation and Development National Program. Cooperativeresearch with other scientists leads to commercial and industrial applications for new crops and newanalytical methods necessary for making progress in a breeding program. Besides the primary usesof these crops, additional products such as gums, bagasse, resins, and seed meals for animal feedcontribute to the New Uses National Program 306.
Potential Benefits
The development of guayule as a new crop would provide relief to the 6 % of the US populationwith allergies to Hevea latex products. This includes 40 % of the medical workers and 60 % ofmultiple surgery cases. It would also develop a domestic source of latex, reducing our dependenceon imported rubber. Development of additional products from the bagasse could result in additionalproducts such as insulation, termite and wood rot resistant wood products, and a new natural gumbase to use in chewing gums. Development of lesquerella as a new crop would result in a domesticsource of hydroxy fatty acid, replacing castor oil imports that cost over $100 million annually. Theoil would serve as base for renewable based lubricating oils. Anticipated Products
This research will result in scientific and popular publications on the basic biology, characteristics,production systems, and methodology for evaluating, enhancing, and growing new crops. The long-term goal is to provide high yielding germplasm of new crops that is adaptable to a variety ofenvironments and has materials needed for industrial uses.
Customers

193
Customers of this research include other scientists, cooperative state extension personnel, regulatoryagencies, growers, users of the GRIN system, other federal agencies, and industry.
SCIENTIFIC BACKGROUND
Germplasm improvement and varietal trials have identified lines that have almost double the rubberyield of older lines. Estimates of the amount of genetic diversity within a facultative apomicticpopulations have shown high amounts of variation from one generation to the next. This variationis due to the facultative (apomixis and sexuality coexisting) nature of guayule. Various breedingstrategies have been devised to accommodate this and improve yield characteristics. Reportsrelative to the cultural management and production of guayule have been completed. In light of thegreat impact of the hypoallergenic guayule latex, research has been done to determine theextractability and post-harvest handling of the shrubs prior to processing. Specific CooperativeAgreements, based primarily on DOD-Advanced Materials from Renewable Resources, have beenestablished with the University of Arizona and University of Akron to work on latex physical andchemical properties, and analysis. Cooperative work has been maintained with the ARS WesternRegional Laboratory on the biological aspects of the latex.
Several new populations of L. fendleri have been collected for use in improving seed yields andother related plant characteristics. These populations had not previously been available through theNational Plant Germplasm System. New collections are necessary for plant breeding since they mayhave improved traits over the present germplasm being used. Other species of Lesquerella and aclosely related genus Physaria also have been collected. These species contain seed oil rich inhydroxy fatty acids that could be developed for lesquerella production in different environments.Preliminary evaluations of some of this new material have been completed. This work is partlyfunded through a grant form USDA, ARS, Plant Exploration Office and was partially funded in thepast through a USDA, Alternative Agricultural Research and Commercialization (AARC) Centergrant. A feature of this project is the creation of a network of relationships among government andprivate sector organization The USWCL has been responsible for defining cultural managementpractices including irrigation timing and amounts, planting and harvesting techniques, as well as theinitial research and development that will eventually result in an alternative crop for the U.S. farmersin a relatively short amount of time.
Hybrids have been produced between a variety of Vernonia galamensis ‘petitina’, that has a day-neutral flowering response, and germplasm with other desirable characteristics. The initial phaseof successfully combining these two germplasm sources has been accomplished. These hybrids havebeen evaluated at this location and at a number other sites across the U.S. Selections better adaptedto specific locations have been made. These hybrids are continuing to be developed throughbreeding and agronomic studies. Grants have also allowed us to evaluate seeds for oil content andthe profile of the fatty acid distribution by the purchases of NMR and gas chromatographicequipment.

194
Short- and long-term goals are variable depending upon the new crop and its stage of development.Thus, each of the three crops will have certain priorities peculiar to that crop. Short term goals are:(1) development and release of higher yielding guayule, lesquerella, and vernonia germplasm; (2)development of production, harvest, post-harvest, and storage guidelines and recommendations forgrowers and industry; (3) evaluation and collection of new lesquerella germplasm from the US andMexico; and (4) develop new uses for primary and secondary products in cooperation with others.The long-term goal for all crops is to provide high yielding germplasm adaptable to a variety ofenvironments with raw materials useful for industry in order to successfully commercialize thesenew crops. All work will be closely coordinated within the CRIS unit, and between cooperators andindustrial users.
Literature Review
A CRIS search was conducted for projects conducting research in the areas of Guayule, Lesqueralla,and Vernonia. Of the 55 projects received, 26 were for projects that have been discontinued beforeJanuary 1995, 12 were for projects that will expire in CY 1995, and 17 were for projects expiringafter January 1996. Twelve of the 17 will expire in CY 1996, in which two are support for theexisting CRIS, one is a cooperative project with this project, and the other two are not related toresearch proposed in this CRIS. These findings indicate the importance of continuing this projectfor successful development of lesquerella, guayule, and vernonia as new industrial crops. This CRISis the lead USDA-ARS project for breeding, genetics, germplasm collection, germplasm evaluation,and germplasm enhancement of new crops, and is the major source of the raw materials needed forpursuing related work on product development and utilization.
Guayule
The United States is totally dependent upon Hevea natural rubber from southeast Asia for commerceand defense. The annual importing cost of this critical industrial material is about $1 billion.Guayule, a native to north-central Mexico and southwestern Texas, is capable of synthesizing rubberwith properties equivalent to the Hevea plant (Hammond and Polhamus, 1965). In the early 1990s,the wild shrub was harvested and processed for rubber in Mexico. The rubber was used in themanufacture of automobile tires. The rubber was replaced by Hevea because it could be producedcheaper than guayule. However, no reasons exist that would prevent this plant from being growncommercially in the United States. The economics for cultivating guayule have not been good inthe past, but the petroleum crisis of the 1970s and the large increase in natural rubber prices in themid 1990s have greatly improved the possibility for commercialization of the plant.
The recent discovery by an ARS scientist that the rubber from the guayule plant is hypoallergenichas further enhanced the potential for commercializing this crop (Cornish, 1995; Siler and Cornish,1994). Because of the widespread use of latex products and poor quality control, many people havebecome allergic to Hevea latex. The allergy can be mild to life threatening and special meetings havebeen convened to discuss Hevea allergies (European Rubber Journal and Rubber Consultant meeting,1993). There appears to be no solution to the allergy problem with Hevea, since the allergy causing
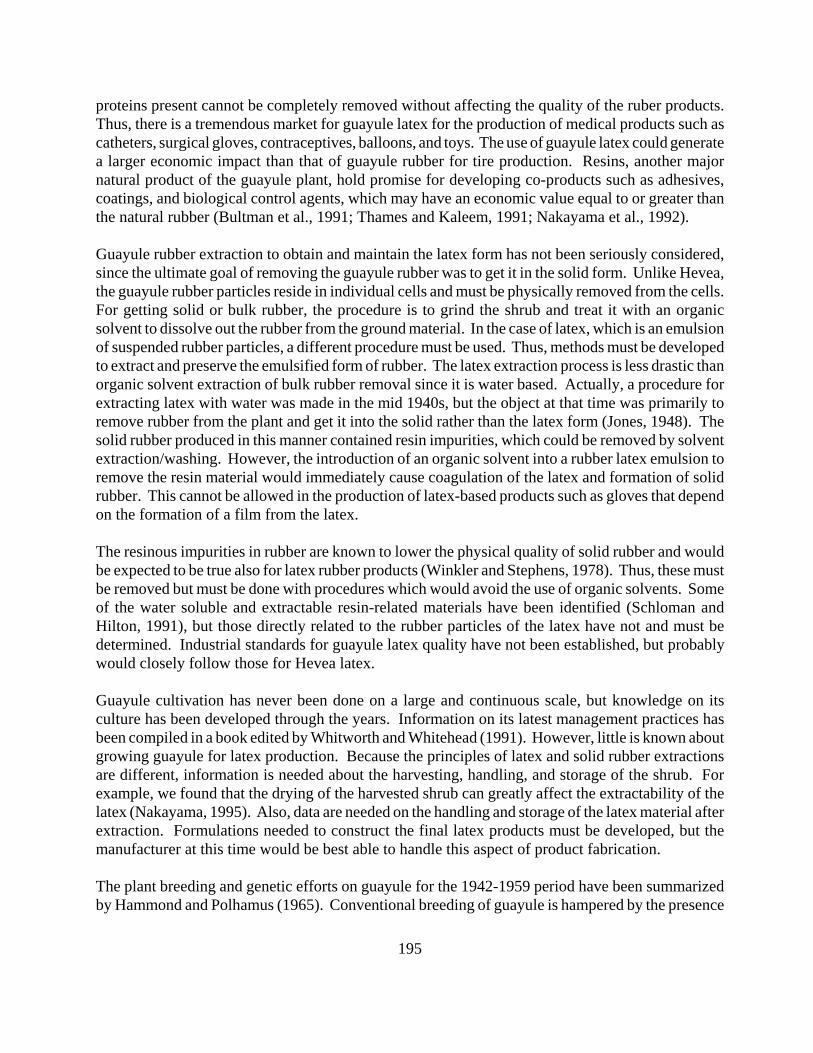
195
proteins present cannot be completely removed without affecting the quality of the ruber products.Thus, there is a tremendous market for guayule latex for the production of medical products such ascatheters, surgical gloves, contraceptives, balloons, and toys. The use of guayule latex could generatea larger economic impact than that of guayule rubber for tire production. Resins, another majornatural product of the guayule plant, hold promise for developing co-products such as adhesives,coatings, and biological control agents, which may have an economic value equal to or greater thanthe natural rubber (Bultman et al., 1991; Thames and Kaleem, 1991; Nakayama et al., 1992).
Guayule rubber extraction to obtain and maintain the latex form has not been seriously considered,since the ultimate goal of removing the guayule rubber was to get it in the solid form. Unlike Hevea,the guayule rubber particles reside in individual cells and must be physically removed from the cells.For getting solid or bulk rubber, the procedure is to grind the shrub and treat it with an organicsolvent to dissolve out the rubber from the ground material. In the case of latex, which is an emulsionof suspended rubber particles, a different procedure must be used. Thus, methods must be developedto extract and preserve the emulsified form of rubber. The latex extraction process is less drastic thanorganic solvent extraction of bulk rubber removal since it is water based. Actually, a procedure forextracting latex with water was made in the mid 1940s, but the object at that time was primarily toremove rubber from the plant and get it into the solid rather than the latex form (Jones, 1948). Thesolid rubber produced in this manner contained resin impurities, which could be removed by solventextraction/washing. However, the introduction of an organic solvent into a rubber latex emulsion toremove the resin material would immediately cause coagulation of the latex and formation of solidrubber. This cannot be allowed in the production of latex-based products such as gloves that dependon the formation of a film from the latex.
The resinous impurities in rubber are known to lower the physical quality of solid rubber and wouldbe expected to be true also for latex rubber products (Winkler and Stephens, 1978). Thus, these mustbe removed but must be done with procedures which would avoid the use of organic solvents. Someof the water soluble and extractable resin-related materials have been identified (Schloman andHilton, 1991), but those directly related to the rubber particles of the latex have not and must bedetermined. Industrial standards for guayule latex quality have not been established, but probablywould closely follow those for Hevea latex.
Guayule cultivation has never been done on a large and continuous scale, but knowledge on itsculture has been developed through the years. Information on its latest management practices hasbeen compiled in a book edited by Whitworth and Whitehead (1991). However, little is known aboutgrowing guayule for latex production. Because the principles of latex and solid rubber extractionsare different, information is needed about the harvesting, handling, and storage of the shrub. Forexample, we found that the drying of the harvested shrub can greatly affect the extractability of thelatex (Nakayama, 1995). Also, data are needed on the handling and storage of the latex material afterextraction. Formulations needed to construct the final latex products must be developed, but themanufacturer at this time would be best able to handle this aspect of product fabrication.
The plant breeding and genetic efforts on guayule for the 1942-1959 period have been summarizedby Hammond and Polhamus (1965). Conventional breeding of guayule is hampered by the presence

196
of apomixis in most polyploid material and by self-incompatibility in most sexual diploids. Theseconstraints also have limited the amount of current knowledge on the heritability of economicallyimportant characters. Thompson and Ray (1988) and Estilai and Ray (1991) have thoroughlyreviewed many of the aspects for improving guayule through breeding and management practices.
Numerous researchers have found a high degree of variability within and between guayule lines (Ray,1983, 1989; Benitez and Kuruvadi, 1985; Naqvi, 1985; Thompson et al., 1988; Dierig et al., 1989a,1989b; Thompson et al., 1990b; Estilai and Ray, 1991). Several of these studies have also shown thatplant dry weight is generally a better predictor of final rubber or resin yield than either the rubber orresin percentage. These results indicate that significant improvements in plant dry weight, rubberyield, and latex yield should be possible.
The better rubber yielding lines in the Uniform Regional Varietal Trials have been selected andreplanted for additional testing and seed increase. Because of the facultative apomictic nature ofreproduction in guayule improvement of germplasm through traditional breeding methods is difficult.Tissue culture technology has been developed for clonal propagation of guayule (Radin et al, 1982,1985). Initial studies been made on the characterization of isozymes in guayule (Estiali et al., 1990;Ray et al., 1993). Development of isozyme patterns in guayule would be helpful for the identificationof sexual hybrids in crosses among apomictic parents.
Lesquerella
Domestication of Lesquerella species as a new crop for arid lands and a domestic source of hydroxyfatty acids has been discussed (Hinman, 1984, 1986; Princen, 1979, 1982, 1983; Princen and Rothfus,1984; Senft, 1988; Thompson, 1985, 1988, 1989, 1990a; Thompson and Dierig, 1988; Thompson etal., 1989; Thompson, 1990). Rapid progress is being made toward full commercialization withcooperation between industry and government agencies (Dierig, et al., 1993). Lesquerella is a newWorld genus of annual, biennial, and perennial herbs. Over 90 species have been described (Barclayet al, 1962; Rollins and Shaw, 1973). The basic chromosome numbers for species within the genusare n=5, 6, 8, and 9 (Rollins and Shaw, 1973). Rollins and Solbrig (1973) demonstrated thatinterspecific hybridization occurs in nature among some taxa of Lesquerella. This indicated thatcontrolled crossing among selected species many permit transfer of desirable genes and result ingenetic recombinations that may be amenable to breeding and selection. However, a sporophyticmultiple allele incompatibility system was found to be operative in lesquerella, which may placeconstraints on transfer of genetic factors (Rollins and Shaw, 1973; Rollins and Solbrig, 1973;Sampson, 1958). Several putative male sterile plants of L. fendleri have been observed.
The chemical composition of lesquerolic acid in lesquerella seed oil is very similar to that of ricinoleicacid in castor oil, and is seen as a viable replacement for imported castor oil. Because the carbonchain length of lesquerolic acid is longer than that of ricinoleic acid (C20 vs C18), the possibilityexists that lesquerella oil may also prove to be more useful than castor oil in the formulation of newindustrial products. About 95% of lipstick is currently being made from castor oil and part of this canbe readily replaced with lesquerella oil. Research indicates that when lesquerella seed oil containinglesquerolic acid is polymerized to form polyesters or polyurethanes in the presence of polystyrene, a

197
new class of tough plastics (interpenetrating polymer networks) is formed (Sperling and Manson,1983). The two other types of hydroxy fatty acids, auricolic and densipolic acid, found in variouslesquerella species, may also prove to be valuable industrial feedstocks for the development of new,unique products.
As with other members of the Brassica family, glucosinolates are present in lesquerella seed meals,but none were found that give rise to goitrogenic substances (Daxenbichler et al., 1962). Seed mealsresemble those of other Brassicaceae such as rapeseed and crambe. Lysine contents were found to besignificantly higher than those of 41 other species of Brassicaceae, which suggest that they may serveas good protein supplements for feed grains (Miller et al., 1962). A specific glucosinolate(methylsulfinylpropyl isothiocyanate) found in L. flendleri, L. gordonii, and other species is believedto have anti-cancerous tumor activity, and is currently under investigation at the University ofMinnesota (Dr. L. W. Wattenberg, personal communication).
One species native to the arid Southwest, L. fendleri, is considered to be the prime candidate fordomestication (Gentry and Barclay, 1962). This species is a perennial grown as a winter annual atelevations between 600 and 1800 meters in areas of annual precipitation ranging from 250 to 400mm. Germplasm evaluations by Thompson (1988) and Dierig et al. (1995) have confirmed theprediction of Gentry and Barclay (1962) that L. fendleri contains the best germplasm for developmentof a new industrial oilseed crop. Fortunately, germination of seeds of L. fendleri appears not to behampered by dormancy as has been found with other species (Bass et al., 1956; Sharir and Gelmond,1971). A breeding and selection program and initial agronomic research was initiated by USDA-ARS in 1984 in Arizona (Thompson and Dierig, 1994). Thompson and Dierig (1988) and Thompsonet al (1989) reported on the yield potential of L. fendleri, preliminary results on the effects of plantpopulation, and water usage. Plant populations of around 1 million/ha appear to be optimal.Seasonal water use of about 640 mm has been found to produce good yields of 1700 kg/ha of seed,30% oil, and 50% of lesquerolic acid. Lesquerella can be produced in a cropping system very similarto wheat or other small grains grown as a winter crop in areas such as central Arizona (Thompson,1988). Harvest of lesquerella has been successfully accomplished with a standard combine equippedwith small-sized screens (Dierig et al, 1993).
Vernonia
Vernolic acid was first discovered in seed oil of Vernonia anthelminitica by Gunstone (1954). Thisspecies also was identified in the USDA-ARS plant screening program at NCAUR, Peoria, IL, whereoil contents of 26.5% were determined (Earle et al., 1960), and the presence of vernolic acid in theamount of 67% was identified (Smith et al., 1959). Substantial research was conducted to developthis plant into a new crop source of epoxy fatty acids used as industrial feedstocks for the coatingsand plastic industries (Princen, 1979, 1982, 1983; Princen and Rothfus, 1984). However, there weremajor constraints to the domestication of this species that forced termination of the research effort.
Vernonia belongs to the Asteraceae (Compositae) family. There are about 1,000 species in theVernonia genus (Jones, 1977). Plant exploration and collections were attempted in 1966-67 by Smith(1971) for other potential Vernonia sp. in Ethiopia, Kenya, Uganda, Tanzania, and South Africa.

198
Prior to this exploration, collections of V. galamensis (formerly known as V. pauciflora) were madein Ethiopia by Perdue while on another mission in 1964 (Perdue et al., 1986, and Gilbert, 1986).Seeds of this new germplasm contained 42% oil and 73% vernolic acid, which is considerably higherthan V. anthelmintica.
The important discovery of this germplasm led to a revived interest in the domestication of vernoniaas a source of epoxy fatty acids. Additional germplasm has been collected from Malawi, Ghana,Nigeria, and Kenya. Six subspecies are taxonomically recognized, with one containing four distinctbotanical varieties (Gilbert, 1986; Jeffrey, 1988). Currently, there are 33 accessions of the taxaavailable for crop improvement. In 1989, USDA-ARS initiated a major germplasm developmentprogram at the U.S. Water Conservation laboratory. Available accessions of V. galamensis werecharacterized in regard to seed oil content, fatty acid composition, seed weights, and chromosomenumbers (Thompson et al., 1994a) Germplasm also was grown at other locations in Texas, Louisiana,Arizona, Virginia, Oregon, and Iowa, to determine the extent of variation under differentenvironmental and geographic conditions (Thompson et al., 1994b).
Vernonia can be grown in most areas of the U.S. only in warm seasons, since it is frost sensitive. Thegermplasm being evaluated flowered only under short day (cool season) conditions, except in oneaccession, V. galamensis ssp. galamensis var. petitiana. This accession flowered under anyphotoperiod condition (Phatak et al., 1989). Unfortunately, our evaluations demonstrated that thisvariety lacked important agronomic characters present in other subspecies and varieties.
To overcome day-length restrictions, a hybridization program to recombine day-neutral floweringwith the other desirable growth characteristic was attempted. Thompson et al. (1994c) outlined thesuccessful progress of these crosses. The main emphasis of the present breeding program at USWCLis to further develop yield characteristics of these day-neutral hybrids. Other plant characteristicsbeing investigated include autofertility, non-dormant seed germination, seed retention, and increaseduniformity of seed maturity (Dierig and Thompson, 1993). Lipase activity in the seed, capable ofhydrolyzing the triglyceride, is also an industry concern (Ayorinde et al., 1993).
Interest also has been revived in vernonia utilization research (Afolabi et al., 1989; Ayorinde et al.,1988, 1989; Carlson et al., 1981; Carlson and Chang, 1985). A pilot plant for extraction of seed oilproduced in Zimbabwe has been completed (K. D. Carlson, personal communication), which willprovide both oil and meal for further research and evaluation by industry. The low viscosity ofvernonia oil may permit it to be used as a solvent or additive to alkyd-resin paints with theexpectation that emissions of volatile organic compounds (VOC) will be greatly reduced. VOCsreact with nitrogen oxides in the presence of sunlight to crate ground-level ozone, a deleteriouscomponent of smog. The more promising uses of vernonia oil for industrial products are bakedcoatings on metal panels (Carlson et al., 1981), and the synthesis of dibasic acids and interpenetratingpolymer networks (Afolabi et al., 1989; Ayorinde et al., 1988, 1989).
APPROACH AND RESEARCH PROCEDURES
The evaluation and development of new-crop germplasm that leads to useful agronomic cultivars

199
with concurrent development of appropriate crop production practices are long-term researchactivities. Timetables are difficult to construct and frequently inaccurate or misleading even with themost conservative estimates of the problem. Progress toward achieving the objectives will beconstantly reviewed and changes made as necessary to maximize efficient use of personnel andresources.
Objective 1 - Acquire and characterize germplasm of guayule, lesquerella, vernonia, and otherpromising new/alternative crops.
Experimental Design
The success of this breeding program is based on a diverse, well characterized germplasm base.Once this diversity is established, necessary breeding strategies will be implemented to furtherdevelop and improve the specific crop. The Germplasm Resources Information System (GRIN)database of the National Plant Germplasm System (NPGS) will be used as a source to identifypotential plant diversity. However, in many cases, the available species accessions found in theNPGS do not adequately represent the amount of genetic diversity available in nature. In these cases,new seed collections will be acquired, evaluated, and enhanced. An extensive database has beenestablished for Lesquerella and Physaria species, which includes extensive locality information frommany U.S. herbaria. This database now has over 1400 different entries for collection use.
The goal of our germplasm collections is to obtain genetically diverse plant populations of thepotential crop. Related species will also be utilized in crop development and will also need to becollected. Seed will be increased following collection from native areas. Some initial evaluationinformation will be obtained from original native population sites, and when the seed is increased.Additional evaluation information will be obtained from replicated yield trials when adequateplanting seed becomes available. Another important aspect of this objective will be to incorporatethese new acquisitions into NPGS. Once accessions are evaluated and characterized, the desiredtraits will be exploited through breeding strategies.
Contingencies
The successful completion of this object will depend on the continued support by outside funding forcollection trips and evaluation and seed increase of germplasm collected. Funding levels willdetermine whether all three crops can be studied or if studies will be limited to areas that are the mostpromising. Adequate student and technical help is critical to successful completion of this objective.
Collaborations
Collections and evaluation are coordinated with the Plant Germplasm Introduction and TestingResearch Unit, Pullman WA; Regional Plant Introduction Station, Ames IA; and National SeedStorage Laboratory, Fort Collins CO.
Objective 2 - Evaluate and Enhance Germplasm of New Crops for Industrial Raw Materials.

200
Experimental Design
Standard breeding techniques will be used to develop improved germplasm of each potential newcrop. Depending on the floral structure and biology of the crop, different breeding strategies areemployed for cop development. Some of these strategies include: (1) improvement of germplasmby half-sib family recurrent selections in open-pollinated populations; (2) incorporation of specifictraits, such as day-neutral flowering, from donor plants through backcross breeding; (3) developmentof lines with natural or chemically inducted mutations for altered seed-oil fatty acid profiles; (4)development of lines through mass, family or single plant selection, as appropriate or wide crossesthrough intra- and interspecific hybridization to obtain desired recombinations. Lines or cultivarswill then evaluated in yield trials at single or multiple locations.
The U.S. Water Conservation Laboratory (USWCL) is equipped to participate in various types ofscreening and evaluations needed for conducting a breeding program. Seeds can be non-destructivelyanalyzed for oil content by NMR and fatty acid profiles by GC. Assays will be developed for rapidscreening for amounts of glucosinolates and seed-coat gums. Work has been done on seedconditioning. Light and dissecting microscopy is routinely performed for cyrological and floralbiology information. Haploid production through anther culture or microsporogenesis will beattempted for mutation breeding and generating homozygotes for various genetic studies. Isozymemarkers have been identified for various crops and will continue to be used as co-dominant geneticmarkers. Our laboratory is also equipped for DNA marker analyses, such as RAPD’s, utilizingPolymerase Chain Reaction (PCR) techniques.
Contingencies
Successful completion of this objective will depend on being able to achieve the desired crossesbetween divergent parents within and between species. Funding levels will determine whether allthree crops can be studied or if studies will be limited to areas that are the most promising. Adequatestudent and technical help is critical to successful completion of this objective.
Collaborations
Analyses of other seed oil constituents are at times sent to ARS, USDA, National Center forAgricultural Utilization Research (NCAUR), Peoria IL. We also collaborate with the University ofArizona and the ARS, USDA, Western Regional Research Lab, Albany CA to develop methods toanalyze latex, rubber, and resin content of single guayule plants. Collaborations also exist with theNational Forest Products Lab, University of Illinois, The University of Arizona, and others indeveloping uses for guayule bagasse following latex extraction.
Objective 3 - Develop knowledge of floral biology/seed Production and Plant Responses toStresses
Experimental Design

201
In order to make hybrids and develop enhanced germplasm, basic knowledge of floral biology suchas time of anthesis, degree of autofertility, sterility, day length requirements, seed retention traits, andterminal flowering habits will be developed. Basic studies utilizing accepted and new methodologiesand experimental procedures will be used to determine: (1) the amount of autofertility present in thelesquerella germplasm collection; (2) the types and of causes of male sterility, including cytoplasmic,in lesquerella; (3) the day length flowering requirements in the vernonia germplasm collection andhybrid populations; (4) the seed retention traits of guayule, lesquerella, and vernonia; (5) therelationship between head size and yield of vernonia; and (6) the development of terminal floweringhabits in vernonia for uniform maturity at harvest.
Successful production of new crops also required knowledge of the crop’s response to stress. Whilethe effects of water stress on guayule for rubber production have been determined, similar studies willbe conducted to determine the effects on latex production, and seed production in lesquerella andvernonia. Susceptibility to insects and diseases will be evaluated as the need arises utilizing acceptedprocedures or modifications as necessary. Since guayule and lesquerella are proposed for productionin semiarid regions, water requirements and related management studies will be conducted.
Contingencies
Funding levels will determine whether all three crops can be studied or if studies will be limited toareas that are the most promising. Adequate student and technical help is critical to successfulcompletion of this objective.
Collaborations
Cooperative work with the Irrigation and Water Quality group at USWCL, the Remote Sensing unitof the Environmental and Plant Dynamics group, and The University of Arizona will be needed toaccomplish this objective.
Objective 4 - Develop Economical Cultural Practices and Production Systems for New Cropsunder Various Environmental and Management Conditions
Experimental Design
For new crops to become successful, economical cultural practices and production systems must beadequately defined and established. Similarly for the breeding program to be successful thesepractices and systems must also be specified so that the desired traits can be selected and incorporatedinto advanced lines. Production practices for solid rubber production for guayule have beendeveloped. However, the effects of these practices on latex production are unknown.
Therefore, tests will be conducted to compare the advantages and disadvantages of direct seedingversus transplants. If transplants are found to be the more desirable practice, the newest fieldtransplanting techniques developed for other crops will be adapted. Concurrently, studies with

202
multiple germplasm lines will be conducted to determine the effects of stem size, time of harvest, andfrequency of harvest on latex content. Appropriate field designs and statistical analyses will be usedin all experiments. Basic tests will also be conducted to develop production systems for lesquerellaand vernonia. Information needed includes fertility levels, optimum plants populations, weed andpest control methods, and planting and harvesting methods. Information developed from thesestudies will be utilized in the breeding program when selecting parents for developing newpopulations.
Contingencies
Funding levels will determine whether all three crops can be studied or if studies will be limited toareas that are the most promising. Adequate student and technical help is critical to successfulcompletion of this objective.
Collaborations
Cooperative work with the Irrigation and Water Quality group at USWCL, the Remote Sensing unitof the Environmental and Plant Dynamics group, and The University of Arizona will be needed toaccomplish this objective.
Objective 5 - Develop Methods for Efficient Guayule Latex Extraction and /Seed Oil Analysis forCharacterizing Latex and Oil Properties
Experimental Design
The development of new crops requires specific extraction and analytical procedures that are notpresently available. In addition, the germplasm improvement program will need a vast number ofsamples to be analyzed and processed rapidly in time for selection and preparation for the nextplanting cycle. Areas that will need special attention will be sample preparation prior to analysis andautomation of the analysis and data reduction. New developments in instrumentation also will beincorporated into the analytical scheme.
A reliable procedure for extracting latex from the guayule shrub is not available at present. Thus,several methods for obtaining latex only will be investigated. The primary procedure being used atpresent is a water-based process where the shrub is ground with a mixture of antioxidant, resinabsorber, and water. The crude latex will be initially cleaned of other plant residue by centrifugation,and the resultant latex will be used for various types of physical and chemical property testing.Preliminary results indicate that the latex must be further purified to remove more of the resinmaterial. The resin material will be analyzed and characterized. Several possible routes to attainacceptable latex purity will be followed. These include solid phase extraction and selective solventextraction techniques. All the steps taken from shrub preparation, extraction, and purification of thelatex will be carefully evaluated for achieving maximum yields. Latex preparation also will becoordinated with cultural practices, such as time of harvest and methods of shrub storage, in orderto maximize latex production.

203
Contingencies
Funding levels will determine whether studies will be limited to areas that are the most promising orif other possible areas can also be investigated. Adequate student and technical help is critical tosuccessful completion of this objective.
Collaborations
We will collaborate with The University of Arizona and the ARS, USDA, Western RegionalResearch Lab, Albany CA to develop methods to analyze latex, rubber, and resin content of guayuleplants. Collaborations also exist with the National Forest Products Lab, University of Illinois, TheUniversity of Arizona, and others in developing uses for guayule bagasse following latex extraction.

204
Milestones and Expected OutcomesThis project is scheduled for formal review in 2002, thus only three year milestones and expected outcomes are listed.
Date Objective 1 Objective 2 Objective 3 Objective 4 Objective 5
January2002
New lesquerella germplasmfrom Mexico will be obtainedand seed increased
Guayule germplasmlines will be evaluatedfor latex and growth
Environmentaleffects on guayulewill be determined
New studies on water usefor guayule will bestarted
Effects of differentsurfactants on latexextraction will beestablished
January2003
New lesquerella germplasmfrom the US and Mexico willbe obtained, evaluated, andseed increased for GRINsystem
New lesquerellagermplasm lines will bereleased with higher oilyields
Production systemguidelines forlesquerella will bereleased to growers
Harvesting guidelines forlesquerella will bedeveloped and madeavailable to growers
New products forlesquerella oil will bedeveloped and testedin cooperation with acommercial partner
January2004
New vernonia germplasm willbe released
New higher yieldingand faster growingguayule germplasmlines will be released
Production systemguidelines forguayule will bereleased to growers
Production systemguidelines for guayulewill be developed andmade available togrowers
New products fromguayule bagasse willbe developed incooperation withindustry

205
LITERATURE CITED
Afolabi, O.A., M.E. Aluko, W.A. Anderson, and P.O. Ayorinde. 1989. Synthesis of a toughenedelastomer from Vernonia galamensis seed oil. J. Am. Oil Chem. Soc. 66:983-985.
Allan, S.G., and F.S. Nakayama. 1988. Relationship between crop water stress, water potential,conductance, transpiration, and photosynthesis. Field Crops Res. 18:287-296.
Ayorinde, F.O., C.P. Nwaonicha, V.N., Parchment, D.A. Bryant, M. Hassan, and M.T. Clayton.1993. Enzymatic synthesis and spectroscopic characterization of 1,3-divernoloyl glycerol fromVernonia galamensis seed oil. J. Am Oil Chem. Soc. 70:129-134.
Ayorinde, F.O., G. Osman, R.L. Shepard, and F.T. Powers. 1989. Synthesis of azelaic acid andsuberic acid from Vernonia galamensis oil. J. Am. Oil Chem. Soc. 65:1774-1777.
Ayorinde, F.O., F.T. Powers, L.D. Streele, R.L. Shepard, and D.N. Tabir, 1989. Synthesis ofdodecanedioic acid from Vernonia galamensis oil. J. Am. Oil Chem. Soc. 66:690-692.
Backhaus, R.A., R.R. Higgins, and D.A. Dierig. 1989. Photoperiodic induction of flowering inguayule. HortScience 21(6):939-941.
Backhaus, R.A., and F.S. Nakayama. 1988. Variation in the molecular weight distribution of rubberfrom cultivated guayule. Rubber Chem. and Tech. 61:78-85.
Barclay, A.S. M.S. Gentry, and Q. Jones. 1962. The search for new industrial crops II: Lesquerella(Cruciferae) as a source of new oilseeds. Econ. Bot. 16:95-100.
Bass, L.H., D.C. Clark, and R.L. Sayers. 1966. Germination experiments with seed of Lesquerellaspecies. Proc. & Assoc. Official Seed Analysis 56:148-153.
Benitez, A.L. and S. Kuruvadi. 1985. Variation in yield components and correlation in guayule.El. Guayulero 7(1&2):19-23.
Black, L.T., G.E. Humerstrand, F.S. Nakayama, and B.A. Rasnick. 1983. Gravimetric analysis fordetermining the resin and rubber content of guayule. Rubber Chem. and Tech. 56(2):367-371.
Bucks, D.A., F.S. Nakayama, O.F. French, W.W. Legard, and W.L. Alexander. 1985b. Irrigatedguayule-evapotranspiration and plant water stress. Agric. Water Mgmt. 10:61-79.
Bucks, D.A., F.S. Nakayama. O.F.French, W.W. Legard, and W.L. Alexander. 1985c. Irrigatedguayule - production and water use relationships. Agric. Water Mgmt. 10:95-102.
Bucks, D.A., F.S. Nakayama, O.F. French, B.A. Rasnick, and W.L. Alexander. 1985d. Irrigated

206
guayule - plant growth and production. Agric. Water Mgmt. 10:81-93.
Bucks, D.A., R.L. Roth, F.S. Nakayama, and B.R. Gardner. 1985a. Irrigation water, nitrogen andbioregulation for guayule production. Trans. ASAE 28(4):1196-1205.
Bultman, J.D., R.L. Gilbertson, J. Adaskaveg, T.L. Amburgey, S.V. Parikh, and C.A. Bailey. 1991.Efficacy of guayule resin as a pesticide. Bioresource Technol. 35:197-201.
Carlson, K.D. and S.P. Chang. 1985. Chemical apoxidation of a natural unsaturated epoxy seed oilfrom Vernonia galamensis and a look at epoxy oil markets. J. Am. Oil Chem. Soc. 63:934-939.
Carlson, K.D., W.D. Schneider, S.P. Chang, and L.H. Princen. 1981. Vernonia galamensis seed oil:a new source for epoxy coatings. Am. Oil. Chem. Soc. Monograph: 297-318.
Cornish, K. 1995. Hypoallergenic Natural Rubber Products from Parthenium argentatum (Gray)and other non-Hevea brasillesia species. U.S. Patent Office 8:423,911.
Daxenbichler, M.R., C.H. van Etten, H. Zobel, and I.A. Wolff. 1962. Isothiocyanates fromenzymatic hydrolysis of Lesquerella seed meals. J. Am. Oil Chem. Soc. 19:244-245.
Dierig, D.A., and R.A. Backhaus. 1990. Effect of morphactin and (DCPTA) on stem growth andbioinduction of rubber in guayule. HortScience 25(5):531-533.
Dierig, D.A., D.T. Ray, and A.E. Thompson. 1989a. Variation of agronomic characters among andbetween guayule lines. Euphytica. 44:265-271.
Dierig, D.A. and A.E. Thompson. 1993. Vernonia and lesquerella potential for commercialization.In J. Janick and J.R. Simon. (Eds.). New Crops. John Wiley and Sons, Inc. New York, NY. pp.361-367.
Dierig, D.A., A.E. Thompson, and F.S. Nakayama. 1993. Lesquerella commercialization effortsin the United States. Indus. Crops and Products, 1:289-293.
Dierig, D.A., A.E. Thompson, and D.T. Ray. 1989b. Relationship of morphological variables torubber production in guayule. Euphytica. 44:259-264.
Dierig, D.A., A.E. Thompson, and D.T. Ray. 1991. Effects of field storage on guayule rubberquantity and quality. Rubber Chem. and Tech. 64(2):211-217.
Dierig, D.A., A.E. Thompson, and D.T. Ray. 1992. Yield evaluation of new Arizona guayuleselections. In A.E. Estilai, J., P. Ting, and H.H. Naqvi (eds.). New Industrial Crops and Products.Office of Arid Land Studies, University of Arizona, Tucson AZ. pp. 83-87.

207
Dierig, D.A., A.E. Thompson, J.P. Rebman, R. Kleiman, and B.S. Phillips. 1996. Collection andevaluation of new Lesquerella and Physaria germplasms. Indus. Crops and Prods. 5:53-63.
Earle, F.R., I.A. Wolff, and Q. Jones. 1960. Search for new industrial oils. III. Oils fromCompositae. J. Am. Oil Chem. Soc. 37:254-256.
Ehrler, W.L., D.A. Bucks, and F.S. Nakayama. 1985. Relations among relative leaf water content,growth, and rubber accumulation in guayule. Crop Sci. 25:779-782.
Estilai, A., B. Ehdaie, H.N. Naqvi, D.A. Dierig, D.T. Ray, and A.E. Thmpson. 1992. Correlationsand path analyses of agronomic traits in guayule. Crop Sci. 32:953-957.
Estilai, A., A. Hashemi, and J.B. Waines. 1990. Isozyme markers for cultivar identification inguayule. HortScience 25:346-348.
Estilai, A. and D.T. Ray, 1991. Genetics, cytogenetics and breeding of guayule. In J.W. Whitworthand E.E. Whitehead (eds.). Guayule Natural Rubber. Office of Arid Land Studies, Tucson, AZ. pp.47-91.
European Rubber Journal and Rubber Consultants. 1993. Latex Protein Allergy: The PresentPosition. Crain Communications Ltd. Hertford, United Kingdom.
Gentry, N.S. and A.S. Barclay. 1962. The search for new industrial crops III: Prospectus ofLesquerella fendleri. Econ. Bot. 16:206-211.
Gilbert, M.G. 1986. Notes on Best African Vernonicae (Compositae). A revision of the Vernoniagalamensis complex. Kew Bul. 41:19-35.
Gunstone, F.D. 1954. Fatty acids, Part II. The nature of the oxygenated acids present in Vernoniaanthelmintica (Willd). Seed oil. J. Chem Soc. May:1611-1616.
Hammond, B.L. and L.G. Polhamus. 1965. Research on guayule (Parthenium argentatum): 1942-1959. U.S. Dept. Agr. Tech. Bul. 1327. 157 pp.
Hinman, C.W. 1984. New crops for arid lands. Science 225:1445-1448.
Hinman, C.W. 1986. Potential new crops. Sci. Am. 255:32-37.
Jeffrey, C. 1988. The Vernonieae in east tropical Africa. Notes on Compositae: V. Kew Bul.43:195-277.
Jones, E.P. 1948. Recovery of rubber latex from guayule shrub. Indus. Engin. Chem. 40:864-874.

208
Jones, S.B. 1977. Veronieae - systematic review. In V.H. Heywood, J.B. Harborne, and B.L. Turner(Eds.) The Biology and Chemistry of the Compositae. Academic Press. NY pp. 503-522.
Miller, R.W., C.H. van Etten, and I.A. Wolff. 1962. Amino acid composition of lesquerella seedmeals. J. Am. Oil. Chem. Soc. 39:115-117.
Nakayama, F.S. 1984. Hydrocarbon emissions and carbon balance of guayule. J. Arid Environ.7:353-357.
Nakayama, F.S. 1990. Application of neutron soil surface monitoring for plant establishment. InProc. of 1990 Nat. Conf. ASCE, Durango CO, 11-13 July 1990. pp. 210-214.
Nakayama, F.S. 1991. Influence of environmental and management practices on rubber quality.In J. W. Whitworth and E.E. Whitehead (Eds.). Guayule Natural Rubber. pp. 217-240. Office ofArid Land Studies, Tucson AZ.
Nakayama, F.S. 1992. Guayule as an alternate source of natural rubber. In: M.R. Mathew, N.M.Sethuraj (Eds.) Natural Rubber: Biology, Cultivation and Technology. Elsevier NY pp. 568-596.
Nakayama, F.S. and D. A. Bucks. 1984. Crop water stress index, soil water, and rubber yieldrelations for the guayule plant. Agron. J. 76:791-794.
Nakayama, F.S., D.A. Bucks, C.L. Gonzalez, and J.M. Foster. 1991a. Water and nutrientrequirement of guayule under irrigated and dryland production,. In J.W. Whitworth and E.E.Whitehead (Eds.). Guayule Natural Rubber. pp. 802-813. Office of Arid Land Studies, Tucson AZ.
Nakayama, F.S., D.A. Bucks, R.L. Roth, and B.R. Gardner. 1991b. Guayule biomass productionunder irrigation. Bioresource Technol. 35:173-178.
Nakayama, F.S. and W. Coates. 1996. Storage effects on rubber content of laboratory- and field-prepared guayule shrub. pp. 243-246. In L.H. Princen and C. Rossi, eds. Proc. Third InternationalConf. On New Industrial Crops and Products.
Nakayama, F.S., W.W. Schloman, Jr., and S.F. Thames. 1992. Guayule has real rubber in it, andit grows in the United States. New Crops, New Uses, New Markets, 1992 Yearbook of Agriculture.pp. 98-105.
Naqvi, H.H. 1985. Variability in rubber content among USDA guayule lines. Bul. Torrey Bot.Club 112:196-198.
Perdue, R.E., Jr., K.D. Carlson, and M.G. Gilbert. 1986. Vernonia galamensis, potential new cropsource of epoxy acid. Econ. Bot. 40:54-68.

209
Phatak, S.C., A.E. Thompson, C.A. Jaworski, and D.A. Dierig. 1989. Response of Vernoniagalamensis to photoperiod. Abstrs. First Ann. Conf. Assoc. Advanc. Indus. Crops. October 2-6,1989. Peoria IL.
Princen, L.H. 1979. New crop developments for industrial oils. J. Am. Oil Chem. Soc. 56:845-848.
Princen, L.H. 1982. Alternative industrial feedstocks from agriculture. Econ. Bot. 36:302-312.
Princen, L.H. 1983. New oilseed crops on the horizon. Econ. Bot. 37:478-492.
Princen, L.H. and J.A. Rothfus. 1984. Development of new crops for industrial raw materials. J.Am. Oil Chem. Soc. 61:281-289.
Radin, D.N., M.M. Behl, P. Proksch, and E. Rodriquez. 1982. Rubber and other hydrocarbonsproduced in tissue cultures of guayule (Parthenium argentatum). Plant Sci. Letters 26:301-310.
Radin, D.N., R.A. Norton, and E. Rodriquez. 1985. Cloning guayule plant selections via tissueculture. In D.D. Fangmeier and S.M. Alcorn (Eds.). Fourth Intern. Conf. on Guayule Res. andDevelop. Program and Abstracts. Oct. 16-19, 1985. Tucson AZ. p. 3.
Ray, D.T. 1983. Preliminary report of the first guayule uniform regional variety trials (1982-1985).El Cuayulero 7(3&4):10-27.
Ray, D.T. 1989. The second guayule uniform regional yield trials. El Guayulero. 11 (3&4):46-54.
Ray, D.T., D.A. Dierig, and A.E. Thompson. 1990. Facultative apomixis in guayule as a source ofgenetic diversity. In J. Janick and J.E. Simon (Eds.). Advances in New Crops. Timber Press,Portland OR. pp. 245-247.
Ray, D.T., D.A. Dierig, A.E. Thompson, and M.M. Diallo. 1993. Parent-offspring relationships inapomictic guayule. J. Am. Oil Chemists 70:1235-1237.
Ray, D.T., A.E. Thompson, and D.A. Dierig, 1992. Variability for yield components amongapomictic guayule lines developed from a very narrow germplasm base. Indus. Crops and Products.
Roetheli, J.C., K.D. Carlson, R. Kleiman, A.E. Thompson, D.A. Dierig, L.K. Glaser, M.G. Blase, andJ. Ginshell. 1992. An assessment lesquerella as a source of hydroxy fatty acids for industrialproducts. U. S. Dept of Agriculture, Cooperative State Research Service, Office of AgriculturalMaterials. Growing Industrial Material Series. 46 p.
Rollins, R.C. and B.A. Shaw. 1973. The genus Lesquerella (Cruciferae) in North America. HarvardUniv. Press. Cambridge MA.

210
Rollins, R.C. and O.T. Solbrig. 1973. Interspecific hybridization in Lesquerella. Contribution GrayHerb. No. 203:3-48.
Ronis, D.H., A.E. Thompson, D.A. Dierig, and E.R. Johnson. 1990. Isozyme verification ofinterspecific hybrids of Cuphea. HortScience 25:1431-1434.
Sampson, D.R. 1958. The genetics of self-incompatibility in Lesquerella densipila and in the F1hybrid L. desipila x L. lescuri. Canadian J. Bot. 36:39-56.
Schloman, W.W., Jr. and A.S. Hilton. 1991. Allelopathic response of vegetables to guayule residue.Bioresource Technol. 35:191-196.
Senft, D. 1988. Homegrown lubricants and plastics. Agr. Res. 36:8-9.
Sharir, A. and H. Gelmond. 1971. Germination studies of Lesquerella fenleri and L. gordonii withreference to their cultivation. Econ. Bot. 25:55-59.
Silex, D.J. and K. Cornish. 1994. Hypoallergenicity of guayule rubber particle proteins comparedto Hevea latex proteins. Indus. Crops and Products 2:307-313.
Smith, C.E., Jr. 1971. Observations on Stengeloid species of Vernonia. Agric. Handbook No. 396.USDA, ARS. Washington, D.C.
Smith, C.E., Jr., K.F. Koch, and L.A. Wolff. 1959. Isolation of vernolic acid from Vernoniaanthelmintica oil. J. Am. Oil Chem. Soc. 36:219-200.
Sperling, L.H. and J.A. Manson. 1983. Interpenetrating polymer networks from triglyceride oilscontaining special functional groups: a brief review. J. Am. Oil Chem. Soc. 60:1887-1892.
Thames, S.F. and K. Kaleem. 1991. Guayule resin in amino-epoxy strippable coatings, BioresourceTechnol. 35:185-190.
Thompson, A.E. 1985. New native crops for the arid Southwest. Econ. Bot. 39:436-453.
Thompson, A.E. 1988. Lesquerella - a potential new crop for arid lands. In C.F, Hutchinson, B.N.Timmerman, R.D. Varady and E.E. Whitehead (Eds.) Arid Lands: Today and Tomorrow. WestviewPress, Boulder CO. pp. 1311-1320.
Thompson, A.E. 1989. Alternative crop opportunities and constraints on development efforts. InL. L. Hardman and I. Waters (Eds.). Symposium Proc. on Strategies of Alternative CropDevelopment: Case Histories, November 29, 1988, Anaheim CA. Center for Alternative Crops andProducts. Univ. Minnesota, St. Paul MN. pp. 1-9.

211
Thompson, A.E. 1990. Arid-land industrial crops. In J. Janick, J.E. Simon, and H.L. Shands (Eds.).Advances in New Crops. Timber Press, Portland OR. pp. 101-103.
Thompson, A.E. and D.A. Dierig. 1988. Lesquerella - a new arid land industrial oil seed crop. ElGuayulero. 19(1&2):16-18.
Thompson, A.E. and D.A. Dierig. 1994. Initial selection and breeding of Lesquerella fendleri, a newindustrial oilseed. Indus. Crops and Products. 2:97-106.
Thompson, A.E., D.A. Dierig, and E.R. Johnson.1989. Yield potential of Lesquerella fendleri (Gray)Wats., new desert plant resource for hydroxy fatty acids. J. Arid Environ. 16:331-336.
Thompson, A.E., D.A. Dierig, E.R. Johnson, G.H. Dahlquist, and R. Kleiman. 1994c. Germplasmdevelopment of Vernonia galamensis as a new industrial oilseed crop. Indus. Crops and Products3:185-200.
Thompson, A.E., D.A. Dierig, and R. Kleiman. 1994a. Characterization of Vernonia galamensisgermplasm for seed oil content, fatty acid composition, seed weight, and chromosome number.Indus. Crops and Products 2:299-305.
Thompson, A.E, D.A. Dierig, and R. Kleiman. 1994b. Variation in vernonia galamensis floweringcharacteristics, seed oil and vernolic acid contents. Indus. Crops and Products. 3:175-183.
Thompson, A.E., D.A. Dierig, S.J. Knapp, and R. Kleiman. 1990a. Variaton in fatty acid content andseed weight in some lauric acid rich Cuphea species. J. Am. Oil Chem. Soc. 67(10):611-617.
Thompson, A.E., D.A. Dierig, and D.T. Ray. 1990b. Estimated yield performance of new Arizonaguayule selections. El Gayulero. 12(1&2):12-20.
Thompson, A.E., D.A. Dierig, and G.A. White. 1992. Use of plant introductions to develop newindustrial crop cultivars. In: H.L. Weiser and L.E. Shands (Eds.) Use of Plant Introductions inCultivar Development, Crop Science Soc. America, Special Publications No. 20. pp. 9-48.
Thompson, A.E. and F.S. Nakayama. 1993. Commercializing industrial crops: The industrialcomponent. In J. Janick and J. E. Simon. (Eds.). New Crops. John Wiley and Sons, Inc. New York,NY. pp. 674, 688, 690, and 691.
Thompson, A.E. and D.T. Ray. 1988. Breeding guayule. Plant Breeding Rev. 6:93-165.
Thompson, A.E., D.T. Ray, M. Livingston, and D.A. Dierig. 1988. Variability of rubber productionand plant growth characteristics among single plant selections from a diverse guayule breedingpopulation. J. Am Soc. Hort. Sci. 113(4):608-611.

212
Whitworth, J.W. and E.E. Whitehead (Eds.). 1991. Guayule Natural Rubber. USDA CooperativeState Research Service. Office of Arid Lands Studies. The University of Arizona, Tucson AZ. 445pp.
Winkler, D.S. and H.L. Stephens. 1978. Plastification effect of guayule resin in raw rubber. In E.Campos-Lopez, and W. G. McGinnies (Eds.). Guayule: Encunertro en al Desierto. Publ. 371.CIAQ, Saltillo, Coachuila, Mexico. pp. 303-314.


213
2001 PUBLICATIOINS
Adam, N. R., C. E. Owensby, and J. M. Ham. 2000. The effect of CO2 enrichment ofphotosynthetic rates and instantaneous water use efficiency of Andropogon gerardii in thetallgrass prairie. Photosynthesis Research 65:121-129. WCL# 2212.
Adam, N. R. and G. W. Wall. 2001. Multi-purpose cryogenic surface apparatus: A liquidnitrogen-chilled sample tray. Crop Sci. 41(3):755-758. WCL# 2088.
Adamsen, F. J. Changes in the chemistry of a mid-atlantic coastal plain soil resulting fromirrigation with sodic water. Soil Sci. Soc. Am. J. (Approved) WCL# 1980.
Adamsen, F. J. and D. J. Hunsaker. 2000. Water content determination in saline soils using self-contained TDR and electrical capacitance systems. p. 351-356. In 4th Decennial NationalIrrigation Symposium, November 14-16, 2000, Phoenix AZ. WCL# 2231.
Adamsen, F. J., D. J. Hunsaker, E. M. Barnes, A. J. Clemmens, and E. Bautista. 2001. Surfaceirrigation and precision crop management. p. CD-ROM, unpaginated. In 5th Proc. InternationalConference on Precision Agriculture, Bloomington MN. July 16-19, 2000. WCL# 2267.
Adamsen, F. J., P. J. Pinter Jr., E. M. Barnes, G. W. Wall, and B. A. Kimball. 1999. Measuringwheat senescence using a digital camera. Crop Sci. 39:719-724. WCL# 1998.
Barnes, E. M., T. R. Clarke, S. E. Richards, P. D. Colaizzi, J. Haberland, M. Kostrzewski, P.Waller, C. Choi, E. Riley, T. Thompson, R. J. Lascano, H. Li, and M. S. Moran. 2001.Coincident detection of crop water stress, nitrogen status and canopy density using ground-basedmultispectral data. CD ROM, unpaginated.In 5th International Conference on PrecisionAgriculture Abstracts and Proceedings, Bloomington MN, July 16-19, 2000. WCL# 2227.
Barnes, E. M. and D. J. Hunsaker. Irrigation water requirements. In Encyclopedia ofagricultural and food engineering. (Accepted 8-23-2001) WCL# 2276.
Bautista, E., R. S. Gooch, B. T. Wahlin, R. J. Strand, and A. J. Clemmens. 2001. Evaluation ofa canal control method by volume compensation at the Salt River Project, AZ. CD ROM,unpaginated. In XI Congreso Nacional de Irrigation, Guanajuato, MX, September 19-21, 2001.WCL# 2298.
Bhardwaj, H. L., A. A. Hamama, M. Ragappa, and D. A. Dierig. 2001. Vernonia galamensisproduction in mid-atlantic region of USA: results of experiments with genotypes, fertilizer, andhebicides in Virginia. Industrial Crops and Products 12:119-124. WCL# 2214.
Bouwer, H. 2001. Capturing flood waters for artificial recharge of groundwater. p. 99-106. InProc.10th Artificial Recharge Symposium,, Tucson, AZ, June 7-8, 2001. WCL# 2285.
Bouwer, H., J. Ludke, and R. C. Rice. 2001. Sealing pond bottoms with muddy water. Journalof Ecol. Eng. 18(2):233-238. WCL# 2263.

214
Clarke, T. R., M. S. Moran, E. M. Barnes, P. J. Pinter Jr., and J. Qi. 2001. Planar domainindices: a method for measuring a quality of a single component in two-component pixels. p.unpaginated CD-ROM. In IEEE International Geoscience and Remote Sensing SymposiumProceedings (IGARSS 2001) Scanning the Present and Resolving the Future, 9-13 July 2001,Sydney, Australia. WCL# 2284.
Clemmens, A. J., T. S. Strelkoff, and E. Playan. Field verification of two-dimensional surfaceirrigation model. Irrigation and Drainage Engineering. (Accepted 11-17-2000) WCL# 2238.
Clemmens, A. J., T. L. Wahl, M. G. Bos, and J. A. Replogle. 2001. Water measurement withflumes and weirs, Publication #58. 382 pp. International Institute for Land Reclamation andImprovement, Wageningen, The Netherlands. WCL# 2294.
Colaizzi, P. D., E. M. Barnes, T. R. Clarke, C. Y. Choi, and P. M. Waller. Estimating soilmoisture under low frequency irrigation using the CWSI. ASCE J of Irrigation and Drainage.(Accepted 8-15-2001) WCL# 2290.
Colaizzi, P. D., E. M. Barnes, T. R. Clarke, C. Y. Choi, P. M. Waller, J. Haberland, and M.Kostrzewski. Water stress detection under high frequency irrigation with WDI. AmericanSociety of Civil Engineers Journal of Irrigation and Drainage. (Accepted 8-15-2001) WCL#2289.
Conley, M. M., B. A. Kimball, T. J. Brooks, P. J. Pinter Jr., D. J. Hunsaker, G. W. Wall, N. R.Adam, R. L. LaMorte, A. D. Matthias, T. L. Thompson, S. W. Leavitt, M. J. Ottman, A. B.Cousins, and J. M. Triggs. 2001. CO2 enrichment increases water use efficiency in Sorghum. New Phytologist 151(2): 407-412. WCL# 2262.
Cousins, A. B., N. R. Adam, G. W. Wall, B. A. Kimball, P. J. Pinter Jr., S. W. Leavitt, R. L.LaMorte, A. D. Matthias, M. J. Ottman, T. J. Thompson, and A. N. Webber. 2001. Reducedphotorespiration and increased energy-use efficiency in young CO2-enriched sorghum leaves. New Phytologist 150(2):275-284. WCL# 2204.
Dedrick, A. R. 2000. Special issue on the Management Improvement Program. Irrigation andDrainage Systems 14(1&2):1-166. WCL# 2192.
Dierig, D. 1999. Potential of some new industrial southwestern U.S. crops for Mexico. InProceedings Exposicion Internacional De Agroproductos No Tradicionales, Monterrey, NuevoLeon, Mexico, No. 22-24, 1999. (ACCEPTED 12/13/1999) WCL# 2189.
Dierig, D. A., M.C. Shannon, and C.M. Grieve. 2001. Registration of WCL-SL1 salt tolerantlesquerella fendleri germplasm. Crop Science 40:604-605. WCL# 2202.
Dierig, D. A., P.M. Tomasi, and G.H. Dahlquist. 2001. Registration of WCL-LY2 high oillesquerella fendleri germplasm. Crop Science 41:604. WCL# 2203.

215
Dierig, D. A. and D. T. Ray. 2001. Inheritance of male sterility in Lesquerella fendleri (Gray)Wats. American Society for Horticultural Science 126:737-743. WCL# 2272.
Dierig, D. A., D. T. Ray, T. A. Coffelt, F. S. Nakayama, G. Leake, and G. Lorenz. 2001.Heritability of height, width, resin, rubber, and latex in guayule (parthenium argentatum). Industrial Crops and Products 13:229-238. WCL# 2160.
El-Haddad, Z., A. J. Clemmens, M. El-Ansary, and M. Awad. 2001. Influence of culturalpractices on the performance of long level basins in Eygpt. 15(4). (In Press) WCL# 2100.
Ewert, F., D. Rodriguez, P. Jamieson, M. A. Semenov, R. A. C. Mitchell, J. Goudriaan, J. R.Porter, B. A. Kimball, P. J. Pinter Jr., R. Manderscheid, H. J. Weigel, A. Fangmeier, E. Fereres,and F. Villalobos. 2002. Effects of elevated CO2 and drought on wheat: testing crop simulationmodels for different experimental and climatic conditions.. Agriculture, Ecosystems, andEnvironment. (In press) WCL# 2252.
Goodrich, D. C., R. Scott, J. Qi, B. Goff, C. L. Unkrich, M. S. Moran, D. Williams, S. Schaeffer,K. Snyder, R. Macnish, T. Maddock, D. Pool, A. Chehbouni, D. I. Cooper, W. E. Eichinger, W.J. Shuttleworth, Y. Kerr, R. Marsett, and W. Ni. 2000. Seasonal Estimates of RiparianEvapotranspiration Using Remote and in Situ Measurements. Agricultural and ForestMeterology 105:281-309. WCL# 2128.
Grant, R. F., B. A. Kimball, T. J. Brooks, G. W. Walls, P. J. Pinter Jr., D. J. Hunsaker, F. J.Adamsen, R. L. LaMorte, S. W. Leavitt, T. L. Thompson, and A. D. Matthias. 2001. Modelinginteractions among carbon dioxide, nitrogen, and climate on energy exchange of wheat in a freeair carbon dioxide experiment. Agronomy Journal 93(3):638-649. WCL# 2153.
Grieve, C. A., M. C. Shannon, and D. A. Dierig. 2001. Salinity effects on growth, shoot-ionrelations and seed production of lesquerella fendleri (gray) s. wats. Industrial Crops & Prod13:57-65. WCL# 2147.
Grieve, C. M., M. C. Shannon, and D. A. Dierig. 1999. Sulfide salinity effects on growth,shoot-ion relations and seed production of Lesquerella fendleri Gray) S. Wats. 233-237. J.Janick (ed.) In Perspectives in new crops and new uses. WCL# 2132.
Grossman-Clarke, S., P. J. Pinter Jr., T. Kartschall, B. A. Kimball, D. J. Hunsaker, G. W. Wall,R. L. Garcia, and R. L. LaMorte. 2001. Modeling a spring wheat crop under elevated carbondioxide and drought. New Phytologist 150(2):315-335. WCL# 2277.
Hunsaker, D. J., B. A. Kimball, P. J. Pinter Jr., G. W. Wall, R. L. LaMorte, F. J. Adamsen, S. W.Leavitt, T. W. Thompson, and T. J. Brooks. 2000. CO2 enrichment and soil nitrogen effects onwheat evapotranspiration and water use efficiency. Agricultural Forest Meteorology (104)2:85-100. WCL# 2168.
Idso, C. D., S. B. Idso, and R. C. Balling Jr. 2001. An intensive two-week study of an urbanCO2 dome. Atmospheric Environment 35 (6): 995-1000. (Accepted 08/23/2000) WCL# 2217.

216
Idso, S. B. and K. E. Idso. 2001. Effects of atmospheric CO2 enrichment on plant constituentsrelated to animal and human health. Environmental and Experimental Botany. 45:179-199.WCL# 2241.
Idso, S. B., K. E. Idso, and C. D. Idso. The future of earth's biosphere as influenced by theongoing rise in the air's CO2 concentration. Encyclopedia of Human Ecology, TransactionPublishers. (Accepted Apr 1999) WCL# 2110.
Idso, S. B. and B. A. Kimball. 2001. CO2 enrichment of sour orange trees: 13 years andcounting. Environmental and Experimental Botany 46(2):147-153. WCL# 2176.
Jones, D. and E. M Barnes. 2000. Fuzzy composite programming to combine remote sensingand crop models for decision support in precision crop management. Agricultural Systems65:137-158. WCL# 2188.
Keys, R. N., D. T. Ray, and D. A. Dierig. Characterization of Apomictic potential in guayule(parathenium argentatum gray) in vivo and in vitro. Journal of American Society ofHorticulture Science. (Accepted 11/28/2001) WCL# 2228.
Kimball, B. A., C. F. Morris, P. J. Pinter Jr., G. W. Wall, D. J. Hunsaker, F. J. Adamsen, R. L.LaMorte, S. W. Leavitt, T. L. Thompson, A. D. Matthias, and T. J. Brooks. 2001. ElevatedCO2, drought and soil nitrogen effects on wheat grain quality. New Phytologist 150(2):295-303. WCL# 2232.
Leavitt, S. W., E. Pendall, E. A. Paul, T. J. Brooks, B. A. Kimball, and P. J. Pinter Jr. 2001.Stable-carbon isotopes and soil organic carbon in wheat under CO2 enrichment. NewPhytologist 150(2):305-314. WCL# 2275.
Li, A-G., G. W. Wall, A. Trent, and Y. Hou. 1999. Free-air CO2 enrichment effects on apexdimensional growth of spring wheat. Crop Science 39:1083-1088. WCL# 2116.
Li, H., R. J. Lascano, J. Booker, K. F. Bronson, E. M. Barnes, L. T. Wilson, and E. Segarra.2001. Spectral reflectance characteristics of cotton related to soil water and topographyvariability. p. CD-ROM, unpaginated. In Proc. 5th International Conference on PrecisionAgriculture, Bloomington MN, July 16-19, 2000. WCL# 2229.
Li, H., R. J. Lascano, J. Booker, K. F. Bronson, E. M. Barnes, L. T. Wilson, and E. Segarra.2001. Temporal patterns of cotton reflectance and NDVI-days lint yield modeling. p. 1:590-594. In Beltwide Cotton Conference, Anaheim CA, January 9-13, 2001. WCL# 2302.
Martin, E. C., D. J. Hunsaker, E. M. Barnes, and P. M. Waller. 2000. Growing crops in thedesert. Resourcep. 7(11):7-8. WCL# 2254.
Matthias, A. D., S. W. Leavitt, T. L. Thompson, B. A. Kimball, P. J. Pinter Jr., G. W. Wall, R. S.Rauschkolb, R. L. Ottman, R. L. Roth, T. J. Brooks, N. R. Adam, R. L. LaMorte, G. Wechsung,F. Wechsung, F. J. Adamsen, D. G. Williams, F. S. Nakayama, D. J. Hunsaker, J. Watson, S. A.

217
White, and J. Welzmiller. 2001. Free-air CO2 enrichment effects on wheat and sorghum atMaricopa AZ, USA. p. 87-96. In Carbon Dioxide and Vegetation - Advanced InternationalApproaches for Absorption of CO2 and Reponses to CO2 CGER Report, ISSN 1341-4356. Centerfor Global Environmental Research, National Institute of Environmental Sciences, Ministry ofthe Environment, Tsukuba, Ibaraki, Japan. WCL# 2118.
Moran, M. S. 2000. Image-based remote sensing for precision crop management - a statusreport. American Society of Civil Engineers. p. 185-193. In Watershed Management 2000 -Science and Engineering Technology for the New Millennium, Colorado State University, FortCollins CO. June 21-24, 2000. WCL# 2149.
Moran, M. S., R. Bryant, T. R. Clarke, and J. Qi. 2001. Deployment and calibration ofreference reflectance tarps for use with airborne cameras. Photogrammetric Engineering andRemote Sensing 67:273-286. WCL# 2154.
Moran, M. S., R. Bryant, K. Thome, W. Ni, Y. Nouvellon, M. P. Gonzales-Dugo, J. Qi, and T.R. Clarke. 2001. A refined empirical line approach for reflectance factor retrieval fromLandsat-5 TM and Landsat-7 ETM+. Remote Sensing of Environment 78:71-82. WCL# 2316.
Nakayama, F. S., P. Chow, D. S. Bajwa, J. A. Youngquist, J. H. Muehl, and A. M. Krzysik.2000. Preliminary investigation on the natural durability of guayule (parathenium argentatum)-based wood products. p. IRG/WP 00-40154. In 31st Annual Meeting, Kona HI, USA, May 14-19, 2000. WCL# 2226.
Norby, R. J., K. Kobayashi, and B. A. Kimball. 2001. Rising CO2 - future ecosystems. NewPhytologist 150:215-222. WCL# 2283.
Nouvellon, Y., A. Begue, M. S. Moran, D. L. Seen, S. Rambal, D. Luquet, G. Chehbouni, and Y.Inoue. 2000. PAR extinction in shortgrass-ecosystems: effects of clumping, sky conditions andsoil albedo. Agricultural and Forest Meteorology 105:21-41. WCL# 2165.
Nouvellon, Y., S. Rambal, D. Lo Seen, M. S. Moran, J. P. Lhomme, A. Begue, A. Chehbouni,and Y. Kerr. 2000. Modelling of daily fluxes of water and carbon from shortgrass steppes. Agric. & Forest Meteorol. 100:137-153. WCL# 2087.
Ottman, M. M., B. A. Kimball, P. J. Pinter Jr., G. W. Wall, R. L. Vanderlip, S. W. Leavitt, R. L.LaMorte, A. D. Matthias, and T. J. Brooks. 2001. Elevated CO2 increases sorghum biomassunder drought conditions. New Phytologist 150(2):261-273. WCL# 2274.
Pendall, Elise, Steven W. Leavitt, Talbot Brooks, Bruce A. Kimball, Paul J. Pinter Jr., Gerard W.Wall, Robert L. LaMorte, Gabriele Wechsung, Frank Wechsung, Floyd J. Adamsen, Allan D.Matthias, and Thomas L. Thompson. 2001. Elevated CO2 stimulates soil respiration in a FACEwheat field. Basic Applied Ecology 2:193-201. WCL# 2307.

218
Qi, J., R. Marsett, M. S. Moran, D. Goodrich, P. Heilman, Y. H. Kerr, G. Dediu, and A.Chehbouni. 2000. Spatial and Temporal Dynamics of Vegetation in the San Pedro River BasinArea. Agricultural and Forest Meteorology 105:55-68. WCL# 2129.
Replogle, J. A. An overview of flow measurements in irrigation at the end of the millennium. Transactions of the ASAE. (ACCEPTED October 01) WCL# 2281.
Rice, R. C., D. J. Hunsaker, F. J. Adamsen, and A. J. Clemmens. Irrigation and nitratemovement evaluation in conventional and alternate-furrow irrigated cotton. 44(3):555-568.InTrans. ASAE. WCL# 2074.
Rillig, M. C., S. E. Wright, B. A. Kimball, P. J. Pinter Jr., G. W. Wall, M. J. Ottman, and S. W.Leavitt. 2001. Elevated carbon dioxide and irrigation effects on water stable aggregates in aSorghum field: a possible role for arbuscular mycorrhizal fungi. Global Change Biology7(3):333-337. WCL# 2256.
Solomon, K. H. and A. R. Dedrick. 2001. Standards benefit developing irrigation markets. Agricultural Mechanization in Asia, Africa and Latin America 32(2):48-54. WCL# 2031.
Soon, W., S. Balinunas, K. S. Demirchan, S. B. Idso, K. Y. Kondratyev, and E. S. Posmentier.2001. The impact of anthropogenic CO2 emissions on climate: unsolved problems. Proceedings of the Russian Geographical Society p. 1-19. WCL# 2291.
Soon, W., S. Baliunas, K. Y. Kondratyev, S. B. Idso, and E S. Posmentier. Calculating theclimatic impacts of increased CO2: The issue of model validation. Special Publication 463European Space Agency, Noordwijk, The Netherlands. (Accepted 10/11/2000) WCL# 2243.
Wahl, T. L., J. A. Replogle, B. T. Wahlin, and J. A. Higgs. 2000. New developments in designand application of long-throated flumes. p. CD Rom (unpaginated). In 2000 Joint Conf. onWater Resources Engineering & Water Resources Planning & Management, Minneapolis, MN,July 23-26, 2001. WCL# 2301.
Wahlin, B. T. and A. J. Clemmens. 1999. Performance of several historic canal controlalgorithms on the ASCE test cases. p. 467-481. In Proc. USCID Workshop on Modernizationof Irrigation Water Delivery Systems, Scottsdale AZ. October 17-21, 1999. WCL# 2125.
Wahlin, B. T., A. J. Clemmens, and J. A. Replogle. Evaluating the measurement accuracy ofsurface water flows and accumulated volumes. p. CD Rom unpaginated. In Proc. InternationalConference on Water Resources Engineering, ASCE Joint Conference on Water ResourcesPlanning and Management, Minn MN, July 30-August 2, 2000. WCL# 2215.
Wall, G. W. 2001. Elevated atmospheric CO2 alleviates drought stress in wheat. Agriculture,Ecosystems and Environment 261-271. WCL# 2117.
Wall, G. W., T. J. Brooks, N. R. Adam, A. B. Cousins, B. A. Kimball, P. J. Pinter Jr., R. L.LaMorte, J. Triggs, M. J. Ottman, S. W. Leavitt, A. D. Matthias, D. G. Williams, and A. N.

219
Webber. 2001. Elevated atmospheric CO2 improved sorghum plant water status byameliorating the adverse effects of drought. New Phytologist 152:231-248. WCL# 2244.
Williams, D. G., B. Gempko, A. Fravolini, S. W. Leavitt, G. W. Wall, B. A. Kimball, P. J. PinterJr., R. LaMorte, and M. Ottman. 2001. Carbon isotope discrimination by sorghum bicolor underCO2 enrichment and drought. New Phytologist 150(2):285-293. WCL# 2246.

220
Technology Transfer
Following are summaries of the laboratory’s major technology transfer accomplishments for 2001.
Irrigation and Water Quality
Scientist: Bert Clemmens – Flow MeasurementComputer software originally developed by Bert Clemmens and John Replogle at the U.S. WaterConservation Laboratory, Phoenix Arizona, and cooperator Rien Bos of the International Institutefor Land Reclamation and Improvement (ILRI), The Netherlands, for the design and calibration oflong-throated measuring flumes, has been reprogrammed for the Windows environment by TonyWahl at the Water Resources Research Laboratory of the Bureau of Reclamation, Denver, Colorado.Over the past several years, this software has been downloaded by about 700 individualsrepresenting 54 countries. A new book, Water Measurement with Flumes and Weirs, by Clemmens,Wahl, Bos, and Replogle, being published this year by ILRI, provides guidance on design,construction, and calibration of these structures, along with guidance on use of the software.
Scientist: Bert Clemmens – Surface-Drained Level BasinsLevel basin irrigation systems that include surface drainage have gained popularity in centralArizona in recent years and, with modification, are expanding rapidly in Louisiana, with more than10,000 acres converted from sloping irrigation to level basins over the last few years. Thistechnology, originally developed in the early 1980s by Al Dedrick (currently ADA for NaturalResources and Sustainable Agricultural Systems) and Southern Colorado farmer Ves Quinlan, wasintroduced into Louisiana by farmer Walter Davis with guidance from Al Dedrick and BertClemmens. A Davis innovation--“spin ditches” or depressed furrows that allow water to drain offthe field surface more effectively--made these basins effective even under high rainfall conditions. Davis and other farmers in the area report 20-40% yield increases with these systems compared totraditional irrigation methods in the area. Clemmens is cooperating with NRCS engineers and localconservationists to verify their functioning and provide design guidelines.
Scientist: Herman Bouwer – Simplified Prediction of Infiltration RatesHerman Bouwer developed a simple cylinder infiltrometer technique to accurately predictinfiltration rates for groundwater recharge basins. Previous infiltrometer techniques were timeconsuming and inaccurate, due to divergence of flow in the soil away from the cylinder and tolimited depth of wetting. The new technique measures and corrects for these phenomena in a simpleway, thus yielding values that can be used to design infiltration systems for artificial recharge ofgroundwater or to predict seepage losses from wetlands or other impoundments. The method waspublished in 1999 and is now widely used by consultants and project planners with good results. InArizona during 2001, the method was used by consultants and water districts for proposed rechargeprojects at the Agua Fria River (Salt River Project), at Lake Powell (National Parks Service), nearCasa Grande and Western Maricopa County (private wastewater facilities), the Queen Creek andChandler areas (for recharge), and the Lake Pleasant area (private development).

221
Scientist: Herman Bouwer – Predicting and Managing Salt Accumulation and Groundwater Rises in South-Central ArizonaBy analyzing regional water and salt balances, Herman Bouwer of the U.S. Water ConservationLaboratory, Phoenix, Arizona, has made long-range predictions about increasing salinity ofgroundwater and rising groundwater levels in the Phoenix-Tucson region of south-central Arizona.He also pointed out various management procedures to prevent salinity and water logging problems,including groundwater pumping, sequential irrigation of increasingly salt-tolerant crops, reverseosmosis, evaporation ponds, and ultimate ocean disposal or inland storage of brine and salts. TheCity of Phoenix organized a “salt forum” in the summer of 1999 to present and discuss the issuesto the municipalities and irrigation districts involved, and where Herman Bouwer gave an overviewof the situation. A grant proposal by ASU and an independent consultant has been submitted in 2001to the Water Environment Research Foundation for further study of the issues. Dr. Bouwer presentedan overview to water and wastewater treatment officials and consultants at a salt panel discussionat the Spring Meeting 2001 of the Arizona Water Pollution Control Association, and consultantshave been invited by the City of Phoenix to present proposals for further studies and managementstrategies with Dr. Bouwer as technical advisor.
Environmental and Plant Dynamics
Scientists: Francis Nakayama & Terry Coffelt – Release of Guayule Latex and BagasseApproximately 10 gallons of guayule latex was provided to Yulex Corporation by scientists at theUSDA-ARS, U.S. Water Conservation Laboratory, Phoenix, Arizona, and Western RegionalResearch Center, Albany, California. Yulex successfully used the latex to fabricate hypoallergenicfilms for making medical products. In addition, about 300 pounds of guayule bagasse wastransferred to Yulex under a Material Transfer Agreement for their study in the use of this wasteproduct for making insulation materials. Applications were submitted for U.S. and internationalpatents covering the fabrication of guayule composite boards that are termite resistant. The use ofthe waste products from latex extraction will greatly help the economics and commercialization ofthe guayule crop.

222
ARS WEEKLY ACTIVITY REPORTS
Throughout the year scientists submit items for the “ARS Weekly Activity Report. These reportsare consolidated at ARS Area level and submitted to ARS headquarters for the information ofagency and departmental management.
John Replogle - Measuring and Monitoring Sediment-Laden Streams. Studies completed byengineers at the USDA-ARS U.S. Water Conservation Laboratory (USWCL) in Phoenix AZ willmake it possible to measure the flow rates of water in natural streams that carry heavy loads ofsediment, a common occurrence in semiarid regions. Flow measurement is essential to controllingand managing flowing water, and even the computer-predictable flow measuring systems now inuse become clogged when used in sediment-laden streams. USWCL engineers recognized that thereis usually a period near the beginning of a storm flow that can be measured accurately becauseincreasing flow rates tend to temporarily suspend the sediments. Using this information to modifyexisting flow measuring systems, they have conducted successful tests in cooperation with theCalifornia Water Quality Control Board and the University of California at Berkeley to monitorwater quantity and quality downstream from a mining site. Additional studies of the concept wereconducted simultaneously in a University Arizona thesis project under USWCL supervision. Apaper outlining the concepts and results of the field and laboratory studies will be presented July 30at the International Meeting of the American Society of Agricultural Engineers in Sacramento CA.
Herman Bouwer - ARS and USGS Cooperative Research on Irrigation with Sewage Effluent.Scientists at the USDA-ARS U.S. Water Conservation Laboratory in Phoenix AZ, in cooperationwith USGS scientists, have undertaken studies to assess the impact of irrigation with sewage effluenton the underlying groundwater. The practice would seem beneficial to mitigate water shortages anduse conflicts. In dry climates, however, the excess irrigation water needed to leach salts and otherchemicals out of the root zone can eventually reach the groundwater and make it unfit for drinking.The severity of the problem will be assessed with in-depth laboratory and field studies to determineif the effluent or underlying groundwater requires additional treatment.
Bruce A. Kimball - International Collaboration Focuses on Effects of Increasing CarbonDioxide (CO2) on Agricultural Crops. In a study arising from the conference on free-air carbondioxide enrichment (FACE), held in Tsukuba, Japan, in June 2000, and aided by a 3-month sabbaticalin Japan, Dr. Bruce Kimball, Soil Scientist at the U. S. Water Conservation Laboratory, Phoenix AZ,with collaborators from Italy and Japan, has completed an exhaustive examination of free-air CO2enrichment (FACE) experiments conducted since 1989 in four countries on eight different crops. TheFACE research was conducted to determine the likely effects of the increasing atmospheric CO2concentration on the physiology, growth, yield, water use, and soil carbon storage of agriculturalcrops under open-field conditions. Experiments were conducted in Arizona, Switzerland, Italy,and Japan on the major world food crops wheat, rice, and potatoes, as well as on cotton, sorghum,ryegrass, white clover, and grape. Generally, the elevated CO2 stimulated growth and yield of all thecrops when soil moisture and water were ample, except sorghum, which was stimulated underdrought conditions. Soil carbon content appeared to increase, which would tend to slow the rate ofrise of the atmospheric CO2. Comparisons of the FACE results with those from earlier chamber-

223
based results were consistent, which supports the accuracy of conclusions drawn from both types ofdata.
Bruce Kimball - Interviewed for the Arizona Republic. Bruce Kimball from the U.S. WaterConservation Laboratory, Phoenix AZ, was interviewed on 19 July 2001 by Mr. Max Jarvan, reporterfor the Arizona Republic. Mr. Jarvan wanted to know about plans and proposals to conduct globalwarming or global change research at Springerville AZ. Dr. Kimball described the large geologicpool of CO2 that exists there and how it could be used to conduct free-air CO2 enrichment (FACE)research on the pinon-juniper rangeland ecosystem in which is situated. Ultimately experiments oncultivated crops could also be done. However, plans are slowed by a lack of funds. A researchproposal has been written involving Northern Arizona University, USDA-ARS, The University ofArizona, Arizona State University, and other scientists.
Thomas Clarke - ARS Participates in Cooperative Satellite Calibration. On July 26 and 27,remote sensing specialists from the Agricultural Research Service’s U.S. Water ConservationLaboratory in Phoenix AZ and the Southwest Watershed Research Center in Tucson AZ joined forceswith personnel from NASA Stennis Space Center and the National Imaging and Mapping Agencyin a multiple platform calibration. Images of the University of Arizona’s Maricopa AgriculturalCenter were required from IKONOS, LANDSAT 7, and EO-1 satellites and by aircraft ranging froma Learjet to a powered parachute. Ground crews recorded plant and soil parameters as well as surfacereflectances and atmospheric measurements in support of the effort. NASA will use the informationto compare the different sensor systems while ARS scientists will evaluate each sensor’s suitabilityfor helping growers make better-informed management decisions related to the water, nutrient, andpest needs of their crops.
Douglas Hunsaker - ARS Technical Presentation on Surface Irrigation Fertigation. In earlyAugust, ARS scientists with the USDA ARS, U.S. Water Conservation Laboratory, Phoenix AZpresented results from their nitrogen fertigation (adding nitrogen fertilizer to irrigation water) fieldexperiments at the ASAE International Meeting in Sacramento CA. Producers who utilize surfaceirrigation systems have found fertigation can be a very cost-effective method of applying fertilizerto their fields. However, insufficient scientific data are available to develop appropriate guidelinesand practices for applying chemicals to fields in this manner. The presentations provided importantinformation on level basin irrigation showing that fertigation was more effective on furrowed cottonthan on flat-planted wheat. The applied irrigation water was more uniform in the cotton while loweruniformity in the wheat led to significant leaching of nitrogen below the crop rooting zone at theupper end of the field and low application rates of nitrogen at the lower end of the field. Theimplications for the wheat were lower yield and potential environmental concerns about nitrogenleaching below the root zone, indicating the need to provide farmers with improved guidelines andpractices for this cost- and labor-saving technology.
Bruce Kimball - Cooperative Research Shows Effects of Increased Carbon Dioxide on theNutritional and Baking Quality of Wheat. ARS researchers at the U.S. Water ConservationLaboratory, Phoenix AZ; and Western Wheat Quality Laboratory, Pullman WA, with collaborators

224
from The University of Arizona, have determined the likely consequences of future high levels ofatmospheric carbon dioxide (CO2) concentration on the nutritional and baking quality of wheat, amajor world food crop. The grain for testing came from free-air CO2 enrichment (FACE)experiments conducted at ample and limiting levels of irrigation and nitrogen fertilizer. Grainsamples from the final harvests were subjected to a battery of nutritional and bread-making qualitytests. Water stress improved protein and bread loaf volumes slightly. In contrast, low nitrogendecreased quality drastically with protein decreasing 36% and load volume 26%. At ample water andnitrogen, FACE decreased quality slightly or not at all. However, FACE worsened the deleteriouseffects of low nitrogen on both protein and loaf volume. Thus, these data suggest that future elevatedCO2 concentrations will exacerbate the deleterious effects of low soil nitrogen on grain quality; butwith ample fertilizer nitrogen, the effects will be minor.
Norma Duran - ARS Scientist Conducts Collaborative Research with Embrapa/Pantanal. FromJuly 30-August 24, 2001, Norma L. Duran, Microbiologist, U.S. Water Conservation Laboratory,Phoenix AZ participated in a joint research project with the Brazilian Agricultural ResearchCorporation (Embrapa), Pantanal Research Center (CPAP) in Corumba, Brazil. Funding for theresearch project came from the state of Mato Grosso do Sul, Brazil, to study microbial communitiesin different environmental conditions and assess potential problems of mercury contamination in thePantanal wetlands. She also presented a seminar at Embrapa’s center, “The Use of Gene ProbeMolecular Methods to Study Microbial Mediated Demethylation and Methylation Processes ofMercury.” Results from this project will improve our current understanding of microbial diversityand metabolic range while addressing the global environmental problem of mercury pollution inwetland systems.
Glenn Fitzgerald - ARS and University of Arizona Organize Precision Agriculture Meeting.On August 16, 2001, ARS researchers from the U.S. Water Conservation Laboratory in Phoenix AZand The University of Arizona NASA space grant extension specialist in geospatial technology metwith researchers, extension agents, and other stakeholders to discuss precision agriculture issues inArizona. The meeting was organized by the ARS and The University of Arizona representatives;and topics included the uses of remote sensing and geographical information systems in precisionagriculture, precision tillage, soil spatial variability, barriers to adoption, and technology transfer.A round table discussion provided insights about research needs in Arizona and the potential toimplement precision agriculture concepts and technology in Arizona.
Paul Pinter - Carbon Dioxide (CO2) Enrichment in Open Fields is ISI “Fast-Breaking Paper”for October 2001. The Institute for Scientific Information (ISI) Web of Knowledge has identifieda manuscript written by the Global Change Research Team, led by Bruce Kimball, at the ARS, U.S.Water Conservation Laboratory in Phoenix AZ as October’s “fast breaking paper” for being themost cited paper in the field of agricultural sciences published in the last two years (http://esi-topics.com/fbp/index.html ). The article, “Free-air CO2 enrichment (FACE): Blower effects onwheat canopy microclimate and plant development,” was published in the July 2000 issue ofAgricultural and Forest Meteorology, 103:319-333. The authorship reflects the multi-agency andinternational collaboration that characterizes global change research in ARS: P.J. Pinter, Jr., B.A.Kimball, G.W. Wall, D.J. Hunsaker, F.J. Adamsen (U.S. Water Conservation Lab.), K.F.A. Frumau,

225
H.F. Vugts (Vrije Universiteit, Amsterdam, The Netherlands), G.R. Hendrey, K.F. Lewin, J. Nagy(Brookhaven National Lab., Upton, Long Island NY), H.B. Johnson (ARS, Grassland Soil and WaterResearch Lab., Temple TX), F. Wechsung (Potsdam Inst. for Climate Impact Research, Potsdam,Germany), S.W. Leavitt, T.L. Thompson, A.D. Matthias, and T.J. Brooks (Univ. of AZ, Tucson).The FACE approach was developed jointly by scientists from ARS and Brookhaven NationalLaboratory and has provided essential knowledge regarding the potential effects of anticipatedincreases in atmospheric CO2 on crop production. This paper identified a limitation in the originaldesign, which led to improvements in FACE operating strategies in the U.S. and around the world.
Francis S. Nakayama - ARS and Cooperators File for Patent on Termite and Wood Rot-Resistant Composite Board. Francis Nakayama, Research Chemist at the U. S. WaterConservation Laboratory in Phoenix, with co-inventors from the University of Illinois, Urbana ILand the Forest Products Laboratory (FPL) in Madison WI have applied for a patent for a compositeboard, made of otherwise waste plant material from the guayule shrub, that resists termite and wood-rot. The composite board is made from the residual plant material that otherwise would requiredisposal after the hypoallergenic latex has been extracted from guayule for the manufacture ofmedical and other products. A demonstration on the use of guayule, a renewable, biobasedagricultural crop, is being presented at FPL for its “Madison House: A Construction Laboratory”Open House in October to highlight the uses of guayule’s by-products to preserve wood.
Edward M. Barnes - Improved Irrigation Scheduling Using Remote Sensing. ARS scientistsat the U. S. Water Conservation Laboratory in Phoenix AZ in cooperation with engineers at TheUniversity of Arizona, are using remotely sensed data to improve irrigation scheduling methods forfarmers. The result can be higher productivity and profits, lower water use, and less chance ofdegrading water quality. The new procedures being used to interpret remotely sensed data relate anestablished crop water stress index an established crop water stress index (CWSI) derived fromremotely sensed data with plant available water. In the past, the CWSI has proven a valuable sourceof information by indicating when there is water stress, but reliable determination of how muchirrigation is needed based on the index has not been possible. A link between the CWSI and a soildryness term already developed for crop water use calculations has been found that now allows theCWSI to be related to soil moisture content. The relationship provided reasonable estimates of soilmoisture in a field study with surface irrigated cotton (relatively low irrigation frequency). Furtherstudies are planned to test the relationship for high frequency irrigation systems.


226
U. S. WATER CONSERVATION LABORATORY STAFF
PERMANENT EMPLOYEES
Name TitleAdamsen, Floyd J. Soil ScientistArterberry, Carl K. Agricultural Science Research Technician SoilAskins, JoAnne Physical Science TechnicianBarnes, Edward M. Agricultural EngineerBautista, Eduardo Agricultural EngineerBouwer, Herman Research Hydraulic EngineerClarke, Thomas R. Physical ScientistClemmens, Albert J. Lab Director, Supvy Res Hydr EngrCoffelt, Terry A. Research Geneticist (Plants)Colbert, Sharette M. Physical Science TechnicianConley, Matthew M. Billogical Science Technician (Plants)Dahlquist, Gail H. Agricultural Science Research Technician (Plants)Dierig, David A. Research Geneticist (Plants)Draper, T. Lou Secretary (Office Automation)Duran, Norma MicrobiologistFitzgerald, Glenn J. Research ArgonomistGerard, Robert J. Laboratory Support WorkerHarner, Paulina A. Secretary (Office Automation)Hunsaker, Douglas J. Agricultural EngineerJohnson, Kathy J. Physical Science TechnicianJohnson, Stephanie M. Biological Science TechnicianKimball, Bruce A. Research Leader and Supervisory Soil ScientistLeake, Greg S. Biological Science Technician (Plants)Lewis, Clarence L. MachinistManeely, Suzette M. Biological Science Technician (Plants)Mastin, Harold L. Computer AssistantMills, Terry A. Computer SpecialistNakayama, Francis S. Research ChemistOlivieri, Laura M. Biological Science TechnicianPettit, Dean E. Electronics EngineerPinter, Jr., Paul J. Research BiologistPowers, Donald E. Physical Science TechnicianReplogle, John A. Research Hydraulic EngineerRish, Shirley A. Program AnalystRokey, Ric R. Biological Science Technician (Plants)Strand, Robert J. Engineering TechnicianStrelkoff, Fedja Research Hydraulic Engineer/ResearchValdez, Deborah K. Office Automation ClerkVinyard, Stephen H. Physical Science Technician

227
Wahlin, Brian T. Civil EngineerWall, Gerard W. Plant Physiologist
ADMINISTRATIVE OFFICE
Name TitleGerard, Robert J. Maintenance WorkerHodge, Vanessa J. Budget and Accounting AssistantLee, Richard E. Custodial WorkerMartin, Kevin R. Maintenance Mechanic SupervisorSchoenholz, Jason L. Maintenance WorkerSexton, Judith A. Purchasing AgentSteele, Terry L. Safety & Occupational Health SpecialistWiggett, Michael R. Administrative OfficerWorthen, Michelle Office Automation Assistant
TEMPORARY EMPLOYEES
Name TitleAdam, Neal R. Plant PhysiologistAmann, Michael A. Engineer TechnicianAshley, Amy F. Biological Science TechnicianBishop, Lerey R. Computer ClerkBlank, Melissa A. Biological Science TechnicianDeGraw, Christa L. Office Automation ClerkDeGraw, Lisa L. Office Automation ClerkEshelman, Trathferd G. Physical Science TechnicianFaber, Amy Physical Science TechnicianJacob, Sally J. Biological Science AidJerman, James A. Physical Science AidLanison, John C. Biological Science AidLuckett, William E. Physical Science TechnicianMarcil, Marie A. Physical Science AidO’Brien, Jessica L. Physical Science AidSchmidt, Baran V. Computer Programmer SpecialistTabbara, Hadi Soil ScientistTomasi, Pernell M. Biological Science TechnicianVu, Duong H.T. Engineering Technician

228
TEMPORARY STATE EMPLOYEES
Name TitleO=Brien, Carrie C. Research Laboratory Assistant (Staff)Richards, Stacy Biological Science AidTriggs, Jonathan Biological Science Aid

229
COOPERATORS
UNIVERSITIESArizona State University Tempe, Arizona
Department of Civil and Environmental EngineeringDepartment of GeographyDepartment of Plant Biology
Plant BiologyCalifornia Polytechnic State University San Luis Obispo, CaliforniaKansas State University Manhattan, KansasMichigan State University East Lansing, MichiganMississippi State Univeristy Starkville, Mississippi
Dept of Agricultural & Biological EngineeringNew Mexico State University Las Cruces, New MexicoNorthern Arizona University Flagstaff, ArizonaNorthwest Agriculture University Yangling, Shaanxi, China.Peter-Gules van Overloop, van Overloop Consultancy The NetherlandsTexas A&M University Lubbock/Pecos, Texas
Agriculture Experiment StationUniversidad Autonoma Agraraia Antonio Narro (UAAAN) Saltillo, MexicoUniversita della Tuscia Viterbo, ItalyUniversitat Autonoma Barcelona, SpainUniversity of Akron Akron, Ohio
Department of ChemistryUniversity of Alberta Edmonton, CanadaUniversity of Arizona Tucson, Arizona
Dept of Agri & Biosystems Engineering “Dept. of Entomology “Dept of Plant Sciences “Dept of Soil, Water & Env Science “Laboratory of Tree-Ring Research “Maricopa Agriculture Center Maricopa, ArizonaMarana Agricultural Center Marana, ArizonaMaricopa County Extension Service Phoenix, ArizonaYuma Agricultural Center Yuma, Arizona
University of Colorado Boulder, ColoradoUniversity of Essex Colchester, United KingdomUniversity of Florence Florence, ItalyUniversity of Florida Gainesville, FloridaUniversity of Guelph Guelph, Ontario, CanadaUniversity of Illinois Chicago, Illinois
Natural Resources and Environmental Sciences Urbana, IllinoisUniversity of Mississippi Stoneville, MississippiUniversity of Montana Missoula, Montana

230
University of Nebraska Lincoln, NebraskaDept of Biological Systems Engineering
University of Queensland Gatton, Queensland,Australia
Virginia State University Petersburg, VirginiaVirginia Tech Univ-Virginia Agric Exp Station Suffolk, VirginiaVrie Universiteit of Amsterdam, University of Amsterdam Amsterdam, Netherlands
STATE, COUNTY, AND CITY AGENCIESCalifornia Water Quality Control Board Oakland, California &
Sacramento, CaliforniaImperial Irrigation District Imperial, CaliforniaCity of Surprise Surprise, ArizonaCity of Tolleson Tolleson, ArizonaMaricopa Country Extension Service Phoenix, Arizona
FEDERAL LABORATORIESBrookhaven National Laboratory Upton, New YorkNASA Goddard Institute for Space Studies New York, New YorkNASA, Stennis Space Center Stennis, MississippiNational Germplasm Resources Laboratory Beltsville, MarylandNatural Resources Conservation Service Portland, Oregon
National Water and Climate Center Little Rock, ArkansasNational Water Management Center Phoenix, Arizona
U.S. Department of Energy Washington, DCEnvironmental Sciences Division
USDI-USGS Tucson, ArizonaUSDA-ARS, Citrus and Subtropical Products Laboratory Winter Haven, FloridaUSDA-ARS, Grassland Protection Research Temple, TexasUSDA-ARS, National Soil Dynamics Laboratory Auburn, AlabamaUSDA-ARS, Northwest Irrigation and Soils Res Laboratory Kimberly, IdahoUSDA-ARS, Plant Germplasm Introduction Station Pullman, WashingtonUSDA-ARS, U.S. Salinity Laboratory Riverside, CaliforniaUSDA-ARS, South Central Agricultural Research Lab Lane, OklahomaUSDA-ARS, Southwest Watershed Research Lab Tucson, ArizonaUSDA-ARS, Western Wheat Quality Laboratory Pullman, Washington USDA-ARS, National Center for Agricultural Utilization Res Peoria, IllinoisUSDA-ARS, Western Regional Research Center Albany, CaliforniaUSDA-ARS, National Center for Genetic Resources Preservation Ft. Collins, ColoradoUSDA-Forest Products Laboratory Madison, Wisconsin

231
OTHERAgriculture & Agri-Food Canada Quebec, Canada
Horticultural R&D CentreAgricultural Research Council of South Africa Elsenberg, South AfricaAutomata, Inc. Nevada City, CaliforniaCenter for the Study of Carbon Dioxide and Global Change Tempe, ArizonaCitrus Research and Education Center Lake Alfred, FloridaGCTE (Global Change Terrestrial Ecosystems) Wheat Network Oxon, United KingdomIMTA (Mexican Institute for Water Technology) Cuernavaca, Mexico Maricopa-Stanfield Irrigation & Drainage District Stanfield, ArizonaNational Institute of Agro-Environmental Sciences Tsukuba, JapanPotsdam Institute for Climate Impact Research Potsdam, GermanySalt River Project Phoenix, ArizonaYulex, Corp. Philadelphia, Pennsylvania