Embed Size (px)
Citation preview

1© GfK 2016 | Analyst call | March 18, 2016
Annual Results 2015GfK SE – Analyst Call
March 18, 2016

2© GfK 2016 | Analyst call | March 18, 2016
2015 – Growth and further developmentMatthias Hartmann | CEO
GfK SE
March 2016

3© GfK 2016 | Analyst call | March 18, 2016
Overview
What did we achieve
in 2015?
Results
� Back to growth � Missed margin guidance� Further implementation of data strategyDigital Roadmap
� Progress with new products � Growing portfolio of digital platform based products� Digitizing the business: NORM acquisition� Adding digital data sources: Netquest acquisition
(closed in 02/2016)Organization Development
� New Management Board setup agreed:� Sales focus: “One Region”, “One Industry”� Productivity focus: “One Operations”� Reduction of non-core business

4© GfK 2016 | Analyst call | March 18, 2016
Key figures for 2015
Growth � Sales 1,543 m€ (2014: 1,453 m€)� Organic growth 1.1%� Overall growth due to currency effects 6.2%
Income � Adjusted operating income of 187.6 m€(2014: 178.8 m€)
� Margin of 12.2% (2014: 12.3%) � Consolidated income 40.7 m€ (2014: 19.4 m€)
Cash Flow & Investment � Cash flow from operating activity decreased to 170.9 m€(-13.2%)
� Investments amounting to 108.6 m€

5© GfK 2016 | Analyst call | March 18, 2016
Sales growth in % for 2015
1 Data Investment Management segment isolated. Comprises Kantar, TNS, Millward Brown and The Futures Company, among others. Comparison analysis on revenue basis
GfK and Peers in 2015
1.1
6.2
1.2
5.0
-1.8
n/a
6.9
-1.0
n/a
-0.1 -0.2
3.5
Data Investment Management1
Ipsos does not report growth at constant FX rates
Nielsen does not report organic growth
Total Organic At constant currency

6© GfK 2016 | Analyst call | March 18, 2016
GfK combines ad exposure with surveyed brand KPIs
Ads seen in-app
NEW
Ads seen in browser
Ads on TV, radio, in print
INSIGHTSto deliverthe
Cross reference to unify exposure for the individua l
How mobile is integrated into full media evaluation
7© GfK 2016 | Analyst call | March 18, 2016
Ads in TV Mobile
Online Purchases
GfK Crossmedia Link
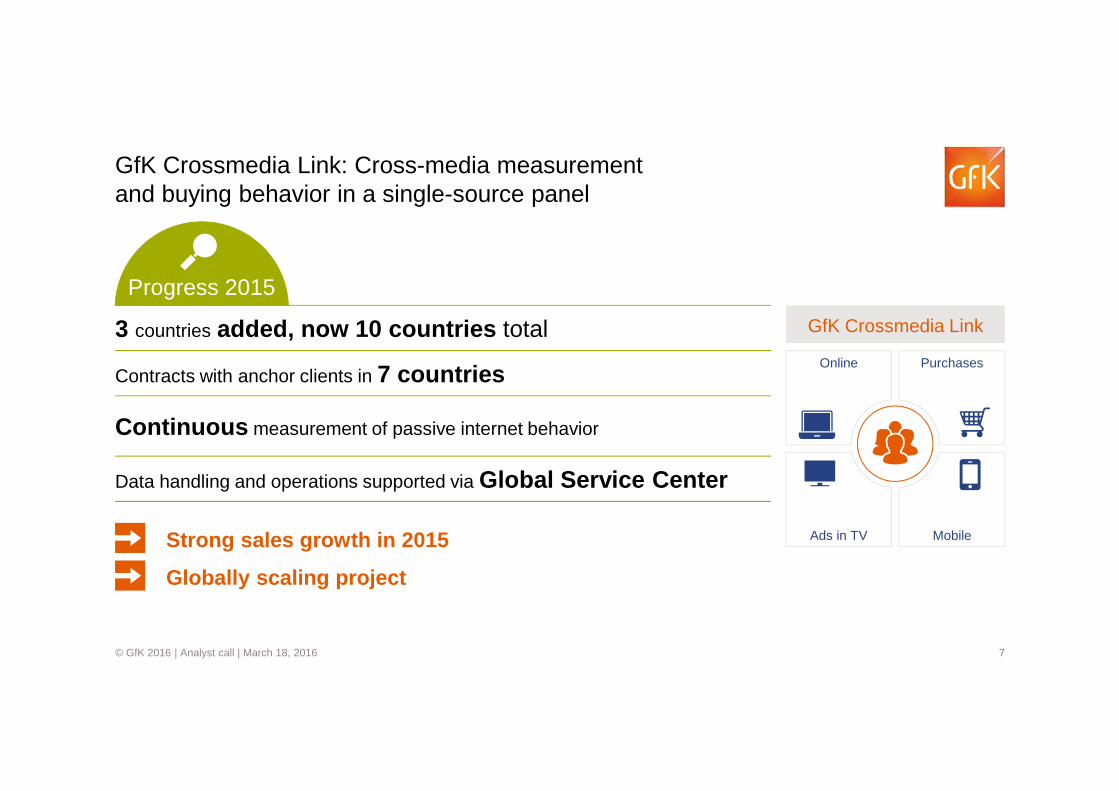
GfK Crossmedia Link: Cross-media measurementand buying behavior in a single-source panel
3 countries added, now 10 countries total
Contracts with anchor clients in 7 countries
Continuous measurement of passive internet behavior
Data handling and operations supported via Global Service Center
Globally scaling project
Strong sales growth in 2015
Progress 2015

8© GfK 2016 | Analyst call | March 18, 2016
GfK business model
� Profound industry knowledge
� Customer and consumer proximity
� Innovative solution know-how
� Data & marketing sciences
� Leading technology for crossdevice measurement
� Scaling digital platform forproject business
� Virtualization of shoppingexperiences
� Scaling cloud environment fordata processing and dataintegration
� Harmonized and automated processes
� Synergies both within market and internal structures
� Globally scaling products and services
� Data partnerships
Added value for our clients

9© GfK 2016 | Analyst call | March 18, 2016
Expand our Core with new data sets
Netquest significantly enhances our presence in Latin Americaand supports further panel set-up in the APAC region
Access Panel
Current GfK assets
Netquest/Wakoopa
Potential expansion

10© GfK 2016 | Analyst call | March 18, 2016
Expand our Core with new data sets
We will expand our GXL footprint rapidly, and Netquest will help to accelerate it
GfK Cross Media Link
Current GfK Crossmedia
Link assets
Expansion GfK Crossmedia Link
Netquest/Wakoopa

11© GfK 2016 | Analyst call | March 18, 2016
2015 – Key figures of the financial yearChristian Diedrich | CFO
GfK SE
March 18, 2016

12© GfK 2016 | Analyst call | March 18, 2016
Return to organic sales growth –slight margin decline due to ongoing investments
� Organic growth in sector Consumer Choices partly offset by revenue decline in sector Consumer Experiences
� Foreign exchange rate contributed positively to overall growth of 6.2%
� Adjusted operating income grew by 8.7 m€, margin declined by -0.2pts
� Consumer Choices margin down by -0.8pts due to ongoing investments in growth projects
� Consumer Experiences margin flat despite revenue decline of -1.2%
In m €
Actual Actual ∆ Actual ∆2015 2015 2015 vs 2014 2015 2015 vs 2014
Consumer Choices
681.1 9.2% 4.3% 0.0% 5.0% 145.0 7.3 21.3% -0.8pts
Consumer Experiences
859.1 4.0% -1.2% 0.2% 5.0% 58.9 1.4 6.9% -0.1pts
Other 3.2 - - - - -16.4 0.0 - -
Group 1,543.4 6.2% 1.1% 0.1% 5.0% 187.6 8.7 12.2% -0.2pts
Sales Growth rate in % AOI Margin in %
Q4 YTD Total Organic FX effectAcqui-sitions

13© GfK 2016 | Analyst call | March 18, 2016
622
5 out of 6 regions growing organically – double digit growth in Latin America, Northern Europe decliningSales in m€ Fiscal Year 2015
North America Northern Europe
In % FY
Total +22.1
Organic +2.4
FX +19.6
263321
2014 2015
In % FY
Total +0.1
Organic -3.1
FX +3.0
575 576
2014 2015
CEE/META
In % FY
Total -0.8
Organic +6.6
FX -7.3
127 127
2014 2015
Latin Amerika
In % FY
Total +11.0
Organic +18.7
FX -7.7
61 68
2014 2015
Southern & Western Europe
In % FY
Total +0.6
Organic +0.4
FX -
265 267
2014 2015
Asia and the Pacific
In % FY
Total +15.2
Organic +4.4
FX +10.8
161 185
2014 2015

14© GfK 2016 | Analyst call | March 18, 2016
AOI bridge GfK Group
12.2
FY 2015Sales / Volume mix, Currency
and Others
0.3
Product & System ramp-up
-0.4
FY 2014
12.3
Restructuring/Utilization
0.3
TAM BR
-0.3
FY 2015 AOI margin compared to FY 2014 (in pts)

15© GfK 2016 | Analyst call | March 18, 2016
Group – Staff Development
129
68145
157
13,380
GSC ramp-up and Other
Newlyconsolidated
entities
YE2014
-395
New TAM business
Sector CE
Sector CC
13,485
+1%
YE 2015
Productivity and Capacity management
Investment in new panels
Scope of consolidationand GSC
+105

16© GfK 2016 | Analyst call | March 18, 2016
GfK Group: Income statement
In m€ 2014 20152015 v
∆ in m€...s. 2014
∆ in %
Sales 1,452.9 1,543.4 +90.5 +6.2
Gross income from sales 462.3 481.5 +19.2 +4.1
Selling and administrative expenses -301.0 -302.2 -1.2 -0.4
Other income / expenses -93.4 -75.1 +18.3 +19.5
Highlighted items 110.9 83.4 -27.5 -24.7
Adjusted operating income 178.8 187.6 +8.8 +4.9
AOI Margin 12.3% 12.2% – –Highlighted items -110.9 -83.4 +27.5 +24.7
Operating income 68.0 104.2 +36.2 +53.2
Net income from participations 4.0 2.0 -2.0 -49.4
EBIT 71.9 106.2 +34.3 47.5
EBIT Margin 5.0% 6.9% – –Net financial income -24.4 -18.3 +6.1 +25.0
Income before taxes 47.6 87.9 +40.3 +84.7
Tax on income -28.2 -47.2 -19.0 -67.2
Tax rate 59.3% 53.7% – –
Tax rate w/o goodwill impairment 26.3% 37.0% – –
Consolidated total income 19.4 40.7 +21.3 +110.2
Earnings per share 0.16 1.01 +0.85 –
Incl. 39.4 €m goodwill impairment (improvement by 20.1 m€)
Positive one-off effects in previous year due to tax optimization in France and the US
1.1% organic growth, 5.0% currency effect
See next slide
Interest expenses and FX effect improved

17© GfK 2016 | Analyst call | March 18, 2016
GfK Group: Highlighted items
In m€ 2014 20152015 v
∆ in m€....s. 2014
∆ in %
Goodwill impairment -59.5 -39.4 +20.1 +33.7
Write-ups and write-downs ofadditional assets identified on acquisitions -11.4 -4.3 +7.1 +62.1
Income and expensesin connection with share and asset deals -1.0 8.7 +9.7 –
Income and expenses in connectionwith reorganization and improvement projects -17.1 -22.8 -5.7 -33.5
Personnel expensesfor share-based incentive payments -1.0 -1.9 -0.9 -88.7
Currency conversion differences -1.1 -2.2 -1.1 -96.1
Income and expenses related to one-off effectsand other exceptional circumstances -19.7 -21.4 -1.7 -8.6
Total highlighted items -110.9 -83.4 +27.5 +24.7
Goodwill impairment 59,5 39,4
Total highlighted items w/o goodwill impairment -51,4 -44,0 +7,3 +14,3
12.0 m€ income from sale of NPD Intelect USA shares
• 20.0 m€ Impairment on Mobile Insight/Location Insight and CPIMS/NEO
• Reduction of costs for Turkey case by 10.8 m€
• Gain from sale of real estate in Switzerland 1.1 m€
Severances increased by 3.1 m€

18© GfK 2016 | Analyst call | March 18, 2016
Consolidated balance sheet of GfK GroupAssets in m€ Dec. 31, 2014 Dec. 31, 2015 Change in m€ Share 2015 in %
Goodwill 772.7 774.0 +1.3 42.0
Other non-current assets 458.6 447.7 -10.9 24.3
Non-current assets 1,231.4 1,221.7 -9.7 66.3
Trade receivables 384.7 396.3 +11.6 21.5
Other current assets 151.4 184.9 +33.5 10.0
Assets held for sale 0.0 39.4 +39.4 2.2
Current assets 536.1 620.6 +84.5 33.7
Assets 1,767.4 1,842.3 +74.9 100.0
Equity and liabilities in m€ Dec. 31, 2014 Dec. 31, 2015 Change in m€ Share 2015 in %
Equity 705.3 720.5 +15.2 39.1
Non-current financial liabilities 359.2 256.4 -102.9 13.9
Other non-current liabilities 164.6 184.4 +19.8 10.0
Non-current liabilities 523.8 440.7 -83.1 23.9
Operating liabilities 248.1 257.9 +9.8 14.0
Other current liabilities 290.2 415.6 +125.4 22.6
Liabilities held for sale 0.0 7.6 +7.6 0.4
Current liabilities 538.3 681.1 +142.7 37.0
Equity and liabilities 1,767.4 1,842.3 +74.9 100.0
• Panel set-up: +14 m€• Sale of real estate Switzerland: -7 m€• Sale / planned sale of shares in NPD Intelect,
USEEDS: -11 m€
• Goodwill impairment: -40 m€• FX effects: +45 m€
Sale of Kynetec Group, USEEDS, PrintCenter CH(adverse effect in other line items on assets side, mainly non-current assets)
New loans +140 m€, repayments -54 m€,Reclassification of bond from long- to short-term -186 m€
Sale of Kynetec Group, PrintCenter CH(adverse effect in other line items on liabilities side)
Reclassification of bond from long- to short-term +186 m€Repayments -40 m€

19© GfK 2016 | Analyst call | March 18, 2016
GfK Group: Cash flow statement
In m€ 2014 20152015 v
∆ in m€...s. 2014
∆ in %
Consolidated total income 19.4 40.7 +21.3 +110.2
Total write-downs/write-ups 131.9 128.8 -3.1 -2.3
Change in trade receivables/liabilities 6.4 -4.3 -10.6 –
Other 27.5 -14.3 -41.7 –
Interest result 18.6 15.8 -2.9 -15.3
Taxes paid/tax expenses -6.8 4.2 +11.0 –
Cash flow from operating activity 196.9 170.9 -26.0 -13.2
CAPEX -89.2 -94.1 -4.9 -5.5
Acquisitions, other investments and divestitures
-9.7 17.8 +27.5 –
Free cash flow 1) 98.0 94.6 -3.4 -3.5
Cash flow from financing activity -75.5 -59.4 +16.1 +21.4
Receivables ∆ -7.8 m€
• Turkey case payment ∆ -15.8 m€(accrued for in 2014)
• Currency effects
1) After acquisitions, other investments and divestitures
*
*
*
* Item influenced by NPD transaction
Mainly panel set-up
Increase due to loans in preparation for bond repayment in April 2016
20© GfK 2016 | Analyst call | March 18, 2016
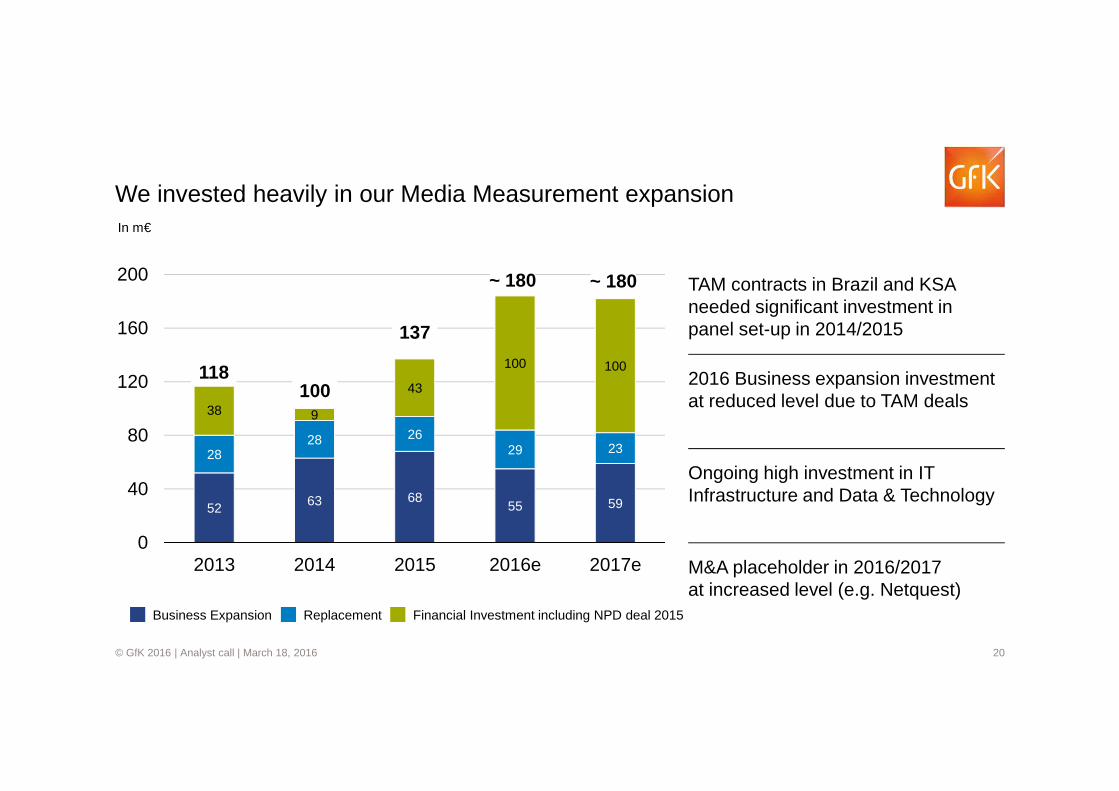
52 63 6855 59
2828 26
29 23
38 9
43
100 100
0
40
80
120
160
200
2013 2014 2015 2016e 2017e
118100
137
~ 180~ 180
We invested heavily in our Media Measurement expansion
Business Expansion Financial Investment including NPD deal 2015Replacement
TAM contracts in Brazil and KSA needed significant investment in panel set-up in 2014/2015
2016 Business expansion investment at reduced level due to TAM deals
Ongoing high investment in IT Infrastructure and Data & Technology
M&A placeholder in 2016/2017 at increased level (e.g. Netquest)
In m€

21© GfK 2016 | Analyst call | March 18, 2016
Depreciation/amortization will increase due to high investments
From 2016 onwards increasing depreciation/amortization is expected in Consumer Choices Sector due to� Audience Measurement projects� StarTrack/Neo
investment of the past � Business projects,
e.g. AutoCat, Health & Medical
Higher depreciation/amortization in Other reflects investment in ERP and IT Infrastructure as well as a revised reporting logic from 2014 onwards
Sector Others Sector Consumer ExperiencesSector Consumer Choices
1220 21 23 23
29
29 3039 4413
10 7
88
0
20
40
60
80
100
2013 2014 2015 2016e 2017e
5459 58
7570
In m€

22© GfK 2016 | Analyst call | March 18, 2016
0.46
0.30
0.48
0.65 0.65 0.65 0.65 0.65
20.217.8
20.7
26.9
37.0
32.730.1
29.6
0,00
0,10
0,20
0,30
0,40
0,50
0,60
0,70
2008 2009 2010 2011 2012 2013 2014 20150
5
10
15
20
25
30
35
40Dividendin €
Pay-outratio1)
in %
Net Debt / EBITDA 2.51 3.14 2.14 1.63 2.38 1.90 1.94 1.73
EPS (excl. Goodwill impairments) 2.04 1.42 1.99 2.06 1.43 1.66 1.79 2.09
EPS (incl. Goodwill impairments) 2.04 1.42 1.99 2.06 1.43 -1.48 0.16 1.01
Dividend per share Range of pay-out ratio Pay-out ratio1)
Dividendproposal
Dividend proposal: €0.65 per share
1) Pay-out ratio as percentage of consolidated total income adjusted by the following goodwill depreciation: 114.6 m€ (2013), 59.5 m€ (2014) resp. 39.4 m€ (2015)
0.70
0.60
0.50
0.40
0.30
0.20
0.10
0.00

23© GfK 2016 | Analyst call | March 18, 2016
Net debt virtually unchanged in 2015
Net debt to EBITDA (IFRS) < 2.00 – stable Investment grade
2012 2013 2014 2015
CAPEX in m€ 71 80 89 94
M&A in m€ 107 38 10 44
Net Debt IFRS in m€ -461.8 -427.5 -393.1 -400.0
Net Debt / EBITDA 2.38 1.90 1.94 1.73
IFRS Net Debt
EBITDA
462428
393 400
195225 202
231
In m€

24© GfK 2016 | Analyst call | March 18, 2016
Funding structurein %
Maturity profile of financial debt significantly improved
In m€ 2014 2015 April 2016< 3 years 62% 53% 17%> 3 years < 12 years 38% 47% 83%Total debt (gross) -389 -437 -450
� Floating Schuldschein of over 40 m€canceled and increased to 90 m€, margin improvement is at 1.10%
� Bond partially repurchased in May 2015
� Revolving Credit Facility was extended to 2020, currently the line is unused
� Maturing Bond refunded by bank term loans and a new German Schuld-schein
� 83% funded for more than 3 years
� Maturities up to 12 years
� Significant interest savings from April 2016 onwards
Cash +93 +130 +110Total debt (net) +296 +307 +340RCF/Credit Lines 279 286 286
31
1411
43 5222
27
Bond
Schuldschein fix
Bank loans
Schuldschein floating
Initiatives in 2015

25© GfK 2016 | Analyst call | March 18, 2016
Significant interest rate savings from April 2016 onwards
10%
90%
2014
Floating
Fix
14%
86%
2015
30%
70%
4/2016
YE Interest in % 3.97 3.23 1.50
Total Debt (gross) in m€ 389 437 450
GfK benefits from low floating interest rates
GfK has the flexibility to repay debt before maturity (floating share)
GfK has the option to initiate interest rate hedges, if applicable

26© GfK 2016 | Analyst call | March 18, 2016
Operational progress: reduction of complexity
In 2015 number of legal entities reduced to 182 Basis for further mergers
ReductionExpansion Entities as at Dec. 31st
Cross ownership with The NPD Group unwound and replaced with strategic partnership agreement
� Opens leeway for further mergers of subsidiaries
� Share of earnings attributable to minority interests (before impairments) declines from 17% (2014) to 5% (2015)
Number of legal entities Cross ownership unwound
224209 203 201
189 184 182
6
810 11
4 9
21
14 1223
9 11
150
175
200
225
250
2009 2010 2011 2012 2013 2014 2015
-19%
27© GfK 2016 | Analyst call | March 18, 2016
2016 – GfK in the future and guidanceMatthias Hartmann| CEO
GfK SE
März 2016

28© GfK 2016 | Analyst call | March 18, 2016
One CCO per Sector
� full sector accountability (P&L, product portfolio, client delivery, external reporting)
“One GfK” approach reflected in Management Board setup
One MBM per Region
� steer region(s) to deliver sector and cross sector targets
� drive “One GfK”
One GfK Industries
� drive GfK’s global and cross sector offering via a top down approach
One GfK Operations
� manage Operations processes and services
� ensure high quality and deliver on client needs
Christian Diedrich Chief Financial Officer
David KrajicekChief Commercial Officer
Alessandra Cama Chief Operations Officer
Dr. Gerhard HausruckingerChief Commercial Officer
Matthias HartmannChief Executive Officer

29© GfK 2016 | Analyst call | March 18, 2016
Focus 2016
Consumer
ChoicesConsumer
Experiences
Deliver on TAM projects
Expand GfK Crossmedia Link
Drive PoS Measurement innovation
Grow value added services
Drive multi-channel commercial activation
Integrate NORM & Netquest
Push branded products
Increase efficiency
Efficiency – Reduce operation costs
Quality – Increase perceived client quality
Speed – Speed up time to market
Digital Innovation – Build digital panels and raise data innovation
Operations
GfK
GroupUse benefits of “One GfK“
Use benefits of Operations
Reduce complexity
Active product portfolio management
with digital focus

30© GfK 2016 | Analyst call | March 18, 2016
Guidance 2016
• The year started in line with expectations. Sales coverage as at the end of January 2016 was
41.2% of predicted annual sales (2015: 40.7%), which is well in line with historic range of 33%
to 42% over the last 5 years.
• In 2016 the Group anticipates a modest organic growth higher than in the previous year and
above the market research industry.
• The AOI (Adjusted Operating Income) margin should increase considerably.
Start of the year 2016
Guidance

31© GfK 2016 | Analyst call | March 18, 2016
Q&A…

32© GfK 2016 | Analyst call | March 18, 2016
Appendix

33© GfK 2016 | Analyst call | March 18, 2016
GfK´s strategy, the changing market environment andthe effect on Goodwill
• Focus on acquisitions to achieve a global footprint
• Strong growth of market research industry
• Competitive M&A environment drove high multiples
• Significant increase of Goodwill
• GfK managed as “Holding” company with independent local entities
„Internationalization“ of GfK – pre 2012
• New strategy focusing on organic growth . Selective technology driven acquisitions
• Decelerated growth, price pressure and commoditization in Customs Research market
• Changing environment makes transformation of GfK‘s business modelnecessary. Shift from local, low margin product portfolio to global, high marginofferings accepting overall reduced volumes
• Impairment test based on current market conditions and the new GfK businessmodel
• Goodwill impairment is cash neutral and therefore has no effect on investments and future business success
"Globalization and Integration" of GfK – since 2012
71 346 334 359 372119
573 448 413 402
2004 bis 2012 2013 2014 2015
CE
CC
GoodwillIn € m
CE goodwill
impairment-40
Group:FX effect
+45
774
Pre new strategy Post new strategy
Equityratio %
45.6 41.3 39.1 39.9 39.1
919
779 773
190
CE goodwill
impairment-113
Group: FX effect
-29
Goodwill impairment in Balance sheet: 39.8 m€, FX rate as of December 31, 2015; Goodwill impairment in Income Statement 2015: 39.4 m€, average FX rate (12 month 2015)
CEgoodwill
impairment-63
Group: FX effect
+53
34© GfK 2016 | Analyst call | March 18, 2016
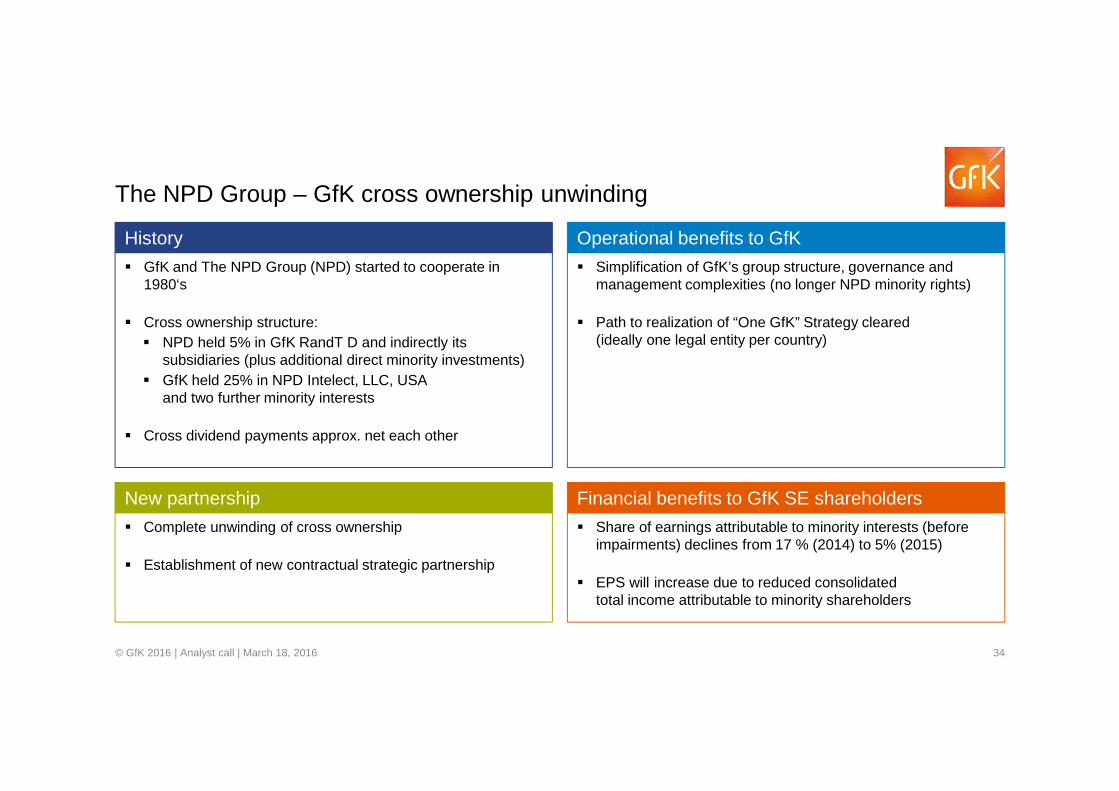
The NPD Group – GfK cross ownership unwinding
� Share of earnings attributable to minority interests (before impairments) declines from 17 % (2014) to 5% (2015)
� EPS will increase due to reduced consolidated total income attributable to minority shareholders
Financial benefits to GfK SE shareholders
� Simplification of GfK’s group structure, governance and management complexities (no longer NPD minority rights)
� Path to realization of “One GfK” Strategy cleared (ideally one legal entity per country)
Operational benefits to GfK
� Complete unwinding of cross ownership
� Establishment of new contractual strategic partnership
New partnership
� GfK and The NPD Group (NPD) started to cooperate in 1980‘s
� Cross ownership structure: � NPD held 5% in GfK RandT D and indirectly its
subsidiaries (plus additional direct minority investments)� GfK held 25% in NPD Intelect, LLC, USA
and two further minority interests
� Cross dividend payments approx. net each other
History