Embed Size (px)
Citation preview
Hamm
erson plc Annual Review and Sum
mary Financial Statem
ents 2003
ANNUAL REVIEW and SUMMARY FINANCIAL STATEMENTS 2003
Hammerson is a leadingEuropean propertycompany with a portfoliovalued at nearly £4 billion.
.02 Financial Highlights
.04 Business Highlights
.06 Board of Directors
.08 Chairman’s Statement
.12 Business Review
.14 Relationships
.16 Vision
.18 Performance
.20 Market Overview
.22 Objectives and Strategy
.24 Corporate Responsibility
.26 Portfolio Review
.32 Financial Review
.35 Summary Directors’ Report
.36 Summary Remuneration Report
.37 Auditors’ Report
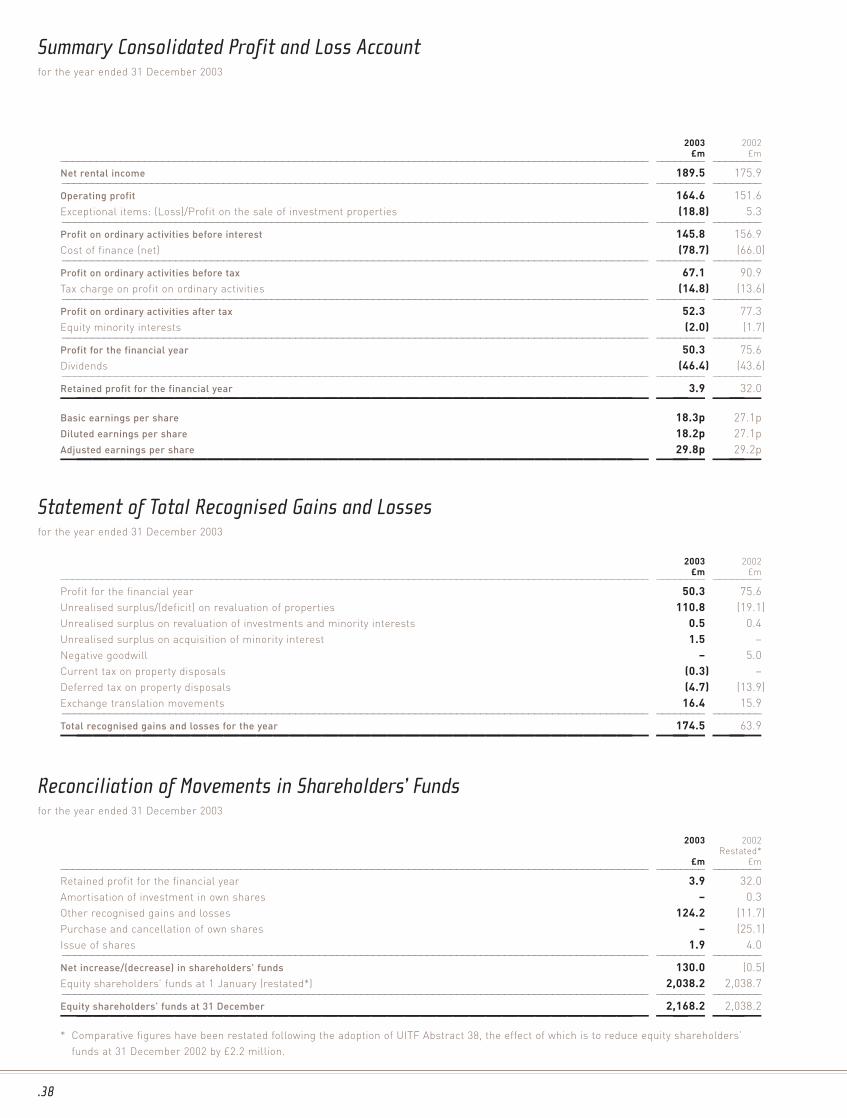
.38 Summary Consolidated Profit and Loss Account
.38 Statement of Total Recognised Gains and Losses
.38 Reconciliation of Movements in Shareholders’ Funds
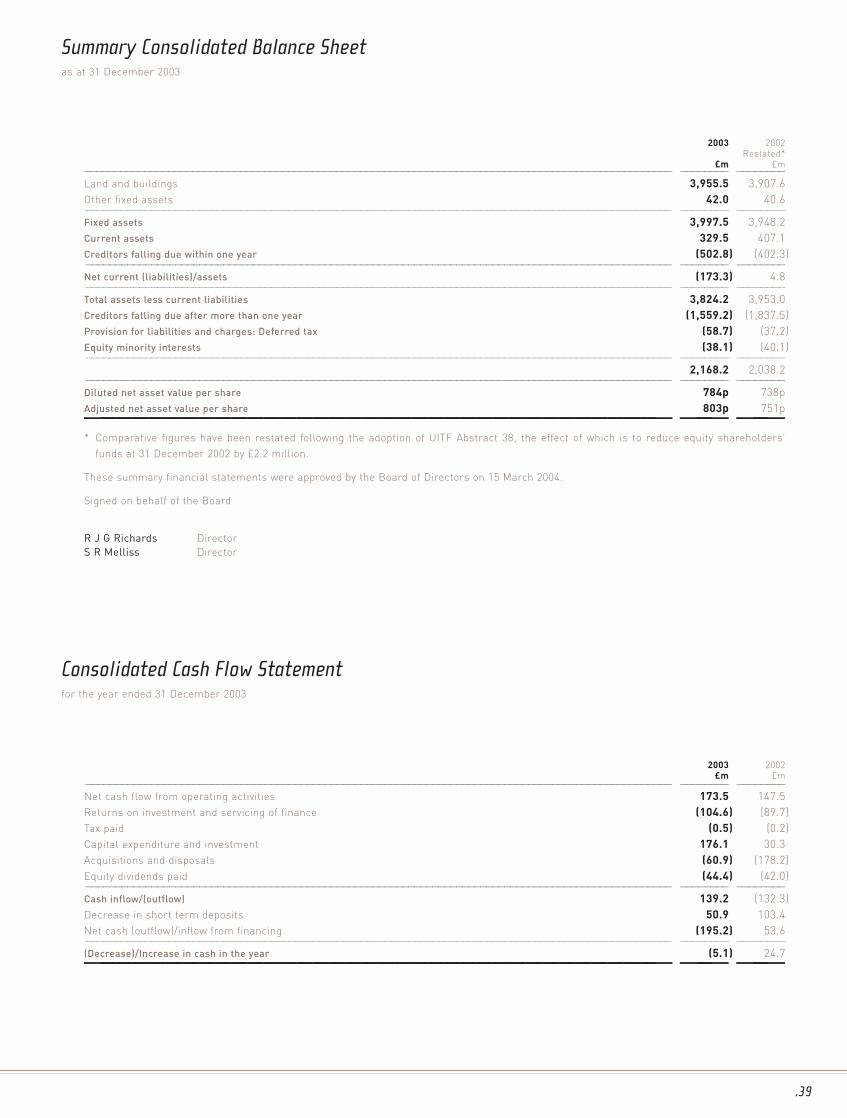
.39 Summary Consolidated Balance Sheet
.39 Consolidated Cash Flow Statement
.40 Five Year Financial Summary
.41 Shareholder Information
.42 Senior Management
.43 Principal Group Addresses
.44 Glossary of Terms
Pages 38 and 39 contain summary financial statements for the year. Financial information relating to any large group is complex and the aim hereis to present the key data on Hammerson’s financial performance.
All the information has been extracted from the Directors’ Report and Financial Statements. The summary financial statements do not present thedetail that is included in the Directors’ Report and Financial Statements and which would permit a comprehensive analysis of Hammerson’sperformance. Copies of the Directors’ Report and Financial Statements are available from the Company Secretary, Hammerson plc, 100 Park Lane,London W1K 7AR and are also shown on the group’s website, www.hammerson.co.uk.
.01
Hammerson has a reputationfor operating well managedproperties which provide
attractive and efficientenvironments and meetthe changing needs ofoccupiers and their customers.
The group’s high qualityportfolio provides around1,000,000 m2 of retail space and220,000 m2 of prime offices.
Hammerson – a leadingforce in European real estate.
Hammerson’s objective is to achieve attractivereturns to shareholders through a strategyof investment and development ina small number of key Europeanproperty markets.
.02
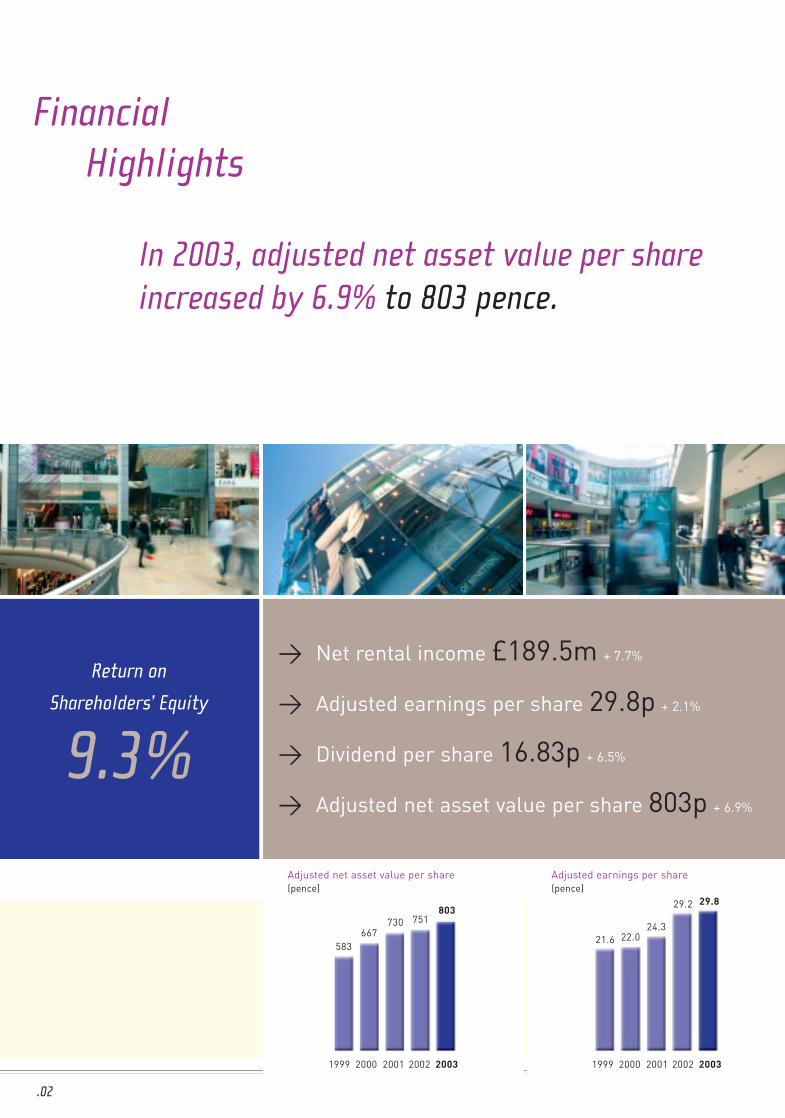
FinancialHighlights
In 2003, adjusted net asset value per shareincreased by 6.9% to 803 pence.
Return on
Shareholders’ Equity
9.3%
> Net rental income £189.5m + 7.7%
> Adjusted earnings per share 29.8p + 2.1%
> Dividend per share 16.83p + 6.5%
> Adjusted net asset value per share 803p + 6.9%
Adjusted earnings per share(pence)
21.6 22.024.3
29.829.2
1999 2000 2001 2002 2003
Adjusted net asset value per share(pence)
1999 2000 2001 2002 2003
583667
730803
751
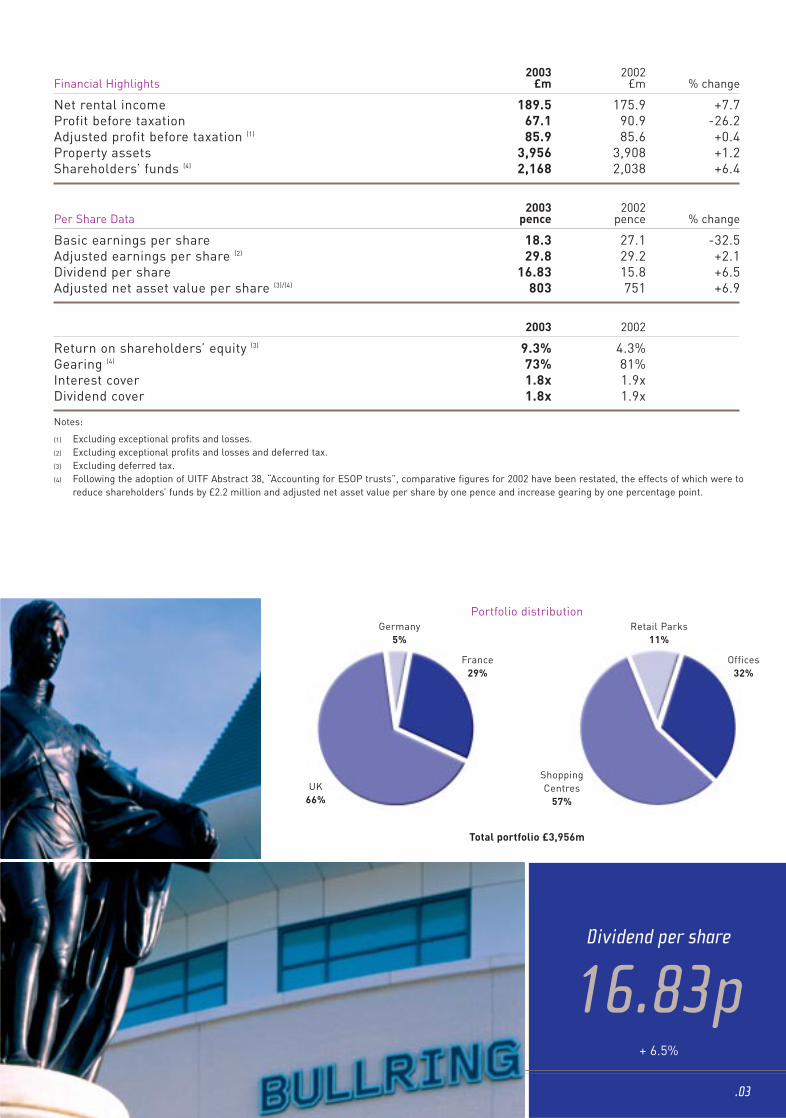
Dividend per share
16.83p+ 6.5%
2003 2002Financial Highlights £m £m % change
Net rental income 189.5 175.9 +7.7Profit before taxation 67.1 90.9 -26.2Adjusted profit before taxation (1) 85.9 85.6 +0.4Property assets 3,956 3,908 +1.2Shareholders’ funds (4) 2,168 2,038 +6.4
2003 2002Per Share Data pence pence % change
Basic earnings per share 18.3 27.1 -32.5Adjusted earnings per share (2) 29.8 29.2 +2.1Dividend per share 16.83 15.8 +6.5Adjusted net asset value per share (3)/(4) 803 751 +6.9
2003 2002
Return on shareholders’ equity (3) 9.3% 4.3%Gearing (4) 73% 81%Interest cover 1.8x 1.9xDividend cover 1.8x 1.9x
Notes:
(1) Excluding exceptional profits and losses.(2) Excluding exceptional profits and losses and deferred tax.(3) Excluding deferred tax.(4) Following the adoption of UITF Abstract 38, “Accounting for ESOP trusts”, comparative figures for 2002 have been restated, the effects of which were to
reduce shareholders’ funds by £2.2 million and adjusted net asset value per share by one pence and increase gearing by one percentage point.
Portfolio distribution
Total portfolio £3,956m
Germany5%
France29%
UK66%
Offices32%
Retail Parks11%
ShoppingCentres
57%
.03

.04
BusinessHighlights
Hammerson made further progress, bothin the UK and on the continent during 2003.Highlights included securing planning consent for over 75,000 m2 of new retail park
space and the continued growth within the UK and French shopping centre portfolios.
September saw the opening of Bullring, Birmingham, a major regional shopping
centre, where Hammerson was the development manager for The Birmingham
Alliance joint venture.

.05
February: Hammerson purchased for £17 million an industrial park in Sittingbourne,Kent, where it plans a retail-led redevelopment.
The pre-letting of the 75,000 m2 Bishops Square office development inLondon to Allen & Overy became unconditional following irrevocableplanning consent.
March: Two London office buildings, Globe House, London WC2, and 16 Old Bailey,London EC4, were sold for a total of £194 million.
May: Hammerson exchanged contracts for the sale of 53 quai d’Orsay,Paris 7ème, for £76 million.
June: Planning consent was received for a 23,600 m2 retail park on the outskirtsof Merthyr Tydfil, Wales.
July: Merseyway Shopping Centre, Stockport, was sold for £128 million.
August: Hammerson exchanged contracts for the sale of Luisencenter, Darmstadt,for £71 million.
September: Bullring in Birmingham, a 110,000 m2 regional shopping centre andEurope’s largest retail-led urban regeneration project, opened.
October: Hammerson secured planning consent for St. Oswald’s Retail Park,Gloucester, a proposed retail-led mixed use development on a 21 hectaresite close to the city centre.
November: Hammerson acquired Drakehouse Retail Park, Sheffield, for £60 million.
December: Hammerson exchanged contracts for the sale of its interest inCity Center shopping centre in Essen, Germany, for £20 million.
Key Events in 2003
In the last 12 months Hammerson has continued to recycle itscapital with £556 million raised through disposals and totalcapital investment of over £440 million.
.06
R R SPINNEY FRICS, CHAIRMAN – Ronald Spinney (62), a CharteredSurveyor, was appointed Chairman in 1999, having joinedHammerson as Chief Executive in 1993. He is Chairman of theNomination Committee. He is a Crown Estate Commissioner, adirector of EPRA, Chairman of Hanover Property Unit TrustInvestment Advisory Committee, a non-executive director ofRentokil Initial plc, Fuller Smith & Turner plc and HomestyleGroup plc and Chairman of London First Centre.
G F PIMLOTT MA, DEPUTY CHAIRMAN – Graham Pimlott (54) wasappointed non-executive Deputy Chairman in 2000, having beenappointed a non-executive director of Hammerson in 1993. He isChairman of the Audit Committee and a member of theRemuneration and Nomination Committees. He is a non-executive director of Tesco plc and Provident Financial plc andChairman of the Export Credits Guarantee Department.
R J G RICHARDS BSC, FRICS, CHIEF EXECUTIVE – John Richards (48), aChartered Surveyor, joined the Company in 1981 as adevelopment surveyor and was appointed a director of the UKbusiness in 1987. He was appointed a director of the Company in1990. He was responsible for Hammerson’s UK operations from1993 to 1998 and then took responsibility for the group’sinternational operations, prior to being appointed ChiefExecutive of Hammerson in 1999. He is a director and immediatepast President of the British Council of Shopping Centres.
R J O BARTON CA, MBA – John Barton (59) was appointed a non-executive director of Hammerson in 1998. He is Chairman of theRemuneration Committee and a member of the NominationCommittee. He is Chairman of Wellington Underwriting plc anda non-executive director of WH Smith Group plc, Next plc and theGeneral Insurance Standards Council.
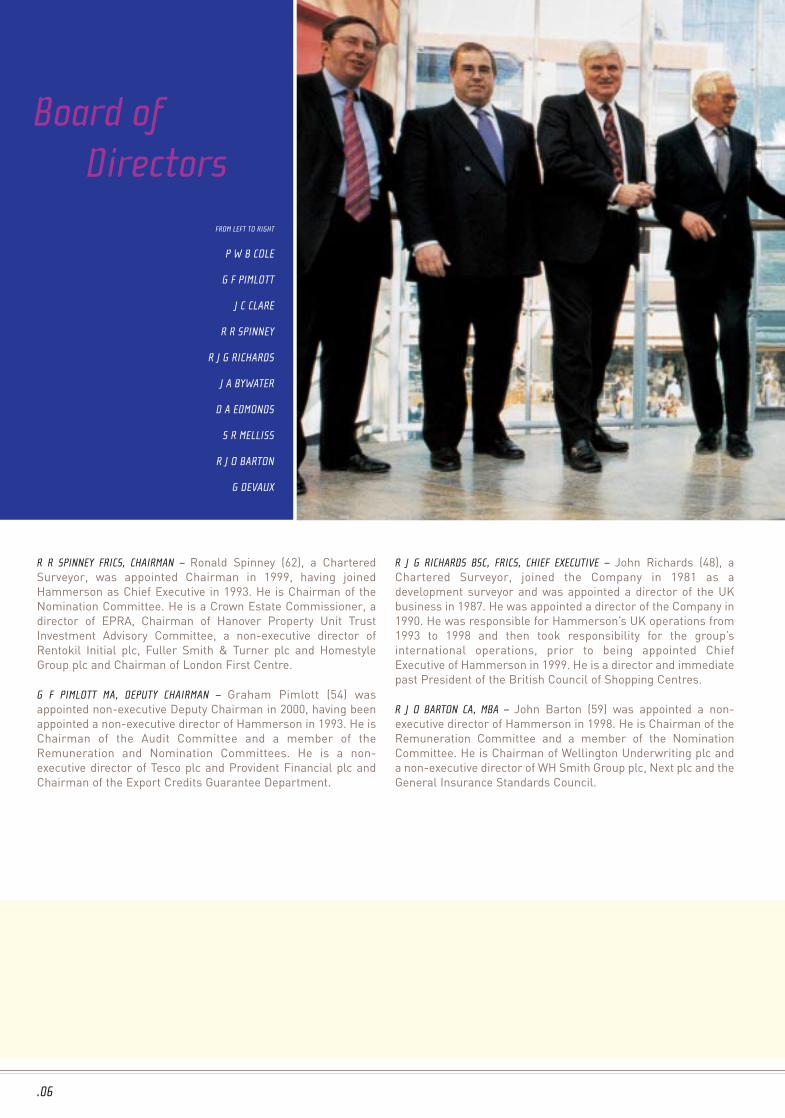
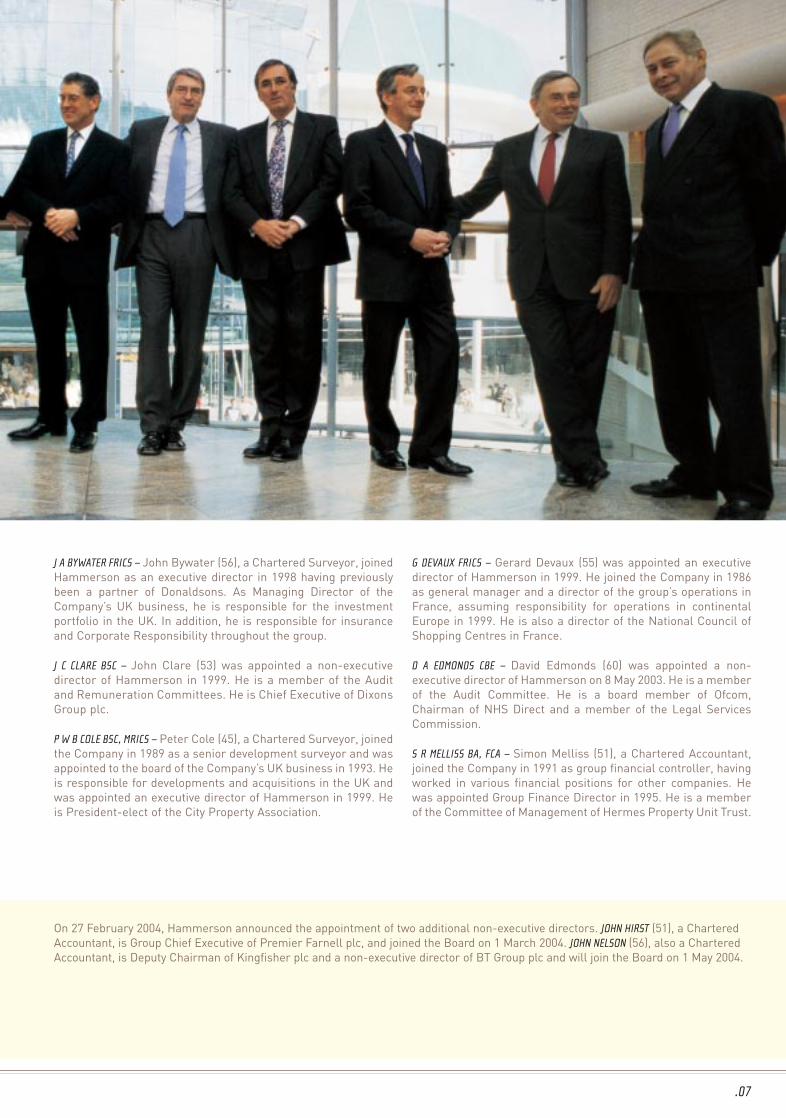
Board of Directors
FROM LEFT TO RIGHT
P W B COLE
G F PIMLOTT
J C CLARE
R R SPINNEY
R J G RICHARDS
J A BYWATER
D A EDMONDS
S R MELLISS
R J O BARTON
G DEVAUX
.07
J A BYWATER FRICS – John Bywater (56), a Chartered Surveyor, joinedHammerson as an executive director in 1998 having previouslybeen a partner of Donaldsons. As Managing Director of theCompany’s UK business, he is responsible for the investmentportfolio in the UK. In addition, he is responsible for insuranceand Corporate Responsibility throughout the group.
J C CLARE BSC – John Clare (53) was appointed a non-executivedirector of Hammerson in 1999. He is a member of the Auditand Remuneration Committees. He is Chief Executive of DixonsGroup plc.
P W B COLE BSC, MRICS – Peter Cole (45), a Chartered Surveyor, joinedthe Company in 1989 as a senior development surveyor and wasappointed to the board of the Company’s UK business in 1993. Heis responsible for developments and acquisitions in the UK andwas appointed an executive director of Hammerson in 1999. Heis President-elect of the City Property Association.
G DEVAUX FRICS – Gerard Devaux (55) was appointed an executivedirector of Hammerson in 1999. He joined the Company in 1986as general manager and a director of the group’s operations inFrance, assuming responsibility for operations in continentalEurope in 1999. He is also a director of the National Council ofShopping Centres in France.
D A EDMONDS CBE – David Edmonds (60) was appointed a non-executive director of Hammerson on 8 May 2003. He is a memberof the Audit Committee. He is a board member of Ofcom,Chairman of NHS Direct and a member of the Legal ServicesCommission.
S R MELLISS BA, FCA – Simon Melliss (51), a Chartered Accountant,joined the Company in 1991 as group financial controller, havingworked in various financial positions for other companies. Hewas appointed Group Finance Director in 1995. He is a memberof the Committee of Management of Hermes Property Unit Trust.
On 27 February 2004, Hammerson announced the appointment of two additional non-executive directors. JOHN HIRST (51), a CharteredAccountant, is Group Chief Executive of Premier Farnell plc, and joined the Board on 1 March 2004. JOHN NELSON (56), also a CharteredAccountant, is Deputy Chairman of Kingfisher plc and a non-executive director of BT Group plc and will join the Board on 1 May 2004.

.08
I am pleased to report on another year of good progress forHammerson with further growth in rental income and net assetvalue. This was against a background of challenging conditionsin several of the group’s markets. In line with the group’sstrategy of recycling capital, £556 million was raised throughdisposals, compared with total capital investment of over£440 million. The retail portfolio weighting increased by threepercentage points to 68% at the end of the year.
Chairman’sStatement
.09
There was a sound performance from the group’s retail properties in the UK and France, which showed good underlying rentalgrowth and valuation increases. Particular highlights were the completion and opening of Bullring shopping centre in Birminghamin September and the encouraging progress in the group’s retail parks business. Our entry into the retail parks market at the endof 2002 has proved to be very successful and the portfolio continues to offer excellent growth prospects.
Conditions in the London and Paris office markets were challenging in 2003. As a consequence, our three office schemes,completed towards the end of the year at a total cost of £268 million, remain unlet. However, we recently announced the firstletting at One London Wall and I am encouraged by the increasing level of interest from prospective occupiers.
Since the year end Hammerson has arranged a £300 million unsecured bond issue with a term of 22 years. This furtherstrengthens the group’s financing structure and balance sheet.
At the end of January 2004, a major block of Hammerson shares, amounting to nearly 20% of the Company’s equity and previouslyowned by Standard Life Investments, was successfully placed with a wide range of existing and new shareholders.
FINANCIAL
In 2003, Hammerson achieved an underlying increase in
rental income overall of 6.9%. In the retail portfolio, the
like-for-like increase was 8.8% following successful
rent reviews and lease renewals.
The increase in rental income was largely offset by an
increase in financing costs, reflecting the fact that
interest is no longer being capitalised on the recently
completed office developments, together with the cost
of holding assets pending their redevelopment. Profit
before tax and exceptional items rose by £0.3 million to
£85.9 million in 2003. There was an exceptional loss of
£18.8 million on property disposals which realised more
than £550 million. The loss related primarily to the
disposal of a retail property in Germany.
Adjusted earnings per share rose by 2.1% to 29.8 pence.
The directors are recommending a final dividend of
11.71 pence, compared with 10.99 pence in 2002. This
makes a total dividend for the year of 16.83 pence, an
increase of 6.5%.
There was an underlying increase of 2.9% in the value of
the group’s properties during 2003. An increase in the
value of the group’s retail portfolio of 7.1% more than
offset a decrease of 5.1% in the value of the offices.
Adjusted net asset value per share rose by 52 pence or
6.9% to 803 pence, principally due to the increase in
property values. The return on equity was 9.3% in 2003,
compared with 4.3% in 2002.
MARKETS AND OUTLOOK
Retail PropertyUK retail sales continued to grow overall in 2003, but
with considerable variation from month to month and at
a somewhat lower rate than during the previous year.
Anticipated continued growth in consumer spending in
2004 should support increases in rental levels at major
regional shopping centres and retail parks.
In France, retail sales growth showed a further
improvement in 2003, although monthly movements
were quite volatile. As in the UK, demand for space from
retailers has focused on the larger, higher turnover
shopping centres. The more positive outlook for the
French economy, accompanied by increasing consumer
confidence, should encourage rental growth.
In both the UK and France investor sentiment towards
retail property remained positive.
In Germany, the economy and consumer confidence
weakened further in 2003, leading to lower retail
spending and rents. The outlook for the retail property
sector remains subdued.
Office PropertyConditions in the office occupational markets in London
and Paris remained challenging in 2003, with a further
fall in rents. Nevertheless, investor demand for prime
office assets in both markets remained strong, due
principally to the low interest rate environment.
There was a sound performance from thegroup’s retail properties in the UK and France.
.10
MARKETS AND OUTLOOK (continued)
In London, whilst there was some pick up in office
occupational demand from the low level of the previous
year, the large number of development completions led
to a higher overall vacancy rate putting further
pressure on prime rents. However, with virtually no
developments started in 2003, the supply of new prime
London office space coming to the market during 2005
and 2006 is limited. This, coupled with a recovery in the
banking and financial services sectors, is expected to
lead to a reduction in vacancy levels and a gradual
increase in rents.
In Paris, headline office rents showed a modest decline
during 2003. Looking ahead, the anticipated improvement
in the economy and business confidence should lead to
increased demand from occupiers and some recovery in
rental levels.
TAXATION
The Board announced on 1 March 2004 that it has
applied to list the Company’s shares on the Premier
Marché of Euronext, Paris, the French Stock Exchange.
This follows legislation passed in France at the end of
2002, which permits real estate companies listed in
France to elect into a new tax exempt regime. It is
Hammerson’s intention to make such an election. As a
consequence, Hammerson’s French business, which
now accounts for nearly 30% of the total portfolio,
would, in return for a one-off charge of approximately
£70 million, payable in four equal annual instalments,
become largely exempt from tax on income and capital
gains. At the same time deferred tax of approximately
£45 million would be released and the group’s
contingent tax liability reduced by around £121 million.
The full effect of this would be reflected in the group’s
2004 accounts.
This is a very positive development, which should benefit
Hammerson’s operations in France and the group
overall.
I am also encouraged that the UK Government has
recently begun a consultation exercise, in which
Hammerson is participating, in connection with the
possible introduction of tax transparent property
vehicles in the UK.
THE BOARD
In May, David Edmonds joined the Board as a
non-executive director. He is a board member of Ofcom,
Chairman of NHS Direct and member of the Legal
Services Commission.
I am delighted to confirm the appointment of two
additional non-executive directors. John Hirst, a
Chartered Accountant, is Group Chief Executive of
Premier Farnell plc and joined the Board on 1 March
2004. John Nelson, who is also a Chartered Accountant
and a former senior investment banker, is Deputy
Chairman of Kingfisher plc and a non-executive director
of BT Group plc and will join the Board with effect from
1 May 2004. I am sure that both will make major
contributions to Hammerson.
Frank Charnock stood down from the Board in May. We
are grateful to him for his wise counsel and contribution
to Hammerson over the last nine years.
CONCLUSION
Another year of progress for Hammerson saw further
growth in the group’s rental income and net asset value,
with the good performance of our retail assets more
than offsetting the lower returns from offices. The policy
of progressive increases in dividends has been
maintained with a proposed rise of 6.5% this year.
We have announced plans to seek a listing on Euronext
in Paris. This should enable us to take advantage of tax
exempt status for our French business, which now
represents almost 30% of the group’s total portfolio.
Conditions in the group’s principal retail markets
appear favourable and I am encouraged by the recent
signs of an improvement in the central London office
market. The group has a high quality portfolio, which
together with the opportunities presented by the future
development programme, give me great confidence in
Hammerson’s continued success.
I would like to thank all of our staff, customers,
suppliers, and other stakeholders for their continued
commitment and contribution to the group.
Ronald SpinneyChairman
15 March 2004
Chairman’s Statement (continued)
.11
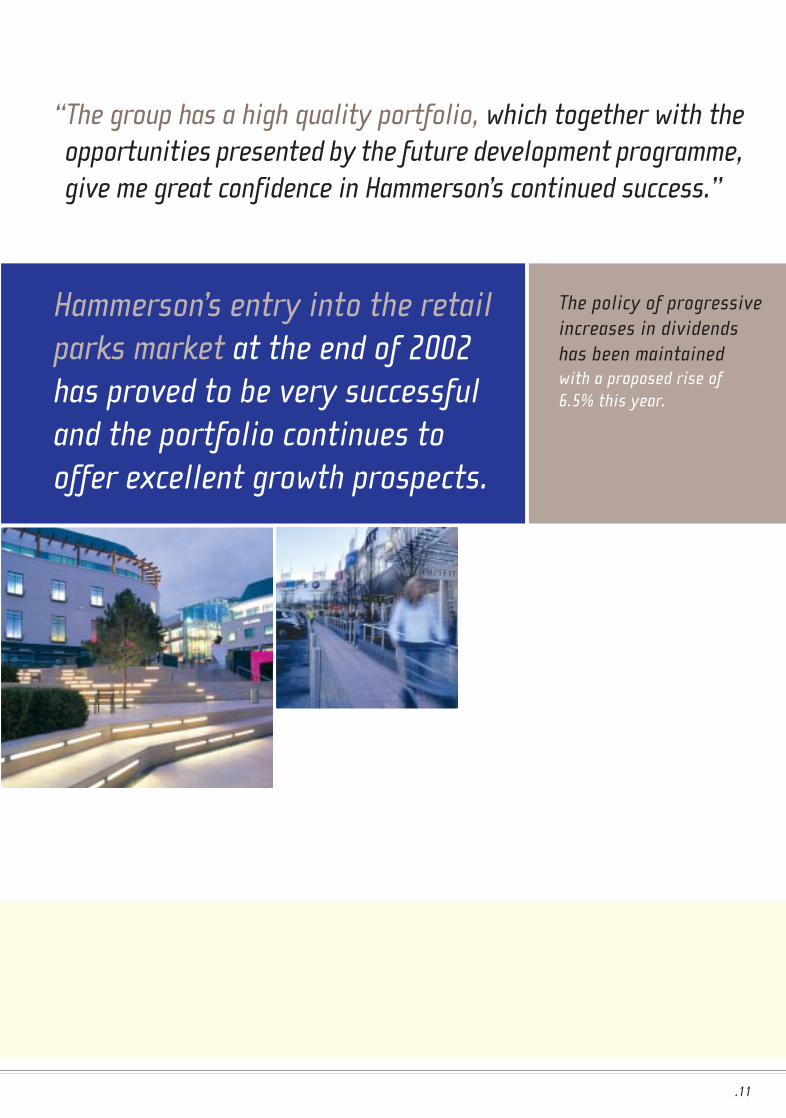
“The group has a high quality portfolio, which together with theopportunities presented by the future development programme,give me great confidence in Hammerson’s continued success.”
The policy of progressiveincreases in dividendshas been maintainedwith a proposed rise of6.5% this year.
Hammerson’s entry into the retailparks market at the end of 2002has proved to be very successfuland the portfolio continues tooffer excellent growth prospects.

.12
Business Review
The strategy we have followed has generated growth inadjusted net asset value per share over the past five yearsof 10% per annum and in adjusted earnings per share of 7%per annum. During the same period, dividends increased by5.6% per annum and the total return to shareholders hasaveraged 17.5% per annum.
.13
Over the past five years, Hammerson has maintained its policy of actively recyclingits capital. During this period some £2 billion has been raised from propertydisposals, whilst acquisitions have totalled £1.5 billion and almost £1 billion hasbeen invested in new developments and improvements to existing assets.
We have completed and successfully launched three major shopping centres in theUK, entered and achieved critical mass in the retail parks sector and enhanced ourbusiness on the continent. Hammerson now has a portfolio of the highest quality.
The group has many opportunities for future developments in the UK and France. We areworking in partnership with a number of towns and cities on major retail-led schemes andhave the potential to expand and improve several of our shopping centres. Developmentremains an important part of Hammerson’s strategy.
Regeneration and development require private capital. Access to this capital wouldundoubtedly be helped by the introduction of tax transparent vehicles, an issue that is onthe agenda in both the UK and France. Indeed, Hammerson has announced that it will beseeking a listing of its shares on Euronext, in order to benefit from the introduction of thenew SIIC tax exempt status in France. The UK Government is expected to startconsultations in connection with the introduction of a tax transparent vehicle for propertyownership in the UK. We believe such a vehicle could prove attractive to all parties,including investors, the property industry and the Government.
Whether or not such a vehicle is introduced, Hammerson will continue to focus on achievinga balance between earnings growth and capital appreciation. The strategy we have followedhas generated growth in adjusted net asset value per share over the past five years of 10%per annum and in adjusted earnings per share of 7% per annum. During the same period,dividends increased by 5.6% per annum and the total return to shareholders has averaged17.5% per annum.
It remains our objective to continue to drive Hammerson’s performance and generateattractive returns to shareholders.
John RichardsChief Executive
15 March 2004

.14
Partnership… a hallmark of Hammerson’s approach.
Opened in September 2003, BULLRING is a very successful example of a major retail-led city
centre regeneration project.
This success has been forged on Partnership. A partnership of threeinvestors coming together to form The Birmingham Alliance and embracinga fourth partner, Birmingham City Council.
A partnership between the Alliance and the many organisations andindividuals involved in the planning and construction of the project.A partnership with the retailers who have brought vitality andexcitement to the scheme.
Above all a partnership with the people of Birmingham who arebenefiting from a revitalised city centre.
Jon Emery, Project Directorof Bullring (pictured right),Sheila King, Head of Leasingand Simon Wallis,Development Executive.
RReellaattiioonnsshhiippss

.15
.16
.17
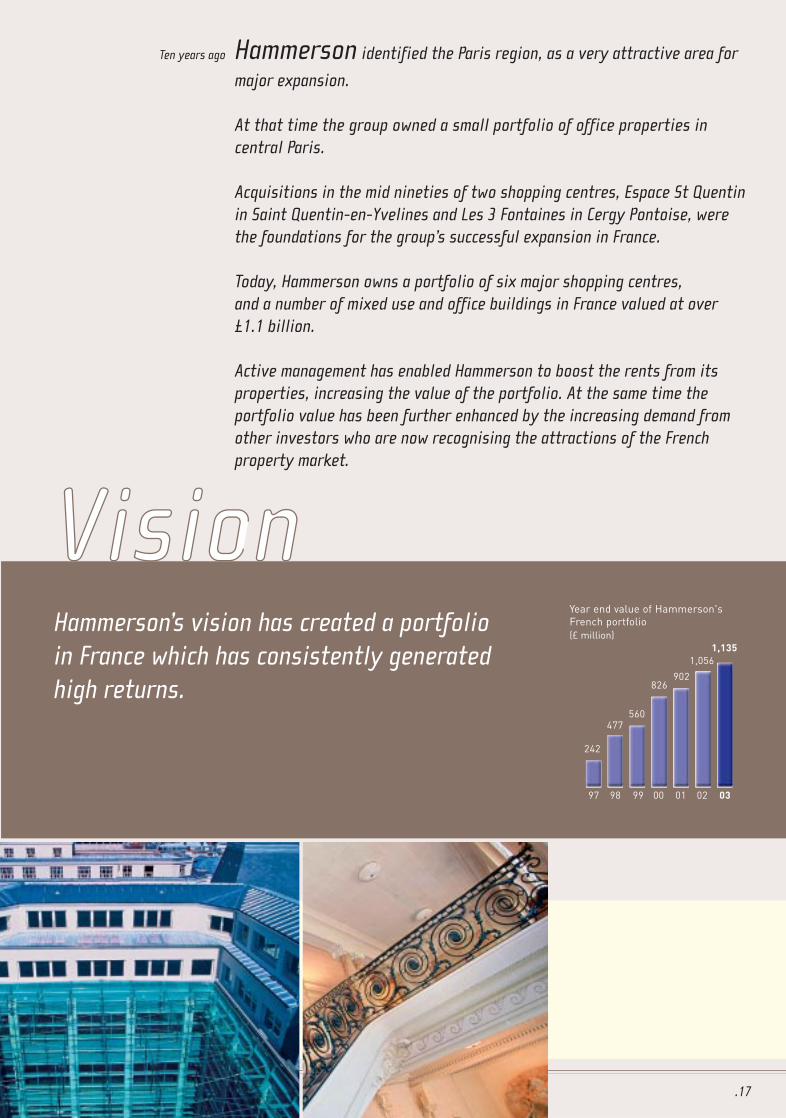
Hammerson’s vision has created a portfolioin France which has consistently generatedhigh returns.
Ten years ago Hammerson identified the Paris region, as a very attractive area for
major expansion.
At that time the group owned a small portfolio of office properties incentral Paris.
Acquisitions in the mid nineties of two shopping centres, Espace St Quentinin Saint Quentin-en-Yvelines and Les 3 Fontaines in Cergy Pontoise, werethe foundations for the group’s successful expansion in France.
Today, Hammerson owns a portfolio of six major shopping centres,and a number of mixed use and office buildings in France valued at over£1.1 billion.
Active management has enabled Hammerson to boost the rents from itsproperties, increasing the value of the portfolio. At the same time theportfolio value has been further enhanced by the increasing demand fromother investors who are now recognising the attractions of the Frenchproperty market.
Year end value of Hammerson'sFrench portfolio(£ million)
97 98 99 00 01 02 03
242
560
826
1,0561,135
477
902
VViissiioonn
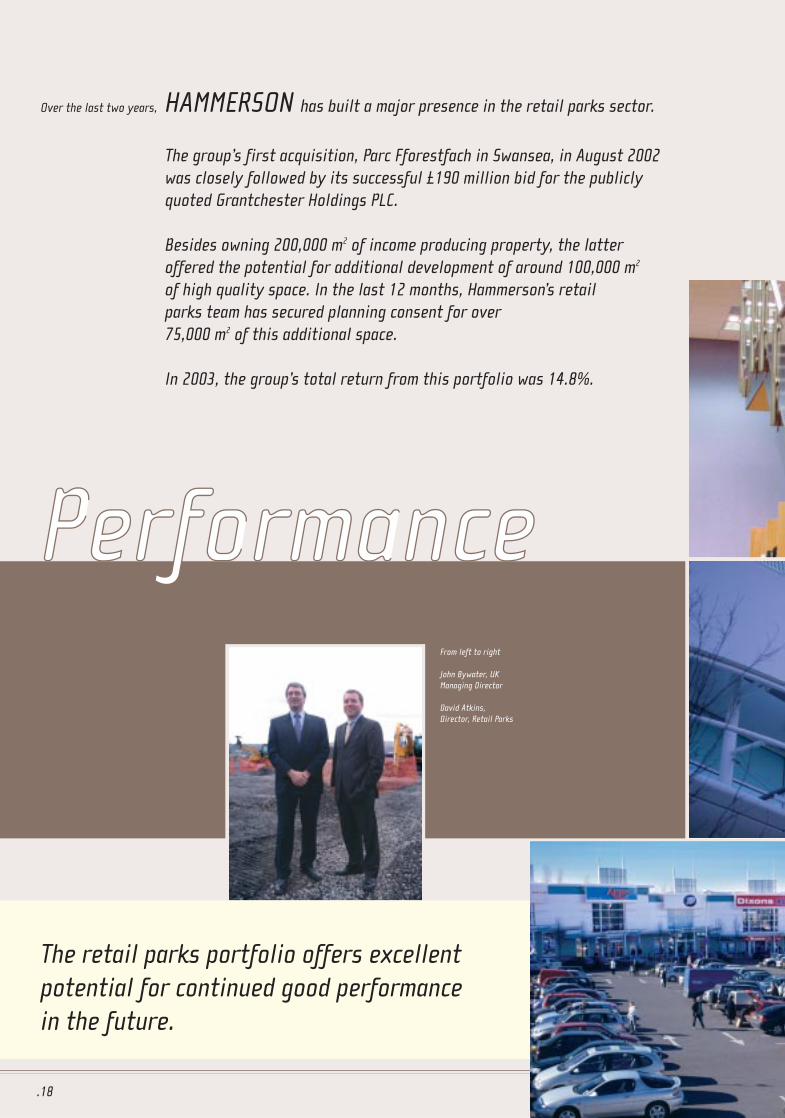
Over the last two years, HAMMERSON has built a major presence in the retail parks sector.
The group’s first acquisition, Parc Fforestfach in Swansea, in August 2002was closely followed by its successful £190 million bid for the publiclyquoted Grantchester Holdings PLC.
Besides owning 200,000 m2 of income producing property, the latteroffered the potential for additional development of around 100,000 m2
of high quality space. In the last 12 months, Hammerson’s retailparks team has secured planning consent for over75,000 m2 of this additional space.
In 2003, the group’s total return from this portfolio was 14.8%.
.18
From left to right
John Bywater, UKManaging Director
David Atkins,Director, Retail Parks
The retail parks portfolio offers excellentpotential for continued good performancein the future.
PPeerrffoorrmmaannccee
.19
.20
Market Overview
ECONOMIC ENVIRONMENT
The global economy improved substantially in 2003 and preliminary figures for the UK show the economy to have
expanded by 2.3%, compared with 1.8% in 2002. The outlook is for a further increase in growth in 2004.
Conditions in the Eurozone, particularly in France and Germany, proved to be more difficult with little growth overall in
2003. Looking ahead, both France and Germany should see higher growth and more favourable conditions in 2004.
UK RETAIL
Retail sales volumes for comparison goods grew by 4.5% in 2003, compared to 8.1% in the previous year. Despite
this slowdown in growth, regional shopping centres and retail parks continued to attract retailers and their
customers and therefore generate rental growth.
Investor sentiment towards retail property remained strong throughout 2003 and there was further downward
movement in retail yields.
LONDON OFFICES
In the London office market, occupational take-up increased by around 20% in 2003, albeit from the low levels
experienced in 2002. This was primarily due to higher take-up in the City of London, with the second half of the year
seeing a more positive business sentiment and improving economic environment.
Whilst this is encouraging, take-up in absolute terms remained comparatively low. Furthermore, a large number of
new developments were completed, leading to increased vacancy levels. Consequently, over the course of 2003,
prime rents fell by around 10% in both the City and the West End.
The completion of speculative developments will increase new supply further during 2004. Encouragingly,
development starts have fallen sharply in the past twelve months, with the effect that little new space is projected
to be added to office supply during 2005 and 2006. With improving demand from occupiers, a recovery in rents can
be anticipated.
Investor demand has been concentrated on prime offices let on long leases to strong covenants, rather than higher
risk properties with imminent vacancy or other uncertainties. Investor demand should be maintained as the
occupational market recovers.
Investor sentiment towards retail propertyremained strong throughout 2003 and there wasfurther downward movement in retail yields.
.21
FRANCE RETAIL
French retail sales volumes for comparison goods grew by 2.5% in 2003 compared to just 1.3% in 2002, with demand
from retailers being focused in high-turnover locations, supporting rental growth in major shopping centres. The
indexation terms of French leases, which are linked to construction inflation, boosted rental income on many
existing leases by 2.1% from the start of 2003. Looking forward, improvements in the rate of growth of the French
economy and in consumer confidence are forecast to sustain further rental growth.
There were few transactions involving major shopping centres in the French market in 2003. Nonetheless, the strong
demand for those assets that have come to the market has supported prime yields on shopping centres in the Paris
region.
PARIS OFFICES
Occupational demand rose in central Paris in 2003 compared to the previous year, although much of the demand
was for secondhand space. Given the restrictions on office development in the area, the volume of new supply that
can be added in the Central Business District is limited. Consequently, even at a time of weakness in the office cycle,
the vacancy rate in central Paris rose by less than one percentage point to 5.7% in the year to 31 December 2003.
Prime headline rents fell by between 5% and 10% during 2003. Looking ahead, an improvement in the economic
outlook is expected to give occupiers the confidence to take space in the prime central Paris locations.
The Paris office market has remained popular with investors, particularly the German open-ended funds who have
been active purchasers during 2003. Due to strong demand from such investors, prime yields on offices have
remained stable.
GERMAN RETAIL
Despite a revival in business sentiment, confidence among German consumers has so far failed to recover, with
unemployment remaining high. This was reflected in retail sales volumes falling by around 1% in 2003, applying
downward pressure to retail rents. Although an improvement in economic growth and consumer confidence is
anticipated, the outlook for sales and rental growth remains subdued.
The Paris office market has remained popularwith investors, particularly the German open-endedfunds, who have been active purchasers in 2003.

.22
ObjectivesFINANCIAL
The group invests in assets to create value for shareholders by achieving returns above its cost of capital. The
business is financed by an appropriate mix of shareholders’ equity and debt so as to enhance the return to
shareholders. In this way, Hammerson seeks to achieve its primary financial objective of an annual return on equity
greater than its cost of equity, whilst maintaining a sound financial structure and adopting appropriate risk
management procedures.
CORPORATE
Hammerson’s objective is to build on its position as one of Europe’s most successful real estate companies, by
exploiting its key competitive advantages, including its reputation for innovation, the quality of its relationships and
its financial strength.
Business StrategyHammerson’s strategy is to invest in, develop and manage properties in key European markets.
Hammerson’s strategy provides the group with a range of attractive investment opportunities. This enables
Hammerson to increase returns by taking advantage of different market cycles. Recycling of capital is fundamental
to this strategy. Management carries out rigorous reviews of each property in its portfolio, benchmarking
performance against its hurdle rates. In addition, Hammerson is able to share ideas, information and contacts
between the teams at its various operations.
By investing in retail property in more than one country, Hammerson benefits from its excellent relationships with
retailers, many of whom are pursuing European expansion programmes, and from its group-wide development and
property management expertise.
The group’s strategy for its developments has three elements: first, to create properties valued at substantially more
than their cost; second, to generate income above the group’s cost of finance, thereby increasing earnings per share;
and third, to create assets which would be difficult to acquire on the open market and which offer potential for good
growth in income and capital.
Financial StrategyThe Board believes that shareholder returns can be enhanced by active management of the group’s debt and equity
capital. The return of capital to shareholders, including the purchase of the Company’s own shares, is evaluated against
alternative investment opportunities and takes account of the share price compared with net asset value per share.
Objectives and Strategy
.23
Risk ManagementThe management of risk is an integral part of Hammerson’s approach to running its business. It is addressed in the
annual Business Plan and is subject to regular review both to assess progress and reflect changes in economic and
investment conditions. Set out below are some of the key risks and how these are managed.
MARKET RISK
The group follows a policy of investing in politically stable, sound economies in the UK and continental Europe in the
retail and office sectors. It is therefore diversified both by country and sector. The group makes extensive use of
research to help it to identify future market trends.
PROPERTY RISK
Hammerson’s properties are generally of high quality and in prime locations. Hammerson has therefore been able
to attract as tenants large businesses, professional firms and major retailers.
Many of the group’s leases are long term with varying expiry dates and, in the UK, upward only rent reviews. This
reduces the risk of having to attract new tenants or renegotiate rents for a substantial part of the portfolio at a period
of weak occupational demand.
Hammerson’s retail properties are, to a certain extent, protected from competitor action by the restrictive planning
regulations in the countries in which the group operates.
Development risk is managed by phasing the development programme, by rigorous project management and
procurement, and by timely marketing and letting of major developments. In the case of very large projects,
Hammerson often reduces its risk by entering into joint ventures. The balance within the portfolio between
investment and development is monitored so as to control the overall development risk at any one time.
Post completion reviews identify lessons to be learnt from projects and these contribute towards improving the way
in which future projects are managed.
TREASURY RISK
Hammerson operates a centralised treasury function with clear authorities for the implementation of the treasury
objectives and policies established by the Board.
The treasury department operates as a cost centre and not as a profit centre and there are internal controls to
ensure that no transactions can be undertaken on a speculative basis. Regular reports are produced which enable
management to monitor and control treasury activities closely.
In order to maintain operational flexibility, Hammerson’s policy is to borrow on an unsecured basis on the strength
of the group’s covenant. Management arranges the group’s borrowings to maintain short term liquidity and ensure
an appropriate maturity profile and balance between fixed and floating rate debt.
HUMAN RESOURCES
Attracting and retaining the right people is important to Hammerson’s business. The group employs skilled local
teams with good experience of their markets. Hammerson encourages staff to build on their skills, through
appropriate training and regular performance appraisals, to enable them to contribute to the growth of the group.
REPUTATION
Hammerson has an excellent reputation for its property management and development skills. To enhance its
reputation Hammerson is careful to ensure that it communicates clearly with its customers, suppliers, local
communities and other stakeholders and acknowledges their views and opinions.
Directors and senior management are encouraged to represent the Company’s views by serving on the boards of
industry bodies such as the British Property Federation, British Council of Shopping Centres, City Property
Association, the European Public Real Estate Association and Fédération des Sociétés Immobilières et Foncières.

.24
CorporateResponsibility
Working with and within the local community is important to Hammerson.
Hammerson recognises itsresponsibilities to others. Ourcustomers, suppliers, staff, shareholders andthe local communities in which the group’sproperties are located, all have a directinterest in the way we run our business. Thegroup recognises the importance of effectivecommunication with all these audiences.
IR MAGAZINE AWARDS 2003 PRESENTED TO HAMMERSON
> GRAND PRIX FOR BEST INVESTOR RELATIONSBY A FTSE 250 COMPANY
> BEST DISCLOSURE PRACTICE
> BEST CORPORATE GOVERNANCE
> BEST INVESTOR RELATIONS WEBSITE
> BEST INVESTOR RELATIONSDURING A TAKEOVER
> BEST ANNUAL REPORT
> BEST INVESTOR RELATIONS OFFICER

We recognise the positive impact we can have on the many visitors to the group’sretail centres and office buildings by the use of good design and the creation ofattractive and efficient environments.
Hammerson has clear policies in relation to corporate responsibility, includingcorporate governance and ethics, employee relations, health and safety,environmental management and community involvement.
Hammerson is a member of both Dow Jones SGI and FTSE4Good Indices, as well as aparticipant in Business in the Environment’s annual index of corporate environmentalengagement.
During 2003, the group produced its first Corporate Responsibility Report. This hasbeen updated to reflect the group’s performance on meeting its objectives and thisinformation can be found in the document ‘Corporate Responsibility 2004’, whichaccompanies these accounts, and on Hammerson’s website www.hammerson.co.uk.
.25
Hammerson was the winner of
the Built Environmentcategory of the 2004Liveable City Awards.
THE BULLRING JOBS BUS
.26
PortfolioReview
At 31 December 2003, Hammerson’s portfolio hada book value of £3,956 million.
The retail component of the portfolio increased from 65%at the beginning of the year to 68% at 31 December 2003.Retail parks now account for 11% of the group’s portfolio.The distribution between the UK and continental Europewas unchanged at 66% and 34% respectively at year end.
Total capital additions amounted to £364 million in 2003. Of this £202 million was invested in the developmentprogramme, £101 million was attributable to acquisitions and £61 million was spent on the existing portfolio.
Hammerson now has a retail portfolio of 16 major shopping centres and 11 retail parks, providing over one millionsquare metres of retail space. The group’s office portfolio consists of 12 prime office buildings located in centralLondon and central Paris with a total area of over 220,000 m2.
During 2003, the group renewed over 130 expiring leases and carried out over 50 rent reviews, which, together withrent reviews and renewals in 2002, resulted in an underlying increase in rents of 6.9%.
The value of the development programme at 31 December 2003 was £328 million compared with £468 million at theend of the previous year. This reduction reflects the completion of Bullring shopping centre in Birmingham inSeptember 2003 and the completion of office developments in London and Paris.
VACANCY
At the end of 2003 the vacancy within the group’s portfolio stood at 9.2% compared with 5.0% at the end of2002. The increase resulted mainly from the completion, in the second half of 2003, of the three officedevelopments at One London Wall and 10 Grosvenor Street, London and Néo, 14 boulevard Haussmann in Paris,each of which were unlet at 31 December 2003. Excluding these properties the portfolio vacancy rate wouldhave been 5.6%.
.27
Portfolio Review
.28
Portfolio Review (continued)
Portfolio Informationfor the year ended 31 December 2003
Net Underlying Average
rental Properties valuation Total Reversionary/ unexpired
income at valuation change return (Over-rented) lease term
£m £m % % % Years—————————————————————————————————————————— ————————————————— ————————————————— —————————————————
Note (1)
—————————————————————————————————————————— ————————————————— ————————————————— —————————————————
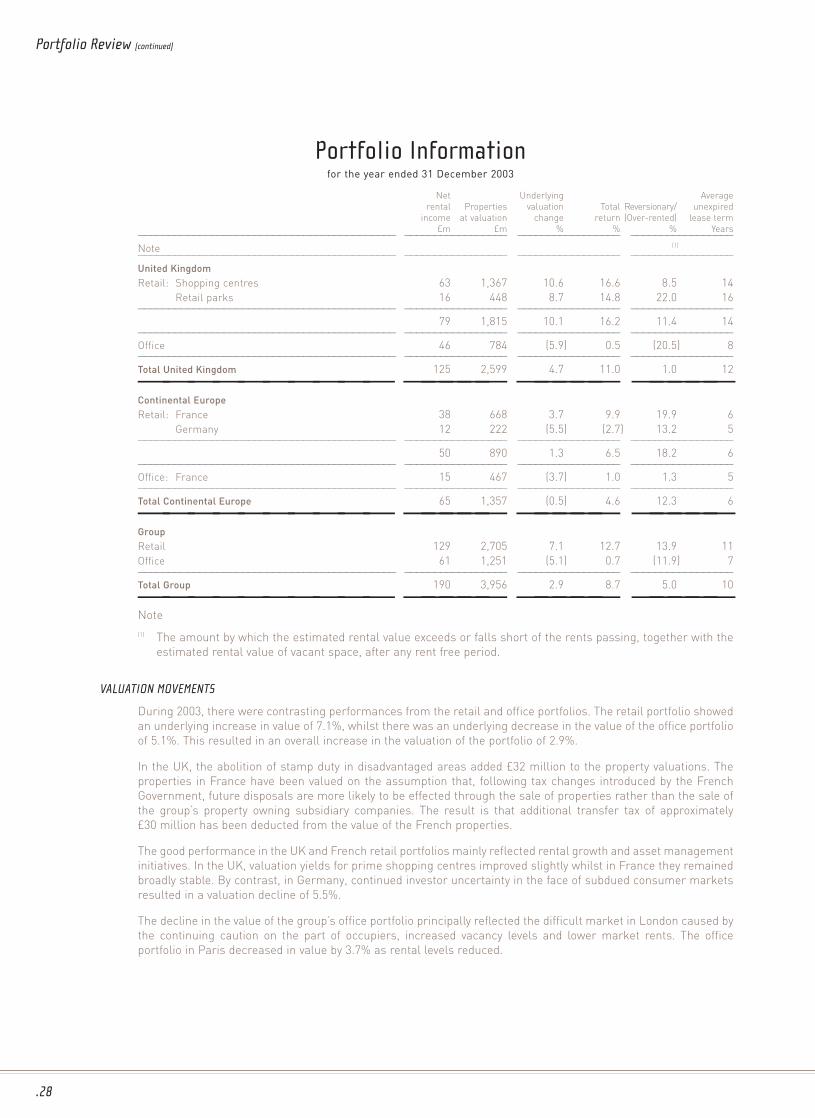
United KingdomRetail: Shopping centres 63 1,367 10.6 16.6 8.5 14
Retail parks 16 448 8.7 14.8 22.0 16—————————————————————————————————————————— ————————————————— ————————————————— —————————————————
79 1,815 10.1 16.2 11.4 14—————————————————————————————————————————— ————————————————— ————————————————— —————————————————
Office 46 784 (5.9) 0.5 (20.5) 8—————————————————————————————————————————— ————————————————— ————————————————— —————————————————
Total United Kingdom 125 2,599 4.7 11.0 1.0 12—————————— ————— ————— —————Continental EuropeRetail: France 38 668 3.7 9.9 19.9 6
Germany 12 222 (5.5) (2.7) 13.2 5—————————————————————————————————————————— ————————————————— ————————————————— —————————————————
50 890 1.3 6.5 18.2 6—————————————————————————————————————————— ————————————————— ————————————————— —————————————————
Office: France 15 467 (3.7) 1.0 1.3 5—————————————————————————————————————————— ————————————————— ————————————————— —————————————————
Total Continental Europe 65 1,357 (0.5) 4.6 12.3 6—————————— ————— ————— —————GroupRetail 129 2,705 7.1 12.7 13.9 11
Office 61 1,251 (5.1) 0.7 (11.9) 7—————————————————————————————————————————— ————————————————— ————————————————— —————————————————
Total Group 190 3,956 2.9 8.7 5.0 10—————————— ————— ————— —————Note
(1) The amount by which the estimated rental value exceeds or falls short of the rents passing, together with the
estimated rental value of vacant space, after any rent free period.
VALUATION MOVEMENTS
During 2003, there were contrasting performances from the retail and office portfolios. The retail portfolio showed
an underlying increase in value of 7.1%, whilst there was an underlying decrease in the value of the office portfolio
of 5.1%. This resulted in an overall increase in the valuation of the portfolio of 2.9%.
In the UK, the abolition of stamp duty in disadvantaged areas added £32 million to the property valuations. The
properties in France have been valued on the assumption that, following tax changes introduced by the French
Government, future disposals are more likely to be effected through the sale of properties rather than the sale of
the group’s property owning subsidiary companies. The result is that additional transfer tax of approximately
£30 million has been deducted from the value of the French properties.
The good performance in the UK and French retail portfolios mainly reflected rental growth and asset management
initiatives. In the UK, valuation yields for prime shopping centres improved slightly whilst in France they remained
broadly stable. By contrast, in Germany, continued investor uncertainty in the face of subdued consumer markets
resulted in a valuation decline of 5.5%.
The decline in the value of the group’s office portfolio principally reflected the difficult market in London caused by
the continuing caution on the part of occupiers, increased vacancy levels and lower market rents. The office
portfolio in Paris decreased in value by 3.7% as rental levels reduced.
.29
TOTAL RETURN
The total return from the portfolio was 8.7% in 2003, compared with 5.3% in the previous year, with the increase
mainly attributable to the positive valuation movement in the retail portfolio.
INCOME QUALITY
At 31 December 2003, the passing rent from the group’s portfolio amounted to £210 million and the average
unexpired lease term was ten years. Within the retail portfolio, the average unexpired lease term for shopping
centres was ten years and for retail parks 16 years. The average unexpired lease terms for the office portfolios in
London and Paris were eight and five years respectively.
The group’s five largest retail tenants accounted for 10.9% of total passing rent and comprised: Hennes & Mauritz
(3.0%); Dixons (2.5%); Next (2.0%); Arcadia (1.8%) and Boots (1.6%). Given the spread of tenants in the retail
portfolio, the overall risk to Hammerson of individual tenant default is considered low.
The group’s three largest office tenants accounted for 13.1% of total passing rent and comprised: Deutsche Bank
(7.0%); Network Rail (3.5%) and Lazard (2.6%). In addition, the group has pre-let its development at Bishops
Square, London, to Allen & Overy, and Hammerson’s share of the annual rent on completion of the development
will amount to £27 million.
RENT REVIEWS
In 2003, UK rent reviews with a passing rent of £2 million were agreed, giving rise to an increase in annual rents
of £1 million, whilst reviews remaining to be settled from 2003 could increase rents by a further £3 million.
In the UK, leases subject to rent review in 2004 to 2006 have current rents passing of £80 million. Management
estimates that, on review, rents receivable in respect of these leases would increase by £6 million to £86 million
by 2006 if reviewed at current rental values. This is not a forecast and takes no account of increases or decreases
in rental values before the relevant review dates.
2004 2005 2006 2004-06£m £m £m £m
——————————————————————————————————————————————————————————————— ————————— ————————— ————————— —————————
Rents passing from leases subject to review 20 29 31 80
Projected rent after review at current ERV 23 31 32 86——————————————————————————————————————————————————————————————— ————————— ————————— ————————— —————————
Potential rent increases 3 2 1 6
—————————————— —— —— —— ——LEASE EXPIRIES AND BREAKS
During 2003, tenant leases with passing rents of £7 million expired. Most of the leases were renewed or the tenants
replaced and, because the expiring leases were at rents below market levels, additional annual income of
£3 million was secured.
Over the three years 2004 to 2006, leases with current rents passing of £31 million are subject either to expiry or
tenants’ break clauses. Management estimates that, assuming renewals at current ERVs, additional annual rents
from this element of the portfolio would total £1 million by 2006 as shown in the table below. This is not a forecast
and takes no account of void periods, tenant incentives, or possible changes in rental values before the relevant
lease expiry dates.
2004 2005 2006 2004-06£m £m £m £m
——————————————————————————————————————————————————————————————— ————————— ————————— ————————— —————————
Rents passing from leases subject to expiries or breaks 10 14 7 31
Current ERV 11 13 8 32——————————————————————————————————————————————————————————————— ————————— ————————— ————————— —————————
Potential rent increases / (decreases) 1 (1) 1 1
—————————————— —— —— —— ——
.30
Portfolio Review (continued)
RETAIL PORTFOLIO
The group’s retail portfolio had a book value of £2,705 million at 31 December 2003. The retail portfolio was 14%
reversionary, with annual rents passing of £147 million, compared with a current estimated rental value of
£174 million. The latter figure includes vacant space and rent reversions due after 2006. The shopping centre
portfolio was 13% reversionary and the retail park portfolio 22% reversionary. The vacancy rate in the retail portfolio
at the end of the year was 4.6%, compared with 3.1% at the end of 2002. The principal reason for the increase was
that a number of properties in the retail parks portfolio are vacant pending redevelopment.
INVESTMENT ACTIVITY
Hammerson’s retail portfolio mainly comprises prime regional shopping centres that dominate their catchment
areas, retail parks and city centre properties that could form part of future retail-led developments.
The value of retail property acquisitions amounted to £101 million during 2003, whilst proceeds from disposals were
£252 million.
During 2003, the group continued to expand its retail park portfolio. In February, Sittingbourne Industrial Park was
acquired for £17 million. The ten hectare site is situated close to the town centre and currently comprises light
industrial and warehouse units. Hammerson is working on proposals for a retail-led redevelopment.
In November, the group acquired the largest retail park in Sheffield, Drakehouse Retail Park, at a cost of £60 million.
The current leases have an average unexpired term of 19 years.
In December, Hammerson and Standard Life Investments jointly acquired the freehold interest in Brent Cross
Shopping Park, a development close to Brent Cross Shopping Centre, London NW4. Hammerson’s interest in the
retail park is 40.6% and its share of the initial cost for the site was £18 million. Hammerson’s total commitment to
the development, including the initial consideration, is £30 million. On completion, the 8,600 m2 scheme will be the
largest open A1 retail park in North London.
In the UK, the B&Q retail warehouse in Romford was sold for £21 million in April and, in July, the group’s leasehold
interest in Merseyway Shopping Centre, Stockport was sold raising £128 million. Sprowston Retail Park, Norwich,
was sold in September for £13 million.
In Germany, the sale of Luisencenter, Darmstadt, was completed in December for a consideration of £71 million,
£66 million of which was received before the year end, with the balance expected to be received in 2004. Contracts
were also exchanged for the sale for £20 million of Hammerson’s 22% interest in City Center shopping centre, Essen
and the adjacent car park.
Following the reduction of the size of its business in Germany, Hammerson has outsourced the property
management of its three remaining retail properties and will be closing its Berlin office.
DEVELOPMENTS
Bullring shopping centre was completed in September, at a total cost to Hammerson of £170 million, and opened
more than 95% let. Hammerson’s share of the estimated annual income is £13.3 million. Hammerson was the
development manager for the scheme undertaken by The Birmingham Alliance. The 110,000 m2 shopping centre, in
the heart of Birmingham, has proved extremely successful to date with over 20 million visitors in the six months
since opening.
The major refurbishment of the 49,000 m2 Liberty Centre, Romford was completed in April. Over 95% let at
completion, these works have resulted in a significant improvement in the tenant mix and the overall rental value of
the centre.
In June, Hammerson was granted planning consent for the 23,600 m2 Cyfarthfa Retail Park at Merthyr Tydfil. The
total development costs are estimated to be £35 million and work started in February 2004. Lease agreements have
been signed with tenants for 52% of the projected rental income. In October, Hammerson was granted planning
consent for the St. Oswald’s Retail Park in Gloucester. Work on the first phase of the development is expected to
start in the second half of 2004 at a total cost of £52 million. Since the year end, Hammerson has received planning
consent for the development of a 7,500 m2 retail park in Thanet, Kent. It is anticipated that construction will begin
at the end of 2004, with total development costs expected to be £14 million.
.31
The Bristol Alliance, a partnership between Hammerson, Land Securities and Morley Fund Management, has made
good progress on its development proposals for the Broadmead area of Bristol and the necessary planning consents
are in place for the 90,000 m2 retail development. A leasing campaign is underway and site assembly is progressing
with a view to construction starting in 2005.
The group is also working with local authorities and landowners in several other major towns and cities, including
Aberdeen, Barnet, Birmingham, Kingston-upon-Thames, Leeds, Leicester, Peterborough and Sheffield, to advance
potential retail-led development schemes or expansions to existing centres.
In France, the group continued to advance plans for improvements and refurbishments to a number of its retail
assets, including Les 3 Fontaines in Cergy Pontoise, Espace Saint Quentin in Saint Quentin-en-Yvelines and Parinor
in Aulnay sous Bois.
OFFICE PORTFOLIO
The group’s office portfolio had a book value of £1,251 million at 31 December 2003, and annual rents passing of
£64 million. The portfolio was 12% over-rented, compared with 7% at the end of 2002, reflecting the decline in rental
values in the London and Paris office markets.
Three development schemes completed towards the end of the year, 10 Grosvenor Street, London W1, One London
Wall, London EC2, and Néo, 14 boulevard Haussmann, Paris 9ème, remained unlet. As a result the office vacancy
rate at the end of the year was 26.8%, compared with 11.3% at the end of 2002.
INVESTMENT AND DEVELOPMENT ACTIVITY
Office capital additions in 2003 amounted to £173 million. The disposals of Globe House, London WC2, and 16 Old
Bailey, London EC4, in March, raised £194 million, whilst the sale of 53 quai d’Orsay, Paris 7ème, in July, raised a
further £76 million.
Two office developments in central London were completed during 2003. A lease for 2,930 m2 of space has been
signed with the leading international law firm, Dewey Ballantine, at One London Wall and negotiations are underway
with prospective occupiers at both that property and at 10 Grosvenor Street. The development at Moorhouse is
progressing and is expected to be completed towards the end of 2004.
The construction of Bishops Square, London, is progressing well. The 75,000 m2 office building has been pre-let to
Allen & Overy and is expected to be completed in June 2005. A marketing campaign will begin shortly for the
3,700 m2 of retail space.
In Paris, the letting of 2,900 m2 of office accommodation at 148, rue de l’Université to GIE SC Autoroutes leaves only
1,600 m2 of the 10,300 m2 building unlet.
September 2003 saw the completion of the development of Néo, 14 boulevard Haussmann, a 26,700 m2 office
building. Hammerson is in discussions with a number of potential tenants, but the market in Paris remains
competitive with occupiers cautious.
At 9 place Vendôme, Paris, work started in January 2004 on a scheme comprising 22,900 m2 of offices and 5,300 m2
of retail space in a 50:50 joint venture with AXA. Hammerson’s share of the total cost of the project is £96 million
and completion is scheduled for Spring 2006.
In February 2004, the group sold 21 Moorfields, London EC2, to raise sale proceeds of £48 million.
.32
Financial Review
PROFIT AND LOSS ACCOUNT
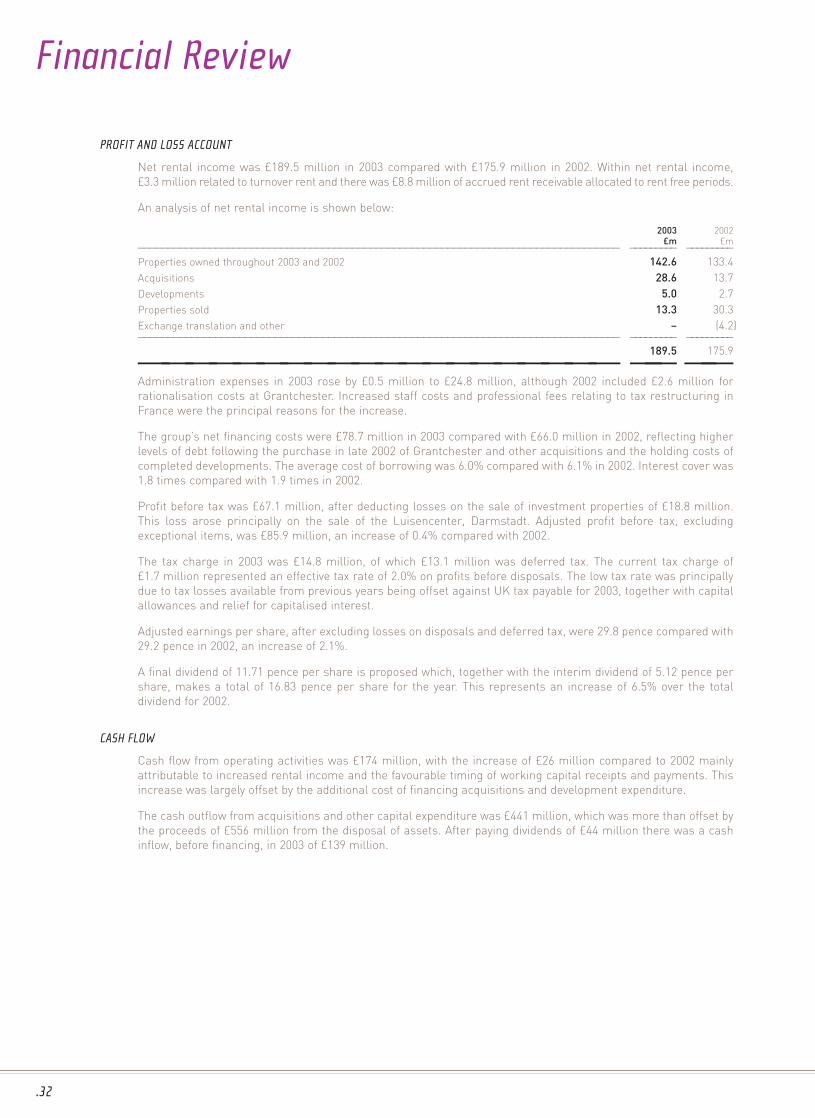
Net rental income was £189.5 million in 2003 compared with £175.9 million in 2002. Within net rental income,
£3.3 million related to turnover rent and there was £8.8 million of accrued rent receivable allocated to rent free periods.
An analysis of net rental income is shown below:
2003 2002£m £m
————————————————————————————————————————————————————————————————————————————————— ————————— —————————
Properties owned throughout 2003 and 2002 142.6 133.4
Acquisitions 28.6 13.7
Developments 5.0 2.7
Properties sold 13.3 30.3
Exchange translation and other – (4.2)————————————————————————————————————————————————————————————————————————————————— ————————— —————————
189.5 175.9———————————————————— —— ——Administration expenses in 2003 rose by £0.5 million to £24.8 million, although 2002 included £2.6 million for
rationalisation costs at Grantchester. Increased staff costs and professional fees relating to tax restructuring in
France were the principal reasons for the increase.
The group’s net financing costs were £78.7 million in 2003 compared with £66.0 million in 2002, reflecting higher
levels of debt following the purchase in late 2002 of Grantchester and other acquisitions and the holding costs of
completed developments. The average cost of borrowing was 6.0% compared with 6.1% in 2002. Interest cover was
1.8 times compared with 1.9 times in 2002.
Profit before tax was £67.1 million, after deducting losses on the sale of investment properties of £18.8 million.
This loss arose principally on the sale of the Luisencenter, Darmstadt. Adjusted profit before tax, excluding
exceptional items, was £85.9 million, an increase of 0.4% compared with 2002.
The tax charge in 2003 was £14.8 million, of which £13.1 million was deferred tax. The current tax charge of
£1.7 million represented an effective tax rate of 2.0% on profits before disposals. The low tax rate was principally
due to tax losses available from previous years being offset against UK tax payable for 2003, together with capital
allowances and relief for capitalised interest.
Adjusted earnings per share, after excluding losses on disposals and deferred tax, were 29.8 pence compared with
29.2 pence in 2002, an increase of 2.1%.
A final dividend of 11.71 pence per share is proposed which, together with the interim dividend of 5.12 pence per
share, makes a total of 16.83 pence per share for the year. This represents an increase of 6.5% over the total
dividend for 2002.
CASH FLOW
Cash flow from operating activities was £174 million, with the increase of £26 million compared to 2002 mainly
attributable to increased rental income and the favourable timing of working capital receipts and payments. This
increase was largely offset by the additional cost of financing acquisitions and development expenditure.
The cash outflow from acquisitions and other capital expenditure was £441 million, which was more than offset by
the proceeds of £556 million from the disposal of assets. After paying dividends of £44 million there was a cash
inflow, before financing, in 2003 of £139 million.
.33
BALANCE SHEET
At 31 December 2003, Hammerson’s investment property portfolio was valued at £3,956 million, compared with
£3,908 million at the end of 2002. The increase arose from capital additions of £364 million, a revaluation surplus
of £111 million and exchange translation gains of £109 million, partly offset by the disposal of properties with a
book value of £536 million.
The development properties within the investment portfolio were valued at £328 million, £26 million above cost.
Developments are shown at a valuation that is discounted for the estimated costs to complete, including interest,
and a profit margin that a potential purchaser might apply. The group does not intend to dispose of any of its
developments prior to their completion.
Adjusted net asset value per share, after excluding deferred tax, increased by 52 pence or 6.9% to 803 pence at
the year end. The portfolio revaluation accounted for 40 pence of this increase, with the balance reflecting
exchange translation movements and retained profits.
BORROWINGS
At 31 December 2003, the group’s borrowings were £1,772 million. Undrawn committed facilities at the same date
were £182 million.
The weighted average maturity of borrowings at 31 December 2003 was approximately eight years. During the
year, secured borrowings of £184 million were repaid and cancelled, so that at the year end 99% of debt was
unsecured.
With cash and deposits of £187 million, net debt amounted to £1,585 million. Gearing at 31 December 2003 was
73% compared with 81% at the end of 2002.
The market value of borrowings at the year end was £1,940 million, some £168 million greater than the book value,
equivalent, after tax relief, to 42 pence per share. During 2003, the margin above government bonds of
Hammerson’s bonds fell significantly which had the effect of increasing the market value of debt by £42 million.
In February 2004, Hammerson issued £300 million 6% unsecured bonds maturing in 2026. The proceeds of the
issue have been swapped into floating rate debt, currently at a rate of 5.2%. As a result of this issue, the average
maturity of the group’s debt has increased to ten years.
RETURN ON SHAREHOLDERS’ EQUITY
At 9.3%, Hammerson’s return on equity was above the group’s estimated cost of equity of 8.0%. The principal
reason for this was the uplift in value of the property portfolio. Over the last three years the group has achieved
an average return on equity of 7.3%.
TAXATION
At the end of 2002, the French Government announced new regulations enabling real estate companies listed in
Paris to elect for the Sociétés d’Investissements Immobiliers Côtées (“SIIC”) tax status, under which property
income and capital gains are exempt from French tax.
Hammerson is applying for a listing of its shares on the Premier Marché of Euronext, Paris, the French Stock
Exchange. Such a listing, provided it is obtained by 30 April 2004, will enable Hammerson and its French
subsidiaries to elect for SIIC tax status. It is envisaged that elections will be made, with retrospective effect from
1 January 2004, covering all the group’s properties in France with the exception of 9 place Vendôme, Paris.
Hammerson’s elected French subsidiaries will be required to pay a one-off exit charge, payable in four equal
annual instalments, calculated at 16.5% of their latent capital gains at the time they enter the SIIC regime. There
is an additional requirement that Hammerson plc continues to be a French-listed property investment business
for ten years to avoid the charge being recalculated at full rates.
The elected French subsidiaries will be required to pay dividends equal to 85% of their net accounting profit on
income and 50% of their net accounting capital gains on disposals. However, the dividend payment obligations of
the French subsidiaries will be reduced by interest and depreciation. These intercompany dividends will, when
received, be taxed in the UK. Hammerson plc will be under an obligation to pay dividends at least equal to the
intercompany dividends received but, in the foreseeable future, the amounts are expected to be small and
therefore will not affect the Company’s dividend policy.
Financial Review
.34
If elections are made, the following effects on the group’s 2004 accounts are anticipated:
• Provision for exit tax of approximately £70 million (B100 million), payable in four equal annual instalments with the first
payment in December 2004.
• The write back of previously provided deferred tax of approximately £45 million (B64 million).
• The exit tax of £70 million will be accounted for as a charge in the profit and loss account of £45 million and a charge in the
statement of recognised gains and losses of £25 million. The release of £45 million of deferred tax will be credited in the
profit and loss account.
• Pro forma shareholders’ funds following these two adjustments would be:
Pence per£ million share
—————————————————————————————————————————————————————————————————————————————————————————— ———————— ————————
Shareholders’ funds at 31 December 2003 2,168 784
Exit tax payable (70) (25)
Deferred tax provision no longer required 45 16—————————————————————————————————————————————————————————————————————————————————————————— ———————— ————————
Pro forma shareholders’ funds at 31 December 2003 2,143 775———————————————————————————————— —— ——In addition to the deferred tax release, the group’s contingent tax liability as at 31 December 2003 would be reduced by
approximately £121 million.
Therefore, taking the £45 million deferred tax release and the £121 million contingent tax reduction net of the £70 million exit
charge, Hammerson’s pro forma triple net NAV would increase by £96 million or 35 pence per share.
INTERNATIONAL FINANCIAL REPORTING STANDARDS (‘IFRS’)
With effect from 1 January 2005, all companies quoted in the European Union will be required to adopt IFRS. Hammerson will
continue to report under UK Accounting Standards up to and including 31 December 2004, but will move to IFRS in 2005.
The International Accounting Standards Board is in the process of finalising the standards that must be adopted in 2005 and
has stated that this work will be completed by the end of March 2004.
If the adopted standards are substantially unchanged from the existing proposals, they will have a significant impact on
Hammerson’s financial statements. It is likely that the main changes will include the recognition of property revaluation
surpluses and deficits in the income statement rather than the statement of recognised gains and losses; the inclusion in the
balance sheet of contingent tax that may arise on the disposal of properties; and the treatment of certain leasehold property
interests as finance leases rather than investment properties. There remain areas of uncertainty which have not yet been
resolved. These include the application of IAS 39 “Financial Instruments: Recognition and Measurement” and guidance from the
Inland Revenue on the tax implications of the adoption of IFRS.
Hammerson will continue to monitor developments and manage the transition to IFRS and will provide more information on the
impact on its financial statements as it approaches the change.
URGENT ISSUES TASK FORCE (‘UITF’) ABSTRACT 38 – ACCOUNTING FOR ESOP TRUSTS
UITF 38 was issued in December 2003 changing the accounting treatment for a company’s own shares held for Employee Share
Ownership Plans (ESOPs). The UITF requires that such shares be included in the balance sheet as a deduction from
shareholders’ funds rather than held as an asset. Comparative figures have been restated and net assets have been reduced
by £2.2 million at 31 December 2003 and 31 December 2002. There is no impact on the profit and loss account.
Financial Review (continued)
.35
PRINCIPAL ACTIVITIES AND BUSINESS REVIEW
The principal activities of the Company have continued to be property investment and development.
A review of the group’s activities and results for the year is given in the Chairman’s Statement and on pages 12 to 34.
RESULTS FOR THE YEAR AND DIVIDENDS
The results for the year are set out in the Summary Consolidated Profit and Loss Account on page 38. The profit before
tax for the year was £67.1 million. After tax and minority interests the profit attributable to shareholders was £50.3 million.
The directors recommend a final dividend of 11.71 pence per share which, together with the interim dividend paid on
31 October 2003, will make a total dividend for the year of 16.83 pence (2002: 15.8 pence). It is intended that warrants in
respect of the final dividend will be posted on 12 May 2004 for payment on 13 May 2004 to shareholders on the register
at close of business on 16 April 2004.
DIRECTORS AND THEIR REMUNERATION
The names and biographical details of the directors are given on pages 6 and 7. Details of directors’ remuneration are given
in the Summary Remuneration Report on page 36.
By Order of the Board
S J HaydonSecretary
15 March 2004
Summary Directors’ Report
.36
THE REMUNERATION COMMITTEE (‘THE COMMITTEE’)
The Committee currently comprises R J O Barton (Chairman), J C Clare and G F Pimlott.
The Committee meets to consider, for recommendation to the Board, Company policy on the remuneration of executive directors and to approve
the composition and level of remuneration of executive directors and certain senior executives. The Board has accepted, without amendment,
the Committee’s recommendations relating to remuneration policy.
In determining an appropriate remuneration policy for recommendation to the Board, the Committee’s objective is to ensure that the Company
continues to be able to attract, retain and motivate experienced individuals, who are capable of making a major contribution to Hammerson’s
success. Remuneration for executive directors and senior executives takes account of performance through an annual performance related bonus
scheme and, for long term performance, by the award of shares under the Company’s deferred share plan. In implementing the policy, following
its approval by the Board, the Committee takes into account remuneration packages available within other comparable companies, the Company’s
overall performance, achievement of corporate objectives, individual performance and published views of investors and their representatives.
To assist the Committee in determining remuneration policy, the Committee has received advice from Hay Group who have been appointed by
the Committee and who provide no other services to the Company. In addition, although they are not members of the Committee, information
and advice has been provided and recommendations have been made by R R Spinney, R J G Richards (other than in respect of his own position)
and by the group’s Director of Human Resources, E A Houlihan.
Non-executive directors are not eligible for performance related bonuses or grants of options and their fees are not pensionable.
A resolution to amend the rules of the deferred share plan in respect of the performance targets is to be put to the Annual General Meeting.
Full details are included in the Circular to Shareholders and Notice of Meeting that accompanies this Annual Review and Summary Financial
Statements.
DIRECTORS’ REMUNERATION
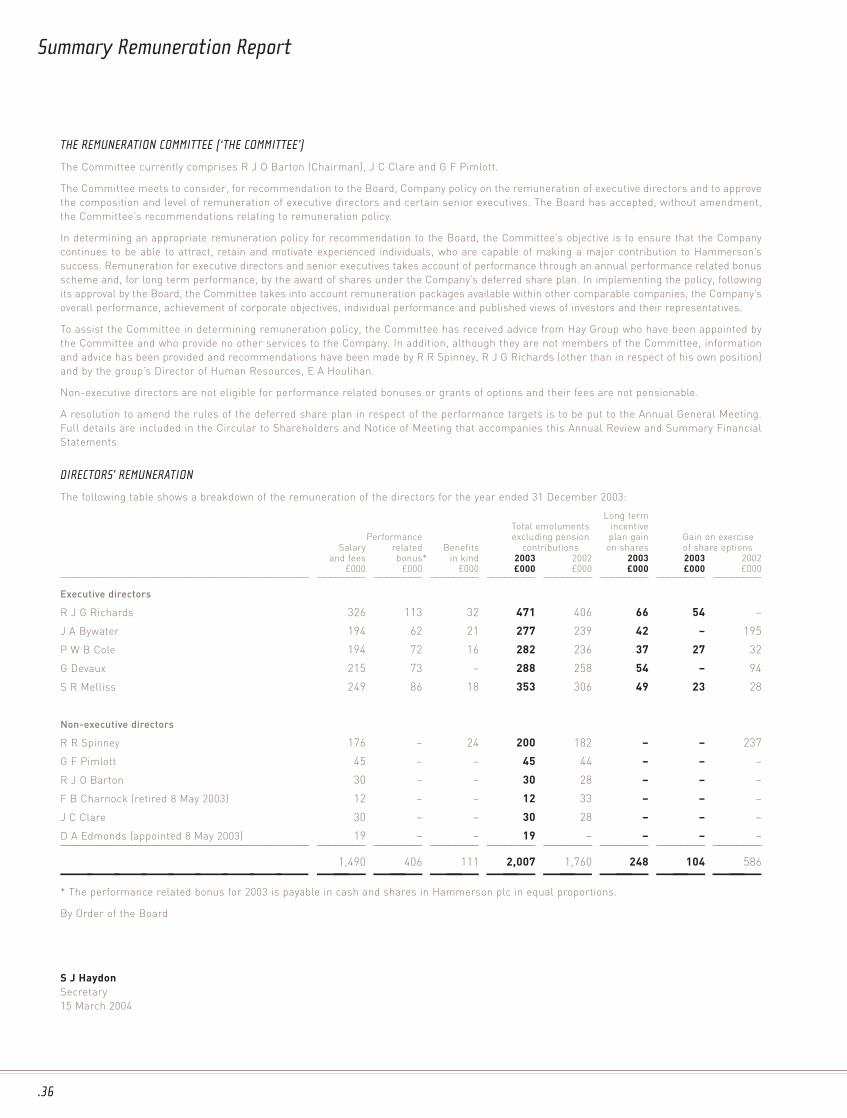
The following table shows a breakdown of the remuneration of the directors for the year ended 31 December 2003:
Long termTotal emoluments incentive
Performance excluding pension plan gain Gain on exerciseSalary related Benefits contributions on shares of share options
and fees bonus* in kind 2003 2002 2003 2003 2002£000 £000 £000 £000 £000 £000 £000 £000
———————————————————————————————————————— ———————— ———————— ———————— ———————— ———————— ———————— ———————— ————————
Executive directors
R J G Richards 326 113 32 471 406 66 54 –
J A Bywater 194 62 21 277 239 42 – 195
P W B Cole 194 72 16 282 236 37 27 32
G Devaux 215 73 – 288 258 54 – 94
S R Melliss 249 86 18 353 306 49 23 28
Non-executive directors
R R Spinney 176 – 24 200 182 – – 237
G F Pimlott 45 – – 45 44 – – –
R J O Barton 30 – – 30 28 – – –
F B Charnock (retired 8 May 2003) 12 – – 12 33 – – –
J C Clare 30 – – 30 28 – – –
D A Edmonds (appointed 8 May 2003) 19 – – 19 – – – –———————————————————————————————————————— ———————— ———————— ———————— ———————— ———————— ———————— ———————— ————————
1,490 406 111 2,007 1,760 248 104 586————————— —— —— —— —— —— —— —— ——* The performance related bonus for 2003 is payable in cash and shares in Hammerson plc in equal proportions.
By Order of the Board
S J HaydonSecretary
15 March 2004
Summary Remuneration Report
.37
Auditors’ Report
STATEMENT OF THE INDEPENDENT AUDITORS TO THE MEMBERS OF HAMMERSON PLC
We have examined the summary financial statements, which comprise the summary directors’ report, summary consolidated profit and loss
account, summary consolidated balance sheet, statement of total recognised gains and losses, reconciliation of movements in shareholders’
funds and consolidated cash flow statement and the amounts disclosed relating to directors’ remuneration set out on page 36.
This report is made solely to the Company’s members, as a body, in accordance with section 251 of the Companies Act 1985. Our work has been
undertaken so that we might state to the Company’s members those matters we are required to state to them in an auditors’ report and for no
other purpose. To the fullest extent permitted by law, we do not accept or assume responsibility to anyone other than the Company and the
Company’s members as a body, for our audit work, for this report, for our audit report, or for the opinions we have formed.
RESPECTIVE RESPONSIBILITIES OF DIRECTORS AND AUDITORS
The directors are responsible for preparing the Annual Review and Summary Financial Statements in accordance with applicable law. Our
responsibility is to report to you our opinion on the consistency of the summary financial statements with the Directors’ Report and Financial
Statements, and its compliance with the relevant requirements of section 251 of the Companies Act 1985 and the regulations made thereunder.
We also read the other information contained in the Annual Review and Summary Financial Statements, as described in the contents section,
and consider the implications for our report if we become aware of any apparent misstatements or material inconsistencies with the summary
financial statements.
BASIS OF OPINION
We conducted our work in accordance with Bulletin 1999/6 “The Auditor’s Statement on the Summary Financial Statement” issued by the United
Kingdom Auditing Practices Board.
OPINION
In our opinion, the summary financial statements are consistent with the Directors’ Report and Financial Statements of Hammerson plc for the
year ended 31 December 2003 and comply with the applicable requirements of section 251 of the Companies Act 1985, and the regulations made
thereunder.
Deloitte & Touche LLPChartered Accountants and Registered Auditors
London
15 March 2004
The independent auditors’ report on the financial statements is unqualified and does not contain any statement concerning accounting records
or failure to obtain necessary information and explanations.
.38
2003 2002£m £m
—————————————————————————————————————————————————————————————————————————————————————————————————— ———————— ————————
Net rental income 189.5 175.9—————————————————————————————————————————————————————————————————————————————————————————————————— ———————— ————————
Operating profit 164.6 151.6
Exceptional items: (Loss)/Profit on the sale of investment properties (18.8) 5.3—————————————————————————————————————————————————————————————————————————————————————————————————— ———————— ————————
Profit on ordinary activities before interest 145.8 156.9
Cost of finance (net) (78.7) (66.0)—————————————————————————————————————————————————————————————————————————————————————————————————— ———————— ————————
Profit on ordinary activities before tax 67.1 90.9
Tax charge on profit on ordinary activities (14.8) (13.6)—————————————————————————————————————————————————————————————————————————————————————————————————— ———————— ————————
Profit on ordinary activities after tax 52.3 77.3
Equity minority interests (2.0) (1.7)—————————————————————————————————————————————————————————————————————————————————————————————————— ———————— ————————
Profit for the financial year 50.3 75.6
Dividends (46.4) (43.6)—————————————————————————————————————————————————————————————————————————————————————————————————— ———————— ————————
Retained profit for the financial year 3.9 32.0——————————————————————————————————— —— ——Basic earnings per share 18.3p 27.1p
Diluted earnings per share 18.2p 27.1p
Adjusted earnings per share 29.8p 29.2p——————————————————————————————————— —— ——
2003 2002£m £m
—————————————————————————————————————————————————————————————————————————————————————————————————— ———————— ————————
Profit for the financial year 50.3 75.6
Unrealised surplus/(deficit) on revaluation of properties 110.8 (19.1)
Unrealised surplus on revaluation of investments and minority interests 0.5 0.4
Unrealised surplus on acquisition of minority interest 1.5 –
Negative goodwill – 5.0
Current tax on property disposals (0.3) –
Deferred tax on property disposals (4.7) (13.9)
Exchange translation movements 16.4 15.9—————————————————————————————————————————————————————————————————————————————————————————————————— ———————— ————————
Total recognised gains and losses for the year 174.5 63.9——————————————————————————————————— —— ——
Summary Consolidated Profit and Loss Accountfor the year ended 31 December 2003
Statement of Total Recognised Gains and Lossesfor the year ended 31 December 2003
2003 2002Restated*
£m £m—————————————————————————————————————————————————————————————————————————————————————————————————— ———————— ————————
Retained profit for the financial year 3.9 32.0
Amortisation of investment in own shares – 0.3
Other recognised gains and losses 124.2 (11.7)
Purchase and cancellation of own shares – (25.1)
Issue of shares 1.9 4.0—————————————————————————————————————————————————————————————————————————————————————————————————— ———————— ————————
Net increase/(decrease) in shareholders’ funds 130.0 (0.5)
Equity shareholders’ funds at 1 January (restated*) 2,038.2 2,038.7—————————————————————————————————————————————————————————————————————————————————————————————————— ———————— ————————
Equity shareholders’ funds at 31 December 2,168.2 2,038.2——————————————————————————————————— —— ——* Comparative figures have been restated following the adoption of UITF Abstract 38, the effect of which is to reduce equity shareholders’
funds at 31 December 2002 by £2.2 million.
Reconciliation of Movements in Shareholders’ Fundsfor the year ended 31 December 2003
.39
2003 2002Restated*
£m £m—————————————————————————————————————————————————————————————————————————————————————————————————— ———————— ————————
Land and buildings 3,955.5 3,907.6
Other fixed assets 42.0 40.6—————————————————————————————————————————————————————————————————————————————————————————————————— ———————— ————————
Fixed assets 3,997.5 3,948.2
Current assets 329.5 407.1
Creditors falling due within one year (502.8) (402.3)—————————————————————————————————————————————————————————————————————————————————————————————————— ———————— ————————
Net current (liabilities)/assets (173.3) 4.8—————————————————————————————————————————————————————————————————————————————————————————————————— ———————— ————————
Total assets less current liabilities 3,824.2 3,953.0
Creditors falling due after more than one year (1,559.2) (1,837.5)
Provision for liabilities and charges: Deferred tax (58.7) (37.2)
Equity minority interests (38.1) (40.1)—————————————————————————————————————————————————————————————————————————————————————————————————— ———————— ————————
2,168.2 2,038.2—————————————————————————————————————————————————————————————————————————————————————————————————— ———————— ————————
Diluted net asset value per share 784p 738p
Adjusted net asset value per share 803p 751p——————————————————————————————————— —— ——* Comparative figures have been restated following the adoption of UITF Abstract 38, the effect of which is to reduce equity shareholders’
funds at 31 December 2002 by £2.2 million.
These summary financial statements were approved by the Board of Directors on 15 March 2004.
Signed on behalf of the Board
R J G Richards Director
S R Melliss Director
2003 2002£m £m
—————————————————————————————————————————————————————————————————————————————————————————————————— ———————— ————————
Net cash flow from operating activities 173.5 147.5
Returns on investment and servicing of finance (104.6) (89.7)
Tax paid (0.5) (0.2)
Capital expenditure and investment 176.1 30.3
Acquisitions and disposals (60.9) (178.2)
Equity dividends paid (44.4) (42.0)—————————————————————————————————————————————————————————————————————————————————————————————————— ———————— ————————
Cash inflow/(outflow) 139.2 (132.3)
Decrease in short term deposits 50.9 103.4
Net cash (outflow)/inflow from financing (195.2) 53.6—————————————————————————————————————————————————————————————————————————————————————————————————— ———————— ————————
(Decrease)/Increase in cash in the year (5.1) 24.7——————————————————————————————————— —— ——
Summary Consolidated Balance Sheetas at 31 December 2003
Consolidated Cash Flow Statementfor the year ended 31 December 2003
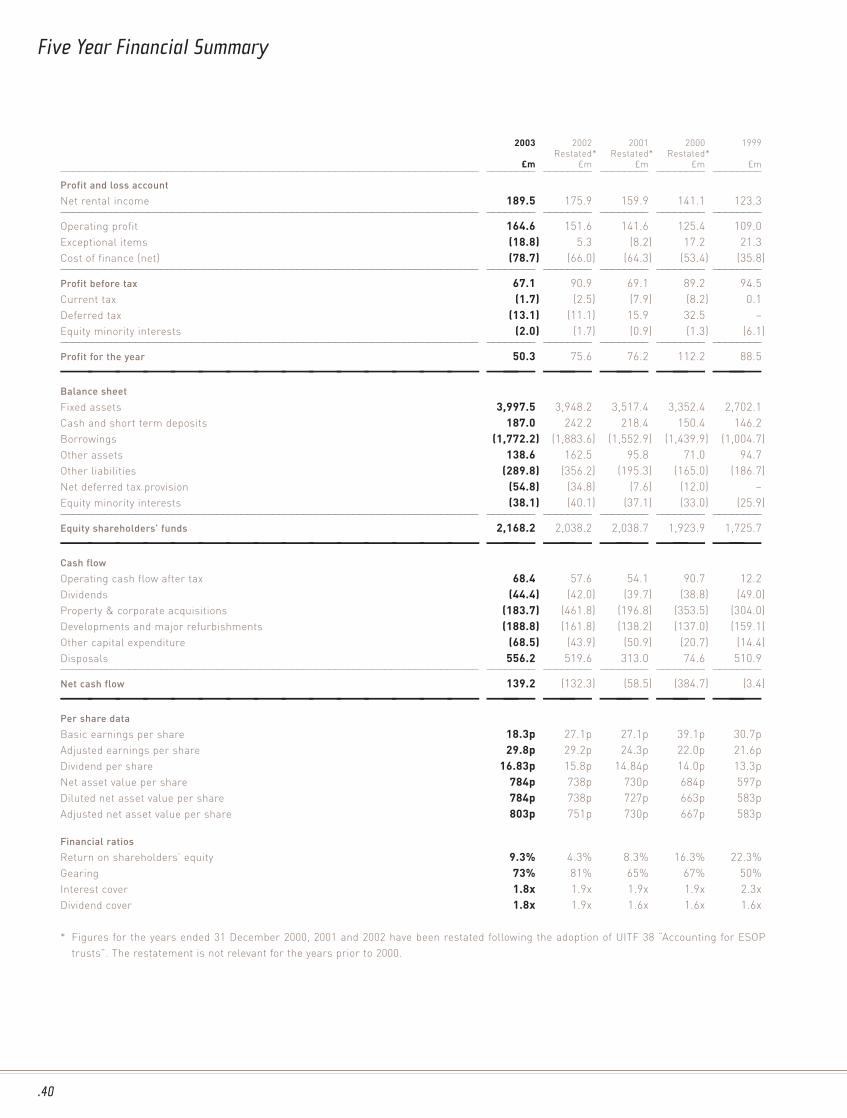
.40
Five Year Financial Summary
2003 2002 2001 2000 1999Restated* Restated* Restated*
£m £m £m £m £m——————————————————————————————————————————————————————————————————— ———————— ———————— ———————— ———————— ————————
Profit and loss account
Net rental income 189.5 175.9 159.9 141.1 123.3——————————————————————————————————————————————————————————————————— ———————— ———————— ———————— ———————— ————————
Operating profit 164.6 151.6 141.6 125.4 109.0
Exceptional items (18.8) 5.3 (8.2) 17.2 21.3
Cost of finance (net) (78.7) (66.0) (64.3) (53.4) (35.8)——————————————————————————————————————————————————————————————————— ———————— ———————— ———————— ———————— ————————
Profit before tax 67.1 90.9 69.1 89.2 94.5
Current tax (1.7) (2.5) (7.9) (8.2) 0.1
Deferred tax (13.1) (11.1) 15.9 32.5 –
Equity minority interests (2.0) (1.7) (0.9) (1.3) (6.1)——————————————————————————————————————————————————————————————————— ———————— ———————— ———————— ———————— ————————
Profit for the year 50.3 75.6 76.2 112.2 88.5
——————————————— —— —— —— —— ——Balance sheet
Fixed assets 3,997.5 3,948.2 3,517.4 3,352.4 2,702.1
Cash and short term deposits 187.0 242.2 218.4 150.4 146.2
Borrowings (1,772.2) (1,883.6) (1,552.9) (1,439.9) (1,004.7)
Other assets 138.6 162.5 95.8 71.0 94.7
Other liabilities (289.8) (356.2) (195.3) (165.0) (186.7)
Net deferred tax provision (54.8) (34.8) (7.6) (12.0) –
Equity minority interests (38.1) (40.1) (37.1) (33.0) (25.9)——————————————————————————————————————————————————————————————————— ———————— ———————— ———————— ———————— ————————
Equity shareholders’ funds 2,168.2 2,038.2 2,038.7 1,923.9 1,725.7
——————————————— —— —— —— —— ——Cash flow
Operating cash flow after tax 68.4 57.6 54.1 90.7 12.2
Dividends (44.4) (42.0) (39.7) (38.8) (49.0)
Property & corporate acquisitions (183.7) (461.8) (196.8) (353.5) (304.0)
Developments and major refurbishments (188.8) (161.8) (138.2) (137.0) (159.1)
Other capital expenditure (68.5) (43.9) (50.9) (20.7) (14.4)
Disposals 556.2 519.6 313.0 74.6 510.9——————————————————————————————————————————————————————————————————— ———————— ———————— ———————— ———————— ————————
Net cash flow 139.2 (132.3) (58.5) (384.7) (3.4)
——————————————— —— —— —— —— ——Per share data
Basic earnings per share 18.3p 27.1p 27.1p 39.1p 30.7p
Adjusted earnings per share 29.8p 29.2p 24.3p 22.0p 21.6p
Dividend per share 16.83p 15.8p 14.84p 14.0p 13.3p
Net asset value per share 784p 738p 730p 684p 597p
Diluted net asset value per share 784p 738p 727p 663p 583p
Adjusted net asset value per share 803p 751p 730p 667p 583p
Financial ratios
Return on shareholders’ equity 9.3% 4.3% 8.3% 16.3% 22.3%
Gearing 73% 81% 65% 67% 50%
Interest cover 1.8x 1.9x 1.9x 1.9x 2.3x
Dividend cover 1.8x 1.9x 1.6x 1.6x 1.6x
* Figures for the years ended 31 December 2000, 2001 and 2002 have been restated following the adoption of UITF 38 “Accounting for ESOP
trusts”. The restatement is not relevant for the years prior to 2000.
Shareholder Information
FINANCIAL CALENDAR
Full year results announced 1 March 2004
Annual General Meeting 6 May 2004
Recommended final dividend – Ex dividend date 14 April 2004
– Record date 16 April 2004
– Payable on 13 May 2004
Anticipated 2004 interim dividend November 2004
TAXATION
For the purposes of computing capital gains tax, the value of the Company’s shares on 31 March 1982, after adjustment for subsequent issues,
was 290p for each ordinary share at that date and 315p for each share classified as “A” ordinary (limited voting) at that date. The cost to be used
by shareholders in computing the gain on any disposal of shares will, however, vary according to individual circumstances and shareholders
should seek professional advice on the amount of tax that may arise.
REGISTRAR
Capita Registrars, The Registry, 34 Beckenham Road, Beckenham, Kent BR3 4TU
Tel 0870 162 3100
Website www.capitaregistrars.com
UNSOLICITED MAIL
Hammerson is obliged by law to make its share register available on request to other organisations who may then use it as a mailing list. This
may result in you receiving unsolicited mail. If you wish to limit the receipt of unsolicited mail you may do so by writing to the Mailing Preference
Service, an independent organisation whose services are free to you. Once your name and address have been added to its records, it will advise
the companies and other bodies that support the service that you no longer wish to receive unsolicited mail. If you would like more details you
should write to: The Mailing Preference Service, FREEPOST 22, London W1E 7EZ, telephone their helpline on 0845 703 4599 or register on their
website www.mpsonline.org.uk.
ADVISERS
Valuers Cushman & Wakefield Healey & Baker
Donaldsons
DTZ Debenham Tie Leung
Auditors Deloitte & Touche LLP
Solicitors Herbert Smith
Financial Advisers Dresdner Kleinwort Wasserstein
Stockbrokers Citigroup
.41

.42
Senior Management
GROUP
R J G Richards Chief Executive
J A Bywater Executive Director
P W B Cole Executive Director
G Devaux Executive Director
S R Melliss Group Finance Director
J D Aitchison Group Tax Manager
W S Austin Head of Financial Reporting and Control
D R Beardsley Group Treasurer
N A S Hardie Group Financial Controller
S J Haydon Company Secretary
E A Houlihan Director, Human Resources
C D M Smith Director, Corporate Affairs
A J G Thomson Corporate Planning Manager
UNITED KINGDOM
J A Bywater Managing Director
P W B Cole Development Director
Directors
D J Atkins Retail Parks
M J Baker Office Asset Management
J M Emery Retail Development
V Forster Retail Asset Management
B N Isles Retail Development
S M King Retail Leasing
S J Töpel London Office Development
G H Wright Construction and Project Management
CONTINENTAL EUROPE
G Devaux Managing Director
FRANCE
J-M Besson Managing Director
J-P Mouton Managing Director, Marketing & Valorisation
C Bourbon Director, Finance
E Damiron Director, Retail Management
F Davy Manager, Human Resources
I Janssen Director, Communications and Marketing
L Maranzana Director, New Markets
M P Sandillon Director, Offices
L Santiago Director, Project Management
GERMANY
S P Cotton General Manager

.43
UNITED KINGDOM
Hammerson plc, 100 Park Lane, London W1K 7AR
Tel +44 (0) 20 7887 1000 Fax +44 (0) 20 7887 1010
FRANCE
Hammerson SA, Washington Plaza Immeuble Artois, 44 rue Washington, 75408 Paris CEDEX 08, France
Tel +33 (1) 56 69 30 00 Fax +33 (1) 56 69 30 01
GERMANY
Hammerson GmbH, Charlottenstraße 80, 10117 Berlin, Germany
Tel +49 (30) 20 24 71 00 Fax +49 (30) 20 24 72 00
WEBSITE
The 2003 Annual Review and Summary Financial Statements, 2003 Directors’ Report and Financial Statements and other information are available on
the Company’s website, www.hammerson.co.uk. The Company operates a service whereby all registered users of the Company’s website can choose
to receive, via e-mail, notice of all Company announcements which can be viewed on the website.
REGISTERED OFFICE
100 Park Lane, London W1K 7AR
Registered in England No. 360632
Principal Group Addresses

Glossary of Terms
.44
ADJUSTED FIGURES Reported amount adjusted to exclude exceptional items and deferred tax
AVERAGE COST OF BORROWING The cost of finance expressed as a percentage of the weighted average of borrowings during the period
DIVIDEND COVER Adjusted earnings per share divided by dividend per share
EARNINGS PER SHARE Profit after tax divided by the average number of shares in issue during the year
ERV The estimated market rental value of space
GEARING Net debt expressed as a percentage of shareholders’ funds
INTEREST COVER Net rental income divided by net interest expense before capitalised interest
INTEREST RATE AND An agreement with another party to exchange an interest or currency rate obligation
CURRENCY SWAP for a pre-determined period of time
LIKE-FOR-LIKE/UNDERLYING When applied to net rental income, the year-on-year change for completed properties owned
throughout both years after taking account of exchange translation movements
When applied to property valuations, the year-on-year change for properties held at the current year
end, after taking account of capital expenditure and exchange translation movements
NET ASSET VALUE PER SHARE Shareholders’ funds divided by the number of shares in issue at the year end
OVER-RENTED Space that is let at a rent above its ERV
PASSING RENT The annual rental income receivable which may be more or less than the ERV
(see over-rented and under-rented)
PRE-LET A lease signed with a tenant prior to completion of a development
RETURN ON Capital growth and profit for the year expressed as a percentage of shareholders’ funds at the
SHAREHOLDERS’ EQUITY beginning of the year, all excluding deferred tax
REVERSIONARY OR Space where passing rent is below the ERV
UNDER-RENTED
SIIC Sociétés d’Investissements Immobiliers Cotées. A French tax exempt regime available to property
companies listed in France
TOTAL RETURN Net rental income and capital growth expressed as a percentage of opening book value of property
adjusted for capital expenditure during the year

Designed and Produced by MAGEEPrinted by First Impression
Printed on
Mega Gloss
Manufactured using pulp from plantation forests,
forest thinning, off cuts and surplus timber. No pulp
is utilised from tropical rain wood forests. Up to
50% of Mega’s total fibre amount are regenerated
fibres resulting from collected mill broke from
different divisions and affiliated mills.


Hamm
erson plc Annual Review and Sum
mary Financial Statem
ents 2003
ANNUAL REVIEW and SUMMARY FINANCIAL STATEMENTS 2003


![SUMMARY OF FINANCIAL STATEMENTS [IFRS] (CONSOLIDATED) Financial Results … · SUMMARY OF FINANCIAL STATEMENTS [IFRS] (CONSOLIDATED) Financial Results for the Fiscal Year Ended March](https://img.pdfslide.net/doc/110x75/5e92676282566416065a9900/summary-of-financial-statements-ifrs-consolidated-financial-results-summary.jpg)


![Summary of Consolidated Financial Statements ... - lion.co.jp · Summary of Consolidated Financial Statements for the Year Ended . December 31, 2017 [Japanese Standard] February 9,](https://img.pdfslide.net/doc/110x75/5d2d8d7a88c993384b8c2c77/summary-of-consolidated-financial-statements-lioncojp-summary-of-consolidated.jpg)

![Summary of Financial Statements for the Fiscal Year Ended ... · SymBio Pharmaceuticals Limited (4582) Summary of Financial Statements [Japanese GAAP] (Non-consolidated) Results for](https://img.pdfslide.net/doc/110x75/5f072b5d7e708231d41ba6e1/summary-of-financial-statements-for-the-fiscal-year-ended-symbio-pharmaceuticals.jpg)