Embed Size (px)
Citation preview

IT COULD HAVE BEEN WORSE...
ANNUAL REVIEW
202019
Annex A

2
ANNUAL REPORT 2019/20 INTRODUCTION
LOCAL AUTHORITY PENSION PERFORMANCE ANALYTICS | @PIRC Ltd
We are delighted to be able to publish this year’s peer group results, based on a Universe of 63 funds with a value of £180 bn. This represents some two thirds of local authority pension fund assets and includes all of the Welsh and Northern Pools, all bar one of the London Pool, with funds from all other pools except Central.
2019/20Investment market volatility is nothing new. Many reading this document will have lived through the irrational exuberance of the Dot-Com bubble, the market crash now termed the Global Financial Crisis, the Asian,Chinese and Russian market crises, the Japanese equity bubble, the list goes on…….
However unlike previous market crashes no one could have predicted the events that brought the world to a virtual standstill at the start of 2020. The first quarter of 2020 saw global equity markets lose a quarter of their value while credit markets also fell,
property funds were closed as managers struggled to value assets in these new times.
But the results for the year were not as bad as might have been expected from the gloomy position we found ourselves in at the end of March. Equities had fallen, but from historic highs, and funds, now more diversi-fied than ever, saw their total assets fall, but only by an average of 4.8%.
Those funds that had more of their money invested in alternative strategies, particularly private equity, performed better than their peers who had high quoted equity expo-sures. Some funds had put in place insur-ance against market falls and those funds reaped the benefit last year. However not all strategies that were intended to be low risk delivered - alternative bond strategies failed to deliver positive results as did diversified growth investments.
How this fits in to the longer term storyThe scale of this year’s dislocation has been much lower than that seen in 2003 or 2008 and, whilst the annual result is impacting short term performance, over the medium term, fund returns remain strong and signifi-cantly ahead of inflation.
Equities are no longer well ahead of other asset classes in terms of the long term returns that have been delivered, but they make up a much smaller proportion of the average fund now than they did 30 years ago.
Funds have become increasingly diversi-fied which has brought with it challenges of its own. Pooling should assist with diver-sification. Funds will need to conitinue to ensure that they focus on providing a best value service not just one of least cost.

3
ANNUAL REPORT 2019/20
LOCAL AUTHORITY PENSION PERFORMANCE ANALYTICS | @PIRC Ltd
ANNUAL REVIEW 2019/20CONTENTS1: THIS YEAR p5
- This Year in Context - The Year Begins - The Year Unfolds - Equities - Bonds - Alternatives - Property
2: LONGER TERM p12
- Long Term Results - Equities - Bonds - Alternatives - Property - Audit Fees
3: INSIGHTS p19
- Are funds being rewarded for the risk they are taking?
- Can there be too much diversity?
- Why do some funds do better than others?
4: STATISTICAL APPENDIX p28

4
ANNUAL REPORT 2019/20
LOCAL AUTHORITY PENSION PERFORMANCE ANALYTICS | @PIRC Ltd
Investment returns going well for nine months. Despite global economic and political uncertainty equity markets had reached historic highs. Once investors recognise the impact that COVID is going to have, global markets will tumble.
As markets were falling from historic highs and Local Authority funds were well diversified, returns were negative but, at -4.8% for the year, better than many expected.
12019/20

5
ANNUAL REPORT 2019/20
LOCAL AUTHORITY PENSION PERFORMANCE ANALYTICS | @PIRC Ltd
1. THIS YEAR
91 92 93 94 95 96 97 98 99 2000 01 02 03 04 05 06 07 08 09 10 11 12 13 14 15 16 17 18 19 20
1200
1000
800
600
400
200
0
Investment
performance over the long term has been and remains
excellent.
Dot-Com Bubble
Global Financial Crisis
2019/20 IN THE CONTEXT OF THE LAST 30 YEARS
Before we look at the latest year in detail, it will be useful to get some context into which to place it.
Pension funds are long term investors. They have long term liabilities, many of which are 30 or even 40 years in the future.
A fund that was valued at £100m thirty years ago, that achieved average Local Authority Pension Fund returns over the period (one which contains two major market equity market crises as well as the one we are currently living through) would have seen its value rise to over a £1 billion before falling back just below in the latest year.
Growth of an Average Fund Over 30 Years
2002/03Local Authority Funds returned -20%. The following year they returned +23%
2008/09 In 2008/9 Local Authority pension funds returned -20%. The following year they returned +35%
COVID 19
That performance measure is solely based on returns achieved and does not include contributions. Investment performance over the long term has been and remains excellent. Bearing that in mind, we can now turn to look at this latest year.

6
ANNUAL REPORT 2019/20
LOCAL AUTHORITY PENSION PERFORMANCE ANALYTICS | @PIRC Ltd
1. 2019/2020 – THE YEAR BEGINS
AT THE START OF THE YEAR SENTIMENT WAS MIXED
• Despite reducing exposure for over a decade at the end of March 2019, funds still held 55% of their assets in equities.• The Universe funds had transitioned 25% of their assets across into the Pool structures.
• The 2019 Triennial Valuation results had been delivered – strong asset returns over the preceding three years (35% cumula-tive) and slowing down of the increase in longevity brought the average fund up to 98% funded. There was tension
between wanting to take off some risk as they reached / approached 100% and increased cost implications for contributors which would result from lower expected future returns.• Cash flow – total income (including investment
income) was still in excess of total outflows although there was variation across funds but cash flow management was rising in importance within funds decision making.• Environmental / social impacts were rising up on committee’s agendas.
HOW FUNDS WERE POSITIONED AT THE START OF THE YEAR
There were headwinds...US/China tensions The ongoing lack of resolution around Brexit – the UK was originally meant to leave on 29 March, a deadline which has already passedHistorically high US equity market levels
...and challengesHow to respond to improved funding levelsContemplating low / negative cash flowPooling
FIG.1
Fund Allocation at end March 2019
Equities Bonds Cash Alternatives Diversified Growth Property

7
ANNUAL REPORT 2019/20
LOCAL AUTHORITY PENSION PERFORMANCE ANALYTICS | @PIRC Ltd
1. 2019/20
The year unfolds As Figure 2 shows, funds saw returns increase quite steadily, with a cumulative return of over 8% for the first nine months of the year before this was completely wiped out in February and March by the spread outwards from China of COVID-19 and the subsequent fall in equity markets across the world.
The scale of the global disruption brought by the pandemic meant that the impact was felt across the range of asset classes. In the first quarter of 2020, as can be seen in Figure 3, equities took the largest fall, but diversified growth (DG) funds also fell sharply (reflecting the high equity content of many). Whilst government bonds delivered large positive returns,
most funds saw negative results from their fixed income portfolios as absolute return bond funds and multi asset credit portfolios struggled with illiquidity. Alternative performance was often difficult to quantify accurately (an issue in itself) and returns were mixed while property returns stayed flat despite issues around rent collection and near term valuations of some segments, particularly retail.
Could have been worse? Bringing the four quarters together, performance for the year was perhaps better than many would have expected.
As can be seen in Figure 3, the equity market falls experienced in the first quarter of 2020 had come on the back of strong returns in each of the three previous quarters, so the decline, though steep, was from record highs in many markets. The final results of the year can be seen in figure 4.
-10-8-6-4-202468
10
MarFebJanDecNovOctSepAugJulJunMayApr
Month Cumulative
2019 2020
FIG.2Local Authority fund performance month by month
-20
-15
-10
-5
0
5
10
15
Total
Assets
Proper
ty
Diversi
fied G
rowth
Infras
tructu
re
Hedge /
Absol
ute Al
ts
Privat
e Equ
ity
Altern
ativesCash
Multi A
sset C
redit
Absol
ute Retu
rn Bond
s
Non UK B
onds
UK IL
UK Corp
UK Govt
Total
Bonds
Emerg
ing
Oversea
sUKGlob
al
Total
Equit
y
-12.5 -11.9
-18.2
-8.8
-14.6
1.7
8.1
0.12.0 1.7
-5.2
5.55.7
12.1
7.4
-0.6
-11.8
-4.1
1.7
-4.8
FIG.4 2019/20 Performance
DG - well behind benchmarkUK equities
well behind overseas
Once again emerging markets fail to add value
Absolute bond funds / MAC fail to achieve positive returns
Private Equity continues run of excellent results
The annual results
-25
-20
-15
-10
-5
0
5
10
Q1Q4Q3Q2
Equity Bonds Alternatives Property DG
FIG.3 Asset class performance by quarter
%
8
ANNUAL REPORT 2019/20
LOCAL AUTHORITY PENSION PERFORMANCE ANALYTICS | @PIRC Ltd
1. 2019/20
-20
-15
-10
-5
0
5
10
15
20
25
30
35
202020192018201720162015201420132012201120102009200820072006200520042003200220012000199919981997199619951994199319921991
01020304050
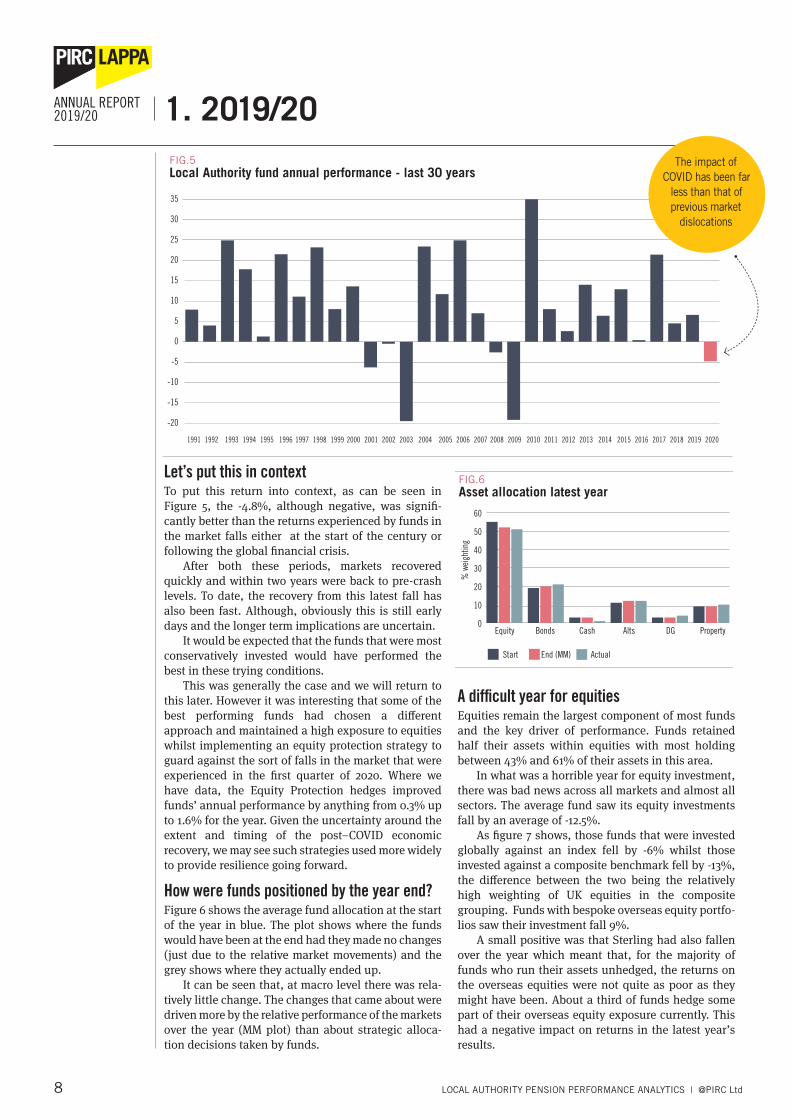
FIG.5 Local Authority fund annual performance - last 30 years
Let’s put this in contextTo put this return into context, as can be seen in Figure 5, the -4.8%, although negative, was signifi-cantly better than the returns experienced by funds in the market falls either at the start of the century or following the global financial crisis.
After both these periods, markets recovered quickly and within two years were back to pre-crash levels. To date, the recovery from this latest fall has also been fast. Although, obviously this is still early days and the longer term implications are uncertain.
It would be expected that the funds that were most conservatively invested would have performed the best in these trying conditions.
This was generally the case and we will return to this later. However it was interesting that some of the best performing funds had chosen a different approach and maintained a high exposure to equities whilst implementing an equity protection strategy to guard against the sort of falls in the market that were experienced in the first quarter of 2020. Where we have data, the Equity Protection hedges improved funds’ annual performance by anything from 0.3% up to 1.6% for the year. Given the uncertainty around the extent and timing of the post–COVID economic recovery, we may see such strategies used more widely to provide resilience going forward.
How were funds positioned by the year end?Figure 6 shows the average fund allocation at the start of the year in blue. The plot shows where the funds would have been at the end had they made no changes (just due to the relative market movements) and the grey shows where they actually ended up.
It can be seen that, at macro level there was rela-tively little change. The changes that came about were driven more by the relative performance of the markets over the year (MM plot) than about strategic alloca-tion decisions taken by funds.
A difficult year for equitiesEquities remain the largest component of most funds and the key driver of performance. Funds retained half their assets within equities with most holding between 43% and 61% of their assets in this area.
In what was a horrible year for equity investment, there was bad news across all markets and almost all sectors. The average fund saw its equity investments fall by an average of -12.5%.
As figure 7 shows, those funds that were invested globally against an index fell by -6% whilst those invested against a composite benchmark fell by -13%, the difference between the two being the relatively high weighting of UK equities in the composite grouping. Funds with bespoke overseas equity portfo-lios saw their investment fall 9%.
A small positive was that Sterling had also fallen over the year which meant that, for the majority of funds who run their assets unhedged, the returns on the overseas equities were not quite as poor as they might have been. About a third of funds hedge some part of their overseas equity exposure currently. This had a negative impact on returns in the latest year’s results.
0
10
20
30
40
50
60
PropertyDGAltsCashBondsEquity
Start End (MM) Actual
FIG.6
Asset allocation latest year
% w
eigh
ting
The impact of COVID has been far
less than that of previous market
dislocations

9
ANNUAL REPORT 2019/20
LOCAL AUTHORITY PENSION PERFORMANCE ANALYTICS | @PIRC Ltd
1. 2019/20
The increased investment in various enhanced index / low volatility strategies in 2018/19 came to a halt in the latest year as there were no further mandates awarded. Performance was generally below that of market cap index benchmarks.
UK equities continue to disappointUK equities performed worse than their overseas peers, in part because of the high exposure to oil and gas within the index and in part due to the decline in Sterling over the year, in part because of the continu-ing uncertanties around Brexit. Funds with a high commitment to the domestic equity market would have underperformed their peers.
The number of funds who retain an actively managed UK portfolio is continuing to reduce and few external managers manage more than a single portfolio.
In the latest year the active managers in aggregate managed to slightly outperform the index. Outside of the pools Majedie remained the largest manager of UK equity money. Majedie’s poor run of performance continued in the latest year, underperforming the index by around 3%.
Equity allocation becomes ever more globalUK Equity exposure continues to decline and not just as a result of poor relative market performance.
Figure 8 shows that UK equity exposure has fallen from 24% at the end of March 2019 to only 20% by the year end. There was a continuation of the move away
from an explicit UK / overseas split towards funds holding their full allocation globally. Now just half of the funds in the Universe still retain a bespoke UK equity allocation.
Within global equities there was a continuation of the move across into assets managed by the Pools. There was almost no activity resulting from manager under performance.
Through the year there was a further £1bn invested into low carbon / green investment strategies – mostly through index tracking investments. The move is still lower than might be expected given the level of interest in this area from stakeholders and these strat-egies still only account for just under 5% of total equity investment. We expect that this will increase further over the near term.
Despite some interest in the approach we have not yet seen a move towards the approach of exclusion of high carbon stocks from portfolios within the Universe.
Lack of diversity in global equitiesAt the end of March 2020 the level of equity assets managed passively was broadly unchanged from the previous year at just under 40%. Almost all of this was managed within the Pool structure and 60% of the passive assets were managed by LGIM.
Whilst much discussion and effort is spent at a structural level on ensuring broad and efficient diver-sification, within equities, fund investment is increas-ingly large and concentrated.
The move to global equity investing effec-tively means that a fund is benchmarked
against an index that is comprised around 55% of its investment in one market – the US. Over 10% of the Index (twice the capitalisation of the UK) is in just five stocks – Microsoft, Apple, Amazon,
Facebook and Alphabet, whilst the tech-nology sector makes up almost 20% of the
index. This means effectively that whilst the global index may have 600+ stocks, most will
have little impact on the overall return or volatility of the index. The level of stock-specific risk is something pension funds need to be increasingly aware of.
Active management results are mixedOne of the main arguments for employing active managers has always been that they will be nimble enough to avoid the worst of market falls. In this time of extreme market dislocation, the range of returns from active managers was wider than usually seen but in aggregate they outperformed.
Value strategies struggled in the latest year whilst growth manager performance was mixed. Of the larger active managers of LGPS global equity money, Baillie Gifford and Newton both outperformed whilst Longview, UBS and Schroders were well behind their benchmarks.
Within the global equity assets managed by the pools, LPPI was the best performing.
5% of Total Equities
invested in bespoke Green / Low Carbon 2020
March 19 March 20
0 10 20 30 40 50 60 70 80
Overseas
UK
FIG.8
Allocation to UK equities
% total equities
Universe Relative to benchmark
-20
-15
-10
-5
0
5
EmergingOverseasGlobal v composite
Global v Index
UK
FIG.7
Equity performance – latest year%
retu
rn

10
ANNUAL REPORT 2019/20
LOCAL AUTHORITY PENSION PERFORMANCE ANALYTICS | @PIRC Ltd
1. 2019/20Funds that have moved to portfolios managed in a
more ethical / green basis were rewarded in the last year. Low carbon funds outperformed their broad market peers, reflecting the poor performance of oil and gas (sectors underweighted by these mandates) over the year.
Emerging markets did not reward the additional risk taken by investorsEmerging Markets, with an aggregate return of -14.6%, continued their long run of disappointing perfor-mance. This was compounded further by the aggregate active manager result falling below the index.
Absolute return bond funds fail to add valueAs Figure 9 shows, the largest component of the average funds bond allocation is now managed on an absolute return basis. Historically, fund bond portfo-lios were benchmarked against a UK gilts index. In recent years, partly driven by the historically low yields of government securities, there has been a very marked move away from this approach towards an absolute return benchmark for this asset. As can be seen in Figure 9, absolute return bond strategies are now the largest component of the average fund bond allocation. There was also a rise in multi – asset credit (MAC) where CQS, on behalf of the LCIV, are the largest manager.
Funds diversified across a broader range of credit to reduce volatility or improve yield. The performance of these funds will depend to a great degree on manager skill. As Figure 10 shows, in the latest year these diversifying strategies have not generally added value.
Whilst funds UK Gilt investments returned 8% for the year and index linked gilt investment 2.6%, absolute return strategies delivered -4.7% and Multi Asset Credit produced a return below that of Equities at -10.2%.
Alternatives do well but manager selection remains keyThis group of assets has continued to deliver excep-tionally strong performance but, as ever, the range of results was extremely wide reflecting the importance of manager and product selection. Because most of the return from these assets is manager / product risk it is likely to have as much impact as the decision to invest or not.
Private equity produced the best return within the Universe this year. Whilst funds are enjoying a continued run of excellent results from this asset there is beginning to be more interest in just how such returns are generated and it seems likely that Environmental Social and Governance (ESG) issues will come more to the fore for investors in this area.
Infrastructure, hedge fund / absolute return alter-natives and private debt all delivered positive returns of just under 6%. Absolute return funds did signifi-cantly better than diversified growth funds with whom their returns are usually closely aligned.
The allocation within alternatives remained broadly unchanged with private equity making up over two fifths of the allocation and infrastructure another third. The remaining assets are split between absolute return / hedge funds and multi asset strategies.
Two thirds of funds now have some level of private equity investment. Investment into infrastructure continued to grow with a number of smaller funds moving into the asset for the first time over the year bringing the proportion of funds invested up to two thirds.
March 19 March 20
-12-10
-8-6-4-202468
10
MACAbsoluteOverseasUK ILUK CorpUK Govt
FIG.10
Bond returns - latest year
%
Range Mid 50% of funds
0
10
20
30
40
50
60
Hedge FundsInfrastructurePrivate Equity
FIG.11 Latest year range of alternative results
FIG.9
Bond allocation at end March 2020
MAC
Private Debt
Overseas
UK IL
UK Corp
UK Govt
Absolute
Bonds Cash Alternatives Diversified Growth Property

11
ANNUAL REPORT 2019/20
LOCAL AUTHORITY PENSION PERFORMANCE ANALYTICS | @PIRC Ltd
1. 2019/20The full range of returns achieved remained
extremely wide, for example the best result in private equity was 55% above the worst. However, as can be seen in Figure 11 the interquartile ranges (the returns achieved by 50% of the group) are now quite tight. This may be reflecting the move into Pool assets where funds will achieve the same returns. If so, as this trend continues the overall range should narrow too.
Diversified GrowthDiversified Growth (DG) covers those funds invested in a range of broadly diversified assets with the aim of producing a positive, usually cash plus, type return at a relatively low level of volatility.
They produced a broad range of returns over the year, ranging from -11% to +4% with an average of -5.2%.
There are a wide number of managers in this area
and the range of returns was generally closely linked to the level of equities held by the products invested in. GMO, Barings and Baillie Gifford all delivered large negative results whilst even Ruffer, the best perform-ing of the managers, failed to match the benchmark for most of their funds.
Property Stayed PositiveThis year property produced a return of 2%. This return was less than the income generated - there was no capital growth over the year. The annual return includes a better than expected March quarter but managers are warning of the impact of rent arrears / properties being vacated and near future volatility in valuations.
Only a few funds hold overseas property but this did relatively well largely because of the continuing fall in Sterling.
-5
0
5
10
15
20
25
AugJulyJuneMayApril
Quarterly Cumulative
Return of the MSCI AC World index since year end
%
IS 2020/21 SHAPING UP TO BE ANY BETTER?
In the first five months of this fiscal year equity markets have returned over 25%. However the implications of COVID on the global economy and the subsequent impact on markets have yet to be fully under-stood.

12
ANNUAL REPORT 2019/20
LOCAL AUTHORITY PENSION PERFORMANCE ANALYTICS | @PIRC Ltd
2THE LONGER TERM STORY
Despite the negative results of the latest year long term returns remain strongly positive.
Whilst exposure has been greatly reduced equities remain the dominant asset in most funds allocation.
The move into alternative assets has had positive benefits for many funds but the reliance on manager skill has brought wide differences in returns achieved.
Diversified growth has not been as diversifying as funds may have expected.

13
ANNUAL REPORT 2019/20
LOCAL AUTHORITY PENSION PERFORMANCE ANALYTICS | @PIRC Ltd
2. LONGER TERM
As we said before, the market fall in the latest year was not of the scale that funds experienced in either the start of the century, 2008/09 or earlier still on Black Monday in 1987. All of these events saw a rapid rebound in the subsequent year and this has so far also been the case with the COVID related fall. However it has obviously had an impact on the medium term numbers, bringing the three year result of 1.9% p.a. below that required to meet actuarial assumptions (although still marginally ahead of CPI). Over the five years the return is above 5% p.a. and over ten years 7% p.a.
As figure 12 shows longer term performance is better still. The thirty year return of just under 8% p.a, is 5.5% p.a above CPI for the same period.
Over the last ten years the average fund has expe-rienced broadly the same level of volatility as it did
over the preceding period however, the level of return achieved has dropped sharply. The volatility of the periods that include either the financial crisis or the rebound from it are substantially higher. What can clearly be seen in Figure 13 is that the returns achieved in the ten years to March 2019 were the exception - funds were being rewarded at a level of 1.4% p.a. return for every 1% of volatility that they experienced and that the current ratio is much closer to what has been seen previously.
The 10 year rolling returns are plotted in Figure 14. The double digit returns experienced until 2002 were brought to an end by the equity crash as the Dotcom bubble burst. They have only been experienced once since, in 2019. What can also be seen is the relatively small impact the latest year’s fall has had on the results.
Despite the current pandemic, long term results remain in good health
FIG. 13 Reward for Accepting Volatility
10 years to end March 2015 2016 2017 2018 2019 2020
Return % p.a. 7.9 5.6 6.8 7.5 10.8 7.0Volatility 10.2 9.0 10.0 9.7 7.5 7.3Ratio 0.8 0.6 0.7 0.8 1.4 1.0
Despite the impact of COVID in the latest year and the Global Financial crisis and Dot-Com bubble in the 20 and 30 year numbers, Local Authority returns have held up well. They are ahead of inflation over all periods, usually comfortably so.
01234
95 96 97 98 99 2000 01 02 03 04 05 06 07 08 09 10 11 12 13 14 15 16 17 18 19 20
0
1
2
3
4
5
6
7
8
CPI
Universe
30 yrs20 yrs10yrs5yrs3yrs
FIG.12 Fund performance – last thirty years
Universe CPI
%p.
a.
2019 saw the first double digit 10 year return since 2002 as the equity ‘shocks’ worked their way out of the results.
0
3
6
9
12
15
97 98 99 00 01 02 03 04 05 06 07 08 09 10 11 12 13 14 15 16 17 18 19 20
FIG.14
Rolling 10 Year Performance – to end March
% p
.a.

14
ANNUAL REPORT 2019/20
LOCAL AUTHORITY PENSION PERFORMANCE ANALYTICS | @PIRC Ltd
2. LONGER TERMAsset Class PerformanceAt asset class level, equities have dominated perfor-mance over all periods. However the performance has been mixed.
Funds invest in a range of assets with different attributes and behaviours to allow a broadly diversi-fied return. When setting strategy the fund will take into account the expected level of return of each asset and the associated level of volatility. There is an expectation that the more volatility that is accepted the higher level of return should be delivered. Equity markets are less predictable than the central bank responsible for setting interest rates for instance. As a result funds will expect a higher rate of return from their equity investments than from the cash that they hold.
In Figure 15 we have plotted the performance of the major asset classes with in the Universe over the last ten years in risk and return space. In ‘normal’ times it would be expected that these plots would cluster along a line at around 45 degrees – more vola-tility: more return.
Over this period it can be seen that, unusually, funds have been better rewarded for holding alterna-tives and property than equities. These assets have produced better absolute returns at significantly lower volatility.
Equity exposure reduced as diversification comes ever more to the foreEquity exposure has reduced significantly over the last thirty years. By the end of March 2020, as shown in Figure 16, at 51%, it was at its lowest ever level within the average funds allocation.
Much of this disinvestment has come about because of concern around the volatility of equity markets and the need to diversify assets to reduce overall fund risk. The latest year has highlighted why
such concerns exist. Looking in Figure 17 at the returns achieved over the last 25 years, it can be seen clearly that there has indeed been a very wide range of annual results from +50% in 2009/10 to -30% in 2002/3.
On a rolling three year basis (in figure 18) however there are only two periods of negative return. Given the long term nature of pension fund investment, one could question the scale of the fixation with equity volatility and the push to diversify into ‘low risk’ assets.
Retaining a high exposure to the UK has hurt equity performanceThe most interesting feature of equity performance over the last decade has been the relative performance of the UK. Figure 19 shows the relative performance of the UK equity average within the Universe to the overall equity return. In each of the last six years it has had a significantly negative impact.
This feature helps explain the change in equity
FIG.15
Asset class performance – last 10 years
15
Cash
Property
Alternatives
Bonds
Total Assets
Equities
0 5 10 150
5
10
15
Retu
rn (%
p.a.
)
Volatility (%p.a.)
1995 2000 2005 2010 2015 20200
10
20
30
40
50
60
70
80
FIG.16Average equity exposure – last 25 years
95 96 97 98 99 2000 01 02 03 04 05 06 07 08 09 10 11 12 13 14 15 16 17 18 19 20-30
-20
-10
0
10
20
30
40
50
60
FIG.17 Annual equity performance – last 25 years
% re
turn
95 96 97 98 99 2000 01 02 03 04 05 06 07 08 09 10 11 12 13 14 15 16 17 18 19 20-20-15-10-505
1015202530
FIG.18 Rolling three year performance of equities
% re
turn

15
ANNUAL REPORT 2019/20
LOCAL AUTHORITY PENSION PERFORMANCE ANALYTICS | @PIRC Ltd
2. LONGER TERM
rankings of many of the larger funds in the Universe. Historically these funds had enjoyed strong equity selection but this has fallen away over this period as these funds have held higher allocations to the UK.
The loss in confidence and uncertainty around Brexit has been another factor whilst the high index
exposure to the Oil and Gas and Energy sectors have dragged down recent perfor-mance further.
At the end of March 2014 the average fund held 40% of its assets in UK stocks. This had halved to 20% by the end of March 2020.
The disappointing returns from UK equities was worsened further for many funds by the relatively poor results from active UK equity managers over much of the period. The majority of actively managed UK equity portfolios underperformed the index, making the switch to a global equity approach a somewhat easier decision for funds.
Emerging markets have struggled since the global financial crisisLike UK Equities, holding Emerging Markets has not had a positive impact on the equity performance of funds for most of the period since the global financial crisis. The rationale behind holding these stocks is that the higher level of risk associated with them will deliver a higher level of return. Rather, over the last
decade as can be seen in Figure 20, as an asset it has underperformed the aggregate equity result by 7% p.a.
A strong dollar, slowing global growth, particu-larly in China and the issues arising from the fallout of the global financial crisis, including social unrest and the growth in protectionist policies have all acted to dampen returns.
Most funds have exposure to Emerging Markets through their global equity portfolios – the MSCI All Countries index (which includes Emerging Markets) being the most used benchmark. However a third of funds retain separate Emerging or Frontier Market portfolios. Almost all of these are managed actively and most of these managers underperformed the index over the last three years.
Global equity restructuring continuesThe last couple of years has seen a major change in the way global equities are managed as the move towards pooling continues.
Of the global equity assets managed actively more than half is now within the Pools. While it is still too early to review the performance of this grouping, most seem to have got off to a reasonable start. Of the multi-manager offerings the only one to have been in place for three years is that run by LPPI and it has performed extremely well, outperforming the index by almost 3% p.a.
The shrinking group of active global equity mandates that remain external to the Pools outper-formed the benchmark index in the latest year and
01234
95 96 97 98 99 2000 01 02 03 04 05 06 07 08 09 10 11 12 13 14 15 16 17 18 19 20
-15
-12
-9
-6
-3
0
3
6
FIG.20 Performance of emerging markets relative to total equities
2008 2009 2010 2011 2012 2013 2014 2015 2016 2017 2018 2019 2020 3 Yrs 5 Yrs 10 Yrs
%p.
a.
%
01234
95 96 97 98 99 2000 01 02 03 04 05 06 07 08 09 10 11 12 13 14 15 16 17 18 19 20
-8
-7
-6
-5
-4
-3
-2
-1
0
1
2
3
FIG.19
Performance of UK equities relative to total equities
2008 2009 2010 2011 2012 2013 2014 2015 2016 2017 2018 2019 2020 3 Yrs 5 Yrs 10 Yrs
%p.
a.
%
Emerging markets have failed to add value for most of the period since the global financial crisis. Funds have been poorly rewarded for the additional risk associated with these investments.
Since 2015, UK equity investments have significantly underperformed the returns from overseas. Funds that have retained a high UK allocation have seen performance relative to their peers decline.
The decline of SterlingAt the end of March 2014 (the last time UK stocks added value to the equity mix) one pound bought US$1.67. By the end of March 2020 this had fallen to US$1.24 – it
had lost a quarter of its value. £

16
ANNUAL REPORT 2019/20
LOCAL AUTHORITY PENSION PERFORMANCE ANALYTICS | @PIRC Ltd
2. LONGER TERMover the last three years, suggesting that funds are more reluctant to transfer assets into the Pools from stronger performing managers.
Traditional bond portfolios have outperformed their ‘lower risk’ peersDespite yields falling to historic lows, the average fund exposure to bonds continues to increase, albeit at an extremely gradual pace. By the end of the March 2020 the average fund held 21% of its assets within this asset type. This is in stark contrast to corporate schemes who, it is estimated hold almost three times that amount.
Within this, as can be seen in Figure 21, there has been continued diversification away from the core UK government bonds (gilts) and UK Government Index Linked bonds that made up the bulk of those asset exposure a decade ago.
The move away from index based benchmarks towards absolute return mandates was driven by the broad rationale that by allowing the manager a wider opportunity set over which to invest, bond-like returns that were diversified from core index linked or corporate/ government bonds would be delivered. The move was accelerated by concerns over bond valuations and the historically low yields that have resulted from the combination of increased demand from de-risking corporate pension funds, falling global interest rates and deliberate direct intervention by Central Banks through their quantitative easing (QE) policies.
However, by giving the manager less constraints and a broader base over which to invest, funds are reliant upon manager skill to generate return not the market beta. Therefore manager selection becomes critical.
Over the last five years portfolios invested in UK government / corporate bonds returned around 4% p.a whilst absolute return investments delivered less than 1% p.a. Over three years the performance is poorer – UK bonds delivering around 4% p.a. while absolute return portfolios just failing to deliver a positive return.
UK Govt UK Corp Index Linked Overseas
Absolute Return MAC Private Debt
2005 2010 2015 20200
102030405060
% 708090
100
FIG.21 Bond allocation over time
Portfolio returns
FIG.22Performance of absolute return bond portfolios – last three years
-4
-3
-2
-1
0
1
2
3
4
5
6
7
8
% p
.a.
More than half the portfolios failed even to achieve a positive return over the last three years. Only four managed to outperform their benchmark over this period.
10 year bond yield
0
1
2
3
4
5
6
7
8
FIG.x
Bond yields collapse
2000 2005 2010 2015 2020
UK bond yields have declined significantly over the last twenty years

17
ANNUAL REPORT 2019/20
LOCAL AUTHORITY PENSION PERFORMANCE ANALYTICS | @PIRC Ltd
2. LONGER TERM
Looking at the absolute return bond portfolios which have been invested for that full three year period there were 17 different managers in place. The absolute returns that were delivered by the absolute return portfolios are shown in Figure 22. Whilst benchmarks vary most are in the range 3-4%
Only three managers and four portfolios managed to outperform their benchmark over this period.
Private equity leads a strong showing from alternativesThe weighting in alternatives has doubled over the last decade to reach the current level of 11% of the average funds’ assets. Ten years ago around half of all alternative investment was held within private equity, a percentage that has stayed broadly consistent through the period. However, the investments that funds held ten years ago in active currency and tactical asset allocation funds have largely disappeared and been replaced with infrastructure, hedge fund and various absolute return strategies instead.
Hedge fund investment increased markedly following the credit crisis as funds sought to reduce equity volatility, peaking in 2011 before falling back, partly on the grounds of disappointing returns and in part, as funds diversified into an increasingly broad and complex, but arguably more transparent, pool of other absolute return investments.
Infrastructure has only been identified as a distinct component of many funds’ strategies in recent years but is becoming increasingly important as funds seek diversified forms of risk and relatively high yields. It now makes up the second largest component of the average fund alternatives exposure. Allowing better access for smaller funds to infrastructure investments was one of the key drivers behind pooling and we expect to see a continuation of the positive cash flow to this area as a result.
Figure 23 shows the strong results from private equity and infrastructure. Whilst absolute return funds have delivered returns in line with their bench-marks, the return achieved over all periods has been well below the other alternative asset classes.
The issues around pricing alternatives, particu-larly private equity which is usually valued at least a quarter in arrears, means that the returns need to be viewed with some caution.
the continued interest in the area (driven in part by the strong returns) and new investment is likely to reduce the risk premium over quoted equity as well as enable poorer quality investments to be funded.
If the risk premium over quoted equity (currently around 5% p.a. but falling)reduces to a level where funds believe active quoted equity managers can deliver then we may see a move back towards quoted equites. Funds would have the potential to achieve similar levels of return in a liquid market at a fraction of the fee.
0
3
6
9
12
15
Hedge Funds
Infrastructure
Private Equity
10 yrs5 yrs3 yrs
Private Equity Infrastructure Hedge Funds
FIG.23
Longer term performance of alternatives%
p.a
.
-15-10
-505
1015202530
DG Equity
2013 2014 2015 2016 2017 2018 2019 2020 3 Years 5 Years 8 Years
FIG.24Equity and DG performance last 8 years
% p
.a.
Private equity performance has been exceptionally strong over all periods. Likewise infrastructure investments have exceeded expectations, particularly given many funds are still in early stage investments.
Equity and DG returns move in the same direction but at different magnitudes. The correlation between the two assets is over 0.9, due largely to the high concentration of equities within many DG strategies

18
ANNUAL REPORT 2019/20
LOCAL AUTHORITY PENSION PERFORMANCE ANALYTICS | @PIRC Ltd
2. LONGER TERM
Diversified growth not as ‘diversifying’ as funds may have thoughtDiversified Growth (DG) was originally often described as aspiring to equity –like returns at well below equity –like volatility. In the three years to end March 2019, equity markets had raced ahead and funds with large DG holdings found that they had had a large drag on overall returns as can be seen in Figure 24.
DG also hadn’t worked as well as a diversifying asset as might have been hoped, largely because many of the DG options contain relatively large equity exposures within them.
However, after the negative results of the latest year the situation is looking quite different.
Looking at Figure 25 it can be seen that in the three years to 2019 holding a 30% allocation to DG would have reduced overall volatility by around a quarter (from 7.6% pa to 5.9% pa) however to achieve this the Fund would have given up over a quarter of its return (from 11.5% p.a,) to 8.5% p.a.
Move forward a year and a 30% allocation will have reduced volatility by almost a quarter but the overall fund return is almost unchanged. DG has not been a good equity diversifier and whilst funds that held a high allocation in the latest year, benefited from a better than equity performance in the latest period, over longer periods the benefit has been eroded. Funds with high DG allocations will haveex-perienced lower returns for relatively small reductions in volatility.
A Decade of Positive Returns For PropertyAfter a period of underperformance in the period following the global financial crisis property has, until the latest year, had a period of sustained excellent results. With a return of around 8% p.a. over both the last ten and twenty years it has outperformed both equities and bonds. As can be seen in Figure 26 it has delivered a positive result in each of the last ten years and in eighteen of the last twenty.
Property remains the best diversifier of equities of any major asset class. Funds with a high property allo-cation over the last decade have seen overall returns improve and volatility reduce as a result of this decision.
Like all asset classes, investments are becoming more diverse. The number of funds holding overseas property remains low, although this has benefited from the extended decline of Sterling in recent years.
Investments have also been made into student accommodation, long lease investments and absolute return property funds. Not all of this is considered a ‘property’ investment – some funds choosing to incor-porate these less mainstream investments into their yield or alternatives portfolios.
Larger funds have always tended to outperform their smaller peers, something that continues to date. The larger funds benefit from lower costs and perhaps a wider opportunity set available because of their scale. It is also likely that, as early adopters they may have managed to get hold of a higher proportion of prime real estate.
Holding cash hurt long term performanceAny exposure to cash over any of the periods would have reduced overall fund performance. To be fully invested has been a very successful long term strategy.
Property performed consist-ently well delivering a positive result in 18 of the last twenty years. It also has almost no correlation with equity performance which has made it a very efficient diversifier.
-30-25-20-15-10-505
10152025
FIG.26Long term performance of property
% p
.a.
01 02 03 04 05 06 07 08 09 10 11 12 13 14 15 16 17 18 19 20 3 yrs 5 yrs 10 yrs 20 yrs
FIG. 25 Impact of DG as a Diversifying Asset
to end March 2019 to end March 2020 % Allocation % p.a. % p.a.Equity Bond DG Return Volatility Return Volatility
80 20 11.5 7.6 -0.2 10.970 20 10 10.5 7.0 -0.2 10.260 20 20 9.5 6.4 -0.3 9.450 20 30 8.5 5.9 -0.3 8.6

19
ANNUAL REPORT 2019/20
LOCAL AUTHORITY PENSION PERFORMANCE ANALYTICS | @PIRC Ltd
3INSIGHTS
Funds have diversified away from equities in an attempt to reduce volatility.
Over the last 10 years equity risk has not been rewarded but picking excellent equity managers has been the key factor in being top decile over this period.
Funds need to question taking on additional complexity.
ANNUAL REPORT 2019/20

20
ANNUAL REPORT 2019/20
LOCAL AUTHORITY PENSION PERFORMANCE ANALYTICS | @PIRC Ltd
3. INSIGHTS
Figure 27 shows high level asset allocation remained broadly unchanged over the last decade – while the equity exposure has been reduced in favour of diversi-fying alternatives equities still remain by far the largest asset class in most funds’ allocations.
The average local authority fund is still substan-tially overweight equities when compared to schemes in the corporate sector that continue to run an invest-ment portfolio. These schemes have shrunk their equity component as they have sought to ‘de-risk’ their assets, moving instead to bonds and cash-flow matching investments.
Given the strong performance of equities over most of the last decade this decision will have made the corporate schemes considerably more expensive for the employer. In contrast, LGPS funds have seen their asset values increase significantly. As well as having a positive impact on funding levels this has offset some of the increases brought about by increased longevity and falling bond yields (the metric on which they are measured) in their liabilities over the same period.
The performance of LGPS funds is always dominated by the results from equities and the volatil-ity, or variability, of the return that is experienced is directly linked to the level of equities held.
Funds have different attitudes to the investment (asset) risk that they are taking. Whilst many view
their funds as very long term investments and are therefore prepared to live with equity market volatility in the short term, others are increasingly looking to mitigate the impact of these short term fluctuations and are reducing their equity exposure as a result. The average allocation hides a wide range. At the end of March 2020 the lowest allocation was 13% with the highest being 70%. The funds at either end of this scale have markedly different risk appetites and return expectations.
Over recent years there has been a large increase in lower risk investments such as absolute return strategies and in assets with strong income generating potential, most commonly through property, infra-structure and bonds.. These lower risk strategies are being put in place because of the changing circum-stances in which funds find themselves. After decades of being in a situation where the money coming in (through contributions and income) has been greater than that going out things have become more complex.
Complex profiles of admitted body employers also have an impact on individual fund risk appetite and funding strategies to deal with this issue continues to tax many funds.
The Scheme Advisory Board 18/19 annual report confirmed that, in aggregate, funds are paying out more in benefits and expenses than they are taking in
2011 2012 2013 2014 2015 2016 2017 2018 2019 2020
FIG.27
Long term asset allocation
0
10
20
30
40
50
60
70
80
90
100
Equities Bonds Cash Alternatives Diversified Growth Property
%Are funds being rewarded for the risk they are taking?
Money has moved out of equities in each of the last ten years. It has been largely directed into alternatives and absolute bond strategies. Equities still however make up around half of most funds’ asset allocation.

21
ANNUAL REPORT 2019/20
LOCAL AUTHORITY PENSION PERFORMANCE ANALYTICS | @PIRC Ltd
3. INSIGHTSthrough contributions. However almost all funds are still currently generating sufficient investment income to cover this deficiency. As such they are still currently unlikely to be in the position of a forced seller of equities.
The charts below demonstrate the expected rela-tionship between risk and return – the greater volatil-ity that a fund is prepared to accept, the higher a return it can hope to achieve over the longer term. As such, we should expect to see the more risk averse funds deliver lower volatility but achieve lower returns than their peers.
We have plotted the various asset classes into this risk/ return space over the last ten years in Figure 28
below. It can be seen that while, as usual, the least volatile (cash) has delivered the lowest return the other assets are all grouped much closer together than would be expected. Property and alternatives have delivered better levels or return, when adjusted for the volatility, than might be expected whilst equities have delivered a less efficient level of return.
If we look at the shorter term in Figure 28, a very similar picture emerges. Funds have not been rewarded for the risk that they have taken on through their equity investment. Alternatives and property have been the most efficient asset classes over this period too (although there will be a large range of risk and return profiles within each group).
Expected relation between risk and return over time
Incr
easi
ng re
turn
Increasing volatilty
Over the 10 years it can be seen that property and altenatives are sitting to the right of the expected volatility / return line while equities are off to the left. Funds have achieved a substantially better risk adjusted return from the former while being relatively poorly rewarded for the additional volatility of the equity assets held.
Over the last five years the position is similar but more extreme - alternatives have delivered a return double that of equities at less than half the associated volatility.
FIG. 28 Asset Class in risk / return space
Last 10 years
Retu
rn (%
p.a.
)
Risk (%p.a.)
0 5 10 150
5
10
15
Cash
PropertyAlternatives
Bonds
Total Assets Equities
Last 5 years
Retu
rn (%
p.a.
)
Risk (%p.a.)
0 5 10 150
5
10
15
Cash
Property
Alternatives
Bonds
Total Assets
Equities
Alternatives and Property volatility may be understated because of the valuation methodology.

22
ANNUAL REPORT 2019/20
LOCAL AUTHORITY PENSION PERFORMANCE ANALYTICS | @PIRC Ltd
3. INSIGHTS
Is there such a thing as too much diversification?
FIG. 29 Complexity Over Time
2000 2010 2020Average Number of Mandates 5 9 12 % Passive 9 23 27Mandate UK Equity UK Equity UK Equity Overseas Equity Overseas Equity Overseas Equity Emerging Market Equity Emerging Market Equity Emerging Market Equity UK Gilts UK Gilts UK Gilts UK IL UK IL UK IL Cash Cash Cash Property Property Property Corporate Bonds Corporate Bonds Private Equity Private Equity Hedging Hedging Absolute return Absolute return Alternative Credit Hedge Funds Infrastructure Commodities Diversified Growth Multi Asset Credit Liability Matching Equity Protection Smart Beta Climate Aware and more…
The Challenges of Complexity
Increase in: Challanges
Manager choice -More to choose from makes selection increasingly difficult (particularly within alternative space)
-Likelihood of choosing more than one manager
Investment opportunities -Complexity of asset types and range of products needs more training, more governance and has led to a greater reliance on consultants.
-Possibility of distracting fund away from what it is trying to achieve: how much return can it give up to reduce risk the appearance of cash benchmarks for some alternatives
(soft/unchallenging/inappropriate)
Number of portfolios -Increased administration and committee time burdens -Less time to build strong manager relationships -Likelihood of increased manager change -Smaller portfolios result in higher costs
23
ANNUAL REPORT 2019/20
LOCAL AUTHORITY PENSION PERFORMANCE ANALYTICS | @PIRC Ltd
3. INSIGHTS
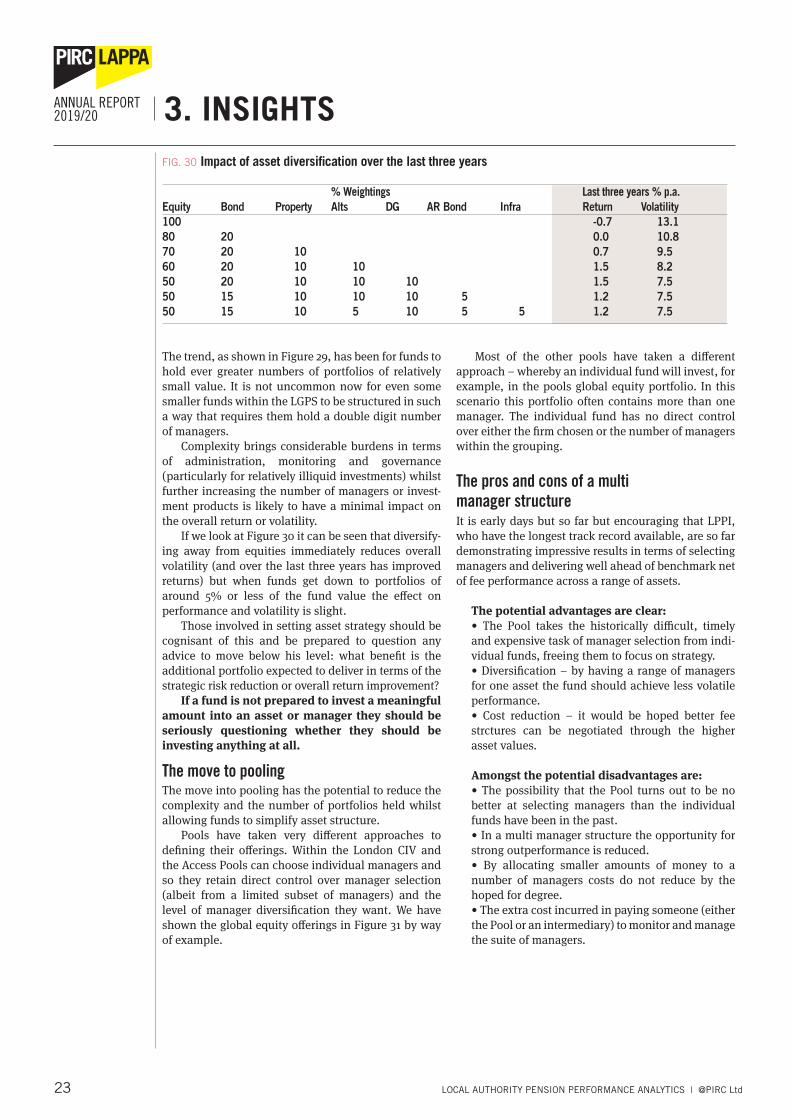
The trend, as shown in Figure 29, has been for funds to hold ever greater numbers of portfolios of relatively small value. It is not uncommon now for even some smaller funds within the LGPS to be structured in such a way that requires them hold a double digit number of managers.
Complexity brings considerable burdens in terms of administration, monitoring and governance (particularly for relatively illiquid investments) whilst further increasing the number of managers or invest-ment products is likely to have a minimal impact on the overall return or volatility.
If we look at Figure 30 it can be seen that diversify-ing away from equities immediately reduces overall volatility (and over the last three years has improved returns) but when funds get down to portfolios of around 5% or less of the fund value the effect on performance and volatility is slight.
Those involved in setting asset strategy should be cognisant of this and be prepared to question any advice to move below his level: what benefit is the additional portfolio expected to deliver in terms of the strategic risk reduction or overall return improvement?
If a fund is not prepared to invest a meaningful amount into an asset or manager they should be seriously questioning whether they should be investing anything at all.
The move to poolingThe move into pooling has the potential to reduce the complexity and the number of portfolios held whilst allowing funds to simplify asset structure.
Pools have taken very different approaches to defining their offerings. Within the London CIV and the Access Pools can choose individual managers and so they retain direct control over manager selection (albeit from a limited subset of managers) and the level of manager diversification they want. We have shown the global equity offerings in Figure 31 by way of example.
Most of the other pools have taken a different approach – whereby an individual fund will invest, for example, in the pools global equity portfolio. In this scenario this portfolio often contains more than one manager. The individual fund has no direct control over either the firm chosen or the number of managers within the grouping.
The pros and cons of a multi manager structureIt is early days but so far but encouraging that LPPI, who have the longest track record available, are so far demonstrating impressive results in terms of selecting managers and delivering well ahead of benchmark net of fee performance across a range of assets.
The potential advantages are clear:• The Pool takes the historically difficult, timely and expensive task of manager selection from indi-vidual funds, freeing them to focus on strategy. • Diversification – by having a range of managers for one asset the fund should achieve less volatile performance. • Cost reduction – it would be hoped better fee strctures can be negotiated through the higher asset values.
Amongst the potential disadvantages are:• The possibility that the Pool turns out to be no better at selecting managers than the individual funds have been in the past. • In a multi manager structure the opportunity for strong outperformance is reduced. • By allocating smaller amounts of money to a number of managers costs do not reduce by the hoped for degree. • The extra cost incurred in paying someone (either the Pool or an intermediary) to monitor and manage the suite of managers.
FIG. 30 Impact of asset diversification over the last three years
% Weightings Last three years % p.a. Equity Bond Property Alts DG AR Bond Infra Return Volatility100 -0.7 13.180 20 0.0 10.870 20 10 0.7 9.560 20 10 10 1.5 8.250 20 10 10 10 1.5 7.550 15 10 10 10 5 1.2 7.550 15 10 5 10 5 5 1.2 7.5

24
ANNUAL REPORT 2019/20
LOCAL AUTHORITY PENSION PERFORMANCE ANALYTICS | @PIRC Ltd
3. INSIGHTS FIG. 31 Pool global equity management arrangements
Single Managers Multi Manager Funds
Access London CIV B2C Brunel Central LPP WalesLongview Baillie Gifford Investec AllianceBernstein Union Internal Baillie GiffordBaillie Gifford Longview Harris Assoc Baillie Gifford Harris Assoc Robecco PzenaBaillie Gifford Epoch Lindsell Train Fiera Schroders Magellan VeritasM&G Allianz (Closing) Loomis Sayles Harris Assoc First Eagle Morgan StanleyFidelity Newton Royal London Wellington NumericNewton Quoniam Baron SandersDodge & Cox Robeco Jacobs LevyJ O Hambro SW Mitchell NWQ Oaktree
Figure 32 below shows individual fund performance over the period in the risk and return space. Each fund for which we have a full data set is represented by a blue dot. The higher the fund lies on the vertical y axis the better its return, the further to the right on the horizontal x axis the greater the volatility experienced. The cross-hair lines represent the median risk and return. Most funds would prefer to be in the top left quadrant – delivering a higher level of return than average at a lower level of volatility, although many would be equally happy to be in the top right quadrant – higher volatility delivering higher return.
The top decile funds over the period in term of return have been highlighted in green. Over the ten year period more than half these have accepted a higher level of volatility than average and this volatil-ity has been rewarded. The others managed the enviable feat of achieving a well above average return over the period at a level of volatility below that of the average.
The funds in the top left quadrant that have managed to deliver better than average results at a lower than average volatility have historically tended to be larger than their peers as size seemed to allow more effective diversification. However this advantage seems to be fading and the funds in this quadrant now represent a broad mix of size, structure and location.
The poorest performing funds (bottom decile) over this period (in orange) have underperformed across a range of volatility. The common characteristic of this group is manager selection. All of these funds are bottom decile in terms of either equity selection, bond selection, or in one case, both.
Over the last five years, as can be seen in Figure 32, (shown on the same scale) the median level of volatili-ties has remained unchanged but the return has declined.
The best performing funds are almost unchanged
from the ten year chart – six of the seven are in the top group over both periods. There has been more movement within the bottom group where only two remain from the ten year period.
It is difficult to pin down just what brings about the strong performance of the top performing funds.
Is bigger better?Larger fund size was one of the factors behind the move to pooling. Larger funds had historically performed better than most of their smaller peers for a variety of reasons including lower cost, less change of managers and earlier investment into property and private equity which resulted in better returns. Historically the larger funds were able to deliver these better than average results at low levels of volatility. However this outperformance has disappeared over the recent past largely as these funds suffered from high UK equity allocations.
The right advice?There is no apparent link between performance and consultant used. If we look across funds there is, perhaps surprisingly, little commonality in structure, managers or performance across funds using the same investment consultant.
Aon, Hymans and Mercers are all represented in both the top and bottom decile funds in the analysis.
Interestingly funds in the bottom group are more likely to have an independent advisor (although it is difficult to know whether these have been appointed in response to poor performance or whether they are a factor in the underperformance).
Being well funded helpsThe better performing funds over both the five and ten year periods were substantially better funded than those in the bottom decile. This has been a recurring
Why do some funds do better than others?

25 LOCAL AUTHORITY PENSION PERFORMANCE ANALYTICS | @PIRC Ltd
3. INSIGHTSANNUAL REPORT 2019/20
Last five YearsOver the last five years the best performing fund has managed to deliver well above average performance at well below average volatility - an excellent and unusual outcome.
Last ten YearsThe best performing funds have generally accepted a relatively high level of volatility. The poorest performing funds have also generally had a relatively high level of volatility but this has not been rewarded.
Expected relation between risk and return over time
Incr
easi
ng re
turn
Increasing volatilty
FIG. 32 Risk and return distribution of funds
Last 10 years
Incr
easi
ng R
etur
n %
p.a
.
Increasing Volatility % p.a.
5 6 7 8 9 102
3
4
5
6
7
8
9
10
5 6 7 8 9 102
3
4
5
6
7
8
9
10
Last 5 years
Incr
easi
ng R
etur
n %
p.a
.
Increasing Volatility % p.a.
5 6 7 8 9 102
3
4
5
6
7
8
9
10
bottom decile funds
top decile funds
funds
median
Last 5 years
Incr
easi
ng R
etur
n %
p.a
.
Increasing Volatility % p.a.
5 6 7 8 9 102
3
4
5
6
7
8
9
10
bottom decile funds
top decile funds
funds
median
feature and, as ever it is difficult to determine whether the funds are underfunded as a result of poorer perfor-mance or whether the decisions made in response to the underfunding have resulted in the lower returns.
As does keeping things simpleIn terms of structure the better performing funds tend to be less complex than their peers and to have held their managers for longer. This is likely to have helped keep costs down which will have boosted performance.
Picking equity managers remains a key factorWhat the group do have in common is excellent equity selection. The one defining feature of this group is their consistently strong equity performance – all top decile funds over the last ten years have an equity ranking of 15th percentile or above.
They also have more of their equities managed actively than other funds. Whilst they employ a broad range of managers, Baillie Gifford is the one most commonly used, managing money for more than half.

26
ANNUAL REPORT 2019/20
LOCAL AUTHORITY PENSION PERFORMANCE ANALYTICS | @PIRC Ltd
3. INSIGHTS
It is still early days for Pooling but it is of interest to see where funds are in terms of performance when grouped by pool. Figure 33 shows the funds in our Universe for whom we have a full set of monthly data over the last ten years.
There is no clear clustering with most groupings appearing across quadrants over this period. London funds are on average more risk averse. As a group they hold significantly more in Diversified Growth than
their peers and less in private equity which are two of the key factors in the relatively low volatility of many of them.
Over the more recent period the range of results has been much wider. The Funds now in the Brunel pool have performed relatively poorly whilst the Welsh funds are largely outperforming. The large funds of the Northern Pool have performed close to average.
Past performance of funds by pool
Last 10 years
Incr
easi
ng R
etur
n %
p.a
.
Increasing Volatility % p.a. 5 6 7 8 9 10
2
3
4
5
6
7
8
9
10
Access
BCPP
Brunel
London
LPPI
Northern
Wales
Last 5 years
Incr
easi
ng R
etur
n %
p.a
.
Increasing Volatility % p.a
5 6 7 8 9 102
3
4
5
6
7
8
9
10
Ten year performanceThe London funds have been the most and least volatile over this period. The most volatile funds also delivered the best returns.
Five year performanceOver the last five years the range of results has widened and there has been less return for volatility. The Brunel funds performed less well than those in other pools over this period.
FIG. 33 Fund performance by pool
Last 10 years
Incr
easi
ng R
etur
n %
p.a
.
Increasing Volatility % p.a. 5 6 7 8 9 10
2
3
4
5
6
7
8
9
10
Access
BCPP
Brunel
London
LPPI
Northern
Wales

27
ANNUAL REPORT 2019/20
LOCAL AUTHORITY PENSION PERFORMANCE ANALYTICS | @PIRC Ltd
SOME FINAL THOUGHTS
ANNUAL REPORT 2019/20
COVID is still very much with us. The variable impact on people and economies and the shape of the recovery is going to drive markets for the forseeable future.
The impact will vary greatly across markets, sectors and individual companies. This should provide great opportunities for active managers to add significant value. It will be interesting to see whether they can deliver.
Traditional index tracking funds hold the whole index, including sectors and companies that may now be in long term decline. Perhaps it is time for funds to review this ‘low risk’ approach.
Property performance, like equity markets is going to be impacted differentially as behaviours begun in lockdown become cemented and the office market may follow retail into secular decline.
Credit markets too, have suffered some severe dislocation. More impairments and defaults are likely and choice of invest-ments will be key.
All of these factors are pointing to the need for active managers who can demonstrate skill. The LGPS has had mixed experi-ence of active management but should recognise that one of the key drags on long term performance has been the explicit and implicit cost of manager change. It will be important that funds and pools give managers an appropriate time horizon to allow them to demonstrate their skill over this challenging and unprecedented time.

28
ANNUAL REPORT 2019/20
LOCAL AUTHORITY PENSION PERFORMANCE ANALYTICS | @PIRC Ltd
4. STATISTICAL APPENDIXPerformance - Last 10 Years end March % 2011 2012 2013 2014 2015 2016 2017 2018 2019 2020
Total Equity 9.2 -0.1 17.8 8.3 13.6 -1.9 28.9 4.3 7.3 -12.5Global 7.5 0.2 16.2 8.6 18.3 -1.6 30.5 4.8 8.6 -11.9UK 9.7 2.2 18.0 11.3 6.3 -3.8 21.4 1.4 5.7 -18.2Overseas 8.9 -2.1 17.5 6.4 18.1 -1.3 32.9 5.5 6.0 -8.8Emerging 11.7 -8.1 10.5 -5.1 13.5 -7.8 33.2 8.8 0.0 -13.0Total Bonds 6.1 11.6 9.8 -1.1 12.7 1.3 11.3 1.4 3.7 1.7UK Govt 10.1 2.0 5.1 8.1UK Corp 11.7 2.0 4.0 0.1UK IL 6.4 19.8 11.2 -4.4 20.2 2.1 18.2 0.2 5.3 2.0Non UK Bonds 2.7 7.3 10.0 -6.1 8.7 4.2 14.8 0.1 3.9 1.7Absolute Return Bonds 5.1 2.7 1.0 -4.1MAC 0.1 -11.8Cash 1.5 0.2 2.8 1.1 1.5 1.1 0.2 -0.2 0.8 -0.4Alternatives 7.5 2.8 10.2 4.4 11.9 8.6 16.0 5.8 10.3 7.4Private Equity 10.3 5.3 11.8 5.4 15.7 14.2 19.6 8.9 15.3 12.1Hedge Funds 5.3 -0.1 7.3 3.6 8.6 0.1 10.0 2.2 1.8 5.7Infrastructure 2.9 10.6 1.6 10.7 9.1 17.7 6.2 11.7 5.5Diversified Growth 10.6 3.4 9.5 -2.7 7.2 1.6 0.3 -5.2Property 8.6 6.0 6.8 11.8 15.2 11.0 6.2 9.8 6.1 1.7Total Assets 8.0 2.6 14.0 6.4 12.9 0.4 21.4 4.5 6.6 -4.8CPI 4.0 3.5 2.8 1.6 -0.1 0.5 2.3 2.5 1.9 1.5
Performance - Longer Term
end March % 3 Years 5 Years 10 Years 20 Years 30 Years % p.a. % p.a. % p.a. % p.a. % p.a.
Equities -0.7 4.4 7.0 5.1 8.0Bonds 2.2 3.8 5.7 5.9 7.7Cash 0.2 0.4 0.9 - -Alternatives 7.8 9.6 8.5 7.4 -Diversified Growth -1.2 0.1 - - -Property 5.8 6.9 8.2 7.0 7.3Total Assets 1.9 5.2 6.9 5.5 7.9CPI 2.0 1.7 2.0 2.0 2.4
Asset Allocation
End March % 2011 2012 2013 2014 2015 2016 2017 2018 2019 2020
Equities 64 62 63 63 62 60 62 55 55 51Bonds 17 18 18 17 17 16 15 18 19 21Cash 3 4 3 3 3 3 2 3 2 1Alternatives 9 8 8 8 8 9 10 11 11 12Diversified Growth 1 2 3 3 3 3 4 3 4Property 7 7 7 8 8 9 8 9 9 10

29
ANNUAL REPORT 2019/20 XXXXXXX
LOCAL AUTHORITY PENSION PERFORMANCE ANALYTICS | @PIRC Ltd
ANNUAL REVIEW
Pensions & Investment Research consultants ltdExchange Tower2 Harbour Exchange SquareLondon E14 9GE
Tel +44 (0)207 247 [email protected]@pirc.co.ukwww.pirc.co.uk
While all reasonable efforts have been made to ensure theaccuracy of the information contained in this documentthere is no warranty, express or implied, as to its accuracyor completeness. Any opinions expressed in this documentare subject to change without notice.
The document is for general information only and PIRC Ltdaccepts no responsibility for any loss arising from anyaction taken or not taken by anyone using this material.
Pensions & Investment Research Consultants Limited(PIRC Ltd) is authorised and regulated by the FinancialConduct Authority (FCA Register number 144331,see FCA register for registration details) and registeredin England and Wales No. 2300269.
This document is provided solely for private clients,company pension schemes, the appointees of companypension scheme trustees, and pension scheme membersfor their personal use and may not be used by any otherthird party or commercial organisation without prior express written consent from PIRC Ltd.
Regulated by the Financial Conduct AuthorityPensions & Investment Research Consultants Limited is Registered in England and Wales. No. 2300269© PIRC Limited 2020