Embed Size (px)
Citation preview
KONE 2016
ANNUAL REVIEW
KONE’s financial reporting schedule in 2017
Financial Statement Bulletin and Financial Statements for 2016 Thursday, January 26, 2017
Printed Financial Statements for 2016 Week 8 February, 2017
Interim report for January 1–March 31, 2017 Thursday, April 27, 2017
Interim report for January 1–June 30, 2017 Wednesday, July 19, 2017
Interim report for January 1–September 30, 2017 Thursday, October 26, 2017
In the second quarter of 2017, KONE will publish a separate Corporate Responsibility Report forthe year 2016.
Annual General Meeting February 28, 2017 in HelsinkiMore information on page 88.
Board’s dividend proposal of 1.55 EUR per class B-ShareMore information on page 88.
Contents
KONE 2016 Annual Review | Contents
2 KONE at a glance
4 KONE’s strategy and business model
6 Board of Directors’ report
Consolidated financial statements*18 Consolidated statement of income19 Consolidated statement of financial position20 Consolidated statement of changes in equity21 Consolidated statement of cash flows
22 Notes to the consolidated financial statements*
22 1. Basis of preparation
25 2. Financial performance26 2.1 Sales27 2.2 Costs and expenses27 2.3 Depreciation and amortization28 2.4 Foreign exchange sensitivity29 2.5 Financing income and expenses30 2.6 Income taxes30 2.7 Earnings per share31 2.8 Other comprehensive income
32 3. Net working capital33 3.1 Inventories and advance payments received34 3.2 Accounts receivable34 3.3 Deferred assets34 3.4 Accruals35 3.5 Provisions36 3.6 Deferred tax assets and liabilities
37 4. Acquisitions and capital expenditure38 4.1 Acquisitions39 4.2 Goodwill40 4.3 Other intangible assets41 4.4 Property, plant and equipment
43 5. Capital structure44 5.1 Capital management45 5.2 Shareholders’ equity47 5.3 Financial risks and instruments50 5.4 Shares and other non-current financial assets51 5.5 Deposits and loans receivable51 5.6 Associated companies52 5.7 Employee benefits54 5.8 Finance lease liabilities54 5.9 Commitments
55 6. Others55 6.1 Management remuneration56 6.2 Share-based payments
59 Shares and shareholders
62 Key figures and financial development
62 Calculation of key figures
63 Parent company financial statements*
76 Corporate governance statement76 Corporate government principles80 Board of Directors81 Executive Board
82 Board of Directors’ dividend proposal and signatures*
83 Auditors’ report* part of the official financial statements
We have renewed our Annual Review
What’s new in this report?• The new Annual Review includes the
Board of Directors’ report, Audited financial statements, Corporate gover-nance statement and Auditors’ report
• More graphs and tables to make the report easier to read
• Note disclosures are split into six distinct sections to enable a better understan-ding of KONE’s performance in 2016
• Accounting principles have been moved to the relevant part of the notes to make the report more user-friendly
Coal Valley
Allen
Torreón
HyvinkääHelsinki
EssenÙsti nad labem
Cadrezzate
Chennai
KunshanNanxun
Pero
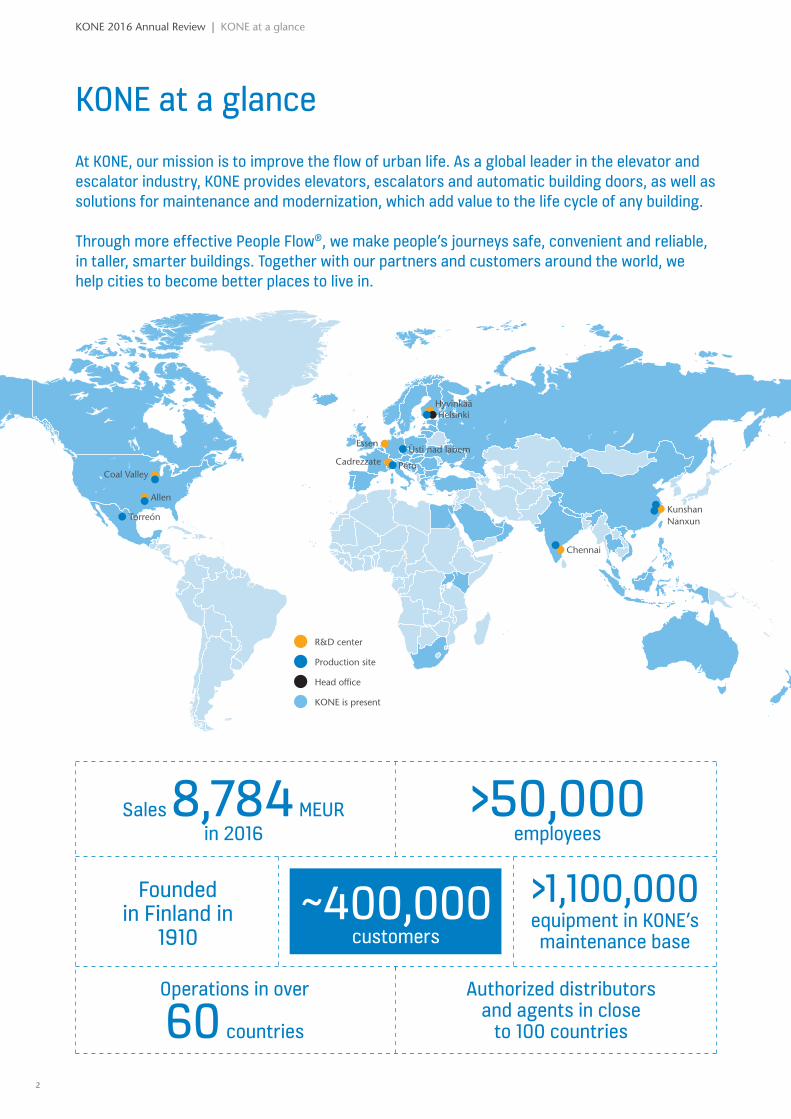
KONE at a glance
KONE 2016 Annual Review | KONE at a glance
~400,000 customers
>50,000 employees
>1,100,000 equipment in KONE’s maintenance base
Sales 8,784 MEUR in 2016
R&D center
Production site
Head office
KONE is present
At KONE, our mission is to improve the flow of urban life. As a global leader in the elevator and escalator industry, KONE provides elevators, escalators and automatic building doors, as well as solutions for maintenance and modernization, which add value to the life cycle of any building.
Through more effective People Flow®, we make people’s journeys safe, convenient and reliable, in taller, smarter buildings. Together with our partners and customers around the world, we help cities to become better places to live in.
Founded in Finland in
1910
Operations in over
60 countries
Authorized distributors and agents in close
to 100 countries
2
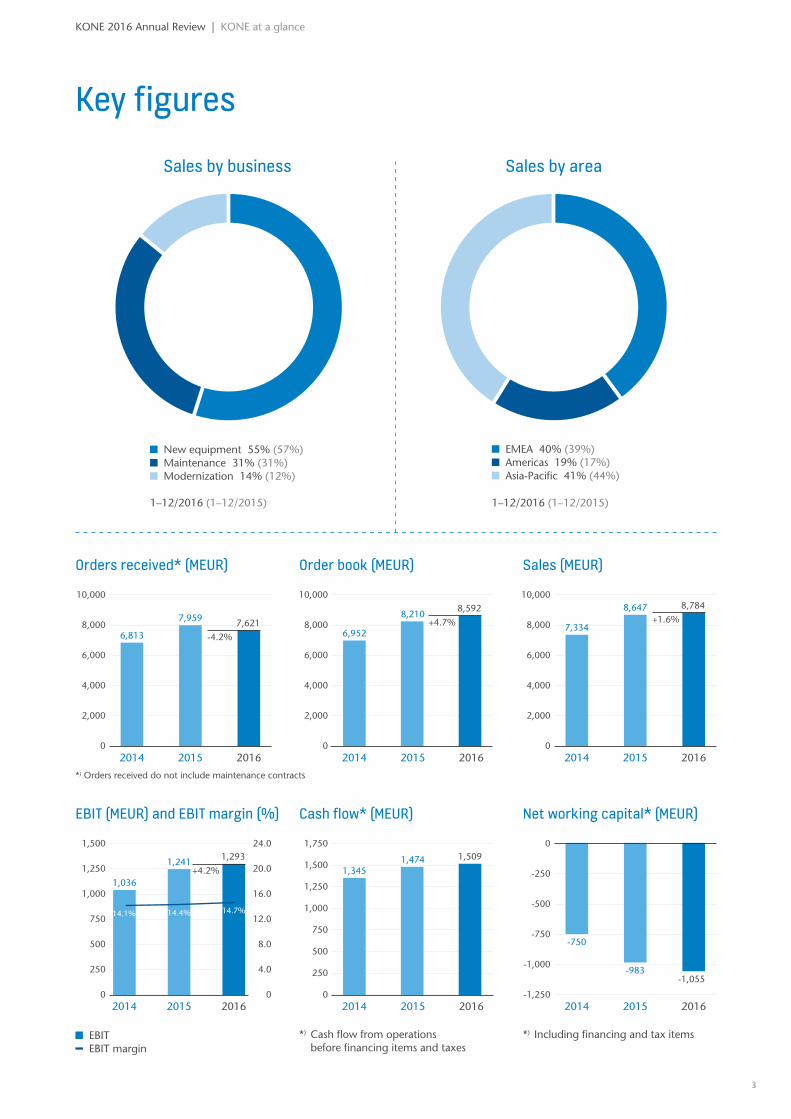
Key figures
*) Including financing and tax items*) Cash flow from operations before financing items and taxes
Net working capital* (MEUR)EBIT (MEUR) and EBIT margin (%) Cash flow* (MEUR)
1,500 24.0
1,250 20.0
1,000 16.0
750 12.0
500 8.0
250 4.0
0 0
1,750
1,500
1,250
1,000
750
500
250
0
0
-250
-500
-750
-1,000
-1,250
1,241
1,036
1,4741,345
Sales by business Sales by area
EMEA 40% (39%) Americas 19% (17%) Asia-Pacific 41% (44%)
1–12/2016 (1–12/2015)
New equipment 55% (57%) Maintenance 31% (31%) Modernization 14% (12%)
EBIT EBIT margin
1–12/2016 (1–12/2015)
Order book (MEUR) Sales (MEUR)Orders received* (MEUR)
10,000
8,000
6,000
4,000
2,000
0
10,000
8,000
6,000
4,000
2,000
0
10,000
8,000
6,000
4,000
2,000
0
7,959
6,813
8,210
6,952
8,647
7,334
KONE 2016 Annual Review | KONE at a glance
*) Orders received do not include maintenance contracts
-1,055
1,5091,293
7,621
8,592 8,784
+4.2%
-4.2%
+4.7% +1.6%
14.7%14.4%14.1%
3
2016 20162016 2015 20152015 2014 20142014
2016 2016 20162015 2015 20152014 2014 2014
-983
-750
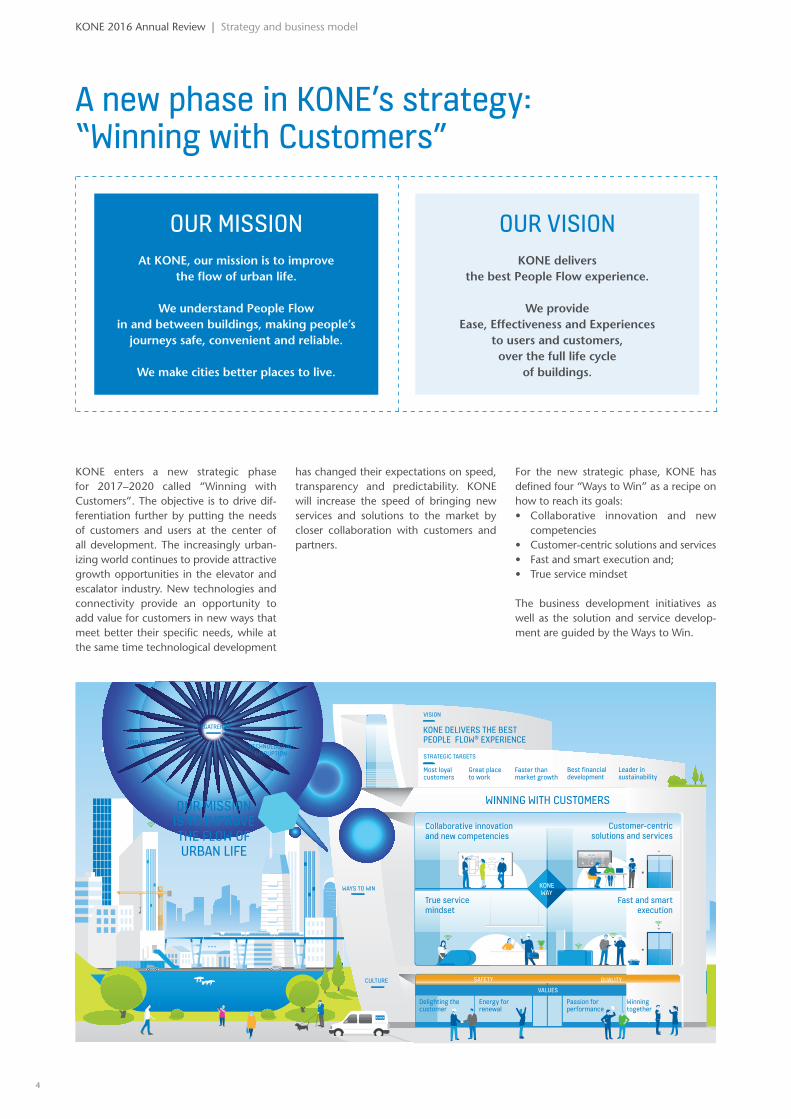
A new phase in KONE’s strategy: “Winning with Customers”
OUR MISSION OUR VISIONAt KONE, our mission is to improve
the flow of urban life.
We understand People Flow in and between buildings, making people’s
journeys safe, convenient and reliable.
We make cities better places to live.
KONE delivers the best People Flow experience.
We provide Ease, Effectiveness and Experiences
to users and customers, over the full life cycle
of buildings.
KONE 2016 Annual Review | Strategy and business model
WAYS TO WIN
STRATEGIC TARGETS
VISION
WINNING WITH CUSTOMERS
CULTUREVALUES
Energy for renewal
SAFETY QUALITY
Passion for performance
Delighting the customer
Winning together
Collaborative innovation and new competencies
True service mindset
Fast and smart execution
KONE DELIVERS THE BEST PEOPLE FLOW® EXPERIENCE
OUR MISSION IS TO IMPROVE THE FLOW OF URBAN LIFE
Customer-centric solutions and services
URBANIZATIONTECHNOLOGICAL
DISRUPTION
Best financial development
Leader in sustainability
Most loyal customers
Great place to work
Faster than market growth
MEGATRENDS
KONE WAY
KONE enters a new strategic phase for 2017–2020 called “Winning with Customers”. The objective is to drive dif-ferentiation further by putting the needs of customers and users at the center of all development. The increasingly urban-izing world continues to provide attractive growth opportunities in the elevator and escalator industry. New technologies and connectivity provide an opportunity to add value for customers in new ways that meet better their specific needs, while at the same time technological development
has changed their expectations on speed, transparency and predictability. KONE will increase the speed of bringing new services and solutions to the market by closer collaboration with customers and partners.
For the new strategic phase, KONE has defined four “Ways to Win” as a recipe on how to reach its goals: • Collaborative innovation and new
competencies• Customer-centric solutions and services • Fast and smart execution and;• True service mindset
The business development initiatives as well as the solution and service develop-ment are guided by the Ways to Win.
4
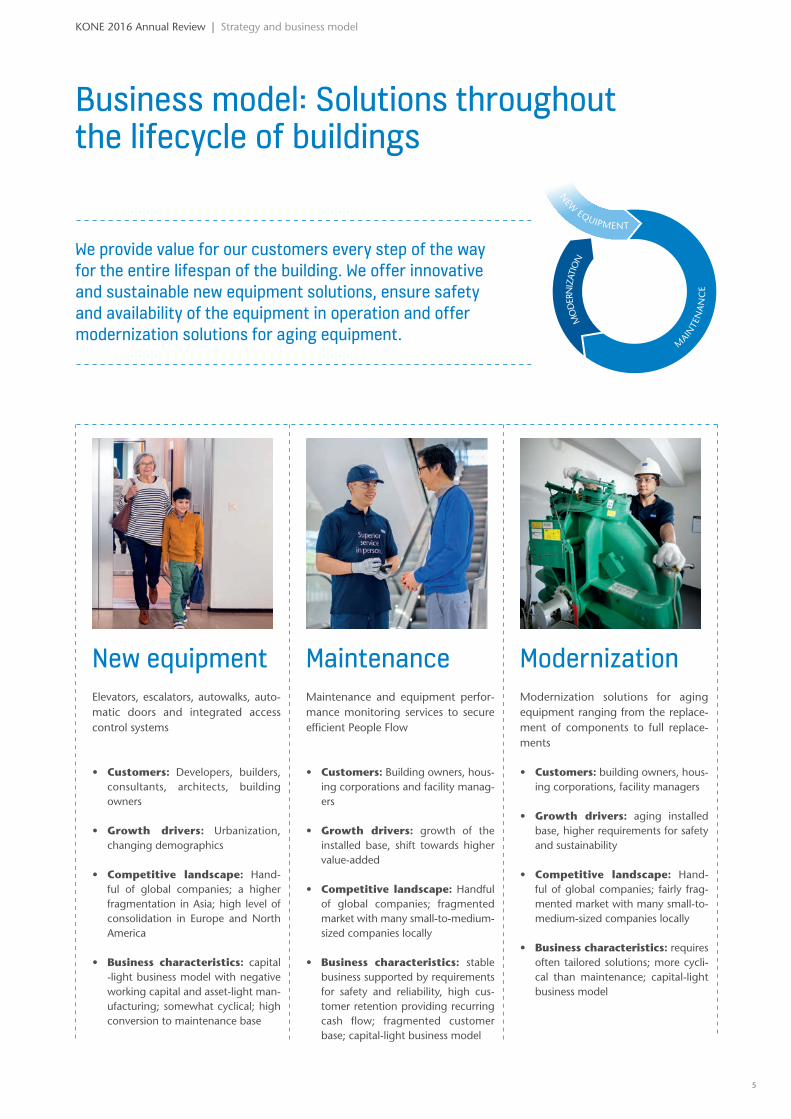
Business model: Solutions throughout the lifecycle of buildings
We provide value for our customers every step of the way for the entire lifespan of the building. We offer innovative and sustainable new equipment solutions, ensure safety and availability of the equipment in operation and offer modernization solutions for aging equipment.
New equipmentElevators, escalators, autowalks, auto-matic doors and integrated access control systems
• Customers: Developers, builders, consultants, architects, building owners
• Growth drivers: Urbanization, changing demographics
• Competitive landscape: Hand-ful of global companies; a higher fragmentation in Asia; high level of consolidation in Europe and North America
• Business characteristics: capital -light business model with negative working capital and asset-light man-ufacturing; somewhat cyclical; high conversion to maintenance base
ModernizationModernization solutions for aging equipment ranging from the replace-ment of components to full replace-ments
• Customers: building owners, hous-ing corporations, facility managers
• Growth drivers: aging installed base, higher requirements for safety and sustainability
• Competitive landscape: Hand-ful of global companies; fairly frag-mented market with many small-to-medium-sized companies locally
• Business characteristics: requires often tailored solutions; more cycli-cal than maintenance; capital-light business model
MaintenanceMaintenance and equipment perfor-mance monitoring services to secure efficient People Flow
• Customers: Building owners, hous-ing corporations and facility manag-ers
• Growth drivers: growth of the installed base, shift towards higher value-added
• Competitive landscape: Handful of global companies; fragmented market with many small-to-medium-sized companies locally
• Business characteristics: stable business supported by requirements for safety and reliability, high cus-tomer retention providing recurring cash flow; fragmented customer base; capital-light business model
KONE 2016 Annual Review | Strategy and business model
M
AINTE
NA
NC
E
NEW
EQUIPMENT
MO
DER
NIZ
ATIO
N
5
Stable > slight > somewhat > clear > significant > strong
KONE 2016 Annual Review | Board of Directors’ report
Board of Directors’ report
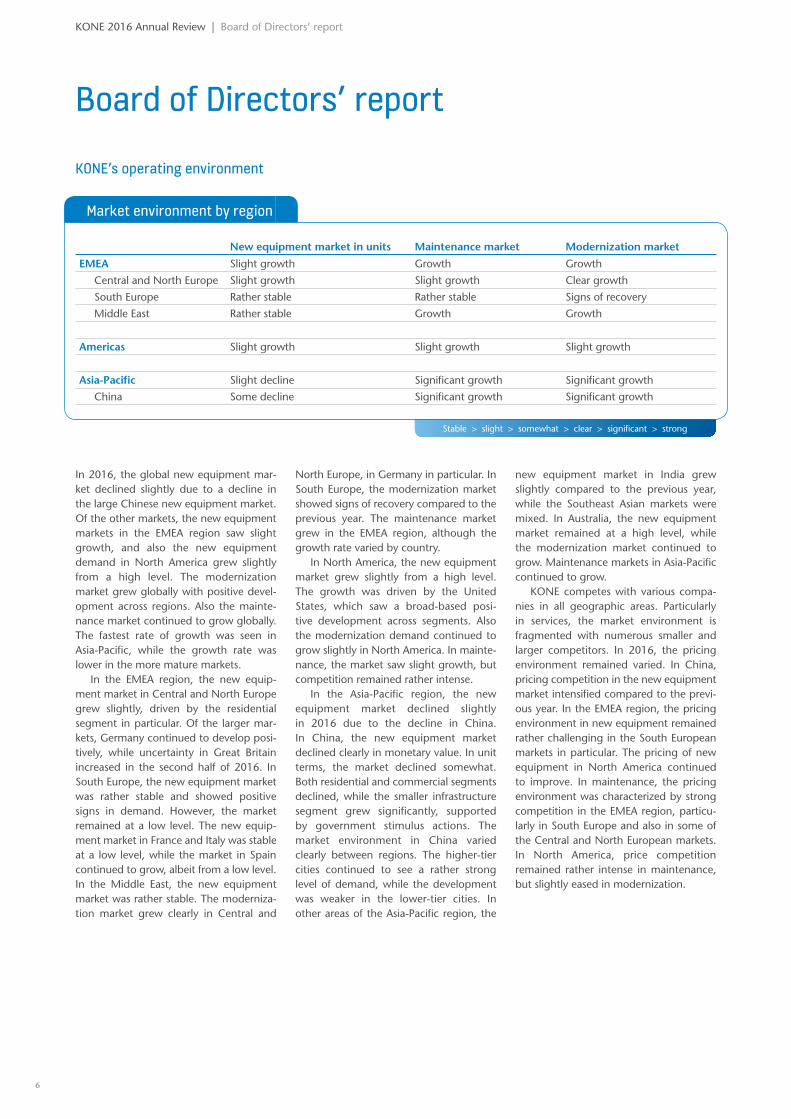
KONE’s operating environment
Market environment by region
New equipment market in units Maintenance market Modernization market
EMEA Slight growth Growth Growth
Central and North Europe Slight growth Slight growth Clear growth
South Europe Rather stable Rather stable Signs of recovery
Middle East Rather stable Growth Growth
Americas Slight growth Slight growth Slight growth
Asia-Pacific Slight decline Significant growth Significant growth
China Some decline Significant growth Significant growth
In 2016, the global new equipment mar-ket declined slightly due to a decline in the large Chinese new equipment market. Of the other markets, the new equipment markets in the EMEA region saw slight growth, and also the new equipment demand in North America grew slightly from a high level. The modernization market grew globally with positive devel-opment across regions. Also the mainte-nance market continued to grow globally. The fastest rate of growth was seen in Asia-Pacific, while the growth rate was lower in the more mature markets.
In the EMEA region, the new equip-ment market in Central and North Europe grew slightly, driven by the residential segment in particular. Of the larger mar-kets, Germany continued to develop posi-tively, while uncertainty in Great Britain increased in the second half of 2016. In South Europe, the new equipment market was rather stable and showed positive signs in demand. However, the market remained at a low level. The new equip-ment market in France and Italy was stable at a low level, while the market in Spain continued to grow, albeit from a low level. In the Middle East, the new equipment market was rather stable. The moderniza-tion market grew clearly in Central and
North Europe, in Germany in particular. In South Europe, the modernization market showed signs of recovery compared to the previous year. The maintenance market grew in the EMEA region, although the growth rate varied by country.
In North America, the new equipment market grew slightly from a high level. The growth was driven by the United States, which saw a broad-based posi-tive development across segments. Also the modernization demand continued to grow slightly in North America. In mainte-nance, the market saw slight growth, but competition remained rather intense.
In the Asia-Pacific region, the new equipment market declined slightly in 2016 due to the decline in China. In China, the new equipment market declined clearly in monetary value. In unit terms, the market declined somewhat. Both residential and commercial segments declined, while the smaller infrastructure segment grew significantly, supported by government stimulus actions. The market environment in China varied clearly between regions. The higher-tier cities continued to see a rather strong level of demand, while the development was weaker in the lower-tier cities. In other areas of the Asia-Pacific region, the
new equipment market in India grew slightly compared to the previous year, while the Southeast Asian markets were mixed. In Australia, the new equipment market remained at a high level, while the modernization market continued to grow. Maintenance markets in Asia-Pacific continued to grow.
KONE competes with various compa-nies in all geographic areas. Particularly in services, the market environment is fragmented with numerous smaller and larger competitors. In 2016, the pricing environment remained varied. In China, pricing competition in the new equipment market intensified compared to the previ-ous year. In the EMEA region, the pricing environment in new equipment remained rather challenging in the South European markets in particular. The pricing of new equipment in North America continued to improve. In maintenance, the pricing environment was characterized by strong competition in the EMEA region, particu-larly in South Europe and also in some of the Central and North European markets. In North America, price competition remained rather intense in maintenance, but slightly eased in modernization.
6
Stable > slight > somewhat > clear > significant > strong
KONE 2016 Annual Review | Board of Directors’ report
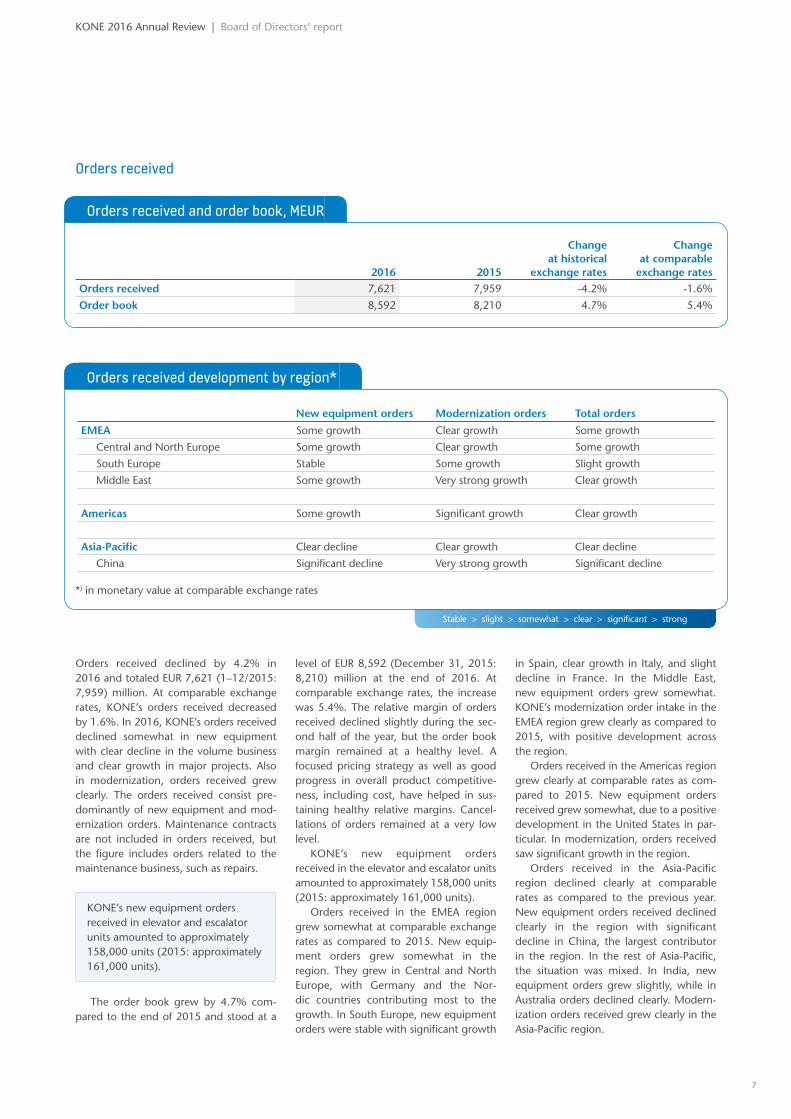
Orders received
Orders received and order book, MEUR
2016 2015
Change at historical
exchange rates
Change at comparable
exchange ratesOrders received 7,621 7,959 -4.2% -1.6%
Order book 8,592 8,210 4.7% 5.4%
Orders received development by region*
New equipment orders Modernization orders Total orders
EMEA Some growth Clear growth Some growth
Central and North Europe Some growth Clear growth Some growth
South Europe Stable Some growth Slight growth
Middle East Some growth Very strong growth Clear growth
Americas Some growth Significant growth Clear growth
Asia-Pacific Clear decline Clear growth Clear decline
China Significant decline Very strong growth Significant decline
*) in monetary value at comparable exchange rates
Orders received declined by 4.2% in 2016 and totaled EUR 7,621 (1–12/2015: 7,959) million. At comparable exchange rates, KONE’s orders received decreased by 1.6%. In 2016, KONE’s orders received declined somewhat in new equipment with clear decline in the volume business and clear growth in major projects. Also in modernization, orders received grew clearly. The orders received consist pre-dominantly of new equipment and mod-ernization orders. Maintenance contracts are not included in orders received, but the figure includes orders related to the maintenance business, such as repairs.
KONE’s new equipment orders received in elevator and escalator units amounted to approximately 158,000 units (2015: approximately 161,000 units).
The order book grew by 4.7% com-pared to the end of 2015 and stood at a
level of EUR 8,592 (December 31, 2015: 8,210) million at the end of 2016. At comparable exchange rates, the increase was 5.4%. The relative margin of orders received declined slightly during the sec-ond half of the year, but the order book margin remained at a healthy level. A focused pricing strategy as well as good progress in overall product competitive-ness, including cost, have helped in sus-taining healthy relative margins. Cancel-lations of orders remained at a very low level.
KONE’s new equipment orders received in the elevator and escalator units amounted to approximately 158,000 units (2015: approximately 161,000 units).
Orders received in the EMEA region grew somewhat at comparable exchange rates as compared to 2015. New equip-ment orders grew somewhat in the region. They grew in Central and North Europe, with Germany and the Nor-dic countries contributing most to the growth. In South Europe, new equipment orders were stable with significant growth
in Spain, clear growth in Italy, and slight decline in France. In the Middle East, new equipment orders grew somewhat. KONE’s modernization order intake in the EMEA region grew clearly as compared to 2015, with positive development across the region.
Orders received in the Americas region grew clearly at comparable rates as com-pared to 2015. New equipment orders received grew somewhat, due to a positive development in the United States in par-ticular. In modernization, orders received saw significant growth in the region.
Orders received in the Asia-Pacific region declined clearly at comparable rates as compared to the previous year. New equipment orders received declined clearly in the region with significant decline in China, the largest contributor in the region. In the rest of Asia-Pacific, the situation was mixed. In India, new equipment orders grew slightly, while in Australia orders declined clearly. Modern-ization orders received grew clearly in the Asia-Pacific region.
7
Stable > slight > somewhat > clear > significant > strong
KONE 2016 Annual Review | Board of Directors’ report
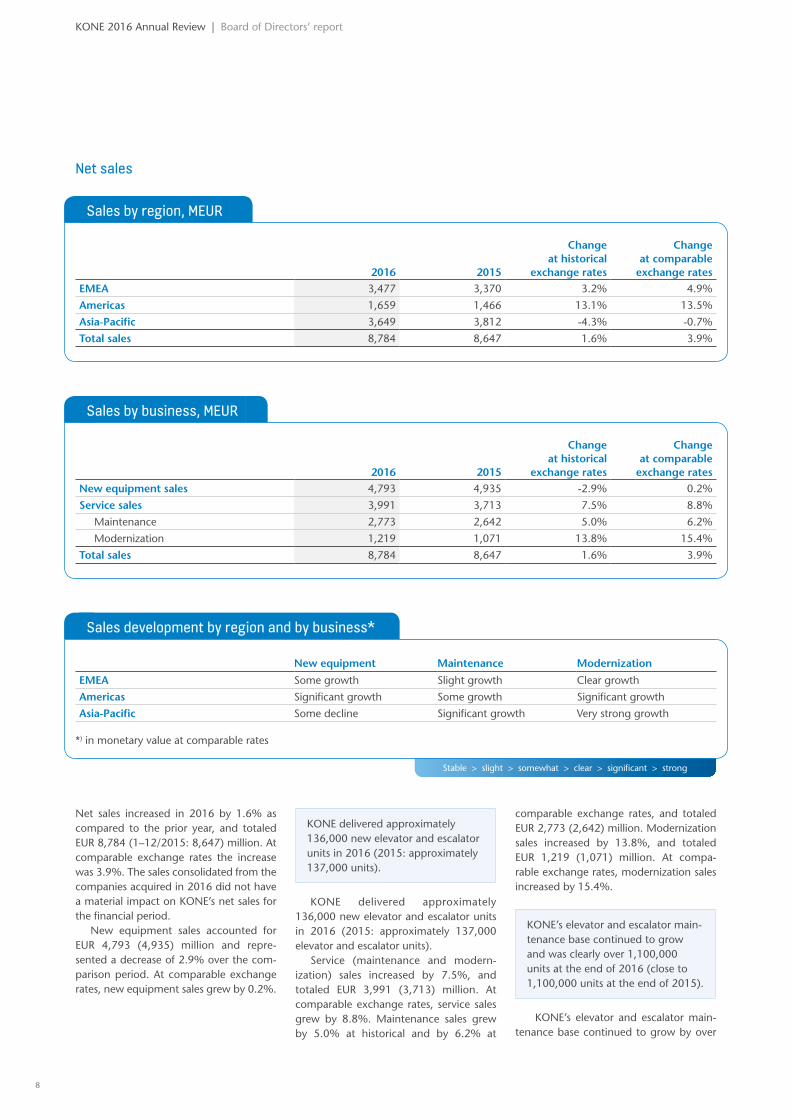
Net sales
Sales by region, MEUR
2016 2015
Change at historical
exchange rates
Change at comparable
exchange ratesEMEA 3,477 3,370 3.2% 4.9%
Americas 1,659 1,466 13.1% 13.5%
Asia-Pacific 3,649 3,812 -4.3% -0.7%
Total sales 8,784 8,647 1.6% 3.9%
Sales by business, MEUR
2016 2015
Change at historical
exchange rates
Change at comparable
exchange ratesNew equipment sales 4,793 4,935 -2.9% 0.2%
Service sales 3,991 3,713 7.5% 8.8%
Maintenance 2,773 2,642 5.0% 6.2%
Modernization 1,219 1,071 13.8% 15.4%
Total sales 8,784 8,647 1.6% 3.9%
Sales development by region and by business*
New equipment Maintenance Modernization
EMEA Some growth Slight growth Clear growth
Americas Significant growth Some growth Significant growth
Asia-Pacific Some decline Significant growth Very strong growth
*) in monetary value at comparable rates
Net sales increased in 2016 by 1.6% as compared to the prior year, and totaled EUR 8,784 (1–12/2015: 8,647) million. At comparable exchange rates the increase was 3.9%. The sales consolidated from the companies acquired in 2016 did not have a material impact on KONE’s net sales for the financial period.
New equipment sales accounted for EUR 4,793 (4,935) million and repre-sented a decrease of 2.9% over the com-parison period. At comparable exchange rates, new equipment sales grew by 0.2%.
KONE delivered approximately 136,000 new elevator and escalator units in 2016 (2015: approximately 137,000 units).
KONE delivered approximately 136,000 new elevator and escalator units in 2016 (2015: approximately 137,000 elevator and escalator units).
Service (maintenance and modern-ization) sales increased by 7.5%, and totaled EUR 3,991 (3,713) million. At comparable exchange rates, service sales grew by 8.8%. Maintenance sales grew by 5.0% at historical and by 6.2% at
comparable exchange rates, and totaled EUR 2,773 (2,642) million. Modernization sales increased by 13.8%, and totaled EUR 1,219 (1,071) million. At compa-rable exchange rates, modernization sales increased by 15.4%.
KONE’s elevator and escalator main-tenance base continued to grow and was clearly over 1,100,000 units at the end of 2016 (close to 1,100,000 units at the end of 2015).
KONE’s elevator and escalator main-tenance base continued to grow by over
8
KONE 2016 Annual Review | Board of Directors’ report
6% and was clearly over 1,100,000 units at the end of 2016 (close to 1,100,000 units at the end of 2015). The growth of the maintenance base was driven, in particular, by a continued good level of conversions of new equipment deliveries to the maintenance base. Acquisitions also contributed to the growth. In 2016, the balance of maintenance contracts that were won from or lost to competition was still slightly negative, but it was at a bet-ter level than at the end of the previous year. Another factor burdening the growth of the maintenance base was the usual impact from equipment taken out of use due to building closures.
The share of new equipment sales was 55% (57%) and the share of service
sales 45% (43%) of total sales, with maintenance representing 31% (31%) and modernization 14% (12%) of total sales. The geographical distribution of net sales was 40% (39%) EMEA, 19% (17%) Americas and 41% (44%) Asia-Pacific. The largest individual countries in terms of net sales were China, the United States, France and Germany. China’s share was approximately 30%, United States’ share approximately 15%, France’s and Ger-many’s share approximately 5% of KONE’s total net sales in 2016.
Sales in the EMEA region grew by 3.2% and totaled EUR 3,477 (3,370) mil-lion. At comparable exchange rates, the growth was 4.9%. New equipment sales grew somewhat, maintenance sales grew
slightly and modernization sales grew clearly.
Sales in the Americas region grew by 13.1% and totaled EUR 1,659 (1,466) million. At comparable exchange rates, the growth was 13.5%. Sales grew significantly in new equipment and in modernization. Maintenance sales grew somewhat.
Sales in the Asia-Pacific region declined by 4.3% and totaled EUR 3,649 (3,812) million. At comparable exchange rates, the decline was 0.7% with some decline in new equipment but significant growth in maintenance and very strong growth in modernization.
Financial result
Financial result
Jan 1–Dec 31, 2016 Jan 1–Dec 31, 2015
Operating income, MEUR 1,293 1,241Income before taxes, MEUR 1,330 1,364Earnings per share, EUR 2.00 2.01
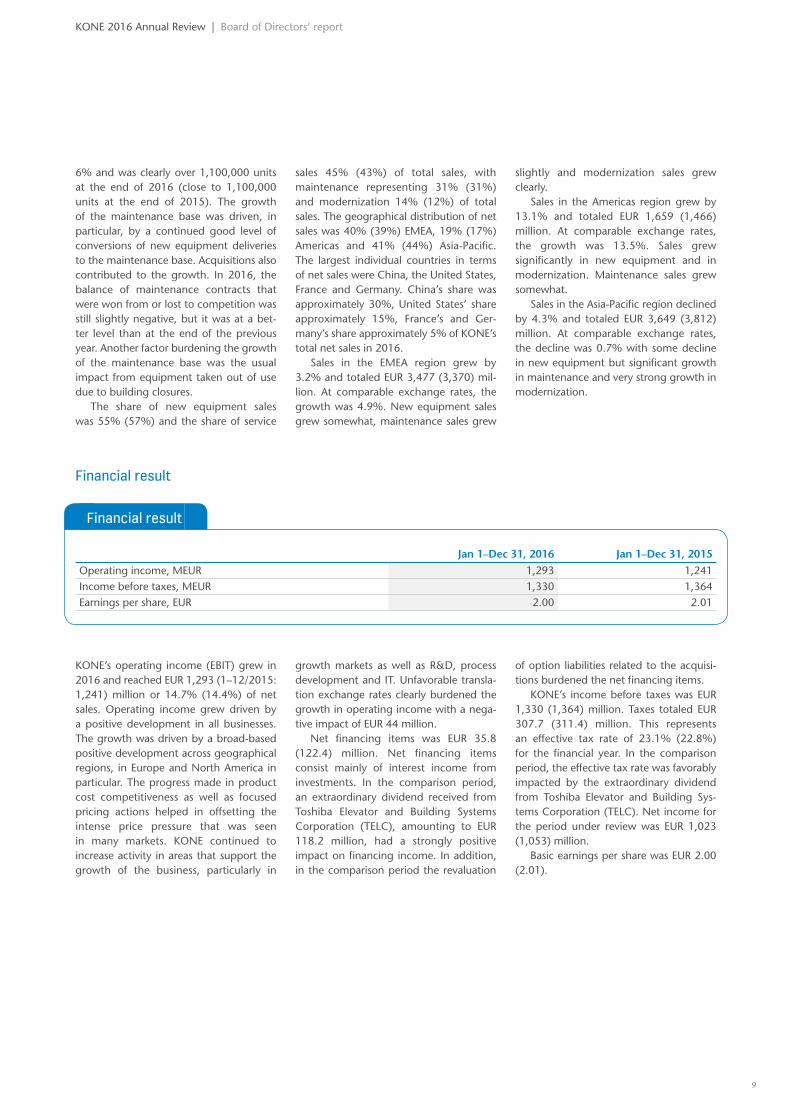
KONE’s operating income (EBIT) grew in 2016 and reached EUR 1,293 (1–12/2015: 1,241) million or 14.7% (14.4%) of net sales. Operating income grew driven by a positive development in all businesses. The growth was driven by a broad-based positive development across geographical regions, in Europe and North America in particular. The progress made in product cost competitiveness as well as focused pricing actions helped in offsetting the intense price pressure that was seen in many markets. KONE continued to increase activity in areas that support the growth of the business, particularly in
growth markets as well as R&D, process development and IT. Unfavorable transla-tion exchange rates clearly burdened the growth in operating income with a nega-tive impact of EUR 44 million.
Net financing items was EUR 35.8 (122.4) million. Net financing items consist mainly of interest income from investments. In the comparison period, an extraordinary dividend received from Toshiba Elevator and Building Systems Corporation (TELC), amounting to EUR 118.2 million, had a strongly positive impact on financing income. In addition, in the comparison period the revaluation
of option liabilities related to the acquisi-tions burdened the net financing items.
KONE’s income before taxes was EUR 1,330 (1,364) million. Taxes totaled EUR 307.7 (311.4) million. This represents an effective tax rate of 23.1% (22.8%) for the financial year. In the comparison period, the effective tax rate was favorably impacted by the extraordinary dividend from Toshiba Elevator and Building Sys-tems Corporation (TELC). Net income for the period under review was EUR 1,023 (1,053) million.
Basic earnings per share was EUR 2.00 (2.01).
9
KONE 2016 Annual Review | Board of Directors’ report
Financial position and cash flow
Financial position and cash flow
MEUR Jan 1–Dec 31, 2016 Jan 1–Dec 31, 2015
Cash flow from operations 1,509 1,474Net working capital -1,055 -983.4
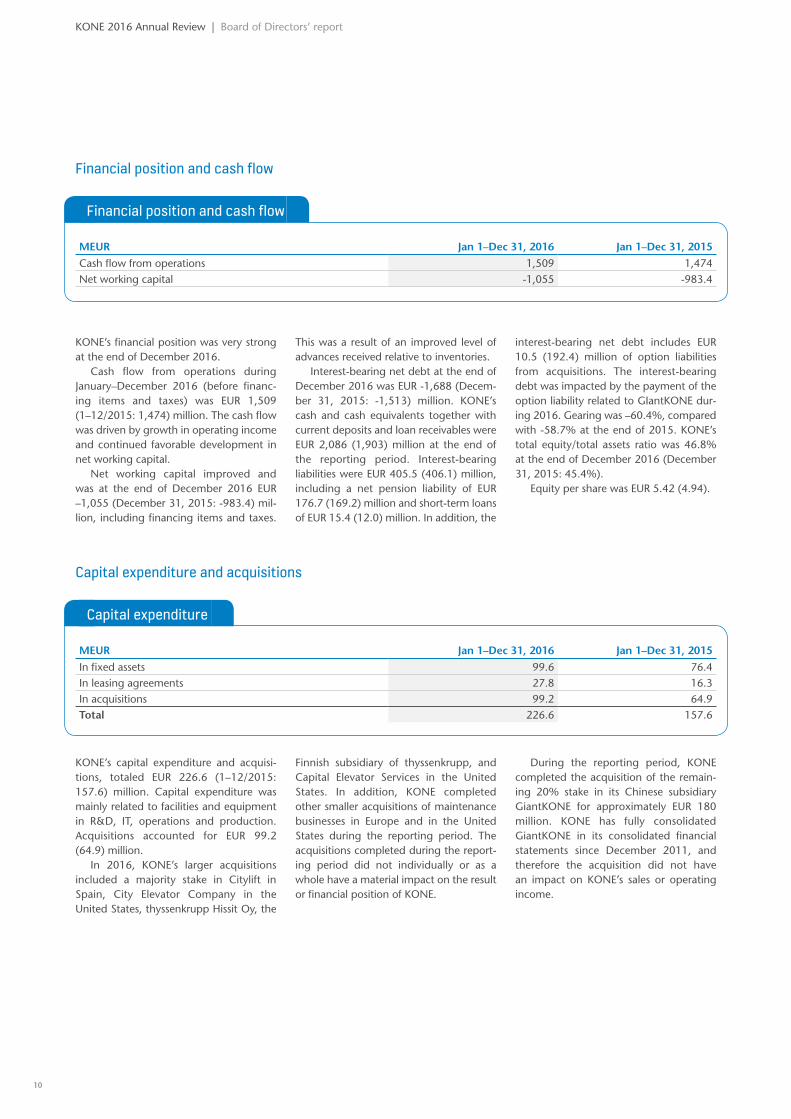
KONE’s financial position was very strong at the end of December 2016.
Cash flow from operations during January–December 2016 (before financ-ing items and taxes) was EUR 1,509 (1–12/2015: 1,474) million. The cash flow was driven by growth in operating income and continued favorable development in net working capital.
Net working capital improved and was at the end of December 2016 EUR –1,055 (December 31, 2015: -983.4) mil-lion, including financing items and taxes.
This was a result of an improved level of advances received relative to inventories.
Interest-bearing net debt at the end of December 2016 was EUR -1,688 (Decem-ber 31, 2015: -1,513) million. KONE’s cash and cash equivalents together with current deposits and loan receivables were EUR 2,086 (1,903) million at the end of the reporting period. Interest-bearing liabilities were EUR 405.5 (406.1) million, including a net pension liability of EUR 176.7 (169.2) million and short-term loans of EUR 15.4 (12.0) million. In addition, the
interest-bearing net debt includes EUR 10.5 (192.4) million of option liabilities from acquisitions. The interest-bearing debt was impacted by the payment of the option liability related to GIantKONE dur-ing 2016. Gearing was –60.4%, compared with -58.7% at the end of 2015. KONE’s total equity/total assets ratio was 46.8% at the end of December 2016 (December 31, 2015: 45.4%).
Equity per share was EUR 5.42 (4.94).
Capital expenditure and acquisitions
Capital expenditure
MEUR Jan 1–Dec 31, 2016 Jan 1–Dec 31, 2015
In fixed assets 99.6 76.4In leasing agreements 27.8 16.3In acquisitions 99.2 64.9Total 226.6 157.6
KONE’s capital expenditure and acquisi-tions, totaled EUR 226.6 (1–12/2015: 157.6) million. Capital expenditure was mainly related to facilities and equipment in R&D, IT, operations and production. Acquisitions accounted for EUR 99.2 (64.9) million.
In 2016, KONE’s larger acquisitions included a majority stake in Citylift in Spain, City Elevator Company in the United States, thyssenkrupp Hissit Oy, the
Finnish subsidiary of thyssenkrupp, and Capital Elevator Services in the United States. In addition, KONE completed other smaller acquisitions of maintenance businesses in Europe and in the United States during the reporting period. The acquisitions completed during the report-ing period did not individually or as a whole have a material impact on the result or financial position of KONE.
During the reporting period, KONE completed the acquisition of the remain-ing 20% stake in its Chinese subsidiary GiantKONE for approximately EUR 180 million. KONE has fully consolidated GiantKONE in its consolidated financial statements since December 2011, and therefore the acquisition did not have an impact on KONE’s sales or operating income.
10
KONE 2016 Annual Review | Board of Directors’ report
Research and development
R&D expenditure
MEUR Jan 1–Dec 31, 2016 Jan 1–Dec 31, 2015
R&D expenditure 140.5 121.7As percentage of sales, % 1.6 1.4
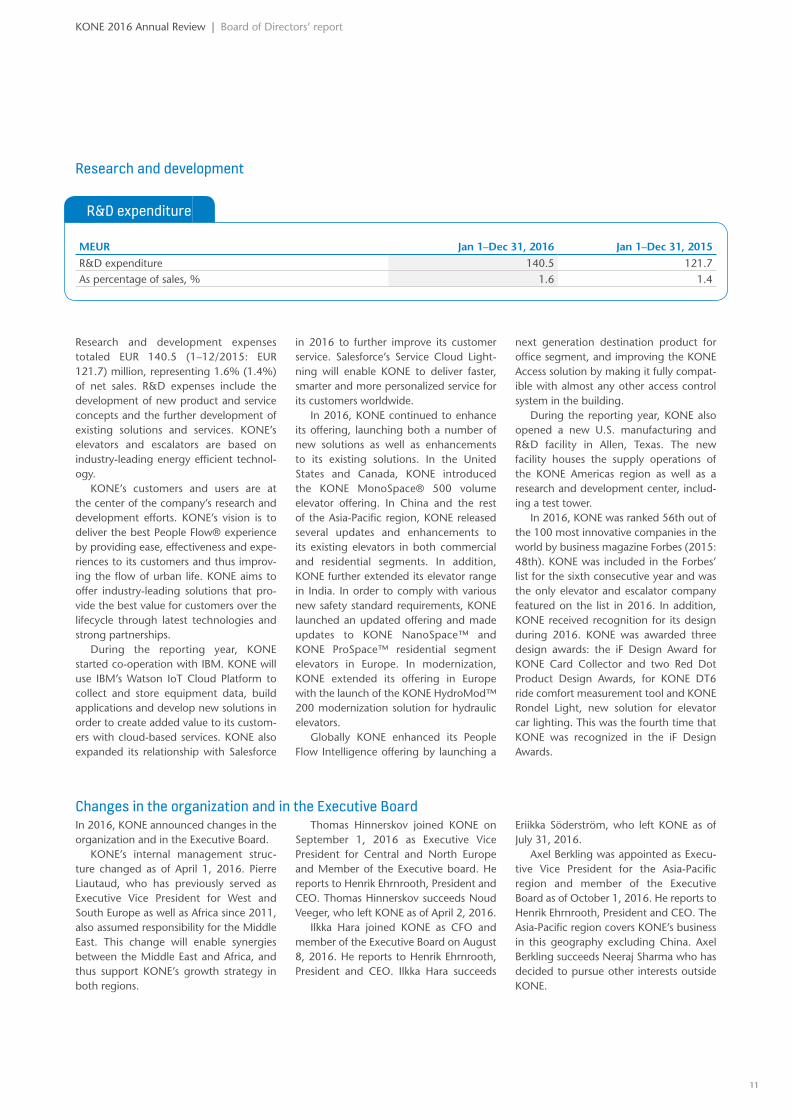
Research and development expenses totaled EUR 140.5 (1–12/2015: EUR 121.7) million, representing 1.6% (1.4%) of net sales. R&D expenses include the development of new product and service concepts and the further development of existing solutions and services. KONE’s elevators and escalators are based on industry-leading energy efficient technol-ogy.
KONE’s customers and users are at the center of the company’s research and development efforts. KONE’s vision is to deliver the best People Flow® experience by providing ease, effectiveness and expe-riences to its customers and thus improv-ing the flow of urban life. KONE aims to offer industry-leading solutions that pro-vide the best value for customers over the lifecycle through latest technologies and strong partnerships.
During the reporting year, KONE started co-operation with IBM. KONE will use IBM’s Watson IoT Cloud Platform to collect and store equipment data, build applications and develop new solutions in order to create added value to its custom-ers with cloud-based services. KONE also expanded its relationship with Salesforce
in 2016 to further improve its customer service. Salesforce’s Service Cloud Light-ning will enable KONE to deliver faster, smarter and more personalized service for its customers worldwide.
In 2016, KONE continued to enhance its offering, launching both a number of new solutions as well as enhancements to its existing solutions. In the United States and Canada, KONE introduced the KONE MonoSpace® 500 volume elevator offering. In China and the rest of the Asia-Pacific region, KONE released several updates and enhancements to its existing elevators in both commercial and residential segments. In addition, KONE further extended its elevator range in India. In order to comply with various new safety standard requirements, KONE launched an updated offering and made updates to KONE NanoSpace™ and KONE ProSpace™ residential segment elevators in Europe. In modernization, KONE extended its offering in Europe with the launch of the KONE HydroMod™ 200 modernization solution for hydraulic elevators.
Globally KONE enhanced its People Flow Intelligence offering by launching a
next generation destination product for office segment, and improving the KONE Access solution by making it fully compat-ible with almost any other access control system in the building.
During the reporting year, KONE also opened a new U.S. manufacturing and R&D facility in Allen, Texas. The new facility houses the supply operations of the KONE Americas region as well as a research and development center, includ-ing a test tower.
In 2016, KONE was ranked 56th out of the 100 most innovative companies in the world by business magazine Forbes (2015: 48th). KONE was included in the Forbes’ list for the sixth consecutive year and was the only elevator and escalator company featured on the list in 2016. In addition, KONE received recognition for its design during 2016. KONE was awarded three design awards: the iF Design Award for KONE Card Collector and two Red Dot Product Design Awards, for KONE DT6 ride comfort measurement tool and KONE Rondel Light, new solution for elevator car lighting. This was the fourth time that KONE was recognized in the iF Design Awards.
Changes in the organization and in the Executive BoardIn 2016, KONE announced changes in the organization and in the Executive Board.
KONE’s internal management struc-ture changed as of April 1, 2016. Pierre Liautaud, who has previously served as Executive Vice President for West and South Europe as well as Africa since 2011, also assumed responsibility for the Middle East. This change will enable synergies between the Middle East and Africa, and thus support KONE’s growth strategy in both regions.
Thomas Hinnerskov joined KONE on September 1, 2016 as Executive Vice President for Central and North Europe and Member of the Executive board. He reports to Henrik Ehrnrooth, President and CEO. Thomas Hinnerskov succeeds Noud Veeger, who left KONE as of April 2, 2016.
Ilkka Hara joined KONE as CFO and member of the Executive Board on August 8, 2016. He reports to Henrik Ehrnrooth, President and CEO. Ilkka Hara succeeds
Eriikka Söderström, who left KONE as of July 31, 2016.
Axel Berkling was appointed as Execu-tive Vice President for the Asia-Pacific region and member of the Executive Board as of October 1, 2016. He reports to Henrik Ehrnrooth, President and CEO. The Asia-Pacific region covers KONE’s business in this geography excluding China. Axel Berkling succeeds Neeraj Sharma who has decided to pursue other interests outside KONE.
11
KONE 2016 Annual Review | Board of Directors’ report
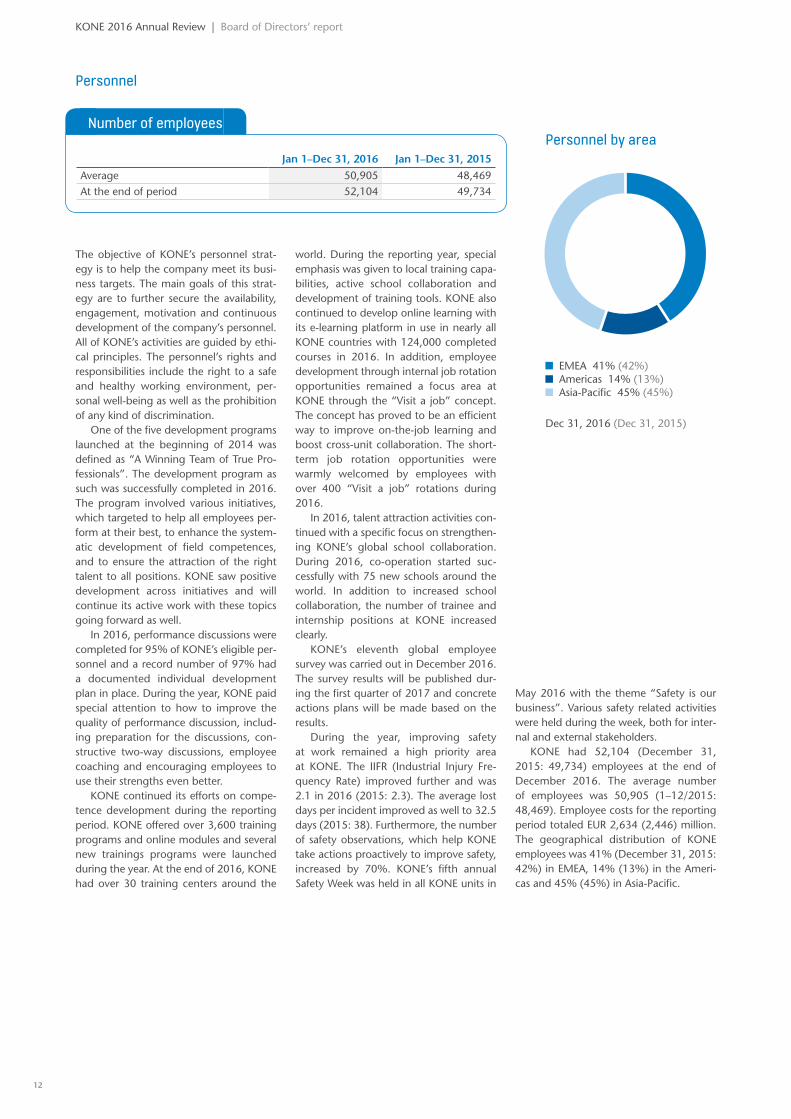
Personnel by area
EMEA 41% (42%) Americas 14% (13%) Asia-Pacific 45% (45%)
Dec 31, 2016 (Dec 31, 2015)
Personnel
Number of employees
Jan 1–Dec 31, 2016 Jan 1–Dec 31, 2015
Average 50,905 48,469At the end of period 52,104 49,734
The objective of KONE’s personnel strat-egy is to help the company meet its busi-ness targets. The main goals of this strat-egy are to further secure the availability, engagement, motivation and continuous development of the company’s personnel. All of KONE’s activities are guided by ethi-cal principles. The personnel’s rights and responsibilities include the right to a safe and healthy working environment, per-sonal well-being as well as the prohibition of any kind of discrimination.
One of the five development programs launched at the beginning of 2014 was defined as “A Winning Team of True Pro-fessionals”. The development program as such was successfully completed in 2016. The program involved various initiatives, which targeted to help all employees per-form at their best, to enhance the system-atic development of field competences, and to ensure the attraction of the right talent to all positions. KONE saw positive development across initiatives and will continue its active work with these topics going forward as well.
In 2016, performance discussions were completed for 95% of KONE’s eligible per-sonnel and a record number of 97% had a documented individual development plan in place. During the year, KONE paid special attention to how to improve the quality of performance discussion, includ-ing preparation for the discussions, con-structive two-way discussions, employee coaching and encouraging employees to use their strengths even better.
KONE continued its efforts on compe-tence development during the reporting period. KONE offered over 3,600 training programs and online modules and several new trainings programs were launched during the year. At the end of 2016, KONE had over 30 training centers around the
world. During the reporting year, special emphasis was given to local training capa-bilities, active school collaboration and development of training tools. KONE also continued to develop online learning with its e-learning platform in use in nearly all KONE countries with 124,000 completed courses in 2016. In addition, employee development through internal job rotation opportunities remained a focus area at KONE through the “Visit a job” concept. The concept has proved to be an efficient way to improve on-the-job learning and boost cross-unit collaboration. The short-term job rotation opportunities were warmly welcomed by employees with over 400 “Visit a job” rotations during 2016.
In 2016, talent attraction activities con-tinued with a specific focus on strengthen-ing KONE’s global school collaboration. During 2016, co-operation started suc-cessfully with 75 new schools around the world. In addition to increased school collaboration, the number of trainee and internship positions at KONE increased clearly.
KONE’s eleventh global employee survey was carried out in December 2016. The survey results will be published dur-ing the first quarter of 2017 and concrete actions plans will be made based on the results.
During the year, improving safety at work remained a high priority area at KONE. The IIFR (Industrial Injury Fre-quency Rate) improved further and was 2.1 in 2016 (2015: 2.3). The average lost days per incident improved as well to 32.5 days (2015: 38). Furthermore, the number of safety observations, which help KONE take actions proactively to improve safety, increased by 70%. KONE’s fifth annual Safety Week was held in all KONE units in
May 2016 with the theme “Safety is our business”. Various safety related activities were held during the week, both for inter-nal and external stakeholders.
KONE had 52,104 (December 31, 2015: 49,734) employees at the end of December 2016. The average number of employees was 50,905 (1–12/2015: 48,469). Employee costs for the reporting period totaled EUR 2,634 (2,446) million. The geographical distribution of KONE employees was 41% (December 31, 2015: 42%) in EMEA, 14% (13%) in the Ameri-cas and 45% (45%) in Asia-Pacific.
12
KONE 2016 Annual Review | Board of Directors’ report
Environment For KONE, environmental responsibility is a combination of offering its customers innovative solutions that are both energy- and cost-efficient, and reducing the adverse environmental impacts of its own operations. In KONE’s long-term environ-mental targets, the company aims to be a leading provider of low-carbon People Flow® solutions and to have efficient low-carbon operations. KONE strives to further strengthen its position as the industry leader in sustainability by supporting green building initiatives and the ongoing transformation of the urban environment into smart eco-cities globally.
The most significant environmental impact of KONE’s business globally relates to the amount of electricity used by KONE’s solutions during their lifetime, underlining the importance of eco-efficient innovations. Accordingly, KONE focuses on further improving the energy efficiency of its elevators, escalators, and building doors. KONE also continuously aims to minimize its operational carbon footprint and to ensure that its suppliers comply with corresponding requirements and environmental targets. The most significant impact of KONE’s operational carbon footprint relates to logistics, the company’s vehicle fleet, and the electricity consumption of KONE’s facilities.
In line with its Environmental Excel-lence program, KONE continued to develop the energy efficiency of its solu-tions in 2016. During the fourth quarter of 2016, KONE extended the classification coverage of its product range according to the ISO 25745 energy efficiency stan-dard. KONE E MonoSpace® and KONE Z MiniSpace™ elevators achieved the high-est A-class classification during 2016 in addition to ten elevators classified earlier. Also KONE TransitMaster™ 140 escalator achieved the highest A+++ classification for escalators in addition to KONE Travel-Master™ 110 escalator classified already in the previous year.
During the fourth quarter of 2016, CDP, an international non-profit orga-nization focusing on environmental performance, identified KONE as a world leader for its actions in response to climate change. For the second year running, KONE was awarded a position on the global CDP Climate A List out of thou-sands of companies assessed by CDP. Dur-ing 2016, KONE also received recognition as a leading supplier for action on climate change and was recognized on the new global CDP Supplier A List. The Supplier A list includes the best 2% of companies responding to CDP’s supplier program at the request of 75 multinational purchas-ers, including KONE’s customers.
In July and December 2016, KONE was confirmed as a constituent of the FTSE-4Good Index, a global sustainability index measuring the performance of companies that demonstrate strong environmental, social and governance practices. KONE performed particularly well in environ-mental themes, reaching top marks in both climate change and pollution as well as resource related issues.
KONE published its Sustainability Report 2015 in June 2016. The report follows the Global Reporting Initiative G4 reporting guidelines when applicable. The most significant environmental achieve-ments in 2015 included reductions in reported greenhouse gas emissions from the company’s own operations. KONE’s 2015 carbon footprint relative to overall operations (net sales) decreased by 4.4% compared to 2014, with sales growth calculated at comparable exchange rates. KONE’s greenhouse gas reporting has been assured by an objective third party. In November 2016, KONE’s Sustainability Report 2015 was chosen as the best report of the year in the NGO’s Choice category of Sustainability Reporting Award Finland. This year the choice was made by Green-peace Finland. According to the feedback from the jury, sustainability is strongly integrated into KONE’s values and busi-ness operations.
Other events In 2007 a decision was issued by the European Commission concerning alleged local anticompetitive practices before early 2004 in Germany, Luxembourg, Belgium and the Netherlands by leading eleva-tor and escalator companies, including KONE’s local subsidiaries. Also, the Aus-trian Cartel Court issued in 2007 a deci-sion concerning anticompetitive practices that had taken place before mid-2004 in
local Austrian markets by leading eleva-tor and escalator companies, including KONE’s local subsidiary. As announced by KONE earlier, a number of civil damage claims by certain companies and public entities, relating to the two 2007 deci-sions, are pending in related countries. The claims have been made against various companies concerned by the deci-sions, including certain KONE companies.
All claims are independent and are pro-gressing procedurally at different stages. The total capital amount claimed jointly and severally from all of the defendants together was EUR 237 million at the end of December 2016 (December 31, 2015: EUR 262 million). KONE’s position is that the claims are without merit. No provision has been made.
13
KONE 2016 Annual Review | Board of Directors’ report
Most significant risks KONE is exposed to risks that may arise from its operations or changes in the operating environment. The risk factors described below can potentially have an adverse effect on KONE’s business operations and financial position and, as a result, on the value of the company. Other risks, which are currently either unknown or considered immaterial to KONE may, however, become material in the future.
STRATEGIC RISKSA weakening of the global economic envi-ronment could result in a deterioration of the market environment and the competi-tive situation in the industry. In particular, a stronger than anticipated decline or a prolonged weakness of the construc-tion market could result in a significant decline in the new equipment market and a more challenging market environment for services. In particular, a sustained mar-ket decline in China, which accounts for approximately 30% of KONE’s sales, could have an adverse effect on KONE’s growth and profitability.
Digitalization, and the resulting new customer requirements as well as poten-tial new competition, ecosystems and business models, could have a significant impact on the elevator and escalator industry. A failure to anticipate or address changes in the external market environ-ment could result in a deterioration of KONE’s growth, competitiveness, market share or profitability.
KONE operates in an industry with vari-ous local regulatory requirements. Sudden or unanticipated changes in regulations, equipment codes or standards may result in a need for process or technology adjust-ments, which could adversely impact KONE’s profit development in affected countries. In addition, an increase in
geopolitical tensions or a rise in regula-tory protectionism could result in more challenging market conditions in affected countries. Such developments could have an adverse impact on KONE’s operations.
A significant part of KONE’s compo-nent suppliers and global supply capacity is located in China, both in the elevator and in the escalator business. Therefore KONE’s operations may be adversely impacted by changes in trade agreements or introduction of restrictions to trade.
OPERATIONAL RISKSAs one of the leading companies in the industry, KONE has a strong brand and reputation, meaning that reputation or brand issues could have an impact on KONE’s business and financial perfor-mance. Such reputation risks could mate-rialize e.g. in the case of an incident or a product quality issue. Issues with product integrity or quality could also have an impact on KONE’s financial performance.
KONE operates in certain high growth markets, where focused management of rapid business growth is required. This applies in particular to the availability of skilled personnel, the adequate supply of components and materials, and the ability to ensure the quality of delivered prod-ucts and services. Failure to adequately manage resourcing, quality of delivery, or other critical aspects in projects, could have an adverse impact on KONE’s profit-ability.
KONE’s business activities are depen-dent on the uninterrupted operation, quality and reliability of its manufacturing facilities, sourcing channels, operational service solutions and logistics processes. KONE’s operations also utilize information technology extensively and its business is dependent on the quality and avail-
ability of information. Thus, in addition to physical risks, KONE is exposed to cyber security risks as operational information systems and products may be vulnerable to interruption, loss of data or malfunc-tions which can result in disruptions in processes and equipment availability and therefore impact KONE’s business. Such cyber incidents could be caused by, including but not limited to, cyber-attacks, computer malware, denial of service attacks, fraudulent attempts and data breaches.
The majority of components used in KONE’s supply chain are sourced from external suppliers, which exposes KONE to component price risk as well as raw material price risk. Therefore stronger than anticipated increases in raw material and component prices may have a significant impact on KONE’s profitability.
FINANCIAL RISKSThe majority of KONE’s sales is denomi-nated in other currencies than the euro, which exposes KONE to risks arising from foreign exchange rate fluctuations. KONE is also exposed to counterparty risks related to financial institutions through the significant amounts of liquid funds that are deposited with financial institu-tions in the form of financial investments and in derivatives. Additionally, KONE is exposed to risks related to the liquidity and payment schedules of its customers, which may lead to credit losses. Signifi-cant changes in local financial or taxation regulation could also have an impact on KONE’s financial performance. For further information on financial risks, please refer to notes 2.4 and 5.3 in the Financial State-ments for 2016.
14
KONE 2016 Annual Review | Board of Directors’ report
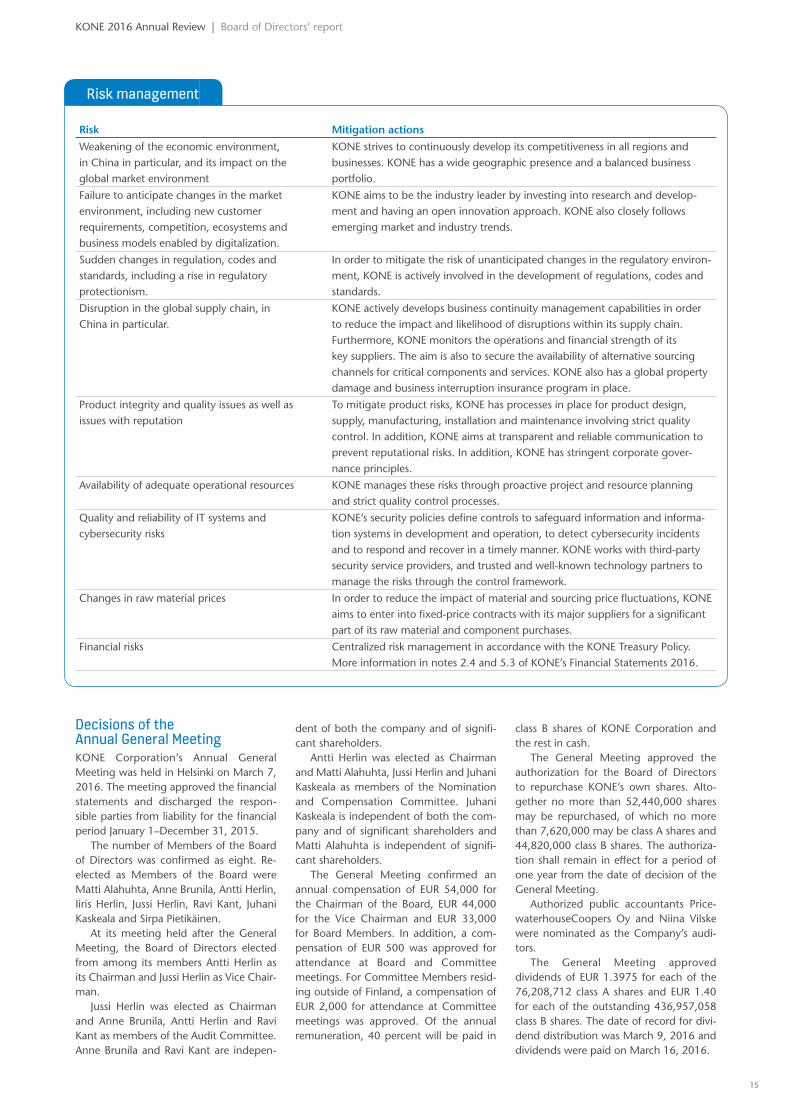
Risk management
Risk Mitigation actions
Weakening of the economic environment, in China in particular, and its impact on the global market environment
KONE strives to continuously develop its competitiveness in all regions and businesses. KONE has a wide geographic presence and a balanced business portfolio.
Failure to anticipate changes in the market environment, including new customer requirements, competition, ecosystems and business models enabled by digitalization.
KONE aims to be the industry leader by investing into research and develop-ment and having an open innovation approach. KONE also closely follows emerging market and industry trends.
Sudden changes in regulation, codes and standards, including a rise in regulatory protectionism.
In order to mitigate the risk of unanticipated changes in the regulatory environ-ment, KONE is actively involved in the development of regulations, codes and standards.
Disruption in the global supply chain, in China in particular.
KONE actively develops business continuity management capabilities in order to reduce the impact and likelihood of disruptions within its supply chain. Furthermore, KONE monitors the operations and financial strength of its key suppliers. The aim is also to secure the availability of alternative sourcing channels for critical components and services. KONE also has a global property damage and business interruption insurance program in place.
Product integrity and quality issues as well as issues with reputation
To mitigate product risks, KONE has processes in place for product design, supply, manufacturing, installation and maintenance involving strict quality control. In addition, KONE aims at transparent and reliable communication to prevent reputational risks. In addition, KONE has stringent corporate gover-nance principles.
Availability of adequate operational resources KONE manages these risks through proactive project and resource planning and strict quality control processes.
Quality and reliability of IT systems and cybersecurity risks
KONE’s security policies define controls to safeguard information and informa-tion systems in development and operation, to detect cybersecurity incidents and to respond and recover in a timely manner. KONE works with third-party security service providers, and trusted and well-known technology partners to manage the risks through the control framework.
Changes in raw material prices In order to reduce the impact of material and sourcing price fluctuations, KONE aims to enter into fixed-price contracts with its major suppliers for a significant part of its raw material and component purchases.
Financial risks Centralized risk management in accordance with the KONE Treasury Policy. More information in notes 2.4 and 5.3 of KONE’s Financial Statements 2016.
Decisions of the Annual General Meeting KONE Corporation’s Annual General Meeting was held in Helsinki on March 7, 2016. The meeting approved the financial statements and discharged the respon-sible parties from liability for the financial period January 1–December 31, 2015.
The number of Members of the Board of Directors was confirmed as eight. Re-elected as Members of the Board were Matti Alahuhta, Anne Brunila, Antti Herlin, Iiris Herlin, Jussi Herlin, Ravi Kant, Juhani Kaskeala and Sirpa Pietikäinen.
At its meeting held after the General Meeting, the Board of Directors elected from among its members Antti Herlin as its Chairman and Jussi Herlin as Vice Chair-man.
Jussi Herlin was elected as Chairman and Anne Brunila, Antti Herlin and Ravi Kant as members of the Audit Committee. Anne Brunila and Ravi Kant are indepen-
dent of both the company and of signifi-cant shareholders.
Antti Herlin was elected as Chairman and Matti Alahuhta, Jussi Herlin and Juhani Kaskeala as members of the Nomination and Compensation Committee. Juhani Kaskeala is independent of both the com-pany and of significant shareholders and Matti Alahuhta is independent of signifi-cant shareholders.
The General Meeting confirmed an annual compensation of EUR 54,000 for the Chairman of the Board, EUR 44,000 for the Vice Chairman and EUR 33,000 for Board Members. In addition, a com-pensation of EUR 500 was approved for attendance at Board and Committee meetings. For Committee Members resid-ing outside of Finland, a compensation of EUR 2,000 for attendance at Committee meetings was approved. Of the annual remuneration, 40 percent will be paid in
class B shares of KONE Corporation and the rest in cash.
The General Meeting approved the authorization for the Board of Directors to repurchase KONE’s own shares. Alto-gether no more than 52,440,000 shares may be repurchased, of which no more than 7,620,000 may be class A shares and 44,820,000 class B shares. The authoriza-tion shall remain in effect for a period of one year from the date of decision of the General Meeting.
Authorized public accountants Price-waterhouseCoopers Oy and Niina Vilske were nominated as the Company’s audi-tors.
The General Meeting approved dividends of EUR 1.3975 for each of the 76,208,712 class A shares and EUR 1.40 for each of the outstanding 436,957,058 class B shares. The date of record for divi-dend distribution was March 9, 2016 and dividends were paid on March 16, 2016.
15
KONE 2016 Annual Review | Board of Directors’ report
Share capital and market capitalization In 2013, KONE granted a conditional option program. The stock options 2013 were listed on Nasdaq Helsinki Ltd. as of April 1, 2015. The total number of stock options was 750,000 and 55,000 of them are held by KONE Corporation’s subsid-iary. During the reporting period, 749,438 new KONE class B shares were subscribed for with the 2013 option rights. On December 31, 2016 a maximum of 514,278 shares could be subscribed for with the remaining outstanding option rights. Each option entitles its holder to subscribe for two (2) new class B shares at the price of, on December 31, 2016, EUR 24.00 per share. The share subscription period for the stock option 2013 is April 1, 2015–April 30, 2017.
In December 2013, KONE granted a conditional 2014 option program. The stock options 2014 were listed on Nasdaq Helsinki Ltd. as of April 1, 2016. The total number of stock options was 1,500,000 and 133,000 of them are held by KONE Corporation’s subsidiary. During the reporting period, 13,130 class B shares were subscribed for with the 2014 option rights. On December 31, 2016, a maxi-mum of 1,353,870 shares can be sub-scribed for with the remaining outstand-ing option rights. Each option entitles its holder to subscribe for one (1) new class B KONE share at the price of, on December 31, 2016, EUR 28.20 per share. The share subscription period for the stock options 2014 is April 1, 2016–April 30, 2018.
In December 2014, KONE granted a conditional 2015 option program. Stock options 2015 are granted according to the decision of the Board of Directors on December 18, 2014 to approximately 560 key employees. The decision was based on the authorization received from the Shareholders’ Meeting on March 1, 2010. A maximum total of 1,500,000 options are granted. The original share subscription price for the option was EUR 36.20 per share and it is further reduced in situations mentioned in the terms, for example with dividends distributed before the subscription of the shares. The effec-tive subscription price as per December 31, 2016 is EUR 33.60. Each stock option entitles its holder to subscribe for one (1) new or an existing company’s own class B KONE share. The share subscription period for the stock options 2015 will be April 1, 2017–April 30, 2019. The share subscription period begins accordingly on April 1, 2017 as the financial performance of the KONE Group for the financial years 2015–2016 based on the total consider-
ation of the Board of Directors was equal to or better than the average performance of the key competitors of KONE.
KONE has two separate share-based incentive plans. One plan is targeted for the senior management of KONE includ-ing the President & CEO, members of the Executive Board and other top manage-ment, consisting of approximately 60 individuals. A second plan is targeted for other key personnel of KONE, totaling approximately 425 individuals. The poten-tial reward is based on the annual growth in sales and operating income (EBIT) in both plans. However, KONE´s Board of Directors has the possibility to change the basis of the target setting annually. The potential reward is to be paid as a combination of KONE class B shares and a cash payment equivalent to the taxes and similar charges that are incurred from the receipt of shares. Plans include conditions preventing participants from transferring and participants are obliged to return the shares and the cash payments if employ-ment or service contract is terminated during a period of two years following the ending of each earning period. As part of the plan for the senior management, a long term target for the their ownership has been set.
On December 31, 2016, KONE’s share capital was EUR 65,771,110.26 compris-ing 449,960,170 listed class B shares and 76,208,712 unlisted class A shares. KONE’s market capitalization was EUR 21,851 million on December 31, 2016, disregarding own shares in the Group’s possession. Market capitalization is cal-culated on the basis of both the listed B shares and the unlisted A shares excluding treasury shares. Class A shares are valued at the closing price of the class B shares at the end of the reporting period.
Shares in KONE’s possession During January–December 2016, KONE used its authorization to repurchase own shares. In April, 391,662 class B shares in the company’s possession were assigned to the share-based incentive plan and 2,923 class B shares as a part of the board members’ annual remuneration. In May, KONE bought back in total 1,000,000 of its own class B shares. In August, 21,752, in October 5,554 and in December, 10,876 class B shares were returned to KONE Corporation by virtue of the term of KONE Corporation’s share-based incentive program for the years 2013–2015. At the end of December 2016, the Group had 12,884,141 class B shares in its possession. The shares in the Group’s possession rep-resent 2.9% of the total number of class
B shares. This corresponds to 1.1% of the total voting rights.
Shares traded on the Nasdaq Helsinki Ltd. The Nasdaq Helsinki Ltd. traded 194.7 million KONE Corporation’s class B shares in January–December 2016, equivalent to a turnover of EUR 8,075 million. The daily average trading volume was 769,607 shares (1–12/2015: 1,032,543). The share price on December 31, 2016 was EUR 42.57. The volume weighted average share price during the period was EUR 41.47. The highest quotation during the period under review was EUR 47.89 and the lowest EUR 35.50. In addition to the Nasdaq Helsinki Stock Exchange, KONE’s class B share is traded also on various alternative trading platforms. The volume of KONE’s B shares traded on the Nasdaq Helsinki Stock Exchange represented approximately 28.7% of the total volume of KONE’s class B shares traded in Janu-ary–December 2016 (source: Fidessa Frag-mentation Index, http://fragmentation.fidessa.com).
The number of registered shareholders was 56,441 at the beginning of the review period and 57,471 at its end. The num-ber of private households holding shares totaled 53,693 at the end of the period, which corresponds to approximately 13.2% of the listed B shares.
According to the nominee registers, 50.1% of the listed class B shares were owned by foreign shareholders on Decem-ber 31, 2016. Other foreign ownership at the end of the period totaled 1.4%. Thus a total of 51.5% of KONE’s listed class B shares were owned by international inves-tors, corresponding to approximately 19.1% of the total votes in the company.
Flagging notifications During January–December 2016, Black-Rock, Inc. announced several notices to KONE Corporation in accordance with the Finnish Securities Market Act, Chapter 9, Section 10. The notices were announced on January 6, January 7, January 8, March 17, March 18, March 21, April 29, Sep-tember 1, October 20 and October 28. All notices have been released as stock exchange releases and are available on KONE Corporation’s internet pages at www.kone.com. According to the lat-est notification, released on October 31, 2016, the total number of KONE Corpora-tion shares owned by BlackRock, Inc. and its funds decreased below five (5) per cent of the share capital of KONE Corporation on October 27, 2016.
16
This report contains forward-looking statements that are based on the current expectations, known factors, decisions and plans of the management of KONE. Although the management believes that the expectations reflected in such forward-looking statements are reasonable, no assurance can be given that such expectations will prove to be correct. Accordingly, results could differ materially from those implied in the forward-looking statements as a result of, among other factors, changes in economic, market and competitive conditions, changes in the regulatory environment and other govern-ment actions as well as fluctuations in exchange rates.
Information required required by the Companies’ Act and the Decree of the Ministry of Finance on the Regular Duty of Disclosure of an Issuer of a Security, such as classes of shares, shareholders, related parties, share-based remuneration and terms of stock options and financial key figures are presented on pages 59–62, which are part of the official Board of Directors’ Report, as well as in the notes to the Financial Statements.
KONE 2016 Annual Review | Board of Directors’ report
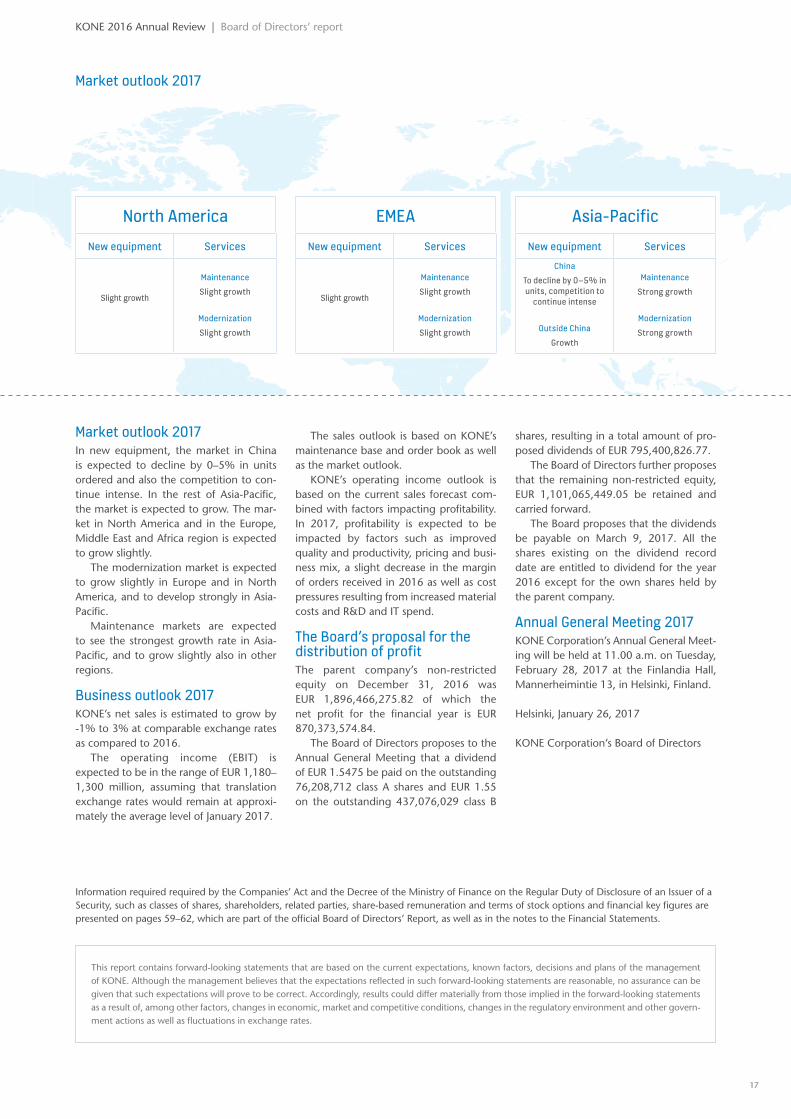
Market outlook 2017
Market outlook 2017In new equipment, the market in China is expected to decline by 0–5% in units ordered and also the competition to con-tinue intense. In the rest of Asia-Pacific, the market is expected to grow. The mar-ket in North America and in the Europe, Middle East and Africa region is expected to grow slightly.
The modernization market is expected to grow slightly in Europe and in North America, and to develop strongly in Asia-Pacific.
Maintenance markets are expected to see the strongest growth rate in Asia-Pacific, and to grow slightly also in other regions.
Business outlook 2017 KONE’s net sales is estimated to grow by -1% to 3% at comparable exchange rates as compared to 2016.
The operating income (EBIT) is expected to be in the range of EUR 1,180–1,300 million, assuming that translation exchange rates would remain at approxi-mately the average level of January 2017.
The sales outlook is based on KONE’s maintenance base and order book as well as the market outlook.
KONE’s operating income outlook is based on the current sales forecast com-bined with factors impacting profitability. In 2017, profitability is expected to be impacted by factors such as improved quality and productivity, pricing and busi-ness mix, a slight decrease in the margin of orders received in 2016 as well as cost pressures resulting from increased material costs and R&D and IT spend.
The Board’s proposal for the distribution of profitThe parent company’s non-restricted equity on December 31, 2016 was EUR 1,896,466,275.82 of which the net profit for the financial year is EUR 870,373,574.84.
The Board of Directors proposes to the Annual General Meeting that a dividend of EUR 1.5475 be paid on the outstanding 76,208,712 class A shares and EUR 1.55 on the outstanding 437,076,029 class B
shares, resulting in a total amount of pro-posed dividends of EUR 795,400,826.77.
The Board of Directors further proposes that the remaining non-restricted equity, EUR 1,101,065,449.05 be retained and carried forward.
The Board proposes that the dividends be payable on March 9, 2017. All the shares existing on the dividend record date are entitled to dividend for the year 2016 except for the own shares held by the parent company.
Annual General Meeting 2017KONE Corporation’s Annual General Meet-ing will be held at 11.00 a.m. on Tuesday, February 28, 2017 at the Finlandia Hall, Mannerheimintie 13, in Helsinki, Finland.
Helsinki, January 26, 2017
KONE Corporation’s Board of Directors
North AmericaNew equipment Services
Slight growth
Maintenance
Slight growth
Modernization
Slight growth
EMEANew equipment Services
Slight growth
Maintenance
Slight growth
Modernization
Slight growth
Asia-PacificNew equipment Services
China
To decline by 0–5% in units, competition to
continue intense
Outside China
Growth
Maintenance
Strong growth
Modernization
Strong growth
17
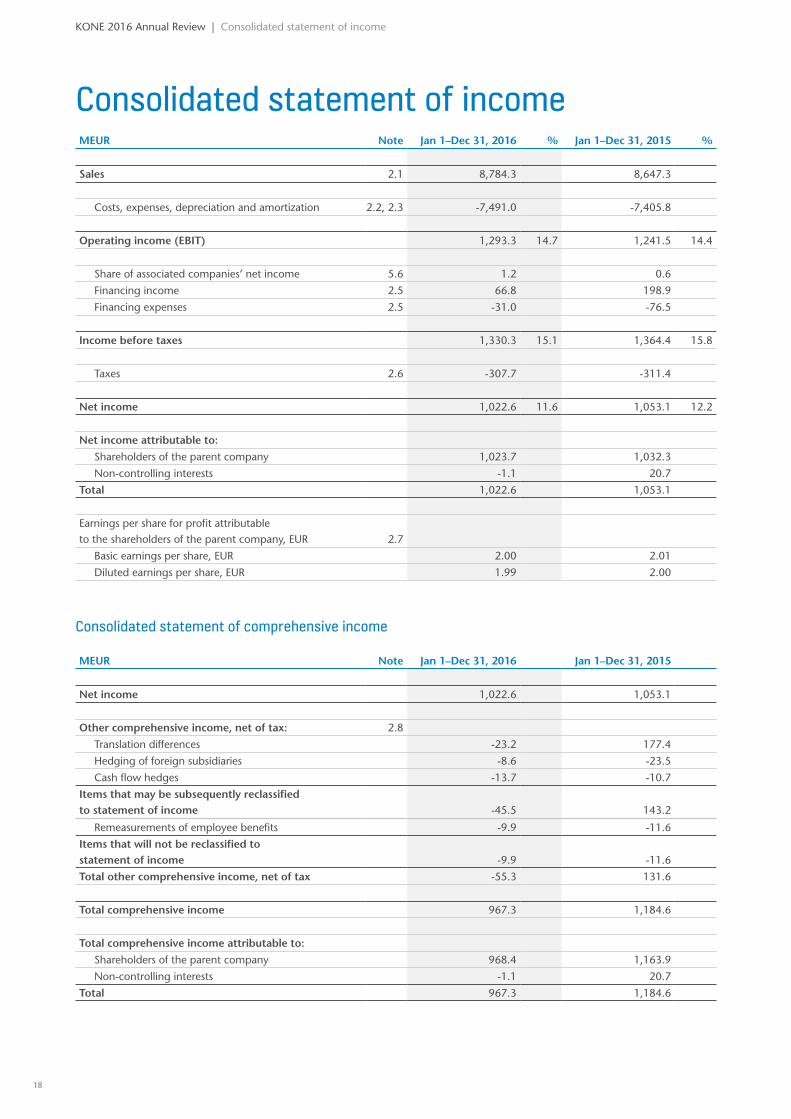
Consolidated statement of incomeMEUR Note Jan 1–Dec 31, 2016 % Jan 1–Dec 31, 2015 %
Sales 2.1 8,784.3 8,647.3
Costs, expenses, depreciation and amortization 2.2, 2.3 -7,491.0 -7,405.8
Operating income (EBIT) 1,293.3 14.7 1,241.5 14.4
Share of associated companies’ net income 5.6 1.2 0.6
Financing income 2.5 66.8 198.9
Financing expenses 2.5 -31.0 -76.5
Income before taxes 1,330.3 15.1 1,364.4 15.8
Taxes 2.6 -307.7 -311.4
Net income 1,022.6 11.6 1,053.1 12.2
Net income attributable to:
Shareholders of the parent company 1,023.7 1,032.3
Non-controlling interests -1.1 20.7
Total 1,022.6 1,053.1
Earnings per share for profit attributable to the shareholders of the parent company, EUR 2.7
Basic earnings per share, EUR 2.00 2.01
Diluted earnings per share, EUR 1.99 2.00
Consolidated statement of comprehensive income
MEUR Note Jan 1–Dec 31, 2016 Jan 1–Dec 31, 2015
Net income 1,022.6 1,053.1
Other comprehensive income, net of tax: 2.8
Translation differences -23.2 177.4
Hedging of foreign subsidiaries -8.6 -23.5
Cash flow hedges -13.7 -10.7
Items that may be subsequently reclassified to statement of income -45.5 143.2
Remeasurements of employee benefits -9.9 -11.6
Items that will not be reclassified to statement of income -9.9 -11.6
Total other comprehensive income, net of tax -55.3 131.6
Total comprehensive income 967.3 1,184.6
Total comprehensive income attributable to:
Shareholders of the parent company 968.4 1,163.9
Non-controlling interests -1.1 20.7
Total 967.3 1,184.6
KONE 2016 Annual Review | Consolidated statement of income
18
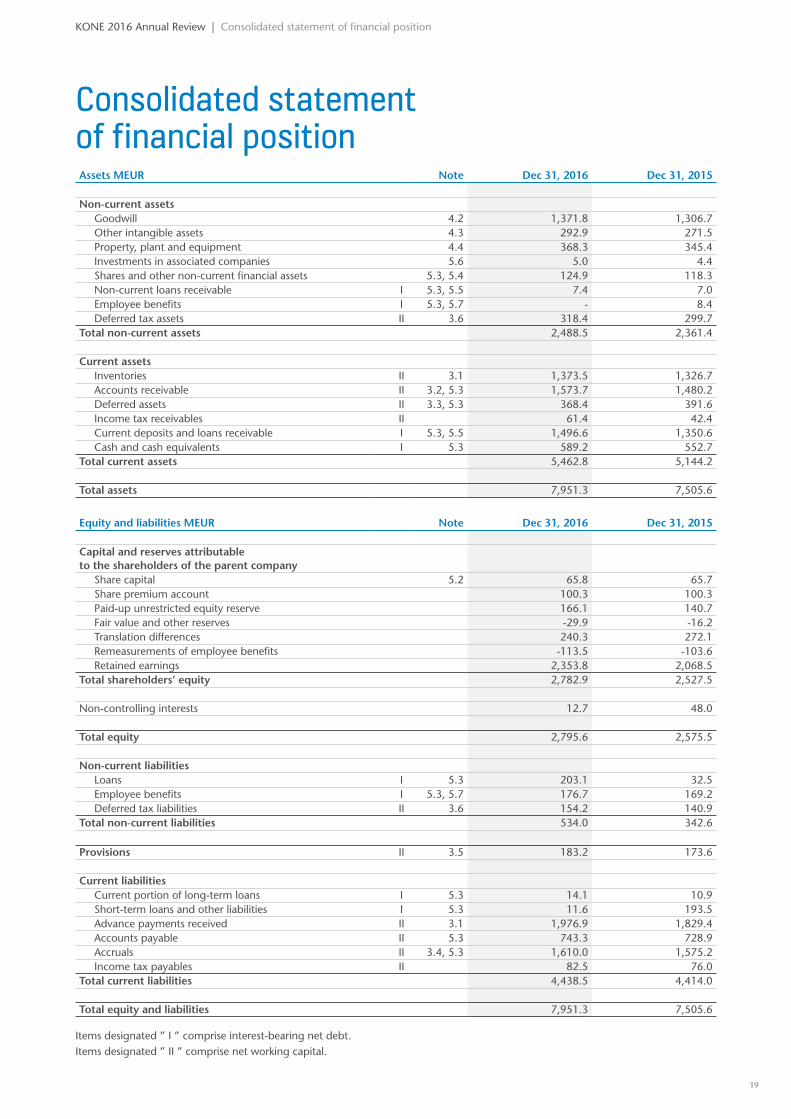
Consolidated statement of financial positionAssets MEUR Note Dec 31, 2016 Dec 31, 2015
Non-current assets Goodwill 4.2 1,371.8 1,306.7Other intangible assets 4.3 292.9 271.5Property, plant and equipment 4.4 368.3 345.4Investments in associated companies 5.6 5.0 4.4Shares and other non-current financial assets 5.3, 5.4 124.9 118.3Non-current loans receivable I 5.3, 5.5 7.4 7.0Employee benefits I 5.3, 5.7 - 8.4Deferred tax assets II 3.6 318.4 299.7
Total non-current assets 2,488.5 2,361.4 Current assets
Inventories II 3.1 1,373.5 1,326.7Accounts receivable II 3.2, 5.3 1,573.7 1,480.2Deferred assets II 3.3, 5.3 368.4 391.6Income tax receivables II 61.4 42.4Current deposits and loans receivable I 5.3, 5.5 1,496.6 1,350.6Cash and cash equivalents I 5.3 589.2 552.7
Total current assets 5,462.8 5,144.2
Total assets 7,951.3 7,505.6
Equity and liabilities MEUR Note Dec 31, 2016 Dec 31, 2015 Capital and reserves attributable to the shareholders of the parent company
Share capital 5.2 65.8 65.7Share premium account 100.3 100.3Paid-up unrestricted equity reserve 166.1 140.7Fair value and other reserves -29.9 -16.2Translation differences 240.3 272.1Remeasurements of employee benefits -113.5 -103.6Retained earnings 2,353.8 2,068.5
Total shareholders’ equity 2,782.9 2,527.5 Non-controlling interests 12.7 48.0 Total equity 2,795.6 2,575.5 Non-current liabilities
Loans I 5.3 203.1 32.5Employee benefits I 5.3, 5.7 176.7 169.2Deferred tax liabilities II 3.6 154.2 140.9
Total non-current liabilities 534.0 342.6 Provisions II 3.5 183.2 173.6 Current liabilities
Current portion of long-term loans I 5.3 14.1 10.9Short-term loans and other liabilities I 5.3 11.6 193.5Advance payments received II 3.1 1,976.9 1,829.4Accounts payable II 5.3 743.3 728.9Accruals II 3.4, 5.3 1,610.0 1,575.2Income tax payables II 82.5 76.0
Total current liabilities 4,438.5 4,414.0 Total equity and liabilities 7,951.3 7,505.6
Items designated ” I ” comprise interest-bearing net debt.Items designated ” II ” comprise net working capital.
KONE 2016 Annual Review | Consolidated statement of financial position
19
Consolidated statement of changes in equity
MEUR Not
e
Shar
e ca
pit
al
Shar
e p
rem
ium
ac
coun
t
Paid
-up
un
rest
rict
ed
equi
ty r
eser
ve
Fair
val
ue a
nd
ot
her
res
erve
s
Tran
slat
ion
d
iffe
ren
ces
Rem
easu
rem
ents
of
em
plo
yee
ben
efits
Ow
n
shar
es
Ret
ain
ed
earn
ing
s
Net
inco
me
fo
r th
e p
erio
d
Non
-con
trol
ling
in
tere
sts
Tota
l eq
uity
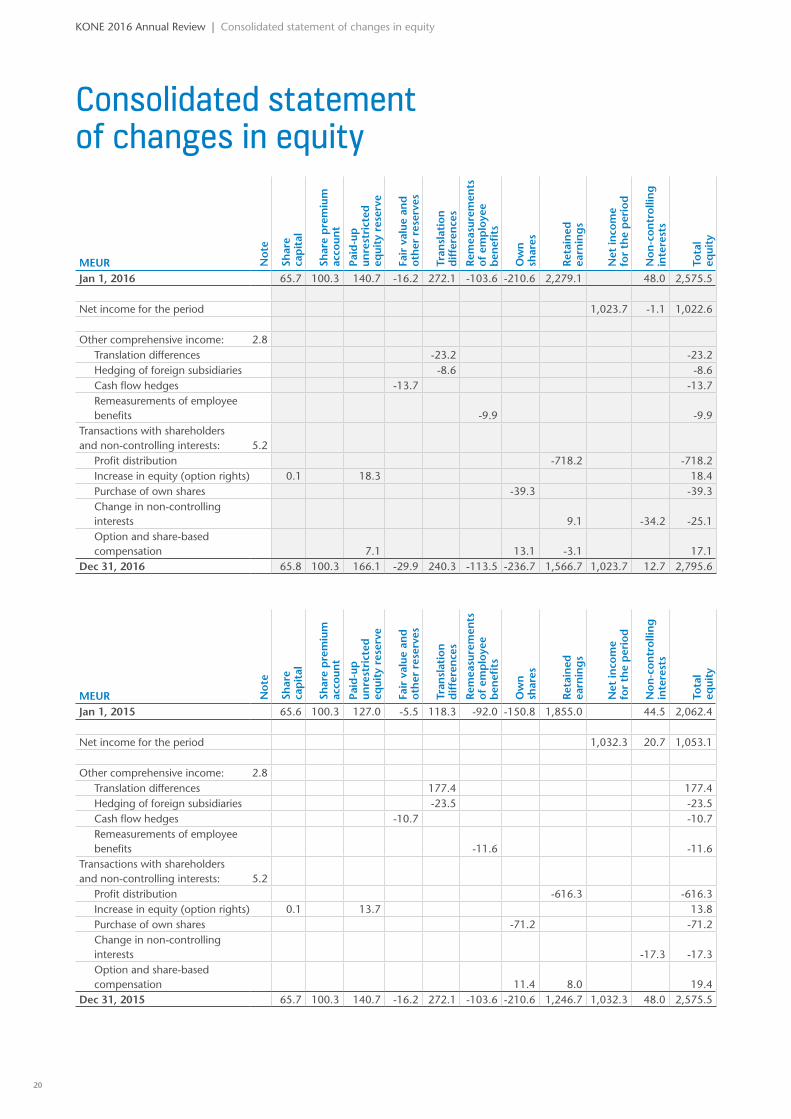
Jan 1, 2016 65.7 100.3 140.7 -16.2 272.1 -103.6 -210.6 2,279.1 48.0 2,575.5
Net income for the period 1,023.7 -1.1 1,022.6
Other comprehensive income: 2.8Translation differences -23.2 -23.2Hedging of foreign subsidiaries -8.6 -8.6Cash flow hedges -13.7 -13.7Remeasurements of employee benefits -9.9 -9.9
Transactions with shareholders and non-controlling interests: 5.2
Profit distribution -718.2 -718.2Increase in equity (option rights) 0.1 18.3 18.4Purchase of own shares -39.3 -39.3Change in non-controlling interests 9.1 -34.2 -25.1Option and share-based compensation 7.1 13.1 -3.1 17.1
Dec 31, 2016 65.8 100.3 166.1 -29.9 240.3 -113.5 -236.7 1,566.7 1,023.7 12.7 2,795.6
MEUR Not
e
Shar
e ca
pit
al
Shar
e p
rem
ium
ac
coun
t
Paid
-up
un
rest
rict
ed
equi
ty r
eser
ve
Fair
val
ue a
nd
ot
her
res
erve
s
Tran
slat
ion
d
iffe
ren
ces
Rem
easu
rem
ents
of
em
plo
yee
ben
efits
Ow
n
shar
es
Ret
ain
ed
earn
ing
s
Net
inco
me
fo
r th
e p
erio
d
Non
-con
trol
ling
in
tere
sts
Tota
l eq
uity
Jan 1, 2015 65.6 100.3 127.0 -5.5 118.3 -92.0 -150.8 1,855.0 44.5 2,062.4
Net income for the period 1,032.3 20.7 1,053.1
Other comprehensive income: 2.8Translation differences 177.4 177.4Hedging of foreign subsidiaries -23.5 -23.5Cash flow hedges -10.7 -10.7Remeasurements of employee benefits -11.6 -11.6
Transactions with shareholders and non-controlling interests: 5.2
Profit distribution -616.3 -616.3Increase in equity (option rights) 0.1 13.7 13.8Purchase of own shares -71.2 -71.2Change in non-controlling interests -17.3 -17.3Option and share-based compensation 11.4 8.0 19.4
Dec 31, 2015 65.7 100.3 140.7 -16.2 272.1 -103.6 -210.6 1,246.7 1,032.3 48.0 2,575.5
KONE 2016 Annual Review | Consolidated statement of changes in equity
20
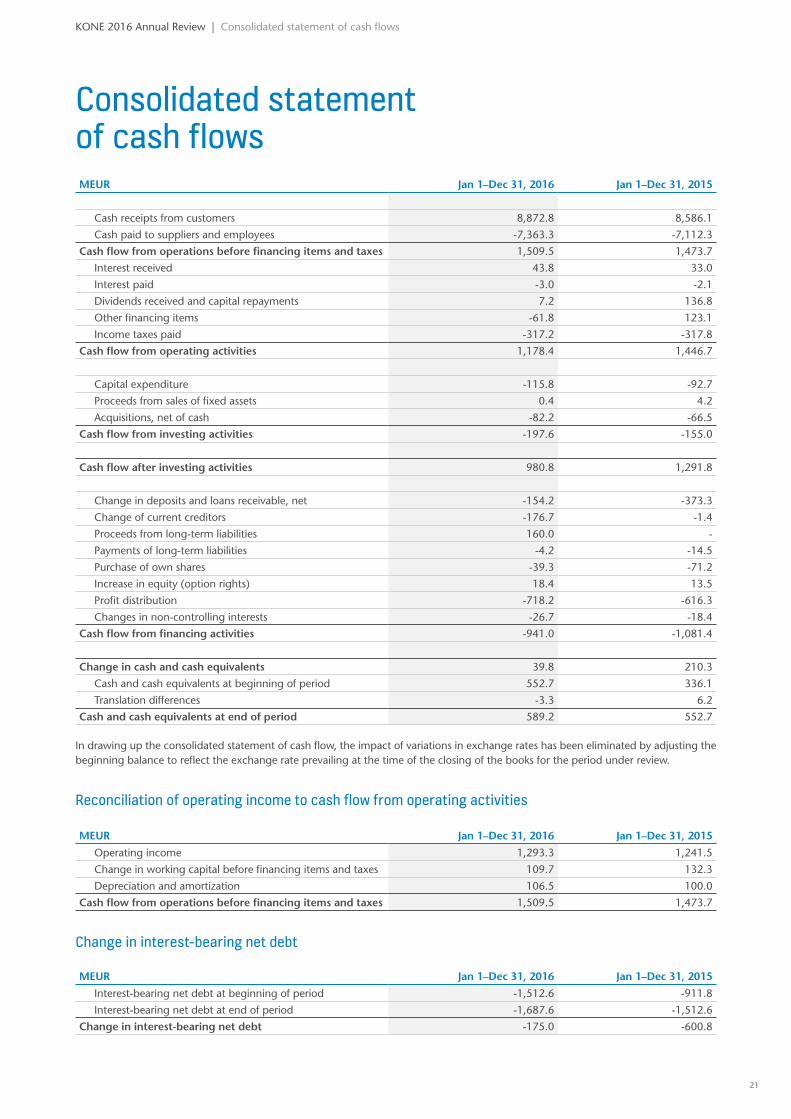
MEUR Jan 1–Dec 31, 2016 Jan 1–Dec 31, 2015
Cash receipts from customers 8,872.8 8,586.1
Cash paid to suppliers and employees -7,363.3 -7,112.3
Cash flow from operations before financing items and taxes 1,509.5 1,473.7
Interest received 43.8 33.0
Interest paid -3.0 -2.1
Dividends received and capital repayments 7.2 136.8
Other financing items -61.8 123.1
Income taxes paid -317.2 -317.8
Cash flow from operating activities 1,178.4 1,446.7
Capital expenditure -115.8 -92.7
Proceeds from sales of fixed assets 0.4 4.2
Acquisitions, net of cash -82.2 -66.5
Cash flow from investing activities -197.6 -155.0
Cash flow after investing activities 980.8 1,291.8
Change in deposits and loans receivable, net -154.2 -373.3
Change of current creditors -176.7 -1.4
Proceeds from long-term liabilities 160.0 -
Payments of long-term liabilities -4.2 -14.5
Purchase of own shares -39.3 -71.2
Increase in equity (option rights) 18.4 13.5
Profit distribution -718.2 -616.3
Changes in non-controlling interests -26.7 -18.4
Cash flow from financing activities -941.0 -1,081.4
Change in cash and cash equivalents 39.8 210.3
Cash and cash equivalents at beginning of period 552.7 336.1
Translation differences -3.3 6.2
Cash and cash equivalents at end of period 589.2 552.7
In drawing up the consolidated statement of cash flow, the impact of variations in exchange rates has been eliminated by adjusting the beginning balance to reflect the exchange rate prevailing at the time of the closing of the books for the period under review.
Reconciliation of operating income to cash flow from operating activities
MEUR Jan 1–Dec 31, 2016 Jan 1–Dec 31, 2015
Operating income 1,293.3 1,241.5
Change in working capital before financing items and taxes 109.7 132.3
Depreciation and amortization 106.5 100.0
Cash flow from operations before financing items and taxes 1,509.5 1,473.7
Change in interest-bearing net debt
MEUR Jan 1–Dec 31, 2016 Jan 1–Dec 31, 2015
Interest-bearing net debt at beginning of period -1,512.6 -911.8
Interest-bearing net debt at end of period -1,687.6 -1,512.6
Change in interest-bearing net debt -175.0 -600.8
Consolidated statement of cash flows
KONE 2016 Annual Review | Consolidated statement of cash flows
21
1
Notes to the consolidated financial statements
KONE 2016 Annual Review | Notes to the consolidated financial statements | Basis of preparation
BASIS OF PREPARATION
IN THIS SECTION • Basis of preparation• New standards• Consolidation principles• Segment information• Accounting estimates
Accounting principles can be found next to the relevant notes in sections 2–6
22
KONE 2016 Annual Review | Notes to the consolidated financial statements | Basis of preparation
Basis of preparationKONE Corporation is a Finnish, public lim-ited company domiciled in Helsinki, Fin-land. KONE Corporation and its subsidiar-ies together form the consolidated KONE Group (“KONE” or “the Group”). KONE’s objective is to offer the best People Flow experience by developing and delivering solutions that enable people to move smoothly, safely, comfortably and without waiting in buildings in an increasingly urbanizing environment. KONE provides its customers with industry-leading eleva-tors, escalators, automatic doors and inte-grated solutions to improve the customer experience in and between buildings. In addition, KONE offers maintenance and modernization services for existing equip-ment.
The consolidated financial statements of KONE Corporation have been prepared
in accordance with the International Financial Reporting Standards (IFRS) as adopted by the European Union, observ-ing the standards and interpretations effective on December 31, 2016.
KONE has adopted the new standards and interpretations that took effect during the accounting period and are relevant to its operations. The changes did not have a material impact on the result or the financial position of the Group or on the presentation of the financial statements.
The IFRS standards that take effect in 2017 are not expected to have a material impact on the result or the financial posi-tion of the Group or on the presentation of the financial statements.
The consolidated financial statements have been prepared for the accounting period of 12 months from January 1 to
December 31, 2016. The financial state-ments have been authorized for issue by the Board of Directors of KONE Corpora-tion on January 26, 2017. According to the Finnish Companies’ Act the Annual General Meeting has the right to approve, reject or make changes to the financial statements after the publication.
The consolidated financial statements are presented in millions of euros and pre-pared under the historical cost convention except as disclosed in the accounting prin-ciples. Figures presented in these financial statements have been rounded from exact figures and therefore the sum of figures presented individually can deviate from the presented sum figure. Key figures have been calculated using exact figures.
Trade date accounting is applied to all financial assets and liabilities.
New standardsThe International Accounting Standards Board has issued three new standards, IFRS 15, Revenue from Contracts with Customers, IFRS 9, Financial Instruments and IFRS 16, Leases which are relevant to KONE. IFRS 15 and IFRS 9 are effective starting on January 1, 2018 and IFRS 16 on January 1, 2019 with a permission for early adoption for entities that apply IFRS 15 at or before the date of initial applica-tion of IFRS 16.The European Union has endorsed the IFRS 15 and 9 standards but not yet IFRS 16.
IFRS 15IFRS 15 establishes a new five-step model that will apply to revenue arising from contracts with customers. Revenue is recognized when, or as, the customer obtains control of the goods or services in an amount that reflects the consideration to which the entity expects to be entitled in exchange for those goods or services. In addition, IFRS 15 requires quantitative and qualitative disclosures about the entity’s contracts with customers, performance obligations in the contracts and significant judgements made. KONE plans to adopt the new standard on the required effective date using the full retrospective method.
KONE has performed a preliminary assessment of IFRS 15, which is subject to changes arising from a more detailed ongoing analysis. Further, KONE is also considering the clarifications issued by the IASB in 2016 and will monitor any further developments. Based on the preliminary assessment the impact is expected to be mainly limited to revenue recognition of new equipment and modernization con-tracts where KONE expects the revenue
recognition to occur over time measured based on percentage of completion method as the customer obtains the con-trol of each asset i.e. separately identifiable performance obligation. A performance obligation is a distinct good or service within a contract that customer can ben-efit on stand-alone basis. For KONE’s new equipment and modernization contracts a performance obligation typically means delivery and installation of a single unit i.e. an elevator, escalator or other People Flow solution. The percentage of comple-tion will be defined as the proportion of individual performance obligation’s cost incurred to date from the total estimated costs for that particular performance obligation. The percentage of comple-tion method requires accurate estimates of future revenues and costs over the full term of the contracts. These significant estimates form the basis for the amount of revenue to be recognized and include the latest updated total revenue, cost and risks adjusted by the typical estimation revisions for similar types of contracts. These estimates may materially change due to the stage of completion of the contract, changes in the contract scope, costs estimates and customer’s plans and other factors.
Application of new revenue recogni-tion principles under IFRS15 will have a material impact on KONE’s consolidated financial statements. Reported sales and operating profit (EBIT) will be impacted due to changes in timing of revenue rec-ognition. In practice, revenue is expected to be recognized earlier based on the progress also for those new equipment and modernization contracts which are
not defined as long-term major projects recognized already under percentage of completion method. From balance sheet perspective, the application of new prin-ciples will significantly decrease work in progress and related advances received while receivables are expected to be somewhat increased. At this stage, KONE is not able to reliable estimate the quanti-tative impacts of the new principles on its consolidated financial statements. KONE will make more detailed assessments of the impact over the next twelve months.
IFRS 9IFRS 9 includes revised guidance on the classification and measurement of finan-cial instruments, a new expected credit loss model for calculating impairment on financial assets, and new general hedge accounting requirements. KONE is cur-rently evaluating the impact of this stan-dard and amendments on its consolidated financial statements and plans to adopt the new standard on the required effec-tive date. However, based on the KONE’s preliminary assessment, application of IFRS 9 is not expected to have a material impact on the transactions and balances recognized in KONE’s consolidated finan-cial statements.
IFRS 16IFRS 16 introduces a single, on-balance sheet lease accounting model for lessees. A lessee recognizes a right-of-use asset representing its right to use the underlying asset and a lease liability representing its obligation to make lease payments. There are optional exemptions for short-term leases and leases of low-value items. Lessor
23
accounting remains similar to the current standard – i.e. lessors continue to classify leases as finance or operating leases.
KONE has started a preliminary assessment of the impacts on its con-solidated financial statements. The most significant impact identified is that KONE will recognize new assets and liabilities,
mainly for its operating leases of facili-ties and vehicles. In addition, the nature of expenses related to those leases will change as IFRS 16 replaces the operating lease expense with a depreciation charge for right-of-use assets and interest expense on lease liabilities reported under financ-ing expenses. KONE has not yet quantified
the impacts of the adoption of IFRS 16 on its consolidated financial statements. More detailed assessments of the impacts will be done over the next twelve months. The transition approach has not yet been final-ized – also an option for early adoption in conjunction with IFRS 15 is considered.
Consolidation principlesThe consolidated accounts include the parent company and those companies in which the parent company held, directly or indirectly, more than 50 percent of the voting power or had control through management agreements with share-holders holding the majority of the vot-ing power at the end of the accounting period. In addition to these holdings, the consolidated accounts include possible holdings that are of a controlling-right nature (units/companies established for a specific reason). Subsidiaries acquired during the period were included in the consolidated financial statements from the date of acquisition, and divested subsidiar-
ies up to the date of sale. Intra-corporate shareholdings have been eliminated using the acquisition method. The acquisition consideration, including deferred and contingent consideration, as well as the identifiable assets acquired and liabilities assumed, is measured at the acquisition date fair values. The acquisition-related costs are accounted as expenses for the period in which they are incurred.
At the acquisition date, the non-controlling interests are valued either at the acquisition date fair values or at non-controlling interests’ proportionate share in the recognized amounts of the identifi-able net assets. Net income for the period
is disclosed in the statement of income as an allocation to the shareholders of the parent company and non-controlling interests. The allocation of the compre-hensive income to the shareholders of the parent company and non-controlling interests is presented in the statement of comprehensive income. Non-controlling interests are disclosed separately under consolidated total equity.
All intra-corporate transactions, receiv-ables, liabilities and unrealized profits, as well as the distribution of profits within the Group have been eliminated in the consolidated financial statements.
Segment informationThe profitability of KONE is presented as a single entity. The KONE business idea is to serve its customers by providing solu-tions throughout the entire lifecycle of the equipment, beginning from the instal-lation of new equipment to the mainte-nance and modernization during their lifecycle and the full replacement of the
equipment. Most of the equipment that are delivered are converted into long-term KONE maintenance contracts. KONE’s operating business structure is globally harmonized based on defined business processes. Material operative decisions are made by the Board of Directors of KONE. Such decisions are prepared and pre-
sented by the full-time Chairman of the Board and the President and Chief Execu-tive Officer. Due to the business model of KONE, the nature of its operations and its governance structure, the Group as a whole is the relevant operating segment to be reported.
Accounting estimatesThe preparation of the financial statements in accordance with the IFRS requires man-agement to make judgements, estimates and assumptions that affect the measure-ment of the reported assets and liabilities and other information, such as contingent assets and liabilities and the recognition of income and expenses in the statement
of income. Although these estimates and assumptions are based on the manage-ment’s best knowledge of current events and actions, actual results may differ from the estimates.
For KONE the most significant judge-ments, estimates and assumptions made by the management relate to revenue
recognition, especially to project estimates for long-term major projects, assumptions used in impairment testing, valuation of accounts receivables and inventories, and recognition of provisions and uncertain tax positions.
KONE 2016 Annual Review | Notes to the consolidated financial statements | Basis of preparation
24
2
IN THIS SECTIONThis section comprises the following notes describing KONE’s financial performance in 2016: 2.1 Sales2.2 Costs and expenses2.3 Depreciation and amortization2.4 Foreign exchange sensitivity2.5 Financing income and expenses2.6 Income taxes2.7 Earnings per share2.8 Other comprehensive income
8,784 MEUR
NET SALES
1,293 MEUR
EBIT
FINANCIAL PERFORMANCE
GROWTH: Faster than the
market
PROFITABILITY: EBIT 16%
CASH FLOW: Improved working capital
rotation
KONE 2016 Annual Review | Notes to the consolidated financial statements | Financial performance
FINANCIAL TARGETS
KONE has defined long-term financial targets for its financial performance:
• KONE has not defined a time frame for the achievement of these financial targets.
• Given the capital and asset structure of KONE, the aim is not to maximize the EBIT margin in the short term, but rather to grow the abso-lute EBIT in an optimal way over the long term and as a result maintain a strong return on capital employed.
• The relative EBIT margin target is relevant in ensuring that growth is profitable and that pricing, quality and productivity improve con-tinuously.
25
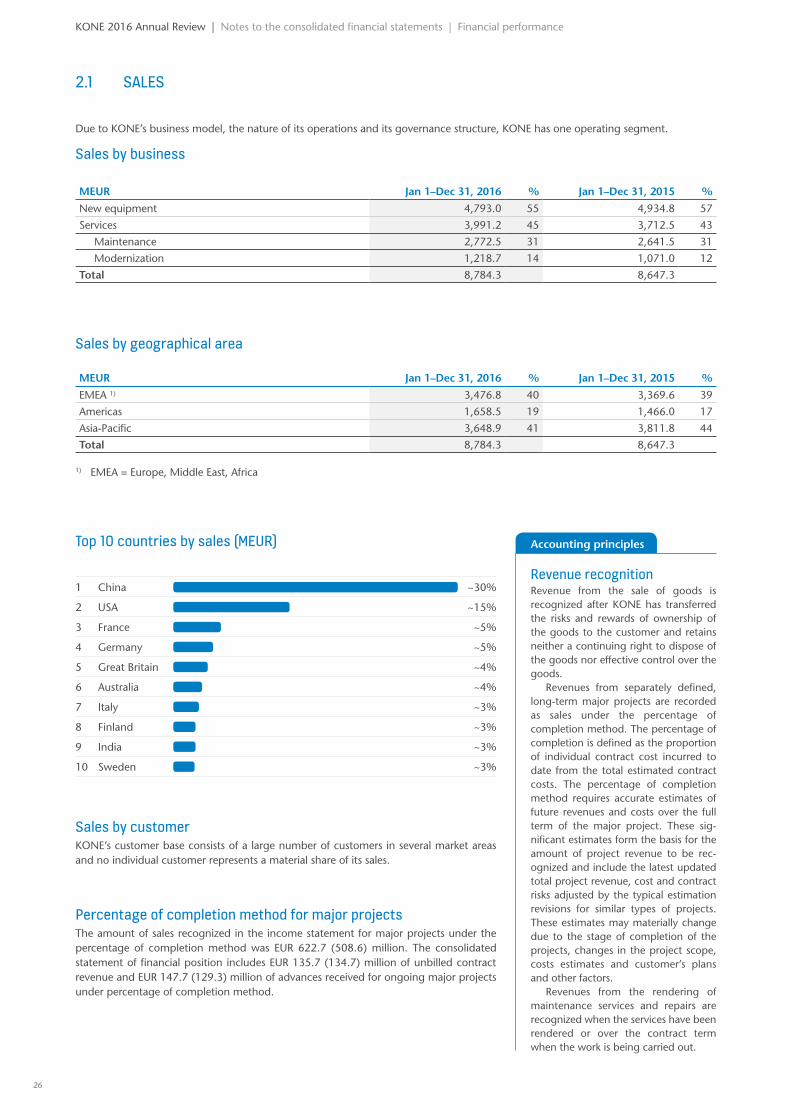
Top 10 countries by sales (MEUR)
1 China ~30%
2 USA ~15%
3 France ~5%
4 Germany ~5%
5 Great Britain ~4%
6 Australia ~4%
7 Italy ~3%
8 Finland ~3%
9 India ~3%
10 Sweden ~3%
2.1 SALES
Due to KONE’s business model, the nature of its operations and its governance structure, KONE has one operating segment.
Sales by business
MEUR Jan 1–Dec 31, 2016 % Jan 1–Dec 31, 2015 %
New equipment 4,793.0 55 4,934.8 57
Services 3,991.2 45 3,712.5 43
Maintenance 2,772.5 31 2,641.5 31
Modernization 1,218.7 14 1,071.0 12
Total 8,784.3 8,647.3
Sales by geographical area
MEUR Jan 1–Dec 31, 2016 % Jan 1–Dec 31, 2015 %
EMEA 1) 3,476.8 40 3,369.6 39
Americas 1,658.5 19 1,466.0 17
Asia-Pacific 3,648.9 41 3,811.8 44
Total 8,784.3 8,647.3
1) EMEA = Europe, Middle East, Africa
Percentage of completion method for major projectsThe amount of sales recognized in the income statement for major projects under the percentage of completion method was EUR 622.7 (508.6) million. The consolidated statement of financial position includes EUR 135.7 (134.7) million of unbilled contract revenue and EUR 147.7 (129.3) million of advances received for ongoing major projects under percentage of completion method.
Sales by customerKONE’s customer base consists of a large number of customers in several market areas and no individual customer represents a material share of its sales.
Accounting principles
Revenue recognitionRevenue from the sale of goods is recognized after KONE has transferred the risks and rewards of ownership of the goods to the customer and retains neither a continuing right to dispose of the goods nor effective control over the goods.
Revenues from separately defined, long-term major projects are recorded as sales under the percentage of completion method. The percentage of completion is defined as the proportion of individual contract cost incurred to date from the total estimated contract costs. The percentage of completion method requires accurate estimates of future revenues and costs over the full term of the major project. These sig-nificant estimates form the basis for the amount of project revenue to be rec-ognized and include the latest updated total project revenue, cost and contract risks adjusted by the typical estimation revisions for similar types of projects. These estimates may materially change due to the stage of completion of the projects, changes in the project scope, costs estimates and customer’s plans and other factors.
Revenues from the rendering of maintenance services and repairs are recognized when the services have been rendered or over the contract term when the work is being carried out.
KONE 2016 Annual Review | Notes to the consolidated financial statements | Financial performance
26
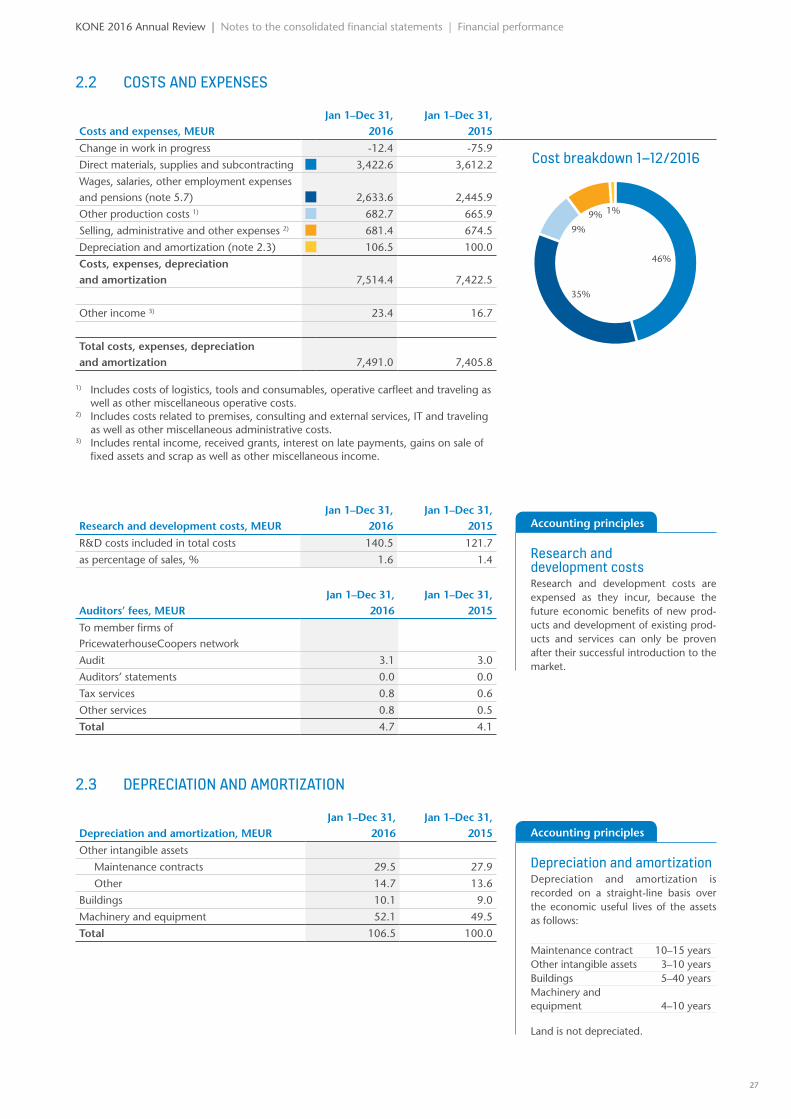
2.2 COSTS AND EXPENSES
Costs and expenses, MEURJan 1–Dec 31,
2016Jan 1–Dec 31,
2015
Change in work in progress -12.4 -75.9
Direct materials, supplies and subcontracting 3,422.6 3,612.2
Wages, salaries, other employment expenses and pensions (note 5.7) 2,633.6 2,445.9
Other production costs 1) 682.7 665.9
Selling, administrative and other expenses 2) 681.4 674.5
Depreciation and amortization (note 2.3) 106.5 100.0
Costs, expenses, depreciation and amortization 7,514.4 7,422.5
Other income 3) 23.4 16.7
Total costs, expenses, depreciation and amortization 7,491.0 7,405.8
1) Includes costs of logistics, tools and consumables, operative carfleet and traveling as well as other miscellaneous operative costs.
2) Includes costs related to premises, consulting and external services, IT and traveling as well as other miscellaneous administrative costs.
3) Includes rental income, received grants, interest on late payments, gains on sale of fixed assets and scrap as well as other miscellaneous income.
Research and development costs, MEURJan 1–Dec 31,
2016Jan 1–Dec 31,
2015
R&D costs included in total costs 140.5 121.7
as percentage of sales, % 1.6 1.4
Auditors’ fees, MEURJan 1–Dec 31,
2016Jan 1–Dec 31,
2015
To member firms of PricewaterhouseCoopers network
Audit 3.1 3.0
Auditors’ statements 0.0 0.0
Tax services 0.8 0.6
Other services 0.8 0.5
Total 4.7 4.1
2.3 DEPRECIATION AND AMORTIZATION
Depreciation and amortization, MEURJan 1–Dec 31,
2016Jan 1–Dec 31,
2015
Other intangible assets
Maintenance contracts 29.5 27.9
Other 14.7 13.6
Buildings 10.1 9.0
Machinery and equipment 52.1 49.5
Total 106.5 100.0
Cost breakdown 1–12/2016
Accounting principles
Research and development costsResearch and development costs are expensed as they incur, because the future economic benefits of new prod-ucts and development of existing prod-ucts and services can only be proven after their successful introduction to the market.
Accounting principles
Depreciation and amortization Depreciation and amortization is recorded on a straight-line basis over the economic useful lives of the assets as follows:
Maintenance contract 10–15 yearsOther intangible assets 3–10 yearsBuildings 5–40 yearsMachinery and equipment
4–10 years
Land is not depreciated.
KONE 2016 Annual Review | Notes to the consolidated financial statements | Financial performance
46%
1%
9%
9%
35%
27
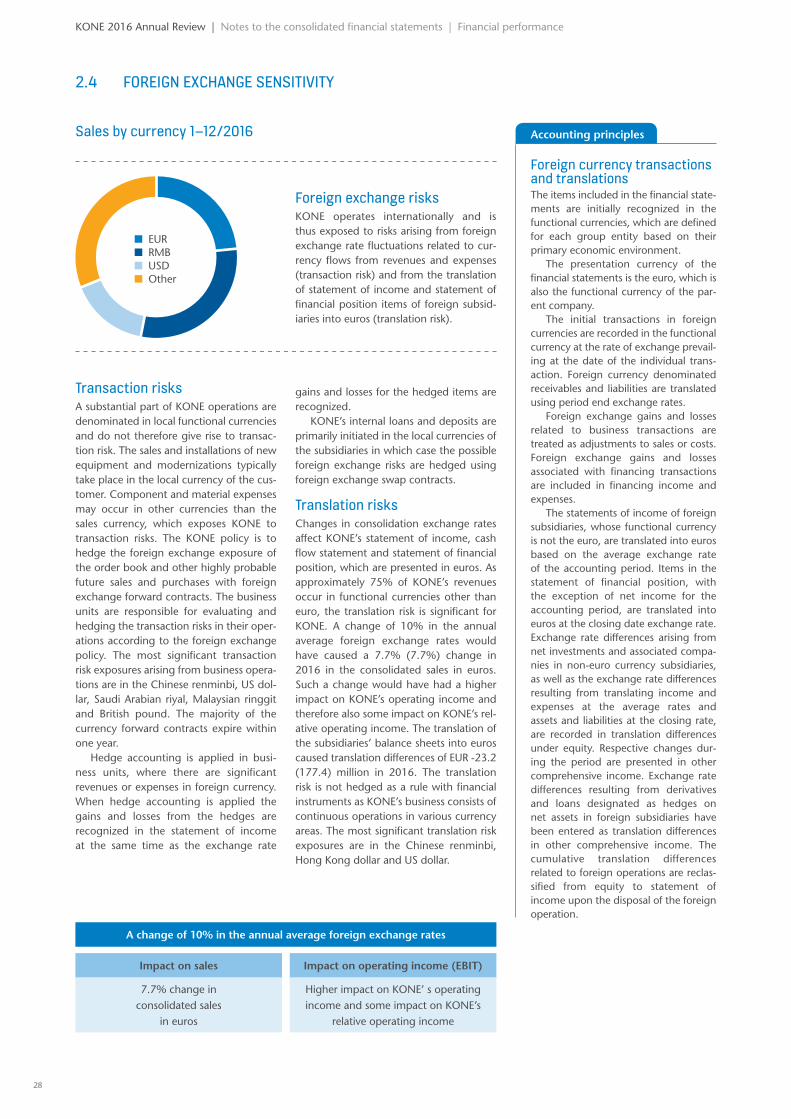
Transaction risksA substantial part of KONE operations are denominated in local functional currencies and do not therefore give rise to transac-tion risk. The sales and installations of new equipment and modernizations typically take place in the local currency of the cus-tomer. Component and material expenses may occur in other currencies than the sales currency, which exposes KONE to transaction risks. The KONE policy is to hedge the foreign exchange exposure of the order book and other highly probable future sales and purchases with foreign exchange forward contracts. The business units are responsible for evaluating and hedging the transaction risks in their oper-ations according to the foreign exchange policy. The most significant transaction risk exposures arising from business opera-tions are in the Chinese renminbi, US dol-lar, Saudi Arabian riyal, Malaysian ringgit and British pound. The majority of the currency forward contracts expire within one year.
Hedge accounting is applied in busi-ness units, where there are significant revenues or expenses in foreign currency. When hedge accounting is applied the gains and losses from the hedges are recognized in the statement of income at the same time as the exchange rate
gains and losses for the hedged items are recognized.
KONE’s internal loans and deposits are primarily initiated in the local currencies of the subsidiaries in which case the possible foreign exchange risks are hedged using foreign exchange swap contracts.
Translation risks Changes in consolidation exchange rates affect KONE’s statement of income, cash flow statement and statement of financial position, which are presented in euros. As approximately 75% of KONE’s revenues occur in functional currencies other than euro, the translation risk is significant for KONE. A change of 10% in the annual average foreign exchange rates would have caused a 7.7% (7.7%) change in 2016 in the consolidated sales in euros. Such a change would have had a higher impact on KONE’s operating income and therefore also some impact on KONE’s rel-ative operating income. The translation of the subsidiaries’ balance sheets into euros caused translation differences of EUR -23.2 (177.4) million in 2016. The translation risk is not hedged as a rule with financial instruments as KONE’s business consists of continuous operations in various currency areas. The most significant translation risk exposures are in the Chinese renminbi, Hong Kong dollar and US dollar.
Foreign exchange risksKONE operates internationally and is thus exposed to risks arising from foreign exchange rate fluctuations related to cur-rency flows from revenues and expenses (transaction risk) and from the translation of statement of income and statement of financial position items of foreign subsid-iaries into euros (translation risk).
2.4 FOREIGN EXCHANGE SENSITIVITY
Sales by currency 1–12/2016
EUR RMB USD Other
A change of 10% in the annual average foreign exchange rates
Impact on sales
7.7% change in consolidated sales
in euros
Impact on operating income (EBIT)
Higher impact on KONE’ s operating income and some impact on KONE’s
relative operating income
Accounting principles
Foreign currency trans actions and translationsThe items included in the financial state-ments are initially recognized in the functional currencies, which are defined for each group entity based on their primary economic environment.
The presentation currency of the financial statements is the euro, which is also the functional currency of the par-ent company.
The initial transactions in foreign currencies are recorded in the functional currency at the rate of exchange prevail-ing at the date of the individual trans-action. Foreign currency denominated receivables and liabilities are translated using period end exchange rates.
Foreign exchange gains and losses related to business transactions are treated as adjustments to sales or costs. Foreign exchange gains and losses associated with financing transactions are included in financing income and expenses.
The statements of income of foreign subsidiaries, whose functional currency is not the euro, are translated into euros based on the average exchange rate of the accounting period. Items in the statement of financial position, with the exception of net income for the accounting period, are translated into euros at the closing date exchange rate. Exchange rate differences arising from net investments and associated compa-nies in non-euro currency subsidiaries, as well as the exchange rate differences resulting from translating income and expenses at the average rates and assets and liabilities at the closing rate, are recorded in translation differences under equity. Respective changes dur-ing the period are presented in other comprehensive income. Exchange rate differences resulting from derivatives and loans designated as hedges on net assets in foreign subsidiaries have been entered as translation differences in other comprehensive income. The cumulative translation differences related to foreign operations are reclas-sified from equity to statement of income upon the disposal of the foreign operation.
KONE 2016 Annual Review | Notes to the consolidated financial statements | Financial performance
28
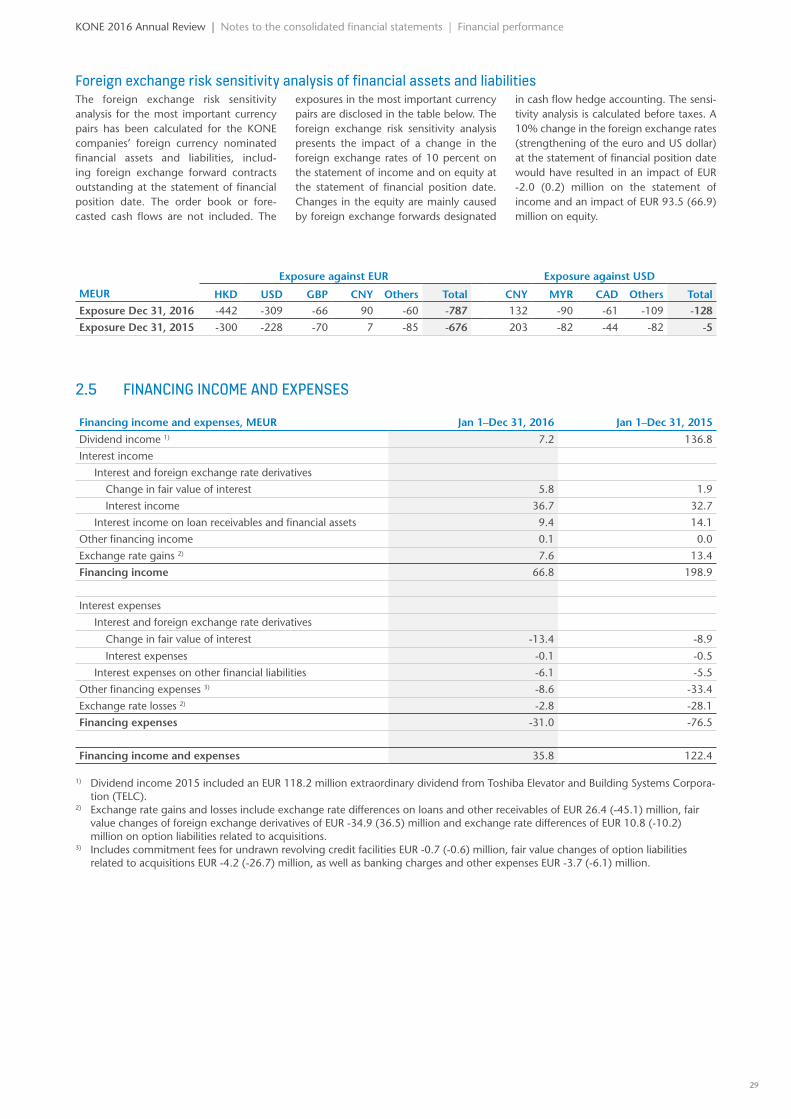
2.5 FINANCING INCOME AND EXPENSES
Financing income and expenses, MEUR Jan 1–Dec 31, 2016 Jan 1–Dec 31, 2015
Dividend income 1) 7.2 136.8
Interest income
Interest and foreign exchange rate derivatives
Change in fair value of interest 5.8 1.9
Interest income 36.7 32.7
Interest income on loan receivables and financial assets 9.4 14.1
Other financing income 0.1 0.0
Exchange rate gains 2) 7.6 13.4
Financing income 66.8 198.9
Interest expenses
Interest and foreign exchange rate derivatives
Change in fair value of interest -13.4 -8.9
Interest expenses -0.1 -0.5
Interest expenses on other financial liabilities -6.1 -5.5
Other financing expenses 3) -8.6 -33.4
Exchange rate losses 2) -2.8 -28.1
Financing expenses -31.0 -76.5
Financing income and expenses 35.8 122.4
1) Dividend income 2015 included an EUR 118.2 million extraordinary dividend from Toshiba Elevator and Building Systems Corpora-tion (TELC).
2) Exchange rate gains and losses include exchange rate differences on loans and other receivables of EUR 26.4 (-45.1) million, fair value changes of foreign exchange derivatives of EUR -34.9 (36.5) million and exchange rate differences of EUR 10.8 (-10.2) million on option liabilities related to acquisitions.
3) Includes commitment fees for undrawn revolving credit facilities EUR -0.7 (-0.6) million, fair value changes of option liabilities related to acquisitions EUR -4.2 (-26.7) million, as well as banking charges and other expenses EUR -3.7 (-6.1) million.
KONE 2016 Annual Review | Notes to the consolidated financial statements | Financial performance
Foreign exchange risk sensitivity analysis of financial assets and liabilitiesThe foreign exchange risk sensitivity analysis for the most important currency pairs has been calculated for the KONE companies’ foreign currency nominated financial assets and liabilities, includ-ing foreign exchange forward contracts outstanding at the statement of financial position date. The order book or fore-casted cash flows are not included. The
exposures in the most important currency pairs are disclosed in the table below. The foreign exchange risk sensitivity analysis presents the impact of a change in the foreign exchange rates of 10 percent on the statement of income and on equity at the statement of financial position date. Changes in the equity are mainly caused by foreign exchange forwards designated
in cash flow hedge accounting. The sensi-tivity analysis is calculated before taxes. A 10% change in the foreign exchange rates (strengthening of the euro and US dollar) at the statement of financial position date would have resulted in an impact of EUR -2.0 (0.2) million on the statement of income and an impact of EUR 93.5 (66.9) million on equity.
Exposure against EUR Exposure against USD
MEUR HKD USD GBP CNY Others Total CNY MYR CAD Others TotalExposure Dec 31, 2016 -442 -309 -66 90 -60 -787 132 -90 -61 -109 -128
Exposure Dec 31, 2015 -300 -228 -70 7 -85 -676 203 -82 -44 -82 -5
29
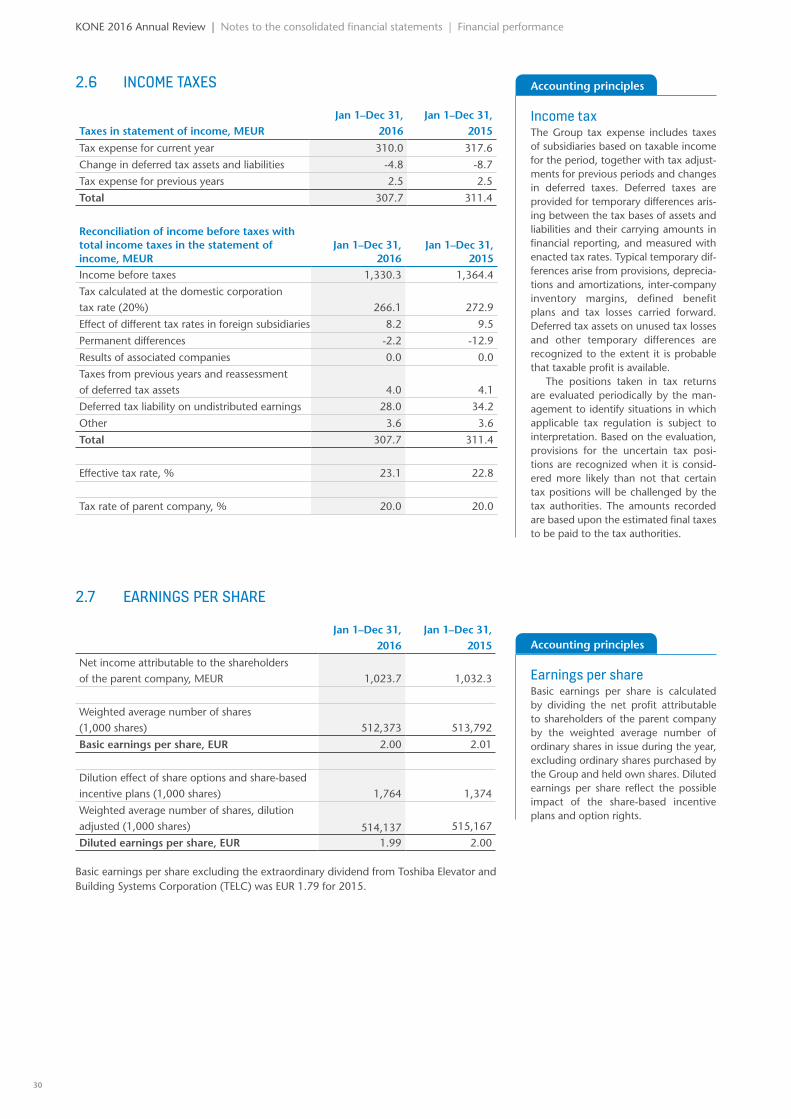
2.6 INCOME TAXES
Taxes in statement of income, MEURJan 1–Dec 31,
2016Jan 1–Dec 31,
2015
Tax expense for current year 310.0 317.6
Change in deferred tax assets and liabilities -4.8 -8.7
Tax expense for previous years 2.5 2.5
Total 307.7 311.4
Reconciliation of income before taxes with total income taxes in the statement of income, MEUR
Jan 1–Dec 31, 2016
Jan 1–Dec 31, 2015
Income before taxes 1,330.3 1,364.4
Tax calculated at the domestic corporation tax rate (20%) 266.1 272.9
Effect of different tax rates in foreign subsidiaries 8.2 9.5
Permanent differences -2.2 -12.9
Results of associated companies 0.0 0.0
Taxes from previous years and reassessment of deferred tax assets 4.0 4.1
Deferred tax liability on undistributed earnings 28.0 34.2
Other 3.6 3.6
Total 307.7 311.4
Effective tax rate, % 23.1 22.8
Tax rate of parent company, % 20.0 20.0
2.7 EARNINGS PER SHARE
Jan 1–Dec 31,
2016Jan 1–Dec 31,
2015
Net income attributable to the shareholders of the parent company, MEUR 1,023.7 1,032.3
Weighted average number of shares (1,000 shares) 512,373 513,792
Basic earnings per share, EUR 2.00 2.01
Dilution effect of share options and share-based incentive plans (1,000 shares) 1,764 1,374
Weighted average number of shares, dilution adjusted (1,000 shares) 514,137 515,167
Diluted earnings per share, EUR 1.99 2.00
Basic earnings per share excluding the extraordinary dividend from Toshiba Elevator and Building Systems Corporation (TELC) was EUR 1.79 for 2015.
Accounting principles
Income taxThe Group tax expense includes taxes of subsidiaries based on taxable income for the period, together with tax adjust-ments for previous periods and changes in deferred taxes. Deferred taxes are provided for temporary differences aris-ing between the tax bases of assets and liabilities and their carrying amounts in financial reporting, and measured with enacted tax rates. Typical temporary dif-ferences arise from provisions, deprecia-tions and amortizations, inter-company inventory margins, defined benefit plans and tax losses carried forward. Deferred tax assets on unused tax losses and other temporary differences are recognized to the extent it is probable that taxable profit is available.
The positions taken in tax returns are evaluated periodically by the man-agement to identify situations in which applicable tax regulation is subject to interpretation. Based on the evaluation, provisions for the uncertain tax posi-tions are recognized when it is consid-ered more likely than not that certain tax positions will be challenged by the tax authorities. The amounts recorded are based upon the estimated final taxes to be paid to the tax authorities.
Accounting principles
Earnings per shareBasic earnings per share is calculated by dividing the net profit attributable to shareholders of the parent company by the weighted average number of ordinary shares in issue during the year, excluding ordinary shares purchased by the Group and held own shares. Diluted earnings per share reflect the possible impact of the share-based incentive plans and option rights.
KONE 2016 Annual Review | Notes to the consolidated financial statements | Financial performance
30
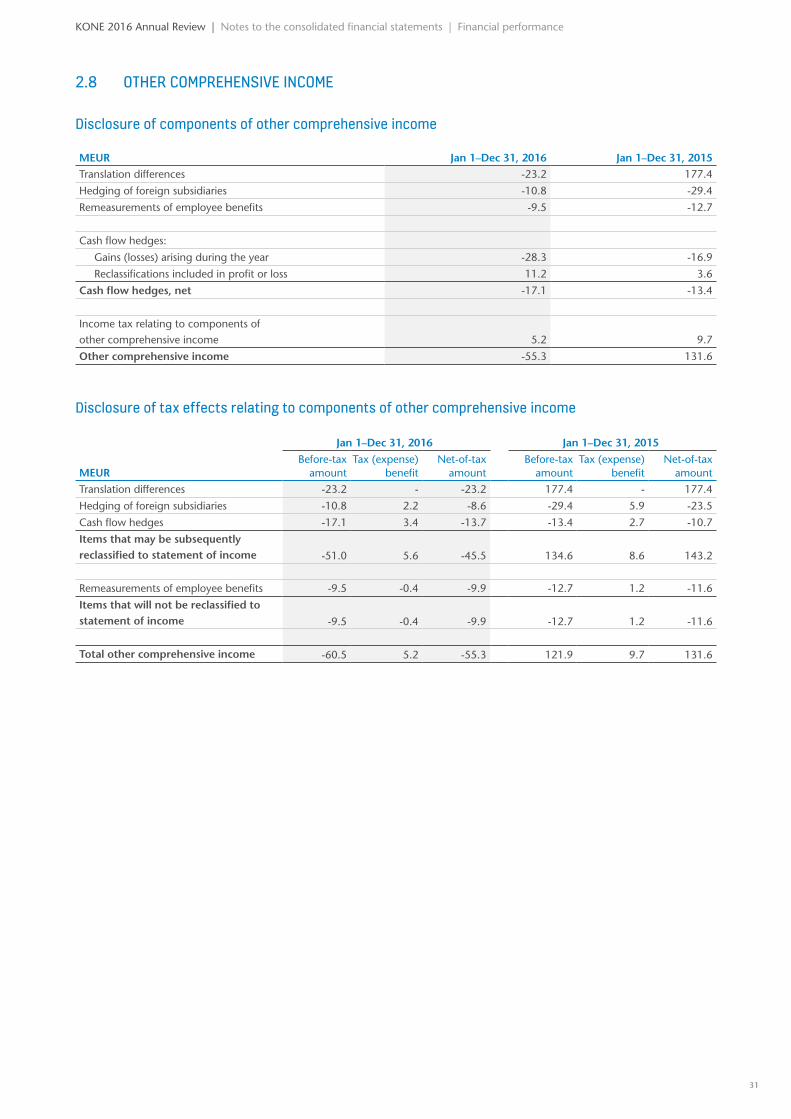
2.8 OTHER COMPREHENSIVE INCOME
Disclosure of components of other comprehensive income
MEUR Jan 1–Dec 31, 2016 Jan 1–Dec 31, 2015Translation differences -23.2 177.4
Hedging of foreign subsidiaries -10.8 -29.4
Remeasurements of employee benefits -9.5 -12.7
Cash flow hedges:
Gains (losses) arising during the year -28.3 -16.9
Reclassifications included in profit or loss 11.2 3.6
Cash flow hedges, net -17.1 -13.4
Income tax relating to components of other comprehensive income 5.2 9.7
Other comprehensive income -55.3 131.6
Disclosure of tax effects relating to components of other comprehensive income
MEUR
Jan 1–Dec 31, 2016 Jan 1–Dec 31, 2015
Before-tax amount
Tax (expense) benefit
Net-of-tax amount
Before-tax amount
Tax (expense) benefit
Net-of-tax amount
Translation differences -23.2 - -23.2 177.4 - 177.4
Hedging of foreign subsidiaries -10.8 2.2 -8.6 -29.4 5.9 -23.5
Cash flow hedges -17.1 3.4 -13.7 -13.4 2.7 -10.7
Items that may be subsequently reclassified to statement of income -51.0 5.6 -45.5 134.6 8.6 143.2
Remeasurements of employee benefits -9.5 -0.4 -9.9 -12.7 1.2 -11.6
Items that will not be reclassified to statement of income -9.5 -0.4 -9.9 -12.7 1.2 -11.6
Total other comprehensive income -60.5 5.2 -55.3 121.9 9.7 131.6
KONE 2016 Annual Review | Notes to the consolidated financial statements | Financial performance
31
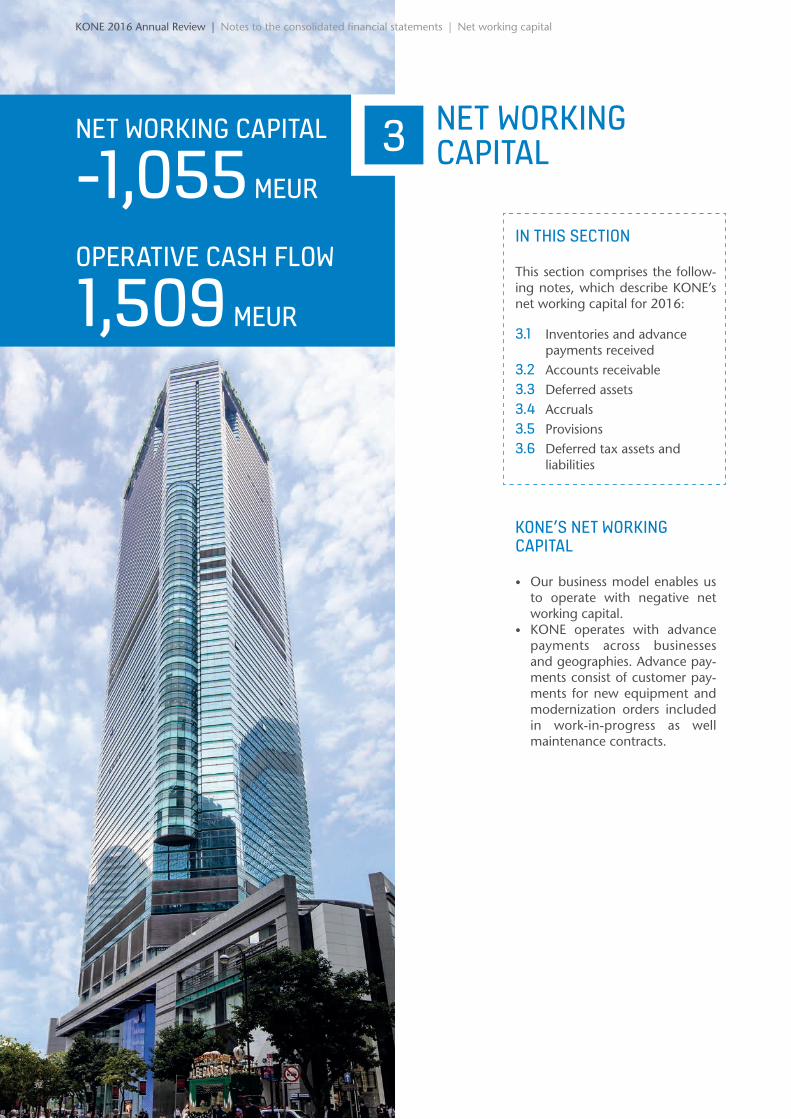
3
IN THIS SECTION
This section comprises the follow-ing notes, which describe KONE’s net working capital for 2016:
3.1 Inventories and advance payments received
3.2 Accounts receivable3.3 Deferred assets3.4 Accruals3.5 Provisions3.6 Deferred tax assets and
liabilities
KONE’S NET WORKING CAPITAL
• Our business model enables us to operate with negative net working capital.
• KONE operates with advance payments across businesses and geographies. Advance pay-ments consist of customer pay-ments for new equipment and modernization orders included in work-in-progress as well maintenance contracts.
-1,055 MEUR
NET WORKING CAPITAL
1,509 MEUR
OPERATIVE CASH FLOW
NET WORKING CAPITAL
KONE 2016 Annual Review | Notes to the consolidated financial statements | Net working capital
32
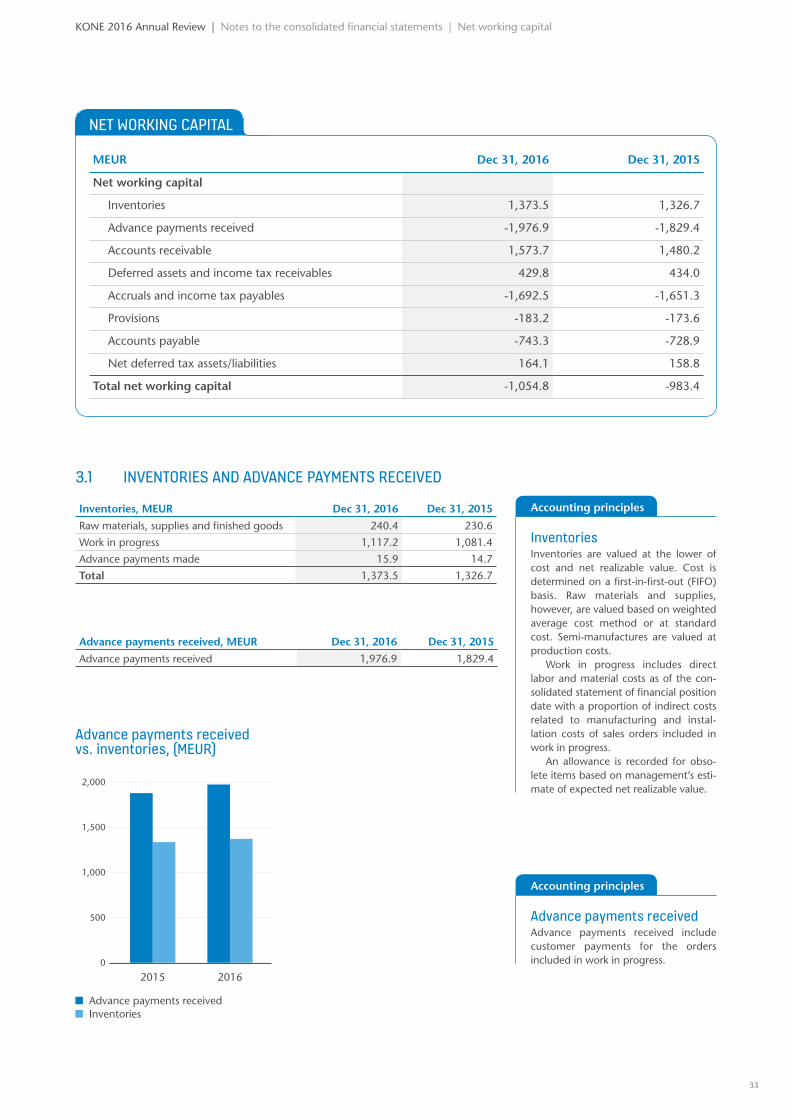
20162015
NET WORKING CAPITAL
MEUR Dec 31, 2016 Dec 31, 2015
Net working capital
Inventories 1,373.5 1,326.7
Advance payments received -1,976.9 -1,829.4
Accounts receivable 1,573.7 1,480.2
Deferred assets and income tax receivables 429.8 434.0
Accruals and income tax payables -1,692.5 -1,651.3
Provisions -183.2 -173.6
Accounts payable -743.3 -728.9
Net deferred tax assets/liabilities 164.1 158.8
Total net working capital -1,054.8 -983.4
3.1 INVENTORIES AND ADVANCE PAYMENTS RECEIVED
Inventories, MEUR Dec 31, 2016 Dec 31, 2015
Raw materials, supplies and finished goods 240.4 230.6
Work in progress 1,117.2 1,081.4
Advance payments made 15.9 14.7
Total 1,373.5 1,326.7
Advance payments received, MEUR Dec 31, 2016 Dec 31, 2015
Advance payments received 1,976.9 1,829.4
Accounting principles
InventoriesInventories are valued at the lower of cost and net realizable value. Cost is determined on a first-in-first-out (FIFO) basis. Raw materials and supplies, however, are valued based on weighted average cost method or at standard cost. Semi-manufactures are valued at production costs.
Work in progress includes direct labor and material costs as of the con-solidated statement of financial position date with a proportion of indirect costs related to manufacturing and instal-lation costs of sales orders included in work in progress.
An allowance is recorded for obso-lete items based on management’s esti-mate of expected net realizable value.
Accounting principles
Advance payments receivedAdvance payments received include customer payments for the orders included in work in progress.
KONE 2016 Annual Review | Notes to the consolidated financial statements | Net working capital
Advance payments received vs. inventories, (MEUR)
2,000
1,500
1,000
500
0
Advance payments received Inventories
33
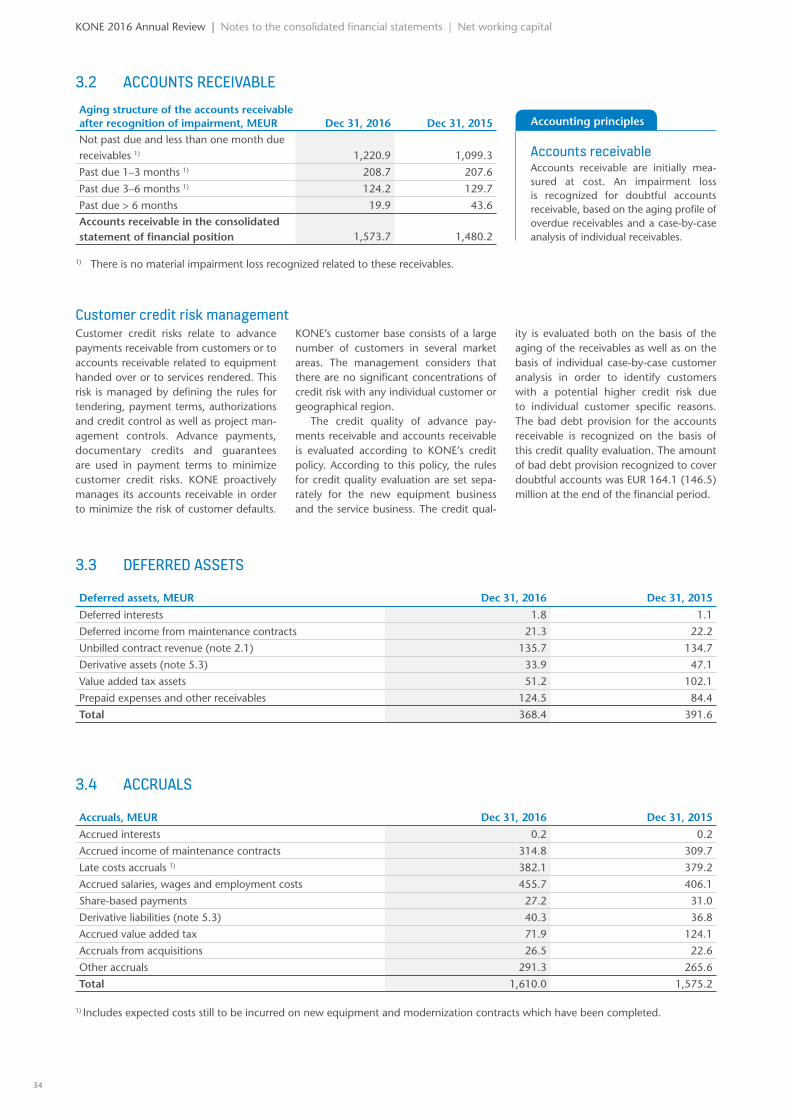
3.3 DEFERRED ASSETS
Deferred assets, MEUR Dec 31, 2016 Dec 31, 2015
Deferred interests 1.8 1.1
Deferred income from maintenance contracts 21.3 22.2
Unbilled contract revenue (note 2.1) 135.7 134.7
Derivative assets (note 5.3) 33.9 47.1
Value added tax assets 51.2 102.1
Prepaid expenses and other receivables 124.5 84.4
Total 368.4 391.6
3.4 ACCRUALS
Accruals, MEUR Dec 31, 2016 Dec 31, 2015
Accrued interests 0.2 0.2
Accrued income of maintenance contracts 314.8 309.7
Late costs accruals 1) 382.1 379.2
Accrued salaries, wages and employment costs 455.7 406.1
Share-based payments 27.2 31.0
Derivative liabilities (note 5.3) 40.3 36.8
Accrued value added tax 71.9 124.1
Accruals from acquisitions 26.5 22.6
Other accruals 291.3 265.6
Total 1,610.0 1,575.2
1) Includes expected costs still to be incurred on new equipment and modernization contracts which have been completed.
3.2 ACCOUNTS RECEIVABLEAging structure of the accounts receivable after recognition of impairment, MEUR Dec 31, 2016 Dec 31, 2015Not past due and less than one month due receivables 1) 1,220.9 1,099.3
Past due 1–3 months 1) 208.7 207.6
Past due 3–6 months 1) 124.2 129.7
Past due > 6 months 19.9 43.6Accounts receivable in the consolidated statement of financial position 1,573.7 1,480.2
1) There is no material impairment loss recognized related to these receivables.
Accounting principles
Accounts receivableAccounts receivable are initially mea-sured at cost. An impairment loss is recognized for doubtful accounts receivable, based on the aging profile of overdue receivables and a case-by-case analysis of individual receivables.
KONE 2016 Annual Review | Notes to the consolidated financial statements | Net working capital
Customer credit risk managementCustomer credit risks relate to advance payments receivable from customers or to accounts receivable related to equipment handed over or to services rendered. This risk is managed by defining the rules for tendering, payment terms, authorizations and credit control as well as project man-agement controls. Advance payments, documentary credits and guarantees are used in payment terms to minimize customer credit risks. KONE proactively manages its accounts receivable in order to minimize the risk of customer defaults.
KONE’s customer base consists of a large number of customers in several market areas. The management considers that there are no significant concentrations of credit risk with any individual customer or geographical region.
The credit quality of advance pay-ments receivable and accounts receivable is evaluated according to KONE’s credit policy. According to this policy, the rules for credit quality evaluation are set sepa-rately for the new equipment business and the service business. The credit qual-
ity is evaluated both on the basis of the aging of the receivables as well as on the basis of individual case-by-case customer analysis in order to identify customers with a potential higher credit risk due to individual customer specific reasons. The bad debt provision for the accounts receivable is recognized on the basis of this credit quality evaluation. The amount of bad debt provision recognized to cover doubtful accounts was EUR 164.1 (146.5) million at the end of the financial period.
34
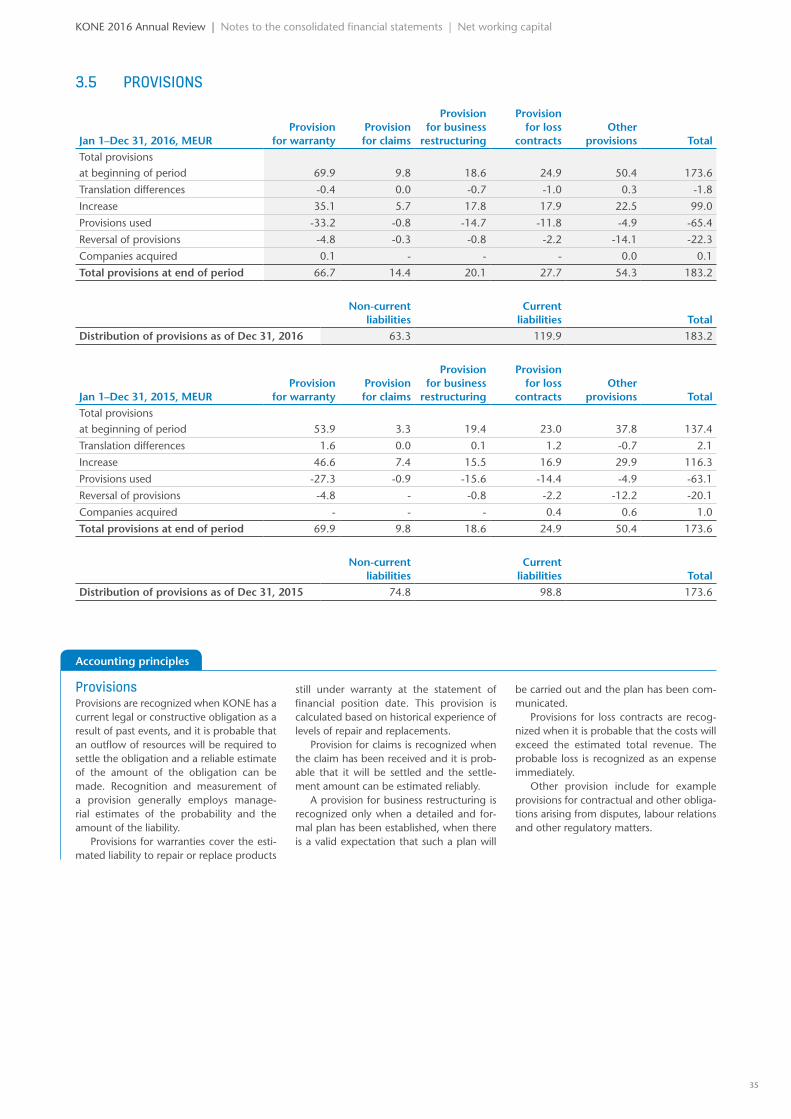
3.5 PROVISIONS
Jan 1–Dec 31, 2016, MEURProvision
for warrantyProvision for claims
Provision for business
restructuring
Provision for loss
contractsOther
provisions TotalTotal provisions at beginning of period 69.9 9.8 18.6 24.9 50.4 173.6
Translation differences -0.4 0.0 -0.7 -1.0 0.3 -1.8
Increase 35.1 5.7 17.8 17.9 22.5 99.0
Provisions used -33.2 -0.8 -14.7 -11.8 -4.9 -65.4
Reversal of provisions -4.8 -0.3 -0.8 -2.2 -14.1 -22.3
Companies acquired 0.1 - - - 0.0 0.1
Total provisions at end of period 66.7 14.4 20.1 27.7 54.3 183.2
Non-current
liabilitiesCurrent
liabilities TotalDistribution of provisions as of Dec 31, 2016 63.3 119.9 183.2
Jan 1–Dec 31, 2015, MEURProvision
for warrantyProvision for claims
Provision for business
restructuring
Provision for loss
contractsOther
provisions TotalTotal provisions at beginning of period 53.9 3.3 19.4 23.0 37.8 137.4
Translation differences 1.6 0.0 0.1 1.2 -0.7 2.1
Increase 46.6 7.4 15.5 16.9 29.9 116.3
Provisions used -27.3 -0.9 -15.6 -14.4 -4.9 -63.1
Reversal of provisions -4.8 - -0.8 -2.2 -12.2 -20.1
Companies acquired - - - 0.4 0.6 1.0
Total provisions at end of period 69.9 9.8 18.6 24.9 50.4 173.6
Non-current
liabilitiesCurrent
liabilities TotalDistribution of provisions as of Dec 31, 2015 74.8 98.8 173.6
Accounting principles
KONE 2016 Annual Review | Notes to the consolidated financial statements | Net working capital
Provisions Provisions are recognized when KONE has a current legal or constructive obligation as a result of past events, and it is probable that an outflow of resources will be required to settle the obligation and a reliable estimate of the amount of the obligation can be made. Recognition and measurement of a provision generally employs manage-rial estimates of the probability and the amount of the liability.
Provisions for warranties cover the esti-mated liability to repair or replace products
still under warranty at the statement of financial position date. This provision is calculated based on historical experience of levels of repair and replacements.
Provision for claims is recognized when the claim has been received and it is prob-able that it will be settled and the settle-ment amount can be estimated reliably.
A provision for business restructuring is recognized only when a detailed and for-mal plan has been established, when there is a valid expectation that such a plan will
be carried out and the plan has been com-municated.
Provisions for loss contracts are recog-nized when it is probable that the costs will exceed the estimated total revenue. The probable loss is recognized as an expense immediately.
Other provision include for example provisions for contractual and other obliga-tions arising from disputes, labour relations and other regulatory matters.
35
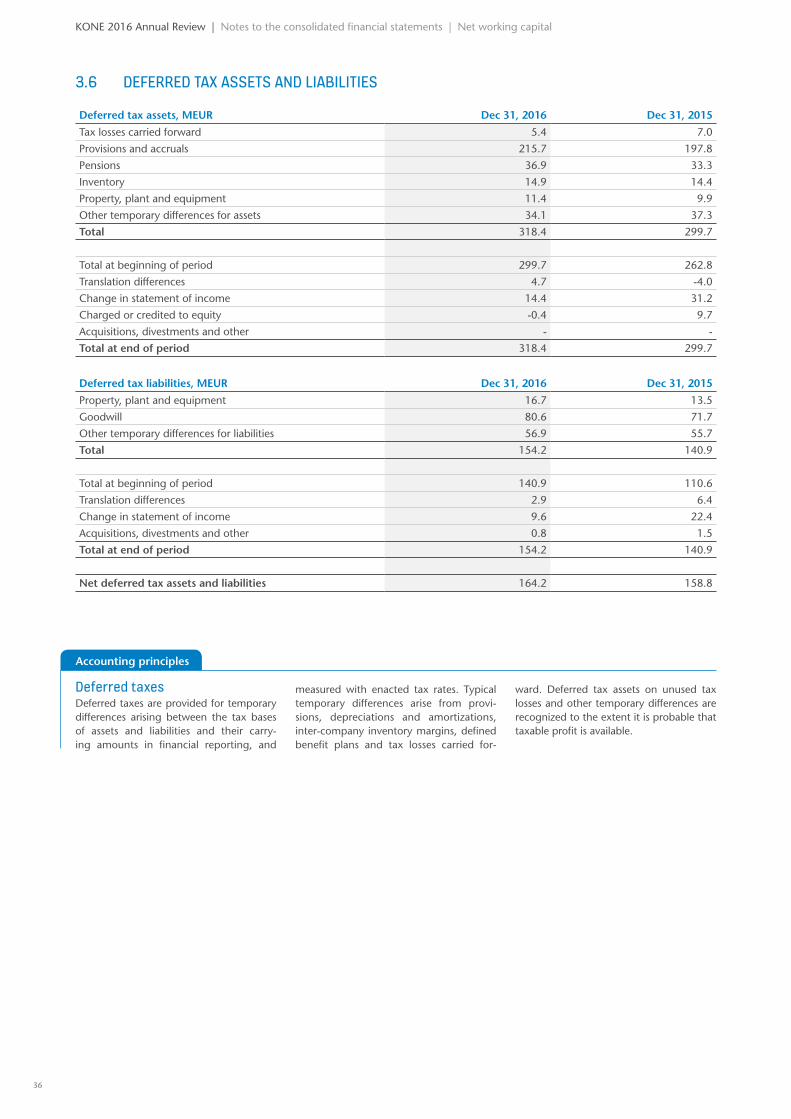
3.6 DEFERRED TAX ASSETS AND LIABILITIES
Deferred tax assets, MEUR Dec 31, 2016 Dec 31, 2015
Tax losses carried forward 5.4 7.0
Provisions and accruals 215.7 197.8
Pensions 36.9 33.3
Inventory 14.9 14.4
Property, plant and equipment 11.4 9.9
Other temporary differences for assets 34.1 37.3
Total 318.4 299.7
Total at beginning of period 299.7 262.8
Translation differences 4.7 -4.0
Change in statement of income 14.4 31.2
Charged or credited to equity -0.4 9.7
Acquisitions, divestments and other - -
Total at end of period 318.4 299.7
Deferred tax liabilities, MEUR Dec 31, 2016 Dec 31, 2015
Property, plant and equipment 16.7 13.5
Goodwill 80.6 71.7
Other temporary differences for liabilities 56.9 55.7
Total 154.2 140.9
Total at beginning of period 140.9 110.6
Translation differences 2.9 6.4
Change in statement of income 9.6 22.4
Acquisitions, divestments and other 0.8 1.5
Total at end of period 154.2 140.9
Net deferred tax assets and liabilities 164.2 158.8
Accounting principles
KONE 2016 Annual Review | Notes to the consolidated financial statements | Net working capital
Deferred taxes Deferred taxes are provided for temporary differences arising between the tax bases of assets and liabilities and their carry-ing amounts in financial reporting, and
measured with enacted tax rates. Typical temporary differences arise from provi-sions, depreciations and amortizations, inter-company inventory margins, defined benefit plans and tax losses carried for-
ward. Deferred tax assets on unused tax losses and other temporary differences are recognized to the extent it is probable that taxable profit is available.
36
4227 MEUR
ACQUISITIONSAND CAPEX
19 COMPLETED ACQUISITIONS
IN THIS SECTION
This section comprises the following notes, which describe acquisitions and capital expenditure at KONE for 2016:
4.1 Acquisitions4.2 Goodwill4.3 Other intangible assets4.4 Property, plant and equipment
ACQUISITIONS AND CAPITAL EXPENDITURE AT KONE
• KONE’s business is capital-light and labor-intensive in nature, particularly in services. On the new equipment side, a large share of production is outsourced to component suppliers. As a result, the level of tangible and intangible assets is relatively low in the business.
• Capital expenditure is mainly related to R&D, IT, production and business opera-tions.
• The majority of KONE’s acquisitions in 2016 consisted of small maintenance companies in Europe and North America.
ACQUISITIONS AND CAPITAL EXPENDITURE
KONE’s capital expenditure 1.5% of
sales in 2016
KONE 2016 Annual Review | Notes to the consolidated financial statements | Capital expenditure and acquisitions
37
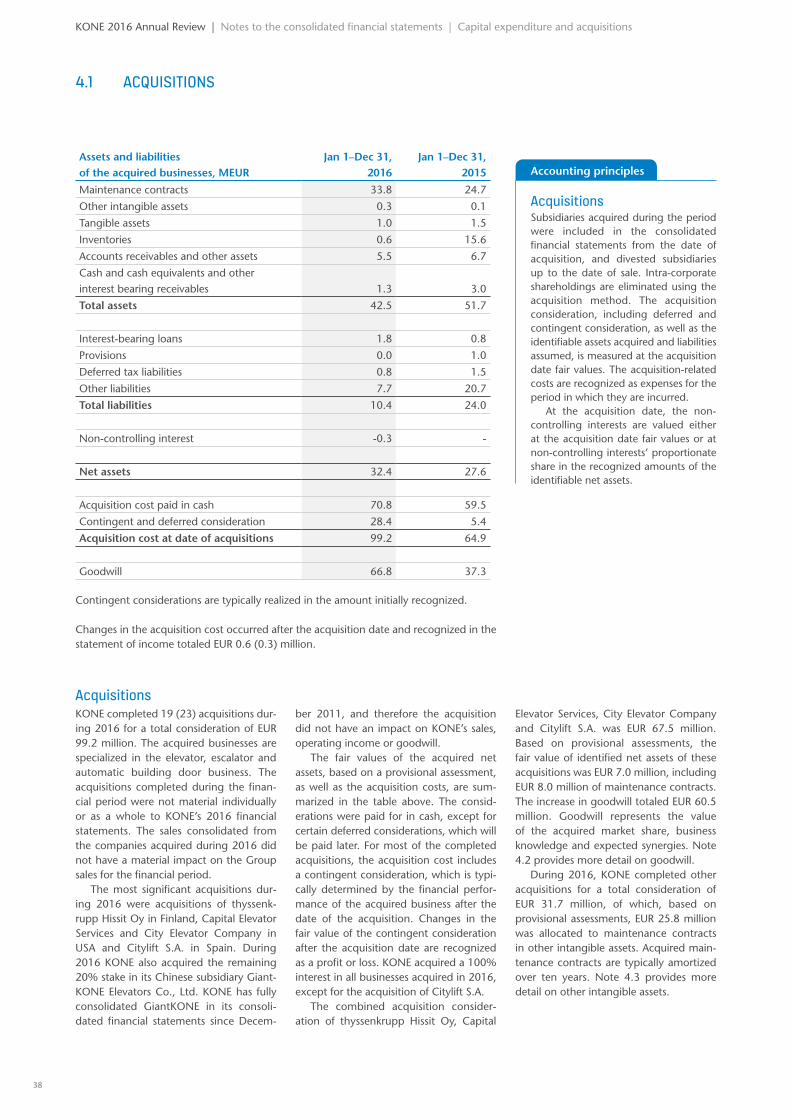
Assets and liabilities of the acquired businesses, MEUR
Jan 1–Dec 31, 2016
Jan 1–Dec 31, 2015
Maintenance contracts 33.8 24.7
Other intangible assets 0.3 0.1
Tangible assets 1.0 1.5
Inventories 0.6 15.6
Accounts receivables and other assets 5.5 6.7
Cash and cash equivalents and other interest bearing receivables 1.3 3.0
Total assets 42.5 51.7
Interest-bearing loans 1.8 0.8
Provisions 0.0 1.0
Deferred tax liabilities 0.8 1.5
Other liabilities 7.7 20.7
Total liabilities 10.4 24.0
Non-controlling interest -0.3 -
Net assets 32.4 27.6
Acquisition cost paid in cash 70.8 59.5
Contingent and deferred consideration 28.4 5.4
Acquisition cost at date of acquisitions 99.2 64.9
Goodwill 66.8 37.3
Contingent considerations are typically realized in the amount initially recognized.
Changes in the acquisition cost occurred after the acquisition date and recognized in the statement of income totaled EUR 0.6 (0.3) million.
Acquisitions KONE completed 19 (23) acquisitions dur-ing 2016 for a total consideration of EUR 99.2 million. The acquired businesses are specialized in the elevator, escalator and automatic building door business. The acquisitions completed during the finan-cial period were not material individually or as a whole to KONE’s 2016 financial statements. The sales consolidated from the companies acquired during 2016 did not have a material impact on the Group sales for the financial period.
The most significant acquisitions dur-ing 2016 were acquisitions of thyssenk-rupp Hissit Oy in Finland, Capital Elevator Services and City Elevator Company in USA and Citylift S.A. in Spain. During 2016 KONE also acquired the remaining 20% stake in its Chinese subsidiary Giant-KONE Elevators Co., Ltd. KONE has fully consolidated GiantKONE in its consoli-dated financial statements since Decem-
ber 2011, and therefore the acquisition did not have an impact on KONE’s sales, operating income or goodwill.
The fair values of the acquired net assets, based on a provisional assessment, as well as the acquisition costs, are sum-marized in the table above. The consid-erations were paid for in cash, except for certain deferred considerations, which will be paid later. For most of the completed acquisitions, the acquisition cost includes a contingent consideration, which is typi-cally determined by the financial perfor-mance of the acquired business after the date of the acquisition. Changes in the fair value of the contingent consideration after the acquisition date are recognized as a profit or loss. KONE acquired a 100% interest in all businesses acquired in 2016, except for the acquisition of Citylift S.A.
The combined acquisition consider-ation of thyssenkrupp Hissit Oy, Capital
Elevator Services, City Elevator Company and Citylift S.A. was EUR 67.5 million. Based on provisional assessments, the fair value of identified net assets of these acquisitions was EUR 7.0 million, including EUR 8.0 million of maintenance contracts. The increase in goodwill totaled EUR 60.5 million. Goodwill represents the value of the acquired market share, business knowledge and expected synergies. Note 4.2 provides more detail on goodwill.
During 2016, KONE completed other acquisitions for a total consideration of EUR 31.7 million, of which, based on provisional assessments, EUR 25.8 million was allocated to maintenance contracts in other intangible assets. Acquired main-tenance contracts are typically amortized over ten years. Note 4.3 provides more detail on other intangible assets.
4.1 ACQUISITIONS
Accounting principles
Acquisitions Subsidiaries acquired during the period were included in the consolidated financial statements from the date of acquisition, and divested subsidiaries up to the date of sale. Intra-corporate shareholdings are eliminated using the acquisition method. The acquisition consideration, including deferred and contingent consideration, as well as the identifiable assets acquired and liabilities assumed, is measured at the acquisition date fair values. The acquisition-related costs are recognized as expenses for the period in which they are incurred.
At the acquisition date, the non-controlling interests are valued either at the acquisition date fair values or at non-controlling interests’ proportionate share in the recognized amounts of the identifiable net assets.
KONE 2016 Annual Review | Notes to the consolidated financial statements | Capital expenditure and acquisitions
38
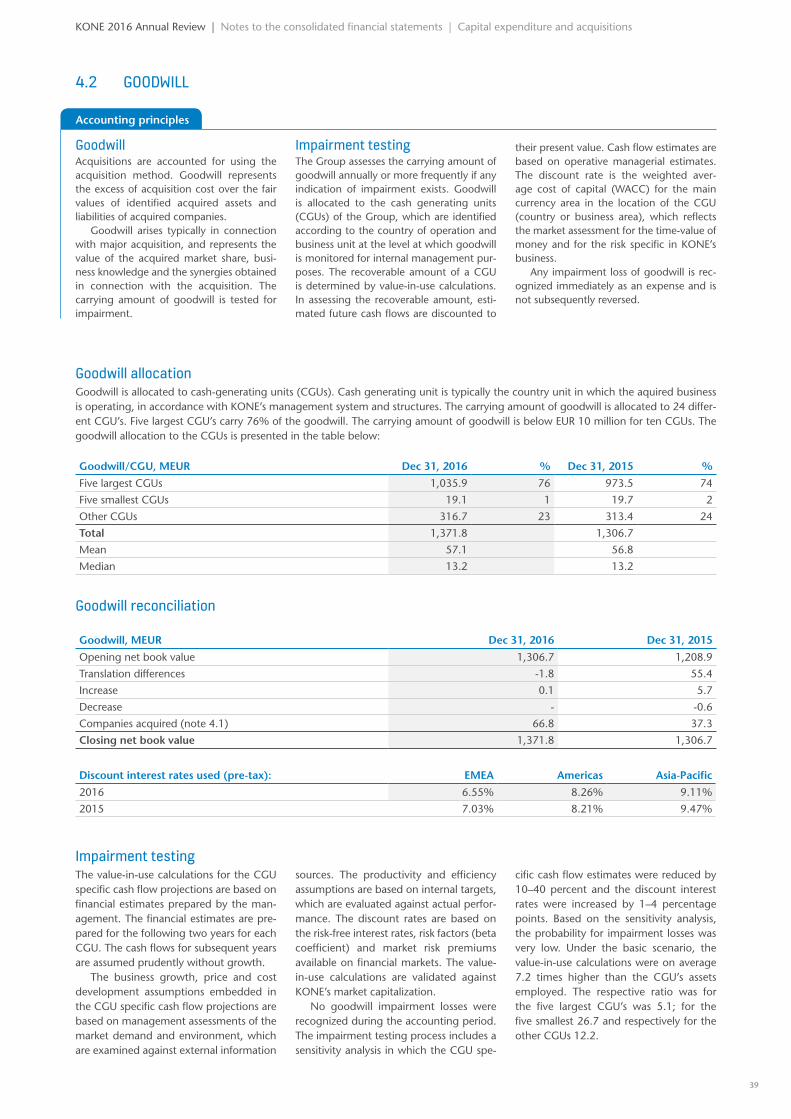
4.2 GOODWILL
Goodwill allocationGoodwill is allocated to cash-generating units (CGUs). Cash generating unit is typically the country unit in which the aquired business is operating, in accordance with KONE’s management system and structures. The carrying amount of goodwill is allocated to 24 differ-ent CGU’s. Five largest CGU’s carry 76% of the goodwill. The carrying amount of goodwill is below EUR 10 million for ten CGUs. The goodwill allocation to the CGUs is presented in the table below:
Goodwill/CGU, MEUR Dec 31, 2016 % Dec 31, 2015 %
Five largest CGUs 1,035.9 76 973.5 74
Five smallest CGUs 19.1 1 19.7 2
Other CGUs 316.7 23 313.4 24
Total 1,371.8 1,306.7
Mean 57.1 56.8
Median 13.2 13.2
Goodwill reconciliation
Goodwill, MEUR Dec 31, 2016 Dec 31, 2015
Opening net book value 1,306.7 1,208.9
Translation differences -1.8 55.4
Increase 0.1 5.7
Decrease - -0.6
Companies acquired (note 4.1) 66.8 37.3
Closing net book value 1,371.8 1,306.7
Discount interest rates used (pre-tax): EMEA Americas Asia-Pacific
2016 6.55% 8.26% 9.11%
2015 7.03% 8.21% 9.47%
Impairment testingThe value-in-use calculations for the CGU specific cash flow projections are based on financial estimates prepared by the man-agement. The financial estimates are pre-pared for the following two years for each CGU. The cash flows for subsequent years are assumed prudently without growth.
The business growth, price and cost development assumptions embedded in the CGU specific cash flow projections are based on management assessments of the market demand and environment, which are examined against external information
sources. The productivity and efficiency assumptions are based on internal targets, which are evaluated against actual perfor-mance. The discount rates are based on the risk-free interest rates, risk factors (beta coefficient) and market risk premiums available on financial markets. The value-in-use calculations are validated against KONE’s market capitalization.
No goodwill impairment losses were recognized during the accounting period. The impairment testing process includes a sensitivity analysis in which the CGU spe-
cific cash flow estimates were reduced by 10–40 percent and the discount interest rates were increased by 1–4 percentage points. Based on the sensitivity analysis, the probability for impairment losses was very low. Under the basic scenario, the value-in-use calculations were on average 7.2 times higher than the CGU’s assets employed. The respective ratio was for the five largest CGU’s was 5.1; for the five smallest 26.7 and respectively for the other CGUs 12.2.
Goodwill Acquisitions are accounted for using the acquisition method. Goodwill represents the excess of acquisition cost over the fair values of identified acquired assets and liabilities of acquired companies.
Goodwill arises typically in connection with major acquisition, and represents the value of the acquired market share, busi-ness knowledge and the synergies obtained in connection with the acquisition. The carrying amount of goodwill is tested for impairment.
Impairment testingThe Group assesses the carrying amount of goodwill annually or more frequently if any indication of impairment exists. Goodwill is allocated to the cash generating units (CGUs) of the Group, which are identified according to the country of operation and business unit at the level at which goodwill is monitored for internal management pur-poses. The recoverable amount of a CGU is determined by value-in-use calculations. In assessing the recoverable amount, esti-mated future cash flows are discounted to
their present value. Cash flow estimates are based on operative managerial estimates. The discount rate is the weighted aver-age cost of capital (WACC) for the main currency area in the location of the CGU (country or business area), which reflects the market assessment for the time-value of money and for the risk specific in KONE’s business.
Any impairment loss of goodwill is rec-ognized immediately as an expense and is not subsequently reversed.
Accounting principles
KONE 2016 Annual Review | Notes to the consolidated financial statements | Capital expenditure and acquisitions
39
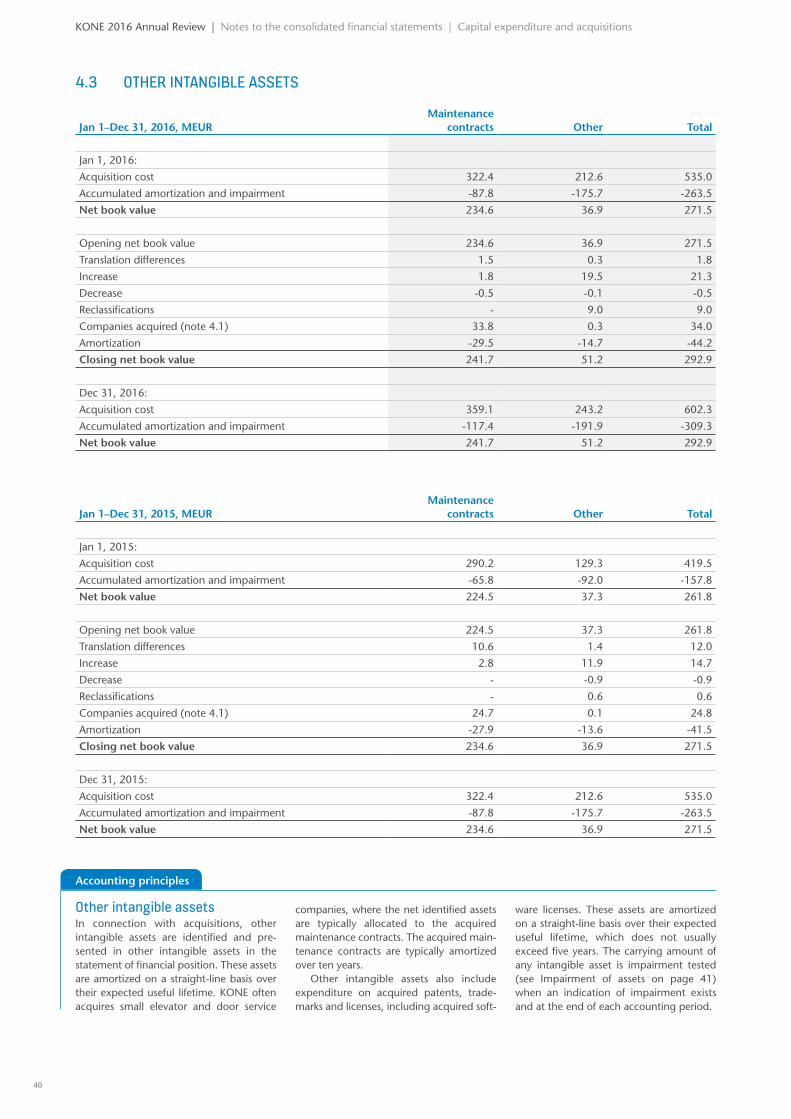
4.3 OTHER INTANGIBLE ASSETS
Jan 1–Dec 31, 2016, MEURMaintenance
contracts Other Total
Jan 1, 2016:
Acquisition cost 322.4 212.6 535.0
Accumulated amortization and impairment -87.8 -175.7 -263.5
Net book value 234.6 36.9 271.5
Opening net book value 234.6 36.9 271.5
Translation differences 1.5 0.3 1.8
Increase 1.8 19.5 21.3
Decrease -0.5 -0.1 -0.5
Reclassifications - 9.0 9.0
Companies acquired (note 4.1) 33.8 0.3 34.0
Amortization -29.5 -14.7 -44.2
Closing net book value 241.7 51.2 292.9
Dec 31, 2016:
Acquisition cost 359.1 243.2 602.3
Accumulated amortization and impairment -117.4 -191.9 -309.3
Net book value 241.7 51.2 292.9
Jan 1–Dec 31, 2015, MEURMaintenance
contracts Other Total
Jan 1, 2015:
Acquisition cost 290.2 129.3 419.5
Accumulated amortization and impairment -65.8 -92.0 -157.8
Net book value 224.5 37.3 261.8
Opening net book value 224.5 37.3 261.8
Translation differences 10.6 1.4 12.0
Increase 2.8 11.9 14.7
Decrease - -0.9 -0.9
Reclassifications - 0.6 0.6
Companies acquired (note 4.1) 24.7 0.1 24.8
Amortization -27.9 -13.6 -41.5
Closing net book value 234.6 36.9 271.5
Dec 31, 2015:
Acquisition cost 322.4 212.6 535.0
Accumulated amortization and impairment -87.8 -175.7 -263.5
Net book value 234.6 36.9 271.5
Other intangible assetsIn connection with acquisitions, other intangible assets are identified and pre-sented in other intangible assets in the statement of financial position. These assets are amortized on a straight-line basis over their expected useful lifetime. KONE often acquires small elevator and door service
companies, where the net identified assets are typically allocated to the acquired maintenance contracts. The acquired main-tenance contracts are typically amortized over ten years.
Other intangible assets also include expenditure on acquired patents, trade-marks and licenses, including acquired soft-
ware licenses. These assets are amortized on a straight-line basis over their expected useful lifetime, which does not usually exceed five years. The carrying amount of any intangible asset is impairment tested (see Impairment of assets on page 41) when an indication of impairment exists and at the end of each accounting period.
Accounting principles
KONE 2016 Annual Review | Notes to the consolidated financial statements | Capital expenditure and acquisitions
40
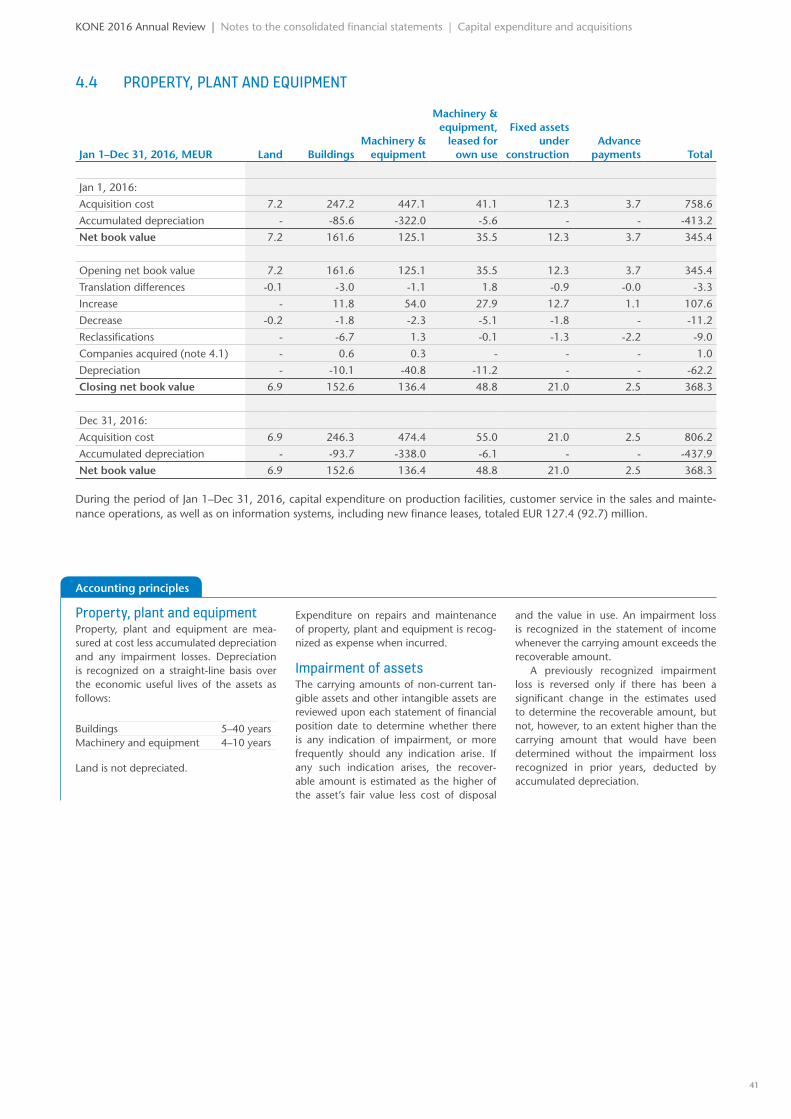
4.4 PROPERTY, PLANT AND EQUIPMENT
Jan 1–Dec 31, 2016, MEUR Land BuildingsMachinery &
equipment
Machinery & equipment,
leased for own use
Fixed assets under
construction Advance
payments Total
Jan 1, 2016:
Acquisition cost 7.2 247.2 447.1 41.1 12.3 3.7 758.6
Accumulated depreciation - -85.6 -322.0 -5.6 - - -413.2
Net book value 7.2 161.6 125.1 35.5 12.3 3.7 345.4
Opening net book value 7.2 161.6 125.1 35.5 12.3 3.7 345.4
Translation differences -0.1 -3.0 -1.1 1.8 -0.9 -0.0 -3.3
Increase - 11.8 54.0 27.9 12.7 1.1 107.6
Decrease -0.2 -1.8 -2.3 -5.1 -1.8 - -11.2
Reclassifications - -6.7 1.3 -0.1 -1.3 -2.2 -9.0
Companies acquired (note 4.1) - 0.6 0.3 - - - 1.0
Depreciation - -10.1 -40.8 -11.2 - - -62.2
Closing net book value 6.9 152.6 136.4 48.8 21.0 2.5 368.3
Dec 31, 2016:
Acquisition cost 6.9 246.3 474.4 55.0 21.0 2.5 806.2
Accumulated depreciation - -93.7 -338.0 -6.1 - - -437.9
Net book value 6.9 152.6 136.4 48.8 21.0 2.5 368.3
During the period of Jan 1–Dec 31, 2016, capital expenditure on production facilities, customer service in the sales and mainte-nance operations, as well as on information systems, including new finance leases, totaled EUR 127.4 (92.7) million.
KONE 2016 Annual Review | Notes to the consolidated financial statements | Capital expenditure and acquisitions
Property, plant and equipmentProperty, plant and equipment are mea-sured at cost less accumulated depreciation and any impairment losses. Depreciation is recognized on a straight-line basis over the economic useful lives of the assets as follows:
Buildings 5–40 yearsMachinery and equipment 4–10 years
Land is not depreciated.
Expenditure on repairs and maintenance of property, plant and equipment is recog-nized as expense when incurred.
Impairment of assetsThe carrying amounts of non-current tan-gible assets and other intangible assets are reviewed upon each statement of financial position date to determine whether there is any indication of impairment, or more frequently should any indication arise. If any such indication arises, the recover-able amount is estimated as the higher of the asset’s fair value less cost of disposal
and the value in use. An impairment loss is recognized in the statement of income whenever the carrying amount exceeds the recoverable amount.
A previously recognized impairment loss is reversed only if there has been a significant change in the estimates used to determine the recoverable amount, but not, however, to an extent higher than the carrying amount that would have been determined without the impairment loss recognized in prior years, deducted by accumulated depreciation.
Accounting principles
41
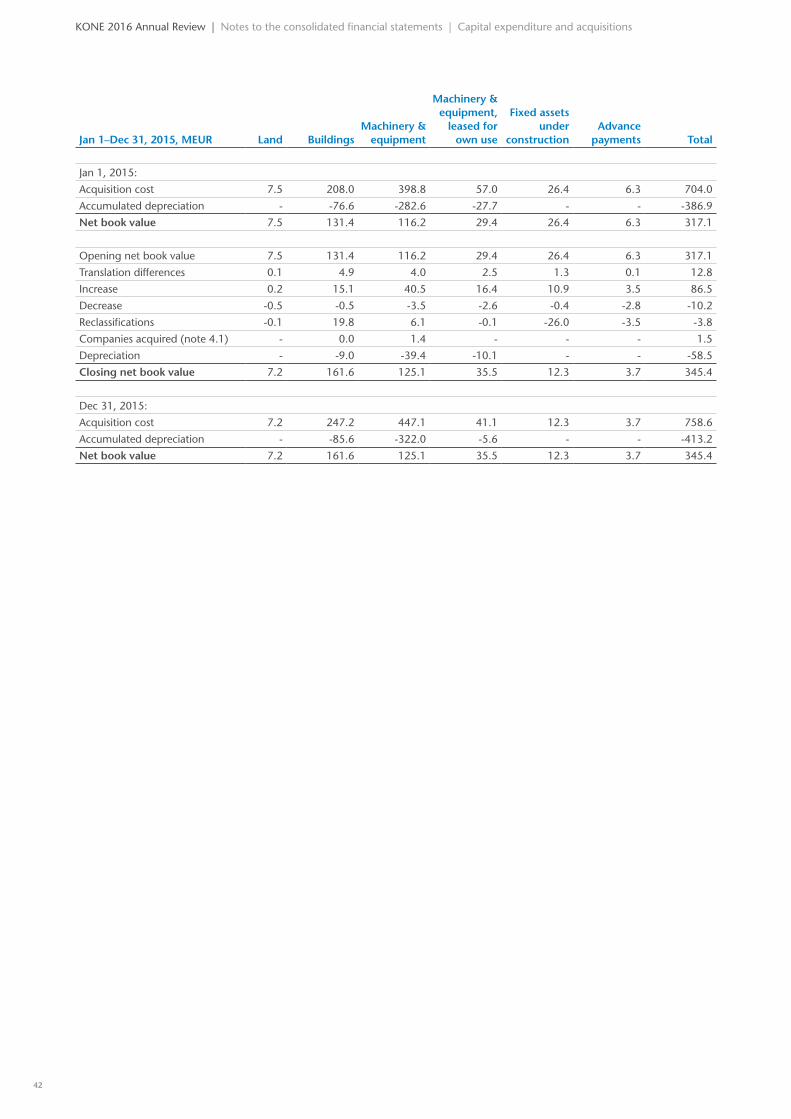
KONE 2016 Annual Review | Notes to the consolidated financial statements | Capital expenditure and acquisitions
Jan 1–Dec 31, 2015, MEUR Land BuildingsMachinery &
equipment
Machinery & equipment,
leased for own use
Fixed assets under
construction Advance
payments Total
Jan 1, 2015:
Acquisition cost 7.5 208.0 398.8 57.0 26.4 6.3 704.0
Accumulated depreciation - -76.6 -282.6 -27.7 - - -386.9
Net book value 7.5 131.4 116.2 29.4 26.4 6.3 317.1
Opening net book value 7.5 131.4 116.2 29.4 26.4 6.3 317.1
Translation differences 0.1 4.9 4.0 2.5 1.3 0.1 12.8
Increase 0.2 15.1 40.5 16.4 10.9 3.5 86.5
Decrease -0.5 -0.5 -3.5 -2.6 -0.4 -2.8 -10.2
Reclassifications -0.1 19.8 6.1 -0.1 -26.0 -3.5 -3.8
Companies acquired (note 4.1) - 0.0 1.4 - - - 1.5
Depreciation - -9.0 -39.4 -10.1 - - -58.5
Closing net book value 7.2 161.6 125.1 35.5 12.3 3.7 345.4
Dec 31, 2015:
Acquisition cost 7.2 247.2 447.1 41.1 12.3 3.7 758.6
Accumulated depreciation - -85.6 -322.0 -5.6 - - -413.2
Net book value 7.2 161.6 125.1 35.5 12.3 3.7 345.4
42
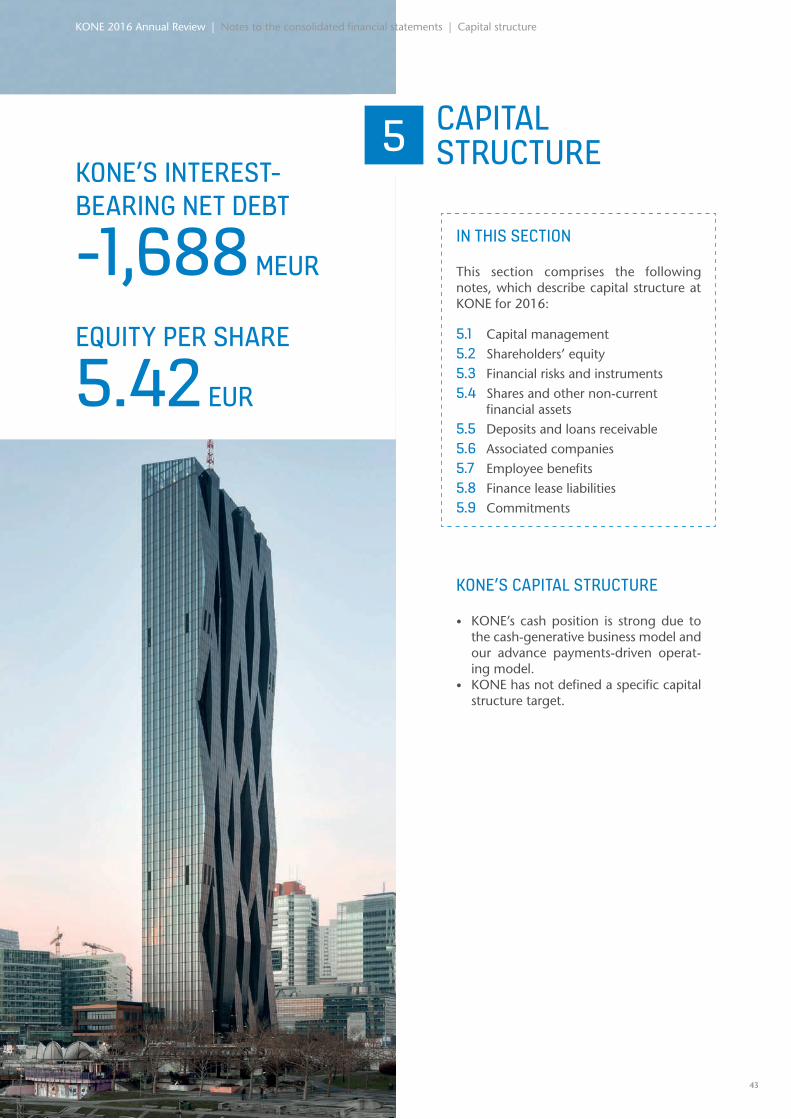
5
-1,688 MEUR
KONE’S INTEREST-BEARING NET DEBT
5.42 EUR
EQUITY PER SHARE
IN THIS SECTION
This section comprises the following notes, which describe capital structure at KONE for 2016:
5.1 Capital management5.2 Shareholders’ equity5.3 Financial risks and instruments5.4 Shares and other non-current
financial assets5.5 Deposits and loans receivable5.6 Associated companies5.7 Employee benefits5.8 Finance lease liabilities5.9 Commitments
KONE’S CAPITAL STRUCTURE
• KONE’s cash position is strong due to the cash-generative business model and our advance payments-driven operat-ing model.
• KONE has not defined a specific capital structure target.
CAPITAL STRUCTURE
KONE 2016 Annual Review | Notes to the consolidated financial statements | Capital structure
43
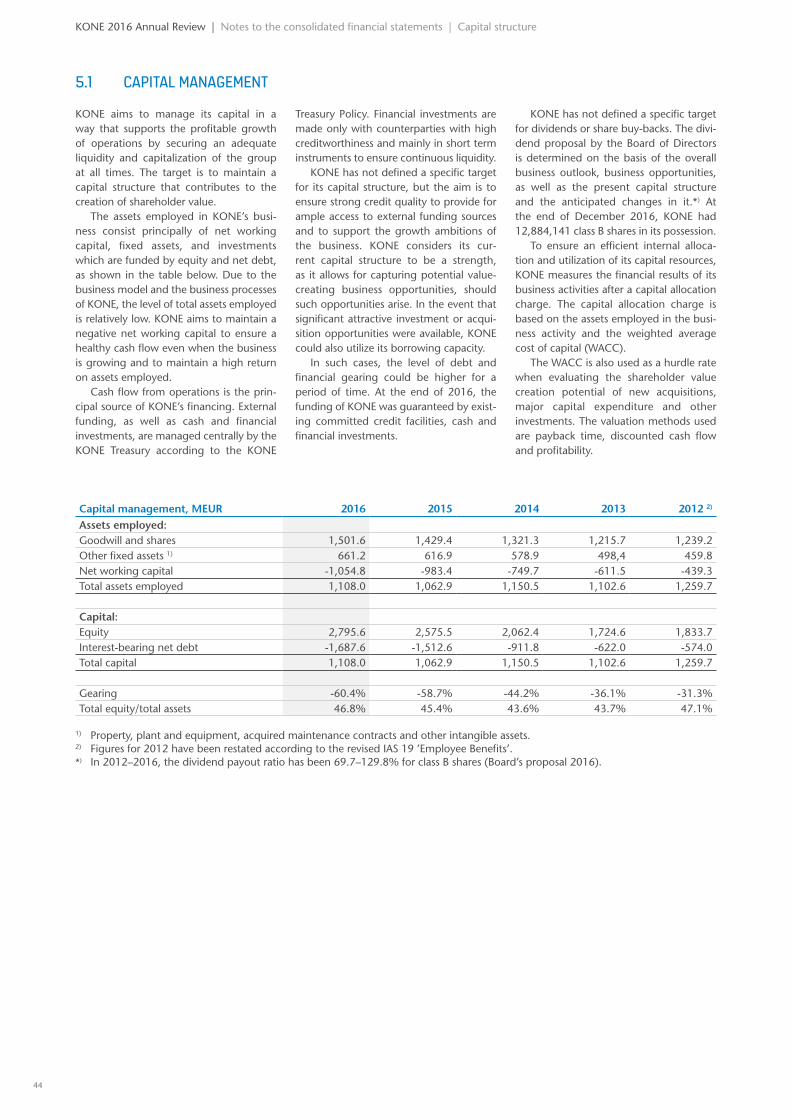
5.1 CAPITAL MANAGEMENT
KONE aims to manage its capital in a way that supports the profitable growth of operations by securing an adequate liquidity and capitalization of the group at all times. The target is to maintain a capital structure that contributes to the creation of shareholder value.
The assets employed in KONE’s busi-ness consist principally of net working capital, fixed assets, and investments which are funded by equity and net debt, as shown in the table below. Due to the business model and the business processes of KONE, the level of total assets employed is relatively low. KONE aims to maintain a negative net working capital to ensure a healthy cash flow even when the business is growing and to maintain a high return on assets employed.
Cash flow from operations is the prin-cipal source of KONE’s financing. External funding, as well as cash and financial investments, are managed centrally by the KONE Treasury according to the KONE
Treasury Policy. Financial investments are made only with counterparties with high creditworthiness and mainly in short term instruments to ensure continuous liquidity.
KONE has not defined a specific target for its capital structure, but the aim is to ensure strong credit quality to provide for ample access to external funding sources and to support the growth ambitions of the business. KONE considers its cur-rent capital structure to be a strength, as it allows for capturing potential value-creating business opportunities, should such opportunities arise. In the event that significant attractive investment or acqui-sition opportunities were available, KONE could also utilize its borrowing capacity.
In such cases, the level of debt and financial gearing could be higher for a period of time. At the end of 2016, the funding of KONE was guaranteed by exist-ing committed credit facilities, cash and financial investments.
KONE has not defined a specific target for dividends or share buy-backs. The divi-dend proposal by the Board of Directors is determined on the basis of the overall business outlook, business opportunities, as well as the present capital structure and the anticipated changes in it.*) At the end of December 2016, KONE had 12,884,141 class B shares in its possession.
To ensure an efficient internal alloca-tion and utilization of its capital resources, KONE measures the financial results of its business activities after a capital allocation charge. The capital allocation charge is based on the assets employed in the busi-ness activity and the weighted average cost of capital (WACC).
The WACC is also used as a hurdle rate when evaluating the shareholder value creation potential of new acquisitions, major capital expenditure and other investments. The valuation methods used are payback time, discounted cash flow and profitability.
Capital management, MEUR 2016 2015 2014 2013 2012 2)
Assets employed:Goodwill and shares 1,501.6 1,429.4 1,321.3 1,215.7 1,239.2Other fixed assets 1) 661.2 616.9 578.9 498,4 459.8Net working capital -1,054.8 -983.4 -749.7 -611.5 -439.3Total assets employed 1,108.0 1,062.9 1,150.5 1,102.6 1,259.7
Capital:Equity 2,795.6 2,575.5 2,062.4 1,724.6 1,833.7Interest-bearing net debt -1,687.6 -1,512.6 -911.8 -622.0 -574.0Total capital 1,108.0 1,062.9 1,150.5 1,102.6 1,259.7
Gearing -60.4% -58.7% -44.2% -36.1% -31.3%Total equity/total assets 46.8% 45.4% 43.6% 43.7% 47.1%
1) Property, plant and equipment, acquired maintenance contracts and other intangible assets.2) Figures for 2012 have been restated according to the revised IAS 19 ’Employee Benefits’.*) In 2012–2016, the dividend payout ratio has been 69.7–129.8% for class B shares (Board’s proposal 2016).
KONE 2016 Annual Review | Notes to the consolidated financial statements | Capital structure
44
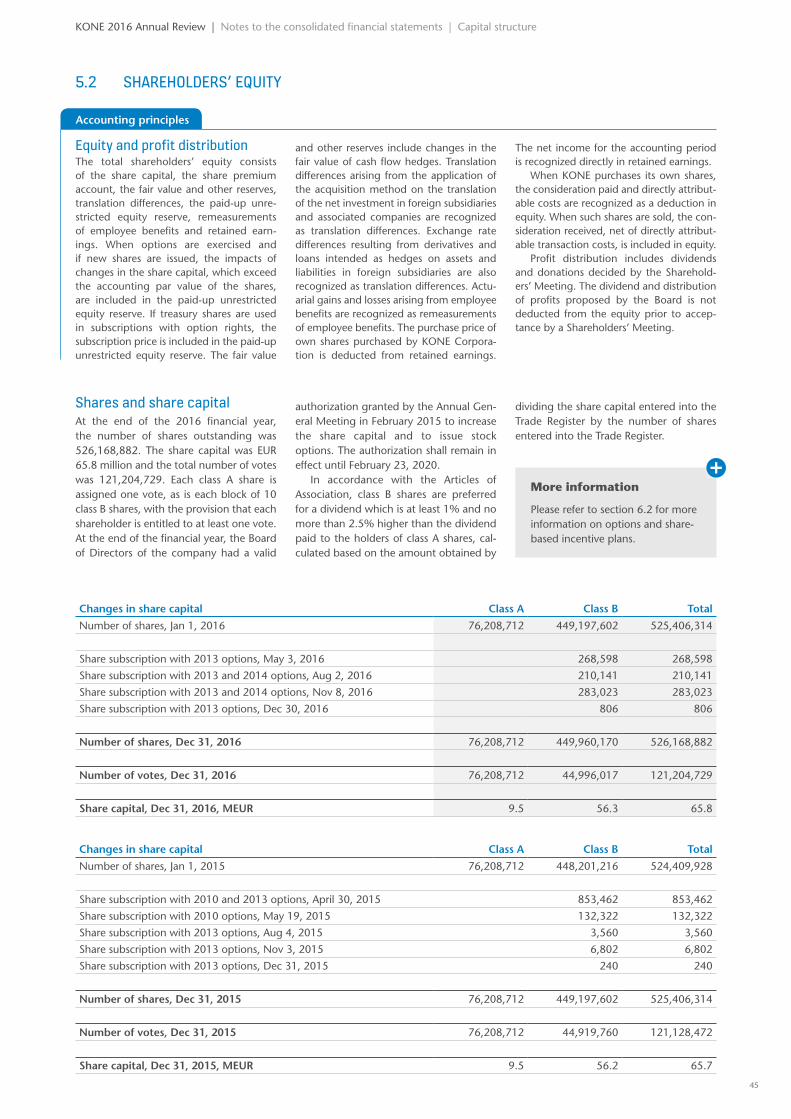
Shares and share capitalAt the end of the 2016 financial year, the number of shares outstanding was 526,168,882. The share capital was EUR 65.8 million and the total number of votes was 121,204,729. Each class A share is assigned one vote, as is each block of 10 class B shares, with the provision that each shareholder is entitled to at least one vote. At the end of the financial year, the Board of Directors of the company had a valid
authorization granted by the Annual Gen-eral Meeting in February 2015 to increase the share capital and to issue stock options. The authorization shall remain in effect until February 23, 2020.
In accordance with the Articles of Association, class B shares are preferred for a dividend which is at least 1% and no more than 2.5% higher than the dividend paid to the holders of class A shares, cal-culated based on the amount obtained by
dividing the share capital entered into the Trade Register by the number of shares entered into the Trade Register.
Changes in share capital Class A Class B Total
Number of shares, Jan 1, 2016 76,208,712 449,197,602 525,406,314
Share subscription with 2013 options, May 3, 2016 268,598 268,598
Share subscription with 2013 and 2014 options, Aug 2, 2016 210,141 210,141
Share subscription with 2013 and 2014 options, Nov 8, 2016 283,023 283,023
Share subscription with 2013 options, Dec 30, 2016 806 806
Number of shares, Dec 31, 2016 76,208,712 449,960,170 526,168,882
Number of votes, Dec 31, 2016 76,208,712 44,996,017 121,204,729
Share capital, Dec 31, 2016, MEUR 9.5 56.3 65.8
Changes in share capital Class A Class B Total
Number of shares, Jan 1, 2015 76,208,712 448,201,216 524,409,928
Share subscription with 2010 and 2013 options, April 30, 2015 853,462 853,462
Share subscription with 2010 options, May 19, 2015 132,322 132,322
Share subscription with 2013 options, Aug 4, 2015 3,560 3,560
Share subscription with 2013 options, Nov 3, 2015 6,802 6,802
Share subscription with 2013 options, Dec 31, 2015 240 240
Number of shares, Dec 31, 2015 76,208,712 449,197,602 525,406,314
Number of votes, Dec 31, 2015 76,208,712 44,919,760 121,128,472
Share capital, Dec 31, 2015, MEUR 9.5 56.2 65.7
Equity and profit distribution The total shareholders’ equity consists of the share capital, the share premium account, the fair value and other reserves, translation differences, the paid-up unre-stricted equity reserve, remeasurements of employee benefits and retained earn-ings. When options are exercised and if new shares are issued, the impacts of changes in the share capital, which exceed the accounting par value of the shares, are included in the paid-up unrestricted equity reserve. If treasury shares are used in subscriptions with option rights, the subscription price is included in the paid-up unrestricted equity reserve. The fair value
and other reserves include changes in the fair value of cash flow hedges. Translation differences arising from the application of the acquisition method on the translation of the net investment in foreign subsidiaries and associated companies are recognized as translation differences. Exchange rate differences resulting from derivatives and loans intended as hedges on assets and liabilities in foreign subsidiaries are also recognized as translation differences. Actu-arial gains and losses arising from employee benefits are recognized as remeasurements of employee benefits. The purchase price of own shares purchased by KONE Corpora-tion is deducted from retained earnings.
The net income for the accounting period is recognized directly in retained earnings.
When KONE purchases its own shares, the consideration paid and directly attribut-able costs are recognized as a deduction in equity. When such shares are sold, the con-sideration received, net of directly attribut-able transaction costs, is included in equity.
Profit distribution includes dividends and donations decided by the Sharehold-ers’ Meeting. The dividend and distribution of profits proposed by the Board is not deducted from the equity prior to accep-tance by a Shareholders’ Meeting.
5.2 SHAREHOLDERS’ EQUITY
Accounting principles
KONE 2016 Annual Review | Notes to the consolidated financial statements | Capital structure
More information
Please refer to section 6.2 for more information on options and share-based incentive plans.
45
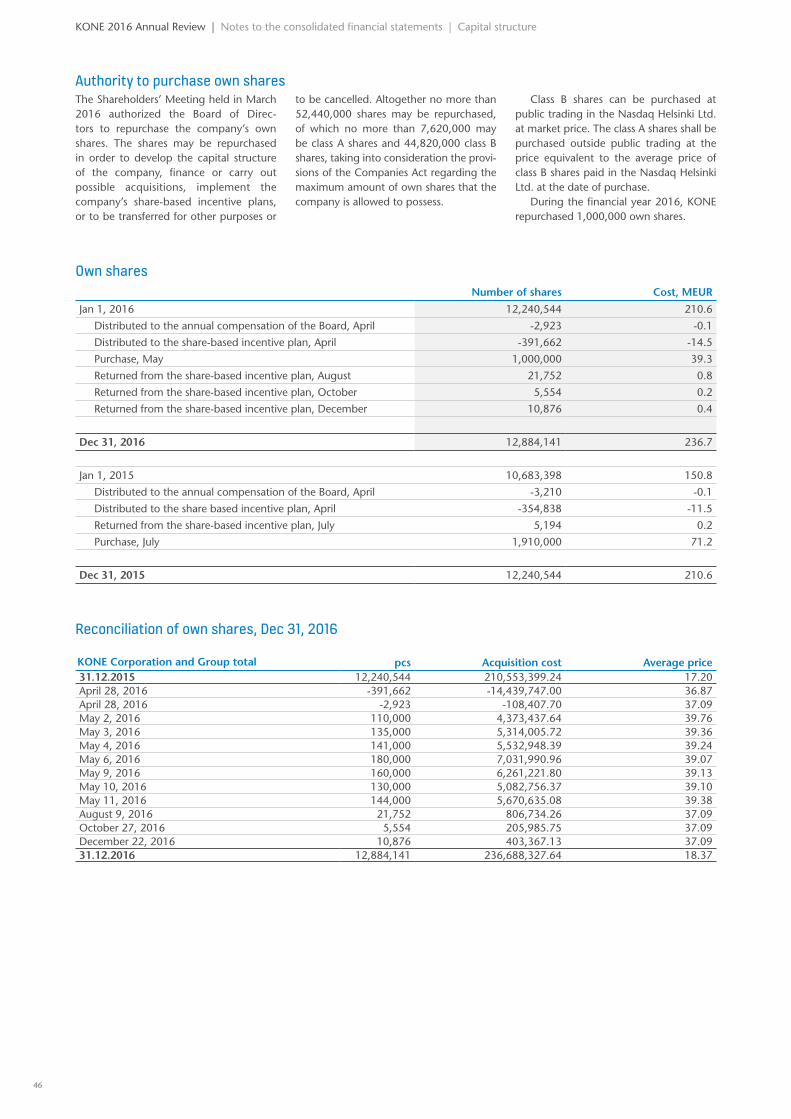
Authority to purchase own sharesThe Shareholders’ Meeting held in March 2016 authorized the Board of Direc-tors to repurchase the company’s own shares. The shares may be repurchased in order to develop the capital structure of the company, finance or carry out possible acquisitions, implement the company’s share-based incentive plans, or to be transferred for other purposes or
to be cancelled. Altogether no more than 52,440,000 shares may be repurchased, of which no more than 7,620,000 may be class A shares and 44,820,000 class B shares, taking into consideration the provi-sions of the Companies Act regarding the maximum amount of own shares that the company is allowed to possess.
Class B shares can be purchased at public trading in the Nasdaq Helsinki Ltd. at market price. The class A shares shall be purchased outside public trading at the price equivalent to the average price of class B shares paid in the Nasdaq Helsinki Ltd. at the date of purchase.
During the financial year 2016, KONE repurchased 1,000,000 own shares.
Own shares Number of shares Cost, MEUR
Jan 1, 2016 12,240,544 210.6
Distributed to the annual compensation of the Board, April -2,923 -0.1
Distributed to the share-based incentive plan, April -391,662 -14.5
Purchase, May 1,000,000 39.3
Returned from the share-based incentive plan, August 21,752 0.8
Returned from the share-based incentive plan, October 5,554 0.2
Returned from the share-based incentive plan, December 10,876 0.4
Dec 31, 2016 12,884,141 236.7
Jan 1, 2015 10,683,398 150.8
Distributed to the annual compensation of the Board, April -3,210 -0.1
Distributed to the share based incentive plan, April -354,838 -11.5
Returned from the share-based incentive plan, July 5,194 0.2
Purchase, July 1,910,000 71.2
Dec 31, 2015 12,240,544 210.6
Reconciliation of own shares, Dec 31, 2016
KONE Corporation and Group total pcs Acquisition cost Average price31.12.2015 12,240,544 210,553,399.24 17.20April 28, 2016 -391,662 -14,439,747.00 36.87April 28, 2016 -2,923 -108,407.70 37.09May 2, 2016 110,000 4,373,437.64 39.76May 3, 2016 135,000 5,314,005.72 39.36May 4, 2016 141,000 5,532,948.39 39.24May 6, 2016 180,000 7,031,990.96 39.07May 9, 2016 160,000 6,261,221.80 39.13May 10, 2016 130,000 5,082,756.37 39.10May 11, 2016 144,000 5,670,635.08 39.38August 9, 2016 21,752 806,734.26 37.09October 27, 2016 5,554 205,985.75 37.09December 22, 2016 10,876 403,367.13 37.0931.12.2016 12,884,141 236,688,327.64 18.37
KONE 2016 Annual Review | Notes to the consolidated financial statements | Capital structure
46
5.3 FINANCIAL RISKS AND INSTRUMENTS
Derivative financial instruments and hedge accountingDerivative financial instruments are initially and subsequently recognized at fair value in the statement of financial position. The fair values of foreign exchange forward contracts are calculated by discounting the future cash flows of the contracts with the relevant market interest rate yield curves on the valuation date and by calculating the difference between the discounted values in euros. The fair values of cross currency swaps are determined by discounting the expected future cash flows of the contracts with the market interest rate yield curves of the currencies concerned. The fair value of electricity price forwards is based on electricity stock exchange prices on the valuation date.
At the contract date the derivatives are classified according to the foreign exchange policy as hedging instruments of a busi-ness transaction or firm or highly probable purchase or sales contract. These are partly included in cash flow hedge accounting, hedges against fair value changes of assets or liabilities or hedges of net investments in foreign entities.
When cash flow hedge accounting is applied and the hedging relationship meets the effectiveness criteria then the effective portion of changes in the fair values of the foreign exchange derivatives initiated for hedging firm or highly probable future purchase or sales contracts is recognized through the statement of comprehensive income to the hedge reserve. The gain or loss relating to the ineffective portion is recognized immediately in the adjustment items to sales and purchases. The cumula-tive changes of fair values are transferred into the statement of income in adjustment items to sales or purchases simultaneously when the hedged sale or purchase realizes. If a foreign exchange derivative included in the cash flow hedge accounting expires
or is sold or when a hedge no longer meets the criteria for hedge accounting, the cumulative change in the fair value of the hedging instrument will remain in the hedge reserve and is recognized in the income statement at the same time with the hedged sale or purchase. The cumula-tive fair values of the hedging instruments are transferred from the hedge reserve to adjustment items to sales or purchases immediately if the hedged cash flow is no longer expected to occur. When cash flow hedge accounting is applied, the hedged risk and the hedging relationship are docu-mented in accordance with the principles of hedge accounting. Hedge effectiveness is assessed before hedge accounting is applied and at least on a quarterly basis thereafter.
The changes in the fair values of deriva-tives that are designated as hedging instru-ments but are not accounted for accord-ing to the principles of cash flow hedge accounting are recognized based on their nature either in the operative costs or as financial income or expenses: if the hedged item is an operative transaction, the fair values of the hedging instruments are rec-ognized in operative costs and expenses, and if the hedged item is a monetary transaction, the fair values are recognized in financing items.
Changes in the fair values of foreign exchange derivatives are recognized in financing income and expenses if the hedged item is a loan receivable, deposit or a financial asset or liability denominated in a foreign currency. Fair value changes of electricity price forwards designated as hedges against future electricity purchases are recognized in the income statement as adjustment items to purchases.
The effective portion of the changes in the fair values of foreign currency hedges against the translation differences arising from consolidating net investments in
foreign entities are recognized through the statement of comprehensive income to the translation differences and would be trans-ferred to the income statement in case the net investment were disposed of partially or in its entirety.
Accrued interest on cross currency swaps during the accounting period is rec-ognized in financing income and expenses.
Fair values of derivative instruments are recognized under current assets and liabili-ties in the balance sheet.
LoansLoans payable are classified in the valu-ation category other financial liabilities. They are measured initially at fair value, net of directly attributable transaction costs incurred and are subsequently carried at amortized cost using the effective interest rate method.
Current deposits and loans receivableCurrent deposits and loans receivable are initially recognized at fair value and there-after at amortized cost using the effective interest rate method. Only substantial transaction costs are counted for when measuring the acquisition cost. Deposits and loan receivables are impaired if the car-rying amount is greater than the estimated recoverable amount.
Investments in commercial papers, short-term bank deposits, interest rate funds and other money market instruments are included in deposits and loans receiv-able.
Cash and cash equivalentsCash and cash equivalents include cash-in-hand and bank account balances. Bank overdrafts are included in other current liabilities.
Accounting principles
KONE’s business activities are exposed to financial risks such as foreign exchange risks, interest rate risks, liquidity risks and credit risks. These financial risks are man-
aged as part of the total KONE risk port-folio. KONE Treasury is responsible for the centralized management of financial risks in accordance with the KONE Treasury
Policy approved by the Board of Direc-tors. KONE business units manage their financial risks locally in accordance with the KONE Treasury Policy.
KONE 2016 Annual Review | Notes to the consolidated financial statements | Capital structure
47
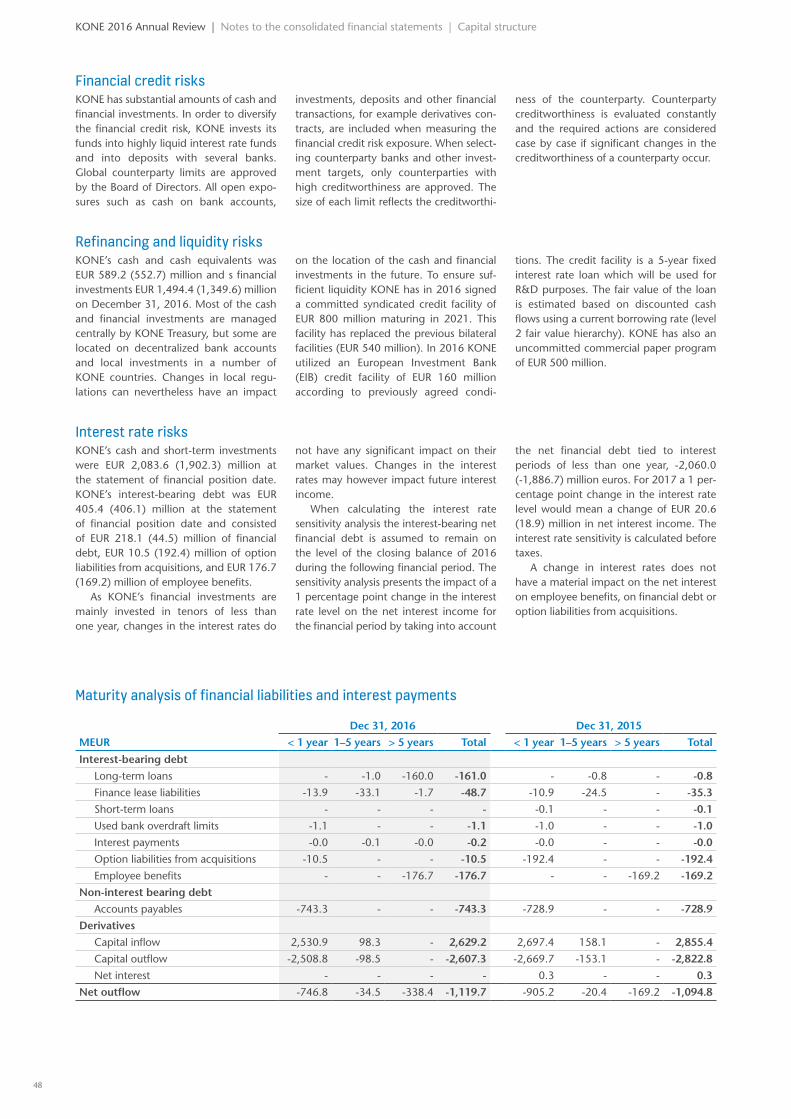
Maturity analysis of financial liabilities and interest payments
Dec 31, 2016 Dec 31, 2015
MEUR < 1 year 1–5 years > 5 years Total < 1 year 1–5 years > 5 years Total
Interest-bearing debt
Long-term loans - -1.0 -160.0 -161.0 - -0.8 - -0.8
Finance lease liabilities -13.9 -33.1 -1.7 -48.7 -10.9 -24.5 - -35.3
Short-term loans - - - - -0.1 - - -0.1
Used bank overdraft limits -1.1 - - -1.1 -1.0 - - -1.0
Interest payments -0.0 -0.1 -0.0 -0.2 -0.0 - - -0.0
Option liabilities from acquisitions -10.5 - - -10.5 -192.4 - - -192.4
Employee benefits - - -176.7 -176.7 - - -169.2 -169.2
Non-interest bearing debt
Accounts payables -743.3 - - -743.3 -728.9 - - -728.9
Derivatives
Capital inflow 2,530.9 98.3 - 2,629.2 2,697.4 158.1 - 2,855.4
Capital outflow -2,508.8 -98.5 - -2,607.3 -2,669.7 -153.1 - -2,822.8
Net interest - - - - 0.3 - - 0.3
Net outflow -746.8 -34.5 -338.4 -1,119.7 -905.2 -20.4 -169.2 -1,094.8
Interest rate risksKONE’s cash and short-term investments were EUR 2,083.6 (1,902.3) million at the statement of financial position date. KONE’s interest-bearing debt was EUR 405.4 (406.1) million at the statement of financial position date and consisted of EUR 218.1 (44.5) million of financial debt, EUR 10.5 (192.4) million of option liabilities from acquisitions, and EUR 176.7 (169.2) million of employee benefits.
As KONE’s financial investments are mainly invested in tenors of less than one year, changes in the interest rates do
not have any significant impact on their market values. Changes in the interest rates may however impact future interest income.
When calculating the interest rate sensitivity analysis the interest-bearing net financial debt is assumed to remain on the level of the closing balance of 2016 during the following financial period. The sensitivity analysis presents the impact of a 1 percentage point change in the interest rate level on the net interest income for the financial period by taking into account
the net financial debt tied to interest periods of less than one year, -2,060.0 (-1,886.7) million euros. For 2017 a 1 per-centage point change in the interest rate level would mean a change of EUR 20.6 (18.9) million in net interest income. The interest rate sensitivity is calculated before taxes.
A change in interest rates does not have a material impact on the net interest on employee benefits, on financial debt or option liabilities from acquisitions.
KONE 2016 Annual Review | Notes to the consolidated financial statements | Capital structure
Financial credit risksKONE has substantial amounts of cash and financial investments. In order to diversify the financial credit risk, KONE invests its funds into highly liquid interest rate funds and into deposits with several banks. Global counterparty limits are approved by the Board of Directors. All open expo-sures such as cash on bank accounts,
investments, deposits and other financial transactions, for example derivatives con-tracts, are included when measuring the financial credit risk exposure. When select-ing counterparty banks and other invest-ment targets, only counterparties with high creditworthiness are approved. The size of each limit reflects the creditworthi-
ness of the counterparty. Counterparty creditworthiness is evaluated constantly and the required actions are considered case by case if significant changes in the creditworthiness of a counterparty occur.
Refinancing and liquidity risksKONE’s cash and cash equivalents was EUR 589.2 (552.7) million and s financial investments EUR 1,494.4 (1,349.6) million on December 31, 2016. Most of the cash and financial investments are managed centrally by KONE Treasury, but some are located on decentralized bank accounts and local investments in a number of KONE countries. Changes in local regu-lations can nevertheless have an impact
on the location of the cash and financial investments in the future. To ensure suf-ficient liquidity KONE has in 2016 signed a committed syndicated credit facility of EUR 800 million maturing in 2021. This facility has replaced the previous bilateral facilities (EUR 540 million). In 2016 KONE utilized an European Investment Bank (EIB) credit facility of EUR 160 million according to previously agreed condi-
tions. The credit facility is a 5-year fixed interest rate loan which will be used for R&D purposes. The fair value of the loan is estimated based on discounted cash flows using a current borrowing rate (level 2 fair value hierarchy). KONE has also an uncommitted commercial paper program of EUR 500 million.
48
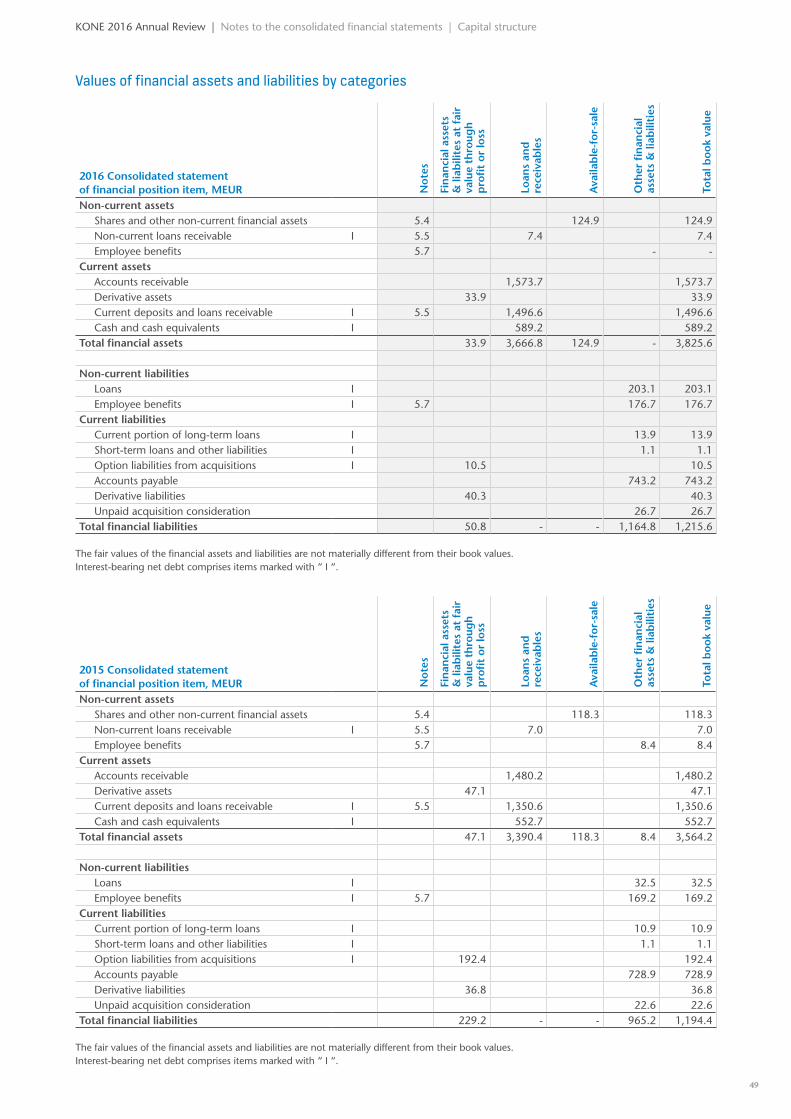
Values of financial assets and liabilities by categories
2016 Consolidated statement of financial position item, MEUR N
otes
Fin
anci
al a
sset
s &
liab
ilite
s at
fai
r va
lue
thro
ugh
p
rofi
t or
loss
Loan
s an
d
rece
ivab
les
Ava
ilab
le-f
or-s
ale
Oth
er fi
nan
cial
as
sets
& li
abili
ties
Tota
l boo
k va
lue
Non-current assetsShares and other non-current financial assets 5.4 124.9 124.9Non-current loans receivable I 5.5 7.4 7.4Employee benefits 5.7 - -
Current assetsAccounts receivable 1,573.7 1,573.7Derivative assets 33.9 33.9Current deposits and loans receivable I 5.5 1,496.6 1,496.6Cash and cash equivalents I 589.2 589.2
Total financial assets 33.9 3,666.8 124.9 - 3,825.6
Non-current liabilitiesLoans I 203.1 203.1Employee benefits I 5.7 176.7 176.7
Current liabilitiesCurrent portion of long-term loans I 13.9 13.9Short-term loans and other liabilities I 1.1 1.1Option liabilities from acquisitions I 10.5 10.5Accounts payable 743.2 743.2Derivative liabilities 40.3 40.3Unpaid acquisition consideration 26.7 26.7
Total financial liabilities 50.8 - - 1,164.8 1,215.6
The fair values of the financial assets and liabilities are not materially different from their book values.Interest-bearing net debt comprises items marked with “ I “.
2015 Consolidated statement of financial position item, MEUR N
otes
Fin
anci
al a
sset
s &
liab
ilite
s at
fai
r va
lue
thro
ugh
p
rofi
t or
loss
Loan
s an
d
rece
ivab
les
Ava
ilab
le-f
or-s
ale
Oth
er fi
nan
cial
as
sets
& li
abili
ties
Tota
l boo
k va
lue
Non-current assetsShares and other non-current financial assets 5.4 118.3 118.3Non-current loans receivable I 5.5 7.0 7.0Employee benefits 5.7 8.4 8.4
Current assetsAccounts receivable 1,480.2 1,480.2Derivative assets 47.1 47.1Current deposits and loans receivable I 5.5 1,350.6 1,350.6Cash and cash equivalents I 552.7 552.7
Total financial assets 47.1 3,390.4 118.3 8.4 3,564.2
Non-current liabilitiesLoans I 32.5 32.5Employee benefits I 5.7 169.2 169.2
Current liabilitiesCurrent portion of long-term loans I 10.9 10.9Short-term loans and other liabilities I 1.1 1.1Option liabilities from acquisitions I 192.4 192.4Accounts payable 728.9 728.9Derivative liabilities 36.8 36.8Unpaid acquisition consideration 22.6 22.6
Total financial liabilities 229.2 - - 965.2 1,194.4
The fair values of the financial assets and liabilities are not materially different from their book values.Interest-bearing net debt comprises items marked with “ I “.
KONE 2016 Annual Review | Notes to the consolidated financial statements | Capital structure
49
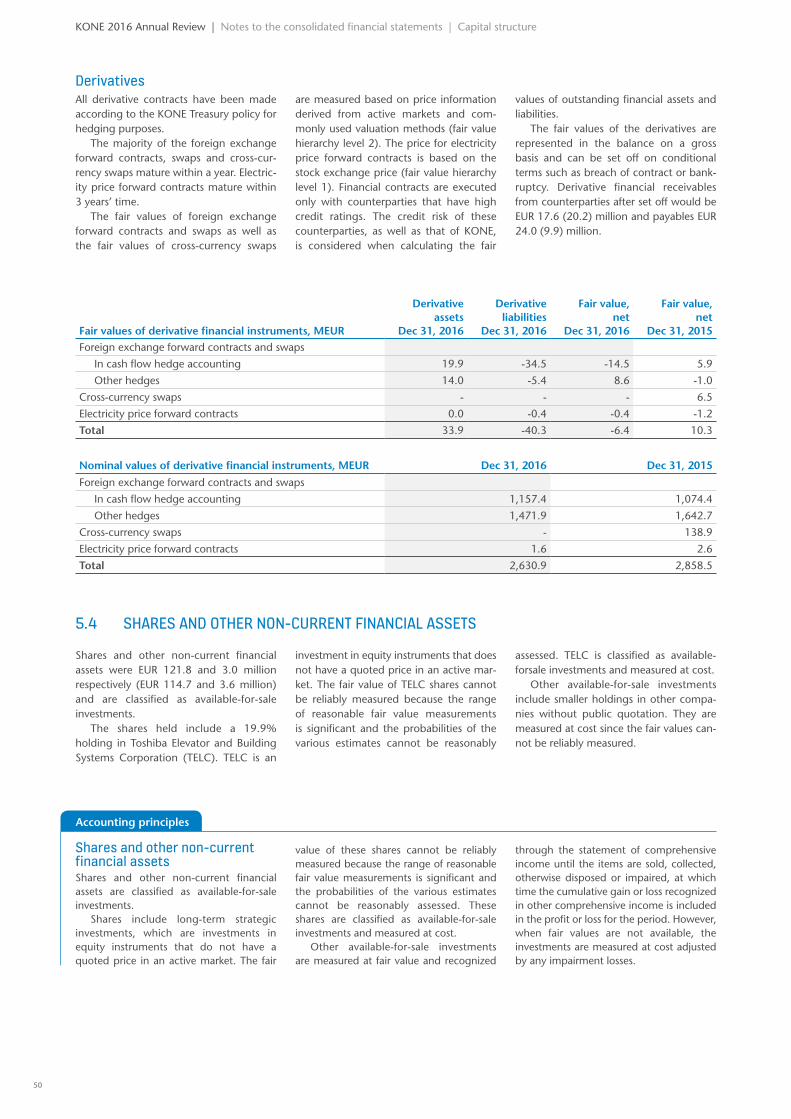
DerivativesAll derivative contracts have been made according to the KONE Treasury policy for hedging purposes.
The majority of the foreign exchange forward contracts, swaps and cross-cur-rency swaps mature within a year. Electric-ity price forward contracts mature within 3 years’ time.
The fair values of foreign exchange forward contracts and swaps as well as the fair values of cross-currency swaps
are measured based on price information derived from active markets and com-monly used valuation methods (fair value hierarchy level 2). The price for electricity price forward contracts is based on the stock exchange price (fair value hierarchy level 1). Financial contracts are executed only with counterparties that have high credit ratings. The credit risk of these counterparties, as well as that of KONE, is considered when calculating the fair
values of outstanding financial assets and liabilities.
The fair values of the derivatives are represented in the balance on a gross basis and can be set off on conditional terms such as breach of contract or bank-ruptcy. Derivative financial receivables from counterparties after set off would be EUR 17.6 (20.2) million and payables EUR 24.0 (9.9) million.
Fair values of derivative financial instruments, MEUR
Derivative assets
Dec 31, 2016
Derivative liabilities
Dec 31, 2016
Fair value,net
Dec 31, 2016
Fair value,net
Dec 31, 2015Foreign exchange forward contracts and swaps
In cash flow hedge accounting 19.9 -34.5 -14.5 5.9
Other hedges 14.0 -5.4 8.6 -1.0
Cross-currency swaps - - - 6.5
Electricity price forward contracts 0.0 -0.4 -0.4 -1.2
Total 33.9 -40.3 -6.4 10.3
Nominal values of derivative financial instruments, MEUR Dec 31, 2016 Dec 31, 2015
Foreign exchange forward contracts and swaps
In cash flow hedge accounting 1,157.4 1,074.4
Other hedges 1,471.9 1,642.7
Cross-currency swaps - 138.9
Electricity price forward contracts 1.6 2.6
Total 2,630.9 2,858.5
KONE 2016 Annual Review | Notes to the consolidated financial statements | Capital structure
5.4 SHARES AND OTHER NON-CURRENT FINANCIAL ASSETS
Shares and other non-current financial assets were EUR 121.8 and 3.0 million respectively (EUR 114.7 and 3.6 million) and are classified as available-for-sale investments.
The shares held include a 19.9% holding in Toshiba Elevator and Building Systems Corporation (TELC). TELC is an
investment in equity instruments that does not have a quoted price in an active mar-ket. The fair value of TELC shares cannot be reliably measured because the range of reasonable fair value measurements is significant and the probabilities of the various estimates cannot be reasonably
assessed. TELC is classified as available-forsale investments and measured at cost.
Other available-for-sale investments include smaller holdings in other compa-nies without public quotation. They are measured at cost since the fair values can-not be reliably measured.
Shares and other non-current financial assetsShares and other non-current financial assets are classified as available-for-sale investments.
Shares include long-term strategic investments, which are investments in equity instruments that do not have a quoted price in an active market. The fair
value of these shares cannot be reliably measured because the range of reasonable fair value measurements is significant and the probabilities of the various estimates cannot be reasonably assessed. These shares are classified as available-for-sale investments and measured at cost.
Other available-for-sale investments are measured at fair value and recognized
through the statement of comprehensive income until the items are sold, collected, otherwise disposed or impaired, at which time the cumulative gain or loss recognized in other comprehensive income is included in the profit or loss for the period. However, when fair values are not available, the investments are measured at cost adjusted by any impairment losses.
Accounting principles
50
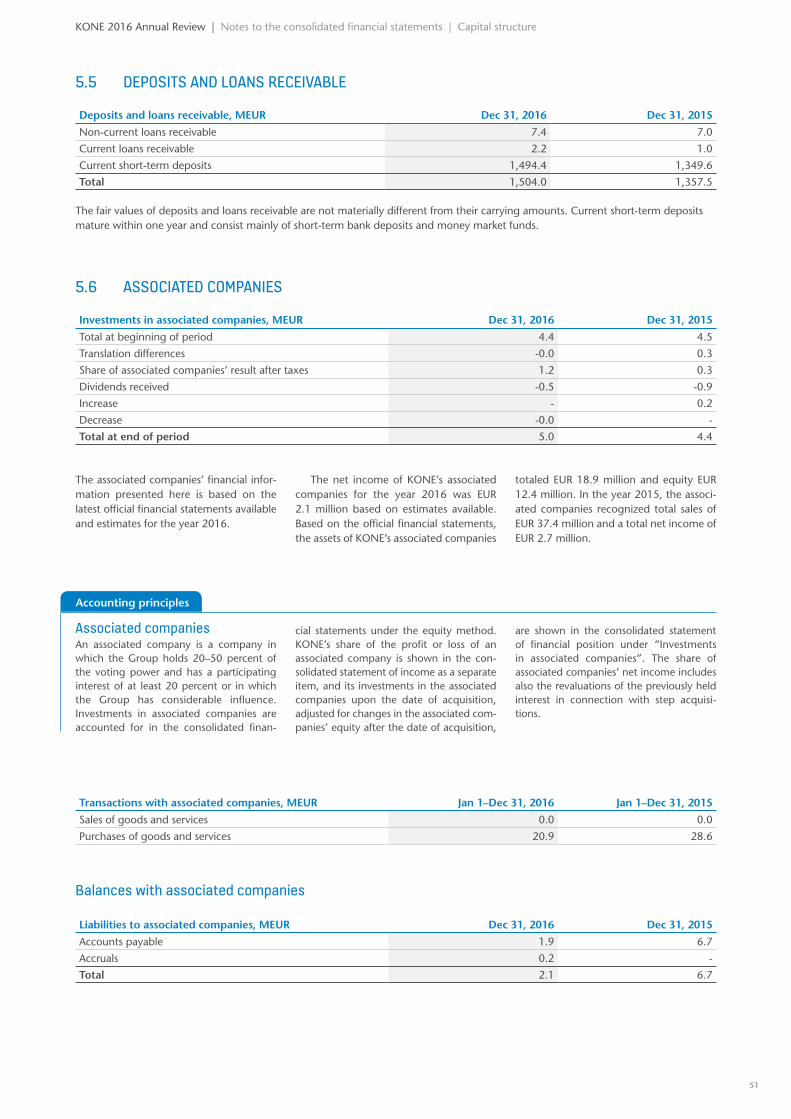
5.6 ASSOCIATED COMPANIES
Investments in associated companies, MEUR Dec 31, 2016 Dec 31, 2015
Total at beginning of period 4.4 4.5
Translation differences -0.0 0.3
Share of associated companies’ result after taxes 1.2 0.3
Dividends received -0.5 -0.9
Increase - 0.2
Decrease -0.0 -
Total at end of period 5.0 4.4
The associated companies’ financial infor-mation presented here is based on the latest official financial statements available and estimates for the year 2016.
The net income of KONE’s associated companies for the year 2016 was EUR 2.1 million based on estimates available. Based on the official financial statements, the assets of KONE’s associated companies
totaled EUR 18.9 million and equity EUR 12.4 million. In the year 2015, the associ-ated companies recognized total sales of EUR 37.4 million and a total net income of EUR 2.7 million.
KONE 2016 Annual Review | Notes to the consolidated financial statements | Capital structure
Associated companiesAn associated company is a company in which the Group holds 20–50 percent of the voting power and has a participating interest of at least 20 percent or in which the Group has considerable influence. Investments in associated companies are accounted for in the consolidated finan-
cial statements under the equity method. KONE’s share of the profit or loss of an associated company is shown in the con-solidated statement of income as a separate item, and its investments in the associated companies upon the date of acquisition, adjusted for changes in the associated com-panies’ equity after the date of acquisition,
are shown in the consolidated statement of financial position under “Investments in associated companies”. The share of associated companies’ net income includes also the revaluations of the previously held interest in connection with step acquisi-tions.
Accounting principles
5.5 DEPOSITS AND LOANS RECEIVABLE
Deposits and loans receivable, MEUR Dec 31, 2016 Dec 31, 2015
Non-current loans receivable 7.4 7.0
Current loans receivable 2.2 1.0
Current short-term deposits 1,494.4 1,349.6
Total 1,504.0 1,357.5
The fair values of deposits and loans receivable are not materially different from their carrying amounts. Current short-term deposits mature within one year and consist mainly of short-term bank deposits and money market funds.
Transactions with associated companies, MEUR Jan 1–Dec 31, 2016 Jan 1–Dec 31, 2015
Sales of goods and services 0.0 0.0
Purchases of goods and services 20.9 28.6
Balances with associated companies
Liabilities to associated companies, MEUR Dec 31, 2016 Dec 31, 2015
Accounts payable 1.9 6.7
Accruals 0.2 -
Total 2.1 6.7
51
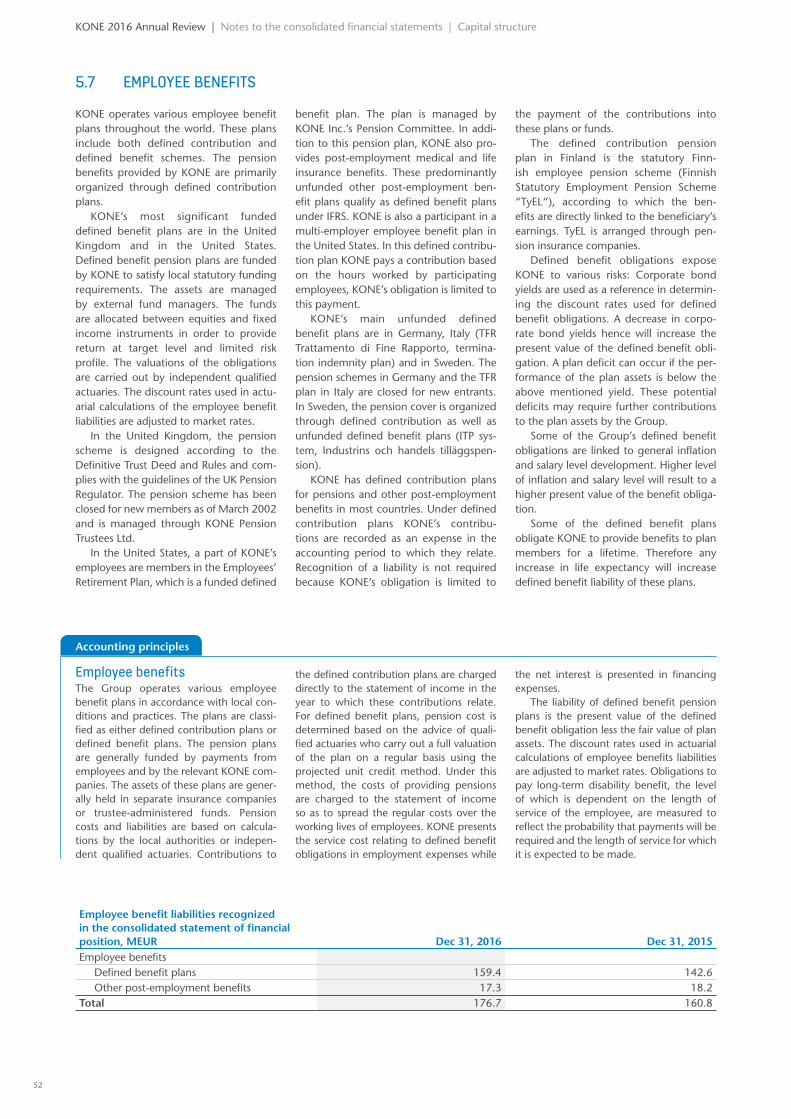
5.7 EMPLOYEE BENEFITS
KONE 2016 Annual Review | Notes to the consolidated financial statements | Capital structure
Employee benefits The Group operates various employee benefit plans in accordance with local con-ditions and practices. The plans are classi-fied as either defined contribution plans or defined benefit plans. The pension plans are generally funded by payments from employees and by the relevant KONE com-panies. The assets of these plans are gener-ally held in separate insurance companies or trustee-administered funds. Pension costs and liabilities are based on calcula-tions by the local authorities or indepen-dent qualified actuaries. Contributions to
the defined contribution plans are charged directly to the statement of income in the year to which these contributions relate. For defined benefit plans, pension cost is determined based on the advice of quali-fied actuaries who carry out a full valuation of the plan on a regular basis using the projected unit credit method. Under this method, the costs of providing pensions are charged to the statement of income so as to spread the regular costs over the working lives of employees. KONE presents the service cost relating to defined benefit obligations in employment expenses while
the net interest is presented in financing expenses.
The liability of defined benefit pension plans is the present value of the defined benefit obligation less the fair value of plan assets. The discount rates used in actuarial calculations of employee benefits liabilities are adjusted to market rates. Obligations to pay long-term disability benefit, the level of which is dependent on the length of service of the employee, are measured to reflect the probability that payments will be required and the length of service for which it is expected to be made.
Accounting principles
KONE operates various employee benefit plans throughout the world. These plans include both defined contribution and defined benefit schemes. The pension benefits provided by KONE are primarily organized through defined contribution plans.
KONE’s most significant funded defined benefit plans are in the United Kingdom and in the United States. Defined benefit pension plans are funded by KONE to satisfy local statutory funding requirements. The assets are managed by external fund managers. The funds are allocated between equities and fixed income instruments in order to provide return at target level and limited risk profile. The valuations of the obligations are carried out by independent qualified actuaries. The discount rates used in actu-arial calculations of the employee benefit liabilities are adjusted to market rates.
In the United Kingdom, the pension scheme is designed according to the Definitive Trust Deed and Rules and com-plies with the guidelines of the UK Pension Regulator. The pension scheme has been closed for new members as of March 2002 and is managed through KONE Pension Trustees Ltd.
In the United States, a part of KONE’s employees are members in the Employees’ Retirement Plan, which is a funded defined
benefit plan. The plan is managed by KONE Inc.’s Pension Committee. In addi-tion to this pension plan, KONE also pro-vides post-employment medical and life insurance benefits. These predominantly unfunded other post-employment ben-efit plans qualify as defined benefit plans under IFRS. KONE is also a participant in a multi-employer employee benefit plan in the United States. In this defined contribu-tion plan KONE pays a contribution based on the hours worked by participating employees, KONE’s obligation is limited to this payment.
KONE’s main unfunded defined benefit plans are in Germany, Italy (TFR Trattamento di Fine Rapporto, termina-tion indemnity plan) and in Sweden. The pension schemes in Germany and the TFR plan in Italy are closed for new entrants. In Sweden, the pension cover is organized through defined contribution as well as unfunded defined benefit plans (ITP sys-tem, Industrins och handels tilläggspen-sion).
KONE has defined contribution plans for pensions and other post-employment benefits in most countries. Under defined contribution plans KONE’s contribu-tions are recorded as an expense in the accounting period to which they relate. Recognition of a liability is not required because KONE’s obligation is limited to
the payment of the contributions into these plans or funds.
The defined contribution pension plan in Finland is the statutory Finn-ish employee pension scheme (Finnish Statutory Employment Pension Scheme “TyEL“), according to which the ben-efits are directly linked to the beneficiary’s earnings. TyEL is arranged through pen-sion insurance companies.
Defined benefit obligations expose KONE to various risks: Corporate bond yields are used as a reference in determin-ing the discount rates used for defined benefit obligations. A decrease in corpo-rate bond yields hence will increase the present value of the defined benefit obli-gation. A plan deficit can occur if the per-formance of the plan assets is below the above mentioned yield. These potential deficits may require further contributions to the plan assets by the Group.
Some of the Group’s defined benefit obligations are linked to general inflation and salary level development. Higher level of inflation and salary level will result to a higher present value of the benefit obliga-tion.
Some of the defined benefit plans obligate KONE to provide benefits to plan members for a lifetime. Therefore any increase in life expectancy will increase defined benefit liability of these plans.
Employee benefit liabilities recognized in the consolidated statement of financial position, MEUR Dec 31, 2016 Dec 31, 2015Employee benefits
Defined benefit plans 159.4 142.6Other post-employment benefits 17.3 18.2
Total 176.7 160.8
52
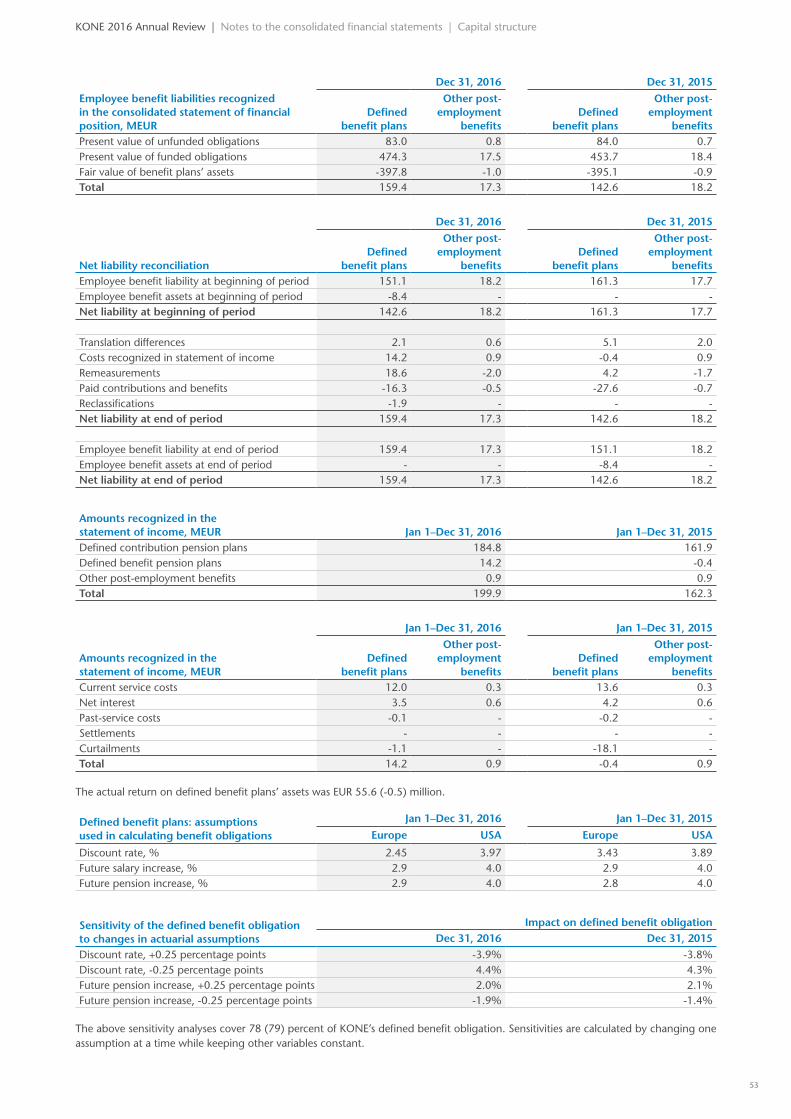
Dec 31, 2016 Dec 31, 2015
Employee benefit liabilities recognized in the consolidated statement of financial position, MEUR
Defined benefit plans
Other post- employment
benefitsDefined
benefit plans
Other post- employment
benefitsPresent value of unfunded obligations 83.0 0.8 84.0 0.7Present value of funded obligations 474.3 17.5 453.7 18.4Fair value of benefit plans’ assets -397.8 -1.0 -395.1 -0.9Total 159.4 17.3 142.6 18.2
Dec 31, 2016 Dec 31, 2015
Net liability reconciliationDefined
benefit plans
Other post- employment
benefitsDefined
benefit plans
Other post- employment
benefitsEmployee benefit liability at beginning of period 151.1 18.2 161.3 17.7Employee benefit assets at beginning of period -8.4 - - -Net liability at beginning of period 142.6 18.2 161.3 17.7
Translation differences 2.1 0.6 5.1 2.0Costs recognized in statement of income 14.2 0.9 -0.4 0.9Remeasurements 18.6 -2.0 4.2 -1.7Paid contributions and benefits -16.3 -0.5 -27.6 -0.7Reclassifications -1.9 - - -Net liability at end of period 159.4 17.3 142.6 18.2
Employee benefit liability at end of period 159.4 17.3 151.1 18.2Employee benefit assets at end of period - - -8.4 -Net liability at end of period 159.4 17.3 142.6 18.2
Amounts recognized in the statement of income, MEUR Jan 1–Dec 31, 2016 Jan 1–Dec 31, 2015Defined contribution pension plans 184.8 161.9Defined benefit pension plans 14.2 -0.4Other post-employment benefits 0.9 0.9Total 199.9 162.3
Jan 1–Dec 31, 2016 Jan 1–Dec 31, 2015
Amounts recognized in the statement of income, MEUR
Defined benefit plans
Other post- employment
benefitsDefined
benefit plans
Other post- employment
benefitsCurrent service costs 12.0 0.3 13.6 0.3Net interest 3.5 0.6 4.2 0.6Past-service costs -0.1 - -0.2 -Settlements - - - -Curtailments -1.1 - -18.1 -Total 14.2 0.9 -0.4 0.9
The actual return on defined benefit plans’ assets was EUR 55.6 (-0.5) million.
Defined benefit plans: assumptions used in calculating benefit obligations
Jan 1–Dec 31, 2016 Jan 1–Dec 31, 2015
Europe USA Europe USA
Discount rate, % 2.45 3.97 3.43 3.89Future salary increase, % 2.9 4.0 2.9 4.0Future pension increase, % 2.9 4.0 2.8 4.0
Sensitivity of the defined benefit obligation to changes in actuarial assumptions
Impact on defined benefit obligation Dec 31, 2016 Dec 31, 2015
Discount rate, +0.25 percentage points -3.9% -3.8%Discount rate, -0.25 percentage points 4.4% 4.3%Future pension increase, +0.25 percentage points 2.0% 2.1%Future pension increase, -0.25 percentage points -1.9% -1.4%
The above sensitivity analyses cover 78 (79) percent of KONE’s defined benefit obligation. Sensitivities are calculated by changing one assumption at a time while keeping other variables constant.
KONE 2016 Annual Review | Notes to the consolidated financial statements | Capital structure
53
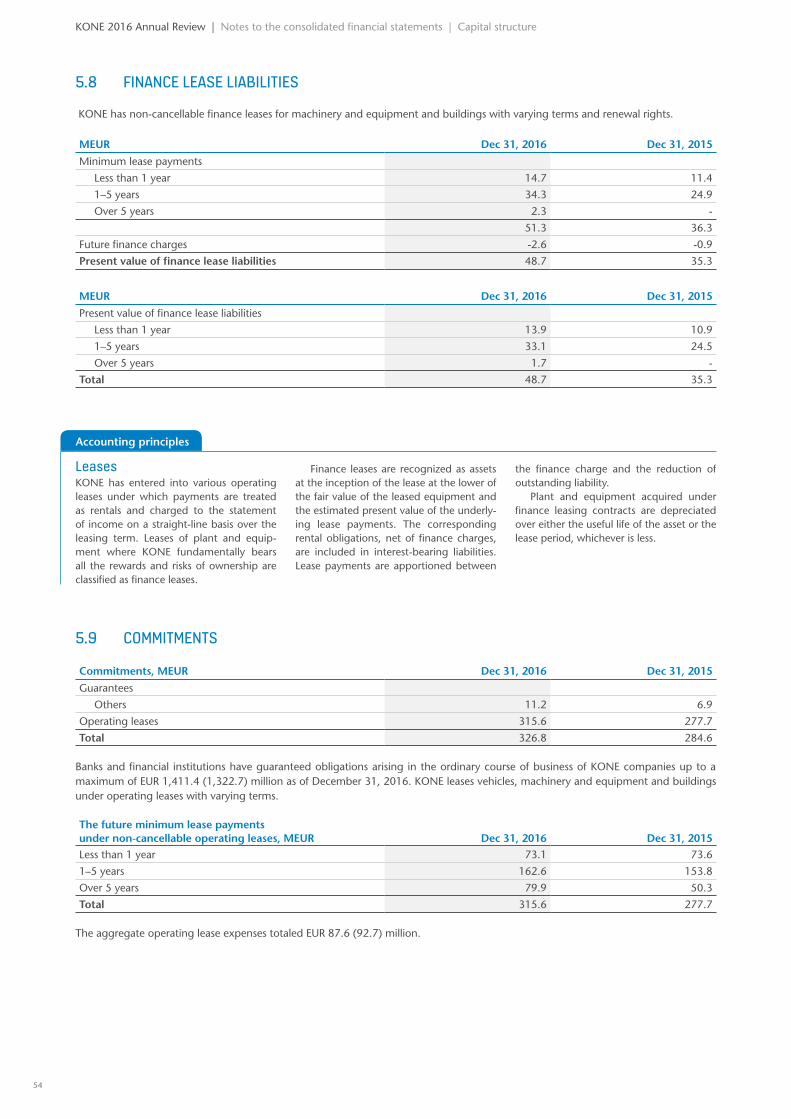
5.9 COMMITMENTS
Commitments, MEUR Dec 31, 2016 Dec 31, 2015
Guarantees
Others 11.2 6.9
Operating leases 315.6 277.7
Total 326.8 284.6
Banks and financial institutions have guaranteed obligations arising in the ordinary course of business of KONE companies up to a maximum of EUR 1,411.4 (1,322.7) million as of December 31, 2016. KONE leases vehicles, machinery and equipment and buildings under operating leases with varying terms.
The future minimum lease payments under non-cancellable operating leases, MEUR Dec 31, 2016 Dec 31, 2015Less than 1 year 73.1 73.6
1–5 years 162.6 153.8
Over 5 years 79.9 50.3
Total 315.6 277.7
The aggregate operating lease expenses totaled EUR 87.6 (92.7) million.
KONE 2016 Annual Review | Notes to the consolidated financial statements | Capital structure
Leases KONE has entered into various operating leases under which payments are treated as rentals and charged to the statement of income on a straight-line basis over the leasing term. Leases of plant and equip-ment where KONE fundamentally bears all the rewards and risks of ownership are classified as finance leases.
Finance leases are recognized as assets at the inception of the lease at the lower of the fair value of the leased equipment and the estimated present value of the underly-ing lease payments. The corresponding rental obligations, net of finance charges, are included in interest-bearing liabilities. Lease payments are apportioned between
the finance charge and the reduction of outstanding liability.
Plant and equipment acquired under finance leasing contracts are depreciated over either the useful life of the asset or the lease period, whichever is less.
5.8 FINANCE LEASE LIABILITIES
KONE has non-cancellable finance leases for machinery and equipment and buildings with varying terms and renewal rights.
MEUR Dec 31, 2016 Dec 31, 2015
Minimum lease payments
Less than 1 year 14.7 11.4
1–5 years 34.3 24.9
Over 5 years 2.3 -
51.3 36.3
Future finance charges -2.6 -0.9
Present value of finance lease liabilities 48.7 35.3
MEUR Dec 31, 2016 Dec 31, 2015
Present value of finance lease liabilities
Less than 1 year 13.9 10.9
1–5 years 33.1 24.5
Over 5 years 1.7 -
Total 48.7 35.3
Accounting principles
54
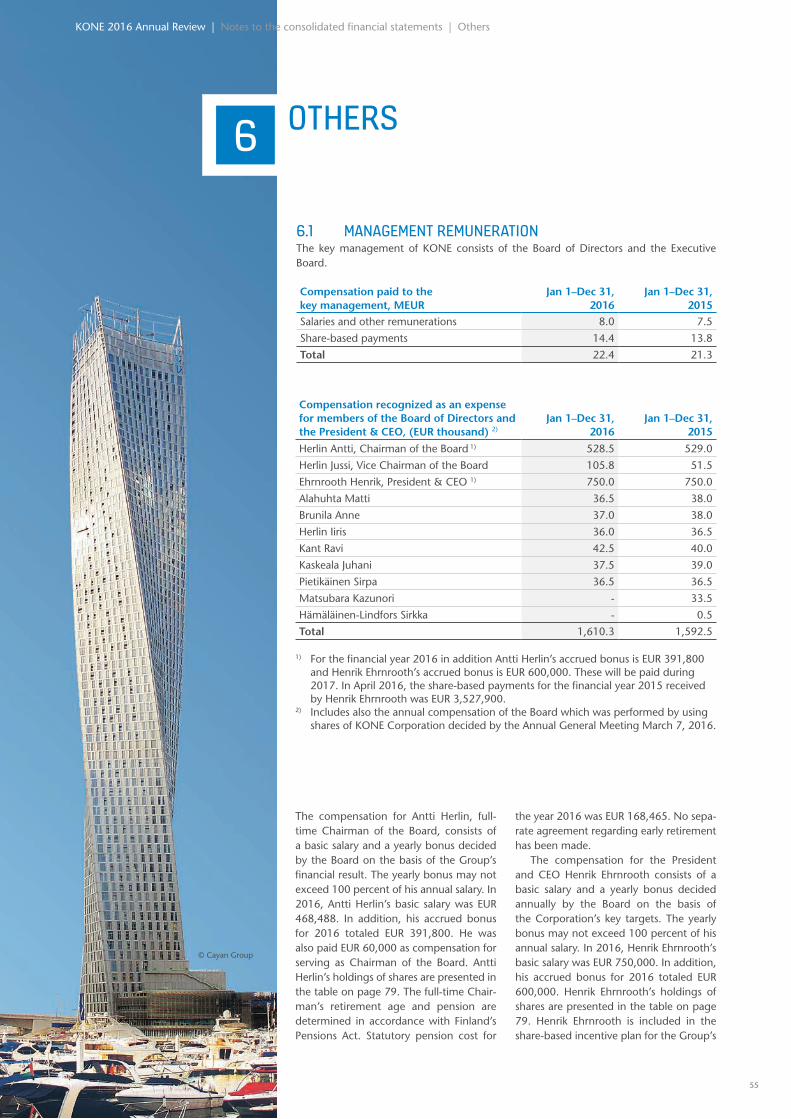
6
Compensation recognized as an expense for members of the Board of Directors and the President & CEO, (EUR thousand) 2)
Jan 1–Dec 31, 2016
Jan 1–Dec 31, 2015
Herlin Antti, Chairman of the Board 1) 528.5 529.0
Herlin Jussi, Vice Chairman of the Board 105.8 51.5
Ehrnrooth Henrik, President & CEO 1) 750.0 750.0
Alahuhta Matti 36.5 38.0
Brunila Anne 37.0 38.0
Herlin Iiris 36.0 36.5
Kant Ravi 42.5 40.0
Kaskeala Juhani 37.5 39.0
Pietikäinen Sirpa 36.5 36.5
Matsubara Kazunori - 33.5
Hämäläinen-Lindfors Sirkka - 0.5
Total 1,610.3 1,592.5
1) For the financial year 2016 in addition Antti Herlin’s accrued bonus is EUR 391,800 and Henrik Ehrnrooth’s accrued bonus is EUR 600,000. These will be paid during 2017. In April 2016, the share-based payments for the financial year 2015 received by Henrik Ehrnrooth was EUR 3,527,900.
2) Includes also the annual compensation of the Board which was performed by using shares of KONE Corporation decided by the Annual General Meeting March 7, 2016.
The compensation for Antti Herlin, full-time Chairman of the Board, consists of a basic salary and a yearly bonus decided by the Board on the basis of the Group’s financial result. The yearly bonus may not exceed 100 percent of his annual salary. In 2016, Antti Herlin’s basic salary was EUR 468,488. In addition, his accrued bonus for 2016 totaled EUR 391,800. He was also paid EUR 60,000 as compensation for serving as Chairman of the Board. Antti Herlin’s holdings of shares are presented in the table on page 79. The full-time Chair-man’s retirement age and pension are determined in accordance with Finland’s Pensions Act. Statutory pension cost for
the year 2016 was EUR 168,465. No sepa-rate agreement regarding early retirement has been made.
The compensation for the President and CEO Henrik Ehrnrooth consists of a basic salary and a yearly bonus decided annually by the Board on the basis of the Corporation’s key targets. The yearly bonus may not exceed 100 percent of his annual salary. In 2016, Henrik Ehrnrooth’s basic salary was EUR 750,000. In addition, his accrued bonus for 2016 totaled EUR 600,000. Henrik Ehrnrooth’s holdings of shares are presented in the table on page 79. Henrik Ehrnrooth is included in the share-based incentive plan for the Group’s
6.1 MANAGEMENT REMUNERATIONThe key management of KONE consists of the Board of Directors and the Executive Board.
Compensation paid to the key management, MEUR
Jan 1–Dec 31, 2016
Jan 1–Dec 31, 2015
Salaries and other remunerations 8.0 7.5
Share-based payments 14.4 13.8
Total 22.4 21.3
OTHERS
KONE 2016 Annual Review | Notes to the consolidated financial statements | Others
© Cayan Group
55
KONE 2016 Annual Review | Notes to the consolidated financial statements | Others
senior management. The potential bonus is based on the growth in KONE’s net sales and operating profit. In April 2016, on the basis of the incentive plan for year 2015, Henrik Ehrnrooth received a bonus of EUR 3,527,900, which consisted of 40,495 KONE class B shares together with a cash bonus to cover taxes and similar charges arising from the receipt of shares. The cor-responding bonus accrued from 2016 and due for payment in April 2017 is 36,715 KONE class B shares together with a cash bonus to cover taxes and similar charges arising from the receipt of shares. Henrik Ehrnrooth’s retirement age and pension are determined in accordance with Fin-land’s Pensions Act. Statutory pension cost for the year 2016 was EUR 260,775. No separate agreement regarding early retire-ment has been made. Should his employ-ment contract be terminated before retire-
ment, he has the right to the equivalent of 18 months’ salary, which includes the salary for a six-month term of notice.
The compensation for the members of the Executive Board comprises a base salary and a yearly bonus, based on the Group’s annual result and the achieve-ment of personal targets. The bonus amount is determined by the Nomination and Compensation Committee and may not exceed 50 percent of the annual sal-ary. The Executive Board members’ hold-ings of shares are presented in the table on page 79.
The members of the Executive Board are included in the share-based incentive plan for senior management. In April 2016, on the basis of the incentive plan, the members of the Executive Board received a bonus of 183,732 KONE class B shares together with a cash bonus equal
to the amount required to cover taxes and similar charges arising from the receipt of shares. The corresponding bonus accrued from 2016 and due for payment in April 2017 is 282,142 KONE class B shares together with a cash bonus equal to the amount of taxes and similar charges. No separate agreement regarding early retire-ment has been made for the members of the Executive Board. The compensation for the termination of the employment contract prior to retirement is a maximum of 15 months’ salary, which includes the salary for a six-month term of notice.
The amount of the pension liability for Board Member Matti Alahuhta (served as President & CEO until March 31, 2014) included in the balance sheet is EUR 6.6 million at the end of the year 2016 and the monthly pension paid by KONE to him is EUR 21,594 (December 2016).
Share-based incentive planKONE has two separate share-based incentive plans. One plan is targeted for the senior management of KONE includ-ing the President & CEO, members of the Executive Board and other top manage-ment, consisting of approximately 60 individuals. A second plan is targeted for other key personnel of KONE, totaling approximately 425 individuals. The poten-tial reward is based on the annual growth in sales and operating income (EBIT) in both plans. However, KONE´s Board of Directors has the possibility to change the basis of the target setting annually. The potential reward is to be paid as a combination of KONE class B shares and a
cash payment equivalent to the taxes and similar charges that are incurred from the receipt of shares. Plans include conditions preventing participants from transferring and participants are obliged to return the shares and the cash payments if employ-ment or service contract is terminated during a period of two years following the ending of each earning period. As part of the plan for the senior management, a long term target for the their ownership has been set.
As part of the previous share-based incentive plan a total of 391,662 KONE class B shares were granted in April 2016 to the management as a reward due to
the achievement of the targets for the year 2015. During year 2016 a total of 38,182 of those KONE class B shares were returned to KONE Corporation. In April 2017, a total of 485,966 class B shares will be granted to the senior management as a reward due to the achievement of the targets for the year 2016. To the other key personnel of KONE the total reward from the year 2016 is based on the value of 326,113 KONE class B shares to be delivered in January 2019 and reduced by such an amount of shares to be equivalent to the taxes and similar charges that are incurred by the receipt of shares.
6.2 SHARE-BASED PAYMENTS
56
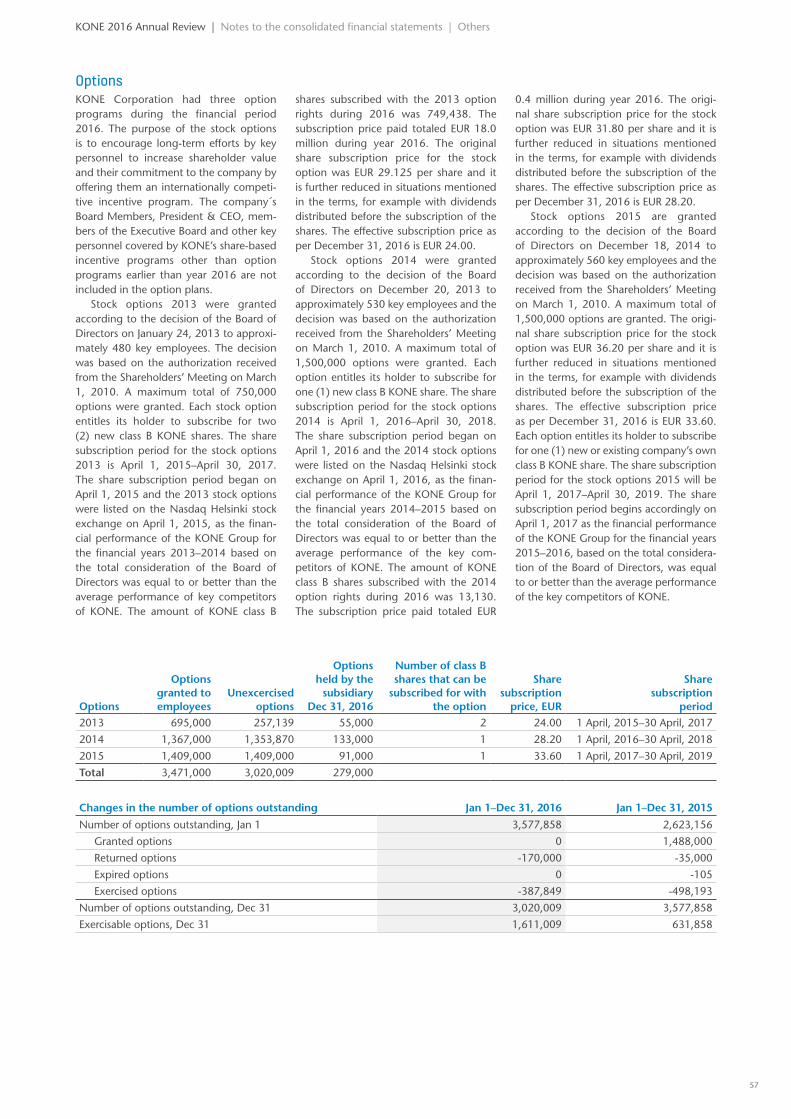
OptionsKONE Corporation had three option programs during the financial period 2016. The purpose of the stock options is to encourage long-term efforts by key personnel to increase shareholder value and their commitment to the company by offering them an internationally competi-tive incentive program. The company´s Board Members, President & CEO, mem-bers of the Executive Board and other key personnel covered by KONE’s share-based incentive programs other than option programs earlier than year 2016 are not included in the option plans.
Stock options 2013 were granted according to the decision of the Board of Directors on January 24, 2013 to approxi-mately 480 key employees. The decision was based on the authorization received from the Shareholders’ Meeting on March 1, 2010. A maximum total of 750,000 options were granted. Each stock option entitles its holder to subscribe for two (2) new class B KONE shares. The share subscription period for the stock options 2013 is April 1, 2015–April 30, 2017. The share subscription period began on April 1, 2015 and the 2013 stock options were listed on the Nasdaq Helsinki stock exchange on April 1, 2015, as the finan-cial performance of the KONE Group for the financial years 2013–2014 based on the total consideration of the Board of Directors was equal to or better than the average performance of key competitors of KONE. The amount of KONE class B
shares subscribed with the 2013 option rights during 2016 was 749,438. The subscription price paid totaled EUR 18.0 million during year 2016. The original share subscription price for the stock option was EUR 29.125 per share and it is further reduced in situations mentioned in the terms, for example with dividends distributed before the subscription of the shares. The effective subscription price as per December 31, 2016 is EUR 24.00.
Stock options 2014 were granted according to the decision of the Board of Directors on December 20, 2013 to approximately 530 key employees and the decision was based on the authorization received from the Shareholders’ Meeting on March 1, 2010. A maximum total of 1,500,000 options were granted. Each option entitles its holder to subscribe for one (1) new class B KONE share. The share subscription period for the stock options 2014 is April 1, 2016–April 30, 2018. The share subscription period began on April 1, 2016 and the 2014 stock options were listed on the Nasdaq Helsinki stock exchange on April 1, 2016, as the finan-cial performance of the KONE Group for the financial years 2014–2015 based on the total consideration of the Board of Directors was equal to or better than the average performance of the key com-petitors of KONE. The amount of KONE class B shares subscribed with the 2014 option rights during 2016 was 13,130. The subscription price paid totaled EUR
0.4 million during year 2016. The origi-nal share subscription price for the stock option was EUR 31.80 per share and it is further reduced in situations mentioned in the terms, for example with dividends distributed before the subscription of the shares. The effective subscription price as per December 31, 2016 is EUR 28.20.
Stock options 2015 are granted according to the decision of the Board of Directors on December 18, 2014 to approximately 560 key employees and the decision was based on the authorization received from the Shareholders’ Meeting on March 1, 2010. A maximum total of 1,500,000 options are granted. The origi-nal share subscription price for the stock option was EUR 36.20 per share and it is further reduced in situations mentioned in the terms, for example with dividends distributed before the subscription of the shares. The effective subscription price as per December 31, 2016 is EUR 33.60. Each option entitles its holder to subscribe for one (1) new or existing company’s own class B KONE share. The share subscription period for the stock options 2015 will be April 1, 2017–April 30, 2019. The share subscription period begins accordingly on April 1, 2017 as the financial performance of the KONE Group for the financial years 2015–2016, based on the total considera-tion of the Board of Directors, was equal to or better than the average performance of the key competitors of KONE.
Options
Options granted to employees
Unexcercised options
Options held by the
subsidiary Dec 31, 2016
Number of class B shares that can be
subscribed for with the option
Share subscription
price, EUR
Share subscription
period2013 695,000 257,139 55,000 2 24.00 1 April, 2015–30 April, 2017
2014 1,367,000 1,353,870 133,000 1 28.20 1 April, 2016–30 April, 2018
2015 1,409,000 1,409,000 91,000 1 33.60 1 April, 2017–30 April, 2019
Total 3,471,000 3,020,009 279,000
Changes in the number of options outstanding Jan 1–Dec 31, 2016 Jan 1–Dec 31, 2015
Number of options outstanding, Jan 1 3,577,858 2,623,156
Granted options 0 1,488,000
Returned options -170,000 -35,000
Expired options 0 -105
Exercised options -387,849 -498,193
Number of options outstanding, Dec 31 3,020,009 3,577,858
Exercisable options, Dec 31 1,611,009 631,858
KONE 2016 Annual Review | Notes to the consolidated financial statements | Others
57
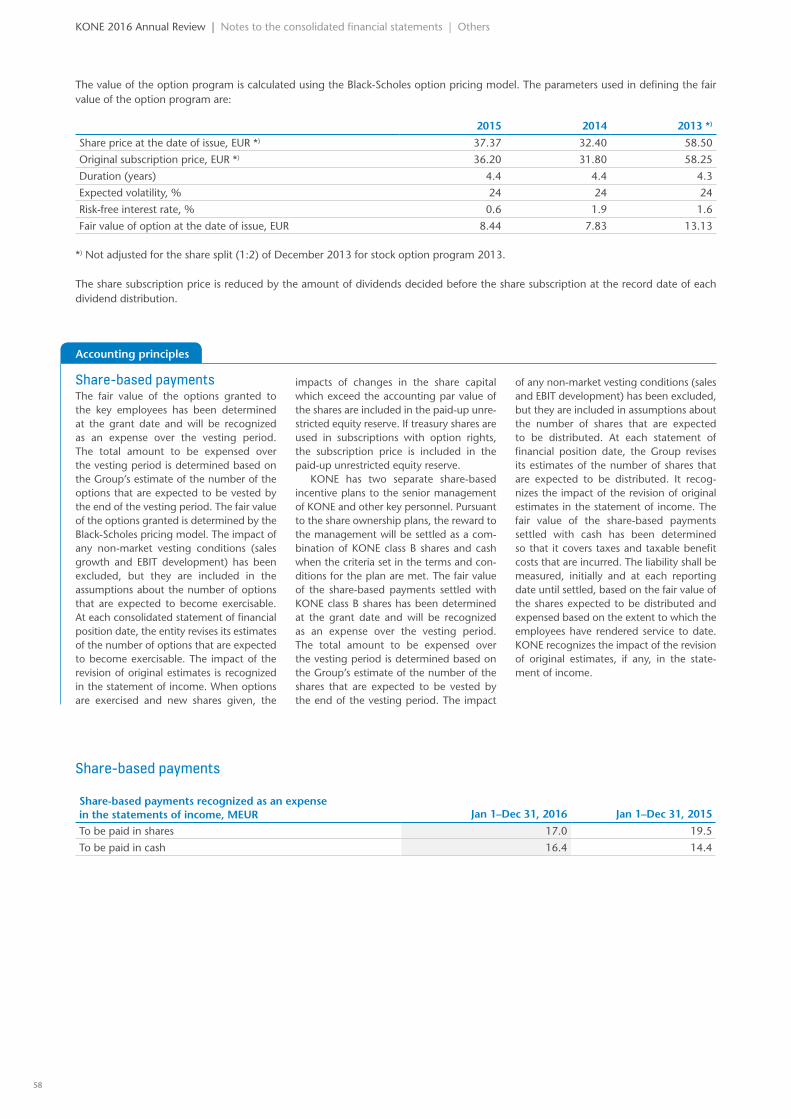
Share-based paymentsThe fair value of the options granted to the key employees has been determined at the grant date and will be recognized as an expense over the vesting period. The total amount to be expensed over the vesting period is determined based on the Group’s estimate of the number of the options that are expected to be vested by the end of the vesting period. The fair value of the options granted is determined by the Black-Scholes pricing model. The impact of any non-market vesting conditions (sales growth and EBIT development) has been excluded, but they are included in the assumptions about the number of options that are expected to become exercisable. At each consolidated statement of financial position date, the entity revises its estimates of the number of options that are expected to become exercisable. The impact of the revision of original estimates is recognized in the statement of income. When options are exercised and new shares given, the
impacts of changes in the share capital which exceed the accounting par value of the shares are included in the paid-up unre-stricted equity reserve. If treasury shares are used in subscriptions with option rights, the subscription price is included in the paid-up unrestricted equity reserve.
KONE has two separate share-based incentive plans to the senior management of KONE and other key personnel. Pursuant to the share ownership plans, the reward to the management will be settled as a com-bination of KONE class B shares and cash when the criteria set in the terms and con-ditions for the plan are met. The fair value of the share-based payments settled with KONE class B shares has been determined at the grant date and will be recognized as an expense over the vesting period. The total amount to be expensed over the vesting period is determined based on the Group’s estimate of the num ber of the shares that are expected to be vested by the end of the vesting period. The impact
of any non-market vesting conditions (sales and EBIT development) has been excluded, but they are included in assumptions about the number of shares that are expected to be distributed. At each statement of financial posi tion date, the Group revises its estimates of the number of shares that are expected to be distributed. It recog-nizes the impact of the revision of original estimates in the statement of income. The fair value of the share-based payments settled with cash has been determined so that it covers taxes and taxable benefit costs that are incurred. The liability shall be measured, initially and at each reporting date until settled, based on the fair value of the shares expected to be distributed and expensed based on the extent to which the employees have ren dered service to date. KONE recognizes the impact of the revision of original estimates, if any, in the state-ment of income.
Accounting principles
KONE 2016 Annual Review | Notes to the consolidated financial statements | Others
Share-based payments
Share-based payments recognized as an expense in the statements of income, MEUR Jan 1–Dec 31, 2016 Jan 1–Dec 31, 2015
To be paid in shares 17.0 19.5
To be paid in cash 16.4 14.4
The value of the option program is calculated using the Black-Scholes option pricing model. The parameters used in defining the fair value of the option program are:
2015 2014 2013 *)
Share price at the date of issue, EUR *) 37.37 32.40 58.50
Original subscription price, EUR *) 36.20 31.80 58.25
Duration (years) 4.4 4.4 4.3
Expected volatility, % 24 24 24
Risk-free interest rate, % 0.6 1.9 1.6
Fair value of option at the date of issue, EUR 8.44 7.83 13.13
*) Not adjusted for the share split (1:2) of December 2013 for stock option program 2013.
The share subscription price is reduced by the amount of dividends decided before the share subscription at the record date of each dividend distribution.
58
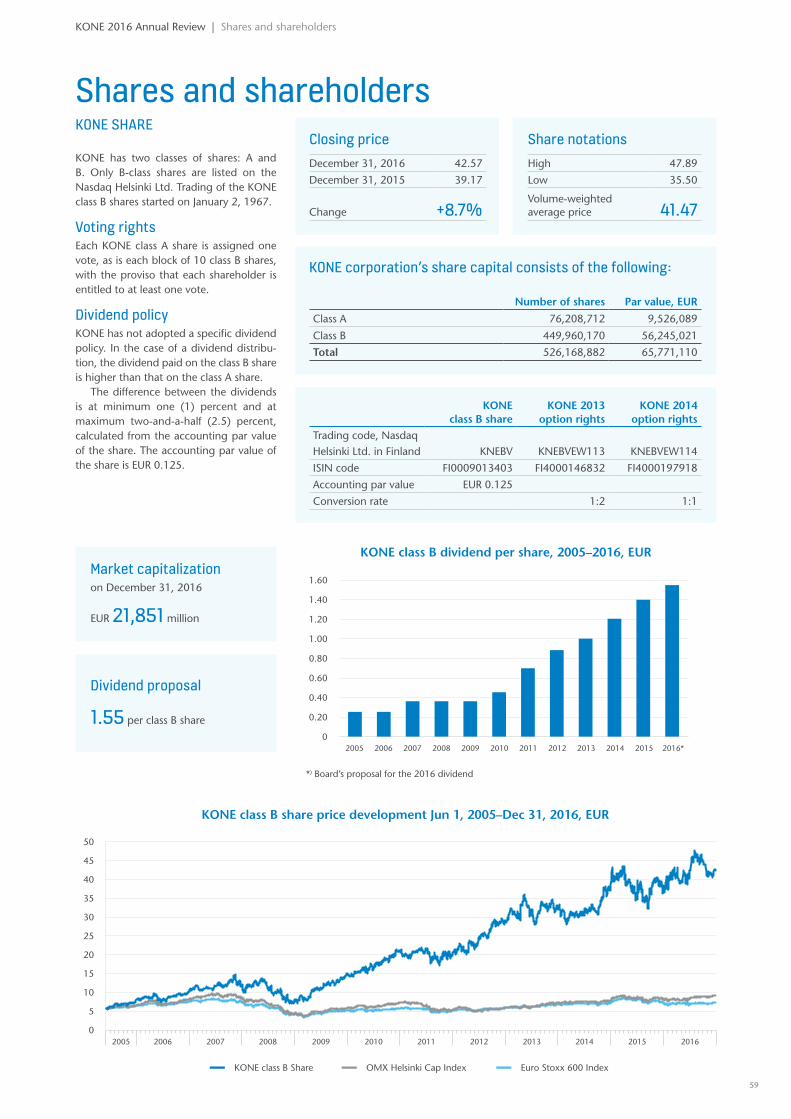
50
45
40
35
30
25
20
15
10
5
020132010 2011 201220092008200720062005 2014 2015 2016
Shares and shareholders
KONE corporation’s share capital consists of the following:
Number of shares Par value, EUR
Class A 76,208,712 9,526,089
Class B 449,960,170 56,245,021
Total 526,168,882 65,771,110
KONE class B share
KONE 2013option rights
KONE 2014option rights
Trading code, Nasdaq Helsinki Ltd. in Finland KNEBV KNEBVEW113 KNEBVEW114
ISIN code FI0009013403 FI4000146832 FI4000197918
Accounting par value EUR 0.125
Conversion rate 1:2 1:1
KONE 2016 Annual Review | Shares and shareholders
KONE SHARE
KONE has two classes of shares: A and B. Only B-class shares are listed on the Nasdaq Helsinki Ltd. Trading of the KONE class B shares started on January 2, 1967.
Voting rightsEach KONE class A share is assigned one vote, as is each block of 10 class B shares, with the proviso that each shareholder is entitled to at least one vote.
Dividend policyKONE has not adopted a specific dividend policy. In the case of a dividend distribu-tion, the dividend paid on the class B share is higher than that on the class A share.
The difference between the dividends is at minimum one (1) percent and at maximum two-and-a-half (2.5) percent, calculated from the accounting par value of the share. The accounting par value of the share is EUR 0.125.
KONE class B share price development Jun 1, 2005–Dec 31, 2016, EUR
KONE class B Share OMX Helsinki Cap Index Euro Stoxx 600 Index
Closing priceDecember 31, 2016 42.57
December 31, 2015 39.17
Change +8.7%
Dividend proposal
1.55 per class B share
Share notationsHigh 47.89
Low 35.50
Volume-weighted average price 41.47
Market capitalization on December 31, 2016
EUR 21,851 million
1.60
1.40
1.20
1.00
0.80
0.60
0.40
0.20
0
KONE class B dividend per share, 2005–2016, EUR
*) Board’s proposal for the 2016 dividend
59
20132010 2011 201220092008200720062005 2014 2015 2016*
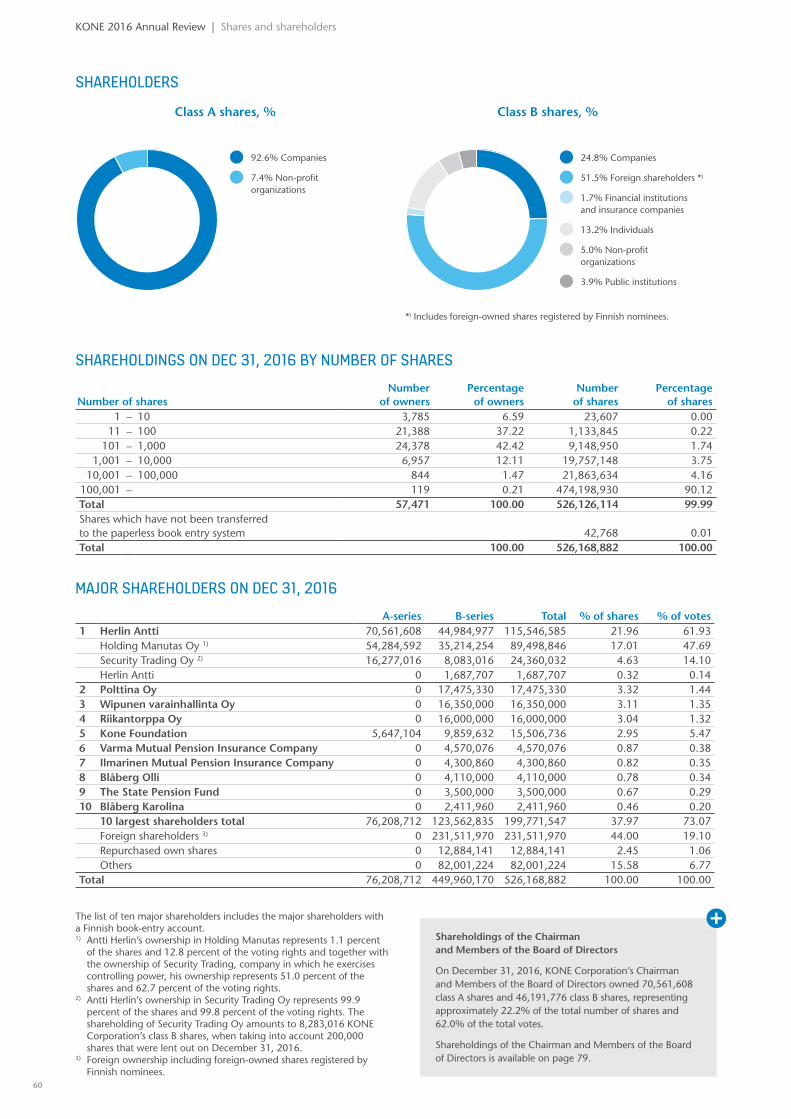
SHAREHOLDERS
Class A shares, % Class B shares, %
*) Includes foreign-owned shares registered by Finnish nominees.
24.8% Companies
51.5% Foreign shareholders *)
1.7% Financial institutions and insurance companies
13.2% Individuals
5.0% Non-profit organizations
3.9% Public institutions
92.6% Companies
7.4% Non-profit organizations
Shareholdings of the Chairman and Members of the Board of Directors
On December 31, 2016, KONE Corporation’s Chairman and Members of the Board of Directors owned 70,561,608 class A shares and 46,191,776 class B shares, representing approximately 22.2% of the total number of shares and 62.0% of the total votes.
Shareholdings of the Chairman and Members of the Board of Directors is available on page 79.
KONE 2016 Annual Review | Shares and shareholders
SHAREHOLDINGS ON DEC 31, 2016 BY NUMBER OF SHARES
Number of sharesNumber
of ownersPercentage
of ownersNumber
of sharesPercentage
of shares1 – 10 3,785 6.59 23,607 0.00
11 – 100 21,388 37.22 1,133,845 0.22101 – 1,000 24,378 42.42 9,148,950 1.74
1,001 – 10,000 6,957 12.11 19,757,148 3.7510,001 – 100,000 844 1.47 21,863,634 4.16
100,001 – 119 0.21 474,198,930 90.12Total 57,471 100.00 526,126,114 99.99Shares which have not been transferred to the paperless book entry system 42,768 0.01Total 100.00 526,168,882 100.00
MAJOR SHAREHOLDERS ON DEC 31, 2016 A-series B-series Total % of shares % of votes 1 Herlin Antti 70,561,608 44,984,977 115,546,585 21.96 61.93 Holding Manutas Oy 1) 54,284,592 35,214,254 89,498,846 17.01 47.69 Security Trading Oy 2) 16,277,016 8,083,016 24,360,032 4.63 14.10 Herlin Antti 0 1,687,707 1,687,707 0.32 0.142 Polttina Oy 0 17,475,330 17,475,330 3.32 1.443 Wipunen varainhallinta Oy 0 16,350,000 16,350,000 3.11 1.354 Riikantorppa Oy 0 16,000,000 16,000,000 3.04 1.325 Kone Foundation 5,647,104 9,859,632 15,506,736 2.95 5.476 Varma Mutual Pension Insurance Company 0 4,570,076 4,570,076 0.87 0.387 Ilmarinen Mutual Pension Insurance Company 0 4,300,860 4,300,860 0.82 0.358 Blåberg Olli 0 4,110,000 4,110,000 0.78 0.349 The State Pension Fund 0 3,500,000 3,500,000 0.67 0.2910 Blåberg Karolina 0 2,411,960 2,411,960 0.46 0.20 10 largest shareholders total 76,208,712 123,562,835 199,771,547 37.97 73.07 Foreign shareholders 3) 0 231,511,970 231,511,970 44.00 19.10
Repurchased own shares 0 12,884,141 12,884,141 2.45 1.06 Others 0 82,001,224 82,001,224 15.58 6.77Total 76,208,712 449,960,170 526,168,882 100.00 100.00
The list of ten major shareholders includes the major shareholders with a Finnish book-entry account.1) Antti Herlin’s ownership in Holding Manutas represents 1.1 percent
of the shares and 12.8 percent of the voting rights and together with the ownership of Security Trading, company in which he exercises controlling power, his ownership represents 51.0 percent of the shares and 62.7 percent of the voting rights.
2) Antti Herlin’s ownership in Security Trading Oy represents 99.9 percent of the shares and 99.8 percent of the voting rights. The shareholding of Security Trading Oy amounts to 8,283,016 KONE Corporation’s class B shares, when taking into account 200,000 shares that were lent out on December 31, 2016.
3) Foreign ownership including foreign-owned shares registered by Finnish nominees.
60
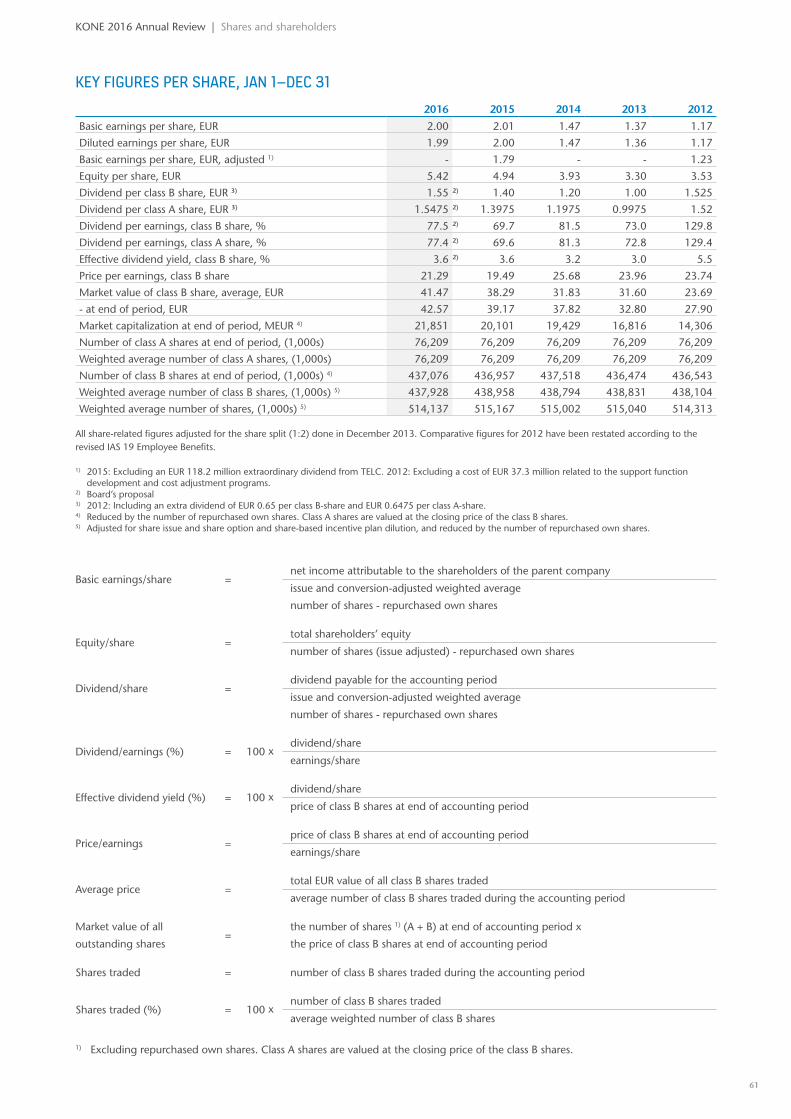
KEY FIGURES PER SHARE, JAN 1–DEC 312016 2015 2014 2013 2012
Basic earnings per share, EUR 2.00 2.01 1.47 1.37 1.17
Diluted earnings per share, EUR 1.99 2.00 1.47 1.36 1.17
Basic earnings per share, EUR, adjusted 1) - 1.79 - - 1.23
Equity per share, EUR 5.42 4.94 3.93 3.30 3.53
Dividend per class B share, EUR 3) 1.55 2) 1.40 1.20 1.00 1.525
Dividend per class A share, EUR 3) 1.5475 2) 1.3975 1.1975 0.9975 1.52
Dividend per earnings, class B share, % 77.5 2) 69.7 81.5 73.0 129.8
Dividend per earnings, class A share, % 77.4 2) 69.6 81.3 72.8 129.4
Effective dividend yield, class B share, % 3.6 2) 3.6 3.2 3.0 5.5
Price per earnings, class B share 21.29 19.49 25.68 23.96 23.74
Market value of class B share, average, EUR 41.47 38.29 31.83 31.60 23.69
- at end of period, EUR 42.57 39.17 37.82 32.80 27.90
Market capitalization at end of period, MEUR 4) 21,851 20,101 19,429 16,816 14,306
Number of class A shares at end of period, (1,000s) 76,209 76,209 76,209 76,209 76,209
Weighted average number of class A shares, (1,000s) 76,209 76,209 76,209 76,209 76,209
Number of class B shares at end of period, (1,000s) 4) 437,076 436,957 437,518 436,474 436,543
Weighted average number of class B shares, (1,000s) 5) 437,928 438,958 438,794 438,831 438,104
Weighted average number of shares, (1,000s) 5) 514,137 515,167 515,002 515,040 514,313
All share-related figures adjusted for the share split (1:2) done in December 2013. Comparative figures for 2012 have been restated according to the revised IAS 19 Employee Benefits.
1) 2015: Excluding an EUR 118.2 million extraordinary dividend from TELC. 2012: Excluding a cost of EUR 37.3 million related to the support function development and cost adjustment programs.
2) Board’s proposal3) 2012: Including an extra dividend of EUR 0.65 per class B-share and EUR 0.6475 per class A-share. 4) Reduced by the number of repurchased own shares. Class A shares are valued at the closing price of the class B shares.5) Adjusted for share issue and share option and share-based incentive plan dilution, and reduced by the number of repurchased own shares.
Basic earnings/share = net income attributable to the shareholders of the parent company
issue and conversion-adjusted weighted average
number of shares - repurchased own shares
Equity/share = total shareholders’ equity
number of shares (issue adjusted) - repurchased own shares
Dividend/share = dividend payable for the accounting period
issue and conversion-adjusted weighted average
number of shares - repurchased own shares
Dividend/earnings (%) = 100 x dividend/share
earnings/share
Effective dividend yield (%) = 100 x dividend/share
price of class B shares at end of accounting period
Price/earnings = price of class B shares at end of accounting period
earnings/share
Average price = total EUR value of all class B shares traded
average number of class B shares traded during the accounting period Market value of all
outstanding shares=
the number of shares 1) (A + B) at end of accounting period x
the price of class B shares at end of accounting period Shares traded = number of class B shares traded during the accounting period
Shares traded (%) = 100 x number of class B shares traded
average weighted number of class B shares
1) Excluding repurchased own shares. Class A shares are valued at the closing price of the class B shares.
KONE 2016 Annual Review | Shares and shareholders
61
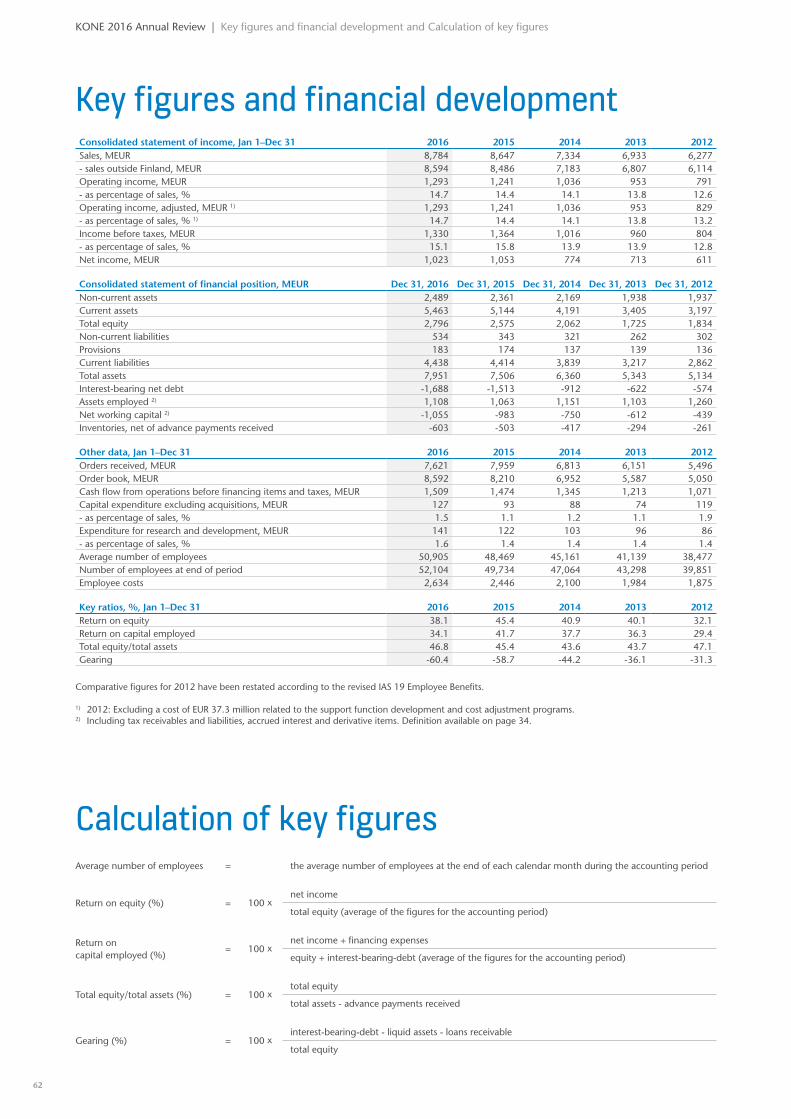
Key figures and financial developmentConsolidated statement of income, Jan 1–Dec 31 2016 2015 2014 2013 2012Sales, MEUR 8,784 8,647 7,334 6,933 6,277- sales outside Finland, MEUR 8,594 8,486 7,183 6,807 6,114Operating income, MEUR 1,293 1,241 1,036 953 791- as percentage of sales, % 14.7 14.4 14.1 13.8 12.6Operating income, adjusted, MEUR 1) 1,293 1,241 1,036 953 829- as percentage of sales, % 1) 14.7 14.4 14.1 13.8 13.2Income before taxes, MEUR 1,330 1,364 1,016 960 804- as percentage of sales, % 15.1 15.8 13.9 13.9 12.8Net income, MEUR 1,023 1,053 774 713 611
Consolidated statement of financial position, MEUR Dec 31, 2016 Dec 31, 2015 Dec 31, 2014 Dec 31, 2013 Dec 31, 2012Non-current assets 2,489 2,361 2,169 1,938 1,937Current assets 5,463 5,144 4,191 3,405 3,197Total equity 2,796 2,575 2,062 1,725 1,834Non-current liabilities 534 343 321 262 302Provisions 183 174 137 139 136Current liabilities 4,438 4,414 3,839 3,217 2,862Total assets 7,951 7,506 6,360 5,343 5,134Interest-bearing net debt -1,688 -1,513 -912 -622 -574Assets employed 2) 1,108 1,063 1,151 1,103 1,260Net working capital 2) -1,055 -983 -750 -612 -439Inventories, net of advance payments received -603 -503 -417 -294 -261
Other data, Jan 1–Dec 31 2016 2015 2014 2013 2012Orders received, MEUR 7,621 7,959 6,813 6,151 5,496Order book, MEUR 8,592 8,210 6,952 5,587 5,050Cash flow from operations before financing items and taxes, MEUR 1,509 1,474 1,345 1,213 1,071Capital expenditure excluding acquisitions, MEUR 127 93 88 74 119- as percentage of sales, % 1.5 1.1 1.2 1.1 1.9Expenditure for research and development, MEUR 141 122 103 96 86- as percentage of sales, % 1.6 1.4 1.4 1.4 1.4Average number of employees 50,905 48,469 45,161 41,139 38,477Number of employees at end of period 52,104 49,734 47,064 43,298 39,851Employee costs 2,634 2,446 2,100 1,984 1,875
Key ratios, %, Jan 1–Dec 31 2016 2015 2014 2013 2012Return on equity 38.1 45.4 40.9 40.1 32.1Return on capital employed 34.1 41.7 37.7 36.3 29.4Total equity/total assets 46.8 45.4 43.6 43.7 47.1Gearing -60.4 -58.7 -44.2 -36.1 -31.3
Comparative figures for 2012 have been restated according to the revised IAS 19 Employee Benefits.
1) 2012: Excluding a cost of EUR 37.3 million related to the support function development and cost adjustment programs.2) Including tax receivables and liabilities, accrued interest and derivative items. Definition available on page 34.
Calculation of key figuresAverage number of employees = the average number of employees at the end of each calendar month during the accounting period
Return on equity (%) = 100 x net income
total equity (average of the figures for the accounting period)
Return on capital employed (%)
= 100 x net income + financing expenses
equity + interest-bearing-debt (average of the figures for the accounting period)
Total equity/total assets (%) = 100 xtotal equity
total assets - advance payments received
Gearing (%) = 100 xinterest-bearing-debt - liquid assets - loans receivable
total equity
KONE 2016 Annual Review | Key figures and financial development and Calculation of key figures
62
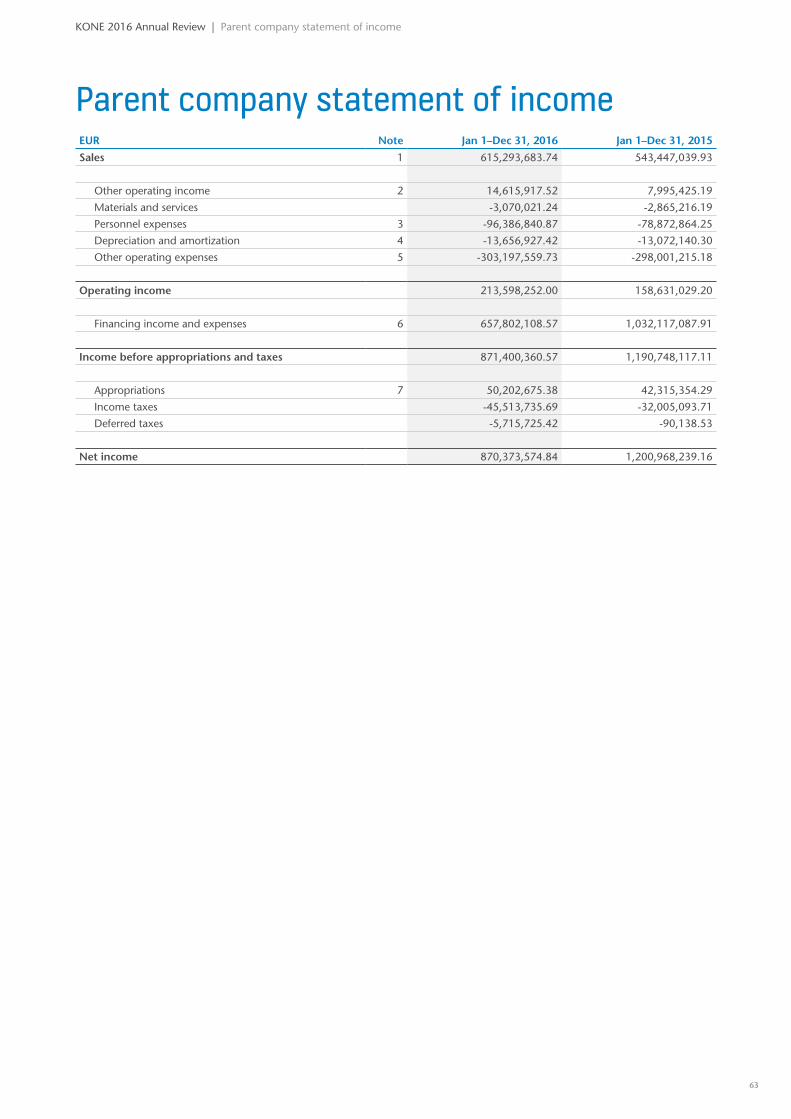
Parent company statement of incomeEUR Note Jan 1–Dec 31, 2016 Jan 1–Dec 31, 2015
Sales 1 615,293,683.74 543,447,039.93
Other operating income 2 14,615,917.52 7,995,425.19
Materials and services -3,070,021.24 -2,865,216.19
Personnel expenses 3 -96,386,840.87 -78,872,864.25
Depreciation and amortization 4 -13,656,927.42 -13,072,140.30
Other operating expenses 5 -303,197,559.73 -298,001,215.18
Operating income 213,598,252.00 158,631,029.20
Financing income and expenses 6 657,802,108.57 1,032,117,087.91
Income before appropriations and taxes 871,400,360.57 1,190,748,117.11
Appropriations 7 50,202,675.38 42,315,354.29
Income taxes -45,513,735.69 -32,005,093.71
Deferred taxes -5,715,725.42 -90,138.53
Net income 870,373,574.84 1,200,968,239.16
KONE 2016 Annual Review | Parent company statement of income
63
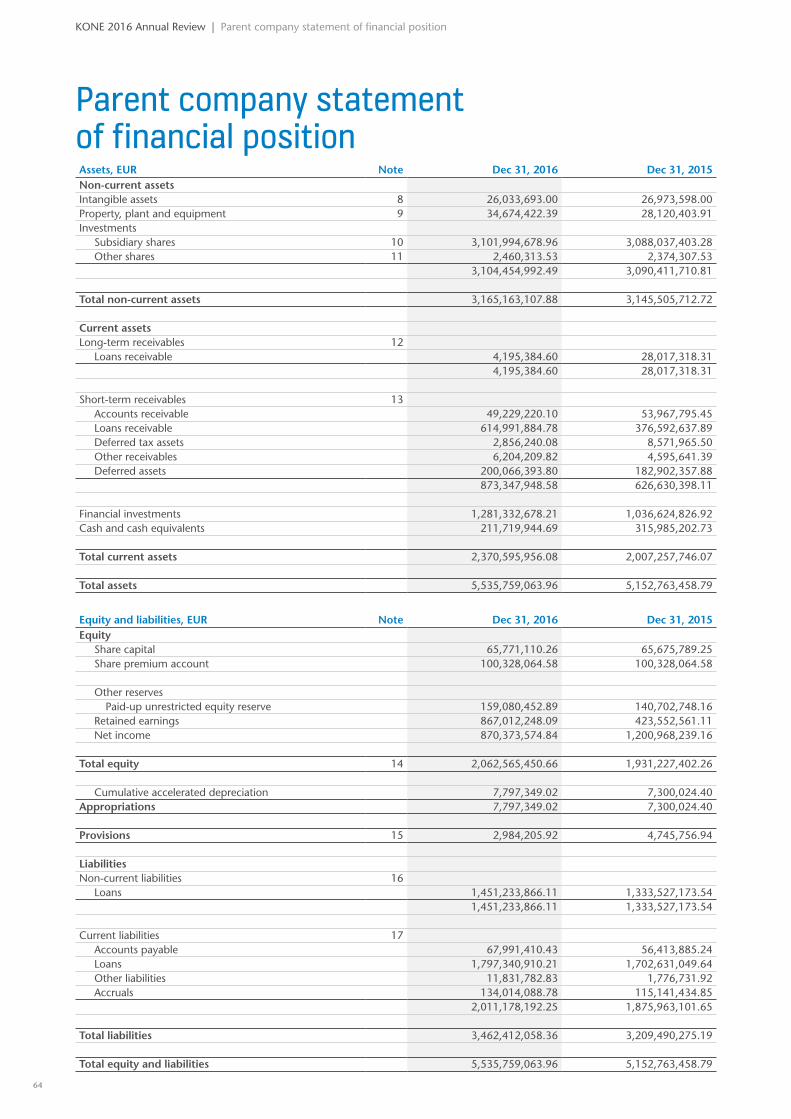
Parent company statement of financial position
KONE 2016 Annual Review | Parent company statement of financial position
Assets, EUR Note Dec 31, 2016 Dec 31, 2015Non-current assetsIntangible assets 8 26,033,693.00 26,973,598.00Property, plant and equipment 9 34,674,422.39 28,120,403.91Investments
Subsidiary shares 10 3,101,994,678.96 3,088,037,403.28Other shares 11 2,460,313.53 2,374,307.53
3,104,454,992.49 3,090,411,710.81
Total non-current assets 3,165,163,107.88 3,145,505,712.72
Current assetsLong-term receivables 12
Loans receivable 4,195,384.60 28,017,318.314,195,384.60 28,017,318.31
Short-term receivables 13Accounts receivable 49,229,220.10 53,967,795.45Loans receivable 614,991,884.78 376,592,637.89Deferred tax assets 2,856,240.08 8,571,965.50Other receivables 6,204,209.82 4,595,641.39Deferred assets 200,066,393.80 182,902,357.88
873,347,948.58 626,630,398.11
Financial investments 1,281,332,678.21 1,036,624,826.92Cash and cash equivalents 211,719,944.69 315,985,202.73
Total current assets 2,370,595,956.08 2,007,257,746.07
Total assets 5,535,759,063.96 5,152,763,458.79
Equity and liabilities, EUR Note Dec 31, 2016 Dec 31, 2015Equity
Share capital 65,771,110.26 65,675,789.25Share premium account 100,328,064.58 100,328,064.58
Other reservesPaid-up unrestricted equity reserve 159,080,452.89 140,702,748.16
Retained earnings 867,012,248.09 423,552,561.11Net income 870,373,574.84 1,200,968,239.16
Total equity 14 2,062,565,450.66 1,931,227,402.26
Cumulative accelerated depreciation 7,797,349.02 7,300,024.40Appropriations 7,797,349.02 7,300,024.40
Provisions 15 2,984,205.92 4,745,756.94
LiabilitiesNon-current liabilities 16
Loans 1,451,233,866.11 1,333,527,173.541,451,233,866.11 1,333,527,173.54
Current liabilities 17Accounts payable 67,991,410.43 56,413,885.24Loans 1,797,340,910.21 1,702,631,049.64Other liabilities 11,831,782.83 1,776,731.92Accruals 134,014,088.78 115,141,434.85
2,011,178,192.25 1,875,963,101.65
Total liabilities 3,462,412,058.36 3,209,490,275.19
Total equity and liabilities 5,535,759,063.96 5,152,763,458.79
64
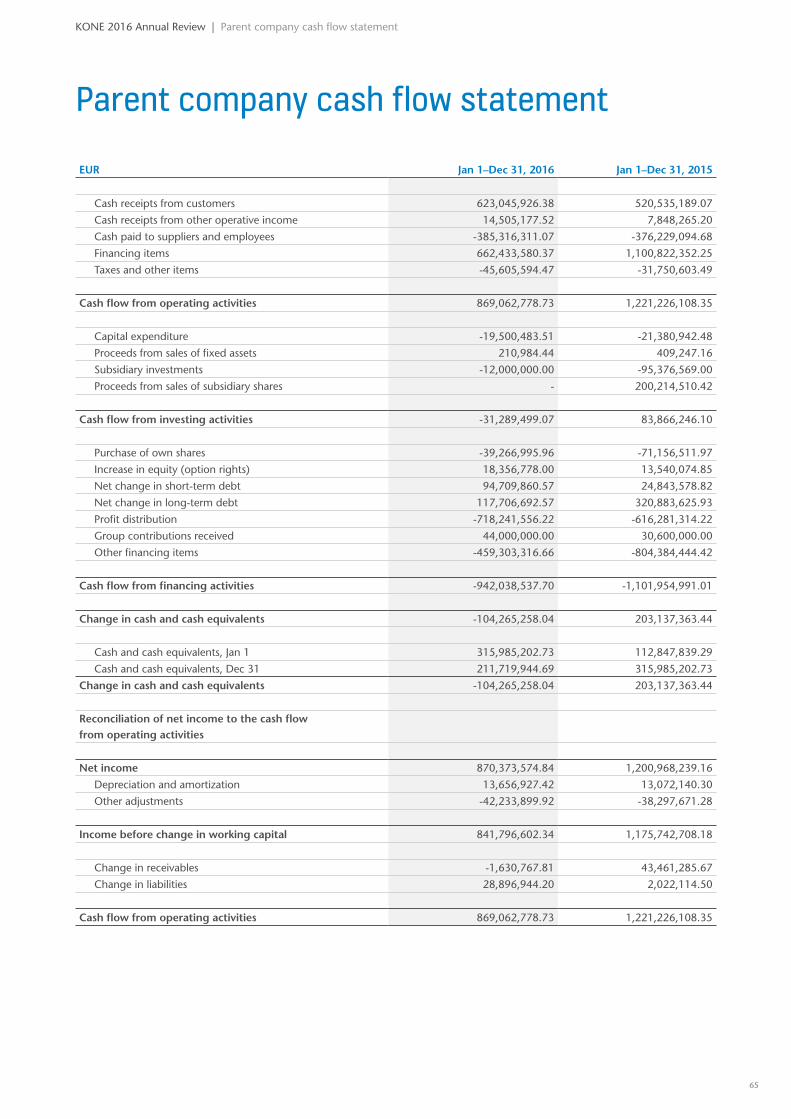
Parent company cash flow statement
EUR Jan 1–Dec 31, 2016 Jan 1–Dec 31, 2015
Cash receipts from customers 623,045,926.38 520,535,189.07
Cash receipts from other operative income 14,505,177.52 7,848,265.20
Cash paid to suppliers and employees -385,316,311.07 -376,229,094.68
Financing items 662,433,580.37 1,100,822,352.25
Taxes and other items -45,605,594.47 -31,750,603.49
Cash flow from operating activities 869,062,778.73 1,221,226,108.35
Capital expenditure -19,500,483.51 -21,380,942.48
Proceeds from sales of fixed assets 210,984.44 409,247.16
Subsidiary investments -12,000,000.00 -95,376,569.00
Proceeds from sales of subsidiary shares - 200,214,510.42
Cash flow from investing activities -31,289,499.07 83,866,246.10
Purchase of own shares -39,266,995.96 -71,156,511.97
Increase in equity (option rights) 18,356,778.00 13,540,074.85
Net change in short-term debt 94,709,860.57 24,843,578.82
Net change in long-term debt 117,706,692.57 320,883,625.93
Profit distribution -718,241,556.22 -616,281,314.22
Group contributions received 44,000,000.00 30,600,000.00
Other financing items -459,303,316.66 -804,384,444.42
Cash flow from financing activities -942,038,537.70 -1,101,954,991.01
Change in cash and cash equivalents -104,265,258.04 203,137,363.44
Cash and cash equivalents, Jan 1 315,985,202.73 112,847,839.29
Cash and cash equivalents, Dec 31 211,719,944.69 315,985,202.73
Change in cash and cash equivalents -104,265,258.04 203,137,363.44
Reconciliation of net income to the cash flow from operating activities
Net income 870,373,574.84 1,200,968,239.16
Depreciation and amortization 13,656,927.42 13,072,140.30
Other adjustments -42,233,899.92 -38,297,671.28
Income before change in working capital 841,796,602.34 1,175,742,708.18
Change in receivables -1,630,767.81 43,461,285.67
Change in liabilities 28,896,944.20 2,022,114.50
Cash flow from operating activities 869,062,778.73 1,221,226,108.35
KONE 2016 Annual Review | Parent company cash flow statement
65
Accounting principles of the parent company financial statementsThe parent company financial statements have been prepared according to the Finnish Accounting Standards. Financial statements have been prepared for the period of 12 months between January 1 and December 31, 2016.
Foreign currency transactionsTransactions in foreign currencies are recorded at the rate of exchange prevail-ing on the date of the individual trans-action. Foreign currency denominated receivables and liabilities are translated using the period end exchange rates.
Foreign exchange gains and losses associated with loans, deposits and other statement of financial position items are included under financing income and expenses.
Derivative instrumentsDerivate financial instruments that are used to hedge the currency and the interest rate risks as well as to hedge the commodity risk related to the electricity price risk are initially and subsequently recognized at fair value in the statement of financial position. The fair values of foreign exchange forward contracts are calculated by discounting the future cash flows of the contracts with the relevant market interest rate yield curves on the valuation date and by calculating the difference between the discounted values in euros. The fair values of cross currency swaps are determined by discounting the expected future cash flows of the contracts with the market interest rate yield curves of the currencies concerned. The fair value of electricity price forwards is based on electricity stock exchange prices on the valuation date. The fair values of derivative financial instruments are presented in note 19.
Changes in the fair values of foreign exchange derivatives are recognized in financing income and expenses if the hedged item is a loan receivable, deposit or a financial asset or liability denominated in a foreign currency. Fair value changes of electricity price forwards designated as hedges against future electricity purchases are recognized in the income statement as adjustment items to purchases.
Revenue recognitionRevenues related to the utilization of intangible property rights are recognized as sales on an accrual basis, according to the existing contracts. The sales of services are recognized as sales when the services
have been rendered or when the work is being carried out.
Research and development costResearch and development costs are expensed as they incur.
PensionsAn external pension insurance company manages the parent company statutory pension plan. Contributions to the pen-sion plan are charged directly to the state-ment of income in the year to which these contributions relate.
LeasesLeasing payments are charged to the statement of income on a straight-line basis over the leasing term. Remaining future leasing liabilities from existing con-tracts are presented in note 18.
TaxesTax expense includes taxes based on tax-able income for the period, together with tax adjustments for previous periods and changes in deferred taxes. Deferred taxes are provided for temporary differences arising between the tax basis of assets and liabilities and their book values in financial reporting, and measured with enacted tax rates.
Deferred tax liabilities arising from temporary differences are fully recognized with prudency, whereas the deferred tax assets are recognized only to the extent of the probable future tax benefit.
Non-current assetsIntangible assets and property, plant and equipment are stated at the cost less accu-mulated depreciation and amortization. Depreciation and amortization is recorded on a straight-line basis over the economic useful lives of the assets as follows:
Buildings 5–40 yearsMachinery and equipment 4–10 yearsOther long-term expenditure 4–10 years
Land is not depreciated.
Investments in subsidiaries and other com-panies are measured at cost, or fair value in case the fair value is less than cost.
ProvisionsFuture costs in which the parent company has committed to and which probably will not contribute in future revenues are recognized in provisions.
Financial risk managementParent company business activities are exposed to financial risks such as foreign exchange risks, interest rate risks, liquid-ity risks and credit risks. These financial risks are managed in accordance with the KONE Treasury Policy. Parent company financials risks are not significantly differ-ent from the group’s financials risks, see notes 2.4 and 5.3.
Cash and cash equivalentsCash and cash equivalents includes cash-in-hand and bank account balances. Used bank overdrafts are included in other cur-rent liabilities.
Share-based paymentsKONE has two separate share-based incentive plans to the senior manage-ment of KONE and other key personnel. Pursuant to the share ownership plans, the reward to the management will be settled as a combination of KONE class B shares and cash when the criteria set in the terms and conditions for the plan are met. The fair value of the share-based payments settled with KONE class B shares has been determined at the grant date and will be recognized as an expense over the vesting period. The total amount to be expensed over the vesting period is determined based on the company’s estimate of the num ber of the shares that are expected to be vested by the end of the vesting period. The impact of any non-market vesting conditions (sales and EBIT devel-opment) has been excluded, but they are included in assumptions about the number of shares that are expected to be distributed. At each statement of financial posi tion date, the company revises its estimates of the number of shares that are expected to be distributed. It recognizes the impact of the revision of original esti-mates in the statement of income. The fair value of the share-based payments settled with cash has been determined so that it covers taxes and taxable benefit costs that are incurred. The liability shall be mea-sured, initially and at each reporting date until settled, based on the fair value of the shares expected to be distributed and expensed based on the extent to which the employees have ren dered service to date. KONE recognizes the impact of the revision of original estimates, if any, in the statement of income.
KONE 2016 Annual Review | Accounting principles of the parent company financial statements
66
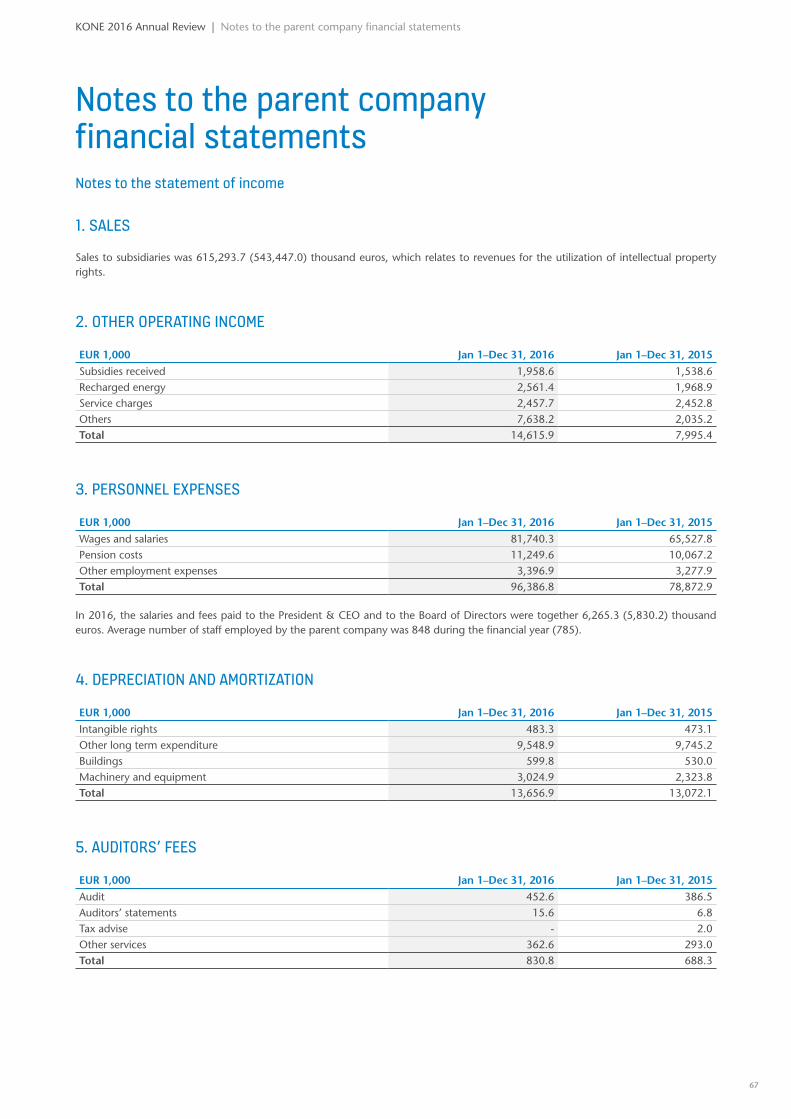
Notes to the parent company financial statementsNotes to the statement of income
1. SALES
Sales to subsidiaries was 615,293.7 (543,447.0) thousand euros, which relates to revenues for the utilization of intellectual property rights.
2. OTHER OPERATING INCOME
EUR 1,000 Jan 1–Dec 31, 2016 Jan 1–Dec 31, 2015
Subsidies received 1,958.6 1,538.6Recharged energy 2,561.4 1,968.9Service charges 2,457.7 2,452.8Others 7,638.2 2,035.2Total 14,615.9 7,995.4
3. PERSONNEL EXPENSES
EUR 1,000 Jan 1–Dec 31, 2016 Jan 1–Dec 31, 2015
Wages and salaries 81,740.3 65,527.8Pension costs 11,249.6 10,067.2Other employment expenses 3,396.9 3,277.9Total 96,386.8 78,872.9
In 2016, the salaries and fees paid to the President & CEO and to the Board of Directors were together 6,265.3 (5,830.2) thousand euros. Average number of staff employed by the parent company was 848 during the financial year (785).
4. DEPRECIATION AND AMORTIZATION
EUR 1,000 Jan 1–Dec 31, 2016 Jan 1–Dec 31, 2015
Intangible rights 483.3 473.1Other long term expenditure 9,548.9 9,745.2Buildings 599.8 530.0Machinery and equipment 3,024.9 2,323.8Total 13,656.9 13,072.1
5. AUDITORS’ FEES
EUR 1,000 Jan 1–Dec 31, 2016 Jan 1–Dec 31, 2015
Audit 452.6 386.5Auditors’ statements 15.6 6.8Tax advise - 2.0Other services 362.6 293.0Total 830.8 688.3
KONE 2016 Annual Review | Notes to the parent company financial statements
67
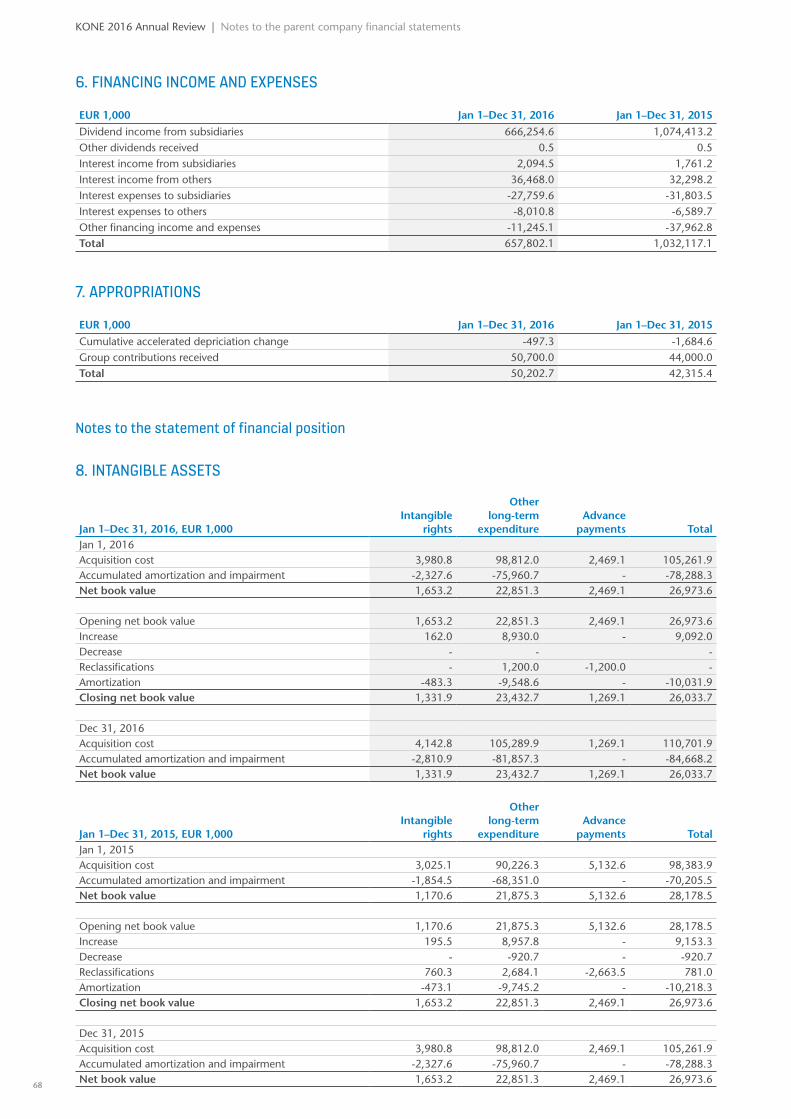
6. FINANCING INCOME AND EXPENSES
EUR 1,000 Jan 1–Dec 31, 2016 Jan 1–Dec 31, 2015
Dividend income from subsidiaries 666,254.6 1,074,413.2Other dividends received 0.5 0.5Interest income from subsidiaries 2,094.5 1,761.2Interest income from others 36,468.0 32,298.2Interest expenses to subsidiaries -27,759.6 -31,803.5Interest expenses to others -8,010.8 -6,589.7Other financing income and expenses -11,245.1 -37,962.8Total 657,802.1 1,032,117.1
7. APPROPRIATIONS
EUR 1,000 Jan 1–Dec 31, 2016 Jan 1–Dec 31, 2015
Cumulative accelerated depriciation change -497.3 -1,684.6Group contributions received 50,700.0 44,000.0Total 50,202.7 42,315.4
Notes to the statement of financial position
8. INTANGIBLE ASSETS
Jan 1–Dec 31, 2016, EUR 1,000 Intangible
rights
Other long-term
expenditureAdvance
payments TotalJan 1, 2016Acquisition cost 3,980.8 98,812.0 2,469.1 105,261.9Accumulated amortization and impairment -2,327.6 -75,960.7 - -78,288.3Net book value 1,653.2 22,851.3 2,469.1 26,973.6
Opening net book value 1,653.2 22,851.3 2,469.1 26,973.6Increase 162.0 8,930.0 - 9,092.0Decrease - - -Reclassifications - 1,200.0 -1,200.0 -Amortization -483.3 -9,548.6 - -10,031.9Closing net book value 1,331.9 23,432.7 1,269.1 26,033.7
Dec 31, 2016Acquisition cost 4,142.8 105,289.9 1,269.1 110,701.9Accumulated amortization and impairment -2,810.9 -81,857.3 - -84,668.2Net book value 1,331.9 23,432.7 1,269.1 26,033.7
Jan 1–Dec 31, 2015, EUR 1,000 Intangible
rights
Other long-term
expenditureAdvance
payments TotalJan 1, 2015Acquisition cost 3,025.1 90,226.3 5,132.6 98,383.9Accumulated amortization and impairment -1,854.5 -68,351.0 - -70,205.5Net book value 1,170.6 21,875.3 5,132.6 28,178.5
Opening net book value 1,170.6 21,875.3 5,132.6 28,178.5Increase 195.5 8,957.8 - 9,153.3Decrease - -920.7 - -920.7Reclassifications 760.3 2,684.1 -2,663.5 781.0Amortization -473.1 -9,745.2 - -10,218.3Closing net book value 1,653.2 22,851.3 2,469.1 26,973.6
Dec 31, 2015Acquisition cost 3,980.8 98,812.0 2,469.1 105,261.9Accumulated amortization and impairment -2,327.6 -75,960.7 - -78,288.3Net book value 1,653.2 22,851.3 2,469.1 26,973.6
KONE 2016 Annual Review | Notes to the parent company financial statements
68
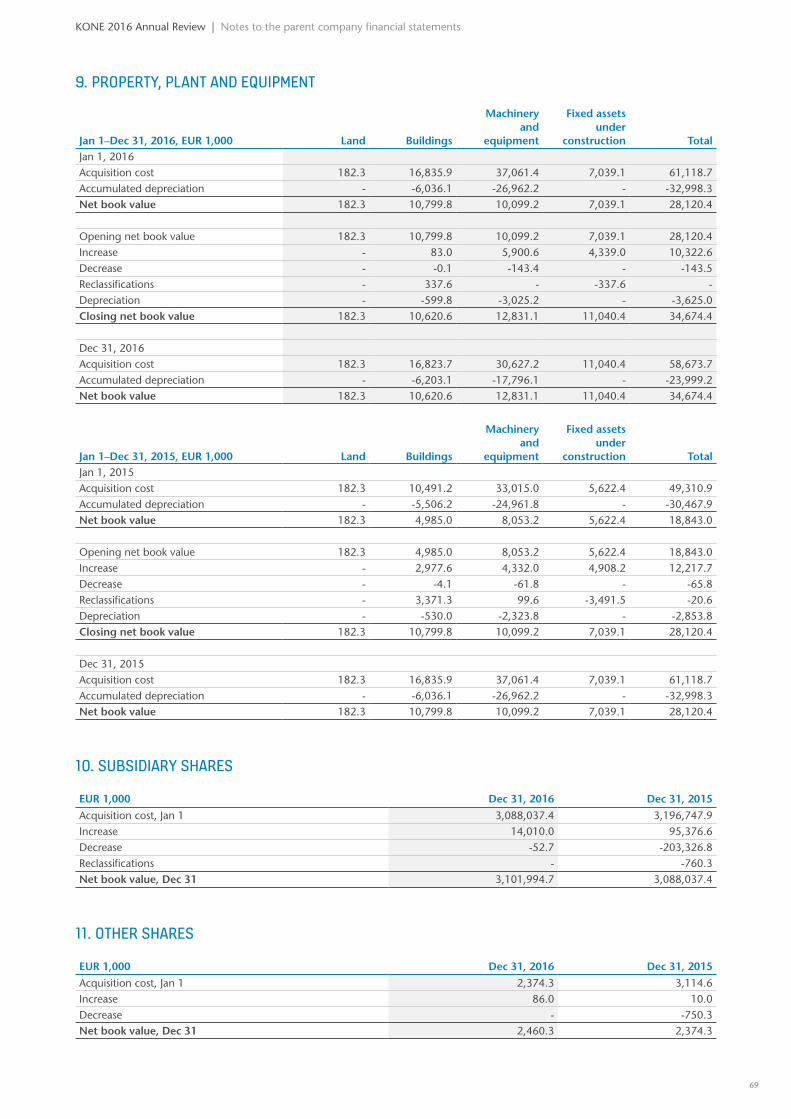
9. PROPERTY, PLANT AND EQUIPMENT
Jan 1–Dec 31, 2016, EUR 1,000 Land Buildings
Machinery and
equipment
Fixed assets under
construction TotalJan 1, 2016Acquisition cost 182.3 16,835.9 37,061.4 7,039.1 61,118.7Accumulated depreciation - -6,036.1 -26,962.2 - -32,998.3Net book value 182.3 10,799.8 10,099.2 7,039.1 28,120.4
Opening net book value 182.3 10,799.8 10,099.2 7,039.1 28,120.4Increase - 83.0 5,900.6 4,339.0 10,322.6Decrease - -0.1 -143.4 - -143.5Reclassifications - 337.6 - -337.6 -Depreciation - -599.8 -3,025.2 - -3,625.0Closing net book value 182.3 10,620.6 12,831.1 11,040.4 34,674.4
Dec 31, 2016Acquisition cost 182.3 16,823.7 30,627.2 11,040.4 58,673.7Accumulated depreciation - -6,203.1 -17,796.1 - -23,999.2Net book value 182.3 10,620.6 12,831.1 11,040.4 34,674.4
Jan 1–Dec 31, 2015, EUR 1,000 Land Buildings
Machinery and
equipment
Fixed assets under
construction TotalJan 1, 2015Acquisition cost 182.3 10,491.2 33,015.0 5,622.4 49,310.9Accumulated depreciation - -5,506.2 -24,961.8 - -30,467.9Net book value 182.3 4,985.0 8,053.2 5,622.4 18,843.0
Opening net book value 182.3 4,985.0 8,053.2 5,622.4 18,843.0Increase - 2,977.6 4,332.0 4,908.2 12,217.7Decrease - -4.1 -61.8 - -65.8Reclassifications - 3,371.3 99.6 -3,491.5 -20.6Depreciation - -530.0 -2,323.8 - -2,853.8Closing net book value 182.3 10,799.8 10,099.2 7,039.1 28,120.4
Dec 31, 2015Acquisition cost 182.3 16,835.9 37,061.4 7,039.1 61,118.7Accumulated depreciation - -6,036.1 -26,962.2 - -32,998.3Net book value 182.3 10,799.8 10,099.2 7,039.1 28,120.4
10. SUBSIDIARY SHARES
EUR 1,000 Dec 31, 2016 Dec 31, 2015
Acquisition cost, Jan 1 3,088,037.4 3,196,747.9Increase 14,010.0 95,376.6Decrease -52.7 -203,326.8Reclassifications - -760.3Net book value, Dec 31 3,101,994.7 3,088,037.4
11. OTHER SHARES
EUR 1,000 Dec 31, 2016 Dec 31, 2015
Acquisition cost, Jan 1 2,374.3 3,114.6Increase 86.0 10.0Decrease - -750.3Net book value, Dec 31 2,460.3 2,374.3
KONE 2016 Annual Review | Notes to the parent company financial statements
69
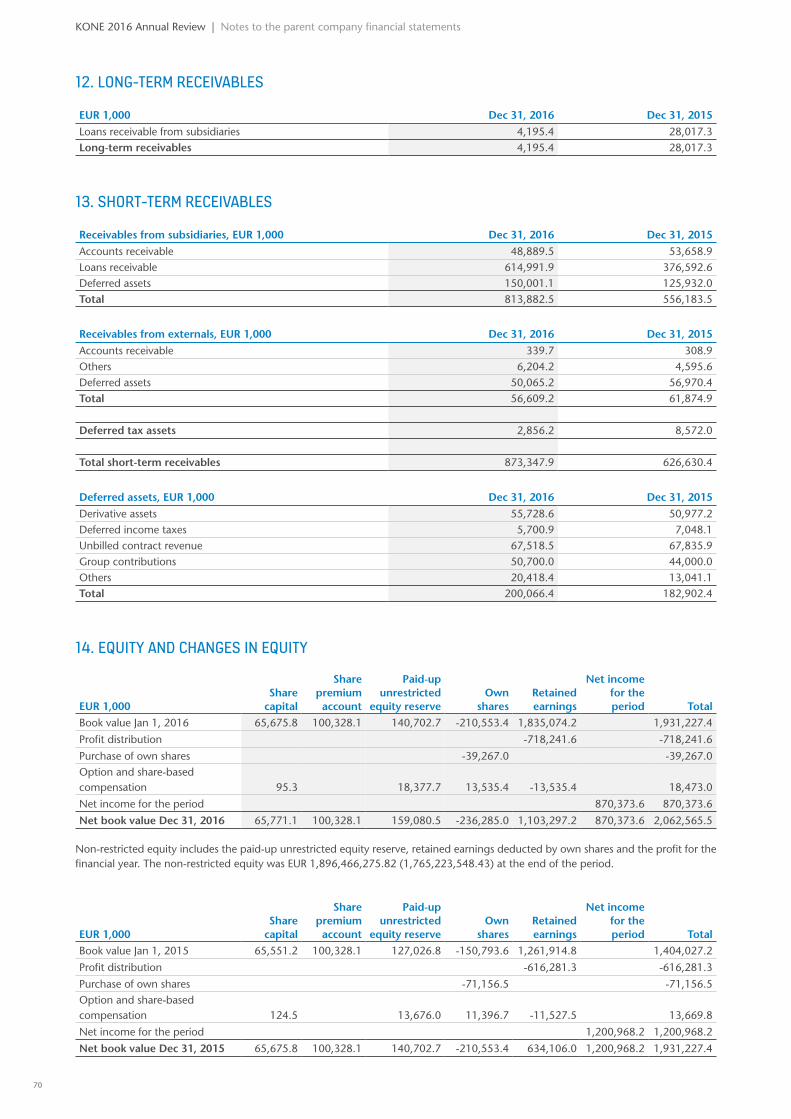
12. LONG-TERM RECEIVABLES
EUR 1,000 Dec 31, 2016 Dec 31, 2015
Loans receivable from subsidiaries 4,195.4 28,017.3Long-term receivables 4,195.4 28,017.3
13. SHORT-TERM RECEIVABLES
Receivables from subsidiaries, EUR 1,000 Dec 31, 2016 Dec 31, 2015
Accounts receivable 48,889.5 53,658.9Loans receivable 614,991.9 376,592.6Deferred assets 150,001.1 125,932.0Total 813,882.5 556,183.5
Receivables from externals, EUR 1,000 Dec 31, 2016 Dec 31, 2015
Accounts receivable 339.7 308.9Others 6,204.2 4,595.6Deferred assets 50,065.2 56,970.4Total 56,609.2 61,874.9
Deferred tax assets 2,856.2 8,572.0
Total short-term receivables 873,347.9 626,630.4
Deferred assets, EUR 1,000 Dec 31, 2016 Dec 31, 2015
Derivative assets 55,728.6 50,977.2Deferred income taxes 5,700.9 7,048.1Unbilled contract revenue 67,518.5 67,835.9Group contributions 50,700.0 44,000.0Others 20,418.4 13,041.1Total 200,066.4 182,902.4
14. EQUITY AND CHANGES IN EQUITY
EUR 1,000Share
capital
Sharepremium account
Paid-up unrestricted
equity reserveOwn
sharesRetainedearnings
Net income for the period Total
Book value Jan 1, 2016 65,675.8 100,328.1 140,702.7 -210,553.4 1,835,074.2 1,931,227.4
Profit distribution -718,241.6 -718,241.6
Purchase of own shares -39,267.0 -39,267.0Option and share-based compensation 95.3 18,377.7 13,535.4 -13,535.4 18,473.0
Net income for the period 870,373.6 870,373.6
Net book value Dec 31, 2016 65,771.1 100,328.1 159,080.5 -236,285.0 1,103,297.2 870,373.6 2,062,565.5
Non-restricted equity includes the paid-up unrestricted equity reserve, retained earnings deducted by own shares and the profit for the financial year. The non-restricted equity was EUR 1,896,466,275.82 (1,765,223,548.43) at the end of the period.
EUR 1,000Share
capital
Sharepremium account
Paid-up unrestricted
equity reserveOwn
sharesRetainedearnings
Net income for the period Total
Book value Jan 1, 2015 65,551.2 100,328.1 127,026.8 -150,793.6 1,261,914.8 1,404,027.2
Profit distribution -616,281.3 -616,281.3
Purchase of own shares -71,156.5 -71,156.5Option and share-based compensation 124.5 13,676.0 11,396.7 -11,527.5 13,669.8
Net income for the period 1,200,968.2 1,200,968.2
Net book value Dec 31, 2015 65,675.8 100,328.1 140,702.7 -210,553.4 634,106.0 1,200,968.2 1,931,227.4
KONE 2016 Annual Review | Notes to the parent company financial statements
70
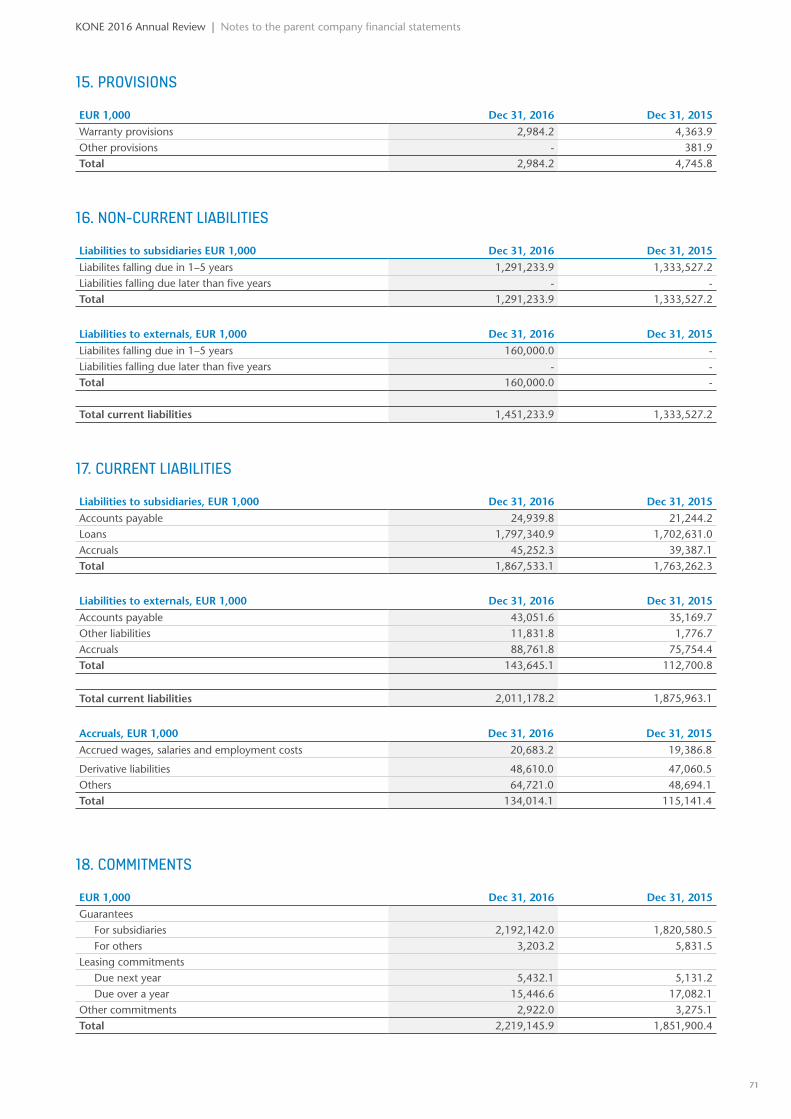
15. PROVISIONS
EUR 1,000 Dec 31, 2016 Dec 31, 2015
Warranty provisions 2,984.2 4,363.9Other provisions - 381.9Total 2,984.2 4,745.8
16. NON-CURRENT LIABILITIES
Liabilities to subsidiaries EUR 1,000 Dec 31, 2016 Dec 31, 2015
Liabilites falling due in 1–5 years 1,291,233.9 1,333,527.2Liabilities falling due later than five years - -Total 1,291,233.9 1,333,527.2
Liabilities to externals, EUR 1,000 Dec 31, 2016 Dec 31, 2015
Liabilites falling due in 1–5 years 160,000.0 -Liabilities falling due later than five years - -Total 160,000.0 -
Total current liabilities 1,451,233.9 1,333,527.2
17. CURRENT LIABILITIES
Liabilities to subsidiaries, EUR 1,000 Dec 31, 2016 Dec 31, 2015
Accounts payable 24,939.8 21,244.2Loans 1,797,340.9 1,702,631.0Accruals 45,252.3 39,387.1Total 1,867,533.1 1,763,262.3
Liabilities to externals, EUR 1,000 Dec 31, 2016 Dec 31, 2015
Accounts payable 43,051.6 35,169.7Other liabilities 11,831.8 1,776.7Accruals 88,761.8 75,754.4Total 143,645.1 112,700.8
Total current liabilities 2,011,178.2 1,875,963.1
Accruals, EUR 1,000 Dec 31, 2016 Dec 31, 2015
Accrued wages, salaries and employment costs 20,683.2 19,386.8
Derivative liabilities 48,610.0 47,060.5Others 64,721.0 48,694.1Total 134,014.1 115,141.4
18. COMMITMENTS
EUR 1,000 Dec 31, 2016 Dec 31, 2015
GuaranteesFor subsidiaries 2,192,142.0 1,820,580.5For others 3,203.2 5,831.5
Leasing commitmentsDue next year 5,432.1 5,131.2Due over a year 15,446.6 17,082.1
Other commitments 2,922.0 3,275.1Total 2,219,145.9 1,851,900.4
KONE 2016 Annual Review | Notes to the parent company financial statements
71
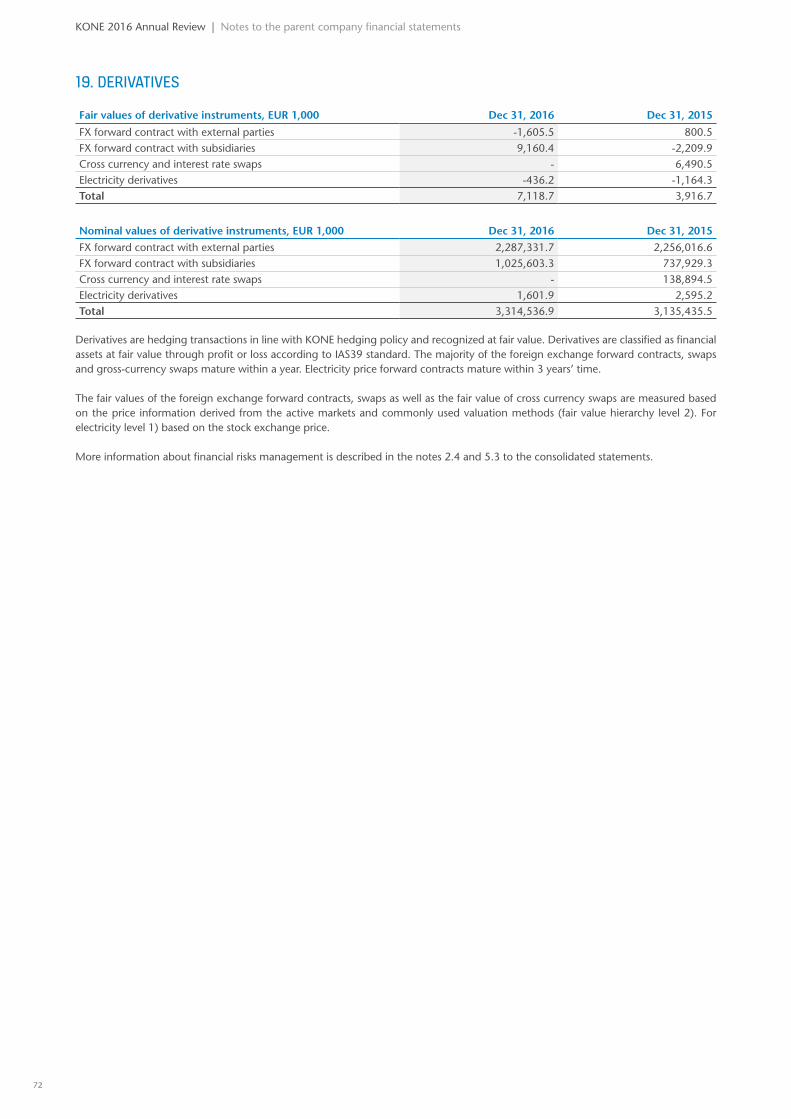
19. DERIVATIVES
Fair values of derivative instruments, EUR 1,000 Dec 31, 2016 Dec 31, 2015
FX forward contract with external parties -1,605.5 800.5FX forward contract with subsidiaries 9,160.4 -2,209.9Cross currency and interest rate swaps - 6,490.5Electricity derivatives -436.2 -1,164.3Total 7,118.7 3,916.7
Nominal values of derivative instruments, EUR 1,000 Dec 31, 2016 Dec 31, 2015
FX forward contract with external parties 2,287,331.7 2,256,016.6FX forward contract with subsidiaries 1,025,603.3 737,929.3Cross currency and interest rate swaps - 138,894.5Electricity derivatives 1,601.9 2,595.2Total 3,314,536.9 3,135,435.5
Derivatives are hedging transactions in line with KONE hedging policy and recognized at fair value. Derivatives are classified as financial assets at fair value through profit or loss according to IAS39 standard. The majority of the foreign exchange forward contracts, swaps and gross-currency swaps mature within a year. Electricity price forward contracts mature within 3 years’ time.
The fair values of the foreign exchange forward contracts, swaps as well as the fair value of cross currency swaps are measured based on the price information derived from the active markets and commonly used valuation methods (fair value hierarchy level 2). For electricity level 1) based on the stock exchange price.
More information about financial risks management is described in the notes 2.4 and 5.3 to the consolidated statements.
KONE 2016 Annual Review | Notes to the parent company financial statements
72
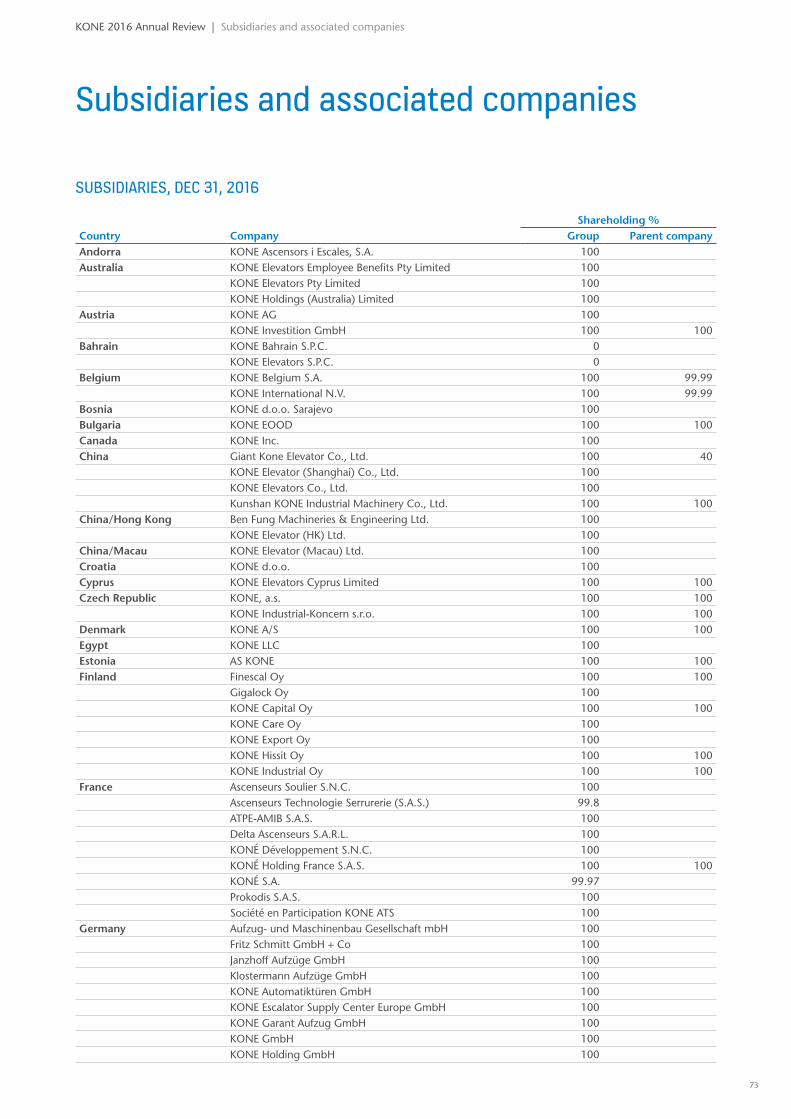
Subsidiaries and associated companies
KONE 2016 Annual Review | Subsidiaries and associated companies
SUBSIDIARIES, DEC 31, 2016
Share holding %Country Company Group Parent company Andorra KONE Ascensors i Escales, S.A. 100Australia KONE Elevators Employee Benefits Pty Limited 100 KONE Elevators Pty Limited 100 KONE Holdings (Australia) Limited 100Austria KONE AG 100 KONE Investition GmbH 100 100Bahrain KONE Bahrain S.P.C. 0 KONE Elevators S.P.C. 0Belgium KONE Belgium S.A. 100 99.99 KONE International N.V. 100 99.99Bosnia KONE d.o.o. Sarajevo 100Bulgaria KONE EOOD 100 100Canada KONE Inc. 100China Giant Kone Elevator Co., Ltd. 100 40 KONE Elevator (Shanghai) Co., Ltd. 100 KONE Elevators Co., Ltd. 100 Kunshan KONE Industrial Machinery Co., Ltd. 100 100China/Hong Kong Ben Fung Machineries & Engineering Ltd. 100 KONE Elevator (HK) Ltd. 100China/Macau KONE Elevator (Macau) Ltd. 100Croatia KONE d.o.o. 100Cyprus KONE Elevators Cyprus Limited 100 100Czech Republic KONE, a.s. 100 100 KONE Industrial-Koncern s.r.o. 100 100Denmark KONE A/S 100 100Egypt KONE LLC 100Estonia AS KONE 100 100Finland Finescal Oy 100 100 Gigalock Oy 100 KONE Capital Oy 100 100 KONE Care Oy 100 KONE Export Oy 100 KONE Hissit Oy 100 100 KONE Industrial Oy 100 100France Ascenseurs Soulier S.N.C. 100 Ascenseurs Technologie Serrurerie (S.A.S.) 99.8 ATPE-AMIB S.A.S. 100
Delta Ascenseurs S.A.R.L. 100 KONÉ Développement S.N.C. 100 KONÉ Holding France S.A.S. 100 100 KONÉ S.A. 99.97 Prokodis S.A.S. 100
Société en Participation KONE ATS 100Germany Aufzug- und Maschinenbau Gesellschaft mbH 100 Fritz Schmitt GmbH + Co 100 Janzhoff Aufzüge GmbH 100 Klostermann Aufzüge GmbH 100 KONE Automatiktüren GmbH 100 KONE Escalator Supply Center Europe GmbH 100 KONE Garant Aufzug GmbH 100 KONE GmbH 100 KONE Holding GmbH 100
73
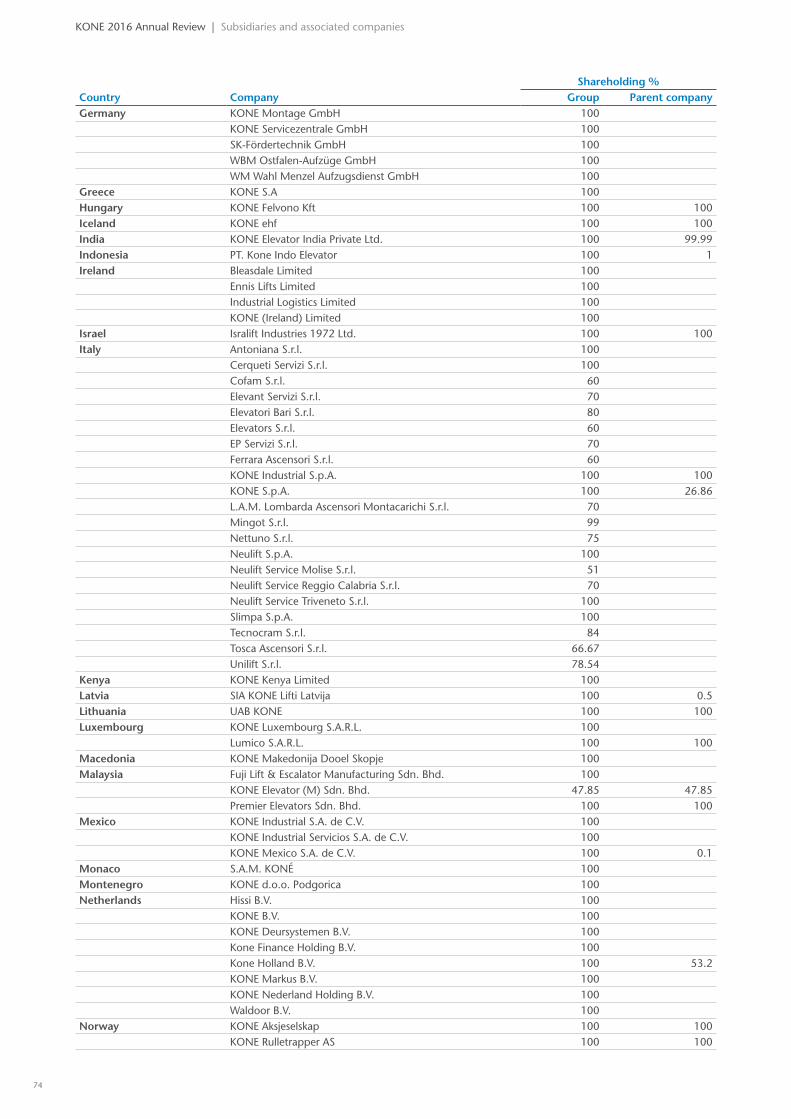
Share holding %Country Company Group Parent company Germany KONE Montage GmbH 100
KONE Servicezentrale GmbH 100 SK-Fördertechnik GmbH 100 WBM Ostfalen-Aufzüge GmbH 100 WM Wahl Menzel Aufzugsdienst GmbH 100Greece KONE S.A 100Hungary KONE Felvono Kft 100 100Iceland KONE ehf 100 100India KONE Elevator India Private Ltd. 100 99.99Indonesia PT. Kone Indo Elevator 100 1Ireland Bleasdale Limited 100 Ennis Lifts Limited 100 Industrial Logistics Limited 100 KONE (Ireland) Limited 100Israel Isralift Industries 1972 Ltd. 100 100Italy Antoniana S.r.l. 100 Cerqueti Servizi S.r.l. 100 Cofam S.r.l. 60 Elevant Servizi S.r.l. 70 Elevatori Bari S.r.l. 80 Elevators S.r.l. 60 EP Servizi S.r.l. 70 Ferrara Ascensori S.r.l. 60 KONE Industrial S.p.A. 100 100 KONE S.p.A. 100 26.86 L.A.M. Lombarda Ascensori Montacarichi S.r.l. 70 Mingot S.r.l. 99 Nettuno S.r.l. 75 Neulift S.p.A. 100 Neulift Service Molise S.r.l. 51 Neulift Service Reggio Calabria S.r.l. 70 Neulift Service Triveneto S.r.l. 100 Slimpa S.p.A. 100 Tecnocram S.r.l. 84 Tosca Ascensori S.r.l. 66.67 Unilift S.r.l. 78.54Kenya KONE Kenya Limited 100Latvia SIA KONE Lifti Latvija 100 0.5Lithuania UAB KONE 100 100Luxembourg KONE Luxembourg S.A.R.L. 100 Lumico S.A.R.L. 100 100Macedonia KONE Makedonija Dooel Skopje 100Malaysia Fuji Lift & Escalator Manufacturing Sdn. Bhd. 100 KONE Elevator (M) Sdn. Bhd. 47.85 47.85 Premier Elevators Sdn. Bhd. 100 100Mexico KONE Industrial S.A. de C.V. 100 KONE Industrial Servicios S.A. de C.V. 100 KONE Mexico S.A. de C.V. 100 0.1Monaco S.A.M. KONÉ 100Montenegro KONE d.o.o. Podgorica 100Netherlands Hissi B.V. 100 KONE B.V. 100 KONE Deursystemen B.V. 100 Kone Finance Holding B.V. 100 Kone Holland B.V. 100 53.2 KONE Markus B.V. 100 KONE Nederland Holding B.V. 100 Waldoor B.V. 100Norway KONE Aksjeselskap 100 100 KONE Rulletrapper AS 100 100
KONE 2016 Annual Review | Subsidiaries and associated companies
74
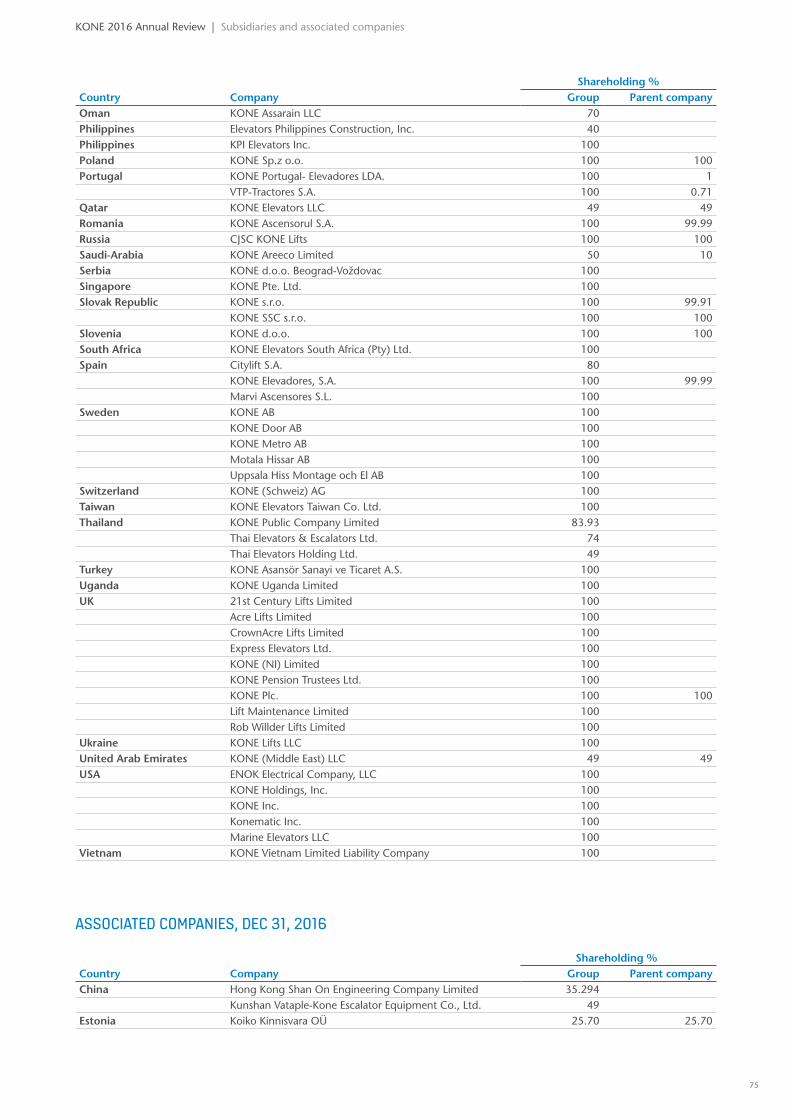
KONE 2016 Annual Review | Subsidiaries and associated companies
Share holding %Country Company Group Parent company Oman KONE Assarain LLC 70Philippines Elevators Philippines Construction, Inc. 40Philippines KPI Elevators Inc. 100Poland KONE Sp.z o.o. 100 100Portugal KONE Portugal- Elevadores LDA. 100 1 VTP-Tractores S.A. 100 0.71Qatar KONE Elevators LLC 49 49Romania KONE Ascensorul S.A. 100 99.99Russia CJSC KONE Lifts 100 100Saudi-Arabia KONE Areeco Limited 50 10Serbia KONE d.o.o. Beograd-Voždovac 100Singapore KONE Pte. Ltd. 100Slovak Republic KONE s.r.o. 100 99.91 KONE SSC s.r.o. 100 100Slovenia KONE d.o.o. 100 100South Africa KONE Elevators South Africa (Pty) Ltd. 100Spain Citylift S.A. 80 KONE Elevadores, S.A. 100 99.99 Marvi Ascensores S.L. 100Sweden KONE AB 100 KONE Door AB 100 KONE Metro AB 100 Motala Hissar AB 100 Uppsala Hiss Montage och El AB 100Switzerland KONE (Schweiz) AG 100Taiwan KONE Elevators Taiwan Co. Ltd. 100Thailand KONE Public Company Limited 83.93 Thai Elevators & Escalators Ltd. 74 Thai Elevators Holding Ltd. 49Turkey KONE Asansör Sanayi ve Ticaret A.S. 100Uganda KONE Uganda Limited 100UK 21st Century Lifts Limited 100 Acre Lifts Limited 100 CrownAcre Lifts Limited 100 Express Elevators Ltd. 100 KONE (NI) Limited 100 KONE Pension Trustees Ltd. 100 KONE Plc. 100 100 Lift Maintenance Limited 100 Rob Willder Lifts Limited 100Ukraine KONE Lifts LLC 100United Arab Emirates KONE (Middle East) LLC 49 49USA ENOK Electrical Company, LLC 100 KONE Holdings, Inc. 100 KONE Inc. 100 Konematic Inc. 100 Marine Elevators LLC 100Vietnam KONE Vietnam Limited Liability Company 100
ASSOCIATED COMPANIES, DEC 31, 2016
Share holding %Country Company Group Parent company China Hong Kong Shan On Engineering Company Limited 35.294
Kunshan Vataple-Kone Escalator Equipment Co., Ltd. 49Estonia Koiko Kinnisvara OÜ 25.70 25.70
75
Corporate governance statement
KONE’s general governance principles The duties and responsibilities of KONE Corporation’s various governing bodies are determined by Finnish law and KONE’s corporate governance principles. KONE complies with the Finnish Corporate Gover-nance Code 2015 published by the Securi-ties Market Association, with the exception of recommendations 16 (Independence of the company of the members of the audit committee), 17 (Independence of the com-pany of the members of the remuneration committee) and 18a (Independence of the company of the members of the nomina-tion committee). The entire Code is avail-able on the Internet at www.cgfinland.fi. These exceptions are due to the company’s ownership structure. The company’s larg-est shareholder, Antti Herlin, controls 62 percent of the company’s voting rights and 22 percent of its shares. The significant entrepreneurial risk associated with owner-ship justifies the main shareholder serving as either Chairman or Member of the Board of Directors and of its Committees and, in this capacity, overseeing the shareholders’ interests.
KONE’s administrative bodies and officers with the greatest decision-making power are the General Meeting of Share-holders, the Board of Directors of KONE Corporation, the Chairman of the Board and the President and CEO. At the Annual General Meeting of Shareholders, the shareholders approve the consolidated financial statements, decide on the distribu-tion of profits, select the members of the Board of Directors and the auditors and determine their compensation.
KONE Corporation’s Annual General Meeting is convened by the Board of Direc-tors. According to the Articles of Associa-tion, the Annual General Meeting of Share-holders shall be held within three months of the closing of the financial year on a date decided by the Board of Directors.
Board of Directors
Duties and responsibilitiesThe Board of Directors’ duties and responsi-bilities are defined primarily by the Articles of Association and the Finnish Limited Liability Companies’ Act. The Board’s duties include:• compiling of the Board of Directors’
report, interim reports and financial statements
• ensuring the proper organization and surveillance of the accounting and asset management
• the preparation of proposals for the General Meeting and the convocation of the General Meetings
• the approval and confirmation of strate-gic guidelines and the principles of risk management
• the ratification of annual budgets and plans
• the appointment of a full-time Chair-man of the Board and a President and CEO, and decisions on the terms and conditions of their employment
• decisions on the company’s corporate structure
• decisions on major acquisitions and investments
• decisions on other matters falling under the Board’s responsibility by law
The Board has created rules of procedure stipulating the duties of the Board, its Chairman and its Committees. The Board of Directors holds six regular meetings a year and additional meetings as required. The Board of Directors reviews its own performance and procedures once a year.
Members of the BoardThe Annual General Meeting elects five to ten members and no more than three deputy members to the Board of Directors for one year at a time in accordance with KONE Corporation’s Articles of Association. The Board of Directors elects a Chairman and Vice Chairman among its members. The proposals for Board members are prepared at the Nomination and Compen-sation Committee and under the steering of the Chairman of the Board. During the preparation and in the proposal to the General Meeting of Shareholders attention is paid to the board candidates’ broad and mutually complementary background, experience, expertise, age, gender and views of both KONE’s business and other businesses so that the diversity of the board supports KONE´s business and its future in the best available way.
CommitteesThe Board of Directors has appointed two committees consisting of its members: the Audit Committee and the Nomination and Compensation Committee. The Board has confirmed rules of procedure for both Committees. The Secretary to the Board acts as the Secretary of both Committees.
The Audit Committee monitors the Group’s financial situation and supervises reporting related to the financial state-ments and interim reports. The Audit Com-mittee monitors and assesses the adequacy and appropriateness of KONE’s internal control and risk management, as well as
the adherence to rules and regulations. It also monitors and oversees the financial statement and financial reporting process. In addition, the Audit Committee processes the description of the main features of the internal control and risk management sys-tems pertaining to the financial reporting process included in the company’s corpo-rate governance statement. In addition, it deals with the Corporation’s internal audit plans and reports. The Director of Internal Audit reports the internal audit results to the Committee. The Audit Commit-tee evaluates the auditing of the Group’s companies and the appropriateness of the related arrangements and auditing ser-vices, and considers the auditors’ reports. Furthermore, the Committee formulates a proposal to the Annual General Meeting regarding the auditors to be selected for the Corporation.
The Nomination and Compensation Committee prepares proposals to be made to the Annual General Meeting regarding the nomination of Board members and their compensation and makes decisions regarding senior management appoint-ments and compensation. The Committee also decides on the compensation systems to be used.
Management
Full-time Chairman of the Board and the President and CEOKONE Corporation’s Board of Directors appoints the full-time Chairman of the Board and the President and CEO. The Board determines the terms and conditions of employment of the full-time Chairman of the Board and the President and CEO, and these are defined in their respective written contracts. The Chairman of the Board prepares matters to be considered by the Board together with the President and CEO and the corporate staff. The Chairman of the Board and the President and CEO are responsible for the execution of the targets, plans, strategies and goals set by the Board of Directors within the KONE Group. The President and CEO is also responsible for operational leadership within the scope of the strategic plans, budgets, operational plans, guidelines and orders approved by KONE Corporation’s Board of Directors. The President and CEO presents operational issues to the Board, and is responsible for implementing the decisions of the Board.
Executive BoardThe Executive Board supports the President and CEO in executing the corporate strat-egy. The Executive Board follows business developments, initiates actions and defines
KONE 2016 Annual Review | Corporate governance statement | Corporate governance principles
76
operating principles and methods in accor-dance with guidelines handed down by the Board of Directors and the President and CEO. The Executive Board holds regular monthly meetings and additional meetings as required.
Control systemsKONE Corporation’s Board of Directors has ratified the principles of internal control, risk management and internal auditing to be followed within the Group.
Internal controlThe goal of KONE’s internal control system is to ensure that the Group’s operations are efficient and profitable, that its business risk management is adequate and appropriate, and that the information created is reliable. The control system also makes it possible to oversee that the determined operating principles, given instructions and possible related party transactions are followed.
The Board’s Audit Committee monitors the functioning of the internal control pro-cess. The Corporation has an Internal Audit Department, which is separate from the management. The Head of Internal Audit reports to the Chairman of the Board. The Internal Audit Department is responsible for auditing both the internal control system and the management of business risks. It reports its findings to the Audit Committee.
Risk managementKONE’s Risk Management function coor-dinates and develops a systematic assess-ment of risks and opportunities within core business planning and decision-making processes together with the Strategy Devel-opment function.
KONE continuously assesses the risks and opportunities related to its business environment, operations and financial performance in order to limit unnecessary or excessive risks. In addition, KONE’s units and functions systematically identify and assess, as part of the strategic planning and budgeting processes, the risks that can threaten the achievement of their business objectives. Key risks are reported to the Risk Management function, which facilitates the risk management process and consolidates the risk information to the Executive Board. The Executive Board assigns the owner-ship of identified risk exposures to specific functions or units. The Board of Directors
reviews the KONE risk portfolio regularly on the basis of the Executive Board’s assess-ment.
The Risk Management function is also responsible for administering the global insurance programs. The Treasury function manages financial risks centrally according to the KONE Treasury Policy.
Main features of internal control and risk management related to financial reportingCorrect financial reporting in KONE’s inter-nal control framework means that its finan-cial statements give a true and fair view of the operations and the financial position of the group and that such statements do not include intentional or unintentional misstatements or omissions both in respect of the figures and level of disclosure. The internal control framework is built and based on reporting processes and frame-works as described below, as well as com-pany values, a culture of honesty and high ethical standards. Such framework is pro-moted by proper training, a positive and a disciplined work attitude and by the hiring and promoting of suitable employees.
Corporate-wide financial management and control of operations is coordinated by the Global Finance and Control function and implemented by a network of subsid-iary and business entity Controllers within KONE. Internal control processes and procedures are regularly controlled and steered by the Board of Directors, the Audit Committee, Business and Finance manage-ment and internal and external auditors.
KONE’s monthly management planning and financial reporting process represents a key control procedure within KONE in ensuring the effectiveness and efficiency of operations. KONE’s financial statements are based on the monthly management report-ing process. This process includes in-depth analyses of deviations between actual performance, budgets, prior year perfor-mance and latest forecasts for the business. The process covers financial information as well as key performance indicators that measure the operational performance on a business unit and corporate level. The process is designed to ensure that any deviations from plans, in terms of financial or operating performance and financial management policies are identified, com-municated and reacted upon efficiently, in a harmonized and timely manner.
Financial control tasks are built into the business processes of KONE as well as into the ongoing business supervision and monitoring of the management. KONE has established Financial Control Models for order-based activities, service activities as well as for treasury and tax matters. The models have been defined in order to ensure that the financial control cov-ers the relevant tasks in an efficient and timely manner. Financial Control Models are designed to support the efficiency
and effectiveness of operations through well-defined and productive monitoring process. The correctness of the financial reporting is supported and monitored through the Financial Control Models. The models include Key Control Tasks for Finance Directors and controllers of KONE’s subsidiaries and business entities. Key Con-trol Indicators are defined and linked to the tasks in the Financial Control Models. The aim of these indicators is to measure and support the effectiveness and harmoniza-tion of operations. The effectiveness of the Financial Control Models and indicators is assessed in all units regularly and moni-tored by the Global Finance and Control Function.
The internal control procedures applied to KONE’s financial reporting process are laid down in carefully defined principles and instructions. A unified and globally harmonized framework provides processes, tools and instructions to cover manage-rial and external financial reporting. The interpretation and application of account-ing standards is centralized in the Global Finance and Control function, which main-tains, under supervision of the Audit Com-mittee, the KONE Accounting Standards. The Global Finance and Control function monitors the compliance of the KONE Accounting Standards in the various enti-ties of the group. Budgeting and reporting processes and contents are defined in the KONE Accounting and Reporting Instruc-tions. These standards and instructions are maintained and updated centrally by the Global Finance and Control function and applied uniformly throughout KONE.
KONE has a global enterprise resource planning (ERP) system which is built to reflect the KONE Accounting Standards and KONE Accounting and Reporting Instructions. KONE applies a controlled change management process ensuring that no changes to the financial posting logic of the ERP system can be made without approval from the Global Finance and Con-trol function. Automatic interfaces between different systems are principally applied in the period-end financial reporting pro-cess of KONE. Transactional processing is increasingly automated and centralized in dedicated internal shared service centers.
Effective internal control over record to report processes, from business processes and systems to the financial statements, is important in ensuring the correctness of financial reporting. This is driven by the identification of key data elements of the business and the quality of the data to ensure correct financial reporting and forecasting ability.
AuditingThe objective of a statutory audit is to express an opinion whether the consoli-dated financial statements give a true and fair view of the financial position, financial performance and cash flows of the group,
More information
Most significant risks and uncertainties related to KONE’s business are described in the Board of Directors’ Report. Financial risk management is described in note 2.4 and 5.3.
KONE 2016 Annual Review | Corporate governance statement | Corporate governance principles
77
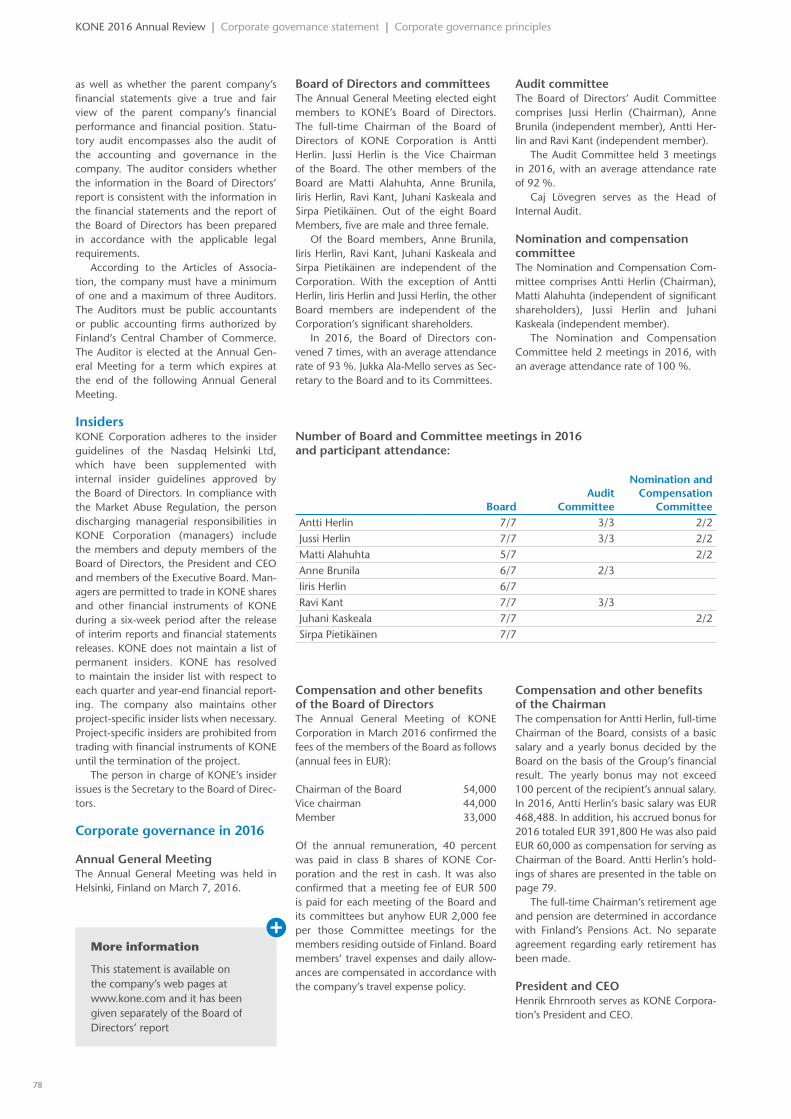
as well as whether the parent company’s financial statements give a true and fair view of the parent company’s financial performance and financial position. Statu-tory audit encompasses also the audit of the accounting and governance in the company. The auditor considers whether the information in the Board of Directors’ report is consistent with the information in the financial statements and the report of the Board of Directors has been prepared in accordance with the applicable legal requirements.
According to the Articles of Associa-tion, the company must have a minimum of one and a maximum of three Auditors. The Auditors must be public accountants or public accounting firms authorized by Finland’s Central Chamber of Commerce. The Auditor is elected at the Annual Gen-eral Meeting for a term which expires at the end of the following Annual General Meeting.
InsidersKONE Corporation adheres to the insider guidelines of the Nasdaq Helsinki Ltd, which have been supplemented with internal insider guidelines approved by the Board of Directors. In compliance with the Market Abuse Regulation, the person discharging managerial responsibilities in KONE Corporation (managers) include the members and deputy members of the Board of Directors, the President and CEO and members of the Executive Board. Man-agers are permitted to trade in KONE shares and other financial instruments of KONE during a six-week period after the release of interim reports and financial statements releases. KONE does not maintain a list of permanent insiders. KONE has resolved to maintain the insider list with respect to each quarter and year-end financial report-ing. The company also maintains other project-specific insider lists when necessary. Project-specific insiders are prohibited from trading with financial instruments of KONE until the termination of the project.
The person in charge of KONE’s insider issues is the Secretary to the Board of Direc-tors.
Corporate governance in 2016
Annual General MeetingThe Annual General Meeting was held in Helsinki, Finland on March 7, 2016.
Board of Directors and committeesThe Annual General Meeting elected eight members to KONE’s Board of Directors. The full-time Chairman of the Board of Directors of KONE Corporation is Antti Herlin. Jussi Herlin is the Vice Chairman of the Board. The other members of the Board are Matti Alahuhta, Anne Brunila, Iiris Herlin, Ravi Kant, Juhani Kaskeala and Sirpa Pietikäinen. Out of the eight Board Members, five are male and three female.
Of the Board members, Anne Brunila, Iiris Herlin, Ravi Kant, Juhani Kaskeala and Sirpa Pietikäinen are independent of the Corporation. With the exception of Antti Herlin, Iiris Herlin and Jussi Herlin, the other Board members are independent of the Corporation’s significant shareholders.
In 2016, the Board of Directors con-vened 7 times, with an average attendance rate of 93 %. Jukka Ala-Mello serves as Sec-retary to the Board and to its Committees.
Audit committeeThe Board of Directors’ Audit Committee comprises Jussi Herlin (Chairman), Anne Brunila (independent member), Antti Her-lin and Ravi Kant (independent member).
The Audit Committee held 3 meetings in 2016, with an average attendance rate of 92 %.
Caj Lövegren serves as the Head of Internal Audit.
Nomination and compensation committeeThe Nomination and Compensation Com-mittee comprises Antti Herlin (Chairman), Matti Alahuhta (independent of significant shareholders), Jussi Herlin and Juhani Kaskeala (independent member).
The Nomination and Compensation Committee held 2 meetings in 2016, with an average attendance rate of 100 %.
Number of Board and Committee meetings in 2016 and participant attendance:
BoardAudit
Committee
Nomination and Compensation
CommitteeAntti Herlin 7/7 3/3 2/2Jussi Herlin 7/7 3/3 2/2Matti Alahuhta 5/7 2/2Anne Brunila 6/7 2/3Iiris Herlin 6/7Ravi Kant 7/7 3/3Juhani Kaskeala 7/7 2/2Sirpa Pietikäinen 7/7
Compensation and other benefits of the Board of DirectorsThe Annual General Meeting of KONE Corporation in March 2016 confirmed the fees of the members of the Board as follows (annual fees in EUR):
Chairman of the Board 54,000Vice chairman 44,000Member 33,000
Of the annual remuneration, 40 percent was paid in class B shares of KONE Cor-poration and the rest in cash. It was also confirmed that a meeting fee of EUR 500 is paid for each meeting of the Board and its committees but anyhow EUR 2,000 fee per those Committee meetings for the members residing outside of Finland. Board members’ travel expenses and daily allow-ances are compensated in accordance with the company’s travel expense policy.
Compensation and other benefits of the ChairmanThe compensation for Antti Herlin, full-time Chairman of the Board, consists of a basic salary and a yearly bonus decided by the Board on the basis of the Group’s financial result. The yearly bonus may not exceed 100 percent of the recipient’s annual salary. In 2016, Antti Herlin’s basic salary was EUR 468,488. In addition, his accrued bonus for 2016 totaled EUR 391,800 He was also paid EUR 60,000 as compensation for serving as Chairman of the Board. Antti Herlin’s hold-ings of shares are presented in the table on page 79.
The full-time Chairman’s retirement age and pension are determined in accordance with Finland’s Pensions Act. No separate agreement regarding early retirement has been made.
President and CEOHenrik Ehrnrooth serves as KONE Corpora-tion’s President and CEO.
KONE 2016 Annual Review | Corporate governance statement | Corporate governance principles
More information
This statement is available on the company’s web pages at www.kone.com and it has been given separately of the Board of Directors’ report
78
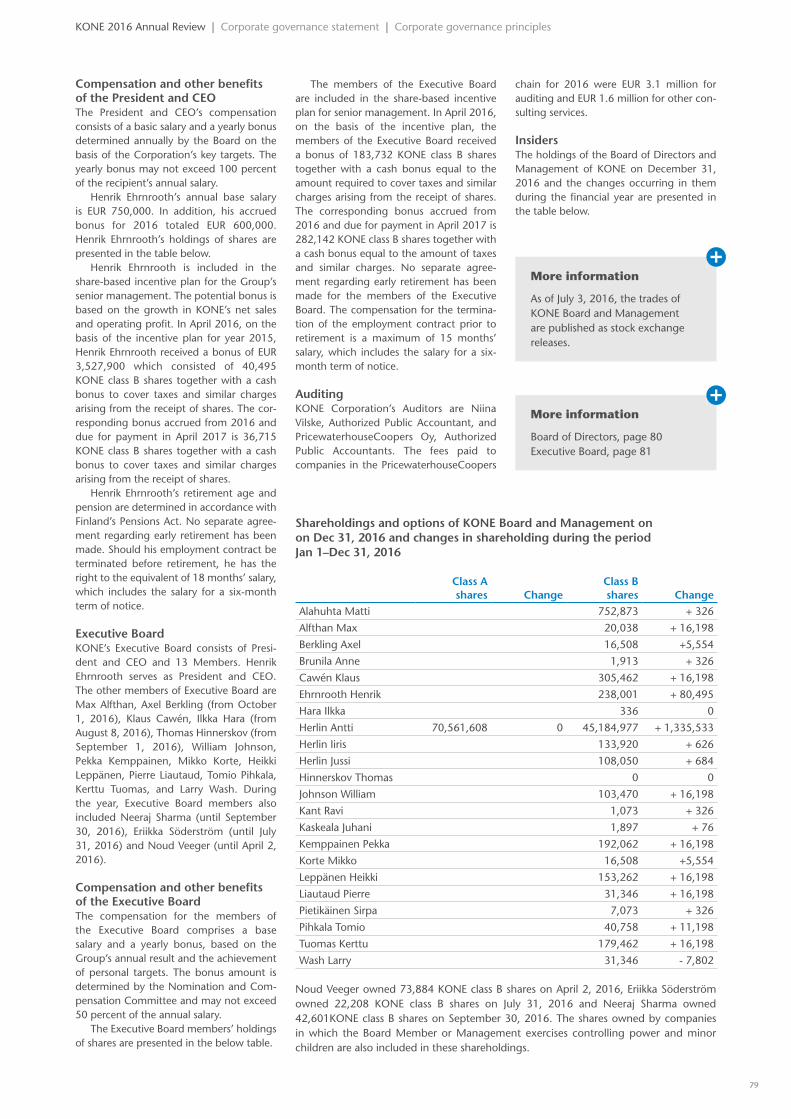
Compensation and other benefits of the President and CEOThe President and CEO’s compensation consists of a basic salary and a yearly bonus determined annually by the Board on the basis of the Corporation’s key targets. The yearly bonus may not exceed 100 percent of the recipient’s annual salary.
Henrik Ehrnrooth’s annual base salary is EUR 750,000. In addition, his accrued bonus for 2016 totaled EUR 600,000. Henrik Ehrnrooth’s holdings of shares are presented in the table below.
Henrik Ehrnrooth is included in the share-based incentive plan for the Group’s senior management. The potential bonus is based on the growth in KONE’s net sales and operating profit. In April 2016, on the basis of the incentive plan for year 2015, Henrik Ehrnrooth received a bonus of EUR 3,527,900 which consisted of 40,495 KONE class B shares together with a cash bonus to cover taxes and similar charges arising from the receipt of shares. The cor-responding bonus accrued from 2016 and due for payment in April 2017 is 36,715 KONE class B shares together with a cash bonus to cover taxes and similar charges arising from the receipt of shares.
Henrik Ehrnrooth’s retirement age and pension are determined in accordance with Finland’s Pensions Act. No separate agree-ment regarding early retirement has been made. Should his employment contract be terminated before retirement, he has the right to the equivalent of 18 months’ salary, which includes the salary for a six-month term of notice.
Executive BoardKONE’s Executive Board consists of Presi-dent and CEO and 13 Members. Henrik Ehrnrooth serves as President and CEO. The other members of Executive Board are Max Alfthan, Axel Berkling (from October 1, 2016), Klaus Cawén, Ilkka Hara (from August 8, 2016), Thomas Hinnerskov (from September 1, 2016), William Johnson, Pekka Kemppainen, Mikko Korte, Heikki Leppänen, Pierre Liautaud, Tomio Pihkala, Kerttu Tuomas, and Larry Wash. During the year, Executive Board members also included Neeraj Sharma (until September 30, 2016), Eriikka Söderström (until July 31, 2016) and Noud Veeger (until April 2, 2016).
Compensation and other benefits of the Executive BoardThe compensation for the members of the Executive Board comprises a base salary and a yearly bonus, based on the Group’s annual result and the achievement of personal targets. The bonus amount is determined by the Nomination and Com-pensation Committee and may not exceed 50 percent of the annual salary.
The Executive Board members’ holdings of shares are presented in the below table.
KONE 2016 Annual Review | Corporate governance statement | Corporate governance principles
The members of the Executive Board are included in the share-based incentive plan for senior management. In April 2016, on the basis of the incentive plan, the members of the Executive Board received a bonus of 183,732 KONE class B shares together with a cash bonus equal to the amount required to cover taxes and similar charges arising from the receipt of shares. The corresponding bonus accrued from 2016 and due for payment in April 2017 is 282,142 KONE class B shares together with a cash bonus equal to the amount of taxes and similar charges. No separate agree-ment regarding early retirement has been made for the members of the Executive Board. The compensation for the termina-tion of the employment contract prior to retirement is a maximum of 15 months’ salary, which includes the salary for a six-month term of notice.
AuditingKONE Corporation’s Auditors are Niina Vilske, Authorized Public Accountant, and PricewaterhouseCoopers Oy, Authorized Public Accountants. The fees paid to companies in the PricewaterhouseCoopers
chain for 2016 were EUR 3.1 million for auditing and EUR 1.6 million for other con-sulting services.
InsidersThe holdings of the Board of Directors and Management of KONE on December 31, 2016 and the changes occurring in them during the financial year are presented in the table below.
More information
As of July 3, 2016, the trades of KONE Board and Management are published as stock exchange releases.
More information
Board of Directors, page 80Executive Board, page 81
Shareholdings and options of KONE Board and Management on on Dec 31, 2016 and changes in shareholding during the period Jan 1–Dec 31, 2016
Class A shares Change
Class B shares Change
Alahuhta Matti 752,873 + 326
Alfthan Max 20,038 + 16,198
Berkling Axel 16,508 +5,554
Brunila Anne 1,913 + 326
Cawén Klaus 305,462 + 16,198
Ehrnrooth Henrik 238,001 + 80,495
Hara Ilkka 336 0
Herlin Antti 70,561,608 0 45,184,977 + 1,335,533
Herlin Iiris 133,920 + 626
Herlin Jussi 108,050 + 684
Hinnerskov Thomas 0 0
Johnson William 103,470 + 16,198
Kant Ravi 1,073 + 326
Kaskeala Juhani 1,897 + 76
Kemppainen Pekka 192,062 + 16,198
Korte Mikko 16,508 +5,554
Leppänen Heikki 153,262 + 16,198
Liautaud Pierre 31,346 + 16,198
Pietikäinen Sirpa 7,073 + 326
Pihkala Tomio 40,758 + 11,198
Tuomas Kerttu 179,462 + 16,198
Wash Larry 31,346 - 7,802
Noud Veeger owned 73,884 KONE class B shares on April 2, 2016, Eriikka Söderström owned 22,208 KONE class B shares on July 31, 2016 and Neeraj Sharma owned 42,601KONE class B shares on September 30, 2016. The shares owned by companies in which the Board Member or Management exercises controlling power and minor children are also included in these shareholdings.
79
Board of DirectorsAntti Herlin Chairman of the Boardb. 1956, D.Sc. (Econ.) h.c., D.Arts h.c., D.Sc. (Tech.) h.c.Member of the Board since 1991.Has served as Chairman of the Board since 2003. Previously served as CEO of KONE Corporation 1996–2006 and as Deputy Chairman 1996–2003.Current key positions of trust are Chairman of the Board of Security Trading Oy andHolding Manutas Oy, Vice Chairman of the Board of Sanoma Corporation and Deputy Chairman of the Supervisory Board of Ilma-rinen Mutual Pension Insurance Company.
Jussi Herlin Vice Chairman of the Boardb. 1984, M. Sc. (Econ.)Member of the Board since 2012. Senior Business Analyst, Strategy Develop-ment at KONE Corporation since 2016. Previously served as Consultant at Accenture between 2012–2014 and Deputy Member of the Board of KONE Corporation during the years 2007–2012.Current key positions of trust are Member of the Board of Security Trading Oy, Member of the Board of the Tiina and Antti Herlin Foundation, Member of the Board of Tech-nology Industries of Finland and Member of the Supervisory Board of the Finnish Fair Corporation.
Matti Alahuhtab. 1952, D. Sc. (Tech.), D.Sc. (Tech.) h.c.Member of the Board since 2003. Previously served as President of KONE Cor-poration since 2005, and President & CEO from 2006 to 2014, as Executive Vice Presi-dent of Nokia Corporation 2004, as Presi-dent of Nokia Mobile Phones 1998–2003 and as President of Nokia Telecommunica-tions 1993–1998.Current key positions of trust are Chairman of the Board of DevCo Partners Corporation, Chairman of the Board of Outotec Corpora-tion, Member of the Board of AB Volvo and Member of the Board of ABB Ltd.
Anne Brunila b. 1957, D.Sc. (Econ.), D.Sc. (Econ.) h.c.Member of the Board since 2009.Professor of Practice, Hanken School of Economics since 2014. Previously served as Executive Vice President, Corporate Relations and Strategy and Member of the Management Team of Fortum 2009–2012, as President and CEO of the Finnish Forest Industries Federation 2006–2009, in the Finnish Ministry of Finance as Director General 2003–2006 and in several advisory and executive positions in the Bank of Fin-land 1992–2000 and in the European Com-mission 2000–2002.Current key positions of trust are Member of the Board of Stora Enso, Member of the Board of Sanoma Corporation and Chairman of the Board of Aalto University Foundation.
Iiris Herlinb. 1989, B.Soc. Sc.Member of the Board since 2015. Deputy Member of the Board 2013–2014.Current key positions of trust are Member of the Board of Security Trading Oy and Mem-ber of the Board of the Tiina and Antti Herlin Foundation.
Ravi Kantb. 1944, B. Tech. (Hons.), M.Sc., D.Sc. (Hon)Member of the Board since 2014.Previously served in different positions in Tata Motors since 1999, and as Managing Director and CEO from 2005 to 2009 and after that as the Vice Chairman of the Board of Directors until 2014. Prior to that, he was Director, Consumer Electronics, Philips India; Director (Marketing) LML Ltd. and Vice President (Marketing) Titan Watches Ltd.Current key positions of trust are Chairman of the Board of Indian Institute of Manage-ment Rohtak, Chairman of the Board of Indian Institute of Information Technology Allahabad and Member of the Board of Vedanta Ltd and Member of the Board of Hawkins Cookers Ltd.
Juhani Kaskeala b. 1946, AdmiralMember of the Board since 2009.Managing director of Admiral Consulting Oy since 2011. Previously served in the Finnish Defence Forces in several positions 1965–2009, last as Commander of the Finnish Defence Forces 2001–2009.Current key positions of trust are Member of the Board of Oy Forcit Ab, Member of the Board of Nixu Oyj, Member of the Board of John Nurminen Foundation, Senior Advisor of Blic Oy and Member of the European Leadership Network.
Sirpa Pietikäinen b. 1959, M.Sc. (Econ.)Member of the Board since 2006.Served as Member of the European Parlia-ment since 2008 and as a negotiation theory lecturer and consultant since 1999. Previ-ously served as a Member of Finland’s Parlia-ment 1983–2003 and as Finland’s Minister of the Environment 1991–1995.Current key positions of trust are Chairman of GLOBE EU, Chairman of the Finnish Asso-ciation of Landscape Industries, Vice Chair-man of the Board of the Martha Organisa-tion, Member of the Board of Alzheimer Europe, Member of the Board of Lammi Savings Bank, Member of the Finn Church EU Advisory Board and Member of the KVS Foundation Advisory Board.
Jukka Ala-Mello b. 1963, M.Sc. (Econ.), Authorized Public AccountantSecretary to the Board of Directors since 2006. Has served as Director of KONE Corpora-tion and Managing Director and Member of the Board of Security Trading Oy and Holding Manutas Oy since 2006. Previously served as a Partner and APA Auditor in Price-waterhouseCoopers Oy 1993–2006 and Financial Manager of Panostaja Corporation 1990–1993.Current key positions of trust are Chairman of the Board of Panostaja Corporation and Chairman of the Board of OWH-Yhtiöt Cor-poration.
KONE 2016 Annual Review | Corporate governance statement | Board of Directors
More information
Corporate governance, page 76
More information
Shareholdings of KONE Corpora-tion’s public insiders are available on page 79.
80
Executive BoardHenrik EhrnroothPresident and CEOb. 1969, M.Sc. (Econ)President & CEO of KONE Corporation since 2014. Member of the Executive Board. Previously served as Chief Financial Officer of KONE Corporation 2009–2014. Earlier worked at Goldman Sachs from 1998–2009, most recently as a Managing Director in the Investment Banking Division and at UBS in various positions from 1994–1998.Current key positions of trust are Member of the Board of UPM Kymmene Corpora-tion, Member of the Foundation Board of the International Institute for Management Development (IMD, Switzerland) and Member of the Board of the Mannerheim Foundation.
Max AlfthanMarketing and Communications b. 1961, M.Sc. (Econ.)Member of the Executive Board and employed by KONE Corporation since 2014. Previously served as Chief Strategy Officer of Fiskars 2008–2014, Senior Vice President for Communications of Amer Sports Corpora-tion 2001–2008, Managing Director of Lowe Lintas & Part-ners Oy 1998–2001 and Marketing Director of Sinebrychoff 1989–1998.
Axel BerklingAsia-Pacific (from October 1, 2016)b. 1967, M. Sc (Econ)Member of the Executive Board since 2016. Employed by KONE Corporation since 1998. Previously served at KONE Corporation as Managing Director of KONE Germany from 2012–2016. Axel has held various regional commercial roles since 2007, including managing KONE’s service business in Ger-many. Prior to joining KONE, he served as Managing Director of Nass Magnet MgbH 1996–1998, and held different roles at Arthur Andersen from 1992–1995.
Klaus CawénM&A and Strategic Alliances, Russia, Legal Affairsb. 1957, LL.M.Member of the Executive Board since 1991. Employed by KONE Corporation since 1983. Previously served as General Counsel of KONE Corporation 1991–2001.Current key positions of trust are Member of the Board of Oy Karl Fazer Ab, Member of the Board of East Office of Finnish Indus-tries Ltd, Member of the Board of Outotec Oyj and Member of the Board of Toshiba Elevator and Building Systems Corporation (Japan).
Ilkka HaraCFO (from August 8, 2016)b. 1975, M.Sc. (Finance and Accounting)Member of the Executive Board and employed by KONE Corporation since 2016. Previously served as GM and CFO of Microsoft Phones 2014–2016, in various leadership roles at Nokia 2004–2014. Prior to Nokia worked at ABN AMRO 2003–2004 and Morgan Stanley 2001–2003.Current key positions of trust are Member of the Board at Hartili Oy.
Thomas HinnerskovCentral and North Europe (from Septem-ber 1, 2016)b. 1971, M.Sc. (Finance and Accounting)Member of the Executive Board and employed by KONE Corporation since 2016. Previously served as Regional CEO for ISS Western Europe (2016) and for ISS APAC (2012–2016), as well as serving in various other leadership roles at ISS during 2003–2012. Prior to ISS, he worked at TEMA Kapital 2002–2003, McKinsey & Company 2001–2002 and Gudme Raaschou Invest-ment Bank from 1995–2000.
William B. JohnsonGreater Chinab. 1958, MBAMember of the Executive Board since 2012, and employed by KONE Corporation since 2004. Previously served as Managing Direc-tor of KONE China since 2004, Service Vice President of Asia-Pacific, Carrier Interna-tional Corporation (United Technologies) 2002–2004, as Managing Director Australia, Carrier Air Conditioning Ltd. (United Tech-nologies) 2001–2002, and in various leader-ship roles with Otis Elevator Company and Trammell Crow Company.
Pekka KemppainenService Businessb. 1954, Licentiate in TechnologyMember of the Executive Board since 2005. Employed by KONE Corporation since 1984. Previously served in KONE Corporation as Executive Vice President, Asia-Pacific 2004–2010, as Executive Vice President, New Equipment Business, Elevators and Escala-tors 2001–2004, as Senior Vice President, New Equipment Business and Technology 1995–2001 and as Director of the Research Center 1990–1994.
Mikko KorteOperations Development b. 1968, M. Sc. (Eng)Member of the Executive Board since 2016. Employed by KONE Corporation since 1995. Previously served as Head of New Equipment Business for KONE Americas 2013–2015, Managing Director for KONE Finland and Baltics 2011–2013, Service Director for KONE Central and North Europe 2007–2011, Service Business Director for KONE Scandinavia 2004–2007 and Service Operations Manager for KONE Finland 1999–2004.
Heikki LeppänenNew Equipment Businessb. 1957, Licentiate in TechnologyMember of the Executive Board since 2005. Employed by KONE Corporation since 1982. Previously served in KONE Corpora-tion as Senior Vice President, Technology 2004–2005 and as Head of Global Research and Development 2000–2004.
Pierre LiautaudWest and South Europe, Middle East and Africab. 1958, M.Sc (Ecole Polytechnique, Ecole Nationale Supérieure des Télécommunications)Member of the Executive Board and employed by KONE Corporation since 2011.
Previously served in Microsoft EMEA as Vice President, Enterprise & Partner Group 2003–2006, then Area Vice President West-ern Europe 2006–2009. Was CEO at @viso (Vivendi-Softbank, 1999–2001) and Activia Networks (2001–2003). Also served in IBM Corporation 1982–1999, most recently as Vice-President Marketing, Internet Division (1998) and General Manager, Global Elec-tronics Industry (1999).
Tomio PihkalaTechnology & Innovationb. 1975, M. Sc. (Mechanical Engineering)Member of the Executive Board since 2013. Employed by KONE Corporation since 2001. Previously served in KONE Corpora-tion as Executive Vice President, Operations Development 2014–2015, as Executive Vice President, Safety, Quality and Installation 2013–2014, as Vice President, Technology Finland 2011–2013, as Director, Service Business, in KONE China 2009–2010, as Director, Product Strategy and Marketing, in KONE China 2007–2008.
Current key positions of trust are Mem-ber of the Board of Toshiba Elevator and Building Systems Corporation and Member of the Board of Vexve Oy.
Kerttu TuomasHuman Resourcesb. 1957, B. Sc. (Econ.)Member of the Executive Board and employed by KONE Corporation since 2002. Previously served as Group Vice President, Human Resources of Elcoteq Network Cor-poration 2000–2002, as Personnel & Orga-nization Manager of Masterfoods Oy (Mars) 1994–1999 and as Consultant at Mercuri Urval 1987–1993.Current key positions of trust are Vice Chair-man of the Board of Kemira Corporation, member of the Strategic Board of CEMS, the Global Alliance In Management Education and member of the Board of Directors of the Finnish National Opera Ballet.
Larry WashAmericasb. 1961, M. Sc. (Electrical Engineering), M. (Business Administration)Member of the Executive Board and employed by KONE Corporation since 2012. Previously served as President of Global Services for the Climate Solutions sector of Ingersoll Rand, as Vice President of service and contracting business for Trane within North and Latin America, and in various leadership roles with Xerox and Eastman Kodak.
Neeraj SharmaAsia-Pacific (until September 30, 2016)b. 1960, B.E (Marine)
Eriikka SöderströmCFO (until July 31, 2016)b. 1968, M.Sc. (Econ.)
Noud VeegerCentral and North Europe (until April 2, 2016)b. 1961, M.Sc. (Econ.)
KONE 2016 Annual Review | Corporate governance statement | Executive Board
81
Dividend proposal
The parent company’s non-restricted equity on December 31, 2016 is EUR 1,896,466,275.82 of which the net income for the financial year is EUR 870,373,574.84.
The Board of Directors proposes to the Annual General Meeting that a dividend of EUR 1.5475 be paid on the outstanding 76,208,712 class A shares and EUR 1.55 on the outstanding 437,076,029 class B shares, resulting in a total amount of proposed divi-dends of EUR 795,400,826.77. The Board of Directors further proposes that the remaining non-restricted equity, EUR 1,101,065,449.05 be retained and carried forward.
The Board proposes that the dividends be payable from March 9, 2017.
Signatures for the Financial statements and Board of Directors’ report
Helsinki, January 26, 2017
Antti Herlin Jussi Herlin
Matti Alahuhta Anne Brunila
Iiris Herlin Ravi Kant
Juhani Kaskeala Sirpa Pietikäinen
Henrik Ehrnrooth,President & CEO
The Auditors’ Note
Our auditors’ report has been issued today.
Helsinki, January 26, 2017
PricewaterhouseCoopers OyAuthorised Public Accountants
Pasi Karppinen Niina VilskeAuthorised Authorised Public Accountant Public Accountant
Dividend proposal, signatures for the Board of Directors’ report and Financial statements and Auditor’s note.
KONE 2016 Annual Review | Dividend proposal, signatures for the Board of Directors’ report and Financial statements and Auditor’s note.
82
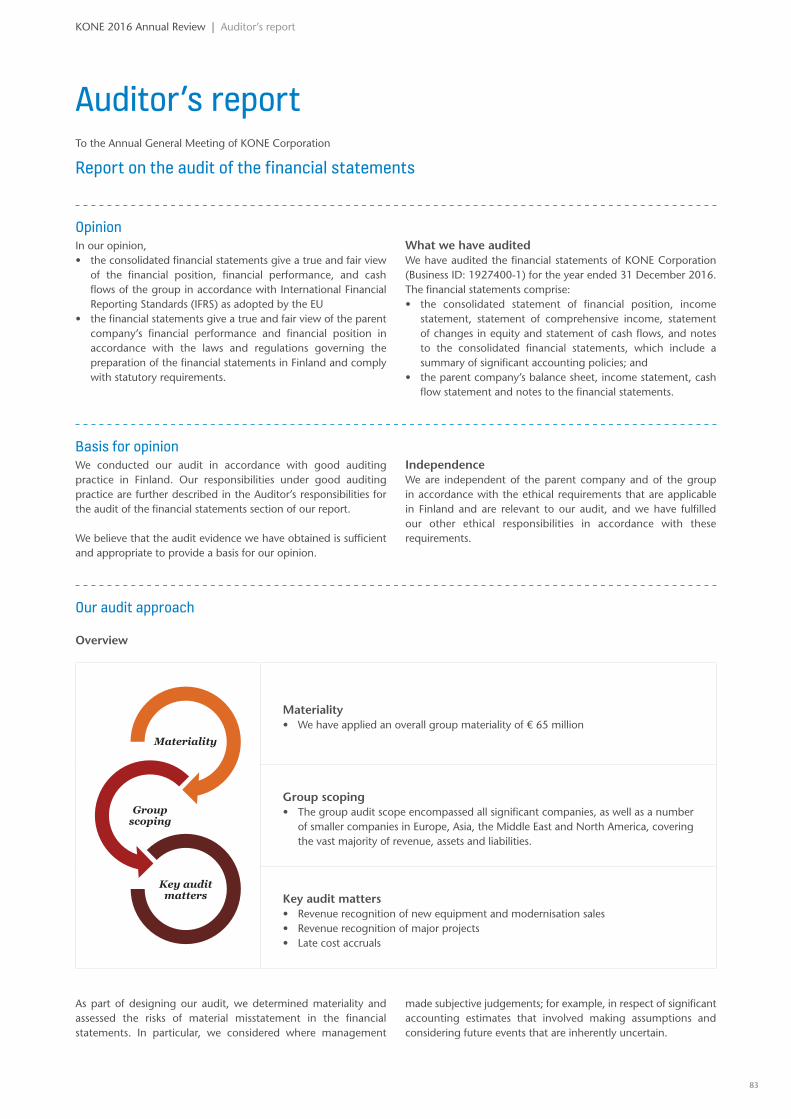
Auditor’s reportTo the Annual General Meeting of KONE Corporation
Report on the audit of the financial statements
OpinionIn our opinion, • the consolidated financial statements give a true and fair view
of the financial position, financial performance, and cash flows of the group in accordance with International Financial Reporting Standards (IFRS) as adopted by the EU
• the financial statements give a true and fair view of the parent company’s financial performance and financial position in accordance with the laws and regulations governing the preparation of the financial statements in Finland and comply with statutory requirements.
What we have auditedWe have audited the financial statements of KONE Corporation (Business ID: 1927400-1) for the year ended 31 December 2016. The financial statements comprise:• the consolidated statement of financial position, income
statement, statement of comprehensive income, statement of changes in equity and statement of cash flows, and notes to the consolidated financial statements, which include a summary of significant accounting policies; and
• the parent company’s balance sheet, income statement, cash flow statement and notes to the financial statements.
Basis for opinion We conducted our audit in accordance with good auditing practice in Finland. Our responsibilities under good auditing practice are further described in the Auditor’s responsibilities for the audit of the financial statements section of our report.
We believe that the audit evidence we have obtained is sufficient and appropriate to provide a basis for our opinion.
IndependenceWe are independent of the parent company and of the group in accordance with the ethical requirements that are applicable in Finland and are relevant to our audit, and we have fulfilled our other ethical responsibilities in accordance with these requirements.
Our audit approach
Overview
Materiality• We have applied an overall group materiality of € 65 million
Group scoping• The group audit scope encompassed all significant companies, as well as a number
of smaller companies in Europe, Asia, the Middle East and North America, covering the vast majority of revenue, assets and liabilities.
Key audit matters• Revenue recognition of new equipment and modernisation sales • Revenue recognition of major projects • Late cost accruals
As part of designing our audit, we determined materiality and assessed the risks of material misstatement in the financial statements. In particular, we considered where management
made subjective judgements; for example, in respect of significant accounting estimates that involved making assumptions and considering future events that are inherently uncertain.
KONE 2016 Annual Review | Auditor’s report
83
KONE 2016 Annual Review | Auditor’s report
MaterialityThe scope of our audit was influenced by our application of materiality. An audit is designed to obtain reasonable assurance whether the financial statements are free from material misstatement. Misstatements may arise due to fraud or error. They are considered material if individually or in aggregate, they could reasonably be expected to influence the economic decisions of users taken on the basis of the financial statements.
Based on our professional judgement, we determined certain quantitative thresholds for materiality, including the overall group materiality for the consolidated financial statements as set out in the table below. These, together with qualitative considerations, helped us to determine the scope of our audit and the nature, timing and extent of our audit procedures and to evaluate the effect of misstatements on the financial statements as a whole.
Overall group materiality
€ 65 million
How we determined it
5% of operating profit
Rationale for the materiality benchmark applied
We chose operating profit as the benchmark because, in our view, it is the bench mark against which the performance of the Group is most commonly measured by users of these financial statements. We applied 5% which is within the range of acceptable quantitative materiality thresholds in auditing standards.
How we tailored our group audit scopeWe tailored the scope of our audit, taking into account the structure of the KONE Group, the industry in which it operates as well as the group’s processes and controls related to financial reporting.
We determined the type of work that needed to be performed at group companies by us, as the group engagement team, or
by auditors from other PwC network firms operating under our instruction. Audits were performed in group companies which are considered significant either because of their individual financial significance or due to their specific nature, covering the vast majority of revenue, assets and liabilities of the Group. Selected specified procedures as well as analytical procedures were performed to cover the remaining companies.
Key audit matters Key audit matters are those matters that, in our professional judgment, were of most significance in our audit of the financial statements of the current period. These matters were addressed in the context of our audit of the financial statements as a whole, and in forming our opinion thereon, and we do not provide a separate opinion on these matters.
As in all of our audits, we also addressed the risk of management override of internal controls, including among other matters consideration of whether there was evidence of bias that represented a risk of material misstatement due to fraud.
Key audit matter in the audit of the Group How our audit addressed the key audit matter
Revenue recognition of new equipment and modernisation sales Refer to note 2.1 in the financial statements
The sales of the group comprise new equipment, modernisation and maintenance sales.
Given the different nature of the revenue streams, we consider their related risks to be different. While the accounting for maintenance revenue is less complex, we consider the accounting for new equipment and modernisation business revenue to constitute focus areas of the audit. Revenue recognition of major projects is a separate key audit matter.
Revenue for new equipment and modernisation contracts is recognized when the group has transferred the significant risks and rewards of ownership of the equipment to the customer in accordance with the underlying sales contract and applicable regulation. We considered the revenue recognition in the correct financial year to be a focus area of the audit due to the risk of either too early or late revenue recognition.
Our procedures included obtaining an understanding of the processes and controls related to the timing of revenue recognition, testing of certain key controls as well as substantive testing of revenue transactions. Our procedures also included the testing of relevant IT controls and system configuration.
Our substantive tests of revenue included • reviewing a sample of sales contracts, ensuring appropriate
revenue recognition criteria have been applied;• testing a sample of transactions occurring within proximity of
the financial year-end;• testing journal entries posted to revenue on a sample basis;
and• testing revenue related balances recognized in the balance
sheet.
We also audited a sample of revenue transactions recorded during the financial year.
84
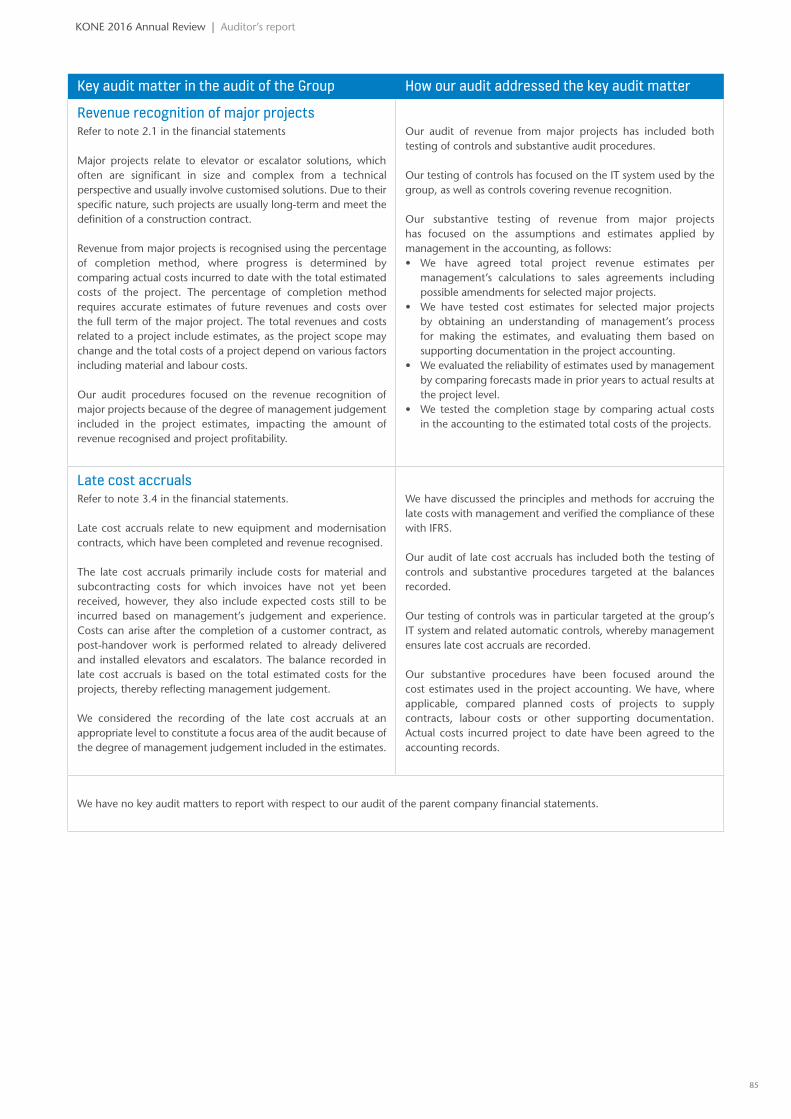
KONE 2016 Annual Review | Auditor’s report
Key audit matter in the audit of the Group How our audit addressed the key audit matter
Revenue recognition of major projects Refer to note 2.1 in the financial statements
Major projects relate to elevator or escalator solutions, which often are significant in size and complex from a technical perspective and usually involve customised solutions. Due to their specific nature, such projects are usually long-term and meet the definition of a construction contract.
Revenue from major projects is recognised using the percentage of completion method, where progress is determined by comparing actual costs incurred to date with the total estimated costs of the project. The percentage of completion method requires accurate estimates of future revenues and costs over the full term of the major project. The total revenues and costs related to a project include estimates, as the project scope may change and the total costs of a project depend on various factors including material and labour costs.
Our audit procedures focused on the revenue recognition of major projects because of the degree of management judgement included in the project estimates, impacting the amount of revenue recognised and project profitability.
Our audit of revenue from major projects has included both testing of controls and substantive audit procedures.
Our testing of controls has focused on the IT system used by the group, as well as controls covering revenue recognition.
Our substantive testing of revenue from major projects has focused on the assumptions and estimates applied by management in the accounting, as follows:• We have agreed total project revenue estimates per
management’s calculations to sales agreements including possible amendments for selected major projects.
• We have tested cost estimates for selected major projects by obtaining an understanding of management’s process for making the estimates, and evaluating them based on supporting documentation in the project accounting.
• We evaluated the reliability of estimates used by management by comparing forecasts made in prior years to actual results at the project level.
• We tested the completion stage by comparing actual costs in the accounting to the estimated total costs of the projects.
Late cost accrualsRefer to note 3.4 in the financial statements.
Late cost accruals relate to new equipment and modernisation contracts, which have been completed and revenue recognised.
The late cost accruals primarily include costs for material and subcontracting costs for which invoices have not yet been received, however, they also include expected costs still to be incurred based on management’s judgement and experience. Costs can arise after the completion of a customer contract, as post-handover work is performed related to already delivered and installed elevators and escalators. The balance recorded in late cost accruals is based on the total estimated costs for the projects, thereby reflecting management judgement.
We considered the recording of the late cost accruals at an appropriate level to constitute a focus area of the audit because of the degree of management judgement included in the estimates.
We have discussed the principles and methods for accruing the late costs with management and verified the compliance of these with IFRS.
Our audit of late cost accruals has included both the testing of controls and substantive procedures targeted at the balances recorded.
Our testing of controls was in particular targeted at the group’s IT system and related automatic controls, whereby management ensures late cost accruals are recorded.
Our substantive procedures have been focused around the cost estimates used in the project accounting. We have, where applicable, compared planned costs of projects to supply contracts, labour costs or other supporting documentation. Actual costs incurred project to date have been agreed to the accounting records.
We have no key audit matters to report with respect to our audit of the parent company financial statements.
85
KONE 2016 Annual Review | Auditor’s report
Responsibilities of the Board of Directors and the Managing Director for the financial statementsThe Board of Directors and the Managing Director are responsible for the preparation of consolidated financial statements that give a true and fair view in accordance with International Financial Reporting Standards (IFRS) as adopted by the EU, as well as for the preparation of financial statements that give a true and fair view in accordance with the laws and regulations governing the preparation of the financial statements in Finland and comply with statutory requirements. The Board of Directors and the Managing Director are also responsible for such internal control as they determine is necessary to enable the preparation of financial
statements that are free from material misstatement, whether due to fraud or error.
In preparing the financial statements, the Board of Directors and the Managing Director are responsible for assessing the Group’s ability to continue as a going concern, disclosing, as applicable, matters related to going concern and using the going concern basis of accounting unless they either intend to liquidate the Group or to cease operations, or have no realistic alternative but to do so.
Auditor’s responsibilities for the audit of the financial statementsOur objectives are to obtain reasonable assurance about whether the financial statements as a whole are free from material misstatement, whether due to fraud or error, and to issue an auditor’s report that includes our opinion. Reasonable assurance is a high level of assurance, but is not a guarantee that an audit conducted in accordance with good auditing practice will always detect a material misstatement when it exists. Misstatements can arise from fraud or error and are considered material if, individually or in the aggregate, they could reasonably be expected to influence the economic decisions of users taken on the basis of these financial statements.
As part of an audit in accordance good auditing practice, we exercise professional judgment and maintain professional skepticism throughout the audit. We also:• Identify and assess the risks of material misstatement of the
financial statements, whether due to fraud or error, design and perform audit procedures responsive to those risks, and obtain audit evidence that is sufficient and appropriate to provide a basis for our opinion. The risk of not detecting a material misstatement resulting from fraud is higher than for one resulting from error, as fraud may involve collusion, forgery, intentional omissions, misrepresentations, or the override of internal control.
• Obtain an understanding of internal control relevant to the audit in order to design audit procedures that are appropriate in the circumstances, but not for the purpose of expressing an opinion on the effectiveness of the parent company’s or the group’s internal control.
• Evaluate the appropriateness of accounting policies used and the reasonableness of accounting estimates and related disclosures made by management.
• Conclude on the appropriateness of the Board of Directors’ and the Managing Director’s use of the going concern basis of accounting and based on the audit evidence obtained, whether a material uncertainty exists related to events or conditions that may cast significant doubt on the parent company’s or the group’s ability to continue as a going concern. If we conclude that a material uncertainty exists, we are required to draw
attention in our auditor’s report to the related disclosures in the financial statements or, if such disclosures are inadequate, to modify our opinion. Our conclusions are based on the audit evidence obtained up to the date of our auditor’s report. However, future events or conditions may cause the parent company or the group to cease to continue as a going concern.
• Evaluate the overall presentation, structure and content of the financial statements, including the disclosures, and whether the financial statements represent the underlying transactions and events in a manner that achieves fair presentation.
• Obtain sufficient appropriate audit evidence regarding the financial information of the entities or business activities within the group to express an opinion on the consolidated financial statements. We are responsible for the direction, supervision and performance of the group audit. We remain solely responsible for our audit opinion.
We communicate with those charged with governance regarding, among other matters, the planned scope and timing of the audit and significant audit findings, including any significant deficiencies in internal control that we identify during our audit.
We also provide those charged with governance with a statement that we have complied with relevant ethical requirements regarding independence, and to communicate with them all relationships and other matters that may reasonably be thought to bear on our independence, and where applicable, related safeguards.
From the matters communicated with those charged with governance, we determine those matters that were of most significance in the audit of the financial statements of the current period and are therefore the key audit matters. We describe these matters in our auditor’s report unless law or regulation precludes public disclosure about the matter or when, in extremely rare circumstances, we determine that a matter should not be communicated in our report because the adverse consequences of doing so would reasonably be expected to outweigh the public interest benefits of such communication.
86
KONE 2016 Annual Review | Auditor’s report
Other reporting requirements
Other information The Board of Directors and the Managing Director are responsible for the other information. The other information comprises information included in the report of the Board of Directors and in the annual review, but does not include the financial statements and our auditor’s report thereon.
Our opinion on the financial statements does not cover the other information.
In connection with our audit of the financial statements, our responsibility is to read the other information identified above and, in doing so, consider whether the other information is materially inconsistent with the financial statements or our knowledge obtained in the audit, or otherwise appears to be materially misstated. With respect to the report of the Board of
Directors our responsibility also includes considering whether the report of Board of Directors has been prepared in accordance with the applicable legal requirements.
In our opinion• the information in the report of the Board of Directors is
consistent with the information in the financial statements• the report of the Board of Directors has been prepared in
accordance with the applicable legal requirements.
If, based on the work we have performed, we conclude that there is a material misstatement of the other information, we are required to report that fact. We have nothing to report in this regard.
Helsinki 26 January, 2017
PricewaterhouseCoopers OyAuthorised Public Accountants Pasi Karppinen Niina VilskeAuthorised Public Accountant Authorised Public Accountant
87
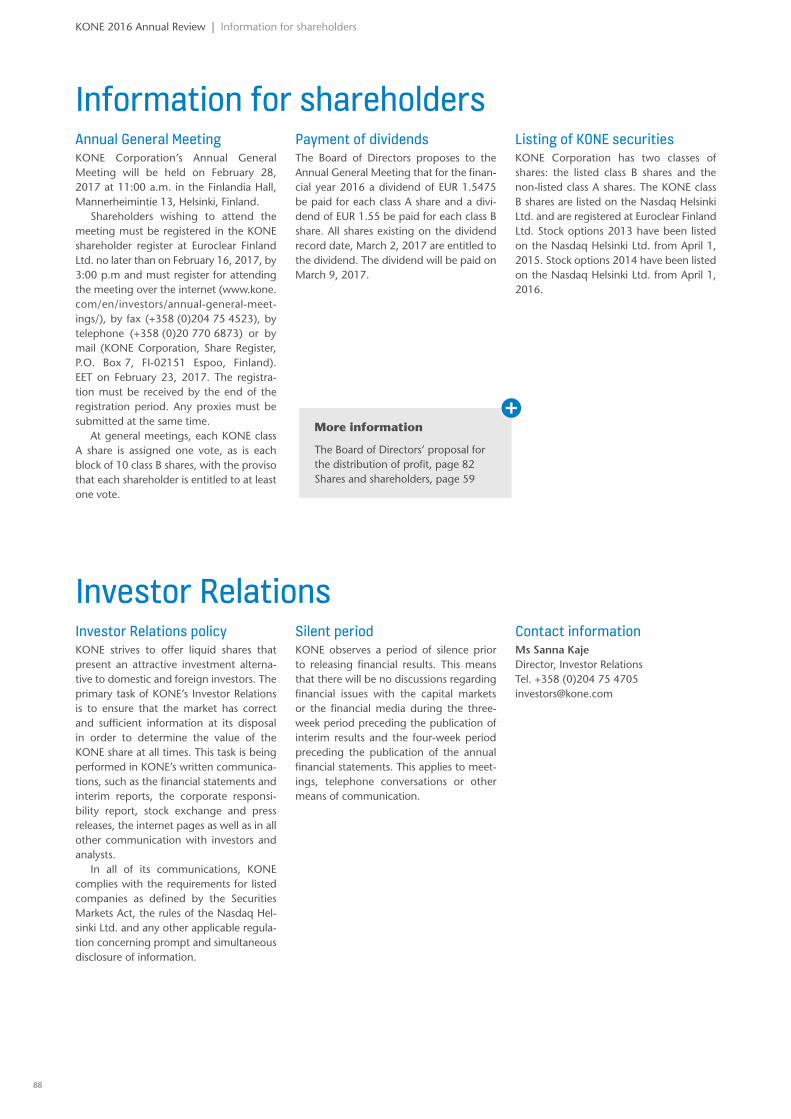
Investor RelationsInvestor Relations policyKONE strives to offer liquid shares that present an attractive investment alterna-tive to domestic and foreign investors. The primary task of KONE’s Investor Relations is to ensure that the market has correct and sufficient information at its disposal in order to determine the value of the KONE share at all times. This task is being performed in KONE’s written communica-tions, such as the financial statements and interim reports, the corporate responsi-bility report, stock exchange and press releases, the internet pages as well as in all other communication with investors and analysts.
In all of its communications, KONE complies with the requirements for listed companies as defined by the Securities Markets Act, the rules of the Nasdaq Hel-sinki Ltd. and any other applicable regula-tion concerning prompt and simultaneous disclosure of information.
Silent periodKONE observes a period of silence prior to releasing financial results. This means that there will be no discussions regarding financial issues with the capital markets or the financial media during the three-week period preceding the publication of interim results and the four-week period preceding the publication of the annual financial statements. This applies to meet-ings, telephone conversations or other means of communication.
Contact informationMs Sanna KajeDirector, Investor RelationsTel. +358 (0)204 75 [email protected]
Annual General MeetingKONE Corporation’s Annual General Meeting will be held on February 28, 2017 at 11:00 a.m. in the Finlandia Hall, Mannerheimintie 13, Helsinki, Finland.
Shareholders wishing to attend the meeting must be registered in the KONE shareholder register at Euroclear Finland Ltd. no later than on February 16, 2017, by 3:00 p.m and must register for attending the meeting over the internet (www.kone.com/en/investors/annual-general-meet-ings/), by fax (+358 (0)204 75 4523), by telephone (+358 (0)20 770 6873) or by mail (KONE Corporation, Share Register, P.O. Box 7, FI-02151 Espoo, Finland). EET on February 23, 2017. The registra-tion must be received by the end of the registration period. Any proxies must be submitted at the same time.
At general meetings, each KONE class A share is assigned one vote, as is each block of 10 class B shares, with the proviso that each shareholder is entitled to at least one vote.
Information for shareholdersPayment of dividendsThe Board of Directors proposes to the Annual General Meeting that for the finan-cial year 2016 a dividend of EUR 1.5475 be paid for each class A share and a divi-dend of EUR 1.55 be paid for each class B share. All shares existing on the dividend record date, March 2, 2017 are entitled to the dividend. The dividend will be paid on March 9, 2017.
Listing of KONE securities KONE Corporation has two classes of shares: the listed class B shares and the non-listed class A shares. The KONE class B shares are listed on the Nasdaq Helsinki Ltd. and are registered at Euroclear Finland Ltd. Stock options 2013 have been listed on the Nasdaq Helsinki Ltd. from April 1, 2015. Stock options 2014 have been listed on the Nasdaq Helsinki Ltd. from April 1, 2016.
KONE 2016 Annual Review | Information for shareholders
More information
The Board of Directors’ proposal for the distribution of profit, page 82Shares and shareholders, page 59
88

Des
ign
Zee
land
Fam
ily, p
rintin
g Pa
inot
alo
Plus
Dig
ital,
Laht
i
KONE Corporation
Head OfficeKartanontie 1P.O. Box 8FI-00331 HelsinkiFinlandTel. +358 (0)204 751Fax +358 (0)204 75 4309
Corporate OfficesKeilasatama 3P.O. Box 7FI-02150 EspooFinlandTel. +358 (0)204 751Fax +358 (0)204 75 4496
www.kone.com
KONE 2016 ANNUAL REVIEW