Embed Size (px)
Citation preview

C
Annual Review of Funding Levels and Risks
November 17, 2015

Table of Contents
Executive Summary ........................................................................................................................ 3
Introduction ..................................................................................................................................... 3
Shared Risk ..................................................................................................................................... 4
Changing Pension Environment ..................................................................................................... 5
Plans Are Maturing ..................................................................................................................... 5
Trend Towards Lower Discount Rates ....................................................................................... 7
Municipal Bankruptcies .............................................................................................................. 8
Contribution Levels ........................................................................................................................ 8
Funding Levels.............................................................................................................................. 15
Going Concern Basis ................................................................................................................ 15
Hypothetical Termination Basis ............................................................................................... 20
Risk Measures ............................................................................................................................... 22
Volatility ................................................................................................................................... 22
Asset Liability Management ..................................................................................................... 25
Proposed Funding Risk Mitigation Policy .................................................................................... 28
Conclusion .................................................................................................................................... 29

3
Executive Summary
Overall, this year’s report reiterates that employers are exposed to a considerable amount of contribution rate volatility and a risk of significant changes in funded status. Contribution rates are expected to remain high for an extended period unless there is a period of exceptional returns in the markets. Although the fund rate of return for Fiscal Year 2013-14 was 17.7% it was followed by a Fiscal Year 2014-15 return of 2.4%.
Current contribution levels are high relative to historical levels and for most employers are projected to increase over the next several years as a consequence of our amortization policies and deferred losses. Although funding levels have improved from their lows, they are still considerably below 100%. Our current amortization policies are expected to fully fund the plans over the next 30 years but to do so will require the high contribution levels shown in this report. Furthermore, the probability of reaching the low funded status thresholds in the report has worsened compared to last year and remains higher than staff is comfortable with.
In short, the report demonstrates that there is a significant amount of risk being taken in the funding of the system. Consequently, the probability that the system will face a period of severe stress is still at a level that may be unacceptable.
To address the risks in the funding of the system, the CalPERS Board of Administration directed staff to examine approaches to reduce funding volatility through a risk mitigation strategy. Staff developed a proposed policy and presented it to the Board at the October Finance and Administration Committee meeting. The policy is expected to be presented to the Board of Administration for a second reading in November.
If adopted, the policy will begin to mitigate funding risk by reducing the expected volatility of the investment returns by changing the target asset allocation after years of good investment returns. This in turn will result in lower expected returns and a lower discount rate.
The policy is expected to gradually lower the risks to the funding of the system over many years. It is not expected to significantly lower the risk of low funded status immediately – to do so would have required a strategy that would significantly increase the risk of high contribution rates. The policy reflects a balanced approach that is sensitive to the needs of all stakeholders.
Introduction
This report is intended to assist the CalPERS Board of Administration in assessing the funded status of the Public Employees Retirement System and its overall soundness and sustainability.
This is the fourth annual report on funding levels and risk measures. Last year’s report was based on the results of the June 30, 2013 valuations. The results presented in this

4
report are based on preliminary June 30, 2014 annual valuation results rather than the final results. This is due to delays caused by the additional work of implementing and providing GASB 68 reporting for our stakeholders. In this report, we focus on:
Current and near-term contribution levels,
Current funding levels on a going concern basis
Current funding levels on a hypothetical termination basis,
The volatility index (a measure of plan maturity)
Three key funding risk considerations that are used in the Asset Liability Management process.
The potential impact on risk levels if the proposed Funding Risk Mitigation Policy is adopted.
Any attempt to present an overview of funding levels and risks for a system such as CalPERS has an inherent difficulty; the system is composed of many plans, and several risk sharing pools that are funded separately. As a result, it is not sufficient to look at the funded status or various risk measures for the system as a whole. Instead, we need to look at the breakdown of the various measures for each of the non-pooled public agency plans, the two public agency risk pools and the State and Schools plans. Given the number of non-pooled public agency plans, we will focus on presenting the distribution of results with additional analysis of the outliers.
Shared Risk
As fiduciaries of the System, we are concerned about the risks to the members and their benefits, and also the risks to the employers and their financial needs.
Of primary concern is the risk that a member’s benefits will not be paid – in full and when due – as a result of the way the plan has been funded. It is also important, though, to consider the risks borne by the employer as this can impact their ability to make required contributions to fund the pensions. Investment and actuarial policies adopted by the CalPERS Board are always adopted with the purpose of maintaining benefit security for members while also considering the employers’ ability to pay the contributions needed to fund the benefits. Helping employers plan for their contribution requirement reduces risks to both the employer and the members’ benefits.
So long as the employer makes all of the contributions needed to fund the plan, along with the contributions from the members and the investment returns provided by CalPERS, the members’ benefits will be paid. While there is a legal requirement for the employer to make the full contribution needed to fund the system, in extreme circumstances the employer may be unable to do so. In these situations, the employer’s financial hardship can become a direct risk to the members and their

5
benefits. By focusing on the risks to the Soundness and Sustainability to the overall system, CalPERS can better reduce the risks to both members and employers.
In the end, some of the greatest risks to the sound and sustainable funding of members' benefits are those things that put stress on the financial strength of their employer. We are reminded that, ultimately, members and employers are in this together.
Changing Pension Environment
Plans Are Maturing
The aging of the population and the retirement of the baby boomer generation is well known to everyone. Demographic shifts have long been predicted and taken into account in the funding of the system. The higher number of retirements we have seen the last few years was projected all along and this trend is expected to continue as the baby boomer generation leaves the workforce to enter into its retirement years. Even though anticipated, this demographic shift is impacting risk measures identified in this report and has to be part of any discussion on funding levels and risks. One way to look at the maturity level of CalPERS and its plans is to look at the ratio of actives to retirees. A pension plan in its infancy will have a very high ratio of active to retired members. As the plan matures, the ratio starts declining. A mature plan will often have a ratio near or below one. For both CalPERS and other retirement systems in the US, these ratios have been steadily declining in recent years. Following is a chart comparing the ratio of active to retired members for CalPERS to other public retirement systems in the US. The trend for CalPERS plans is that they are becoming more mature. The ratio of active members to retired members is decreasing for the most part. There may be some cities or agencies that are in a growth cycle however, it appears that most are in a static growth period. This in conjunction with the benefit levels has resulted in an increase in the asset to payroll ratio. This will mean that volatility from this source will have a greater impact on employers than it had in the past.
6
As can be seen, the ratio for CalPERS has dropped from just above 2 to just above 1.3 over the time period. Currently we only have about one and one third active members payrolls to spread the risk associated with each retiree's benefits instead of the two to one ratio of a decade ago. An additional concern is that these ratios are also expected to continue dropping over the next few decades until they reach a floor somewhere between 0.6 and 0.8 depending on the plan. Below is a chart showing a projection of the ratio over the next 50 years for a sample of plans at CalPERS.

7
As plans mature, risk measures such as probabilities of large changes in contribution rates from year to year will increase and remain high unless actions are taken to significantly reduce the risk imbedded in the current asset allocation. This means that when financial markets fail to deliver a strong return or even collapse like they did in 2008-2009, it can lead to very high contribution levels that could lead to employer insolvency or even bankruptcy that ultimately could impact the security of benefits for members.
Trend towards Lower Discount Rates
In addition to the demographic forces above there are increased concerns about the investment horizon. The trend nationally for public pension plans in recent years has been a reduction in the rate of return assumption. The chart on the following page shows the change in distribution of public pension investment return assumptions from the 2001 Fiscal Year through May 2015 as compiled by the National Association of State Retirement Administrators. Among the 126 plans measured in the Public Fund Survey, more than one-half have reduced their investment return assumption since Fiscal Year 2008. The average return assumption is 7.68% and the median is 7.75%.

8
It is likely that the reductions in rate of return assumptions is a result of the same factors that have influenced changes at CalPERS, namely, a general lowering of expectations about future investment returns for a given level of risk and a concern about the level of risk being taken.
Municipal Bankruptcies
In the recent past, four CalPERS participating employers have declared bankruptcy. They are the cities of Stockton, San Bernardino and Vallejo and the town of Mammoth Lakes. CalPERS has sought to educate the bankruptcy courts and municipalities that the effect of less than full payment to CalPERS results in plan termination, and a corresponding reduction in member benefits.
Other than the City of San Bernardino, none of these municipalities have failed to pay CalPERS the amount that was determined was necessary to properly fund the benefits; and none of them proposed a plan of adjustment seeking to modify or reduce the municipality’s pension obligations to CalPERS. The City of San Bernardino did not remit its full contributions for the Fiscal Year 2012-13. The principal amount of payments required to be made to CalPERS by the City during Fiscal Year 2012-13 and that were not made by the City during that time was approximately $13.5 million for all of the City’s plans (Miscellaneous and Safety) combined, excluding interest, penalties, late fees, costs of collection and the like. During Fiscal Year 2013-14, as part of a court-ordered mediation process, the City and CalPERS reached an agreement pursuant to which the City agreed to pay the deferred amount in full, and since reaching the agreement, the City has made timely payments to CalPERS under the agreement. Even though municipal bankruptcy was at the forefront of both local and national news for a few
years, employers continued to fulfill their pension promises to their members. No additional
participating employers have declared bankruptcy since the declaration by San Bernardino in
2012.
Contribution Levels
For the most part, contribution levels have continued to increase over the prior year as expected due to the Board’s amortization policies. While most employers saw relatively modest increases in their required contributions, some employers in risk pools with high retiree to active member ratios are seeing significant increases in their required contributions. This is a result of the combining of risk pools in response to the Public Employee Pension Reform Act (PEPRA).
In addition, many employers have been reducing their payrolls. Since the required contribution to pay off the unfunded liability is not related to their payroll, this is having the effect of increasing the UAL contribution rate as a percent of the (reduced) payroll. As a reminder, the UAL amount for pooled plans is now billed as a dollar amount and for the chart below converted to a percent of payroll for comparison purposes.

9
Most employers who saw significant increases in their contribution rates were affected by one of these two factors.
The distribution of the changes in employer rates is shown in the following table. This table reflects each employer’s plans combined together, so an employer’s miscellaneous plan and safety plan are combined into one theoretical employer rate.
Distribution of Changes in Employer Rates between 2015-16 & 2016-17
With the implementation of the Public Employees’ Pension Reform Act, there has been an explosion of new benefit tiers and, for pooled plans, this has meant new rate plans. Most of these new rate plans have no unfunded liabilities and hence have modest required contribution rates. However, it should not be seen as an overall reduction in the contribution levels for employers. Below is a graph which sums all employers’ plans into one rate either Miscellaneous or Safety plan. So if an employer has three miscellaneous rate plans, we have compressed this into one employer rate, similar for Safety plans.

10
2015-16 Public Agency Employer Rates*
2016-17 Public Agency Employer Rates*
* Includes all Employers’ Plans categorized into one Safety or Miscellaneous for each Employer.
We are expecting to see continuing increases in the contribution requirement for the State and School plans. The following charts show the distribution of the Fiscal Year 2015-16 and the estimated Fiscal Year 2016-17 contribution rates for State and Schools plans.

11
2015-16 State and Schools Employer Rates

12
Estimated 2016-17 State and Schools Employer Rates
Estimate of 2017-18 Employer Contribution Rates
As in prior years, the actuarial valuation reports include a projection of the employer contribution rates for the next fiscal year, in this case 2017-18. The rates were calculated based on an estimated 2.4 percent investment return for Fiscal Year 2014-151 and the new actuarial assumptions that have been implemented as of June 30, 2014.
The following chart shows the distribution of the estimated 2017-18 contribution rates for Miscellaneous and Safety plans based on the new amortization and smoothing policy.
1 The money weighted rate of return net of investment expenses was 2.6%. However, this was reduced to include an
allowance for administrative expenses resulting in a net return of 2.4%.

13
Estimated 2017-18 Public Agency Employer Rates*
* Includes all Employers’ Plans categorized into one Safety or Miscellaneous for each Employer.
This graph shows that the number of employers with contributions above 30 or 40 percent of pay continues to increase.
As always, member contributions (whether paid by the employer or the employee) are in addition to the above rates.
Another way to look at the gradual increase in employer contribution rates is by looking at the expected average contribution rate. Following is a table showing the average estimated employer contribution rates for Miscellaneous and Safety plans for Fiscal Years 2015-16 to 2021-22.

14
Average Employer Contribution Rates
While employers are expected to see a small reduction in their required contributions in Fiscal Year 2021-22, the rates in that year are still expected to be above current levels.
The impact of smoothing and providing projected contribution rates should be of assistance to employers in their budgeting process. Nonetheless, the overall level of contributions is still of concern, especially for Safety plans.
Plans at CalPERS are still at risk of higher expected contributions if investment markets do not perform well. A return 10 percent below the funding assumption will see contributions continue to rise. In contrast, a return 10 percent above the funding assumption would result in rates remaining essentially stable to slightly lower in the first few years. The Actuarial Office continues to disclose this potential risk in the form of an investment return sensitivity analysis. This sensitivity analysis includes the impact on rates over the next 5 years under various investment return scenarios. These projections show that rates are more likely to increase in the event of a poor investment performance.
As noted in last year’s report, current contribution levels are high relative to historical levels and, for almost all employers, scheduled to increase further as our amortization policies continue to phase in previous asset losses. For many plans, the contribution rates have never been as high as they are now. Current contribution levels already exceed 30% of payroll for over 80 miscellaneous plans. Safety plans generally have higher contribution levels with over 135 plans having contribution levels of more than 40% of payroll. Employers are reporting that these contribution levels are putting

15
significant strain on their budgets and limiting their ability to provide services to the people in their jurisdictions.
Funding Levels
In February 2014, the CalPERS Board made important decisions regarding the funding of pension benefits at CalPERS, these decisions also had an impact on funding levels. Specifically, the Board adopted relatively modest changes to the current asset allocation that will reduce the expected volatility of investment returns while holding the fund’s long-term assumed rate of return at 7.5 percent. The Board also adopted more significant changes to the actuarial assumptions, most importantly, the inclusion of future mortality improvements in the actuarial assumptions. Finally, the Board approved a new financing method, which determines when and how quickly these changes will impact employer contributions. The actuarial assumptions adopted by the CalPERS Board of Administration are designed to ensure greater sustainability and soundness of the pension fund, and will be better at predicting future experience resulting in more secure retirement benefits in the decades to come. The current experience study was based on demographic CalPERS data for years 1997 to 2011. The study focused on recent patterns of termination, death, disability, retirement and salary increases. These new assumptions will apply for funding purposes beginning with the June 30, 2015 valuation for the Schools Pool, setting employer contribution rates for the 2016-17 Fiscal Year. For Public Agencies, the new assumptions apply for funding purposes in the June 30, 2014 valuations, setting rates for the 2016-17 Fiscal Year. The charts below, and for our discussion here we have computed the funded statuses with the new assumptions applied as of June 30, 2014.
The discussion below looks at funding levels in two different contexts. First, we examine the funding levels on an on-going plan basis. That is, we look at the funded status using our regular funding assumptions assuming that the plan is on going with service being accrued by members, salary increases occurring normally and so on. The second context is that of a hypothetical termination basis where we look at what the funded status would have been had the employer sponsoring the plan elected to terminate their contract with CalPERS.
Going Concern Basis
It is not required, nor necessarily desirable; to have accumulated assets sufficient to cover the total present value of benefits until every member has left employment. Instead, the actuarial funding process calculates a regular contribution schedule of employee contributions and employer contributions (called normal costs) that are designed to accumulate with interest to equal the total present value of benefits by the time every member has left employment. As of each June 30, the actuary calculates the “desirable” level of plan assets as of that point in time by subtracting the present value of scheduled future employee contributions and future employer normal costs from the total present value of benefits. The resulting “desirable” level of assets is called the accrued liability.

16
A plan with assets exactly equal to the plan’s accrued liability is simply “on schedule” in funding that plan, and only future employee contributions and future employer normal costs are needed. A plan with assets below the accrued liability is “behind schedule”, or is said to have an unfunded liability, and must temporarily increase contributions to get back on schedule. A plan with assets in excess of the plan’s accrued liability is “ahead of schedule”, or is said to have excess assets. Such a plan will no longer have a UAL contribution but as a result of PEPRA is still required to contribute the plan’s total normal cost. Of course, events such as plan amendments and investment or demographic gains or losses can change a plan’s condition from year to year.
The funded status of a pension plan is defined as the ratio of assets to a plan’s accrued liabilities. The funded status shown in the following summary and charts is based on the market value of assets. As of June 30, 2014, after reflecting the new assumptions adopted by the CalPERS Board, the PERF was 76 percent funded on a market value basis. This number is an average of all plans that are part of the PERF. As a result of the 2.4% percent investment return in Fiscal Year 2014-15, we estimate the funded status on a market value basis for the PERF to be about 73 percent as of June 30, 20152. When looking at the funding risk, one needs to look at all plans individually and not only the PERF as a whole. Below are charts of the funded status of the PERF system broken down by various groups as of June 30, 2014 based on the new assumptions adopted by the Board in February 2014 as well as charts showing the estimated funded status as of June 30, 2015.
2 The estimated funded status as of June 30, 2015 is estimated after changes to actuarial assumptions and the known
investment return in Fiscal Year 2014-2015 of approximately 2.4%.

17

18

19

20
As shown in the charts above, most plans in the system are between 65 percent and 85 percent funded as of June 30, 2014. The vast majority of pooled plans were between 70 percent and 90 percent funded as of June 30, 2015 with a few hundred plans over 100%; these plans were recently created new tier plans prior to PEPRA. Being less than 100 percent funded means that employer contributions need to be higher than the employer normal cost.
There is one non-pooled plan that has a funded status below 60 percent. The plan has just recently contracted with CalPERS with 100 percent past service so a low funded status is to be expected.
There are a few non-pooled plans that has a funded status over 100 percent, these are plans that have either recently joined CalPERS and has contributed more than their liabilities (0 percent past service) since inception or have had good investment, demographic experience or made additional payments towards their UAL. There are over 80 non-pooled plans that are between 80 percent and 100 percent funded, these plans have had either good experience or have been making contributions above those that are required but none indicated that Pension Obligation Bonds were the source of the extra contributions.
The funded status risk measure does not appear to indicate an immediate risk, but will continue to be monitored closely. As stated earlier, being less than 100 percent funded means that employer contributions need to be higher than the employer normal cost. While this does not necessarily mean that contributions need to be higher than the current contribution level, results presented earlier show that contributions are expected to increase over the next five years.
Hypothetical Termination Basis
In August 2011, the CalPERS Board adopted an investment policy and asset allocation strategy for the Terminated Agency Pool that more closely reflects expected benefit payments from that pool. With this change, CalPERS increased benefit security for members while limiting its funding risk.
It is important to keep in mind that tracking the funded status on a hypothetical termination basis is key because if a plan were to terminate and the employer is unable to make up the shortfall, benefits could be reduced by the amount that the plan is underfunded.
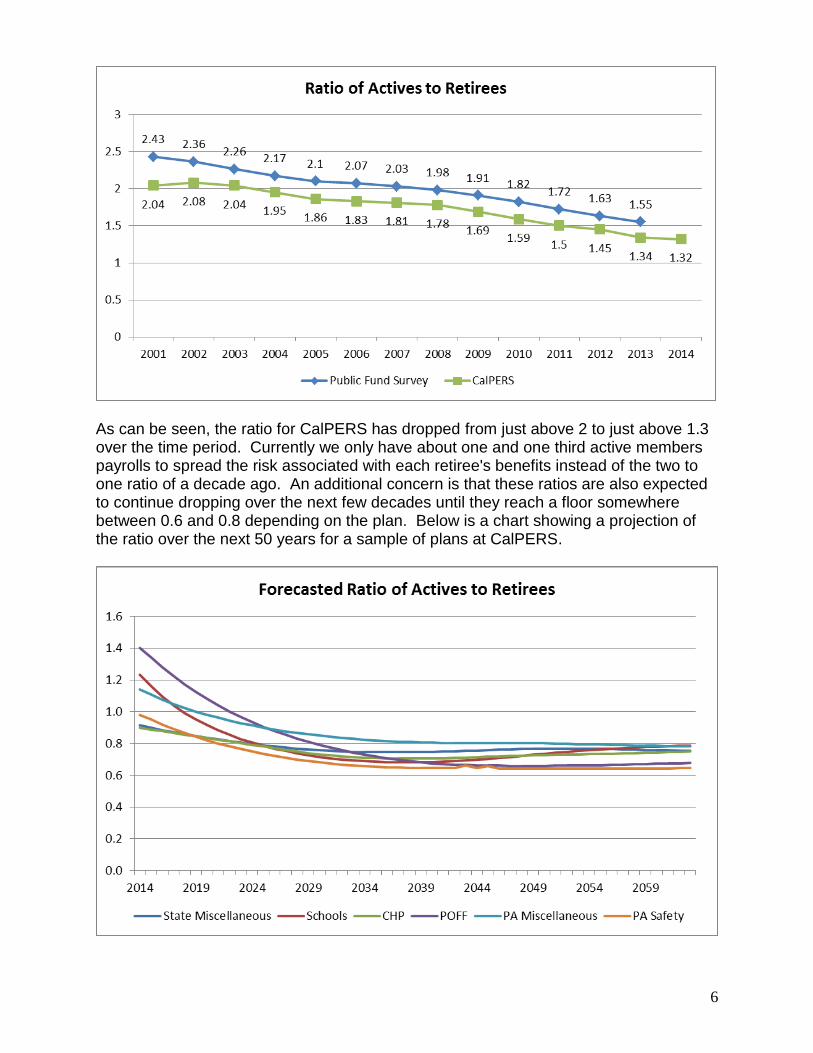
The assumptions used, including the discount rate, take into account the yields available in the US Treasury market on the valuation date and the mortality load for contingencies. The discount rate is duration weighted and is not necessarily the rate that would be used for a given plan if it were to terminate. The discount rate for each plan’s termination liability would depend on the duration of the liabilities of the plan. Please note, as of June 30, 2014 the 30-year US Treasury Stripped Coupon Rate was 3.64 percent. On this basis the hypothetical termination funded statuses for most plans is in the 40 percent to 60 percent range and are based on the old actuarial assumption set, the only available at the writing of this report.

21
Below are charts of the hypothetical termination funded status of the public agency plans3. For the non-pooled plans the bulk of plans are currently in the 40% to 60% funded range and for those below 40%, nearly all are near 40% funded. For the pooled plans, the same pattern exists with the exception of several new rate plans that are just beginning to develop and show much higher liabilities relative to assets.
1 Excludes PEPRA plans, as they have a low membership base and have been recently created. Due to this, they
have a hypothetical funded status greater than 100%, which would skew the chart.
2 Most plans with a funded status greater than 100% are recently created 2
nd Tier plans that have low assets and
liabilities. These plans correspond to 1st Tier plans that are between 40-60% funded.
3 Legislation does not permit State & Schools Plans to be terminated.
22
Even though actuarial valuations now show hypothetical information on the amount that would be owed at termination, a plan termination is a rare occurrence at CalPERS and usually occurs as a result of an employer ceasing to exist. The current terminated agency pool at CalPERS has 90 employers that have terminated for which we have liabilities. In the last fiscal year, four very small employers terminated their contract with CalPERS. Three of the terminations were initiated by CalPERS once staff discovered the agencies were no longer in existence. The other employer initiated the process due to its inability to continue to fund the pension plan. In all cases, these employers were very small in size.
Risk Measures
Volatility
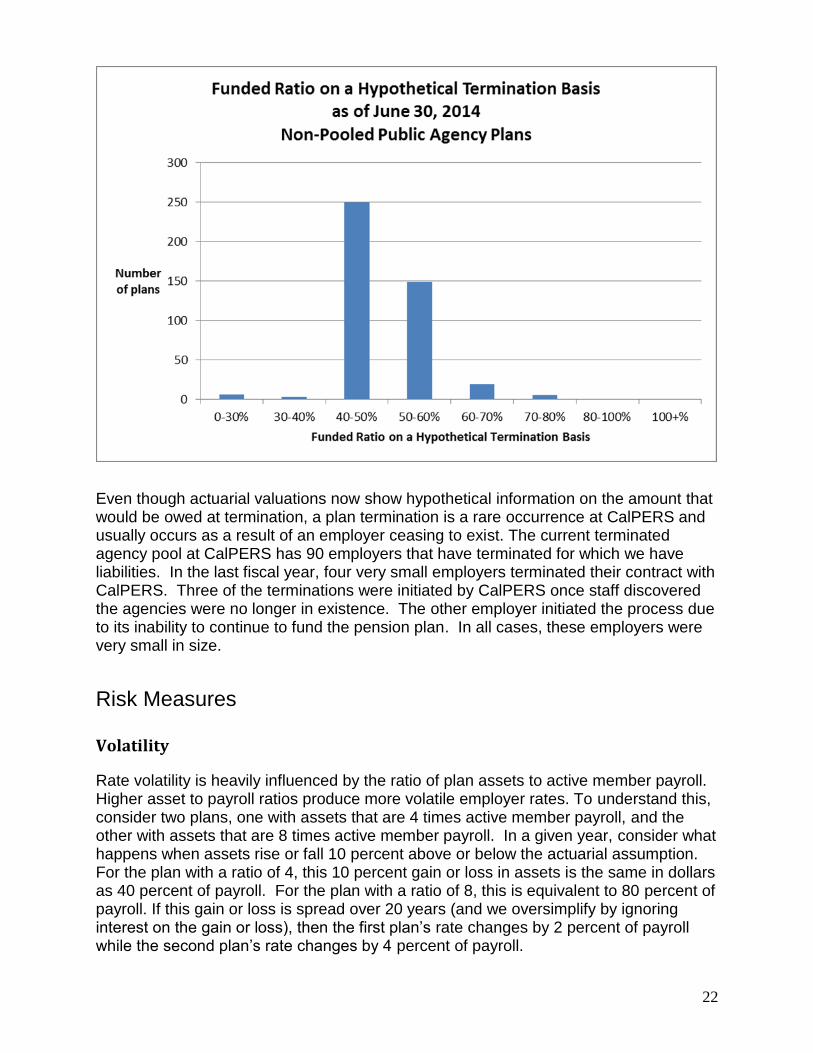
Rate volatility is heavily influenced by the ratio of plan assets to active member payroll. Higher asset to payroll ratios produce more volatile employer rates. To understand this, consider two plans, one with assets that are 4 times active member payroll, and the other with assets that are 8 times active member payroll. In a given year, consider what happens when assets rise or fall 10 percent above or below the actuarial assumption. For the plan with a ratio of 4, this 10 percent gain or loss in assets is the same in dollars as 40 percent of payroll. For the plan with a ratio of 8, this is equivalent to 80 percent of payroll. If this gain or loss is spread over 20 years (and we oversimplify by ignoring interest on the gain or loss), then the first plan’s rate changes by 2 percent of payroll while the second plan’s rate changes by 4 percent of payroll.

23
Plans with relatively larger benefits and earlier retirement ages need to accumulate assets at a faster rate than their counterparts. Such plans tend to have a higher ratio and are more susceptible to larger asset gains or losses. Thus, larger ratios combined with large asset gains or losses translate into larger contribution changes relative to payroll.
This ratio is significantly affected by plan maturity. Plans start their lives with no assets and so the asset to payroll ratio is zero. As time goes by, the ratio rises and then tends to stabilize at some level as the plan matures. As discussed in the section on "Changing Pension Environment" plans at CalPERS have been and continue to mature. This means that the asset to payroll ratio is expected to continue to increase for some time. Ultimately, the ratio is expected to decline from the peak as a result of the lower benefit levels included in PEPRA but that will take many years.
The following charts of the asset to payroll ratios of the PERF system are broken down by various groups:

24
This risk measure is descriptive in nature. That is, there is nothing to “fix” if the Volatility Index is high. A high Volatility Index simply indicates that there is a lot of money invested for the plan--a good thing in the overall scheme of a pension plan. It should, however, serve as a reminder that the more money invested, the more impact investment gains and losses have. It should also be noted that this Volatility Index only considers volatility related to investment returns and, to a lesser extent, payroll. Other gains and losses affect the liability and are therefore not taken into account in the determination of the index.
As shown in the charts above, the average asset to payroll ratio is between 4 and 5 but there are a significant number of plans with ratios above this level. Given the expected level of investment volatility, plans with an asset to payroll ratio of 4 are expected to experience a gain or loss in excess of 50 percent of the sponsoring employer’s payroll in about one third of future years. Plans with higher asset to payroll ratios are expected to experience even greater levels of sensitivity to investment returns.

25
Asset Liability Management
Over the last year few years, CalPERS Actuarial Office, Investment Office, and Financial Office have worked together to develop the Asset Liability Management (ALM) model to help understand the issue of funding risk. It uses an integrated view of assets and liabilities to assist in the evaluation of actuarial and investment decisions. This tool has proved very useful in bringing risk issues into the foreground.
The ALM model focusses on three measures of risk over an extended period of time. The measures are:
1. The probability of low funded status which is an indication of risk to the members in the event that the employer does not continue funding.
2. The probability of high levels of employer contribution rates which is an indication of financial strain on the employers and could lead to employers being unable to continue funding the benefits.
3. The probability of a large increase in employer rates in a single year, which is another indication of financial strain on the employers.
At the present time, the ALM model is only able to provide information on a limited set of plans. Currently these plans are:
State Miscellaneous Plan
State Peace Officer/Firefighter Plan (State POFF)
California Highway Patrol Plan
The Schools Pool
A sample (very large) public agency Miscellaneous plan
A sample (very large) public agency Safety plan
The probabilities of the funded status of these plans falling below various levels at any point in the next 30 years are shown below.
Plan Name
Probability of Falling Below Given Funding Level
(at any point in next 30 years)
40% 50% 60%
State Misc. 15% 35% 61%
Schools 11% 28% 50%
PA Misc. 13% 29% 52%
CHP 14% 39% 73%
State POFF 12% 33% 61%
PA Safety 14% 33% 58%

26
The table above shows an uncomfortably high probability that plans will fall below 50%. This probability has increased slightly from the prior year shown below due to the 2.4 percent investment return for Fiscal Year 2014-15.
Plan Name
Probability of Falling Below Given Funding Level
(at any point in next 30 years)
40% 50% 60%
State Misc. 14% 32% 55%
Schools 10% 23% 43%
PA Misc. 11% 26% 47%
CHP 13% 35% 100%
State POFF 11% 30% 55%
PA Safety 12% 29% 51%
Because of the demands of safety jobs, safety plans are designed to accommodate earlier retirement. As such, they generally have higher required contribution levels. For this reason, we show the high contribution levels and large single year increases for Safety and Miscellaneous plans at different levels. The table below shows the probability of plans exceeding a specified contribution level at some point in the next 30 years.
Plan Name
Probability of Employer Contribution Rates Exceeding Given Level (at any point in next 30 years)
30% of Payroll
35% of Payroll
40% of Payroll
State Misc. 73% 53% 34%
Schools 31% 15% 5%
PA Misc. 43% 25% 12%
50% of Payroll
55% of Payroll
60% of Payroll
CHP 89% 70% 56%
State POFF 56% 44% 32%
PA Safety 61% 50% 39%

27
These probabilities have increased in comparison with the prior report because of the projected loss being ramped in over five years of the 2.4 percent investment return for Fiscal Year 2014-15. For comparison, below is the same chart from the last risk report.
Plan Name
Probability of Employer Contribution Rates Exceeding Given Level (at any point in next 30 years)
30% of Payroll
35% of Payroll
40% of Payroll
State Misc. 67% 49% 33%
Schools 27% 13% 5%
PA Misc. 39% 22% 10%
50% of Payroll
55% of Payroll
60% of Payroll
CHP 76% 62% 50%
State POFF 52% 40% 29%
PA Safety 54% 44% 34%
Finally, the table below shows the probability of an increase in the employer contribution level above a specified level at some point in the next 30 years.
Plan Name
Probability of Employer Contribution Rates Increasing by More Than a
Given Level (at any point in next 30 years)
3% of Payroll
5% of Payroll
7% of Payroll
State Misc. 54% 10% 1%
Schools 45% 4% 0%
PA Misc. 49% 8% 1%
5% of Payroll
7% of Payroll
9% of Payroll
CHP 55% 25% 9%
State POFF 46% 18% 6%
PA Safety 58% 24% 9%

28
In comparison, below is the same chart from the last risk report.
The tables above show that there is considerable risk in the funding of the system. Unless changes are made, it is likely that there will be a point over the next 30 years where the funded status of many plans will fall below 60% at some point. There is about a 15% chance that we will see funded statuses below 40%.
The new amortization and smoothing methods recently adopted by the Board have made it less likely that employers will see sharp increases in their rates in a single year. Hopefully this will give employers time to plan for and, as best as they can, mitigate the impact of higher contributions if we experience a difficult financial period.
The combined message of the ALM measures shown above is that all three measures are very comparable to what we have seen last year, but in general are slightly higher due to our most recent investment experience.
Proposed Funding Risk Mitigation Policy
A proposed Funding Risk Mitigation Policy has been developed and is expected to be presented to the Board of Administration at the same meeting as this report will be presented. The policy, if adopted, will result in a change in the target asset allocation that lowers the expected investment volatility, expected investment returns and the discount rate. These changes will happen after years when the investment return exceeds certain thresholds.
Plan Name
Probability of Employer Contribution Rates Increasing by More Than a
Given Level (at any point in next 30 years)
3% of Payroll
5% of Payroll
7% of Payroll
State Misc. 59% 15% 2%
Schools 43% 6% 0%
PA Misc. 48% 10% 1%
5% of Payroll
7% of Payroll
9% of Payroll
CHP 61% 28% 11%
State POFF 49% 20% 7%
PA Safety 55% 27% 10%

29
Over time, these changes would result in significantly less investment volatility which is the most significant driver of fluctuation in employer contribution rates and funded status.
While adoption of the policy would have no immediate effect on the asset allocation or discount rate, it will have significant impacts over the 30-year period that the ALM model considers when it measures risk. The interaction of the policy with the risk measures described in the previous section of this report is complex.
As an example, it is useful to consider what happens to the probability of low funded status when a lowering of the expected investment volatility and discount rate is triggered under the policy. Because of the lower discount rate, the actuarial liabilities will increase and the funded status will decrease. This in turn will result in an increase in the near-term probability of low funded status. But, because of the lowered investment volatility in the future, future fluctuations of funded status will be less and the progress towards full funding will be smoother. This will reduce the probability of low funded status in the longer term. Which factor has the larger impact on the probability of low funded status over the next 30 years is not obvious. What is clear is that the policy will reduce the probability of low funded status in the long term.
Because of the interaction described above, the initial impact of adopting a funding risk mitigation policy on the probability is modest. For example, for the State Miscellaneous plan, the probability of falling below 50% funded at some point in the next 30 years would be reduced by about 4% (from 35% to 31%).
The impact on the probability of high employer contributions is more straightforward. It generally increases the probability of high employer contributions. For the State Miscellaneous plan, the probability of the employer contribution rate exceeding 40% of pay at any point in the next 30 years increases by about 2% (from 34% to 36%).
Finally, the biggest impact of risk mitigation is on the probability of large single year increases in employer rates. These are reduced significantly. For the State Miscellaneous plan, the probability of the employer contribution rate increasing by more than 5% of pay in any of the next 30 years decreases substantially (from 10% to 3%).
The essential result of adopting the proposed policy is to shift the system over time to be more sound and sustainable.
Conclusion
The various measures that were analyzed give different perspectives on the risk associated with the funding of the system. When looked at together, these risk measures show that there is still considerable risk in the funding of the system. The risk of low funded status has been reduced considerably over the last few years by the adoption of a new asset allocation and new assumptions and by changes to the smoothing policies. However, this improvement has come at the expense of increasing employer contributions and this has put additional strain on contributing employers.

30
In the short term, contribution rate levels are expected to increase unless the System experiences a period of exceptional investment returns. The rates will probably remain high for an extended period to eliminate the unfunded liabilities.
Pension plans at CalPERS are becoming more mature. Along with the benefit levels, this has resulted in an increase in the asset to payroll levels. This means that investment volatility is having a greater impact on employers than it had in the past.
Changes to accounting standards (GASB Statement 68) were implemented this year and may affect employers’ willingness to accept the current level of risks associated with the sponsoring of a defined benefit pension plan. This may result in pressure to change their risk profile by making changes to actuarial or investment policies and/or benefit levels.
Pension reforms that were implemented effective January 1, 2013 will afford employers some relief in the longer term both as to the level and volatility of contributions but this will take decades to fully take hold.
Governmental revenues appear to be recovering from the lows experienced after the Great Recession. A more positive tone about employers’ financial situation was evident at the recently completed CalPERS Education Forum. Also evident at the forum was a desire on the part of many employers to address unfunded liabilities in advance of any future downturn in the economy.
The Asset Liability Management risk measures show that there remains considerable risk in the funding of the system. There is a substantial risk that, at some point over the foreseeable future, there will be periods of low funded status and high employer contribution rates. Should this coincide with a period of financial weakness for employers or if such a period occurs before we recover from the current funding shortfall, the consequences could be very difficult to bear.
Combined, the measures discussed above indicate that, while employers may be under less financial stress than in recent years, employers will continue to be exposed to the risk of significant financial stress unless steps are taken to mitigate these risks.
A proposed Funding Risk Mitigation Policy has been developed and is expected to be presented to the Board of Administration at the same meeting as this report will be presented. If adopted, this proposed policy will gradually reduce the level of risk in the funding of the system by changing the target asset allocation to reduce the volatility of investment returns. The policy would ultimately reduce the risks in the funding of the System significantly. However, it will take many years for this to happen and ongoing vigilance will still be needed in the interim.