Embed Size (px)
Citation preview

Annual Statistics of Scientific Procedures on Living Animals Great Britain 2012
HC 549£10.75


HOME OFFICE Annual Statistics of Scientific Procedures on Living Animals
GREAT BRITAIN 2012 Presented to Parliament pursuant to section 21(7) of
the Animals (Scientific Procedures) Act 1986 Ordered by the House of Commons to be printed 16 July 2013
HC 549 LONDON: The Stationery Office £10.75

© Crown copyright 2013
You may re-use this information (excluding logos) free of charge in any format or medium, under the terms of the Open Government Licence. To view this licence, visit http://www.nationalarchives.gov.uk/doc/open-government-licence/ or email: [email protected]. Where we have identified any third party copyright information you will need to obtain permission from the copyright holders concerned. Any enquiries regarding this publication should be emailed to us at [email protected] or sent to us at Home Office Statistics, 5th Floor, Peel Building, 2 Marsham Street, London, SW1P 4DF. You can download this publication from https://www.gov.uk/government/publications/statistics-of-scientific-procedures-on-living-animals-great-britain-2012. ISBN: 9780102986518 Printed in the UK by The Stationery Office Limited on behalf of the Controller of Her Majesty’s Stationery Office ID 2573951 07/13 Printed on paper containing 75% recycled fibre content minimum.

Contents
Page Introductory Notes
5
SUMMARY
7
COMMENTARY
9
TABLES
Organisation chart: relationship between the tables
24
General Tables:
Table
Table Title
1 Scientific procedures by species of animal and primary purpose of the procedure 25 1a Animals used by species of animal and primary purpose of the procedure 27 2 Scientific procedures by Schedule 2 listed species and source of animals 29 3 Scientific procedures by species of animal and genetic status – summary version 30 4 Scientific procedures by species of animal and target body system 31 5 Scientific procedures by species of animal and level of anaesthesia 32 Non-toxicology:
Table Table Title 6 Scientific procedures (non-toxicology) by species of animal and field of research 33 6a Animals used (non-toxicology) by species of animal and field of research 37 7 Scientific procedures (non-toxicology) by species of animal and production of
biological materials
41
Toxicology:
Table Table Title 9 Scientific procedures (toxicology) by species of animal and toxicological purpose 42 9a Animals used (toxicology) by species of animal and toxicological purpose 46 10 Scientific procedures (toxicology) by species of animal and type of legislation –
summary version 50
11 Scientific procedures (toxicology) by species of animal and type of toxicological test: all purposes
51
Appendix A General system of control under the Animals (Scientific Procedures) Act 1986 53
Table Table Title 19 Project licences and scientific procedures by type of designated establishment 56 Note: The ‘Supplementary Tables’ and ‘Time Series Tables’ and the ‘User Guide to Home Office Statistics of Scientific Procedures on Living Animals’ can be found on the website at: https://www.gov.uk/government/publications/statistics-of-scientific-procedures-on-living-animals-great-britain-2012.
3

This page is intentionally blank
4

Introductory Notes The statistics in this publication relate to scientific procedures performed using living animals subject to the provisions of the Animals (Scientific Procedures) Act 1986, during the year 2012. The purpose of the publication is to meet the requirements of the Animals (Scientific Procedures) Act 1986 section 21(7) “The Secretary of State shall in each year publish and lay before Parliament such information as he considers appropriate with respect to the use of protected animals in the previous year for experimental or other scientific purposes”. The system of control under the 1986 Act is explained in detail in Appendix A. Confidentiality and data quality
Detailed information on the work of individual project licence holders is not readily identifiable in this publication. Where a further breakdown of the ‘other’ species categories is not given in the commentary this is to safeguard the confidentiality of the establishment and the licence holder. The data are subject to revision in accordance with the Home Office’s revisions policy. For more information, please see the User Guide to Home Office Statistics of Scientific Procedures on Living Animals, hereafter referred to as the User Guide. Symbols used in tables .. not available - nil N/A not applicable r revised Acknowledgements
This publication and the accompanying web tables have been prepared by staff in the Home Office Statistics unit of the Home Office Science Group. We are grateful for the contribution of licensees who provided the returns on which this report is based. We are also grateful for the support of colleagues in the Policing Data Collection Section for data input; the Animals in Science Regulation Unit for their assistance with the collection, processing and quality assurance processes involved in preparing this report; and colleagues in the Communications Development Section who assisted in preparing the report for publication.
Uses of the statistics
The statistics are used to inform the general public, by the Government for policy decisions, for resource allocation, to inform private sector commercial choices, to support third sector activity and to facilitate academic research. For more detailed information, please refer to the User Guide.
Further information available
This publication is available online at: https://www.gov.uk/government/publications/statistics-of-scientific-procedures-on-living-animals-great-britain-2012. The website also includes:
• the ‘User Guide to Home Office Statistics of Scientific Procedures on Living Animals’ (a useful online reference guide which includes explanatory notes on the issues and classifications which are key to the production and presentation of the statistics);
• the ‘Supplementary Tables’ and the ‘Time Series Tables’.
5

The dates of forthcoming publications are pre-announced and listed on the UK National Statistics Publication Hub: http://www.statistics.gov.uk/hub/index.html.
Home Office Responsible Statistician
David Blunt, Chief Statistician and Head of Profession for Statistics
Information on how Home Office Statistics outputs are published independently as part of the Code of Practice for Official Statistics is available at https://www.gov.uk/government/organisations/home-office/about/statistics.
Enquiries
If you have any enquiries about this publication, please email [email protected] or write to:
Home Office Statistics, 5th Floor, Peel Building, 2 Marsham Street, London, SW1P 4DF.
This statistical bulletin is a National Statistics output produced to the highest professional standards and free from political interference. It has been produced by statisticians working in Home Office Statistics in accordance with the Home Office’s Statement of Compliance with the Code of Practice for Official Statistics, which covers our policy on revisions and other matters. The governance arrangements in the Home Office for statistics were strengthened on 1 April 2008 to place the statistical teams under the direct line management of a Chief Statistician, who reports to the National Statistician with respect to all professional statistical matters.
6

Summary
1. In 2012, 4.11 million scientific procedures were started in Great Britain, an increase of eight per
cent (+317,200 procedures) compared with 2011. The rise was mainly attributable to a 22 per cent (+363,100) increase in the breeding of genetically modified (GM) animals1 and harmful mutants (HM)2
2. For the first time, the number of procedures involving GM animals (1.91 million) was greater than the number performed on normal animals (1.68 million).
, mainly mice, to 1.98 million procedures, nearly half (48%) of the total number of procedures performed. Excluding the breeding of GM and HM animals, the total number of procedures decreased by two per cent (-46,000) to 2.13 million procedures.
3. There were increases in 2012 in the numbers of procedures for the following species: mice (+379,058 or +14%); sheep (+5,157 or +14%); goats (+1,462 or +746%), up from 196; guinea pigs (+1,203 or +10%); and non-human primates (+545 or +22%). There were falls for the following species: fish (-63,073 or -11%); amphibians (-2,218 or -14%); rabbits (-1,595 or -10%); and pigs (-961 or -22%).
4. The numbers of procedures for safety testing (toxicology3
5. The number of non-toxicology procedures increased by ten per cent (+339,200) to 3.73 million and included rises for the following fields of research: nutrition (79,300 or +425%); anatomy
) decreased by six per cent (-22,100) to 377,000, with a greater proportion to 2011 carried out to meet at least one legislative/regulatory requirement (94% compared with 84%).
4 (73,200 or +20%); cancer research (+69,000 or +16%); genetics5 (+46,000 or +13%); ecology6 (+33,100 or +85%); and biochemistry7 (+15,800 or +54%). There were falls in the fields of physiology8 (-173,600 or -29%); pharmaceutical research and development (-24,600 or -11%); and pharmacology9
1 Genetically modified animals are animals whose genetic characteristics have been altered using genetic engineering, which produces a new trait in an animal or a biological substance, such as a protein or hormone. For a more detailed description, please see the User Guide.
(-10,100 or -14%).
2 Harmful mutants are animals possessing one or more genes that have undergone mutation, which involves a change in their genetic structure. For a more detailed description, please see the User Guide. 3 For the purposes of these statistics, toxicology means the safety evaluation of the effects of substances on man, animals or the environment, mainly medical treatments. 4 The study of a physical structure of an organism. 5 The study of genes, heredity, and variation in living organisms. 6 The study of interactions among organisms and their environment. 7 The study of chemical processes within, and relating to, living organisms. 8 The study of the functions of the individual structures and systems within an organism. 9 The study of drugs.
Definition – for the compilation of these statistics the number of procedures reported generally corresponds to the number of animals. A procedure, as regulated by law, is an experiment (or other scientific procedure) conducted on a living animal which has the effect of causing that animal pain, suffering, distress or lasting harm. Please see the User Guide for the legal definition. Where an animal that has recovered fully from a completed procedure is used again for a further procedure it is counted as a separate procedure.
Presentation – the figures given refer to the numbers of procedures that were started in 2012 (rather than the numbers of animals), compared with 2011, unless indicated otherwise. Some figures have been rounded depending on the size of the figures in a particular section of commentary.
7

6. There were 1.49 million more procedures (+57%) than in 2001 (which had the lowest figure since 1955), primarily due to increases in the use of breeding to produce GM or HM animals (+1.20 million or +155%) and fundamental biological research10 (+525,400 or +67%), although there was also a notable decrease in procedures for applied studies11
(Source: Tables 1, 3, 6, 9, 10, 19; and online Time Series Tables 20, 26)
in human medicine or dentistry (-194,200 or -28%). Mice primarily accounted for the rises for both GM and HM animals (+1.04 million) and fundamental biological research (+412,600). Excluding GM or HM breeding, the total number of procedures was higher than in 2001 (+284,500 or +15%).
10 Fundamental biological research is carried out with the primary intention of increasing knowledge of the structure, function and malfunction of man and other animals, or plants. Please see the User Guide for more details. 11 Consists of research into, development of and quality control of products or devices. See User Guide for more information.
8

Commentary
Procedures started in 2012 (Tables 1, 1a; and online Time Series Tables 20, 26) There were 4.11 million scientific procedures started in 2012, an increase of 317,200 (+8%) compared with 2011. The rise was mainly attributable to an increase of 363,100 (+22%) in the breeding of genetically modified (GM) animals12 and harmful mutants (HM)13
, mainly mice, to 1.98 million procedures, nearly half (48%) of the total number of procedures performed. Excluding the breeding of GM and HM animals, the total number of procedures decreased by 46,000 (-2%) to 2.13 million procedures. There were 4.03 million animals used for the first time in procedures started in 2012, an increase of 322,700 (+9%), reflecting the increase in the numbers of procedures started.
Figure 1 shows that the number of experiments increased considerably between 1945 and 1971, rising from 1.18 million to 5.61 million (+4.43 million or +377%), and from that period on to 1986 the number decreased to 3.11 million (-2.50 million or -45%). The implementation of the Animals (Scientific Procedures) Act 1986 changed the methodology of the collection from experiments to procedures14
and in 1987 data were collected based on both measures, the combined figure being 3.63 million experiments/procedures.
From 1988 onwards data for procedures alone were collected and in the following years the number decreased to 2.62 million in 2001 (-882,600 or -25%), mainly due to a reduction in the use of rats, mice, all other rodents15
12 Genetically modified animals are animals whose genetic characteristics have been altered using genetic engineering, which produces a new trait in an animal or a biological substance, such as a protein or hormone. For a more detailed description, please see the User Guide.
, rabbits, and birds (although there was an increase in the number of procedures performed on fish). Since then, the number of procedures has risen to 4.11 million in 2012 (+1.49 million or +57%), primarily due to increases in breeding to produce GM or HM animals (+1.20 million
13 Harmful mutants are animals possessing one or more genes that have undergone mutation, which involves a change in their genetic structure. For a more detailed description, please see the User Guide. 14 The Cruelty to Animals Act 1876 covered all animals which were used in experiments i.e. a procedure of unknown outcome. The Animals (Scientific Procedures) Act 1986 has a broader definition as it includes all scientific procedures which may cause pain, suffering, distress or lasting harm. Therefore, the change in methodology accounted for the increase in figures from 1987 onwards. 15 Includes guinea pigs, hamsters, gerbils, and other rodent species.
Definition – for the compilation of these statistics the number of procedures reported generally corresponds to the number of animals. A procedure, as regulated by law, is an experiment (or other scientific procedure) conducted on a living animal which has the effect of causing that animal pain, suffering, distress or lasting harm. Please see the User Guide for the legal definition. Where an animal that has recovered fully from a completed procedure is used again for a further procedure it is counted as a separate procedure. The circumstances in which this re-use of an animal is permitted are limited.
Presentation – the figures given refer to the numbers of procedures that were started in 2012 (rather than the numbers of animals), compared with 2011, unless indicated otherwise. Some figures have been rounded depending on the size of the figures in a particular section of commentary. For given sections, all figures are presented in an unrounded form where some figures are less than 1,000 and all figures are presented to the nearest 100 where all figures are in their thousands. All figures in millions are presented as millions to two decimal places (e.g. 4.11 million). This practice is taken in order to simplify the explanation/presentation; therefore the figures shown will not be identical to the figures in the tables. However, percentage changes given are calculated using the unrounded data available in the tables.
9

or +155%) and fundamental biological research16
(+525,400 or +67%), with mice mainly accounting for the rises.
The overall level of scientific procedures is determined by a number of factors, including the economic climate and global trends in scientific endeavour. In recent years, while many types of research have declined or even ended, the advent of modern scientific techniques has opened up new research areas, with genetically modified animals, mainly mice, often being required to support these areas.
Figure 1: Experiments or procedures commenced each year, 1945–2012
(1) Scientific Procedures under the 1986 Act (2) Experiments under the 1876 Act * The 1987 total includes experiments under the 1876 Act as well as procedures under the 1986 Act.
Primary purpose (Tables 1 and 1a) Figure 2 below compares breeding to produce GM and HM animals with other primary purposes. It shows that breeding to produce GM or HM animals increased from 312,700 in 1995 to 1.98 million in 2012 (+1.67 million or 534%). Following on from that trend, the proportion of the total number of procedures accounted for by breeding to produce GM or HM animals rose from 12 per cent in 1995 to 48 per cent in 2012, nearly half of the total number of procedures performed. The number of procedures undertaken for other primary purposes generally declined between 1995 to 2005, decreasing from 2.40 million to 1.87 million (-528,000 or -22%). The figure then rose to 2.27 million in 2008, fell to 2.09 million the following year and has remained relatively stable since with the figure being 2.13 million in 2012. The most common primary purposes throughout the period, other than breeding to produce GM or HM
16 Fundamental biological research is carried out with the primary intention of increasing knowledge of the structure, function and malfunction of man and other animals, or plants. Please see the User Guide for more details.
10

animals, were fundamental biological research and applied studies17
in human medicine or dentistry.
Figure 2: Comparison of breeding to produce GM and HM animals with other primary purposes, 1995–2012
Increases There were increases in the numbers of procedures between 2011 and 2012 for the following primary purposes: • breeding of GM or HM animals (+363,000 or +22%);
• applied studies in human medicine or dentistry (+12,900 or +3%);
• direct diagnosis18
(+3,600 or +8%).
Decreases There were decreases in the numbers of procedures between 2011 and 2012 for the following primary purposes: • fundamental biological research (-34,800 or -3%);
• protection of man, animals or environment19
• applied studies in veterinary medicine (-10,600 or -6%).
(-17,000 or -15%);
17 Consists of research into, development of and quality control of products or devices. See User Guide for more information. 18 Direct diagnosis is the investigation of disease including investigating suspected poisoning. Please see the User Guide for more information. 19 Refers to using toxicological or other safety or environmental evaluation to protect man, animals or the environment.
11

Species used (Tables 1, 1a and online Time Series Table 20) Figure 3 below shows that:
• Mice were the most commonly used species accounting for around three-quarters of procedures (74%).
• Fish (12%), rats (7%) and birds20
• Other mammals
(4%) were the next most frequently used species. Domestic fowl accounted for 89 per cent of all procedures using birds.
21
• Other rodents
accounted for two per cent of all procedures, of which dogs, cats and non-human primates combined were used in 0.2 per cent of all procedures, with a combined total of 8,100.
22
and reptiles/amphibians accounted for 0.4 per cent and 0.3 per cent of procedures respectively.
Figure 3: Procedures by species of animal, 2012
Increases There were higher numbers of procedures using some species in 2012, as follows: • mice (+379,058 or +14 %);
• sheep (+5,157 or +14%);
20 Includes domestic fowl (Gallus domesticus), turkeys, all species of quail, and other bird species. The species are grouped together for the purposes of the pie chart but data are collected and published on them separately. 21 Includes rabbits, cats, dogs, ferrets, other carnivores, horses and other equids, pigs, goats, sheep, cattle, deer, marmosets/tamarins, macaques and other mammal species. The species are grouped together for the purposes of the pie chart but data are collected and published on them separately. 22 Includes guinea pigs, hamsters, gerbils, and other rodent species. The species are grouped together for the purposes of the pie chart but data are collected and published on them separately.
12

• goats (+1,462 or +746%), up from 196;
• guinea pigs (+1,203 or 10%);
• non-human primates23 (+545 or +22%), with New World monkeys24 (-68 or -19%) and Old World monkeys25
Decreases
(+613 or +29%).
There were lower numbers of procedures using other species in 2012, as follows: • fish (-63,073 or -11%);
• amphibians (-2,218 or -14%);
• rabbits (-1,595 or -10%);
• pigs (-961 or -22%).
Use of mice, rats, and fish
Figure 4 below details the numbers of procedures on the most common species used (mice, rats and fish). The chart shows that there has been a decline in the use of rats, falling from 694,400 in 1995 to 271,500 in 2011 (-61% or -422,800) but the figure increased slightly to 278,400 in 2012. The number of procedures using mice, the most frequently used species of the three throughout the series, rose from 1.45 million in 1995 to 2.63 million in 2009 (+81% or +1.17 million). The figure remained relatively stable for a couple of years then rose to 3.06 million in 2012. The overall trend for fish has seen their numbers gradually grow from 131,100 to 500,800 over the same period (+282% or 369,700), with fish being more commonly used than rats from 2008 onwards. The proportion of total procedures accounted for by mice, rats and fish has steadily increased from 84 per cent in 1995 to 93 per cent in 2012.
23 The definition for non-human primates includes prosimians, New World monkeys, Old World monkeys, and apes. However, in recent years only procedures on New World monkeys and Old World monkeys have been undertaken. 24 The definition for New World (i.e. the Americas and Oceania) monkeys includes marmosets/tarmarins; squirrel, owl, and spider monkeys; and other New World monkeys. However, in recent years, including both 2011 and 2012, only marmosets have been used in procedures. 25 The definition for Old World (i.e. Europe, Asia, and Africa) monkeys includes macaques, baboons, and other Old World monkeys. However, in recent years, including both 2011 and 2012, only macaques have been used in procedures.
13
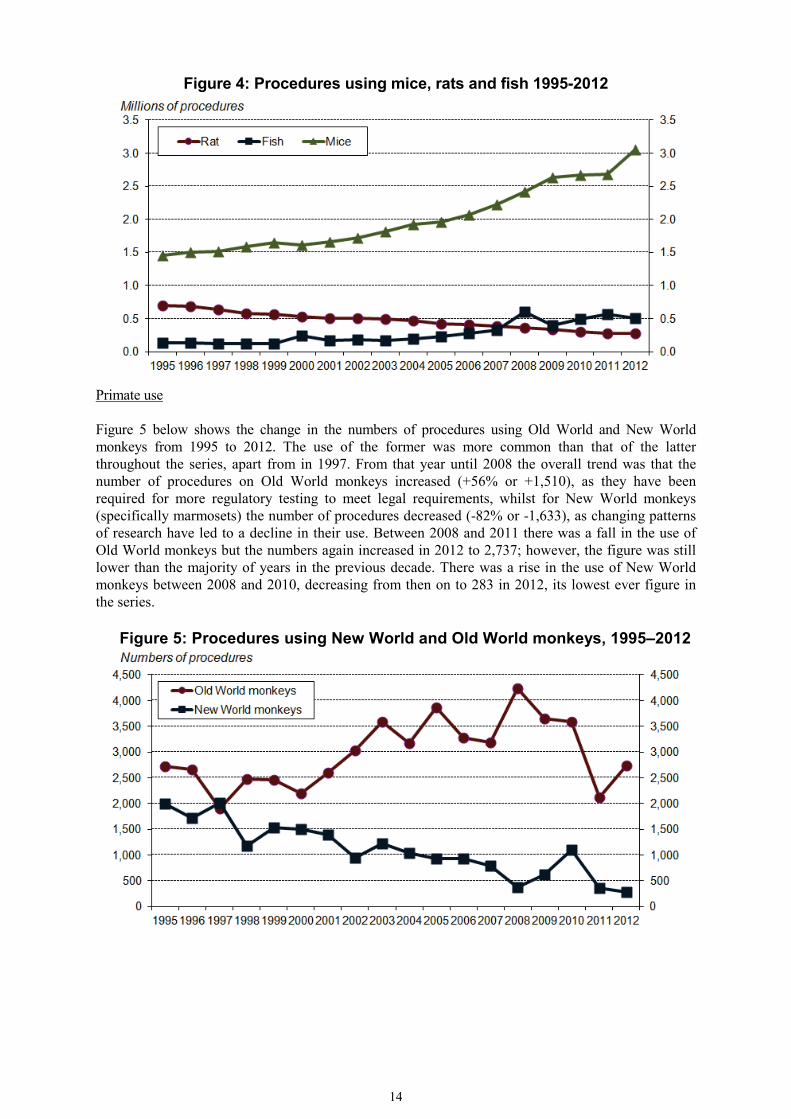
Figure 4: Procedures using mice, rats and fish 1995-2012
Primate use Figure 5 below shows the change in the numbers of procedures using Old World and New World monkeys from 1995 to 2012. The use of the former was more common than that of the latter throughout the series, apart from in 1997. From that year until 2008 the overall trend was that the number of procedures on Old World monkeys increased (+56% or +1,510), as they have been required for more regulatory testing to meet legal requirements, whilst for New World monkeys (specifically marmosets) the number of procedures decreased (-82% or -1,633), as changing patterns of research have led to a decline in their use. Between 2008 and 2011 there was a fall in the use of Old World monkeys but the numbers again increased in 2012 to 2,737; however, the figure was still lower than the majority of years in the previous decade. There was a rise in the use of New World monkeys between 2008 and 2010, decreasing from then on to 283 in 2012, its lowest ever figure in the series.
Figure 5: Procedures using New World and Old World monkeys, 1995–2012
14

Comparing the changes between just 2011 and 2012: • The number of procedures using New World monkeys (i.e. marmosets/tamarins only in this
comparison) fell by 68 (-19%) to 283, and the number of animals used also decreased by 12 to 232.
• The number of procedures using Old World monkeys (i.e. macaques only in this comparison) rose by 613 (+29%) to 2,737, and the number of animals used also increased by 739 to 1,954.
• Some primates were used more than once since some of the procedures they were involved in had only a minimal effect.
• Overall, the total number of procedures using non-human primates increased by 545 (+22%) to 3,020 and the number of animals used also rose by 727 to 2,186.
Species on which no procedures were started in 2012 No procedures were performed using greyhounds, a number of primate species, camelids, other ungulates26, quail (Coturnix coturnix)27 and Octopus vulgaris28
. No great apes have been used since the current legislation (the 1986 Act) was implemented in 1987.
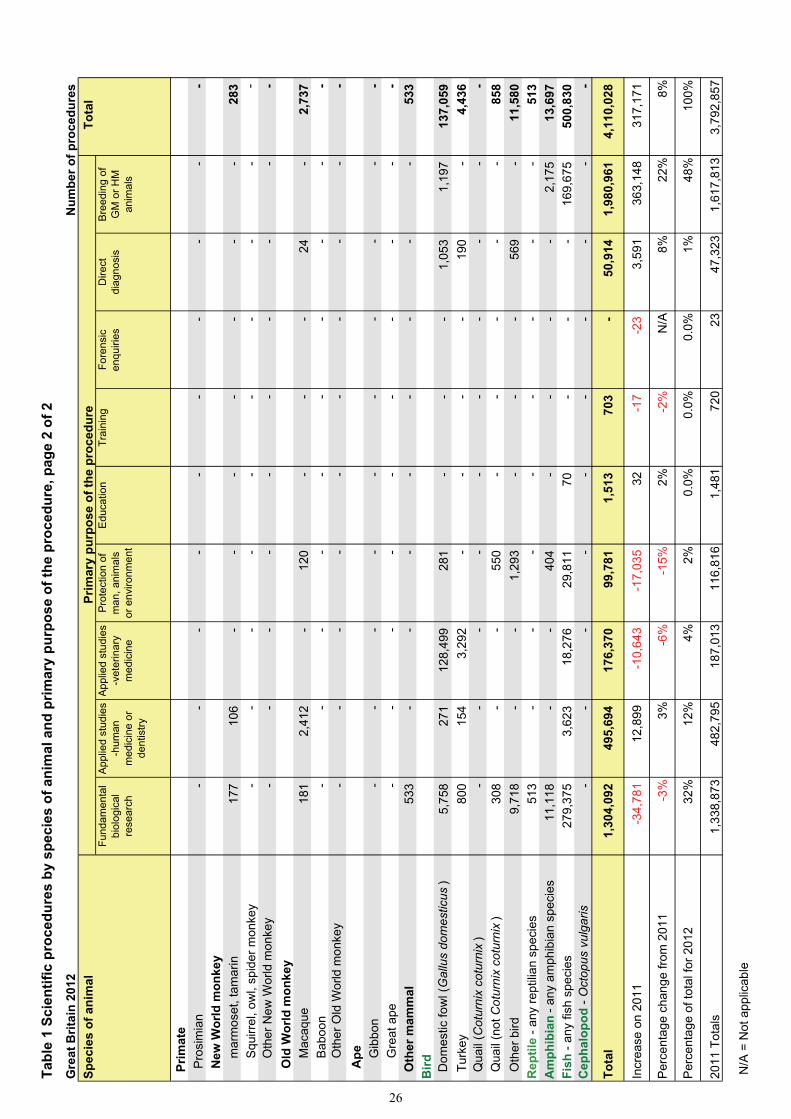
Source (Table 2 and online Supplementary Tables 2.1, 2.2) The majority (82% or 3.37 million) of the 4.11 million procedures started in 2012 were performed using animals listed in Schedule 2 of the Act. These animals must come from a designated source29, unless a special exemption is granted. Animals listed in Schedule 2 are: mice; rats; guinea pigs; hamsters; gerbils; rabbits; cats; dogs; ferrets; non-human primates; pigs (if genetically modified); sheep (if genetically modified); and common quail (Coturnix coturnix). The procedures involving animals listed in Schedule 2 and acquired from non-designated sources30
in the UK are authorised under Section 10(3) of the Act. The following were sources for Schedule 2 listed animals in 2012:
• Designated establishments in the UK were the source of animals for 3.35 million (82%) procedures using Schedule 2 listed species.
• Other EU countries were the source of animals for 11,900 (0.3%) procedures using Schedule 2 listed species.
• Schedule 2 listed animals acquired from other sources (including Council of Europe countries who are signatories to ETS12331
) were used in 16,000 procedures (0.4%).
26 Ungulates are animals which have hooves. 27 Coturnix coturnix is the common quail. Quail (not Coturnix coturnix) refers to all other species of quail. 28 Octopus vulgaris refers to the common Octopus. 29A designated source is a supplier licensed to breed or supply animals for scientific purposes. 30 Non-designated sources include any unlicensed source of animals in the UK, as well as any source of animals outside of the UK. 31 European Convention for the Protection of Vertebrate Animals used for Experimental and Other Scientific Purposes.
15

Genetic status (Table 3 and online Supplementary Tables 3 (full), 3.1, 3.2, 3.3)
Figure 6 below shows the number of procedures performed by the genetic status of the animal between 1995 and 2012. It shows that the use of GM animals increased considerably over the period from 215,300 in 1995 to 1.91 million animals in 2012 (+1.69 million or +786%), with the breeding of GM animals and fundamental biological research being the main primary purposes accounting for the rise. In 2012, for the first time in the series, the number of procedures involving GM animals was greater than the number involving normal animals32
.
Between 1995 and 2012, the number of procedures involving animals with a harmful genetic mutation also rose, but to a lesser extent, from 226,600 in 1995 to 525,000 in 2012 (+298,400 or +132%), with the breeding of HM animals driving the increase. The change between 2011 and 2012 accounted for half of this increase (+149,300). Over the same period, the use of normal animals decreased from 2.27 million in 1995 to 1.68 million in 2012 (-591,200 or -26%), mainly due to a reduction in procedures undertaken for applied studies, although there was an increase in the use of normal animals for the breeding of GM or HM animals.
Figure 6: Procedures by genetic status of animal, 1995–2012
Genetically normal animals There were 1.68 million procedures involving normal animals in 2012 (41% of the overall total), with mice, fish and rats accounting for the majority (52%, 17%, and 15% of normal animals respectively), and fundamental biological research, applied studies and the breeding of GM or HM animals being the main primary purposes for these species. Compared with 2011, there was a decrease in procedures using normal animals (-86,900 or -5%), mainly due to a decline in the use of fish (-117,000 or -29%), although there was an increase in the use of mice (+46,400 or +6%). Animals with a harmful genetic mutation There were 525,000 procedures involving animals with a harmful genetic mutation in 2012 (13% of the overall total), with mice accounting for the majority (84% of animals with a harmful genetic mutation) , and the breeding of HM animals being the main primary purpose for this species. Compared with
32 Non-GM or HM animals.
16
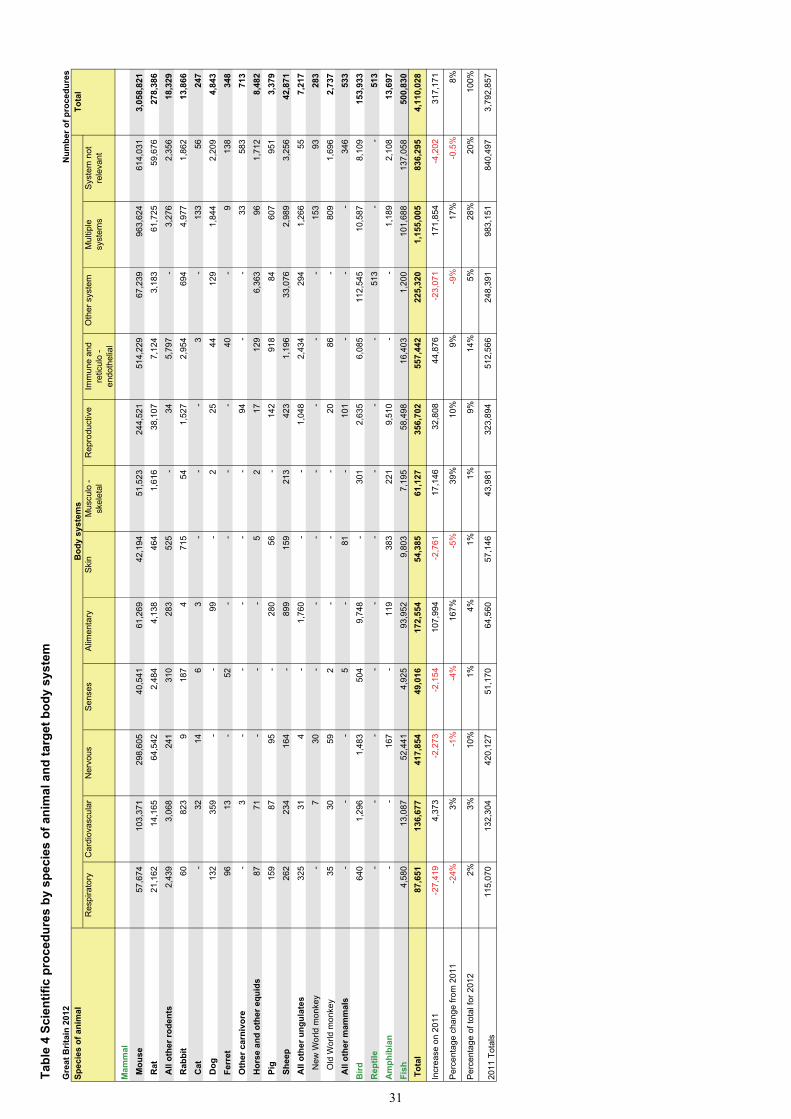
2011, there was an increase in procedures using animals with a harmful genetic mutation (+149,300 or +40%), which was also mainly attributable to mice (+119,100 or +37%). Genetically modified animals There were 1.91 million procedures involving GM animals in 2012 (46% of the overall total), with mice accounting for the majority (91% of GM animals), and breeding of GM animals and fundamental biological research being the main primary purposes for this species. Compared with 2011, there was an increase in procedures using GM animals (+254,800 or +15%), with mice also being the key driver of the increase (+213,500 or 14%). Target body system (Table 4) In 2012, 2.12 million, slightly over half (52%) of all procedures, were directed towards one particular body system33
.
• The immune system was the largest single category, accounting for 557,400 procedures (14% of all procedures), of which the main species used was mice (514,200 or 92% of this type of procedure).
• The nervous and reproductive systems were the next largest single categories with 417,900 (10%) and 356,700 (9%) procedures respectively. Mice, rats and fish were the most common species used for these systems accounting for 415,600 (99%) of procedures for the former and 341,100 (96%) of procedures for the latter.
• Of the single body system categories, the largest increase was in the alimentary34
body system (+108,000 or +167%) and the largest decrease was in the respiratory system (-27,400 or -24%).
Procedures conducted where the target body system was not relevant accounted for 836,300 (20% of all procedures) and remained stable compared with 2011 (-4,200 or -0%). The category for multiple target body systems accounted for 1.16 million procedures (28% of all procedures) increasing by 171,900 (+17%). Use of anaesthesia (Table 5) Procedures which cause pain, suffering, distress, or lasting harm to the animal are only permitted without anaesthesia35 or analgesic36
when such administration is judged more traumatic than the procedure itself, or when it is incompatible with the object of the procedure.
• In 2012, 28 per cent of procedures (1.16 million) had some form of anaesthesia to alleviate the severity of the interventions, a similar proportion to 2011 (29%). For many of the remaining procedures the use of anaesthesia would have potentially increased the adverse effects of the procedure.
• The use of neuromuscular blocking agents (NMBA)37
was recorded in 1,675 procedures, a decrease from 2,547 procedures in 2012. All NMBA procedures involved the use of general anaesthesia.
33 A group of organs that work together to perform a certain task. 34 Includes all parts of the body involved in preparing food for absorption into the body and excretion of waste products. 35 Anaesthesia involves using medication to induce a loss of sensation in the animal. 36 An analgesic is a drug used to relieve pain. 37 Neuromuscular blocking agents (NMBA) relax skeletal muscles and induce paralysis.
17

Fundamental and applied studies other than toxicology, regulatory or safety purposes (Table 6) Non-toxicology38 accounted for 3.73 million procedures in 2012 (91% of the total number of procedures), an increase of 339,200 (+10%) compared with the previous year. The main fields of research were: immunology (575,800 or 15% of the total number of non-toxicological procedures); cancer research (500,700 or 13%); physiology39 (430,900 or 12%); anatomy40 (430,400 or 12%); and genetics41
(391,700 or 11%).
Compared with 2011, there were increases for: nutrition (+79,300 or +425%); anatomy (+73,200 or +20%); cancer research (+69,000 or +16%); genetics (+46,000 or +13%); ecology42 (+33,100 or +85%); and biochemistry43 (+15,800 or +54%). There were falls for: physiology (-173,600 or -29%); pharmaceutical research and development (-24,600 or -11%); and pharmacology44
(-10,100 or -14%).
Production of biological materials (Table 7) In 2012, 357,800 procedures were carried out to produce biological materials, 8,100 more (+2%) than in 2011. Biological materials were produced for the following purposes: • 134,500 procedures (38% of the procedures undertaken to produce biological materials) were for the
production of infectious agents, of which the most common species used were birds (78%) and mice 17%).
• Vectors45, neoplasms46 and antibody production47
• The remaining 192,700 biological procedures (54%) were undertaken to produce other biological material such as tissues or blood products, with mice (65%) and pigs, sheep, and all other ungulates (19%) used.
accounted for 30,600 procedures (9%) undertaken to produce biological materials, with mice predominantly used (87%).
• The numbers of procedures using immunisation to produce monoclonal antibodies by in vitro methods fell by 17 per cent (-300) to 1,600 procedures in 2012, less than half the level of 4,000 procedures in 2008.
Toxicology, other safety or efficacy evaluation (Tables 9, 9a, 10, 11; online Supplementary Tables 12, 15, 16; and online Time Series Table 25) In 2012, 377,000 procedures were undertaken for toxicological or other safety/efficacy48
38 For the purposes of these statistics, toxicology means the safety evaluation of the effects of substances on man, animals or the environment, mainly medical treatments.
evaluation
39 The study of the functions of the individual structures and systems within an organism. 40 The study of a physical structure of an organism. 41 The study of genes, heredity, and variation in living organisms. 42 The study of interactions among organisms and their environment. 43 The study of chemical processes within, and relating to, living organisms. 44 The study of drugs. 45 A vector is an agent that transfers genetic material from one cell to another. 46 A neoplasm is an abnormal growth of tissue in animals. 47 Antibodies identify and neutralise foreign objects such as bacteria and viruses. 48 Safety testing is generally carried out to meet regulatory requirements for safety of pharmaceuticals, chemicals etc. Efficacy testing is to demonstrate the effectiveness of drugs, which may or may not be carried out for regulatory purposes.
18
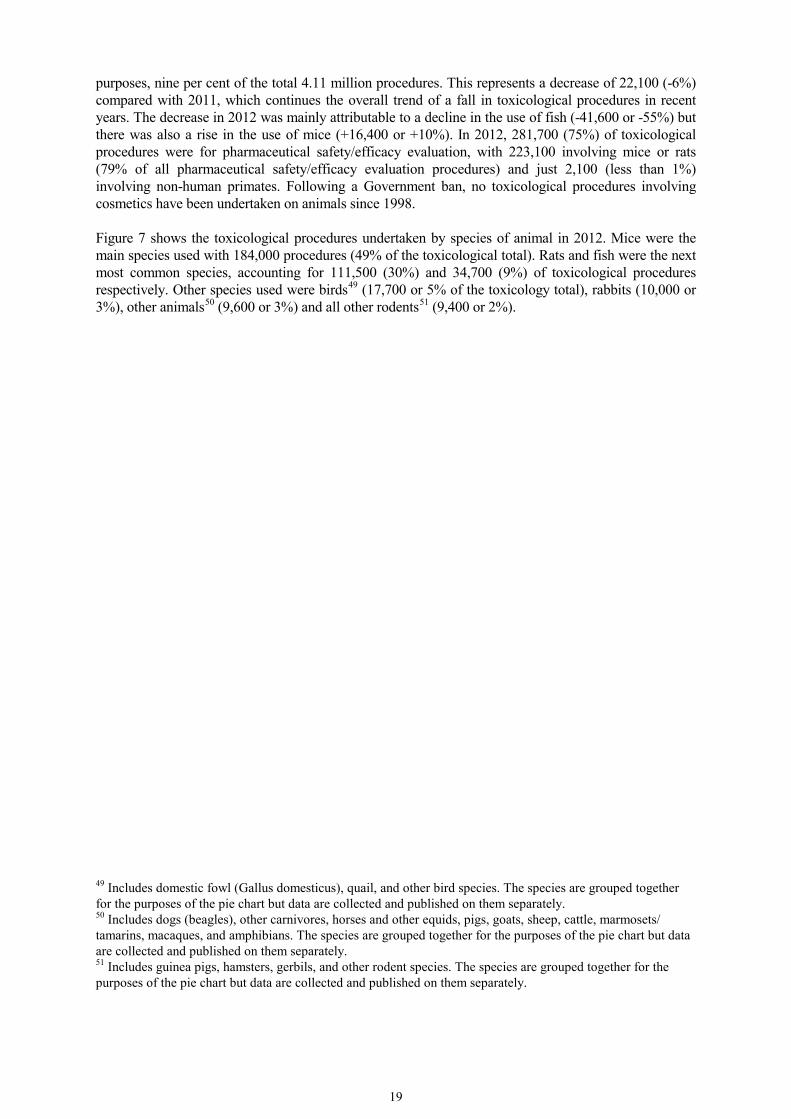
purposes, nine per cent of the total 4.11 million procedures. This represents a decrease of 22,100 (-6%) compared with 2011, which continues the overall trend of a fall in toxicological procedures in recent years. The decrease in 2012 was mainly attributable to a decline in the use of fish (-41,600 or -55%) but there was also a rise in the use of mice (+16,400 or +10%). In 2012, 281,700 (75%) of toxicological procedures were for pharmaceutical safety/efficacy evaluation, with 223,100 involving mice or rats (79% of all pharmaceutical safety/efficacy evaluation procedures) and just 2,100 (less than 1%) involving non-human primates. Following a Government ban, no toxicological procedures involving cosmetics have been undertaken on animals since 1998. Figure 7 shows the toxicological procedures undertaken by species of animal in 2012. Mice were the main species used with 184,000 procedures (49% of the toxicological total). Rats and fish were the next most common species, accounting for 111,500 (30%) and 34,700 (9%) of toxicological procedures respectively. Other species used were birds49 (17,700 or 5% of the toxicology total), rabbits (10,000 or 3%), other animals50 (9,600 or 3%) and all other rodents51
(9,400 or 2%).
49 Includes domestic fowl (Gallus domesticus), quail, and other bird species. The species are grouped together for the purposes of the pie chart but data are collected and published on them separately. 50 Includes dogs (beagles), other carnivores, horses and other equids, pigs, goats, sheep, cattle, marmosets/ tamarins, macaques, and amphibians. The species are grouped together for the purposes of the pie chart but data are collected and published on them separately. 51 Includes guinea pigs, hamsters, gerbils, and other rodent species. The species are grouped together for the purposes of the pie chart but data are collected and published on them separately.
19
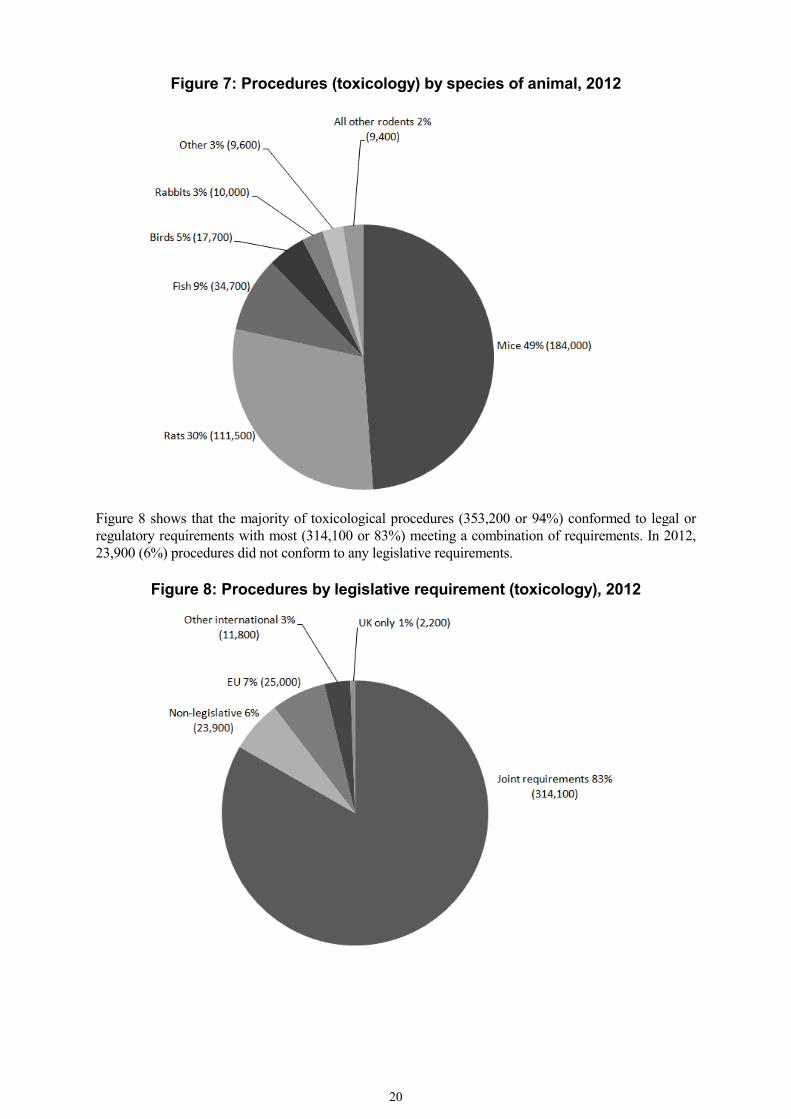
Figure 7: Procedures (toxicology) by species of animal, 2012
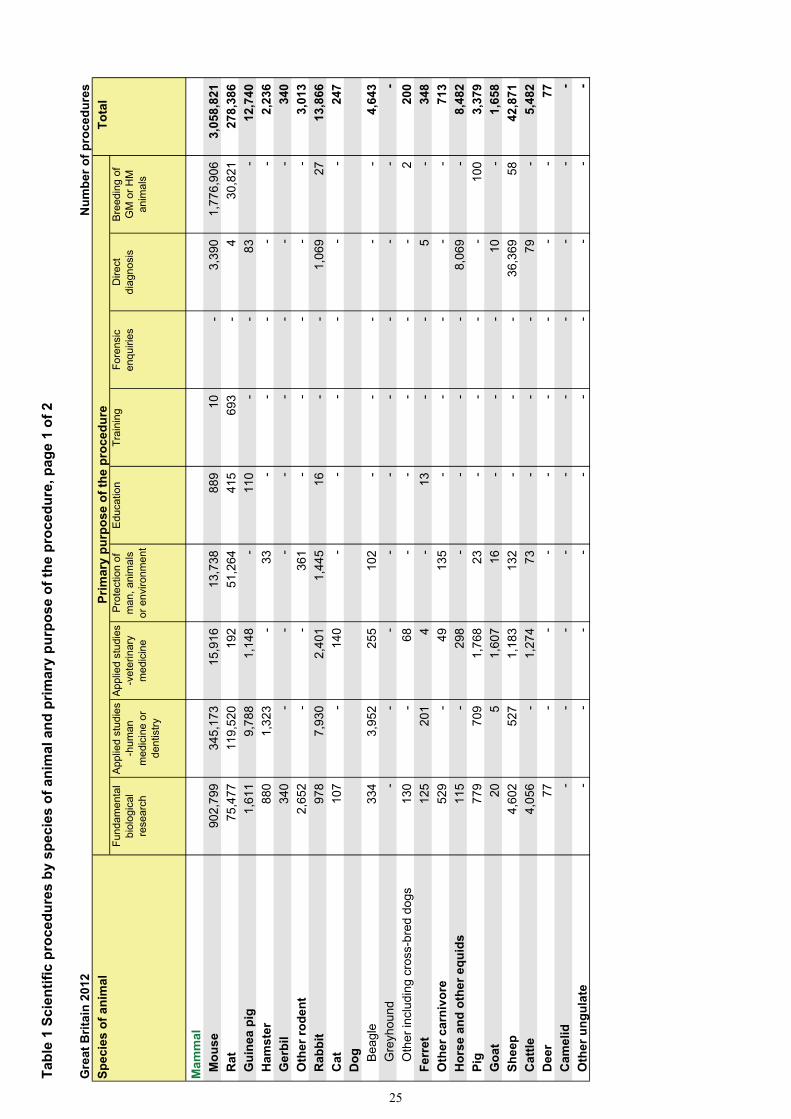
Figure 8 shows that the majority of toxicological procedures (353,200 or 94%) conformed to legal or regulatory requirements with most (314,100 or 83%) meeting a combination of requirements. In 2012, 23,900 (6%) procedures did not conform to any legislative requirements.
Figure 8: Procedures by legislative requirement (toxicology), 2012
20

Rodenticide trials It is impracticable to collect accurate figures on the number of animals used in field trials of rodenticide52
substances. Nonetheless, no returns indicated that such field trials occurred in 2012.
Use of animals on the CITES list Returns were required on the use of animals listed in Appendix 1 of the Convention on International Trade in Endangered Species of Flora and Fauna (CITES)53
or in Annex C.1 to the Council Regulation (EEC) 3626/82 (see form notes section in the User Guide). There were 147 procedures performed using animals in this category in 2012; these involved wild birds and amphibia in research relevant to those species.
Type of establishment (Table 19 and Online Time Series Table 23) Universities accounted for the majority of procedures in 2012, undertaking 48 per cent (1.97 million) of the 4.11 million procedures. In addition, universities held 76 per cent (2,467) of the 3,239 licences for which returns were received. Other types of establishment which undertook procedures were commercial organisations (accounting for 27% or 1.13 million procedures), other public bodies (accounting for 13% or 549,500 procedures) and non-profit organisations (accounting for 9% or 352,000 procedures). These organisations respectively held eight per cent, seven per cent and four per cent of the licences for which returns were received.
Figure 9 shows the procedures undertaken in universities/medical schools and commercial organisations between 1995 and 2012. The number of procedures accounted for by the commercial sector decreased between 1995 and 2005 from 1.33 million to 908,200 (-421,200 or -32%). The figure then rose from then on to 1.33 million in 2008, the same figure as 1995, and then fell in the following year to 1.03 million. The number remained relatively stable between 2009 and 2011 and then increased slightly in 2012 to 1.13 million. Between 1995 and 2012, the number of procedures carried out in the university sector rose by 1.14 million (+139%) to 1.97 million, with the figure overtaking the commercial sector from 2002 onwards. The difference in trends between the commercial sector and the university sector is likely to reflect the increase in fundamental research using GM animals within universities, as well as the decline in procedures undertaken for toxicological purposes.
52 Rodenticides are a category of pest control chemicals intended to kill rodents. Rodenticide trials are field trials of such chemicals and are occasionally undertaken by commercial companies who produce them. 53 CITES is an international agreement between governments with the aim of ensuring that international trade in specimens of wild animals and plants does not threaten their survival.
21

Figure 9: Procedures by establishment type, 1995–2012
International comparisons (Table 1a and Commission report54
Tables 1.0 and 1.1)
Data compiled by EU countries and submitted to the European Commission use a narrower, but common, definition of animal experiments. The main difference with the definition used for the other statistics in this publication is that the data are based on numbers of animals and excludes breeding to produce GM or HM animals. The latest data are for 200855
and some of the key points are as follows:
• The total number of animals used for experiments in the 27 EU Member States in 2008 was just over 12 million, falling by two per cent compared with 2005.
• In France, the UK and Germany there were experiments using 2.33 million animals, 2.27 million animals, and 2.02 million animals respectively.
• No apes were used in experiments anywhere in the EU in 2008. A total of 9,569 non-human primates were used in experiments across the EU27, a third (35% or 3,354) of which were used in the UK.
The full report is available on the Commission’s website http://ec.europa.eu/environment/chemicals/lab_animals/reports_en.htm Returns, project licensees and designated places (Appendix A Table 19) Statistical returns are required each year from every person in Great Britain who holds a project licence for part or all of the year. For 2012, 3,239 licensees provided returns which reported either that
54 Commission Staff Working Paper - Report on the Statistics on the Number of Animals used for Experimental and other Scientific Purposes in the Member States of the European Union in the year 2008 (SEC (2010) 1107/final 2), available at http://ec.europa.eu/environment/chemicals/lab_animals/reports_en.htm. Data quoted are from Tables 1.0 and 1.1 of the Commission Working Paper SEC (2010) 1107/final 2, available at http://ec.europa.eu/environment/chemicals/lab_animals/pdf/sec_2010_1107.pdf. 55 Data for France related to 2007.
22

procedures were started (2,556 licensees, of which 15 reported only non-countable procedures56
) or that none were started (681 licensees).
There were 2,717 project licences in force at the end of 2012 compared with 2,624 at the end of 2011, a slight increase. The number of certificates of designation in force authorising places where work was carried out was 176 at the end of 2012 compared with 181 at the end of 2011, continuing the trend of falls in recent years. The number of personal licences in force decreased to 14,875 at the end of 2012, compared with 15,403 at the end of 2011. Further information Information about research and testing using animals can be found at https://www.gov.uk/research-and-testing-using-animals. Information about the Animals in Science Committee can be found at https://www.gov.uk/government/organisations/animals-in-science-committee. Information about the National Centre for the Replacement, Refinement and Reduction of Animals in research (NC3Rs) can be found at http://www.nc3rs.org.uk/. Information relating to Northern Ireland is published by the Department of Health, Social Services and Public Safety and can be found at http://www.dhsspsni.gov.uk/healthprotection-animalscience. Information on public attitudes to animal testing is available from IPSOS MORI at http://www.ipsos-mori.com/researchpublications/publications/1343/Views-on-Animal-Experimentation.aspx.
Tables
Notes providing details of the terms and classifications used (‘User Guide to Home Office Statistics of Scientific Procedures on Living Animals’), and the ‘Supplementary Tables’ and ‘Time Series Tables’ can be found at: https://www.gov.uk/government/publications/statistics-of-scientific-procedures-on-living-animals-great-britain-2012. Definitions
All tables refer to the numbers of scientific procedures started on adult animals in 2012, unless indicated otherwise. Tables suffixed with an ‘a’ (e.g. Tables 1a, 6a, 9a) relate to the numbers of animals used. Symbols used in tables
.. not available - nil NA not applicable r revised
56 It is not possible to collect accurate figures on the numbers of procedures started using immature forms (e.g. larvae, embryos). Information is collected indicating when procedures using such forms are carried out, which are classified as non-countable procedures.
23

Organisation Chart: Relationship between the tables, 2012
TABLE 1 TABLE 1aSpecies by purpose Species by purpose
(procedures) (animals)
TABLE 2 TABLES 2.1, 2.2 wSource of animals Source by genetic status: w
w
e TABLE 3 we Genetic status w
ww
TABLE 4Target body system
TABLE 5Anaesthesia
(Toxicology) (Non-toxicology)
TABLE 9 TABLE 9a TABLE 6a TABLE 6Field of toxicology Field of toxicology Field of research Field of research
(procedures) (animals) (animals) (procedures)
e TABLE 10 we Legislative requirements w TABLE 7
w Production ofw biological materials
TABLE 11Type of test - overall TABLE 8
Techniques of interest
Notes
number of animals usedTABLE 12 w
Type of test - safety w number of proceduresother than pharmaceut w
procedures by genetic status
GM = genetically modifiedTABLE 15 w HM = harmful mutant
Type of test - safety wof pharmaceuticals w w website only
e extended version on website
TABLE 16 wType of test -other safety w
or toxicology testing w
HM, GM
HM, GM
TABLES 6.1, 6.2Field of researchby genetic status:
Breeding procedures andresearch by genetic status
TABLES 3.1, 3.2, 3.3
HM, GM
24
Tabl
e 1
Scie
ntifi
c pr
oced
ures
by
spec
ies
of a
nim
al a
nd p
rimar
y pu
rpos
e of
the
proc
edur
e, p
age
1 of
2
Gre
at B
ritai
n 20
12N
umbe
r of p
roce
dure
sSp
ecie
s of
ani
mal
Prim
ary
purp
ose
of th
e pr
oced
ure
Tot
al
Fund
amen
tal
biol
ogic
al
rese
arch
App
lied
stud
ies
-hum
an
med
icin
e or
de
ntis
try
App
lied
stud
ies
-vet
erin
ary
med
icin
e
Pro
tect
ion
of
man
, ani
mal
s or
env
ironm
ent
Edu
catio
nTr
aini
ngFo
rens
ic
enqu
iries
Dire
ct
diag
nosi
sB
reed
ing
of
GM
or H
M
anim
als
Mam
mal
Mou
se90
2,79
9
345,
173
15
,916
13
,738
88
9
10
-
3,
390
1,77
6,90
6
3,
058,
821
Rat
75,4
77
119,
520
19
2
51,2
64
415
69
3
-
4
30
,821
27
8,38
6
Gui
nea
pig
1,61
1
9,
788
1,14
8
-
11
0
-
-
83
-
12
,740
H
amst
er88
0
1,32
3
-
33
-
-
-
-
-
2,23
6
G
erbi
l34
0
-
-
-
-
-
-
-
-
340
O
ther
rode
nt2,
652
-
-
361
-
-
-
-
-
3,
013
Rab
bit
978
7,
930
2,40
1
1,
445
16
-
-
1,
069
27
13
,866
C
at10
7
-
140
-
-
-
-
-
-
24
7
Dog
B
eagl
e33
4
3,95
2
25
5
102
-
-
-
-
-
4,
643
G
reyh
ound
-
-
-
-
-
-
-
-
-
-
O
ther
incl
udin
g cr
oss-
bred
dog
s13
0
-
68
-
-
-
-
-
2
200
F
erre
t12
5
201
4
-
13
-
-
5
-
348
O
ther
car
nivo
re52
9
-
49
13
5
-
-
-
-
-
713
H
orse
and
oth
er e
quid
s11
5
-
298
-
-
-
-
8,
069
-
8,48
2
P
ig77
9
709
1,
768
23
-
-
-
-
10
0
3,37
9
G
oat
20
5
1,60
7
16
-
-
-
10
-
1,
658
She
ep4,
602
527
1,
183
132
-
-
-
36
,369
58
42,8
71
Cat
tle4,
056
-
1,27
4
73
-
-
-
79
-
5,
482
Dee
r77
-
-
-
-
-
-
-
-
77
C
amel
id-
-
-
-
-
-
-
-
-
-
O
ther
ung
ulat
e-
-
-
-
-
-
-
-
-
-
25
Tabl
e 1
Scie
ntifi
c pr
oced
ures
by
spec
ies
of a
nim
al a
nd p
rimar
y pu
rpos
e of
the
proc
edur
e, p
age
2 of
2G
reat
Brit
ain
2012
Num
ber o
f pro
cedu
res
Spec
ies
of a
nim
alPr
imar
y pu
rpos
e of
the
proc
edur
e T
otal
Fu
ndam
enta
l bi
olog
ical
re
sear
ch
App
lied
stud
ies
-hum
an
med
icin
e or
de
ntis
try
App
lied
stud
ies
-vet
erin
ary
med
icin
e
Pro
tect
ion
of
man
, ani
mal
s or
env
ironm
ent
Edu
catio
nTr
aini
ngFo
rens
ic
enqu
iries
Dire
ct
diag
nosi
sB
reed
ing
of
GM
or H
M
anim
als
Prim
ate
P
rosi
mia
n-
-
-
-
-
-
-
-
-
-
New
Wor
ld m
onke
y
m
arm
oset
, tam
arin
177
10
6
-
-
-
-
-
-
-
283
S
quirr
el, o
wl,
spid
er m
onke
y-
-
-
-
-
-
-
-
-
-
O
ther
New
Wor
ld m
onke
y-
-
-
-
-
-
-
-
-
-
Old
Wor
ld m
onke
y
M
acaq
ue18
1
2,41
2
-
12
0
-
-
-
24
-
2,
737
Bab
oon
-
-
-
-
-
-
-
-
-
-
Oth
er O
ld W
orld
mon
key
-
-
-
-
-
-
-
-
-
-
A
pe
G
ibbo
n-
-
-
-
-
-
-
-
-
-
G
reat
ape
-
-
-
-
-
-
-
-
-
-
Oth
er m
amm
al53
3
-
-
-
-
-
-
-
-
533
B
ird D
omes
tic fo
wl (
Gal
lus
dom
estic
us)
5,75
8
27
1
128,
499
28
1
-
-
-
1,05
3
1,
197
137,
059
T
urke
y80
0
154
3,
292
-
-
-
-
190
-
4,
436
Qua
il (C
otur
nix
cotu
rnix
)-
-
-
-
-
-
-
-
-
-
Q
uail
(not
Cot
urni
x co
turn
ix)
308
-
-
55
0
-
-
-
-
-
858
O
ther
bird
9,71
8
-
-
1,
293
-
-
-
569
-
11
,580
R
eptil
e - a
ny re
ptili
an s
peci
es51
3
-
-
-
-
-
-
-
-
513
A
mph
ibia
n - a
ny a
mph
ibia
n sp
ecie
s11
,118
-
-
40
4
-
-
-
-
2,17
5
13
,697
Fi
sh -
any
fish
spec
ies
279,
375
3,
623
18,2
76
29,8
11
70
-
-
-
16
9,67
5
500,
830
Cep
halo
pod
- Oct
opus
vul
garis
-
-
-
-
-
-
-
-
-
-
Tota
l1,
304,
092
495,
694
17
6,37
0
99,7
81
1,51
3
70
3
-
50,9
14
1,98
0,96
1
4,
110,
028
Incr
ease
on
2011
-34,
781
12,8
99-1
0,64
3 -1
7,03
5 32
-17
-23
3,59
136
3,14
831
7,17
1
Per
cent
age
chan
ge fr
om 2
011
-3%
3%-6
%-1
5%2%
-2%
N/A
8%22
%8%
Per
cent
age
of to
tal f
or 2
012
32%
12%
4%2%
0.0%
0.0%
0.0%
1%48
%10
0%
2011
Tot
als
1,33
8,87
348
2,79
518
7,01
311
6,81
61,
481
720
2347
,323
1,61
7,81
33,
792,
857
N/A
= N
ot a
pplic
able
26

Tabl
e 1a
Ani
mal
s us
ed, b
y sp
ecie
s of
ani
mal
and
prim
ary
purp
ose
of th
e pr
oced
ure,
pag
e 1
of 2
Gre
at B
ritai
n 20
12N
umbe
r of a
nim
als
Spec
ies
of a
nim
alPr
imar
y pu
rpos
e of
the
proc
edur
e T
otal
Fu
ndam
enta
l bi
olog
ical
re
sear
ch
App
lied
stud
ies
-hum
an
med
icin
e or
de
ntis
try
App
lied
stud
ies
-vet
erin
ary
med
icin
e
Pro
tect
ion
of
man
, ani
mal
s or
env
ironm
ent
Edu
catio
nTr
aini
ngFo
rens
ic
enqu
iries
Dire
ct
diag
nosi
sB
reed
ing
of
GM
or H
M
anim
als
Mam
mal
Mou
se89
7,62
0
34
3,70
7
15
,916
13
,730
88
9
10
-
3,
390
1,77
4,69
4
3,04
9,95
6
Rat
72,5
20
117,
435
192
50
,970
41
5
693
-
4
30
,817
27
3,04
6
G
uine
a pi
g1,
611
9,78
8
1,
148
-
11
0
-
-
83
-
12
,740
H
amst
er88
0
1,32
3
-
33
-
-
-
-
-
2,
236
Ger
bil
327
-
-
-
-
-
-
-
-
32
7
Oth
er ro
dent
1,68
4
-
-
36
1
-
-
-
-
-
2,
045
Rab
bit
807
5,
561
1,66
3
1,
445
16
-
-
1,01
9
27
10
,538
C
at62
-
140
-
-
-
-
-
-
20
2
Dog
B
eagl
e13
9
2,64
7
24
7
85
-
-
-
-
-
3,
118
G
reyh
ound
-
-
-
-
-
-
-
-
-
-
O
ther
incl
udin
g cr
oss-
bred
dog
s26
-
68
-
-
-
-
-
2
96
Fer
ret
125
20
1
4
-
13
-
-
5
-
348
O
ther
car
nivo
re48
1
-
27
13
5
-
-
-
-
-
64
3
Hor
se a
nd o
ther
equ
ids
23
-
125
-
-
-
-
43
- 19
1
Pig
758
63
9
1,61
0
21
-
-
-
-
97
3,
125
Goa
t20
5
1,60
7
16
-
-
-
10
-
1,
658
She
ep4,
362
412
1,
040
132
-
-
-
645
58
6,
649
Cat
tle3,
404
-
1,
216
67
-
-
-
79
-
4,76
6
D
eer
77
-
-
-
-
-
-
-
-
77
Cam
elid
-
-
-
-
-
-
-
-
-
-
Oth
er u
ngul
ate
-
-
-
-
-
-
-
-
-
-
27

Tabl
e 1a
Ani
mal
s us
ed, b
y sp
ecie
s of
ani
mal
and
prim
ary
purp
ose
of th
e pr
oced
ure,
pag
e 2
of 2
Gre
at B
ritai
n 20
12N
umbe
r of a
nim
als
Spec
ies
of a
nim
alPr
imar
y pu
rpos
e of
the
proc
edur
e T
otal
Fu
ndam
enta
l bi
olog
ical
re
sear
ch
App
lied
stud
ies
-hum
an
med
icin
e or
de
ntis
try
App
lied
stud
ies
-vet
erin
ary
med
icin
e
Pro
tect
ion
of
man
, ani
mal
s or
env
ironm
ent
Edu
catio
nTr
aini
ngFo
rens
ic
enqu
iries
Dire
ct
diag
nosi
sB
reed
ing
of
GM
or H
M
anim
als
Prim
ate
P
rosi
mia
n-
-
-
-
-
-
-
-
-
-
New
Wor
ld m
onke
y
m
arm
oset
, tam
arin
171
61
-
-
-
-
-
-
-
232
S
quirr
el, o
wl,
spid
er m
onke
y-
-
-
-
-
-
-
-
-
-
O
ther
New
Wor
ld m
onke
y-
-
-
-
-
-
-
-
-
-
Old
Wor
ld m
onke
y
M
acaq
ue97
1,
739
-
11
5
-
-
-
3
-
1,
954
Bab
oon
-
-
-
-
-
-
-
-
-
-
Oth
er O
ld W
orld
mon
key
-
-
-
-
-
-
-
-
-
-
A
pe
G
ibbo
n-
-
-
-
-
-
-
-
-
-
G
reat
ape
-
-
-
-
-
-
-
-
-
-
Oth
er m
amm
al46
0
-
-
-
-
-
-
-
-
460
B
ird D
omes
tic fo
wl (
Gal
lus
dom
estic
us)
5,75
8
21
5
128,
499
238
-
-
-
1,05
3
1,
197
136,
960
Tur
key
800
10
3,
292
-
-
-
-
82
-
4,
184
Qua
il (C
otur
nix
cotu
rnix
)-
-
-
-
-
-
-
-
-
-
Q
uail
(not
Cot
urni
x co
turn
ix)
308
-
-
55
0
-
-
-
-
-
85
8
Oth
er b
ird8,
816
-
-
1,29
3
-
-
-
248
-
10,3
57
Rep
tile
- any
rept
ilian
spe
cies
513
-
-
-
-
-
-
-
-
51
3
Am
phib
ian
- any
am
phib
ian
spec
ies
4,80
8
-
-
40
4
-
-
-
-
763
5,
975
Fish
- an
y fis
h sp
ecie
s27
9,05
0
3,
623
18,2
76
29,8
11
70
-
-
-
16
9,22
6
50
0,05
6
C
epha
lopo
d - O
ctop
us v
ulga
ris-
-
-
-
-
-
-
-
-
-
Tota
l1,
285,
707
48
7,36
6
17
5,07
0
99
,406
1,
513
703
-
6,66
4
1,
976,
881
4,
033,
310
Incr
ease
on
2011
-25,
560
14,8
47-1
0,41
8 -1
6,82
3 38
-17
-23
-2,2
73
362,
918
322,
689
Per
cent
age
chan
ge fr
om 2
011
-2%
3%-6
%-1
4%3%
-2%
N/A
-25%
22%
9%P
erce
ntag
e of
tota
l for
201
232
%12
%4%
2%0.
0%0.
0%0.
0%0.
2%49
%10
0%20
11 T
otal
s1,
311,
267
472,
519
185,
488
116,
229
1,47
572
023
8,93
71,
613,
963
3,71
0,62
1
N/A
= N
ot a
pplic
able
28

Tabl
e 2
Scie
ntifi
c pr
oced
ures
by
Sche
dule
2 li
sted
spe
cies
and
sou
rce
of a
nim
als
Gre
at B
ritai
n 20
12N
umbe
r of p
roce
dure
s
Spec
ies
of a
nim
alSo
urce
Tota
lA
nim
als
acqu
ired
from
with
in o
wn
desi
gnat
ed
esta
blis
hmen
t
Ani
mal
s ac
quire
d fro
m a
noth
er
desi
gnat
ed
bree
ding
or
supp
lyin
g es
tabl
ishm
ent i
n th
e U
K
Ani
mal
s ac
quire
d fro
m n
on-
desi
gnat
ed
sour
ces
in th
e U
K
Ani
mal
s ac
quire
d fro
m s
ourc
es
with
in th
e E
U
(out
side
the
UK
)
Ani
mal
s ac
quire
d fro
m C
ounc
il of
E
urop
e co
untri
es
who
are
si
gnat
orie
sto
ETS
123
Ani
mal
s ac
quire
d fro
m o
ther
so
urce
s
Ani
mal
s no
t lis
ted
in S
ched
ule
2
Mou
se2,
466,
003
573,
594
32
9
7,29
6
38
4
11,2
15
-
3,
058,
821
Rat
62,3
85
21
3,44
4
14
1,
366
-1,
177
-27
8,38
6
Gui
nea
pig
1,15
3
9,
802
-1,
785
--
-12
,740
Ham
ster
339
1,
641
-
256
-
--
2,23
6
Ger
bil
266
17
-33
-24
-34
0
Rab
bit
4,97
2
8,
236
-32
5
-33
3
-13
,866
Cat
72
2
-
92
-
81
-
247
Dog
1,25
9
2,
297
39
64
1
-60
7
-4,
843
Fer
ret
17
31
5
--
-16
-34
8
Pig
(gen
etic
ally
mod
ified
)43
--
--
--
43
She
ep (g
enet
ical
ly m
odifi
ed)
33
-
--
--
-
33
Prim
ate
409
34
2
-80
-2,
189
-3,
020
Qua
il (C
otur
nix
cotu
rnix
)-
--
--
--
-
Ani
mal
s no
t lis
ted
in S
ched
ule
2-
--
--
-
735,
105
73
5,10
5
Tot
al2,
536,
951
809,
690
38
2
11,8
74
38
4
15,6
42
73
5,10
5
4,11
0,02
8
Incr
ease
on
2011
373,
484
12,3
51-5
7 -1
,777
22
81,
869
-68,
927
317,
171
Per
cent
age
chan
ge fr
om 2
011
17%
2%-1
3%-1
3%14
6%14
%-9
%8%
Per
cent
age
of to
tal f
or 2
012
62%
20%
0.0%
0.3%
0.0%
0.4%
18%
100%
2011
Tot
als
2,16
3,46
7
79
7,33
9
439
13
,651
156
13
,773
804,
032
3,
792,
857
Not
e. T
he to
tal n
umbe
r of p
roce
dure
s us
ing
anim
als
liste
d in
sch
edul
e 2
was
3,3
74,9
23.
29

Table 3 Scientific procedures by species of animal, and genetic statusSummary VersionNote. For numbers of procedures by purpose, see full table available on the website
Great Britain 2012 Number of proceduresSpecies of animal Genetic status Total
Normal animal Animal with harmful genetic
mutation
Genetically modified animal
Mammal Mouse 875,298 441,610 1,741,913 3,058,821 Rat 243,954 27,386 7,046 278,386 Guinea pig 12,740 - - 12,740 Hamster 2,236 - - 2,236 Gerbil 340 - - 340 Other rodent 3,013 - - 3,013 Rabbit 13,839 - 27 13,866 Cat 247 - - 247 Dog Beagle 4,643 - - 4,643 Greyhound - - - - Other inc cross-breds 198 2 - 200 Ferret 348 - - 348 Other carnivore 713 - - 713 Horse and other equids 8,482 - - 8,482 Pig 3,336 - 43 3,379 Goat 1,658 - - 1,658 Sheep 42,838 - 33 42,871 Cattle 5,482 - - 5,482 Deer 77 - - 77 Camelid - - - - Other ungulate - - - - Primate Prosimian - - - - New World monkey marmoset, tamarin 283 - - 283 Squirrel, owl, spider monkey - - - - Other New World monkey - - - - Old World monkey Macaque 2,737 - - 2,737 Baboon - - - - Other Old World monkey - - - - Ape Gibbon - - - - Great ape - - - - Other mammal 533 - - 533 Bird Domestic fowl (Gallus domesticus ) 135,836 522 701 137,059 Turkey 4,436 - - 4,436 Quail (Coturnix coturnix ) - - - - Quail (not Coturnix coturnix ) 858 - - 858 Other bird 11,580 - - 11,580 Reptile 513 - - 513 Amphibian 11,179 405 2,113 13,697 Fish 289,131 55,056 156,643 500,830 Cephalopod - - - - Total 1,676,528 524,981 1,908,519 4,110,028 Percentage of total for 2012 41% 13% 46% 100%
30
Tabl
e 4
Scie
ntifi
c pr
oced
ures
by
spec
ies
of a
nim
al a
nd ta
rget
bod
y sy
stem
Gre
at B
ritai
n 20
12N
umbe
r of p
roce
dure
sSp
ecie
s of
ani
mal
Tota
lR
espi
rato
ryC
ardi
ovas
cula
rN
ervo
usS
ense
sA
limen
tary
Ski
nM
uscu
lo -
skel
etal
Rep
rodu
ctiv
eIm
mun
e an
d re
ticul
o -
endo
thel
ial
Oth
er s
yste
mM
ultip
le
syst
ems
Sys
tem
not
re
leva
nt
Mam
mal
Mou
se57
,674
10
3,37
1
29
8,60
5
40
,541
61
,269
42
,194
51
,523
24
4,52
1
51
4,22
9
67
,239
96
3,62
4
61
4,03
1
3,
058,
821
R
at21
,162
14
,165
64
,542
2,
484
4,
138
46
4
1,
616
38
,107
7,
124
3,
183
61
,725
59
,676
27
8,38
6
A
ll ot
her r
oden
ts2,
439
3,
068
24
1
31
0
28
3
52
5
-
34
5,79
7
-
3,
276
2,
356
18
,329
R
abbi
t60
82
3
9
187
4
71
5
54
1,
527
2,
954
69
4
4,
977
1,
862
13
,866
C
at-
32
14
6
3
-
-
-
3
-
13
3
56
24
7
D
og13
2
35
9
-
-
99
-
2
25
44
12
9
1,
844
2,
209
4,
843
F
erre
t96
13
-
52
-
-
-
-
40
-
9
138
348
Oth
er c
arni
vore
-
3
-
-
-
-
-
94
-
-
33
58
3
71
3
H
orse
and
oth
er e
quid
s87
71
-
-
-
5
2
17
129
6,36
3
96
1,71
2
8,48
2
Pig
159
87
95
-
28
0
56
-
142
918
84
607
951
3,37
9
She
ep26
2
23
4
16
4
-
899
159
213
423
1,19
6
33,0
76
2,98
9
3,25
6
42,8
71
All
othe
r ung
ulat
es32
5
31
4
-
1,
760
-
-
1,
048
2,
434
29
4
1,
266
55
7,
217
New
Wor
ld m
onke
y-
7
30
-
-
-
-
-
-
-
153
93
283
O
ld W
orld
mon
key
35
30
59
2
-
-
-
20
86
-
80
9
1,
696
2,
737
A
ll ot
her m
amm
als
-
-
-
5
-
81
-
101
-
-
-
34
6
53
3
B
ird64
0
1,
296
1,
483
50
4
9,
748
-
301
2,63
5
6,08
5
112,
545
10,5
87
8,10
9
153,
933
Rep
tile
-
-
-
-
-
-
-
-
-
51
3
-
-
51
3
A
mph
ibia
n-
-
16
7
-
119
383
221
9,51
0
-
-
1,18
9
2,10
8
13,6
97
Fish
4,58
0
13,0
87
52,4
41
4,92
5
93,9
52
9,80
3
7,19
5
58,4
98
16,4
03
1,20
0
101,
688
137,
058
500,
830
Tota
l87
,651
13
6,67
7
41
7,85
4
49
,016
17
2,55
4
54
,385
61
,127
35
6,70
2
55
7,44
2
22
5,32
0
1,
155,
005
83
6,29
5
4,
110,
028
Incr
ease
on
2011
-27,
419
4,37
3-2
,273
-2
,154
10
7,99
4-2
,761
17
,146
32,8
0844
,876
-23,
071
171,
854
-4,2
02
317,
171
Per
cent
age
chan
ge fr
om 2
011
-24%
3%-1
%-4
%16
7%-5
%39
%10
%9%
-9%
17%
-0.5
%8%
Per
cent
age
of to
tal f
or 2
012
2%3%
10%
1%4%
1%1%
9%14
%5%
28%
20%
100%
2011
Tot
als
115,
070
132,
304
420,
127
51,1
70
64,5
60
57,1
46
43,9
81
323,
894
512,
566
248,
391
983,
151
840,
497
3,79
2,85
7
Bod
y sy
stem
s
31

Tabl
e 5
Scie
ntifi
c pr
oced
ures
by
spec
ies
of a
nim
al a
nd le
vel o
f ana
esth
esia
Gre
at B
ritai
n 20
12N
umbe
r of p
roce
dure
s
Spec
ies
of a
nim
alTo
tal
No
anae
sthe
sia
Gen
eral
ana
esth
esia
, with
re
cove
ryLo
cal a
naes
thes
iaG
ener
al a
naes
thes
ia a
t en
d of
pro
cedu
re, w
ithou
t re
cove
ry
Gen
eral
ana
esth
esia
th
roug
hout
, with
out
reco
very
Mam
mal
Mou
se2,
363,
943
41
9,00
4
13
0,95
1
97
,120
47
,803
3,
058,
821
R
at16
1,01
5
69
,349
88
1
26
,935
20
,206
27
8,38
6
A
ll ot
her r
oden
ts11
,725
2,
629
14
1
1,
604
2,
230
18
,329
R
abbi
t8,
334
32
5
1,
517
1,
389
2,
301
13
,866
C
at94
15
3
-
--
247
Dog
3,89
8
402
124
274
145
4,84
3
Fer
ret
9
312
-5
22
34
8
O
ther
car
nivo
re22
0
47
7
-
-16
71
3
H
orse
and
oth
er e
quid
s35
0
12
8,
120
-
-8,
482
P
ig2,
659
34
7
12
1
36
0
3,
379
S
heep
42,1
14
626
45
75
11
42,8
71
All
othe
r ung
ulat
es7,
129
16
68
-
4
7,21
7
Prim
ate
N
ew W
orld
mon
key
156
84
-12
31
28
3
Old
Wor
ld m
onke
y2,
004
71
6
-
5
12
2,73
7
All
othe
r mam
mal
s52
8
3
-
-2
53
3
B
ird50
,234
63
5
-
101,
989
1,07
5
153,
933
Rep
tile
513
--
--
513
Am
phib
ian
11,9
03
1,72
0
--
74
13,6
97
Fish
285,
964
193,
191
99
20,9
11
665
500,
830
Tot
al2,
952,
792
69
0,00
1
14
1,95
8
25
0,32
0
74
,957
4,
110,
028
Incr
ease
on
2011
257,
071
131,
534
-14,
343
-54,
311
-2,7
80
317,
171
Per
cent
age
chan
ge fr
om 2
011
10%
24%
-9%
-18%
-4%
8%
Per
cent
age
of to
tal f
or 2
012
72%
17%
3%6%
2%10
0%
2011
Tot
als
2,69
5,72
1
55
8,46
7
156,
301
30
4,63
1
77,7
37
3,
792,
857
Not
e. N
euro
mus
cula
r blo
ckin
g ag
ents
(NM
BA
) wer
e us
ed in
1,6
75 p
roce
dure
s in
201
2. A
ll of
thes
e pr
oced
ures
invo
lved
the
use
of g
ener
al a
naes
thes
ia.
Type
of a
naes
thes
ia
32
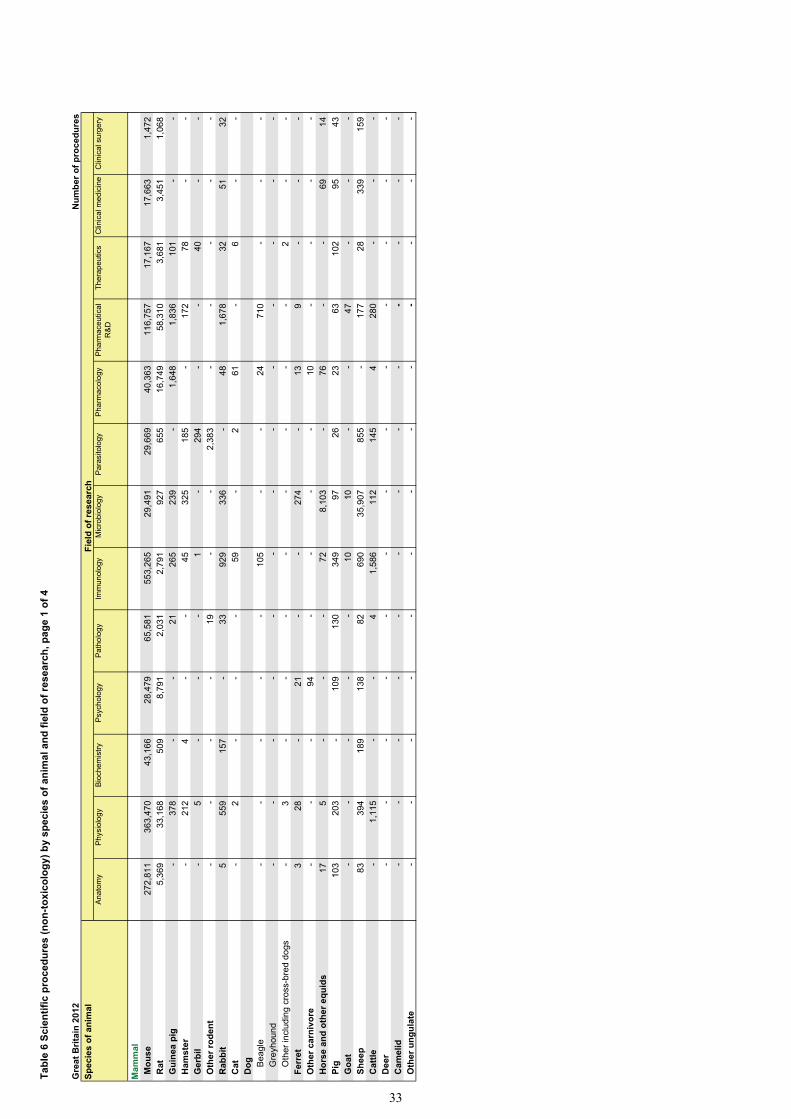
Tabl
e 6
Scie
ntifi
c pr
oced
ures
(non
-toxi
colo
gy) b
y sp
ecie
s of
ani
mal
and
fiel
d of
rese
arch
, pag
e 1
of 4
Gre
at B
ritai
n 20
12N
umbe
r of p
roce
dure
sSp
ecie
s of
ani
mal
Ana
tom
yP
hysi
olog
yB
ioch
emis
tryP
sych
olog
yP
atho
logy
Imm
unol
ogy
Mic
robi
olog
yP
aras
itolo
gyP
harm
acol
ogy
Pha
rmac
eutic
al
R&
DTh
erap
eutic
sC
linic
al m
edic
ine
Clin
ical
sur
gery
Mam
mal
Mou
se27
2,81
1
363,
470
43
,166
28,4
79
65
,581
553,
265
29
,491
29,6
69
40
,363
116,
757
17
,167
17,6
63
1,
472
R
at5,
369
33
,168
509
8,79
1
2,03
1
2,79
1
927
655
16,7
49
58
,310
3,68
1
3,45
1
1,06
8
Gui
nea
pig
-
378
--
21
26
5
23
9
-
1,64
8
1,83
6
101
--
Ham
ster
-
212
4
--
45
32
5
18
5
-
172
78
-
- G
erbi
l-
5
-
--
1
-29
4
-
-40
--
Oth
er ro
dent
-
--
-19
--
2,38
3
--
--
- R
abbi
t5
55
9
15
7
-
33
92
9
33
6
-
48
1,
678
32
51
32
Cat
-2
-
--
59
-
2
61
-
6
--
Dog
B
eagl
e-
--
--
105
--
24
71
0
-
--
G
reyh
ound
-
--
--
--
--
--
--
O
ther
incl
udin
g cr
oss-
bred
dog
s-
3
-
--
--
--
-2
-
- F
erre
t3
28
-21
--
274
-13
9
--
- O
ther
car
nivo
re-
-
-94
--
--
10
-
--
- H
orse
and
oth
er e
quid
s17
5
--
-72
8,10
3
-76
--
69
14
Pig
103
203
-10
9
13
0
34
9
97
26
23
63
10
2
95
43
G
oat
-
--
--
10
10
--
47
-
--
She
ep83
394
189
138
82
69
0
35
,907
855
-17
7
28
339
159
Cat
tle-
1,
115
-
-4
1,
586
11
2
14
5
4
28
0
-
--
Dee
r-
-
-
--
--
--
--
--
Cam
elid
-
--
-
--
--
--
--
- O
ther
ung
ulat
e-
-
--
-
--
--
--
--
Fiel
d of
rese
arch
33

Tabl
e 6
Scie
ntifi
c pr
oced
ures
(non
-toxi
colo
gy) b
y sp
ecie
s of
ani
mal
and
fiel
d of
rese
arch
, pag
e 2
of 4
Gre
at B
ritai
n 20
12N
umbe
r of p
roce
dure
sSp
ecie
s of
ani
mal
Ana
tom
y P
hysi
olog
y B
ioch
emis
try
Psy
chol
ogy
Pat
holo
gy
Imm
unol
ogy
Mic
robi
olog
yP
aras
itolo
gyP
harm
acol
ogy
Pha
rmac
eutic
al
R&
DTh
erap
eutic
sC
linic
al m
edic
ine
Clin
ical
sur
gery
Prim
ate
P
rosi
mia
n-
--
--
-
--
--
--
-
New
Wor
ld m
onke
y
m
arm
oset
, tam
arin
7
48
-
38
59
13
4
-
25
47
--
-
S
quirr
el, o
wl,
spid
er m
onke
y-
--
--
--
-
--
--
-
O
ther
New
Wor
ld m
onke
y-
--
--
--
-
--
--
-
Old
Wor
ld m
onke
y
M
acaq
ue3
18
56
40
-74
64
-
-
214
--
-
B
aboo
n-
--
--
--
--
-
--
-
O
ther
Old
Wor
ld m
onke
y-
--
--
--
--
--
-
-
Ape
Gib
bon
--
--
--
--
--
--
-
Gre
at a
pe-
--
--
--
--
--
--
O
ther
mam
mal
-
5
--
--
--
--
--
-B
ird D
omes
tic fo
wl (
Gal
lus
dom
estic
us)
1,17
3
1,63
7
3
70
-
922
7,23
8
104,
185
-
941
200
12
-
Tur
key
--
--
-18
222
1224
-27
0
-
--
Qua
il (C
otur
nix
cotu
rnix
)-
-
--
--
--
--
--
- Q
uail
(not
Cot
urni
x co
turn
ix)
-
241
--
--
--
--
--
- O
ther
bird
14
63
-1,
284
-
565
4
42
-
--
--
Rep
tile
- any
rept
ilian
spe
cies
-
--
--
--
--
--
--
Am
phib
ian
- any
am
phib
ian
spec
ies
10,6
80
47
6
1,
057
-
--
303
80
24
--
--
Fish
-any
fish
spe
cies
140,
151
28
,879
-1,
026
6,
947
14
,003
10,7
57
4,
726
5,
128
22
,276
-1,
592
-
Cep
halo
pod
- Oct
opus
vul
garis
--
--
--
--
--
--
-
Tota
l43
0,41
9
430,
909
45
,141
40,0
90
74
,907
575,
762
94
,413
144,
471
64
,196
203,
787
21
,437
23,2
72
2,
788
Incr
ease
on
2011
73,1
66-1
73,6
45
15,7
64-6
,096
1,
248
43,6
616,
918
-12,
883
-10,
127
-24,
629
2,26
45,
443
-236
Per
cent
age
chan
ge fr
om 2
011
20%
-29%
54%
-13%
2%8%
8%-8
%-1
4%-1
1%12
%31
%-8
%
Per
cent
age
of to
tal f
or 2
012
12%
12%
1%1%
2%15
%3%
4%2%
5%1%
0.6%
0.1%
2011
Tot
als
357,
253
604,
554
29,3
7746
,186
73,6
5953
2,10
187
,495
157,
354
74,3
2322
8,41
619
,173
17,8
293,
024
Fiel
d of
rese
arch
34

Tabl
e 6
Scie
ntifi
c pr
oced
ures
(non
-toxi
colo
gy) b
y sp
ecie
s of
ani
mal
and
fiel
d of
rese
arch
, pag
e 3
of 4
Gre
at B
ritai
n 20
12N
umbe
r of p
roce
dure
sSp
ecie
s of
ani
mal
Tot
al
Den
tistry
G
enet
ics
Mol
ecul
ar
biol
ogy
Can
cer r
esea
rch
Nut
ritio
n Z
oolo
gy
Bot
any
Ani
mal
sci
ence
E
colo
gy
Ani
mal
wel
fare
O
ther
T
obac
co (1
) A
lcoh
ol
Mam
mal
Mou
se11
9
36
0,10
6
165,
709
47
2,25
7
2,53
5
-19
12
-
493
293,
602
-
57
1
2,
874,
777
Rat
64
16
5
2,
327
3,
085
1,
338
-
4
--
156
22,2
20
-
-
166,
859
G
uine
a pi
g-
--
--
--
--
--
--
4,
488
H
amst
er-
-13
1
20
80
-
--
--
--
-1,
252
G
erbi
l-
--
--
--
--
--
--
340
Oth
er ro
dent
--
--
--
--
441
--
--
2,84
3
Rab
bit
--
--
--
6
--
-12
--
3,87
8
Cat
-32
--
85
-
--
--
--
-24
7
D
og
Bea
gle
--
--
--
--
-6
-
--
845
G
reyh
ound
--
--
--
--
--
--
--
Oth
er in
clud
ing
cros
s-br
ed d
ogs
--
19
46
130
--
--
--
--
200
Fer
ret
--
--
--
--
--
--
-34
8
O
ther
car
nivo
re-
--
--
46
-
-52
4
-
1
--
675
Hor
se a
nd o
ther
equ
ids
--
--
20
-
--
--
--
-8,
376
P
ig-
--
6
--
-70
--
25
-
-1,
444
G
oat
-1,
565
10
--
--
--
--
--
1,64
2
She
ep-
375
--
174
--
2,68
3
-17
142
--
42,4
32
C
attle
--
--
110
--
1,53
5
--
--
-4,
891
D
eer
-77
--
--
--
--
--
-77
Cam
elid
--
--
--
--
--
--
--
O
ther
ung
ulat
e-
--
--
--
--
--
--
-
(1) F
ollo
win
g a
Gov
ernm
ent d
ecis
ion
in 1
997,
pro
cedu
res
usin
g an
imal
s in
rese
arch
on
toba
cco
have
not
bee
n al
low
ed.
Fiel
d of
rese
arch
35
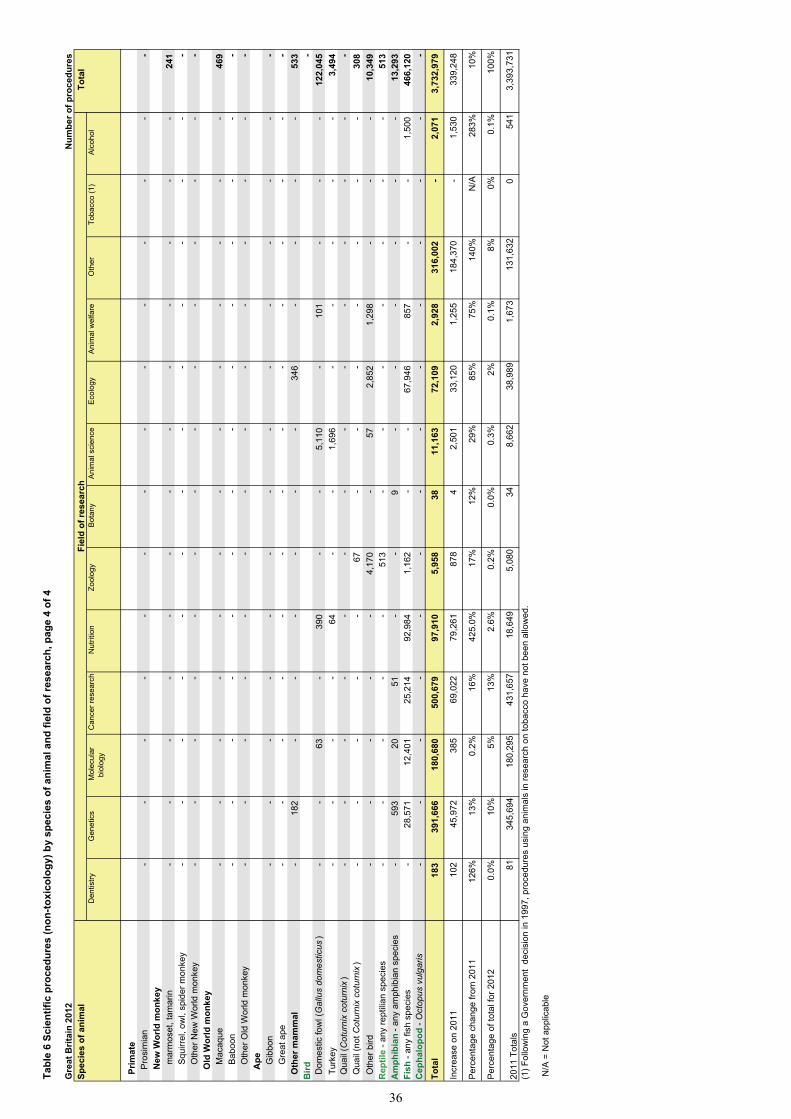
Tabl
e 6
Scie
ntifi
c pr
oced
ures
(non
-toxi
colo
gy) b
y sp
ecie
s of
ani
mal
and
fiel
d of
rese
arch
, pag
e 4
of 4
Gre
at B
ritai
n 20
12N
umbe
r of p
roce
dure
sSp
ecie
s of
ani
mal
Tot
al
Den
tistry
G
enet
ics
Mol
ecul
ar
biol
ogy
Can
cer r
esea
rch
Nut
ritio
n Z
oolo
gy
Bot
any
Ani
mal
sci
ence
E
colo
gy
Ani
mal
wel
fare
O
ther
T
obac
co (1
) A
lcoh
ol
Prim
ate
P
rosi
mia
n-
--
--
--
--
--
--
-
N
ew W
orld
mon
key
mar
mos
et, t
amar
in-
--
--
--
--
--
--
241
Squ
irrel
, ow
l, sp
ider
mon
key
--
--
--
--
--
--
--
O
ther
New
Wor
ld m
onke
y-
--
--
--
--
--
--
-
O
ld W
orld
mon
key
Mac
aque
--
--
--
--
--
--
-46
9
B
aboo
n-
--
--
--
--
--
--
-
Oth
er O
ld W
orld
mon
key
--
--
--
--
--
--
--
Ape
Gib
bon
--
--
--
--
--
--
--
G
reat
ape
--
--
--
--
--
--
--
O
ther
mam
mal
-
182
--
--
--
346
--
--
533
Bird
-
Dom
estic
fow
l (G
allu
s do
mes
ticus
)-
-
63
-
390
--
5,11
0
-10
1
-
--
122,
045
T
urke
y-
--
-
64
-
-1,
696
-
--
--
3,49
4
Qua
il (C
otur
nix
cotu
rnix
)-
--
-
--
--
--
--
--
Q
uail
(not
Cot
urni
x co
turn
ix)
--
--
-
67
-
--
--
--
308
Oth
er b
ird-
--
--
4,17
0
-57
2,85
2
1,29
8
--
-10
,349
Rep
tile
- any
rept
ilian
spe
cies
--
--
-51
3
-
-
--
--
-51
3
A
mph
ibia
n - a
ny a
mph
ibia
n sp
ecie
s-
593
20
51
--
9
-
--
--
-13
,293
Fish
- an
y fis
h sp
ecie
s-
28,5
71
12
,401
25,2
14
92
,984
1,16
2
--
67,9
46
85
7
-
-1,
500
46
6,12
0
Cep
halo
pod
- Oct
opus
vul
garis
--
--
--
--
--
-
--
-
Tota
l18
3
39
1,66
6
180,
680
50
0,67
9
97,9
10
5,
958
38
11,1
63
72
,109
2,92
8
316,
002
-
2,
071
3,
732,
979
Incr
ease
on
2011
102
45,9
7238
569
,022
79,2
6187
84
2,50
133
,120
1,25
518
4,37
0-
1,
530
339,
248
Per
cent
age
chan
ge fr
om 2
011
126%
13%
0.2%
16%
425.
0%17
%12
%29
%85
%75
%14
0%N
/A28
3%10
%
Per
cent
age
of to
tal f
or 2
012
0.0%
10%
5%13
%2.
6%0.
2%0.
0%0.
3%2%
0.1%
8%0%
0.1%
100%
2011
Tot
als
8134
5,69
418
0,29
543
1,65
718
,649
5,08
034
8,66
238
,989
1,67
313
1,63
20
541
3,39
3,73
1
(1) F
ollo
win
g a
Gov
ernm
ent
deci
sion
in 1
997,
pro
cedu
res
usin
g an
imal
s in
rese
arch
on
toba
cco
have
not
bee
n al
low
ed.
N/A
= N
ot a
pplic
able
Fiel
d of
rese
arch
36
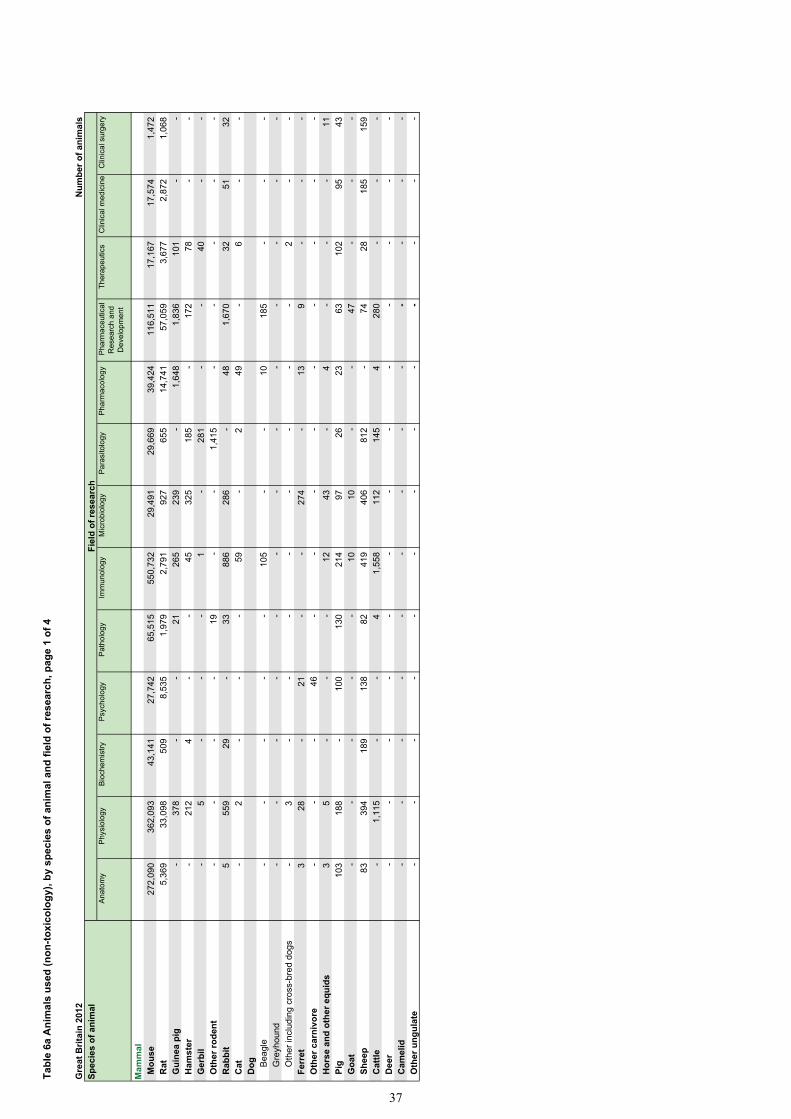
Tabl
e 6a
Ani
mal
s us
ed (n
on-to
xico
logy
), by
spe
cies
of a
nim
al a
nd fi
eld
of re
sear
ch, p
age
1 of
4
Gre
at B
ritai
n 20
12N
umbe
r of a
nim
als
Spec
ies
of a
nim
alFi
eld
of re
sear
ch A
nato
my
Phy
siol
ogy
Bio
chem
istry
P
sych
olog
y P
atho
logy
Im
mun
olog
y M
icro
biol
ogy
Par
asito
logy
P
harm
acol
ogy
Pha
rmac
eutic
al
Res
earc
h an
d D
evel
opm
ent
The
rape
utic
s C
linic
al m
edic
ine
Clin
ical
sur
gery
Mam
mal
Mou
se27
2,09
0
362,
093
43
,141
27,7
42
65
,515
550,
732
29
,491
29,6
69
39
,424
116,
511
17
,167
17,5
74
1,
472
R
at5,
369
33
,098
509
8,53
5
1,97
9
2,79
1
927
655
14,7
41
57
,059
3,67
7
2,87
2
1,06
8
Gui
nea
pig
-
378
--
21
26
5
23
9
-
1,64
8
1,83
6
101
--
Ham
ster
-
212
4
--
45
32
5
18
5
-
172
78
-
- G
erbi
l-
5
-
--
1
-28
1
-
-40
--
Oth
er ro
dent
-
--
-19
--
1,41
5
--
--
- R
abbi
t5
55
9
29
-33
886
286
-48
1,67
0
32
51
32
C
at-
2
--
-59
-2
49
-6
-
- D
og
Bea
gle
--
--
-10
5
-
-10
185
--
-
Gre
yhou
nd-
-
--
--
--
--
--
-
Oth
er in
clud
ing
cros
s-br
ed d
ogs
-
3
--
--
--
--
2
--
Fer
ret
3
28
-
21
-
-27
4
-
13
9
-
--
Oth
er c
arni
vore
-
--
46
-
--
--
-
--
- H
orse
and
oth
er e
quid
s3
5
-
--
12
43
-4
-
--
11
Pig
103
188
-10
0
13
0
21
4
97
26
23
63
10
2
95
43
G
oat
-
--
--
10
10
--
47
-
--
She
ep83
394
189
138
82
41
9
40
6
81
2
-
74
28
185
159
Cat
tle-
1,
115
-
-4
1,
558
11
2
14
5
4
28
0
-
--
Dee
r-
-
-
--
--
--
--
--
Cam
elid
-
--
-
--
--
--
--
- O
ther
ung
ulat
e-
-
--
-
--
--
--
--
37

Tabl
e 6a
Ani
mal
s us
ed (n
on-to
xico
logy
), by
spe
cies
of a
nim
al a
nd fi
eld
of re
sear
ch, p
age
2 of
4
Gre
at B
ritai
n 20
12N
umbe
r of a
nim
als
Spec
ies
of a
nim
alFi
eld
of re
sear
ch A
nato
my
Phy
siol
ogy
Bio
chem
istry
P
sych
olog
y P
atho
logy
Im
mun
olog
y M
icro
biol
ogy
Par
asito
logy
P
harm
acol
ogy
Pha
rmac
eutic
al
Res
earc
h an
d D
evel
opm
ent
The
rape
utic
s C
linic
al m
edic
ine
Clin
ical
sur
gery
Prim
ate
P
rosi
mia
n-
--
--
-
--
--
--
-
New
Wor
ld m
onke
y
m
arm
oset
, tam
arin
7
42
-
38
59
13
4
-
25
37
--
-
S
quirr
el, o
wl,
spid
er m
onke
y-
--
--
--
-
--
--
-
O
ther
New
Wor
ld m
onke
y-
--
--
--
-
--
--
-
Old
Wor
ld m
onke
y
M
acaq
ue2
18
2
11
-
74
64
--
6
-
--
Bab
oon
--
--
--
--
--
-
--
Oth
er O
ld W
orld
mon
key
--
--
--
--
--
-
--
A
pe
G
ibbo
n-
--
--
--
--
--
-
-
G
reat
ape
--
--
--
--
--
--
-
O
ther
mam
mal
-
5
--
--
--
--
--
-B
ird D
omes
tic fo
wl (
Gal
lus
dom
estic
us)
1,17
3
1,63
7
3
70
-
922
7,23
8
104,
185
-
885
200
12
-
Tur
key
--
--
-18
74
1,
224
-
166
--
- Q
uail
(Cot
urni
x co
turn
ix)
-
--
--
--
--
--
--
Qua
il (n
ot C
otur
nix
cotu
rnix
)-
24
1
-
--
--
--
--
--
Oth
er b
ird14
63
-
1,19
9
-24
8
-
42
--
--
-R
eptil
e - a
ny re
ptili
an s
peci
es-
-
--
--
--
--
--
-A
mph
ibia
n - a
ny a
mph
ibia
n sp
ecie
s4,
268
92
182
--
-30
3
80
24
-
--
-Fi
sh -
any
fish
spec
ies
140,
060
28
,879
-1,
026
6,
947
13
,685
10,7
57
4,
726
5,
128
22
,276
-1,
592
-
Cep
halo
pod
- Oct
opus
vul
garis
--
--
--
--
--
--
-
Tota
l42
3,18
0
429,
057
44
,059
38,9
26
74
,789
572,
057
50
,650
143,
447
61
,141
201,
276
21
,433
22,3
81
2,
785
38

Tabl
e 6a
Ani
mal
s us
ed (n
on-to
xico
logy
), by
spe
cies
of a
nim
al a
nd fi
eld
of re
sear
ch, p
age
3 of
4
Gre
at B
ritai
n 20
12N
umbe
r of a
nim
als
Spec
ies
of a
nim
alFi
eld
of re
sear
ch T
otal
D
entis
try
Gen
etic
s M
olec
ular
bi
olog
y C
ance
r res
earc
h N
utrit
ion
Zoo
logy
B
otan
y A
nim
al s
cien
ce
Eco
logy
A
nim
al w
elfa
re
Oth
er
Tob
acco
(1)
Alc
ohol
Mam
mal
Mou
se11
9
35
9,91
4
165,
108
47
1,12
2
2,53
5
-19
12
-
493
293,
602
-
57
1
2,
866,
116
Rat
48
16
5
2,
327
3,
071
1,
338
-
4
--
156
22,2
20
-
-
162,
609
G
uine
a pi
g-
--
--
--
--
--
--
4,
488
H
amst
er-
-13
1
20
80
-
--
--
--
-1,
252
G
erbi
l-
--
--
--
--
--
--
327
Oth
er ro
dent
--
--
--
--
441
--
--
1,87
5
Rab
bit
--
--
--
6
--
-12
--
3,64
9
Cat
-32
--
52
-
--
--
--
-20
2
D
og
Bea
gle
--
--
--
--
-6
-
--
306
G
reyh
ound
--
--
--
--
--
--
--
Oth
er in
clud
ing
cros
s-br
ed d
ogs
--
19
46
26
-
--
--
--
-96
Fer
ret
--
--
--
--
--
--
-34
8
O
ther
car
nivo
re-
--
--
46
-
-52
4
-
-
--
616
Hor
se a
nd o
ther
equ
ids
--
--
20
-
--
--
--
-98
Pig
--
-6
-
--
65
-
-25
--
1,28
0
Goa
t-
1,56
5
10
-
--
--
--
--
-1,
642
S
heep
-37
5
-
-83
--
2,63
6
-17
142
--
6,22
2
Cat
tle-
--
-94
--
896
--
--
-4,
208
D
eer
-77
--
--
--
--
--
-77
Cam
elid
--
--
--
--
--
--
--
O
ther
ung
ulat
e-
--
--
--
--
--
--
-
(1) F
ollo
win
g a
Gov
ernm
ent d
ecis
ion
in 1
997,
pro
cedu
res
usin
g an
imal
s in
rese
arch
on
toba
cco
have
not
bee
n al
low
ed.
39

Tabl
e 6a
Ani
mal
s us
ed (n
on-to
xico
logy
), by
spe
cies
of a
nim
al a
nd fi
eld
of re
sear
ch, p
age
4 of
4
Gre
at B
ritai
n 20
12N
umbe
r of a
nim
als
Spec
ies
of a
nim
alFi
eld
of re
sear
ch T
otal
D
entis
try
Gen
etic
s M
olec
ular
bi
olog
y C
ance
r res
earc
h N
utrit
ion
Zoo
logy
B
otan
y A
nim
al s
cien
ce
Eco
logy
A
nim
al w
elfa
re
Oth
er
Tob
acco
(1)
Alc
ohol
Prim
ate
P
rosi
mia
n-
--
--
--
--
--
--
-
N
ew W
orld
mon
key
-
mar
mos
et, t
amar
in-
--
--
--
--
--
--
225
Squ
irrel
, ow
l, sp
ider
mon
key
--
--
--
--
--
--
--
O
ther
New
Wor
ld m
onke
y-
--
--
--
--
--
--
-
O
ld W
orld
mon
key
Mac
aque
--
--
--
--
--
--
-17
7
B
aboo
n-
--
--
--
--
--
--
-
Oth
er O
ld W
orld
mon
key
--
--
--
--
--
--
--
Ape
Gib
bon
--
--
--
--
--
--
--
G
reat
ape
--
--
--
--
--
--
--
Oth
er m
amm
al-
18
2
-
--
--
-27
3
-
--
-46
0
B
ird D
omes
tic fo
wl (
Gal
lus
dom
estic
us)
--
63
-39
0
-
-5,
110
-
101
--
-12
1,98
9
Tur
key
--
-
-64
--
1,69
6
--
--
-3,
242
Q
uail
(Cot
urni
x co
turn
ix)
--
--
-
--
--
--
--
-
Qua
il (n
ot C
otur
nix
cotu
rnix
)-
--
--
67
--
--
--
-30
8
O
ther
bird
--
--
-3,
476
-
1
2,78
5
1,29
8
--
-9,
126
R
eptil
e - a
ny re
ptili
an s
peci
es-
--
--
513
-
--
--
--
513
Am
phib
ian
- any
am
phib
ian
spec
ies
-59
3
20
-
--
9
-
--
--
-5,
571
Fi
sh -
any
fish
spec
ies
-28
,531
12,4
01
25
,214
92,6
59
1,
162
-
-67
,946
857
--
1,50
0
465,
346
C
epha
lopo
d - O
ctop
us v
ulga
ris-
--
--
--
--
-
--
--
Tota
l16
7
39
1,43
4
180,
079
49
9,47
9
97,3
41
5,
264
38
10,4
16
71
,969
2,92
8
316,
001
-
2,
071
3,
662,
368
(1) F
ollo
win
g a
Gov
ernm
ent d
ecis
ion
in 1
997,
pro
cedu
res
usin
g an
imal
s in
rese
arch
on
toba
cco
have
not
bee
n al
low
ed.
40

Tabl
e 7
Scie
ntifi
c pr
oced
ures
(non
-toxi
colo
gy) b
y sp
ecie
s of
ani
mal
and
pro
duct
ion
of b
iolo
gica
l mat
eria
ls
Gre
at B
ritai
n 20
12N
umbe
r of p
roce
dure
s
Spec
ies
of a
nim
alPr
oduc
tion
Oth
er (1
)To
tal
Infe
ctio
us
agen
tsV
ecto
rsN
eopl
asm
sM
onoc
lona
l an
tibod
ies
(asc
ites
mod
el)
Mon
oclo
nal
antib
odie
s (in
itial
im
mun
isat
ion)
Pol
yclo
nal
antib
odie
sO
ther
bi
olog
ical
m
ater
ials
Mam
mal
Mou
se23
,478
3,74
7
13,9
33
-
1,46
7
7,48
0
126,
180
2,
698,
492
2,87
4,77
7
Rat
669
65
24
9
-
43
61
10
,751
155,
021
16
6,85
9
All
othe
r rod
ents
349
-20
--
81
1,
155
7,
318
8,
923
Rab
bit
--
--
28
2,
200
79
3
85
7
3,
878
Cat
2
--
--
3
-24
2
24
7
Dog
--
--
--
677
368
1,04
5
Fer
ret
--
--
-89
-25
9
34
8
Oth
er c
arni
vore
--
--
--
3
672
675
Hor
se a
nd o
ther
equ
ids
--
--
-1
6,
426
1,
949
8,
376
Pig
s, s
heep
& a
ll ot
her u
ngul
ate s
661
3
--
24
85
5
36
,440
12,5
03
50
,486
Prim
ate
N
ew W
orld
mon
key
--
--
--
67
17
4
24
1
O
ld W
orld
mon
key
--
--
--
289
180
469
All
othe
r mam
mal
s-
--
--
--
533
533
Bird
104,
411
-
--
-24
3
2,
032
29
,510
136,
196
Rep
tile,
Am
phib
ian
--
--
--
7,07
5
6,73
1
13,8
06
Fish
4,89
3
--
--
-85
5
46
0,37
2
466,
120
Tot
al13
4,46
3
3,81
5
14,2
02
-
1,
562
11
,013
192,
743
3,
375,
181
3,73
2,97
9
Incr
ease
on
2011
-13,
001
-1,3
54
3,66
80
-311
3,
618
15,4
5433
1,17
433
9,24
8
Per
cent
age
chan
ge fr
om 2
011
-9%
-26%
35%
N/A
-17%
49%
9%11
%10
.0%
Per
cent
age
of to
tal f
or 2
012
4%0.
1%0.
4%0.
0%0.
0%0.
3%5%
90%
100%
2011
Tot
als
147,
464
5,
169
10
,534
01,
873
7,
395
17
7,28
9
3,04
4,00
7
3,
393,
731
(1) I
nclu
des
bree
ding
pro
cedu
res
whi
ch a
re n
ow d
etai
led
in T
able
s 3.
1 - 3
.3
N/A
= N
ot a
pplic
able
41
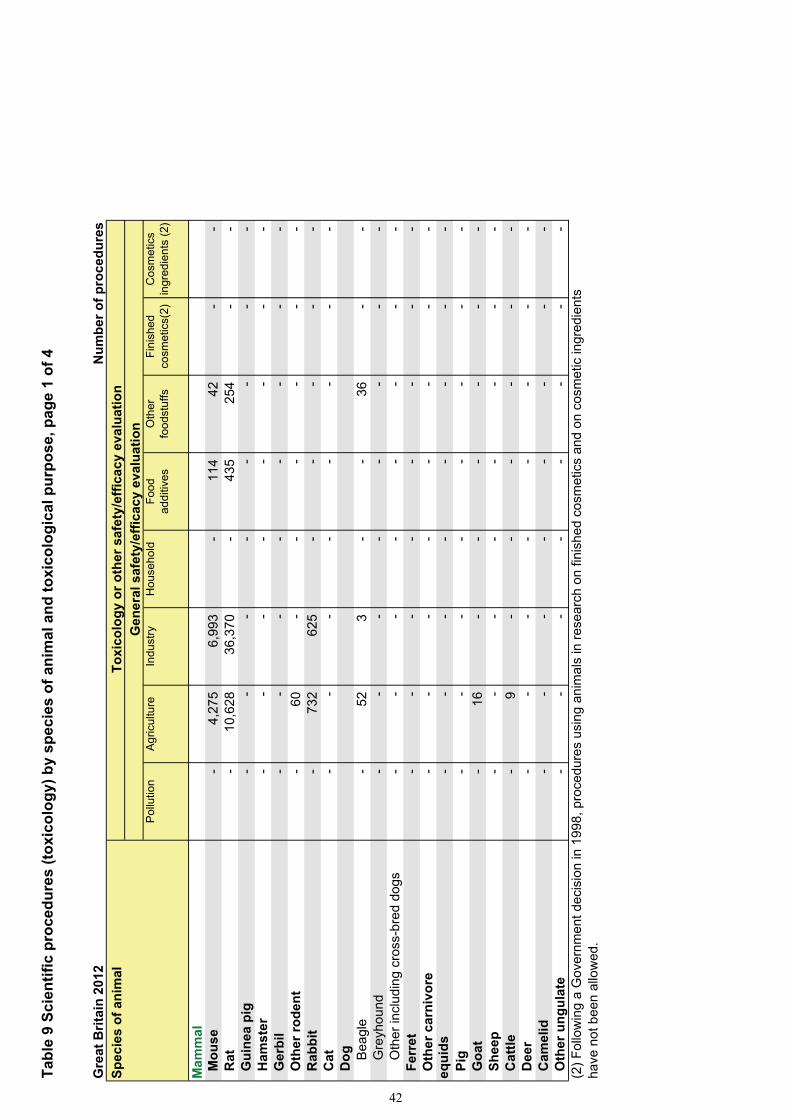
Tabl
e 9
Scie
ntifi
c pr
oced
ures
(tox
icol
ogy)
by
spec
ies
of a
nim
al a
nd to
xico
logi
cal p
urpo
se, p
age
1 of
4
Gre
at B
ritai
n 20
12N
umbe
r of p
roce
dure
sSp
ecie
s of
ani
mal
Toxi
colo
gy o
r oth
er s
afet
y/ef
ficac
y ev
alua
tion
Gen
eral
saf
ety/
effic
acy
eval
uatio
nP
ollu
tion
Agr
icul
ture
Indu
stry
Hou
seho
ldFo
od
addi
tives
Oth
er
food
stuf
fsFi
nish
ed
cosm
etic
s(2)
Cos
met
ics
ingr
edie
nts
(2)
Mam
mal
Mou
se-
4,27
5
6,99
3
-
11
4
42
-
- R
at-
10,6
28
36,3
70
-43
5
25
4
-
- G
uine
a pi
g-
--
--
--
- H
amst
er-
--
-
-
--
-
G
erbi
l-
--
--
--
- O
ther
rode
nt-
60
--
--
--
Rab
bit
-
73
2
62
5
-
--
-
-
Cat
-
-
--
--
--
Dog
B
eagl
e-
52
3
-
-36
-
-
Gre
yhou
nd-
--
--
--
-
Oth
er in
clud
ing
cros
s-br
ed d
ogs
-
-
--
--
--
Fer
ret
-
-
--
--
--
Oth
er c
arni
vore
-
-
--
--
--
equi
ds-
--
--
--
- P
ig-
--
--
--
- G
oat
-
16
-
--
--
- S
heep
-
-
--
--
--
Cat
tle-
9
-
--
--
- D
eer
-
-
--
--
--
Cam
elid
-
-
--
--
--
Oth
er u
ngul
ate
-
-
--
--
--
(2) F
ollo
win
g a
Gov
ernm
ent d
ecis
ion
in 1
998,
pro
cedu
res
usin
g an
imal
s in
rese
arch
on
finis
hed
cosm
etic
s an
d on
cos
met
ic in
gred
ient
sha
ve n
ot b
een
allo
wed
.
42

Tabl
e 9
Scie
ntifi
c pr
oced
ures
(tox
icol
ogy)
by
spec
ies
of a
nim
al a
nd to
xico
logi
cal p
urpo
se, p
age
2 of
4
Gre
at B
ritai
n 20
12N
umbe
r of p
roce
dure
sSp
ecie
s of
ani
mal
Toxi
colo
gy o
r oth
er s
afet
y/ef
ficac
y ev
alua
tion
Gen
eral
saf
ety/
effic
acy
eval
uatio
nP
ollu
tion
Agr
icul
ture
Indu
stry
Hou
seho
ldFo
od
addi
tives
Oth
er
food
stuf
fsFi
nish
ed
cosm
etic
s(2)
Cos
met
ics
ingr
edie
nts(
2)
Prim
ate
P
rosi
mia
n-
--
--
--
-
New
Wor
ld m
onke
y
m
arm
oset
, tam
arin
-
-
--
--
--
Squ
irrel
, ow
l, sp
ider
mon
key
-
-
--
--
--
Oth
er N
ew W
orld
mon
key
-
-
--
--
--
O
ld W
orld
mon
key
Mac
aque
-
-
--
--
--
Bab
oon
-
-
--
--
--
Oth
er O
ld W
orld
mon
key
-
-
--
--
--
A
pe
G
ibbo
n-
--
--
--
-
G
reat
Ape
-
-
--
--
--
Oth
er m
amm
al-
--
--
--
-B
ird D
omes
tic fo
wl (
Gal
lus
dom
estic
us)
-
15
7
-
-12
0
-
--
Tur
key
-
-
--
--
--
Qua
il (C
otur
nix
cotu
rnix
)-
--
--
--
- Q
uail
(not
Cot
urni
x co
turn
ix)
-
55
0
-
--
--
- O
ther
bird
-
1,
231
-
--
--
-R
eptil
e - a
ny re
ptili
an s
peci
es-
--
--
--
-A
mph
ibia
n - a
ny a
mph
ibia
n sp
ecie
s40
0
-
--
--
--
Fish
- an
y fis
h sp
ecie
s8,
150
2,
989
79
6
-
--
--
Tota
l8,
550
20
,699
44
,787
-
669
332
-
-
Incr
ease
on
2011
-5,1
26
-2,0
86
25,5
840
-2,8
55
-3,7
57
00
Per
cent
age
chan
ge fr
om 2
011
-37%
-9%
133%
N/A
-81%
-92%
N/A
N/A
Per
cent
age
of to
tal f
or 2
012
2%5%
12%
0.0%
0.2%
0.1%
0.0%
0.0%
2011
Tot
als
13,6
7622
,785
19,2
030
3,52
44,
089
00
N/A
= N
ot a
pplic
able
(2) F
ollo
win
g a
Gov
ernm
ent d
ecis
ion
in 1
998,
pro
cedu
res
usin
g an
imal
s in
rese
arch
on
finis
hed
cosm
etic
s an
d on
cos
met
ic in
gred
ient
sha
ve n
ot b
een
allo
wed
.
43

Tabl
e 9
Scie
ntifi
c pr
oced
ures
(tox
icol
ogy)
by
spec
ies
of a
nim
al a
nd to
xico
logi
cal p
urpo
se, p
age
3 of
4
Gre
at B
ritai
n 20
12N
umbe
r of p
roce
dure
sSp
ecie
s of
ani
mal
Toxi
colo
gy o
r oth
er s
afet
y/ef
ficac
y ev
alua
tion
Tota
lPh
arm
aceu
tical
saf
ety/
effic
acy
eval
uatio
nO
ther
pur
pose
sS
afet
y te
stin
gE
ffica
cy
test
ing
Qua
lity
cont
rol
AD
ME
and
re
sidu
eTo
xico
logy
re
sear
chTo
bacc
o sa
fety
(1)
Med
ical
de
vice
saf
ety
Met
hod
deve
lopm
ent
Oth
er
Mam
mal
Mou
se31
,525
6,
299
11
7,24
0
9,
905
56
1
-
1,08
0
4,86
3
1,14
7
184,
044
Rat
47,5
14
148
1,22
8
9,21
8
393
--
3,83
5
1,50
4
111,
527
Gui
nea
pig
4,81
3
-3,
379
-
--
-60
-
8,25
2
Ham
ster
900
-12
72
-
--
--
984
Ger
bil
--
--
--
--
- O
ther
rode
nt-
--
--
--
-11
0
17
0
R
abbi
t5,
218
9
3,01
7
24
--
175
144
44
9,98
8
Cat
--
--
--
--
-
-
Dog
B
eagl
e2,
687
42
4
735
--
-23
8
1
3,79
8
G
reyh
ound
--
--
--
--
--
O
ther
incl
udin
g cr
oss-
bred
dog
s-
--
--
--
--
-
F
erre
t-
--
-
-
--
--
-
O
ther
car
nivo
re16
22
-
--
--
--
38
Hor
se a
nd o
ther
equ
ids
-
10
0
-
6
-
-
-
--
106
Pig
980
816
-87
11
-
-
41
-
1,93
5
Goa
t-
--
--
--
-
-
16
She
ep14
5
10
5
13
5
27
-
-27
-
-
43
9
C
attle
43
414
10
104
--
-11
-
591
Dee
r-
--
--
--
--
-
C
amel
id-
--
--
--
--
-
O
ther
ung
ulat
e-
--
--
--
--
-
(1
) Fol
low
ing
a G
over
nmen
t de
cisi
on in
199
7, p
roce
dure
s us
ing
anim
als
in re
sear
ch o
n to
bacc
o ha
ve n
ot b
een
allo
wed
.
44

Tabl
e 9
Scie
ntifi
c pr
oced
ures
(tox
icol
ogy)
by
spec
ies
of a
nim
al a
nd to
xico
logi
cal p
urpo
se, p
age
4 of
4
Gre
at B
ritai
n 20
12N
umbe
r of p
roce
dure
sSp
ecie
s of
ani
mal
Toxi
colo
gy o
r oth
er s
afet
y/ef
ficac
y ev
alua
tion
Tota
lPh
arm
aceu
tical
saf
ety/
effic
acy
eval
uatio
nO
ther
pur
pose
sS
afet
y te
stin
gE
ffica
cy
test
ing
Qua
lity
cont
rol
AD
ME
and
re
sidu
eTo
xico
logy
re
sear
chTo
bacc
o sa
fety
(1)
Med
ical
de
vice
saf
ety
Met
hod
deve
lopm
ent
Oth
er
Prim
ate
P
rosi
mia
n-
--
--
--
--
-
New
Wor
ld m
onke
y
m
arm
oset
, tam
arin
10
19
-13
-
--
-
-
42
Squ
irrel
, ow
l, sp
ider
mon
key
--
--
--
--
--
Oth
er N
ew W
orld
mon
key
--
--
--
--
--
O
ld W
orld
mon
key
Mac
aque
1,71
2
5
-
334
--
-21
7
-
2,26
8
Bab
oon
--
--
--
--
--
Oth
er O
ld W
orld
mon
key
--
--
--
--
--
A
pe
G
ibbo
n-
--
--
--
--
-
G
reat
Ape
--
--
--
--
--
Oth
er m
amm
al-
--
--
--
--
-
B
ird D
omes
tic fo
wl (
Gal
lus
dom
estic
us)
1,79
0
11,5
11
880
54
--
-10
8
39
4
15
,014
T
urke
y71
0
23
2
-
--
--
--
942
Qua
il (C
otur
nix
cotu
rnix
)-
--
--
--
--
-
Q
uail
(not
Cot
urni
x co
turn
ix)
--
--
--
--
-55
0
O
ther
bird
--
--
--
--
-1,
231
R
eptil
e - a
ny re
ptili
an s
peci
es-
--
--
--
--
-
A
mph
ibia
n - a
ny a
mph
ibia
n sp
ecie
s-
--
--
--
-4
404
Fish
- an
y fis
h sp
ecie
s10
,227
6,
191
-
1,03
9
--
-5,
318
-
34,7
10
Tota
l10
8,29
0
25
,913
12
5,90
5
21
,618
96
5
-
1,28
2
14,8
35
3,20
4
377,
049
Incr
ease
on
2011
-46,
604
2,56
015
,619
118
-1,1
80
0-9
57
-2,6
70
-723
-2
2,07
7
Per
cent
age
chan
ge fr
om 2
011
-30%
11%
14%
1%-5
5%N
/A-4
3%-1
5%-1
8%-6
%
Per
cent
age
of to
tal f
or 2
012
29%
7%33
%6%
0.3%
0.0%
0.3%
4%1%
100%
Tota
l15
4,89
423
,353
110,
286
21,5
002,
145
02,
239
17,5
053,
927
399,
126
(1) F
ollo
win
g a
Gov
ernm
ent
deci
sion
in 1
997,
pro
cedu
res
usin
g an
imal
s in
rese
arch
on
toba
cco
have
not
bee
n al
low
ed.
N/A
= N
ot a
pplic
able
45

Tabl
e 9a
Ani
mal
s us
ed (t
oxic
olog
y), b
y sp
ecie
s of
ani
mal
and
toxi
colo
gica
l pur
pose
, pag
e 1
of 4
Gre
at B
ritai
n 20
12N
umbe
r of a
nim
als
Spec
ies
of a
nim
alTo
xico
logy
or o
ther
saf
ety/
effic
acy
eval
uatio
nG
ener
al s
afet
y/ef
ficac
y ev
alua
tion
Pol
lutio
nA
gric
ultu
reIn
dust
ryH
ouse
hold
Food
add
itive
sO
ther
fo
odst
uffs
Fini
shed
co
smet
ics(
2)C
osm
etic
s in
gred
ient
s (2
)
Mam
mal
Mou
se-
4,27
5
6,99
3
-
11
4
42
-
- R
at-
10,6
28
36,3
70
-43
5
25
4
-
- G
uine
a pi
g-
--
--
--
- H
amst
er-
--
-
-
--
-
G
erbi
l-
--
--
--
- O
ther
rode
nt-
60
--
--
--
Rab
bit
-
73
2
62
5
-
--
-
-
Cat
-
-
--
--
--
Dog
B
eagl
e-
49
3
-
-36
-
-
Gre
yhou
nd-
--
--
--
-
Oth
er in
clud
ing
cros
s-br
ed d
ogs
-
-
--
--
--
Fer
ret
-
-
--
--
--
Oth
er c
arni
vore
-
-
--
--
--
Hor
se a
nd o
ther
equ
ids
-
-
-
-
--
--
Pig
-
-
--
--
--
Goa
t-
16
--
--
--
She
ep-
--
--
--
- C
attle
-
9
--
--
--
Dee
r-
--
--
--
- C
amel
id-
--
--
--
- O
ther
ung
ulat
e-
--
--
--
-(2
)Fol
low
ing
a G
over
nmen
t de
cisi
on in
199
8, p
roce
dure
s us
ing
anim
als
in re
sear
ch o
n fin
ishe
d co
smet
ics
and
on c
osm
etic
ingr
edie
nts
have
not
bee
n al
low
ed.
46

Tabl
e 9a
Ani
mal
s us
ed (t
oxic
olog
y), b
y sp
ecie
s of
ani
mal
and
toxi
colo
gica
l pur
pose
, pag
e 2
of 4
Gre
at B
ritai
n 20
12N
umbe
r of a
nim
als
Spec
ies
of a
nim
alTo
xico
logy
or o
ther
saf
ety/
effic
acy
eval
uatio
nG
ener
al s
afet
y/ef
ficac
y ev
alua
tion
Pol
lutio
nA
gric
ultu
reIn
dust
ryH
ouse
hold
Food
add
itive
sO
ther
fo
odst
uffs
Fini
shed
co
smet
ics(
2)C
osm
etic
s in
gred
ient
s (2
)
Prim
ate
P
rosi
mia
n-
--
--
--
-
New
Wor
ld m
onke
y
m
arm
oset
, tam
arin
-
-
--
--
--
Squ
irrel
, ow
l, sp
ider
mon
key
-
-
--
--
--
Oth
er N
ew W
orld
mon
key
-
-
--
--
--
Old
Wor
ld m
onke
y
M
acaq
ue-
--
--
--
-
B
aboo
n-
--
--
--
-
O
ther
Old
Wor
ld m
onke
y-
--
--
--
- A
pe
G
ibbo
n-
--
--
--
-
G
reat
Ape
-
-
--
--
--
Oth
er m
amm
al-
--
--
--
-B
ird D
omes
tic fo
wl (
Gal
lus
dom
estic
us)
-
11
4
-
-12
0
-
--
Tur
key
-
-
--
--
--
Qua
il (C
otur
nix
cotu
rni x
)-
--
--
--
- Q
uail
(not
Cot
urni
x co
turn
ix)
-
55
0
-
--
--
- O
ther
bird
-
1,
231
-
--
--
-R
eptil
e - a
ny re
ptili
an s
peci
es-
--
--
--
-A
mph
ibia
n - a
ny a
mph
ibia
n sp
ecie
s40
0
-
--
--
--
Fish
- an
y fis
h sp
ecie
s8,
150
2,
989
79
6
-
--
--
Cep
halo
pod
- Oct
opus
vul
garis
-
-
--
--
--
Tota
l8,
550
20
,653
44
,787
-
669
332
-
-
(2)F
ollo
win
g a
Gov
ernm
ent
deci
sion
in 1
998,
pro
cedu
res
usin
g an
imal
s in
rese
arch
on
finis
hed
cosm
etic
s an
d on
cos
met
ic in
gred
ient
sha
ve n
ot b
een
allo
wed
.
47

Tabl
e 9a
Ani
mal
s us
ed (t
oxic
olog
y), b
y sp
ecie
s of
ani
mal
and
toxi
colo
gica
l pur
pose
, pag
e 3
of 4
Gre
at B
ritai
n 20
12N
umbe
r of a
nim
als
Spec
ies
of a
nim
alTo
xico
logy
or o
ther
saf
ety/
effic
acy
eval
uatio
nTo
tal
Phar
mac
eutic
al s
afet
y/ef
ficac
y ev
alua
tion
Oth
er p
urpo
ses
Saf
ety
test
ing
Effi
cacy
te
stin
gQ
ualit
y co
ntro
lA
DM
E a
nd
resi
due
Toxi
colo
gy
rese
arch
Toba
cco
safe
ty (1
)M
edic
al
devi
ce s
afet
yM
etho
d de
velo
pmen
tO
ther
Mam
mal
Mou
se31
,525
6,
299
11
7,24
0
9,
905
56
1
-
1,08
0
4,65
9
1,14
7
183,
840
Rat
47,3
07
148
1,22
2
9,21
5
393
--
2,97
5
1,49
0
110,
437
Gui
nea
pig
4,81
3
-3,
379
-
--
-60
-
8,25
2
Ham
ster
900
-12
72
-
--
--
984
Ger
bil
--
--
--
--
--
Oth
er ro
dent
--
--
--
--
110
170
Rab
bit
3,51
8
9
1,
729
23
-
-17
5
34
44
6,
889
C
at-
--
--
--
--
-
D
og
Bea
gle
2,43
5
42
4
18
2
-
--
61
-
2,
812
Gre
yhou
nd-
-
-
--
--
--
-
Oth
er in
clud
ing
cros
s-br
ed d
ogs
--
-
-
--
--
--
Fer
ret
--
--
--
--
--
Oth
er c
arni
vore
12
15
--
-
-
--
-
27
H
orse
and
oth
er e
quid
s-
87
-6
--
--
-
93
P
ig95
2
80
0
-
51
11
--
31
-1,
845
G
oat
--
--
--
--
-16
S
heep
135
105
133
27
--
27
--
427
Cat
tle43
38
1
10
10
4
-
--
11
-55
8
D
eer
--
--
--
--
--
Cam
elid
--
--
--
--
--
Oth
er u
ngul
ate
--
--
--
--
-
-
(1)F
ollo
win
g a
Gov
ernm
ent d
ecis
ion
in 1
997,
pro
cedu
res
usin
g an
imal
s in
rese
arch
on
toba
cco
have
not
bee
n al
low
ed.
48

Tabl
e 9a
Ani
mal
s us
ed (t
oxic
olog
y), b
y sp
ecie
s of
ani
mal
and
toxi
colo
gica
l pur
pose
, pag
e 4
of 4
Gre
at B
ritai
n 20
12N
umbe
r of a
nim
als
Spec
ies
of a
nim
alTo
xico
logy
or o
ther
saf
ety/
effic
acy
eval
uatio
nTo
tal
Phar
mac
eutic
al s
afet
y/ef
ficac
y ev
alua
tion
Oth
er p
urpo
ses
Saf
ety
test
ing
Effi
cacy
te
stin
gQ
ualit
y co
ntro
lA
DM
E a
nd
resi
due
Toxi
colo
gy
rese
arch
Toba
cco
safe
ty (1
)M
edic
al
devi
ce s
afet
yM
etho
d de
velo
pmen
tO
ther
Prim
ate
P
rosi
mia
n-
--
--
--
--
-
New
Wor
ld m
onke
y
m
arm
oset
, tam
arin
-
-
-7
--
--
-
7
Squ
irrel
, ow
l, sp
ider
mon
key
--
--
--
--
--
Oth
er N
ew W
orld
mon
key
--
--
--
--
--
Old
Wor
ld m
onke
y
M
acaq
ue1,
539
3
-10
5
-
--
130
-1,
777
B
aboo
n-
--
--
--
--
-
O
ther
Old
Wor
ld m
onke
y-
--
--
--
--
-
A
pe
G
ibbo
n-
--
--
--
--
-
G
reat
Ape
--
--
--
--
--
Oth
er m
amm
al-
--
--
--
--
-
B
ird D
omes
tic fo
wl (
Gal
lus
dom
estic
us)
1,79
0
11,5
11
88
0
54
--
-10
8
39
4
14
,971
T
urke
y71
0
23
2
-
--
--
--
942
Qua
il (C
otur
nix
cotu
rni x
)-
--
--
--
--
-
Q
uail
(not
Cot
urni
x co
turn
ix)
--
--
--
--
-55
0
O
ther
bird
--
--
--
--
-1,
231
R
eptil
e - a
ny re
ptili
an s
peci
es-
--
--
--
--
-
A
mph
ibia
n - a
ny a
mph
ibia
n sp
ecie
s-
--
--
--
-4
404
Fish
- an
y fis
h sp
ecie
s10
,227
6,
191
-
1,03
9
--
-5,
318
-
34,7
10
Cep
halo
pod
- Oct
opus
vul
garis
--
--
--
--
--
Tota
l10
5,90
6
25
,823
12
4,60
9
20
,790
96
5
-
1,28
2
13,3
87
3,18
9
370,
942
(1)F
ollo
win
g a
Gov
ernm
ent
deci
sion
in 1
997,
pro
cedu
res
usin
g an
imal
s in
rese
arch
on
toba
cco
have
not
bee
n al
low
ed.
49

Tabl
e 10
Sci
entif
ic p
roce
dure
s (to
xico
logy
) by
spec
ies
of a
nim
al a
nd ty
pe o
f leg
isla
tion
Sum
mar
y ve
rsio
nN
ote.
For
num
bers
of p
roce
dure
s by
pur
pose
, see
full
tabl
e av
aila
ble
on th
e w
ebsi
te
Gre
at B
ritai
n 20
12N
umbe
r of p
roce
dure
sSp
ecie
s of
ani
mal
UK
requ
irem
ents
on
lyO
ne E
U c
ount
ry
only
(not
UK
)E
U re
quire
men
ts,
incl
. Eur
opea
n P
harm
acop
oeia
Req
uire
men
ts o
f (n
on-E
U) C
ounc
il of
Eur
ope
Req
uire
men
ts o
f ot
her c
ount
ries
Any
com
bina
tion
of le
gisl
ativ
e re
quire
men
ts
Non
-legi
slat
ive
purp
oses
Tota
l
Mam
mal
Mou
se41
1
-
6,24
3
-
9,
796
163,
220
4,
374
184,
044
R
at16
9
-5,
661
-11
0
101,
072
4,
515
111,
527
A
ll ot
her r
oden
ts67
-95
5
-34
2
8,04
2
-
9,
406
Rab
bit
112
-
3,19
7
-
48
6,
314
317
9,
988
Cat
-
-
-
-
-
-
-
-
Dog
-
-
42
-
-
3,
617
139
3,
798
Fer
ret
--
--
--
--
O
ther
car
nivo
re38
--
--
--
38
Hor
se a
nd o
ther
equ
ids
-
-
41
-
-
65
-
106
P
igs,
she
ep &
all
othe
r ung
ulat
es-
-
1,
141
-
3
1,
745
92
2,
981
Prim
ate
N
ew W
orld
mon
key
--
--
-42
-42
O
ld W
orld
mon
key
--
--
-2,
200
68
2,
268
All
othe
r mam
mal
s-
-
--
--
--
B
ird-
-2,
366
-1,
005
14,1
62
204
17
,737
R
eptil
e / A
mph
ibia
n-
-
--
-40
4
-
404
Fi
sh1,
386
-5,
403
-53
4
13,2
30
14,1
57
34,7
10
Tota
l 2,
183
-
25,0
49
-
11,8
38
314,
113
23
,866
37
7,04
9
Incr
ease
on
2011
-1,0
88
-1,5
62
-2,3
53
-46
9,29
815
,492
-41,
818
-22,
077
Per
cent
age
chan
ge fr
om 2
011
-33%
-100
%-9
%N
/A36
6%5%
-64%
-6%
Per
cent
age
of to
tal f
or 2
012
1%0.
0%7%
0.0%
3%83
%6%
100%
2011
Tot
als
3,27
11,
562
27,4
0246
2,54
029
8,62
165
,684
399,
126
N/A
= N
ot a
pplic
able
50
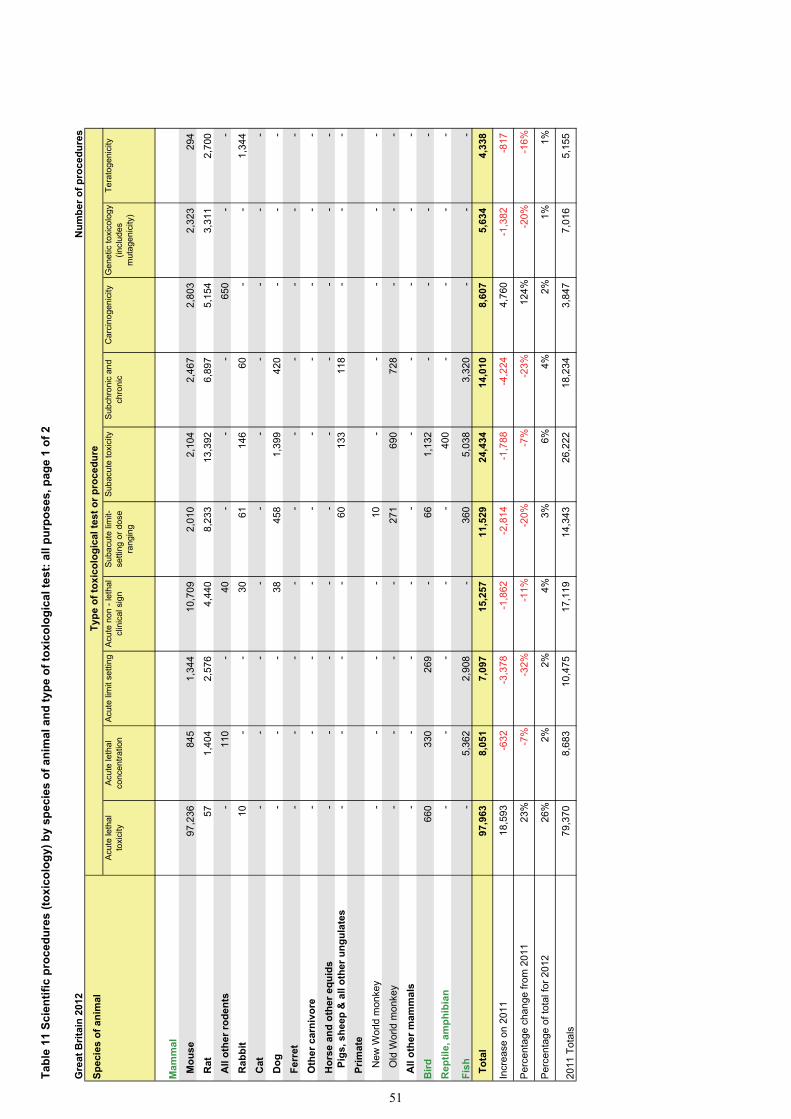
Tabl
e 11
Sci
entif
ic p
roce
dure
s (to
xico
logy
) by
spec
ies
of a
nim
al a
nd ty
pe o
f tox
icol
ogic
al te
st: a
ll pu
rpos
es, p
age
1 of
2
Gre
at B
ritai
n 20
12N
umbe
r of p
roce
dure
s
Spec
ies
of a
nim
alTy
pe o
f tox
icol
ogic
al te
st o
r pro
cedu
reA
cute
leth
alto
xici
tyA
cute
leth
alco
ncen
tratio
nA
cute
lim
it se
tting
Acu
te n
on -
leth
al
clin
ical
sig
nS
ubac
ute
limit-
setti
ng o
r dos
e ra
ngin
g
Sub
acut
e to
xici
tyS
ubch
roni
c an
d ch
roni
cC
arci
noge
nici
tyG
enet
ic to
xico
logy
(in
clud
es
mut
agen
icity
)
Tera
toge
nici
ty
Mam
mal
Mou
se97
,236
84
5
1,
344
10
,709
2,
010
2,
104
2,
467
2,
803
2,
323
29
4
Rat
57
1,40
4
2,57
6
4,44
0
8,23
3
13,3
92
6,89
7
5,15
4
3,31
1
2,70
0
All
othe
r rod
ents
-11
0
-
40
--
-65
0
-
-
Rab
bit
10
--
30
61
146
60
--
1,34
4
Cat
--
--
--
--
--
Dog
--
-38
45
8
1,
399
42
0
-
--
Fer
ret
--
--
--
--
--
Oth
er c
arni
vore
--
--
--
--
--
Hor
se a
nd o
ther
equ
ids
-
-
--
--
--
--
P
igs,
she
ep &
all
othe
r ung
ulat
es-
-
-
-
60
13
3
11
8
-
--
Prim
ate
N
ew W
orld
mon
key
--
--
10
--
--
-
O
ld W
orld
mon
key
--
--
271
690
728
--
-
All
othe
r mam
mal
s-
--
--
--
--
-
Bird
660
330
269
-66
1,
132
-
--
-
Rep
tile,
am
phib
ian
-
-
--
-40
0
-
--
-
Fish
-5,
362
2,
908
-
360
5,03
8
3,32
0
--
- T
otal
97,9
63
8,05
1
7,09
7
15,2
57
11,5
29
24,4
34
14,0
10
8,60
7
5,63
4
4,33
8
Incr
ease
on
2011
18,5
93-6
32
-3,3
78
-1,8
62
-2,8
14
-1,7
88
-4,2
24
4,76
0-1
,382
-8
17
Per
cent
age
chan
ge fr
om 2
011
23%
-7%
-32%
-11%
-20%
-7%
-23%
124%
-20%
-16%
Per
cent
age
of to
tal f
or 2
012
26%
2%2%
4%3%
6%4%
2%1%
1%
2011
Tot
als
79,3
70
8,68
3
10,4
75
17,1
19
14,3
43
26,2
22
18,2
34
3,84
7
7,01
6
5,15
5
51

Tabl
e 11
Sci
entif
ic p
roce
dure
s (to
xico
logy
) by
spec
ies
of a
nim
al a
nd ty
pe o
f tox
icol
ogic
al te
st: a
ll pu
rpos
es, p
age
2 of
2
Gre
at B
ritai
n 20
12N
umbe
r of p
roce
dure
s
Spec
ies
of a
nim
alTy
pe o
f tox
icol
ogic
al te
st o
r pro
cedu
reTo
tal
Oth
er re
prod
uctiv
e to
xici
tyIn
eye
sFo
r ski
n Irr
itatio
nFo
r ski
n se
nsiti
satio
nTo
xico
kine
tics
Pyr
ogen
icity
Bio
com
patib
ility
Enz
yme
indu
ctio
n fo
r in
vitro
test
sIm
mun
otox
icol
ogy
Oth
er to
xico
logy
Mam
mal
Mou
se1,
092
-
115
982
6,68
9
-70
0
-
7,64
1
44,6
90
184,
044
Rat
40,0
44
--
-8,
072
-
-14
8
29
0
14
,809
11
1,52
7
A
ll ot
her r
oden
ts-
--
-72
-
--
-8,
534
9,
406
R
abbi
t15
6
71
2
59
5
-
8
4,
655
23
6
-
-1,
975
9,
988
C
at-
--
--
--
--
-
-
Dog
82
--
-27
8
-
--
-1,
123
3,
798
F
erre
t-
--
--
--
--
--
Oth
er c
arni
vore
--
--
--
--
-38
38
H
orse
and
oth
er e
quid
s-
--
-6
--
--
100
106
Pig
s, s
heep
& a
ll ot
her u
ngul
ates
--
--
125
-63
-
-2,
482
2,
981
P
rimat
e
New
Wor
ld m
onke
y-
--
-6
--
-
-
26
42
O
ld W
orld
mon
key
--
--
202
--
--
377
2,26
8
All
othe
r mam
mal
s-
--
--
--
--
--
Bird
456
--
-12
7
-
--
-14
,697
17
,737
R
eptil
e, a
mph
ibia
n-
--
--
--
--
4
40
4
Fish
885
--
-37
8
-
-
-
-16
,459
34
,710
T
otal
42,7
15
712
710
982
15,9
63
4,65
5
999
148
7,93
1
105,
314
377,
049
Incr
ease
on
2011
6,23
620
-391
-3
72
-3,8
73
374
358
-114
-5
,196
-2
5,57
5 -2
2,07
7
Per
cent
age
chan
ge fr
om 2
011
17%
3%-3
6%-2
7%-2
0%9%
56%
-44%
-40%
-19.
5%-6
%
Per
cent
age
of to
tal f
or 2
012
11%
0.2%
0.2%
0.3%
4%1%
0.3%
0.0%
2%28
%10
0%
2011
Tot
als
36,4
79
692
1,10
1
1,35
4
19,8
36
4,28
1
641
262
13,1
27
130,
889
399,
126
52

Appendix A General system of control under the Animals (Scientific Procedures) Act 1986. Introduction
1. The Animals (Scientific Procedures) Act 1986 puts into effect a rigorous system of controls on scientific work on living animals, including the need for: both the researcher and the project to be separately licensed; stringent safeguards on animal pain and suffering; and general requirements to ensure the care and welfare of animals. The Act implements, and in some ways exceeds, the requirements of European Union Directive 86/609/EEC.
2. Operation of the Act is a reserved issue in Great Britain, the Home Office
administering the legislation in England, Scotland and Wales. The Act is separately administered in Northern Ireland.
Scope of the Act
3. The 1986 Act controls any experimental or other scientific procedure applied to a ‘protected animal’ which may have the effect of causing that animal pain, suffering, distress or lasting harm. Such work is referred to in the Act as a ‘regulated procedure’.
4. ‘Protected animals’ are defined as all living vertebrate animals, except man, plus one
invertebrate species, Octopus vulgaris. The definition extends to fetal, larval or embryonic forms that have reached specified stages in their development.
5. Under the Act an animal is regarded as ‘living’ until “the permanent cessation of
circulation or complete destruction of its brain”. Procedures carried out on decerebrate animals are also subject to the controls of the Act.
6. The definition of a regulated procedure encompasses most breeding of animals with
genetic defects; production of antisera and other blood products; the maintenance and passage of tumours and parasites; and the administration for a scientific purpose of an anaesthetic, analgesic, tranquilliser or other drug to dull perception. Killing an animal requires licence authority in certain circumstances.
7. The controls of the 1986 Act do not extend to procedures applied to animals in the course
of recognised veterinary, agricultural or animal husbandry practice; procedures for the identification of animals for scientific purposes, if this causes no more than momentary pain or distress and no lasting harm; or the administration of a novel veterinary product under authority of an Animal Test Exemption Certificate (issued under the Medicines Act 1968).
8. Two kinds of licence are required for all work controlled by the Act. The procedures must
be part of a programme of work authorised by a project licence and the person applying the regulated procedures must hold a personal licence. No work may be done unless the procedure, the animals used and the place where the work is to be done are specifically authorised in both project and personal licences.
Personal licences
9. A personal licence is the Home Secretary’s endorsement that the holder is a suitable and competent person to carry out specified procedures on specified animals, under
53

supervision where necessary. Applicants must be over 18 and are required to give details of their qualifications, training and experience. Those who have not previously held a Home Office licence need the endorsement of a sponsor (usually a personal licence holder in a senior position at the applicant’s place of work). Satisfactory completion of an accredited training course is also required before a personal licence is issued.
10. On 31 December 2012 there were 14,875 active personal licences. Personal licences
continue to be in force until revoked but they must be reviewed at least every five years.
Project licences
11. A project licence is granted when the Home Secretary considers that the use of living animals in a programme of work, for a purpose permitted by the Act, is justified and the methods proposed appropriate.
12. In deciding whether and on what terms to authorise the project, the likely adverse effects
on the animals used must be weighed against the potential benefits (to humans, other animals or the environment) which are expected to accrue from the work. Adequate consideration must also have been given to the feasibility of using alternative methods not involving living animals.
13. The holder of a project licence undertakes overall responsibility for the scientific direction
and control of the work. New project licence applicants are required to complete an accredited training course before the licence is granted.
14. When making an application for a project licence the applicant nominates, and the
Home Office assigns, an overall severity banding to the project. There are three main severity bandings: mild, moderate and substantial. A fourth band, unclassified, is used for procedures where the animals are decerebrate or used under terminal anaesthesia – i.e. the animal is anaesthetised before the procedure starts, is kept anaesthetised throughout the course of the procedure and is killed without recovering consciousness.
15. The severity band depends not only upon the amount of suffering caused but also the
duration, the number of animals and what action is taken to reduce suffering, such as the use of anaesthesia or early end-points. The overall severity is used in weighing the likely adverse effects on the animals against the benefits likely to accrue, as required by section 5(4) of the Act.
16. The following table details the number of project licences which were active on 31
December 2012, the number granted during 2012 and the number revoked during 2012 (usually either at the licence holder’s request or because the licence had run the maximum allowed term of five years). The total figures are subdivided into severity bandings.
54

Project licences by severity band – number and share of total, 2012 Severity band
In force on 31 December 2012
Granted during 2012 Revoked during 2012
Number % Number % Number % Mild 969 36% 239 38% 197 38% Moderate 1647 61% 366 58% 306 59% Substantial 56 2% 9 1% 9 2% Unclassified 45 2% 13 2% 10 2% Total 2717 627 522 NB Percentages may not sum to 100 due to rounding. Designation of premises
17. Except where otherwise authorised in a project licence (e.g. for field work at a specified place and time), any place where work is carried out under the Act must be designated as a scientific procedure establishment. Since January 1990 establishments that breed certain types of animal listed in Schedule 2 of the Act – mice, rats, guinea pigs, hamsters, rabbits, dogs, cats and primates – for use in scientific procedures (‘breeding establishments’), and establishments that obtain such animals from elsewhere and supply them to laboratories (‘supplying establishments’) must hold a certificate of designation.
18. Quail (Coturnix coturnix) was added to the list of species specified in Schedule 2 of the
Act in 1993, and ferrets, gerbils, genetically modified pigs and genetically modified sheep were added to the list in 1999. Designated establishments are required to nominate a person to be responsible for the day-to-day care of animals and a veterinary surgeon to advise on their health and welfare.
19. There were 176 certificates of designation in force on 31 December 2012. Of these, 175
were registered as user establishments, 114 as breeding establishments and 65 as supplying establishments. These figures add up to more than the total number of establishments because a single establishment may fall into more than one of the categories: for example, an establishment may be registered as both a breeder and user of animals.
55

Tab
le 1
9 Pr
ojec
t lic
ence
s and
scie
ntifi
c pr
oced
ures
by
type
of d
esig
nate
d es
tabl
ishm
ent
Gre
at B
ritai
n 20
12
Type
of d
esig
nate
d es
tabl
ishm
ent
Num
ber o
f lic
ence
hol
ders
(1) re
porti
ng c
ount
able
(2)pr
oced
ures
,
by n
umbe
r of p
roce
dure
s rep
orte
dLi
cens
ees
Num
ber o
fPr
oced
ures
Num
ber o
f pro
cedu
res r
epor
ted
Tota
l
repo
rting
no
n- li
cenc
e ho
lder
s(1)
Tota
lTo
tal
Percentage
1 to
5
051
to 1
0010
1 to
20
020
1 to
40
040
1 to
60
060
1 to
80
080
1 to
1,
000
Mor
e th
an
1,00
0
coun
tabl
e(2)
proc
edur
es
only
repo
rting
no
proc
edur
eslic
ense
es
Publ
ic h
ealth
labo
rato
ries
111
12
3-
-
4
22
2
4
28
14,1
67
0%
Uni
vers
ities
, med
ical
scho
ols
383
208
240
295
157
109
9145
11,
934
9
52
4
2,
467
1,
967,
030
48%
NH
S ho
spita
ls2
34
52
1-
623
-
5
28
21
,882
1%
Gov
ernm
ent d
epar
tmen
ts28
78
93
14
1272
-
26
98
79,5
98
2%
Oth
er p
ublic
bod
ies
2811
1217
912
375
167
2
57
226
549,
463
13%
Non
-pro
fit-m
akin
g or
gani
satio
ns19
118
88
34
4710
8
-
18
12
6
35
2,04
3
9%
Com
mer
cial
org
anis
atio
ns36
1217
2520
118
8821
72
4726
6
1,
125,
845
27%
Tota
l50
725
329
036
120
213
711
068
32,
543
15
681
3,23
9
4,11
0,02
8
100%
(1)
Som
e lic
ence
-hol
ders
hol
d m
ore
than
one
lice
nce;
thes
e fig
ures
are
com
pile
d by
num
bers
of p
roje
ct li
cenc
es, n
ot b
y nu
mbe
rs o
f act
ual l
icen
ce-h
olde
rs.
(2) O
nly
proc
edur
es o
n ad
ult o
r fre
e-liv
ing
anim
als (
incl
udin
g ne
onat
al a
nd ju
veni
le m
amm
als,
and
new
ly-h
atch
ed b
irds)
are
cou
nted
.
D
etai
ls o
f pro
cedu
res o
n im
mat
ure
form
s (e.
g. la
rvae
, em
bryo
s) a
re c
olle
cted
but
not
cou
nted
.
Ani
mal
s in
the
wild
invo
lved
in ro
dent
icid
e tri
als a
re a
lso
not c
ount
ed.
Det
ails
(if a
pplic
able
) are
giv
en in
the
Com
men
tary
.
56


Published by TSO (The Stationery Office) and available from:
Mail, telephone, fax and emailTSO PO Box 29, Norwich NR3 1GN Telephone orders/general enquiries: 0870 600 5522 Order through the Parliamentary Hotline Lo-Call 0845 7 023474 Fax orders: 0870 600 5533 Email: [email protected] Textphone: 0870 240 3701
12 Bridge Street, Parliament Square, London SW1A 2JX Telephone orders/general enquiries: 020 7219 3890 Fax orders: 020 7219 3866 Email: [email protected] Internet: http://www.bookshop.parliament.uk
www.tsoshop.co.ukOnline
The Houses of Parliament Shop
TSO@Blackwell and other accredited agents
ISBN 978 1 78246 170 8