Embed Size (px)
Citation preview
ANNUAL SURVEY CONCERNING . . . .
COMPETITIVE CONDITIONS IN THE STEEL INDUSTRY AND INDUSTRY EFFORTS TO ADJUST AND 'MODERNIZE
Report to the Pre•ld~ on lnvMtlgatlon. ~- 332-201. Under Section 332 of the · Tariff Act of 11·ao ·
USITC PUBLICATION 2019
SEPTEMBER 1987
United States International Trade Commission I Washington, DC 20436
UNITED STATES INTERNATIONAL TRADE COMMISSION
COMMISSIONERS.
Susan Liebeler, Chairman Anne E. Brunsdale, Vice Chairman
Alfred E. Eckes Seeley G. Lodwick
David B. Rohr
This report was prepared principally by:
Peter Avery James Brandon
Laszlo Boszormenyi Nancy Fulcher
Norbert Gannon James Lukes
Mark Paulson Ann Reed
Anna Mae Toth Therese Palmer Weise
Minerals & Metals Division
Off ice of Industries Erland Heginbotham, Director
Address all communications to Kenneth R. Mason, Secretary to the Commission
United States International Trade Commission Washington, DC 20436
Hote.--The whole of the Commission's report to the President may not be made public since it contains certain information that has been classified by the United States Trade Representative or would result in the disclosure of the operations of individual concerns. This published report is the same as the report to the President, except that the above-mentioned information has been omitted (as indicated by asterisks) or combined with data from related product categories to ensure confidentiality.

.!
PREFACE
On Karch 8, 1985, the United States International Trade Commission
instituted investigation No. 332-209, Annual Surveys Concerning Competitive
Conditions in the Steel Industry and Industry Efforts to Adjust and
·Modernize. The investigation, conducted under section 332(g) of the Tariff
Act of 1930 (19 u.s.c. 1332(g)), is in response to a request from the United
States Trade Representative, at the direction of the President Capp. A).
This report is the third in a 5-year annual series that reports on
competitive conditions in the steel industry and industry efforts to adjust
and modernize. The survey compares the period July 1, 1986-June 30, 1987,
with the 12-month period ending June 30, 1986. The data in the report cover
U.S. producers• capacity, production, and shipments, as well as certain
financial and employment information for 22 carbon and specialty steel
products. Also presented in the report are data on U.S. producers• and
importers' prices, as well as data on unfilled orders and inventories of the
subject products.
In addition to the reported data, the report provides certain information
for the 12-month period ending September 30, 1987 on: (1) the extent to which
the major companies of the industry have committed, or will have committed,
their net cash flow from steel product operations for purposes of reinvestment
in, and modernization of, the steel industry; (2) actions taken by the major
companies to maintain international competitiveness, and (3) the extent to
which each of the major companies has committed, or will have committed,

ii
not less than one percent of net cash flow to the retraining of workers.
Information on world steel pricing, labor issues, and financial developments
is also provided.
Notice of the investigation was given by posting copies of the notice of
investigation at the Office of the Secretary, U.S. International Trade
Commission, and by publication of the notice in the Federal Register of
March 20, 1985 Capp. B).
The Conunission collected data and information ·from questionnaires sent to
raw steel producers and selected importers of the carbon and alloy steel
products subject to the investigation. Producers accounting for approximately
96 percent of U.S. raw steel production during July 1, 1986-June 30, 1987, and
importers accounting for approximately 41 percent of imports of the subject
products submitted data to the Commission. The producers which responded to
the Commission's questionnaire are, with few exceptions, the same companies
which responded to the previous survey; data are therefore generally
comparable. Tables from the second survey which contain revised data appear
in Appendix H.
The information and analysis in this report are for the purpose of this
report only. Nothing in this report should be construed to indicate how the
commission would find in an investigation conducted under other statutory
authority covering the same or similar matter.
iii
C 0 N T E N T S
Preface------------------------------------------------------------------- i Executive Summary--------------------------------------------------------- ix Conditions and adjustment in the steel industry:
Industry conditions: Highlights------------------------------------------------------ 1 U.S. producers' capacity, production, and capacity utilization:
Carbon and certain alloy steel------------------------------ 4 Certain stainless and alloy tool steel---------------------- 4
U.S. producers' shipments: Carbon and certain alloy steel------------------------------ 6 Certain stainless and alloy tool steel---------------------- 6
U.S. producers' and U.S. importers' unfilled orders and inventories, and U.S. importers' imports:
Carbon and certain alloy steel------------------------------ 8 Certain stainless and alloy tool steel---------------------- 8
Labor conditions------------------------------------------------ 11 Survey results----------------------------------~----------- 11 Employment trends in the United States---------------------- 13 International comparisons----------------------------------- 13
Labor negotiations---------------------------------------------- 16 Issues------------------------------------------------------ 20 Review of settlements--------------------------------------- 22
Armco Inc.---------------------------------------------- 22 Bethlehem Steel Corporation----------------------------- 23 Inland Steel Corporation-------------------------------- 24 usx Corporation----------------------------------------- 24
Steel labor topics------------------------------------------ 25 Comparative labor costs in integrated mills, specialty
steel mills------------------------------------------- 25 Reconstituted steel mills------------------------------- 27 Pension liabilities------------------------------------- 29 Contracting out----------------------------------------- 32 Labor/management relationships-------------------.:...______ 34
U.S. producers' capital expenditures and research and development expenditures:
Carbon and certain alloy steel------------------------------ 37 Certain stainless and alloy tool steel---------------------- 38
Financial experience of U.S. producers-------------------------- 40 Carbon and certain alloy steel------------------------------ 45 Certain stainless and alloy tool steel---------------------- 46
Steel pricing--------------------------------------------------- 47 Steel price index trends in the United States, Japan,
Canada, and West Germany---------------------------------- 48 International pricing developments-------------------------- 48
United States--------------~---------------------------- 52 Sheet products-------------------------------------- 57 Wire rod-------------------------------------------- 58 Plate----------------------------------------------- 59
iv
CONTENTS
Bar products---------------------------------------- 61 Oil country tubular goods--------------------------- 62 Specialty products-------------------~-------------- 62
Japan--------------------------------------------------- 64 Canada------------------~------------------------------- 65 European Community-------------------------------------- 66
Actions to adjust and modernize, other than capital expenditures----- 67 Investment in activities other than steel---------------------------- 68
Acme Steel Co.-------------------------------------------------- 68 Armco, Inc.----------------------------------------------------- 69 Bethlehem Steel Corp.------------------------------------------- 69 Inland Steel co.------------------------------------------------ 69 Lukens Inc.------~---------------------------------------------- 69 The Timken Company---------------------------------------------- 70 USX------------------------------------------------------------- 70
Cash flow, cash flow commitments, and adjustment of major companies: Net cash flow, cash flow commitments, and expenditures for the
retraining of workers: Cash flow commitments------------------------------------------- 71 Worker retraining----------------------------------------------- 71 Armco , Inc . :
Cash flow commitments--------------------------------------- 76 Worker retraining------------------------------------------- 76
Bethlehem Steel Corp.: Cash flow commitments--------------------------------------- 77 Worker retraining------------------------------------------- 78
Inland Steel Co.: Cash flow commitments---------------------------------------- 79 Worker retraining-------------------------------------------- 80
LTV Steel Co.: Cash flow commitments---------------------------------------- 81 Worker retraining-------------------------------------------- 82
National Steel Corp.: Cash flow commitments---------------------------------------- 82 Worker retraining-------------------------------------------- 83
Nucor Corp. : Cash flow commitments---------------------------------------- 85 Worker retraining-------------------------------------------- 85
Rouge Steel Co. : Cash flow commitments---------------------------------------- 86 Worker retraining-------------------------------------------- 86
USX Corp.: Cash flow commitments---------------------------------------- 88 Worker retraining-------~------------------------------------ 88
V.
CONTENTS
Weirton steel Corp.: Cash flow commitments--------------------------------------- 89 Worker retraining------------------------------------------- 90
Wheeling-Pittsburgh Steel Corp.: Cash flow commitments-------~------------------------------- 91 Worker retraining------------------------------------------- 91
Actions taken to maintain international competitiveness-------------- 92 Armco, Inc.----------------------------------------------------- 93 Bethlehem Steel Corp.------------------------------------------- 93 Inland Steel Co.------------------------------------------------ 94 LTV Steel Co.--------------------------------------------------- 95 National Steel Corp.-------------------------------------------- 96 Nucor Corp.------~--~------------------------------------------- 97 Rouge Steel Co.------------------------------------------------- 97 USX Corp.------------------------------------------------------- 98 Weirton Steel Corp.--------------------------------------------- 99 Wheeling-Pittsburgh Steel Corp.--------------------------------- 100
Appendix A. Copy of letter to Chairwoman Paula Stern from Ambassador William E. Brock, United States Trade Representative, requesting an investigation----------------------------------------------------------- 103
Appendix B. Notice of the Commission's investigation--------------------- 111 Appendix c. Definition of certain terms, and description of the products
subject to the investigation-------------------------------------------- 117 Appendix D. statistical tables, July 1, 1986-June 30, 1987--------------- 125 Appendix E. Specifications of the products referenced in pricing section- 135 Appendix F. Description of actions taken by the steel industry to
adjust and modernize---------------------------------------------------- 139 Appendix G. Description of actions taken by major companies to maintain
international competitiveness------------------------------------------- 153 Appendix H. Revised statistical tables, July 1, 1985-June 30, 1986------- 179
Figures
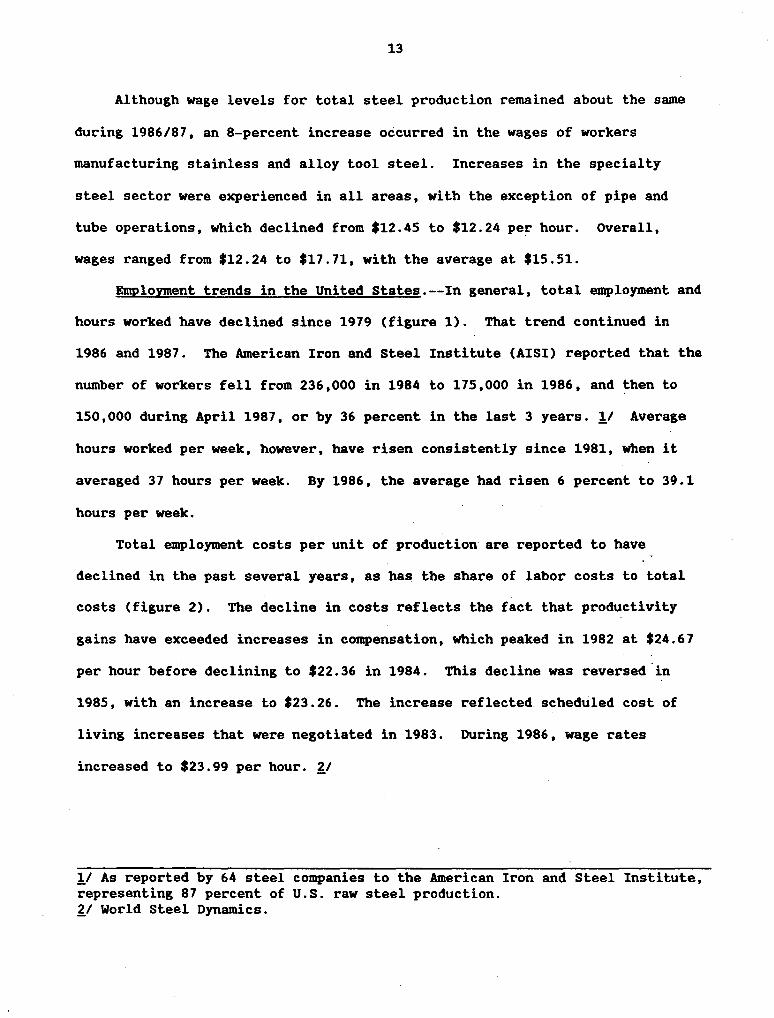
1. Iron and steel average employment: Number employees and hours worked------------------------------------------------------------- 14
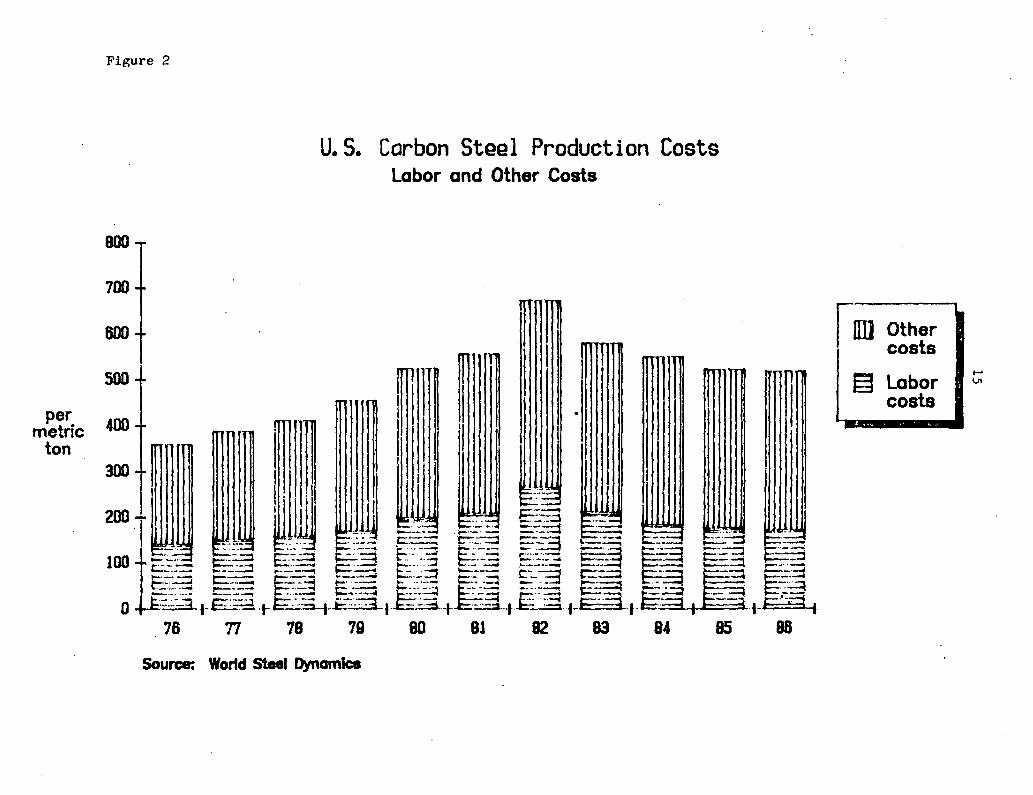
2. U.S. carbon steel production costs: Labor and total costs----------- 15 3. Compensation in the steel industry: U.S. and selected foreign
countries---------------------------------------------------------- 17 4. U.S. carbon steel industry: Indexes of output, employee hours, and
output per employee hour------------------------------------------- 18 5. Steel price indexes in selected countries, January-September 1986---- 49 6. Steel price indexes in selected countries, adjusted for exchange
rate changes January-September 1986-------------------------------- 50
vi
CONTENTS
Tables
1. Certain carbon and alloy steel: Changes in U.S. producers' reported capacity and production, and capacity utilization, by selected operations, July 1, 1985-June 30, 1986 (1985/86) and July 1, 1986-June 30, 1987 (1986/87)-------------------------------------------- 5
2. Certain carbon and alloy steel: U.S. producers' shipments of selected products, and the unit value of those shipments, July 1, 1985-June 30, 1986 (1985/86) and July 1, 1986-June 30, 1987 (1986/87)-------------------------------------------- 7
3. Certain carbon and alloy steel: U.S. producers' and U.S. importers' ratios of inventories to unfilled orders as of June 30, 1986 and June 30, 1987------------------------------------------------------ 9
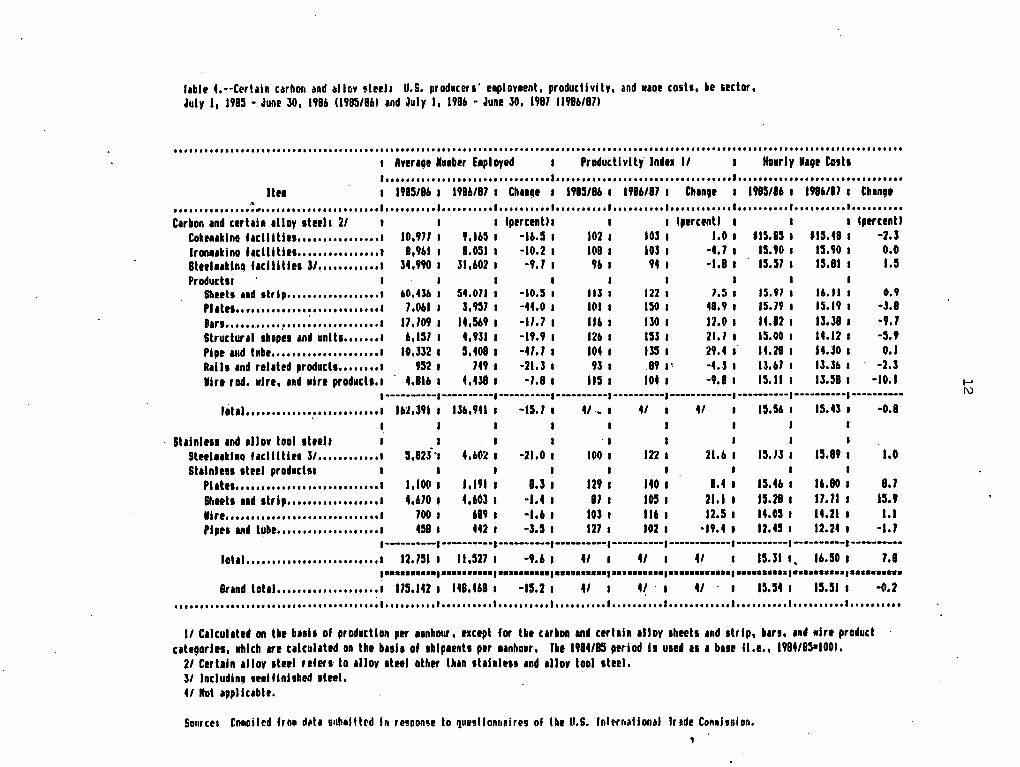
4. Certain carbon and alloy steel: U.S. producers' employment, productivity, and wage costs, by sector, July 1, 1985-June 30, 1986 (1985/86) and July 1, 1986-June 30, 1987 (1986/87)----------------- 12
5. Certain carbon and alloy steel: U.S. producers' capital expenditures and research and development expenditures, July 1, 1985-June 30, 1986 (1985/86) and July 1, 1986-June 30, 1987 (1986/87)--- 39
6. Certain carbon and alloy steel: Total net sales, and net profits and losses as a percentage of sales, by selected product, July 1, 1985-June 30, 1986 (1985/86) and July 1, 1986-June 30, 1987 (1986/87)--- 41
7. Moody's bond ratings of selected U.S. steel producers, 1980-87------- 42 8. Certain carbon and alloy steel: Weighted average net prices for the
three largest sales shipped by u.s~ producers and importers, of selected products, by specified periods---------------------------- 56
9. Calculation of major companies' net cash flow from steel product operations, October 1, 1986-June 30, 1987-------------------------- 72
10. Calculation of major companies' net cash flow from steel product operations, October 1, 1985-September 30, 1986--------------------- 72
11. Major U.S. steel companies: Net cash flow from steel product operations, steel related expenditures, and working capital, October 1, 1986-June 30, 1987-------------------------------------- 75
12. Major U.S. steel companies: Net cash flow from steel product operations, steel related expenditures, and working capital, October 1, 1985-September 30, 1986--------------.------------------- 76
D-1. Certain carbon and alloy steel: U.S. producers' capacity, changes in capacity, production, and capacity utilization, July 1, 1986-June 30, 1987------------------------------------------------------ 126
D-2. Certain carbon and alloy steel: U.S. producers' shipments, unfilled orders, and inventories, and U.S. importers' imports, unfilled orders, and inventories, July 1, 1986-June 30, 1987------- 127
D-3. Certain carbon and alloy steel: U.S. imports for consumption, by product, June 1984-May 1985, June 1985-May 1986, and June 1986-May 1987-------------------~----------------------------- 128
vii
CONTENTS
D-4. Average number of production and related workers employed in U.S. establishments producing certain carbon and alloy steel and hours worked by, wages paid to, and productivity of such employees, July 1, 1986-June 30, 1987----------------------------------------- 129
D-5. Certain carbon and alloy steel: U.S. producers' capital expendi-tures, by types of expenditures, and research and development expenditures, July 1, 1986-June 30, 1987--------------------------- 130
D-6. Certain carbon and alloy steel: Income and loss data from U.S. operations, by product, July 1, 1986-June 30, 1987----------------- 131
D-7. Certain carbon and alloy steel: Financial experience of U.S. producers, July 1, 1986-June 30, 1987------------------------------ 132
D-8. Certain carbon and alloy steel: Weighted average net prices for the three largest sales of U.S. producers and importers by product, by specified period, July 1986-June 1987------------------ 133
F-1. Actions taken to adjust and modernize, July 1, 1986-June 30, 1987: Changes in company practices-------------------------------------- 140
F-2. Actions taken to adjust and modernize, July 1, 1986-June 30, 1987: Cost reduction programs------------------------------------------- 142
F-3. Actions taken to adjust and modernize, July 1, 1986-June 30, 1987: Labor------------------------------------------------------------- 144
F-4. Actions taken to adjust and modernize, July 1, 1986-June 30, 1987: Organizational changes-------------------------------------------- 146
F-5. Actions taken to adjust and modernize, July 1, 1986-June 30, 1987: Divestitures and closures----------------------------------------- 147
F-6. Actions taken to adjust and modernize, July 1, 1986-June 30, 1987: Expansions and acquisitions--------------------------------------- 148
F-7. Actions taken to adjust and modernize, July 1, 1986-June 30, 1987: Training/seminars------------------------------------------------- 149
F-8. Actions taken to adjust and modernize, July 1, 1986-June 30, 1987: Other------------------------------------------------------------- 150
G-1. Actions by Armco Inc. to maintain international competitiveness----- 154 G-2. Actions by Bethlehem Steel Corp. to maintain international
competitiveness--------------------------------------------------- 155 G-3. Actions by Inland Steel Company to maintain international
competitiveness--------------------------------------------------- 156 G-4. Actions by LTV Steel Company Inc. to maintain international
competitiveness-~------------------------------------------------- 158 G-5. Actions by National Steel Corp. to maintain international
competitiveness--------------------------------------------------- 159 G-6. Actions by Nucor Corp. to maintain international competitiveness---- 160 G-7. Actions by .Rouge Steel Company to maintain international
competitiveness--------------------------------------------------- 161 G-8. Actions by USX Corp., Fairfield Works, to maintain
international competitiveness------------------------------------- 162 G-9. Actions by USX Corp., Fairless Works, to.maintain
international competitiveness------------------------------------- 163

viii
CONTENTS
G-10. Actions by USX Corp., Gary Works, to maintain international competitiveness----------------------------------- 166
G-11. Actions by USX Corp., Lorain Plant, to maintain international competitiveness----------------------------------- 170
G-12. Actions by USX Corp. , Kon Valley Plant, to maintain international competitiveness----------------------------------- 171
G~l3. Actions by usx Corp., to maintain international competitiveness: Research-------------------------------------- 172
G-14. Actions by Weirton Steel Corp. to maintain international competitiveness------------------------------------------------- 175
G-15. Actions by Wheeling-Pittsburgh steel Corp. to maintain international competitiveness---------------------~------------- 178
H-1. Certain carbon and ailoy steel: U.S. imports, by product, June 1984-Kay 1985 and June 1985-Kay 1986----------------------- 180
H-2. Certain carbon and alloy steel: Income and loss data from U.S. operations, by product, July 1, 1985-June 30, 1986-------------- 181
H-3. Certain carbon and alloy steel: U.S. producers• capacity, changes in capacity, production, and capacity utilization, July 1, 1985-June 30, 1986-------------------------------------- 182
ix
EXECUTIVE SUMMARY
Industry Conditions
During July 1, 1986-June 30, 1987 (as compared to the previous 12-month period): 11
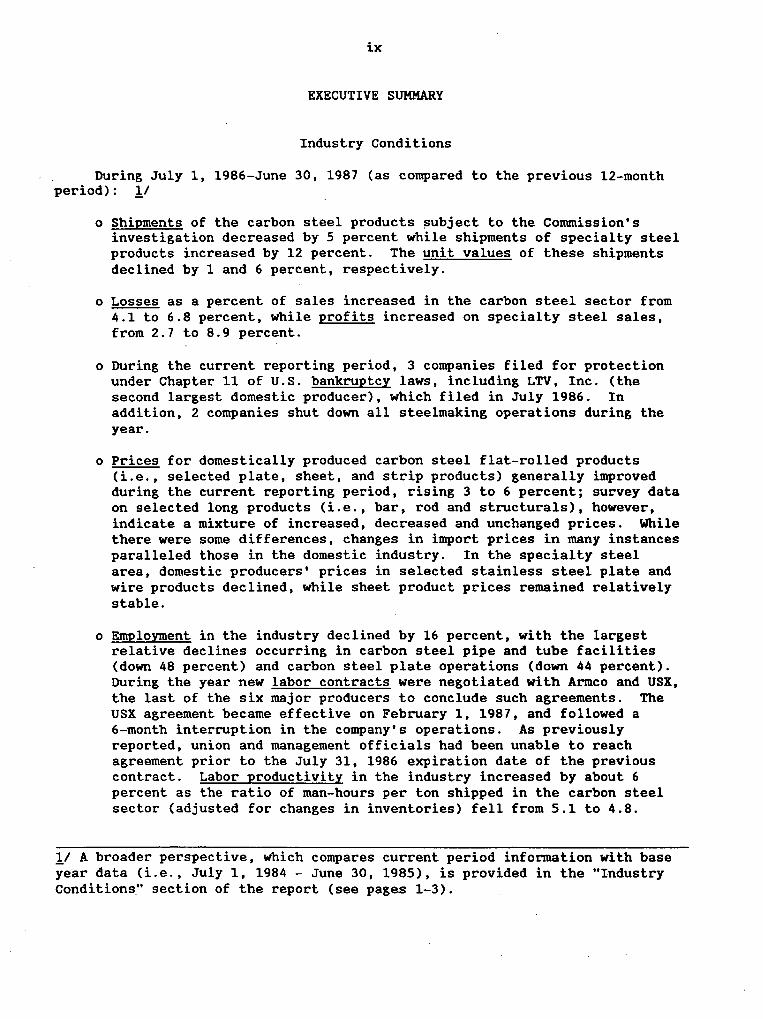
o Shipments of the carbon steel products ~ubject to the Commission's investigation decreased by 5 percent while shipments of specialty steel products increased by 12 percent. The unit values of these shipments declined by 1 and 6 percent, respectively.
o Losses as a percent of sales increased in the carbon steel sector from 4.1 to 6.8 percent, while profits increased on specialty steel sales, from 2.7 to 8.9 percent.
o During the current reporting period, 3 companies filed for protection under Chapter 11 of U.S. bankruptcy laws, including LTV, Inc. (the second largest domestic producer), which filed in July 1986. In addition, 2 companies shut down all steelmaking operations during the year.
o Prices for domestically produced carbon steel flat-rolled products (i.e., selected plate, sheet, and strip products) generally improved during the current reporting period, rising 3 to 6 percent; survey data on selected long products (i.e., bar, rod and structurals), however, indicate a mixture of increased, decreased and unchanged prices. While there were some differences, changes in import prices in many instances paralleled those in the domestic industry. In the specialty steel area, domestic producers' prices in selected stainless steel plate and wire products declined, while sheet product prices remained relatively stable.
o Employment in the industry declined by 16 percent, with the largest relative declines occurring in carbon steel pipe and tube facilities (down 48 percent) and carbon steel plate operations (down 44 percent). During the year new labor contracts were negotiated with Armco and USX, the last of the six major producers to conclude such agreements. The USX agreement became effective on February 1, 1987, and followed a 6-month interruption in the company's operations. As previously reported, union and management officials had been unable to reach agreement prior to the July 31, 1986 expiration date of the previous contract. Labor productivity in the industry increased by about 6 percent as the ratio of man-hours per ton shipped in the carbon steel sector (adjusted for changes in inventories) fell from 5.1 to 4.8.
!I A broader perspective, which compares current period information with base year data (i.e. , July 1, 1984 - June 30, 1985) , is provided in the "Industry Conditions." section of the report (see pages 1-3).

x
o Adjustment continued in the industry during the current reporting period, as raw steel capacity declined 9.8 percent in the carbon steel sector. Capacity increases, however, occurred in continuous casting facilities (up 19.7 percent). Capital expenditures declined by 36 percent, to $1.2 billion during the year.
Issues
o Analysis of labor conditions internationally indicate that the depreciation of the U.S. dollar and increases in U.S. productivity have continued to improve the relative cost competitiveness of U.S. producers. One leading analyst has concluded that U.S. labor productivity surpassed that of other major producers, including Japan and West Germany, during 1986.
o The report indicates that changes are continuing to occur in labor/management relations. One of the more prominent examples involves a newly constructed electrogalvanizing facility where traditional job classification systems have been replaced by a more simplified three-tier system. Despite improvements, labor issues continue to pose problems for the industry, particularly in the area of unfunded pension liabilities. Net claims or underfunding in plans which the government, through the Pension Benefit Guaranty Corporation, has already assumed total about $3.1 billion; underfunding in other companies in the industry are estimated to be on the order of $4 to $6 billion.
o Analysis of world steel prices indicates that shifting exchange rates have produced sizable swings in international steelmaking price and cost differentials. World steel "spot" export prices have reportedly increased by about 8 percent since mid-1986, despite flat or declining demand in major markets. The increase instead reflects the decline in the value of the dollar (which has increased Japanese and European steelmaking costs (in dollar terms)), production cutbacks by these producers, and reduced exports by Brazil, Taiwan, and Korea (due to increases in home market demand in these countries).
xi
Adjustment of Major Companies
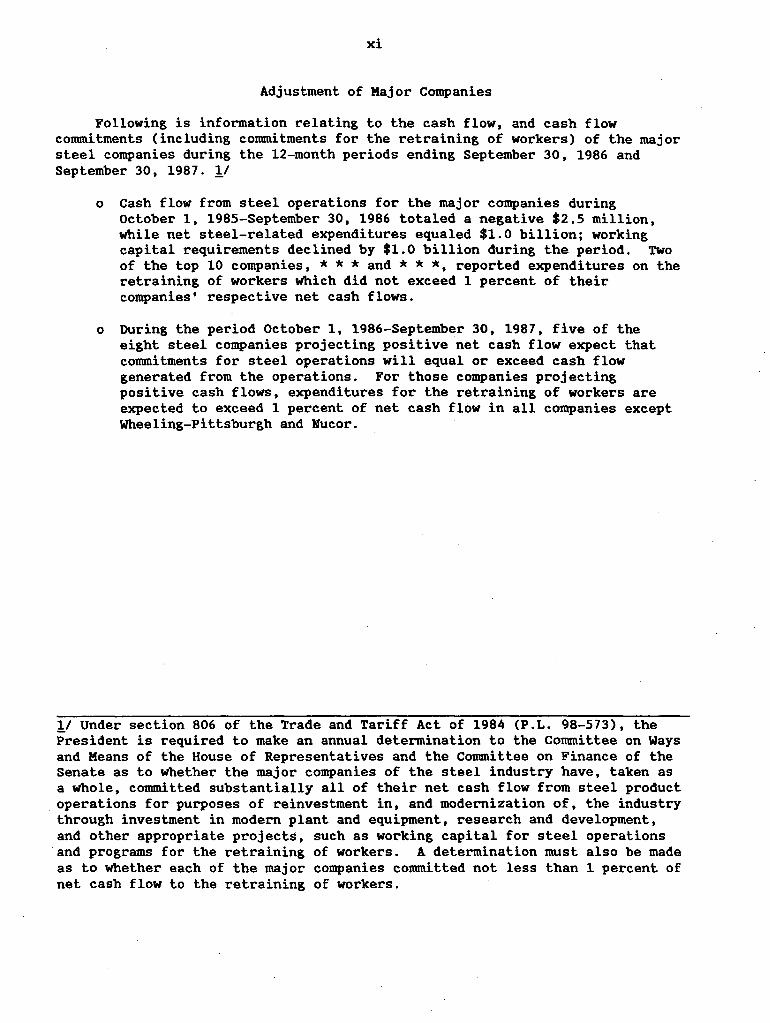
Following is information relating to the cash flow, and cash flow commitments (including commitments for the retraining of workers) of the major steel companies during the 12-month periods ending September 30, 1986 and September 30, 1987. !I
o Cash flow from steel operations for the major companies during October 1, 1985-September 30, 1986 totaled a negative $2.5 million, while net steel-related expenditures equaled $1.0 billion; working capital requirements declined by $1.0 billion during the period. Two of the top 10 companies, * * * and * * *, reported expenditures on the retraining of workers which did not exceed 1 percent of their companies' respective net cash flows.
o During the period October 1, 1986-September 30, 1987, five of the eight steel companies projecting positive net cash flow expect that commitments for steel operations will equal or exceed cash flow generated from the operations. For those companies projecting positive cash flows, expenditures for the retraining of workers are expected to exceed 1 percent of net cash flow in all companies except Wheeling-Pittsburgh and Nucor.
!I Under section 806 of the Trade and Tariff Act of 1984 (P.L. 98-573), the President is required to make an annual determination to the Committee on Ways and Means of the House of Representatives and the Committee on Finance of the Senate as to whether the major companies of the steel industry have, taken as a whole, committed substantially all of their net cash flow from steel product operations for purposes of reinvestment in, and modernization of, the industry through investment in modern plant and equipment, research and development, and other appropriate projects, such as working capital for steel operations and programs for the retraining of workers. A determination must also be made as to whether each of the major companies committed not less than 1 percent of net cash flow to the retraining of workers.

CONDITIONS AND ADJUSTMENT IN THE STEEL INDUSTRY
Industry Conditions
Highlights
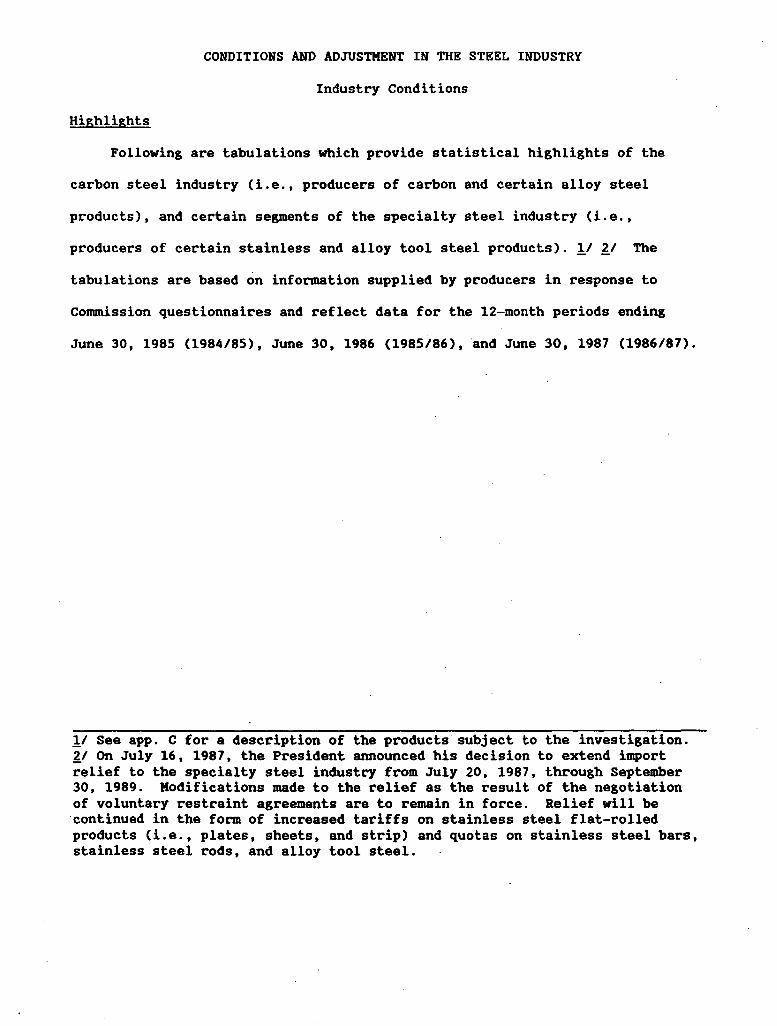
Following are tabulations which provide statistical highlights of the
carbon steel industry (i.e., producers of carbon and certain alloy steel
products), and certain segments of the specialty steel industry (i.e.,
producers of certain stainless and alloy tool steel products). !Ill The
tabulations are based on information supplied by producers in response to
Commission questionnaires and reflect data for the 12-month periods ending
June 30, 1985 (1984/85), June 30, 1986 (1985/86), and June 30, 1987 (1986/87).
!/ See app. C for a description of the products subject to the investigation. ll On July 16, 1987, the President announced his decision to extend import relief to the specialty steel industry from July 20, 1987, through September 30, 1989. Modifications made to the relief as the result of the negotiation of voluntary restraint agreements are to remain in force. Relief will be continued in the form of increased tariffs on stainless steel flat-rolled products (i.e., plates, sheets, and strip) and quotas on stainless steel bars, stainless steel rods, and alloy tool steel.

CarbQ!L~i::id c_ertain alj.Q.Y_ steel _l/
It~~-----·-····-·----------·-··-----·-1-984/85 ----·--·
Raw steel: P·roduct ion ......... mi 11 ion tons .. Capacity ................... do ... . Capacity utilization .... percent ..
Shipments 4/ .......... million tons .. Production-and related workers:
Average number ............ 1,000 .. Manhours ............... millions .. Wages .................. mi 11 ions ..
Financial: Net sales .............. millions .. Pre·-tax profit or (loss) ... do ... ~. Return on sales ......... percent .. Capital expenditures ... millions .. Research and development
expenditures ............. do ... .
80.0 126.6
63 61. 2
175 352
$5,241
$27,542 ($1,027)
-3.7 $2,398
$114
1985/86
83.2 122.5
68 65.2
162 339
$5,275
**"" *** -4.1
$1, 822
$96
Percentage Percentage change, 1986/87 change, 1986/87
-~---from 1985/8_~ 2/. __ _ft.Q~!984/_~2_.u_ __ _ 1?.86/87
73.6 ·-11.6 -8.0 110.5 ··-9. 0 -12.7
67 ~/ ~/ 61. 8 -5.2 0.9
137 -··15. 7 -21.8 286 -15.5 -18.6
$4,421 -·16. 2 -15.6
$25,803 *** -6.3 ($1,748) *** -70.3
-6.8 '!/ '!/ $1.173 -35.6 -51. 1
$81 -·15. 6 -28.6
TTC:ertain alloy -steelreferst-o alloysteel -other th-an s·tai"nles.sor-allo"Ytool steel. ~I Calculated from unrounded data. '!/ Percent change not calculated. ~/ Shipment figures are not directly comparable to raw steel production data, since a significant quantity of scrap is generated in processing raw steel into finished products. Moreover, shipment figures do not include certain cast products.
N
fert~!_r:!__s,!_ail')less. .. --~~ Percentage Percentage ajj9L.!_q9J __ steel !./ change, 1986/87 change, 1986/87
I.:t.~I!). __ ._._,_ .. ______ ... _____ ...... __ ..... __ . __ ..... ___ .. __ ~ 9 8 ~I 8 5 -·-........ ---··-·----1!~~.!}.§ ______ _J 91!,~/ 87_. __ .. f!:.Q!.!L19~~/ ~.6-f.L f rQ.!LJ.2.!!~.f..82.. ... ?L ... _
Raw steel: P~oduction ......... million tons .. Capacity ................... do ... . Capacity utilization .... percent ..
Shipments~/.· ........ million tons .. P~oduction and related workers:
Average number ............ 1,000 .. Manhours ............... millions .. Wages .................. mi 11 ions ..
Financial: Net sales .............. millions .. Pre-tax profit or (loss) ... do .. ~. Return on sales ......... percent .. Capital expenditures ... millions .. Research and development
expenditures ............. do ... .
1.6 2.4
65 1. 1
13.2 26
$418
$2,084 $83 4.0
$132
$18
1.4 2 .. 2 65
1.0
12.8 25
$378
**·K·
*·K,. 2.7 $80
$17
1. 6 2.3
70 1.2
11. 5 23
$376
$2,045 $182 8.9 $57
$15
10.9 2.7 ~./
11. 7
-9.6 -7.8 -·0.6
*',.*' ·~* ~/
-29.5
-·13. 8
2.5 -4.8
·~_1 7.3
-·12. 5 -10.6 -10.0
-1. 9 119.0
~/ -57.0
-18.6
!/ Certain stainless and alloy tool steel refers to semifinished stainless and alloy tool steel products, stainless steel plates, stainless steel sheets and strip, stainless steel wire, and stainless steel pipes and tubes. f_/ Calculated from unrounded data. 11 Percent change not calculated. 1/ Shipment figures are not directly comparable to raw steel production data, since a significant quantity of scrap is generated in processing raw steel into finished products. Moreover, shipment figures do not include certain cast products, and, in the case of specialty steel, shipment figures exclude bars, rods, and most alloy tool steel products.
w
4
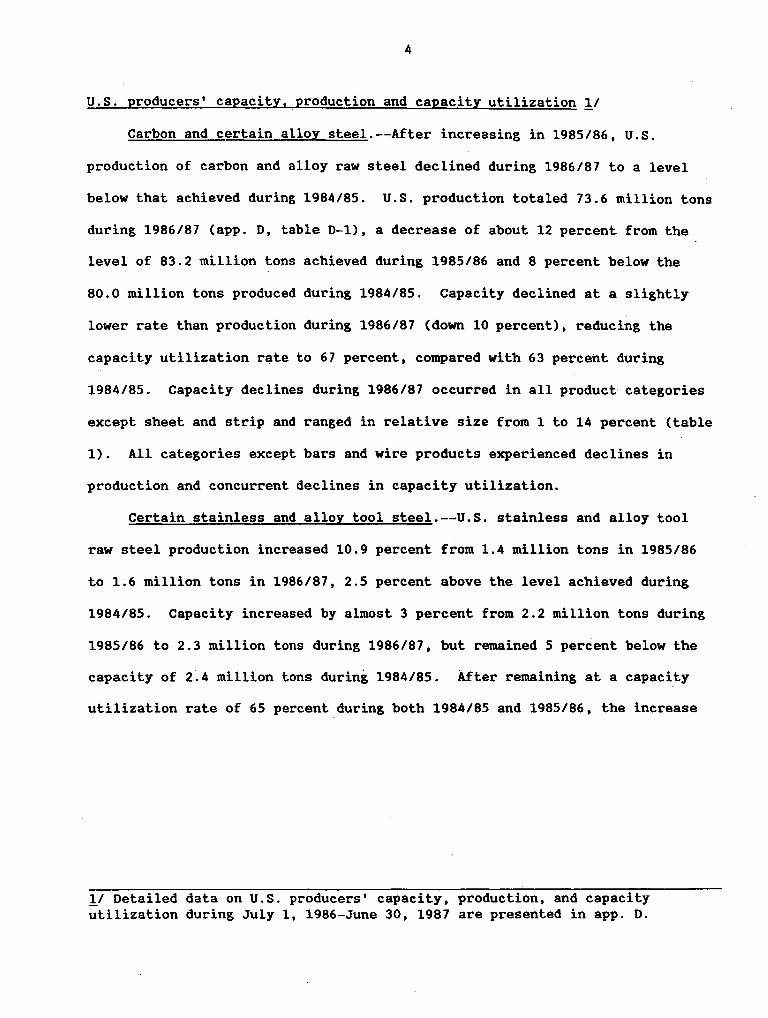
U.S. producers' capacity, production and capacity utilization !I
Carbon and certain alloy steel.--After increasing in 1985/86, U.S.
production of carbon and alloy raw steel declined during 1986/87 to a level
below that achieved during 1984/85. U.S. production totaled 73.6 million tons
during 1986/87 Capp. D, table D-1), a decrease of about 12 percent from the
level of 83.2 million tons achieved during 1985/86 and 8 percent below the
80.0 million tons produced during 1984/85. Capacity declined at a slightly
lower rate than production during 1986/87 (down 10 percent), reducing the
capacity utilization r~te to 67 percent, compared with 63 percent during
1984/85. Capacity declines during 1986/87 occurred in all product categories
except sheet and strip and ranged in relative size from 1 to 14 percent (table
1). All categories except bars and wire products experienced declines in
production and concurrent declines in capacity utilization.
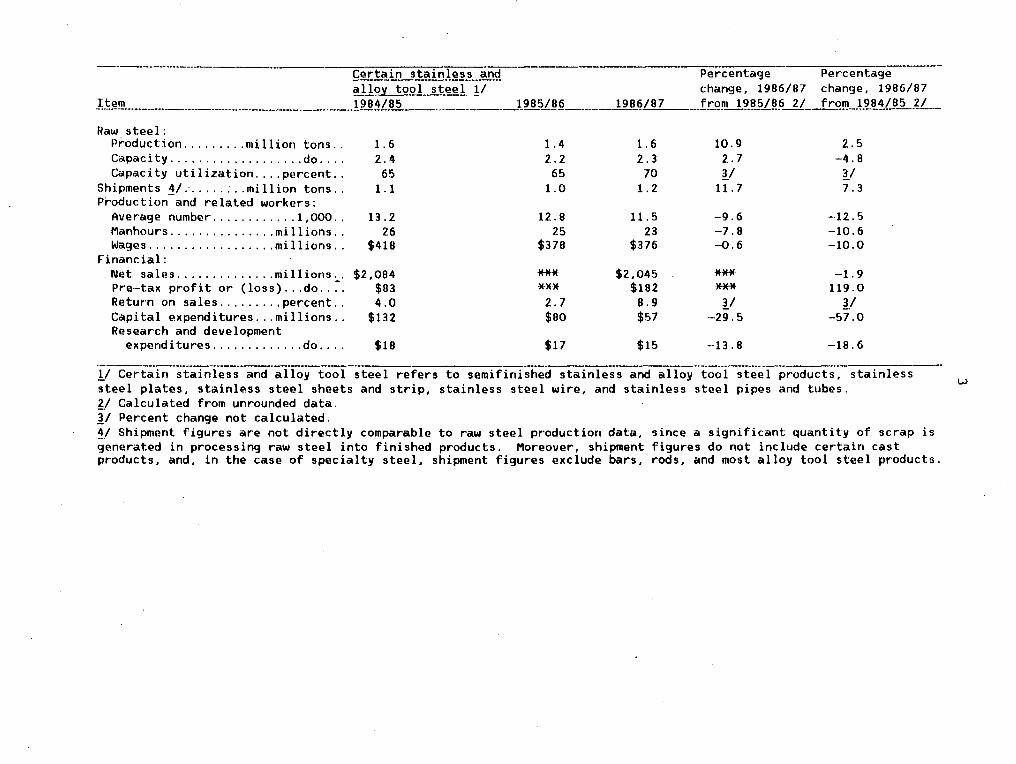
Certain stainless and alloy tool steel.--u.s. stainless and alloy tool
raw steel production increased 10.9 percent from 1.4 million tons in 1985/86
to 1.6 million tons in 1986/87, 2.5 percent above the level achieved during
1984/85. Capacity increased by almost 3 percent from 2.2 million tons during
1985/86 to 2.3 million tons during 1986/87, but remained 5 percent below the
capacity of 2.4 million tons during 1984/85. After remaining at a capacity
utilization rate of 65 percent during both 1984/85 and 1985/86, the increase
11 Detailed data on U.S. producers' capacity, production, and capacity utilization during July 1, 1986-June 30, 1987 are presented in app. D.
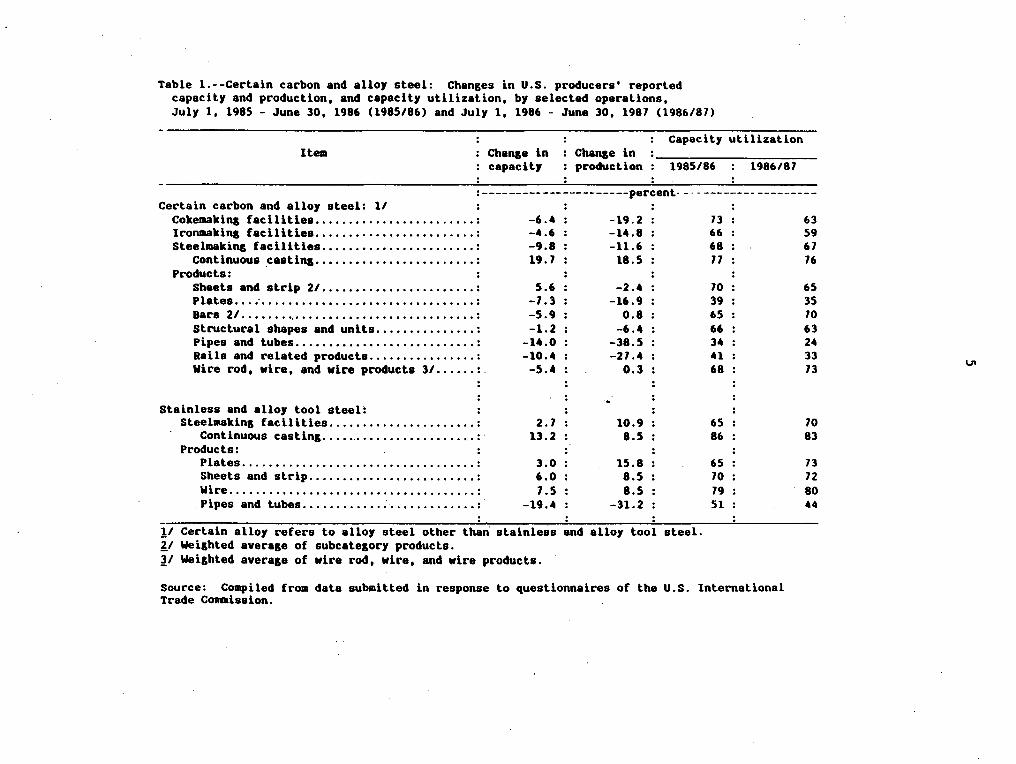
Table 1.--Cerlain carbon and alloy steel: Changes in U.S. producers' reported capacity and production, and capacity utilization, by selected operations, July 1, 1985 - June 30, 1986 (1985/86) and July 1, 1986 - June 30, 1987 (1986/87)
Capacity utilization Item Change in
capacilJ Change in production 1985/86 1986/87
:----------------------percent---------------------Certain carbon and alloy steel: l/
Cokemaking facilities ••••..••..•.•.••.•...•.• : Ironmaking facilities •..•.•••••••••••••..••.. : Sleelmaking facilities •••.••••••••.•••••...•. :
Continuous .casting •••••••••••••••••••.••.. : Products:
Sheets and strip 2/ •.••.•..•••••••.•••.•.• : Plates ••• ; .•.•.••••••.••••••.••••••••••••• : Bars 21 ••••••.....•..••••.•.•••••.•••.•••.. : Slnactural shapes and units ...•••••••••... : Pipes and tubes ...•••••.• , •...••••.••••... : Rails and related products .••.••.•.••..•.. : Wire rod, wire, and wire products 3/ •...•• :.
Stainless and alloy tool steel: Steelmaking facilities ...•••......••..•.•••• :
Continuous casting ••......•••••........... :· Products:
Plates .....•....•...........••........... : Sheets and strip .•...•••...•.•.•........• : Wire ...•..........•..••••••..••••••.•.•.• :
. Pipes and lubes .......••.••. · · ..••....•...• :
-6.4 : -4.6 : -9.8 : 19. 7 :
: 5.6 :
-7.3 : -5.9 : -1.2 :
-14.0 : -10.4 : -5.4 :
2.7 13.2
3.0 6.0 7.5
-19.4 . .
-19.2 : -U.8: -11.6 : 18.5 :
: -2.4 :
-16.9 : 0.8 :
-6.4 : -38.5 : -27.4 :
0.3 :
10.9 : 8.5 :
: 15.8 : 8.5 : 8.5 :
-31. 2 : :
!1 Certain alloy refers to alloy steel other than stainless !I Weighted average of subcategory products.
and alloJ tool steel.
~I Weighted average of wire rod, wire, and wire products.
73 : 66 : 68 : 11 :
: 10 : 39 : 65 : 66 : 34 : 41 : 68 :
65 : 86 :
: 65 : 10 : 79 : 51 :
Source: Compiled from data submitted in response to questionnaires of the U.S. International Trade Conmission.
63 59 67 76
65 35 10 63 24 33 73
10 83
73 72 80 44
VI
6
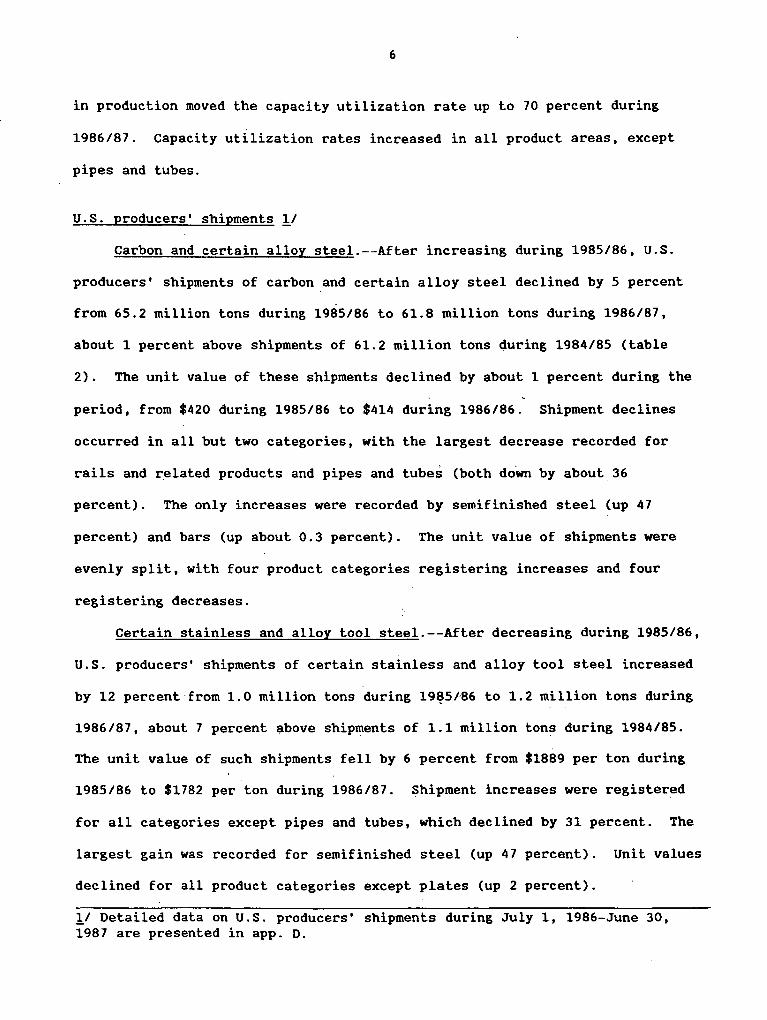
in production moved the capacity utilization rate up to 70 percent during
1986/87. Capacity utilization rates increased in all product areas, except
pipes and tubes.
U.S. producers' shipments 11
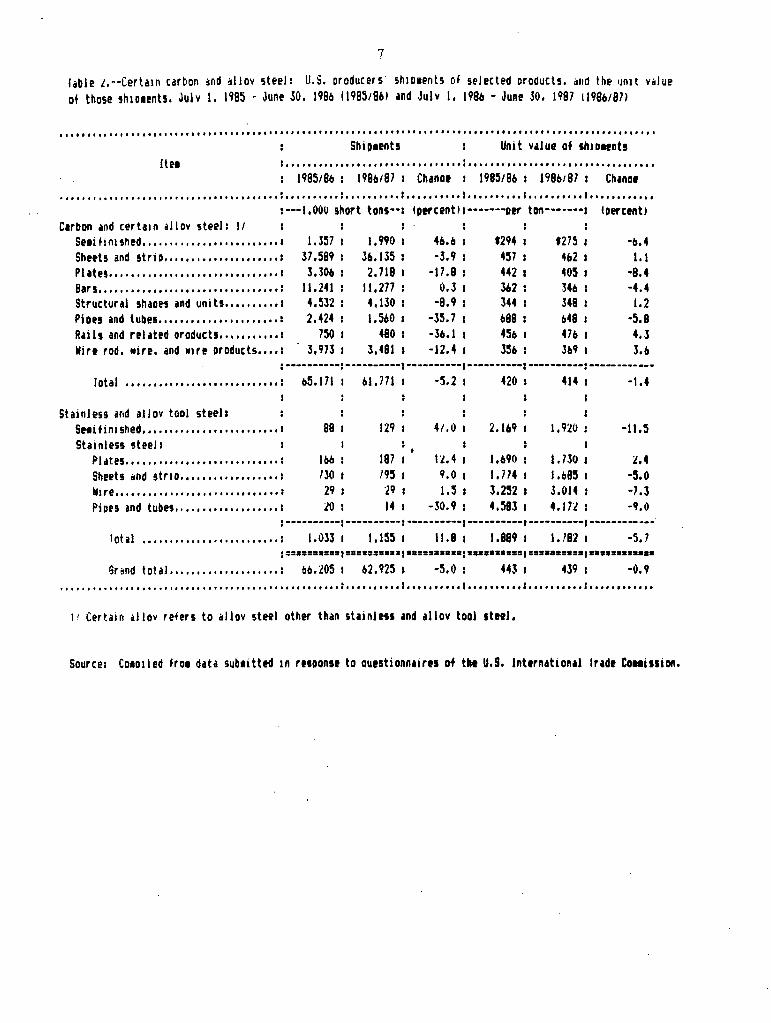
Carbon and certain alloy steel.--After increasing during 1985/86, U.S.
producers' shipments of carbon and certain alloy steel declined by 5 percent
from 65.2 million tons during 1985/86 to 61.8 million tons during 1986/87,
about 1 percent above shipments of 61.2 million tons during 1984/85 (table
2). The unit value of these shipments declined by about 1 percent during the
period, from $420 during 1985/86 to $414 during 1986/86. Shipment declines
occurred in all but two categories, with the largest decrease recorded for
rails and r.elated products and pipes and tubes (both doWn. by about 36
percent). The only increases were recorded by semifinished steel (up 47
percent) and bars (up about 0.3 percent). The unit value of shipments were
evenly split, with four product categories registering increases and four
registering decreases.
Certain stainless and alloy tool steel.--After decreasing during 1985/86,
U.S. producers' shipments of certain stainless and alloy tool steel increased
by 12 percent from 1. 0 million tons during 19Q5l86 to 1. 2 million tons during
1986/87, about 7 percent above shipments of 1.1 million tons during 1984/85.
The unit value of such shipments fell by 6 percent from $1889 per ton during
1985/86 to $1782 per ton during 1986/87. Shipment increases were registered
for all categories except pipes and tubes, which declined by 31 percent. The
largest gain was recorded for semifinished steel (up 47 percent). Unit values
declined for all product categories except plates (up 2 percent).
1/ Detailed data on U.S. producers' shipments during July 1, 1986-June 30, 1987 are presented in app. D.
7
fable J,--Certa1n carbon ~nd ~llov steel: U.S. oroducers shio1ents of selected oroducts. ~ttd the ~nit v~lue of those 5h1oll!nts. Julv I. 1985 - June 30. 1986 (198S18bl and Julv I, 198b - June .so. 1997 t198bt97l
........................................................................................................ ,. ... Shio.enh Unit value of sh1011nts
ltet s •••••••••••••••••••••••••••••••• : •••••••••••••••••••••••••••••••••• 199518/J : 198bl97 : Chan at 1985t9b : 198b18J I Chana1
I I I I I I • t t It t It 1 It t I I I I I I I I I I It t I It I I I I I I I I I I I I I I I I It I I I It I I I I I I I If I If I I I I I I It I I I I I I I It I I I I I I I I I I I It I I I I I I I I I I I I It I
:---1,000 short tons--: tptrcentl:-------oer ton-------1 toercent1 Carbon and certain allov steel: II
Se1i f i ni thed •• , ••••• , ••••••••••• , •••• : 1.357 1.990 4b.b S294 S275 -b.4 Sheets and 5trio ..................... : 37,599 36.135 -3.9 457 462 I. I Plates ••.••....••..•.•••• ,, ••••.••••• : 3.306 2.718 -17.9 442 405 -8.4 Bars ••••••••••••••••••••••••••••••••• : 11.141 11,277 0.3 362 346 -4.4 Structural shaoet and units •••••••••• 1 4,532 4, 130 -8.9 344 349 1.2 Pioes and tube1 •••••••••.•••••••••••• : 2.424 1.560 -35.7 b98 1148 -5.8 Rails and rel dtd oroducts .... , •••• ,.: 750 480 -36. I 456 47b 4.3 llire rod. wire. and wire oroducts •••• : 3,973 3,481 -12.4 35b Jll9 3.6
:----------:----------1----------1----------:----------:------------Iota I . 115. 171 bl. 771 -5.2 420 414 -t.4 ·····························
Stainless and al I ov tool steels Sttitini5hed ••••••••••••••••••••••••• : 88 129 41.0 2.169 1,920 -11.s Stainless steel:
Pl 11.tes •••••••••••• ,., •••••••• , •• ,.: lbb 187 1l.4 1,691) l. 730 :l,4 Sheets •nd str10 •••••••••••••••••• : 130 195 9,0 1.714 1.1195 -5.0 N1re ••••••••••••• , • , •••••• ,, •••••• : 29 ·29 1.5 3.252 3.014 -7 .3 Piues and tubes. I I I •••• I •••••• I ••• : :lO 14 -J0.9 4,583 4.17'! -9.ll
:----------1----------:----------1----------1----------1------------rota I . ·························· 6r~nd total ••••.•.••••••••••••• :
1.033 I 1.155 I
bo.205 I 62,925 I
11.8 I 1.889 : I. 18:2 I -5.7
-5.0 : 443 I 439 I -0.9 1 I 1 f I I I I 1 I I I I I I I I I I I I I I I I I I I I I I I I I I I f I I I I I I I I I I I I I I: I I I I I I I I It It I I I I I I I I I: I I If I I I I It It I I I I I I I I I: I I I I I I I I I I I I
11 Certain illlov refers to allov steel other than shinles1 and allov tool 1t11l.
Source: Co101led fro1 data sub1itted 1n rtsuon5t to ou15tionnairts of t~1 U.S. International lradt Co11i11ion.
8
U.S. producers' and U.S. importers' unfilled orders and inventories and U.S. importers' imports !I
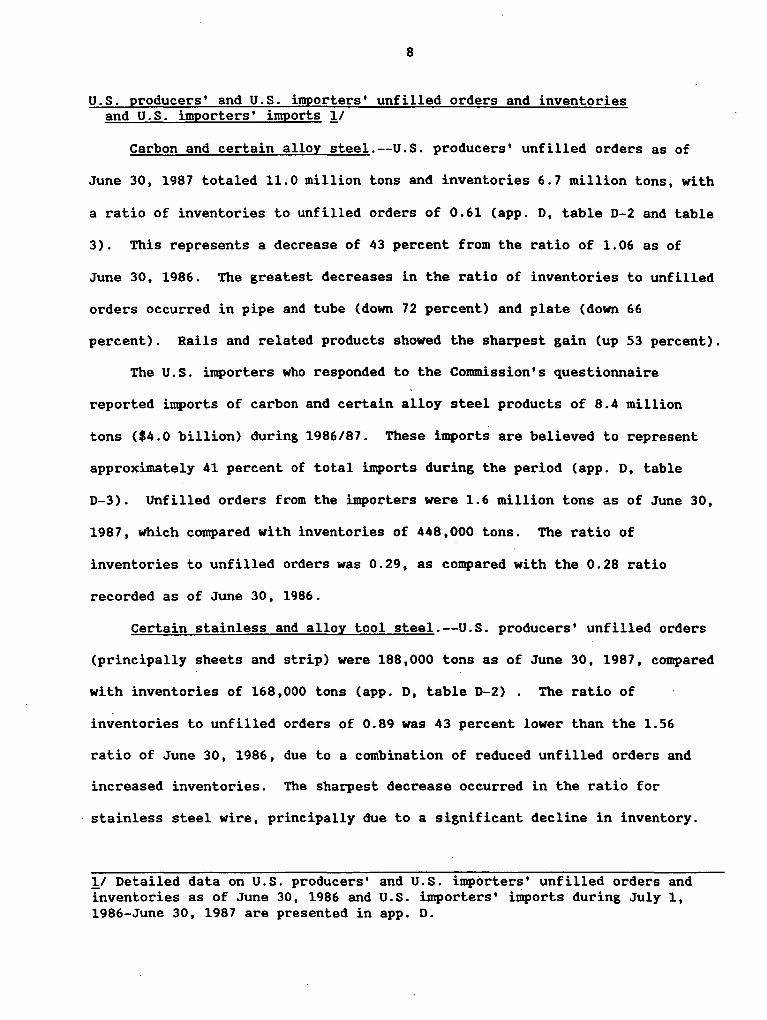
Carbon and certain alloy steel.--U.S. producers' unfilled orders as of
June 30, 1987 totaled 11.0 million tons and inventories 6.7 million tons, with
a ratio of inventories to unfilled orders of 0.61 Capp. D, table D-2 and table
3). This represents a decrease of 43 percent from the ratio of 1.06 as of
June 30, 1986. The greatest decreases in the ratio of inventories to unfilled
orders occurred in pipe and tube (down 72 percent) and plate (down 66
percent). Rails and related products showed the sharpest gain (up 53 percent).
The U.S. importers who responded to the Conunission's questionnaire
reported imports of carbon and certain alloy steel products of 8.4 million
tons ($4.0 billion) during 1986/87. These imports are believed to represent
approximately 41 percent of total imports during the period Capp. D, table
D-3). Unfilled orders from the importers were 1.6 million tons as of June 30,
1987, which compared with inventories of 448,000 tons. The ratio of
inventories to unfilled orders was 0.29, as compared with the 0.28 ratio
recorded as of June 30, 1986.
Certain stainless and alloy tool steel.--U.S. producers' unfilled orders
(principally sheets and strip) were 188,000 tons as of June 30, 1987, compared
with inventories of 168,000 tons Capp. D, table D-2) . The ratio of
inventories to unfilled orders of 0.89 was 43 percent lower than the 1.56
ratio of June 30, 1986, due to a combination of reduced unfilled orders and
increased inventories. The sharpest decrease occurred in the ratio for
stainless steel wire, principally due to a significant decline in inventory.
!/ Detailed data on U.S. producers' and U.S. importers' unfilled orders and inventories as of June 30, 1986 and U.S. importers' imports during July 1, 1986-June 30, 1987 are presented in app. D.

9
fable 3.--Certain carbon and allov steel: U.S. oroducers' isnd IJ,S. i1oorters' ratios of inventories to unfilled orders ii of Junt 30. 1986 ind Junt 30. 1987
············································································································ U.S. Producers u.s. laoorters It I I I I I I I I I I I I I I I I I I I I I I I I I I I I I It It I I I I I It I I I I I I I I I I I I I I I I I I I I I I I I I I
Itet r June Jo, 1 June 30. 1 Chanat 1 June 30. 1 June 30. 1 Chanot 198• 1987 198• 1987 ........................................ : .......... : .......... : .......... : .......... : ..........•............
IDtrctnU: . : 1aercent1 Carbon and certiin allov steels I 1 ' St1i f i ni 1hed .••.••.• , ••• , .•.• , •.•••.• 1 - I 1),j4 O.:.ll -3o,9
Sheets and stria ••••••••••••••••••••• 1 1.16 0.62 -411.3 o.u 0.2i! 70.3 Pl~tts •................•........... 0.59 0.20 -o5.8 0.10 0.20 ''·" 8•r11 I I I It I I I I I I I I I I I I I I I If e I If I I I.- f I 1.02 0.17 ·24.8 0.31 0.55 78.3 Structural 1h1Dtt •nd un1t1 •••••••••• 1 1.30 0.82 ·37,2 I 0.10 o. 14 41.8 Piot 1111d tube •• ••••••••••••••••••••••' l.18 0.88 ·12.~ I 1.8:s o. 79 ·:57.2 Rails •nd related oroduct1 •• ,,,,,,,,,1 0.47 0.72 52.9 0.30 0.03 -89.8 Wire rod. wire. ind wire oroducts •••• 1 o.n 0.63 45.8 O.lo 0.2• 50,7
I
lot•I ' ••••••••••••••••••••••••••• • 1 1.06 0.61 I , ·42.9 0.28 0.29 2.6 1----------1----------1----------1----------1----------1------------
Certiin stainless and illov tool stttll I
St1ifini1htd ••••••••••••••••••••••••• 1
Staanles1 steel• Pl iltts .•.• , •••.•••••..•.•• , •••.•••• 1 1.88 1.62 -13.7 0.28 0.37 32.4 Sh1et1 and 1tr10 ••••••••••••••••••• 1 1.32 0.87 ·34.1 O.lO 0.98 227. 7. Wire •••••••••••••••••••••••••.••••• 1 18.17 1.49 -91.8 0.24 0.22 -10.0 P1oes. tnd tube ........ ,, ........... 1 3.4b 2.24 .1 -35.3 1. 13 1.z:s 10.4
rot., .. I •• I •••• I • I •••••••• I •• I ••• I 1.56 0.89 ·42.7 0.39 1. 15 194.b , .......... , ..........•.....•.... , ........•. , ..........•............ Gr•nd tota1.,,,,,,,,,,,,,,,,,,,,,1 1.07 ' 0.61 I ·43.0 ' 0,28 I 0.30 ' 7,2
•••••••••••••••••••••••••••••••••••••••• 1 ••••••••••••••••••••• 1 •••••••••••••••••••••••••••••••• 1 ••••••••••••
l.t Certaan allov rt+!t's to illDv 1t11I otlltr than 1hinle11 ind allov tool stttJ.
Sources Co1oiled fro1 dab 1ub1itted in rnoDnst to ountionniires Df the U.S. International Jrad1 COMi!sior1.
10
The U.S. importers who responded to the Commission's questionnaire
reported 79,000 tons of imports of the subject stainless and 'alloy tool steel
products ($149 million) during 1986/87, which represented approximately 34
percent of total imports. Unfilled orders were 23,000 tons as of June 30,
1987, which compares with inventories of 27,000 tons Capp. D, table D-2). The
ratio of inventories to unfilled orders of 1.15 was 195 percent higher than
the ratio of 0.39 as of June 30, 1986, due largely to an increase in
inventories. The ratio increased for all products except wire.
11
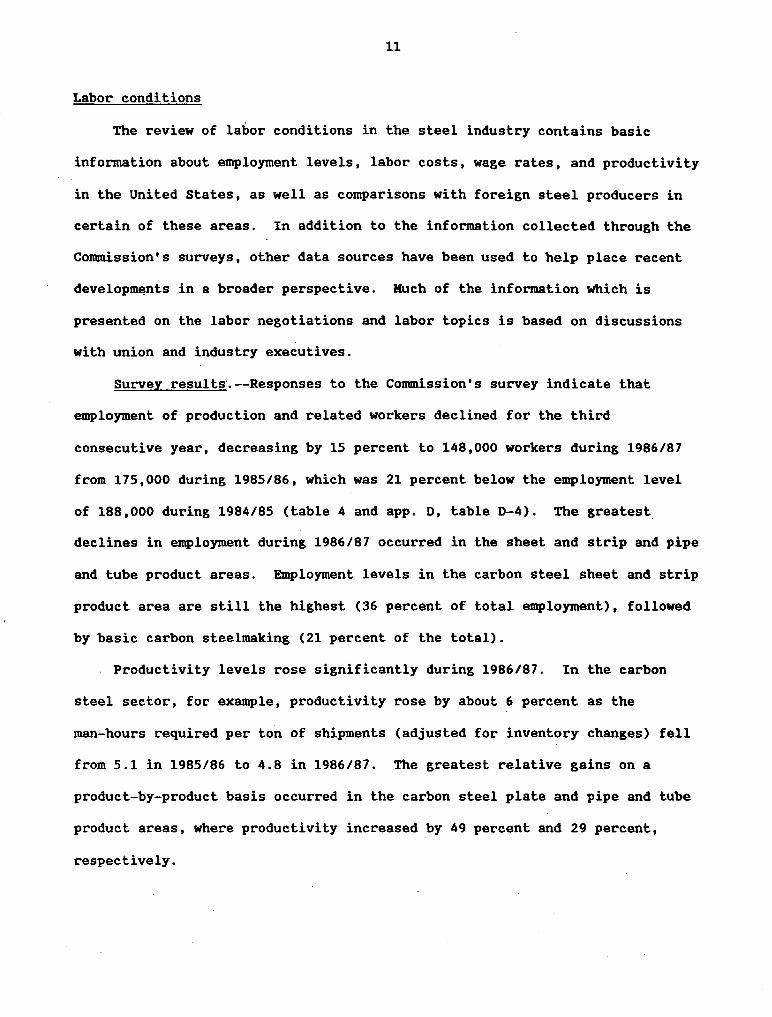
Labor conditions
The review of labor conditions in the steel industry contains basic
information about employment levels, labor costs, wage rates, and productivity
in the United States, as well as comparisons with foreign steel producers in
certain of these areas. In addition to the information collected through the
Commission's surveys, other data sources have been used to help place recent
developm~nts in a broader perspective. Much of the information which is
presented on the labor negotiations and labor topics is based on discussions
with union and industry executives.
Survey results·.--Responses to the Commission's survey indicate that
employment of production and related workers declined for the third
consecutive year, decreasing by 15 percent to 148,000 workers during 1986/87
from 175,000 during 1985/86, which was 21 percent below the employment level
of 188,000 during 1984/85 (table 4 and app. D, table D-4). The greatest
declines in employment during 1986/87 occurred in the sheet and strip and pipe
and tube product areas. Employment levels in the carbon steel sheet and strip
product area are still the highest (36 percent of total employment), followed
by basic carbon steelmaking (21 percent of the total).
Productivity levels rose significantly during 1986/87. In the carbon
steel sector, for example, productivity rose by about 6 percent as the
man-hours required per ton of shipments (adjusted for inventory changes) fell
from 5.1 in 1985/86 to 4.8 in 1986/87. The greatest relative gains on a
product-by-product basis occurred in the carbon steel plate and pipe and tube
product areas, where productivity increased by 49 percent and 29 percent,
respectively.
l1ble 4.--Cerlain c•rboh and allov steels U.S. producers' eaployaent, productivity, and waoe costs, be sector, July 11 1985 - June JO, 1986 11985/861 and July I, 1986 - ~une 30, 1987 11986/871
I• I I I It t I I I It It I I I I It I It I I I I I I I I I I I I I I I I I I I I I I I I I I I I I I I I I I I I I I I I I I I I I I I I I I I It It I I I I It It I I I I I I I I I I I I I I I I I I I I I It I I I I I I I I I I I I I It I I It I I I I I I I I I I I I
1 Aver191 Nu1ber E1ployed ProducllvllY ln•11 I/ Hourly M191 Co1t1 ••.•.............................•.........................•.......••........................•...•...
ltfl I 1915/86 I 1986/87 I Ch1n~t I 1985/86 I 1986/87 I Change I 1985/86 I 1986/87 I Cbln91
.....•...•..... ~~·································· ··········•··········•··········•······•···•············•··········•·•···•····•·········· Carbon ind certain alloy 1te1l1 2/ I lpercenth I 1 Cptrctntl I I 1 CptrunU
Cot111kln1 f1cllltl11,,,,,,,,,,,,,,,,1 10,911 9,165 -16,5 I 102 I IOJ I l,0 I fl5,85 I fl5,48 I -2.l lron11kino f1cllltl11,,,,,,,,,,,,,,,,1 8,961 8.051 -10,2 I 108 I I031 -4,7 I 15.90 I 15. 90 I o.o Btttl11tln~ f1cllltl11 J/,,,,,,,,,,,,1 34.990 31,602 -9, 7 I 96 I 94 I -1.a 1 15,57 I 15,81 I 1.5 Produc:ht I t
Sheets •nd strlp .................. t 60,436 54.071 -10,5 I llJ I 122 I 7,5 I 15.97 I 16.11 I 0.9 Pl1t11,,.,,.,,,,,,,,,,,,,,,,,,,,,,1 7,061 l,957 -44,0 I IOI I 150 t 48,9 I 15,79 I 15.19 I -J.8 8ar1 •• , •• ,_,, .... • ••• , ~,, •• ,, ••• ,, •• 1 17, 109 14,569 -11,1 I 116 I 130 I 12,0 I 14.82 I 13.38 I -9.7 Structur•I 1h1pe1 •n~ unlt1 ••••••• 1 6,151 4,931 -19,9 I 126 t 153 I 21.1 t 15,00 I 14.12 t -5.9 Pipe 111d t11b1 ..................... 1 IO,JJ2 5,408 -41.1 I 104 I 135 I 29.4 I 14,28 I 14.JO t 0.1 R1ll1 and rel1ttd procluct1,,,,,,,,1 952 749 -21,J I 93 I .89 I' -4,J I lJ,61 I ll.J6 t -2.l •lrt rod. wire, ind wire product1.1 4.816 4,UB -1.8 I 115 I 104 I -9,8 I 15, ll I 13.58 I -10.1
·-----""."·--1----------1----------1----------1----------1------------1----------1----------1----------f~t.1 •••••••.••.••••••.••.•••.• 1 162,J91 I IJ6,941 I -15.1 t " . ., I 4/ I
., I 15,56 I 15, 4J I -o.8
I I I I I I
6lalnl111 and 1llov tool 1teel1 I I I I . I I t I I
Slttl11tl10 f1cllltle1 3/,,,,,,,,,,,,, 5,82i·1 4,602 I -21.0 t 100 t 122 I 21,6 I 15. ll t IS.89 I 1.0 St1lnle11 1tttl product11 t I t I I I I I I
Pl1t11 ..••••••.•..••..•••••..•.•.• 1 1,100 I 1,191 I 8.3 I 129 I 140 I 8,4 I 15,46 I 16.80 I 8.7 St.tell and 1trlp .................. 1 4,610 I 4,603 I -1,4 I 81 I 105 I 21,1 I 15.H I 17.11 I 15.9 •tr1 .•••••..•••••••.•••.•••.....•• 1 700 I 689 I •l,6 I IOJ t 116 I 12,5 I 14,05 I 14.ZI I 1.1 Plpt1 111• tube .... , ............... 1 458 I 442 I -J,5 I 121 I 102 I -19, 4 I 12,45 I IZ.24 I -1.1
1----------1----------1----------1----------1----------1------------1----------1----------1----------fot1J,,,,,,,,,,,,,,,, •••.•••••• 1 12,151 I 11,527 I -9.6 I ., I 4/ I 41 I 15.Jl '' J6,50 I 7.8
~··••a•aea•1aaaaaa8•aa1aaaaaaaaaa1aaaD8aaaaa1aa~aasaaaa1aaaaaaaaaaaa1aa•aaaa8as1aaaaaaaaaa18aS8•88888
Brand tot11 •••••••••••••••••••• 1 115, J42 I 148,468 I -JS,2 I 4/ ' 4~ . I 4/ I 15,54 I 15.51 I -o.z ........................................•..........•..........•..........•.....................•............•................................ II C1lcul1t1d on the ba1l1 of production per 11nhour, rxcrpt for lht c:1r•on ind certain alloy 1h11t1and1trlp, •1r1, and wirt product
c1tegorl11, llhlch art c1lcul1led on the ba1l1 of 1hlp1ent1 per 11nhour. Jht 1984/85 period 11 use• 11 1 b111 ll.e., 1984/85•1001, 21Certain1llov 1t11I refer1· lo allov 1t11I other than 1t1inl11s ind alloy tool 1teel. l/ Including se11flnhhed 1t11I, 4/ Nol 1ppllc1blt.
Sonrn~a Cn•oilrd frn• d~h 1•1b1lltrd lh-reuonH to quesllonr1aires of lht U.S. lnltrr1atlonal lnde Co111lnion. ,
1--' I\)
13
Although wage levels for total steel production remained about the same
during 1986/87, an 8-percent increase occurred in the wages of workers
manufacturing stainless and alloy tool steel. Increases in the specialty
steel sector were experienced in all areas, with the exception of pipe and
tube operations, which declined from $12.45 to $12.24 per hour. Overall,
wages ranged from $12.24 to $17.71, with the average at $15.51.
Employment trends in the United States.--ln general, total employment and
hours worked have declined since 1979 (figure 1). That trend continued in
1986 and 1987. The American Iron and Steel Institute (AISI) reported that the
number of workers fell from 236,000 in 1984 to 175,000 in 1986, and then to
150,000 during April 1987, or by 36 percent in the last 3 years. !I Average
hours worked per week, however, have risen consistently since 1981, when it
averaged 37 hours per week. By 1986, the average had risen 6 percent to 39.1
hours per week.
Total employment costs per unit of production are reported to have
declined in the past several years, as has the share of labor costs to total
costs (figure 2). The decline in costs reflects the fact that productivity
gains have exceeded increases in compensation, which peaked in 1982 at $24.67
per hour before declining to $22.36 in 1984. This decline was reversed ·in
1985, with an increase to $23.26. The increase reflected. scheduled cost of
living increases that were negotiated in 1983. During 1986, wage rates
increased to $23.99 per hour. ~/
!I As reported by 64 steel companies to the American Iron and Steel Institute, representing 87 percent of U.S. raw steel production. ~I World Steel Dynamics.
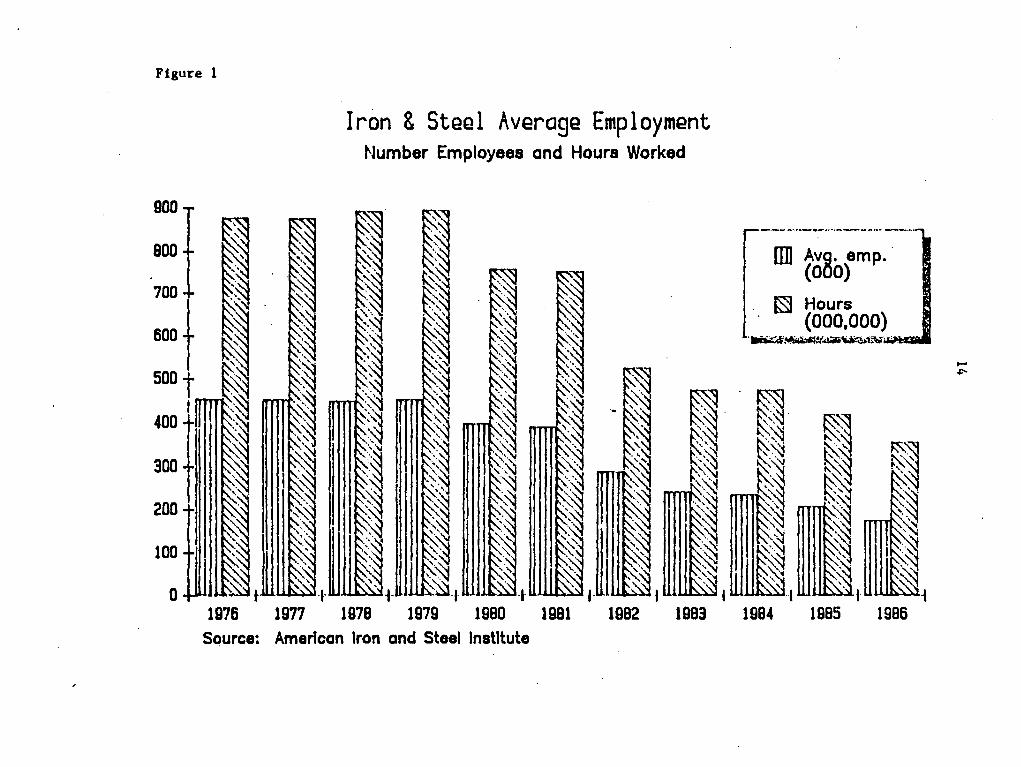
Figure 1
900
BOO
300
200
100
Iron & Steel Average Employment Number Employees and Hours Worked
ITil Avg. emp .. (000)
~ Hours (000,000)
'llllDt.:~~""'1~..,..~~~iW'HG@=
~ ~ ~~ ,. ~-~ ·~~ ~~'
Q +JUJU~ • .W.~.,.W'l 11):~.~-I-'~
,.U.l~ f UUJA~ I w~., wm1. 1976 1977 1978 1980 1981 1982 1983 1984 1985 1986
Source: American Iron and Steel Institute
...... ""
per metric
ton
Figure 2
800
700
600
U.S. Carbon Steel Production Costs Labor and Other Costs
I I II I SOD+ ~1111 400 + ____ nmm 1111!m 111L II
::1 I I I '[J1lll I IJili ;~ --~~ ~~ I -·~ _1111 ___ c:_ ""= ~--= + ··-·· ···-· ·--~ ____ _, 'f .. -- ~-··--- -··~ . ··- - _,. -·. , __ _. .. -~ r·-······-- ._ ~--__.
--·· .. _::..:::l -·-.:.::l ~~ ... ·-- ·-- - --·-' ~.. -~ ..__ r= _:J 100 .---- t:::::---. E .. - c::::··- --· ...... ·- - ~--~--- ----~ §-~ -=t. --··-=·-== ~-= ·--= -= ~c:::i :::-:-:::; c:-c-,-, c::::-- - I r: E.__.::.::j .... ~ C::::.: ... -~ --'"""""4. f'-· ------ ~ ·~·-·"'"~ ~-- .. _.... - _·:::::J ~--... .... -- -··· ~·::: ::=: ?:::::::..-~ §.:~~ ~-=~ .::::~ -~ .::~ ~::-~~ t=-~ "':::::.::::I ._.::-::::;::i ~.:.~ o +-£::.:.-_3 1.E:=-3 . .-t=::·.::;-1 .. E.:::a.1 . .fr~ __ 1_.f:::-·--:t __ ,E :~_,_e=:~ .1.Ea =--- +E·-.:-1, 76 77 78 79 80 81 82 83 84 85 88
Source: Wor1d steel Dynam1ce
!nu Other costs
§ Labor costs
...... V\
16
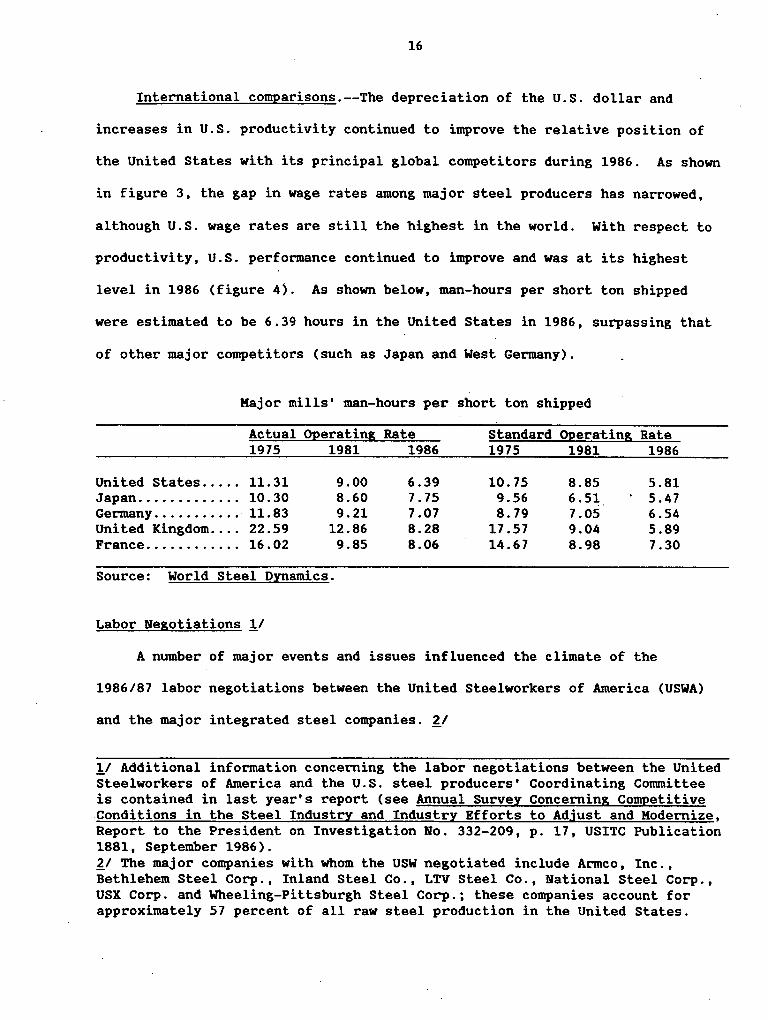
International comparisons.--The depreciation of the U.S. dollar and
increases in U.S. productivity continued to improve the relative position of
the United States with its principal global competitors during 1986. As shown
in figure 3, the gap in wage rates among major steel producers has narrowed,
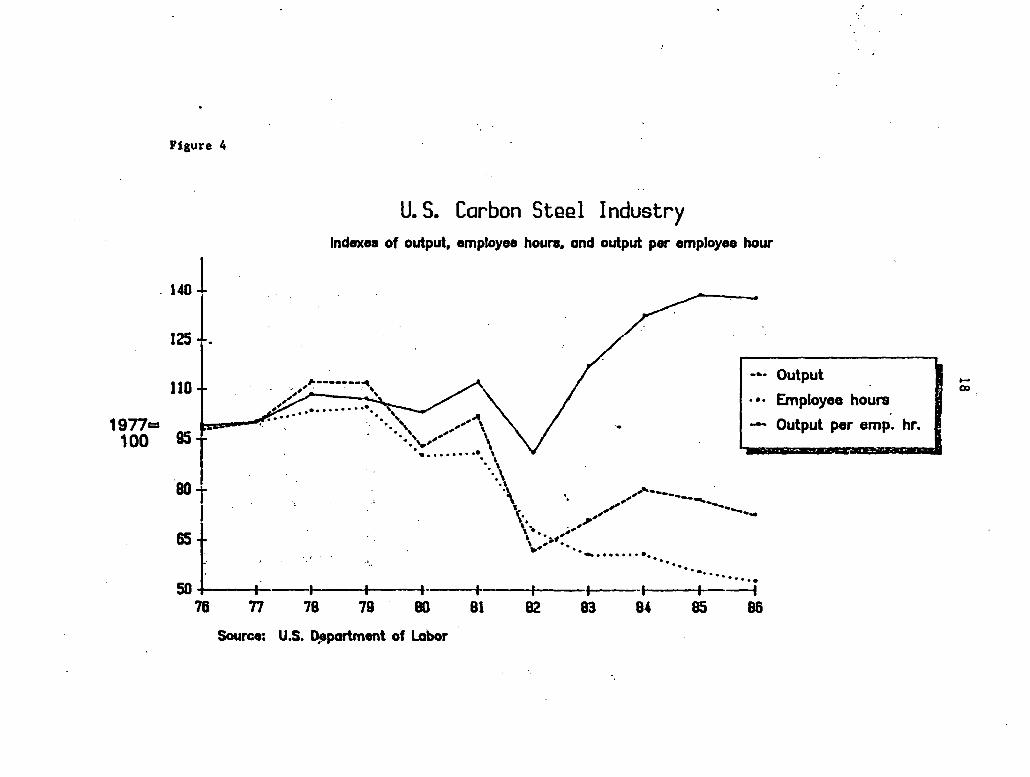
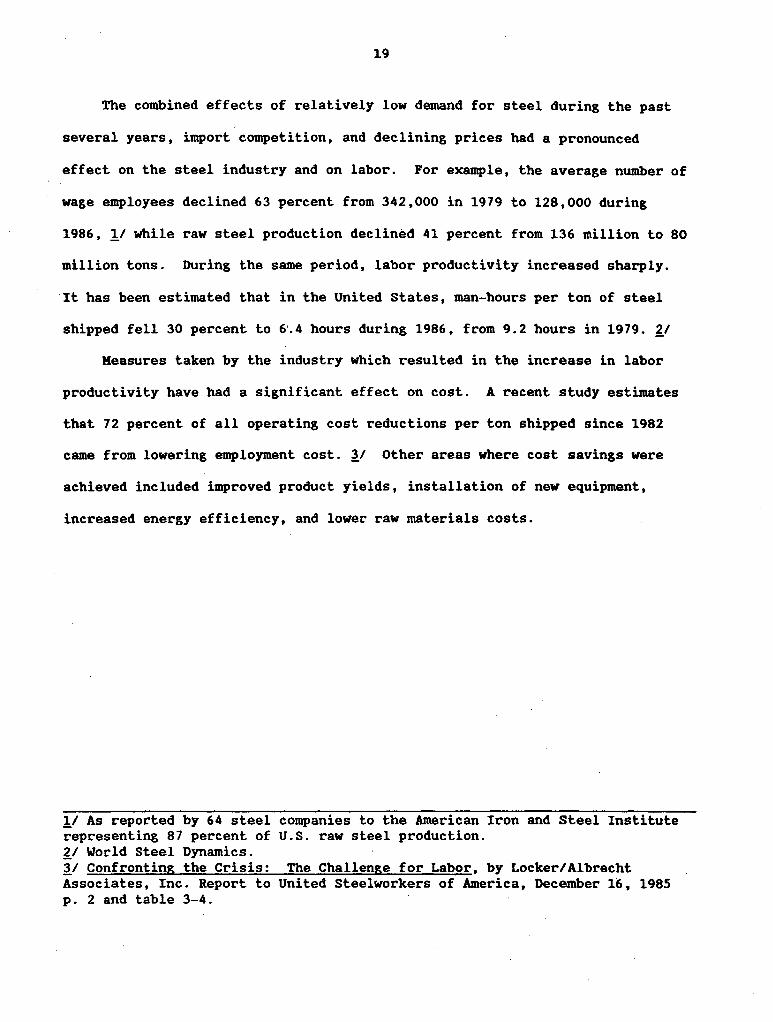
although U.S. wage rates are still the highest in the world. With respect to
productivity, U.S. performance continued to improve and was at its highest
level in 1986 (figure 4). As shown below, man-hours per short ton shipped
were estimated to be 6.39 hours in the United States in 1986, surpassing that
of other major competitors (such as Japan and West Germany).
Major mills' man-hours per short ton shipped
Actual Operating Rate Standard 01>erating Rate 1975 1981 1986 1975 1981 1986
United States ..... 11.31 9.00 6.39 10.75 8.85 5.81 Japan ............. 10.30 8.60 7.75 9.56 6.51 5.47 Germany ........... 11.83 9.21 7.07 8.79 7.05 6.54 United Kingdom .... 22.59 12.86 8.28 17 .57 9.04 5.89 France ............ 16.02 9.85 8.06 14.67 8.98 7.30
Source: World Steel nrnamics.
Labor Negotiations 11
A number of major events and issues influenced the climate of the
1986/87 labor negotiations between the United Steelworkers of America (USWA)
and the major integrated steel companies. ~/
11 Additional information concerning the labor negotiations between the United Steelworkers of America and the U.S. steel producers' Coordinating Committee is contained in last year's report (see Annual Survey Concerning Competitive Conditions in the Steel Industry and Industry Efforts to Adjust and Modernize, Report to the President on Investigation No. 332-209, p. 17, USITC Publication 1881, September 1986). £1 The major companies with whom the usw negotiated include Armco, Inc., Bethlehem Steel Corp., Inland Steel Co., LTV Steel Co., National Steel Corp., USX Corp. and Wheeling-Pittsburgh Steel Corp.; these companies account for approximately 57 percent of all raw steel production in the United States.
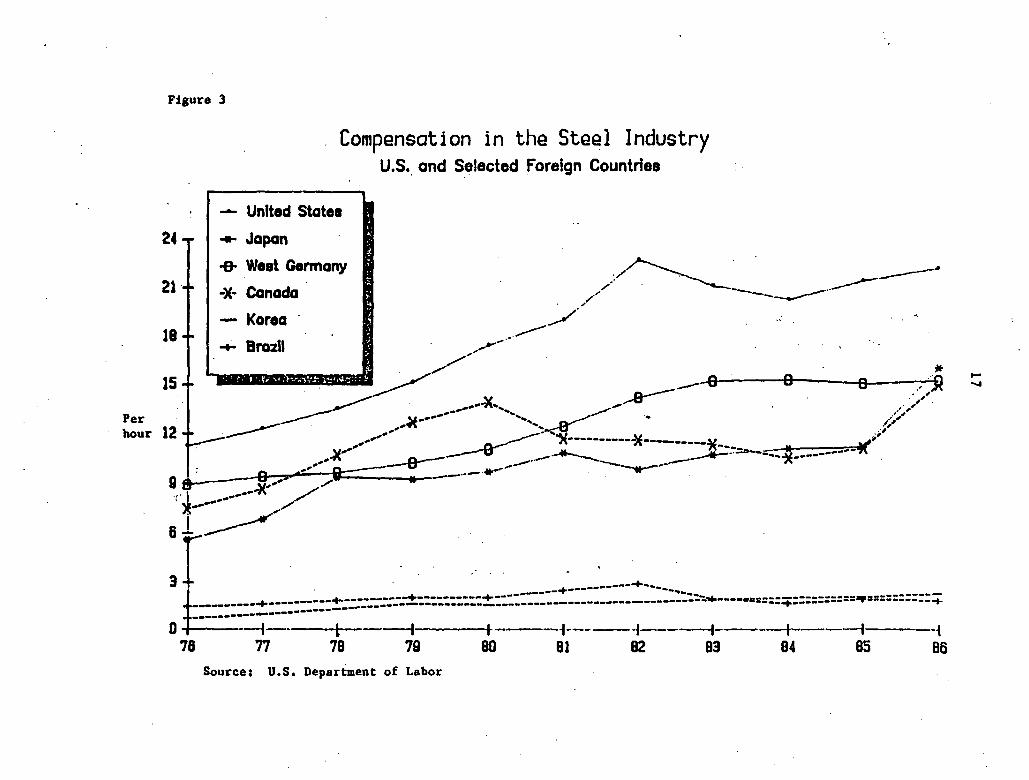
Figure 3
24
21·
Compensation in the Steel Industry U.S •. and Selected foreign Countries
- United States
..... Japan
-& Weat Germany
-X· Canada ,, :./~ / . .
,/,..,. --------···--------.. Korea I -·/ --
18 + I .,., ... --..... ..... Brazil ,.,.-
/' . 15 + ·. ~.I ., ... ~,.hr.;1~·~. l"'.::'•<,1•;;;,. __....../" ~---0 0 0 ..-)~
~ v _....a-- .,,. ----1\-...., _.,,,.,,,.,,,. ,· ,, --- ~.... ,,,,_.. ,,,
Per · ! "'---- ....... -~ ·· /1' ,ft --... ~ .,
hour 12 _ ____...- , .. ----- __a----· .. -,(----------'*---------M- lJ(;i' -- 7'i ---- - ~ --.x- __....,_ ~------ ------- ...... -------...._. .,..---- -- ------ ---a----- _,,.,,, .. .- -·---. --~
; 0 .-- i == --- ..-- --....--9 & - ",, .... - / • -
* ---I\ /
·1·' --- / . ----- / . ,.
6 -r' ____...... . . . - .
3 t:= . . . . . ---------+----------·-----.... ___ -- ----------... -------1-----------+----------~- ----------------------..... ---···==:::;:-:::::::--.. =----------+ -- :::=------------------------------------------- ----
0 -1-· l ---I- I·· --1------1----+-----l---·-f ; 1& 11 1e 79 8D 81 82 e3 04 es es
Source: U.S. Department of Labor
....
......
19n= 100
Figure 4
U.S. Carbon Steel Industry Indexes of output, employee hours, and output per employee hour
. 140 l 1251. 110
• • • Employee hours
-- Output per emp. hr •
-·· Output .., _______ "'
~-~, A
,.,.r-•..... ·. "'' ,,,,"'"' \ lee=• '· • •. ', .,,, \ t ·. '-'"''
95 l .......... ··. \ . \
··.\
. ·~ . ,-""-------"'-80 . ' . ,-"' ---T
' , -~ ~ / I ~ -~ 65 L ',~:>,=:··-···~··· ····· 50 -I :,, f-·--+---+--~~4 ···~······~
..
76 77 78 79 BO Bl 82
Source: U.S. ~partment of Labor
.QC)
19
The combined effects of relatively low demand for steel during the past
several years, import competition, and declining prices had a pronounced
effect on the steel industry and on labor. For example, the average number of
wage employees declined 63 percent from 342,000 in 1979 to 128,000 during
1986, !I while raw steel production declined 41 percent from 136 million to 80
million tons. During the same period, labor productivity increased sharply.
It has been estimated that in the United States, man-hours per ton of steel
shipped fell 30 percent to 6'.4 hours during 1986, from 9.2 hours in 1979. i1
Measures taken by the industry which resulted in the increase in labor
productivity have had a significant effect on cost. A recent study estimates
that 72 percent of all operating cost reductions per ton shipped since 1982
came from lowering employment cost. 11 Other areas where cost savings were
achieved included improved product yields, installation of new equipment,
increased energy efficiency, and lower raw materials costs.
!/ As reported by 64 steel representing 87 percent of ~/ World Steel Dynamics. 11 Confronting the Crisis: Associates, Inc. Report to p. 2 and table 3-4.
companies to the American Iron and Steel Institute U.S. raw steel production.
The Challenge for Labor, by Locker/Albrecht United Steelworkers of America, December 16, 1985
20
During 1986/87, differences in the total hourly employment cost (THEC)
among the "major" producers significantly narrowed. This was the result of
the "level playing field" concept advanced by the USWA, which reflected the
union's desire to take labor cost out of competition (i.e., not to give a
competitive edge in wages to any one company). The equalizing of THEC was
generally achieved for the major producers which were not operating under
Chapter 11 of U.S. Bank~ptcy Law.
lssues.--Some of the major issues that dominated the labor negotiations
and are likely to be significant in the future include: incentive pay,
overtime, wage and benefit rollbacks, and. the contracting out of work.
Incentive pay is linked to production standards that were agreed upon by
the USWA and the steel companies. They are based on a Cooperative Wage Study
developed by the union and the steel companies which establishes the
following: (1) jobs which qualify for incentive pay, (2) the criteria on
which the level of incentive pay should be established, and (3) the criteria
under which incentive production levels are established. !I In 1986/87 the
straight time incentive earnings were $1.58 per man-hour worked, which
!I United Steelworkers of America.
21
represented 14 percent of the base straight time earnings and 7 percent of the
THEC. !I
The union sought to reduce overtime to a minimum so that laid off
employees could be recalled to work. The USWA claims that it has been common
practice in the industry to use .. forced overtime .. which enables companies to
control the size of the labor force and reduce labor costs. According to
Bureau of Labor Statistics data, the use of overtime hours increased 133
percent from 1.5 hours per worker in 1982 to 3.5 hours per worker by August
1985. The report prepared by Locker and Associates estimates that the
elimination of all overtime hours in 1985 would have provided 13,900 jobs,
increasing steelworker employment by approximately 9.2 percent.
With respect to wage and benefit rollbacks, compensation reductions have
generally taken the form of reductions in hourly wages paid as well as
reductions in holidays and Sunday premium bonuses. Some reductions in
insurance costs have also been achieved. ~/
The issue of the contracting out of work was of particular concern to the
USWA (see further discussion in the section on .. Contracting out"). For years
companies have found it more expedient to contract out work rather than to use
in-house labor forces or to recall laid-off steelworkers. Under the current
contracts, language that forbids many kinds of contracting out ~as adopted.
As a result, work capable of being performed by union members is to be
performed by them, thereby limiting the ability of companies to contract
out. 'J_/
!/ As reported by 64 steel companies to the American Iron and Steel Institute. ~I United Steelworkers of America. 'J.I United Steelworkers of America's summaries of proposed agreements.

22
Review of Settlements.--Following is summary of the wage and benefit
reductions agreed to during 1985-87 and a review of the final contracts
reached with Armco and USX during the latter part of 1986 and early 1987.
Additional material on Bethlehem's and Inland's contracts (which were
negotiated in 1986) has also been included. Total wage and benefit reductions
for the major firms are as follows:
Effective date of
Cotnpany .agreement
Wheeling-Pittsburgh!/ ..... 8/85 LTV !I ................... 4/1/86 National ...............•• 4/28/86 Bethlehem .............•.. 7 /l/86 Inland .................•. 8/1/86 usx ...................... 2/1187 Armco:
Ashland ................ 12/1/86 Baltimore .............• 12/1/86 Kansas City ........... ." 12/1/86
!I In Chapter 11 bankruptcy proceeding. ~I 1985 settlement agreement. 'J.I Not available.
THEC Reduction New Expiring (per hour)
~/ $18.00 3/ 3/ !/ $18.09 us.19 $3-:-60 $22.21 $23. 72 $1.51 $22.50 $24.84 $2.34
'}./ 3/ 'J_/ $22.50 $24.84 $2.34
'J.I 'J.I 'J_/ 'J.I 'J.I 'J_/ 'J.I 'J.I 'J.I
~I Includes a $3.50 per hour reduction as a result of the Pension Benefit Guaranty Corporation's assumption of pension liabilities (as estimated by World steel Dynamics).
Armco Inc !/.--Negotiations between the USWA and Armco resulted in
three separate agreements affecting Armco plants at Ashland, KY, Baltimore,
MD, and Kansas City, MO (including Union Wire Rope). ~/ The agreements, which
are in effect from December 1, 1986 until July 31, 1989, are reportedly based
on the competitive situation of the product line at the respective plants.
!I Armco, Inc., Swranary of the Armco/USWA Settlement, November 4, 1986 and United Steelworkers of America. ~I Armco's· Middletown Ohio plant is represented by an independent union, the Armco Employees Independent Federation.
23
At Ashland, total labor cost reductions amount to $0.33 per hour.
Savings are principally from insurance cost containment and some job
elimination. Cost-of-living (COLA) provisions are eliminated for the duration
of the contract. At Baltimore, total wage and benefit reductions of $3.25 per
hour were achieved through the elimination of COLA, two holidays, and certain
premium payments. Sunday premium was reduced from time and one-half to time
and one-quarter and shift differentials were reduced. Baltimore further
agreed to substantial job·reductions and changes in work rules. Special
retirement options will be provided to assist in job reductions. At Kansas
City, total wage and benefit reductions amounted to $2.25 per hour. The COLA
was eliminated for the duration of the agreements. Vacation and Sunday
premiums were reduced in the same manner as at the Baltimore plant. Premium
pay for holidars worked was reduced from double time to time and one-quarter.
Contract clauses applicable at all three plants include the protection of
supplemental employment benefits from any reductions, addition of a new
employee savings plan, and addition of a profit-sharing program . The
negotiated contracting out provisions are similar to those of other companies.
Bethlehem Steel Corporation.--The Bethlehem agreement is in force
from July 1, 1986, to August 1, 1989. Under the agreement total wage and
benefit reductions amount to $2.34 per hour, including a 38 cents per hour tax . saving, a reduction of Sunday premium pay, a suspension of the cost-of-living
adjustment, and a modification of vacation pay. Virtually all of Bethlehem's
production workers are covered under the agreement.
In return for the wage and benefit concessions, Bethlehem will make
annual adjustments if profits are sufficiently high. A $1.5 million . .
contribution for the purpose of job placement, counseling and retraining for
24
displaced workers is also part of the agreement. The company also agreed to
capital investment of up to two billion dollars in steel and steel related
projects.
Inland Steel Corporation.--The Inland agreement is in effect for a
three-year period, ending August 1, 1989. The agreement reduces total wages
and fringe benefits by 40 cents per hour, which was offset by increases in
other areas of an equal amount. There are 11,654 workers covered under the
agreement at Inland's Indian~ Harbor Works, East Chicago, Indiana.
Additional features of the agreement include: a negotiated
profit-sharing plan, under which 10 percent of the total pre-tax profits of
the company will be distributed to workers according to their number of hours
worked; a voluntary gain-sharing plan; a tax-exempt savings plan; a limitation
on contracting out; increased pension and health insurance benefits; and
changes to improve the seniority system.
USX Corporation.--After a 184-day strike, USX Corp. reached an
agreement with the USWA that is to remain in effect from February 1, 1987 to
March 31, 1991. This agreement provides for a reduction in total labor costs
of $2.35 per hour in the first year, of which $0.99 are wage concessions and
$1.36 are benefit concessions. A profit-sharing plan provides for payback for
some, or potentially all, of the wage and benefit concessions.
The agreement further provides for improvements in pension and health
insurance benefits, improvements in supplemental unemployment benefits, and
provision for $2.4 million for retraining dislocated workers. Under the
contract, USX agreed to make new capital investments at its Kon Valley (PA)
and Fairfield (AL) works facilities. Moreover, $37 million of "shut-down"
benefits are to be paid by USX to more than 4,000 workers at idle facilities.
As a result of the agreement 1,346 jobs at USX plants will be eliminated.
25
Steel labor topics.--The purpose of this section is to examine selected
labor issues affecting steel industry competitiveness. The major topics
addressed in this section are:
o Comparative labor costs in integrated steel mills, specialty steel mills, and minimills;
o The effects of "reconstituted" mills on competitive balances (which addresses a number of factors in addition to labor);
o Pension liabilities;
o Contracting out; and
o Labor/management relationships.
Comparative labor costs in integrated steel mills, specialty steel
mills .--As previously indicated, total labor costs account for a substantial
portion of operating costs and are an important element of cost
competitiveness. In those markets in which minimills compete (i.e. primarily
in steel bar, rod, and shape markets), their relatively low wage costs place
significant competitive pressures on integrated mills.
According to data compiled by the American Iron and Steel Institute, the
total hourly employment cost (THEC) for production and maintenance workers in
the steel industry averaged $23.24 in 1986. !I The THEC consisted of average
regular hourly earnings of $13.00, additional payroll costs of $3.22 (which
include shift differentials, SUnday and holiday premium, and overtime work)
and employee benefits of $7.02 (which include pensions, insurance, vacation
plans, and social security).
There were significant variations in THEC among the 14 integrated
companies surveyed. The variance among the largest producers amounted to 21
!I The American Iron and Steel Institute reports on 64 companies representing 87 percent of U.S. domestic raw steel production capacity.
26
percent. The variations are a point of concern with certain producers who
have criticized the USWA for applying a double standard in their labor
negotiations. The level of the THEC is considerably higher for specialty
steel producers (i.e., producers of stainless and alloy tool steel), although
the variance among the companies was less than among the larger integrated
producers.
According to industry sources, THEC's have increased greatly in recent
years for steel companies which experienced reductions in force or temporary
shutdowns. The effect of a reduction in the labor force is to make the
remaining labor force more expensive, as certain fixed costs have to be
allocated over a smaller population of workers .. For example, according to
industry sources, a $23 THEC in a mill after a partial shut down (from 2,000
to 600 employees) could result in an increase in the THEC to $33 because of
lay-off benefits and other .. costs which the steel company may have to carry for
2 to 3 years.
Of the approximately 58 minimill plants located in the United States
(representing 42 companies), 24 are organized by the USWA. The 24 plants
account for over 50 percent of total minimill capacity. Available data and
discussions with industry sources indicate that the average straight time
hourly earnings in minimills equalled $11.38 in 1986, which compares to $13.00
for all domestic steel mills. When benefits are factored in, however, the
difference in THEC between minimills and integrated producers widens, as the
average minimill cost is estimated at $17.50 as compared to $23.24 for the
27
entire industry. !I The variance in THEC among minimills is believed to be
significant, ranging from about $16 to $22. The structure of the THEC among
the minimills also differs significantly. one company has a relatively low
wage and benefit rate with a production bonus plan that represents about 40
percent of the company's THEC. At another company with a comparable THEC, the
wage rate is higher, with benefits accounting for close to half of total
costsi the production bonus represents less than 5 percent of total costs.
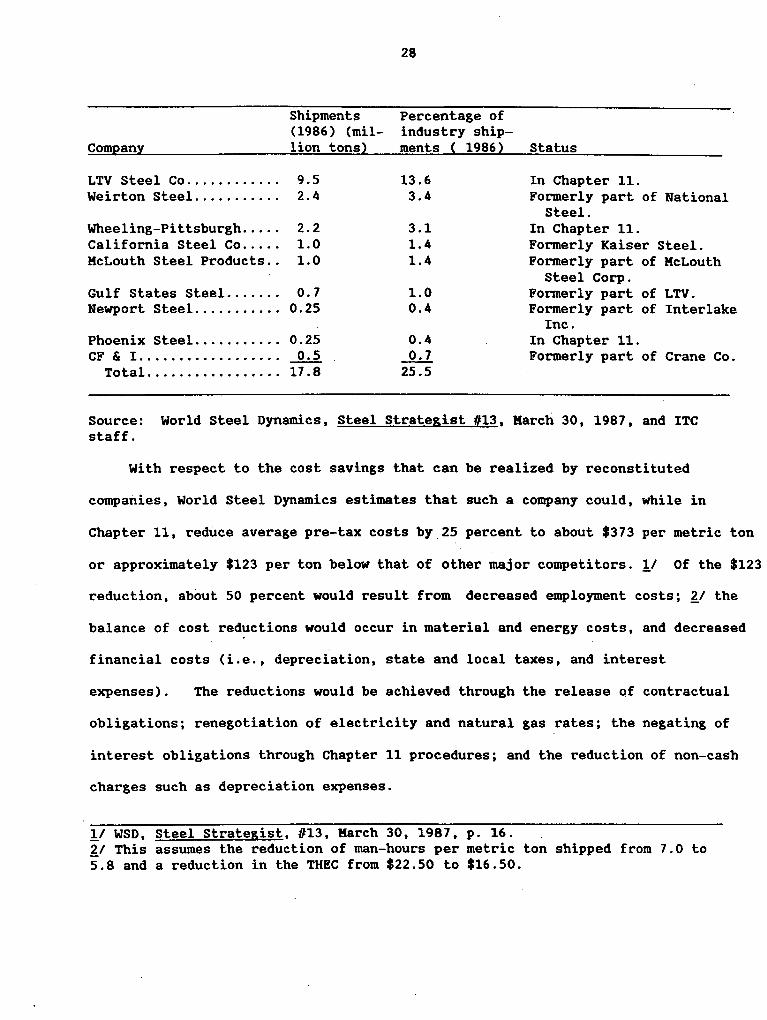
Reconstituted steel mills.--Restructuring within the steel industry
has given rise to a new competitive element which is commonly being referred
to as the "reconstituted" steel producer. The reconstituted producers are
comprised of companies (or parts of companies) which have been sold or
restructured through Chapter 11 bankruptcy proceedings. As of Karch 1987
there were 9 carbon steel producer companies in this category accounting for
an estimated 17.8 million tons (or 25 percent) of total industry shipments in
1986. ~/ All of the companies listed below have been "reconstituted" since
1979.
!/ The all-industry average largely reflects integrated producers' costs as these producers account for a preponderant share of total employment. ll The list consists of producers of carbon steel products (i.e., excluding specialty steel producers and, with the exception of Phoenix; minimills).
Shipments (1986) (mil-
Company lion tons)
LTV Steel Co............ 9.5 Weirton Steel ........... 2.4
Wheeling-Pittsburgh ..... 2.2 California Steel Co ..... 1.0 McLouth Steel Products .. 1.0
Gulf States Steel ....... 0.7 Newport Steel ........... 0.25
Phoenix Steel ........... 0.25 CF & I .................. _Q,d
Total ................. 17.8
28
Percentage of industry shipments ( 1986)
13.6 3.4
3.1 1.4 1.4
1.0 0.4
0.4 _hl 25.5
Status
In Chapter 11. Formerly part of National
Steel. In Chapter 11. Formerly Kaiser Steel. Formerly part of McLouth
Steel Corp. Formerly part of LTV. Formerly part of Interlake
Inc. In Chapter 11. Formerly part of Crane Co.
Source: World Steel Dynamics, Steel Strategist #13, March 30, 1987, and ITC staff.
With respect to the cost savings that can be realized by reconstituted
companies, World Steel Dynamics estimates that such a company could, while in
Chapter 11, reduce average pre-tax costs by 25 percent to about $373 per metric ton
or approximately $123 per ton below that of other major competitors. 11 Of the $123
reduction, about 50 percent would result from decreased employment costs; £1 the
balance of cost reductions would occur in material and energy costs, and decreased
financial costs (i.e., depreciation, state and local taxes, and interest
expenses). The reductions would be achieved through the release of contractual
obligations; renegotiation of electricity and natural gas rates; the negating of
interest obligations through Chapter 11 procedures; and the reduction of non-cash
charges such as depreciation expenses.
11 WSD, Steel Strategist, #13, March 30, 1987, p. 16. £1 This assumes the reduction of man-hours per metric ton shipped from 7.0 to 5.8 and a reduction in the THEC from $22.50 to $16.50.
29
Pension liabilities.--The matter of unfunded pension liabilities in
the steel industry is one which has received increased attention during the
past year. As restructuring in the industry has occurred, pension obligations
have proved to be increasingly burdensome to certain companies. In the case
of LTV, it was considered the single most important element in the company's
filing for protection from creditors under Chapter 11. Under Chapter 11, such
obligations can be assigned or transferred to the Pension Benefit Guaranty
Corporation (PBGC).
The PBGC, an independent agency of the U.S. Federal Government, was
established under Title IV of the Employee Retirement Income Security Act of
1974. The PBGC was intended to be a small, inexpensive program to protect
workers in those instances where pension plans terminated without sufficient
funds to pay employee benefits. In 1972, a Labor Department study concluded
that such a program would incur about $25 million in net claims each year.
currently PBGC pays estimated monthly pension benefits of about $660 million
per year. !I
The PBGC guarantees the pension plans of U.S. workers in a range of
industries. As of March 1987, 81 percent of all PBGC claims were by steel
companies and amounted to approximately $535 million for the year. The 182
plans terminated by steel companies represented about 14 percent of the 1,345
plans terminated. Net claims or under-funding for the 182 steel plans amount
to $3.1 billion as opposed to $3.9 billion for all 1,345 plans.
Underfunding of the pension plans has occurred as companies experiencing
operational problems encountered difficulties setting aside resources to fund
11 Statement by Dr. Kathleen P. Utgoff, Executive Director, PBGC as quoted in News Release, Tuesday, January 13, 1987, "Pension Benefit Guaranty Corporation to Take Over LTV Steel Pension Plans".

30
their pension plans. As of May 1987, the PBGC was responsible for providing
benefits to 151,900 workers in the steel industry, 76,875 of which were
already retired. Following is a tabulation showing the major steel industry
pension plans terminated as of May 1987. !I
Company
Allan Wood Steel Co. Continental Steel Corp. McLouth Phoenix Steel Corp. Washburn Wire Wheeling-Pittsburgh
Steel Corp. Wisconsin Steel Co. Kaiser Steel
LTV: Republic Steel
Date of termination
1977 1986 1982 1983 1976 & 1979
1985 1980 1987
Retirement Plan 1986 Jones and Laughlin
Retirement Plan (salaried) 1987
Pension Plan of Republic Steel (hourly) 1987
Jones and Laughlin Hourly Pension Plan 1987
Subtotals for LTV Steel
Total for steel companies
Other companies
Grand total
Plan· underfunding (in millions)
$41 $61 $51 $43 $21
$498 $62
·$27
$230
$320
$540
$1,230
$2,320 !I
$3,097
_JlQ1
3,900
workers Covered
3,400 3,200 5,500 3,200 1,500
21,500 4,000 1,000
43,300
7,700
15,400
41,600
43,900
108,600
151,900
213,100
292,700
current!] retired
1,100 1,600 1,400 1,100
700
10,000 1,400
175 17,475
3,300
7,700
22,400
26,000
59,400
76,875
94,025
170,900
!I Represents. the difference between the estimated present value of guaranteed benefits ($3,640) and the assets in trust ($1,320).
l/ Source: Pension Benefit Guaranty Corporation, News Release Jan. 13, 1987 and Major Steel Industry Pension Plan Terminations, Table-undated and LTV Corporation Pension Facts, undated.
31
The latest and largest addition to the PBGC group of steel companies was
the court approved termination of three LTV Steel pension plans on January 13,
1987. In 1986, LTV Corp. had three times as many retirees (71,000) as
employees (25,000), and was paying annual pension payments of $380 million.
An important issue is whether LTV will continue to cover $90 million in annual
health and life insurance premiums for retirees, or whether the PBGC will
assume the costs.
Additional supplemental benefit payments of $400 (to be paid to
approximately 10,000 retirees) is to be decided by the Bankruptcy court. The
$400 would be for losses suffered as a result of plant closings, negotiated
work force reductions, and job or skill consolidations.
The PBGC estimates that as of Kay 1987 the total pension underfunding for
five other major steel companies (Bethlehem, Armco, National, usx, and Inland)
was between $4 to $6 billion. The underfunding includes 420,000 participants
in the pension plans of those 5 companies, of whom 220,000 are already retired.
As indicated earlier, the termination of steel pension plans can have a
significant effect on labor costs. By terminating its plans, Wheeling
Pittsburgh saved over $3.00 per hour in pension costs as its THEC fell to
$18.00 per hour. The transfer of LTV pension liabilities to the PBGC has
saved the company an estimated $3.50 per hour labor cost, 11 decreasing its
total employment costs to about $18 per hour.
11 World Steel Dynamics.
32
Contracting out.--Contracting out is the practice of subcontracting
steel mill work to outside contractors. The issue has been particularly
sensitive in light of the unprecedented lay-offs in the industry. Most of the
subcontracting has traditionally consisted of maintenance tasks. In its drive
to improve its competitiveness by lowering costs, however, companies in recent
years have explored new areas for subcontracting.
According to industry executives, contracting out or subcontracting was
the single most important issue in the 1986/87 labor negotiations. It is
estimated that the equivalent of 8 percent of the steel labor force of
approximately 147,000 wage earners, or 12,000 full time steelworkers' jobs
were contracted out in 1986. !I This translates into approximately 24 million
hours of labor. The amount of contracting out varies significantly among the
larger integrated steel companies. While some companies contract out only 1
to 2 percent of their total labor hours, others reportedly contract as much as
25 percent, or more.
How one major steel company is looking upon subcontracting is illustrated
in the following statement made by a steel company official to a group of
investment bankers: i1 "After extensive analysis in 1983, we (USX) developed
a plan which we put into effect in late 1983 . The major attack we made
on the cost side of the equation was to try to reduce our cost of manpower and
better utilization . . We supplemented this with teams of industrial
engineers to work with the plant organization to define detailed job analysis
of each position and determine what activities required steel worker
!I World Steel Dynamics. i1 Thomas J. Usher, Senior Vice President, Operations, Steel, at USX, speaking to a group of Wall Street investment bankers, in 1985. As presented in the USWA publication USX Special Report, undated.
33
expertise, what activities had to be performed on plant site, and what
activities could be performed more economically by non-steel workers,
remembering that our wage costs are substantially higher than manufacturing
labor costs in general. As a result of this kind of effort, we have been
shedding service and support functions where steel worker expertise is not
required. We have ceased the manufacture of process consumables. We have
closed foundry shops. We've cut back on machine shops. We've cut back on
plants, we have reorganized the maintenance effort, and functions such as
shearing, slitting, and finishing steel products, which are high-man-hour
operations, have been transferred to processors outside the plant with lower
unit conversion costs."
Another dimension of subcontracting occurs in instances where a steel
company purchases semifinished products from another manufacturer, domestic or
foreign, thereby saving on employment or, possibly, investment cost. For
example, the purchase of steel slabs and hot rolled bands from South Korea and
Brazil for finishing on domestic mills would fall into this category.
Another producer with whom the issue was discussed noted that
flexibility is a major advantage associated with contracting out.
Specifically, it was noted that steel labor becomes less expensive if the size
of the labor force can be varied according to need; this is reportedly easier
to achieve with subcontracting. Some major producers estimate that a 15- to
30-percent increase in labor productivity can be attained by using
subcontractors.
As indicated earlier, the issue of contracting out was negotiated with
companies during the past 2 years. The result was that all contracts which \
were negotiated by the major producers acknowledge the principle that, "work
34
capable of being performed by bargaining unit employees shall be performed by
such employees." USWA did not object to subcontracting in certain
situations. It was acceptable, for example, if warranty on equipment required
the original manufacturer to perform the work or if special skills or special
equipment were required. What the USWA wanted to prevent during the recent
labor negotiations were instances where companies might sell part of a steel
plant (such as a machine shop or finishing shop) in order to allow other
parties to set it up as an independent contract operation.
Labor/management relationships.--Restructuring in the steel industry
has resulted in significant changes in traditional labor management
relationships, with an increased emphasis on developing cooperative solutions
to problems. One of the more prominent examples can be found at LTV Steel
Co.'s recently constructed state-of-the-art, 72 inch wide electrogalvanizing
line, which is capable of producing 400,000 tons per year of rust-resistant
steel to be pressed into automobile body parts (at its Cleveland Works). The
line is operated by the L-S Electrogalvanizing Company (L-SE), a joint venture
of LTV and Sumitomo Metal Industries, Ltd. (SHI). Basically, LTV provides
operating, sales, marketing, and field ·services, while SHI supplied its
vertical cell, anode plating technology.
The major innovation at L-SE is that a separate labo~ agreement was
concluded between the company and the USWA. In lieu of rigid job classes,
only three skill levels were established, as follows:
35
Classification level Pay per hour Pay category
Skilled $13.50 Straight time rate 2.00 Bonus 1.00 Overtime
$16.50 Total
Intermediate $10.00 Straight time rate 2.00· Bonus 1.00 Overtime
$13.00 Total
Entry and general $8.75 Straight time rate 2.00 Bonus 1.00 Overtime
$11. 75 Total
Bonuses are paid twice a year to all 60 employees; overtime is paid after
40 hours per week. Workers are paid salaries at a rate applicable to 80 hours
of work at straight time during a two week period. There is no cost of living
adjustment, nor extra pay for afternoon, night, or Sunday work. All employees
have guaranteed salaries while laid off (for a maximum of 52 consecutive.
weeks) and are entitled to disability payments, supplemental salary, and
severance allowance. Moreover, workers have a voice in major decisions,
including hiring and firing.
The plant is viewed by both the union and the company as an important
experiment which could serve as a model for changes in other plants. The 45
USWA members and 15 managers have been trained to run the plant as a team
which is cross-trained in various skills. Managers assist in nonsupervisory
activities related to plant operations, and actively solict suggestions and
ideas from junior members of the team.
Each of the 60 employees received the equivalent of more than 800 hours
of classroom preparation, as well as on site training at the SHI Kashima line
36
(in Japan) and the L-SE line in Cleveland. Of the 60 employees all are high
school graduates with various levels of technical or maintenance training.
The L-SE plant is claimed to be the most productive facility of this type
in the United States, requiring 0.3 to 0.4 man-hour per ton of steel for
finishing operations, which compares favorably to the 0.5 man-hour per ton for
a similar facility in Japan. U.S. plants reportedly average approximately
1 man-hour per ton in galvanizing operations.
37
U.S. producers' capital expenditures and research and development expenditures !/
Carbon and certain alloy steel.--Capital expenditures for carbon and
certain alloy steel operations declined for the second consecutive year during
1986/87 to $1.2 billion, representing a decrease of 36 percent from the
expenditure level of $1.8 billion achieved during 1985/86 and 51 percent from
the expenditure level of $2.4 billion during 1984/85. In both 1985/86 and
1986/87, primary steelmaking (including ironmaking, cokemaking, and
semifinished steelmaking facilities) accounted for the largest share of total
capital expenditures (55 percent in 1985/86 and 67 percent in 1986/87),
although actual expenditures in this area fell by 21.8 percent from 1985/86 to
1986/87. Increases in capital expenditures were recorded in wire rod, wire,
and wire products Can increase of 49 percent from 1985/86 to 1986/87).
Capital expenditures declined during the period in the remaining six product
categories, with decreases ranging from 6 percent in bars to 85 percent in
pipe and tube.
Producers' research and development expenditures also declined for the
second consecutive.year during 1986/87 to $81.4 million, a decrease of about
16 percent from expenditures of $96.4 million during 1985/86 and 29 percent
from expenditures of $113.9 million during 1984/85. Research and development
expenditures declined in all areas except plates, bars, and rails and related
products. In both 1985/86 and 1986/87, projects in the sheet and strip
product area accounted for the largest share of research and development
expenditures (40.0 percent in 1985/86 and 41.7 percent in 1986/87).
!I Detailed data on U.S. producers' capital expenditures and research and development expenditures during July 1, 1986-June 30, 1987 are presented in app. D ..

38
Certain stainless and alloy tool steel.--Total capital expenditures for
the production of certain stainless and alloy tool steel products were $56.7
million during 1986/87, a decline of 30 percent from expenditures of $80.4
million during 1985/86 and 57 percent from expenditures of $132.0 million
during 1984/85 (table 5 and app. D, table D-5). Plates (down 76 percent),
pipes and tubes (down*** percent), and wire (down*** percent) exhibited
the largest declines.
Spending for research and development also declined for the second
consecutive year, falling 14 percent from $17.1 million during 1985/86 to
$14.8 million during 1986/87, a decline of 19 percent from spending of $18.1
million during 1984/85. The most significant declines were in steelmaking
facilities (down*** percent) and pipes and tubes (down 54 percent). There
was a significant increase in research and development spending for sheets and
strip (up*** percent).
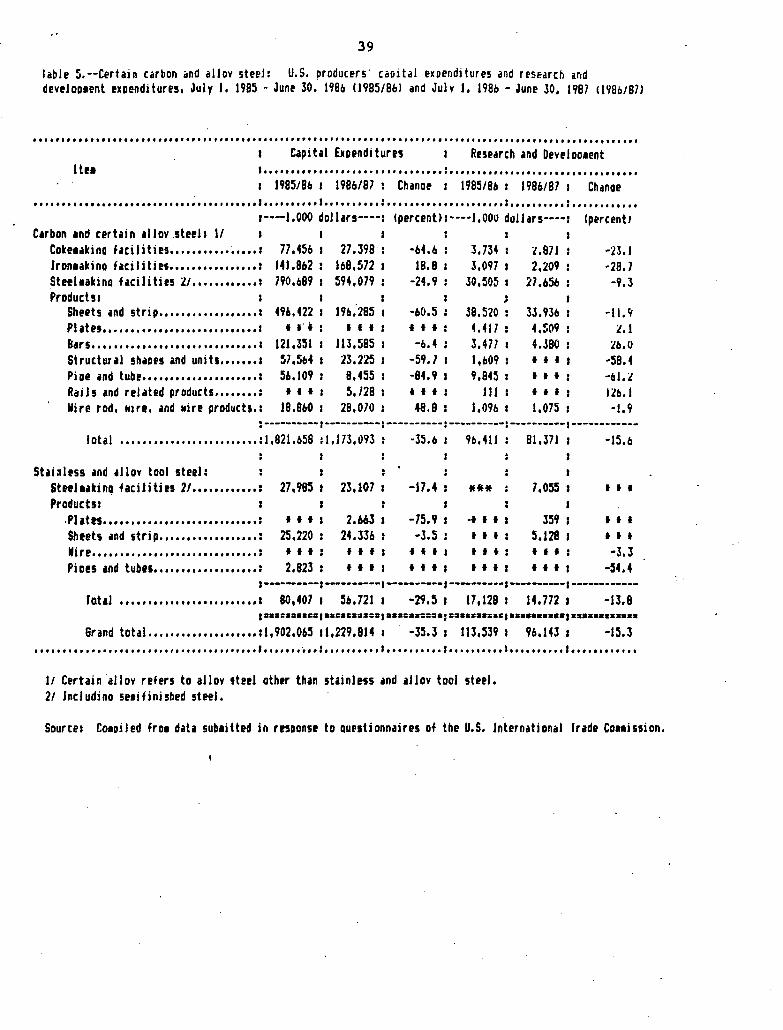
39
lable 5.--Certain carbon •nd allov steel: U.S. producers· caoital exoenditures and resEarch and develoo1ent exoenditures, July J, 1985 - June 30, 1986 C1985/8bl and Julv 1, 198b - June 30, 1987 ClYBb/87)
·····••··•···•·•········••··•·•··•····•····•·•··•······································•·······•············ Capital Exoenditures Research and Develoo1ent
ltH : ................................ : ................................. . 1985186 1 198b/87 : Chanoe 1 1985/Sb : 1986/87 1 Chanae
II t I Ill I II flllll Ill Ill It I II I~ I I II 1111ttlltt111111I1111 Ill I I I I I: II It Ill I tit I I fl Ill I I 1111III11111: II I II II Ill I I
1----1.000 dollars----: lpercent>1----1.ooo dollars----: I percent I Carbon and certain 1llov .1leel1 1/
Coke1akina facilities •••••••••••••••• 1 77,45b 27.398 -b4.b 3.734 : ~.871 -23.1 Jron1akina facilities •••••••••••••••• : 141.862 168,572 18.8 ~.097 I 2,209 ·28.7 Steel1akina facilities lJ •••••••••••• : 790,689 594,079 -24.9 J0,505 I 27,650 -9.l Product11 J
Sheets ind strip •••••••••••••••••• : 496.422 1911."285 -6{1.5 38.520 : 33.9311 -11.rt PJ1tes •••••••••••••••••••••••••••• 1 I t"i I f I f I I 4. 417 : 4.~09 :t.l Bars •••••••• •••••••••••• •••••••••• : 121,351 113,585 -6.4 3,471 I 4.JBO 1b.O Structur•l shaoes and unit1 ••••••• 1 57,5114 23.225 -59.1 l,b09 : f I I -58.4 Pine and tube ••••••••••••••••••••• : 56.109 8,455 -84.9 9,845 f f I -61.:t R~iJs •nd related products •••••••• : I I I 5,/28 I f f 11 l : I I I 1111.1 Nire rod, wire. and Nire products.: 18.BbO 28.070 48.8 J,0911 I 1,075 -1.9
:----------1----------:----------:----------:----------1------------Iota! I I I It I I I I I I I I I I I I I I I I t I I I I : J, 821. 658 :1,173,093 ·35.6 9b. 411 81,371 -IS.ti
Stai~less and •llov tool steel: Steelaakinq facilities 21 •••••••••••• : 27,985 23, 107 -17.4 *** 7,055 I f I
Product11 I
.PJ1tts •••••••••••••••••••••••••••• : I I I 2.663 -75.9 ·I f I I 359 I I I
Sheets and strip •••••••••••••••••• : 25,220 24.336 -3.5 f I f : 5.128 f f I
Nire •••••••••••••••••••••••••••••• : f I f I I I f I f I I I : I I I -3.3 Piues and tubes ••••••••••••••••••• : 2.823 I I I I I I f I I I I I I -54.4
1----------1----------1----------1----------:----------1------------Ta.til •••• , ••••••••••••• I •• I •• ' I 80,407 I 56,721 I -~.5 I 17 1 128 I 14,772 I -13.8
Grand total •••••••••••••••••••• :1,902,065 11,229,814: ·35.3 I 113,539 I 96,143 I -15.3 •••••••••••••••••••••••• , ••••••••••••••• 1 ••••••• ~ •• J •••••••••• : •••••••••• 1 •••••••••• : •••••••••• 1 ••••••••••••
It Certain allov refers to allov tteeJ athtr than stainless and 1Jlov tool steel. 21 Jncludino se1ifinished steel.
Source: Co1oiled fro1 data sub1itted in rtsoonse to Questionnaires of the U.S. International lrade co .. ission.
40
Financial experience of U.S. producers
During the 12-month period ending June 30, 1987, sales of steel products
totaled approximately $27.8 billion, down*** percent from sales in the
preceding 12-month period. Net losses occurred in most product categories, as
overall losses as a percent of sales rose from -3.7 percent to -5.7 percent
(table 6 and app. D, tables D-6 and D-7).
The financial conununity continues to respond to unfavorable financial
conditions in the industry by progressively downgrading the ratings assigned
to companies on certain financial instruments, such as bonds: Table 7 lists
Moody's bond ratings for the top six U.S. steel producers. The ratings are an
indication of the confidence certain financial institutions place in the
investment quality of debt instruments issued by a company. The ratings are
one of several factors which influence market price movements in a bond over
its life. Generally, interest rates vary inversely to the bond ratings.
While all bonds are rated individually fo~ a single company, ratings are
usually the same on all bonds of the company issued in the same rating
period. The major exceptions to this rule are subordinated debentures of a
company, which are rated lower than its bonds.
The Moody's ratings indicate a deterioration in almost all companies'
standings since January 1986. Only National Steel, whose rating rebounded
slightly from B3 to Ba3, showed any improvement over the year. As of June
1987, all these companies' bonds were rated as falling below the level of
medium-grade obligations, a rating two of them held last year. This rating
indicates that the obligations are speculative in nature. The Chapter 11
filing of LTV Corp. severely depressed the rating of its bonds, as they are
currently considered to be· highly speculative. The bonds of the companies
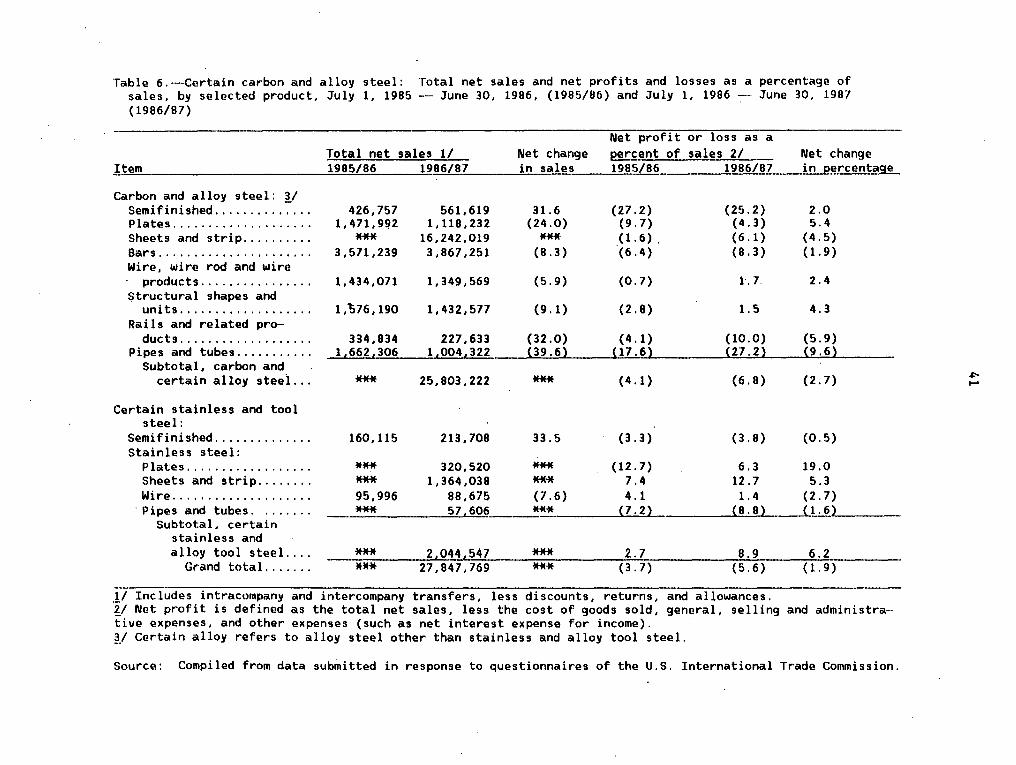
Table 6.-··-Certain carbon and alloy steel: Total net sales and net profits and losses as a percentage of sales, by selected product, July 1, 1985 -- June 30, 1986, (1985/86) and July l, 1986 -- June 30, 1987 (1986/87) .
!.tem _
Carbon and alloy steel: !/ Semifinished ............. . Plates ................... . Sheets and strip ......... . Bars ..................... . Wire, wire rod and wire
products ............... . Structural shapes and
uni ts .................. . Rails and related pro-
ducts .................. . Pipes and tubes .......... .
Subtotal, carbon and certain alloy steel ...
Certain stainless and tool steel:
Semi finished ............. . Stainless steel:
Plates ................. . Sheets and strip ....... . Wire ................... .
· Pipes and tubes. . ..... . Subtotal, certain
stainless and alloy tool steel ... .
Grand total. ..... .
Net profit or loss as a Total net sales 1/ Net change ~ercent of sales 2/ Net change 1985/86 1986/87 in s~les 1985/86 1986/87 in_p_¥rc~nt~~
426,757 561,619 31.6 (27.2) (25.2) 2.0 1,471,9!?2 1,118,232 (24.0) (9.7) (4.3) 5.4
*** 16,242,019 *** (1.6), (6.1) (4.5) 3,571,239 3,867,251 (8.3) (6.4) (8.3) ( 1. 9)
1,434,071 1,349,569 (5.9) (0. 7) 1. 7. 2.4
1,°!;76, 190 1,432,577 {9.1) (2.8) 1. 5 4.3
334,834 227,633 (32.0) (4.1) {10.0) (5.9) 1,662,306 1,004,322 f19.6J_ . ~--{ll_._U~-u (27.2} (9.6}
*** 25,803,222 *** (4.1) (6.8) (2. 7)
160, 115 213,708 33.5 (3.3) (3.8) (0.5)
*** 320,520 *** (12.7) 6.3 19.0
*** 1,364,038 **"* 7.4 12.7 5.3 95,996 88,675 (7 .6) 4.1 1.4 (2.7)
*** 57 606 *** CL2} {!I . 8) {1. 6.L-> --·
*** 2,044,547 *** 2.7 - (3. 7f **"* 27,84"7,769 *** 8.9 6.2
(5.6) (1. 9)
1;-Incl~des intracompany and intercompany transfers, less discounts, returns, and allowances. l/ Net profit is defined as the total net sales, less the cost of goods sold, general, selling and administrative expenses, and other expenses (such as net interest expense for income). 11 Certain alloy refers to alloy steel other than stainless and alloy tool steel.
Source: Compiled from data submitted in response to questionnaires of the U.S. International Trade Commission.
~ .....
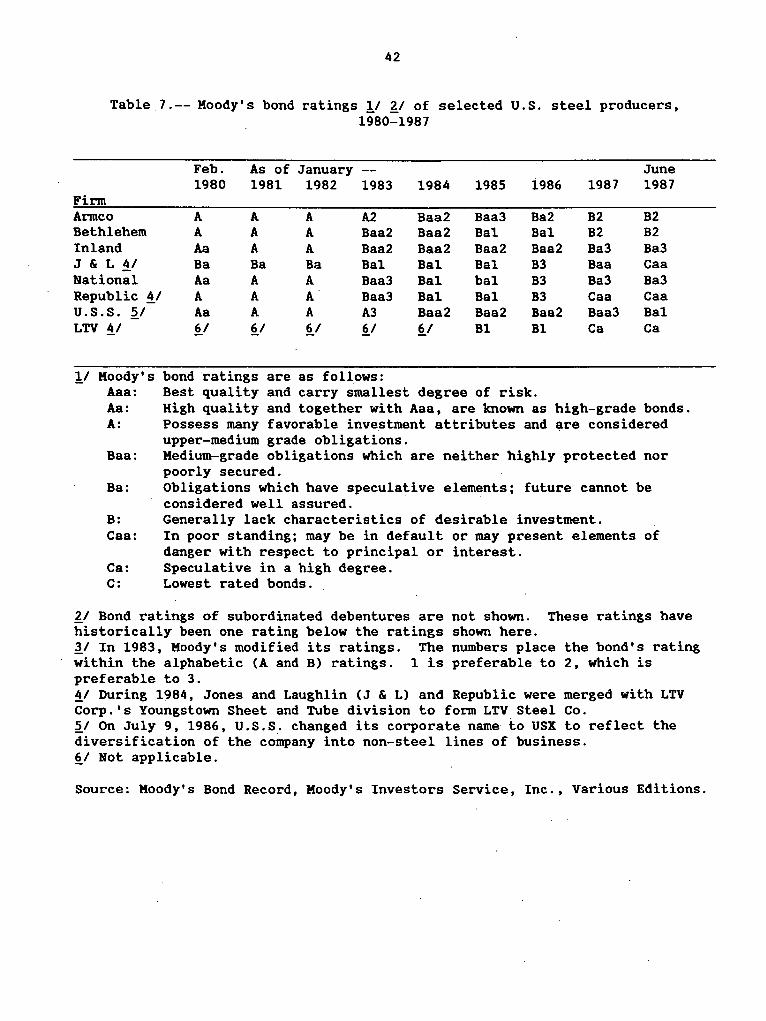
42
Table 7.-- Moody's bond ratings !I 'l,/ of selected U.S. steel producers,
Firm Armco Bethlehem Inland J & L !I National Republic 4/ u.s.s. 2_/ LTV !I
!/ Moody's Aaa: Aa: A:
Baa:
Ba:
B: Caa:
Ca: C:
1980-1987
Feb. As of January June 1980 1981 1982 1983 1984 1985 i986 1987 1987
A A A A2 Baa2 Baa3 Ba2 B2 B2 A A A Baa2 Baa2 Bal Bal B2 B2 Aa A A Baa2 Baa2 Baa2 Baa2 Ba3 Ba3 Ba Ba Ba Bal Bal Bal B3 Baa Caa Aa A A Baa3 Bal bal B3 Ba3 Ba3 A A A Baa3 Bal Bal 83 Caa Caa Aa A A A3 Baa2 Baa2 Baa2 Baa3 Bal 6/ ~I §_I 6/ §_I Bl Bl Ca Ca
bond ratings are as follows: Best quality and carry smallest degree of risk. High quality and together with Aaa, are known as high-grade bonds. Possess many favorable investment attributes and ~re considered upper-medium grade obligations. Medium-grade obligations which are neither highly protected nor poorly secured. Obligations which have speculative elements; future cannot be considered well assured. Generally lack characteristics of desirable investment. In poor standing; may be in default or may present elements of danger with respect to principal or interest. Speculative in a high degree. Lowest rated bonds.
£1 Bond ratings of subordinated debentures are not shown. These ratings have historically been one rating below the ratings shown here. ~I In 1983, Moody's modified its ratings. The numbers place the bond's rating within the alphabetic (A and B) ratings. 1 is preferable to 2, which is preferable to 3. !I During 1984, Jones and Laughlin (J & L) and Republic were merged with LTV Corp.'s Youngstown Sheet and Tube division to form LTV Steel Co. 2_/ On July 9, 1986, U.S.S. changed its corporate name to USX to reflect the diversification of the company into non-steel lines of business. §_/ Not applicable.
Source: Moody's Bond Record, Moody's Investors Service, Inc., Various Editions.

43
absorbed by LTV in 1984, Republic and J & L, were also downgraded to the point
where the principal or interest may be considered to be in danger.
The serious financial problems confronting the industry are also reflected
in the fact that within the study period, five U.S. steel producers either
ceased operations or filed for protection from creditors under Chapter 11 of
the federal bankruptcy code. These firms are listed in the following
tabulation:
Filed under Chapter 11 LTV Steel Sharon Steel Phoenix Steel
Shut down Judson Steel Roblin Steel
July, 1986 April, 1987 April, 1987
September 1, 1986 December, 1986
The firms which filed under Chapter 11 during the period joined
Wheeling-Pittsburgh and Eastmet, both of which had taken similar action at
earlier dates and have not yet emerged from that state.
In July 1986, LTV Corp., a conglomerate involved in aerospace, defense,
and energy products as well as steel, filed for protection under Chapter 11.
The nation's second largest steel producer, the LTV Steel division was formed
by the comb_ination of three steel companies; Jones and Laughlin, Youngstown
Sheet and Tube, and Republic Steel. The company has attempted to phase out
inefficient plants and combine efficient facilities to create a modern and
profitable entity. However, heavy losses in the steelmaking division, which
adversely affected cash flow, and large debt and pension obligations
overwhelmed profitable operations in other divisions. According to company
officials, the $1.7 billion in scheduled debt repayments over the next 3 years
and the $375 million in annual pension obligations were primary factors in
44
their decision to file for_ protection. !I As a result of the filing much of
LTV's pension liabilities were assumed by the Pension Benefit Guaranty
Corporation (PBGC), a move which has endangered the viability of the PBGC.
This move makes the PBGC the largest. single creditor of LTV.
The two other filings for protection ~nder Chapter 11 were by smaller
firms. Sharon Steel, a company which has had a history of financial
difficulties, filed for protection under Chapter 11 when a creditor threatened
liquidation proceedings. Pheonix Steel filed for protection under Chapter 11
for the second time this decade. The company had emerged from Chapter 11 in
1985, but said it needed more time to negotiate the sale of its facilities
than creditors were ready to grant. it
The two firms that shut down during the study period were also small
firms. Judson Steel, a rebar producer located in the San Francisco area, was
reportedly profitable at the time of its shut down, despite a recent history
of losses. However, the mill site is a valuable piece of property and the
owners of the mill, the Australian based firm of Peko-Wallsend, decided to
redevelop the property. While Peko-Wallsend confirmed the profitability of
the mill, they said that profitability levels did not meet internal criteria
for return on investment.
Two firms reported in financial trouble in last years report have changed
their status. Roblin Steel was in Chapter 11 (filed July, 1985) when it laid
off its workforce in November, 1986. Shortly thereafter its banks cut off
!I "LTV Corp. , Hurt by Steel Imports, Files Bankruptcy Petition," Washington Post, July 18, 1986. it "NeW$Watch", Iron Age, June 1987, Pg. 7.
45
lines of credit required for day to day operations. The officials of the firm
resigned as their liability insurance expired, and the bankruptcy court has
appointed a trustee to sell the compnay's facilities, either as a whole or in
pieces. ·'.
Enduro Stainless Corp., operating under Chapter 11 since February 21,
1986, was bought out by a group of investors and is now operating as Mercury
Stainless. Kentucy Electric steel, which had shut down August 2, 1985 after a
protracted labor dispute, soid its facilities to Newport Steel.
The following is a review of the profit arid loss performance of the
industry in key product groups during the twelve month periods ending June 30,
1986 and June 30, 1987.
Carbon and certain a'iloy steel.-- Total net sales of all carbon and
certain alloy steel products subject to the investigation amounted to $2S.8
billion, a decrease from last period's*** billion (table 6). Net losses
before taxes in the sector increased from*** billion to $1.7 billion
between the previous study period and the current one. !/ As a result, losses
as a percent of sales increased from 4.1 to 6.8. Three product areas showed
significant positive movement, as losses narrowed for plates from -9.7 to
-4.3, while wire products C-0. 7 to 1. 7) and structural shapes (-2.8 to 1.5)
both moved from net losses to net profits. Losses as a percentage of sales
were again greatest for semifinished products (25.2 percent), although pipe
!/Detailed data on profit-and-loss by product line. during July,l,. 1986-June 20, 1987 are presented in app. D, table D-6. Final data .on the July 1, 1985-June 30, 1986 period are contained in app. H, table H-2.
46
and tubes showed the greatest negative net change, as losses as a percent of
sales increased from i7.6 percent to 27.2 percent.
Certain stainless and alloy tool steel.-- Total net sales of certain
stainless and alloy tool steel products amounted to $2.0 billion, up * * *
percent from the * * * billion in net sales for the year ending June 30, 1986
(table 6). Net profits before taxes in the sector·rose from $52.6 million to
$178.4 million between the previous study period and the current one. 11 Net
profits as a percent of sales increased from 2.7 to 8.9, a net change of 6.2
percentage points (table 6). Plates rebounded sharply from a loss on sales of
12.7 percent to a profit on sales of 6.3 percent, a net gain of 19.0
percentage points. Sheets and strip also improved its performance, as profits
as a percent of sales increased from 7.4 percent to 12.7 percent. The return
on sales declined in the case of wire (where profits of 1.4 percent turned
into losses of 2.7 percent) and pipe and tube (where losses widened from 7.2
to 8.8 percent).
11 Detailed data on profit-and-loss by product line during July 1, 1986-June 20, 1987 are presented in app. D, table D-6. Final data on the July 1, 1985-June 30, 1986 period are contained in app. H, table H-2.
47
Steel Pricing
The intense pricing competition that exists in domestic and international
steel markets continues to reflect the significant shifts which have occurred
in demand, changes in the value of the dollar and other currencies, and the
restructuring which is occurring worldwide~ As pricing pressures intensified,
both domestic and foreign steel producers were forced into cost reduction
programs which resulted in declining capacity and significant reductions in
employment. In addition, with Developing World steel producers becoming more
efficient and cost effective in steel manufacture, their ability to influence
the level of prices in international markets has become an increasingly
important factor. POSCO of South Korea and China Steel of Taiwan are examples
of how the combination of relatively low-wages and production costs and
capital investment have advanced the competitiveness of developing world steel
producers.
Although wide variations in the prices of certain steel products continue
to exist on a country-by-country basis, in the United States market domestic
producers• steel prices and import prices are moving closer together. In
January 1985, for example, 68 percent of surveyed steel service centers in the
United States reported that foreign mill prices for carbon steel products were
6 to 10 percent below U.S. delivered prices. 11 During June 1987, however, 71
percent of these service centers reported that foreign mill carbon steel
prices were equal to, or no more than 5 percent below, U.S. prices.
1/ These price comparisions are published in Business Conditions prepared by the Steel Service Center Institute.
48
Steel price index trends in the United States, Japan, Canada, and West
Germany.1/--An analysis of government published price indexes £! reveals that
home currency steel prices in the United States and Canada remained stable
(increasing about 1 percent) during January-September 1986, whereas steel
prices in Japan and West Germany declined by about 5 percent during the period
(figure 5). When comparing home currency steel prices during September 1986
with those in 1981, the most significant changes occurred in West Germany and
Canada. These countries recorded increases of 9 percent and 17 percent,
respectively, during September 1986 compared to 1981 prices.
In order to examine the effects of exchange rate fluctuations on relative
prices in these countries, the government price indexes were adjusted to
reflect percentage changes in home currency prices and percentage changes in
currency values versus the U.S. dollar. As illustrated in figure 6, the
adjustment indicates that steel prices in West Germany and Japan (in dollar
terms) increased significantly (by about 12 and 25 percent, respectively)
during January-September 1986, while steel prices in the United States and
Canada remained relatively stable. Although the adjusted steel prices
indicate that all four countries experienced increases in steel prices since
1981, West Germany (18 percent) and Japan (35 percent) recorded the largest
increases.
International pricing developments.--As indicated above, steel pricing in
the Western World continues to be affected by a number of factors.
11 Japan, Canada, and West Germany are the three leading sources of U.S. steel imports, respectively. £! The price indexes do not necessarily reflect movements in transaction prices. See the Conunission•s 1986 Annual Survey Concerning Competitive in the Steel Industry and Industry Efforts to Adjust and Modernize for a fuller discussion of this point.
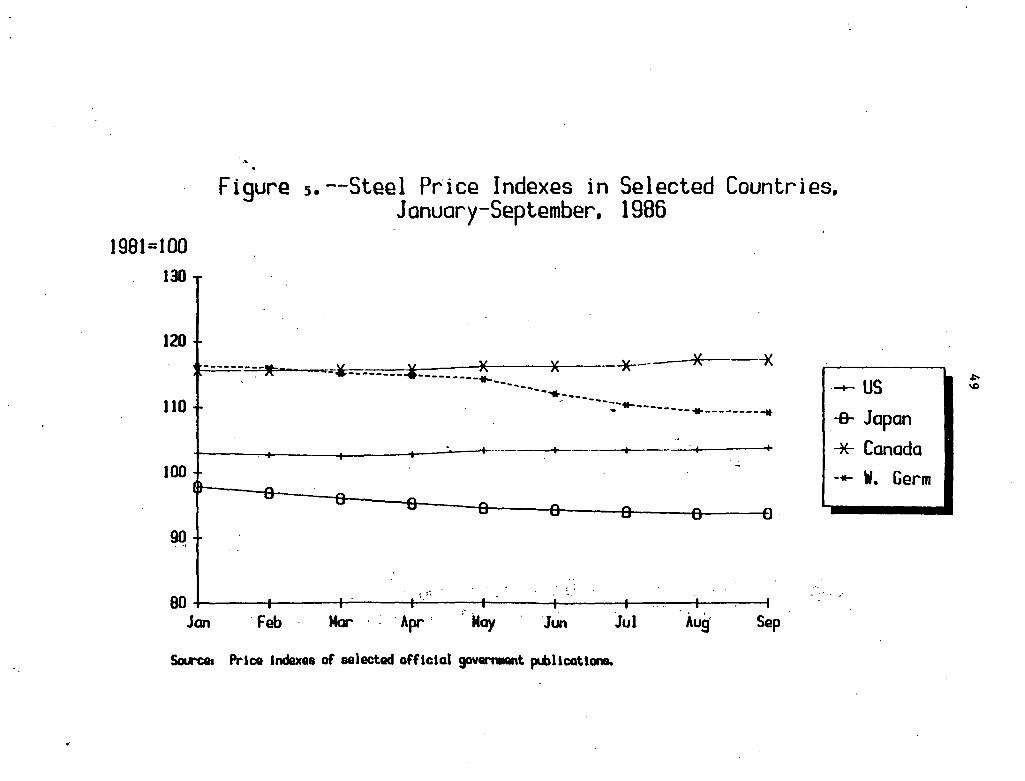
.. Figure s.--Steel Ptice Indexes in Selected Countries,
January-September, 1986 1981=100
130
120 v
110
-)( " )( -- .)(.. ___ * __ _
----·- -=-~------~------------· ... ··--------~ . .-------------------·--------.... = .~ .
+-----:-+------1----+------t-··-------+--·
100
90
~ ; ~ : .
-80+-~~~~-J-~~_._~~-1-~~+-~~~~-+-~~~
Jan Feb Mar . Apr, . May Jun Jul Aug· Sep
So&rcea Price Indexes of ealectad off lclal gov8m11Qnt p.Dllcat.lona.
. ........,. us -a- Japan
*Canada -.- W. Germ
~
'°
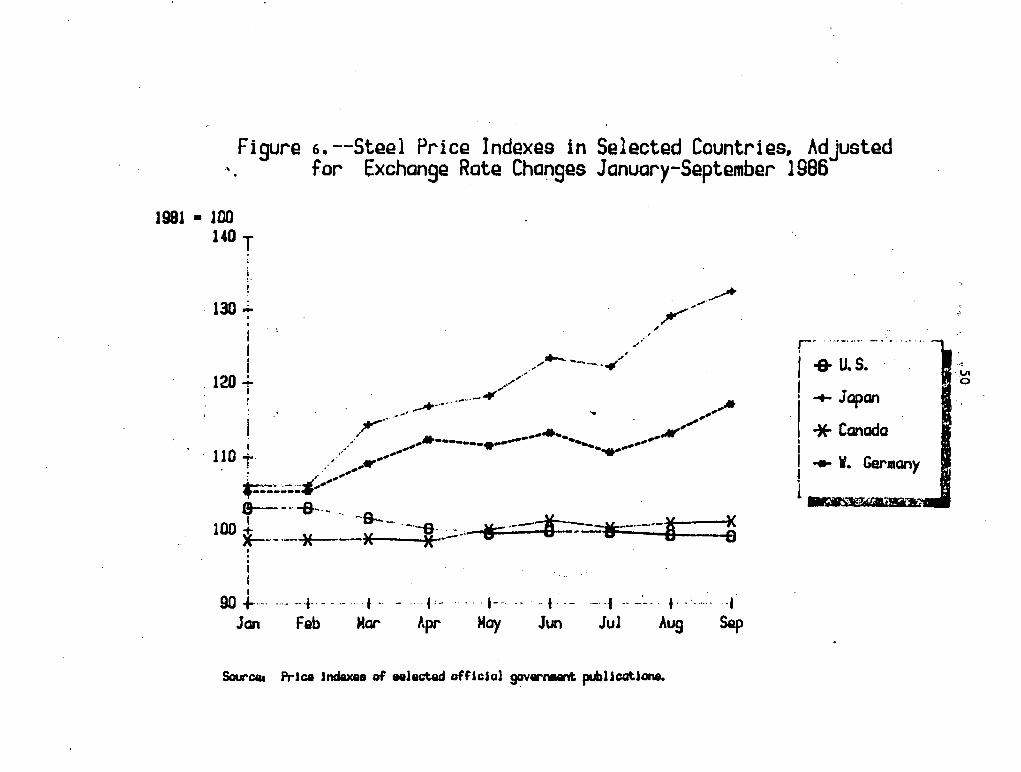
Figure 6.--Steel Price Indexes in Selected Countries, Adjusted ··. for Exchange Rate Cho~ges J onuary-September 1986
1981 • JOO 140 T
130 ~ ! I
I I I
'120 ~ I
..........
,,.,,,_ .... -.... " _,~··
.,/ ....... ._---····'fl"·'·
,....,.. •.•.... -- _., I r····-·· I / ,>- _,A 110 .... / • : / ....... ----- ..... ~--· ,.· ... - ... _ ... -- .-....... .. .... -____ ,.. ..... e---.. -&·-- ~
100 ~ · ·- --a-- --·-a. ~>-- tt= ·--- If :--=-tt=--·-n ~ )E--~ ·--*"'- )C Vd· • ' i I I
90+··-· .... --f---·-·· •-· - · f'- ·····f--· -- --1 -- ·--t ---·--· f·-- .... -I Jan Feb Mer Apr May Jun Jul Aug Sep
Sourcaa Prlca Sndaxaa of aelactad off'Sclal ~rn.ant. publlcatlane.
r· ······-.. ··· -·- ·--··· I -& U.S. I
I I I
-+-Japan
*Canada
I ... V. Germany ! 1~
•'
-" .VI
0

51
Shifting exchange rates, which produced sizable swings in international
steelmaking cost and price differentials, have affected the relative
competitive positions of Western World producers significantly. Moreover, as
a result of unfavorable market conditions, developed Western World producers
were forced to reduce steelmaking capacity by 7 percent during 1981-86, while
Developing World steel producers of relatively low-cost steel increased
capacity by 28 percent during the period, raising their share of total Western
World steelmaking capacity to 20 percent in 1986, up from 14 percent in 1981.
World steel "spot" export prices have moved up about 8 percent in dollar
terms since mid 1986 even though demand is flat in Europe and down in both the
United States and Japan. 11 In those Developing World countries where
currencies have been relatively weak versus the dollar (such as Brazil and
South Korea), "spot" export prices have remained fairly stable. The increase
in World steel "spot" export price can be largely attributed to the following
developments: (1) the devaluation of the dollar which increased Japanese and
European steel producers' costs (in dollar terms); (2) production cutbacks
implemented by these producers; and (3) reduced world exports by Brazil,
Taiwan, and South Korea due to increased demand in their respective home
markets. ~/
Following are summaries of steel pricing developments and conditions in
the United States, Japan, Canada; and the European Community (EC).
11 World Steel Dynamics, "Steel Price Trak 1119-1120." ~I World Steel Dynamics, "Steel Price Trak 1122.
52
United States. ---The decline in domestic "spot" prices that began in
the summer of 1986 was halted in most markets by the USX work stoppage in
August of that year. Since USX accounted for nearly a fifth of the market in
a number of products, its withdrawal from the U.S. market had a significant
impact, especially in the Midwest where the "spot" price of galvanized sheet
rose by about 5 percent to $640 per ton. !I There was reportedly only slight
hedging against the USX stoppage; many service centers did not have the
capital to pile up emergency stocks and others bought cautiously for fear of
being caught with costly stocks when USX returned to production. i1
Subsequent to USX's reentry into the market, indications are that domestic
steel producers have sharply extended lead times and that steel service
centers and producers Qf welded tubing are paying significantly higher prices
for certain steel products in the "spot" market; The effects of the work
stoppage is reflected in a continued reduction in discounts offered by U.S.
producers. As shown in the following tabulation, the level of discounts fell
from as much as 31.2 percent in December 1985, to 14.0 percent in December
1986.
!I World steel Dynamics, "Steel Price Trak ill9-il20." i1 On Feruary 1, 1987, the United Steelworkers and officials of USX approved a 4-year contract to end the 6-month work stoppage. The company agreed to shut down indefinitely one of its plants, as well as significant portions of two more, as part of its restructuring plan. Company officials have asserted that
· USX will re-start the shut down facilities slowly, ultimately reaching full shipping capacity in the fourth quarter of 1987.
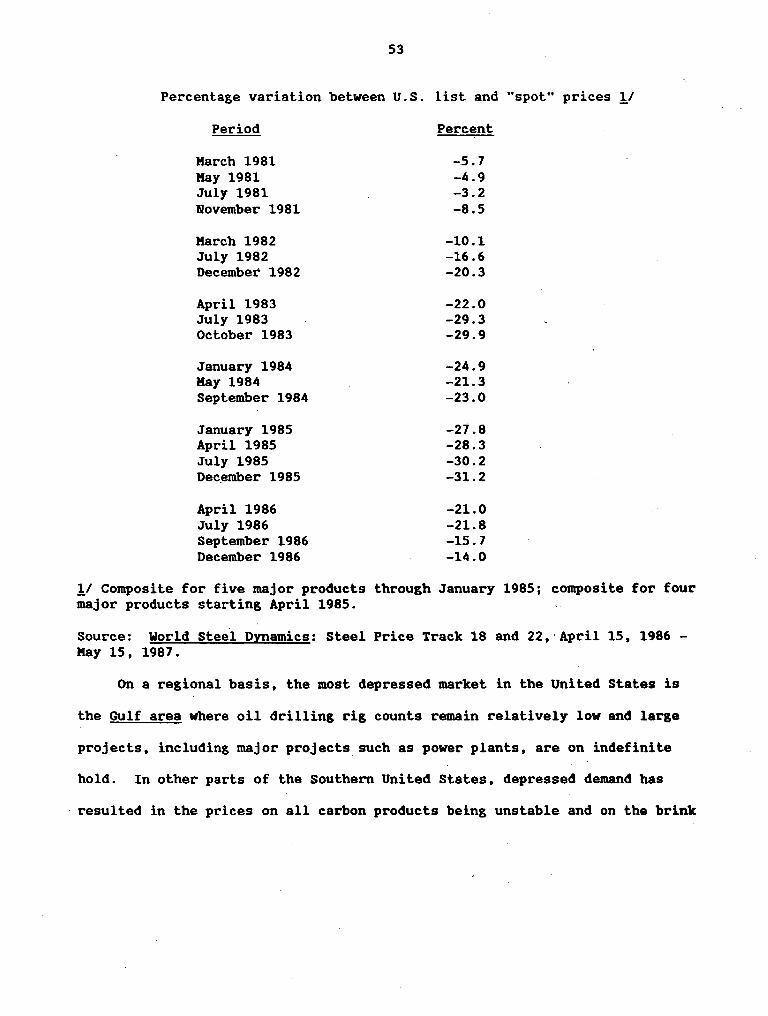
53
Percentage variation between U.S. list and "spot" prices !I
Period Percent
March 1981 -.5. 7 Hay 1981 -4.9 July 1981 -3.2 November 1981 -8.5
March 1982 -10.1 July 1982 -16.6 December 1982 -20.3
April 1983 -22.0 July 1983 -29.3 October 1983 -29.9
January 1984 -24.9 Hay 1984 -21.3 September 1984 -23.0
January 1985 -27.8 April 1985 -28.3 July 1985 -30.2 December 1985 -31.2
April 1986 -21.0 July 1986 -21.8 September 1986 -15.7 December 1986 -14.0
!I Composite for five major products through January 1985; composite for four major products starting April 1985.
Source: World Steel Dynamics: Steel Price Track 18 and 22,'April 15, 1986 -Hay 15, 1987.
On a regional basis, the most depressed market in the United States is
the Gulf area where oil drilling rig counts remain relatively low and large
projects, including major projects such as power plants, are on indefinite
hold. In other parts of the Southern United States, depressed demand has
resulted in the prices on all carbon products being unstable and on the brink
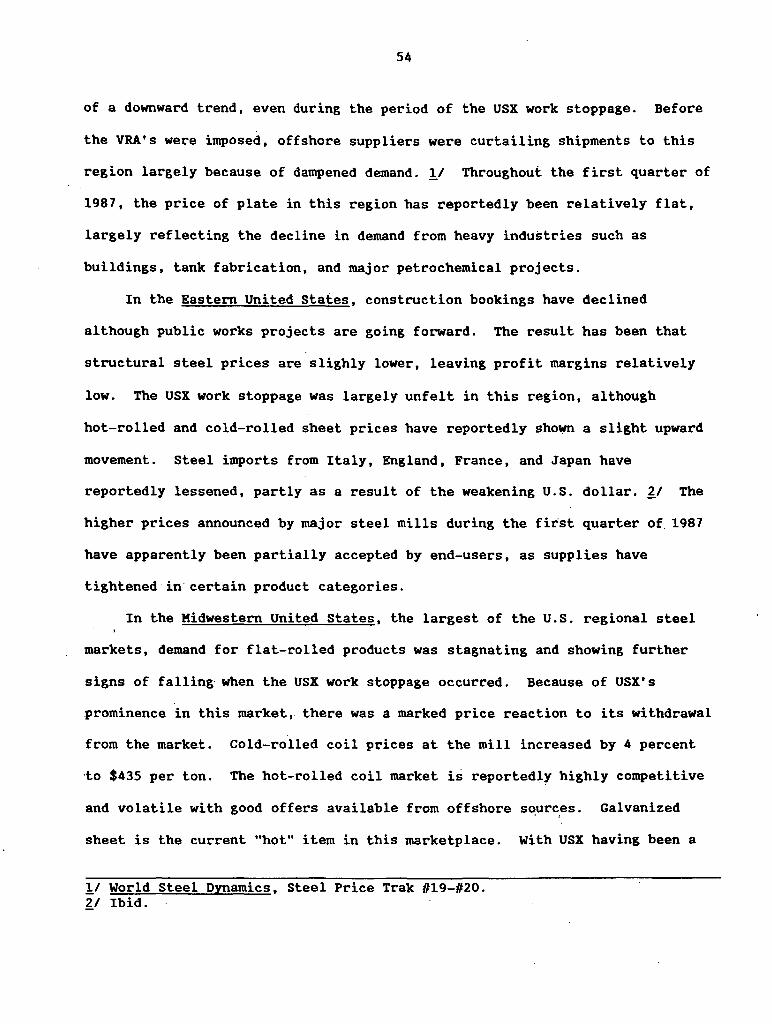
54
of a downward trend, even during the period of the USX work stoppage. Before
the VRA's were imposed, offshore suppliers were curtailing shipments to this
region largely because of dampened demand. 1/ Throughout the first quarter of
1987, the price of plate in this region has reportedly been relatively flat,
largely reflecting the decline in demand from heavy industries such as
buildings, tank fabrication, and major petrochemical projects.
In the Eastern United states, construction bookings have declined
although public works projects are going forward. The result has been that
structural steel prices are slighly lower, leaving profit margins relatively
iow. The USX work stoppage was largely unfelt in this region, although
hot-rolled and cold-rolled sheet prices have reportedly shotiim a slight upward
movement. Steel imports from Italy, England, France, and Japan have
reportedly lessened, partly as a result of the weakening U.S. dollar. i1 The
higher prices announced by major steel mills during the first quarter of 1987
have apparently been partially accepted by end-users, as supplies have
tightened in certain product categories.
In the Midwestern United states, the largest of the U.S. regional steel
markets, demand for flat-rolled products was stagnating and showing further
signs of falling· when the USX work stoppage occurred. Because of USX's
prominence in this market, there was a marked price reaction to its withdrawal
from the market. Cold-rolled coil prices at the mill increased by 4 percent
·to $435 per ton. The hot-rolled coil market is reportedly highly competitive
and volatile with good offers available from offshore sources. Galvanized . '
sheet is the current "hot" item in this marketplace. With USX having been a
11 World Steel Dynamics, Steel Price Trak #19-#20. ~/ Ibid.
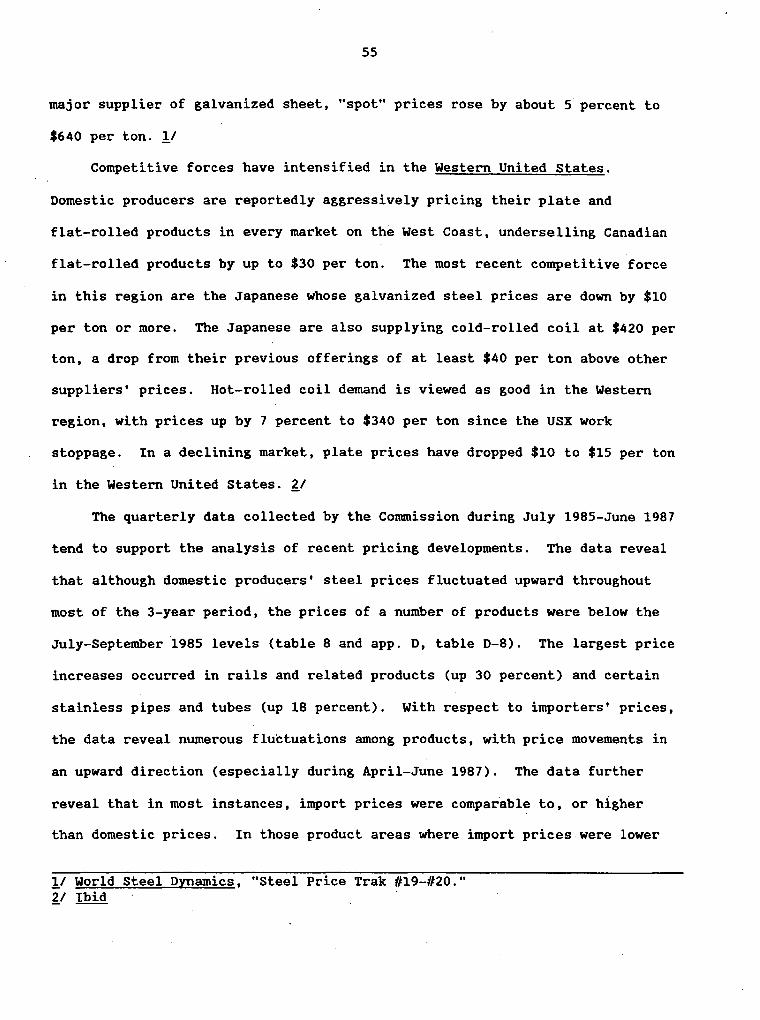
55
major supplier of galvanized sheet, "spot" prices rose by about 5 percent to
$640 per ton. !I
Competitive forces have intensified in the Western United states.
Domestic producers are reportedly aggressively pricing their plate and
flat-rolled products in every market on the West Coast, underselling Canadian
flat-rolled products by up to $30 per ton. The most recent competitive force
in this region are the Japanese whose galvanized steel prices are down by $10
per ton or more. The Japanese are also supplying cold-rolled coil at $420 per
ton, a drop from their previous offerings of at least $40 per ton above other
suppliers' prices. Hot-rolled coil demand is viewed as good in the Western
region, with prices up by 7 percent to $340 per ton since the USX work
stoppage. In a declining market, plate prices have dropped $10 to $15 per ton
in the Western United States. ~/
The quarterly data collected by the Commission during July 1985-June 1987
tend to support the analysis of recent pricing developments. The data reveal
that although domestic producers' steel prices fluctuated upward throughout
most of the 3-year period, the prices of a number of products were below the
July-September 1985 levels (table 8 and app. D, table D-8). The largest price
increases occurred in rails and related products (up 30 percent) and certain
stainless pipes and tubes (up 18 percent). With respect to importers' prices,
the data reveal numerous fluctuations among products, with price movements in
an upward direction (especially during April-June 1987). The data further
reveal that in most instances, import prices were comparable to, or higher
than domestic prices. In those product areas where import prices were lower
!I World Steel Dynamics, "Steel Price Trak il19-#20." ~I Ibid
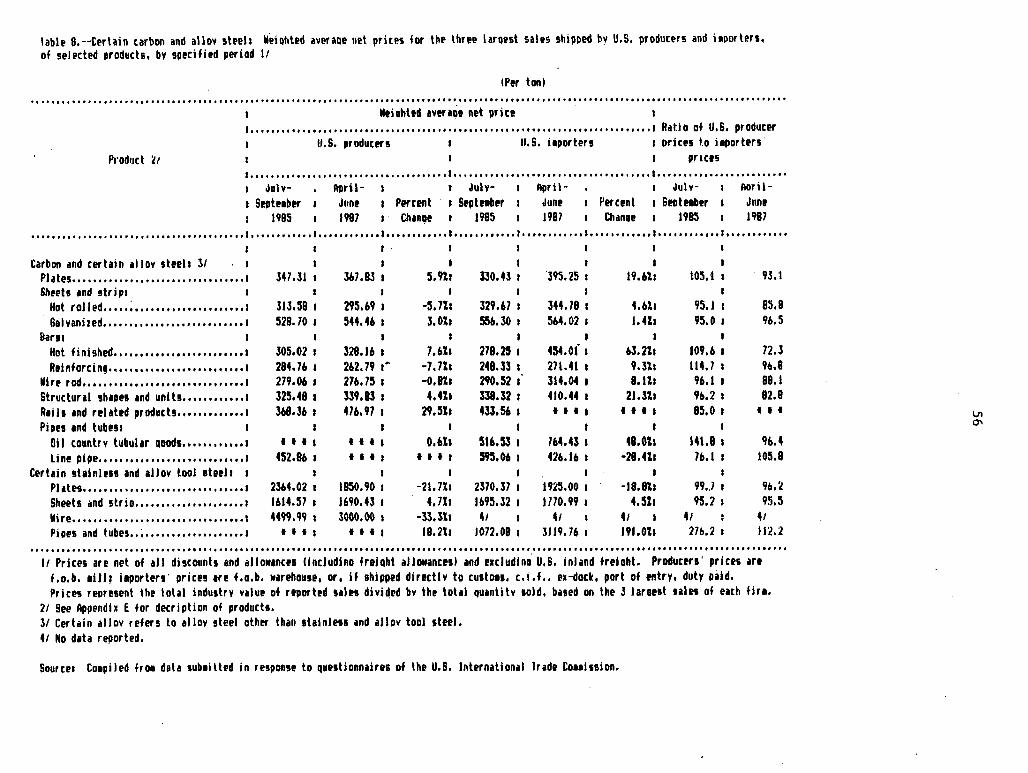
labh 8.--terhin carbon and allov steeh llei11hted avera11e net prices for the three laroest salts shipped bv U.S. producers and il1>orters, of selected products, by specified period I/
IPtr ton) •I I I I I I I I I I I I I I I I I I I I I I I I I I I I I I I It I I I I I I I I I I I I I I I I I I I I I I I I I I I It t It I I I I I I I I It I It I I I I I I I I I I I I I I I I I I I I I I I I I I I I I I I I I I I I I I I I I I I I I I I I I I I I It I" I I I I I It I I I
lltiohttd averaot net price 1 ••••••••••••••••••••••••••••••••••••••••••••••••••••••••••••••••••••••••••••• 1 Ratia of U.S. producer
U.S. producers Prod•ict ~1
II. S. i1porters 1 prices t.o i apor ters · pricts
•······································•······································•························· l Julv- . Aiiri l - I t dulv- I April- I Julv- l 11oril-I S!PtHbtr I June I Percent 1 Septnbrr I June I Percent 1 StPtnber I Junt
1985 I 1987 I Ch1n9t I 1985 I 1987 I Ch.anae I 1985 I 1987 I. I ••••• '. I •••• I ••••• I ••••••••••••••••••• 1. I. I. I. I' I •• I I I' •••• ' ••••••• I I.' •••••••• I I ••••••••• 1 ••••••••• I •••••••••• I •••• 1 ••••••• ' •••• '· •• ' •••••• '.
I. I I I I
Carbon and certain 1llov steels 3/ I I I I I I I I
Pl ates ••••••••••• ,., ••• , •••.••• , ••••••• 1 347.31 I 3b7.83 I 5.911 330.43 I 395. 25 I 19.67.1 105,I I 93.1 Sheets 1nd strips I I I I I I I
Hot rol I ed ••••• ~ ••••••• , ••••••••• , ••• 1 313,58 I 295.69 I -5.711 329,67 I 344.78 I 4.611 95.1 ; 85.B Galvanized ••••••••••••••••••••• , ••• , .1 528.70. 544.46 I 3.0%1 556.30 I 564.02 I 1.u1 95,0 I 96.5
Bar11 I I I I I I I I
Hot finished ••••••••••••••••••••••••• 1 305,02 I 328.16 I 7.611 278.25 I 454.0i I 113.211 109,6 I 72.J R1infarcin9 •••••••••••••••••••••••••• 1 284,76 I 262.79 1· -7.711 248.33 I 27l.41 I 9.311 114. 7 I 96.8
IHr• rod ••••••••••••••••••••••••• , ••••• 1 279.06 I 276,75 I -0.8%1 290.52 1' 314,04 I e. 111 96,J I BB.I Structur1l sh1oe1 ind unit1 •••••••••••• 1 325,48 I 339,83 I 4.411 338.32 I 410,44 I 21.311 911,2 I 82.B R1il1 and relattd products ••••••••••••• 1 368.36 I 476,97 I 29.511 433,56 I I I I I I I I I 85,0 I I I I
Pioe1 ind tubes1 I I I I I I I I
Oil countrv tubul1r oood1 •••••••••••• 1 I I I I I I I I 0.611 516,53 I 764.43 I 48.011 141,8 I %.4 Line pipe •••••••••••••••••••••••••••• 1 452.811 I I I I I I I I I 595,011 I 4211.111 I -28.411 711. I I 105.8
Certain st1inle11 1nd 1llov tool 1teel1 I I I I I I I I
Pl 1tes ••••••••• , •••••••.•.••••• ,, •.•• 1 2364,02 I 1850,90 I -21.111 2370,37 I 1925.00 I -IB.8%1 99,./ I 911.2 Sheets ~nd strio ••••••••••••••••••••• 1 lb14.57 I 1690.43 I 4.m 11195.32 I IJ70,99 I 4.511 95,2 I 95.5 Mire •••••••••••• ,, ••••••••••••••• ····' 4499.99 I 3000,00 I -33.3%1 41 I 4/ ' 41 I 41 : 41 Pioe1 and tube1 •• ~ ••••••••••••••••••• 1 I I I I I I I I 18.211 1072.08 I 3Jl9, 76 I 191.0'11 27/J,2 I 112.2
t t t t I I It t 'It t t t I I I I It t I I I I I I I I It t t I I I I I I I I It It It t It t t t t t t I It It t It t t I It t I I I I I I I I I I It I I I I It I I It I I It I I I I I It I I It t I I I It I I I It I I It It t t I 1 It I I I It t I 1 It I It I
It Prices are net of all discount1 and ~llow1nce1 lincludino freioht all11111ncesl ind ewcludino U.S. inl1nd +reioht. Producers' prices are f.o.b. 1ill! iaporters· prices ire f.o.b. w1rehou1e, or, if shipped directly to custoa1. c.i.f •• er-dock, port of entry, duty paid. Prices represent the total industry Yalut of reported sales divided bv the total quantity sold, bieed on lhe 3 laroest sales of e1ch fir1.
2/ See Appendix E for decription of product1. 3/ Certain allov refers to alloy steel other than stainless and allov tool steel. 41 No d1ta reported.
Sources Co1piled fro• data 1ub1itted in response to questionnaires of the U.S. lnternational lrade Co11isaion.
U1 0\
57
during July-September 1985, the price differential narrowed during April-June
1987.
Following are brief summaries of pricing developments in selected key
product groups during recent months.-
Sheet products.--Sheet product prices appear to be headed
upward. One leading producer (LTV) announced a reduction in the base price
discount on most flat-rolled products by 20 percent, effective with shipments
on or after March 29, 1987. The transaction price hike affects hot-rolled,
cold-rolled, and hot-dipped galvanized sheet. Not affected are
electro-galvanized sheets and terne plate sheets, both products consumed
primarily by automakers that purchase the material on year-long contracts
which were negotiated in the Spring of 1986. Long-term contractual agreements
negotiated prior to November 5, 1986 were not affected by the announcement
(for the life of the contract). !/
During April-May 1987, hot-rolled sheet prices in the South on new mill
orders reportedly increased by about $20 per ton, which effectively eliminated
a $15 per ton discount which had been in effect; the price increase also
reflected full implementation of extra charges announced by southern
steelmakers. ~/ Hot-rolled prices on new orders are generally in the $400 to
$420 per ton range, according to industry sources. Like domestic hot-rolled
sheet prices, prices for imported sheet were also up by about $20 per ton.
Spot prices of carbon sheet for the auto market experienced declines in the
second quarter of 1987. The softening market is directly tied to the
declining production of autos which has lead to order cancellations by
automotive related customers.
!/ American Metal Market, December 3, 1986. ~I American Metal Market, Hay 20, 1987

58
In a recent action, another major producer (USX) reportedly raised
transaction prices by reducing discounts on all sheet products by $15 per ton,
effective with July 1 shipments. The price hikes will raise hot-rolled band
prices by $25 to $30 per ton, resulting in selling prices of about $325 to
$380 per ton. !/
With regard to general international price comparisons, the following
tal>ulation indicates that; as of December 1986, U.S. prices for sheet products
were generally higher than Canadian and EC prices (in their respective
markets) but equal to or less than Japanese prices.
Spot price comparisons, December 1986
(U.S. dollars per net ton)
Hot-rolled Cold-rolled Galvanized Market Coil Coil sheet
Canada 319 392 464 EC 256 377 480 Japan:
Dealer 334 456 729 Big Buyer ?:/ 454 542 634 United States 334 445 640
Source: World Steel Dynamics, "Steel Price Trak 1121"
Wire rod.--Wire rod prices are showing signs of improving.
Citing seasonally slack demand and increasing import compet~tion from non-VRA
countries, domestic carbon wire rod producers cut prices by $5 to $15 per ton
in the first quarter of 1987, hoping to increase tcansaction prices in the
second quarter as the construction market geared up for summer work. 11
!I American Metal Market, March 27, 1987. 'l:_I "Big Buyer" prices are those quoted to b.ig contract buyers in Japan. 11 American Metal Market, February 4, 1987.
59
Transaction prices on low-carbon industrial-grade rods have been lowered to
$300 per ton, or lower, from last year's high of $310 to $330 per ton. Low
carbon rod from Singapore, Malaysia, and Indonesia shipped to the port of
Houston is reportedly available on the "spot" market for $280 per ton. The
two dominant producers of low-carbon wire rod in the south, (Georgetown Steel
and North Star Steel), announced hikes of nearly $10 per ton, effective July
1, 1987. While their competitors have not made any similar announcements,
market sources have asserted that the companies may have enough influence in
the southern market to make a price hike hold. 11 In another price leading
move, Laclede Steel of St. Louis announced a $20 transaction base price
increase to $330-$350 per ton on its high-carbon wire rod. £1
Plate.--Plate prices are apparently headed upward in most
regions, with the exception of the West Coast. In an effort to reclaim a large
portion of the lackluster West Coast carbon plate market and regain
profitability, a producer in the region (Oregon Steel Mills) has reportedly
contracted with some of the region's largest steel distributors and provided a
program that offers a delivered price of $340 per ton for plate (about $10 per
ton less than the "spot" price for plate in this region) if purchases of 5,000
tons or more were made during November 1, 1986 through mid-April 1987. Since
freight from the company's plant in Portland to the region's largest market
(Los Angeles) is more than $30 per ton, industry sources maintain that the
company's effective f.o.b. price to buyers is more on the order of $320 per
ton. 11 The plate market was affected by the work stoppage at USX Corp.,
11 American Metal Market, May 27, 1987. £1 American Metal Market, May 25, 1987. 11 American Metal Market, December 30, 1986·.
60
which halted plate output at its Geneva Works near Provo, Utah. Before the
stoppage this facility of USX accounted for approximately 10,000 tons of plate
per month. The only other plate mill in the West is California Steel
Industries, which is currently producing about 7,000 tons per month. 11
Other major producers recently announced increases in the base published
price of certain plate.products. One (Bethlehem) indicated that carbon and
high-strength low alloy plate prices would be raised by $25 per ton and the
composite published price for alloy plate by $25 per ton (increases of
approximately 5 percent), effective with July 1, 1987 shipments; the composite
price for strip mill plate would also be raised by $15 per ton. The other
company (USX) announced an increase in the price.of carbon high-strength low
alloy plate by $25 per ton, or by approximately 5 percent, effective with
shipments on June 28. ~/
With regard to international price comparisons, the following tabulation
indicates that by December 1986, U.S. "spot" prices for plate products were
very competitive with "spot" plate prices, ~enominated in dollars, in Canada
and Japan. EC prices, on the other hand, were significantly lower.
Spot price comparisons, December 1986
(U.S. dollars per net ton)
Market Plate
Canada------------------------------ 348 EC---------------------------------- 256 Japan:
Dealer---------------------------- 306 Big Buyer------------------------- 481
United States----------------------- 320
Source: World Steel Dynamics, "Steel Price Trak 1121."
11 American Metal Market, December 30, 1986. ~I American Metal Market, April 2, 1987.
61
Bar products.--Like wire rod, bar product prices have softened
slightly since last summer. on a regional basis, demand for rebar in the
Northeast remains good with the price of #6 rebar currently reported at $282
per ton, slightly less than the price of $287 per ton in August 1986. Demand
in the Midwest and Southeast is reasonably good and the price levels of $270
and $267 per ton, respectively, are also slightly lower than August 1986
prices. Because of the oil drilling slump, the price of rebar in Texas has
reportedly declined to the lowest level in the country at about $245 per ton.
The highest price for rebar remains on the West Coast at $292 per ton. !I
Japanese steel producers and one U.S. company (Nucor) ·have announced
price hikes on cold finished bar in the western market. The U.S. company
raised its prices by about three percent (its second increase in 18 months).
The prices, however, are still reportedly below the April 1985 level for
popular grades, such as 1018 bars. Currently, the Japanese are delivering
1-inch diameter 1018 bars for $480 per ton. The Japanese announced a $20 per
ton increase for certain leaded bars, raising prices to $525 per ton, which
compares to a U.S. price of about $550 per ton. ll.
With regard to international price comparisons, by December 1986, u.s.
rebar "spot" prices were very competitive with rebar "spot•• prices in Canada
and Japan, as the following tabulation indicates. Prices in the EC, however,
were reportedly lower.
!I World Steel Dynamics, Steel Price Trak #19 and #20. ll American Metal Market, Kay 22, 1987.
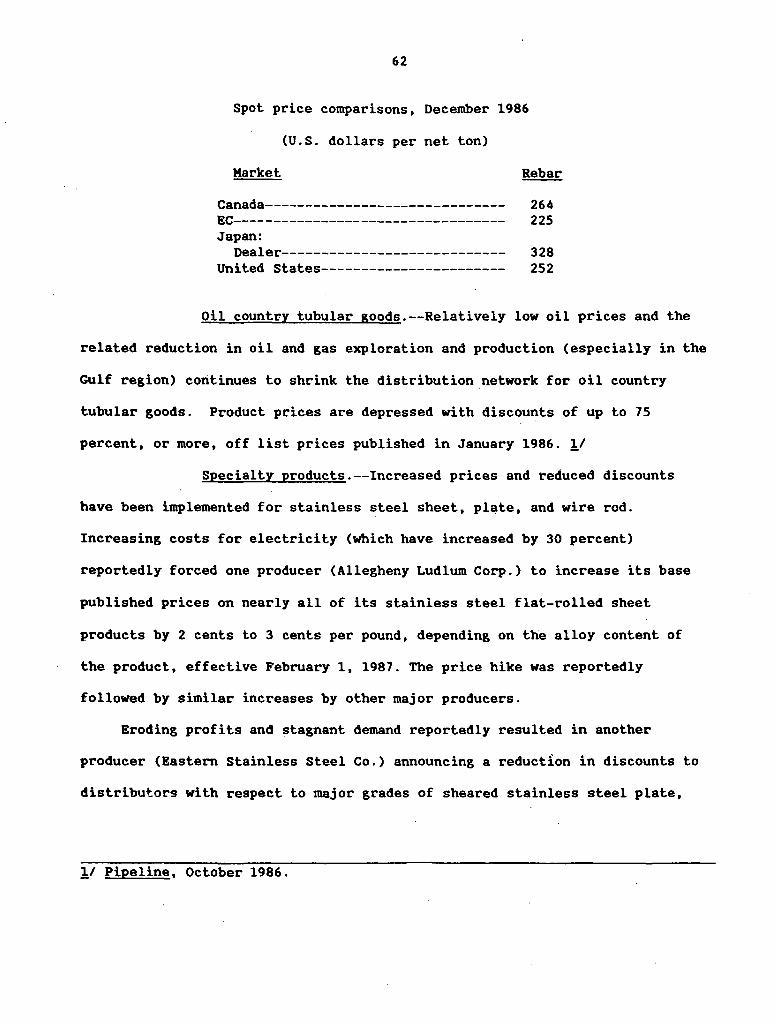
62
Spot price comparisons, December 1986
(U.S. dollars per net ton)
Market Rebar
Canada------------------------------ 264 EC---------------------------------- 225 Japan:
Dealer---------------------------- 328 United States----------------------- 252
Oil country tubular goods.--Relatively low oil prices and the
related reduction in oil and gas exploration and production (especially in the
Gulf region) continues to shrink the distribution network for oil country
tubular goods. Product prices are depressed with discounts of up to 75
percent, or more, off list prices published in January 1986. !/
Specialty products.--Increased prices and reduced discounts
have been implemented for stainless steel sheet, plate, and wire rod.
Increasing costs for electricity (which have increased by 30 percent)
reportedly forced one producer (Allegheny Ludlum Corp.) to increase its base
published prices on nearly all of its stainless steel flat-rolled sheet
products by 2 cents to 3 cents per pound, depending on the alloy content of
the product, effective February 1, 1987. The price hike was reportedly
followed by similar increases by other major producers.
Eroding profits and stagnant demand reportedly resulted in another
producer (Eastern Stainless Steel Co.) announcing a reduction in discounts to
distributors with respect to major grades of sheared stainless steel plate,
!I Pipeline, October 1986.
63
effective with January 5, 1987 shipments. The price discounts for principal
distributors will decline by one to two percentage points on many products,
though certain product prices will remain unchanged. Adjustments are also
being made in the level of deductions, which will effectively raise the price
of certain products.!/ Eastern, which makes only stainless plate after
exiting the sheet and strip market nearly a year ago, will retain a 2 cents
per pound price discount for random-length plates but will discontinue all
other discounts, including a 3 cents per pound deductor on Grades 304 and
304L, and a 4 cents per pound discount on Grades 316, 316L, 317, 309, and 310.
!/
Increasing production costs prompted domestic producers of stainless
steel wire ~od to increase prices an average of 5 cents per pound on two
top-selling grades, effective October 1, 1986. The hikes, which were followed
by most producers, raised the transaction price of types 302 and 304
hot-rolled stainless redrawn rod, which represents the bulk of stainless wire
rod demand, from 85 cents to 90 cents per pound. The base, or published
price, for these heavily discounted wire rod products is $1.27 cents per
pound. ~/
The rise in wire rod costs has affected wire drawers, who have been
experiencing depressed prices resulting from over capacity for more than
!I American Metal Market, December 2, 1986. £1 American Metal Market, October 21, 1986.
64
2 years. Wire drawers have reportedly been unable to translate the rising
material costs into higher selling prices for their own products. !I
Citing the avilability of cheaper foreign stainless steel bars, some
service centers in the South are reportedly resisting the 5 cents per pound
price hike on domestically produced bars which became effective on April 1,
1987. However, some service centers placed orders before that date and have
not yet paid higher prices. ~/
Japan.--The appreciation of the yen against the dollar reportedly
pushed the "Big Buyer" steel price in Japan at least 30 percent above "spot"
prices in the United States at year end 1986. Most of Japan's industries are
finding it difficult to remain profitable at the current exchange rate of
about 150 yen to the dollar (as of mid July 1987), which is up about 60
percent from the 240 level of September 1985, when the dollar began its fall
on the foreign exchange markets. 11 The decline in the yen is particularly
troublesome to the Japanese steelmakers since they export about 30 percent of
their shipments; an additional 20 percent of their steel output is exported
indirectly through exports of cars, machinery, and other equipment. !I
Dealer prices in Japan remain far below "Big Buyer" prices in a number of
steel product areas. For example, dealer prices are 38 percent below "Big
!I American Metal Market, October 21, 1986. ·~1 American Metal Market, April 24, 1987. ~I The Journal of Conunerce, January 26, 1987. !/ World Steel Dynamics, "Steel Price Trak 22."
65
Buyer" quotes for plate, 26 percent below "Big Buyer" quotas hot-rolled coil,
and 16 percent below the "Big Buyer" quotas for cold-rolled coil. Because of
Japan's relatively higher priced steel, imports are reportedly becoming a
growing concern to their steel industry.
In anticipation of a decline in market demand and in production, Japan's
major steelmakers are furloughing or putting surplus workers on temporary
leave with less pay. !I Japan's five l.argest steelmakers .• Nippon Steel,
Nippon Kokan, Sumitomo Metal Industries, Kawasaki Steel, and Kobe Steel employ
178,000 workers. Of these, 30,000 to 40,000 reportedly are becoming
surplus. £1 Many of those furloughed will be paid 70 percent of their full
pay with two-thirds of the cost financed by a government subsidy program. The
program was reportedly instituted to soften the impact of the yen's
appreciation on export-dependent industries, the~eby giving them more
flexibility and time to restructure. 11
Canada.--The Canadian market remains stable and price levels have
increased slightly from the levels established in the Spring of 1986. Market
conditions in the Eastern Provinces and Quebec reportedly remain fair; are
very strong in ontario; and are depressed in Hid-Canada and British Columbia.
At year end 1986, rebar list prices in Eastern Canada were about C$350 ($249)
per ton and in Western Canada C$370 ($263) per ton, with discounting
!I American Metal Market, October 31, 1986. £1 Ibid. 11 American Metal Market, October 31, 1986.
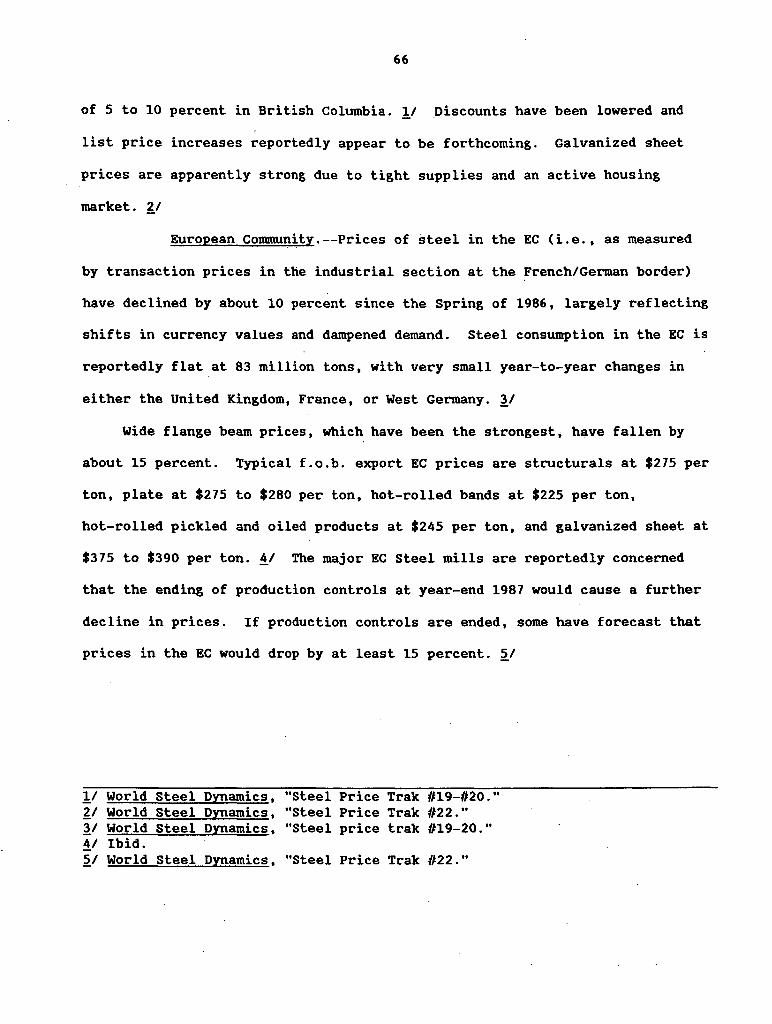
66
of 5 to 10 percent in British Columbia. !/ .Discounts have been lowered and
list price increases reportedly appear to be forthcoming. Galvanized sheet
prices are apparently strong due to tight supplies and an active housing
market. ~/
European Conununity.--Prices of steel in the EC (i.e., as measured
by transaction prices in the industrial section at the French/German border)
have declined by about 10 percent since the Spring of 1986, largely reflecting
shifts in currency values and dampened demand. Steel consumption in the EC is
reportedly flat at 83 million tons, with very small year-to-year changes in
either the United Kingdom, France, or West Germany. 11
Wide flange beam prices, which have been the strongest, have fallen by
about 15 percent. Typical f.o.b. export EC prices are structurals at $275 per
ton, plate at $275 to $280 per ton, hot-rolled bands at $225 per ton,
hot-rolled pickled and oiled products at $245 per ton, and galvanized sheet at
$375 to $390 per ton. !I The major EC Steel mills are reportedly concerned
that the ending of production controls at year-end 1987 would cause a further
decline in prices. If production controls are ended, some have forecast that
prices in the EC would drop by at least 15 percent. ~/
l/ World Steel ornamics, "Steel Price Trak 1119-1120 ... ~I World Steel ornamics, "Steel Price Trak 1122 ... 11 World Steel Dynamics, "Steel price trak 1119-20 ... 4/ Ibid. ~I World Steel ornamics, "Steel Price Trak 1122 ...
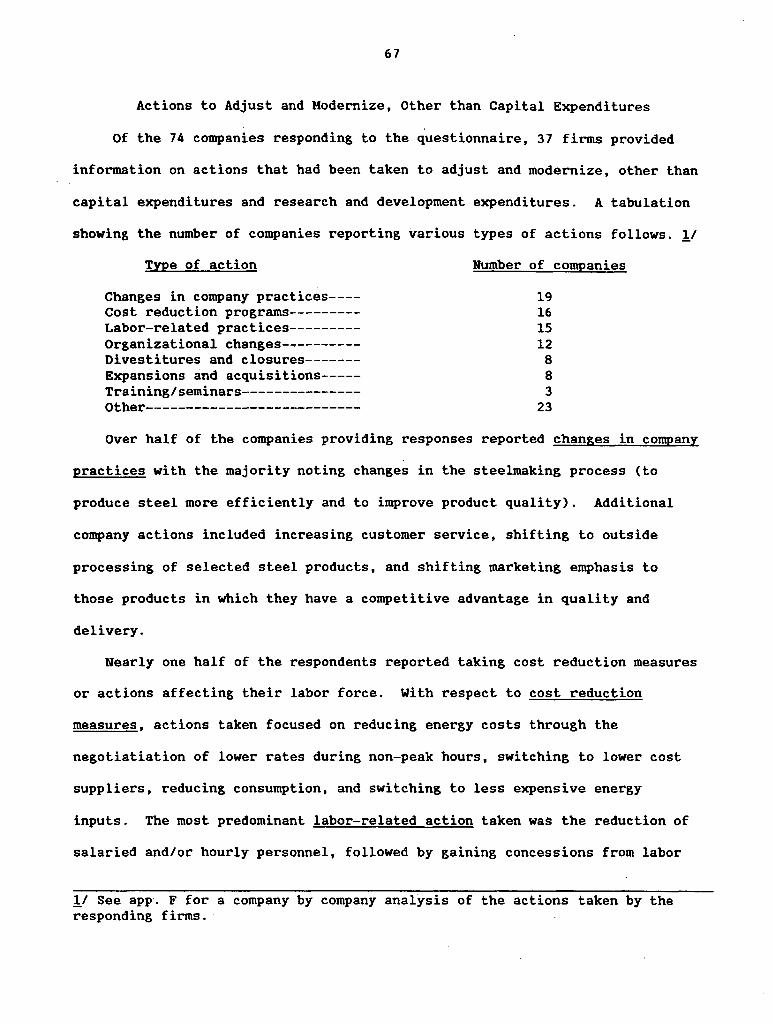
67
Actions to Adjust and Modernize, Other than Capital Expenditures
Of the 74 companies responding to the questionnaire, 37 firms provided
information on actions that had been taken to adjust and modernize, other than
capital expenditures and research and development expenditures. A tabulation
showing the number of companies reporting various types of actions follows. 1/
TyPe of action
Changes in company practices---Cost reduction prograrns--------Labor-related practices--------Organizational changes---------Di vesti tures and closures------Expansions and acquisitions----Training/seminars---------------Other------------------~-------
Number of companies
19 16 15 12
8 8 3
23
Over half of the companies providing responses reported changes in company
practices with the majority noting changes in the steelrnaking process (to
produce steel more efficiently and to improve product quality). Additional
company actions included increasing customer service, shifting to outside
processing of selected steel products, and shifting marketing emphasis to
those products in which they have a competitive advantage in quality and
delivery.
Nearly one half of the respondents reported taking cost reduction measures
or actions affecting their labor force. With respect to cost reduction
measures, actions taken focused on reducing energy costs through the
negotiatiation of lower rates during non-peak hours, switching to lower cost
suppliers, reducing consumption, and switching to less expensive energy
inputs. The most predominant labor-related action taken was the reduction of
salaried and/or hourly personnel, followed by gaining concessions from labor
11 See app·. F for a company by company analysis of the actions taken by the responding firms.

68
after ratification of new union contracts. Additional company actions taken
included cutting back on health benefit programs and introducing prof it
sharing plans in return for labor's concessions.
Approximately one third of the responding companies reported making
organizational changes. These included reorganization of entire companies or
departments, followed by being spun off from the parent company in order to
operate independently, and being acquired by another company.
Actions taken in other areas to aid in adjustment and modernization
efforts included a number of firms idling or shutting down outdated or
inefficient facilities, the acquisition of new facilities related to the
steelmaking business, the expansion and promotion of new products, and the
implementation of new market strategies. Other actions also included shifting
production to high valued products, implementing the recommendations of
consultants to improve operations, leasing major production equipment,
installing computer systems, and training employees in computer process
control techniques.
Investment in Activities Other than Steel
Following is a company by company report on investments that were made by
U.S. producers in activities other than steel that were considered part of
each firm's efforts to adjust during July 1, 1986-June 30, 1987. 11
* * * * * * * (Pages 68 to 70 contain information entitled to confidential treatment and
have not been published.)
11 Based on information submitted in response to questionnaires of the U.S. International Trade Commission.
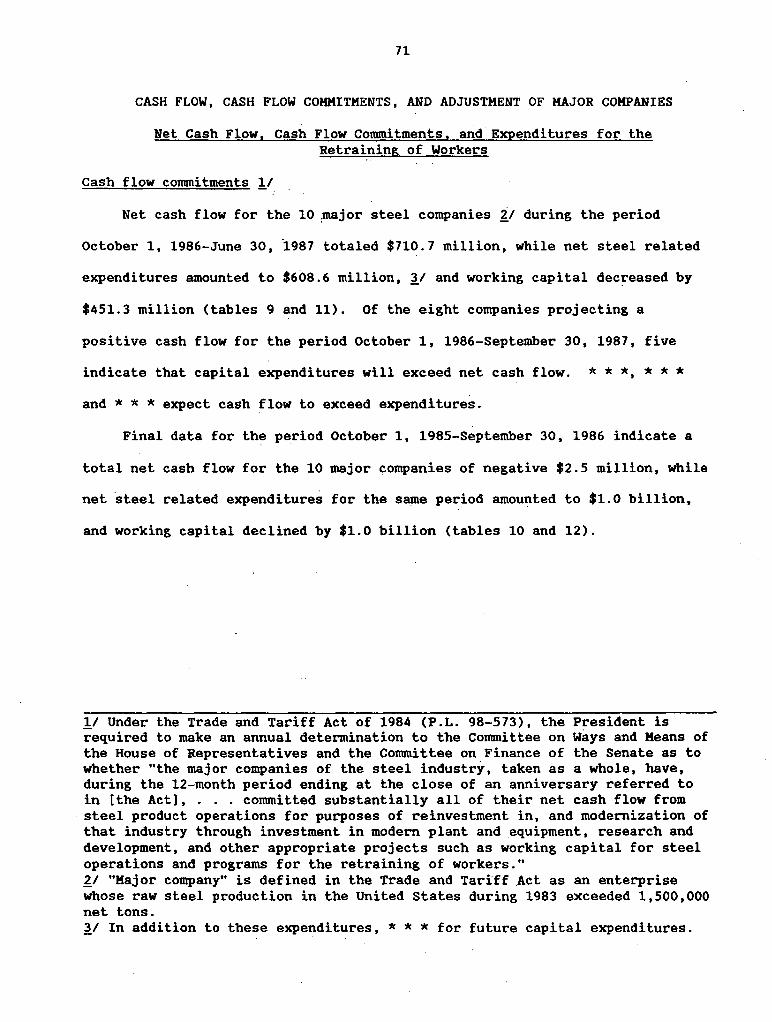
71
CASH FLOW, CASH FLOW COMMITMENTS, AND ADJUSTMENT OF MAJOR COMPANIES
Net Cash Flow, Cash Flow Commitments, and Expenditures for the Retraining of Workers
Cash flow commitments !/
Net cash flow for the 10 :major steel companies t1 during the period
October 1, 1986-June 30, "!987 totaled $710.7 million, while net steel related
expenditures amounted to $608.6 million, 11 and working capital decreased by
$451.3 million (tables 9 and 11). Of the eight companies projecting a
positive cash flow for the period October 1, 1986-September 30, 1987, five
indicate that capital expenditures will exceed net cash flow. * * *, * * *
and * * * expect cash .flow to exceed expenditures.
Final data for the period October 1, 1985-September 30, 1986 indicate a
total net cash flow for the 10 major companies of negative $2.5 million, while
net ·steel related expenditures for the same period amounted to $1.0 billion,
and working capital declined by $1.0 billion (tables 10 and 12).
!I Under the Trade and Tariff Act of 1984 (P.L. 98-573), the President is required to make an annual determination to the Committee on Ways and Means of the House of Representatives and the Committee on Finance of the Senate as to whether "the major companies of the steel industry, taken as a whole, have, during the 12-month period ending at the close of an anniversary referred to in [the Act), ... committed substantially all of their net cash flow from
· steel product operations for purposes of reinvestment in, and modernization of that industry through investment in modern plant and equipment, research and development, and other appropriate projects such as working capital for steel operations and programs for the retraining of workers." 2,.1 "Major company" is defined in the Trade and Tariff Act as an enterprise whose raw steel production in the United States during 1983 exceeded 1,500,000 net tons. 11 In addition to these expenditures, * * * for future capital expenditures.
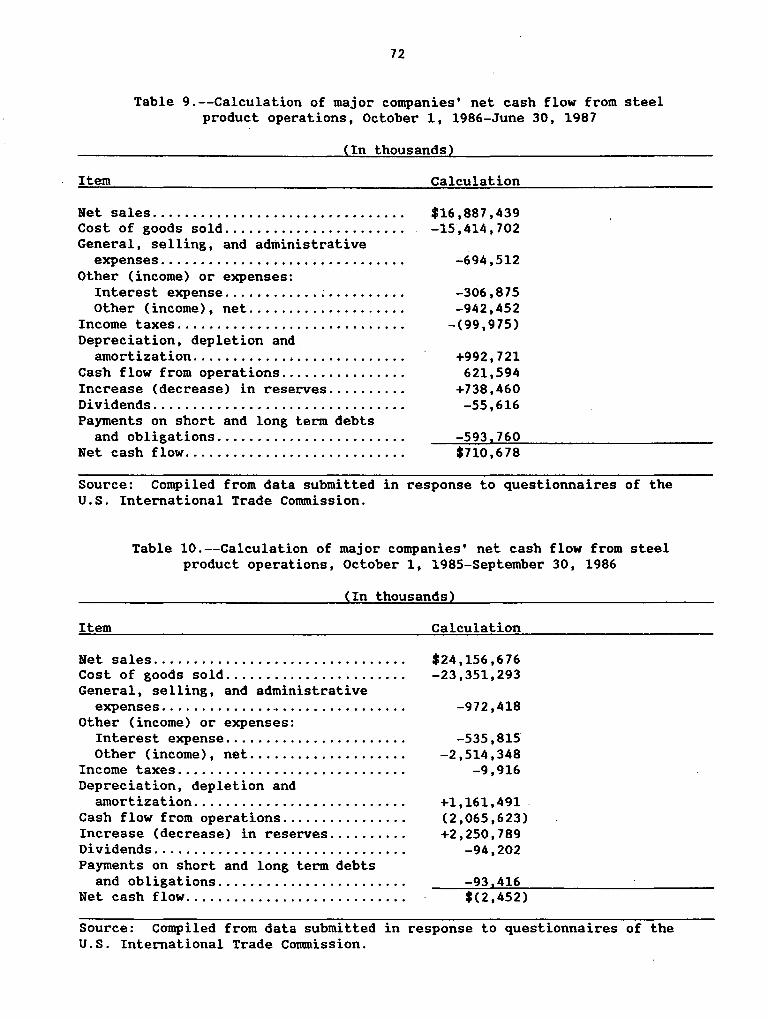
72
Table 9.--Calculation of major companies' net cash flow from steel product operations, October 1, 1986-June 30, 1987
(In thousands)
Item
Net sales ............................... . Cost of goods sold ...................... . General, selling, and administrative
expenses .............................. . Other (income) or expenses:
Interest expense ...................... . Other (income), net ................... .
Income taxes ............................ . Depreciation, depletion and
amortization ............. ; ............ . Cash flow from operations ............... . Increase (decrease) in reserves ......... . Dividends ............................... . Payments on short and long term debts
and obligations ....................... . Net cash flow ........................... .
Calculation
$16,887,439 -15,414,702
-694,512
-306,875 -942,452
-(99,975)
+992, 721 621,594
+738,460 -55,616
-593 760 $710,678
Source: Compiled from data submitted in response to questionnaires of the U.S. International Trade Conunission.
Table 10.--Calculation of major companies' net cash flow from steel product operations, October 1, 1985-September 30, 1986
(In thousands)
Item
Net sales ............................... . Cost of goods sold ...................... . General, selling, and administrative
expenses .............. -· ............... . Other (income) or expenses:
Interest expense ...................... . Other (income), net ................... .
Income taxes ............................ . Depreciation, depletion and
amortization .......................... . Cash flow from operations ............... . Increase (decrease) in reserves ......... . Dividends ............................... . Payments on short and long term debts
and obligations ....................... . Net cash flow ........................... .
Calculation
$24,156,676 -23,351,293
-972,418
-535,815 -2,514,348
-9,916
+1,161,491 (2,065,623) +2,250,789
-94,202
-93 416 $(2,452)
Source: Compiled from data submitted in response to questionnaires of the U.S. International Trade Conunission.
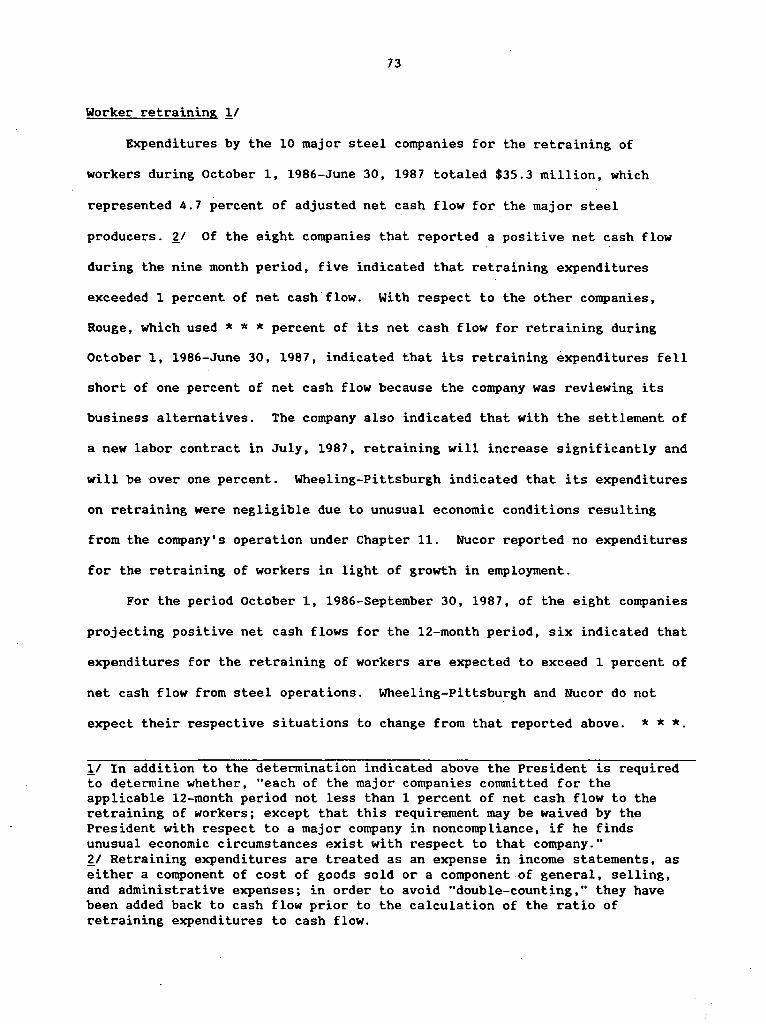
73
Worker retraining 11
Expenditures by the 10 major steel companies for the retraining of
workers during October 1, 1986-June 30, 1987 totaled $35.3 million, which
represented 4.7 percent of adjusted net cash flow for the major steel
producers. £1 Of the eight companies that reported a positive net cash flow
during the nine month period, five indicated that retraining expenditures
exceeded 1 percent of net cash flow. With respect to the other companies,
Rouge, which used * * * percent of its net cash flow for retraining during
October 1, 1986-June 30, 1987, indicated that its retraining expenditures fell
short of one percent of net cash flow because the company was reviewing its
business alternatives. The company also indicated that with the settlement of
a new labor contract in July, 1987, retraining will increase significantly and
will be over one percent. Wheeling-Pittsburgh indicated that its expenditures
on retraining were negligible due to unusual economic conditions resulting
from the company's operation under Chapter 11. Nucor reported no expenditures
for the retraining of workers in light of growth in employment.
For the period October 1, 1986-September 30, 1987, of the eight companies
projecting positive net cash flows for the 12-month period, six indicated that
expenditures for the retraining of workers are expected to exceed 1 percent of
net cash flow from steel operations. Wheeling-Pittsburgh and Nucor do not
expect their respective situations to change from that reported above. * * *
11 In addition to the determination indicated above the President is required to determine whether, "each of the major companies conunitted for the applicable 12-month period not less than 1 percent of net cash flow to the retraining of workers; except that this requirement may be waived by the President with respect to a major company in noncompliance, if he finds unusual economic circumstances exist with respect to that company." £1 Retraining expenditures are treated as an expense in income statements, as either a component of cost of goods sold or· a component of general, selling, and administrative expenses; in order to avoid "double-counting," they have been added back to cash flow prior to the calculation of the ratio of retraining expenditures to cash flow.
74
Final data for the period October 1, 1985-September 30, 1986 indicate
that expenditures by eight of the major companies for the retraining of
workers amounted to $53.1 million during the period. Of the six companies
reporting positive net cash flows for the 12-month period, four indicated that
retraining expenditures exceeded 1 percent of net cash flow. With respect to
the other compani~s, * * *
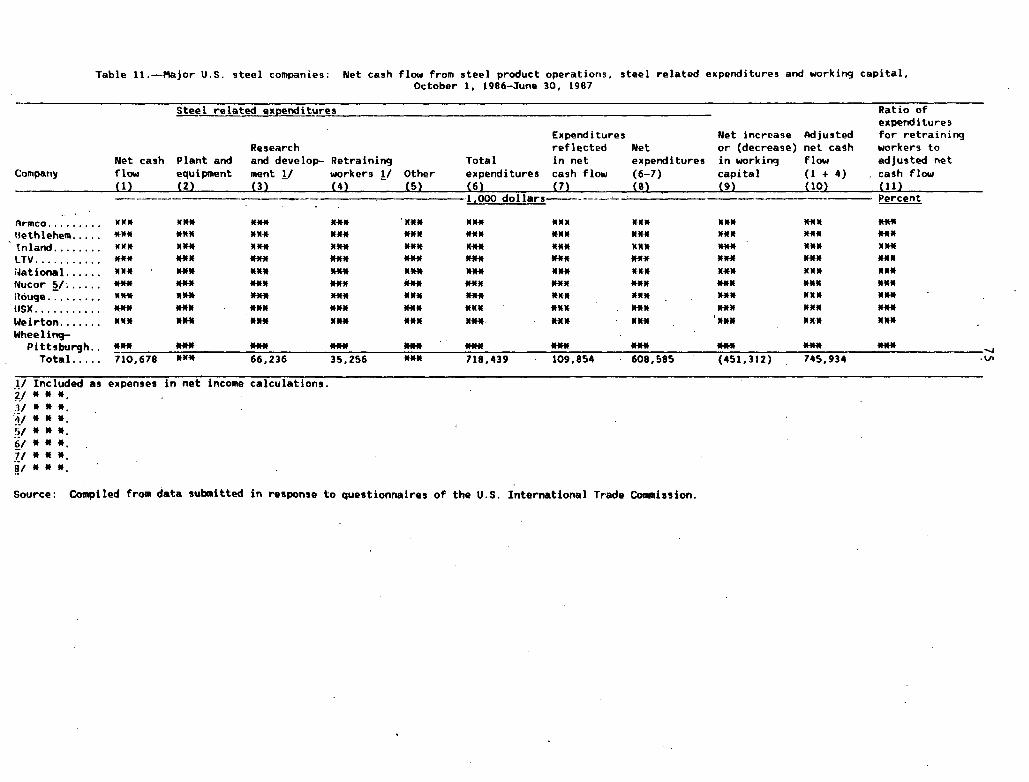
Table 11.-4'1ajor U.S. steel companies: Net cash flow from steel product operations, steel related expenditures and working capital, October 1, 1986-June 30, 1987
Steel related expenditures Ratio of expenditures
Expenditures Net increase Adjusted for retraining Research reflected Net or (decrease) net ca9h workers to
Net cash Plant and and develop- Retraining Total in net expenditures in working flow adjusted net flow equipment ment 1/ workers 1/ Other expenditures cash flow (1) (2_) - (3) - (4) - (5) (6) {7}
(6-7) capital (1 + 4) cash flow (8). (9L _ 110) CH)
Company
--·.--··--------·------·- -· 1,000.dollars----·------···' Percent
Armco ...... , .. Xlllt "** "** "** '"** "** 11101 II lilt lllMt Hit *** Bethlehem ..... *** *** *** *** *** *** *** **" Hit ltllll *** Cnland ........ Xlllt "** *** *** *** "** lllllt 1111 It ltll* lOl·lt lilt*
LTV .... ,, .. ,., *** *** *** *** *** *** *** *** llff *** *** r~ational ...... llll·lt llff *** *** llH llH lllllt lllllt Hit lllllt lilt*
Nucor ~/ ...... *** *** *** *** *** *** *** *** *** *** *** nouge ......... llH II** *** *** 1111* *** 111111 lllllt Hit lllllt ltff
llSX ........... *** ltllll· *** *** *** *** *** fflt *** *** *** W"irton ....... lllllt *** *** ••• "** *** ltlllt llH .,..,. 1111 It ,.,.,. Wheeling-
Pittsburgh .. *** *** *** *** *** *** *** *** *** *** *** Total. .... 710,678 ltll* 66,236 35,256 *** 718,439 109,854 608,585 (451,312) 745,934
Al Included as expenses in net income calculations. ?-_/ * * *· :Jlltlllt,
:l/ •• *· •;/ •• *· 61 • * *· 71 •• *· !it * • •. Source: Compiled from data submitted in response to questionnaires of the U.S. International Trade Commission.
'-I .vi
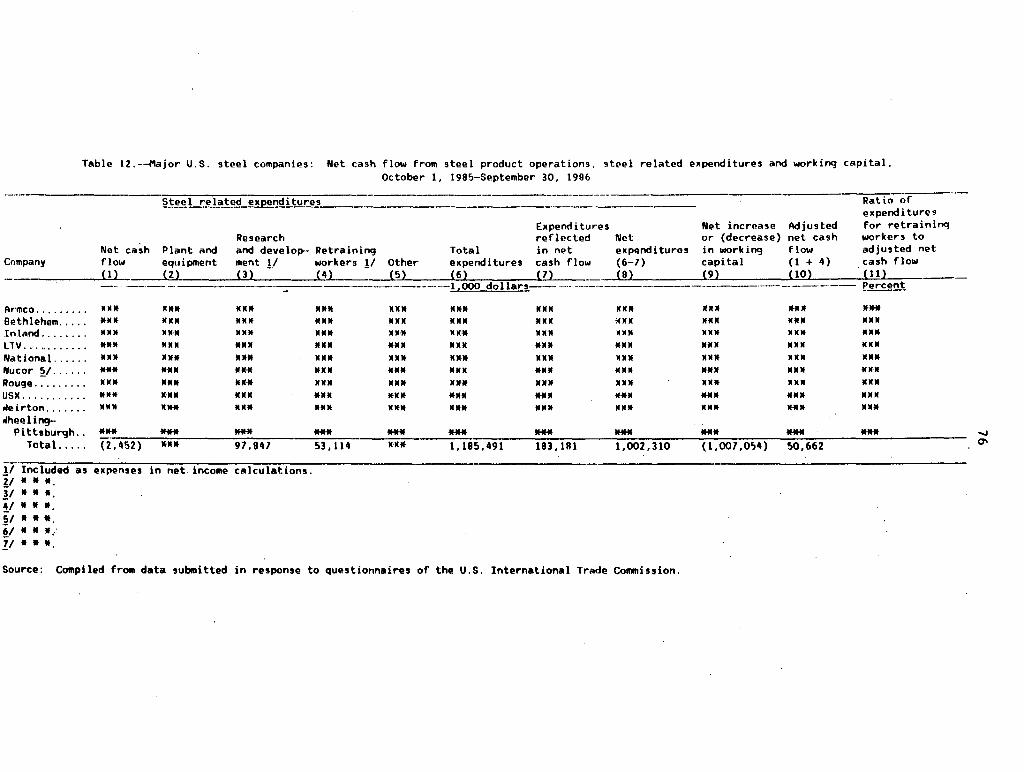
Table l2.--4'1ajor U.S. steel companies: Net cash flow from steel product operations, steel related eKpenditures and workinq capital, October 1, 198'.>-September 30, 1996
-g~Ll_~}~i..ll..d upenctiturl_!s --------·· -------·---···--------· Ratio of eKpendi ture'
E11penditures Net increase Adjusted for retraininq Research reflected Net or (decrease) net cash workers to
Net ca;h Plant and and develop- Retraininq Total in net eKpenditures in workinq flow adjusted net Company flow equipment ment !/ workers !/ Other eKpenditures cash flow (6-7) capital (1 + 4) . cash flow
(1) (2) (3) (4) (5) (6) (7) (9) (9) (10) (11} · ---·--·-··-------·--··---·-·--·----···-·--------·-1,000 dollars--· --- ----·- --·--·-·-·----------------------- !.'_!!rcent
Ar·mco ........• 111111 111111 1111 If 1111* lllllt lilt* J( 1111 lllllf 111111 lfll,. "** Bethlehem ..... **If 111111 IOllf 1111* *MIC· 111111 111111 ;011 10111 111111 111111 Inland ........ 111111 1111·11 111111 1111* 1111-11 lllf* 111111 011 lllllt lllllf 111111. LlV ............ *** J( 1111 *lllf lllflf 111111 lllllC *"II lllllf IHCll ICM II 111111 National ...... 111111 llltll 1111·* 1111* 111111 llH 111111 ICJI If 111111 llJllC 111111 Nucor ~/ ...... •-1111 •-1111 llH .... ICllll lllCll **II ICllll lfltll Wllll llllll Rouge ......... lllllf "** ""* 111111 Jllllt 11 lflt 111111 1111 If lllllf lllllt lllllt lJSX .•.••....•• .... 11·1111 11-1111 *"* *"" *"* ltllll llltll lflClf 111111 111111 loleirton ....... lllCll lllllt ICIClt llllll lllflf lllflt IClllf 111111 111111 11-llllt 1111* iolheeling-
Pittsburgh .. lflflt *** *** *** *** *** *** *** *** *** *** -..J
Total. .... (2,4'>2) 111111 97,847 53. 114 1111* 1,185,491 183,181 1,002,310 (1.007,0'>4) 50,662 a-
iT' Included as e11penses in net income ca lcu lat ions. 2/ • * * it * * •
y * * * 5/ * *,. 61 • * •.· !..1 * • •
Source: Compiled fra111 data submitted in response to questionnaires of the U.S. International Trade Commission.
77
* * * * * * (Pages 77 to 92 contain information which is entitled to confidential
treatment and have not been published.)
*
78
* * * * * * *

93
* * * * * * *
Actions Taken to Maintain International Competitiveness !I
The major companies identified a number of actions they have taken, or
will take, during the period October 1, 1986 to September 30, 1987 to maintain
their international competitiveness. The purpose of the actions were
identified as follows: (1) to produce price-competitive and quality
competitive products; (2) to control costs of production including employments
costs, and (3) to improve productivity. With respect to the first element, a
number of major companies identified actions taken to improve steelmaking and
flat-rolled product (i.e., plates, sheets and strip) operations. These
actions included installation or modifications of continuous casting
equipment, improvements in computer control of operations, and modifications
!I Under the Trade and Tariff Act of 1984, the President is required to make an annual determination as to whether "the major companies of the steel industry, taken as a whole, have, during the 12-month period ending at the close of an anniversary referred to in [The Act) . . . taken sufficient action to maintain their international competitiveness, including action to produce price-competitive and quality-competitive products, to control costs of production, including employment costs, and to improve productivity."

94
in electrogalvanizing equipment. Actions taken by the major companies to
control costs of production and to increase productivity included reductions
in the size of the workforce, company restructuring, new labor contracts, and
use of lower cost raw materials and energy sources. Following is a
company-by-company review of competitive actions taken, based on information
reported by companies in response to Commission questionnaires, as well as
information drawn from annual reports and other sources.
* * * * * * (Pages 93 to 101 contain information entitled to confidential treatment
and have not been published.)
*
103
Appendix A
Copy of Letter to Chairwoman Paula Stern from Ambassador William E. Brock, United States Trade Representative, Requesting an Investigation ·
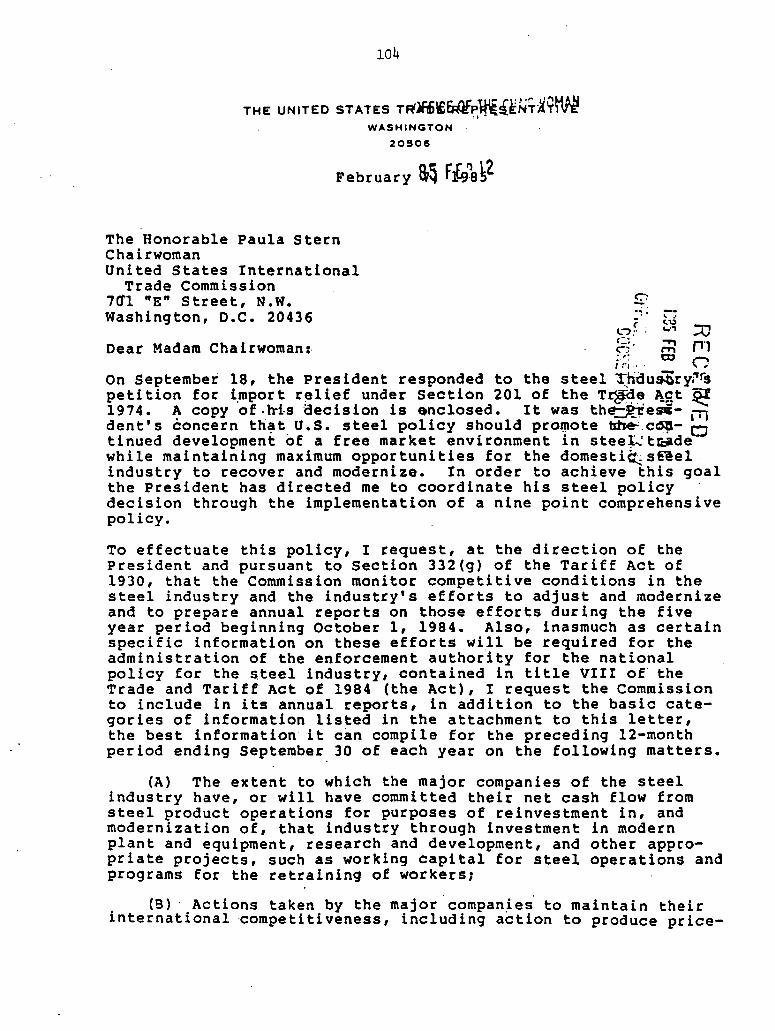
104
WASHINGTON ·
20506
February &~ Fi£91J~Z
The Honorable Paula Stern Chairwoman United States International
Trade Commission 1a1 "E" Street, N.w. Washington, o.c. 20436
Dear Madam Chairwoman:·
-~' ~~ , .. .., l."'.? f : ._., :::0 ,-. 6' ~ ,,.1 i~i .. aJ ("")
On September 18, the President responded to the steel ~pdus:bry~~ petition for i.mport relief under Section 201 of the T~~ ~gt ~ 1974. A copy of -h-i-s i:3ecision is enclosed. It was th~en- rn dent's concern th~t U.S. steel policy should pro~ote ~.c~- c::J tinued development of a free market environment in stee~.: tyde while maintaining maximum opportunities for the domesti~s~el industry to recover and modernize. In order to achieve this goal the President has directed me to coordinate his steel policy decision through the implementation of a nine point comprehensive policy.
To effectuate this policy, I request, at the direction of the President and pursuant to Section 332(g) of the Tariff Act of 1930, that the Commission monitor competitive conditions in the steel industry and the industry's efforts to adjust and modernize and to prepare annual reports on those efforts during the five year period beginning October 1, 1984. Also, inasmuch as certain specific information on these efforts will be required for the administration of the enforcement authority for the national policy for the $teel industry, contained in title VIII of the Trade and Tariff Act of 1984 (the Act), I request the Commission to include in its annual reports, in addition to the basic categories of information listed in the attachment to this letter, the best information it c~n compile for the preceding 12-month period ending September 30 of each year on the following matters.
(A) The extent to which the major companies of the steel industry have, or will have committed their net cash flow from steel product operations for purposes of reinvestment in, and modernization of, that industry through investment in modern plant and equipment, research and development, and other appropriate projects, such as working capital for steel operations and programs for the retraining of workers;
(B) ·Actions taken by the major.compan~ei to maintain their international ~ompetitiveness, including action to produce price-
105
competitive and quality-competitive products, to control costs of production, including employment costs, and to improve productivi ty1 and
(C) Whether each of the major·companles committed, or will have committed, not less than one percent of net cash flow to the retraining of workers.
If any major company did not commit at least one percent of its net cash flow to the retraining of workers, the Commission should report any unusual economic.circumstances which contributed to the company's· failure to do so.
For the purpose of this request the terms •steel industry•, •major company•, and •net cash flow• shall have the same meaning as that set forth in title VIII of the Act.
In addition to. reporting on the progress on the steel indust.~y as a whole; I reques·t that the Commission prepare its report in such a manner that, to the extent possible, the progress of carbon · steel producers in their efforts to adjus.~ and modernize can be distinguished from that of producers of specialty steel.
Inasmuch as·the President's determination called for in the.Act will have to be made before .the end of each annuai period, the Commission ls requested to begin submitting its annual reports on August 1, 1985, and on each successive August 1 through 1989.
Very truly yours,
WI~~BROCR WEB:hcc
Enclosure
106
TB! RBITE BOOSE
Office of tbe Press Secretary
.ror Immediate Release
llEMORAHDOK roR TBE OHITED ST~ TRADE REPRESENTATIVE
SOBJECTa Steel Import Relief Determination
Pureuant to Section 202(b)(l) of tbe Trade Act of 197•, (P.L. tl-618, 88 Stat. 1978), I bave determined tbe actiona I will take witb reepect to tbe report of tbe United State• International Trade Commiaaion (OSITC) dated July 2•, 1984 concerning carbon and alloy ateel.
I. have determined today under Section 203 of the Trade Act tbat import relief ia not in tbe national economic 1ntereat lot the following reaeonaa
1. In responding to tbia preaaing import proble•, we muat do a11· we can to avoi4 protection!••• to keep our ••rket open to free ana fair competition, and to provide certainty of ace••• for our trading partner•. Tbi• Adminiatration baa repeatedly, and mo•t recently at tbe London lconomic Summit, committed it••lf to •re•ist continuing protectionist presaurea, .to reduce barriers to trade, and to •ake renewed effort• to liberalise and ezpand trade in •anufactur••• commoditi•• and aervicea.•
2. It ia not in the national economic intereat to take action• vhicb put at riak tbouaanda of job~ in ateel fabricating and otber consuming induatrit• or in tbe otber ••ctor• of the D.S. economy t~at aigbt be affected by coapenaation or retaliation .eaaurea to vbich our trading partner• would be entitled.
l. Tbi• Adeiniatration baa already taken many atepa to deal vitb tbe ateel import problem. In 1182, a comprebenaive arrangement re•training ateel import• from tbe Buropean Community vu negotiated. Thia Adminiatration baa alao conducted an unprecedented number of antidumping and countervailing duty inveatigation• of •teel import•, in moat ca••• reaulting in.the impoaition of duti•• or a negotiated aettlement. In addition, tbe governmenta of Rezico and Soutb Africa bave unilaterally lmpoaed voluntary re1traint on ezportl, leading to tbe termination of unfair t~ade complaint•.
However, I bave decided to e1tabli1b a government policy for tbe 1teel induatry. I believ~ tbat tb1• new policy i• the beat way to reapond to tbe legitimate concern• of th• do:H!tic industry vblle maintaining accea1 to our aarket for thoae vbo trade fairly.
I am directing you to coordinate and direct the implementation of tbis policy for tb• o.s. •teel indu1try wbich include• tbe following element••
aore
107
1. Tbe Onited States Trade Representative (OSTR) will negotiate •surge control• arrangements or understandings and, vbere appropriate, auspension agreements vith countries whose .. p.orta to the Onited States have increased aignificantly in recent years due to an unfair surge in imports -- unfair because of dumping aubsidization, or diversion from otber importing countries vbo bave restricted accesa to their markets. The OSTR vill negotiate additional aucb arrange~ents and underatandinga, if necessary, to control nev surges of imports that result from aubsidizin9,,dumpin9 or other unfair or restrictive trade practices during tbe nest five yeara. If agreements cannot be. reached to control nev aurges from countries tbat are guilty of unfair practices, tbe Preeident vUl use bis authority under the unfair trade lava including Section 301 of tbe Trade Act of 1974 to assure that these-countries do not maintain unreatricted access to tbe ~nited States market. ·
2. The United Statea Tude Repreaentative will reaffirm eziating •eaaurea with countsiea that bave Yoluntarily restrained their ezporta to our market, and vUl take neceaaary atepa to enaure tbe effectiveneaa of these measures. Specifically tbe Adminiatration will aupport legislation in the Congrea1 to make enforceable at our borders all voluntary agreements and •aurge control• arrangement•.
3. The United States Trade Representative will consult with our trading partner• to aeek the elimination of trade diatortive and trade restraining ·practices in other market• to lead to tbe liberalization of ateel trade around the world.
4. The Department of Co111111erce will continue to rigorously enforce our unfair trade lava. Purtber, tbe Department of Commerce and the United States Trade Representative will •elf-initiate unfair trade cases including antidumping, countervailing duty and Section 301 actions
·wben appropriate.
5. 'l'be United State• International Trade Co111111ission vill be a1ked to monitor tbe efforts of tbe ateel industry to adjust and aodernize, and to prepare an annual report for tbe Preaident on thoae effort•.
6. The Secretary of Commerce vlll eatabli1b an interagency group to analyze all o.s. government domestic tax, regulatory and antitrust lava and policle• which could hinder the ability of tbe 1teel indu1try to modernize.
7. The Secretary of Defen1e and tbe Pederal Emergency Ranagement Agency will analyze dome1tic steel plate rolling capacity in relationship to emergency needs, and to recommend to the Pre1ident appropriate action• if deficienciea are found to ezi1t.
e. Tbe Secretary of Labor vill work vitb state and local governments to develop a program to a1aiat workers in communities adversely affected by 1teel imports.
108
t. The United States Trade Representative will closely aonitor the trade elements of this program and the resultant import tre~ and report them to tbe President on a quarterly basia.
The Administration' a hope ia that thia combination of actions, ~ taken vitbout protectionist intention or effect would enable
one of the Dnited States' aoat basic and vital industries to return to a level playing field, ~n• in which ateel ia traded on tbe basis of market forces, not government intervention, and one in which the 111arket would aeek a return to a more normal level of ateel import•, ·or approximately 18.5 percent, excluding aemi-finiahed 1teel.
Thia deter~lnatlon 11 to be publ11hed in tbe •ed•r•J ae;ieter.
I I t t I I
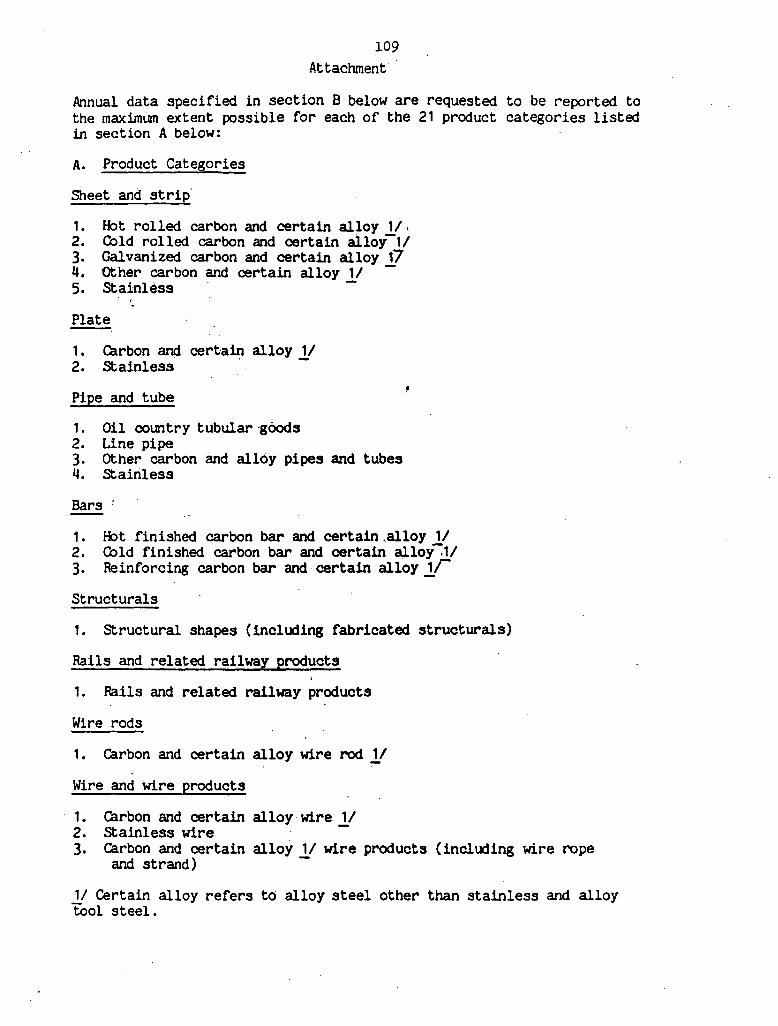
109
Attachment
Annual data specified in section B below are requested to be reported to the maximum extent possible for each of the 21 product categories listed in section A below:
A. Product Categories
Sheet and strip.
1. Hot rolled carbon and certain alloy 1/ , 2. Cold rolled carbon and certain alloy-1/ 3. Galvanized carbon and certain alloy 17 4. Other carbon and certain alloy 1/ -5. Stainless -
Plate
1 • Carbon ~ certa~ alloy 1/ 2. Stainless
Pipe and tube
1. Oil country tubular ·g6ods 2. Line pipe 3. Other carbon and alloy pipes and tubes 4. Stainless
Bars ~
1. Hot finished carbon bar and certain .,alloy 11 2. Cold finished carbon bar and certain allof~l/ 3, Reinforcing carbon bar and certain alloy y Structurals
1. Structural shapes (incll.Xling fabricated structurals)
Rails and related railway products
1. Pails and related railway products
Wire rods
1. Carbon and certain alloy wire rod .Y
Wire and wire products
1. Carbon and certain alloy wire 1/ 2. Stainless wire -3, Carbon and certain alloy 1/ wire products ( incll.Xling wire rope
and strand) -
1/ Certain alloy refers to alloy steel other than stainless and alloy tool steel.
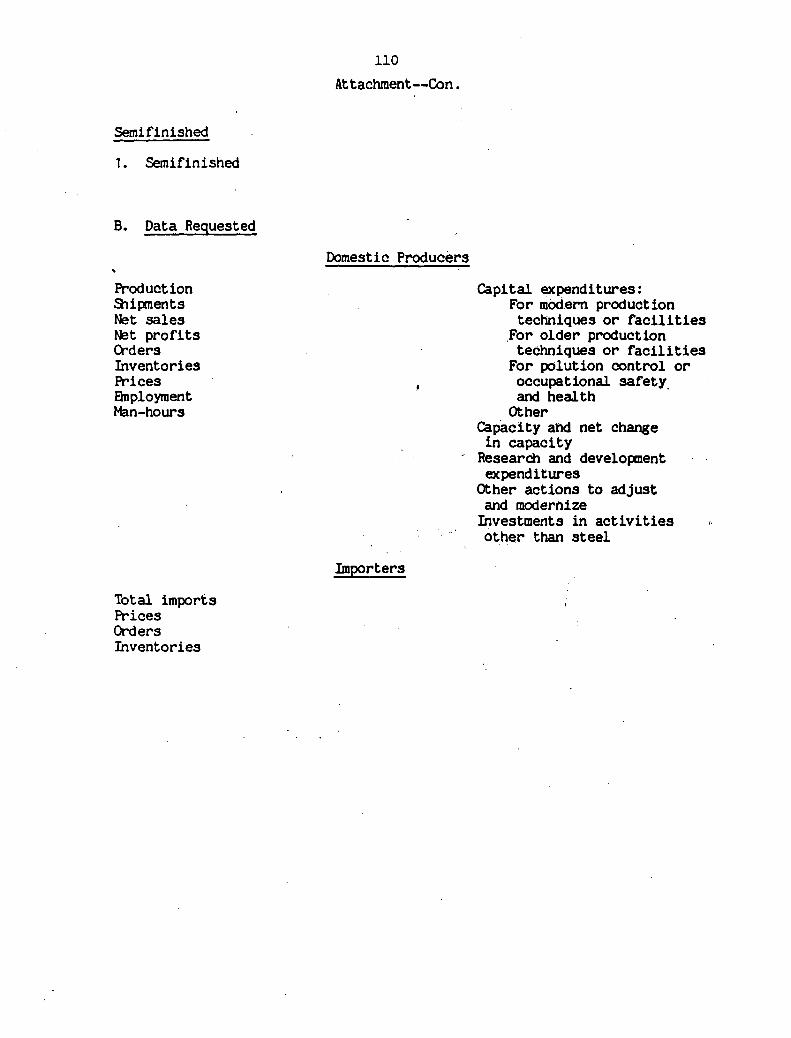
Semi finished
1. Semifinished
8. Data Requested
.. Production S'lii:ments Net sales Net profits C:X-ders Inventories Prices Elnployment Man-hours
Total imports Prices Orders Inventories
110
Attachment--Con.
Domestic Producers
Importers
Capital expenditures: For mooern production techniques or facilities
.For older production techniques or facilities
For p0lution control or occupational safety and health ·
Other Capacity abd net change in capacity
- Research and development expenditures
Other actions to adjust and modernize
Investments in activities other than steel
111
Appendix B
Notice of the Conunission's Investigation
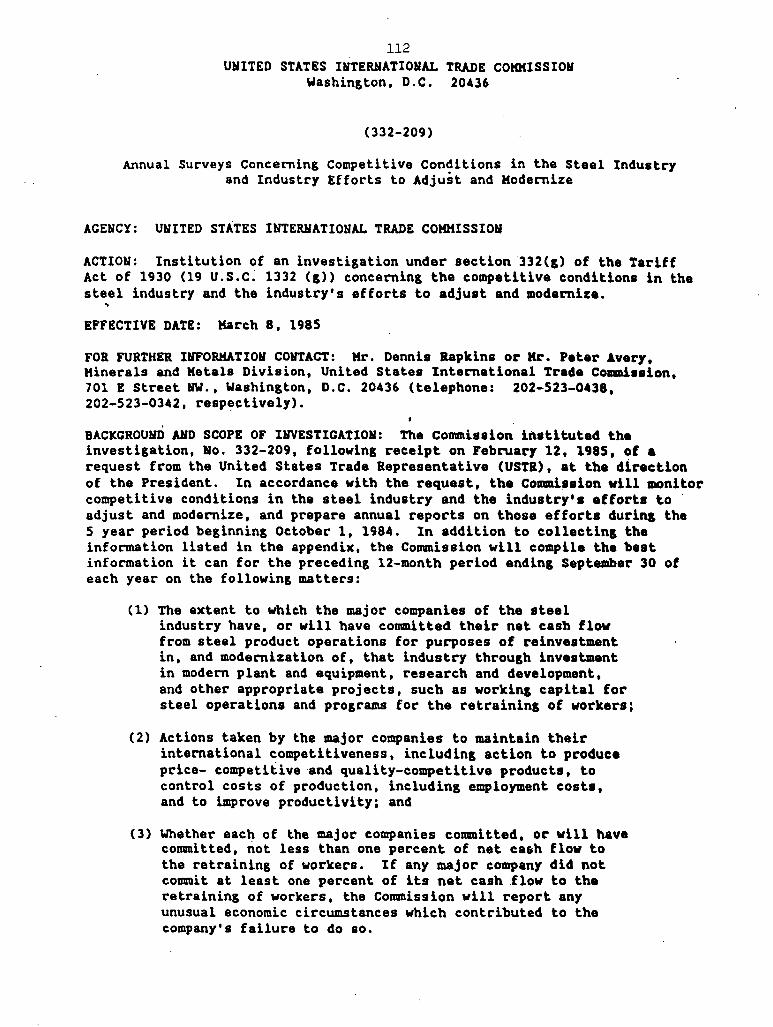
112 UUITED STATES IHTERNATIOHAL TRADE COKKISSIOU
Washington, D.C. 20436
(332-209)
Annual Surveys Concerning Competitive Conditions in the Steel Industry and Industry Efforts to Adjust and Modernize
AGENCY: UNITED STATES INTERNATIONAL TRADE COMKISSIOU
ACTION: Institution of an investigation under section 332(g) of the Tariff Act of 1930 (19 u.s.c~ 1332 Cg)) concerning the competitive condition• in the steel industry and the industry's efforts to adjust and modernize • .. EFFECTIVE DATE: Karch 8, 1985
FOR FURTHER IHFOIUiATIOH COHTACT: Kr. Dennis llapkina or Kr. Peter Avery, Minerals and Metals Division, United States International Trade Commiaaion, 701 E Street HW., Washington, D.C. 20436 (telephone: 202-523-0438, 202-523-0342, resp~~tively).
BACKGROUUD AHD SCOPE OF IHVESTIGATIOU: The Commission instituted th• investigation, Ho. 332-209, following receipt on February 12, 1985, of a request from the United States Trade Representative (USTR), at the direction of the President. In accordance with the request, the Commi•1ion vill monitor competitive conditions in the steel industry and the industry's effort• to · adjust and modernize, and prepare annual reports on those efforts during the 5 year period beginning October 1, 1984. In addition to collecting the information listed in the appendix, the Commission will compile the best information it can for the preceding 12-month period ending September 30 of each year on the following matters:
(1) The extent to which the major companies of the steel industry have, or will have committed their net cash flow from steel product operations for purposes of reinvestment. in, and modernization of, that industry through inva1tmant. in modern plant and equipment, research and development, and other appropriate projects, such as working capital for steel operations and programs for the retraining of workers:
(2) Actions taken by the major companies to maintain their international competitiveness, including action to produce price- competitive ·and quality-competitive products, to control costs of production, including employment costs, and to improve productivity; and
(3) Whether each of the major companies committed, or will have committed, not less than one percent of net ca1h flow to the retraining of workers. If any major company did not commit at least one percent of its net cash flow to the retraining of workers, the Commission will report any unusual economic circumstances which contributed to the company's failure to do so.
113
For the purpoH• of thil investigation, tha term "1teal indu1try" h defined u producera in tha United States of steel products; "major company" ii an enterprise whose raw steal production in the United States during 1983 exceeded 1,500,000 net tons; and "net cash flow" is annual net (after-tax)
.income plu1 depreciation, depletion allowances, amortization, and changes in reserves minus dividends and payments on short-term and long-term debts and liabilities.
In addition to reporting on the.progress of the steel indu1try a• a whole, report.a will be prepared in such a manner that, to tha extant poaaible, the progre•s of carbon steel producers in their efforts to adjust and modernize can be diatinguished from that of producers of specialty steel.
~
The Commi••ion will aubmit its initial annual report to the President and USTI by August 1, 1985. Subsequent reports will be submitted by Aµguat 1 of each successive year through 1989. · A public veraion of the report will be available 2 weeks later.
WRITTEH SUBKISSIOYS: · Interested persons are invited to aubmit written statements concerning the investigation. Co1111Uercial or financial information which a submitting pa~ty desires the Commission to treat as confidential must be submitted on separate sheets of paper, each clearly marked "Confidential Business Information" at the top. All submissions rt:tquesting confidential treatment must conform with the requirements of section 201.6 of the Commission's Rules of Practice and Procedures (19 era 201.6). All writ.ten submissions, except for confidential business information, will be snade available for inspection by interested persons. To be assured of consideration by the Commission, written statements should be received at. t.ha earliest possible date, but no later than July 1. 1985 and by July 1 of each successive year through 1989. All submissions should be addressed to the Secretary at the Commission's Office in Washington, D.C.
By order of the Commission.
Secretary
Attachment
Issued: Karch 11, 1985
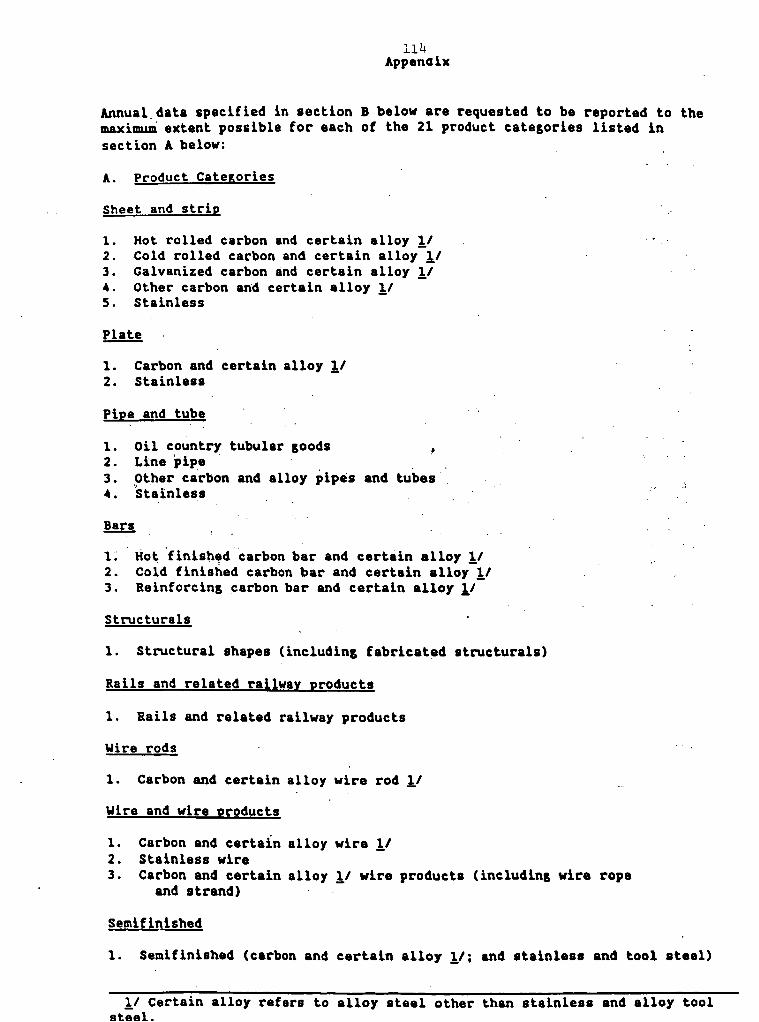
ll4 Appana ix
Annual.data specified in section B below are requested to be reported to the maximum extent possible for each of the 21 product categories listed in section A below:
A. Product Categories
Sheet and strip
1. Hot rolled carbon and certain alloy !I 2. .Cold rolled carbon and certain alloy !/ 3. Galvanized carbon and certain alloy !I 4. Other carbon and certain alloy !I 5. Stainless
1. Carbon and certain alloy !I 2. Stainless
Pipe and tube
1. 2. 3.
••
Oil country Line pip.• · Other carbon 'stainles,s
tubular goods
and alloy pipes and tubes
L Hot ·finished carbon bar and certain alloy !I 2. Cold finished carbon bar and certain. alloy !I 3. Reinforcing carbon bar and certain alloy !I
Structui:-als
1. Structural shapes (including fabricated structurals)
Rails and related railway products
1. Rails and related railway products
Wire rods
1. Carbon and certain alloy wire rod !I
Wire and wire products
1. Carbon and certain alloy wire !/ 2. Stainless wire 3. Carbon and certain alloy !I wire products (including wire rope
and strand)
Semifinisbed
1. Semifinished (carbon and certain alloy !/; and atainless and tool ateel)
!I Cei:-tain alloy ref era to alloy steel other than stainlesa and alloy tool steal.
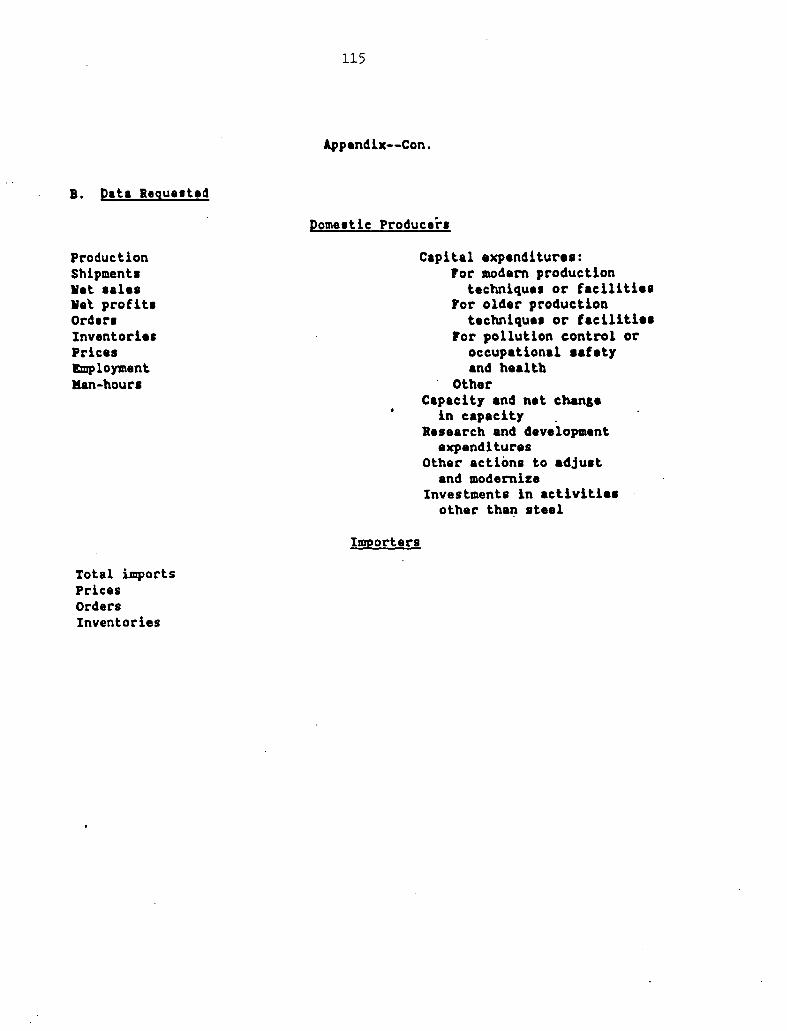
B. pata Regu11ted
Production Shipments Wet aales lie~ profit• Ord1r1 Inventories Prices Employment Han-hours
Total imports Pdces Orders Inventories
115
Appendix--Con.
pomestic Producer•
Capital expenditure•:
Importers
ror modern production technique• or f aeililie•
For older production technique• or faciliti••
For pollution control or occupational aaf ety and healtb
Other Capacity and net change
in capacity . Research and development
expenditures Other action• to adju1t
and modernize Investments in acllvlli••
other than steel


117
Appendix c
Definition of Certain Terms, and Description of the Products SUbject to the Investigation
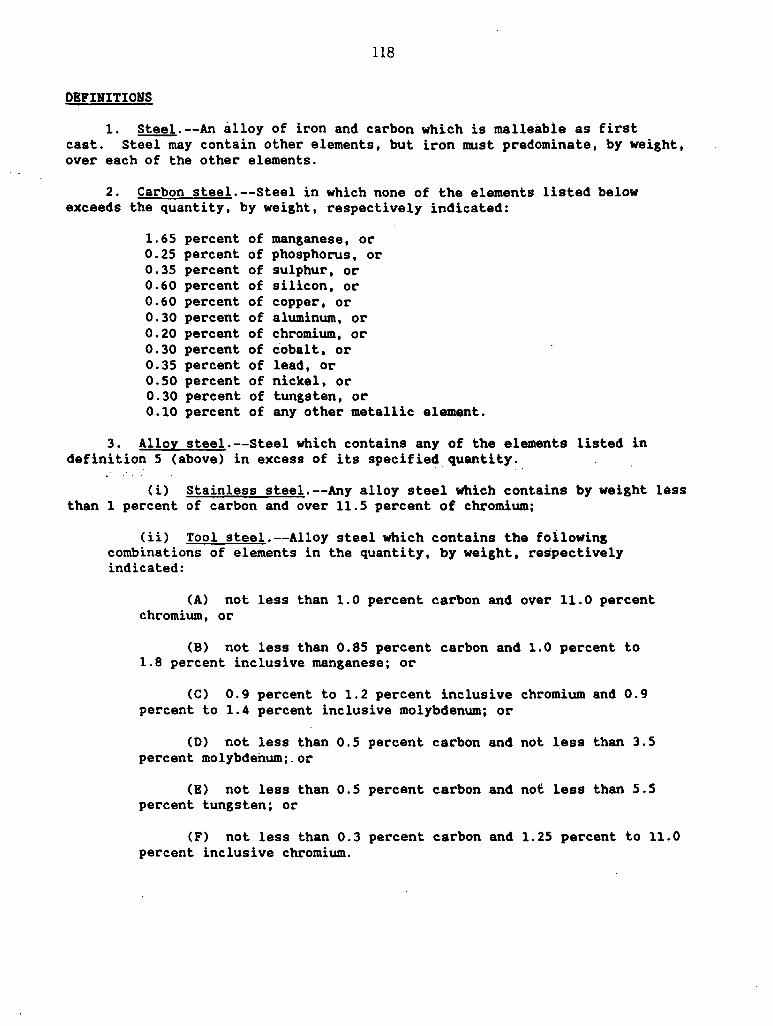
118
DEFINITIONS
1. Steel.--An alloy of iron and carbon which is malleable as first cast. Steel may contain other elements, but iron must predominate, by weight, over each of the other elements.
2. Carbon steel.--Steel in which none of the elements listed below exceeds the quantity, by weight, respectively indicated:
1.65 percent of manganese, or 0.25 percent of phosphorus, or 0.35 percent of sulphur, or 0.60 percent of silicon, or 0.60 percent of copper, or 0.30 percent of aluminum, or 0.20 percent of chromium, or 0.30 percent of cobalt, or 0.35 percent of lead, or 0.50 percent of nickel, or 0.30 percent of tungsten, or 0.10 percent of any other metallic element.
3. Alloy steel.--Steel which contains any of the elements listed in definition 5 (above) in excess of its specified quantity.
Ci) Stainless steel.--Any alloy steel which contains by weight less than 1 percent of carbon and over 11.5 percent of chromium;
(ii) Tool steel.--Alloy steel which contains the following combinations of elements in the quantity, by weight, respectively indicated:
(A) not less than 1.0 percent carbon and over 11.0 percent chromium, or
CB) not less than 0.85 percent carbon and 1.0 percent to 1.8 percent inclusive manganese; or
(C) 0.9 percent to 1.2 percent inclusive chromium and 0.9 percent to 1.4 percent inclusive molybdenum; or
CD) not less than 0.5 percent carbon and not less than 3.5 percent molybdenum;. or
(E) not less than 0.5 percent carbon and not less than 5.5 percent tungsten; or
(F) not less than 0.3 percent carbon and 1.25 percent to 11.0 percent inclusive chromium.
119
DEFIHITIOHS--Continued
4. Galvanized.-~steel which has been coated or plated with zinc.
5. Hot-rolled.--Steel which has been reduced to its final thickness by heating and rolling the product at elevated temperature (usually above 2,2000 F).
6. Cold rolled.--Steel which has been reduced to its final thickness by rolling the product without heating it immediately prior to the rolling operation.
7. Continuous casting.--The method of producing semifinished products in which molten steel flows evenly into a caster where it is rapidly cooled, causing it to solidify directly into semif inished products such as slabs and billets.
8. Short ton.--Two thousand (2,000) pounds.
Semif inished products include
9. (A) Ingots.--Castings resulting from the solidification of molten steel and having a colUllU'\ar form suitable for working by rolling or forging. Ingots are included in American Iron and Steel Institute (AISI) product group Ho. lA.
(B) Blooms and billets.--Semifinished products generally of rectangular or circular cross section, having a length several times greater than the maximum cross~sectional.dimension, and, if rectangular, a width less than 4 times the thickness. A bloom is at least 36 square inches but not less than 3 square inches in cross-sectional areas. Blooms and billets are included in AISI product group Ho. lB.
(C) Slabs and sheet bars.--Semifinished products of rectangular cross section, having a width of at least 4 times the thickness. A slab is not less than 2 inches in thickness; a sheet bar is less than 2 inches in thickness. Slabs and sheet bars are included in AISI product group No. lB.
(i) Carbon and certain alloy semifinished products, as provided for in items 606.6705, 606.6710, 606.6715, 606.6720, 606.6725, 606.6730, 606.6735, 606.6740, 606.6949, 606.6951, 606.6953, 606.6955, 606.6957, 606.6959, 606.6961, 606.6963, 607.6620, and 607.7803 of the Tariff Schedules of the United States Annotated (1987) (TSUSA).
(ii) Stainless and alloy tool steel semifinished products, as provided for in items 606.6901, 606.6902, 606.6904, 606.6905, 606.6906, 606.6909, 606.6912, 606.6915, 606.6918, 606.6921, 606.6923, 607.7210, and 607.7603 of ~he TSUSA.
120
DEFIBITIOBS--Continued
10. Sheets and strip.--Flat rolled products whether or not corrugated or crimped, in coils or cut to length. Sheets are under 0.1875 inch in thickness and over 12 inches in width. Strip is under 0.1875 inch in thickness and, if cold rolled, over 0.50 inch but not over 12 inches in width, or, if not cold rolled, not over 12 inches in width. Sheets and strip are included in AISI product group Nos. 28, 29, 29A, 30, 31, 32, 33A, 338, 34, 348, 35, 36, and 37. For the purposes of this investigation, sheets and strip are classified as follows:
(i) Hot-rolled carbon and alloy steel sheets and strip; provided for in items 607.6710, 607.6720, 607.6730, 607.6740, 607.8100, 607.8342, 607.9205, 608.1920, 608.2120, and 608.2320 of the TSUSA.
(ii) Cold-rolled carbon and alloy steel sheets and strip; provided for in items 607.6200, 607.6400, 607.8350, 607.8355, 607.8360, 607.8362, 607.8366, 607.8375, 607.8378, 607.8380, 607.8385, 607.8390, 607.9210, 607.9315, 607.9320, 608.1930, 608.1940, 608.1945, 608.2130, 608.2140, 608.2145, 608.2150, 608.2160, 608.2170, 608.2330, 608.2340, 608.2345, 608.3810, 608.3820, 608.3900, 608.5510, 608.5520, 608.6710, and 608.6720 of the TSUSA.
(iii) Galvanized carbon and alloy steel sheets and strip; provided for in items 608.0730, 608.1305, 608.1310, 608.1315, 608.1320, 608.1321, 608.1325, 608.1330, 608.1331, and 608.1335 of the I§Y§A.
(iv) All other carbon and alloy steel sheets and strip; provided for in items 607.9600, 607.9700, 607.9900, 608.0100, 608.1340, 608.1350, 608.1440, 609.1710, and 609.1790 of the TSUSA.
· (v) Stainless steel sheets and strip; provided for in items 607.7610, 607.9010, 607.9020, 608.2600, 608.2900, 608.4300, and 608.5700 of the TSUSA.
11. Plates.--Flat rolled products whether or not corrugated or crimped, in coils or cut to length. Plates are 0.1875 inch or more in thickness and, if not cold rolled, over 8 inches in width. Plates are included in AISI product group No. 6. For the purposes of this investigation, plates are classified as follows:
(i) carbon and certain alloy steel plate; as provided for in items 607.6610, 607.6625, 607.7806, 607.8320, 607.9100, 607.9400, 608.0710, 608.1100, 608.1420, and 609.1400 and 609.1500 of the TSUSA.
(ii) Stainless steel plate; as provided for in items 607.7606 and 607.9005 of the TSUSA.
12. Pipes and tubes and blanks therefor.--TUbular products, including hollow bars and hollow billets but not including hollow drill steel, of any cross-sectional configuration, by whatever process made, whether seamless, brazed, or welded and whether with an open or lock seam or joint. For the purposes of this investigation, pipes and tubes and blanks therefor are classified as follows:
121
DEFINITIONS--Continued
(i) Oil country tubular goods, conforming to American Petroleum Institute (API) specifications, as provided for in items 610.3216, 610.3219, 610.3233, 610.3249, 610.3252, 610.3256, 610.3258, 610.3264, 610.3721, 610.3722, 610.3925, 610.3935, 610.4025, 610.4035, 610.4210, 610.4220, 610~4230, 610.4240, ~10.4310, 610.4320, 610.4335, 610.4942, 610.4944, 610.4946, 610.4954, 610.4957, 610.4968, 610.4969, 610.4970, 610.5221, 610.5222, 610.5226, 610.5240, 610.5242, 610.5243, 610.5244 of the TSUSA. Oil country tubular goods are included in AISI product group No. 19.
(ii) Line pipe, conforming to API specifications; as provided for in items 610.3208, 610.3209, 610.3212, 610.3213, 610.3711, 610.3712, 610.3713, 610.4931, 610.4933, 610.4936, 610.5211, 610.5214, and 610.5216. Line pipe is included in AISI product group Ho. 20.
(iii) Other carbon and alloy (excluding stainless) pipes and tubes, as provided for in items 610.3000, 610.3100, 610.3205, 610.3221, 610.3227, 610.3231, 610.3234, 610.32il, 610.3242, 610.3243, 610.3254, 610.3262, 610.3500, 610.3600, 610.3704, 610.3728, 610.3732, 610.3751, 610.3945, 610.3955, 610.4045, 610.4055, 610.4245, 610.4255, 610.4345, 610.4355, 610.4500, 610.4600, 610.4800, 610.4920, 610.4925, 610.4928, 610.4948, 610.4951, 610.4953, 610.4955, 610.4956, 610.4966, 610.4967, 610.4976, 610.5160, 610.5204, 610.5206, 610.5209, 610.5229, 610.5234, and 610.5236, of the TSUSA. Other carbon and alloy steel pipes and tubes are included in AISI product group Hos. 18, 21A, 218, and 22.
(iv) Stainless steel ~i~es and tubes, welded or seamless, provided for in items 610.3701, 610.3727, 610.3731, 610.3741, 610.3742, 610.5130, 610.5202, 610.5230, and 610.5231. Stainiess steel pipes and tubes are included in AISI product group Hos. 21C and 210.
13. Bars.--Products of solid cross section not conforming completely to the respective specifications set forth in the TSUS for blooms, billets, slabs, sheet bars, wire rods, plates, sheets, strip, wire, rails, joint bars, or tie plates, and which have cross sections in the shape of circles, segments of circles, ovals, triangles, rectangles, hexagons, or octagons. Also, for the purposes of this investigation, the term "bars" includes hollow drill steel, which is a hollow produ~t in any cross section suitable for use in making mining drills or mining drill rods, with the largest internal cross-sectional dimension not greater than one-third of the largest external cross-sectional dimension. For the purposes of this investigation, bars are classified as follows:
(i) Hot finished carbon and certain alloy steel bars; as provided for in items 606.8310, 606.8330, 606.8350, 606.8600, 606.9700, 607.0500, 607.0700, and 607.0900 of the TSUSA, and included in AISI product group No. 14.
(ii) Cold finished carbon steel and certain alloy steel bars; as provided for in items 606.8805, 606.8815, and 606.9900 of the TSUSA, and included in AISI product group No. 16.
122
DEFINITIONS--Continued
C iii) Reinforcing carbon and certain alloy steel bars; which are hot-rolled steel bars, of solid cross section, having deformations of various patterns on their surfaces; as provided for in items 606.79 and 606.81 of the TSUS and included in AISI product group Ho. 15.
14. Structural shapes and units include the following articles:
(i) Angles, shapes, and sections. Hontubular products not conforming completely to the respective specifications set forth in the TSUS for blooms, billets, slabs, sheet bars, bars, wire rods, plates, sheets, strip, wire, rails, joint bars, or tie plates, hot rolled, forged, extruded, or drawn, or cold formed or cold finished, whether or not drilled, punched, or otherwise advanced, and if cold formed weighing over 0.29 pound per linear foot. Angles, shapes, and sections comprise:
(A) Light structural shapes (bar-size light shapes having a maximum cross-sectional dimension of less than 3 inches; as provided for in items 609.8050, 609.8070, 609.8090, 609.8235, and 609.8240 of the TSUSA and included in AISI product g~oup Bo. 14A; and
CB) HeavY structural shapes having a maximum cross-sectional dimension of 3 inches or more; as provided for in items 609.8005, 609.8010, 609.8020, 609.8025, 609.8035, 609.8041, 609.8045, 609.8225, and 609.8230 of the TSUSA and included in AISI product group Nos. 4 and 5(pt.); and
(ii) Sheet piling.--Rolled straight web, deep-arch, arch-web, and Z-sections having continuous interlocking joints on each lengthwise edge; as provided for in items 609.96 and 609.98 of the TSUS. Sheet piling is included in AISI product group No. 5 (pt); and
(iii) Fabricated structural units, which include columns, pillars, posts, beams, girders, and similar structural units; as provided for in items 609.84, 609.86, 652.94, 652.96, and 653.00 of the TSUS. These columns, pillars, etc., are included in AISI product group Ho. 38.
15. Rails and related railway products as defined by the following:
(i) Rails are hot-rolled steel products, whether punched or not punched, weighing not less than 8 pounds per yard, with cross-sectional shapes intended for carrying wheel loads-in railroad, railway, and crane runway applications; as provided for in items 610.2010, 610.2025, 610.2030, and 610.2100 of the TSUSA. Rails are included in AISI product group Nos. 7 and 8.
(ii) Joint bars are hot-rolled steel products, usually punched or slotted, designed to connect the ends of adjacent rails in track; tie plates are hot-rolled steel products which are punched to provide holes for spikes and have one or two shoulder sections as rail guides and are used to support rails in track, to maintain track gauge, an_d protect the ties; all the foregoing, as provided for in items 610.25 and 610.26 of the TSUS. Joint bars and tie plates are included in AISI product group Nos. 9 and 10.
123
DEFIHITIOHS--Continued
(iii) Railway track spikes, of one piece construction, used to secure tie plates or ties; as provided for in item 646.3020 of the TSUSA. Railway track spikes are included in AISI product group No. 11.
(iv) Railroad and railway (RR) axles and wheels, parts thereof, and axle bars; as provided for in items 690.25 and 690.30 of the TSUS. These articles are included in AISI product group Nos. 12 and 13.
16. Carbon and certain alloy wire rods.--Coiled, semifinished, hot-rolled products of solid cross section, approximately round in cross section, not under 0.20 inch nor over 0.74 inch in diameter; as provided for in items 607.14, 607.17, 607.22, 607.23, 607.41, and 607.59 of the TSUS. Wire rods are included in AISI product group Ho. 3.
17. Wire and wire products are classified as follows:
(i) Carbon and certain alloy wire; a finished, drawn, nontubular product, of any cross-sectional configuration, in coils, and not over 0.703 inch in maximum cross-sectional dimensioni the term includes a product of solid rectangular cross section, in coils, with a cold-rolled finish, and not over 0.25 inch thick and not over 0.50 inch wide. Wire is provided for in items 609.20, 609.21, 609.22, 609.25, 609.28, 609.35, 609.36, 609.37, 609.40, 609.41, 609.43, 609.70, 609.72, 609.75, and 609.76 of the TSUS, and item 609.3040, 609.3340, 609.4530, and 609.4560 of the TSUSA. Wire is included in AISI product group Hos. 23 and 27(pt.).
(ii) Stainless steel wire; as provided for in items 609.3020, 609.3320, 609.4502, 609.4504, 609.4542, and 609.4544 of the TSUSA. Stainless steel wire is included in AISI product group No. 23.
(iii) Carbon and certain alloy wire_p£Q~ucts as defined by the following:
(A) Barbed wire is a wire, or strand of twisted wires, armed with barbs or sharp points; as provided for in item 642.02 of the TSUS. Barbed wire is included in AISI product group Ho. 25(pt).
(B) Twisted barbless wire is a wire strand of loosely twisted double wire, suitable for fencing purposes, not fitted with fittings, not made up into articles, and not covered with nonmetallic material; as provided for in item 642.1105 of the TSUSA. Twisted barbless wire is included in AISI product group No. 25(pt).
(C) Wire strand is two or more wires which together constitute one of the parts which are twisted together to form rope, cord, or cordage, not fitted with fittings, not made up into articles, not of brass plated wire, not covered with nonmetallic material, and not including twisted barbless wire; as provided for in items 642.1120, 642.1142, 642.1144, and 642.1146 of the TSUSA. Wire strand is included in AISI product group Ho. 23(pt).
124
DEFIHITIOHS--Continued
(0) Wire ropes, cables, and cordage are products made by the twisting of a number of wire strands and are not covered with nonmetallic material, not fitted with fittings, not made up into articles, and, if valued 13 cents or more per pound, not of brass plated wire; as provided for in items 642.12 and 642.16 of the TSUS. Wire ropes, cables, and cordage are included in AISI product group No. 23(pt). ·
(E) Wire fencing is a galvanized product wholly of round wire measuring not over 0.20 inch and not under 0.075 inch in diameter, whether or not such wire is covered with plastics; as provided for in item 642.35 of the TSUS. Wire fencing is included in AISI product group Hos. 23(pt) and 26.
(F) Brads, nails, spikes, staples, and tacks are fasteners, of one piece construction, made of round wire, and not including thumb tacks, staples in strip form, corrugated fasteners, glaziers' points, hook nails, ring nails, or fasteners suitable for use in power-actuated hand tools; as provided for in items 646.25 and 646.26 of the TSUS. Brads, nails, spikes, staples, and tacks are included in AISI product group Vo. 24.
' (G) Other wire products comprises: wire bale ties, with or without buckles or fastenings and whether or not coated with paint or other substance; as provided for in items 642.90 and 642.91 of the TSUS and included in AISI product group Ho. 27(pt); and milliners' wire and.other wire covered with textile or other material not wholly of metal; as provided for in items 642;96 and 642.97 of the TSUS and included AISI product group Ho. 23.
125
Appendix D
Statistical Tables, July 1, 1986-June 30, 1987
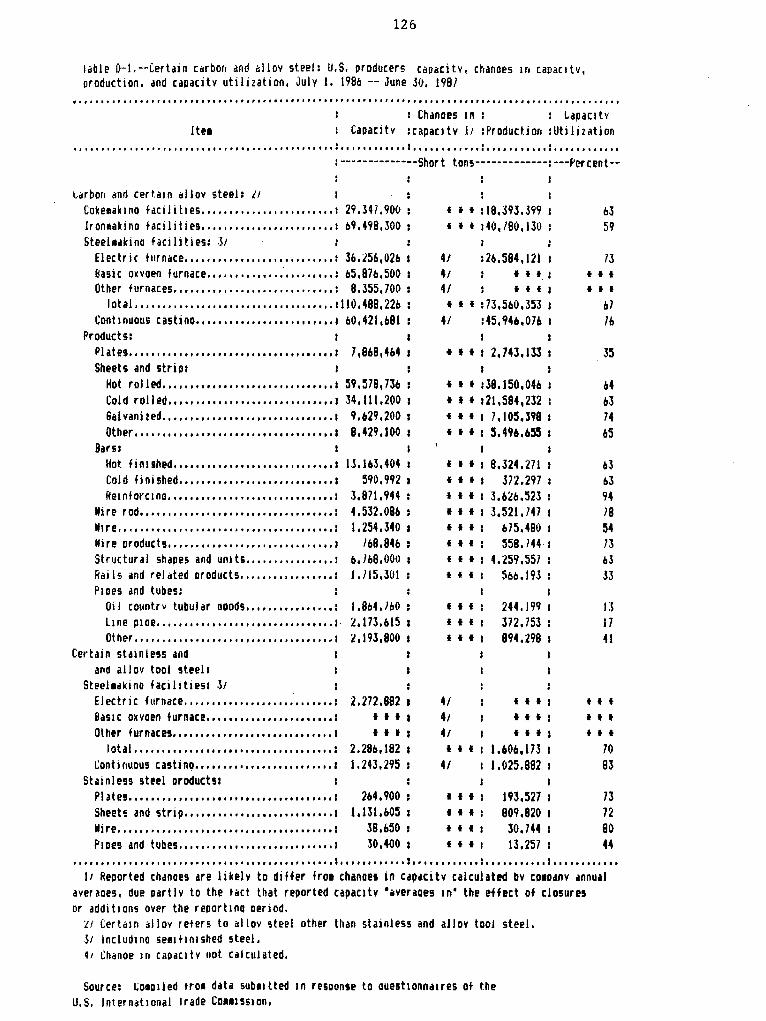
126
!able D-1.--Certain carbon and allov steel: U.S. producers caoacitv. chanoes 1n caoac1tv, oroduction. and capacitv utilization, July 1. 1986 -- June 30. 198i
·································································································· : Chdnoes 1n : : Lapac1tv JtH : Capac1tv :capac1tv 11 :f'roduction :Utilization . . . . .......... ········ ················································································
1 ------··-------Short tons-------------: ---f'er cent--
larbon ~nrl certain allov steel: ti
Coke1ak1no facilities •••.•••.•.•••.••.••••••• : 29.347.900: Jron1akino tacilities ••••.••••••••••••••••••• : 69,498,300: Steeltdkino facilities: l/
Electric turnace ........................... : Jb.l56,02b: Basic oxvaen furnace ••••••••••••. ;, •••••••• : 65,876,500 1 Other furnaces ............................. : B.355,700:
lotal .••.............•.•.............••.. 1110,488,221>: Continuous castino ••••••••••••••••••••••••• 1 b0,421,b81
Products: Plates ..........•.....•.•........ , .•..•..•. : 7,868,464 1
Sheets and strip: Hot rolled ............................... : 59,578,736: Cold rolled .............................. : 34,111.200 1 Sal vani zed ..... , .•..•.••....• , ......•.... 1 9,629,200 : Other .....•...••...•.....•..••.•..•..•.•. 1 8,429,100:
8ars1 Hot fin1 shed •••••••••••••••.••••••••••••• 1 Cold fjnished •••••••••••••..•.•••.••••••• 1
Reinforc100 •••• , •••• , •.•••••••••.•••••••• : Nire rod ••••••.•••...••••••••••••••.••••••• : W1re •• , ••••••• , •••••••••••• , ••••••••••••••• : Wire oroducts ••••.••.•••••..•..•.•••••••.•• 1
Str1Jctural shapes and units ................ : Rails and reldted oroducts ••..••••••••••••• : P1oes and tubes:
I
1.5, 1'13,404 I
590,992 : 3.871,944 : 4,532.08b : 1,254,340 I
/b8,84b I
b,168,000 I
J. J 15,301 :
Oil count.rv tubuliir aoods ................ : l.Bb4,/b0: Line p1oe •••••••••••••••••••••••••••••••• a· ~.173.615 1 Other •••••.••..•.•.•••••••.•• , ••••••••••• 1 2.193,800 1
Certdin stainless and and aJlov tool steel1
Steeltdkino facilities: 31 Electric furnace ........................... : 2.272.882 1
Basic oxvaen furnace ••••••••••••••••••••••• : t t t 1 Other furnaces •••••••••.•••.•••••••••••••.• 1 1 1 t:
lotal .............••..•.•..........•..... : 2.280,182 1
Continuous castino ••••••••••••••••••••••••• 1 1.243,295: Stainless steel oroducts1
Plates ............•...•....•.••...•....•.•• 1 264.900: Sheetcs and strip ........................... 1 1,131.b05: Ni re ...•.....•.........•••.•.•...•••.•• ,, .• : 38,050 1
P1oes and tubes .•.......••..••••••.....•.•. 1 J0,400:
ff t :18,393,399 I
I t f 140,/80,IJO :
4/ :2b,584,121 I
41 I t t. I
4/ t t f I
I t t :73,5b0,353 I
4/ :45,946,076 I
I I
I It I 2,74J,JJJ I
I
f ft 138,150,046 I
I t I 121,584 1 232 f If 7,105,398 I t f I ~.49b,b~
I I t I
t I f I
f f I I
I I t I
I f t I
I I f :
f f t I
t * t I I t
t I f I
t t I I
I
I
8,324.271 I
372.297 I
3.626.523 : 3,521,747 I
b75,480 I
558.144 I
4.259,557 I
5b6, l93 :
244.199 I
372,753 : 894,298 I
4/ f f I
4/ I f t I
4/ I f f I
t If 1,60b,17J I
4/ I 1,025,882 I
I
I f t I 193, 527 I
I I f I 809,820 I
f I f I JO, 744 I
t t f I 13, 257 I
bl 59
73 t • t
I t I
bl lb
35
1>4 b3 74 65
63 b3 94 78 54 73 bl 33
I:~
17 41
I t t
t t I
t t t
70 BJ
73 72 80 44
• I.'. I. I •••• ' •• I •••• I. I •• ' I •••• I •• I' I ••• I ••••• • 1 • •••••••••• I: •••••• I ••• I.: •• I I ••••••• I •• I ••• I •••••
11 Reported chanoes are likelv to differ fro1 chanaes in capacitv calculated bv co1oanv annual averaoes, due partlv to the t11ct that reported capac1tv 'ilveraaes 1n• the effect of closures or additions over the reoort1no oeriod.
!I Cert111n 11llov reters to 11llov steel other than stainJess and alloy tooJ steel. 51 lnclud1no se11t1n1shed steel. 41 Ch11noe 1n caoac1tv not calculated.
Source: ~0101led tro• data sub11tted 1n resoonte to oue1t1onna1res ot the U.S. lnternat1onal lrade Co111ss1on,
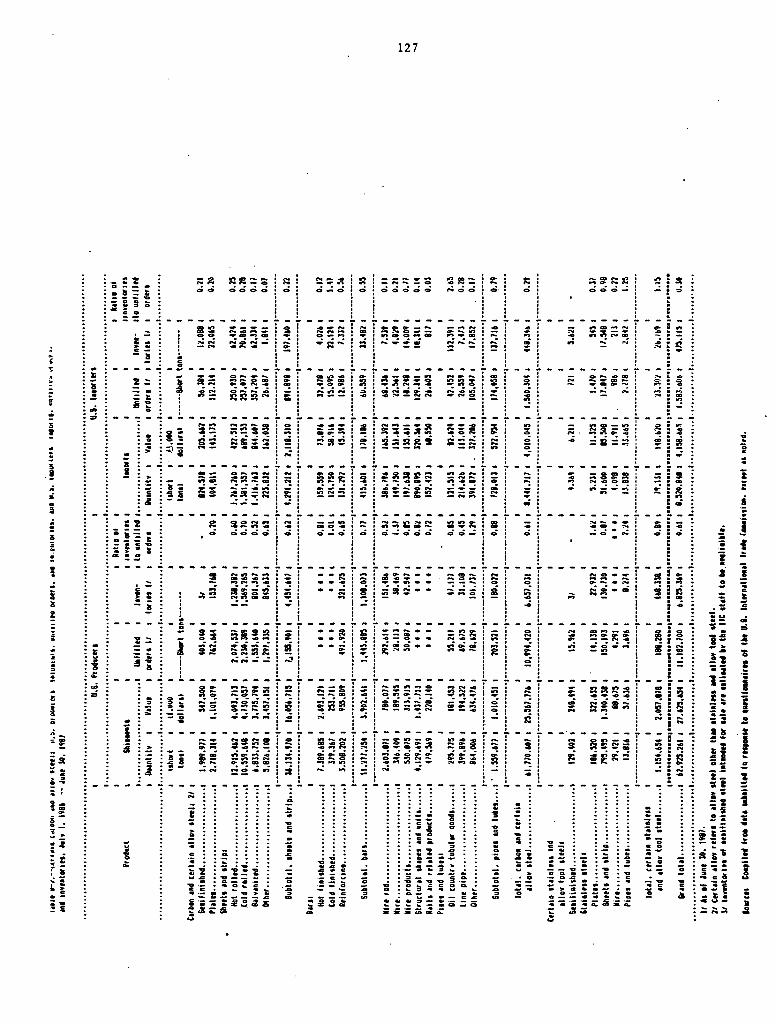
.. !: l5
!
..;
.;
i " . IC
& ..
;o ..... = = . " o-- . ·• .
. : : .. --!
'Z ~ - . - .. :!i !! 0
:~ = : > II ! : ..
i
. .. 1i
... -. -- . i.:;
II
. : .; ....
ii : ~
. l
-=
: ~. : ~..: • - 0 : ..
-...
~ :: :;~ ... 0 --
! ... -... .. _
W'JllD-NN-0
0000
OONn •-n-o 0000
. i::. .,; . . . . . ~r ~
0 ... ~ ...
... .. 0
-.. ~
... .. . ... .. -. : ~
0 ... .i
~~= . ...... ::?~~
·~ . ~ ... ...
-~ • 0: ... -
t ~I
l.,; ! I ; ~ : ii j~ !
. : :=::
0
. . . .
127
- -- --- N - - 0 00000
;:;:;Qc;:~ Q.~000
.. 0- - -CD .o -- - If') - -~~~
- - - --: ::: -. -... - :! •
..: - 0 It ..... .,.,
-... : ::::~~=~
:~ . . :~ . ,.. . i=
.
~ "? 0:.-: ~ !===:;~ i - - -~,.,. .
i ::g~;~ ---. .., c:.= ~ ~i . ""'~ --~ .
~ ;e::: ""!~~
~c;::=
. f;:: . -..
-... ~
-0 ... " "'
. -:
... ...
..;
... -... ~
... -"' ..; ~ ----..
-CD~..., I _,, ~ e-.. N t
o oo..;:
"' ... ...;
---- -~~cg~
. . . . . . . . . ::~°"~:
;; . ...
- --- -:; g = ~
. . ' .
. ; N .0 0 CD t - .,; ;; ~::: : . . .
"' -.0 CD
..:o . . - . "' . . . ....
... -
N 0 • -...... -~- ....... ~ ~ .. ai
c: - • Q. . .. . .. . .. :-:: :-; .... =~ . . .. ~s1• :1 ~-:. .:-~=--•>c: ... •- •• O· ___ ., ...
0 - - G • .... Q ::-=·::=.:taa.: t c,OC8 ...
. I
-... :D .,;
-. - . ·-. ~~ i~ .. 0 :: ::; - ... .! ~ .2
= CD
~ -
-... ... ~
ii ls ·-;1 ::! il o-. 'i: -. ·= .. . .. = 1l • ii
~-:a; ; i .. C> - • : -: ~: .. 0 > 0 .... 0
... . : . . ~ i . .. j
e i i
. .. - .. -. ., - .. ! 2 : ! =•· ~ ~a~l ci ..... t • : c ...,_ __ ,.......,
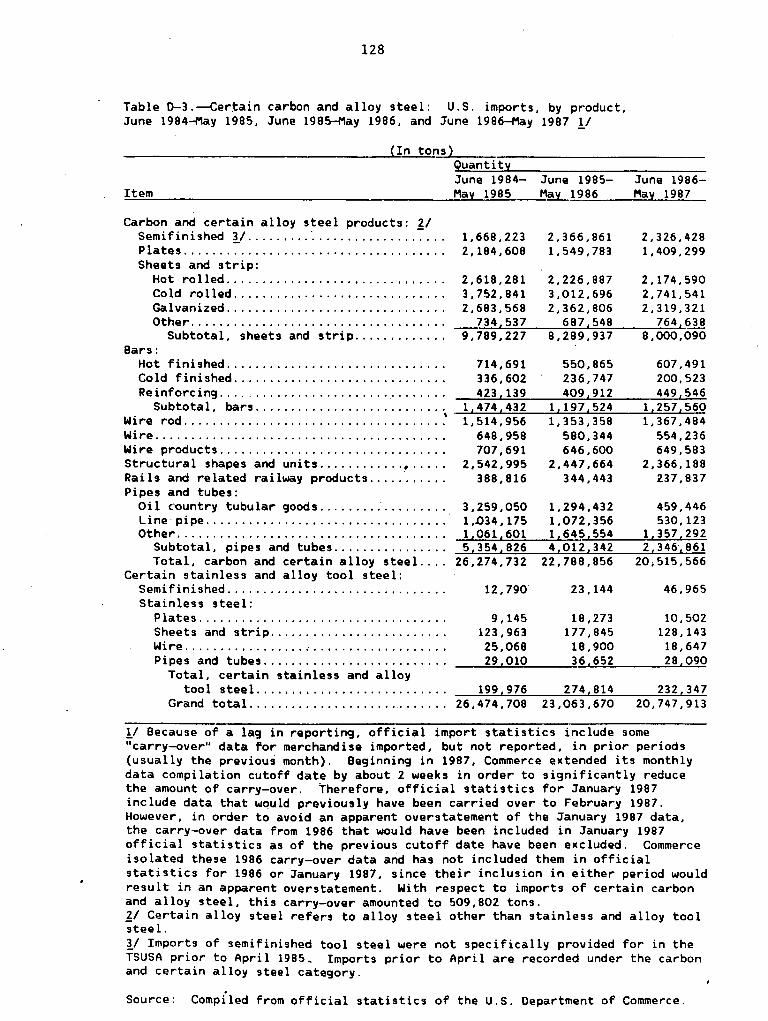
128
Table 0-3.--Certain carbon and alloy steel: U.S. imports, by product, June 1984....f'lay 1985, June 1985....f'lay 1986, and June 1986_,..,ay 1987 l/
(In tons
Item
Carbon and certain alloy steel products: 2/ Semi finished !/ ......... · ............... -:- .. . Plates .................................... . Sheets and strip:
Hot rolled .............................. . Cold rolled ............................. . Galvanized .............................. . Other ................................... .
Subtotal, sheets and strip ............ . Bars:
Hot finished .............................. . Cold finished ............................. . Reinforcing ... , ........................... .
Subtotal, bars .......................... . Wire rod .................................... .' Wire ........................................ . Wire products ............................... . Structural shapes and units ............•..... Rails and re lated railway products ..... ". ..... Pipes and tubes:
Oil country tubular goods ................. . Line· pipe ................................. . Other ..................................... .
Subtotal, pipes and tubes ............... . Total, carbon and certain alloy steel ... .
Certain stainless and alloy tool steel: Semi finished .............................. . Stainless steel:
Plates .................................. . Sheets and strip ........................ . Wire ................. , .................. . Pipes and tubes ......................... .
Total, certain stainless and alloy tool steel .......................... .
Grand total ............................ .
Quantity June 1984-May 1985
1,668,223 2,184,608
2,618,281 3,752,841 2,683,568
734,537 9,789,227
714, 691 336,602 423,139
l,474,432 1,514,956
648,958 707,691
2,542,995 388,816
3,259,050 1,.034' 175 1,061,601 5,354,826
26,274,732
12,790
9,145 123,963 25,068 29,010
199,976 26,474,708
June 1985-May 1986
2,366,861 1,549,783
2,226,887 3,012,696 2, 362, 806
687,548 8,289,937
550, 865 236,747 409,912
l, 197 I 524 1,353,358
580,344 646,600
2,447,664 344,443
1,294,432 1,072,356 1,645,554 4,012,342
22,788,856
23' 144
18,273 177,845 18,900 36,652
274,814 23,063,670
June 1986-May 1987
2,326,428 1,409,299
2,174,590 2,741,541 2,319,321
764,638 8,000,090
607,491 200,523 449,546
1,257,560 1,367,484
554,236 649,583
2,366,188 237,837
459,446 530,123
1,357,292 2 I 346•, 861
20,515,566
46,965
10,502 128,143 18,647 28,090
232,347 20, 747' 913
11 Because of a lag in reporting, official import statistics include some "carry-over" data for merchandise imported, but not reported, in prior periods (usually the previous month). Beginning in 1987, Commerce extended its monthly data compilation cutoff date by about 2 weeks in order to significantly reduce the amount of carry-over. Therefore, official statistics for January 1987 include data that wquld previously have been carried over to February 1987. However, in order to avoid an apparent overstatement of the January 1987 data, the carry-over data from 1986 that would have been included in January 1987 official statistics as of the previous cutoff date have been excluded. Commerce isolated these 1986 carry-over data arid has not included. them in official statistics for 1986 or January 1987, since their inclusion in either period would result in an apparent overstatement. With respect to imports of certain carbon and alloy steel, this carry-over amounted to 509,802 tons. 11 Certain alloy steel refers to alloy steel other than stainless and alloy tool steel. !/ Imports of semifinished tool steel were not specifically provided for in the TSUSA prior to April 1985. Imports prior to April are recorded under the carbon and certain alloy steel category.
Source: Compiled from official statistics of the U.S. Department of Commerce.

129
l~b.le L;·-·i,· ·i<"Haoe nuaber C!t production itOd related workers e11:dov£od lfl U.!). es1i1bl1shrierots t•r(•dt!CJhCJ certd1n carbon and allov steel and hours worked by, waoes paid to. and productivitv of such e1plovees. Jul v I. I 'i'86 -·· June Jo, 1987
•I I It I' t •I If• I I I I I I I I I It I I I I I I It I I I I I I It I I I I I I .. I I I I I I I I I I I I I I I I I I I I I I I I I I I I It I I It I I I I I I I I I I I I I I It I I I I I I I IJ I I I• I I
lte1 Averaae nu1ber
uploved
I
: "an·hour s 1 Produc- : ti vity
llaoes :Unit houri v
labor costs
t I I It I I I Ir I It I I I I I I I It I It I I I I I I I It It I I I I I I I I I I I JI I I I I I• I I I I 1I1 I I I I• I If I I 1 I 1 I I I It I I I I I: I I I I I I I It I It I I I I I It I I I It I
I 1 l1•n-hours 11.00V 1 t lhousandsl per tonl dol larsl
Carbon and certain allov steel: II I
Coke1akino facilities •••••••••••••••••••••••• : 9,lb5 : 18,1138 1.01 288.591 f15.48 Jron1akino faci I ities ........................ 1 8.051 lb.1143 0.41 2114. b7l 15.90 Steel1akino +•cilities i1 •••••••••••••••••••• : 31,1102 65. 91>4 0,90 1,042,8711 15.81 Products:
PJates ••••••••••••••••••••••••••••••••••••• 1 3,957 8,207 2.99 124.b4b 15.19 Sheets and strip: I
Hot rol Jed •• , •••••• , ••••••••••••••••• ,., .1 18.848 : 39,5115 1.04 blb.879 15.59 Cold r oJ Jed •••••••••• , •• , ••••• , •••••••••• : 19.583 : 41,783 I l.94 .. bB&,102 lb.42 Galvanized ••••••••••••••••••••••••••••••• : b.2211 : 13,(174 I 1.84 213.58& lb.34 Other, •••••••••• ,., ••••••• , •••••••• ,, •• , .1 9.414 : J9,19J I 3.bO 323.879 lb.lb
1------------1------------:-----------1------------:~-----------
Subtotal. sheets and strio ••••••••••••• : 54.071 : 114.213 I 3/ I 1.84o,44b : lb.II
: ------------1------------1-----------:.------------1-----------· aisrs:
Hot f 1n1 shed ••••••• , •• , •• , •••••• , •••••••• 1 t I f I f f I l.8b f • t f f t
Cold finished •••••••••••••••••••• ,, •••••• 1 I I I I • t f t I I I I I f t f
Re1ntorc1no •••••••• ,.,., ••••••••••••••• ,. 1 M79: 5.94:i 1.114 111.100 11,l(/
1·-----------1------------1-----------1------------1---·-------· Subtotal. bars ....................... ~.1 J4,5b9: 30.971 1 31 : ' 414.308 1 13.l8
1------------:------------1-----------1------------1-----------· Wire rod ................................... 1 1,892 1 4,5bl J,3(1 b0,299 13.;a !lire ....................................... 1 1.180: 2,291 3.39 32.1105 14.23 Iii re oroduch .............................. 1 1,3bb 1 2,725 4.88 37,J41 13.113 Structural shapes and unit1 ••••••••••••••• ;1 4,931 1 J0.451 2.45 147,565 14.12 Rails and related products,,,,,,,,,,,,,,,,,, 749: 1,389 2.45 18,552 13.36 Pipes and tubes: I
Oil countrv tubular aood1 •••••••••••••••• 1 585 1
Line o;pe ••• , •••••••••••••••••••••••••••• 1 848 1
Other •••••• , ..................... , ••••••• ,: 3,975 l
1.111 I. 704 7.1122
4.55 4.57 8.52
15,638 23,048
110,554
14.08 13.53 14.50
1------------1------------1-----------1------------1------------Subtotal, pipes and tube1 •••••••••••••• 1 5.408 1 10,437 1 3/ 1 149.240: 14.30
1--·-------·-1------~----·1--,---------1------------1 -----------· lotal. carbon and certain allov sttel .. 1 1311,941 1 2811.491 1 31 1 4.420,940 : IS.43
1·-----------:------------1-----------:-----------~:-----------· Certain stainless and allov tool steel:
Steel1akino facilities 11 ••.••••••••••••••••• : 4,bO:l : 9.129 5.b8 145.068 15.89 Stainless steel products:
f'l'ates. 'I ••••••••••• '. I I •• I •• I ••• I •• , ••• '. I: 1.191 I l.420 IJ.50 40,llbO lb.8(1 Sheets and strio ........................... : 4.&03 : 9,147 11.30 lb:t.019 li.71 Wire ••• , •• ,,,., •••••• , ••••••••• , •••••• , •••• : &89 : 1 .. m 44.116 19.504 14. ll P1oes and tubes •••••••••••••••••••••••••••• : 44:l : 72~ : 54.46 B.B3b u.~4
1------------:------------:-----------:---~--------:------------Iota!. stainless and allov tool steel ••• ;: 11.SV : n.m1 31 :. 37b.08i : lb. St•
:======~===•=:======•=====1==s===•====1=========••=:=======:====
Grand total •••• , ••••••••••• , ••••••••• , ••• : 148,4118 I 309.~8~ : 31 : 4.797.027 : JS.51 ............................................... : ............ : ............ : ........... : ............ : ........... . 11 Certain allov reters to alJov steel other than stainless and allov tool steel. '' lncludino se1ifinished steel. 31 Not aool1cable.
Source: Coaoiled fro1 data sub11tted 1n resoonse to ouestionnairea of the U.S. Jnternation&I lrade r ,,, •• , !!',.' "'·
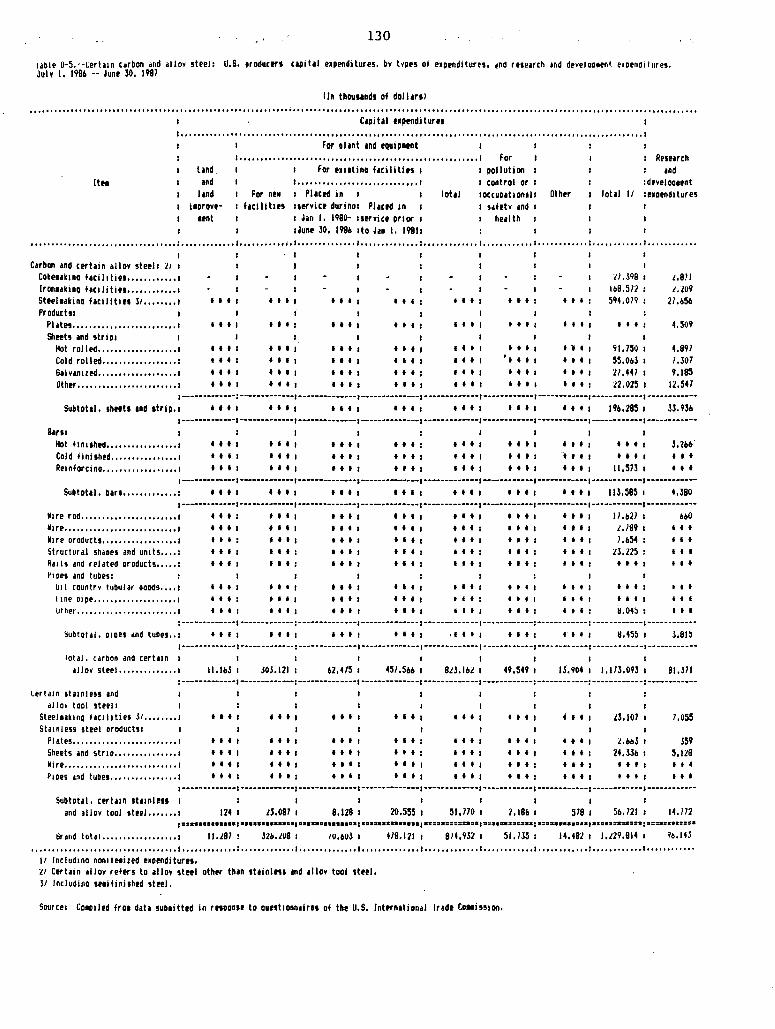
130
lilble 0-5.--~erlun Cilrbon ;,nd •llov steel: U.S. oroducrrs c1pihl e1penditures. bv hpes oi e.penditures, 4nd rese1rch 111d develoo1ent e•oenoi lures. July I, 1986 -- June 30, 1987
Un thou11nd1 of doll •rtl ............................................................................................. , ................................................................ . 1 •••••••••••••••••••••••••••••••••••••••••••••••••••••••••••••••••••••••••••••••••••••••••••••••••••••••••••••• 1
!tea land.
and l•nd
i1orov1-1enl
: •• ,, ,,,, •••••••••••••••••••••••• ,,,,,,,, •• ,, , ••••••••••• • 1 For For t111tino flcilitlts 1 1 oollulion
1 ............................. 1
For ntw 1 Plilttd in 1 flcilitus 11trvicr durinot Phetd in
1 Jan I. 1980· :1trviu prior 1 1Junt 30, 1986 :to Jan I. 19811
lohl 1 control or 1occuut1on1l 1 Othrr
sdttv and : he1lth
Resr1rch ind
:dtvelooeent lohl II 111oenditures
••••••••••••••••••••••••••••••••••• : ••••••••••••• a ••••••••••••• 1 •••••••••••••• : •••••••••••••• 1 ••••••••••••• 1 •••••••••••• 1 •••••••••••• : •••••••••••• : ••••••••••••
I Carbon and certain allov stetll ll 1
CokeHklno hcil1tie1 ............ 1 lronHkina hcilitirs ............ 1 Stteleakino facilities 31 ........ 1 I I I I I I I I I I I I I I I
Producttt 1 Plitet ......................... 1 I I I I I I I I I I I I I I I
Shteh ind strio1 1 t
I I I I I I I I I
I I I I I I I I I
II ,J98 I
lbS.511 594.019
I I I
l,8] I l,J09
21.656
4.509
Hotrolled ................... 1 111 1111 111 11 111 1111 111 91.7501 4.891 Cold rolled .................. : 1111 1111 1111 1111 111 '1111 111 S5.0b31 1.307 6•lv1n1ztd ................... 1 1111 1111 1111 1111 111 1111 111 2/,44/1 9,185 Other ........................ 1 1111 1111 1111 1111 ttt: 1111 tit: 12,0251 12.547
1 ·········-···: -··-·-·----···1 ·--·--····-···1 ··----·····-··1 ······-······1 ····-·······1 ·--··-·-·-··1 ···-------··1 ·······-·--· Subtohl.shtrt11nd1trip.1 1111 ttt1 1111 1111 1111 1111 1111 196.2851 33.9311
1 ········-···1 ····-········1 ··---········-1 ·-···········-1 ············-1 ············1 ·······-····1 ·--·--·····-1 ···-·····---a.rs1 I I I
Hotfinuht0 ................. 1 1111 1111 I I I
Cold linished ................ 1 I I I I I I I I I I I
Rrinforcino .................. 1 I I I I I I I I I I I
I I I
I I I
I I I
I I I
I I I
I I I
I I I I I t I : I I I I
I I I I '1 I I I I I I I I I
I I I I I I I I 11.m I I I
1 ·-···········1 ···--·······1 ··-··-······1 ····-··--···1 ······-······1 ••••••• ·····1············1 ········----1 ·--·-·-··---Subtotal. b1rs ............. : 1111 1111 1111 1111 1111 1111 1111 113,5851 4.380
1-·······-···· 1-·······-···· 1 ••••••••• ••••• 1····-···-·····1 ·······-·····1·······---··:-·-·····-···1-···-····-·-1 ·-··-----·-· M1rerod ....................... 1 1111 1111 1111 1111 1111 1111 1111 17.6271 bbO
Vire .. ,.., • .,.,.,.,.,.,.,",., .1 I I I I t I I I I I I I I I I t I I I I I I I I I t I I l, /89 I I I I
W1reoroduch .................. 1 111: 1111 1111 111 1111 111 1111 ),654: 111 Structuralsh•oe1andun1ts .... : 1111 ttt: 1111 111 111 111 1111 ll.125: 111 Ra:lsandrelatedoroducts ..... 1 1111 111: 111 111 1111 1111 1111 1111 111 P1 oes and tubes:
u1 I countrv tOJbular ooods .... 1 I I I I I I I I I I I I I I I I I I I I I I I I I I I I I t I I
trneo1pe .................... : 1111 1111 111 1111 111 1111 1111 1111 111 Uther ....................... .i 1111 1111 1111 1111 1111 Ill: 111: ~.04~1 Ill
1 ····-··-·····1 ··--·-······-1···-···----·-·1-·--··········1-·---···· ----·--·-··-·----: ·---------·-1 ·----·------: ····-·-···-· oubtotal.01oesandtubes .. 1 111: 1111 111: 1111 .1111 1111 1·111 8,4551 .l,815
1 ·-------···--: -·--·-·····--1---·-·----··--1 ·-·-····-·····1--· -· ·-·--··-1--····· ··-·-: ---· -···-··· 1-·-------·· -: -· ··-· ------1 ot a I, cubon and cert.in : t 1 1 1 1 1
allov steel............... 11.163 I JOJ.121 : 62.415 I m.566 I 813.161 I 49,549 I IJ.904 I 1.113.093 I 81 • .lll 1--·······-··-1 ··-···--·-···1···········-··1 ·--·-------···1 ···-···-·--··1-·--········:-··--···-··-:-----···-··-1 ·-··-·--····
Ler t a1 n st a: nl ess and ol I ov tool steel 1
Steeluk1no +ac1lities 31 ........ 1 Stunlen steel oroduct11 1
PJates ......................... 1
Sheets 1nd stria ............... : Mire .•••• ,,,.,,,,, ••••• , .. , .... 1
I I I I
I I I I
I I I I
t I I I
I
I I I I
I I I I
I I I I
t f I I
I I I
I I I
I I I
I I I I
I I I
I I I
I I I
I f I
I I
I I I
I I t
I I I
t I I
I I I
I I I I
I I I I
I I I I
I I I I
I I I
I I I
I I I I
J3,J07 I
l.bb3
24,3J6 I
I I I I
1.055
359 5,128 I I f
P1 Des and tubn ................ : I I I I f I I : I I I I I f I I I I I I I I : I I I I I I I I I I f
1 ········---··1 ·--·····-···1 ····-··--·····1-··--·······-·1 ··-···-·---··1 ····-···--··1 ·······-··--1 ···---··-··-1-··--····---Subtotal. certun stunltH 1 1 1 t 1 1 1 1 1
and allov tool stte1 ....... 1 124 1 13.081 1 8.128 1 20.SSS 1 51,170 1 2,186 1 578 1 56,721 1 14.112 I ==••===••••••t ••••S••••••••t 11'll••••••••••••1 •••nsanaaa1us1 ••=••=====-••1 :1:1::1n:12a:••1 •=•11•=-••:1••1 •=====•2&==•: •==••••:t===•
Srdrod t~tal .................. 1 11.181 ! lib.LU& I /0,60$ I t/8,121 I SH. 9$2 1 51, /35 I 14,481 I 1,/29,814 : ••••••••••••••••••••••••••••••••••••••••••••••••• 1 ••••••••••••• 1 •••••••••••••• 1 •••••••••••••••••••••••••••• 1 •••••••••••• : •••••••••••• : •••••••••••• 1 ••••••••••••
11 fncludino hon1te1ized 11prnditur11. v Certain allov refrrs to alloy stet! other than shinlrn ind allov tool steel. 31 lncludioo se1ifinished steel.
Sourcer Co101fed fro1 data 1ub1itttd in rnoonH to out1t1onn1irH of tbe U.S. lnttrn1tional lradt Co•iss1on.
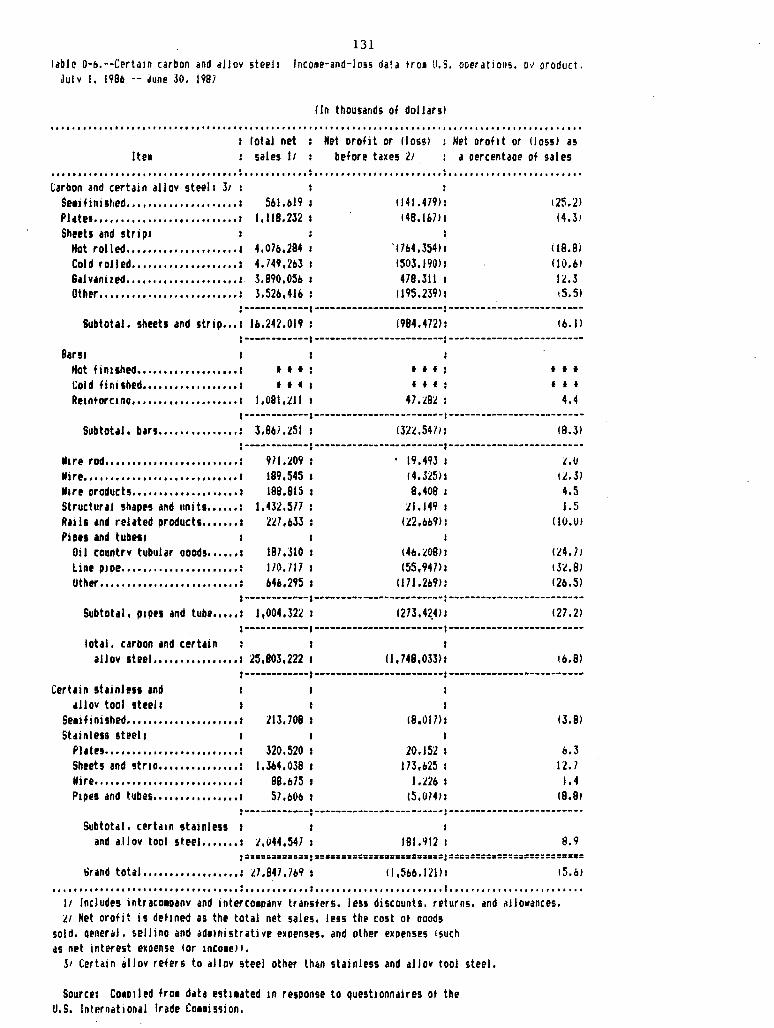
131
lab!~ D-&.--Cerl~tn carbon and allov steel: lncose-and-Joss data tree U.S. ooerations. b~ oroduct. Jul v I. I 98b -- June 30. l 98i
lln thousands of dollarsl ............................................................................ , ..................... . rota! net sales It :
Net orofit or llossl : Net orofit or !loss> as lte1 before taxes 21 a oercentaoe of sales . . .
I I I I I It I I I I I If I I If I If I If I If I I I I I I I I It I I I I I I I I I I I I I I I I I I I I I I I I I I I I I I I I I I I I I I I I I I I I I I I I I I If I I I I I I I I I I
Carbon and certain allov steel: 31 : Se1i fini stied ... , ................. s 561. bl9 f141.479): !25.2) Pl•te1.,,,,,,,,,,,,,,,,,,,,,,,,,,1 1.118.232 148.lblll 14.31 Shttts and strips
Hot rolled ..................•.. 1 4.07&.284 . 17&4 ,3541: I 18.81 Col d r oJ led, , . , .•. , .••• , , •.. , , • : 4. 749,263 1503.19011 110.6> 6•1v•nized ...•................. 1 . . 3.890.05& 478,311 I 12.3 Other ••••••• , •••••••••••••••••• : 3.526,416 1195.239)1 t.5.5)
:------------·------------------------:-------------------------Subtotal. sheets and strip ... a l&.242.019 : (984,472) I <6.11
·------------·------------------------:-------------------------8ars1
Hot fin11hed ................... : I I I
Cold finished •••••••••••••••••• 1 1 t • 1
Rei11torc1no .................... : 1,081.:lll
f I f
I f f
47.t8:l
I I I
f f t
4.4 :------------1------------------------:-------------------------
Subtotal. bars ••••••••••••••• : 3.867.t5l 1 132t.547 I: 18.31
:------------:------------------------·-------------------------th re rod .•••.•••......•••........ : 971,209 I . 19.493 I 'i.O llire .....••.............•.•.•.... : 189,545 I f 4. 325)1 u.J> N1r1 oroducts ......•.•••.....•... 1 188.815 8,408 I 4.5 Structural shapes and unit& ...... : I. 4J;l ,517 LI .149 I 1.5 Rails •nd related oroducts ••••••• 1 W.&33 li!2,bb9)1 I 10.0/ Piot1 and tube11 I I
Oil countrv tubular ooods •••••• 1 187 .JlO 146.:L081: m.11 Line pipe ••••.•.•••••••••.•.••• : l/0,Jl7 I 155,947)1 tJ:.!.8)
Other ••• ••••• , •••••••••••••••• , : 646,295 I I 17 l.2&91: 12&.5)
·------------·------------------------:-------------------------Subtotal, p1oe1 and tube ••••• 1 l,004.32l 1 127.2)
1------------1------------------------1-------------------------lotal. carbon •nd certain 1
allov stee1 •••••••••••••••• 1 25,803,222 1 11,748,033!1 16.8) 1------------:------------------------:-------------------------
Certain stainless 1nd allov tool !teel1 I
Se1i finished ...... , ....•...... ,.,. J 113.708 18,017) I 13.81 Stainle!s steel1 I
PJ •tr1 .................. ,, ..... 1 320.520 20.152 I b.3 Sheets and stria ............... : 1.364.038 I 73,b25 I 12. 7 Wire ••••••••• , ••••••••••• , ••••• : 88.&75 I ,/26 I 1.4 P111es and tubes ................ 1 57.&0b 15.07411 18.81
:------------:------------------------:-------------------------Subtotal. certain stainless 1 1
and a.llov tool stee1 ....... 1 J,044,547 : I
181.912 I 8.9 :=~====•=====:==•==========m======~===:========•======;:::::::a:
~rand total ••••••••••.••••••• : l7.847.7o9: (f ,5&b.l21l1 15.b! ••••••• I •••••• I ••••••••••••••••••• ,: •••••••••.••• I ••• ' •••••••• ' ••••••••••• I •••• I ... , •••••• ' I I.' •••• I •
11 Includes intraco1oanv and interco1oanv transters, Jess discounts. returns. and allowances. ll Het orofit is det1ned as tht total net sales. Jess the cost ot ooods
sold. oeneral, seJlino and ad11nistrative exoenses. and other exoenses isuch as net interest exoense 1or 1nco1e11.
31 Certain ~llov refers to allov steel other than stainless and allov tool steel.
Source1 Co101led fro1 data est11ated 1n resoonse to questionnaires of the U.S. lntr.rniltional lrade Co11ission.

132
lable O-l.--Certa1n carbon and allov steel: Financial exoer1ence ot U.S. oroducers. Julv l. 198b - .June .~o. 1987
tin thousands of dollars)
·· ············· ..................................................... ········ ·················· .... . fill st a11d ess and
al Jov tool steel I t.e1
Ill I r ar bon and certain allov 11 steel oroducts sub 1e.ct to the 1nvest1odt1on 21
oroducts sub1ect ·to Iota! lt the 1nvestlodt1on '1.1 1 . . .
t I f I I I I I I I I I I I I I I I If I I t I I I I I t I I I I I I I I I • I I I I I I t t I I t t I I I t I I It f It r I t It I • It I I .t I t I I I I I I II I I t I I I I I I I If' I I I I
NEI SAL~b:
~xclud1no 1ntraco1oanv ilttd 1nterco1oanv transters ••.•..••. :
lr1tr acoananv illld rnt er ceo1panv transters ....... ,., .. , ......... : lot.:11 net sales ................ :
COSI Of 6UUllS SULO t inc I ud1110 in tr 11co1nanv and rnt er co1oanv : transters11
Ratt "ater1aJ1 .................... : 01 rect 1 dbOr. I. I. I ••••• ' ••• ' •• I •• :
tlth£>r tactorv costs. 1ncludino deprecution and aaortization .. :
Iota! cost ot ooods sold JI •••••• : GROSS PROFll OR tlOSS1 ••••••••••••• 1
6ENERAL, SELL INS, AND ADKIN!· SIRAllVE EXPENSES ••••.••••••••. :
NEl OPERAflN6 PROFJf OR H.OSSl ..... 1
OIHER INCOKE OR IEXPENSE>t , Net interest inco1e
or exoense .•••••.•.•..•••...•. , 1
~II other 1nco1e or texoense1 •••• : lotal other 1nco1e
or En:oense 41 .•....••••••.••••• : NEI PROFll OR ILOSS1 BEFORE IAXES •• : Deorec1~t1on and a1ort1zation .••••. :
l.b,bl.$,l)O(J :
£.48b.40l l9.099.~51
/,b44.554 J,125,m
7.785,.i!'IV : n .447.450 : 1.b52,000 :
I
I ,21b,214 I
388,244 : l
I
<343.1%): 13.198. 0741:
13.5b4,i381: t.S,239 ,Bb41: J. 414 ,835 :
. I
I. ,Ob4 ,09.5
4'1,.H.)
L.Ji9.j50 :
43(1,b91 l
:no, 990
459,291 l.433,507 I
328,943 I
105,2bJ : Lb2,592 I
I.
l
m.1rn1. t34.:lb7): . . \b9,l9bl:
19'l, 724 : 47 • .i!42 I
l.~.55, I.Sq
:1J.//8,801
8,(ti5.l45 3,Ho,.371
8,.i!4.4.57! ;t9.890,9S7
t,98-0,843
1,32h47i b50,92b
t.3i5,4871 13.332.341)
t3.o33,SM> 13.047.1401 J .4bt,077 . . . .. ·················· .............................................................................. .
It Certain dllov reters to dllov steel other than stainless and allov tool steel. · :Li t.ertain resooodents 111c!1Jded financial 1nfor1ation on related orod1Jcts. Jt lncludioQ non1te11!ed costs. 41 lnclud1no non1te11zed exoeoses.
Source: t:o11D1led fro• data sub11tted in resoonse fo questionnaires ot the IJ.S. lnternat1ondl lrade toH1ss1on.
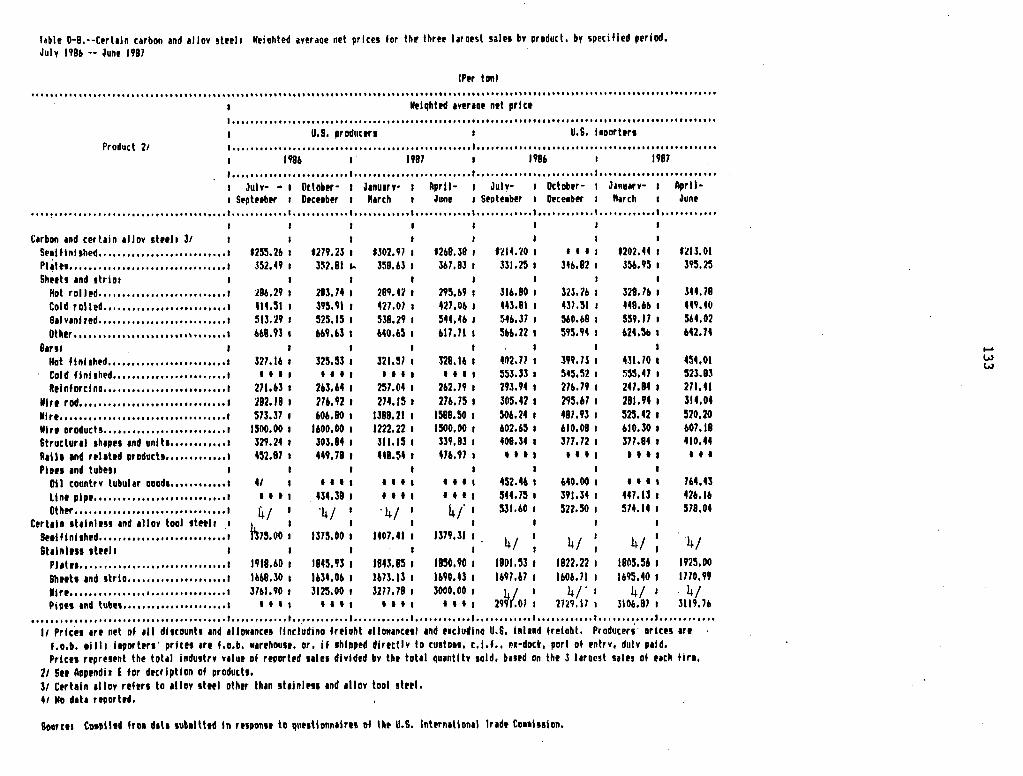
fable D-8.--Cerhln carbon and allov strell lleiahled avrraoe net prices for the- lhrrr lararsl sales by product. by specified period, July l9Bb -- Junr 1987
IPtr tonl ••••••••••••••••••• ' •• '' •••••••••• '.' •••••••••• ' •••••• ' •••••••••••• '' ••••• ' •• ' ••••••••••••••••• ' •••••••••••••••• t ••••• ' •••••••••••••••••• '.' ' ••••
lltl11htrd 1•rrur ntt prlct
········································································································ U.S. prDducrrs U.S. iloorhrt Product 21 ····················································•··················································· I '186 1987 1986 1987
•···················································•··················································· 1 Julv· - 1 llttobtr- 1 J1nu1rY- 1 1 Stph1btr 1 Dtct1brr 1 "arch
AprllJunr
Julv- 1 Octobrr- 1 J1nuArv- 1 1 SHtnber 1 Dtce1ber 1 "•rch
Atirll • Junr
•••• ! •••• ' ••• ' ••• t ••••••• I •••••••••••••• ' •••••••••••• ·'· ••••• '.' ••••• ' •••••••••• 1 •••••• ' ••••• ' •••••••••••• I •••• '. I. I ••• ' •• ' ••• ' t •••• 1 •••••••• ' •••
I I
Carbon ind cert•in 1llov 1letl1 JI I I I I I I
Seil ft ni 1hed ••• , ••••••• , ••• ,., ••••• ,., .1 ms.211, t279.23 I tJ02. 97 I m8.38 1 f214.20 I I I I I f202.44 I ti!ll.01 Pl~tt1 •••••••••••••• I' •••••••••••• I ••••• J52, 49 I m.Bl 1- m.1131 3117,BJ I 331.25 I 34b.82 I l56,95 I 395.25 Shttlt ind 1trio1 I I I I I I I I
Hot rol I ed.,. , , , , • , , ••• , •• , , , , , •• , , , • 1 186,29 I 283. 74 I 289. 47 I 295,b9 I m.eo 1 323,711 I 328.16 I 344.78 Cold rolled •••• , •••• ,,,, •••••• , •••••• 1 m.511 395,91 I 421.01 I m.ott1 m.111 431.511 448.llll I 449.40 81lv1nt1!d.,.,,,,,,,,,,,,,,,,,,,,,,,,1 m.29 I 525.15 I 538,29 I 544,46 I 546,J7 I 56(1,b8 I 559.11 I 564.02 Other.,, ••• ,,,,,,.,,., ..... ,.,,,,., ••• 1 668.'3 I MM31 1140..5 I m.111 566,22 I 595,94 I m.Sb, 1142.H
B1r11 I I I I I I I
Hot fin I 1hrd.,., •••• , , •• ,, •••• , , , ,, .. 1 327,16 I m.531 321.57 I l29.16 4112.11 I m.u 1 431.70 I m.ot Cold flni shed,,.,,,,, .. ,,, ....... , •• , t I I I I I I I I I I I I I I I :ISJ,33 I 545,:12 I 555,47 I 523.Bl Rtinforcina •••• ,,,,,,,,,,, ........... 1 271,63 I 263.64 I 257.04 I m.79 293.94 I 2111.79 I 247,84 I 211.41
lfjr1 rod ••••• ' •• I' ••••••• '. I •••••••• I ••• 292.19 I m.921 274.15 I 276.75 305.42 I 295,61 I 281,94 I 314.04 llir1., ••••• , ,, ,, ,,,,,,,,,,,, ,,,,, •••••• 1 573.37 I 606,80 I 1388.21 I 1588.50 S@6,24 I 481,93 I 525.42 I 520.20 IHrt oroduct1 •• ,,,,,,,,,,,,,,,,,,,,,,,,1 15(10,00 I 1600.00 I 1222.22 I 1500.00 602.65 I 610,08 I 610.JD I 607,18 &tructur1I 1h1pr1 ind unlt1 •••••••••••• 1 329. 24 I 303.84 I m.151 m.Bl 408.34 I 377,72 I 377.84 I 410,44 Aal II and rtlaltd prDtluch ............. 1 452.87 I 449.78 I 448.'4 I 416. 97 I I I I I I I I t I I I • t •
Pl111 ind tubu1 I I I I I I
Oil countrv tubular oood1 •••••••••••• 1 41 I I I I I I I I I t I I 452.46 I 1140.00 I I I I I 764,43 Lint pip1, •• ,,,,,,,,,,,,,,,,,,,,,,,,,1 I I I I 434,38 I I I I I I I t m.151 391,34 I 441,13 I m.16 Other,,,,,,,,,,,,,,,,,,,,,,,,,,,,,,,, 1 4./ I ·41 ·I -41 I 4/ 531,60 I 522.50 I 574.14 I 518.04
Crrt1ln 1t1inlt11 ind 1lloY tool 1trtl1 I
lim.oo : I I
St1iflni1hed ••• ,,. ,, , • , • , • , , • ,, , • , , , ••• 1 1375.00 I 1407,41 I 1379,31 I 4/ I 4/ I 4/ : 4/
Shlnlrn llrel 1 I I I I I I I
PJ1tr1., ••• ,,,,,,,,,,,,,,,,,,,,,,,,,,1 1919.60 I 1945.931 1843.85 I 1950,90 I 1801,53 I 1822,22 I 1805.56 I 1925.00 Bht1t1 and 1tria.,,., •.• ,,, ... , , • , , , .1 lflH,30 I 1m.o• 1 1673.13 I mo.43, 1697.61 I 1606. 71 I 1695.40 I 1110. 99 lfirl1ttlll I It It It It t ltt II II tltltftlttl 3161,90 I 3125,00 I 3217, 78 I 3000,00 I ~j I 4/" I 4/ I 4/ PiDtl and tubt1 •• ,., •••••• , ••• , ••• , • , 1 I I I I I I I I I I I I I I I I zq 1.07 I 2nu11 3106.81 I 3119. 1b
t t t t t It t f It It I I It It I I I I It It It It It I It I I It• I e I I I I I I It t I It t t,t e I I It t I It I 1IttItt1 1 t t 1I1 I I I It I It t It I 1 t t It t I I I I I 1 I 1 I I I It It I I I I I I I I I It I I I I It It I I I I I I I I I I I
11 Prlc!1 1rr ntt of 111 dilcounh 1nd 11Jo111ncn llncludina frrloht lll0tt1nct1I 111d Hclu~lna U.S. lnlud freiahl. Produc1!ri· orlcn are f,a.b. 1i 111 l111ortrr1· prlcH err f.o.b. warrhaust, or, if 1hloped dirrctlv to cu1to11, c.i.f .. r.1-doct, port of entrv, dutv p1ld. Prlcn rtprnent lht tohl lnduttn v1lut of reportrd Hin dhlded bv tht totll qu1ntitv sold, bned on tht l hranl UIH of t1ch tir1,
21 SH Aoptndix E for deer lption of products. 31 Ctrhln 11 lov rrfrrs ta 1llov 1trrl othrr th1n 1hinlr11 ind 1Jloy tool steel. 4/ ND d1ta nportrd,
Baurtll Co1pi11d fro• dth 1ublllttd In rrtponn to q11t1tlonn1irt1 af lh• U.S. lnhrn1llon1l lndt Conlnion.
.... w w

135
Append~x B
Specifications of the Products Referenced in Pricing Section
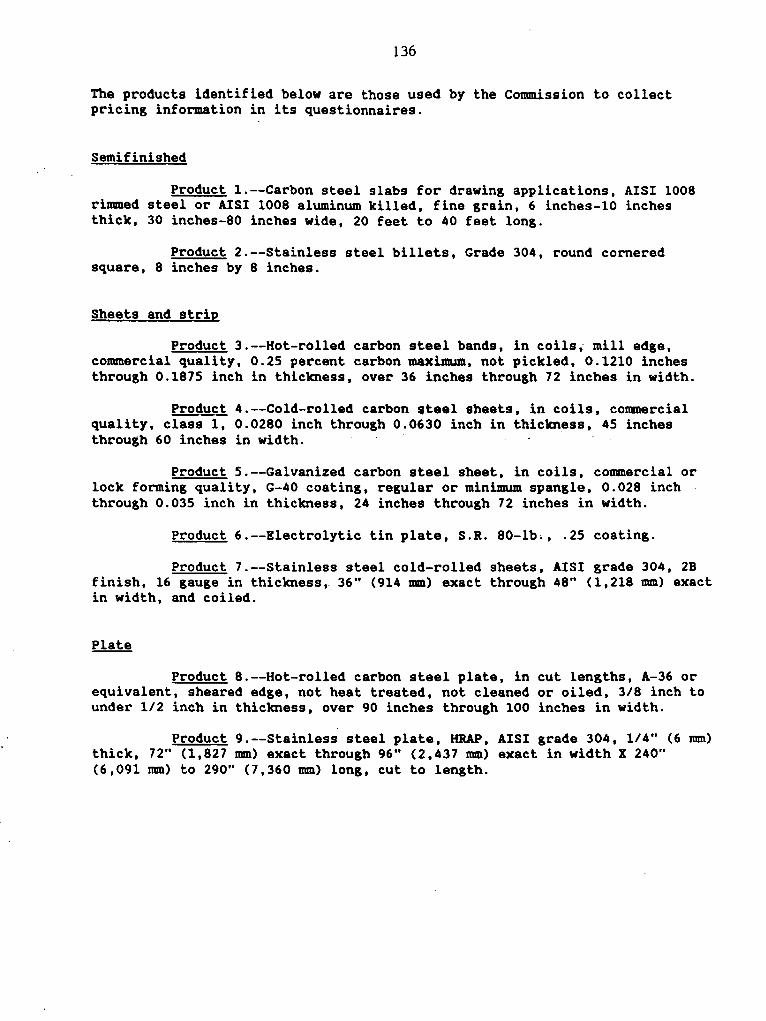
136
The products identified below are those used by the Commission to collect pricing information in its questionnaires.
Semifinished
Product 1.--Carbon steel slabs for drawing applications, AISI 1008 rimmed steel or AISI 1008 aluminum killed, fine grain, 6 inches-10 inches thick, 30 inches-80 inches wide, 20 feet to 40 feet long.
Product 2.--Stainless steel billets, Grade 304, round cornered square, 8 inches by 8 inches.
Sheets and strip
Product 3.--Hot-rolled carbon steel bands, in coils; mill edge, commercial quality, 0.25 percent carbon maximum, not pickled, 0.1210 inches through 0.1875 inch in thickness, over 36 inches through 72 inches in width.
Product 4.--Cold-rolled carbon steel sheets, in coils, commercial quality, class 1, 0.0280 inch through 0.0630 inch in thickness, 45 inches through 60 inches in width.
Product 5.--Galvanized carbon steel sheet, in coils, commercial or lock forming quality, G-40 coating, regular or minimum spangle, 0.028 inch through 0.035 inch in thickness, 24 inches through 72 inches in width.
Product 6.--Electrolytic tin plate, S.R. 80-lb., .25 coating.
Product 7.--Stainless steel cold-rolled sheets, AISI grade 304, 2B finish, 16 gauge in thickness, 36" (914 mm) exact through 48" (1,218 mm) exact in width, and coiled.
Product 8.--Hot-rolled carbon steel plate, in cut lengths, A-36 or equivalent, sheared edge, not heat treated, not cleaned or oiled, 3/8 inch to under 1/2 inch in thickness, over 90 inches through 100 inches in width.
Product 9.--Stainless steel plate, HRAP, AISI grade 304, 1/4" (6 mm) thick, 72" (1,827 mm) exact through 96" (2,437 mm) exact in width X 240" (6,091 mm) to 290" (7,360 mm) long, cut to length.
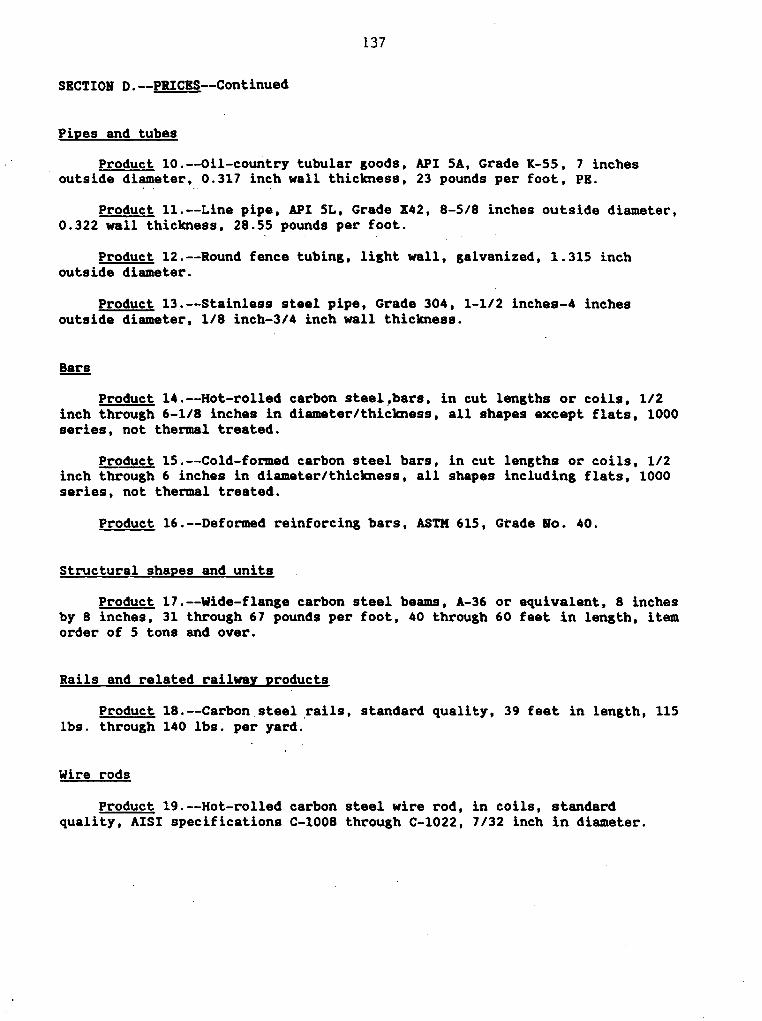
137
SECTION D.--PllICES--Continued
Pipes and tubes
Product 10.--0il-couritry tubular goods, API SA, Grade K-SS, 7 inches outside diameter, 0.317 inch wall thickness, 23 pounds per foot, PE.
Product 11.--Line pipe, API SL, Grade X42, 8-S/8 inches outside diameter, 0.322 wall thickness, 28.SS pounds per foot.
Product 12.--Round fence tubing, light wall, galvanized, l.31S inch outside diameter.
Product 13.--Stainless steel pipe, Grade 304, 1-1/2 inches-4 inches outside diameter, 1/8 inch-3/4 inch wall thickness.
Product 14.--Hot-rolled carbon steel,bars, in cut lengths or coils, 1/2 inch through 6-1/8 inches in diameter/thickness, all shapes except flats, 1000 series, not thermal treated.
Product lS.--Cold-formed carbon steel bars, in cut lengths or coils, 1/2 inch through 6 inches in diameter/thickness, all shapes including flats, 1000 series, not thermal treated.
Product 16.--Deformed reinforcing bars, ASTM 61S, Grade So. 40.
Structural shapes and units
Product 17.--Wide-flange carbon steel beams, A-36 or equivalent, 8 inches by 8 inches, 31 through 67 pounds per foot, 40 through 60 feet in length, item order of S tons and over.
Rails and related railway products
Product 18.--Carbon steel .rails, standard quality, 39 feet in length, llS lbs. through 140 lbs. per yard.
Wire rods
Product 19.--Hot-rolled carbon steel wire rod, in coils, standard quality, AISI specifications C-1008 through C-1022, 7/32 inch in diameter.
138
PRICES--Continued
Wire and wire products
Product 20.--Galvanized wire, 12 gauge, soft industrial quality.
Product 21.--Cold-drawn stainle•• steel round wire, Grade 304, 1/8 inch in diameter.
Product 22.--steel wire rope, IPS, 5/8 inch, 6 x 19, IWRC.
139
Appendix F
Description of Actions Taken by the Steel Industry to Adjust and Modernize
* * * * * * * (Pages 140 to 152 contain information entitled to confidential treatment
and have not been published.)

153
Appendix G
Description of Actions Taken by Major Companies to Maintain International Competitiveness
* * * * * * * (Pages 154 to 178 contain information entitled to confidential treatment and have not been published.)


179
Appendix H
Revised Statistical Tables, July 1, 1985-June 30, 1986 ,
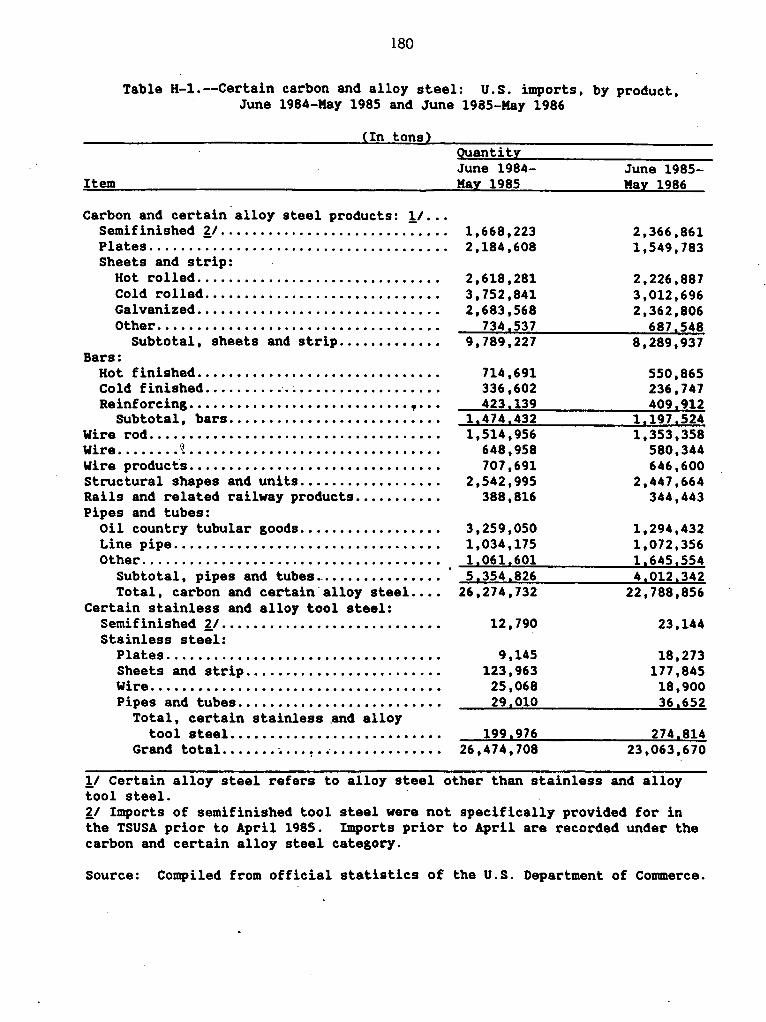
180
Table H-1.--Certain carbon and alloy steel: U.S. imports, by product, June 1984-Kay 1985 and June 1985-Kay 1986
(In tons)
Item
Carbon and certain alloy steel products: 1/ ••• Semifinished 'i:_/ •••••••••••••••••••••••• :-•••• Plates ....................................•. Sheets and strip:
Hot rolled ...........•........••.•....•.. Cold rolled . ............................ . Galvanized . ............................. . Other . .................................. .
Subtotal, sheets and strip .....•.•••..• Bars:
Hot finished ...•.•.•.•........•..•.....•••• Cold finished . ......... · ................... . Reinforcing . ........................... " .. .
subtotal • bars .•...••.•.•..•••.•..•••••.• Wire rod . ................................... . Wire . ....... \~ ............................... . Wire products ••..••..•......••....••.•....•.• Structural shapes and units .•..••••••••..•••• Rails and related railway products •..•••••.•. Pipes and tubes:
Oil country tubular goods ...•..•••.....•••• Line pipe . ................................ . Other . .................................... .
Subtotal, pipes and tubes •..••••••••.••••• Total, carbon and certain.alloy steel .•••
Certain stainless and alloy tool steel: Semifinished '1:_/ • ••••••••••••••••••••••••••• Stainless steel:
Plates . ................................. . Sheets and strip . ........................ . Wire . ................................... . Pipes and tubes •..•••.... · •..•..•....•..••
Total, certain stainless .and alloy tool steel . ......................... .
Grand total . ...... · .... ~ ................ .
Quantity June 1984-Kay 1985
1,668,223 2,184,608
2,618,281 3,752,841 2,683,568
734,537 9,789,227
714,691 336,602 423,139
l,474,432 1,514,956
648,958 707,691
2,542,995 388,816
3,259,050 1,034,175 l,061,601 5,354,826
26,274,732
12,790
9,145 123,963
25,068 29,010
199,976 26,474,708
June 1985-Kay 1986
2,366,861 1,549,783
2,226,887 3,012,696 2,362,806
687,548 8,289,937
550,865 236,747 409,912
l,197,524 1,353,358
580,344 646,600
2,447,664 344,443
1,294,432 1,072,356 1.645,554 4,012,342
22,788,856
23,144
18,273 177 ,845
18,900 36,652
274,814 23,063,670
!I Certain alloy steel refers to alloy steel other than stainless and alloy tool steel. 'i:_/ Imports of semifinished tool steel were not specifically provided for in the TSUSA prior to April 1985. Imports prior to April are recorded under the carbon and certain alloy steel category.
Source: Compiled from official statistics of the U.S. Department of Commerce.

181
lab.le H-L.--Certa1n carbon .ind .iJJov steeJ1 lnco1e-and-loss dilta trot IJ.S. ooerat1ons. bv product, Julv I. 1985 -- June 30. 198b
1Jn thousands of dollars/
1 lotal net : Net orofit or tlossl 1 Net orofit or 1Joss1 as Ite1 sales l/ : before taxes 'LI : a oercentaoe of sales
•••••••••••••••••••• ,, ••••• ,, •• , •••• : •••••••••••• : •••••••••••••••••••••••• 1 •••••••••••••••••••••••••
Larbon and certain allov steel: .s1 I
Stt1ifin1shed ••••••••.••• , ••• ,,, , • : 4:l9. 759 : ti 16.090): t/.7.21 Pl c1tes •••••••••• , ••• , ••• , ••• , •••• J J,47J,99'L 1142.380)1 19. 71 Sheets .ind strio: I
Hot rol I ed ••• , ••• , •••••••••••• , : 4.530,74i 1552.7"L8>: 11i:o t.:oJ d r oJ Jed •• , •• , , , •••••••••. , •• 1 !'i.185.155: t91.b44J: tl.81 Gal van1 zed, ••••••••• , , •• , , , ••• , t 3,375, lb4 : rm. i!531: b.O Ut her ••••••••••••• , ••• , • , • , •••• : I f I : t t I : 4.,~
:------------1------------------------:-------~---R-------------Subtotal. shetts and strio ••• 1 I f I I t t I I ti.bl
1------------:------------------------:----------------~----~---tcars1
Hot fl n1 shed •••••••• , •• , •• , •••• 1 I t f
t,;old tir1j1hed •••••••••••••••••• : 1 1 t
Re1nforc1na •••••••••••••••••••• : 1,193,525
I
li!4'l,5li!I: \i!8.049> I 42.33b I
t f f
t f I
3.5 1------------1------------------------1-------------------------
Subtotal. bars ............... 1 3,57J.i!39 1 1228.22511 16. 4> \
1------------1------------------------1-------------------------lhre rod ......................... 1 974,312 1 (8,69711 I0.91 llire ............................. , 185,835 1 14,i!l411 t:l.31 !lire oroducts .................... 1 273,924 1 3,252 1 1.2 Structural shapes and 1mits ...... : 1.576,190 1 (43,94211 (2.8> Rails and related oroducts ••••••• 1 334,834 113,80511 14.1> Pioes and tube11 1 1
Oil countrv tubular aoods •••••• 1 621,473 1109.290>: line p1pe ...................... 1 345.417 1 (83,82011 Uther .......................... 1 695.416: (99,69211
(17,6)
124.3> 114.J)
:------------·------------------------:-------------------------Subt.otal. pi oes and tube ..... 1 I. 662, JOii : (292,8021 I (17,b)
:------------:-------------------~----·-------------------------lotal. carbon and certain
allov steel ................ : t t t: t t t 1 14.11 1------------1------------------------1-------------------------
i;ertai n stain! ess and 1
allov tool steel: I I
Se11 tin1shed ••••••••• , •••• , •••••• 1 1110, 115 I 15.35211 13.J) Stainless steel1
Plates., •.•.••.• ,,., ••••••••.•• : t f • : • f f tit.. 7> Sheets and str10 ••••••••••••••• 1 t f t I t t f i.4 NirP •••••••• ,, ••••••• , •••••••••• t 95,9911 : 3.898 4.1 ~1oes and tubes •••••••••••••••• : f t t : f t f (],21
1------------1------------------------1-------------------------Subtotal. certain stainless 1 1
and allov tool steeJ ....... 1 t t t 1 t t • 1 l.7
6rand totaJ •••••••••••••••••• 1 t t f : t • t : 13. /) ................................... : ............ : ................................. , ................ . 11 Includes 1ntraco1oanv and interco111anv transter1. Jess djscounts, returns, and allowances. 'l.I Net arofit is deHned u the total net sales. less the cost of ooods
sold. oeneral. sellino and ad1inistrative expenses, and other expenses tsuch as net interest exoense IDr inco1el1.
51 Certain allov refers to allov steel other than stainless and allov tool steel.
Sourcei Co1oi led fro• data est111ted in rnponse to questionnaires of the U.S. International lr.ide Co11ission.
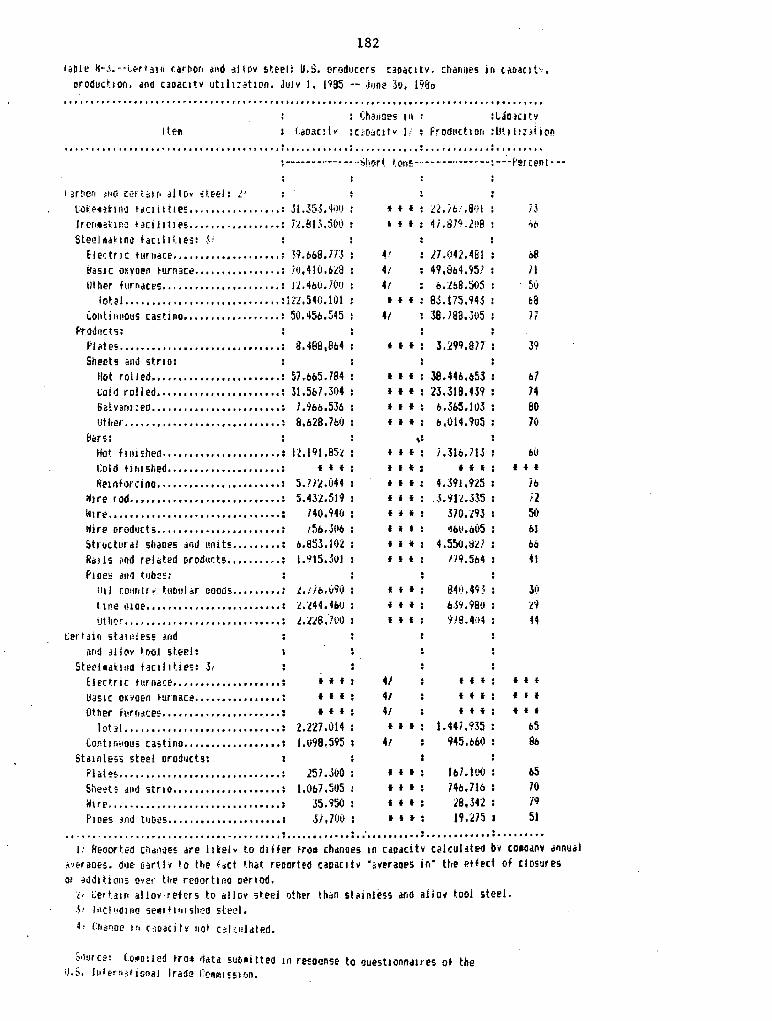
182
1ao1e H-J.--Ler1a1n c~rbon attd allov steel~ U.S. oroducrrs c3o~c1tv. c~a~ues in caDac1t~. oroductioo • .ina caoac1tv •Jt1ll:at1eon. Juiv 1. 1995 -- .iun:? 3o. 1900
t I t I " I t I I' I t I • • • I t I t I t I " I t I "' I t I t I t t t t P I t I I IP I I t P I t t ' I t I t I t I r I I I t t t t .. t t I I I P I I I I I ~ I • It t t 1 t t t
: Ch~.iioes 111 : 11.f.lt
I I I I
, ......... ,, ....................... , ... , ....... ························ ........ ··· ········ ~ ------ -··---· -····Stv:irt. '·on!;-··-- -- -··--- - -- : -- -ft er t&n t - --
t :srt•orr ~!!Cl ce:- t :;1 r1 <ii I Ov £t.e-el: .!.;
L:o~E-43ktnc ldr:l i I tie!:,,,,,,,,,,.,,.,.,: JI .35.~.'l\10 t I I :.U.it:.'.8!JI iJ Ir er1•~~.1nc +~ci.I i11es ••••••••••••••••• : il.813.Slll) t t I ~i.137<1.li!B ;,r. Ste•1! u~ ina tac!l1!:1es: ~'
Ele~tric turuescf' ••• ,, ,,, , ••••••••••• ; H.bbS.m 4! 17.(142.481 .;(I
Basic oxyoeo ~urn.~c~ ................. : itJ,4 l(l.bZ8 41 49,8b4.95l II Other f\lr~aces •• , ••••••••••••••••••• : 12, 4bV .1(HJ 41 o.:.!bB.505 ~·O
total. ............................ :lU,54(;,tl)I t I f SS.175,94.S b8 LOlll i rtl!OUS ca:.tino .................. : 50.456.545 41 38. 788 • .Jvs 77
Prodoct r;; Pl ctt es ..•.•.•.• , ..•••.•...••..••••.• i 8.4B8 18b4 f I I 3.199.877 39 Sheets ~lid str10:
ltot rol Jed. Ir t I I I I I I I I I I I I I I I I• I• I: 57,bb5.184 t I t 38.440,653 . b] . lali1 roJ Jed •••••••• , ••• , •••••••••• : 31,5&7 .304 I I t 23.318,4.19 74 Sal van> :ed ••••••••••••••• ,, ••••••• : 7 .9bo.53o t t t ,, •. ~65.103 80 !Jthef I I It I 11 I I It I I It I I It I• I I I I I I I If: B,o28.7b0 I I t . b,014.905 7(1 .
Eli:!rs: ,: Hat fl ni !he\1.' ••••• ' I'.' ••••• I I ••• : U.191.85t • I t . i .316. 71.l bO . Cold f i r1i shed ••••••••••• , •••••••• ,: f f • I I f . f I t t f f . Re1nforcino ••••••••••••• , ••••••••• : 5.?iJ!.044 t I I ; •.:m.ns ib
~1re rod ••••••• , •••••••••••••••••••• : 5.4J:l.519 I I I ,\.•H"L .. B5 : il N1 rt? ••••••••••••••••• , ••••••••• ~ •••• : i40,940 . I f * .370. t9J . 50 . . Wire Ciroducts ........................ ,; l~ib •. 3t•b I I I %ll.a05 . bl . 5tructL1rdl ShtlDl?5 ~·id 1.1.ni ts ......... : b.853. IOi! f I f 4.550.SZ/ bb
Ri:!l JS i•Od rel Cited nrodutts •••••••••• : 1.915.Jol f f I 1!9.5114 . 41 . f't oe;; ~11<1 t11be~:
ill I numtr,; ~ttb!!i "' OODUS •••• I I .... : 1.;it..v9o . t • I : S4i:•.4Q.) 31) . l 111e OlOE' •• I I I •••• I. I, I I ••• I •• I I. I: '· i!44. 4&0
. i I f . M9.980 z·~ . . lit h~·r It I 1' I It r I I IP I I IP I e IP I It I 11 I I I I: l.U8,°7lll) . I • I ·ne.4•i4 H .
Ler t ~in st~rnie-s~ iftd
i1r•d Hlov 1.r.icil st.er.!: Steel1ol:111a facil1he:: .31
Elect.rir t~tft~ace ..................... : I f I 41 t f +; I t t
tla~JC OKVOen t!1r·nac~ •••••••••••••••• : f f f 41 f I I f f f
Other furndce!! .••••••• , •••••• , ••••.••• : f f • 41 I f f f f t
1ot.:;1 f t 1 I It t t I I I It I I It t t t I 1 I I I I I I I: 2.227 .014 I I I . l.447 ,9.35 . b5 . . lOf! t I nt•OU S castino ....... , ••••••••••• : l.ll98,595 I 41 945.blil) . Sb .
Stain I ess steel oroducts: Pl ali:?s •••••••••••••••••••••••••••••• : i57 .3i.IO f I I . 1&7. too . &5 . . SiH:?>!t: an•:I i;tr10. I I I I I I I I I I• I I• I I I I I: 1,0&7 ,5i}5 I f I : 14b,7lo . 70 . H\ re .• , •••.••••••••••••••••••••••••• : 35.950 I I I . 18,342 : /9 . P1Des ~nJ t1Jt•i!S ••••••••••••••••••• I.: .}i ,]1)1) I t t . 19."'7~ I 51 . . . . . .
I I •I 'I• t I It t" I I I• t t It t t It t I I I I• t 11 I 'I I I It If If I 11 11 I I I I• I I I I I It I I I I I I I I• I I I I I I I I I I I I I I I I I I I I I I
1: keoorti?d C!ld11ae; are l1kelv to differ ~roe chdnoes in c.ipr1citv calculdtel'.I bv co10.inv 011nu11J •~Praoes. dije n~rtlv lo the f~ct lhit reoorted capac1tv ·~veraoes in" the etfe-ct of closures or ~.~d1 tiotts ovef tt;e reoortlno oenod.
i• Ce-rta1n allot·refers to <sllov steel other th~n stainl~ss and ailo~ tool steel. 5• l~cluo1no se«1f1q1shed steel. ~. Clti:r,oe 1r1 c::c.acitv 111)1 cd.:uldiP.d.
S•illr ce: tor110i1 ·~d trot .j,;ta ~tJb•i t t ed 111 re~ocnse to ouestl onnt11 res o• the iJ.5. liilern~tionaJ lr<sae (:ol!!r111~sHJfl,