Embed Size (px)
Citation preview
Annual Tourism Performance Report 2015
Annual Tourism Performance Report 2015
Annual Tourism Performance Report 2015
Introduction
1
Despite the economic and security challenges the region’s tourism has faced in 2015, Qatar’s tourism sector has emerged strong, marking a 3.7% growth from the previous year with 2.93 million visitors.
We had hopes to reach the 3 million visitor milestone this year, however, our statistics and analysis team revised its projections in November following a dip in arrival numbers in the fourth quarter. Nonetheless, Qatar continues to attract a growing number of visitors, and the sector’s contribution to the overall economy is on the rise.
Most significantly, the hospitality sector has continued to thrive in 2015, staying above 70% despite a 30% growth in room supply. As we introduce new standards of grading and classification to the sector this year, we look forward to a more sustainable, environmentally-friendly, and diverse hospitality sector in 2016.
QTA has stressed from the beginning, in the Qatar National Tourism Sector Strategy and in other channels, that tourism is a crucial avenue for developing a sustainable non-hydrocarbon economy in Qatar and conveying Qatari culture to the world.
This report demonstrates the importance of tourism remaining at the forefront of efforts and priorities, because of the resilience it has demonstrated throughout the past year, and because it supports the sustainability of Qatar’s economy.
This reality has come to the fore in 2015 and the job of diversifying the tourism offering and securing a place for Qatar on the map of destinations has gained even more significance. As we welcome an exciting and challenging year in 2016, QTA looks forward to working harder and collaborating closer with you, our partners and stakeholders, to achieve a sustainable and mature tourism sector in Qatar, for today, tomorrow and beyond 2030.
Annual Tourism Performance Report 2015
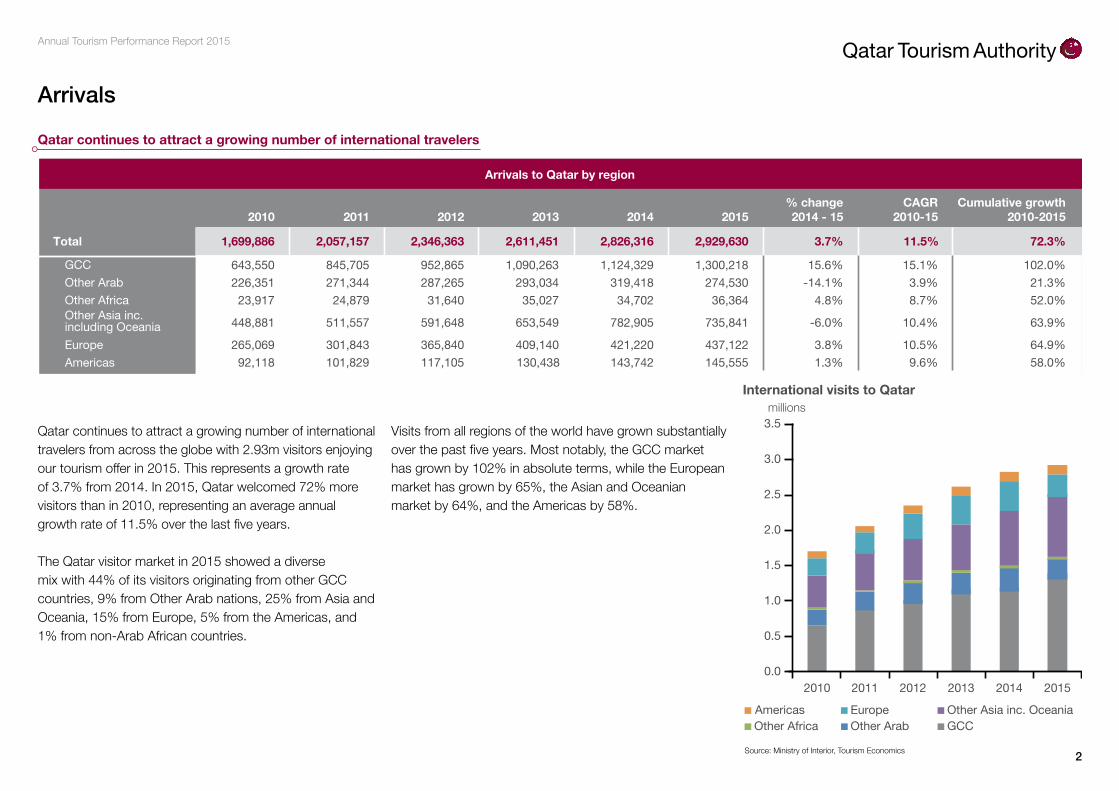
Arrivals
Qatar continues to attract a growing number of international travelers from across the globe with 2.93m visitors enjoying our tourism offer in 2015. This represents a growth rate of 3.7% from 2014. In 2015, Qatar welcomed 72% more visitors than in 2010, representing an average annual growth rate of 11.5% over the last five years.
The Qatar visitor market in 2015 showed a diverse mix with 44% of its visitors originating from other GCC countries, 9% from Other Arab nations, 25% from Asia and Oceania, 15% from Europe, 5% from the Americas, and 1% from non-Arab African countries.
Visits from all regions of the world have grown substantially over the past five years. Most notably, the GCC market has grown by 102% in absolute terms, while the European market has grown by 65%, the Asian and Oceanian market by 64%, and the Americas by 58%.
0.0
0.5
1.0
1.5
2.0
2.5
3.0
3.5
2010 2011 2012 2013 2014 2015
Americas Europe Other Asia inc. Oceania Other Africa Other Arab GCC
Source: Ministry of Interior, Tourism Economics
International visits to Qatarmillions
Qatar continues to attract a growing number of international travelers
2010 2011 2012 2013 2014 2015% change2014 - 15
CAGR2010-15
Cumulative growth2010-2015
Total 1,699,886 2,057,157 2,346,363 2,611,451 2,929,630 3.7% 11.5% 72.3%
GCC 643,550 845,705 952,865 1,090,263 1,300,218 15.6% 15.1% 102.0%Other Arab 226,351 271,344 287,265 293,034 274,530 -14.1% 3.9% 21.3%Other Africa
Other Asia inc.including Oceania
Europe
Americas 92,118 101,829 117,105 130,438 145,555 1.3% 9.6% 58.0%
Arrivals to Qatar by region
2,826,316
1,124,329319,418
23,917 24,879 31,640 35,027 36,364 4.8% 8.7% 52.0%34,702
448,881 511,557 591,648 653,549 735,841 -6.0% 10.4% 63.9%782,905
265,069 301,843 365,840 409,140 437,122 3.8% 10.5% 64.9%421,220143,742
2
Annual Tourism Performance Report 2015
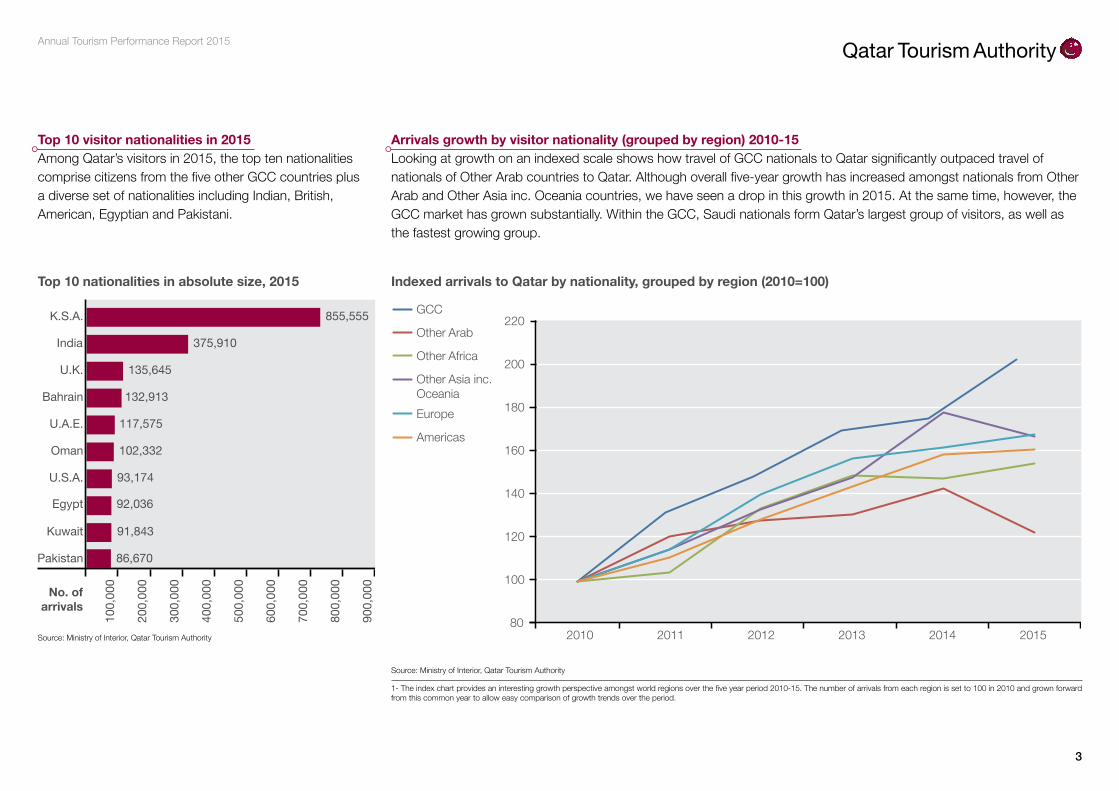
Top 10 visitor nationalities in 2015Among Qatar’s visitors in 2015, the top ten nationalities comprise citizens from the five other GCC countries plus a diverse set of nationalities including Indian, British, American, Egyptian and Pakistani.
Arrivals growth by visitor nationality (grouped by region) 2010-15 Looking at growth on an indexed scale shows how travel of GCC nationals to Qatar significantly outpaced travel of nationals of Other Arab countries to Qatar. Although overall five-year growth has increased amongst nationals from Other Arab and Other Asia inc. Oceania countries, we have seen a drop in this growth in 2015. At the same time, however, the GCC market has grown substantially. Within the GCC, Saudi nationals form Qatar’s largest group of visitors, as well as the fastest growing group.
Top 10 nationalities in absolute size, 2015
Source: Ministry of Interior, Qatar Tourism Authority
Pakistan
Kuwait
U.S.A.
Egypt
Oman
U.A.E.
Bahrain
U.K.
India
K.S.A.
86,670
91,843
93,174
92,036
102,332
117,575
132,913
135,645
375,910
855,555
No. ofarrivals
100
,000
200
,000
300
,000
400
,000
500
,000
600
,000
700
,000
800
,000
900
,000
Indexed arrivals to Qatar by nationality, grouped by region (2010=100)
Source: Ministry of Interior, Qatar Tourism Authority
1- The index chart provides an interesting growth perspective amongst world regions over the five year period 2010-15. The number of arrivals from each region is set to 100 in 2010 and grown forward from this common year to allow easy comparison of growth trends over the period.
80
100
120
140
160
180
200
220
2010 2011 2012 2013 2014 2015
GCC
Other Arab
Other Africa
Other Asia inc.Oceania Europe
Americas
3
Annual Tourism Performance Report 2015
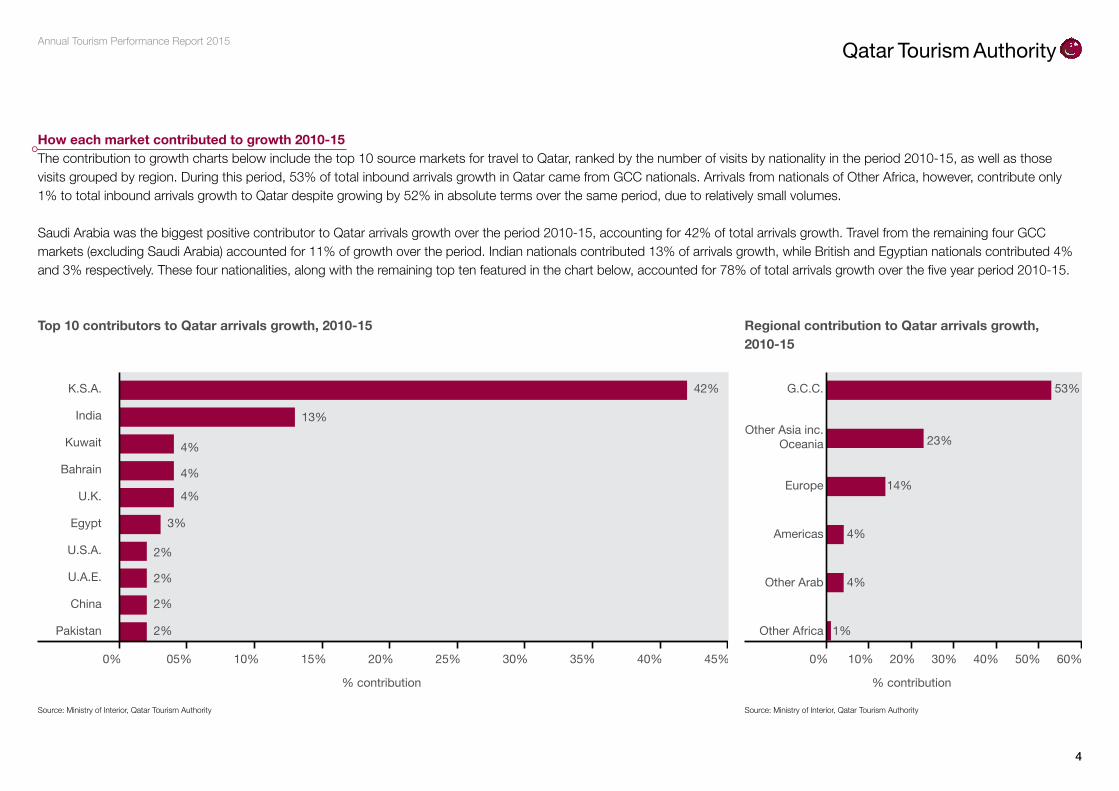
How each market contributed to growth 2010-15 The contribution to growth charts below include the top 10 source markets for travel to Qatar, ranked by the number of visits by nationality in the period 2010-15, as well as those visits grouped by region. During this period, 53% of total inbound arrivals growth in Qatar came from GCC nationals. Arrivals from nationals of Other Africa, however, contribute only 1% to total inbound arrivals growth to Qatar despite growing by 52% in absolute terms over the same period, due to relatively small volumes.
Saudi Arabia was the biggest positive contributor to Qatar arrivals growth over the period 2010-15, accounting for 42% of total arrivals growth. Travel from the remaining four GCC markets (excluding Saudi Arabia) accounted for 11% of growth over the period. Indian nationals contributed 13% of arrivals growth, while British and Egyptian nationals contributed 4% and 3% respectively. These four nationalities, along with the remaining top ten featured in the chart below, accounted for 78% of total arrivals growth over the five year period 2010-15.
Regional contribution to Qatar arrivals growth,2010-15
Source: Ministry of Interior, Qatar Tourism AuthoritySource: Ministry of Interior, Qatar Tourism Authority
G.C.C.
Other Asia inc.Oceania
Europe
Americas
Other Arab
Other Africa
53%
1%
4%
4%
14%
23%
0% 10% 20% 30% 40% 50% 60%
% contribution
42%
2%
2%
2%
2%
3%
4%
4%
4%
13%
0% 05% 10% 15% 20% 25% 30% 35% 40% 45%
% contribution
Pakistan
China
U.A.E.
U.S.A.
Egypt
U.K.
Bahrain
Kuwait
India
K.S.A.
Top 10 contributors to Qatar arrivals growth, 2010-15
4
Annual Tourism Performance Report 2015
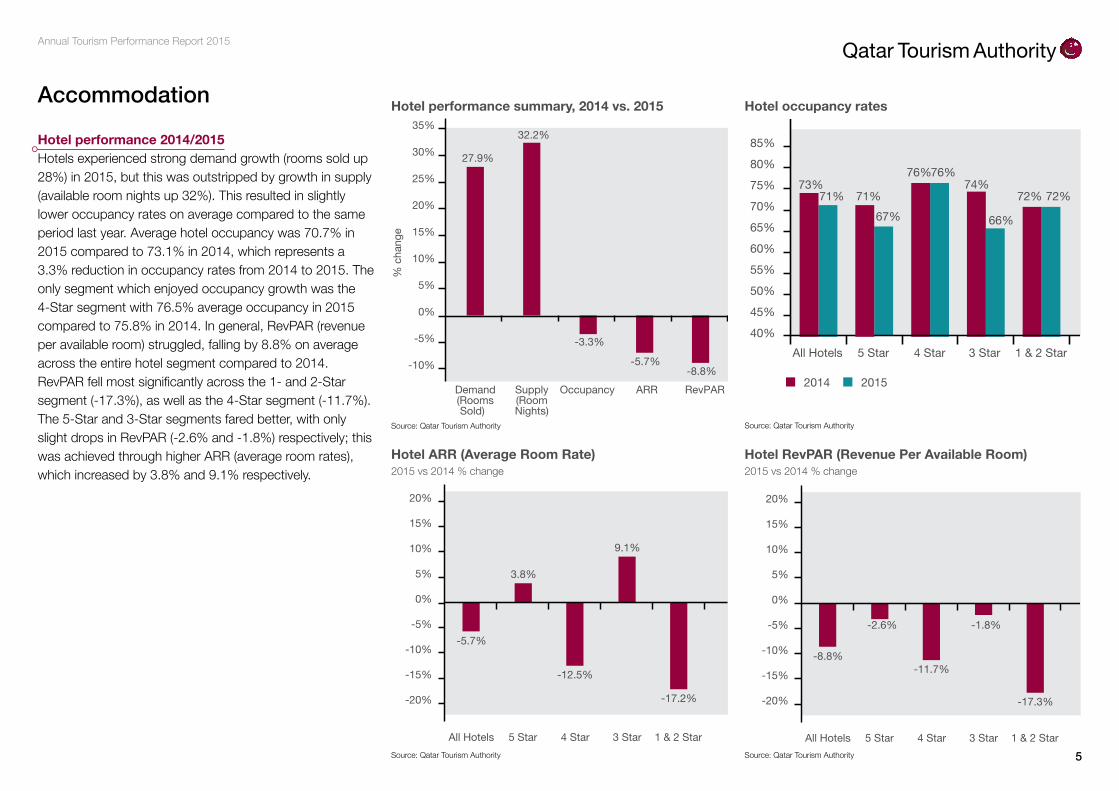
Hotel performance 2014/2015 Hotels experienced strong demand growth (rooms sold up 28%) in 2015, but this was outstripped by growth in supply (available room nights up 32%). This resulted in slightly lower occupancy rates on average compared to the same period last year. Average hotel occupancy was 70.7% in 2015 compared to 73.1% in 2014, which represents a 3.3% reduction in occupancy rates from 2014 to 2015. The only segment which enjoyed occupancy growth was the 4-Star segment with 76.5% average occupancy in 2015 compared to 75.8% in 2014. In general, RevPAR (revenue per available room) struggled, falling by 8.8% on average across the entire hotel segment compared to 2014. RevPAR fell most significantly across the 1- and 2-Star segment (-17.3%), as well as the 4-Star segment (-11.7%). The 5-Star and 3-Star segments fared better, with only slight drops in RevPAR (-2.6% and -1.8%) respectively; this was achieved through higher ARR (average room rates), which increased by 3.8% and 9.1% respectively.
-5.7%
3.8%
-12.5%
9.1%
-17.2%-20%
-15%
-10%
-5%
0%
5%
10%
15%
20%
All Hotels 5 Star 4 Star 3 Star 1 & 2 Star
Demand(RoomsSold)
Supply(RoomNights)
RevPAR
73% 76% 76%
74% 72% 71% 71%
67% 66%
72%
40%
45%
50%
55%
60%
65%
70%
75%
80%
85%
All Hotels 5 Star 4 Star 3 Star 1 & 2 Star
2014 2015
-8.8%
-2.6%
-11.7%
-1.8%
-17.3%-20%
-15%
-10%
-5%
0%
5%
10%
15%
20%
All Hotels 5 Star 4 Star 3 Star 1 & 2 Star
Hotel ARR (Average Room Rate)2015 vs 2014 % change
Hotel occupancy rates
Hotel RevPAR (Revenue Per Available Room)2015 vs 2014 % change
Occupancy ARR RevPAR
0%
5%
10%
15%
% c
hang
e
-10%
-5%
20%
25%
30%
35%
Demand(RoomsSold)
Supply(RoomNights)
27.9%
32.2%
-3.3%
-5.7%-8.8%
Hotel performance summary, 2014 vs. 2015
Source: Qatar Tourism Authority
Source: Qatar Tourism Authority Source: Qatar Tourism Authority
Source: Qatar Tourism Authority
Accommodation
5
Annual Tourism Performance Report 2015
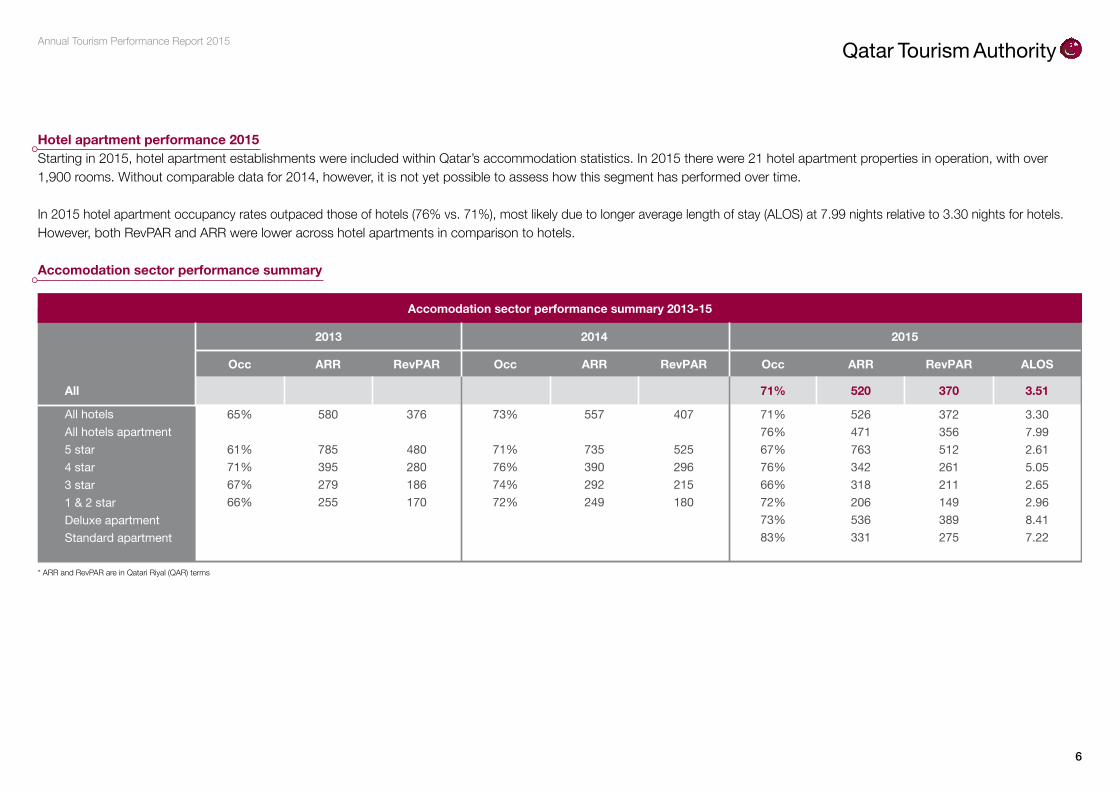
Hotel apartment performance 2015Starting in 2015, hotel apartment establishments were included within Qatar’s accommodation statistics. In 2015 there were 21 hotel apartment properties in operation, with over 1,900 rooms. Without comparable data for 2014, however, it is not yet possible to assess how this segment has performed over time.
In 2015 hotel apartment occupancy rates outpaced those of hotels (76% vs. 71%), most likely due to longer average length of stay (ALOS) at 7.99 nights relative to 3.30 nights for hotels. However, both RevPAR and ARR were lower across hotel apartments in comparison to hotels.
Accomodation sector performance summary
Occ ARR RevPAR Occ ARR RevPAR
2013 2014
Occ ARR RevPAR ALOS
All 71% 520 370
All hotels 65%
61%71%67%66%
580
785395279255
376
480280186170
All hotels apartment5 star4 star3 star1 & 2 starDeluxe apartmentStandard apartment
Accomodation sector performance summary 2013-15
3.51
2015
73%
71%76%74%72%
557
735390292249
407
525296215180
71%76%67%76%66%72%73%83%
526471763342318206536331
372356512261211149389275
3.307.992.615.052.652.968.417.22
* ARR and RevPAR are in Qatari Riyal (QAR) terms
6
Annual Tourism Performance Report 2015
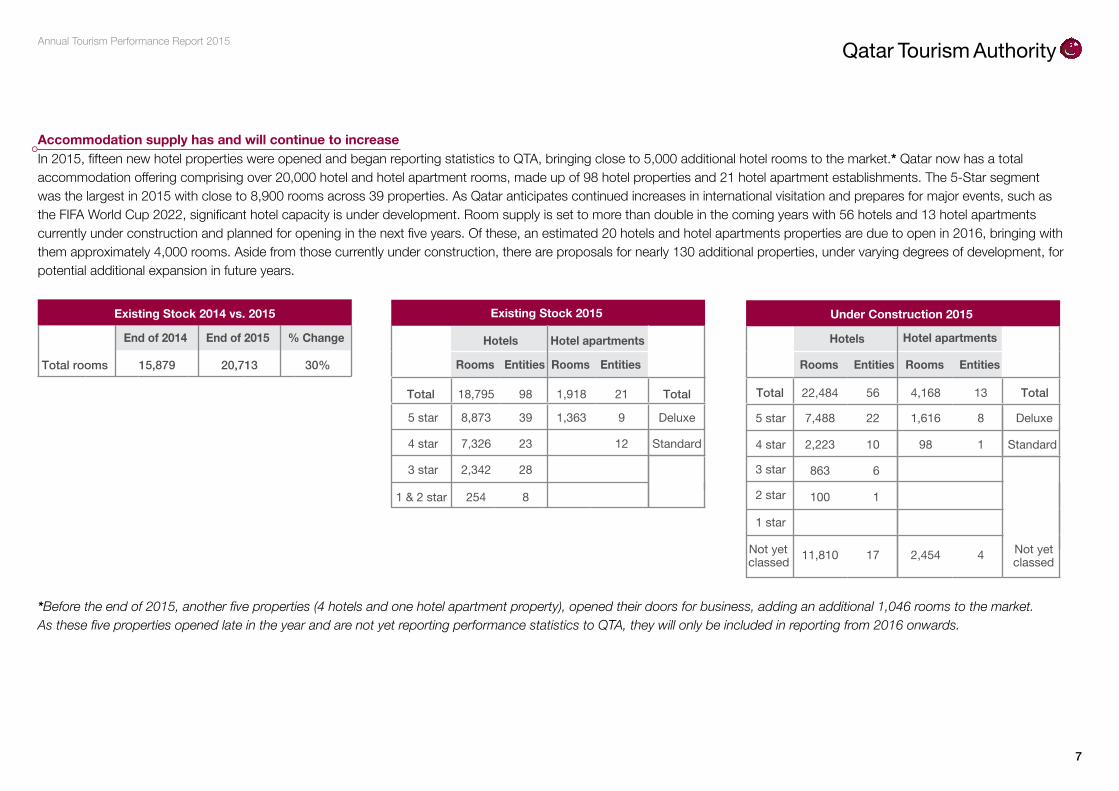
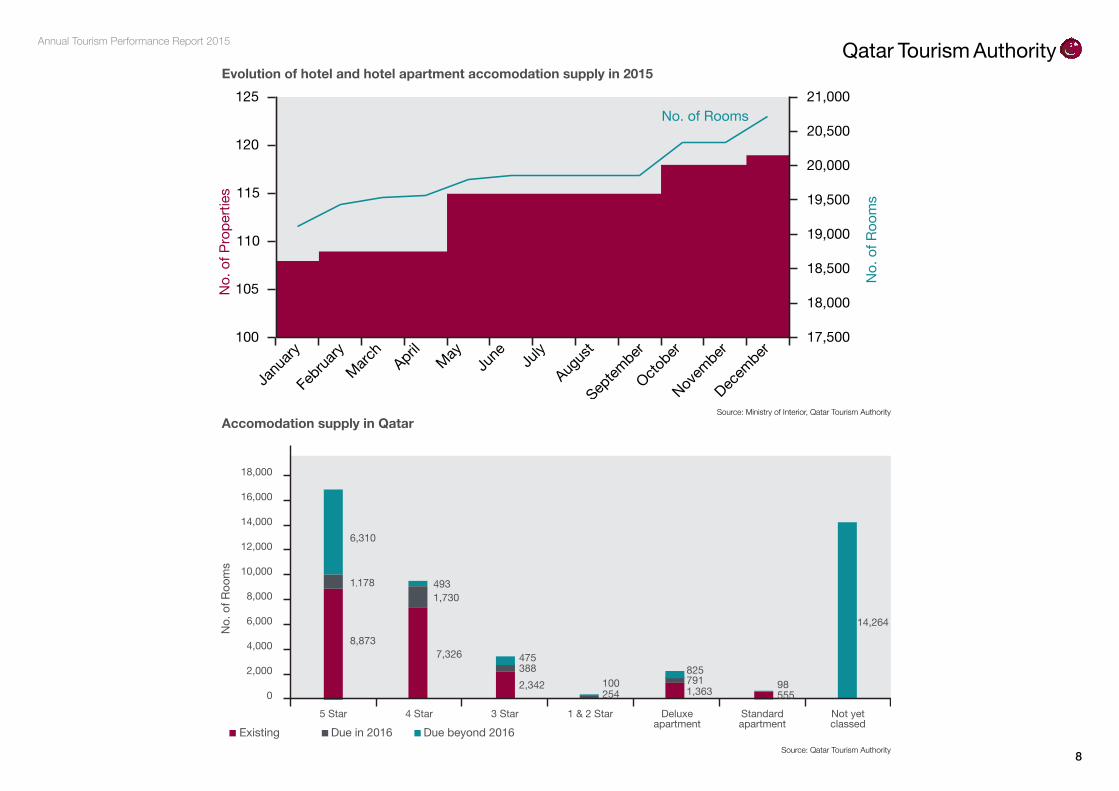
Accommodation supply has and will continue to increaseIn 2015, fifteen new hotel properties were opened and began reporting statistics to QTA, bringing close to 5,000 additional hotel rooms to the market.* Qatar now has a total accommodation offering comprising over 20,000 hotel and hotel apartment rooms, made up of 98 hotel properties and 21 hotel apartment establishments. The 5-Star segment was the largest in 2015 with close to 8,900 rooms across 39 properties. As Qatar anticipates continued increases in international visitation and prepares for major events, such as the FIFA World Cup 2022, significant hotel capacity is under development. Room supply is set to more than double in the coming years with 56 hotels and 13 hotel apartments currently under construction and planned for opening in the next five years. Of these, an estimated 20 hotels and hotel apartments properties are due to open in 2016, bringing with them approximately 4,000 rooms. Aside from those currently under construction, there are proposals for nearly 130 additional properties, under varying degrees of development, for potential additional expansion in future years.
*Before the end of 2015, another five properties (4 hotels and one hotel apartment property), opened their doors for business, adding an additional 1,046 rooms to the market.As these five properties opened late in the year and are not yet reporting performance statistics to QTA, they will only be included in reporting from 2016 onwards.
7
Existing Stock 2015
Hotels Hotel apartments
Rooms Entities Rooms Entities
Total 18,795 98 1,918 21 Total
5 star 8,873 39 1,363 9 Deluxe
4 star 7,326 23 12 Standard
3 star 2,342 28
1 & 2 star 254 8
Hotels Hotel apartments
Rooms Entities Rooms Entities
Total 22,484 56 4,168 13 Total
5 star
4 star
3 star
2 star
1 star
7,488 22 1,616 8 Deluxe
2,223 10 98 1 Standard
863 6
100 1
Not yet classed 11,810 17 2,454 4 Not yet
classed
Under Construction 2015
End of 2014
Total rooms 15,879 20,713 30%
End of 2015 % Change
Existing Stock 2014 vs. 2015
Annual Tourism Performance Report 2015
8,873 7,326
1,178 1,730
6,310
493
2,000
4,000
6,000
8,000
10,000
12,000
14,000
16,000
18,000
0Not yetclassed
5 Star 4 Star 3 Star 1 & 2 Star Deluxeapartment
Standardapartment
Existing Due in 2016 Due beyond 2016
2,342 254 1,363 555
388 791
475
100 825
98
14,264
No.
of R
oom
s
No. of Rooms
17,500
18,000
18,500
19,000
19,500
20,000
20,500
21,000
100
105
110
115
120
125
No.
of R
oom
s
No.
of P
rope
rties
Accomodation supply in Qatar
Evolution of hotel and hotel apartment accomodation supply in 2015
Source: Qatar Tourism Authority
Source: Ministry of Interior, Qatar Tourism Authority
8


![LMP [arrivals] 1_2010](https://img.pdfslide.net/doc/110x75/568c4cab1a28ab4916a10c8f/lmp-arrivals-12010.jpg)


![LMP [arrivals] 2013](https://img.pdfslide.net/doc/110x75/568bd8671a28ab2034a337c9/lmp-arrivals-2013.jpg)