Embed Size (px)
DESCRIPTION
Annual Viewing Trends Total Canada, English, and French*. Adults 55+, By Daypart Average Minute Audience (000) Average Weekly Reach (%) Average Weekly Hours Viewed. Annual Viewing Trends Adults 55+ AMA (000), Total TV All Day Mo-Su 2a-2a. - PowerPoint PPT Presentation
Citation preview

Annual Viewing TrendsTotal Canada, English, and French*
Adults 55+, By Daypart Average Minute Audience (000)
Average Weekly Reach (%)Average Weekly Hours Viewed
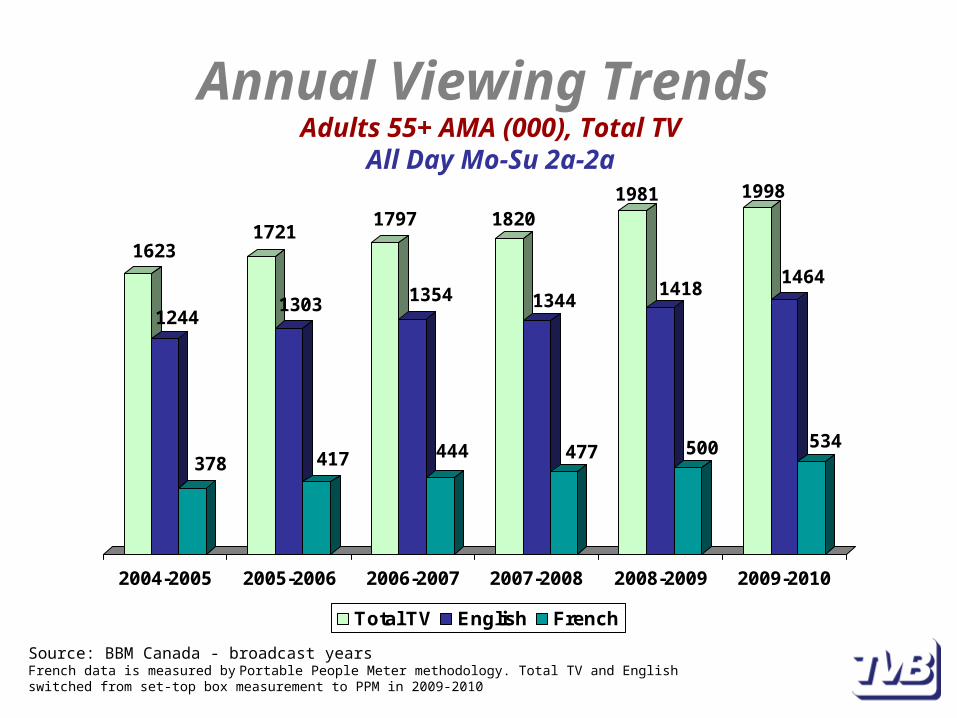
Annual Viewing Trends Adults 55+ AMA (000), Total TV
All Day Mo-Su 2a-2a
1623
1244
378
1721
1303
417
1797
1354
444
1820
1344
477
1981
1418
500
1998
1464
534
2004-2005 2005-2006 2006-2007 2007-2008 2008-2009 2009-2010
Total TV English French
Source: BBM Canada - broadcast yearsFrench data is measured by Portable People Meter methodology. Total TV and English switched from set-top box measurement to PPM in 2009-2010
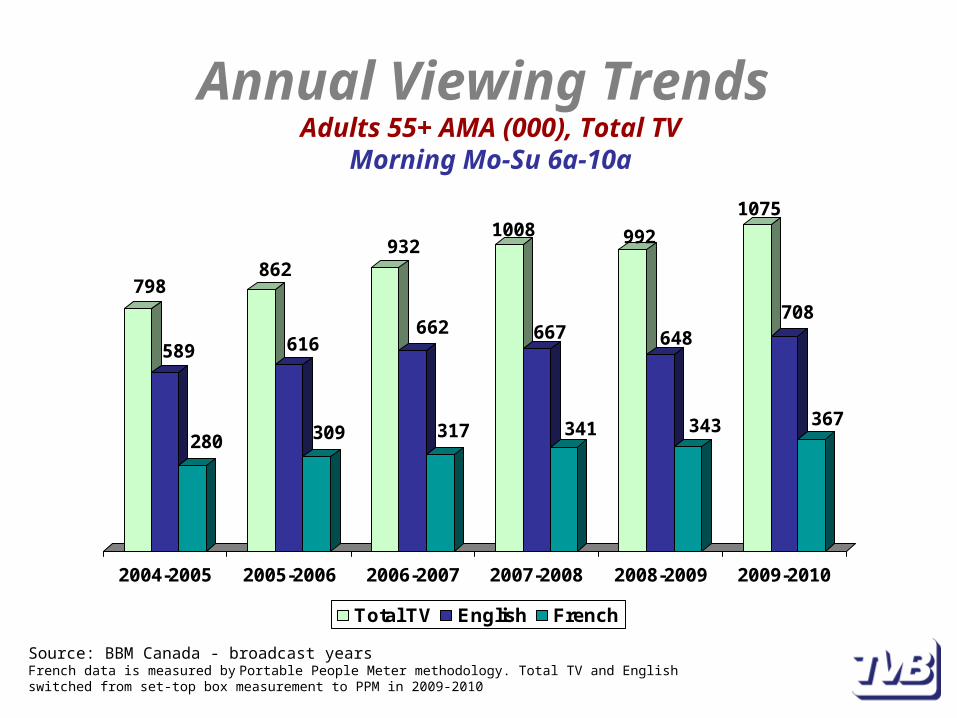
Annual Viewing Trends Adults 55+ AMA (000), Total TV
Morning Mo-Su 6a-10a
798
589
280
862
616
309
932
662
317
1008
667
341
992
648
343
1075
708
367
2004-2005 2005-2006 2006-2007 2007-2008 2008-2009 2009-2010
Total TV English French
Source: BBM Canada - broadcast yearsFrench data is measured by Portable People Meter methodology. Total TV and English switched from set-top box measurement to PPM in 2009-2010
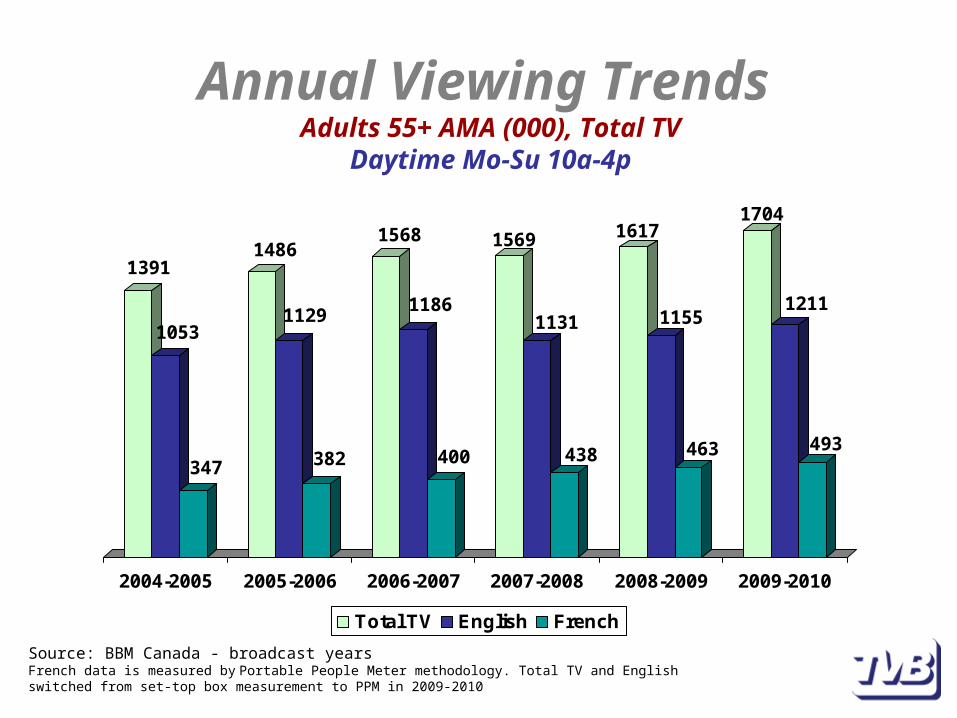
Annual Viewing Trends Adults 55+ AMA (000), Total TV
Daytime Mo-Su 10a-4p
1391
1053
347
1486
1129
382
1568
1186
400
1569
1131
438
1617
1155
463
1704
1211
493
2004-2005 2005-2006 2006-2007 2007-2008 2008-2009 2009-2010
Total TV English French
Source: BBM Canada - broadcast yearsFrench data is measured by Portable People Meter methodology. Total TV and English switched from set-top box measurement to PPM in 2009-2010
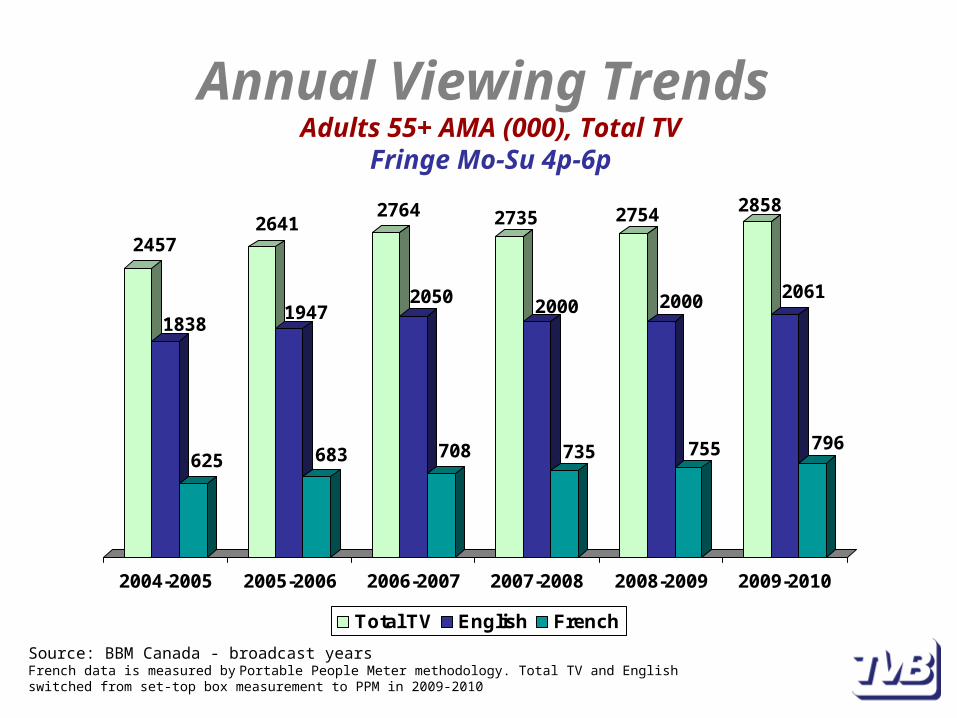
Annual Viewing Trends Adults 55+ AMA (000), Total TV
Fringe Mo-Su 4p-6p
2457
1838
625
2641
1947
683
2764
2050
708
2735
2000
735
2754
2000
755
2858
2061
796
2004-2005 2005-2006 2006-2007 2007-2008 2008-2009 2009-2010
Total TV English French
Source: BBM Canada - broadcast yearsFrench data is measured by Portable People Meter methodology. Total TV and English switched from set-top box measurement to PPM in 2009-2010
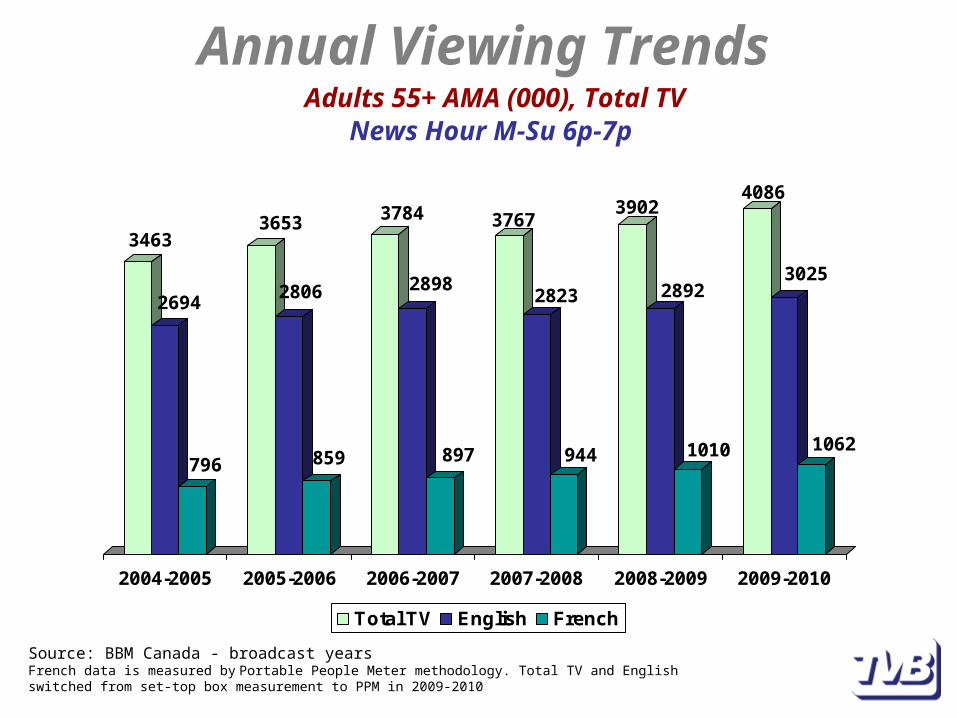
Annual Viewing Trends Adults 55+ AMA (000), Total TV
News Hour M-Su 6p-7p
3463
2694
796
3653
2806
859
3784
2898
897
3767
2823
944
3902
2892
1010
4086
3025
1062
2004-2005 2005-2006 2006-2007 2007-2008 2008-2009 2009-2010
Total TV English French
Source: BBM Canada - broadcast yearsFrench data is measured by Portable People Meter methodology. Total TV and English switched from set-top box measurement to PPM in 2009-2010
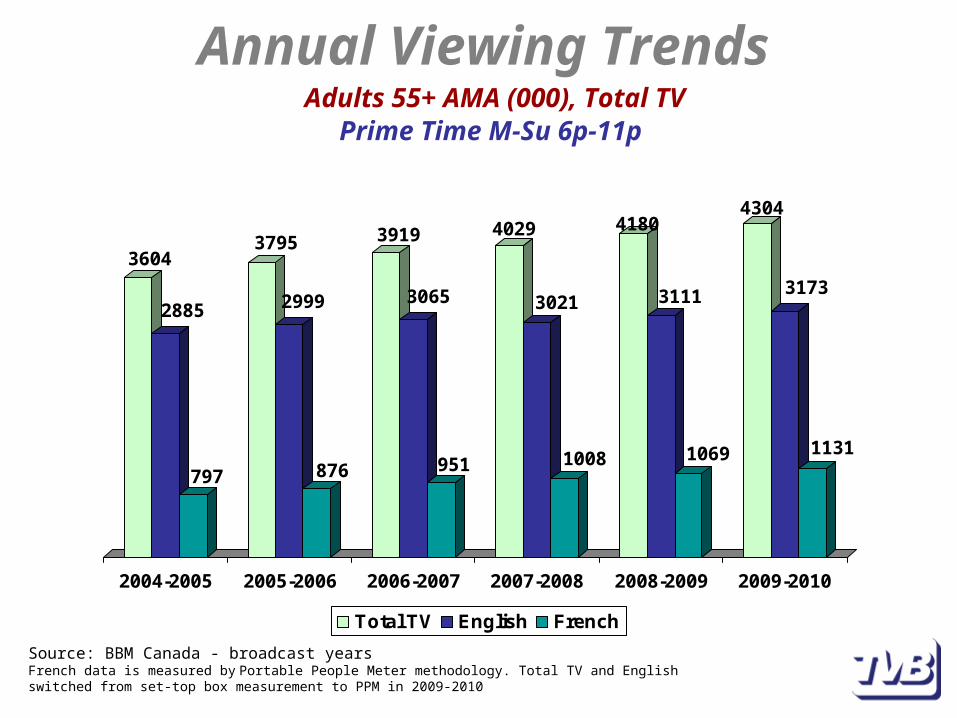
Annual Viewing Trends Adults 55+ AMA (000), Total TV
Prime Time M-Su 6p-11p
3604
2885
797
3795
2999
876
3919
3065
951
4029
3021
1008
4180
3111
1069
4304
3173
1131
2004-2005 2005-2006 2006-2007 2007-2008 2008-2009 2009-2010
Total TV English French
Source: BBM Canada - broadcast yearsFrench data is measured by Portable People Meter methodology. Total TV and English switched from set-top box measurement to PPM in 2009-2010
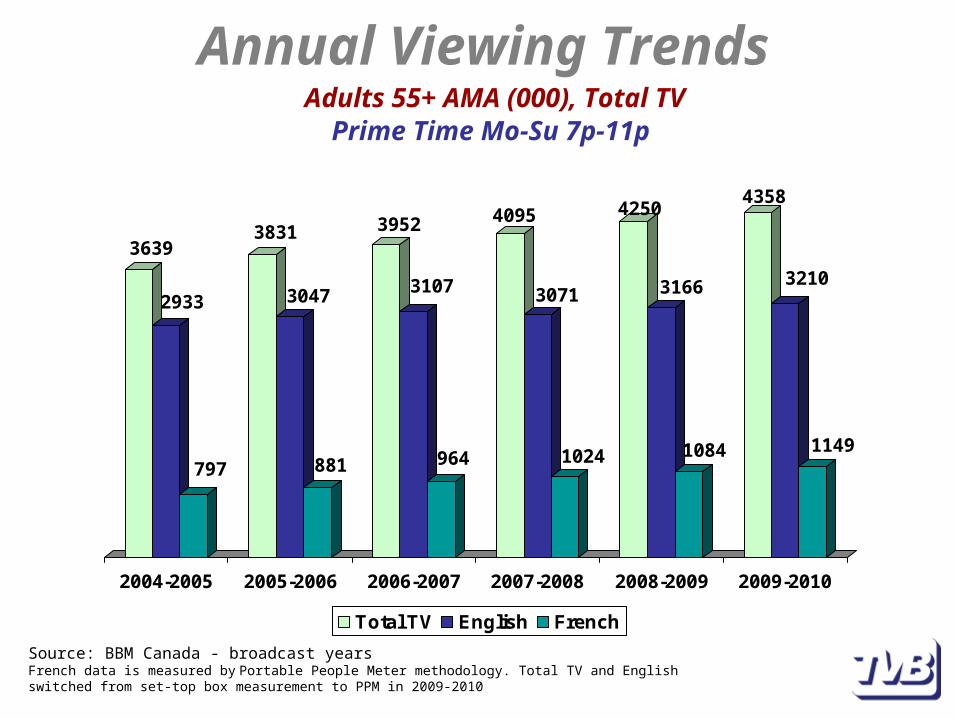
Annual Viewing Trends Adults 55+ AMA (000), Total TV
Prime Time Mo-Su 7p-11p
3639
2933
797
3831
3047
881
3952
3107
964
4095
3071
1024
4250
3166
1084
4358
3210
1149
2004-2005 2005-2006 2006-2007 2007-2008 2008-2009 2009-2010
Total TV English French
Source: BBM Canada - broadcast yearsFrench data is measured by Portable People Meter methodology. Total TV and English switched from set-top box measurement to PPM in 2009-2010
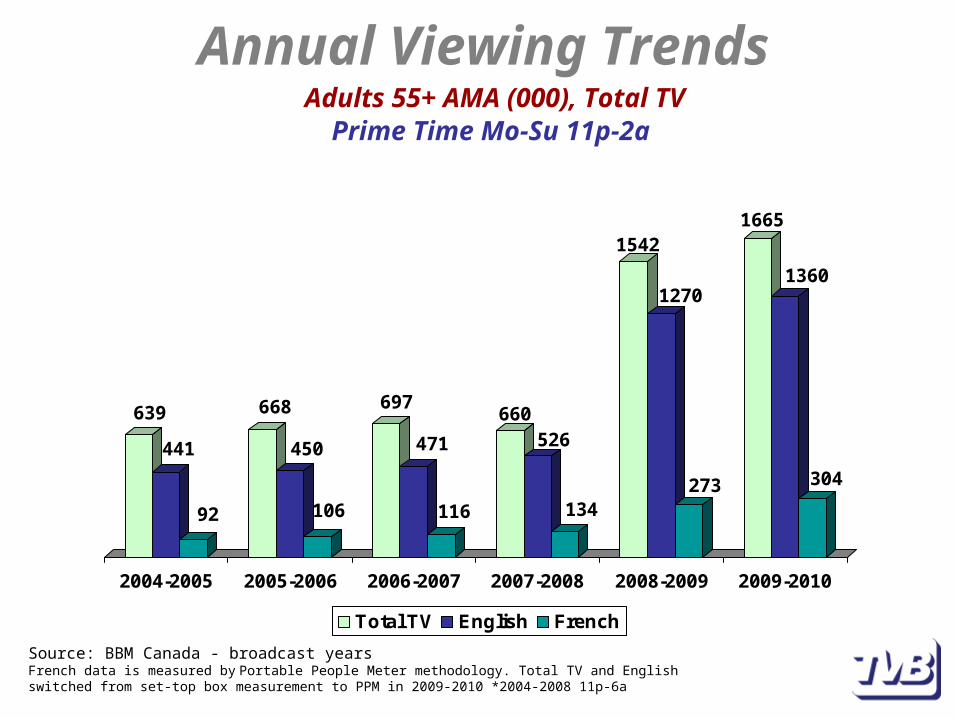
Annual Viewing Trends Adults 55+ AMA (000), Total TV
Prime Time Mo-Su 11p-2a
639
441
92
668
450
106
697
471
116
660526
134
1542
1270
273
1665
1360
304
2004-2005 2005-2006 2006-2007 2007-2008 2008-2009 2009-2010
Total TV English French
Source: BBM Canada - broadcast yearsFrench data is measured by Portable People Meter methodology. Total TV and English switched from set-top box measurement to PPM in 2009-2010 *2004-2008 11p-6a

Average Weekly Reach
Total Canada, English, and French*
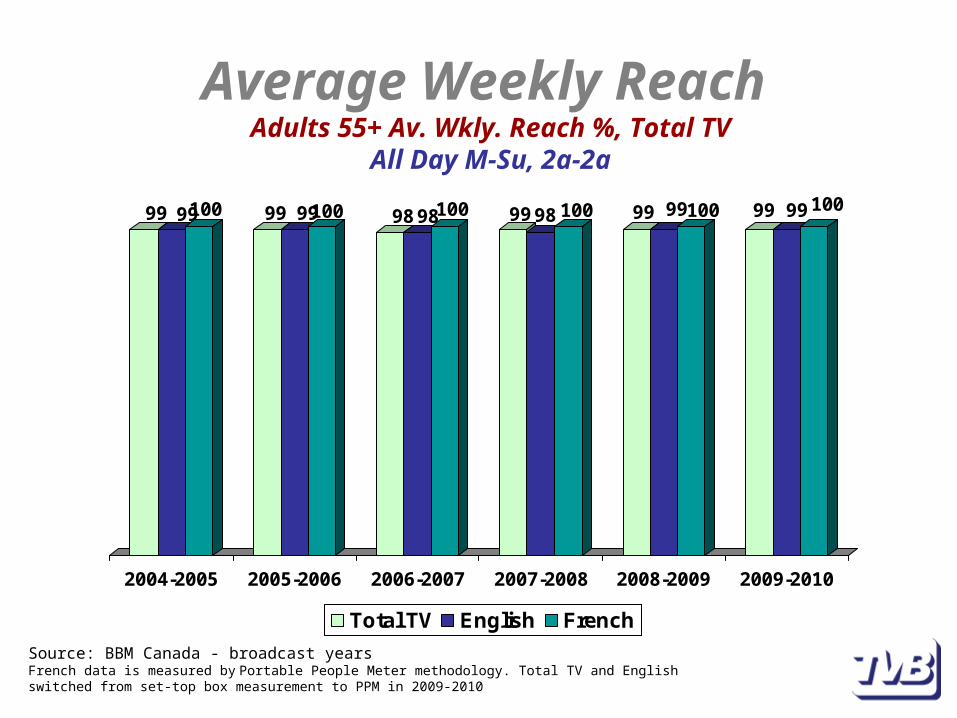
Average Weekly Reach Adults 55+ Av. Wkly. Reach %, Total TV
All Day M-Su, 2a-2a
99 99100 99 99100 98 98100 99 98 100 99 99100 99 99 100
2004-2005 2005-2006 2006-2007 2007-2008 2008-2009 2009-2010
Total TV English French
Source: BBM Canada - broadcast yearsFrench data is measured by Portable People Meter methodology. Total TV and English switched from set-top box measurement to PPM in 2009-2010
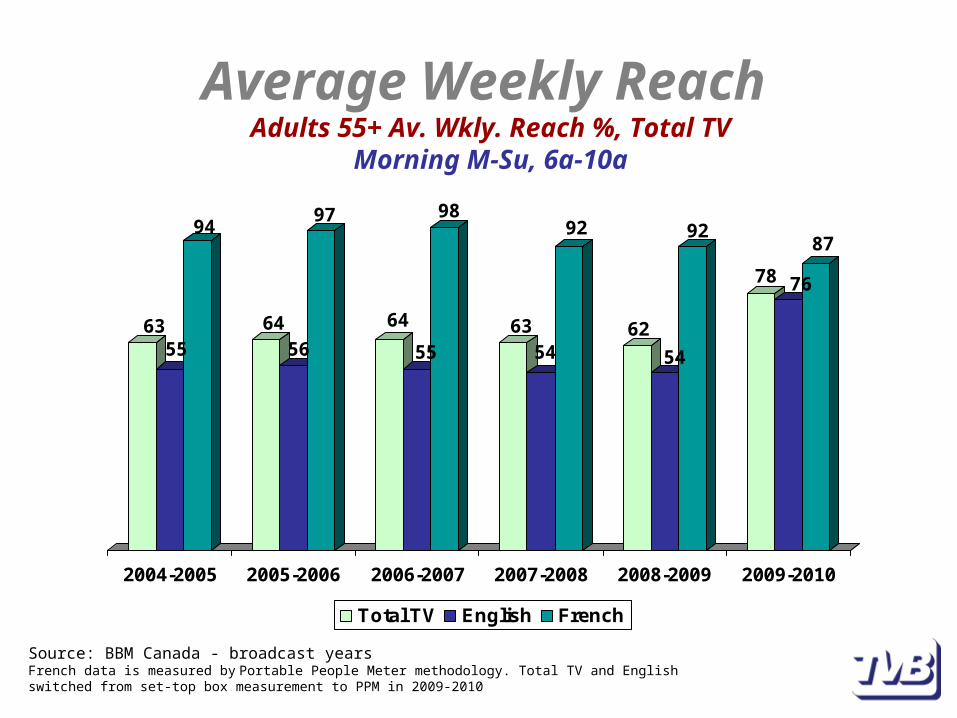
Average Weekly Reach Adults 55+ Av. Wkly. Reach %, Total TV
Morning M-Su, 6a-10a
6355
94
6456
97
64
55
98
6354
92
62
54
92
78 76
87
2004-2005 2005-2006 2006-2007 2007-2008 2008-2009 2009-2010
Total TV English French
Source: BBM Canada - broadcast yearsFrench data is measured by Portable People Meter methodology. Total TV and English switched from set-top box measurement to PPM in 2009-2010
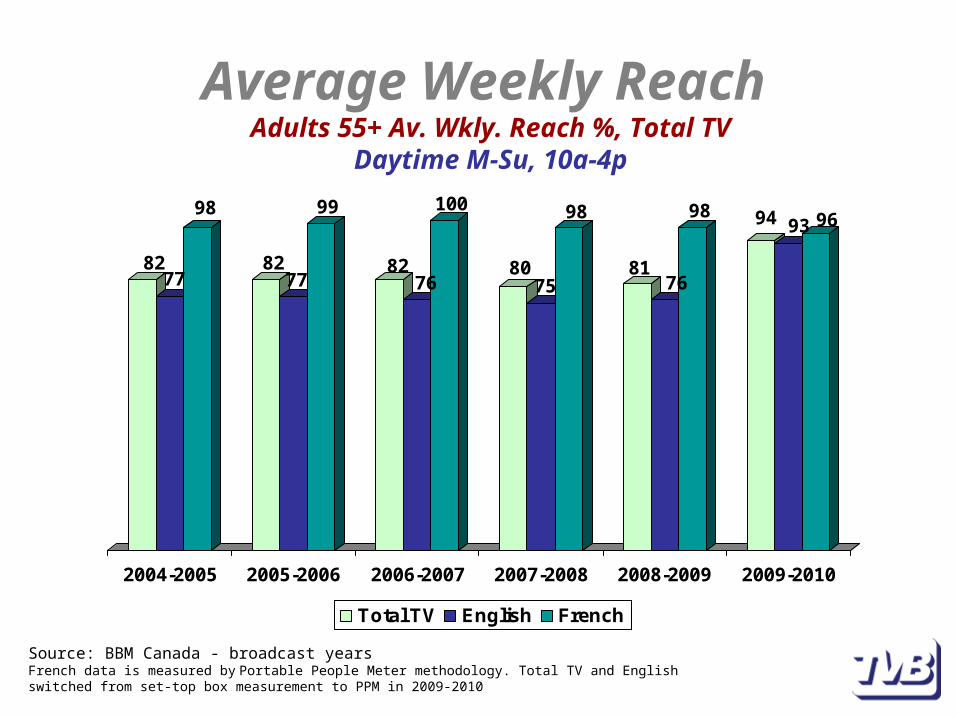
Average Weekly Reach Adults 55+ Av. Wkly. Reach %, Total TV
Daytime M-Su, 10a-4p
8277
98
8277
99
8276
100
8075
98
8176
98 94 93 96
2004-2005 2005-2006 2006-2007 2007-2008 2008-2009 2009-2010
Total TV English French
Source: BBM Canada - broadcast yearsFrench data is measured by Portable People Meter methodology. Total TV and English switched from set-top box measurement to PPM in 2009-2010
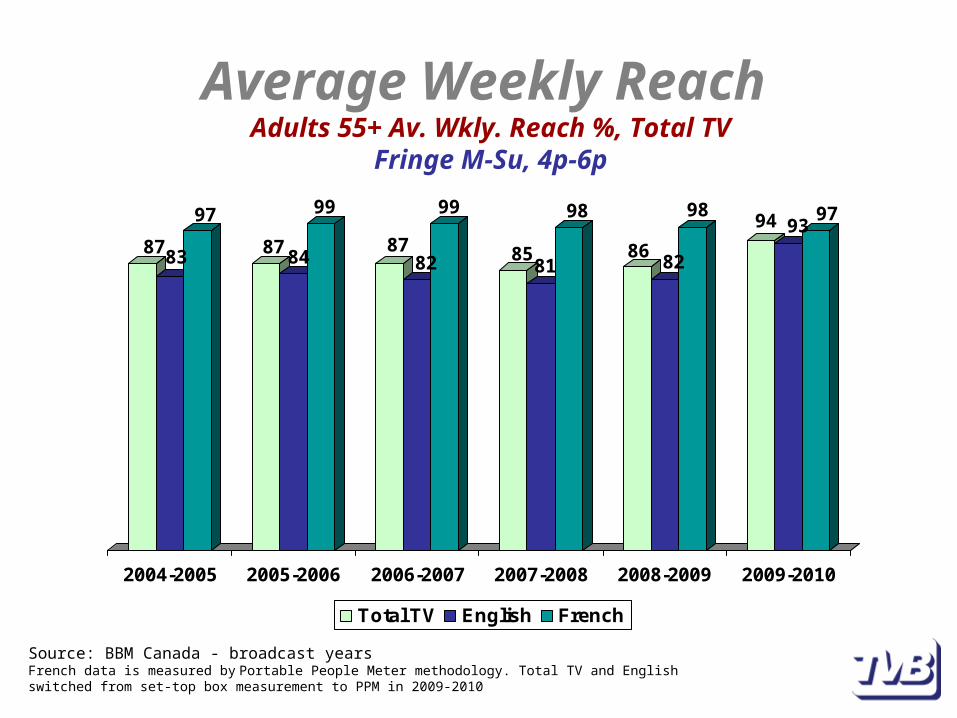
Average Weekly Reach Adults 55+ Av. Wkly. Reach %, Total TV
Fringe M-Su, 4p-6p
8783
97
87 84
99
8782
99
8581
98
8682
9894 93
97
2004-2005 2005-2006 2006-2007 2007-2008 2008-2009 2009-2010
Total TV English French
Source: BBM Canada - broadcast yearsFrench data is measured by Portable People Meter methodology. Total TV and English switched from set-top box measurement to PPM in 2009-2010
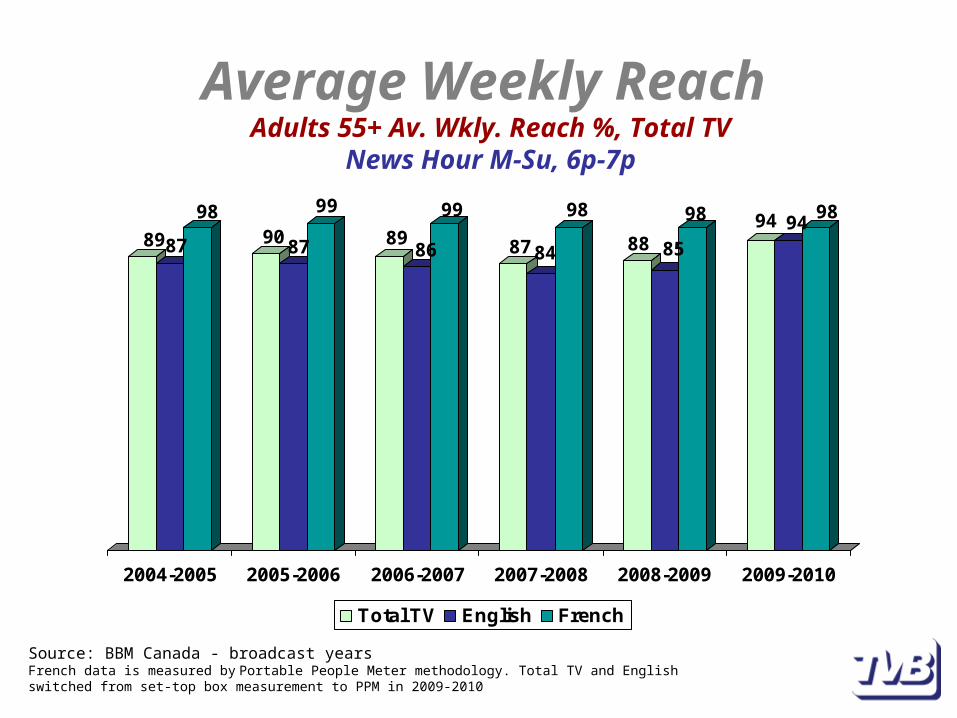
Average Weekly Reach Adults 55+ Av. Wkly. Reach %, Total TV
News Hour M-Su, 6p-7p
8987
9890 87
99
8986
99
87 84
98
88 85
98 94 9498
2004-2005 2005-2006 2006-2007 2007-2008 2008-2009 2009-2010
Total TV English French
Source: BBM Canada - broadcast yearsFrench data is measured by Portable People Meter methodology. Total TV and English switched from set-top box measurement to PPM in 2009-2010
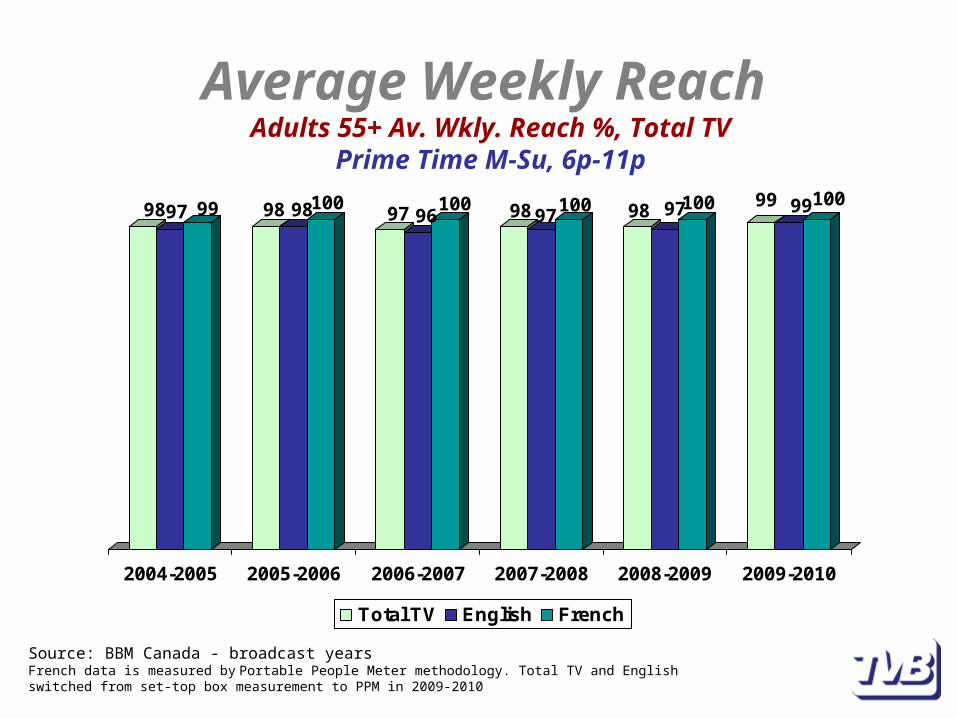
Average Weekly Reach Adults 55+ Av. Wkly. Reach %, Total TV
Prime Time M-Su, 6p-11p
9897 99 98 9810097 96
100 98 97100 98 97100 99 99100
2004-2005 2005-2006 2006-2007 2007-2008 2008-2009 2009-2010
Total TV English French
Source: BBM Canada - broadcast yearsFrench data is measured by Portable People Meter methodology. Total TV and English switched from set-top box measurement to PPM in 2009-2010
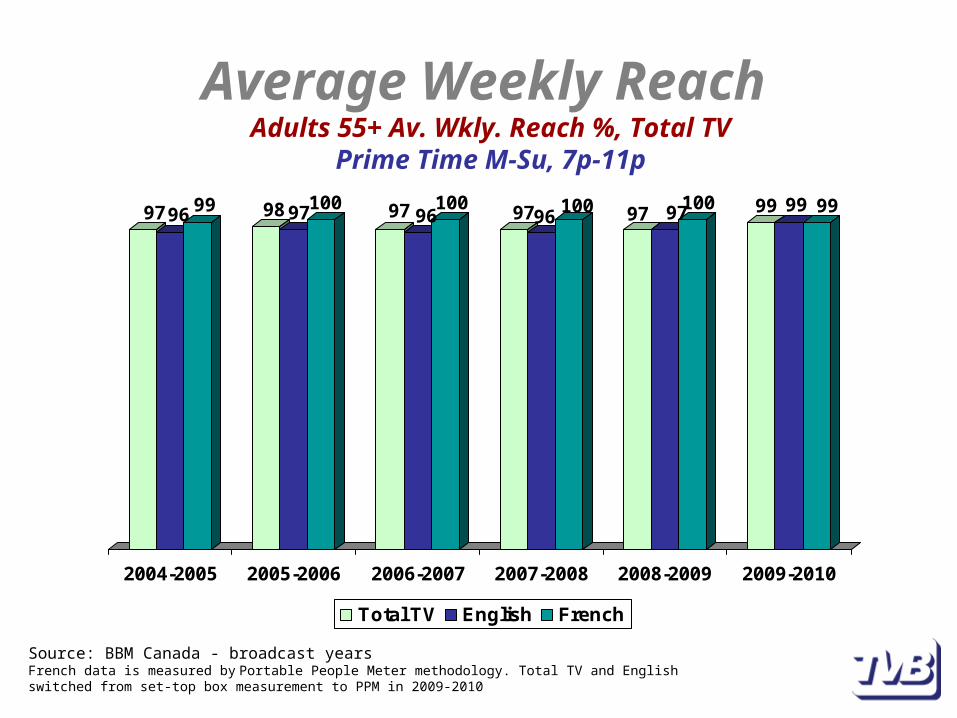
Average Weekly Reach Adults 55+ Av. Wkly. Reach %, Total TV
Prime Time M-Su, 7p-11p
9796 99 98 97100 97 96100 9796
100 97 97100 99 99 99
2004-2005 2005-2006 2006-2007 2007-2008 2008-2009 2009-2010
Total TV English French
Source: BBM Canada - broadcast yearsFrench data is measured by Portable People Meter methodology. Total TV and English switched from set-top box measurement to PPM in 2009-2010
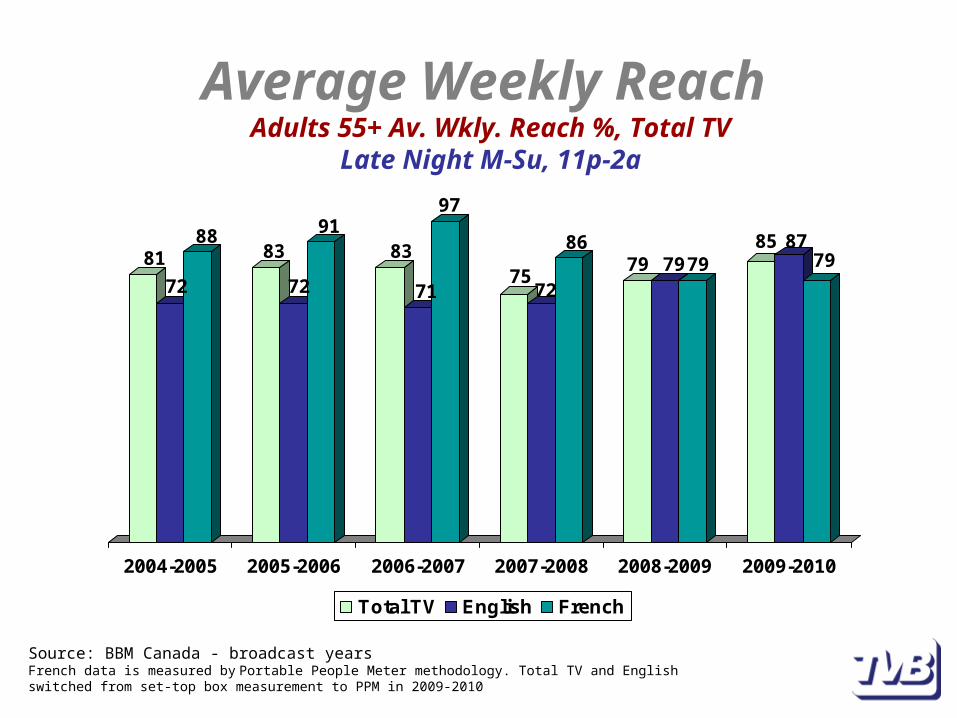
Average Weekly Reach Adults 55+ Av. Wkly. Reach %, Total TV
Late Night M-Su, 11p-2a
81
72
8883
72
9183
71
97
7572
8679 7979
85 8779
2004-2005 2005-2006 2006-2007 2007-2008 2008-2009 2009-2010
Total TV English French
Source: BBM Canada - broadcast yearsFrench data is measured by Portable People Meter methodology. Total TV and English switched from set-top box measurement to PPM in 2009-2010

Average Hours Viewed
Total Canada, English, and French*(Per week, Per Capita)
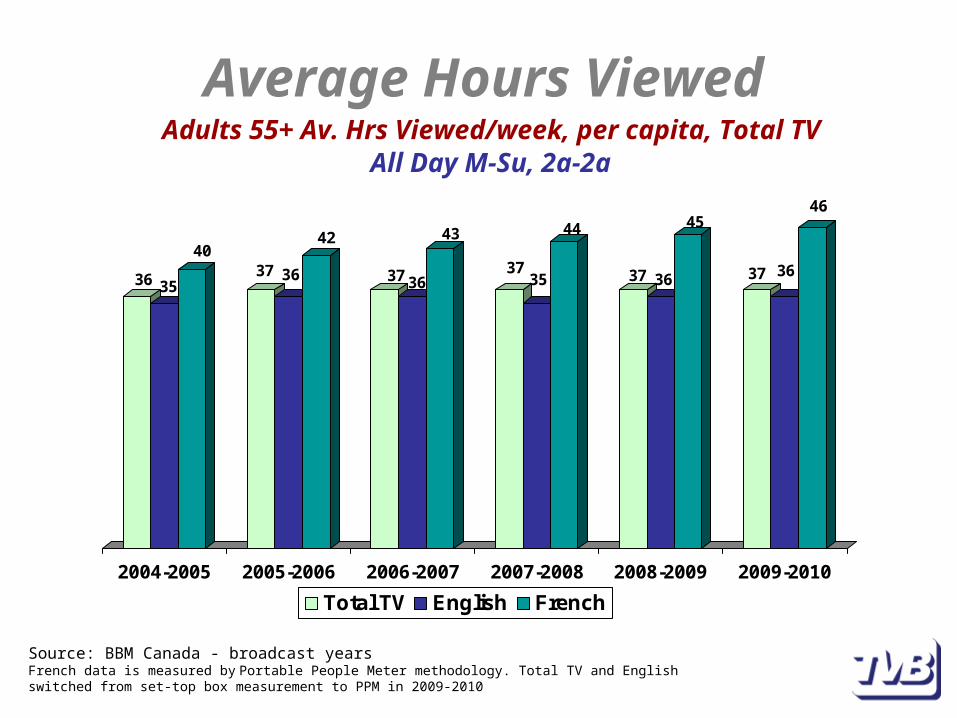
Average Hours Viewed Adults 55+ Av. Hrs Viewed/week, per capita, Total TV
All Day M-Su, 2a-2a
36 35
4037 36
42
37 36
43
3735
44
37 36
45
37 36
46
2004-2005 2005-2006 2006-2007 2007-2008 2008-2009 2009-2010
Total TV English French
Source: BBM Canada - broadcast yearsFrench data is measured by Portable People Meter methodology. Total TV and English switched from set-top box measurement to PPM in 2009-2010
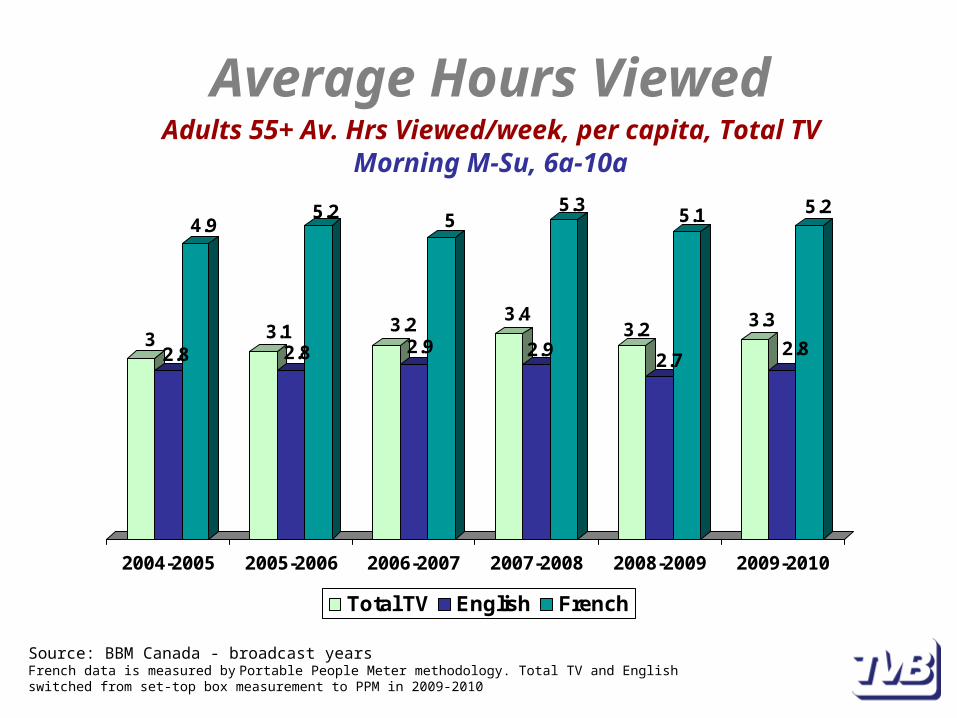
Average Hours Viewed Adults 55+ Av. Hrs Viewed/week, per capita, Total TV
Morning M-Su, 6a-10a
32.8
4.9
3.12.8
5.2
3.22.9
5
3.4
2.9
5.3
3.2
2.7
5.1
3.3
2.8
5.2
2004-2005 2005-2006 2006-2007 2007-2008 2008-2009 2009-2010
Total TV English French
Source: BBM Canada - broadcast yearsFrench data is measured by Portable People Meter methodology. Total TV and English switched from set-top box measurement to PPM in 2009-2010
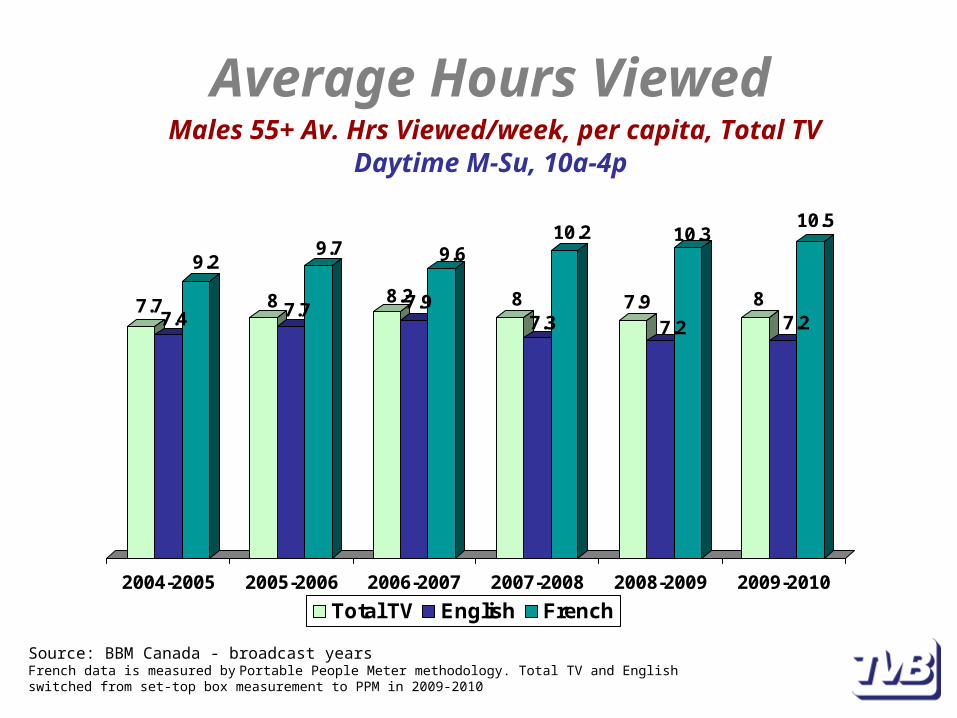
Average Hours Viewed Males 55+ Av. Hrs Viewed/week, per capita, Total TV
Daytime M-Su, 10a-4p
7.77.4
9.2
8 7.7
9.7
8.27.9
9.6
87.3
10.2
7.97.2
10.3
87.2
10.5
2004-2005 2005-2006 2006-2007 2007-2008 2008-2009 2009-2010
Total TV English French
Source: BBM Canada - broadcast yearsFrench data is measured by Portable People Meter methodology. Total TV and English switched from set-top box measurement to PPM in 2009-2010
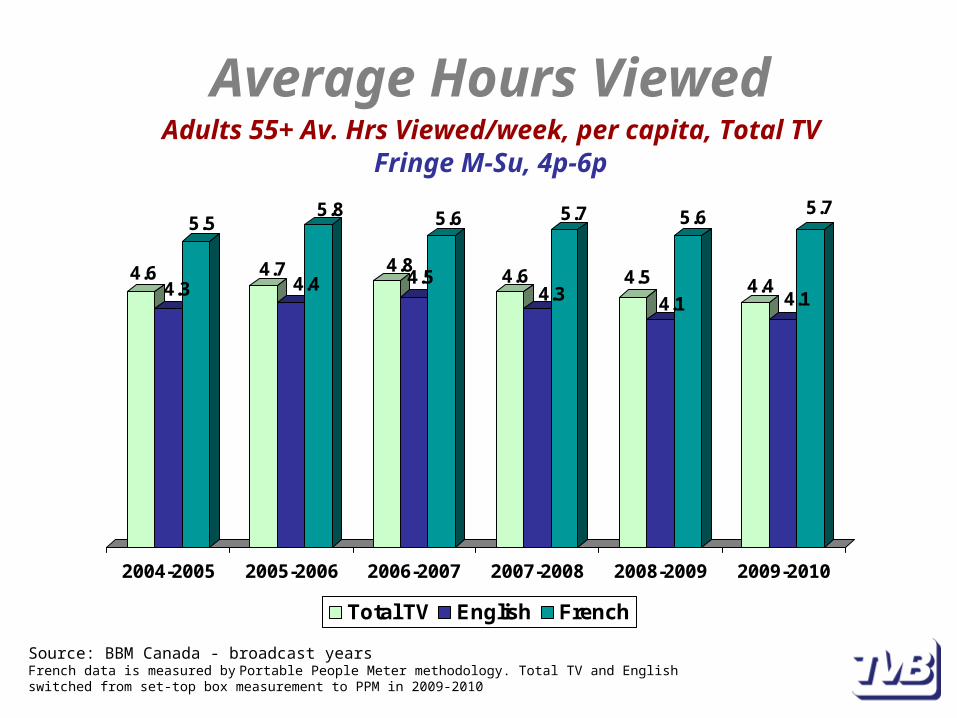
Average Hours Viewed Adults 55+ Av. Hrs Viewed/week, per capita, Total TV
Fringe M-Su, 4p-6p
4.64.3
5.5
4.74.4
5.8
4.84.5
5.6
4.64.3
5.7
4.5
4.1
5.6
4.44.1
5.7
2004-2005 2005-2006 2006-2007 2007-2008 2008-2009 2009-2010
Total TV English French
Source: BBM Canada - broadcast yearsFrench data is measured by Portable People Meter methodology. Total TV and English switched from set-top box measurement to PPM in 2009-2010
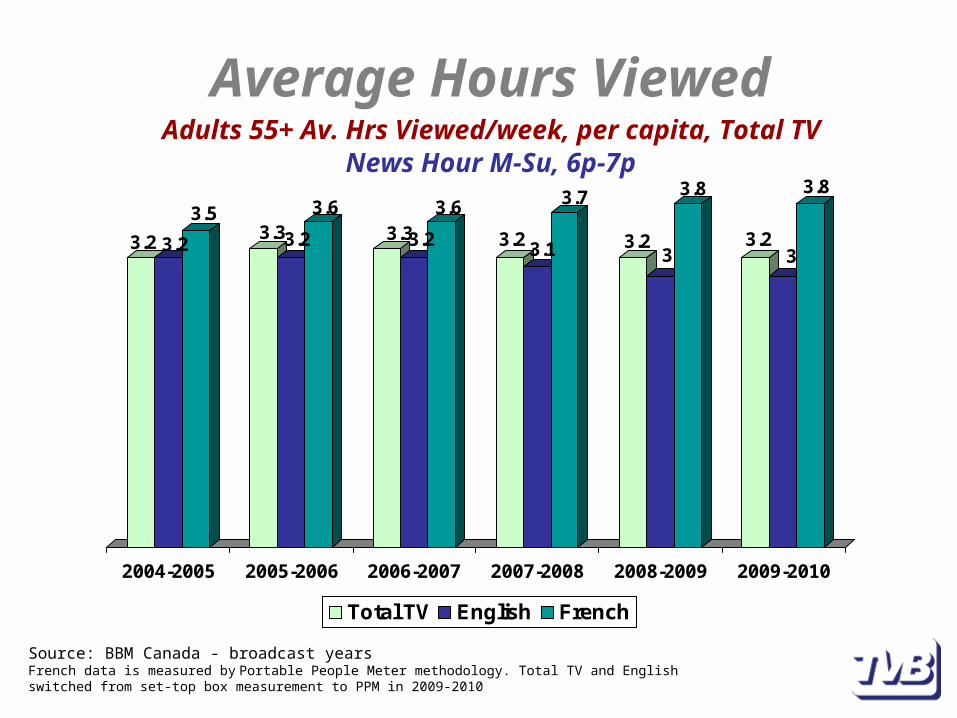
Average Hours Viewed Adults 55+ Av. Hrs Viewed/week, per capita, Total TV
News Hour M-Su, 6p-7p
3.2 3.2
3.53.33.2
3.63.33.2
3.6
3.2 3.1
3.7
3.23
3.8
3.23
3.8
2004-2005 2005-2006 2006-2007 2007-2008 2008-2009 2009-2010
Total TV English French
Source: BBM Canada - broadcast yearsFrench data is measured by Portable People Meter methodology. Total TV and English switched from set-top box measurement to PPM in 2009-2010
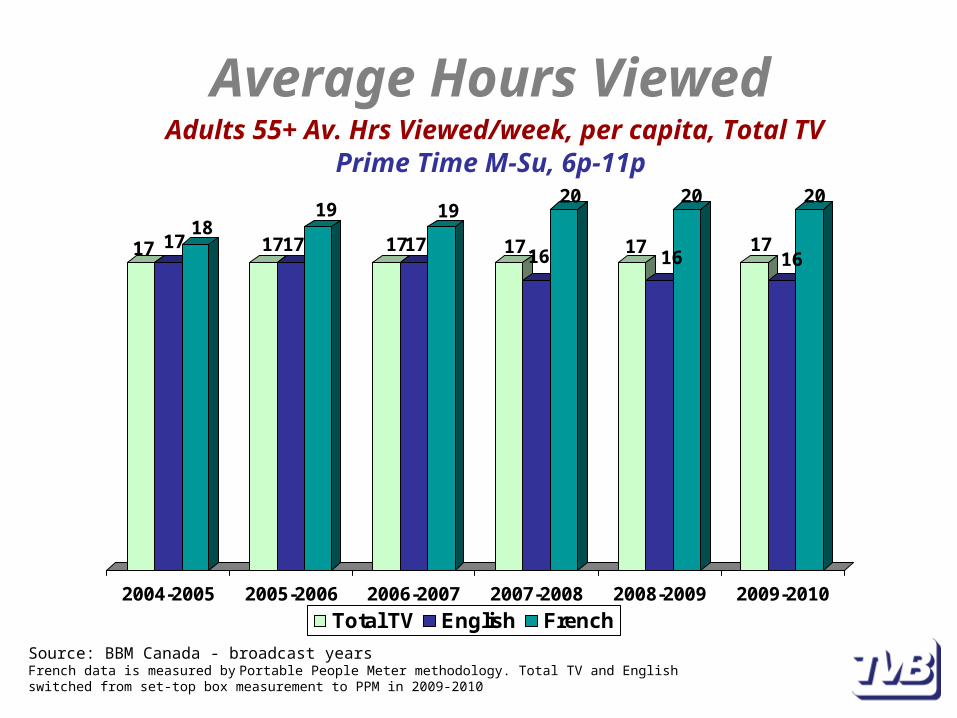
Average Hours Viewed Adults 55+ Av. Hrs Viewed/week, per capita, Total TV
Prime Time M-Su, 6p-11p
17 1718
1717
19
1717
19
1716
20
1716
20
1716
20
2004-2005 2005-2006 2006-2007 2007-2008 2008-2009 2009-2010
Total TV English French
Source: BBM Canada - broadcast yearsFrench data is measured by Portable People Meter methodology. Total TV and English switched from set-top box measurement to PPM in 2009-2010
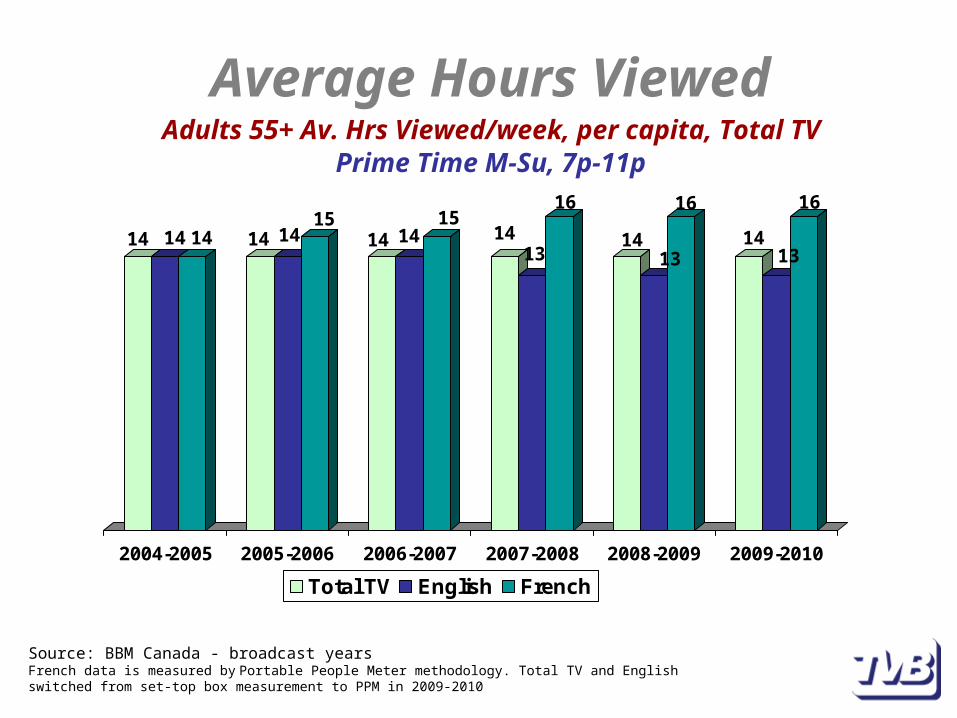
Average Hours Viewed Adults 55+ Av. Hrs Viewed/week, per capita, Total TV
Prime Time M-Su, 7p-11p
14 14 14 14 1415
14 1415
1413
16
1413
16
1413
16
2004-2005 2005-2006 2006-2007 2007-2008 2008-2009 2009-2010
Total TV English French
Source: BBM Canada - broadcast yearsFrench data is measured by Portable People Meter methodology. Total TV and English switched from set-top box measurement to PPM in 2009-2010
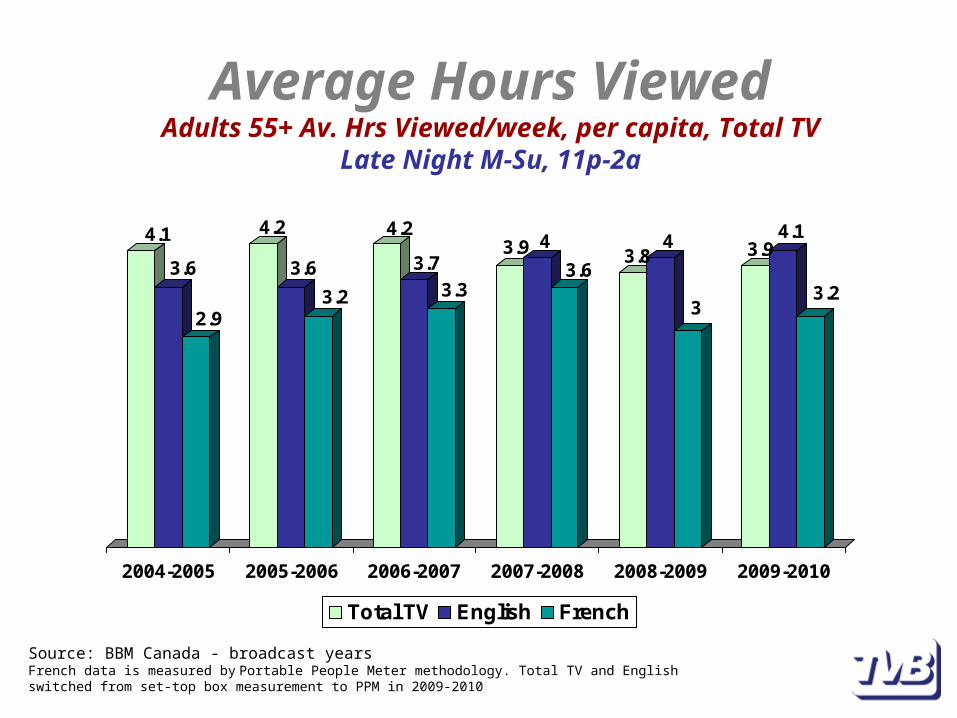
Average Hours Viewed Adults 55+ Av. Hrs Viewed/week, per capita, Total TV
Late Night M-Su, 11p-2a
4.1
3.6
2.9
4.2
3.6
3.2
4.2
3.7
3.3
3.9 4
3.63.8
4
3
3.94.1
3.2
2004-2005 2005-2006 2006-2007 2007-2008 2008-2009 2009-2010
Total TV English French
Source: BBM Canada - broadcast yearsFrench data is measured by Portable People Meter methodology. Total TV and English switched from set-top box measurement to PPM in 2009-2010

![Operating Instructions (French [Canada])help.panasonic.ca/viewing/ALL/KX-TGD390C/OI/TGD390C_PNQX...R L’adaptateur secteur est utilisé comme interrupteur principal. S’assurer que](https://img.pdfslide.net/doc/110x75/5e276d0b182c7712a654f83e/operating-instructions-french-canadahelp-r-laadaptateur-secteur-est-utilis.jpg)