Embed Size (px)
DESCRIPTION
PLC Smart Grid
Citation preview

w w w. a n r i t s u . c o m
White PaperSmart Grid - Power Line Communication
Power Line Communication2
1.0 Introduction
With the rise of smart metering it has become commonplace to transmit critical data over electrical power lines using Power LineCommunication (PLC). Although the transport medium can be considered unconventional for radio communication, PLC is aform of radio frequency (RF) communication. PLC utilises a modulated carrier, typically at low frequencies comparing to mostcommercial radio systems working over an air interface.
The reliability and functionality of any RF link is based on transmitting and receiving data with some specified bit-error-rate atoptimum signal conditions, usually for a specified carrier-to-interference (C/I) ratio. The system will also have to be designed withless-than-ideal signal conditions due to a large distance between the transmitter and receiver. Better signal conditions in thetransmission line result in greater signal range and - in the case of PLC – longer lines being usable for transmission of metereddata.
So, a key factor in building any reliable radio frequency system is establishing a good signal path with low interference. Whatdoes interference have to do with PLC? After all, there should be no other RF signal that is being transmitted in the power linewhich means there should be no interfering signals, right?
In this article we will look at examples of RF interference in specifically PLC as well as how to localise the sources of interference.Anritsu has also produced a number of application notes regarding interference in RF environments which also offer a greatresource of complementary information for any person interested in getting to know this phenomenon a bit deeper
2.0 What causes Interference in PLC?
Interference in itself is quite easy to comprehend. Let’s take an example of two persons having a conversation. In order for thespeech to be intelligible the signal (the voice of the person one is listening to) has to be high enough to reach the receiver (one’sears) so that any possible noise is overcome by a reasonable margin. The interference can be wideband noise like the rumble oftraffic or narrowband like a jackhammer or a police siren, but in any case when the noise level is high enough the signal willbecome unintelligible.
The same simple principle holds true to any RF system. If the interference level is too high the receiver will not be able to “hear”the transmitter and the link between them will not function. The signal level vs. the amount of interference at the receiver is thekey factor: this is the C/I ratio.
Different receivers will also act in different ways. Some receivers will have been designed with interference suppression in mindand will be very narrow-band, meaning they will not “hear” anything far away from their own carrier frequency. For this kind ofreceiver the interference outside of the signal band is all but meaningless but interference within the signal band will be aproblem. If, on the other hand, the receiver has no filtering of out-of-band signals and thus works on a relatively high bandwidthit will “hear” almost everything that’s thrown at it. In this case a strong interfering signal may block communication even if it isseemingly far away from the system’s carrier frequency.

w w w. a n r i t s u . c o m3
2.1 PLC system principles
A normal PLC metering system will look like something in the picture below. Each user will have their own energy meter whichwill communicate with a hub, usually located at the transformer. The PLC communication used for this is described as the bluelines. The hub will then use a radio modem (ex. GPRS) to transmit the data to the utility company via the air interface. The amountof installed meters per hub can be in the order of hundreds where as a single utility may have anywhere between thousands tomillions of metering units installed in the field.
There are many standards implemented for PLC around the world but most technologies employed use a frequency range ofabout 10 – 150 kHz (Europe), or 150 – 400/500 kHz (Japan/USA) .
As the air interface is usually the concern of a mobile operator most utilities will not have to worry about interference over theair. If this is not the case we recommend also reading the aforementioned documents related to finding interference in radionetworks.
However interference in the power line may, and often will, become an issue especially when the amount of installed meters islarge. So what will cause interference in the power line? The sources of interference are many but the most common sourcesinclude but are not limited to:
1. Switch-mode power supplies
2. Electrical engines and their drives such as frequency converters
3. Other types of switching and dimming devicesMany other devices, especially failing/broken ones or poorly designed ones can cause interference.
The interference can be a signal at a particular frequency or a number of frequencies (usually switch-mode power supplies willexhibit this behaviour) or wideband noise (often the case with frequency converters) or even a combination of both.
3
Figure 1: Diagram of a PLC system
4 Power Line Communication4
2.1 PLC vs. EMC
Electromagnetic Compatibility (EMC) regulation normally limits interfering emissions from electronic devices but most EMCstandards have a lower frequency limit of 150 kHz. This means that especially the European PLC frequency band is largelyuncontrolled when it comes to conducted emissions of connected equipment.
3.0 Recognizing the interference
So what does interference look like? The frequency of an interfering signal is the most common parameter leading to theidentification of the interfering source. Thus, an interference problem can often be categorized by its frequency characteristics.
It should be noted that whether the interfering signal is in-band or out-of-band, the signal is almost certainly coming through theantenna, down the cable, and into the affected receiver. Therefore, a spectrum analyzer connected to the operating systemantenna will serve as a substitute measuring receiver which will display and help identify unwanted signals. Remember that thesystem’s band pre-selection filters are inside its receiver, so many out-of-band signals are naturally present at its antenna inputconnector.
Interference generally only affects receiver performance. Although it is possible that a source of interference can be physicallyclose to a transmitter, the characteristics of the transmitted signal will not be affected. Thus, the first step in recognizing ifinterference has corrupted a receiver is to learn the characteristics of the signal that the affected system is intended to receive.
By analyzing the frequency domain using a spectrum analyzer the signal frequency, power, harmonic content, modulation quality,distortion and noise or interference can easily be measured. If interference is overlapping the intended receiver signal, it will berelatively obvious on the spectrum analyzer display.
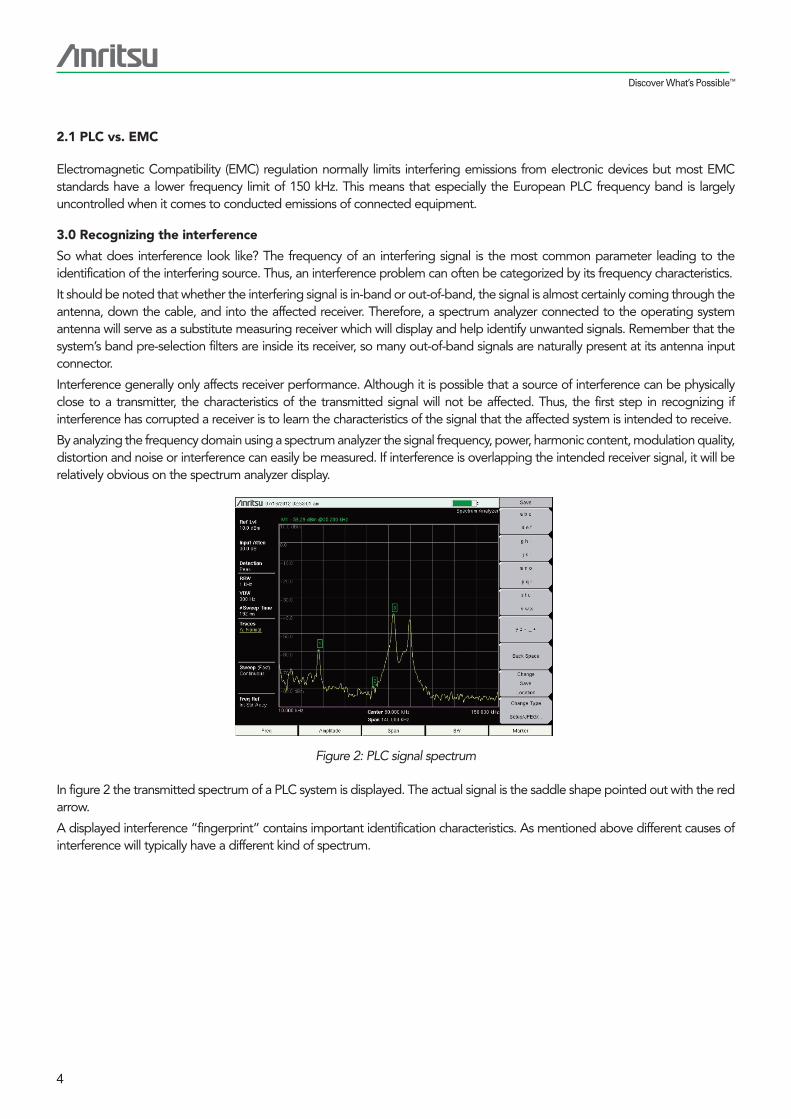
In figure 2 the transmitted spectrum of a PLC system is displayed. The actual signal is the saddle shape pointed out with the redarrow.
A displayed interference “fingerprint” contains important identification characteristics. As mentioned above different causes ofinterference will typically have a different kind of spectrum.
Figure 2: PLC signal spectrum

5
w w w. a n r i t s u . c o m5
Let’s look at figure 3 as one example In the picture above a spectrum measured from a power line feed at a transformer stationis displayed. It is easy to differentiate the saddle shape of the PLC hub trying to communicate with the energy meters but as canbe seen there is also plenty of interference present. The highest amplitude interferer is right on top of the PLC signal, representedwit marker 5. Without the PLC present the signal environment looks like this:
In figure 4 we can see that the strongest interference is a single frequency peak which leads us to the conclusion that it may bea switch-mode power supply operating somewhere close. In this case it was found that in an adjacent building there was a mobilebase station with a large power supply running it. The power supply was turned off in order to verify the signal source and theresult was a somewhat cleaner spectrum.
Figure 3: PLC signal with interference
Figure 4: interference spectrum

6 Power Line Communication6
The resultant spectrum is cleaner as the overall noise floor at the operating frequency of the system is considerably lower (byabout 10 – 20 dB) but also the main interfering signal is removed. However it was found that under the main interferer there wasadditional interference at a slightly lower frequency. The diagnostics continued to make sure this interference was also found.
4.0 Selecting the Appropriate Test Equipment
The most useful and accurate tool for qualitative and quantitative analysis of RF and interference in the field is the broadband,hand held spectrum analyzer. The Anritsu Spectrum Master handheld spectrum analyzer is such a tool that features powerfuluser-convenience parameters (soft keys), data manipulation and storage capabilities.
The spectrum analyser to be chosen should deliver a few key features to be effective in hunting down the interference:
4.1 Spectrum Analyzer features
What do we need to know about a spectrum analyzer to make sure that we can measure the signal environment adequately?Very basically, we need to know the frequency range, sensitivity, dynamic range, frequency resolution and accuracy.
Frequency Range – Frequency range should be the easiest criteria, since you have a good idea of your system’s frequency bandand hence the spectrum span you want to observe. For PLC measurements you will need a lower frequency limit of 10 kHz orbelow. The higher frequency limit is usually not a concern as most modern handheld spectrum analyzers cover a range of up to3 GHz at minimum but if one desires also to measure wireless RF links it is beneficial to have the frequency coverage to allowfor it.
Sensitivity – As the attenuation of power lines is quite high you will need a very sensitive instrument to be able to measure thePLC communication and interference when they are far from the measurement point. This is especially important as thetechnique to “hunt” for the interference is based on physically following the interfering signal along the power line cabling.
Frequency Resolution, Dynamic Range, and Sweep Time – Frequency resolution, dynamic range, and sweep time are inter-related. Think of resolution as the shape of a scanning “window” which sweeps across an unknown band of signals. Spectrumanalyzers provide for selectable resolutions, and call it resolution bandwidth (RBW). Resolution becomes important when you aretrying to measure signals that occur close together in frequency, and you need to be able to distinguish one from the other.Basically the narrower the lowest resolution bandwidth available, the better.
Figure 5: Resultant spectrum

7w w w. a n r i t s u . c o m7
Selectivity – In some interference applications, there will be signals that have amplitudes that are quite unequal. In this case,“selectivity” becomes an important criteria. It is very possible for the smaller of the two signals to become buried under the filterskirt of the larger signal.
Measurement and trace features – Additional processing for the signals may be needed in order to differentiate the sourceof the interference. The following features are desirable additions to a spectrum analyser that is used for hunting interference inpower lines.
• Multiple traces, trace math and trace operations such as max hold will enable the user to easily detect changes insignal conditions between different cables and, for example, when switching off possible sources of interference(see figure 6 below)
• Zero Span mode will allow the user to look at the interfering signal in time domain, thus making it possible todifferentiate a switch-mode power supply (having a particular duty cycle) from other types of narrow-bandinterference (being continuous in nature)
• Multiple markers and marker tabling will allow the user to continuously monitor several frequency points as themeasurements are being made
• A Spectrogram display (displaying spectrum over time) will allow the user to monitor changes in the signal over alonger period of time.
Figure 6: Max hold trace vs. Live trace
8 | Power Line Communication8
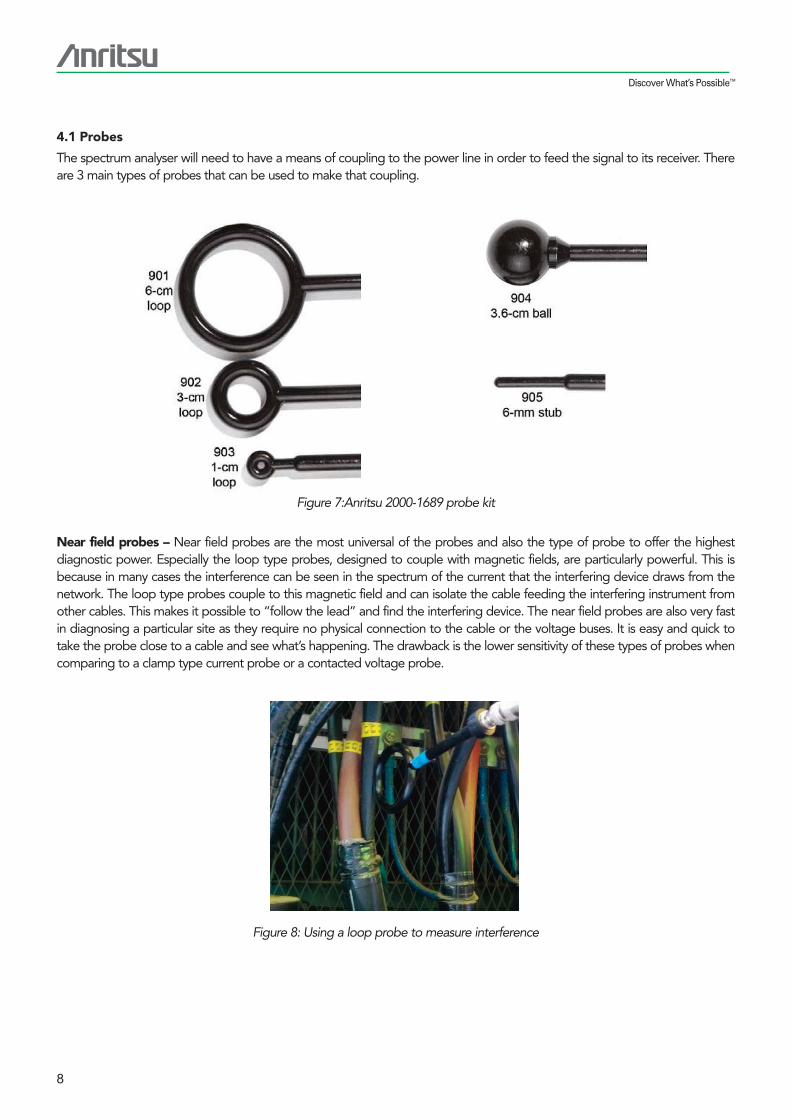
4.1 Probes
The spectrum analyser will need to have a means of coupling to the power line in order to feed the signal to its receiver. Thereare 3 main types of probes that can be used to make that coupling.
Near field probes – Near field probes are the most universal of the probes and also the type of probe to offer the highestdiagnostic power. Especially the loop type probes, designed to couple with magnetic fields, are particularly powerful. This isbecause in many cases the interference can be seen in the spectrum of the current that the interfering device draws from thenetwork. The loop type probes couple to this magnetic field and can isolate the cable feeding the interfering instrument fromother cables. This makes it possible to “follow the lead” and find the interfering device. The near field probes are also very fastin diagnosing a particular site as they require no physical connection to the cable or the voltage buses. It is easy and quick totake the probe close to a cable and see what’s happening. The drawback is the lower sensitivity of these types of probes whencomparing to a clamp type current probe or a contacted voltage probe.
Figure 7:Anritsu 2000-1689 probe kit
Figure 8: Using a loop probe to measure interference
9w w w. a n r i t s u . c o m9
Clamp type current probes– Clamp type probes differ from the above mentioned near-field probes in that they are clampedonto the cable being measured. Because the cable, and thus all of the current that it carries, passes through the clamp it offersbetter coupling to the signal and thus greater sensitivity (about 10 – 20 dB) than the near field loop probe. However using theclamp type probe is sometimes slow, cumbersome and often even dangerous as it needs to be clamped onto live electricalfeeds.
Contacted voltage probes – This probe type is contacted directly onto the voltage bus of the power station and is thus probablythe most dangerous probe type and requires extreme caution and expertise. However when used properly it gives a very goodlook at everything that is happening in that particular voltage bus and offers high sensitivity. However the voltage probe cannotdifferentiate between the cables as the voltage will be exactly the same at a given point and thus has less diagnostic power thanthe current probes mentioned above
5.0 Interference hunting in PLC
In normal over-the-air Radio Frequency telecommunication finding and localising the interference is often very time consuming.The interferer may be intermittent and there is no physical connection between the receiver and the interference. In PLCcommunication the situation is simplified because there is always a wired connection between the receiver and the transmitter.It is at the end of one of these wires where the cause of the interference must be.
In a typical case there will be a number of smart meters down in a particular area. Next we will introduce a basic method to findthe source of interference.
5.1 Start at the root – follow the current
The typical simplified PLC grid topology will look something like a tree. The PLC hub will be located at the transformer stationwhere the power lines will be distributed to different areas. The lines will again be split at distribution boxes to different buildingsand possibly again to different apartments inside the buildings.
The most effective way to find the interferer is to measure the spectrum from the current - not the voltage – of the circuits. Thevoltage at a given point will be essentially the same in all of the circuit but the currents will vary. The current draw of the interfererwill in most cases contain the interference spectrum and can thus be pinpointed.
So, start your hunt at the transformer and measure each line (phase) with a current probe, i.e. a loop or a clamp as describedabove. When you find the line with the highest amplitude of the interfering signal you will know where to go next. Follow theline (and the current) down to the next junction where it is split and repeat the above procedure. Repeat until you know whichbuilding the interference is coming from.
Once you are in the building things get slightly more challenging but still the same methodology applies: Scan the lines with theloop probe to see where the signal is coming from. Take the loop close to the power supply or the supply line of different devices.You will be able to see quite clearly if the interference comes from that particular device. When you have filtered the source downto a manageable amount of possibilities you can start trying to shut devices down to see what kind of an effect it has on theinterference levels. This will allow you to verify which device/devices are causing the interference and what could be done tominimise or remove it altogether.
6.0 Conclusion
PLC communication is a robust and easily deployable system for smart metering. However, as all RF communication systems itis susceptible to interference. What’s more, the frequency range where PLC most commonly operates is commonly not specifiedin EMC regulation. This adds to the probability of finding interfering components being connected into the power grid. It isimportant for the utility company to be able to diagnose the sources of interference in their smart metering network in a fast andefficient manner in order to avoid the cost of not being able to monitor the grid. Anritsu’s lineup of handheld spectrum analyzers,when used with the correct type of probe, provide a simple and economical tool that makes it possible for engineers to pinpointthe sources of interference in their network.

• United StatesAnritsu Company1155 East Collins Blvd., Suite 100, Richardson, TX 75081, U.S.A.Toll Free: 1-800-267-4878Phone: +1-972-644-1777Fax: +1-972-671-1877
• CanadaAnritsu Electronics Ltd.700 Silver Seven Road, Suite 120, Kanata, Ontario K2V 1C3, CanadaPhone: +1-613-591-2003 Fax: +1-613-591-1006
• Brazil Anritsu Eletrônica Ltda.Praça Amadeu Amaral, 27 - 1 Andar01327-010 - Bela Vista - São Paulo - SP - BrazilPhone: +55-11-3283-2511Fax: +55-11-3288-6940
• MexicoAnritsu Company, S.A. de C.V.Av. Ejército Nacional No. 579 Piso 9, Col. Granada11520 México, D.F., MéxicoPhone: +52-55-1101-2370Fax: +52-55-5254-3147
• United KingdomAnritsu EMEA Ltd.200 Capability Green, Luton, Bedfordshire, LU1 3LU, U.K.Phone: +44-1582-433200 Fax: +44-1582-731303
• FranceAnritsu S.A.12 avenue du Québec, Bâtiment Iris 1- Silic 612,91140 VILLEBON SUR YVETTE, FrancePhone: +33-1-60-92-15-50Fax: +33-1-64-46-10-65
• GermanyAnritsu GmbHNemetschek Haus, Konrad-Zuse-Platz 1 81829 München, Germany Phone: +49-89-442308-0 Fax: +49-89-442308-55
• ItalyAnritsu S.r.l.Via Elio Vittorini 129, 00144 Roma, ItalyPhone: +39-6-509-9711 Fax: +39-6-502-2425
• SwedenAnritsu ABBorgarfjordsgatan 13A, 164 40 KISTA, SwedenPhone: +46-8-534-707-00 Fax: +46-8-534-707-30
• FinlandAnritsu ABTeknobulevardi 3-5, FI-01530 VANTAA, FinlandPhone: +358-20-741-8100Fax: +358-20-741-8111
• DenmarkAnritsu A/S (Service Assurance)Anritsu AB (Test & Measurement)Kay Fiskers Plads 9, 2300 Copenhagen S, DenmarkPhone: +45-7211-2200Fax: +45-7211-2210
• RussiaAnritsu EMEA Ltd. Representation Office in RussiaTverskaya str. 16/2, bld. 1, 7th floor.Russia, 125009, MoscowPhone: +7-495-363-1694Fax: +7-495-935-8962
• United Arab EmiratesAnritsu EMEA Ltd.Dubai Liaison OfficeP O Box 500413 - Dubai Internet CityAl Thuraya Building, Tower 1, Suit 701, 7th FloorDubai, United Arab EmiratesPhone: +971-4-3670352Fax: +971-4-3688460
• SingaporeAnritsu Pte. Ltd.60 Alexandra Terrace, #02-08, The Comtech (Lobby A)Singapore 118502Phone: +65-6282-2400Fax: +65-6282-2533
• IndiaAnritsu India Private Limited. India Branch Office2nd & 3rd Floor, #837/1, Binnamangla 1st Stage, Indiranagar, 100ft Road, Bangalore - 560038Phone: +91-80-4058-1300Fax: +91-80-4058-1301
• P.R. China (Shanghai)Anritsu (China) Co., Ltd.Room 1715, Tower A CITY CENTER of Shanghai, No.100 Zunyi Road, Chang Ning District, Shanghai 200051, P.R. ChinaPhone: +86-21-6237-0898Fax: +86-21-6237-0899
• P.R. China (Hong Kong)Anritsu Company Ltd.Unit 1006-7, 10/F., Greenfield Tower, Concordia Plaza,No. 1 Science Museum Road, Tsim Sha Tsui East, Kowloon, Hong Kong, P.R. ChinaPhone: +852-2301-4980Fax: +852-2301-3545
• JapanAnritsu Corporation8-5, Tamura-cho, Atsugi-shi, Kanagawa, 243-0016 JapanPhone: +81-46-296-1221Fax: +81-46-296-1238
• KoreaAnritsu Corporation, Ltd.502, 5FL H-Square N B/D, 681Sampyeong-dong, Bundang-gu, Seongnam-si, Gyeonggi-do, 463-400 KoreaPhone: +82-31-696-7750Fax: +82-31-696-7751
• AustraliaAnritsu Pty. Ltd.Unit 21/270 Ferntree Gully Road, Notting Hill, Victoria 3168, AustraliaPhone: +61-3-9558-8177Fax: +61-3-9558-8255
• TaiwanAnritsu Company Inc.7F, No. 316, Sec. 1, NeiHu Rd., Taipei 114, TaiwanPhone: +886-2-8751-1816Fax: +886-2-8751-1817
Specifications are subject to change without notice.
1202
Printed on Recycled Paper
Please Contact:
No. MG3710A-E-L-1-(1.00) Printed in Japan 2012-3 MG


![NGET An.nn [document title] - National Grid plc](https://img.pdfslide.net/doc/110x75/623fdf194029604cc2040bbc/nget-annn-document-title-national-grid-plc.jpg)