Embed Size (px)
Citation preview

Annual Report
November 2020 - Scientific Edition
Sal
es S
urve
y of
Vet
erin
ary
Pro
duct
s C
onta
inin
g A
ntim
icro
bial
s in
Fra
nce
in 2
019
Sales Survey of Veterinary Medicinal Products Containing
Antimicrobials in France in 2019


Sales Survey of Veterinary Medicinal Products Containing
Antimicrobials in France in 2019
Annual Report
November 2020 - Scientific Edition


ANSES • annual report Veterinary medicinal products containing antimicrobials in France in 2019
Sales Survey of Veterinary Medicinal Products Containing
Antimicrobials in France in 2019
Authors: French Agency for Food, Environmental and Occupational Health & Safety (ANSES) – French Agency for Veterinary Medicinal Products (ANMV)
Delphine Urban, Anne Chevance and Gérard Moulin, ANSES-ANMV
Citation:
ANSES 2020. Sales Survey of Veterinary Medicinal Products Containing Antimicrobials in France in 2019, ANSES-ANMV, France, November 2020, Report, 97 pp.


ANSES • annual report Veterinary medicinal products containing antimicrobials in France in 2019
1
CONTENTS
CONTENTS ............................................................................................................................................. 1
I. Abstract ........................................................................................................................................ 6
II. Introduction ................................................................................................................................ 10
III. Materials and methods .............................................................................................................. 11
1. Data used in this report ............................................................................................................. 11
2. Calculations and interpretation of indicators ............................................................................. 12
3. Important points concerning the 2019 annual report ................................................................. 13
IV. Tonnages of antimicrobials sold and exposure indicators in 2019 ............................................ 15
1. Tonnages by antimicrobial class and route of administration ................................................... 15
2. Tonnages by species ................................................................................................................. 16
3. Indicators by antimicrobial class and route of administration .................................................... 16
4. Indicators by species ................................................................................................................. 18
V. Change in sales and exposure to antimicrobials between 1999 and 2019 ............................... 19
1. Milestone years in the national monitoring scheme .................................................................. 19
2. Change in sales and exposure to antimicrobials by pharmaceutical form ................................ 19
3. Change in sales and exposure to antimicrobials by class ......................................................... 22
VI. Change in exposure to antimicrobials by species ..................................................................... 26
1. Cattle ......................................................................................................................................... 26
2. Pigs ............................................................................................................................................ 31
3. Poultry ........................................................................................................................................ 35
4. Rabbits ....................................................................................................................................... 39
5. Domestic carnivores .................................................................................................................. 43
VII. Update on exposure to fluoroquinolones, third- and fourth-generation cephalosporins and colistin
47
1. Background................................................................................................................................ 47
2. Change in exposure to fluoroquinolones ................................................................................... 47
3. Change in exposure to newer-generation cephalosporins ........................................................ 51
4. Change in exposure to colistin .................................................................................................. 54
VIII. Comparison of exposure calculations and indicators between the French and European
approaches ............................................................................................................................................ 60

ANSES • annual report Veterinary medicinal products containing antimicrobials in France in 2019
2
1. Publication of the DDDvet and DCDvet values by the ESVAC ................................................. 60
2. Differences in the calculations between the French and European approaches ...................... 60
3. Comparison by species for 2019 ............................................................................................... 60
4. Change in exposure indicators since 2011 ............................................................................... 62
IX. Discussion ................................................................................................................................. 64
1. Indicators of sales and indicators of exposure .......................................................................... 64
2. Systems for collecting data on antimicrobials used in animals ................................................. 64
3. Change in exposure of animals to antimicrobials ...................................................................... 66
X. Conclusion ................................................................................................................................. 68
XI. Annexes ..................................................................................................................................... 69
1. Animal population data .............................................................................................................. 70
2. Change in sales and exposure to antimicrobials between 1999 and 2019 ............................... 76
3. Change in exposure to antimicrobials by species ..................................................................... 82

ANSES • annual report Veterinary medicinal products containing antimicrobials in France in 2019
3
Table of illustrations
Figure 1: Relative average proportions of pharmaceutical forms in the body weight treated by different classes of antimicrobials in 2019 ........................................................................................................... 17
Figure 2: Change in ALEA by pharmaceutical form since 1999............................................................ 21
Figure 3: Comparison of the ALEA by antimicrobial class in 2011 and 2019 ....................................... 23
Figure 4: Change in animal exposure in France by antimicrobial class since 2011 (ALEA) ................. 24
Figure 5: Comparison of the ALEA for cattle by antimicrobial class in 2011 and 2019 ........................ 26
Figure 6: Change in exposure of cattle by antimicrobial class since 2011 (ALEA) ............................... 27
Figure 7: Change in exposure of cattle by administration route since 1999 (ALEA) ............................ 29
Figure 8: Change in the number of intramammary treatments per dairy cow during the lactation period and at dry-off since 1999 ....................................................................................................................... 30
Figure 9: Comparison of the ALEA for pigs by antimicrobial class in 2011 and 2019 .......................... 31
Figure 10: Change in exposure of pigs by antimicrobial class since 2011 (ALEA) ............................... 32
Figure 11: Change in exposure of pigs by pharmaceutical form since 1999 (ALEA)............................ 34
Figure 12: Comparison of the ALEA for poultry by antimicrobial class in 2011 and 2019 .................... 35
Figure 13: Change in exposure of poultry by antimicrobial class since 2011 (ALEA) ........................... 36
Figure 14: Change in exposure of poultry by pharmaceutical form since 1999 (ALEA) ....................... 38
Figure 15: Comparison of the ALEA for rabbits by antimicrobial class in 2011 and 2019 .................... 39
Figure 16: Change in exposure of rabbits by antimicrobial class since 2011 (ALEA) ........................... 40
Figure 17: Change in exposure of rabbits by pharmaceutical form since 1999 (ALEA) ....................... 42
Figure 18: Comparison of the ALEA for cats & dogs by antimicrobial class in 2011 and 2019 ............ 43
Figure 19: Change in exposure of domestic carnivores by antimicrobial class since 2011 (ALEA) ..... 44
Figure 20: Change in exposure of domestic carnivores by routes of administration since 1999 (ALEA) ............................................................................................................................................................... 46
Figure 21: Change in exposure to fluoroquinolones (ALEA) ................................................................. 48
Figure 22: Change in body weight treated with fluoroquinolones according to the species (in tonnes) 49
Figure 23: Change in the ALEA for fluoroquinolones as a percentage of total ALEA per species ....... 50
Figure 24: Change in exposure to newer-generation cephalosporins (ALEA) ...................................... 51
Figure 25: Change in body weight treated with newer-generation cephalosporins (in tonnes) ............ 52
Figure 26: Change in the ALEA for third- and fourth-generation cephalosporins as a percentage of total ALEA per species .................................................................................................................................. 53
Figure 27: Change in exposure to colistin according to the pharmaceutical form (ALEA) .................... 54
Figure 28: Change in body weight treated with colistin according to the species (in tonnes) ............... 55
Figure 29: Change in body weight treated by colistin-based premixes (tonnes) .................................. 55
Figure 30: Change in body weight treated by oral forms (excluding premixes) based on colistin (tonnes) ............................................................................................................................................................... 56
Figure 31: Change in body weight treated parenterally with colistin (in tonnes) ................................... 57

ANSES • annual report Veterinary medicinal products containing antimicrobials in France in 2019
4
Figure 32: Change in cumulative exposure to colistin for cattle, pigs and poultry ................................ 58
Figure 33: Change in the ALEA for colistin as a percentage of total ALEA per species ....................... 59
Figure 34: Comparison of body weight treated in 2019 according to the French and European approaches (tonnes) .............................................................................................................................. 61
Figure 35: Comparison of body weight treated-day in 2019 according to the French and European approaches (tonnes) .............................................................................................................................. 61
Figure 36: Change in body weight treated since 2011 according to the French and European approaches (tonnes).................................................................................................................................................. 62
Figure 37: Change in body weight treated-day since 2011 according to the French and European approaches (tonnes) .............................................................................................................................. 63
Table 1: Breakdown of sales for 2019 in tonnage of active ingredient for each antimicrobial class by route of administration ........................................................................................................................... 15
Table 2: Breakdown of sales for 2019 between the different species in tonnage of active ingredient and quantity of active ingredient per kilogram of body weight ..................................................................... 16
Table 3: Body weight treated in 2019 according to the classes of antimicrobials and routes of administration (in tonnes) ...................................................................................................................... 17
Table 4: Breakdown of sales for 2019 between the different species in tonnage of body weight treated and ALEA exposure indicator ................................................................................................................ 18
Table 5: Change in the indicator of exposure by pharmaceutical form (ALEA) .................................... 20
Table 6: Change in sales by antimicrobial class since 1999 in mg of active ingredient per kilogram of body weight (mg/kg) .............................................................................................................................. 22
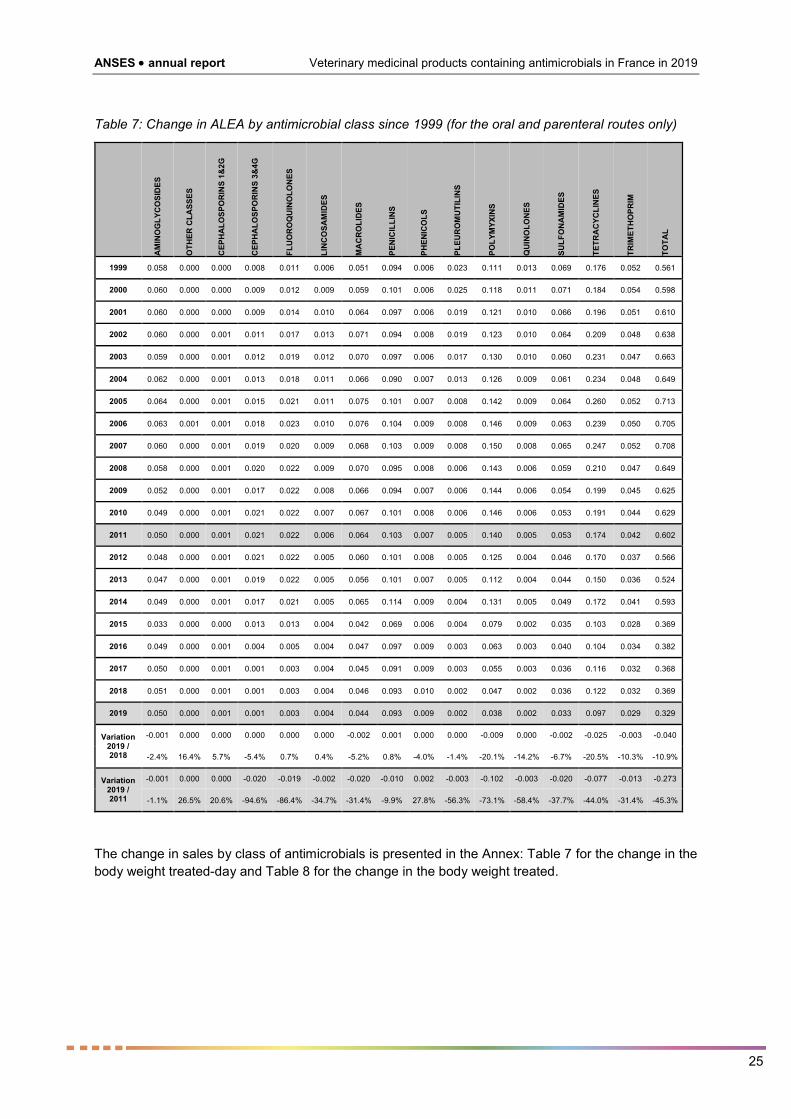
Table 7: Change in ALEA by antimicrobial class since 1999 (for the oral and parenteral routes only) 25
Table 8: Change in exposure of cattle by antimicrobial class since 1999 (for the oral and parenteral routes only) ............................................................................................................................................ 28
Table 9: Change in exposure of pigs by antimicrobial class since 1999 (ALEA calculated for the oral and parenteral routes only) ........................................................................................................................... 33
Table 10: Change in exposure of poultry by antimicrobial class since 1999 (ALEA calculated for the oral and parenteral routes only).................................................................................................................... 37
Table 11: Change in exposure of rabbits by antimicrobial class since 1999 (ALEA calculated for the oral and parenteral routes only).................................................................................................................... 41
Table 12: Change in exposure of domestic carnivores by antimicrobial class since 1999 (ALEA calculated for the oral and parenteral routes only) ................................................................................ 45
Table 13: Change in exposure to fluoroquinolones between 2013 and 2019 according to the species49
Table 14: Change in exposure to fluoroquinolones between 2018 and 2019 according to the species50
Table 15: Change in exposure to third- and fourth-generation cephalosporins between 2013 and 2019 according to the species ........................................................................................................................ 52
Table 16: Change in exposure to third- and fourth-generation cephalosporins between 2018 and 2019 according to the species ........................................................................................................................ 52
Table 17: Change in the quantities of colistin sold according to the European indicator (mg/PCU) ..... 57
ANSES • annual report Veterinary medicinal products containing antimicrobials in France in 2019
5
Table 18: Change in colistin exposure according to species, comparing the 2019 ALEA with the average ALEA for 2014-2015 .............................................................................................................................. 58

ANSES • annual report Veterinary medicinal products containing antimicrobials in France in 2019
6
I. Abstract
The French Agency for Veterinary Medicinal Products (ANSES-ANMV) has been monitoring sales of veterinary antimicrobials in France since 1999. This monitoring is carried out according to the standards defined in Chapter 6.9 of the OIE's Terrestrial Animal Health Code: "Monitoring of the quantities and usage patterns of antimicrobial agents used in food-producing animals".
This monitoring of antimicrobial sales is based on reporting by holders of marketing authorisations (MAs) in accordance with the provisions of Article L. 5141-14-1 of the French Public Health Code, in conjunction with the French Union for the Veterinary Medicinal Product and Reagent Industry (SIMV).
The companies also provide an estimated breakdown of the drugs sold by target species.
The information collected from the pharmaceutical companies covers 100% of authorised drugs in France1.
The information gathered in the context of this national monitoring scheme is one of the essential elements, together with monitoring of bacterial resistance, needed for assessing the risks associated with antimicrobial resistance.
Background
The first EcoAntibio 2012-2016 plan was published in November 2011. This aimed to reduce the use of antimicrobials by 25% in five years, with particular attention being paid to the use of antimicrobials of critical importance in veterinary and human medicine. The main objective of the first plan was met, with a 36.5% decrease in animal exposure to antibiotics during this five-year period.
The Act on the future of agriculture, food and forestry (LAAAF2, Act No. 2014-1170 of 13 October 2014) added specific objectives for antimicrobials of critical importance in human medicine. It thus set a target of a 25% reduction in three years in the use of antimicrobials belonging to the classes of fluoroquinolones and third- and fourth-generation cephalosporins, with 2013 being the reference year. This objective was achieved and even greatly exceeded in 2016.
The second EcoAntibio 2017-2021 plan aims to ensure that the decline in animal exposure to antibiotics is sustained. It provides for communication and training measures, access to alternatives to antimicrobials, and improved prevention of animal diseases. A specific objective for colistin is a 50% reduction in exposure to this antibiotic in five years, in the cattle, pig and poultry sectors.
Tonnage of active ingredient sold
In 2019, the total sales volume for antimicrobials amounted to 422 tonnes, a fall of 10.5% compared to 2018 (472 tonnes).
This was the lowest tonnage recorded since monitoring began in 1999 (1311 tonnes). A 53.3% reduction can also be observed compared to 2011, the reference year for the first EcoAntibio plan. This trend is largely attributable to lower sales of orally administered antimicrobials.
1 The off-label use of veterinary medicinal products is partly taken into consideration in the manufacturers’ reports. Exceptional prescription and off-label use of human drugs or extemporaneous preparations containing antimicrobials under the provisions of the cascade approach (Article L. 5143-4 of the French Public Health Code) is not taken into account. 2 http://www.legifrance.gouv.fr/affichLoiPubliee.do;jsessionid=5691BBA0E2987B8FCBB6195E53853F64.tpdjo07v_2?type=general&idDocument=JORFDOLE000028196878

ANSES • annual report Veterinary medicinal products containing antimicrobials in France in 2019
7
Exposure to antimicrobials
Given the differences in potency and dose between different drugs, the sales in weight of antimicrobials do not accurately reflect their use. Recent antimicrobials are generally more potent and require the administration of a smaller dose of active ingredient.
To assess animal exposure to antimicrobials, it is necessary to consider the dosage and duration of administration, but also changes in the animal population over time.
By comparing the estimates of body weight treated with the mass of the animal population potentially treated with antimicrobials, we obtain an estimate of the level of exposure (ALEA: Animal Level of Exposure to Antimicrobials). This indicator is correlated with the percentage of animals treated relative to the total population and is an objective indicator of exposure to antimicrobials.
Compared to 2011, overall exposure of animals has decreased by 45.3%: by 74.4% for medicated premixes, 51.4% for oral powders and solutions, and 15.2% for injections. Exposure to antimicrobials has declined for all species compared to 2011: -25.5% for cattle, -54.0% for pigs, -60.5% for poultry, -41.4% for rabbits and -13.9% for domestic carnivores. The number of intramammary treatments per dairy cow has decreased by 31.4% since 2011.
The sharp drop observed since 2011 has continued and overall animal exposure fell by 10.9% between 2018 and 2019. Over the last year, the change in exposure has varied according to the species: -9.9% for cattle, -16.4% for pigs, -12.8% for poultry, +1.5% for rabbits and +2.1% for domestic carnivores. Between 2018 and 2019, exposure fell by 16.7% for oral powders and solutions, 6.6% for medicated premixes and 6.0% for injections. The ALEA declined mainly for tetracyclines and polymyxins (oral and parenteral routes combined). The number of intramammary treatments per dairy cow has decreased by 15.4% since 2018.
In 2019, animal exposure to antimicrobials reached its lowest level since 1999. After a sharp decline in the ALEA between 2011 and 2016, there has been a relative stabilisation of animal exposure over the last three years for most classes of antimicrobials, with the exception of tetracyclines and polymyxins.
Exposure to fluoroquinolones and newer-generation cephalosporins
Third- and fourth-generation cephalosporins and fluoroquinolones are considered as particularly important in human medicine because they are among the only alternatives for the treatment of certain infectious diseases in humans.
The Act on the future of agriculture, food and forestry had set a target of a 25% reduction in three years in the use of antimicrobials belonging to each of these classes, taking 2013 as the reference year. A reduction in exposure to antimicrobials of critical importance was observed for all species compared to 2013. These encouraging results followed publication of a Decree and an Interministerial Order in 2016 seeking to regulate the prescription and dispensing of drugs used in veterinary medicine and containing antibiotics of critical importance.
In 2018, animal exposure to newer-generation cephalosporins had fallen by 93.8% compared to 2013. In 2019, the decline in exposure continued, and was estimated to be 94.1% compared to 2013, all species combined. Between 2018 and 2019, a decrease in exposure was observed for all species, except for domestic carnivores (+1.5%). The number of intramammary treatments per dairy cow based on newer-generation cephalosporins decreased by 99.4% between 2013 and 2018. In 2019, this number was higher than in 2018, but there has still been a 98.9% fall since 2013. The increase observed between 2018 and 2019 is explained by a lag in the reported sales figures for 2018 for some drugs, and does not reflect a change in the use of these intramammary treatments.
Regarding fluoroquinolones, in 2018, exposure had declined by 86.1% compared to 2013. In 2019, exposure fell by 86.0% compared to 2013. Indeed, over the last year, a slight increase of 0.7% has been observed: this can be explained by an increase in the use of injections (+2.8% for all species combined).

ANSES • annual report Veterinary medicinal products containing antimicrobials in France in 2019
8
Between 2018 and 2019, exposure to fluoroquinolones increased for cattle, domestic carnivores and horses, while it decreased for pigs and poultry.
Since 2017, the frequency of treatment with critically important antimicrobials has fallen to a very low level. However, despite the significant decrease in the use of these antimicrobials compared to 2013, continued vigilance is needed, and this trend should be monitored over the coming years.
Exposure to colistin
An article published in November 2015 describing the first plasmid-mediated mechanism of resistance to colistin led to the establishment of reinforced surveillance for this antibiotic.
At European level, in July 2016, the Antimicrobial Advice Ad Hoc Expert Group (AMEG)3 recommended reducing the use of colistin within three to four years to no more than 5 mg/PCU (Population Correction Unit) for European countries that are high or moderate consumers, and no more than 1 mg/PCU for European countries with the lowest use of colistin.
In France, in its report4 on colistin published in October 2016, ANSES recommended a 50% reduction in the use of this antimicrobial. Following this opinion, the EcoAntibio2 plan (Action 12) set a five-year goal of a 50% reduction in exposure to colistin in the cattle, pig and poultry sectors, taking the average ALEA for 2014-2015 as a reference.
By 2019, exposure to colistin had fallen by 64.2% compared to the average exposure calculated for 2014 and 2015. Exposure had decreased for pigs (-73.7%), poultry (-58.1%) and cattle (-52.3%) compared to the average exposure for 2014-2015. The objective set by the EcoAntibio 2017-2021 plan to reduce colistin exposure by 50% has therefore been achieved for the pig, poultry and cattle sectors.
Calculating the results in mg/PCU according to the standards defined by the European Surveillance of Veterinary Antimicrobial Consumption (ESVAC) scheme, the value obtained for colistin in 2019 was 1.40 mg/PCU, which is far lower than the 5 mg/PCU threshold advocated by the AMEG.
Conclusion
Following the success of the EcoAntibio 2017 plan, which achieved all of its objectives, the new EcoAntibio 2017-2021 plan aims to ensure that the decline in animal exposure to antibiotics is sustained. The decline observed since 2011 has continued, and overall animal exposure has fallen in the last year. Between 2018 and 2019, the ALEA by species decreased for pigs, poultry and cattle, and increased slightly for domestic carnivores and rabbits.
Exposure to antimicrobials regarded as critical has fallen by 86.0% for fluoroquinolones and 94.1% for newer-generation cephalosporins, compared to 2013. After a sharp decline observed between 2013 and 2016, exposure to critical antimicrobials appears to have stabilised over the last three years.
The objective set by the EcoAntibio 2017-2021 plan to reduce colistin exposure by 50% has been achieved for the cattle, pig and poultry sectors.
Results for 2019 indicate that overall exposure of animals to antimicrobials has fallen compared to 2018. For some classes of antimicrobials, it seems that the reduction in use has reached a limit. It is important
3 http://www.ema.europa.eu/docs/en_GB/document_library/Scientific_guideline/2016/07/WC500211080.pdf 4 https://www.anses.fr/fr/system/files/MV2016SA0160.pdf

ANSES • annual report Veterinary medicinal products containing antimicrobials in France in 2019
9
to monitor antimicrobial uses and assess their consequences on the development of bacterial resistance. The momentum for the prudent and responsible use of antimicrobials in veterinary medicine must be maintained. The EcoAntibio 2 plan aims in particular to consolidate the achievements and pursue the actions previously undertaken in the first national plan.

ANSES • annual report Veterinary medicinal products containing antimicrobials in France in 2019
10
II. Introduction
Antimicrobial resistance is a major public health issue concerning both human and veterinary medicine. Monitoring of sales of antimicrobials is one of the key sources of information used to assess and manage the risks associated with antimicrobial resistance.
ANSES-ANMV has been monitoring sales of veterinary antimicrobials in France since 1999. This monitoring is carried out according to the standards defined in Chapter 6.9 of the OIE's Terrestrial Animal Health Code: "Monitoring of the quantities and usage patterns of antimicrobial agents used in food-producing animals".
France also participates in the European Surveillance of Veterinary Antimicrobial Consumption (ESVAC) scheme, which was launched by the European Medicines Agency (EMA) at the request of the European Commission, with the aim of collecting harmonised data on antimicrobial sales for all countries in the European Union.
In France, the monitoring of antimicrobial sales is based on reporting by holders of marketing authorisations (MAs) in accordance with the provisions of Article L. 5141-14-1 of the French Public Health Code, in conjunction with the French Union for the Veterinary Medicinal Product and Reagent Industry (SIMV). All veterinary antimicrobials sold in France are recorded through this annual monitoring.
This report describes the veterinary antimicrobial sales for 2019 and includes a comparison with results from previous years.

ANSES • annual report Veterinary medicinal products containing antimicrobials in France in 2019
11
III. Materials and methods
1. Data used in this report
Data on sales of medicinal products containing antimicrobials
Monitoring of sales is based on an annual declaration by each marketing authorisation (MA) holder marketing veterinary medicinal products containing antimicrobials authorised in France. Information on the number of units sold for each presentation of each medicinal product is thus sent to ANSES-ANMV. Since 2009, MA holders have also been required to provide information, for each presentation, on the breakdown of sales by target animal species.
The figures collected cover the period from 1 January to 31 December and constitute an exhaustive compilation of the veterinary antimicrobials marketed in France during the calendar year.
To avoid the risk of any reporting errors, sales volumes are compared with annual turnover reported independently by the MA holders. Any discrepancies are investigated. Significant differences compared to previous years are also subject to a specific audit.
Data on French animal populations
To take account of fluctuations in the animal population when interpreting the data, the information published by Agreste5 is used for food-producing animals.
For domestic pets, data are provided by statistics from FACCO6, the French trade federation of food manufacturers for dogs, cats, birds and other pets, which are published every two years.
The data published by the French Horse and Riding Institute7 (IFCE) are used to determine the numbers of Equidae.
For fish, the national production data come from a report published by the Federation of European Aquaculture Producers8 (FEAP).
In order to evaluate the biomasses of animals potentially treated with antimicrobials, different weights have been selected: the weights of adult animals for those with a life cycle of more than one year, and the weights at slaughter for the others.
The data on animal populations used for this report are available in the Annex (Table 1 and Table 2).
Data on veterinary medicinal products containing antimicrobials
A variety of information on medicinal products containing antimicrobials is available in the index of veterinary medicinal products authorised in France9. Some data from the Summary of Product Characteristics (SPC) have been used for each veterinary drug:
- qualitative and quantitative composition in antimicrobials,
- pharmaceutical form,
- dosage and route of administration.
5 http://agreste.agriculture.gouv.fr/ 6 http://www.facco.fr/ 7 https://www.ifce.fr/ 8 http://feap.info/ 9 http://www.ircp.anmv.anses.fr/

ANSES • annual report Veterinary medicinal products containing antimicrobials in France in 2019
12
For each drug and each species, the dosage selected is the one defined in the MA:
- the daily dose, expressed in mg of antimicrobials per kg of body weight treated,
- the duration of treatment, expressed in days.
In the framework of this national monitoring programme, when multiple doses and durations are described in the SPC for the same species, dosing data have been used, according to the following rules:
- When multiple doses are possible, the highest dose was chosen, for the drug’s main indication.
- When multiple treatment durations are possible, the longest treatment duration was chosen.
2. Calculations and interpretation of indicators
To correctly interpret the data in this report, it is necessary to understand what information is used as a basis for the calculations of the proposed indicators. Several indicators are proposed because the results of this study may be used for different purposes.
Some indicators may be preferred for assessing the correlation between sales of antimicrobials and antimicrobial resistance. Others will be more appropriate for monitoring global changes over time in prescription of veterinary medicinal products and for attempting to measure the impact of actions implemented at national level.
In this report, two types of indicators are presented:
- sales indicators, used to monitor the change in the weights of antimicrobials sold over time,
- exposure indicators, used to better represent the use of antimicrobials to treat animals.
Tonnages of antimicrobials sold
The weight of antimicrobials sold by drug presentation is an exact measurement obtained by multiplying the quantitative composition of active ingredient for each presentation by the number of units sold.
For some active ingredients expressed in IU (International Units) or prodrugs, a conversion coefficient (WHO standard value) has been used to calculate the quantity of antimicrobials by drug presentation. The coefficients used for the national monitoring scheme are those recommended by the European Medicines Agency (EMA) in the framework of the European Surveillance of Veterinary Antimicrobial Consumption (ESVAC) scheme10.
In this report, the quantities of antimicrobials sold (expressed in tonnes) are presented by pharmaceutical form of the drugs and/or by class of antimicrobials.
The weight of antimicrobials sold by species is calculated using the estimates provided by the MA holders on the shares of sales for each animal species. This estimated amount is therefore calculated by multiplying the weight of antimicrobials sold by presentation by the percentage of reported sales for a given species.
10 http://www.ema.europa.eu/docs/en_GB/document_library/Other/2015/06/WC500188365.pdf

ANSES • annual report Veterinary medicinal products containing antimicrobials in France in 2019
13
Weight of antimicrobials sold compared to the animal biomass
In order to take account of fluctuations in medicinal product sales and animal populations over time, the ratio between the weights of antimicrobials sold and the biomass of the population potentially using antimicrobials can be calculated.
This indicator is expressed in mg of active ingredient per kg of body weight.
Indicators of exposure of the animal population
For drugs administered by the oral and parenteral routes, three exposure indicators can be calculated: the body weight treated-day, the body weight treated, and the ALEA.
The body weight treated-day for a given drug, also called the "Number of ADDkg", is calculated by dividing the weight of antimicrobials sold by the daily dose chosen for this drug.
This daily dose, or ADDkg (Animal Daily Dose) is the dose necessary to treat one kg of body weight for one day.
The body weight treated-day for a given species is calculated by adding together the numbers of ADDkg calculated for all the drug presentations sold for this species.
The body weight treated for a given drug, also called the "Number of ACDkg", is calculated by dividing the weight of antimicrobials sold by the dose required to treat a kg of typical animal over the entire duration of treatment.
This dose, known as the ACDkg (Animal Course Dose), is the daily dose multiplied by the duration of treatment.
The body weight treated for a given species is calculated by adding together the numbers of ACDkg calculated for all the drug presentations sold for this species.
The indicator of exposure of animals to antimicrobials or ALEA (Animal Level of Exposure to Antimicrobials) is calculated by dividing the body weight treated by the biomass of the animal population potentially using antimicrobials.
The ALEA indicator has no unit and is based on the assumption that all the antimicrobials sold during the year were administered to animals in France during this year.
The total per year in body weight treated is lower than the sum of body weight treated per class of antimicrobials, due to combinations of antimicrobials in some veterinary drugs. The same is true for the total body weight treated-day and the total ALEA, when the results are presented by class of antimicrobials.
3. Important points concerning the 2019 annual report
Changes to the SPC were introduced in 2019 for certain veterinary medicinal products authorised in France. These changes have been incorporated in the analysis of sales for 2019 but do not affect the results of previous years.
The biomass data for the different animal populations have been updated according to the Agreste website, especially for veal calves, for the years 2017 and 2018.

ANSES • annual report Veterinary medicinal products containing antimicrobials in France in 2019
14
Previously, penethamate was regarded as an antimicrobial substance on its own. However, since this substance is a prodrug of benzylpenicillin, a conversion factor of 0.60 was applied to the quantitative composition of penethamate hydroiodide.

ANSES • annual report Veterinary medicinal products containing antimicrobials in France in 2019
15
IV. Tonnages of antimicrobials sold and exposure indicators in 2019
1. Tonnages by antimicrobial class and route of administration
In 2019, the total volume of sales amounted to 422.08 tonnes of antimicrobials. Five antimicrobial classes (tetracyclines, sulfonamides, penicillins, aminoglycosides and macrolides) accounted for more than 89% of total antimicrobial sales (Table 1). Tetracyclines alone represented around 34% of tonnage sold. Critical antimicrobials (newer-generation cephalosporins and fluoroquinolones) accounted for nearly 0.3% of the tonnage of active ingredient sold.
Table 1: Breakdown of sales for 2019 in tonnage of active ingredient for each antimicrobial class by route of administration
MED
ICAT
ED
PREM
IXES
OR
AL F
OR
MS
EXC
LUD
ING
PR
EMIX
ES
INJE
CTI
ON
S
INTR
AMAM
MAR
Y &
INTR
AUTE
RIN
E
TOTA
L
SHAR
E O
F TH
E C
LASS
(%)
AMINOGLYCOSIDES 10.75 11.27 26.70 1.42 50.14 11.88%
OTHER CLASSES11 - 1.61 - 0.04 1.65 0.39%
CEPHALOSPORINS 1&2G - 3.97 0.04 1.10 5.11 1.21%
CEPHALOSPORINS 3&4G - - 0.11 0.00 0.11 0.03%
FLUOROQUINOLONES - 0.69 0.28 - 0.97 0.23%
LINCOSAMIDES 0.31 2.18 0.65 0.02 3.16 0.75%
MACROLIDES 5.74 17.42 7.35 - 30.52 7.23%
PENICILLINS 8.77 31.24 27.77 2.18 69.95 16.57%
PHENICOLS - 0.23 5.20 - 5.43 1.29%
PLEUROMUTILINS 1.67 1.79 0.01 - 3.47 0.82%
POLYMYXINS 0.61 9.26 0.44 0.12 10.42 2.47%
QUINOLONES - 2.33 - - 2.33 0.55%
SULFONAMIDES 37.34 38.62 5.39 - 81.34 19.27%
TETRACYCLINES 62.57 71.83 8.32 1.42 144.15 34.15%
TRIMETHOPRIM 5.69 6.58 1.04 - 13.31 3.15%
TOTAL 133.45 199.03 83.31 6.29 422.08 100.00%
PERCENTAGE 31.62% 47.15% 19.74% 1.49% 100.00%
Sales of antimicrobials administered in local forms (sprays, creams, ear or eye solutions) are not presented in this report. They account for around 0.7% of the tonnage of active ingredient sold.
11 Other classes: dimetridazole, metronidazole, pyrimethamine, rifaximin

ANSES • annual report Veterinary medicinal products containing antimicrobials in France in 2019
16
2. Tonnages by species
In 2019, according to the information on the breakdown by species transmitted to ANSES-ANMV by the pharmaceutical companies, 33% of the tonnage of antimicrobials sold is intended for pigs, 28% is intended for cattle and 17% is destined for poultry (Table 2).
In 2019, 27.51 mg of antimicrobials were sold per kilogram of body weight, with differences depending on the species.
When expressed in weight of active ingredient, the results are not representative of the animal species' "exposure" to antimicrobials.
Table 2: Breakdown of sales for 2019 between the different species in tonnage of active ingredient and quantity of active ingredient per kilogram of body weight
Cattle Pigs Poultry Rabbits
Cats & Sheep & Horses Fish Other Total Dogs Goats
Tonnage sold 117.46 140.62 73.67 31.07 16.41 30.42 8.59 3.40 0.45 422.08
Percentage 27.83% 33.32% 17.45% 7.36% 3.89% 7.21% 2.03% 0.81% 0.11% 100.00%
Sales in mg/kg 13.11 49.80 34.24 382.21 96.06 54.47 16.67 73.94 12.81 27.51
3. Indicators by antimicrobial class and route of administration
Sales expressed in body weight treated show that animals are treated primarily with tetracyclines, penicillins, aminoglycosides, macrolides and polymyxins, followed by sulfonamides (Table 3). Less than 1% of body weight treated in veterinary medicine is treated with fluoroquinolones or newer-generation cephalosporins.
Medicated premixes are generally medicinal products containing older compounds and are administered over a long period. Although they account for nearly 32% of the tonnage of active ingredient sold, they represent around 10% of body weight treated. Oral powders & solutions and injections each represented 44% of total body weight treated with antimicrobials.
For medicated premixes, the tetracycline class accounted for around 37% of body weight treated, and the sulfonamides class for more than 29% of body weight treated. Around 39% of the body weight treated with oral powders or solutions was treated with tetracyclines, and 22% with polymyxins. For parenteral administration, in terms of body weight treated, penicillins were the class most commonly used (41%), followed by aminoglycosides (29%), macrolides (23%) and tetracyclines (20%).
Fluoroquinolones and third- and fourth-generation cephalosporins were used to treat respectively 1.5% and 0.8% of the total body weight treated by the parenteral route.

ANSES • annual report Veterinary medicinal products containing antimicrobials in France in 2019
17
Table 3: Body weight treated in 2019 according to the classes of antimicrobials and routes of administration (in tonnes)
MEDICATED PREMIXES
ORAL POWDERS & SOLUTIONS
OTHER ORAL FORMS* INJECTIONS TOTAL PERCENTAGE
AMINOGLYCOSIDES 39,810 79,139 5,037 641,983 765,969 15.18%
OTHER CLASSES 0 0 6,555 0 6,555 0.13%
CEPHALOSPORINS 1&2G 0 0 11,680 479 12,159 0.24%
CEPHALOSPORINS 3&4G 0 0 0 17,252 17,252 0.34%
FLUOROQUINOLONES 0 12,408 1,267 32,746 46,421 0.92%
LINCOSAMIDES 1,564 34,491 765 23,388 60,208 1.19%
MACROLIDES 39,501 126,099 3,019 505,007 673,626 13.35%
PENICILLINS 71,431 385,309 52,583 921,315 1,430,638 28.35%
PHENICOLS 0 4,608 0 138,386 142,994 2.83%
PLEUROMUTILINS 21,097 13,609 0 411 35,117 0.70%
POLYMYXINS 17,751 490,808 6,080 62,372 577,011 11.43%
QUINOLONES 0 31,400 181 0 31,581 0.63%
SULFONAMIDES 143,690 220,840 10,322 133,633 508,485 10.07%
TETRACYCLINES 181,166 859,860 9,104 442,996 1,493,126 29.58%
TRIMETHOPRIM 116,631 192,856 5,134 132,052 446,673 8.85%
TOTAL (in tonnes) 491,783 2,227,530 98,659 2,229,030 5,047,002 100.00%
PERCENTAGE 9.74% 44.14% 1.95% 44.17% 100.00%
* Tablets, oral pastes, boluses, etc.
Figure 1: Relative average proportions of pharmaceutical forms in the body weight treated by different classes of antimicrobials in 2019
Polymyxins, tetracyclines, sulfonamides and trimethoprim are mainly administered orally (Figure 1). Aminoglycosides, penicillins and macrolides are mainly used by the parenteral route.

ANSES • annual report Veterinary medicinal products containing antimicrobials in France in 2019
18
4. Indicators by species
More than 43% of the body weight of animals treated relates to cattle, more than 28% to pigs and 17% to poultry (Table 4). These percentages should be considered in the context of the biomass of each animal species in France (Table 2 in the Annex). Table 4: Breakdown of sales for 2019 between the different species in tonnage of body weight treated and ALEA exposure indicator
Cattle Pigs Poultry Rabbits Cats & Dogs
Sheep & Goats Horses Fish Other Total
Body weight treated (tonnes)
2,193,014 1,433,492 852,912 151,150 109,642 190,520 99,420 11,666 5,186 5,047,002
Percentage 43.45% 28.40% 16.90% 2.99% 2.17% 3.77% 1.97% 0.23% 0.10% 100.00%
ALEA 0.245 0.508 0.396 1.860 0.642 0.341 0.193 0.254 0.147 0.329
The ALEA indicator best reflects exposure to antimicrobials as it takes into account information on the treatments (dose and duration) and also on potential users (weight of the animal population potentially treated with antimicrobials).
If the ALEA is equal to 1, it means that, for a given species, the estimated body weight treated is exactly the same as the total body weight (produced) of the animal population. An ALEA of 0.245 for cattle means that sales of antimicrobials intended for this animal sector were used to treat 24.5% of the total body weight of cattle.
According to the ALEA calculated for 2019, rabbits, cats and dogs, pigs and poultry are the species most exposed to antimicrobials (Table 4).
However, the ALEA does not take into account the potential differences between the treatment of young and adult animals. To better assess the use of antimicrobials, the weight of the animals during treatment should be taken into account and not the adult weight or weight at slaughter.

ANSES • annual report Veterinary medicinal products containing antimicrobials in France in 2019
19
V. Change in sales and exposure to antimicrobials between 1999 and 2019
1. Milestone years in the national monitoring scheme
The monitoring of sales of antimicrobials in veterinary medicine began in 1999.
After several months of discussions with stakeholders, the first EcoAntibio plan was published in November 2011. One of this plan's objectives was to reduce the use of antimicrobials by 25% in five years, taking 2011 as the reference year.
The Act on the future of agriculture, food and forestry of 13 October 201412 set a target of a 25% reduction in three years in the use of antimicrobials belonging to the classes of fluoroquinolones and third- and fourth-generation cephalosporins, taking 2013 as the reference year. This Act also introduced several measures, such as an end to discounts, rebates and reductions as of 1 January 2015. This led to stockpiling of medicines containing antimicrobials among the parties involved in the distribution and/or prescription of veterinary medicinal products during 2014, which resulted in sales falling in 2015.
Following on from the 2012-2016 EcoAntibio plan, the second EcoAntibio plan was published in April 2017, in order to ensure that the decline in animal exposure to antimicrobials is sustained. One of its goals is a 50% reduction in five years in exposure to colistin in the beef, pork and poultry sectors (using the average ALEA for 2014-2015 as a reference).
Throughout this report, therefore, the results for 2019 have been compared to those of the three reference years 1999, 2011 and 2013.
2. Change in sales and exposure to antimicrobials by pharmaceutical form
Change in weights of active ingredients
Over the 21 years of monitoring, the tonnage of antimicrobials sold has fluctuated between 1383 tonnes in 2000 and 422 tonnes in 2019 (Table 3 in the Annex). The tonnage of antimicrobials sold in 2019 fell by 10.5% compared to the tonnage in 2018. This change was mainly due to a decrease in the tonnage sold for oral powders and solutions (-16.8% in one year).
The weight of antimicrobials sold in 2019 was compared to the tonnage in 2011, the reference year for the first national EcoAntibio plan: a decrease of 53.3% can be observed over these last eight years. This decrease is largely attributable to lower sales of orally administered antimicrobials (-67.2% for medicated premixes and -50.6% for oral powders and solutions).
Change in the body weight treated by antimicrobials
The body weight treated was calculated for each drug for the different oral forms and injections.
Since 1999, the body weight treated has halved (-50.5%). The body weight treated varied between 5 million tonnes (in 2019) and 11 million tonnes (in 2007).
The body weight treated in 2019 was down by 48.5% compared to 2011, the reference year for the first national EcoAntibio plan (Table 5 in the Annex): -75.8% for medicated premixes, -54.2% for oral powders and solutions, and -20.1% for injections.
The change in sales by pharmaceutical form is presented in the Annex: Table 4 for the change in the body weight treated-day and Table 5 for the change in the body weight treated.
12 http://www.legifrance.gouv.fr/affichLoiPubliee.do;jsessionid=5691BBA0E2987B8FCBB6195E53853F64.tpdjo07v_2?type=general&idDocument=JORFDOLE000028196878

ANSES • annual report Veterinary medicinal products containing antimicrobials in France in 2019
20
Change in animal exposure to antimicrobials (ALEA)
Since monitoring of sales began, the level of exposure of animals to antimicrobials, all routes and species combined, has decreased by 41.3% (variation between 1999 and 2019). In 2019, overall exposure fell by 10.9% compared to the previous year and by 45.3% compared to 2011 (Table 5).
Table 5: Change in the indicator of exposure by pharmaceutical form (ALEA)
MEDICATED PREMIXES
ORAL POWDERS & SOLUTIONS
OTHER ORAL FORMS INJECTIONS TOTAL
1999 0.210 0.180 0.007 0.164 0.561
2000 0.217 0.214 0.007 0.160 0.598
2001 0.203 0.245 0.006 0.157 0.610
2002 0.191 0.282 0.006 0.158 0.638
2003 0.184 0.308 0.007 0.164 0.663
2004 0.171 0.317 0.007 0.154 0.649
2005 0.176 0.359 0.007 0.171 0.713
2006 0.176 0.342 0.007 0.180 0.705
2007 0.193 0.342 0.007 0.165 0.708
2008 0.168 0.305 0.007 0.169 0.649
2009 0.154 0.306 0.007 0.158 0.625
2010 0.146 0.310 0.007 0.166 0.629
2011 0.125 0.299 0.007 0.171 0.602
2012 0.098 0.284 0.006 0.178 0.566
2013 0.084 0.262 0.006 0.172 0.524
2014 0.084 0.316 0.007 0.187 0.593
2015 0.069 0.155 0.005 0.139 0.369
2016 0.050 0.172 0.006 0.154 0.382
2017 0.039 0.178 0.006 0.145 0.368
2018 0.034 0.174 0.006 0.155 0.369
2019 0.032 0.145 0.006 0.145 0.329
Variation 2019 / 2018
-0.002 -0.029 0.000 -0.009 -0.040
-6.6% -16.7% 1.2% -6.0% -10.9%
Variation 2019 / 2011
-0.093 -0.153 -0.000 -0.026 -0.273
-74.4% -51.4% -4.1% -15.2% -45.3%
Exposure to antimicrobials via medicated premixes has fallen by 74.4% since 2011 (Figure 2). Over the last year, there has been a 6.6% decrease in exposure to this pharmaceutical form.
Over the last year, there has been a 6.0% decrease in exposure to injections. Since 2011, exposure to antimicrobials in this pharmaceutical form has fallen by 15.2%.
Exposure to antimicrobials via oral powders and solutions has decreased by 16.7% in the last year and by 51.4% since 2011.

ANSES • annual report Veterinary medicinal products containing antimicrobials in France in 2019
21
Exposure to antimicrobials via other orally administered forms (pastes, tablets, boluses, etc.) is low and has been relatively stable since 1999.
Figure 2: Change in ALEA by pharmaceutical form since 1999

ANSES • annual report Veterinary medicinal products containing antimicrobials in France in 2019
22
3. Change in sales and exposure to antimicrobials by class
Change in the tonnage compared to the mass of the animal population
Since 1999, sales expressed in mg of antimicrobials per kg of body weight produced have fluctuated between 27.51 and 78.82 mg/kg (Table 6).
Table 6: Change in sales by antimicrobial class since 1999 in mg of active ingredient per kilogram of body weight (mg/kg)
AM
INO
GLY
CO
SID
ES
OTH
ER C
LASS
ES*
CEP
HA
LOSP
OR
INS
1&2G
CEP
HA
LOSP
OR
INS
3&4G
FLU
OR
OQ
UIN
OLO
NES
LIN
CO
SAM
IDES
MA
CR
OLI
DES
PEN
ICIL
LIN
S
PHEN
ICO
LS
PLEU
RO
MU
TILI
NS
POLY
MYX
INS
QU
INO
LON
ES
SULF
ON
AM
IDES
TETR
AC
YCLI
NES
TRIM
ETH
OPR
IM
TOTA
L
1999 4.49 0.05 0.29 0.05 0.18 0.32 4.37 4.97 0.24 1.71 3.69 1.09 14.25 34.29 2.06 72.06
2000 4.89 0.05 0.29 0.06 0.20 0.44 4.82 5.28 0.25 1.80 3.85 0.90 14.78 35.79 2.11 75.50
2001 4.95 0.05 0.28 0.05 0.22 0.50 5.45 5.04 0.24 1.38 3.85 0.79 13.13 35.62 1.94 73.48
2002 4.95 0.05 0.34 0.06 0.23 0.60 5.95 5.36 0.31 1.39 3.73 0.87 12.56 34.63 1.86 72.91
2003 4.63 0.02 0.39 0.07 0.25 0.58 5.78 5.21 0.24 1.24 3.82 0.79 11.85 36.61 1.84 73.32
2004 4.53 0.05 0.39 0.08 0.25 0.55 5.56 4.86 0.28 0.93 3.63 0.72 12.09 36.75 1.95 72.62
2005 4.61 0.04 0.43 0.10 0.26 0.60 6.01 5.33 0.28 0.50 3.99 0.80 12.94 39.86 2.14 77.89
2006 4.67 0.06 0.39 0.11 0.29 0.54 6.18 5.58 0.37 0.60 4.02 0.78 12.72 36.11 1.99 74.42
2007 4.41 0.04 0.43 0.12 0.28 0.54 5.80 5.56 0.35 0.59 4.39 0.65 13.34 40.32 2.01 78.82
2008 4.39 0.04 0.43 0.13 0.29 0.47 5.71 5.12 0.30 0.48 3.95 0.48 11.72 35.17 1.78 70.45
2009 3.89 0.04 0.42 0.11 0.29 0.43 5.00 5.20 0.29 0.49 3.98 0.45 10.92 30.28 1.70 63.49
2010 3.79 0.04 0.36 0.14 0.32 0.41 4.94 5.50 0.31 0.46 3.95 0.49 10.61 28.66 1.60 61.57
2011 3.91 0.04 0.43 0.14 0.32 0.33 4.33 5.55 0.28 0.42 3.73 0.38 10.53 23.95 1.54 55.89
2012 3.58 0.04 0.41 0.15 0.31 0.29 3.81 5.38 0.29 0.35 3.20 0.33 9.07 20.49 1.33 49.03
2013 3.40 0.04 0.40 0.13 0.30 0.29 3.25 5.42 0.29 0.35 2.68 0.29 8.52 17.62 1.26 44.23
2014 3.60 0.04 0.46 0.13 0.31 0.29 3.65 6.14 0.37 0.40 3.22 0.35 9.18 19.74 1.42 49.29
2015 3.01 0.03 0.28 0.09 0.17 0.20 2.27 4.01 0.24 0.34 1.90 0.17 6.65 11.69 0.97 32.01
2016 3.49 0.08 0.40 0.02 0.11 0.19 2.31 4.86 0.35 0.28 1.27 0.20 6.96 11.61 1.08 33.21
2017 3.49 0.08 0.35 0.01 0.08 0.19 2.16 4.62 0.34 0.26 1.04 0.21 5.84 12.01 1.02 31.70
2018 3.34 0.09 0.36 0.01 0.06 0.20 2.06 4.55 0.37 0.23 0.88 0.18 5.40 11.57 0.97 30.26
2019 3.27 0.11 0.33 0.01 0.06 0.21 1.99 4.56 0.35 0.23 0.68 0.15 5.30 9.40 0.87 27.51
Variation 2019 / 2018
-0.07 0.02 -0.03 0.00 0.00 0.01 -0.07 0.01 -0.02 0.00 -0.20 -0.02 -0.10 -2.17 -0.10 -2.75
-2.1% 20.4% -7.4% -4.6% -1.1% 5.6% -3.3% 0.2% -4.2% -0.3% -22.8% -13.8% -1.8% -18.8% -10.7% -9.1%
Variation 2019 / 2011
-0.64 0.07 -0.10 -0.13 -0.26 -0.13 -2.34 -0.99 0.07 -0.19 -3.05 -0.23 -5.22 -14.56 -0.67 -28.37
-16.4% 166.7% -23.0% -94.9% -80.4% -38.3% -54.0% -17.8% 25.9% -45.6% -81.8% -60.3% -49.6% -60.8% -43.6% -50.8%
* Other classes: dimetridazole, metronidazole, pyrimethamine and rifaximin

ANSES • annual report Veterinary medicinal products containing antimicrobials in France in 2019
23
A 61.8% decrease in the quantity of active ingredient in mg per kilogram of body weight can be observed between 1999 and 2019. This decrease was largely attributable to lower sales of antimicrobials from the classes of tetracyclines (-72.6%) and sulfonamides (-62.8%).
Since 2011, there has been a 50.8% decrease in the quantity of antimicrobials sold in mg per kilogram of body weight. This trend is largely attributable to lower sales of antimicrobials from the classes of tetracyclines (-60.8%) and sulfonamides (-49.6%), but also from the classes of polymyxins (-81.8%) and macrolides (-54.0%).
In the last year, a 9.1% decrease in the quantity of active ingredient in mg per kilogram of body weight has been observed. This trend is largely due to a decrease in sales of tetracyclines, polymyxins, sulfonamides and trimethoprim, aminoglycosides and macrolides between 2018 and 2019. During the same period, sales of fluoroquinolones fell by 1.1% and sales of newer-generation cephalosporins fell by 4.6%.
The change in the tonnage sold by class is shown in Table 6 in the Annex.
Change in animal exposure to antimicrobials (ALEA)
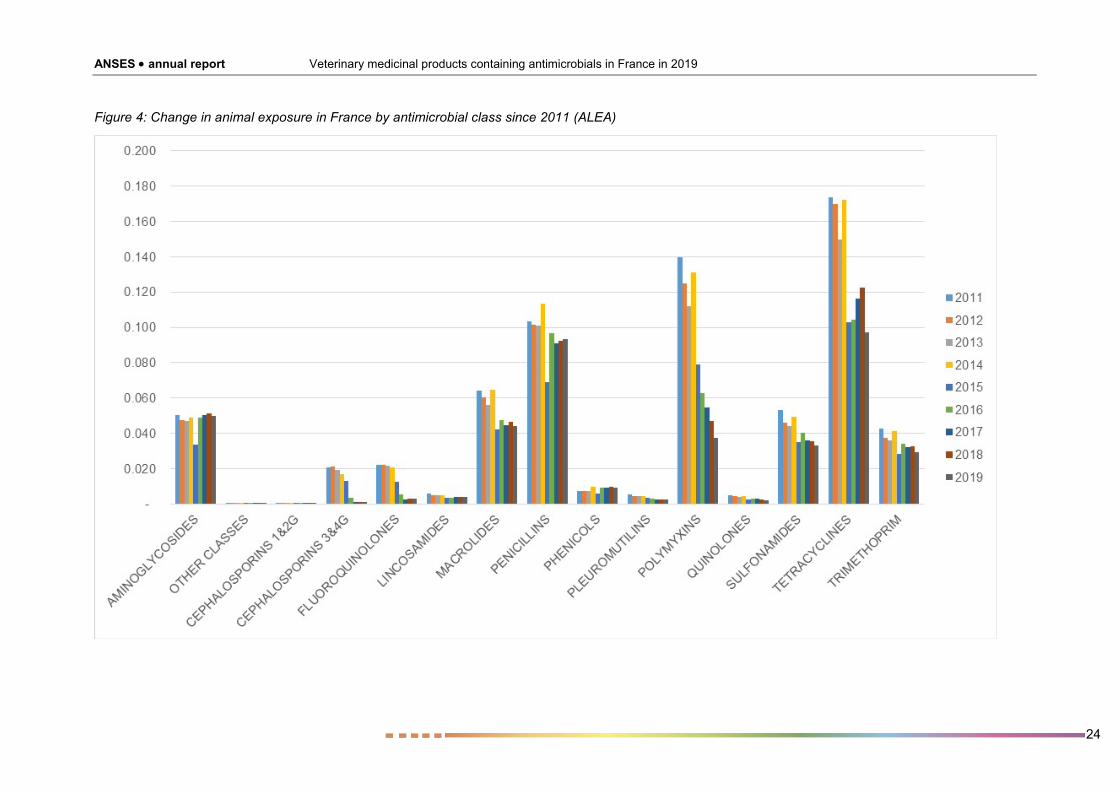
Since 1999, the level of animal exposure to antimicrobials, all classes and animal species combined, has fallen by 41.3%. The trend in exposure varies according to the class considered (Figure 4).
Between 2011 and 2019, overall exposure decreased by 45.3%. This was largely due to lower exposure to polymyxins (-73.1%), tetracyclines (-44.0%), macrolides (-31.4%), sulfonamides (37.7%), third- and fourth-generation cephalosporins (-94.6%) and fluoroquinolones (-86.4%) (Figure 3).
The ALEA was 0.329 in 2019, a decrease of 10.9% in one year (Table 7). Exposure to tetracyclines has fallen by 20.5% in one year. Exposure to polymyxins decreased by 20.1% between 2018 and 2019. Over this period, antimicrobial exposure decreased for all classes except for first- and second-generation cephalosporins, fluoroquinolones, lincosamides and penicillins; exposure for these classes was stable between 2018 and 2019.
Figure 3: Comparison of the ALEA by antimicrobial class in 2011 and 2019
ANSES • annual report Veterinary medicinal products containing antimicrobials in France in 2019
24
Figure 4: Change in animal exposure in France by antimicrobial class since 2011 (ALEA)
ANSES • annual report Veterinary medicinal products containing antimicrobials in France in 2019
25
Table 7: Change in ALEA by antimicrobial class since 1999 (for the oral and parenteral routes only) A
MIN
OG
LYC
OSI
DES
OTH
ER C
LASS
ES
CEP
HA
LOSP
OR
INS
1&2G
CEP
HA
LOSP
OR
INS
3&4G
FLU
OR
OQ
UIN
OLO
NES
LIN
CO
SAM
IDES
MA
CR
OLI
DES
PEN
ICIL
LIN
S
PHEN
ICO
LS
PLEU
RO
MU
TILI
NS
POLY
MYX
INS
QU
INO
LON
ES
SULF
ON
AM
IDES
TETR
AC
YCLI
NES
TRIM
ETH
OPR
IM
TOTA
L
1999 0.058 0.000 0.000 0.008 0.011 0.006 0.051 0.094 0.006 0.023 0.111 0.013 0.069 0.176 0.052 0.561
2000 0.060 0.000 0.000 0.009 0.012 0.009 0.059 0.101 0.006 0.025 0.118 0.011 0.071 0.184 0.054 0.598
2001 0.060 0.000 0.000 0.009 0.014 0.010 0.064 0.097 0.006 0.019 0.121 0.010 0.066 0.196 0.051 0.610
2002 0.060 0.000 0.001 0.011 0.017 0.013 0.071 0.094 0.008 0.019 0.123 0.010 0.064 0.209 0.048 0.638
2003 0.059 0.000 0.001 0.012 0.019 0.012 0.070 0.097 0.006 0.017 0.130 0.010 0.060 0.231 0.047 0.663
2004 0.062 0.000 0.001 0.013 0.018 0.011 0.066 0.090 0.007 0.013 0.126 0.009 0.061 0.234 0.048 0.649
2005 0.064 0.000 0.001 0.015 0.021 0.011 0.075 0.101 0.007 0.008 0.142 0.009 0.064 0.260 0.052 0.713
2006 0.063 0.001 0.001 0.018 0.023 0.010 0.076 0.104 0.009 0.008 0.146 0.009 0.063 0.239 0.050 0.705
2007 0.060 0.000 0.001 0.019 0.020 0.009 0.068 0.103 0.009 0.008 0.150 0.008 0.065 0.247 0.052 0.708
2008 0.058 0.000 0.001 0.020 0.022 0.009 0.070 0.095 0.008 0.006 0.143 0.006 0.059 0.210 0.047 0.649
2009 0.052 0.000 0.001 0.017 0.022 0.008 0.066 0.094 0.007 0.006 0.144 0.006 0.054 0.199 0.045 0.625
2010 0.049 0.000 0.001 0.021 0.022 0.007 0.067 0.101 0.008 0.006 0.146 0.006 0.053 0.191 0.044 0.629
2011 0.050 0.000 0.001 0.021 0.022 0.006 0.064 0.103 0.007 0.005 0.140 0.005 0.053 0.174 0.042 0.602
2012 0.048 0.000 0.001 0.021 0.022 0.005 0.060 0.101 0.008 0.005 0.125 0.004 0.046 0.170 0.037 0.566
2013 0.047 0.000 0.001 0.019 0.022 0.005 0.056 0.101 0.007 0.005 0.112 0.004 0.044 0.150 0.036 0.524
2014 0.049 0.000 0.001 0.017 0.021 0.005 0.065 0.114 0.009 0.004 0.131 0.005 0.049 0.172 0.041 0.593
2015 0.033 0.000 0.000 0.013 0.013 0.004 0.042 0.069 0.006 0.004 0.079 0.002 0.035 0.103 0.028 0.369
2016 0.049 0.000 0.001 0.004 0.005 0.004 0.047 0.097 0.009 0.003 0.063 0.003 0.040 0.104 0.034 0.382
2017 0.050 0.000 0.001 0.001 0.003 0.004 0.045 0.091 0.009 0.003 0.055 0.003 0.036 0.116 0.032 0.368
2018 0.051 0.000 0.001 0.001 0.003 0.004 0.046 0.093 0.010 0.002 0.047 0.002 0.036 0.122 0.032 0.369
2019 0.050 0.000 0.001 0.001 0.003 0.004 0.044 0.093 0.009 0.002 0.038 0.002 0.033 0.097 0.029 0.329
Variation 2019 / 2018
-0.001 0.000 0.000 0.000 0.000 0.000 -0.002 0.001 0.000 0.000 -0.009 0.000 -0.002 -0.025 -0.003 -0.040
-2.4% 16.4% 5.7% -5.4% 0.7% 0.4% -5.2% 0.8% -4.0% -1.4% -20.1% -14.2% -6.7% -20.5% -10.3% -10.9%
Variation 2019 / 2011
-0.001 0.000 0.000 -0.020 -0.019 -0.002 -0.020 -0.010 0.002 -0.003 -0.102 -0.003 -0.020 -0.077 -0.013 -0.273
-1.1% 26.5% 20.6% -94.6% -86.4% -34.7% -31.4% -9.9% 27.8% -56.3% -73.1% -58.4% -37.7% -44.0% -31.4% -45.3%
The change in sales by class of antimicrobials is presented in the Annex: Table 7 for the change in the body weight treated-day and Table 8 for the change in the body weight treated.

ANSES • annual report Veterinary medicinal products containing antimicrobials in France in 2019
26
VI. Change in exposure to antimicrobials by species
1. Cattle
Change in sales and exposure to antimicrobials by class
The tonnage intended for cattle increased considerably between 1999 and 2005 and then declined until 2015 (Table 9 in the Annex). In 2019, it was around 117 tonnes, i.e. 13.9% lower than the tonnage in 2018 and 35.9% lower than in 2011.
The level of exposure of cattle to antimicrobials has fallen by 8.0% since 1999. According to the ALEA per class in 2019, cattle are treated mostly with penicillins, tetracyclines, aminoglycosides and then macrolides (Figure 6).
Between 2011 and 2019, exposure of cattle fell by 25.5%. This was largely due to lower exposure to third- and fourth-generation cephalosporins (-95.2%), fluoroquinolones (-89.8%), polymyxins (-50.6%), macrolides (-21.8%) and penicillins (9.7%) (Figure 5).
The exposure of cattle to antimicrobials seems to have been relatively stable since 2015.
The ALEA was 0.245 in 2019, a variation of -9.9% in one year (Table 8). Between 2018 and 2019, a decrease in exposure was observed for all classes of antimicrobials, except for fluoroquinolones (+1.4%) and penicillins (+1.1%).
Figure 5: Comparison of the ALEA for cattle by antimicrobial class in 2011 and 2019

ANSES • annual report Veterinary medicinal products containing antimicrobials in France in 2019
27
Figure 6: Change in exposure of cattle by antimicrobial class since 2011 (ALEA)

ANSES • annual report Veterinary medicinal products containing antimicrobials in France in 2019
28
Table 8: Change in exposure of cattle by antimicrobial class since 1999 (for the oral and parenteral routes only)
AM
INO
GLY
CO
SID
ES
CEP
HA
LOSP
OR
INS
3&4G
FLU
OR
OQ
UIN
OLO
NES
LIN
CO
SAM
IDES
MA
CR
OLI
DES
PEN
ICIL
LIN
S
PHEN
ICO
LS
POLY
MYX
INS
QU
INO
LON
ES
SULF
ON
AM
IDES
TETR
AC
YCLI
NES
TRIM
ETH
OPR
IM
TOTA
L
1999 0.065 0.012 0.009 0.002 0.045 0.080 0.010 0.029 0.004 0.013 0.072 0.007 0.266
2000 0.064 0.015 0.009 0.002 0.046 0.079 0.011 0.030 0.004 0.015 0.070 0.007 0.271
2001 0.062 0.014 0.013 0.002 0.046 0.077 0.010 0.031 0.004 0.014 0.062 0.007 0.263
2002 0.060 0.017 0.016 0.002 0.050 0.075 0.013 0.033 0.005 0.014 0.067 0.007 0.284
2003 0.062 0.020 0.019 0.002 0.051 0.076 0.011 0.033 0.005 0.013 0.076 0.007 0.299
2004 0.066 0.021 0.017 0.002 0.049 0.079 0.012 0.031 0.004 0.014 0.098 0.007 0.321
2005 0.070 0.025 0.020 0.003 0.056 0.087 0.013 0.035 0.005 0.014 0.117 0.007 0.368
2006 0.068 0.026 0.022 0.003 0.053 0.085 0.016 0.034 0.005 0.014 0.106 0.007 0.357
2007 0.065 0.027 0.020 0.002 0.044 0.079 0.015 0.031 0.004 0.016 0.104 0.007 0.335
2008 0.062 0.029 0.020 0.002 0.053 0.074 0.013 0.031 0.003 0.016 0.081 0.008 0.317
2009 0.053 0.024 0.019 0.002 0.053 0.069 0.011 0.031 0.003 0.013 0.086 0.007 0.305
2010 0.053 0.030 0.023 0.002 0.057 0.079 0.012 0.027 0.004 0.014 0.098 0.007 0.340
2011 0.062 0.033 0.024 0.001 0.062 0.085 0.011 0.021 0.002 0.021 0.075 0.010 0.328
2012 0.059 0.034 0.023 0.002 0.064 0.085 0.011 0.015 0.002 0.016 0.081 0.008 0.327
2013 0.057 0.030 0.022 0.002 0.063 0.084 0.011 0.018 0.002 0.016 0.062 0.008 0.304
2014 0.060 0.027 0.020 0.002 0.074 0.077 0.013 0.028 0.003 0.018 0.095 0.012 0.354
2015 0.040 0.021 0.013 0.002 0.048 0.053 0.009 0.015 0.001 0.013 0.069 0.008 0.240
2016 0.059 0.006 0.004 0.002 0.056 0.071 0.011 0.013 0.002 0.018 0.070 0.015 0.249
2017 0.063 0.002 0.002 0.002 0.052 0.073 0.011 0.013 0.002 0.017 0.080 0.015 0.252
2018 0.067 0.002 0.002 0.002 0.056 0.076 0.012 0.011 0.002 0.019 0.089 0.017 0.272
2019 0.064 0.002 0.002 0.002 0.048 0.077 0.012 0.010 0.002 0.017 0.073 0.016 0.245
Variation 2019 / 2018
-0.002 0.000 0.000 0.000 -0.008 0.001 -0.001 -0.001 0.000 -0.002 -0.016 -0.002 -0.027
-3.4% -5.2% 1.4% -7.8% -14.8% 1.1% -4.9% -8.2% -0.6% -9.5% -17.8% -9.8% -9.9%
Variation 2019 / 2011
0.003 -0.031 -0.021 0.001 -0.013 -0.008 0.001 -0.011 -0.001 -0.004 -0.001 0.005 -0.084
4.1% -95.2% -89.8% 146.8% -21.8% -9.7% 8.9% -50.6% -31.3% -20.1% -1.9% 50.2% -25.5%
Change in exposure by pharmaceutical form
Cattle are treated primarily by the parenteral route and then by the oral route (Figure 7), mainly with the use of oral powders and solutions.
Exposure to antimicrobials via injections has fallen by 20.6% compared to 2011, with an 8.5% decline between 2018 and 2019.

ANSES • annual report Veterinary medicinal products containing antimicrobials in France in 2019
29
Exposure to antimicrobials via the oral route has fallen by 34.1% compared to 2011, with a 14.4% decline between 2018 and 2019.
Figure 7: Change in exposure of cattle by administration route since 1999 (ALEA)
Various indicators calculated for cattle are available in the Annex: antimicrobial sales expressed in mg/kg in Table 9, body weight treated-day in Table 10 and body weight treated in Table 11.
Intramammary treatments
The number of intramammary treatments per dairy cow was estimated by attributing all the sales of intramammary drugs in the cattle sector to the population of dairy cows.
The equivalent of 1.71 intramammary treatments per dairy cow were sold in 1999, and the equivalent of 1.13 treatments per dairy cow in 2019 (Figure 8): a 33.7% fall has therefore been observed since national monitoring began. In 2019, the number of intramammary treatments per dairy cow fell by 31.4% compared to 2011, and by 15.4% compared to 2018.
In 2019 and according to the population data, the number of intramammary treatments was estimated to be 71.9 per 100 dairy cows in the lactation period, and 41.6 per 100 dairy cows at dry-off. Medicinal products administered at dry-off accounted for 43.4% of intramammary treatments in 1999 versus 36.6% for 2019.
Aminoglycosides, penicillins, polymyxins, tetracyclines and first- and second-generation cephalosporins are the classes most used by the intramammary route.
The number of intramammary treatments per dairy cow based on newer-generation cephalosporins decreased by 98.9% between 2013 and 2019. Note that the estimated number of treatments has doubled since 2018. The increase was mainly observed for treatments administered during the lactation period. According to the reported data, the number of dairy cows treated by the intramammary route with newer-generation cephalosporins represented 0.26% of animals in 2019 (versus 0.13% in 2018). The change is explained by a lag in the reported sales figures for 2018 for some drugs, and does not necessarily reflect a change in the use of these intramammary treatments.

ANSES • annual report Veterinary medicinal products containing antimicrobials in France in 2019
30
Figure 8: Change in the number of intramammary treatments per dairy cow during the lactation period and at dry-off since 1999

ANSES • annual report Veterinary medicinal products containing antimicrobials in France in 2019
31
2. Pigs
Change in sales and exposure to antimicrobials by class
The tonnage intended for pigs has declined considerably since 1999 (Table 12 in the Annex). In 2019, it was around 141 tonnes, i.e. 15.6% lower than the tonnage in 2018 and 60.3% lower than in 2011.
The level of exposure of pigs to antimicrobials has decreased by 60.0% since 1999. According to the ALEA per class in 2019, pigs are treated mostly with tetracyclines and penicillins, then with polymyxins, macrolides, sulfonamides and trimethoprim (Figure 10).
Between 2011 and 2019, exposure of pigs fell by 54.0%. This change was largely due to a decrease in exposure to polymyxins (-82.5%), but also to sulfonamides and trimethoprim (-60.6%), macrolides (-57.1%), tetracyclines (-43.8%) and fluoroquinolones (-90.0%) (Figure 9). Exposure to penicillins increased over this period (+12.7%).
The ALEA was 0.508 in 2019, a variation of -16.4% in one year (Table 9). Between 2018 and 2019, exposure to antimicrobials decreased mainly for tetracyclines and polymyxins. Over the same period, exposure to macrolides increased by 8.7%.
Figure 9: Comparison of the ALEA for pigs by antimicrobial class in 2011 and 2019

ANSES • annual report Veterinary medicinal products containing antimicrobials in France in 2019
32
Figure 10: Change in exposure of pigs by antimicrobial class since 2011 (ALEA)

ANSES • annual report Veterinary medicinal products containing antimicrobials in France in 2019
33
Table 9: Change in exposure of pigs by antimicrobial class since 1999 (ALEA calculated for the oral and parenteral routes only)
AM
INO
GLY
CO
SID
ES
CEP
HA
LOSP
OR
INS
3&4G
FLU
OR
OQ
UIN
OLO
NES
LIN
CO
SAM
IDES
MA
CR
OLI
DES
PEN
ICIL
LIN
S
PHEN
ICO
LS
PLEU
RO
MU
TILI
NS
POLY
MYX
INS
QU
INO
LON
ES
SULF
ON
AM
IDES
TETR
AC
YCLI
NES
TRIM
ETH
OPR
IM
TOTA
L
1999 0.072 0.004 0.021 0.020 0.118 0.114 0.000 0.090 0.323 0.029 0.160 0.385 0.146 1.268
2000 0.080 0.005 0.024 0.027 0.153 0.126 0.000 0.087 0.332 0.021 0.161 0.422 0.148 1.363
2001 0.091 0.004 0.026 0.032 0.191 0.130 0.000 0.073 0.342 0.015 0.163 0.485 0.149 1.479
2002 0.090 0.005 0.029 0.037 0.207 0.126 0.000 0.066 0.323 0.012 0.159 0.492 0.147 1.481
2003 0.083 0.005 0.031 0.034 0.192 0.123 0.000 0.042 0.338 0.009 0.144 0.502 0.134 1.443
2004 0.087 0.005 0.030 0.032 0.179 0.118 0.000 0.032 0.320 0.010 0.152 0.475 0.141 1.378
2005 0.088 0.007 0.037 0.033 0.193 0.131 0.000 0.022 0.343 0.011 0.155 0.509 0.145 1.469
2006 0.086 0.014 0.039 0.030 0.204 0.140 0.000 0.018 0.355 0.009 0.157 0.477 0.148 1.474
2007 0.078 0.015 0.033 0.028 0.196 0.148 0.000 0.015 0.410 0.010 0.166 0.518 0.155 1.568
2008 0.073 0.014 0.038 0.027 0.167 0.127 0.000 0.011 0.361 0.009 0.148 0.421 0.137 1.345
2009 0.073 0.013 0.040 0.026 0.162 0.141 0.006 0.012 0.345 0.007 0.141 0.401 0.131 1.315
2010 0.058 0.016 0.024 0.022 0.152 0.135 0.004 0.013 0.324 0.007 0.141 0.366 0.134 1.217
2011 0.043 0.008 0.026 0.018 0.130 0.122 0.005 0.013 0.348 0.007 0.117 0.300 0.116 1.103
2012 0.038 0.006 0.029 0.020 0.105 0.129 0.007 0.015 0.294 0.005 0.101 0.278 0.100 0.994
2013 0.039 0.005 0.029 0.019 0.088 0.132 0.005 0.014 0.246 0.005 0.090 0.317 0.090 0.957
2014 0.040 0.003 0.028 0.019 0.091 0.171 0.009 0.010 0.268 0.005 0.098 0.311 0.098 1.017
2015 0.027 0.002 0.016 0.012 0.061 0.107 0.005 0.008 0.195 0.002 0.070 0.179 0.069 0.657
2016 0.050 0.001 0.008 0.012 0.063 0.169 0.014 0.005 0.112 0.003 0.064 0.187 0.064 0.645
2017 0.046 0.000 0.002 0.012 0.059 0.144 0.012 0.004 0.092 0.003 0.053 0.236 0.053 0.624
2018 0.045 0.000 0.003 0.012 0.051 0.145 0.012 0.003 0.085 0.003 0.051 0.236 0.051 0.607
2019 0.044 0.000 0.003 0.012 0.056 0.138 0.012 0.003 0.061 0.003 0.046 0.169 0.046 0.508
Variation 2019 / 2018
-0.001 0.000 0.000 0.000 0.004 -0.007 0.000 0.000 -0.024 0.000 -0.005 -0.067 -0.005 -0.099
-2.6% -22.0% -3.0% 2.3% 8.7% -5.0% -1.4% -4.6% -28.5% 4.6% -9.0% -28.4% -9.4% -16.4%
Variation 2019 / 2011
0.001 -0.007 -0.023 -0.005 -0.074 0.016 0.006 -0.010 -0.287 -0.003 -0.071 -0.131 -0.070 -0.595
2.7% -96.5% -90.0% -29.9% -57.1% 12.7% 123.0% -76.4% -82.5% -50.8% -60.6% -43.8% -60.6% -54.0%
Change in exposure by pharmaceutical form
Pigs are treated essentially by the oral route, and then by the parenteral route (Figure 11).
Medicated premixes are used less and less: the ALEA for this pharmaceutical form has decreased by 77.6% since 2011 and by 12.5% over the last year.

ANSES • annual report Veterinary medicinal products containing antimicrobials in France in 2019
34
Exposure to antimicrobials via oral powders and solutions has decreased by 41.9% since 2011 and has fallen by 22.8% over the last year.
Exposure to antimicrobials via injections has decreased by 5.6% since 2011 and has fallen by 2.2% over the last year.
Figure 11: Change in exposure of pigs by pharmaceutical form since 1999 (ALEA)
Various indicators calculated for pigs are available in the Annex: antimicrobial sales expressed in mg/kg in Table 12, body weight treated-day in Table 13 and body weight treated in Table 14.

ANSES • annual report Veterinary medicinal products containing antimicrobials in France in 2019
35
3. Poultry
Change in sales and exposure to antimicrobials by class
The tonnage intended for poultry has declined considerably since 1999 (Table 15 in the Annex). In 2019, it was around 74 tonnes, i.e. 14.6% lower than the tonnage in 2018 and 63.6% lower than in 2011.
Since 1999, the level of exposure of poultry to antimicrobials has decreased by 39.5%. According to the ALEA per class in 2019, poultry are treated mostly with polymyxins, penicillins and tetracyclines, and then with sulfonamides and trimethoprim (Figure 13).
Between 2011 and 2019, exposure of poultry fell by 60.5%. This change was largely due to a decrease in exposure to polymyxins (-65.4%), tetracyclines (-72.2%), penicillins (-36.0%) and sulfonamides and trimethoprim (-33.5%), but also to fluoroquinolones (71.9%) and lincosamides (-85.8%) (Figure 12). Note that the use of cephalosporins is not authorised in poultry.
The ALEA was 0.396 in 2019, a variation of -12.8% in one year (Table 10). Between 2018 and 2019, exposure to antimicrobials fell for most classes of antimicrobials, but especially for polymyxins (-17.8%) and tetracyclines (-25.3%). An increase in exposure to penicillins was observed (+11.5%).
Figure 12: Comparison of the ALEA for poultry by antimicrobial class in 2011 and 2019

ANSES • annual report Veterinary medicinal products containing antimicrobials in France in 2019
36
Figure 13: Change in exposure of poultry by antimicrobial class since 2011 (ALEA)

ANSES • annual report Veterinary medicinal products containing antimicrobials in France in 2019
37
Table 10: Change in exposure of poultry by antimicrobial class since 1999 (ALEA calculated for the oral and parenteral routes only)
AM
INO
GLY
CO
SID
ES
FLU
OR
OQ
UIN
OLO
NES
LIN
CO
SAM
IDES
MA
CR
OLI
DES
PEN
ICIL
LIN
S
PHEN
ICO
LS
PLEU
RO
MU
TILI
NS
POLY
MYX
INS
QU
INO
LON
ES
SULF
ON
AM
IDES
TETR
AC
YCLI
NES
TRIM
ETH
OPR
IM
TOTA
L
1999 0.010 0.012 0.009 0.025 0.078 0.000 0.001 0.185 0.029 0.037 0.283 0.037 0.655
2000 0.013 0.013 0.016 0.027 0.113 0.000 0.001 0.218 0.028 0.040 0.302 0.038 0.757
2001 0.014 0.012 0.023 0.027 0.098 0.000 0.001 0.227 0.027 0.037 0.339 0.038 0.790
2002 0.012 0.011 0.032 0.030 0.108 0.000 0.001 0.256 0.023 0.041 0.382 0.036 0.882
2003 0.010 0.012 0.027 0.032 0.107 0.000 0.000 0.283 0.023 0.042 0.437 0.038 0.961
2004 0.011 0.013 0.022 0.035 0.102 0.000 0.000 0.292 0.024 0.042 0.394 0.038 0.922
2005 0.010 0.012 0.020 0.042 0.120 0.000 0.000 0.340 0.023 0.044 0.412 0.043 1.013
2006 0.011 0.015 0.020 0.045 0.143 0.000 0.003 0.390 0.028 0.044 0.398 0.040 1.086
2007 0.011 0.016 0.016 0.042 0.149 0.000 0.004 0.351 0.021 0.046 0.407 0.043 1.050
2008 0.008 0.016 0.015 0.047 0.132 0.000 0.003 0.360 0.014 0.041 0.378 0.039 1.006
2009 0.009 0.017 0.011 0.036 0.144 0.000 0.004 0.409 0.016 0.045 0.347 0.043 1.029
2010 0.011 0.019 0.015 0.033 0.156 0.000 0.002 0.462 0.015 0.033 0.306 0.029 1.043
2011 0.008 0.020 0.015 0.024 0.167 0.000 0.003 0.383 0.012 0.051 0.332 0.046 1.005
2012 0.007 0.018 0.003 0.021 0.143 0.000 0.003 0.376 0.012 0.042 0.325 0.038 0.942
2013 0.009 0.016 0.004 0.019 0.151 0.000 0.002 0.370 0.011 0.038 0.268 0.033 0.882
2014 0.005 0.020 0.001 0.028 0.213 0.000 0.005 0.431 0.011 0.046 0.317 0.041 1.073
2015 0.003 0.008 0.001 0.011 0.090 0.000 0.004 0.204 0.006 0.038 0.136 0.034 0.500
2016 0.007 0.009 0.001 0.013 0.129 0.000 0.004 0.230 0.007 0.048 0.127 0.042 0.573
2017 0.008 0.008 0.002 0.015 0.100 0.000 0.004 0.198 0.008 0.046 0.126 0.039 0.512
2018 0.007 0.006 0.002 0.014 0.096 0.000 0.003 0.161 0.005 0.041 0.123 0.035 0.454
2019 0.008 0.006 0.002 0.012 0.107 0.000 0.003 0.132 0.003 0.034 0.092 0.029 0.396
Variation 2019 / 2018
0.001 0.000 0.000 -0.002 0.011 0.000 0.000 -0.029 -0.002 -0.007 -0.031 -0.006 -0.058
14.2% -1.7% 19.4% -12.0% 11.5% -9.9% 10.7% -17.8% -38.9% -16.5% -25.3% -17.2% -12.8%
Variation 2019 / 2011
0.000 -0.014 -0.013 -0.012 -0.060 0.000 0.001 -0.250 -0.009 -0.017 -0.240 -0.017 -0.608
1.6% -71.9% -85.8% -49.1% -36.0% 38.8% -65.4% -73.2% -33.5% -72.2% -36.5% -60.5%
Change in exposure by pharmaceutical form
Poultry are treated primarily with oral powders and solutions (Figure 14).
Medicated premixes are used less and less: the ALEA for this pharmaceutical form has decreased by 71.1% since 2011 and by 8.1% over the last year.
Exposure to antimicrobials via oral powders and solutions has decreased by 59.9% since 2011 and by 12.9% in the last year.

ANSES • annual report Veterinary medicinal products containing antimicrobials in France in 2019
38
Figure 14: Change in exposure of poultry by pharmaceutical form since 1999 (ALEA)
Various indicators calculated for poultry are available in the Annex: antimicrobial sales expressed in mg/kg in Table 15, body weight treated-day in Table 16 and body weight treated in Table 17.

ANSES • annual report Veterinary medicinal products containing antimicrobials in France in 2019
39
4. Rabbits
Change in sales and exposure to antimicrobials by class
The tonnage intended for rabbits increased between 1999 and 2004, flattened out between 2004 and 2007, then declined until 2017 and has been stable in the past few years (Table 18 in the Annex). In 2019, it was around 31 tonnes, i.e. 10.0% higher than the tonnage in 2018 and 56.3% lower than in 2011.
Since 1999, the level of exposure of rabbits to antimicrobials has decreased by 33.5%. According to the ALEA per class in 2019, rabbits are treated mainly with tetracyclines, sulfonamides and trimethoprim, aminoglycosides, pleuromutilins and polymyxins (colistin and bacitracin) (Figure 16).
Between 2011 and 2019, exposure of rabbits fell by 41.4%. A decrease in exposure was observed for all classes of antimicrobials, except for macrolides (+3.4%). Exposure fell by 54.1% for tetracyclines, 48.9% for polymyxins, 46.0% for aminoglycosides and 38.4% for pleuromutilins.
The ALEA was 1.860 in 2019, a variation of +1.5% in one year (Table 11). Between 2018 and 2019, exposure to antimicrobials decreased for tetracyclines (-17.2%) and polymyxins (-11.3%). In contrast, increases in exposure were estimated for macrolides (+98.0%), sulfonamides (+37.4%) and trimethoprim (+37.6%). These are probably due to the updating of the percentages of the sales breakdowns by species in 2019 for a few drugs. This will be specifically verified in the coming years. Discussions with veterinarians specialising in this sector revealed no particular health episodes that year, nor any changes in their treatment practices. These increases should therefore be interpreted with caution.
Figure 15: Comparison of the ALEA for rabbits by antimicrobial class in 2011 and 2019

ANSES • annual report Veterinary medicinal products containing antimicrobials in France in 2019
40
Figure 16: Change in exposure of rabbits by antimicrobial class since 2011 (ALEA)

ANSES • annual report Veterinary medicinal products containing antimicrobials in France in 2019
41
Table 11: Change in exposure of rabbits by antimicrobial class since 1999 (ALEA calculated for the oral and parenteral routes only)
AM
INO
GLY
CO
SID
ES
FLU
OR
OQ
UIN
OLO
NES
MA
CR
OLI
DES
PLEU
RO
MU
TILI
NS
POLY
MYX
INS
QU
INO
LON
ES
SULF
ON
AM
IDES
TETR
AC
YCLI
NES
TRIM
ETH
OPR
IM
TOTA
L
1999 0.305 0.000 0.081 0.970 0.617 0.001 0.379 0.457 0.189 2.797
2000 0.325 0.000 0.066 1.236 0.681 0.001 0.492 0.425 0.278 3.214
2001 0.320 0.000 0.077 0.904 0.677 0.004 0.473 0.497 0.277 2.935
2002 0.340 0.000 0.080 0.984 0.526 0.005 0.508 0.957 0.320 3.389
2003 0.296 0.000 0.059 1.330 0.420 0.005 0.614 1.424 0.443 4.137
2004 0.262 0.000 0.053 0.988 0.315 0.005 0.685 2.147 0.545 4.450
2005 0.231 0.000 0.040 0.465 0.351 0.006 0.844 2.196 0.722 4.125
2006 0.264 0.000 0.037 0.532 0.346 0.007 0.797 1.871 0.646 3.848
2007 0.286 0.000 0.030 0.584 0.387 0.007 0.882 1.892 0.725 4.063
2008 0.329 0.000 0.020 0.539 0.386 0.007 0.738 1.841 0.609 3.857
2009 0.346 0.000 0.015 0.578 0.465 0.007 0.748 1.739 0.612 3.894
2010 0.459 0.000 0.147 0.546 0.350 0.007 0.666 1.553 0.516 3.723
2011 0.438 0.000 0.121 0.382 0.442 0.000 0.579 1.220 0.468 3.176
2012 0.418 0.000 0.130 0.240 0.367 0.000 0.498 0.969 0.410 2.607
2013 0.331 0.000 0.109 0.261 0.201 0.000 0.506 1.300 0.426 2.701
2014 0.435 0.000 0.098 0.282 0.455 0.000 0.672 1.049 0.570 2.983
2015 0.342 0.006 0.111 0.260 0.518 0.000 0.439 0.606 0.341 2.269
2016 0.399 0.005 0.103 0.248 0.209 0.000 0.602 0.641 0.507 2.192
2017 0.238 0.004 0.061 0.254 0.293 0.000 0.430 0.524 0.380 1.796
2018 0.233 0.003 0.063 0.241 0.255 0.000 0.365 0.677 0.323 1.832
2019 0.236 0.002 0.125 0.235 0.226 0.000 0.502 0.560 0.444 1.860
Variation 2019 / 2018
0.004 0.000 0.062 -0.006 -0.029 0.000 0.137 -0.117 0.121 0.028
1.6% -15.9% 98.0% -2.5% -11.3% 37.4% -17.2% 37.6% 1.5%
Variation 2019 / 2011
-0.201 0.002 0.000 -0.147 -0.216 0.000 -0.077 -0.660 -0.024 -1.316
-46.0% 3.4% -38.4% -48.9% -13.3% -54.1% -5.1% -41.4%
Change in exposure by pharmaceutical form
Rabbits are treated essentially by the oral route (Figure 17).
Medicated premixes are used less and less: the ALEA for this pharmaceutical form has decreased by 55.7% since 2011, although there was an 11.8% increase over the last year.
Exposure to antimicrobials via oral powders and solutions has decreased by 22.8% since 2011, and has fallen by 2.9% over the last year.

ANSES • annual report Veterinary medicinal products containing antimicrobials in France in 2019
42
Figure 17: Change in exposure of rabbits by pharmaceutical form since 1999 (ALEA)
Various indicators calculated for rabbits are available in the annexes: antimicrobial sales expressed in mg/kg in Table 18, body weight treated-day in Table 19 and body weight treated in Table 20.

ANSES • annual report Veterinary medicinal products containing antimicrobials in France in 2019
43
5. Domestic carnivores
Change in sales and exposure to antimicrobials by class
The tonnage intended for cats and dogs increased between 1999 and 2006 (Table 21 in the Annex). It then decreased until 2013 and has been rising again since. In 2019, it was 16.4 tonnes, i.e. 1.3% higher than the tonnage in 2018, but 2.1% lower than in 2011.
Since 1999, the level of exposure of domestic carnivores to antimicrobials has decreased by 12.7% According to the ALEA per class in 2019, cats and dogs were treated mainly with penicillins, followed by aminoglycosides, first-generation cephalosporins, sulfonamides and tetracyclines (Figure 19).
Between 2011 and 2019, exposure of domestic carnivores fell by 13.9%. This change was largely due to a decrease in exposure to aminoglycosides (-32.2%), fluoroquinolones (-69.0%), newer-generation cephalosporins (-71.7%) and penicillins (-7.3%) (Figure 18).
The ALEA was 0.642 in 2019, a variation of +2.1% in one year (Table 12). Exposure of domestic carnivores has been fairly stable over the last three years. Between 2018 and 2019, exposure to sulfonamides and trimethoprim decreased slightly. Over the same period, an increase in exposure was observed mainly for aminoglycosides (+17.6%) and penicillins (+2.7%).
Figure 18: Comparison of the ALEA for cats & dogs by antimicrobial class in 2011 and 2019

ANSES • annual report Veterinary medicinal products containing antimicrobials in France in 2019
44
Figure 19: Change in exposure of domestic carnivores by antimicrobial class since 2011 (ALEA)

ANSES • annual report Veterinary medicinal products containing antimicrobials in France in 2019
45
Table 12: Change in exposure of domestic carnivores by antimicrobial class since 1999 (ALEA calculated for the oral and parenteral routes only)
AM
INO
GLY
CO
SID
ES
OTH
ER C
LASS
ES
CEP
HA
LOSP
OR
INS
1&2G
CEP
HA
LOSP
OR
INS
3&4G
FLU
OR
OQ
UIN
OLO
NES
LIN
CO
SAM
IDES
MA
CR
OLI
DES
PEN
ICIL
LIN
S
PHEN
ICO
LS
POLY
MYX
INS
QU
INO
LON
ES
SULF
ON
AM
IDES
TETR
AC
YCLI
NES
TRIM
ETH
OPR
IM
TOTA
L
1999 0.201 0.047 0.048 0.000 0.047 0.013 0.041 0.408 0.001 0.010 0.001 0.093 0.047 0.034 0.735
2000 0.190 0.051 0.049 0.000 0.064 0.008 0.046 0.392 0.001 0.010 0.004 0.091 0.045 0.030 0.731
2001 0.173 0.047 0.052 0.000 0.070 0.007 0.043 0.358 0.001 0.008 0.003 0.074 0.040 0.024 0.674
2002 0.174 0.045 0.056 0.000 0.078 0.008 0.047 0.318 0.001 0.008 0.005 0.073 0.042 0.020 0.658
2003 0.183 0.018 0.064 0.000 0.078 0.008 0.041 0.301 0.001 0.008 0.004 0.069 0.041 0.017 0.631
2004 0.203 0.045 0.065 0.000 0.080 0.008 0.044 0.330 0.001 0.007 0.003 0.073 0.043 0.018 0.666
2005 0.202 0.032 0.069 0.000 0.075 0.007 0.041 0.364 0.001 0.007 0.003 0.063 0.050 0.015 0.697
2006 0.201 0.056 0.071 0.004 0.077 0.007 0.055 0.403 0.001 0.008 0.000 0.066 0.046 0.015 0.750
2007 0.194 0.040 0.071 0.023 0.081 0.007 0.039 0.429 0.001 0.005 0.002 0.067 0.052 0.014 0.782
2008 0.186 0.039 0.070 0.028 0.082 0.006 0.038 0.409 0.001 0.006 0.000 0.069 0.048 0.014 0.760
2009 0.171 0.036 0.067 0.031 0.084 0.006 0.036 0.404 0.001 0.005 0.001 0.060 0.047 0.012 0.744
2010 0.177 0.035 0.064 0.034 0.084 0.008 0.036 0.409 0.001 0.003 0.000 0.054 0.048 0.012 0.740
2011 0.172 0.035 0.068 0.045 0.076 0.008 0.035 0.404 0.000 0.004 0.000 0.058 0.051 0.016 0.745
2012 0.172 0.034 0.063 0.031 0.071 0.005 0.034 0.378 0.000 0.004 0.000 0.056 0.049 0.014 0.687
2013 0.170 0.027 0.059 0.038 0.079 0.006 0.027 0.370 0.000 0.004 0.000 0.048 0.048 0.013 0.675
2014 0.179 0.027 0.065 0.037 0.079 0.006 0.027 0.421 0.000 0.004 0.000 0.071 0.054 0.029 0.761
2015 0.101 0.024 0.045 0.043 0.054 0.005 0.024 0.305 0.000 0.003 0.000 0.060 0.049 0.023 0.587
2016 0.093 0.037 0.059 0.012 0.034 0.005 0.024 0.326 0.000 0.001 0.000 0.071 0.057 0.034 0.602
2017 0.112 0.036 0.066 0.014 0.021 0.005 0.020 0.369 0.000 0.001 0.000 0.072 0.056 0.035 0.642
2018 0.099 0.034 0.068 0.013 0.023 0.006 0.017 0.365 0.000 0.001 0.000 0.068 0.051 0.038 0.629
2019 0.116 0.038 0.071 0.013 0.024 0.006 0.018 0.375 0.000 0.001 0.000 0.061 0.054 0.030 0.642
Variation 2019 / 2018
0.017 0.005 0.003 0.000 0.001 0.000 0.001 0.010 0.000 0.000 0.000 -0.008 0.003 -0.008 0.013
17.6% 14.6% 4.0% 1.5% 2.3% 0.6% 5.0% 2.7% -8.5% -11.2% 4.9% -21.6% 2.1%
Variation 2019 / 2011
-0.055 0.004 0.003 -0.032 -0.053 -0.002 -0.017 -0.030 0.000 -0.003 0.000 0.003 0.003 0.014 -0.103
-32.2% 10.4% 5.0% -71.7% -69.0% -29.3% -49.1% -7.3% -79.1% 5.2% 6.5% 85.5% -13.9%
Change in exposure by pharmaceutical form
Cats and dogs are treated primarily by the oral route (mostly with the use of tablets), and then by the parenteral route (Figure 20).
Exposure to antimicrobials via the oral route has increased by 8.1% since 2011 and by 1.2% over the last year.
Exposure to antimicrobials via injections has decreased by 47.1% since 2011, but has increased by 4.8% in the last year.

ANSES • annual report Veterinary medicinal products containing antimicrobials in France in 2019
46
Figure 20: Change in exposure of domestic carnivores by routes of administration since 1999 (ALEA)
Various indicators calculated for domestic carnivores are available in the Annex: antimicrobial sales expressed in mg/kg in Table 21, body weight treated-day in Table 22 and body weight treated in Table 23.

ANSES • annual report Veterinary medicinal products containing antimicrobials in France in 2019
47
VII. Update on exposure to fluoroquinolones, third- and fourth-generation cephalosporins and colistin
1. Background
Fluoroquinolones and third- and fourth-generation cephalosporins
Third- and fourth-generation cephalosporins and fluoroquinolones are considered as particularly important in human medicine because they are among the only alternatives for the treatment of certain infectious diseases in humans.
The Act on the future of agriculture, food and forestry (LAAAF13, Act No. 2014-1170 of 13 October 2014) set a target of a 25% reduction in three years in the use of antimicrobials belonging to each of these classes. The year 2013 was taken as a reference for this objective, which was to be achieved by the end of December 2016 at the latest.
On 16 March 2016, a decree was published to regulate the prescription and dispensing of drugs used in veterinary medicine and containing one or more antibiotic substance of critical importance. The two most important provisions for French veterinary medicine are:
- a ban on the prescription of critical antimicrobials for preventive purposes;
- the requirement to conduct a clinical examination followed by an antibiogram before prescribing a critical antibiotic for curative or metaphylactic purposes. Some exceptions apply.
The Interministerial order of 18 March 2016 establishes the list of critical antibiotic substances (4 substances belonging to the third- and fourth-generation cephalosporins and 5 substances belonging to the fluoroquinolones), as well as the list of methods for carrying out the bacterial strain susceptibility test (antibiogram).
Colistin
The scientific article published in November 2015 describing the first plasmid-mediated mechanism of resistance to colistin led to the establishment of reinforced surveillance for this antimicrobial.
At European level, in July 2016, the Antimicrobial Advice Ad Hoc Expert Group (AMEG)14 recommended reducing the use of colistin within three to four years to no more than 5 mg/PCU (Population Correction Unit) for European countries that are high or moderate consumers, and no more than 1 mg/PCU for European countries with the lowest use of colistin.
In France, in its report15 on colistin published in October 2016, ANSES recommended a 50% reduction in the use of this antimicrobial. Following this opinion, the EcoAntibio2 plan (Action 12) set a five-year goal of a 50% reduction in exposure to colistin in the cattle, pig and poultry sectors, taking the average ALEA for 2014-2015 as a reference (see Chapter V.1 of this report). This reference is calculated as follows:
ALEA2014-15 = (body weight treated2014 + body weight treated2015) / (Biomass2014 + Biomass2015)
2. Change in exposure to fluoroquinolones
13 http://www.legifrance.gouv.fr/affichLoiPubliee.do;jsessionid=5691BBA0E2987B8FCBB6195E53853F64.tpdjo07v_2?type=general&idDocument=JORFDOLE000028196878 14 http://www.ema.europa.eu/docs/en_GB/document_library/Scientific_guideline/2016/07/WC500211080.pdf
15 https://www.anses.fr/fr/system/files/MV2016SA0160.pdf

ANSES • annual report Veterinary medicinal products containing antimicrobials in France in 2019
48
Change in exposure of animals in France
In 2019, 44 veterinary drugs containing a fluoroquinolone were marketed, containing one of the following five active ingredients: danofloxacin, enrofloxacin, marbofloxacin, orbifloxacin and pradofloxacin.
Fluoroquinolones are only authorised for use in cattle (oral and parenteral route), pigs (parenteral), poultry (oral), rabbits (oral and parenteral), cats and dogs (oral, parenteral and local), other pets (oral and parenteral) and sheep and goats (parenteral). According to the reports submitted by the pharmaceutical companies, fluoroquinolones are also used to treat horses. Off-label uses not quantified by the pharmaceutical companies as part of this monitoring have not been considered.
The tonnages of fluoroquinolones used in veterinary medicine by the oral and parenteral routes are relatively low: 0.25% of the tonnage of antimicrobials sold in 1999 (3.30 tonnes), 0.68% of the tonnage sold in 2013 (4.80 tonnes) and 0.23% of the tonnage sold in 2019 (0.97 tonnes). Nevertheless, expressing sales in body weight treated reveals a non-negligible use of this class: 1.95% of the body weight treated in 1999, 4.12% of the body weight treated in 2013 and 0.92% of the body weight treated in 2019.
After an increase in exposure to fluoroquinolones until 2006, exposure was relatively stable between 2007 and 2013 (Figure 21). Then a decrease in exposure was observed. Between 2013 and 2019, exposure fell by 86.0% for all species and routes of administration combined. This decrease in exposure was greater for the parenteral route (-88.2% compared to 2013) than for the oral route (-75.0% compared to 2013). Nevertheless, parenteral exposure increased by 56.5% between 2017 and 2019.
Figure 21: Change in exposure to fluoroquinolones (ALEA)
For 2019, the body weight treated with fluoroquinolones corresponded mainly to four animal species (Figure 22): cattle (46.7%), poultry (25.7%), pigs (15.6%) and cats & dogs (8.7%). Horses account for 1.0% of the body weight treated, sheep/goats 1.9% and rabbits 0.4%.

ANSES • annual report Veterinary medicinal products containing antimicrobials in France in 2019
49
Figure 22: Change in body weight treated with fluoroquinolones according to the species (in tonnes)
Change in exposure by species
Compared to 2013, a decrease in exposure to fluoroquinolones was observed in 2019 for all species (Table 13).
This decrease was around 90% for cattle, pigs and horses and was 70.3% for cats and dogs. The exposure of poultry to fluoroquinolones has declined by 66.1% since 2013.
Table 13: Change in exposure to fluoroquinolones between 2013 and 2019 according to the species
Cattle Pigs Poultry Cats & Dogs Horses All
species Change in ALEA -89.0% -91.2% -66.1% -70.3% -91.3% -86.0% - Oral route -97.6% -66.1% -78.3% -75.0% - Parenteral route -88.4% -91.2% -64.8% -91.3% -88.2%
Between 2018 and 2019, exposure to fluoroquinolones remained stable (+0.7%): exposure fell by 3.9% for the oral route and increased by 2.8% for the parenteral route (Table 14).

ANSES • annual report Veterinary medicinal products containing antimicrobials in France in 2019
50
Table 14: Change in exposure to fluoroquinolones between 2018 and 2019 according to the species
Cattle Pigs Poultry Cats & Dogs Horses All
species Change in ALEA 1.4% -3.0% -1.7% 2.3% 3.9% 0.7% - Oral route -36.5% -1.7% 2.5% -3.9% - Parenteral route 2.3% -3.0% 2.2% 3.9% 2.8%
The share of the fluoroquinolones class in total exposure to antimicrobials varies according to the species (Figure 23). The Decree of March 2016 regulating the prescription of critical antimicrobials16 led to a further decrease in the use of fluoroquinolones for all animal species.
In 2013, the ALEA for fluoroquinolones as a percentage of total ALEA per species was between 5% and 12% for horses, cattle, cats and dogs. This share was close to 3% for pigs and 2% for poultry in 2013.
In 2019, the ALEA for fluoroquinolones as a percentage of total ALEA was less than 1% for all species, except poultry (1.4%) and cats & dogs (3.7%).
Figure 23: Change in the ALEA for fluoroquinolones as a percentage of total ALEA per species
16 https://www.legifrance.gouv.fr/eli/decret/2016/3/16/AGRG1515288D/jo/texte
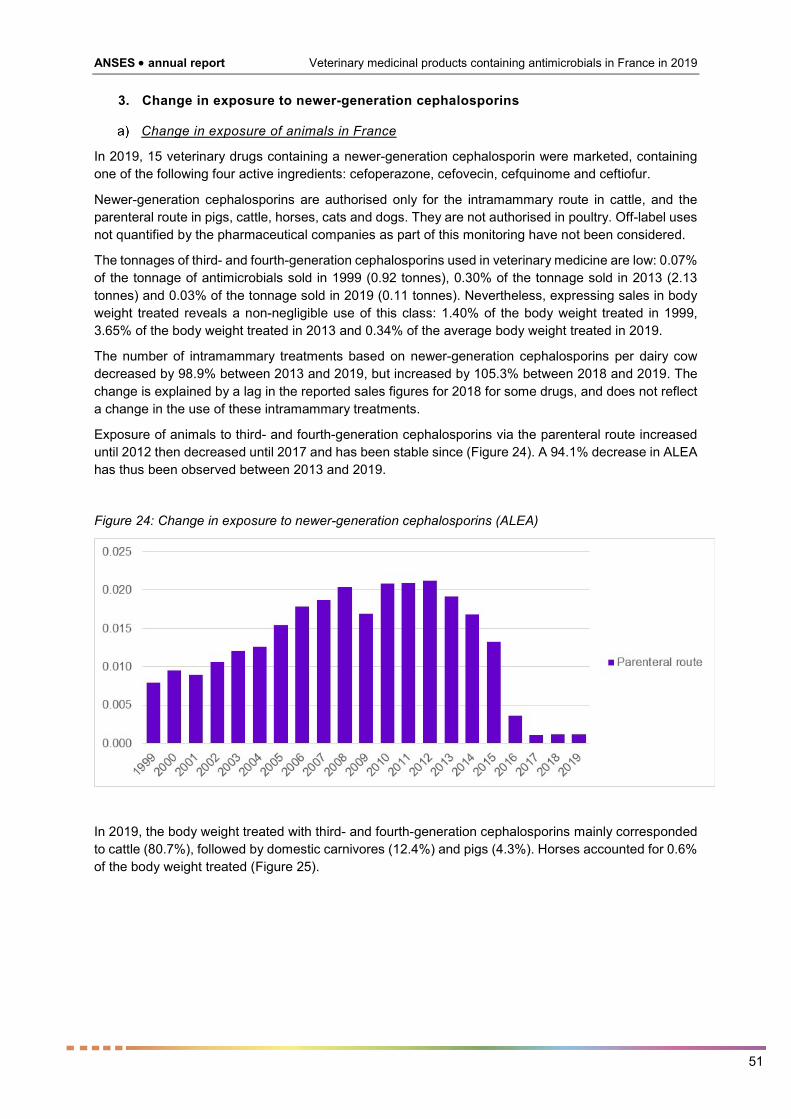
ANSES • annual report Veterinary medicinal products containing antimicrobials in France in 2019
51
3. Change in exposure to newer-generation cephalosporins
Change in exposure of animals in France
In 2019, 15 veterinary drugs containing a newer-generation cephalosporin were marketed, containing one of the following four active ingredients: cefoperazone, cefovecin, cefquinome and ceftiofur.
Newer-generation cephalosporins are authorised only for the intramammary route in cattle, and the parenteral route in pigs, cattle, horses, cats and dogs. They are not authorised in poultry. Off-label uses not quantified by the pharmaceutical companies as part of this monitoring have not been considered.
The tonnages of third- and fourth-generation cephalosporins used in veterinary medicine are low: 0.07% of the tonnage of antimicrobials sold in 1999 (0.92 tonnes), 0.30% of the tonnage sold in 2013 (2.13 tonnes) and 0.03% of the tonnage sold in 2019 (0.11 tonnes). Nevertheless, expressing sales in body weight treated reveals a non-negligible use of this class: 1.40% of the body weight treated in 1999, 3.65% of the body weight treated in 2013 and 0.34% of the average body weight treated in 2019.
The number of intramammary treatments based on newer-generation cephalosporins per dairy cow decreased by 98.9% between 2013 and 2019, but increased by 105.3% between 2018 and 2019. The change is explained by a lag in the reported sales figures for 2018 for some drugs, and does not reflect a change in the use of these intramammary treatments.
Exposure of animals to third- and fourth-generation cephalosporins via the parenteral route increased until 2012 then decreased until 2017 and has been stable since (Figure 24). A 94.1% decrease in ALEA has thus been observed between 2013 and 2019.
Figure 24: Change in exposure to newer-generation cephalosporins (ALEA)
In 2019, the body weight treated with third- and fourth-generation cephalosporins mainly corresponded to cattle (80.7%), followed by domestic carnivores (12.4%) and pigs (4.3%). Horses accounted for 0.6% of the body weight treated (Figure 25).

ANSES • annual report Veterinary medicinal products containing antimicrobials in France in 2019
52
Figure 25: Change in body weight treated with newer-generation cephalosporins (in tonnes)
Change in exposure by species
Compared to 2013, a decrease in exposure to third- and fourth-generation cephalosporins was observed in 2019 for all species (Table 15).
This decrease was more than 90% for cattle, pigs and horses and was equal to 66.7% for cats and dogs.
Table 15: Change in exposure to third- and fourth-generation cephalosporins between 2013 and 2019 according to the species
Cattle Pigs Cats & Dogs Horses All
species Change in ALEA -94.8% -95.0% -66.7% -90.8% -94.1%
Over the last year, a 5.4% decrease in exposure has been observed (Table 16).
Table 16: Change in exposure to third- and fourth-generation cephalosporins between 2018 and 2019 according to the species
Cattle Pigs Cats & Dogs Horses All
species Change in ALEA -5.2% -22.0% 1.5% -17.8% -5.4%
The share of third- and fourth-generation cephalosporins in total exposure to antimicrobials varies by species (Figure 26). The Decree of March 2016 regulating the prescription of critical antimicrobials17 reinforced the decline in the use of third- and fourth- generation cephalosporins:
In 2013, the ALEA for third- and fourth-generation cephalosporins as a percentage of total ALEA per species was between 5% and 10% for cattle, cats and dogs. This share was close to 1% for horses and equal to 0.6% for pigs in 2013.
17 https://www.legifrance.gouv.fr/eli/decret/2016/3/16/AGRG1515288D/jo/texte

ANSES • annual report Veterinary medicinal products containing antimicrobials in France in 2019
53
In 2019, the ALEA for third- and fourth-generation cephalosporins as a percentage of total ALEA was less than 1% for all species except cats and dogs (2.0%).
Figure 26: Change in the ALEA for third- and fourth-generation cephalosporins as a percentage of total ALEA per species

ANSES • annual report Veterinary medicinal products containing antimicrobials in France in 2019
54
4. Change in exposure to colistin
Change in exposure of animals in France
In 2019, 24 veterinary medicinal products containing colistin were marketed. These drugs are authorised for different species and administered by different routes (parenteral, oral or intramammary). Off-label uses not quantified by the pharmaceutical companies as part of this monitoring have not been considered.
Tonnages of colistin used in veterinary medicine have been decreasing since national monitoring began: 63 tonnes in 1999 (4.8% of the tonnage of antimicrobials sold), 40 tonnes on average for the years 2014-2015 (6.1% of the tonnage sold) and 10 tonnes in 2019 (2.4% of the tonnage sold).
In 1999, the body weight treated by colistin accounted for 19.3% of the body weight treated, all species combined. This percentage changed little until 2015 and has been declining since. In 2019, the body weight treated by colistin accounted for 11.3% of the body weight treated.
After increasing until 2007, exposure to colistin changed little between 2008 and 2011, and has been decreasing over the last few years (Figure 27). With an ALEA of 0.037 in 2019, a 73.3% decrease in exposure was observed compared to 2011 (all species and routes of administration combined).
Figure 27: Change in exposure to colistin according to the pharmaceutical form (ALEA)
Exposure to colistin via medicated premixes has decreased by 97.9% since 1999, and by 96.9% since 2011 (Figure 27). Exposure to colistin by the other oral forms (powders, solutions, oral pastes and tablets) has decreased by 26.7% since 1999, and by 67.2% since 2011. Exposure by the parenteral route is relatively low compared to oral exposure; it has decreased by 56.8% since 1999 and by 15.0% since 2011.
In 2019, exposure to colistin decreased by 64.2% compared to the average exposure calculated for 2014 and 2015 (all species and routes of administration combined). This was due to a 66.7% decrease in oral exposure (including a 95.1% decrease for medicated premixes).
For 2019, the body weight treated with colistin corresponded mainly to three animal species (Figure 28): poultry (49.8%), pigs (30.0%), and then cattle (16.2%). Other species are also treated with this antimicrobial, but the percentages of body weight treated attributable to these species are relatively low: 2.4% for rabbits, 1.5% for sheep and goats, 0.1% for horses and 0.02% for domestic carnivores.

ANSES • annual report Veterinary medicinal products containing antimicrobials in France in 2019
55
Figure 28: Change in body weight treated with colistin according to the species (in tonnes)
Change in body weight treated by medicated premixes according to the species
There has been a large decrease in the use of colistin-based premixes in the pig sector (Figure 29): 97.5% since 2011 and 96.1% compared to the average calculated for 2014 and 2015.
In the other animal production sectors, the use of colistin-based premixes has also been falling. Compared to the average for 2014 and 2015, the decrease in body weight treated was 87.7% for sheep and goats, 90.4% for rabbits and 91.4% for poultry.
In 2019, the body weight treated with colistin via premixes mainly concerned pigs (73.7%), then sheep and goats (12.5%), rabbits (11.1%) and poultry (2.8%). According to the sales data from 2016 to 2019, cattle are not treated with colistin-based medicated premixes.
Figure 29: Change in body weight treated by colistin-based premixes (tonnes)
Change in body weight treated by oral forms (excluding premixes) according to the species
Since 2011, the use of colistin-based oral forms (powders, solutions, oral pastes and tablets) has decreased considerably (Figure 30).

ANSES • annual report Veterinary medicinal products containing antimicrobials in France in 2019
56
Use of these oral forms in the poultry sector has fallen by 68.7% since 2011 and by 60.5% compared to the average calculated for 2014 and 2015.
The body weight treated with oral forms of colistin (excluding premixes) in the pig sector has fallen by 71.3% since 2011 and by 53.7% compared to the average calculated for 2014 and 2015.
The use of these oral forms in the cattle sector has fallen by 65.3% since 2011 and by 69.0% compared to the average calculated for 2014 and 2015.
In 2019, the body weight treated with oral forms of colistin (excluding premixes) corresponded mainly to poultry (57.7%), followed by pigs (29.2%) and cattle (9.6%). The share of other animal species in this body weight treated was relatively low: 2.4% for rabbits, 1.1% for sheep and goats, less than 0.1% for horses and domestic carnivores.
Figure 30: Change in body weight treated by oral forms (excluding premixes) based on colistin (tonnes)
Change in body weight treated parenterally according to the species
Since 2011, the use of colistin-based injections has been relatively stable (Figure 31).
In the cattle sector, the body weight treated by injections has fallen by 21.6% since 2011 and by 7.8% compared to the average calculated for 2014 and 2015.
In the pig sector, the body weight treated by injections has increased by 52.8% compared to 2011 but has fallen by 1.8% compared to the average calculated for 2014-2015.
In 2019, the body weight treated with colistin by the parenteral route corresponded mainly to cattle (73.0%) and pigs (23.8%). The percentages of body weight treated attributable to other species were relatively low: 1.9% for sheep and goats, 0.9% for horses, 0.2% for poultry and 0.2% for domestic carnivores.
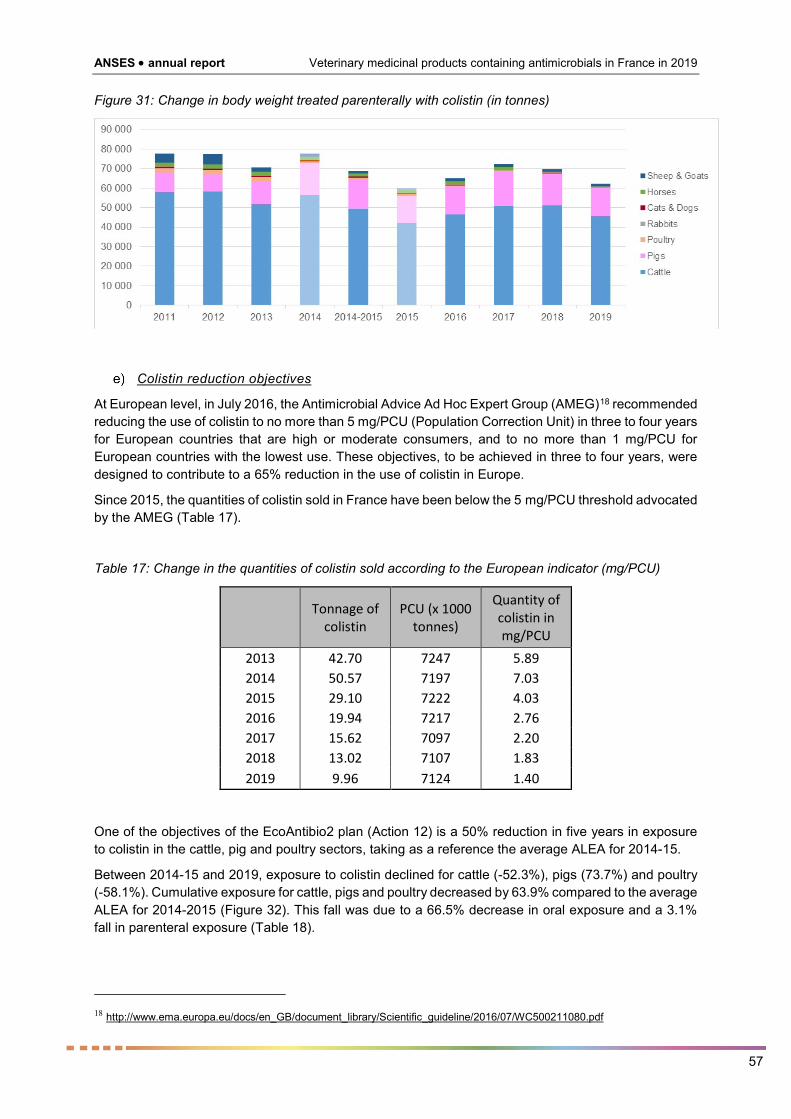
ANSES • annual report Veterinary medicinal products containing antimicrobials in France in 2019
57
Figure 31: Change in body weight treated parenterally with colistin (in tonnes)
Colistin reduction objectives
At European level, in July 2016, the Antimicrobial Advice Ad Hoc Expert Group (AMEG)18 recommended reducing the use of colistin to no more than 5 mg/PCU (Population Correction Unit) in three to four years for European countries that are high or moderate consumers, and to no more than 1 mg/PCU for European countries with the lowest use. These objectives, to be achieved in three to four years, were designed to contribute to a 65% reduction in the use of colistin in Europe.
Since 2015, the quantities of colistin sold in France have been below the 5 mg/PCU threshold advocated by the AMEG (Table 17).
Table 17: Change in the quantities of colistin sold according to the European indicator (mg/PCU)
Tonnage of colistin
PCU (x 1000 tonnes)
Quantity of colistin in mg/PCU
2013 42.70 7247 5.89 2014 50.57 7197 7.03 2015 29.10 7222 4.03 2016 19.94 7217 2.76 2017 15.62 7097 2.20 2018 13.02 7107 1.83 2019 9.96 7124 1.40
One of the objectives of the EcoAntibio2 plan (Action 12) is a 50% reduction in five years in exposure to colistin in the cattle, pig and poultry sectors, taking as a reference the average ALEA for 2014-15.
Between 2014-15 and 2019, exposure to colistin declined for cattle (-52.3%), pigs (73.7%) and poultry (-58.1%). Cumulative exposure for cattle, pigs and poultry decreased by 63.9% compared to the average ALEA for 2014-2015 (Figure 32). This fall was due to a 66.5% decrease in oral exposure and a 3.1% fall in parenteral exposure (Table 18).
18 http://www.ema.europa.eu/docs/en_GB/document_library/Scientific_guideline/2016/07/WC500211080.pdf

ANSES • annual report Veterinary medicinal products containing antimicrobials in France in 2019
58
Table 18: Change in colistin exposure according to species, comparing the 2019 ALEA with the average ALEA for 2014-2015
Cattle Pigs Poultry Cattle + Pigs + Poultry
All species
Change in ALEA -52.3% -73.7% -58.1% -63.9% -64.2% - Oral route -68.0% -75.4% -58.1% -66.5% -66.7% - Parenteral route -3.0% -0.8% -83.5% -3.1% -5.3%
Figure 32: Change in cumulative exposure to colistin for cattle, pigs and poultry
The share of colistin in total exposure to antimicrobials varies according to the species (Figure 33).
In 2014-2015, the ALEA for colistin as a percentage of total ALEA per species was close to 7% for cattle, 28% for pigs and 40% for poultry. These percentages all decreased in 2019 to 4% for cattle, 12% for pigs, and 33% for poultry.

ANSES • annual report Veterinary medicinal products containing antimicrobials in France in 2019
59
Figure 33: Change in the ALEA for colistin as a percentage of total ALEA per species

ANSES • annual report Veterinary medicinal products containing antimicrobials in France in 2019
60
VIII. Comparison of exposure calculations and indicators between the French and European approaches
1. Publication of the DDDvet and DCDvet values by the ESVAC
In April 2016, the ESVAC scheme published reference values (DDDvet and DCDvet) for three animal species19: cattle, pigs and broilers (poultry).
These values were established on the basis of marketing authorisation data from nine European countries, including France.
An average dose and an average treatment duration were therefore established for each active ingredient, route of administration and, in some cases, pharmaceutical form (medicated premixes).
The value of the DDDvet (defined daily dose for animals) corresponds to the dose in mg/kg, and the value of the DCDvet (defined course dose for animals) corresponds to the dose in mg/kg multiplied by the average duration of treatment.
The purpose of the ESVAC scheme is to better estimate animal exposure in Europe and enable a more effective analysis of the changes in exposure to antimicrobials for the different animal species.
2. Differences in the calculations between the French and European approaches
Since 2008, the annual report on sales of antimicrobials in France has presented results by species in number of ACDkg (body weight treated), in ALEA (equal to the number of ACDkg divided by the animal biomass) and in number of ADDkg (body weight treated-day).
The ADD and ACD values are defined according to the doses and treatment durations specified in the SPC for each veterinary medicinal product authorised in France. The maximum doses and treatment durations are generally used.
The European DDDvet and DCDvet reference values are not specific to a drug but depend on the active ingredient and the route of administration. These values are averages established by the ESVAC scheme according to the doses and durations authorised in different European countries.
In the framework of this report, a comparative analysis was performed for the years 2011 to 2019, using the European reference values on the one hand and the French reference values on the other.
3. Comparison by species for 2019
Body weight treated in 2019
When comparing the number of ACDkg (shown as nACD FR) and the number of DCDvet (shown as nDCDvet EU) for all three animal species, there is a difference of 10.0% for the body weight treated in 2019 (Figure 34). For the body weight treated calculated by species, the differences between the French and European approaches are 12.3% for cattle, 0.6% for pigs and 21.9% for poultry.
19 http://www.ema.europa.eu/ema/index.jsp?curl=pages/regulation/general/general_content_001493.jsp&mid

ANSES • annual report Veterinary medicinal products containing antimicrobials in France in 2019
61
Figure 34: Comparison of body weight treated in 2019 according to the French and European approaches (tonnes)
Body weight treated-day in 2019
When comparing the number of ADDkg (shown as nADD FR) and the number of DDDvet (shown as nDDDvet EU) for all three animal species, there is a difference of 14.2% for the body weight treated-day in 2019 (Figure 35). For the body weight treated-day calculated by species, the differences between the French and European approaches are 50.1% for cattle, 8.6% for pigs and 24.3% for poultry.
Figure 35: Comparison of body weight treated-day in 2019 according to the French and European approaches (tonnes)
The observed differences in body weight treated-day between the French or European reference values are therefore relatively large, except for pigs.
This can be explained by the different choices made to establish the reference values in Europe and in France: European values by active ingredient and route of administration versus French values specific to a drug; average doses and durations according to the drugs authorised in Europe versus maximum doses and durations for a drug authorised in France.

ANSES • annual report Veterinary medicinal products containing antimicrobials in France in 2019
62
4. Change in exposure indicators since 2011
Change in body weight treated since 2011
The changes in the numbers of ACDkg (FR) and numbers of DCDvet (EU) are very similar between 2011 and 2019 (Figure 36).
Figure 36: Change in body weight treated since 2011 according to the French and European approaches (tonnes)
Since 2011, the decrease in body weight treated for the three species is 48.9% according to the French reference values and 51.0% with the European reference values.
Change in body weight treated-day since 2011
The changes in the numbers of ADDkg (FR) and numbers of DDDvet (EU) are very similar between 2011 and 2019 (Figure 37).
Since 2011, the decrease in body weight treated-day for the three species is 61.8% according to the French reference values and 55.4% with the European reference values.

ANSES • annual report Veterinary medicinal products containing antimicrobials in France in 2019
63
Figure 37: Change in body weight treated-day since 2011 according to the French and European approaches (tonnes)
Change in animal exposure to antimicrobials
The number of DCDvet was compared to the French animal biomass in order to calculate an ALEA comparable to the ALEA used in the framework of the national monitoring.
Considering the three species (cattle, pigs and poultry), the indicator of exposure to antimicrobials (ALEA) has decreased by 48.2% since 2011 if the French reference values are used. The decrease in this indicator is 46.1% if using the European reference values.
Over the same period, considering the three species, the indicator of exposure to fluoroquinolones has decreased by 87.5% with the French values versus 86.9% with the European values.
For newer-generation cephalosporins, since 2011 the ALEA has decreased by 95.2% with the French values and by 94.9% with the European values.
Despite the differences in the French and European approaches for defining the reference values required for the ALEA calculations, the percentages of the decrease in animal exposure are very similar.

ANSES • annual report Veterinary medicinal products containing antimicrobials in France in 2019
64
IX. Discussion
1. Indicators of sales and indicators of exposure
The results of this sales survey of veterinary medicinal products containing antimicrobials should be interpreted with caution. In this report, the different indicators used describe different phenomena. It is very important to choose the most appropriate indicator to describe a specific change.
Antimicrobial sales expressed in weight of active ingredient do not reflect exposure to the different classes because the antimicrobials’ therapeutic activity is not taken into account. This may however be of interest for environmental studies.
It is therefore necessary to distinguish between indicators of "sales" (in mg of active ingredient and mg/kg, i.e. mass of active ingredient relative to the weight of the animal population) and indicators of exposure (body weight treated-day, body weight treated, ALEA).
The volume of sales in terms of the amount of active ingredient is an accurate measurement when applied to all species combined. When it is defined by species, it is based on an estimate of the breakdown of sales between different species potentially using antimicrobials and becomes an estimated measurement. All expressions of sales in terms of exposure indicators are estimated measurements. They result from the pharmaceutical companies’ estimates of the breakdown of sales by species, and dosages and durations of treatment specified by the MA that are sometimes unrelated to the dosages and durations actually applied in the field.
Since 2009, the breakdown between different species has been based on information provided by the MA holders. This information has been provided for all drugs intended for more than one target species.
The weight of the animal population used in this report corresponds to the weight of the animal population potentially treated with antimicrobials. The weights used for veal calves, rabbits, pigs and poultry are the weights at slaughter. These weights do not generally correspond to the weight at the time of treatment. This leads to an underestimation of actual exposure, although it has no influence on the overall trends observed.
The methodology used in this survey of sales of antimicrobials cannot accurately describe off-label use, even though the new approach introduced in 2009 (estimation by MA holders of the breakdown by species) partly takes this type of use into account.
2. Systems for collecting data on antimicrobials used in animals
The need for more precise data on the use of antimicrobials by species and animal category has been regularly reiterated at European level in recent years. From 2022, the new European Regulation (EU) 2019/6 on veterinary medicinal products will introduce the requirement for Member States to communicate data on antimicrobial sales. As stated in Article 57 of the Regulation published on 7 January 2019, the mandatory communication of data on antimicrobial use by species will have to be introduced progressively. The systems for transmitting data on cattle (distinguishing calves under one year old), pigs and poultry (chickens and turkeys) have to be operational before 28 January 2024. Those concerning all other food-producing animal species have to be operational three years later (by 2027), and six years later (by 2030) for other animals which are bred or kept (mainly pets).
In France, projects were initiated during the first EcoAntibio plan to better estimate antimicrobial exposure by species, animal category or physiological stage. This EcoAntibio plan (2012-2016) recommended the creation of self-assessment tools for breeders and veterinarians on antimicrobial usage in animal husbandry.

ANSES • annual report Veterinary medicinal products containing antimicrobials in France in 2019
65
In this context, the French Pork and Pig Institute (IFIP) and ANSES-ANMV put in place the GVET20 approach on management of veterinary treatments. This approach has two complementary objectives: to modernise the register of treatments and measure antimicrobial usage in animal husbandry. The IFIP and ANSES-ANMV have given specific requirements to software developers to ensure that data on the use of antimicrobials in animal husbandry can be collected and monitored. This computerised livestock register enables breeders to monitor their antimicrobial usage through indicators such as the number of treatments and the number of days of treatment per pig for each holding.
A permanent observatory on the use of antimicrobials in veal calf farms21 was set up by ANSES-ANMV and the French Livestock Institute (IDELE) at the request of the INTERBEV Veaux association. Launched in 2016 and deployed with a panel of volunteer breeders, this approach yielded initial results calculated according to various simple and comparable standardised indicators. The data from this observatory supplement those from the annual sales survey. The data are analysed with a software tool specifically developed at ANSES-ANMV to enable farmers, together with livestock technicians and veterinarians, to assess their antimicrobial use practices. The observatory's first results22 were published in 2018. A professional network was set up to produce references on the use of antimicrobials in poultry farming. This national network, called RefA²vi, aims to produce regular references on antimicrobial exposure indicators for each poultry species. The results from the network's first year of operation23, which consisted of a pilot phase of data collection from volunteer production organisations, were published in 2019. These data were analysed by a working group made up of representatives of ITAVI, ANSES and the ANVOL inter-professional association. The method used to calculate the indicators is broadly based on that of the ALEA and provides references by poultry species, in particular turkeys and broilers.
The Act on the future of agriculture, food and forestry (LAAAF24, Act No. 2014-1170 of 13 October 2014) introduced mandatory reporting of antimicrobial sales throughout France. This law (amended by Act No. 2019-774 of 24 July 2019 on the organisation and transformation of the healthcare system) concerns marketing authorisation (MA) holders, companies manufacturing and distributing medicated feedingstuffs, veterinarians and pharmacists.
A report25 published in July 2019 provides an initial analysis of the data submitted by manufacturers and distributors of medicated feedingstuffs for the first two quarters of 2018. These data have enabled an initial comparison to be made with data obtained from the national monitoring of antimicrobial sales based on reports from MA holders; it showed that these two reporting systems were highly concordant. The sales reports from MA holders and operators appear to slightly overestimate the reports for pigs and poultry and, conversely, to underestimate the reports for sheep/goats, other species (especially game) and rabbits. One possible interpretation is that the reports of sales of medicated premixes by MA operators do not sufficiently take into account the use of antimicrobials for minor species, which occur as part of the therapeutic "cascade" outside the recommendations of the MA. Analysis of all the 2018 data confirmed these results.
The reports of antimicrobial sales by other beneficiaries, veterinary practitioners and pharmacists will provide more precise information for other pharmaceutical forms. The Calypso project, led by the Directorate General for Food, is seeking to set up a specific computer system for managing, reporting
20 https://ifip.asso.fr/fr/content/gestion-informatique-des-traitements-v%C3%A9t%C3%A9rinaires-gr%C3%A2ce-%C3%A0-gvet 21 http://idele.fr/reseaux-et-partenariats/inosys-reseaux-delevage/publication/idelesolr/recommends/observatoire-antibiotique-lexposition-des-veaux-de-boucherie-aux-antibiotiques-a-diminue-de-40-e.html 22 http://www.journees3r.fr/IMG/pdf/texte_3_reduction_intrants_m-chanteperdrix-2.pdf 23https://www.itavi.asso.fr/content/reseau-professionnel-de-references-sur-les-usages-dantibiotiques-en-elevage-avicole 24 http://www.legifrance.gouv.fr/affichLoiPubliee.do;jsessionid=5691BBA0E2987B8FCBB6195E53853F64.tpdjo07v_2?type=general&idDocument=JORFDOLE000028196878 25 https://www.anses.fr/fr/system/files/Rapport_Am-AB-T1_T2.pdf

ANSES • annual report Veterinary medicinal products containing antimicrobials in France in 2019
66
and consulting data. The analysis of these exhaustive data will in time complement that of the sales data currently reported by MA holders, as it is much finer and more detailed.
3. Change in exposure of animals to antimicrobials
Exposure to antimicrobials
Since monitoring of sales began in 1999, the Animal Level of Exposure to Antimicrobials (ALEA) has declined by 41.3% in France, all routes and species combined. Since 2011, overall exposure has decreased by 45.3%: by 74.4% for medicated premixes, 51.4% for oral powders and solutions, and 15.2% for injections. Exposure to antimicrobials has declined for all species compared to 2011: -25.5% for cattle, -54.0% for pigs, -60.5% for poultry, -41.4% for rabbits and -13.9% for domestic carnivores.
The sharp drop observed since 2011 has continued, and overall animal exposure fell by 10.9% between 2018 and 2019. Over the last year, exposure has fallen by 16.7% for oral powders and solutions, 6.6% for medicated premixes and 6.0% for injections. Between 2018 and 2019, the change in exposure varied according to the species: -9.9% for cattle, -16.4% for pigs, -12.8% for poultry, +1.5% for rabbits and +2.1% for domestic carnivores. The number of intramammary treatments per dairy cow has decreased by 15.4% since 2018.
Exposure to fluoroquinolones and newer-generation cephalosporins
Third- and fourth-generation cephalosporins and fluoroquinolones are considered as particularly important in human medicine because they are among the only alternatives for the treatment of certain infectious diseases in humans.
In 2018, animal exposure to newer-generation cephalosporins had fallen by 93.8% compared to 2013. In 2019, the decline in exposure continued, and was estimated to be 94.1% compared to 2013, all species combined. Between 2018 and 2019, a decrease in exposure was observed for all species, except for domestic carnivores (+1.5%).
The number of intramammary treatments per dairy cow based on newer-generation cephalosporins decreased by 98.9% between 2013 and 2019. Note that the number of treatments has doubled since 2018. The increase was mainly observed for treatments administered during the lactation period. According to the reported data, the number of dairy cows treated by the intermammary route with newer-generation cephalosporins represented 0.26% of animals in 2019 (versus 0.13% in 2018). The change is explained by a lag in the reported sales figures for 2018 for some drugs, and does not necessarily reflect a change in the use of these intramammary treatments.
Regarding fluoroquinolones, in 2018, exposure had declined by 86.1% compared to 2013. In 2019, exposure fell by 86.0% compared to 2013. Over the last year, a slight increase of +0.7% has been observed, especially with injections (+2.8% for all species combined). Between 2018 and 2019, exposure to fluoroquinolones increased for cattle, domestic carnivores and horses, while it decreased for pigs and poultry.
Since 2017, the frequency of treatment with critically important antimicrobials has become very low. All species combined, the ALEA in 2019 for fluoroquinolones was equal to 0.003; this means that this class of antimicrobials was used to treat 0.3% of the animal biomass in France. The ALEA in 2019 for newer-generation cephalosporins was 0.001.
Since 2016, the decrease in the use of third- and fourth-generation cephalosporins and fluoroquinolones has mainly resulted in a limited shift to sulfonamides, trimethoprim and aminoglycosides for the parenteral treatment of cattle. For pigs, the shift seems to concern injections containing penicillins, aminoglycosides, phenicols and macrolides. For domestic carnivores, an increase in exposure to penicillins associated with clavulanic acid and first- and second-generation cephalosporins was observed for the oral route.
ANSES • annual report Veterinary medicinal products containing antimicrobials in France in 2019
67
The changes in exposure to critical antimicrobials, along with the shifts in uses to other classes of antimicrobials, need to be monitored in the coming years.
Exposure to colistin
An article published in November 2015 describing the first plasmid-mediated mechanism of resistance to colistin led to the establishment of reinforced surveillance for this antimicrobial.
At European level, in July 2016, the Antimicrobial Advice Ad Hoc Expert Group (AMEG)26 recommended reducing the use of colistin within three to four years to no more than 5 mg/PCU (Population Correction Unit) for European countries that are high or moderate consumers, and no more than 1 mg/PCU for European countries with the lowest use of colistin.
In France, in its report27 on colistin (October 2016), ANSES recommended a 50% reduction in the use of colistin. Following this opinion, the EcoAntibio2 plan (Action 12) set a five-year goal of a 50% reduction in exposure to colistin in the cattle, pig and poultry sectors, taking the average ALEA for 2014-2015 as a reference.
In 2019, exposure to colistin decreased by 64.2% compared to the average exposure calculated for 2014 and 2015, and by 73.1% compared to 2011 (all species and routes of administration combined). Colistin exposure has continued to decrease over the last year for the main user species: -8.2% for cattle, -28.5% for pigs and -17.8% for poultry.
Between 2014-15 and 2019, exposure to colistin fell for pigs (-73.7%), poultry (-58.1%) and cattle (-52.3%). The objective set by the EcoAntibio 2017-2021 plan to reduce exposure by 50% has been achieved for the three sectors.
Calculating the results in mg/PCU according to the standards defined by the ESVAC scheme, the value obtained for colistin in 2019 was 1.40 mg/PCU while it was 5.89 mg/PCU in 2013. In 2019, the quantities of colistin sold in France were therefore below the 5 mg/PCU threshold advocated by the AMEG.
26 http://www.ema.europa.eu/docs/en_GB/document_library/Scientific_guideline/2016/07/WC500211080.pdf 27 https://www.anses.fr/fr/system/files/MV2016SA0160.pdf

ANSES • annual report Veterinary medicinal products containing antimicrobials in France in 2019
68
X. Conclusion
The information gathered through this national monitoring scheme is one of the essential elements, together with monitoring of bacterial resistance, needed for assessing the risks associated with antimicrobial resistance.
The new EcoAntibio 2017-2021 plan aims to ensure that the decline in animal exposure to antibiotics is sustained. The sharp drop observed since 2011 has continued and overall animal exposure fell by 10.9% between 2018 and 2019. Over the last year, the change in exposure has varied according to the species: a decrease in exposure can be observed for pigs, poultry and cattle, while exposure has increased slightly for domestic carnivores and rabbits.
Exposure to antimicrobials regarded as critical has fallen by 86.0% for fluoroquinolones and 94.1% for newer-generation cephalosporins, compared to 2013. This decrease in exposure concerned all species. These encouraging results followed publication of a Decree and an Interministerial Order in 2016 seeking to regulate the prescription and dispensing of drugs used in veterinary medicine and containing antibiotics of critical importance. After a sharp decline observed between 2013 and 2016, exposure to critical antimicrobials appears to have stabilised over the last three years.
By 2019, exposure to colistin had fallen by 64.2% compared to the average exposure calculated for 2014 and 2015. The objective set by the EcoAntibio 2017-2021 plan to reduce exposure by 50% has been achieved for the pig, cattle and poultry sectors.
Results for 2019 indicate that overall exposure of animals to antimicrobials has fallen compared to 2018. For some classes of antimicrobials, it seems that the reduction in use has reached a limit. The momentum for the prudent and responsible use of antimicrobials in veterinary medicine must be maintained by all stakeholders. The EcoAntibio 2 plan aims in particular to consolidate the achievements and pursue the actions previously undertaken in the first national plan.

ANSES • annual report Veterinary medicinal products containing antimicrobials in France in 2019
69
XI. Annexes
Table 1: Numbers of animals potentially using antimicrobials between 1999 and 2019....................... 70
Table 2: Biomasses of animal populations potentially using antimicrobials from 1999 to 2019 (in tonnes) ............................................................................................................................................................... 75
Table 3: Change in the weight of active ingredient by pharmaceutical form (in tonnes)....................... 76
Table 4: Change in body weight treated-day by pharmaceutical form (Number of ADDkg in tonnes) . 77
Table 5: Change in body weight treated by pharmaceutical form (Number of ACDkg in tonnes) ........ 78
Table 6: Change in sales by antimicrobial class since 1999 in tonnes of active ingredient .................. 79
Table 7: Change in sales by antimicrobial class since 1999 in body weight treated-day (number of ADDkg in tonnes) .................................................................................................................................. 80
Table 8: Change in sales by antimicrobial class since 1999 in body weight treated (number of ACDkg in tonnes) ................................................................................................................................................... 81
Table 9: Change in sales for cattle and in their exposure to antimicrobials .......................................... 82
Table 10: Change in body weight treated-day by antimicrobial class for cattle (number of ADDkg in tonnes) ................................................................................................................................................... 83
Table 11: Change in body weight treated by antimicrobial class for cattle (number of ACDkg in tonnes) ............................................................................................................................................................... 84
Table 12: Change in sales for pigs and in their exposure to antimicrobials .......................................... 85
Table 13: Change in body weight treated-day by antimicrobial class for pigs (number of ADDkg in tonnes) ................................................................................................................................................... 86
Table 14: Change in body weight treated by antimicrobial class for pigs (number of ACDkg in tonnes) ............................................................................................................................................................... 87
Table 15: Change in sales for poultry and in their exposure to antimicrobials ...................................... 88
Table 16: Change in body weight treated-day by antimicrobial class for poultry (number of ADDkg in tonnes) ................................................................................................................................................... 89
Table 17: Change in body weight treated by antimicrobial class for poultry (number of ACDkg in tonnes) ............................................................................................................................................................... 90
Table 18: Change in sales for rabbits and in their exposure to antimicrobials ...................................... 91
Table 19: Change in body weight treated-day by antimicrobial class for rabbits (number of ADDkg in tonnes) ................................................................................................................................................... 92
Table 20: Change in body weight treated by antimicrobial class for rabbits (number of ACDkg in tonnes) ............................................................................................................................................................... 93
Table 21: Change in sales for cats and dogs and in their exposure to antimicrobials .......................... 94
Table 22: Change in body weight treated-day by antimicrobial class for cats and dogs (number of ADDkg in tonnes) ............................................................................................................................................... 95
Table 23: Change in body weight treated by antimicrobial class for cats and dogs (number of ACDkg in tonnes) ................................................................................................................................................... 96

ANSES • annual report Veterinary medicinal products containing antimicrobials in France in 2019
70
1. Animal population data
Table 1: Numbers of animals potentially using antimicrobials between 1999 and 2019
Table 1. A: Cattle (number of animals)
Type/ Species
Dairy cows
Suckler cows
1 to 2 yr old dairy heifers
> 2 yr old dairy
heifers
1 to 2 yr old beef heifers
> 2 yr old beef
heifers
1 to 2 yr old other females
> 2 yr old other
females
1 to 2 yr old
bullocks > 2 yr old bullocks
Non-castrated
males 0 to 1 yr
old cattle 1 to 2 yr
old males > 2 yr old
males
Veal calves
(slaugh-tered)
BW in kg 650 750 350 500 450 550 400 500 450 700 650 200 400 700 150
1999 4,424,000 4,071,000 1,350,846 951,154 980,827 906,000 393,000 294,000 303,938 273,062 971,562 5,169,611 1,887,941
2000 4,153,000 4,214,000 1,418,000 974,000 1,044,000 943,000 303,000 318,000 315,000 283,000 918,000 5,706,000 1,843,013
2001 4,195,000 4,293,000 1,433,000 1,009,000 1,085,000 946,000 404,000 320,000 315,000 283,000 1,105,438 5,612,562 1,882,763
2002 4,128,000 4,095,000 1,396,000 1,009,000 1,009,000 957,000 383,000 402,000 372,000 314,000 906,509 5,494,491 1,862,961
2003 4,012,000 4,040,000 1,380,000 1,002,000 970,000 918,000 334,000 362,000 302,000 304,000 754,000 4,961,000 1,822,579
2004 3,803,000 4,166,000 1,346,000 982,000 971,000 891000 315,000 327,000 290,000 260,000 774,000 4,994,000 1,751,708
2005 3,957,858 4,068,096 2,035,440 1,899,069 535,667 481,770 633,675 4,611,368 1,750,492
2006 3,882,195 4,156,628 1,147,598 815,049 1,068,008 869,811 270,742 228,202 4,947,374 922,177 447,909 1,700,867
2007 3,869,936 4,247,432 1,120,796 800,649 1,086,069 891,863 295,220 240,939 5,002,669 951,291 453,517 1,564,549
2008 3,863,435 4,313,976 1,109,701 778,266 1,175,059 980,352 304,547 248,282 4,989,176 990,268 499,047 1,506,004
2009 3,747,886 4,271,801 1,188,085 804,095 1,095,383 1,080,162 294,743 258,280 4,816,839 981,930 512,824 1,449,910
2010 3,732,707 4,299,792 1,161,313 834,652 1,026,254 1,026,119 281,584 253,951 4,838,766 709,607 502,191 1,430,931
2011 3,664,153 4,145,382 1,150,334 805,082 942,066 879,626 363,906 330,863 4,887,805 846860 415745 1,396,702
2012 3,643,200 4,109,861 1,171,956 763,931 949,755 852,355 369,777 318,016 4,899,743 880355 396153 1,355,721
2013 3,697,232 4,101,296 1,180,161 779,828 972,396 886,555 376,364 329,521 4,812,509 908,799 409,968 1,311,016
2014 3,698,450 4,138,148 1,204,838 782,487 944,565 910,828 373,930 334,758 4,921,261 892402 422,434 1,286,756
2015 3,661,183 4,207,412 1,242,113 790,870 970,862 893,365 385,612 332,622 4,989,541 860,654 424,203 1,266,898
2016 3,637,015 4,243,082 1,253,823 783,033 984,884 907,090 388,184 335,260 4,943,925 847,632 418,828 1,267,899
2017 3,596,837 4,154,472 1,211,655 826,872 960,221 959,458 376,103 356,093 4,677,493 833,380 407,635 1,243,073
2018 3,554,232 4,094,903 1,081,963 695,731 934,343 911,080 390,975 473,173 4,685,327 775,097 401,463 1,258,622
2019 3,488,006 4,012,080 1,072,731 654,167 1,028,905 880,180 307,745 450,132 4,571,712 776,657 392,088 1,244,237

ANSES • annual report Veterinary medicinal products containing antimicrobials in France in 2019
71
Table 1. B: Pigs, poultry and rabbits (number of slaughtered animals, except for female rabbits - number of live animals)
Pigs Poultry Rabbits
Type/Species Cull animals Sows (number) Fattening pigs Broilers Turkeys Ducks Guinea fowl Laying hens Pigeons Quails Geese Female
rabbits Rabbits
BW in kg 350 300 105 1.8 10 4 1.4 2 0.65 0.5 8 4 2.5
1999 608,698 1,029,000 25,490,863 777,896,300 105,470,400 69,566,800 32,725,000 49,054,000 4,303,000 52,907,000 480,000 1,446,000 53,273,000
2000 580,334 1,210,208 25,291,317 734,563,400 113,860,700 73,494,900 34,760,000 48,145,000 4,484,000 52,907,000 612,000 1,376,000 52,279,000
2001 581,548 1,369,000 24,815,811 782,180,300 112,554,300 79,505,400 36,988,000 49,052,000 4,122,000 60,100,000 616,000 1,335,000 52,157,000
2002 582,418 1,360,000 25,102,459 729,489,300 98,661,300 79,243,900 31,071,000 48,664,000 4,303,000 60,400,000 692,000 1,293,000 52,179,000
2003 541,406 1,328,000 25,000,385 739,219,300 95,575,100 73,878,900 29,208,000 49,050,000 3,875,000 54,206,000 645,000 1,196,000 49,647,000
2004 521,412 1,302,000 24,757,765 694,837,500 93,668,900 73,384,800 29,020,000 47,224,000 3,875,000 47,364,000 560,000 1,181,000 50,129,000
2005 491,911 1,266,951 24,359,049 715,915,700 81,146,300 76,148,200 29,902,000 46,753,000 4,300,000 49,400,000 458,000 1,127,000 49,364,000
2006 484,950 1,256,179 24,184,591 636,178,400 72,834,400 74,863,200 27,284,000 45,703,000 3,600,000 46,952,000 469,000 1,053,000 47,994,000
2007 471,395 1,224,100 24,457,730 699,511,600 70,220,900 79,114,700 28,092,000 45,213,000 3,400,000 50,786,000 474,000 1,061,000 48,529,000
2008 445,213 1,225,574 24,539,585 711,875,400 62,857,200 79,134,200 27,936,000 45,990,000 3,400,000 55,137,000 462,000 1,012,000 39,941,000
2009 423,514 1,207,500 24,192,857 718,368,200 58,024,100 75,137,100 27,168,000 45,306,000 3,400,000 47,540,000 448,000 893,000 36,757,000
2010 396,998 1,162,135 24,189,737 740,246,900 56,187,900 77,105,400 26,457,000 46,564,000 11,108,971 52,890,000 324,000 878,000 35,752,000
2011 396,397 1,105,817 24,073,359 781,104,600 53,824,600 79,177,800 26,714,000 42,906,000 11,108,971 53,563,000 296,000 871,000 38,943,000
2012 384,557 1,074,340 23,464,399 767,394,000 50,217,000 77,918,000 24,954,000 43,050,000 11,108,971 53,542,000 295,000 835,000 37,242,000
2013 356,481 1,046,738 23,161,982 790,002,000 44,267,000 74,888,000 24,761,000 48,826,000 11,108,971 54,849,000 249,000 825,000 36,586,000
2014 357,042 1,040,948 23,021,543 745,949,000 45,996,000 76,127,000 25,092,000 49,146,000 11,108,971 52,679,000 241,000 837,000 37,439,000
2015 368,068 1,023,343 22,991,646 777,069,000 45,482,000 76,657,000 25,229,000 50,452,000 11,108,971 51,164,000 226,000 871,000 36,700,000
2016 366,176 993,896 23,161,017 754,772,000 44,995,000 66,232,000 25,539,000 48,485,000 11,108,971 51,130,000 167,000 768,000 33,247,000
2017 348,304 1,005,348 22,765,955 757,124,000 42,097,000 63,454,000 24,920,000 50,504,000 11,108,971 49,467,000 153,000 732,000 31,493,000
2018 351,875 1,026,525 22,836,279 754,039,000 41,249,000 73,183,000 26,130,000 47,971,000 11,108,971 48,143,000 147,000 713,000 30,215,000
2019 336,313 991,711 22,935,989 734,777,000 39,333,000 71,428,000 24,929,000 45,950,000 11,108,971 43,242,000 150,000 670,000 29,296,000

ANSES • annual report Veterinary medicinal products containing antimicrobials in France in 2019
72
Table 1. C: Companion and sports animals (number of animals)
Domestic carnivores Horses Other
Type/ Species Dogs Cats Sport horses Draught horses Donkeys Ponies Birds Small mammals
Body weight (kg) 15 4 550 850 350 300 0.1 0.5
1999 8,100,000 8,700,000 634,110 93,170 92,622 257,943 7,100,000 1,800,000
2000 8,100,000 9,000,000 634,110 93,170 92,622 257,943 7,000,000 2,000,000
2001 8,800,000 9,400,000 635,586 92,237 99,178 258,543 8,100,000 4,900,000
2002 8,780,000 9,670,000 665,203 91,566 100,612 270,591 8,000,000 2,320,000
2003 8,600,000 9,700,000 667,176 90,920 104,390 271,394 6,700,000 4,100,000
2004 8,510,000 9,940,000 671,459 91,368 105,039 273,136 6,590,000 3,770,000
2005 8,510,000 9,940,000 673,177 89,613 106,544 273,835 6,590,000 3,770,000
2006 8,080,000 10,040,000 666,785 88,217 106,639 271,234 3,680,000 2,940,000
2007 8,080,000 10,040,000 671,715 87,371 104,864 273,240 3,680,000 2,940,000
2008 7,800,000 10,700,000 673,371 91,304 102,718 273,913 3,500,000 3,200,000
2009 7,800,000 10,700,000 681,036 92,344 103,887 277,032 3,500,000 3,200,000
2010 7,590,000 10,960,000 685,364 92,931 104,547 278,792 6,040,000 3,010,000
2011 7,590,000 10,960,000 686,428 93,075 104,709 279,225 6,040,000 3,010,000
2012 7,420,000 11,410,000 683,148 92,630 104,209 277,891 6,430,000 2,660,000
2013 7,420,000 11,410,000 674,990 91,524 102,965 274,572 6,430,000 2,660,000
2014 7,255,940 12,680,251 662,687 89,856 101,088 269,568 5,750,000 2,840,000
2015 7,255,940 12,680,251 647,637 87,815 98,792 263,446 5,750,000 2,840,000
2016 7,333,995 13,478,046 627,556 85,092 95,729 255,277 5,790,000 3,370,000
2017 7,333,995 13,478,046 628,192 79,226 92,051 255,536 5,790,000 3,370,000
2018 7,600,000 14,200,000 621,675 78,852 90,625 252,885 5,790,000 3,370,000
2019 7,600,000 14,200,000 624,123 77,031 86,417 253,881 4,700,000 3,700,000

ANSES • annual report Veterinary medicinal products containing antimicrobials in France in 2019
73
Table 1. D: Sheep and goats (number of animals)
Type/Species Goats Kids Dairy ewes Meat ewes Covered ewe lambs Maiden ewes Lambs Other sheep
BW in kg 50 9.76 60 80 45 20 15 45
1999 1,362,341 741,132 1,297,000 5,157,000 937,000 348,000 5,336,584 1,771,000
2000 1,362,341 704,766 1,366,038 5,160,188 1,205,963 5,422,589 1,782,514
2001 1,373,565 697,977 1,332,571 4,985,757 1,247,369 5,400,786 1,823,812
2002 1,380,109 725,605 1,329,870 4,884,497 1,265,207 5,120,916 1,819,113
2003 1,370,811 746,987 1,327,743 4,841,187 1,270,733 5,045,598 1,815,842
2004 1,358,242 761,582 1,309,756 4,787,806 1,268,457 4,826,975 1,785,370
2005 1,360,945 913,258 1,299,846 4,749,568 1,262,518 4,724,274 1,760,340
2006 1,367,788 762,212 1,276,350 4,613,460 1,201,634 4,623,501 1,733,031
2007 1,358,729 751,800 1,252,817 4,523,942 1,165,785 4,581,528 1,668,163
2008 1,361,983 707,965 1,272,811 4,168,244 1,118,348 4,233,962 1,562,301
2009 1,410,567 658,507 1,280,508 4,054,899 1,133,234 3,868,100 1,552,740
2010 1,437,620 686,549 1,324,055 3,980,852 1,151,674 3,860,200 1,465,573
2011 1,381,209 707,988 1,297,651 3,851,261 1,103,628 3,958,707 1,406,231
2012 1,307,753 678,094 1,290,933 3,713,872 1,067,159 3,796,118 1,389,970
2013 1,290,623 625,791 1,238,433 3,617,338 1,040,389 3,662,175 1,342,897
2014 1,284,667 589,959 1,230,484 3,562,465 1,057,836 3,688,342 1,330,345
2015 1,261,684 570,425 1,231,793 3,460,147 1,069,763 3,646,166 1,302,838
2016 1,258,204 593,939 1,234,120 3,416,186 1,062,975 3,747,993 1,332,689
2017 1,270,737 549,781 1,247,035 3,333,294 1,054,243 3,622,569 1,266,884
2018 1,302,107 556,555 1,255,072 3,408,470 1,080,978 3,643,552 1,304,200
2019 1,311,688 546,732 1,321,792 3,397,937 1,088,830 3,626,936 1,337,572

ANSES • annual report Veterinary medicinal products containing antimicrobials in France in 2019
74
Table 1. E: Fish (production in kg)
Type/Species Trout Carp Salmon Bass Bream Turbot Sturgeon Other
1999 46,160,000 6,000,000 3,150,000 1,000,000 900,000 110,000
2000 47,500,000 6,000,000 3,600,000 1,400,000 1,000,000 130,000
2001 47,500,000 6,000,000 3,000,000 1,700,000 700,000 150,000
2002 42,900,000 6,000,000 5,000,000 3,500,000 1,500,000 750,000 150,000
2003 37,000,000 6,000,000 800,000 3,700,000 1,100,000 909,000 170,000 1,100,000
2004 37,500,000 6,000,000 70,000 4,000,000 1,600,000 949,000 200,000 1,047,000
2005 34,000,000 6,000,000 1,200,000 4,300,000 1,900,000 791,000 250,000 1,167,000
2006 34,000,000 6,000,000 1,600,000 5,585,000 2,200,000 870,000 250,000 1,182,000
2007 34,000,000 6,000,000 1,800,000 4,764,000 1,392,000 850,000 250,000 1,135,000
2008 34,000,000 6,000,000 0 3,968,000 1,636,000 850,000 250,000 1,106,000
2009 34,000,000 6,000,000 0 3,204,000 1,648,000 531,000 250,000 1,021,000
2010 34,000,000 4,000,000 802,000 2,779,000 1,377,000 394,000 380,000 1,310,000
2011 36,000,000 3,500,000 700,000 3,000,000 1,500,000 300,000 280,000 1,600,000
2012 36,000,000 3,500,000 300,000 2,300,000 1,300,000 250,000 250,000 1,140,000
2013 32,000,000 3,500,000 300,000 1,970,000 1,477,000 255,000 280,000 923,000
2014 34,000,000 3,000,000 300,000 2,021,000 1,105,000 279,000 298,000 1,138,000
2015 36,713,000 3,000,000 300,000 1,980,000 1,502,000 303,000 241,000 982,000
2016 37,200,000 3,000,000 450,000 1,928,000 1,671,000 288,000 450,000 984,000
2017 37,200,000 3,000,000 450,000 1,928,000 1,671,000 288,000 450,000 984,000
2018 37,200,000 3,000,000 450,000 1,928,000 1,671,000 288,000 450,000 984,000
2019 37,200,000 3,000,000 450,000 1,928,000 1,671,000 288,000 450,000 984,000

ANSES • annual report Veterinary medicinal products containing antimicrobials in France in 2019
75
Table 2: Biomasses of animal populations potentially using antimicrobials from 1999 to 2019 (in tonnes)
Cattle Pigs Poultry Rabbits Cats & Dogs Sheep & Goats Horses Fish Other Total
1999 10,397,639 3,198,285 2,907,401 138,967 156,300 767,366 537,755 57,320 30,652 18,191,685
2000 10,466,102 3,221,768 2,931,104 136,202 157,500 778,715 537,755 59,630 30,860 18,319,635
2001 10,746,012 3,219,902 3,036,354 135,733 169,600 766,708 540,249 59,050 32,184 18,705,792
2002 10,436,923 3,247,604 2,793,233 135,620 170,380 755,166 560,084 59,800 31,002 18,189,811
2003 9,982,187 3,212,933 2,753,116 128,902 167,800 750,080 562,184 50,779 31,484 17,639,463
2004 9,852,206 3,172,660 2,644,174 130,047 167,410 739,349 565,670 51,366 31,308 17,354,188
2005 9,278,685 3,109,954 2,566,981 127,918 167,410 732,896 565,860 49,608 31,308 16,630,620
2006 9,558,491 3,085,968 2,329,518 124,197 161,360 715,460 560,410 51,687 30,602 16,617,692
2007 9,665,091 3,100,280 2,436,728 125,567 161,360 701,271 562,383 50,191 30,293 16,833,164
2008 9,807,349 3,100,153 2,388,839 111,997 159,800 668,976 566,088 47,810 30,405 16,623,560
2009 9,724,506 3,050,730 2,329,853 102,609 159,800 657,068 572,532 46,654 30,405 16,674,156
2010 9,558,447 3,027,512 2,361,950 99,916 157,690 652,172 576,170 45,042 34,972 16,478,900
2011 9,331,444 2,998,187 2,386,525 107,810 157,690 634,255 577,065 46,880 34,972 16,274,827
2012 9,258,486 2,920,659 2,345,318 103,125 156,940 587,405 574,307 45,040 34,836 16,026,116
2013 9,332,284 2,870,798 2,325,960 101,365 156,940 570,503 567,449 40,705 34,836 16,000,840
2014 9,393,431 2,854,511 2,268,865 103,642 159,560 565,165 557,106 42,141 34,858 15,979,279
2015 9,443,444 2,849,950 2,323,787 102,202 159,560 554,086 544,454 45,021 34,858 16,057,362
2016 9,452,929 2,858,237 2,233,093 92,334 163,922 553,500 527,572 45,971 35,127 15,962,685
2017 9,320,258 2,813,936 2,199,463 87,517 163,922 542,822 521,726 45,971 35,127 15,730,742
2018 9,139,427 2,828,923 2,220,264 84,094 170,800 553,481 516,530 45,971 35,127 15,594,616
2019 8,960,176 2,823,502 2,151,262 81,280 170,800 558,434 515,154 45,971 35,183 15,341,763

ANSES • annual report Veterinary medicinal products containing antimicrobials in France in 2019
76
2. Change in sales and exposure to antimicrobials between 1999 and 2019
Table 3: Change in the weight of active ingredient by pharmaceutical form (in tonnes)
MEDICATED PREMIXES
ORAL POWDERS & SOLUTIONS
OTHER ORAL FORMS INJECTIONS
INTRAMAMMARY &
INTRAUTERINE TOTAL
1999 853 285 19 139 15 1311
2000 878 332 19 139 15 1383
2001 821 384 18 137 14 1374
2002 732 431 18 131 14 1326
2003 687 451 18 124 14 1293
2004 651 465 18 114 12 1260
2005 653 495 19 116 12 1295
2006 626 459 20 120 11 1237
2007 712 474 19 110 11 1327
2008 627 405 20 109 11 1171
2009 536 393 18 102 10 1059
2010 496 388 19 102 10 1015
2011 407 369 19 104 10 910
2012 308 346 18 105 9 786
2013 267 315 17 101 8 708
2014 276 378 19 107 8 788
2015 210 194 15 87 8 514
2016 199 213 17 93 8 530
2017 162 223 16 91 7 499
2018 137 219 17 91 8 472
2019 133 182 17 83 6 422
Variation 2019 / 2018
-4 -37 0 -8 -1 -50
-2.8% -16.8% 0.4% -8.6% -16.7% -10.5%
Variation 2019 / 2011
-274 -187 -2 -21 -4 -485
-67.2% -50.6% -11.0% -20.0% -37.4% -53.3%

ANSES • annual report Veterinary medicinal products containing antimicrobials in France in 2019
77
Table 4: Change in body weight treated-day by pharmaceutical form (Number of ADDkg in tonnes)
MEDICATED PREMIXES
ORAL POWDERS & SOLUTIONS
OTHER ORAL FORMS INJECTIONS TOTAL
1999 41,937,523 15,687,276 681,490 7,282,096 65,588,385
2000 45,487,889 18,997,926 698,755 7,338,997 72,523,567
2001 43,996,214 22,165,044 687,477 7,254,173 74,102,908
2002 41,895,291 24,911,326 718,661 7,152,465 74,677,743
2003 40,038,192 26,299,946 726,073 7,014,127 74,078,338
2004 35,921,980 26,804,473 725,666 6,513,929 69,966,048
2005 33,923,490 28,952,099 772,720 6,853,123 70,501,432
2006 34,275,063 27,420,511 794,301 7,066,749 69,556,624
2007 37,243,221 27,819,999 796,317 6,599,644 72,459,181
2008 31,973,271 24,447,844 814,218 6,791,781 64,027,114
2009 29,339,104 24,624,010 782,951 6,293,935 61,040,000
2010 26,929,498 24,727,098 789,914 6,498,653 58,945,163
2011 22,268,222 23,654,185 755,115 6,486,296 53,163,818
2012 16,145,372 22,412,893 692,001 6,624,614 45,874,880
2013 13,496,041 20,353,596 697,294 6,506,209 41,053,140
2014 13,972,326 24,616,281 763,763 6,600,794 45,953,164
2015 10,659,440 12,301,933 591,914 5,007,091 28,560,378
2016 8,038,695 13,518,872 669,995 5,118,317 27,345,879
2017 6,497,851 13,844,517 675,657 4,643,820 25,661,845
2018 5,452,429 13,431,974 700,437 4,784,568 24,369,408
2019 4,819,232 10,943,305 698,840 4,387,752 20,849,129
Variation 2019 / 2018
-633,197 -2,488,669 -1,597 -396,816 -3,520,279
-11.6% -18.5% -0.2% -8.3% -14.4%
Variation 2019 / 2011
-17,448,990 -12,710,880 -56,275 -2,098,544 -32,314,689
-78.4% -53.7% -7.5% -32.4% -60.8%

ANSES • annual report Veterinary medicinal products containing antimicrobials in France in 2019
78
Table 5: Change in body weight treated by pharmaceutical form (Number of ACDkg in tonnes)
MEDICATED PREMIXES
ORAL POWDERS & SOLUTIONS
OTHER ORAL FORMS INJECTIONS TOTAL
1999 3,820,859 3,281,363 122,867 2,975,938 10,201,027
2000 3,974,651 3,925,451 128,356 2,933,734 10,962,192
2001 3,788,900 4,582,475 117,759 2,927,877 11,417,011
2002 3,480,322 5,135,194 117,363 2,872,109 11,604,988
2003 3,247,260 5,435,508 119,417 2,893,534 11,695,719
2004 2,969,194 5,498,622 117,164 2,678,732 11,263,712
2005 2,926,740 5,975,773 122,421 2,837,270 11,862,204
2006 2,927,972 5,689,829 120,798 2,983,577 11,722,176
2007 3,256,585 5,764,845 116,362 2,777,477 11,915,269
2008 2,789,002 5,074,768 121,082 2,803,621 10,788,473
2009 2,563,942 5,101,107 111,425 2,640,435 10,416,909
2010 2,398,407 5,110,385 116,605 2,741,597 10,366,994
2011 2,035,767 4,859,987 109,164 2,788,404 9,793,322
2012 1,572,826 4,551,739 101,161 2,850,537 9,076,263
2013 1,336,389 4,190,107 100,277 2,758,424 8,385,197
2014 1,334,647 5,042,333 104,372 2,986,441 9,467,793
2015 1,106,967 2,496,473 86,162 2,229,608 5,919,210
2016 794,288 2,749,711 91,579 2,465,365 6,100,943
2017 613,961 2,797,403 94,481 2,280,525 5,786,370
2018 535,150 2,716,752 99,098 2,409,949 5,760,949
2019 491,783 2,227,530 98,659 2,229,030 5,047,002
Variation 2019 / 2018
-43,367 -489,222 -439 -180,919 -713,947
-8.1% -18.0% -0.4% -7.5% -12.4%
Variation 2019 / 2011
-1,543,984 -2,632,457 -10,505 -559,374 -4,746,320
-75.8% -54.2% -9.6% -20.1% -48.5%

ANSES • annual report Veterinary medicinal products containing antimicrobials in France in 2019
79
Table 6: Change in sales by antimicrobial class since 1999 in tonnes of active ingredient A
MIN
OG
LYC
OSI
DES
OTH
ER C
LASS
ES
CEP
HA
LOSP
OR
INS
1&2G
CEP
HA
LOSP
OR
INS
3&4G
FLU
OR
OQ
UIN
OLO
NES
LIN
CO
SAM
IDES
MA
CR
OLI
DES
PEN
ICIL
LIN
S
PHEN
ICO
LS
PLEU
RO
MU
TILI
NS
POLY
MYX
INS
QU
INO
LON
ES
SULF
ON
AM
IDES
TETR
AC
YCLI
NES
TRIM
ETH
OPR
IM
TOTA
L
1999 81.73 0.93 5.25 0.92 3.30 5.88 79.42 90.46 4.31 31.14 67.19 19.75 259.27 623.82 37.46 1310.82
2000 89.56 0.98 5.30 1.05 3.69 8.02 88.27 96.77 4.65 32.96 70.44 16.50 270.70 655.70 38.63 1383.22
2001 92.51 0.96 5.24 1.02 4.06 9.27 101.88 94.36 4.44 25.80 72.03 14.86 245.63 666.22 36.22 1374.50
2002 90.12 0.94 6.19 1.17 4.18 10.85 108.23 97.54 5.61 25.26 67.89 15.82 228.53 629.91 33.90 1326.14
2003 81.66 0.32 6.84 1.27 4.43 10.21 101.93 91.94 4.30 21.94 67.30 13.99 209.00 645.70 32.53 1293.35
2004 78.59 0.85 6.71 1.37 4.28 9.50 96.53 84.37 4.90 16.15 63.07 12.50 209.75 637.81 33.79 1260.19
2005 76.70 0.66 7.13 1.60 4.36 10.06 99.88 88.70 4.69 8.27 66.35 13.29 215.23 662.93 35.54 1295.38
2006 77.64 1.04 6.41 1.87 4.81 8.98 102.69 92.69 6.08 10.02 66.80 13.04 211.38 600.14 33.14 1236.72
2007 74.29 0.72 7.16 2.00 4.68 9.07 97.60 93.59 5.88 9.95 73.83 10.91 224.56 678.70 33.84 1326.79
2008 72.94 0.70 7.20 2.12 4.89 7.79 94.89 85.04 5.01 7.90 65.73 7.93 194.88 584.57 29.56 1171.15
2009 64.88 0.64 7.01 1.82 4.89 7.11 83.39 86.67 4.79 8.19 66.40 7.48 182.02 504.97 28.32 1058.58
2010 62.49 0.64 5.94 2.28 5.27 6.72 81.36 90.64 5.12 7.62 65.04 8.03 174.79 472.23 26.45 1014.62
2011 63.64 0.66 7.04 2.31 5.27 5.43 70.44 90.26 4.57 6.77 60.72 6.24 171.31 389.84 25.04 909.54
2012 57.37 0.65 6.64 2.33 4.94 4.69 61.00 86.21 4.65 5.64 51.31 5.35 145.28 328.42 21.27 785.76
2013 54.40 0.57 6.40 2.13 4.80 4.58 51.94 86.65 4.69 5.64 42.82 4.70 136.26 281.86 20.21 707.64
2014 57.60 0.61 7.31 2.00 4.90 4.60 58.39 98.16 5.88 6.44 51.43 5.57 146.68 315.36 22.75 787.69
2015 48.34 0.54 4.43 1.49 2.66 3.13 36.47 64.33 3.81 5.42 30.57 2.80 106.75 187.74 15.53 514.02
2016 55.76 1.26 6.40 0.39 1.70 3.01 36.84 77.57 5.59 4.53 20.25 3.21 111.04 185.40 17.23 530.16
2017 54.83 1.32 5.44 0.11 1.18 3.01 33.99 72.68 5.41 4.16 16.40 3.33 91.80 188.99 16.09 498.74
2018 52.05 1.39 5.61 0.12 1.00 3.04 32.09 70.96 5.76 3.54 13.72 2.75 84.23 180.44 15.15 471.85
2019 50.14 1.65 5.11 0.11 0.97 3.16 30.52 69.95 5.43 3.47 10.42 2.33 81.34 144.15 13.31 422.08
Variation 2019 / 2018
-1.91 0.26 -0.50 -0.01 -0.03 0.12 -1.57 -1.01 -0.33 -0.07 -3.29 -0.42 -2.89 -36.29 -1.84 -49.77
-3.7% 18.5% -8.9% -6.2% -2.7% 3.8% -4.9% -1.4% -5.8% -1.9% -24.0% -15.2% -3.4% -20.1% -12.1% -10.5%
Variation 2019 / 2011
-13.50 0.99 -1.93 -2.20 -4.30 -2.27 -39.92 -20.30 0.85 -3.30 -50.30 -3.91 -89.97 -245.69 -11.73 -487.46
-21.2% 151.4% -27.4% -95.2% -81.5% -41.8% -56.7% -22.5% 18.7% -48.7% -82.8% -62.6% -52.5% -63.0% -46.8% -53.6%

ANSES • annual report Veterinary medicinal products containing antimicrobials in France in 2019
80
Table 7: Change in sales by antimicrobial class since 1999 in body weight treated-day (number of ADDkg in tonnes) A
MIN
OG
LYC
OSI
DES
OTH
ER C
LASS
ES
CEP
HA
LOSP
OR
INS
1&2G
CEP
HA
LOSP
OR
INS
3&4G
FLU
OR
OQ
UIN
OLO
NES
LIN
CO
SAM
IDES
MA
CR
OLI
DES
PEN
ICIL
LIN
S
PHEN
ICO
LS
PLEU
RO
MU
TILI
NS
POLY
MYX
INS
QU
INO
LON
ES
SULF
ON
AM
IDES
TETR
AC
YCLI
NES
TRIM
ETH
OPR
IM
TOTA
L
1999 5,314,542 61,559 114,400 613,705 829,639 1,349,919 7,803,382 5,961,946 109,518 6,675,463 14,437,030 1,249,525 7,852,979 18,560,113 5,778,494 65,588,385
2000 5,790,509 66,635 117,557 760,098 910,333 1,827,150 10,182,164 6,500,314 117,177 7,621,741 15,235,272 1,015,743 8,058,445 19,832,367 5,992,872 72,523,567
2001 6,244,677 66,649 136,206 732,296 998,468 2,112,908 11,843,772 6,319,054 112,757 5,769,456 15,541,707 933,434 7,425,390 21,239,150 5,569,444 74,102,908
2002 6,212,152 66,081 151,228 844,120 1,060,534 2,505,567 12,161,797 6,575,953 142,383 5,942,278 14,728,773 1,018,958 6,730,022 21,421,846 5,090,641 74,677,743
2003 5,697,048 20,094 170,144 928,161 1,109,326 2,313,283 11,270,966 6,192,824 109,075 6,366,511 14,687,842 905,360 6,182,552 22,497,858 4,828,311 74,078,338
2004 5,578,208 63,355 171,336 956,306 1,059,975 2,044,525 10,235,902 5,703,962 124,094 4,734,507 13,815,183 776,027 6,096,472 22,651,201 4,922,071 69,966,048
2005 5,561,951 49,954 187,279 1,108,247 1,151,521 2,135,486 10,726,611 6,005,841 118,931 2,284,051 14,573,360 814,949 6,145,501 23,670,632 5,072,329 70,501,432
2006 5,527,036 79,771 185,150 1,179,871 1,221,951 1,867,426 11,466,991 6,227,379 153,634 2,549,288 14,776,261 801,330 5,915,289 21,346,028 4,792,901 69,556,624
2007 5,191,221 54,139 189,566 1,252,310 1,121,520 1,792,187 11,017,235 6,258,505 148,549 2,671,140 16,242,651 674,745 6,143,350 23,252,206 4,928,272 72,459,181
2008 4,849,730 51,933 188,960 1,381,556 1,221,774 1,675,598 10,006,118 5,749,083 127,998 2,147,339 14,594,055 496,030 5,342,185 19,681,136 4,353,707 64,027,114
2009 4,432,394 47,873 182,802 1,130,704 1,230,660 1,569,691 9,210,601 5,807,554 159,834 2,083,986 14,774,326 482,974 5,097,213 18,081,341 4,180,016 61,040,000
2010 3,897,394 46,634 165,331 1,155,511 1,287,784 1,456,974 8,496,503 6,131,167 176,394 1,846,633 14,689,549 514,581 4,908,991 17,180,935 3,958,591 58,945,163
2011 3,654,028 46,985 183,603 1,136,265 1,195,462 1,206,384 7,122,720 6,164,475 168,934 1,426,662 13,670,947 409,713 4,769,510 14,999,077 3,744,852 53,163,818
2012 3,204,704 46,118 171,364 1,132,043 1,131,367 993,472 5,332,637 5,922,552 183,028 956,083 11,683,542 355,498 4,032,944 13,540,269 3,199,166 45,874,880
2013 3,070,545 39,617 159,934 1,059,444 1,164,270 940,810 4,483,224 5,885,842 198,502 975,148 9,899,925 310,410 3,836,174 11,694,340 3,101,504 41,053,140
2014 3,106,743 42,623 184,568 885,300 1,059,271 844,865 4,302,549 6,673,130 238,659 1,036,269 11,804,079 367,309 4,726,287 13,297,098 3,959,069 45,953,164
2015 2,373,930 38,953 111,221 666,725 576,541 557,216 3,175,101 4,168,534 151,309 960,734 6,857,935 194,040 3,473,229 7,386,913 2,799,112 28,560,378
2016 2,744,630 53,770 142,021 229,201 301,301 510,600 2,951,786 5,293,507 245,700 792,199 4,978,331 224,474 3,730,804 7,326,946 3,108,162 27,345,879
2017 2,588,778 50,936 135,580 53,729 174,030 454,343 2,654,092 4,900,231 231,367 733,420 4,132,924 231,703 3,308,263 8,046,216 2,992,456 25,661,845
2018 2,446,134 48,682 136,507 55,028 169,473 454,735 2,415,123 4,734,239 241,543 666,253 3,507,572 188,330 3,088,256 8,170,749 2,810,684 24,369,408
2019 2,249,402 54,938 133,706 49,031 165,129 461,272 2,094,498 4,706,512 229,810 635,946 2,691,359 157,683 2,838,536 6,361,964 2,442,957 20,849,129
Variation 2019 / 2018
-196,732 6,256 -2,801 -5,997 -4,344 6,537 -320,625 -27,727 -11,733 -30,307 -816,213 -30,647 -249,720 -1,808,785 -367,727 -3,520,279
-8.0% 12.9% -2.1% -10.9% -2.6% 1.4% -13.3% -0.6% -4.9% -4.5% -23.3% -16.3% -8.1% -22.1% -13.1% -14.4%
Variation 2019 / 2011
-1,404,626 7,953 -49,897 -1,087,234 -1,030,333 -745,112 -5,028,222 -1,457,963 60,876 -790,716 -10,979,588 -252,030 -1,930,974 -8,637,113 -1,301,895 -32,314,689
-38.4% 16.9% -27.2% -95.7% -86.2% -61.8% -70.6% -23.7% 36.0% -55.4% -80.3% -61.5% -40.5% -57.6% -34.8% -60.8%

ANSES • annual report Veterinary medicinal products containing antimicrobials in France in 2019
81
Table 8: Change in sales by antimicrobial class since 1999 in body weight treated (number of ACDkg in tonnes) A
MIN
OG
LYC
OSI
DES
OTH
ER C
LASS
ES
CEP
HA
LOSP
OR
INS
1&2G
CEP
HA
LOSP
OR
INS
3&4G
FLU
OR
OQ
UIN
OLO
NES
LIN
CO
SAM
IDES
MA
CR
OLI
DES
PEN
ICIL
LIN
S
PHEN
ICO
LS
PLEU
RO
MU
TILI
NS
POLY
MYX
INS
QU
INO
LON
ES
SULF
ON
AM
IDES
TETR
AC
YCLI
NES
TRIM
ETH
OPR
IM
TOTA
L
1999 1,060,632 7,358 7,453 143,160 199,415 114,768 935,311 1,717,621 107,144 424,983 2,015,945 227,976 1,262,505 3,199,139 952,470 10,201,027
2000 1,096,686 8,082 7,666 173,693 219,348 159,385 1,073,405 1,847,755 116,123 450,470 2,170,515 203,194 1,301,343 3,364,520 982,166 10,962,192
2001 1,123,740 8,055 8,816 168,131 267,555 195,279 1,205,024 1,814,370 110,816 360,112 2,260,666 186,051 1,241,046 3,670,787 951,770 11,417,011
2002 1,084,767 7,759 9,612 193,433 305,734 233,426 1,297,976 1,712,853 139,419 350,896 2,236,069 190,262 1,161,266 3,796,702 881,916 11,604,988
2003 1,039,253 3,148 10,689 212,162 334,924 208,835 1,228,220 1,707,865 106,992 307,067 2,296,785 170,170 1,056,504 4,072,594 824,615 11,695,719
2004 1,067,372 7,489 10,896 218,523 312,948 184,307 1,153,792 1,569,252 121,861 230,899 2,182,588 149,779 1,050,189 4,064,879 840,298 11,263,712
2005 1,058,202 5,309 11,628 255,451 342,811 180,234 1,239,789 1,672,908 116,663 127,628 2,365,591 157,703 1,071,517 4,317,924 871,721 11,862,204
2006 1,048,722 8,985 11,496 296,009 376,593 164,527 1,257,883 1,731,032 151,399 127,409 2,421,637 155,718 1,042,325 3,964,054 835,189 11,722,176
2007 1,012,240 6,422 11,379 314,383 344,097 152,145 1,148,960 1,733,067 146,577 128,427 2,531,260 130,832 1,098,619 4,165,335 869,156 11,915,269
2008 968,735 6,200 11,150 338,909 367,442 144,125 1,157,417 1,572,483 124,850 102,892 2,379,086 96,420 973,812 3,495,339 779,411 10,788,473
2009 860,137 5,705 10,761 281,667 360,582 126,955 1,095,828 1,569,510 123,760 105,461 2,401,853 93,928 905,745 3,313,222 745,272 10,416,909
2010 814,488 5,573 10,054 343,656 358,790 118,128 1,100,719 1,664,584 130,965 100,523 2,408,038 100,095 876,094 3,144,169 717,989 10,366,994
2011 821,642 5,499 10,692 340,257 360,937 97,872 1,041,634 1,684,123 118,668 85,261 2,277,429 80,587 865,545 2,829,732 691,141 9,793,322
2012 763,087 5,368 10,290 340,522 352,116 81,143 964,367 1,623,236 120,378 74,402 2,004,615 70,471 736,271 2,719,525 597,435 9,076,263
2013 752,769 4,211 9,290 306,104 345,740 80,026 896,653 1,619,472 119,729 72,993 1,788,447 61,695 704,402 2,392,974 576,469 8,385,197
2014 783,277 4,311 10,410 269,171 332,885 78,789 1,033,443 1,814,348 151,584 69,690 2,098,679 73,240 785,985 2,748,798 660,231 9,467,793
2015 537,161 3,909 7,130 212,424 203,997 56,727 675,590 1,107,705 97,565 58,293 1,268,372 38,624 562,214 1,649,132 455,263 5,919,210
2016 784,122 5,995 9,632 57,406 86,547 57,366 756,587 1,547,375 146,684 46,840 1,002,724 44,698 639,298 1,667,867 545,606 6,100,943
2017 791,893 5,838 10,810 17,619 41,439 59,372 700,305 1,430,701 142,802 41,976 861,223 45,852 567,301 1,830,365 509,088 5,786,370
2018 798,042 5,722 11,692 18,530 46,842 60,941 722,272 1,443,185 151,367 36,210 734,174 37,395 554,197 1,908,496 506,075 5,760,949
2019 765,969 6,555 12,159 17,252 46,421 60,208 673,626 1,430,638 142,994 35,117 577,011 31,581 508,485 1,493,126 446,673 5,047,002
Variation 2019 / 2018
-32,073 833 467 -1,278 -421 -733 -48,646 -12,547 -8,373 -1,093 -157,163 -5,814 -45,712 -415,370 -59,402 -713,947
-4.0% 14.6% 4.0% -6.9% -0.9% -1.2% -6.7% -0.9% -5.5% -3.0% -21.4% -15.5% -8.2% -21.8% -11.7% -12.4%
Variation 2019 / 2011
-55,673 1,056 1,467 -323,005 -314,516 -37,664 -368,008 -253,485 24,326 -50,144 -1,700,418 -49,006 -357,060 -1,336,606 -244,468 -4,746,320
-6.8% 19.2% 13.7% -94.9% -87.1% -38.5% -35.3% -15.1% 20.5% -58.8% -74.7% -60.8% -41.3% -47.2% -35.4% -48.5%

ANSES • annual report Veterinary medicinal products containing antimicrobials in France in 2019
82
3. Change in exposure to antimicrobials by species
Cattle
Table 9: Change in sales for cattle and in their exposure to antimicrobials
Tonnage
sold (tonnes)
Percentage of total
tonnage* Sales in mg/kg
Body weight treated
(tonnes)
Percentage of total body
weight treated*
ALEA
1999 168.88 12.9% 16.24 2,767,006 27.1% 0.266
2000 178.67 12.9% 17.07 2,839,540 25.9% 0.271
2001 174.78 12.7% 16.26 2,831,180 24.8% 0.263
2002 175.61 13.2% 16.83 2,968,454 25.6% 0.284
2003 172.29 13.3% 17.26 2,986,137 25.5% 0.299
2004 193.94 15.4% 19.68 3,164,445 28.1% 0.321
2005 206.98 16.0% 22.31 3,410,079 28.7% 0.368
2006 200.58 16.2% 20.98 3,411,037 29.1% 0.357
2007 198.70 15.0% 20.56 3,238,130 27.2% 0.335
2008 183.53 15.7% 18.71 3,105,792 28.8% 0.317
2009 172.78 16.3% 17.77 2,963,954 28.5% 0.305
2010 182.56 18.0% 19.10 3,247,701 31.3% 0.340
2011 183.26 20.1% 19.64 3,064,806 31.3% 0.328
2012 165.83 21.1% 17.91 3,024,280 33.3% 0.327
2013 146.94 20.8% 15.75 2,838,932 33.9% 0.304
2014 179.25 22.8% 19.08 3,328,807 35.2% 0.354
2015 124.13 24.1% 13.14 2,263,594 38.2% 0.240
2016 124.23 23.4% 13.14 2,354,621 38.6% 0.249
2017 131.01 26.3% 14.06 2,347,798 40.6% 0.252
2018 136.46 28.9% 14.93 2,481,999 43.1% 0.272
2019 117.46 27.8% 13.11 2,193,014 43.5% 0.245
Variation 2019 / 2018
-19.00 -1.82 -288,985 -0.027
-13.9% -12.2% -11.6% -9.9%
Variation 2019 / 2011
-65.79 -6.53 -871,792 -0.084
-35.9% -33.2% -28.4% -25.5%
* "total" means for all animal species

ANSES • annual report Veterinary medicinal products containing antimicrobials in France in 2019
83
Table 10: Change in body weight treated-day by antimicrobial class for cattle (number of ADDkg in tonnes) A
MIN
OG
LYC
OSI
DES
OTH
ER C
LASS
ES
CEP
HA
LOSP
OR
INS
1&2G
CEP
HA
LOSP
OR
INS
3&4G
FLU
OR
OQ
UIN
OLO
NE
S LIN
CO
SAM
IDES
MA
CR
OLI
DES
PEN
ICIL
LIN
S
PHEN
ICO
LS
PLEU
RO
MU
TILI
NS
POLY
MYX
INS
QU
INO
LON
ES
SULF
ON
AM
IDES
TETR
AC
YCLI
NES
TRIM
ETH
OPR
IM
TOTA
L
Bod
y w
eigh
t tre
ated
-da
y / b
iom
ass
1999 2,051,114 0 0 552,250 363,336 109,246 1,060,944 2,671,680 106,775 0 924,376 190,161 543,702 1,864,871 274,735 8,007,921 0.77
2000 2,081,634 0 0 698,186 385,935 110,986 1,111,140 2,725,880 115,972 0 982,092 192,575 608,013 1,965,475 270,884 8,512,471 0.81
2001 2,048,311 0 0 680,314 444,423 103,770 1,136,247 2,699,828 110,448 0 1,042,451 209,029 578,878 1,841,468 270,829 8,509,324 0.79
2002 1,948,318 0 0 784,539 490,831 111,524 1,189,766 2,542,420 138,904 0 1,134,493 251,764 559,933 2,074,359 281,437 8,989,229 0.86
2003 1,834,252 0 0 867,026 518,049 114,113 1,182,909 2,393,302 106,672 0 1,096,276 239,193 497,565 2,364,507 253,607 9,119,792 0.91
2004 1,790,151 0 0 896,593 476,587 121,361 1,153,258 2,297,490 121,515 0 1,040,481 203,648 541,167 3,584,877 275,365 10,188,074 1.03
2005 1,800,135 0 0 1,037,117 532,505 125,507 1,204,988 2,380,816 116,312 0 1,087,936 243,147 517,911 4,108,318 266,810 11,119,608 1.20
2006 1,815,065 0 0 1,078,489 582,448 123,853 1,173,252 2,425,657 151,054 0 1,067,341 246,990 509,685 3,711,989 259,556 10,833,169 1.13
2007 1,712,040 0 0 1,134,965 501,761 120,554 996,529 2,250,958 146,273 0 1,035,073 188,627 572,907 3,715,178 261,869 10,430,334 1.08
2008 1,694,612 0 0 1,263,421 552,306 114,412 1,249,241 2,169,153 123,627 0 1,040,634 136,860 586,506 2,793,841 290,835 9,833,258 1.00
2009 1,430,700 0 0 1,024,180 533,375 102,767 1,136,026 1,979,353 121,464 0 1,067,431 141,672 553,449 3,142,452 278,214 9,567,689 0.98
2010 1,331,289 0 0 1,029,375 683,992 75,496 1,187,433 2,155,593 147,893 0 889,301 172,925 535,451 3,590,307 248,104 10,226,948 1.07
2011 1,640,395 0 0 1,053,442 594,700 41,793 1,189,808 2,357,580 130,998 0 643,979 114,178 967,078 2,310,134 535,679 9,142,586 0.98
2012 1,540,014 0 1432 1,064,093 558,221 72,409 1,313,439 2,324,174 133,378 0 482,855 92,384 625,796 2,256,595 301,159 8,681,343 0.94
2013 1,512,270 0 0 993,813 589,359 73,014 1,281,128 2,283,850 157,427 0 605,123 96,560 622,219 1,489,584 319,250 7,975,452 0.85
2014 1,569,920 0 0 840,298 510,672 113,018 1,531,565 2,060,061 176,751 0 1,074,489 160,252 677,013 2,829,341 420,901 9,801,195 1.04
2015 1,257,963 0 0 634,460 287,427 105,061 974,866 1,592,095 108,196 0 576,095 65,253 485,491 1,594,158 263,188 6,259,157 0.66
2016 1,367,551 0 0 216,021 102,871 96,064 1,135,214 1,767,052 140,830 0 477,589 89,836 623,605 1,601,722 480,179 6,165,796 0.65
2017 1,489,041 0 0 48,458 40,057 106,826 989,915 1,864,586 143,817 0 497,392 95,420 567,286 2,058,180 485,962 6,385,530 0.69
2018 1,483,254 0 0 48,667 54,325 109,558 1,098,113 1,802,819 149,200 0 408,796 77,292 607,844 2,337,225 545,638 6,680,243 0.73
2019 1,368,940 0 0 43,318 51,303 99,060 845,199 1,764,472 139,566 0 366,822 75,326 534,245 1,839,355 474,597 5,744,095 0.64
Variation 2019 / 2018
-114,314 0 0 -5349 -3,022 -10498 -252,914 -38,347 -9,634 0 -41,974 -1,966 -73,599 -497,870 -71,041 -936,148 -0.09
-7.71% -10.99% -5.56% -9.58% -23.03% -2.13% -6.46% -10.27% -2.54% -12.11% -21.30% -13.02% -14.01% -12.29%
Variation 2019 / 2011
-271,455 0 0 -1,010,124 -543,397 57,267 -344,609 -593,108 8,568 0 -277,157 -38,852 -432,833 -470,779 -61,082 -3,398,491 -0.34
-16.55% -95.89% -91.37% 137.03% -28.96% -25.16% 6.54% -43.04% -34.03% -44.76% -20.38% -11.40% -37.17% -34.57%

ANSES • annual report Veterinary medicinal products containing antimicrobials in France in 2019
84
Table 11: Change in body weight treated by antimicrobial class for cattle (number of ACDkg in tonnes)
AM
INO
GLY
CO
SID
ES
OTH
ER C
LASS
ES
CEP
HA
LOSP
OR
INS
1&2G
CEP
HA
LOSP
OR
INS
3&4G
FLU
OR
OQ
UIN
OLO
NES
LIN
CO
SAM
IDES
MA
CR
OLI
DES
PEN
ICIL
LIN
S
PHEN
ICO
LS
PLEU
RO
MU
TILI
NS
POLY
MYX
INS
QU
INO
LON
ES
SULF
ON
AM
IDES
TETR
AC
YCLI
NES
TRIM
ETH
OPR
IM
TOTA
L
1999 672,296 0 0 127,314 89,974 21,849 465,815 828,336 106,775 0 296,921 38,033 140,098 751,371 72,478 2,767,006
2000 672,494 0 0 157,321 93,665 22,197 485,154 831,158 115,972 0 312,159 38,514 155,832 730,747 69,422 2,839,540
2001 661,536 0 0 154,198 134,552 20,754 489,962 829,054 110,448 0 328,709 41,805 150,080 663,289 70,540 2,831,180
2002 627,068 0 0 177,480 166,670 22,305 523,605 778,096 138,904 0 347,008 50,353 145,433 696,226 74,629 2,968,454
2003 621,338 0 0 195,641 188,856 22,823 509,713 763,490 106,672 0 329,087 47,839 131,304 761,692 67,355 2,986,137
2004 648,428 0 0 202,291 169,904 24,272 478,620 781,082 121,515 0 305,894 40,729 137,977 969,377 70,423 3,164,445
2005 651,062 0 0 232,823 184,729 25,101 517,638 807,173 116,312 0 322,856 48,630 133,373 1,085,831 69,427 3,410,079
2006 648,113 0 0 249,975 210,588 24,771 510,220 812,055 151,054 0 322,025 49,397 131,655 1,016,969 67,476 3,411,037
2007 632,066 0 0 261,170 190,385 24,111 427,012 765,075 146,273 0 299,727 37,725 152,848 1,002,908 67,108 3,238,130
2008 612,162 0 0 289,016 197,942 22,882 518,047 727,694 123,627 0 303,898 27,372 157,871 795,622 74,495 3,105,792
2009 518,706 0 0 233,537 186,472 20,553 510,816 670,371 105,249 0 300,469 28,334 127,334 832,883 68,907 2,963,954
2010 504,733 0 0 289,427 222,391 15,099 541,240 753,250 117,261 0 262,789 34,585 129,856 938,915 64,376 3,247,701
2011 575,529 0 0 308,533 220,333 8,359 574,329 797,457 99,980 0 195,504 22,836 199,112 698,957 96,895 3,064,806
2012 541,878 0 477 316,976 211,464 14,482 588,579 791,196 98,910 0 142,928 18,477 148,016 750,997 74,835 3,024,280
2013 536,315 0 0 283,418 205,889 14,603 583,324 787,419 103,554 0 169,048 19,312 149,794 575,405 78,862 2,838,932
2014 564,380 0 0 252,366 191,073 22,604 694,078 722,809 125,988 0 262,555 32,051 170,775 895,139 111,824 3,328,807
2015 380,885 0 0 198,232 126,224 21,012 448,679 497,297 80,819 0 145,628 13,051 123,599 649,419 74,413 2,263,594
2016 556,013 0 0 52,873 36,305 19,213 529,194 668,511 103,612 0 119,036 17,967 169,024 658,220 138,273 2,354,621
2017 590,987 0 0 14,294 14,153 21,365 481,984 679,323 104,551 0 123,658 19,084 157,216 743,618 137,990 2,347,798
2018 607,832 0 0 15,284 21,809 21,912 516,249 697,346 112,170 0 102,983 15,458 172,044 816,733 157,994 2,481,999
2019 575,431 0 0 14,212 21,674 19,812 431,310 691,291 104,527 0 92,679 15,065 152,674 658,209 139,723 2,193,014
Variation 2019 / 2018
-32,401 0 0 -1072 -135 -2100 -84,939 -6,055 -7,643 0 -10,304 -393 -19,370 -158,524 -18,271 -288,985
-5.33% -7.01% -0.62% -9.58% -16.45% -0.87% -6.81% -10.01% -2.54% -11.26% -19.41% -11.56% -11.64%
Variation 2019 / 2011
-98 0 0 -294,321 -198,659 11,453 -143,019 -106,166 4,547 0 -102,825 -7,771 -46,438 -40,748 42,828 -871,792
-0.02% -95.39% -90.16% 137.01% -24.90% -13.31% 4.55% -52.59% -34.03% -23.32% -5.83% 44.20% -28.45%

ANSES • annual report Veterinary medicinal products containing antimicrobials in France in 2019
85
Pigs
Table 12: Change in sales for pigs and in their exposure to antimicrobials
Tonnage sold (tonnes)
Percentage of total tonnage* Sales in mg/kg Body weight
treated (tonnes) Percentage of
total body weight treated*
ALEA
1999 652.36 49.8% 203.97 4,054,918 39.8% 1.268
2000 694.04 50.2% 215.42 4,392,299 40.1% 1.363
2001 696.42 50.7% 216.29 4,762,837 41.7% 1.479
2002 654.75 49.4% 201.61 4,808,885 41.4% 1.481
2003 621.60 48.1% 193.47 4,637,863 39.7% 1.443
2004 575.40 45.7% 181.36 4,372,872 38.8% 1.378
2005 595.52 46.0% 191.49 4,567,621 38.5% 1.469
2006 575.93 46.6% 186.63 4,547,478 38.8% 1.474
2007 635.80 47.9% 205.08 4,861,904 40.8% 1.568
2008 537.10 45.9% 173.25 4,169,442 38.6% 1.345
2009 484.15 45.7% 158.70 4,011,249 38.5% 1.315
2010 446.86 44.0% 147.60 3,683,343 35.5% 1.217
2011 354.38 39.0% 118.20 3,305,508 33.8% 1.103
2012 291.81 37.1% 99.91 2,903,956 32.0% 0.994
2013 270.97 38.3% 94.39 2,748,267 32.8% 0.957
2014 284.77 36.2% 99.76 2,901,647 30.6% 1.017
2015 185.45 36.1% 65.07 1,871,096 31.6% 0.657
2016 189.40 35.7% 66.26 1,843,021 30.2% 0.645
2017 181.27 36.3% 64.42 1,755,851 30.3% 0.624
2018 166.69 35.3% 58.92 1,717,114 29.8% 0.607
2019 140.62 33.3% 49.80 1,433,492 28.4% 0.508
Variation 2019 / 2018
-26.07 -9.12 -283,622 -0.099
-15.6% -15.5% -16.5% -16.4%
Variation 2019 / 2011
-213.76 -68.40 -1,872,016 -0.595
-60.3% -57.9% -56.6% -54.0%
* "total" means for all animal species

ANSES • annual report Veterinary medicinal products containing antimicrobials in France in 2019
86
Table 13: Change in body weight treated-day by antimicrobial class for pigs (number of ADDkg in tonnes) A
MIN
OG
LYC
OSI
DES
OTH
ER C
LASS
ES
CEP
HA
LOSP
OR
INS
1&2G
CEP
HA
LOSP
OR
INS
3&4G
FLU
OR
OQ
UIN
OLO
NES
LIN
CO
SAM
IDES
MA
CR
OLI
DES
PEN
ICIL
LIN
S
PHEN
ICO
LS
PLEU
RO
MU
TILI
NS
POLY
MYX
INS
QU
INO
LON
ES
SULF
ON
AM
IDES
TETR
AC
YCLI
NES
TRIM
ETH
OPR
IM
TOTA
L
Bod
y w
eigh
t tre
ated
-day
/ b
iom
ass
1999 2,291,933 0 0 45,380 210,054 1,049,513 6,125,907 1,642,529 0 2,471,098 9,416,970 538,283 3,173,009 9,143,660 2,615,815 34,209,612 10.70
2000 2,663,876 0 0 47,623 239,199 1,367,730 8,496,477 1,679,057 0 2,376,589 9,629,601 331,960 3,085,774 10,067,534 2,628,024 37,973,460 11.79
2001 3,157,463 0 0 41,525 263,760 1,509,011 10,100,005 1,686,119 1,048 1,943,350 9,760,224 233,442 3,015,817 10,824,599 2,571,084 40,547,095 12.59
2002 3,234,449 0 0 47,474 291,718 1,753,317 10,349,586 2,112,324 709 1,784,871 9,065,876 215,884 2,762,520 10,458,948 2,512,155 40,357,940 12.43
2003 2,979,399 0 0 49,621 308,817 1,657,307 9,548,987 1,907,393 0 1,045,174 9,143,208 162,223 2,469,918 10,402,255 2,262,700 38,154,596 11.88
2004 2,990,867 0 0 49,156 293,612 1,502,272 8,534,591 1,783,549 0 745,779 8,427,154 177,951 2,516,680 9,572,260 2,312,444 35,268,371 11.12
2005 3,040,918 0 0 59,745 352,557 1,640,894 8,934,122 1,807,141 0 437,141 8,610,420 186,353 2,420,581 10,016,206 2,239,518 36,175,213 11.63
2006 2,968,103 0 0 80,702 367,648 1,393,500 9,687,246 1,879,475 0 463,794 8,690,813 152,077 2,360,925 9,284,544 2,216,889 36,287,510 11.76
2007 2,744,839 0 0 85,773 314,133 1,379,388 9,445,982 1,963,578 0 353,065 10,283,262 164,640 2,497,049 10,417,193 2,299,603 38,646,399 12.47
2008 2,412,791 0 0 84,719 361,858 1,286,102 8,173,367 1,756,966 2,127 235,347 8,727,720 137,424 2,221,857 8,540,099 2,042,477 32,867,792 10.60
2009 2,284,068 0 0 74,947 370,961 1,273,124 7,682,694 1,943,040 36,527 252,130 8,310,807 114,949 2,116,391 7,675,053 1,963,207 31,004,975 10.16
2010 1,583,945 0 0 96,608 235,854 1,083,449 6,864,480 1,983,725 27,004 251,499 7,817,966 113,403 2,222,722 6,852,999 2,101,195 28,215,325 9.32
2011 1,141,682 0 0 54,160 245,300 868,818 5,564,533 1,701,565 30,948 253,080 7,550,506 99,895 1,764,218 5,502,986 1,751,966 24,146,712 8.05
2012 905,334 0 0 42,420 252,297 826,715 3,678,768 1,722,109 48,428 278,240 6,035,677 73,886 1,465,634 4,776,944 1,452,262 19,563,214 6.70
2013 853,437 0 0 41,862 245,849 754,568 2,901,541 1,674,548 38,906 261,364 4,643,856 66,294 1,283,114 5,108,942 1,273,334 17,364,177 6.05
2014 836,266 0 0 22,300 209,187 695,790 2,410,657 2,048,115 57,096 217,338 5,243,607 69,534 1,884,345 5,104,040 1,873,843 18,283,703 6.41
2015 559,988 0 0 16,965 108,331 421,383 1,952,929 1,289,384 38,376 185,092 3,292,519 30,573 1,405,418 2,955,046 1,396,912 11,855,983 4.16
2016 767,591 0 0 6,753 49,877 375,572 1,581,085 1,843,102 99,056 125,040 1,660,301 36,237 1,243,263 3,077,716 1,236,500 10,431,195 3.65
2017 588,637 0 0 2,354 14,431 302,513 1,442,729 1,551,612 75,332 86,199 1,211,293 37,319 1,049,173 3,712,165 1,047,039 9,785,124 3.48
2018 538,015 0 0 2,645 20,596 293,501 1,094,843 1,507,214 79,408 68,105 1,123,835 43,078 1,008,999 3,619,870 1,006,273 9,115,244 3.22
2019 498,575 0 0 2,290 18,703 304,614 929,466 1,440,386 77,780 63,347 770,744 45,090 883,871 2,611,380 877,929 7,376,223 2.61
Variation 2019 / 2018
-39,440 0 0 -355 -1,893 11,113 -165,377 -66,828 -1,628 -4,758 -353,091 2,012 -125,128 -1,008,490 -128,344 -1,739,021 -0.61
-7.3% -13.4% -9.2% 3.8% -15.1% -4.4% -2.1% -7.0% -31.4% 4.7% -12.4% -27.9% -12.8% -19.08% -18.92%
Variation 2019 / 2011
-643,107 0 0 -51,870 -226,597 -564,204 -4,635,067 -261,179 46,832 -189,733 -6,779,762 -54,805 -880,347 -2,891,606 -874,037 -16,770,489 -5.44
-56.3% -95.8% -92.4% -64.9% -83.3% -15.3% 151.3% -75.0% -89.8% -54.9% -49.9% -52.5% -49.9% -69.45% -67.56%

ANSES • annual report Veterinary medicinal products containing antimicrobials in France in 2019
87
Table 14: Change in body weight treated by antimicrobial class for pigs (number of ACDkg in tonnes)
AM
INO
GLY
CO
SID
ES
OTH
ER C
LASS
ES
CEP
HA
LOSP
OR
INS
1&2G
CEP
HA
LOSP
OR
INS
3&4G
FLU
OR
OQ
UIN
OLO
NES
LIN
CO
SAM
IDES
MA
CR
OLI
DES
PEN
ICIL
LIN
S
PHEN
ICO
LS
PLEU
RO
MU
TILI
NS
POLY
MYX
INS
QU
INO
LON
ES
SULF
ON
AM
IDES
TETR
AC
YCLI
NES
TRIM
ETH
OPR
IM
TOTA
L
1999 230,989 0 0 14,239 67,875 65,479 377,507 364,211 0 287,041 1,032,593 92,905 511,084 1,231,271 466,800 4,054,918
2000 256,647 0 0 14,943 77,199 87,602 491,457 404,491 0 279,007 1,068,529 66,632 518,129 1,358,297 477,216 4,392,299
2001 293,081 0 0 12,887 85,153 103,370 613,679 419,062 210 234,775 1,100,635 46,820 526,023 1,560,855 480,916 4,762,837
2002 290,934 0 0 14,742 94,428 120,288 670,883 410,777 142 215,128 1,048,149 39,788 516,400 1,597,073 478,088 4,808,885
2003 267,749 0 0 15,370 100,082 109,588 615,937 396,607 0 134,504 1,085,791 29,511 463,489 1,613,641 431,691 4,637,863
2004 276,460 0 0 15,176 94,758 100,860 566,895 373,477 0 101,526 1,015,274 33,043 481,144 1,506,007 447,342 4,372,872
2005 273,117 0 0 21,489 113,933 103,587 600,690 408,334 0 67,516 1,067,625 34,997 483,103 1,581,645 450,933 4,567,621
2006 264,474 0 0 43,687 119,235 91,145 628,113 432,794 0 54,361 1,096,362 28,473 484,839 1,470,614 456,706 4,547,478
2007 242,226 0 0 47,195 102,148 87,659 609,008 459,022 0 46,416 1,271,635 30,942 514,993 1,605,512 481,377 4,861,904
2008 226,448 0 0 43,107 117,802 83,388 519,170 393,247 920 34,465 1,119,960 26,565 457,451 1,304,286 425,975 4,169,442
2009 221,579 0 0 41,155 120,566 80,148 494,291 430,076 18,263 37,823 1,053,497 21,956 429,029 1,222,299 400,082 4,011,249
2010 176,413 0 0 47,064 73,599 66,463 461,338 409,202 13,502 40,592 981,045 21,490 428,285 1,106,873 407,015 3,683,343
2011 129,151 0 0 22,976 77,079 52,793 390,083 366,887 15,474 38,084 1,042,911 19,551 351,086 900,363 348,439 3,305,508
2012 112,035 0 0 17,231 83,597 57,987 305,917 378,060 21,133 43,681 857,499 14,731 294,976 811,971 291,887 2,903,956
2013 113,374 0 0 15,365 83,485 54,925 252,768 379,163 15,486 40,890 706,438 13,361 259,458 910,183 257,303 2,748,267
2014 113,499 0 0 9,648 80,243 53,096 259,872 489,256 24,270 29,356 763,937 14,021 280,877 889,149 278,546 2,901,647
2015 77,695 0 0 6,679 46,133 33,110 174,345 303,701 14,669 22,667 555,507 6,158 199,112 509,600 197,266 1,871,096
2016 144,100 0 0 2,283 22,745 34,608 178,833 482,412 41,201 15,194 320,196 7,279 183,351 533,980 181,996 1,843,021
2017 128,376 0 0 956 5,001 33,794 166,182 406,073 32,410 11,183 259,013 7,529 149,611 664,735 149,186 1,755,851
2018 128,507 0 0 966 7,493 34,155 145,297 410,601 33,025 8,897 240,634 8,681 143,399 667,095 142,883 1,717,114
2019 124,875 0 0 752 7,257 34,874 157,569 389,417 32,493 8,468 171,775 9,062 130,300 476,769 129,168 1,433,492
Variation 2019/2018
-3,632 0 0 -214 -236 719 12,272 -21,184 -532 -429 -68,859 381 -13,099 -190,326 -13,715 -283,622
-2.8% -22.2% -3.1% 2.1% 8.4% -5.2% -1.6% -4.8% -28.6% 4.4% -9.1% -28.5% -9.6% -16.5%
Variation 2019/2011
-4,276 0 0 -22,224 -69,822 -17,919 -232,514 22,530 17,019 -29,616 -871,136 -10,489 -220,786 -423,594 -219,271 -1,872,016
-3.3% -96.7% -90.6% -33.9% -59.6% 6.1% 110.0% -77.8% -83.5% -53.6% -62.9% -47.0% -62.9% -56.6%

ANSES • annual report Veterinary medicinal products containing antimicrobials in France in 2019
88
Poultry
Table 15: Change in sales for poultry and in their exposure to antimicrobials
Tonnage
sold (tonnes)
Percentage of total
tonnage* Sales in mg/kg
Body weight treated
(tonnes)
Percentage of total body
weight treated*
ALEA
1999 221.36 16.9% 76.14 1,905,620 18.7% 0.655
2000 237.18 17.1% 80.92 2,219,218 20.2% 0.757
2001 249.28 18.1% 82.10 2,398,575 21.0% 0.790
2002 250.98 18.9% 89.85 2,464,931 21.2% 0.882
2003 261.95 20.3% 95.15 2,646,125 22.6% 0.961
2004 251.27 19.9% 95.03 2,437,520 21.6% 0.922
2005 254.57 19.7% 99.17 2,599,957 21.9% 1.013
2006 237.66 19.2% 102.02 2,530,206 21.6% 1.086
2007 254.37 19.2% 104.39 2,558,716 21.5% 1.050
2008 242.17 20.7% 101.38 2,404,093 22.3% 1.006
2009 216.43 20.4% 92.89 2,397,571 23.0% 1.029
2010 203.73 20.1% 86.26 2,462,472 23.8% 1.043
2011 202.29 22.2% 84.77 2,398,377 24.5% 1.005
2012 177.24 22.6% 75.57 2,208,711 24.3% 0.942
2013 157.37 22.2% 67.66 2,051,564 24.5% 0.882
2014 178.41 22.7% 78.64 2,434,618 25.7% 1.073
2015 98.94 19.2% 42.58 1,161,503 19.6% 0.500
2016 105.49 19.9% 47.24 1,280,621 21.0% 0.573
2017 94.62 19.0% 43.02 1,126,018 19.5% 0.512
2018 86.29 18.3% 38.87 1,009,035 17.5% 0.454
2019 73.67 17.5% 34.24 852,912 16.9% 0.396
Variation 2019 / 2018
-12.63 -4.62 -156,123 -0.058
-14.6% -11.9% -15.5% -12.8%
Variation 2019 / 2011
-128.63 -50.52 -1,545,465 -0.608
-63.6% -59.6% -64.4% -60.5%
* "total" means for all animal species

ANSES • annual report Veterinary medicinal products containing antimicrobials in France in 2019
89
Table 16: Change in body weight treated-day by antimicrobial class for poultry (number of ADDkg in tonnes) A
MIN
OG
LYC
OSI
DES
OTH
ER C
LASS
ES
CEP
HA
LOSP
OR
INS
1&2G
CEP
HA
LOSP
OR
INS
3&4G
FLU
OR
OQ
UIN
OLO
NES
LIN
CO
SAM
IDES
MA
CR
OLI
DES
PEN
ICIL
LIN
S
PHEN
ICO
LS
PLEU
RO
MU
TILI
NS
POLY
MYX
INS
QU
INO
LON
ES
SULF
ON
AM
IDES
TETR
AC
YCLI
NES
TRIM
ETH
OPR
IM
TOTA
L
Bod
y w
eigh
t tre
ated
-da
y / b
iom
ass
1999 149,763 0 0 0 171,228 178,220 351,930 947,342 0 27,543 2,598,982 428,235 623,244 5,136,192 502,050 10,422,240 3.58
2000 200,499 0 0 0 192,263 338,080 348,275 1,415,277 0 26,541 3,098,379 413,193 710,480 5,460,224 539,524 11,983,009 4.09
2001 227,802 0 0 0 179,820 489,500 350,990 1,278,277 0 21,533 3,301,263 404,224 700,095 6,195,693 578,699 12,904,377 4.25
2002 191,343 0 0 0 156,671 626,430 341,352 1,322,725 0 18,381 3,296,892 331,777 738,003 6,351,976 574,947 13,170,636 4.72
2003 160,922 0 0 0 164,270 525,150 335,388 1,288,964 0 8,375 3,500,196 318,067 760,359 6,997,536 613,407 13,884,626 5.04
2004 157,032 0 0 0 174,366 405,230 348,909 1,152,607 0 5,929 3,512,047 324,450 720,316 6,319,148 596,156 12,945,531 4.90
2005 143,423 0 0 0 158,259 352,080 437,560 1,309,916 0 3,933 3,917,861 301,897 746,458 6,343,124 651,779 13,548,164 5.28
2006 134,363 0 0 0 171,914 331,840 444,888 1,373,963 0 36,378 4,128,588 331,625 696,690 5,572,673 580,968 13,095,819 5.62
2007 126,606 0 0 0 192,569 275,070 457,668 1,493,356 0 44,251 3,973,276 256,068 746,037 6,011,677 650,845 13,452,994 5.52
2008 113,827 0 0 0 192,589 258,010 499,115 1,292,522 0 40,982 3,964,395 170,673 650,855 5,623,860 569,947 12,708,317 5.32
2009 116,335 0 0 0 200,930 176,800 315,099 1,375,370 0 42,092 4,514,814 188,671 676,524 4,907,219 612,577 12,419,498 5.33
2010 197,486 0 0 0 220,997 279,249 288,851 1,463,482 0 27,666 5,338,647 184,259 495,167 4,388,268 388,632 12,716,425 5.38
2011 136,423 0 0 0 236,062 276,976 228,390 1,639,173 0 31,348 4,477,953 149,819 766,438 4,508,289 649,937 12,308,690 5.16
2012 115,917 0 0 0 207,589 78,505 199,025 1,448,987 0 31,053 4,307,656 141,169 608,794 4,216,967 506,047 11,230,872 4.79
2013 167,311 0 0 0 190,535 96,329 180,858 1,508,469 0 29,173 4,238,210 127,780 525,097 3,411,934 430,258 10,353,833 4.45
2014 49,832 0 0 0 223,391 14,878 246,495 2,106,306 1,776 56,904 4,810,375 119,304 616,370 3,864,384 505,903 12,072,243 5.32
2015 30,149 0 0 0 95,717 13,058 106,837 886,978 0 46,928 2,321,896 75,427 547,656 1,819,578 466,368 5,915,651 2.55
2016 125,538 0 0 0 100,330 19,435 111,101 1,227,093 665 44,456 2,544,305 80,483 668,852 1,615,991 573,888 6,508,707 2.91
2017 135,861 0 0 0 88,802 23,427 124,111 960,276 892 43,250 2,140,508 87,458 635,038 1,501,744 531,828 5,706,081 2.59
2018 117,545 0 0 0 62,705 27,369 118,743 926,254 984 35,415 1,760,294 60,731 549,118 1,462,875 470,152 5,082,210 2.29
2019 132,685 0 0 0 59,749 31,690 110,464 1,025,934 861 37,941 1,395,351 35,959 447,367 1,053,471 380,705 4,289,564 1.99
Variation 2019 / 2018
15,140 -2,956 4,321 -8,279 99,680 -123 2,526 -364,943 -24,772 -101,751 -409,404 -89,447 -792,646 -0.30
12.9% -4.7% 15.8% -7.0% 10.8% -12.5% 7.1% -20.7% -40.8% -18.5% -28.0% -19.0% -15.60% -12.89%
Variation 2019 / 2011
-3,738 -176,313 -245,286 -117,926 -613,239 861 6,593 -3,082,602 -113,860 -319,071 -3,454,818 -269,232 -8,019,126 -3.16
-2.7% -74.7% -88.6% -51.6% -37.4% 21.0% -68.8% -76.0% -41.6% -76.6% -41.4% -65.15% -61.34%

ANSES • annual report Veterinary medicinal products containing antimicrobials in France in 2019
90
Table 17: Change in body weight treated by antimicrobial class for poultry (number of ACDkg in tonnes) A
MIN
OG
LYC
OSI
DES
OTH
ER C
LASS
ES
CEP
HA
LOSP
OR
INS
1&2G
CEP
HA
LOSP
OR
INS
3&4G
FLU
OR
OQ
UIN
OLO
NES
LIN
CO
SAM
IDES
MA
CR
OLI
DES
PEN
ICIL
LIN
S
PHEN
ICO
LS
PLEU
RO
MU
TILI
NS
POLY
MYX
INS
QU
INO
LON
ES
SULF
ON
AM
IDES
TETR
AC
YCLI
NES
TRIM
ETH
OPR
IM
TOTA
L
1999 28,199 0 0 0 34,246 25,460 72,280 227,201 0 3206 537,962 83,634 106,825 822,576 106,552 1,905,620
2000 36,824 0 0 0 38,453 48,297 79,041 330,106 0 3121 638,597 82,639 115,988 885,419 110,311 2,219,218
2001 41,731 0 0 0 35,964 69,929 82,529 297,386 0 2609 690,617 80,731 111,626 1,030,167 115,125 2,398,575
2002 33,394 0 0 0 31,334 89,490 83,887 301,969 0 2251 714,931 65,358 115,400 1,065,807 101,212 2,464,931
2003 28,442 0 0 0 32,854 75,021 87,360 294,592 0 1177 778,378 63,222 116,771 1,202,130 105,901 2,646,125
2004 27,795 0 0 0 34,873 57,890 93,338 269,125 0 896 771,245 64,257 110,243 1,040,685 100,416 2,437,520
2005 25,240 0 0 0 31,652 50,297 108,775 308,778 0 661 873,760 59,955 114,005 1,058,825 109,156 2,599,957
2006 24,699 0 0 0 34,383 47,406 105,136 331,984 0 6947 908,239 65,915 103,369 927,645 93,544 2,530,206
2007 26,680 0 0 0 38,514 39,296 102,212 363,841 0 8662 856,303 50,844 112,050 991,210 104,679 2,558,716
2008 19,524 0 0 0 38,518 36,859 111,299 314,301 0 8072 860,386 33,800 98,846 902,634 92,040 2,404,093
2009 20,522 0 0 0 40,186 25,257 82,733 336,510 0 8290 952,731 37,171 104,957 809,201 100,329 2,397,571
2010 26,349 0 0 0 44,199 35,268 77,567 368,538 0 5423 1,091,842 36,501 77,378 723,604 69,254 2,462,472
2011 18,513 0 0 0 47,212 35,467 57,932 397,384 0 6018 912,966 29,784 121,440 791,760 108,911 2,398,377
2012 15,898 0 0 0 41,518 7,850 50,207 335,192 0 5967 881,147 28,120 98,256 762,878 88,684 2,208,711
2013 21,771 0 0 0 38,107 9,633 44,439 350,164 0 5613 861,632 25,547 87,673 623,105 77,827 2,051,564
2014 10,251 0 0 0 44,678 2,125 64,271 482,700 355 11092 977,909 23,861 105,258 719,571 92,290 2,434,618
2015 5,975 0 0 0 19,143 1,865 26,386 209,891 0 9086 474,455 15,086 88,749 316,803 79,587 1,161,503
2016 15,489 0 0 0 20,066 2,776 28,527 288,987 133 8732 514,196 16,097 106,094 284,702 93,242 1,280,621
2017 17,192 0 0 0 17,760 3,358 32,419 220,542 178 8549 435,472 17,492 101,864 277,615 85,795 1,126,018
2018 15,321 0 0 0 12,541 3,921 31,146 212,239 197 7016 357,682 12,147 89,962 273,933 77,740 1,009,035
2019 16,956 0 0 0 11,950 4,535 26,560 229,309 172 7528 284,910 7,192 72,779 198,312 62,337 852,912
Variation 2019 / 2018
1,635 0 0 0 -591 614 -4,586 17,070 -25 512 -72,772 -4,955 -17,183 -75,621 -15,403 -156,123
10.7% -4.7% 15.7% -14.7% 8.0% -12.7% 7.3% -20.3% -40.8% -19.1% -27.6% -19.8% -15.5%
Variation 2019 / 2011
-1,557 0 0 0 -35,262 -30,932 -31,372 -168,075 172 1510 -628,056 -22,592 -48,661 -593,448 -46,574 -1,545,465
-8.4% -74.7% -87.2% -54.2% -42.3% 25.1% -68.8% -75.9% -40.1% -75.0% -42.8% -64.4%

ANSES • annual report Veterinary medicinal products containing antimicrobials in France in 2019
91
Rabbits
Table 18: Change in sales for rabbits and in their exposure to antimicrobials
Tonnage
sold (tonnes)
Percentage of total
tonnage* Sales in mg/kg
Body weight treated
(tonnes)
Percentage of total body
weight treated*
ALEA
1999 75.42 5.8% 542.69 388,697 3.8% 2.797
2000 82.46 6.0% 605.43 437,686 4.0% 3.214
2001 80.80 5.9% 595.30 398,372 3.5% 2.935
2002 89.83 6.8% 662.34 459,635 4.0% 3.389
2003 100.52 7.8% 779.80 533,210 4.6% 4.137
2004 116.77 9.3% 897.94 578,705 5.1% 4.450
2005 114.80 8.9% 897.44 527,722 4.4% 4.125
2006 103.25 8.3% 831.33 477,901 4.1% 3.848
2007 113.66 8.6% 905.19 510,172 4.3% 4.063
2008 103.02 8.8% 919.88 431,942 4.0% 3.857
2009 88.61 8.4% 863.58 399,515 3.8% 3.894
2010 79.90 7.9% 799.71 371,967 3.6% 3.723
2011 71.09 7.8% 659.44 342,378 3.5% 3.176
2012 55.26 7.0% 535.81 268,863 3.0% 2.607
2013 52.46 7.4% 517.57 273,825 3.3% 2.701
2014 61.66 7.8% 594.95 309,151 3.3% 2.983
2015 45.25 8.8% 442.74 231,895 3.9% 2.269
2016 44.22 8.3% 478.93 202,397 3.3% 2.192
2017 31.68 6.4% 362.02 157,143 2.7% 1.796
2018 28.24 6.0% 335.87 154,053 2.7% 1.832
2019 31.07 7.4% 382.21 151,150 3.0% 1.860
Variation 2019 / 2018
2.82 46.34 -2,903 0.028
10.0% 13.8% -1.9% 1.5%
Variation 2019 / 2011
-40.03 -277.23 -191,228 -1.316
-56.3% -42.0% -55.9% -41.4%
* "total" means for all animal species

ANSES • annual report Veterinary medicinal products containing antimicrobials in France in 2019
92
Table 19: Change in body weight treated-day by antimicrobial class for rabbits (number of ADDkg in tonnes) A
MIN
OG
LYC
OSI
DES
OTH
ER C
LASS
ES
CEP
HA
LOSP
OR
INS
1&2G
CEP
HA
LOSP
OR
INS
3&4G
FLU
OR
OQ
UIN
OLO
NES
LIN
CO
SAM
IDES
MA
CR
OLI
DES
PEN
ICIL
LIN
S
PHEN
ICO
LS
PLEU
RO
MU
TILI
NS
POLY
MYX
INS
QU
INO
LON
ES
SULF
ON
AM
IDES
TETR
AC
YCLI
NES
TRIM
ETH
OPR
IM
TOTA
L
Bod
y w
eigh
t tre
ated
-day
/ bi
omas
s
1999 435,842 0 0 0 0 0 198,522 0 0 4,176,822 1,020,245 690 369,180 629,259 139,720 6,820,589 49.08
2000 455,506 0 0 0 0 0 158,203 0 0 5,218,611 1,103,266 635 508,684 572,579 254,607 8,009,347 58.81
2001 439,336 0 0 0 0 0 189,523 0 0 3,804,573 1,101,718 2,415 474,000 665,353 247,465 6,666,321 49.11
2002 445,188 0 0 0 0 0 206,122 0 0 4,139,026 844,874 3,127 539,775 943,762 319,050 7,115,074 52.46
2003 361,322 0 0 0 0 0 140,417 0 0 5,312,962 608,582 3,074 646,328 1,241,358 459,999 8,308,213 64.45
2004 314,180 0 0 0 0 0 132,567 0 0 3,982,799 501,837 3,210 754,560 1,817,533 605,779 7,502,825 57.69
2005 266,428 0 0 0 0 0 88,044 0 0 1,842,977 555,982 4,076 921,562 1,751,995 796,200 5,426,835 42.42
2006 295,350 0 0 0 0 0 77,824 0 0 2,049,116 531,688 4,327 861,404 1,428,065 708,858 5,244,430 42.23
2007 309,171 0 0 0 0 0 59,892 0 0 2,273,824 577,110 4,252 955,902 1,520,688 795,873 5,698,173 45.38
2008 329,121 0 0 0 0 0 30,229 0 0 1,871,010 516,820 4,167 697,730 1,486,118 585,049 4,933,109 44.05
2009 343,113 0 0 0 0 0 24,771 0 0 1,789,764 555,605 3,485 616,216 1,234,738 503,675 4,565,869 44.50
2010 541,691 0 0 0 0 0 106,100 0 0 1,567,468 409,766 3,384 507,178 1,071,977 388,281 4,205,492 42.09
2011 537,013 0 0 0 0 0 90,401 0 0 1,142,234 520,890 2 438,716 942,285 337,423 3,667,867 34.02
2012 455,320 0 0 0 0 0 92,095 0 0 646,790 421,864 1 348,463 694,554 276,243 2,650,256 25.70
2013 368,510 0 0 0 0 0 77,674 0 0 684,611 184,793 0 342,637 821,307 279,400 2,474,604 24.41
2014 470,499 0 0 0 14 0 68,957 0 0 762,027 366,329 0 474,106 714,165 389,897 2,849,471 27.49
2015 369,999 0 0 0 2,949 0 69,768 0 0 728,714 436,009 0 335,229 434,164 252,219 2,367,222 23.16
2016 354,925 0 0 0 2,181 0 65,157 0 0 622,703 130,219 0 393,378 394,435 325,133 1,951,622 21.14
2017 242,859 0 0 0 1,696 0 36,587 0 0 603,971 191,186 0 259,079 308,579 231,086 1,638,778 18.73
2018 213,639 0 0 0 1,182 0 36,500 0 0 562,733 153,659 0 206,165 348,178 181,329 1,518,946 18.06
2019 152,012 0 0 0 957 0 70,718 0 0 534,658 111,167 0 292,080 290,460 258,181 1,434,321 17.65
Variation 2019 / 2018
-61,627 -225 0 34,218 0 0 -28,075 -42,492 0 85,915 -57,718 76,852 -84,625 -0.42
-28.8% -19.0% 93.7% -5.0% -27.7% 41.7% -16.6% 42.4% -5.57% -2.30%
Variation 2019 / 2011
-385,001 957 0 -19,683 0 0 -607,576 -409,723 -2 -146,636 -651,825 -79,242 -2,233,546 -16.38
-71.7% -21.8% -53.2% -78.7% -100.0% -33.4% -69.2% -23.5% -60.89% -48.13%

ANSES • annual report Veterinary medicinal products containing antimicrobials in France in 2019
93
Table 20: Change in body weight treated by antimicrobial class for rabbits (number of ACDkg in tonnes) A
MIN
OG
LYC
OSI
DES
OTH
ER C
LASS
ES
CEP
HA
LOSP
OR
INS
1&2G
CEP
HA
LOSP
OR
INS
3&4G
FLU
OR
OQ
UIN
OLO
NES
LIN
CO
SAM
IDES
MA
CR
OLI
DES
PEN
ICIL
LIN
S
PHEN
ICO
LS
PLEU
RO
MU
TILI
NS
POLY
MYX
INS
QU
INO
LON
ES
SULF
ON
AM
IDES
TETR
AC
YCLI
NES
TRIM
ETH
OPR
IM
TOTA
L
1999 42,389 0 0 0 0 0 11,305 0 0 134736 85,792 138 52,630 63,474 26,325 388,697
2000 44,198 0 0 0 0 0 9,029 0 0 168342 92,760 127 67,000 57,879 37,899 437,686
2001 43,385 0 0 0 0 0 10,489 0 0 122728 91,893 483 64,197 67,465 37,655 398,372
2002 46,128 0 0 0 0 0 10,802 0 0 133517 71,277 625 68,842 129,833 43,432 459,635
2003 38,190 0 0 0 0 0 7,565 0 0 171386 54,090 615 79,100 183,501 57,056 533,210
2004 34,120 0 0 0 0 0 6,946 0 0 128477 40,942 642 89,143 279,252 70,891 578,705
2005 29,531 0 0 0 0 0 5,120 0 0 59451 44,846 815 107,923 280,961 92,333 527,722
2006 32,806 0 0 0 0 0 4,558 0 0 66101 42,924 865 98,960 232,411 80,199 477,901
2007 35,873 0 0 0 0 0 3,758 0 0 73349 48,582 850 110,777 237,626 91,076 510,172
2008 36,874 0 0 0 0 0 2,227 0 0 60355 43,262 833 82,695 206,187 68,250 431,942
2009 35,456 0 0 0 0 0 1,588 0 0 59348 47,751 697 76,726 178,386 62,828 399,515
2010 45,859 0 0 0 0 0 14,688 0 0 54508 35,000 677 66,564 155,156 51,571 371,967
2011 47,194 0 0 0 0 0 13,052 0 0 41159 47,675 0 62,432 131,564 50,489 342,378
2012 43,075 0 0 0 0 0 13,366 0 0 24754 37,839 0 51,364 99,932 42,275 268,863
2013 33,544 0 0 0 0 0 11,097 0 0 26490 20,339 0 51,256 131,775 43,222 273,825
2014 45,091 0 0 0 1 0 10,200 0 0 29242 47,119 0 69,643 108,760 59,088 309,151
2015 34,923 0 0 0 588 0 11,307 0 0 26540 52,939 0 44,888 61,943 34,801 231,895
2016 36,867 0 0 0 436 0 9,477 0 0 22914 19,342 0 55,615 59,218 46,800 202,397
2017 20,847 0 0 0 338 0 5,340 0 0 22244 25,619 0 37,596 45,864 33,254 157,143
2018 19,570 0 0 0 235 0 5,317 0 0 20297 21,436 0 30,714 56,924 27,155 154,053
2019 19,219 0 0 0 191 0 10,177 0 0 19121 18,378 0 40,786 45,531 36,115 151,150
Variation 2019 / 2018
-351 -44 0 4,860 0 0 -1176 -3,058 0 10,072 -11,393 8,960 -2,903
-1.8% -18.7% 91.4% -5.8% -14.3% 32.8% -20.0% 33.0% -1.9%
Variation 2019 / 2011
-27,975 191 0 -2,875 0 0 -22038 -29,297 0 -21,646 -86,033 -14,374 -191,228
-59.3% -22.0% -53.5% -61.5% -34.7% -65.4% -28.5% -55.9%

ANSES • annual report Veterinary medicinal products containing antimicrobials in France in 2019
94
Domestic carnivores
Table 21: Change in sales for cats and dogs and in their exposure to antimicrobials
Tonnage
sold (tonnes)
Percentage of total
tonnage* Sales in mg/kg
Body weight treated
(tonnes)
Percentage of total body
weight treated*
ALEA
1999 16.00 1.2% 102.38 114,904 1.1% 0.735
2000 15.89 1.1% 100.91 115,055 1.0% 0.731
2001 15.70 1.1% 92.55 114,392 1.0% 0.674
2002 16.45 1.2% 96.57 112,040 1.0% 0.658
2003 15.46 1.2% 92.14 105,961 0.9% 0.631
2004 16.50 1.3% 98.58 111,431 1.0% 0.666
2005 17.23 1.3% 102.94 116,726 1.0% 0.697
2006 18.42 1.5% 114.17 120,969 1.0% 0.750
2007 18.29 1.4% 113.36 126,125 1.1% 0.782
2008 18.19 1.6% 113.80 121,448 1.1% 0.760
2009 17.38 1.6% 108.75 118,934 1.1% 0.744
2010 16.88 1.7% 107.04 116,706 1.1% 0.740
2011 16.75 1.8% 106.25 117,524 1.2% 0.745
2012 15.66 2.0% 99.80 107,800 1.2% 0.687
2013 14.29 2.0% 91.03 105,939 1.3% 0.675
2014 17.03 2.2% 106.76 121,478 1.3% 0.761
2015 12.73 2.5% 79.78 93,609 1.6% 0.587
2016 15.63 2.9% 95.36 98,642 1.6% 0.602
2017 16.08 3.2% 98.10 105,164 1.8% 0.642
2018 16.20 3.4% 94.86 107,424 1.9% 0.629
2019 16.41 3.9% 96.06 109,642 2.2% 0.642
Variation 2019 / 2018
0.21 1.20 2,218 0.013
1.3% 1.3% 2.1% 2.1%
Variation 2019 / 2011
-0.35 -10.19 -7,882 -0.103
-2.1% -9.6% -6.7% -13.9%
* "total" means for all animal species

ANSES • annual report Veterinary medicinal products containing antimicrobials in France in 2019
95
Table 22: Change in body weight treated-day by antimicrobial class for cats and dogs (number of ADDkg in tonnes) A
MIN
OG
LYC
OSI
DES
OTH
ER C
LASS
ES
CEP
HA
LOSP
OR
INS
1&2G
CEP
HA
LOSP
OR
INS
3&4G
FLU
OR
OQ
UIN
OLO
NES
LIN
CO
SAM
IDES
MA
CR
OLI
DES
PEN
ICIL
LIN
S
PHEN
ICO
LS
PLEU
RO
MU
TILI
NS
POLY
MYX
INS
QU
INO
LON
ES
SULF
ON
AM
IDES
TETR
AC
YCLI
NES
TRIM
ETH
OPR
IM
TOTA
L
Bod
y w
eigh
t tre
ated
-day
/ bi
omas
s
1999 83,648 61,307 114,400 0 85,021 12,940 56,093 187,477 1,285 0 6,278 996 75,759 36,287 35,257 598,430 3.83
2000 78,470 66,454 117,557 0 92,936 10,354 61,523 180,250 1,205 0 5,907 3,217 73,714 34,935 31,416 600,448 3.81
2001 73,425 66,410 136,206 0 110,465 10,627 62,165 173,398 1,261 0 5,445 2,727 63,935 33,805 27,108 616,480 3.63
2002 78,783 65,850 151,228 0 121,314 14,296 72,004 167,868 1,279 0 5,160 4,014 62,255 35,916 22,561 654,031 3.84
2003 75,159 19,864 170,144 0 118,190 16,713 60,379 165,174 1,275 0 5,243 3,126 55,378 34,407 17,897 645,353 3.85
2004 75,467 63,254 171,336 0 115,410 15,662 63,871 177,033 1,242 0 4,586 2,318 58,313 35,760 17,887 658,047 3.93
2005 73,997 49,780 187,279 0 108,200 17,005 59,590 218,166 1,318 0 4,429 2,550 50,407 41,610 14,518 705,264 4.21
2006 69,460 79,644 185,150 631 99,941 18,233 80,411 254,480 1,326 0 4,718 330 50,239 37,267 13,595 743,202 4.61
2007 65,256 54,009 189,566 3,743 113,057 17,175 55,139 282,701 1,207 0 3,593 1,316 51,738 41,688 13,207 766,055 4.75
2008 63,476 51,855 188,960 4,448 115,021 17,074 52,245 285,018 1,006 0 3,651 241 51,905 38,555 12,125 761,922 4.77
2009 60,204 47,873 182,802 4,877 125,394 17,000 50,087 282,710 843 0 3,250 715 45,378 37,791 10,659 754,087 4.72
2010 61,304 46,411 165,331 5,310 120,390 18,780 48,894 298,510 649 0 2,511 87 42,505 37,684 10,426 741,133 4.70
2011 57,305 46,890 183,603 7,111 98,426 18,797 46,888 287,645 0 0 2,648 13 45,346 39,820 13,326 728,932 4.62
2012 58,129 46,007 169,932 4,807 91,821 15,843 46,007 249,433 0 0 2,682 44,320 38,107 12,388 661,708 4.22
2013 54,914 39,533 159,934 6,009 112,477 16,899 39,533 252,949 0 0 2,816 37,619 37,507 10,547 663,001 4.22
2014 58,914 42,580 184,568 5,919 94,285 21,179 42,580 313,936 0 0 3,336 51,197 43,258 19,119 758,530 4.75
2015 39,410 38,925 111,221 7,180 66,507 17,714 38,925 250,791 74 0 2,347 44,409 38,252 15,132 576,331 3.61
2016 39,185 53,750 142,021 1,897 40,055 19,529 39,371 303,585 0 0 975 52,763 47,028 23,405 661,641 4.04
2017 43,584 50,936 135,580 2,308 26,428 21,577 33,577 337,475 0 0 682 54,074 46,187 24,300 675,945 4.12
2018 37,891 48,682 136,507 2,147 27,296 24,307 28,750 353,675 0 0 709 51,481 44,455 26,528 689,716 4.04
2019 41,863 54,938 133,706 2,179 29,495 25,323 30,187 349,307 0 0 652 48,674 47,668 22,965 692,531 4.05
Variation 2019 / 2018
3,972 6,256 -2,801 32 2,199 1,016 1,437 -4,368 0 0 -57 0 -2,807 3,213 -3,563 2,815 0.02
10.5% 12.9% -2.1% 1.5% 8.1% 4.2% 5.0% -1.2% -8.0% -5.5% 7.2% -13.4% 0.41% 0.41%
Variation 2019 / 2011
-15,442 8,048 -49,897 -4,932 -68,931 6,526 -16,701 61,662 0 0 -1,996 -13 3,328 7,848 9,639 -36,401 -0.57
-26.9% 17.2% -27.2% -69.4% -70.0% 34.7% -35.6% 21.4% -75.4% -100.0% 7.3% 19.7% 72.3% -4.99% -12.29%

ANSES • annual report Veterinary medicinal products containing antimicrobials in France in 2019
96
Table 23: Change in body weight treated by antimicrobial class for cats and dogs (number of ACDkg in tonnes)
AM
INO
GLY
CO
SID
ES
OTH
ER C
LASS
ES
CEP
HA
LOSP
OR
INS
1&2G
CEP
HA
LOSP
OR
INS
3&4G
FLU
OR
OQ
UIN
OLO
NES
LIN
CO
SAM
IDES
MA
CR
OLI
DES
PEN
ICIL
LIN
S
PHEN
ICO
LS
PLEU
RO
MU
TILI
NS
POLY
MYX
INS
QU
INO
LON
ES
SULF
ON
AM
IDES
TETR
AC
YCLI
NES
TRIM
ETH
OPR
IM
TOTA
L
1999 31,474 7,308 7,453 0 7,320 1,980 6,453 63,788 161 0 1,634 199 14,553 7,342 5,334 114,904
2000 29,868 8,046 7,666 0 10,031 1,289 7,237 61,675 151 0 1,558 643 14,388 7,015 4,712 115,055
2001 29,380 8,007 8,816 0 11,886 1,226 7,319 60,708 158 0 1,389 545 12,607 6,784 4,150 114,392
2002 29,721 7,713 9,612 0 13,302 1,343 8,074 54,230 160 0 1,336 803 12,518 7,205 3,439 112,040
2003 30,695 3,102 10,689 0 13,132 1,403 6,901 50,517 159 0 1,356 625 11,508 6,899 2,929 105,961
2004 33,948 7,469 10,896 0 13,413 1,285 7,287 55,208 155 0 1,181 464 12,139 7,169 3,022 111,431
2005 33,816 5,274 11,628 0 12,497 1,249 6,906 61,011 165 0 1,118 510 10,628 8,339 2,500 116,726
2006 32,426 8,959 11,496 631 12,387 1,205 8,846 65,006 166 0 1,230 66 10,648 7,468 2,425 120,969
2007 31,297 6,396 11,379 3,743 13,050 1,079 6,305 69,256 151 0 882 263 10,850 8,351 2,308 126,125
2008 29,746 6,184 11,150 4,448 13,180 996 6,036 65,367 126 0 891 48 11,030 7,718 2,226 121,448
2009 27,355 5,705 10,761 4,877 13,358 997 5,760 64,588 105 0 781 143 9,598 7,558 1,923 118,934
2010 27,913 5,529 10,054 5,310 13,291 1,298 5,638 64,426 81 0 528 17 8,515 7,537 1,943 116,706
2011 27,075 5,480 10,692 7,111 11,995 1,253 5,480 63,745 0 0 573 3 9,089 7,964 2,563 117,524
2012 26,981 5,345 9,813 4,807 11,101 824 5,345 59,326 0 0 570 0 8,739 7,622 2,212 107,800
2013 26,618 4,194 9,290 6,009 12,457 865 4,194 58,106 0 0 603 0 7,492 7,501 1,981 105,939
2014 28,564 4,302 10,410 5,919 12,546 964 4,302 67,096 0 0 697 0 11,284 8,651 4,668 121,478
2015 16,147 3,903 7,130 6,886 8,551 740 3,903 48,688 74 0 499 0 9,613 7,792 3,603 93,609
2016 15,187 5,991 9,632 1,897 5,542 769 3,937 53,509 0 0 226 0 11,655 9,405 5,649 98,642
2017 18,402 5,838 10,810 2,308 3,519 855 3,358 60,469 0 0 136 0 11,811 9,238 5,747 105,164
2018 16,918 5,722 11,692 2,147 3,933 953 2,875 62,318 0 0 142 0 11,654 8,760 6,569 107,424
2019 19,894 6,555 12,159 2,179 4,022 959 3,019 63,977 0 0 130 0 10,352 9,189 5,150 109,642
Variation 2019 / 2018
2,976 833 467 32 89 6 144 1,659 0 0 -12 0 -1,302 429 -1,419 2,218
17.6% 14.6% 4.0% 1.5% 2.3% 0.6% 5.0% 2.7% -8.5% -11.2% 4.9% -21.6% 2.1%
Variation 2019 / 2011
-7,181 1,075 1,467 -4,932 -7,973 -294 -2,461 232 0 0 -443 -3 1,263 1,225 2,587 -7,882
-26.5% 19.6% 13.7% -69.4% -66.5% -23.5% -44.9% 0.4% -77.3% -100.0% 13.9% 15.4% 100.9% -6.7%

ANSES • annual report Veterinary medicinal products containing antimicrobials in France in 2019
97

ISS
N 2
25
7 9
39
7 -
Dép
ôt lé
gal :
févr
ier
20
21-
© A
nses
Édi
tion
s : n
ovem
bre
20
20
- C
ouve
rtur
e : P
arim
age
(cré
atio
n), A
nses
(réa
lisat
ion)
- C
rédi
t ph
oto
: Gui
llaum
e de
Roq
uem
aure
l
Agence nationale de sécurité sanitaire de l’alimentation, de l’environnement et du travail14 rue Pierre et Marie CurieF94701 Maisons-Alfort cedexwww.anses.fr
@Anses_fr
Sal
es S
urve
y of
Vet
erin
ary
Pro
duct
s C
onta
inin
g A
ntim
icro
bial
s in
Fra
nce
in 2
019