Embed Size (px)
Citation preview
Answer Outline
Midterm Exam (80 Points Total) Leigh TesfatsionDATE: Thursday, March 13, 11:00am Econ 308, Spring 2008
QUESTION 1:SHORT ANSWERS [15 Points Total, 5 Points Each Part A-C(About 15 Minutes)]
Part A [5 Points] In order for a system to be referred to as complex , what two key prop-erties do researchers generally agree the system should possess?
Part A Answer Outline: From “Complex Systems,” Syllabus Section I.A
http://www.econ.iastate.edu/classes/econ308/tesfatsion/casdef.pdf
A complex system is a system that: (1) is composed of interacting units (compo-nents, primitive elements, constituents,), and (2) exhibits emergent properties,i.e., properties arising from the interactions of the units that are not propertiesof the individual units themselves.
Part B [5 Points] What does it mean to say that a market is organized as a bilateral trademarket? Give a simple specific example of a bilateral trade market.
Part B Answer Outline: From required Section III notes (“Modeling Behavior, Learning,and Interaction Networks in Dynamic Market Economies”)
http://www.econ.iastate.edu/classes/econ308/tesfatsion/ACEMarketModelingIntro.pdf
Two basic forms of trading:
1. Bilateral trading (Seller ↔ Buyer): No intermediary between buyer and seller
2. Mediated trading (Seller ↔ Mediator ↔ Buyer)
Simple Example of Bilateral Trade: Any direct buyer-to-seller trading, such as workers
seeking to “buy” a job from an employer
1
Part C [5 Points] Carefully define IN WORDS the meaning of a (pure) strategy for an
ITERATED game played for TMax iterations, where TMax ≥ 2. Give a specific example ofa (pure) strategy for a player in a 2-person simultaneous-move Iterated Prisoner’s Dilemma(IPD) game played for two iterations.
Part C Answer Outline: From required Section II notes: “Game Theory: Basic Concepts
and Terminology”http://www.econ.iastate.edu/classes/econ308/tesfatsion/gamedef.pdf
A pure strategy for a player in any particular game (including any iterated game) is a completecontingency plan, i.e., a plan dictating what move that player should take in each possiblesituation (“information state”) in which he could find himself.
Example: For a 2-person simultaneous-move Iterated Prisoner’s Dilemma (IPD) gameplayed for two iterations, every pure strategy consists of the following:
• A specific choice X (either C or D) for a move in the first iteration of the game;
• A rule that dictates which move Y (either C or D) to make on the second iterationof the game for each possible move Z (either C or D) of the rival player in the firstiteration of the game.
Since there are precisely two ways to choose X, two ways to choose Y, and two ways to chooseZ, it follows that there are 2× 2× 2 = 16 possible pure strategies that could be specifiedhere to answer this portion of Part C.A specific example of such a pure strategy is as follows: Start by defecting, then do the
opposite of what your rival did on the first move (i.e., defect if he cooperated and cooperateif he defected).
2
QUESTION 2: [30 Points Total, 5 Points Each Part A-F (About 30 Minutes)]
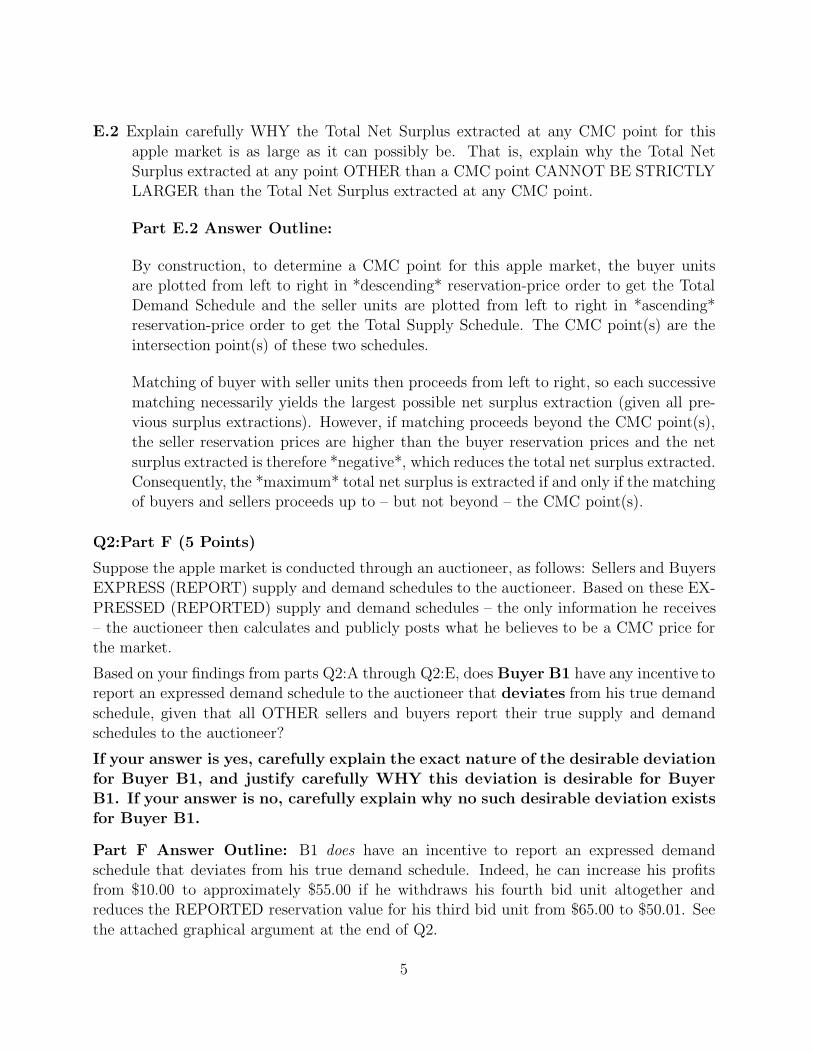
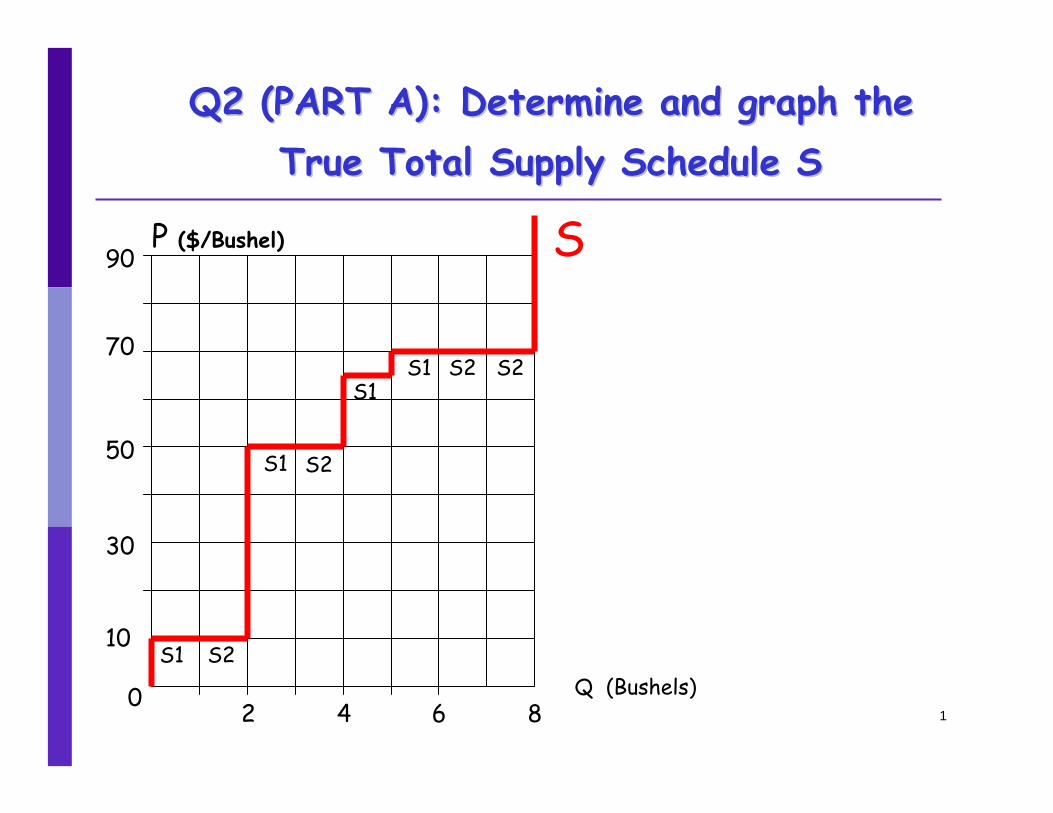
Consider a market for apples consisting of two profit-seeking sellers S1 and S2 plus threeprofit-seeking buyers B1, B2, and B3.
Table 1, below, presents the specific apple reservation prices (per bushel) for sellers andbuyers for each successive bushel of apples they sell and buy, respectively.
Table 1: True Apple Reservation Prices for Sellers and Buyers
Bushels S1 S2 B1 B2 B3
1 $10.00 $10.00 $70.00 $70.00 $25.00
2 $50.00 $50.00 $70.00 $50.00 0
3 $65.00 $70.00 $65.00 $25.00 0
4 $70.00 $70.00 $65.00 0 0
5 ∞ ∞ 0 0 0
7 ∞ ∞ 0 0 0
8 ∞ ∞ 0 0 0
IMPORTANT NOTE:
The Blank Graphs provided for Q2:A through Q2:D, below, should be used to provide therequested graphical answers for Q2:A through Q2:D in clear carefully labeled form.
If you wish, you can superimpose some or all of your graphical answers for Q2:A through
Q2:D on top of each other in one graph instead of graphing each one separately as long asthe resulting graph(s) clearly depict all required graphical answers for Q2:A through Q2:D.
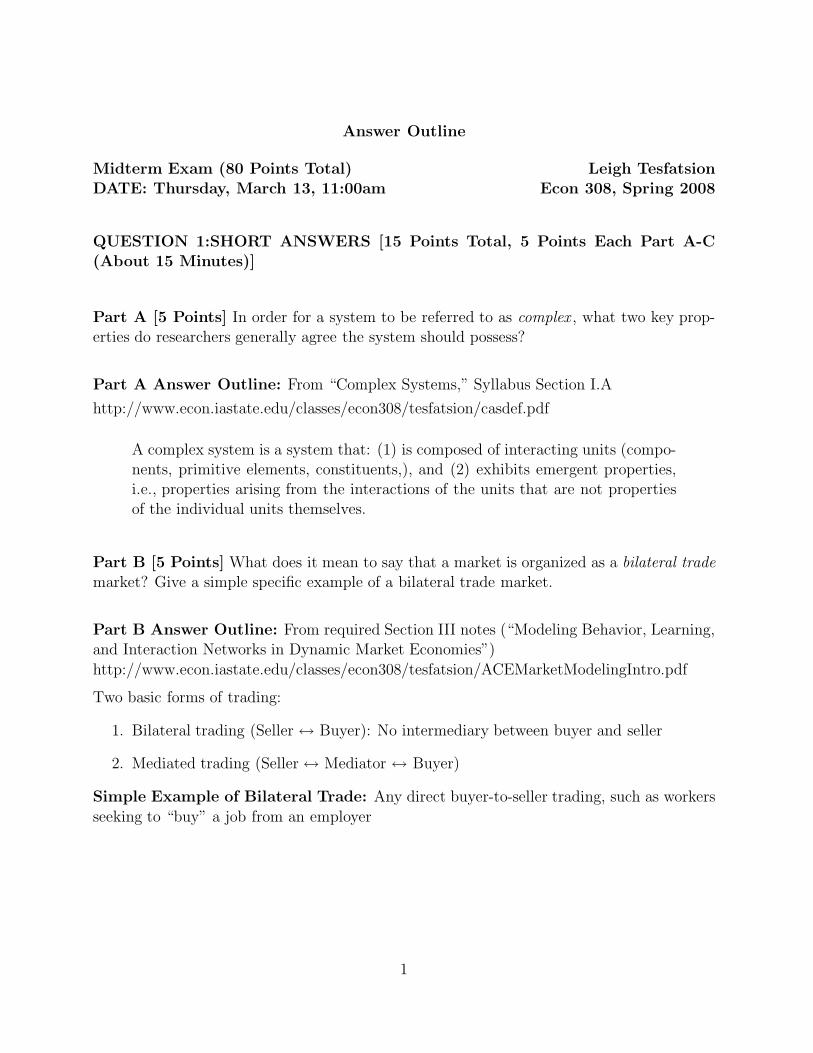
Q2:Part A (5 Points) Using the information in Table 1, graphically depict below theTrue Total Supply Schedule for this apple market with apple quantity (in bushels) on
the horizontal axis and the apple price per bushel on the vertical axis.
Part A Answer Outline: See graph at end of Q2.
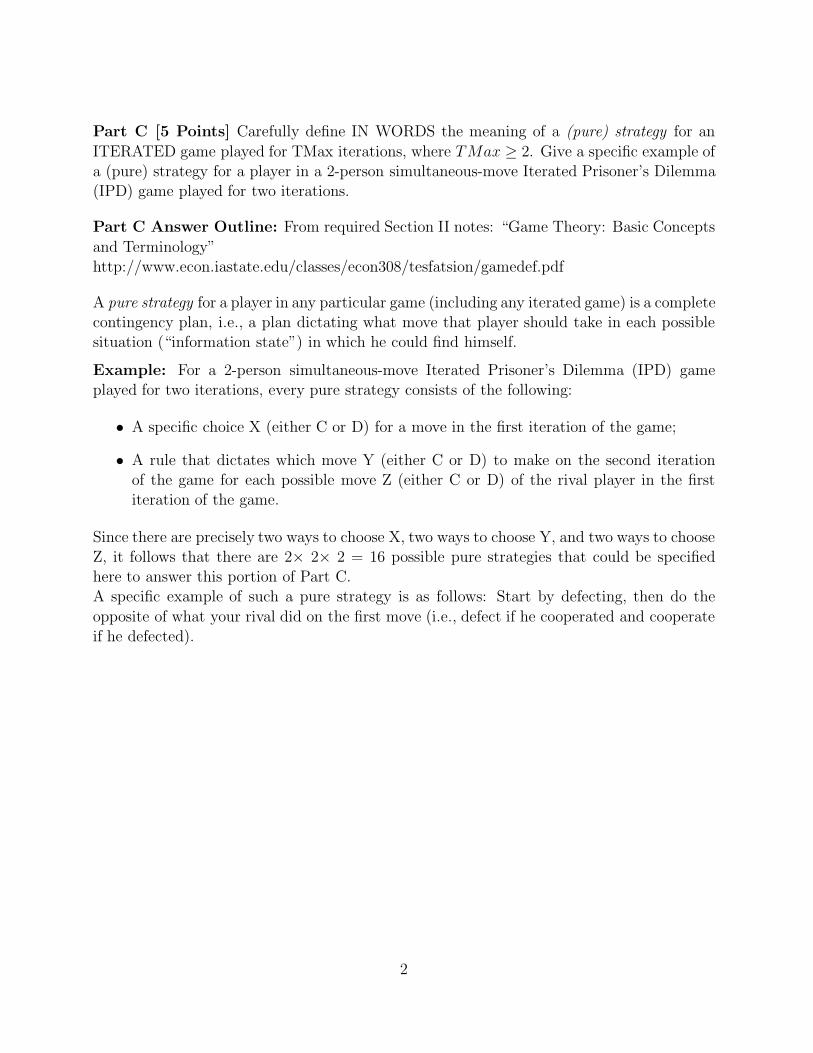
Q2:Part B (5 Points) Using the information in Table 1, graphically depict below the True
Total Demand Schedule for this apple market with apple quantity (in bushels) on thehorizontal axis and the apple price per bushel on the vertical axis.
Part B Answer Outline: See graph at end of Q2.
3
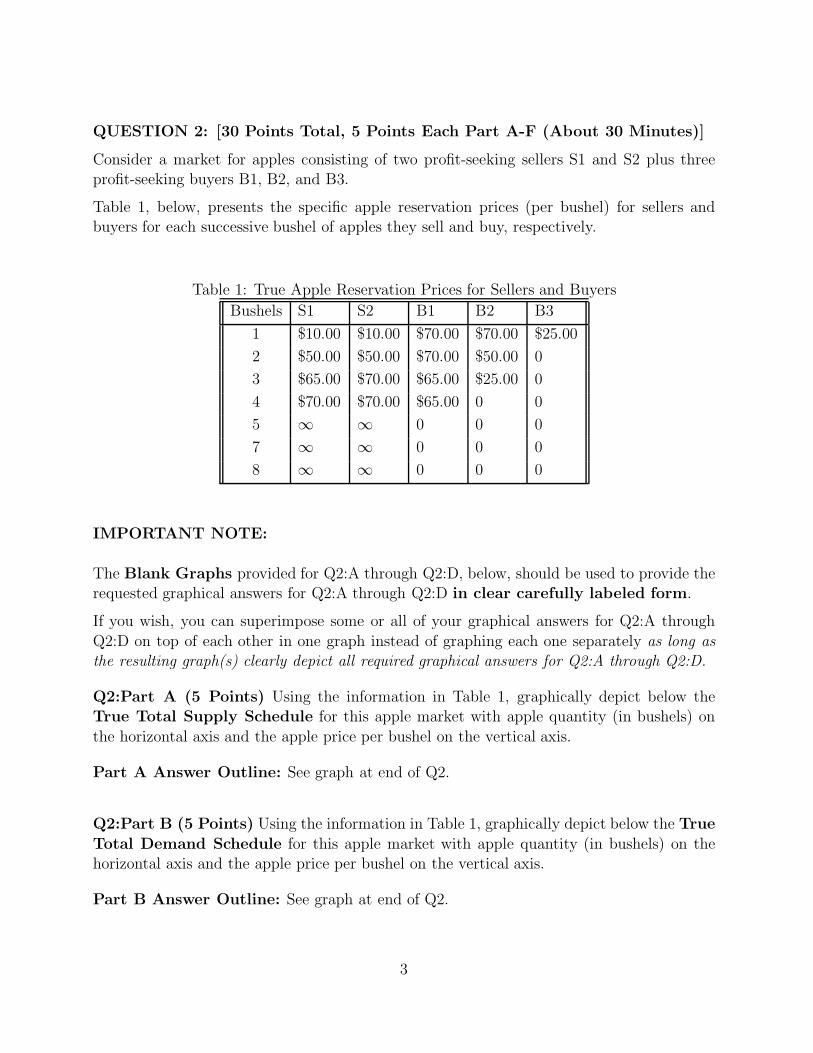
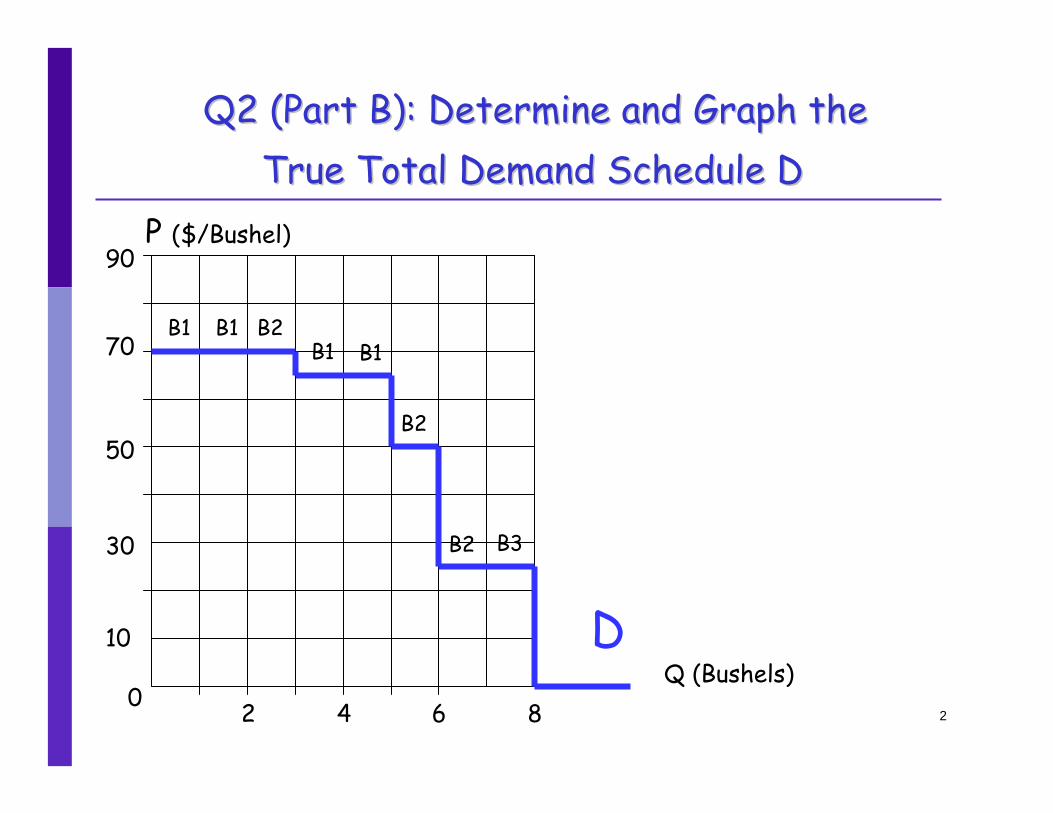
Q2:Part C (5 Points) Using your findings in parts Q2:A and Q2:B, graphically depict all
possible Competitive Market Clearing (CMC) Points for this apple market.
Part C Answer Outline: See graph at end of Q2.
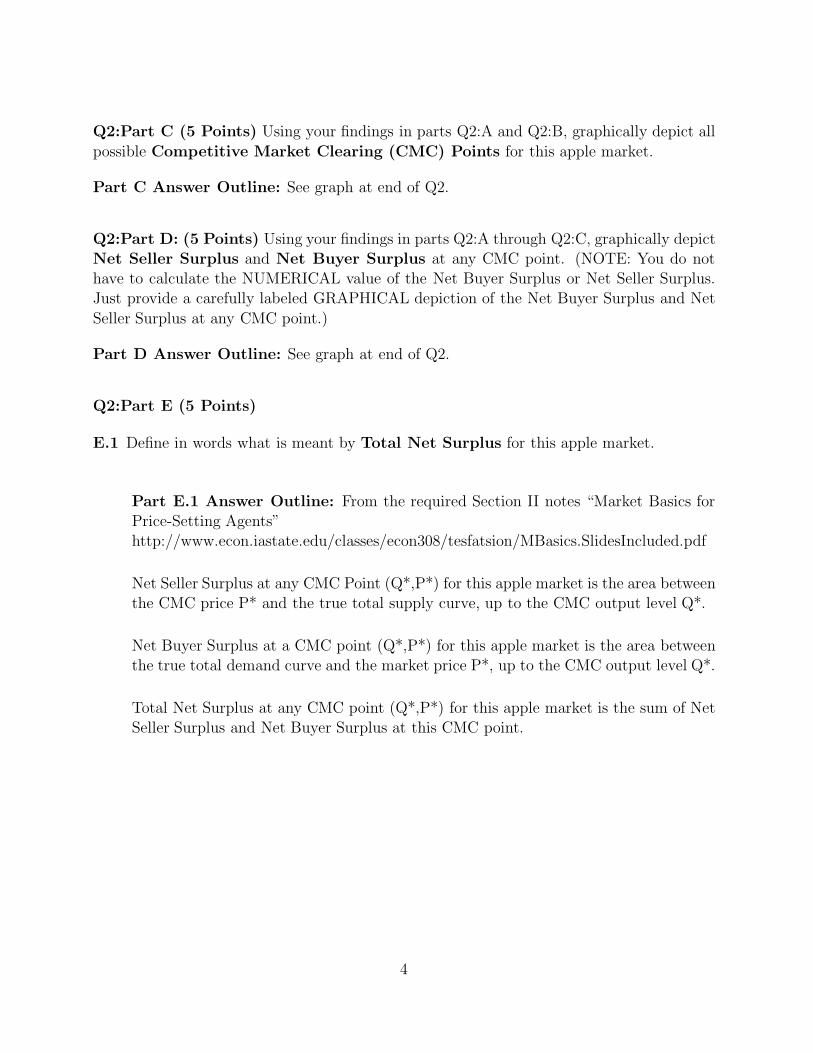
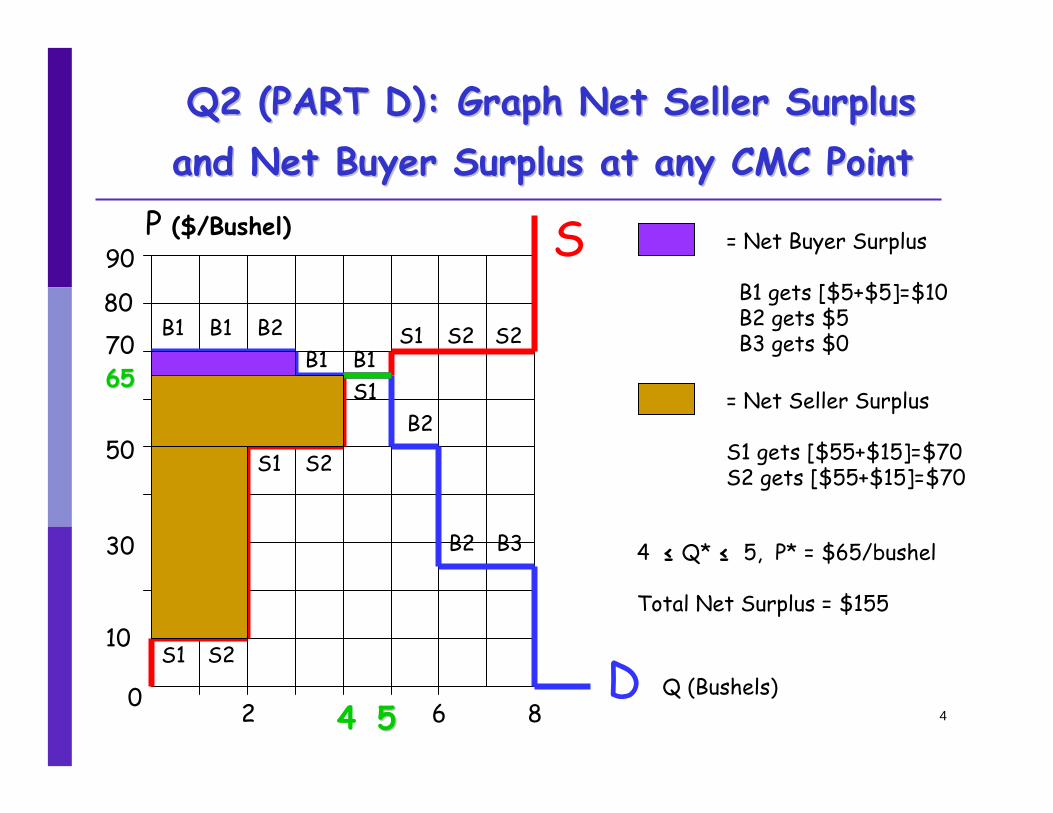
Q2:Part D: (5 Points) Using your findings in parts Q2:A through Q2:C, graphically depictNet Seller Surplus and Net Buyer Surplus at any CMC point. (NOTE: You do nothave to calculate the NUMERICAL value of the Net Buyer Surplus or Net Seller Surplus.Just provide a carefully labeled GRAPHICAL depiction of the Net Buyer Surplus and Net
Seller Surplus at any CMC point.)
Part D Answer Outline: See graph at end of Q2.
Q2:Part E (5 Points)
E.1 Define in words what is meant by Total Net Surplus for this apple market.
Part E.1 Answer Outline: From the required Section II notes “Market Basics forPrice-Setting Agents”http://www.econ.iastate.edu/classes/econ308/tesfatsion/MBasics.SlidesIncluded.pdf
Net Seller Surplus at any CMC Point (Q*,P*) for this apple market is the area betweenthe CMC price P* and the true total supply curve, up to the CMC output level Q*.
Net Buyer Surplus at a CMC point (Q*,P*) for this apple market is the area betweenthe true total demand curve and the market price P*, up to the CMC output level Q*.
Total Net Surplus at any CMC point (Q*,P*) for this apple market is the sum of NetSeller Surplus and Net Buyer Surplus at this CMC point.
4
E.2 Explain carefully WHY the Total Net Surplus extracted at any CMC point for this
apple market is as large as it can possibly be. That is, explain why the Total NetSurplus extracted at any point OTHER than a CMC point CANNOT BE STRICTLYLARGER than the Total Net Surplus extracted at any CMC point.
Part E.2 Answer Outline:
By construction, to determine a CMC point for this apple market, the buyer unitsare plotted from left to right in *descending* reservation-price order to get the TotalDemand Schedule and the seller units are plotted from left to right in *ascending*reservation-price order to get the Total Supply Schedule. The CMC point(s) are the
intersection point(s) of these two schedules.
Matching of buyer with seller units then proceeds from left to right, so each successive
matching necessarily yields the largest possible net surplus extraction (given all pre-vious surplus extractions). However, if matching proceeds beyond the CMC point(s),the seller reservation prices are higher than the buyer reservation prices and the net
surplus extracted is therefore *negative*, which reduces the total net surplus extracted.Consequently, the *maximum* total net surplus is extracted if and only if the matchingof buyers and sellers proceeds up to – but not beyond – the CMC point(s).
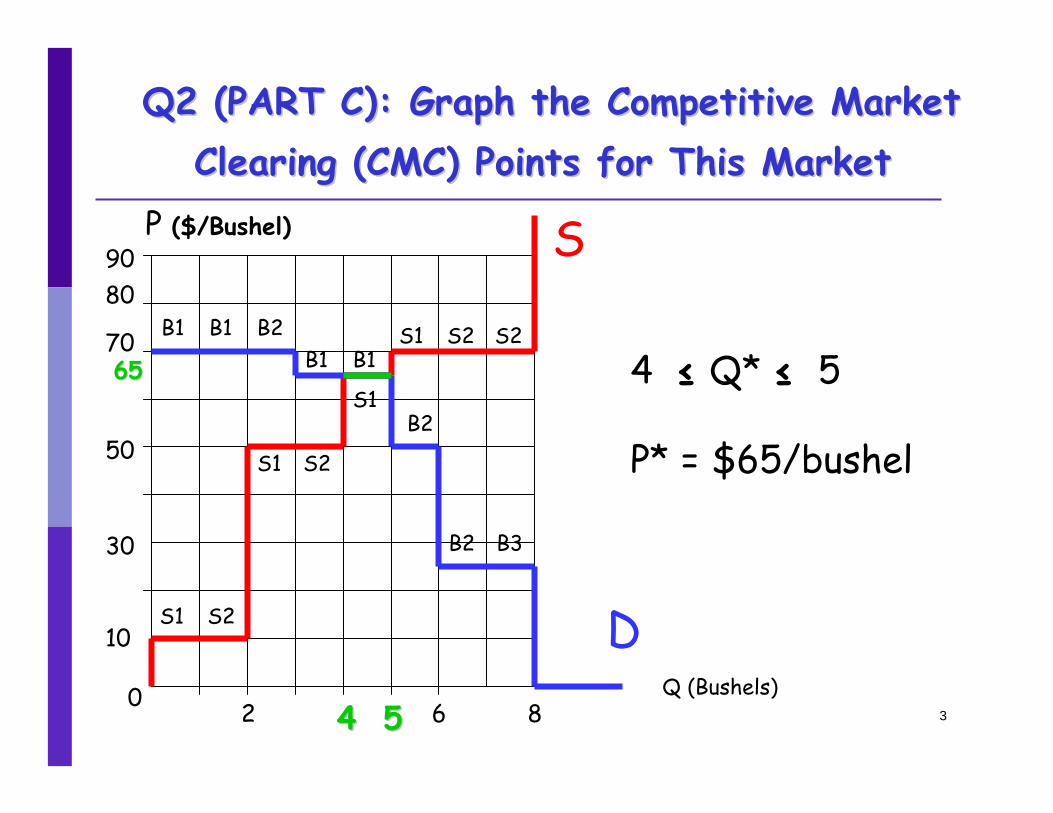
Q2:Part F (5 Points)
Suppose the apple market is conducted through an auctioneer, as follows: Sellers and BuyersEXPRESS (REPORT) supply and demand schedules to the auctioneer. Based on these EX-
PRESSED (REPORTED) supply and demand schedules – the only information he receives– the auctioneer then calculates and publicly posts what he believes to be a CMC price forthe market.
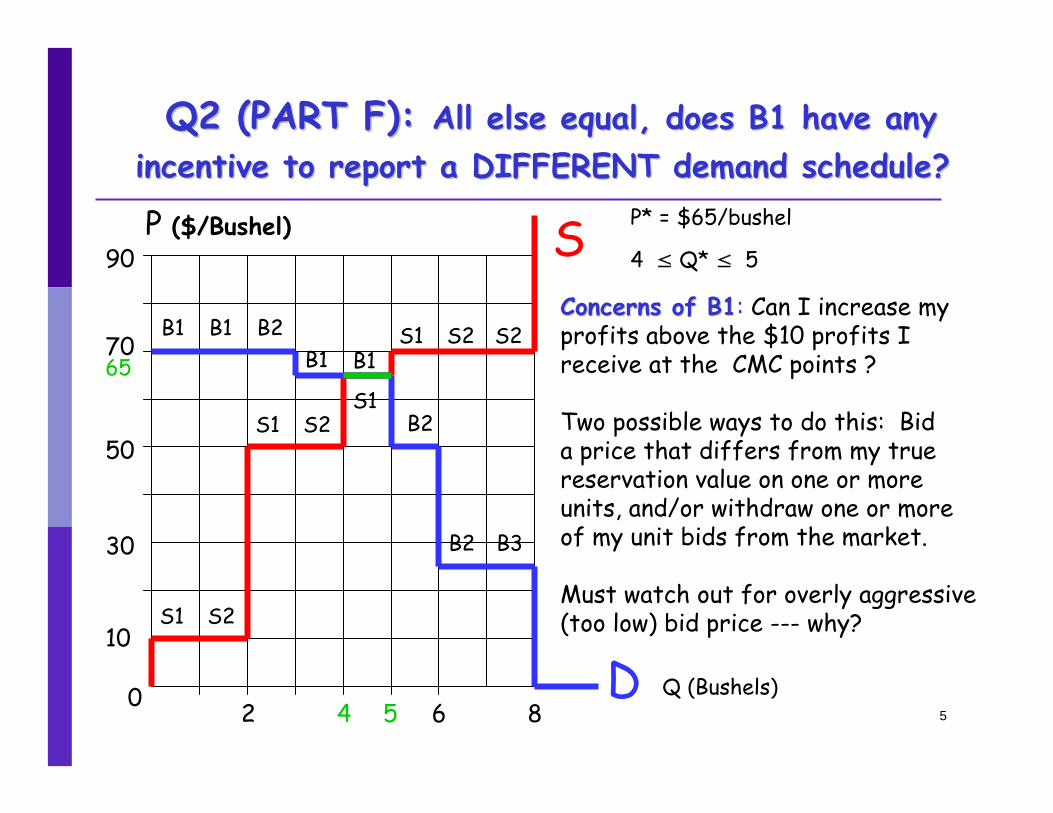
Based on your findings from parts Q2:A through Q2:E, does Buyer B1 have any incentive toreport an expressed demand schedule to the auctioneer that deviates from his true demand
schedule, given that all OTHER sellers and buyers report their true supply and demandschedules to the auctioneer?
If your answer is yes, carefully explain the exact nature of the desirable deviationfor Buyer B1, and justify carefully WHY this deviation is desirable for BuyerB1. If your answer is no, carefully explain why no such desirable deviation existsfor Buyer B1.
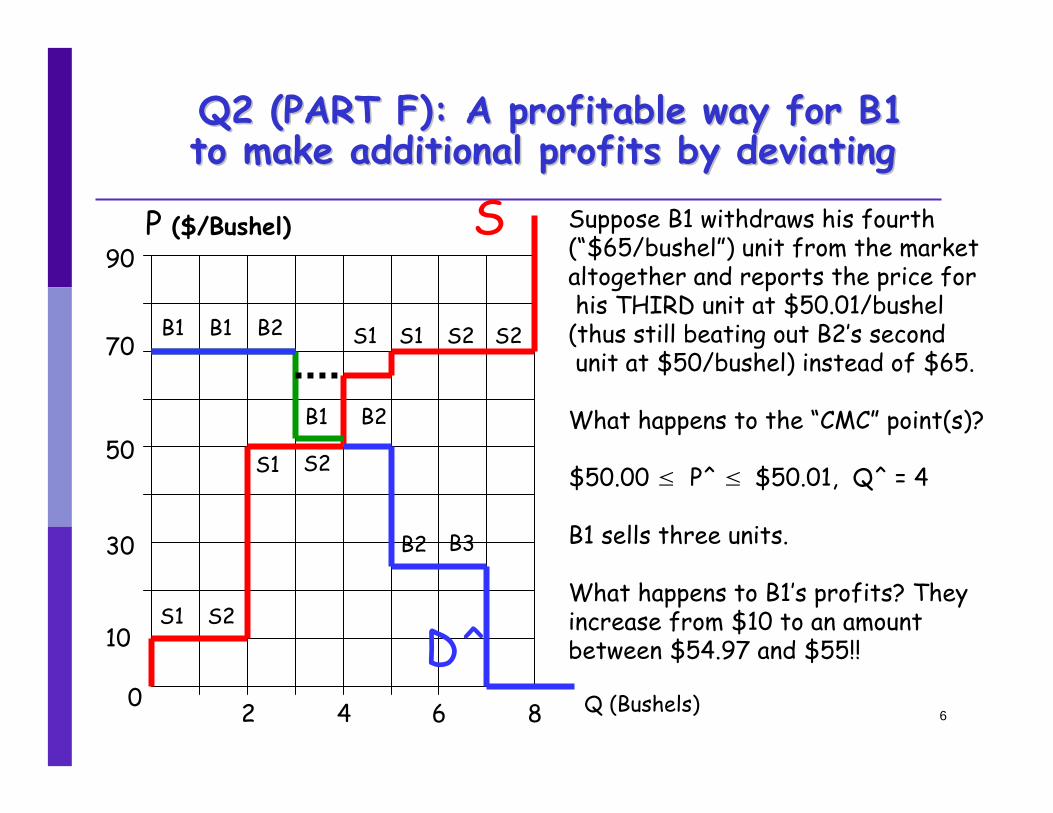
Part F Answer Outline: B1 does have an incentive to report an expressed demandschedule that deviates from his true demand schedule. Indeed, he can increase his profitsfrom $10.00 to approximately $55.00 if he withdraws his fourth bid unit altogether andreduces the REPORTED reservation value for his third bid unit from $65.00 to $50.01. See
the attached graphical argument at the end of Q2.
5
1
Q2 (PART A): Determine and graph the Q2 (PART A): Determine and graph the True Total Supply Schedule STrue Total Supply Schedule S
P ($/Bushel)
0
90
10
30
50
70
2 4 6 8
S
Q (Bushels)S1 S2
S1 S2
S1S1 S2 S2
2
Q2 (Part B): Determine and Graph the Q2 (Part B): Determine and Graph the True Total Demand Schedule DTrue Total Demand Schedule D
P ($/Bushel)
0
90
10
30
50
70
2 4 6 8Q (Bushels)
D
B1 B1 B2B1 B1
B2
B2 B3
3
Q2 (PART C): Graph the Competitive Market Q2 (PART C): Graph the Competitive Market Clearing (CMC) Points for This MarketClearing (CMC) Points for This Market
P ($/Bushel)
0
90
10
30
50
6565
2 44 6 8
S
D
B1 B1 B2B1 B1
B2
B2 B3
S1 S2
S1 S2 S2
4 ≤ Q* ≤ 5
P* = $65/bushel
Q (Bushels)
80
55
S1
S1 S2
70
4
Q2 (PART D): Graph Net Seller Surplus Q2 (PART D): Graph Net Seller Surplus and Net Buyer Surplus at any CMC Pointand Net Buyer Surplus at any CMC Point
P ($/Bushel)
0
90
10
30
50
6565
2 4 6 8
S
D
B1 B1 B2B1 B1
B2
B2 B3
S1 S2
S1 S2
S1 S2 S2
4 ≤ Q* ≤ 5, P* = $65/bushel
Total Net Surplus = $155
Q (Bushels)
= Net Buyer Surplus
B1 gets [$5+$5]=$10B2 gets $5B3 gets $0
= Net Seller Surplus
S1 gets [$55+$15]=$70S2 gets [$55+$15]=$70
55
80
S1
S1
S2
S2
S1
70
5
Q2 (PART F): Q2 (PART F): All else equal, does B1 have any All else equal, does B1 have any incentive to report a DIFFERENT demand schedule?incentive to report a DIFFERENT demand schedule?
P ($/Bushel)
0
90
10
30
50
70
2 4 6 8
S
D
B1 B1 B2B1 B1
B2
B2 B3
S1 S2
S1 S2S1
S1 S2 S2
P* = $65/bushel
4 ≤ Q* ≤ 5
Q (Bushels)
Concerns of B1Concerns of B1: Can I increase my profits above the $10 profits I receive at the CMC points ?
Two possible ways to do this: Bid a price that differs from my true reservation value on one or more units, and/or withdraw one or moreof my unit bids from the market.
Must watch out for overly aggressive (too low) bid price --- why?
5
65
6
Q2 (PART F): A profitable way for B1 Q2 (PART F): A profitable way for B1 to make additional profits by deviatingto make additional profits by deviating
P ($/Bushel)
0
90
10
30
50
70
2 4 6 8
S
D^
B1 B1 B2
B1 B2
B2 B3
S1 S2
S1
S1 S1 S2 S2
Q (Bushels)
Suppose B1 withdraws his fourth(“$65/bushel”) unit from the marketaltogether and reports the price forhis THIRD unit at $50.01/bushel
(thus still beating out B2’s secondunit at $50/bushel) instead of $65.
What happens to the “CMC” point(s)?
$50.00 ≤ P^ ≤ $50.01, Q^ = 4
B1 sells three units.
What happens to B1’s profits? Theyincrease from $10 to an amount between $54.97 and $55!!
S2
7
Q2 (PART F): A profitable way for B1 Q2 (PART F): A profitable way for B1 to make additional profits by deviatingto make additional profits by deviating
P ($/Bushel)
0
90
10
30
50
70
2 4 6 8
S
D^
B1 B1 B2
B1 B2
B2 B3
S1 S2
S2
S1 S1 S2 S2
Q (Bushels)
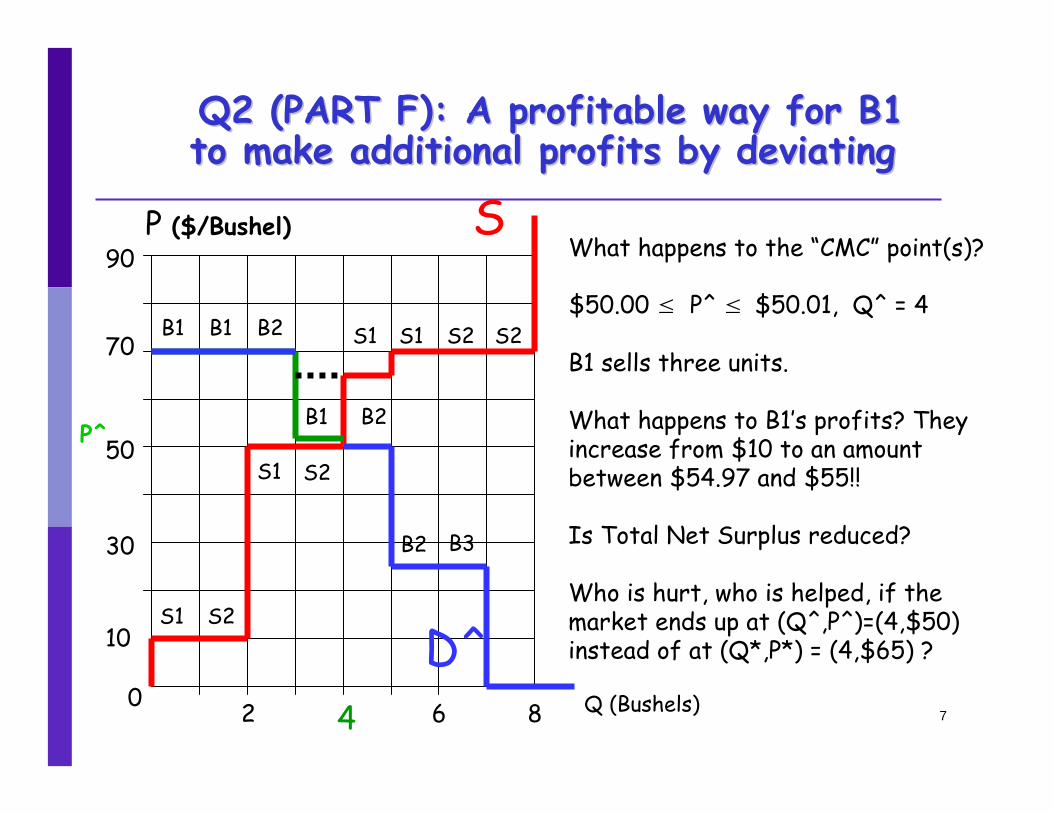
What happens to the “CMC” point(s)?
$50.00 ≤ P^ ≤ $50.01, Q^ = 4
B1 sells three units.
What happens to B1’s profits? Theyincrease from $10 to an amount between $54.97 and $55!!
Is Total Net Surplus reduced?
Who is hurt, who is helped, if themarket ends up at (Q^,P^)=(4,$50) instead of at (Q*,P*) = (4,$65) ?
P^S1
QUESTION 3: CREATIVE MODELING [35 Points Total (About 35 Minutes)]
GAS WAR!!
This question asks you to consider how the strategic pricing and location decisions of tworival gas stations might be modeled using game theory and agent-based modeling tools underalternative demand scenarios.
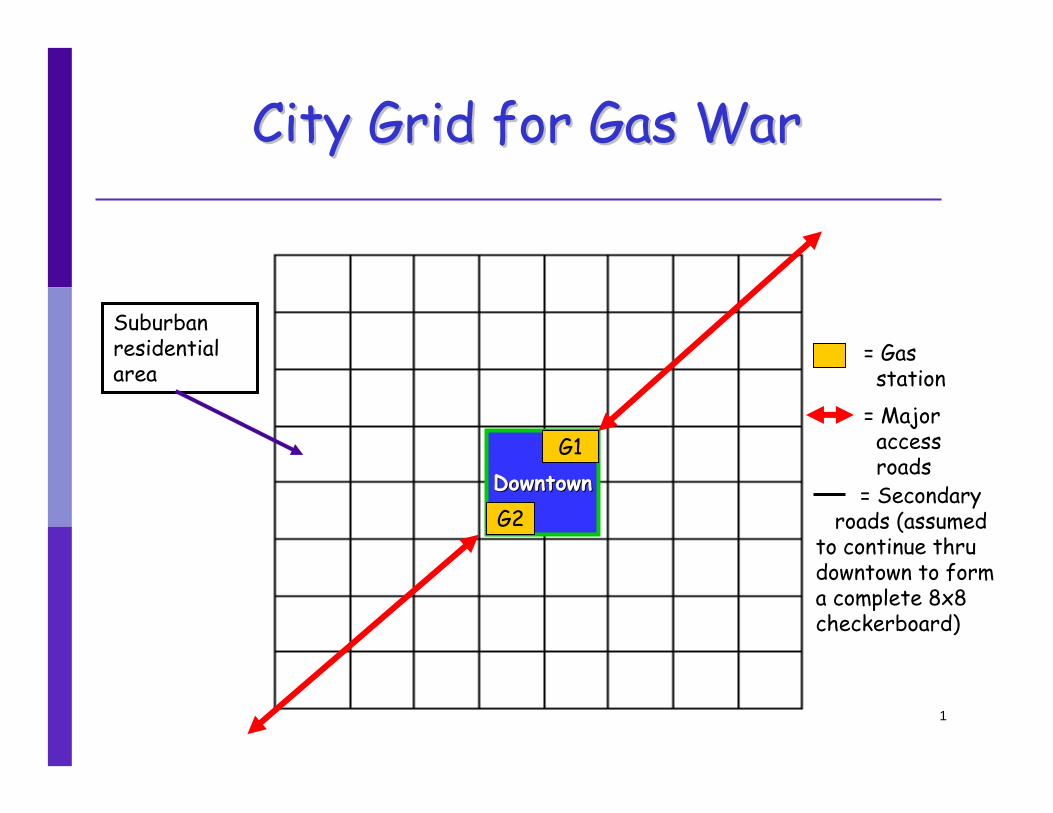
As depicted in the accompanying 8×8 checkerboard graphic, suppose two rival profit-seekinggas stations, G1 and G2, are located along the boundaries of an urban downtown area (inner
four squares) surrounded by a suburban residential area (surrounding 60 squares). Due torestrictive zoning laws, G1 and G2 are the ONLY gas stations permitted to locate withinthe indicated urban/suburban areas.
At the beginning of Day 1, G1 and G2 must post a gas price ($/gallon) in an attempt to
attract customers.
Suppose for simplicity that this price posted by G1 and G2 is restricted to two possiblevalues:
• H=High Price ($4.00/gallon) or
• L=Low Price ($3.00/gallon),
and that whatever prices G1 and G2 post on Day 1 must be maintained forever afterwards.
Suppose, also, that gasoline can be stored indefinitely, and that G1 and G2 have identical
variable production costs: namely, each gallon of gas they supply to a customer costs them$1.00.
Finally, assume the daily flow of traffic into the urban downtown area along EACH majoraccess road is 100 vehicles, with 10% in need of gas, and that each gas fill-up is for 10 gallons.
6
1
City Grid for Gas WarCity Grid for Gas War
DowntownDowntownG1
G2
= Gas station
= Majoraccessroads
= Secondaryroads (assumed
to continue thrudowntown to forma complete 8x8checkerboard)
Suburbanresidentialarea
Part A:[10 Points Total] Consider the following demand scenario:
Demand Scenario 1: The ONLY vehicle traffic flowing into and out ofthe urban downtown area is along the two major access roads, and ALL vehicle
owners in need of gas search for the LOWEST price of gas.
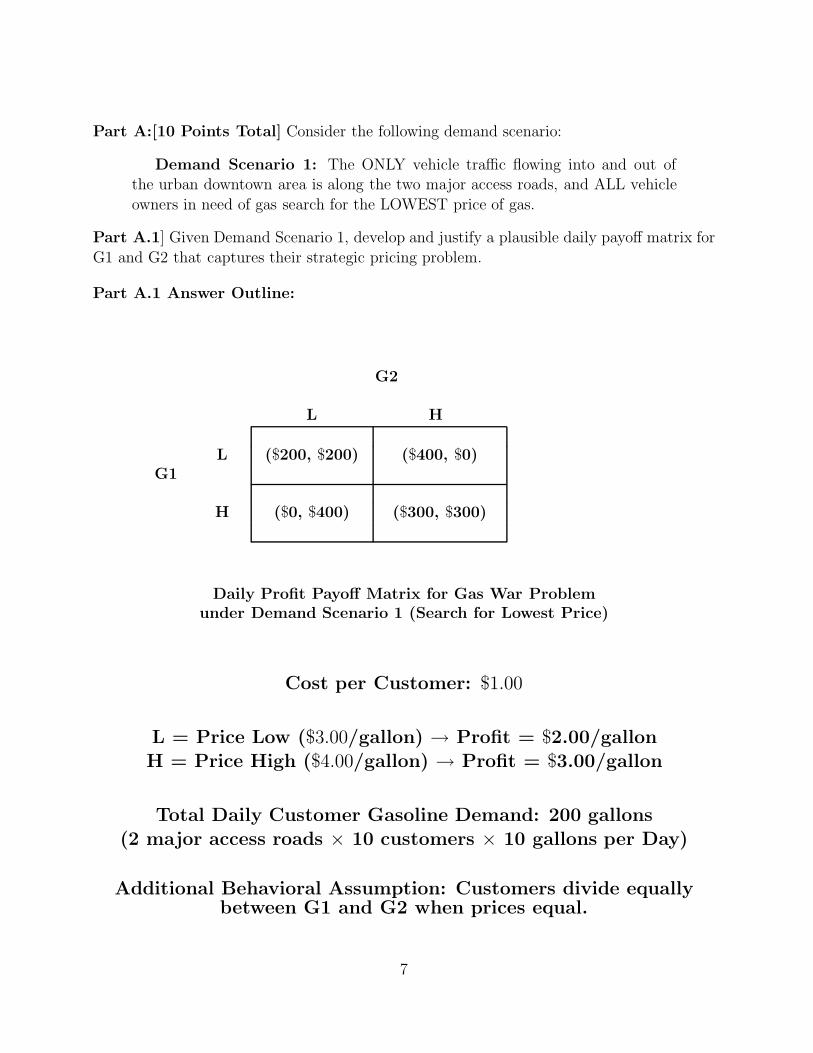
Part A.1] Given Demand Scenario 1, develop and justify a plausible daily payoff matrix for
G1 and G2 that captures their strategic pricing problem.
Part A.1 Answer Outline:
G2
L H
L ($200, $200) ($400, $0)G1
H ($0, $400) ($300, $300)
Daily Profit Payoff Matrix for Gas War Problemunder Demand Scenario 1 (Search for Lowest Price)
Cost per Customer: $1.00
L = Price Low ($3.00/gallon) → Profit = $2.00/gallon
H = Price High ($4.00/gallon) → Profit = $3.00/gallon
Total Daily Customer Gasoline Demand: 200 gallons
(2 major access roads × 10 customers × 10 gallons per Day)
Additional Behavioral Assumption: Customers divide equallybetween G1 and G2 when prices equal.
7
Part A.2: Carefully analyze and describe the strategic structure of the resulting game. In
particular, which price choices for G1 and G2 (if any) are Nash equilibria? Pareto efficient?Pareto dominated? Represent coordination failure? Also, does either G1 or G2 have adominant price choice?
Part A.2 Answer Outline:
• The price-choice pair (L,L) is the ONLY Nash equilibrium – that is, the only price-choice pair such that neither player has an incentive to change its price choice given
the price choice of the other player.
• The price-choice pairs (L,H), (H,L), and (H,H) are EACH Pareto efficient – that is,
starting from any one of these three pairs, there is no OTHER price-choice pair theplayers could move to that would result in all players being at least as well off andat least one player strictly better off. (Another way to phrase this is that these threeprice-choice pairs are not Pareto dominated.)
• The price-choice pair (L,L) is Pareto-dominated by (H,H) in the sense that (H,H) giveseach player at least as much payoff and at least one player strictly more. None of the
other three price-choice pairs is Pareto-dominated (i.e., each of these other pairs isPareto efficient).
• The price-choice pair (L,L) is a Pareto-dominated Nash equilibrium, hence by definitionit represents a situation of coordination failure for the two gas stations – not for thecustomers!
• The price choice L is a dominant price choice for each player, in the sense it gives thehighest payoff regardless of the other player’s price choice.
Remark: Recall that a Prisoner’s Dilemma Game is defined by four payoffs (CC=MutualCoop,CD=Sucker, DC=Temptation, and DD=Mutual Defection) satisfying the additional condi-tion CC > [CD + DC]/2. The above payoff matrix for Demand Scenario 1 has this Prisoner’s
Dilemma Configuration with L playing the role of “Defect,” H playing the role of “Cooper-ate,” and $200=DD, $300=CC, $400=CD, and $0=DC.
8
Part A.3 Carefully discuss the ECONOMIC implications of your findings.
Part A.3 Answer Outline:
In Parts A.1 and A.2 it is assumed that every gallon of gasoline is like every other, and that
gasoline customers are fully informed about the location of all gasoline stations, have nosearch costs (“transactions costs”), and are only concerned with finding the lowest price forgasoline.
In this case, the only way either G1 or G2 can attract any customers at all is if they both
offer the same price. This is an example of the famous (within economics!) dictate called the“law of one price.” Moreover, either gas station can profitably undercut the other (taking allthe customers) unless they both offer the same low price, L. Thus, absent collusion betweenG1 and G2, one would anticipate an outcome (L,L).
In the real-world, driving through cities, you see gas stations in any one locale typically
offering very similar prices. However, every once in a while a “price war” breaks out andyou see plunging prices.
On the other hand, it is also typical to see prices offered “on a declining gradient” dependingon how far away a gas station is located from major access roads. In this case the gas stations
are betting that customers coming off major access roads are more interested in getting gasquickly than at the cheapest possible price. The implications of this change in customersearch strategy are explored in Part B, below.
9
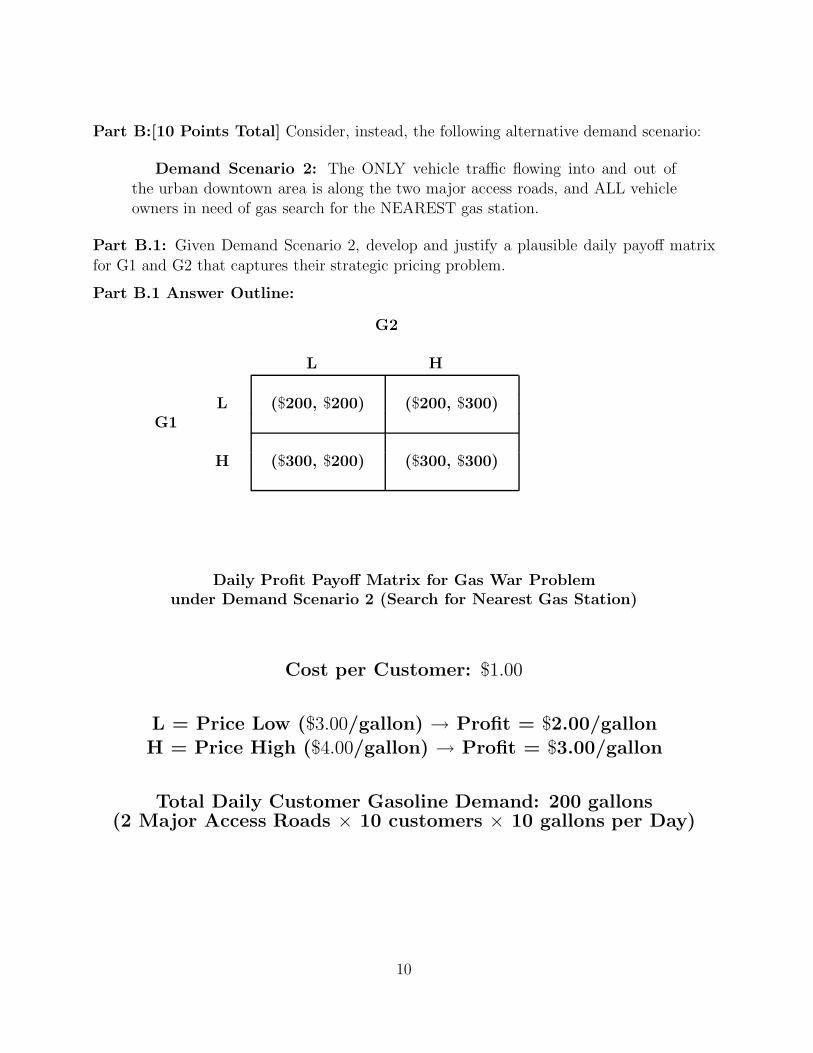
Part B:[10 Points Total] Consider, instead, the following alternative demand scenario:
Demand Scenario 2: The ONLY vehicle traffic flowing into and out ofthe urban downtown area is along the two major access roads, and ALL vehicleowners in need of gas search for the NEAREST gas station.
Part B.1: Given Demand Scenario 2, develop and justify a plausible daily payoff matrix
for G1 and G2 that captures their strategic pricing problem.
Part B.1 Answer Outline:
G2
L H
L ($200, $200) ($200, $300)G1
H ($300, $200) ($300, $300)
Daily Profit Payoff Matrix for Gas War Problemunder Demand Scenario 2 (Search for Nearest Gas Station)
Cost per Customer: $1.00
L = Price Low ($3.00/gallon) → Profit = $2.00/gallon
H = Price High ($4.00/gallon) → Profit = $3.00/gallon
Total Daily Customer Gasoline Demand: 200 gallons(2 Major Access Roads × 10 customers × 10 gallons per Day)
10
Part B.2 Carefully analyze the strategic structure of the resulting game. In particular, which
price choices for G1 and G2 (if any) are Nash equilibria? Pareto efficient? Pareto dom-inated? Represent coordination failure? Also, does either G1 or G2 have a dominantprice strategy?
Part B.2 Answer Outline:
• The price-choice pair (H,H) is the ONLY Nash equilibrium – that is, the only price-
choice pair such that neither player has an incentive to change its price choice giventhe price choice of the other player.
• The price-choice pair (H,H) is Pareto efficient – that is, starting at (H,H), there is noOTHER price-choice pair the players could move to that would make all players at
least as well off and at least one player strictly better off. (Another way to phrase thisis that (H,H) is not Pareto dominated.)
• Each of the price-choice pairs (L,L), (L,H), and (H,L) is Pareto-dominated by (H,H) inthe sense that (H,H) gives each player at least as much payoff and at least one player
strictly more.
• There is no Pareto-dominated Nash equilibrium, hence by definition there is no situa-tion that represents coordination failure for the two gas stations.
• Move H is a dominant price choice for each player, in the sense it gives the highestpayoff regardless of the other player’s price choice.
Part B.3 Carefully discuss the ECONOMIC implications of your findings.
Part B.3 Answer Outline:
In economics a “good” is a bundle of attributes that have positive value for potentialpurchasers. These attributes can include physical form, place of availability, time of avail-
ability, and possibly additional aspects (e.g., risk considerations). Goods are economicallydistinct if they differ in their attributes in a way that causes people to assign different valueto them.
Under Demand Scenario 2, even though the two gas stations are selling the same physicalproduct (gasoline), customers are also interested in a second attribute of the product — thelocation of its sale. Indeed, in Demand Scenario 2 this second attribute is the ONLY factordetermining demand for each product.
In effect, then, the two gas stations G1 and G2 are selling two different goods to twodifferent customer bases (the vehicle traffic entering downtown on the major access roadnearest to each station), and each gas station is effectively a “monopolist” for its own good.
In this case, as seen above, the most profitable pricing strategy for each gas station is simplyto charge the high price H. There is no price competition for customers.
11
Part C:[15 Points] Finally, consider instead the following alternative demand scenario:
Demand Scenario 3: Vehicle traffic flows into and out of the urban down-town area along the SECONDARY roads as well as along the two major access
roads. Vehicle owners in need of gas that enter downtown on SECONDARY roads(“the locals”) always search for a gas station with the LOWEST price, whereasvehicle owners in need of gas that enter downtown on a MAJOR ACCESS road
(“the tourists”) always search for a NEAREST gas station.
Given Demand Scenario 3, G1 wants to choose a profitable pricing strategy – indeed, G1
would even be willing to relocate his gas station elsewhere in the urban downtown area orin the suburban residential area if this would ensure a suitably large increase in his profits.
However, G1 is unsure regarding relative traffic flows on secondary versus major access roads,relative demands for gas among locals versus tourists, and the intended pricing/locationchoices of his rival gas station G2.
To help with his pricing and location decisions, G1 decides to hire a consultant (YOU). Heasks you to develop an “agent-based test bed” that he can use to explore the profitabilityof different possible combinations of pricing and location choices for his gas station under
different plausible scenarios regarding gas customer search strategies, relative traffic flows,relative demands for gas, AND the pricing/location choices of G2.
Using simple diagrams and verbal descriptions, outline a possible way that such an agent-based test bed might be developed for G1, keeping in mind the limited time you have todevote to Q3:Part C (15 minutes).
Part C Answer Outline:
Obviously many different types of answers could be submitted for Part C. For a fifteen-minute
question, only the outline of a possible approach can be expected.
These outlines will be evaluated on the basis of the following four characteristics: (1) extentto which the proposed approach is consistent with the objective of developing an “agent-basedtest bed” for the consulting assignment at hand; (2) originality of thought; (3) plausibility,
correctness, and interest of assertions; and (4) clarity of exposition.
However, it is of interest to consider what kinds of considerations would presumably haveto go into the development of such an agent-based test bed were this an actual real-worldconsultant project. Key development steps are indicated below.
Clearly, however, each development step would have to be guided and supported by appro-
priate empirical data in order to achieve a test bed with sufficient operational validity thatit can generate useful scenario-conditioned predictions.
12
Key Development Steps:
• Agent Hierarchy: Identify the types of agents who will populate the test bed andtheir logical relationships (inheritance, composition, association,..).
Given the stated purpose for which the agent-based test bed is desired,presumably these agents should include: vehicle drivers who will have de-mands for gas (differentiated into tourists from out of town and locals fromresidential areas); gas station managers in charge of pricing and location
policies; and the city landscape, e.g., roads (differentiated into major acessand secondary), gas stations, and residential housing.
The modeling of the city landscape might be accomplished by modeling
the city as a 2-dimensional grid of “cells.” However, much more is neededthan a traditional 2D-cellular automaton in which each “cell” has the samerule governing its actions.
For example, to capture a continuous roadway traversing the city, the
city cells would need to have correlated but still differentiated attributes,such as different sizes, spatial coordinates, physical type (road pavement vs.building vs. open land), and so forth.
• Flow Diagram: Identify the basic types of dynamic agent activities and interactions
to be modeled.
For example, different types of vehicle drivers will potentially have dif-
ferent types of driving patterns, different demands for gas both at a pointin time (across vehicle owners) and at different times of day, and differentsearch strategies for determining from whom to purchase gas. Gas stationswill presumably have different locations and different strategies for deter-
mining their gas prices.The interactions of these demand and supply forces could lead to traffic
congestion patterns that affect the amount of gas that can feasibly be pur-
chased in any given time period. These congestion patterns could in turnaffect the future activities (e.g., gas demands and supplies) of vehicle ownersand gas station managers.
13
• Implementation of Agent Methods:
Agents that represent city landscape features (e.g., city “cells”) are passive(non-cognitive) agents. Their attributes will presumbly be either fixed orchanging for external reasons (e.g., formation of pot-holes in proportion tointensity of use that slow down traffic flow, or a change from being an empty
location to a location with a gas station). And their methods would pre-sumably take only simple forms (e.g., a “get” method for a road location todetermine its intensity of use).
However, for the cognitive agents (vehicle owners and gas station managers),
at least some of their attributes are going to have to be “state variables” thatchange over time due to their own actions (e.g., money holdings, amountof gas in gas tank, etc.). Moreover, behavioral methods will be needed todetermine demands and supplies of gas under alternative conditions, perhaps
with some kind of learning capabilities permitting the agents to change whatactions they choose to take in any given situation based on past experiences.
What makes this consulting assignment seemingly require some kind of agent-based modeling approach is the complex interactions (feedbacks) that would
realistically be expected among the following three types of behaviors of thecognitive agents over time: the vehicle owners’ plans regarding the frequencyand pattern of their driving, which collectively results in potential conges-tive conditions and affects actual gas usage and gas demands; the particular
search methods that vehicle owners use in an attempt to find “suitable” gasstations when they need gas; the placement of the gas stations; and thepricing strategies of the gas stations.
Conjecture: In any real-world city, the micro-level determination of gas de-
mands and supplies is exceedingly complex. However, over time there will beemergent city-wide traffic pattern flows that exhibit at least some degree ofhomeostasis, i.e., persistence over time despite perturbations going on at themicro level (see Syllabus Section I.A, Batten Chapter 1, Glossary of Terms.)
14