Embed Size (px)
Citation preview
Answer to PTP_Final_Syllabus 2008_Dec2014_Set 1
Academics Department, The Institute of Cost Accountants of India (Statutory Body under an Act of Parliament) Page 1
Paper- 15 : MANAGEMENT ACCOUNTING – ENTERPRISE PERFORMANCE MANAGEMENT
Time Allowed: 3 Hours Full Marks: 100
The figures in the margin on the right side indicate full marks.
Attempt Question No. 1 (carrying 25 marks), which is compulsory and any five more questions
(each carrying 15 marks) from the rest.
Please: (i) Answer all part of a question at one place only.
(ii) Open a new page for answer to a new question.
Working Notes should form part of the answer.
Whenever necessary, suitable assumptions should be made and indicated in answer by the
candidates.
1. (a) In each of the cases given below, only one is the most appropriate option. Indicate the
correct answer (=1 mark) and show your workings/reasons briefly in support of your answer (=1
mark): [2×5=10]
(i) A company makes and sells a single product. The selling price and marginal revenue
equations are :
Selling Price = ` 100 – ` 0.001X
Marginal Revenue = ` 100 – ` 0.002X
Where X is the product the company makes. The variable costs amount to `20 per unit
and the fixed costs are `2,00,000.
In order to maximize the profit, the selling price should be:
A. ` 25
B. ` 30
C. ` 40
D. ` 60
Answer:
D. — ` 60.
Selling price = ` 100 – ` 0.001X
Marginal Revenue = ` 100 – ` 0.002X
Variable Cost per unit = Marginal Cost per unit = ` 20
Optimal output for maximum profit: 20 = 100 – 0.002X,
Hence, X = 80/0.002 = 40,000 units
SP = 100 – 0.001X = 100 – 0.001(40,000) = 100 – 40 = ` 60.
(ii) A particular job requires 1,600 kgs of material - X.
1,000 kgs. of the particular material is currently in stock.
The original price of the material - X was ` 600 but current resale value of the same has been
determined as ` 400. If the current replacement price of the material - X is ` 1.20 per kg., the
relevant cost of the material - X required for the job would be :
A. ` 1,920
B. ` 600
C. `1,120
Answer to PTP_Final_Syllabus 2008_Dec2014_Set 1
Academics Department, The Institute of Cost Accountants of India (Statutory Body under an Act of Parliament) Page 2
D. None of these.
Answer:
C. — ` 1,120.
1,000 kgs. of material in stock at resale value = ` 400
Balance 600 kgs. of material at current price of ` 1.20 = ` 720
Relevant Cost of the material = ` 1,120.
(iii) Vipul Ltd., is preparing its Sales Budget for the coming 3 months. The Sales Department has
given an estimate that Sales will be 2,40,000 units, if the monsoon is good and 1,60,000 units if
the monsoon is poor. The probability that the monsoon will be poor is 0.3. The expected Sales
Volume for next quarter would be:
A. 1,68,000 units
B. 1,60,000 units
C. 2,16,000 units
D. None of these.
Answer:
C. — 2,16,000.
[1,60,000 x 0.30] + [2,40,000 x 0.70]
= 48,000 + 1,68,000 = 2,16,000.
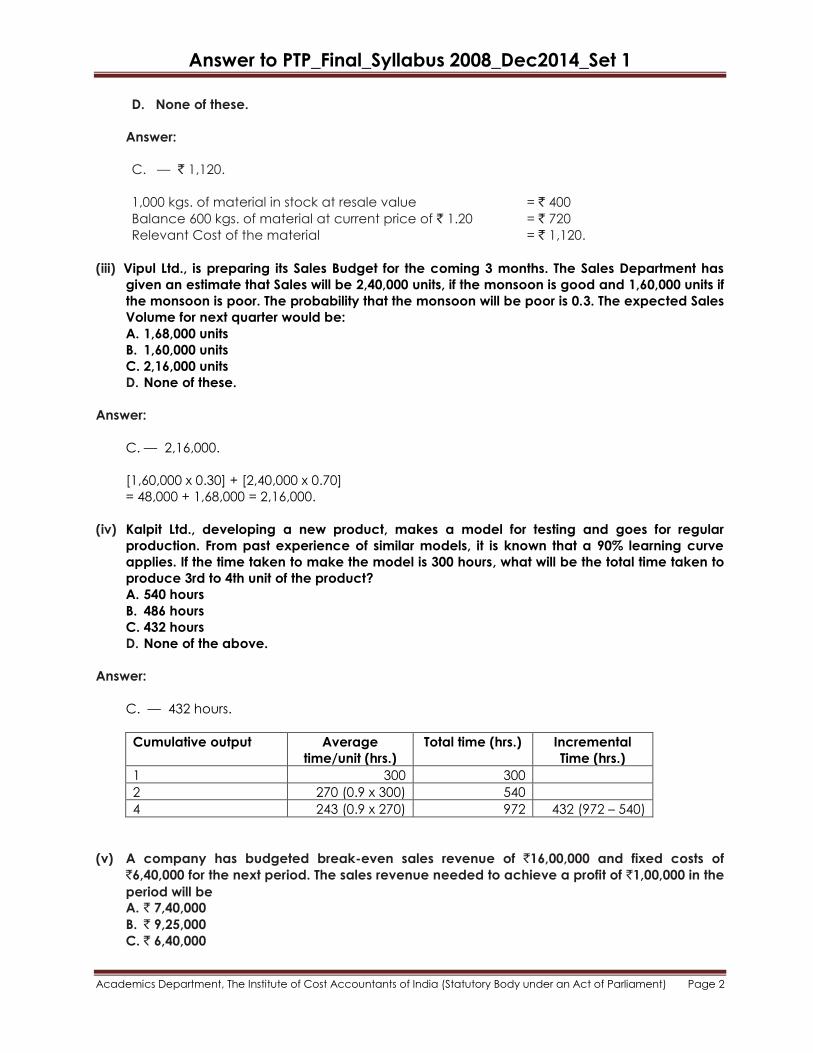
(iv) Kalpit Ltd., developing a new product, makes a model for testing and goes for regular
production. From past experience of similar models, it is known that a 90% learning curve
applies. If the time taken to make the model is 300 hours, what will be the total time taken to
produce 3rd to 4th unit of the product?
A. 540 hours
B. 486 hours
C. 432 hours
D. None of the above.
Answer:
C. — 432 hours.
Cumulative output Average
time/unit (hrs.)
Total time (hrs.) Incremental
Time (hrs.)
1 300 300
2 270 (0.9 x 300) 540
4 243 (0.9 x 270) 972 432 (972 – 540)
(v) A company has budgeted break-even sales revenue of `16,00,000 and fixed costs of
`6,40,000 for the next period. The sales revenue needed to achieve a profit of `1,00,000 in the
period will be
A. ` 7,40,000
B. ` 9,25,000
C. ` 6,40,000
Answer to PTP_Final_Syllabus 2008_Dec2014_Set 1
Academics Department, The Institute of Cost Accountants of India (Statutory Body under an Act of Parliament) Page 3
D. ` 18,50,000
Answer:
D .— `18,50,000.
P/V Ratio = Fixed cost/ BE Sales = 6,40,000/ 16,00,000 = 40%
Contribution required = FC + Profit = ` (6,40,000 + 1,00,000) = `7,40,000.
Sales = 7,40,000/ 40% = `18,50,000.
(b) Define the following terms in one/two sentences: [1×5=5]
(i) Vat analysis;
(ii) Detector;
(iii) Control Chart ;
(iv) Query tools;
(v) Generic Benchmarking.
Answer:
(i) Vat analysis: determines the general flow of parts and products from raw materials to
finished products. It conceptualises an organization in terms of the interaction of its
individual components parts, products and processes.
(ii) Detector: tracks the performance and can be visualised as a scanning system and it feeds
on information. In fact the Detector is another name for Management Information System.
(iii) Control Chart: is a quality control tool to maintain a process under statistical control.
(iv) Query tools: allow the users to find the information needed to perform any specific
function.
(v) Generic Benchmarking: is an application of functional benchmarking that compares a
particular business function at two or more organizations, selected without regard to their
industry.
(c) Expand the following abbreviations: [1×5=5]
(i) CPOF;
(ii) EMS;
(iii) CER;
(iv) FMECA;
(v) FAST.
Answer:
(i) CPOF: Capacity Planning using Overall Factors;
(ii) EMS: Environmental Management System;
(iii) CER: Cost Estimating Relationships;
(iv) FMECA: Failure Mode, Effects, Criticality Analysis;
(v) FAST: Functional Analysis System Techniques.
Answer to PTP_Final_Syllabus 2008_Dec2014_Set 1
Academics Department, The Institute of Cost Accountants of India (Statutory Body under an Act of Parliament) Page 4
(d) Fill in the blanks with the appropriate word out of the options indicated in the bracket against
each statement: [1×5=5]
(i) Instead of (accepting / not accepting) the current practice, Zero Base Budgeting creates a
challenging and questioning attitude.
(ii) Finite Capacity Scheduling (FCS) is an extension of [Capacity Requirement Planning (CRP)/
Manufacturing Resource Planning (MRP)].
(iii) Marginal Cost is a (constant/ variable) ratio which may be expressed in terms of an amount
per unit of output.
(iv) In a Transportation Problem, when the quantities are allocated to cost cells within the matrix
and if such allocations are less than the number of rows plus number of columns plus one,
such situation is known as (unbalanced/ degeneracy).
(v) A relative measure of (standard deviation/dispersion) is the coefficient of variation.
Answer:
(i) accepting;
(ii) Capacity Requirement Planning;
(iii) constant;
(iv) degeneracy;
(v) dispersion.
2. (a) What are the stages involved in the creation of a Balanced Score Card? [5]
Answer:
The stages involved in the creation of a balanced score card are enumerated below:
(i) To Identify a vision i.e., where an organization is going?
(ii) To Identify Organisation‘s strategies: i.e., how an Organization is planning to go there?
(iii) Define Critical success factors and perspectives: i.e., what we have to do well in each
Perspective? i.e. Customer perspective, Internal perspective, Innovation and Learning
perspective and Financial perspective.
(iv) Identify measures which will ensure that everything is going in the expected way.
(v) Evaluation of Balanced score card i.e., ensuring what we are measuring is right.
(vi) Create action plans and plan reporting of the Balanced score Card.
(vii) Follow up and manage i.e., which person should have reports and what reports should
look like?
(b) Yummy Food have observed from a market survey that they can sell a special type of packed
snack at a price of ` 50 per pack during festive season only.
However, for this purpose they will have to make a fresh investment of `3,00,000 in equipment.
The variable cost of production would be `25 p.u. The variable cost of production would come
down to `20 if the investment is made for `6,00,000.The likely sales to be achieved are as
under:
Volume Probability
10,000 0.30
Answer to PTP_Final_Syllabus 2008_Dec2014_Set 1
Academics Department, The Institute of Cost Accountants of India (Statutory Body under an Act of Parliament) Page 5
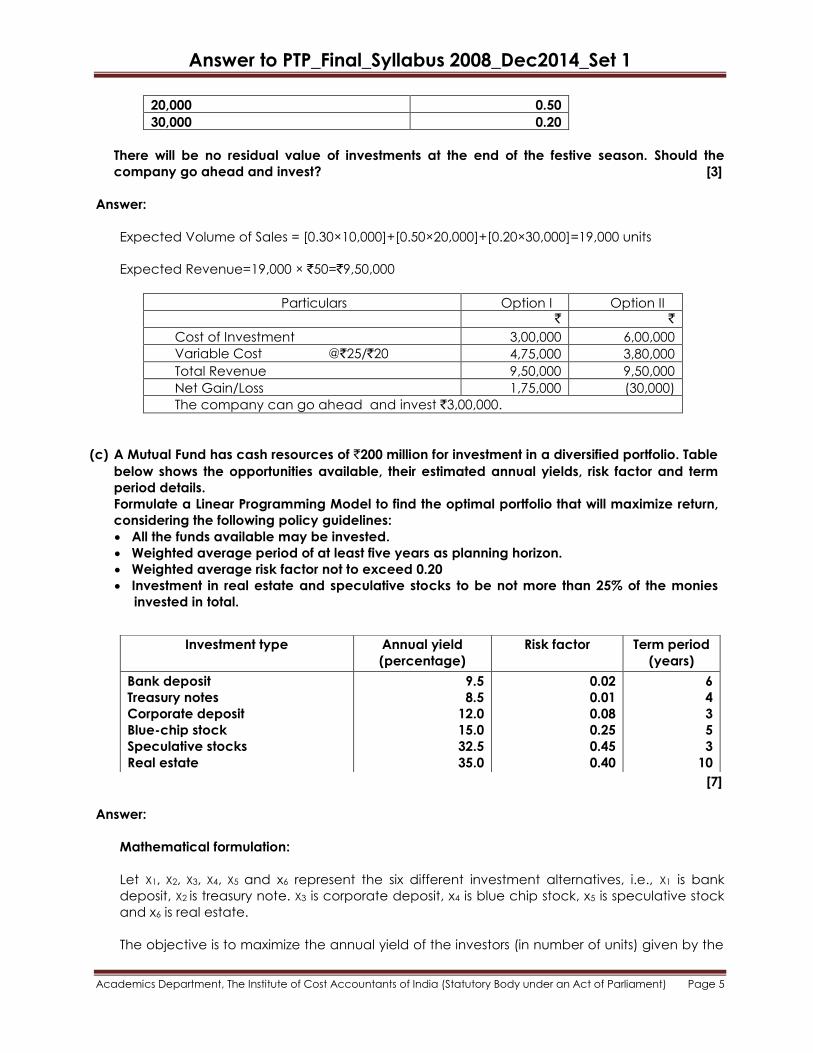
20,000 0.50
30,000 0.20
There will be no residual value of investments at the end of the festive season. Should the
company go ahead and invest? [3]
Answer:
Expected Volume of Sales = [0.30×10,000]+[0.50×20,000]+[0.20×30,000]=19,000 units
Expected Revenue=19,000 × `50=`9,50,000
Particulars Option I Option II
` `
Cost of Investment 3,00,000 6,00,000
Variable Cost @`25/`20 4,75,000 3,80,000
Total Revenue 9,50,000 9,50,000
Net Gain/Loss 1,75,000 (30,000)
The company can go ahead and invest `3,00,000.
(c) A Mutual Fund has cash resources of `200 million for investment in a diversified portfolio. Table
below shows the opportunities available, their estimated annual yields, risk factor and term
period details.
Formulate a Linear Programming Model to find the optimal portfolio that will maximize return,
considering the following policy guidelines:
All the funds available may be invested.
Weighted average period of at least five years as planning horizon.
Weighted average risk factor not to exceed 0.20
Investment in real estate and speculative stocks to be not more than 25% of the monies
invested in total.
[7]
Answer:
Mathematical formulation:
Let X1, X2, X3, X4, X5 and x6 represent the six different investment alternatives, i.e., X1 is bank
deposit, X2 is treasury note. X3 is corporate deposit, x4 is blue chip stock, x5 is speculative stock
and x6 is real estate.
The objective is to maximize the annual yield of the investors (in number of units) given by the
Investment type Annual yield
(percentage)
Risk factor Term period
(years)
Bank deposit
Treasury notes
Corporate deposit
Blue-chip stock
Speculative stocks
Real estate
9.5
8.5
12.0
15.0
32.5
35.0
0.02
0.01
0.08
0.25
0.45
0.40
6
4
3
5
3
10
Answer to PTP_Final_Syllabus 2008_Dec2014_Set 1
Academics Department, The Institute of Cost Accountants of India (Statutory Body under an Act of Parliament) Page 6
Linear expression.
Maximise Z = 9.5x1+8.5x2+12.0x3+15.0x4+32.5x5+35.0x6 subject to the constraints:
x1 + x2 + x3 + x4 + x5 + x6 ≤ 1 (Investment decision)
0.02x1 + 0.01x2 + 0.08x3 + 0.25x4 + 0.45x5 + 0.40x6 ≤ 0.20(weighted average risk of the portfolio)
6x1 + 4x2 + 3x3 + 5x4 + 3x5 +10x6 ≥ 5(weighted average length of investment)
x5+x6 ≤ 0.25 (limit on investment in real estate and speculative stock)
x1, x2, x3, x4, x5, x6 ≥ 0 [non-negativity condition].
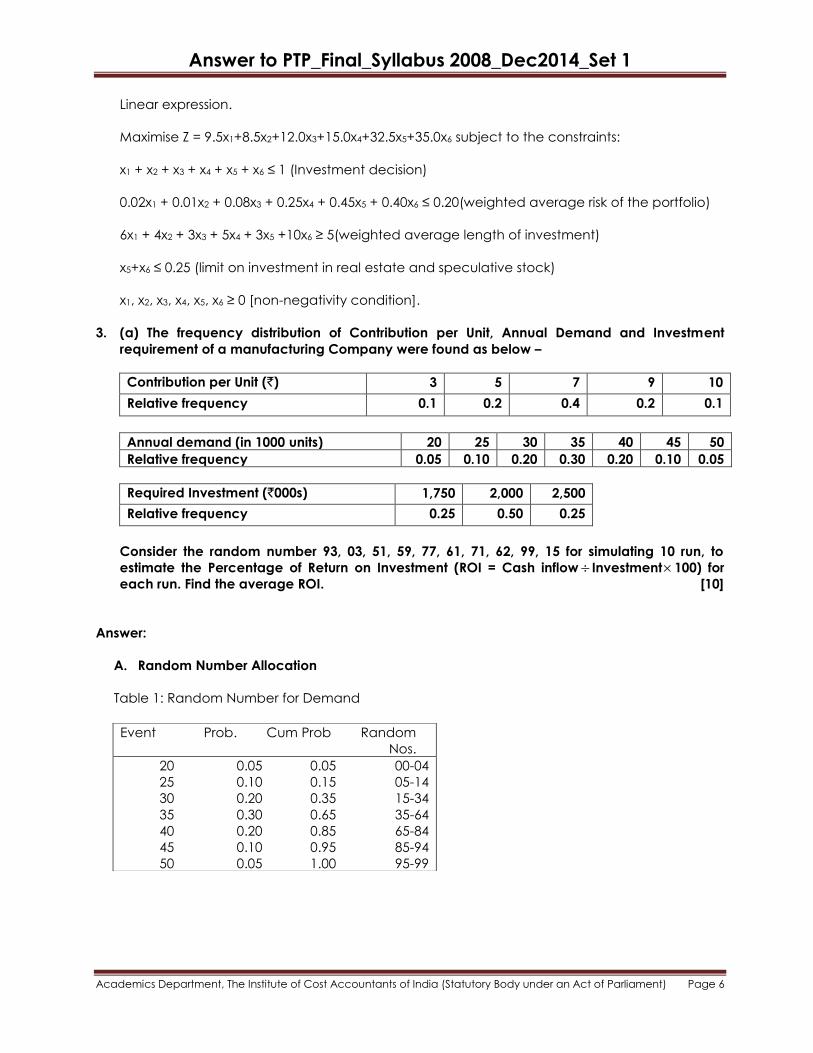
3. (a) The frequency distribution of Contribution per Unit, Annual Demand and Investment
requirement of a manufacturing Company were found as below –
Contribution per Unit (`) 3 5 7 9 10
Relative frequency 0.1 0.2 0.4 0.2 0.1
Annual demand (in 1000 units) 20 25 30 35 40 45 50
Relative frequency 0.05 0.10 0.20 0.30 0.20 0.10 0.05
Required Investment (`000s) 1,750 2,000 2,500
Relative frequency 0.25 0.50 0.25
Consider the random number 93, 03, 51, 59, 77, 61, 71, 62, 99, 15 for simulating 10 run, to
estimate the Percentage of Return on Investment (ROI = Cash inflow Investment100) for
each run. Find the average ROI. [10]
Answer:
A. Random Number Allocation
Table 1: Random Number for Demand
Event Prob. Cum Prob Random
Nos.
20 0.05 0.05 00-04
25 0.10 0.15 05-14
30 0.20 0.35 15-34
35 0.30 0.65 35-64
40 0.20 0.85 65-84
45 0.10 0.95 85-94
50 0.05 1.00 95-99
Answer to PTP_Final_Syllabus 2008_Dec2014_Set 1
Academics Department, The Institute of Cost Accountants of India (Statutory Body under an Act of Parliament) Page 7
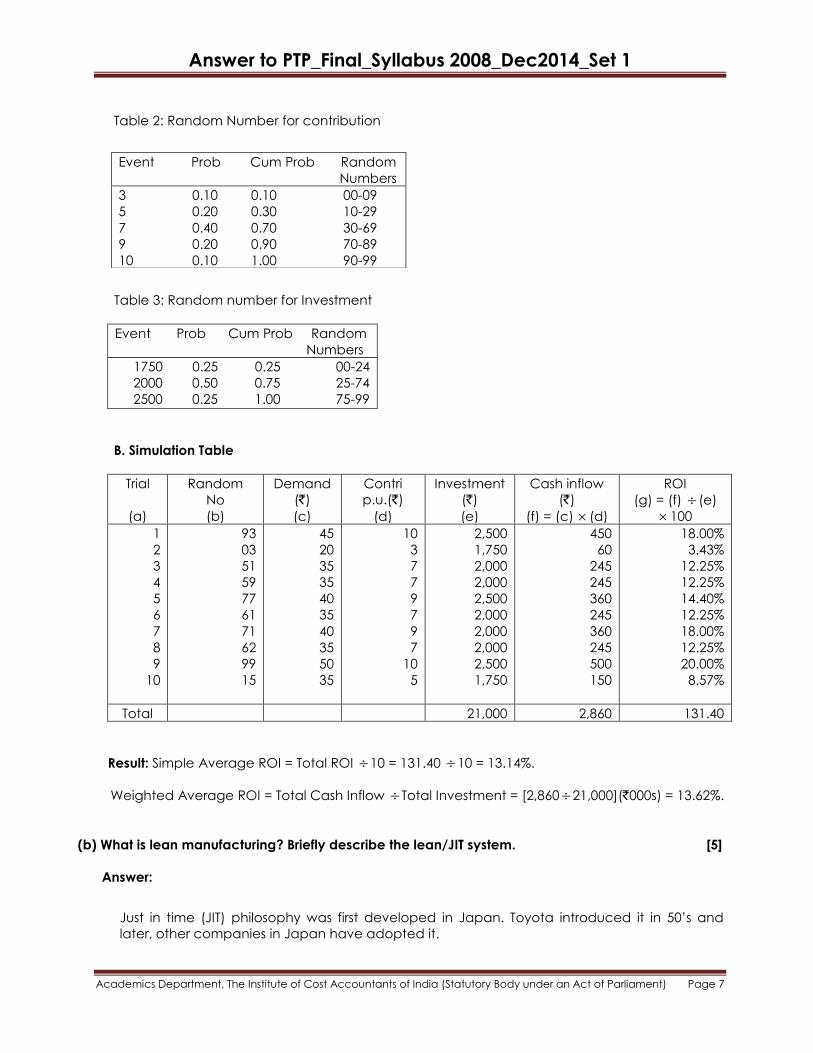
Table 2: Random Number for contribution
Table 3: Random number for Investment
Event Prob Cum Prob Random
Numbers
1750 0.25 0.25 00-24
2000 0.50 0.75 25-74
2500 0.25 1.00 75-99
B. Simulation Table
Trial
(a)
Random
No
(b)
Demand
(`)
(c)
Contri
p.u.(`)
(d)
Investment
(`)
(e)
Cash inflow
(`)
(f) = (c) (d)
ROI
(g) = (f) (e)
100
1
2
3
4
5
6
7
8
9
10
93
03
51
59
77
61
71
62
99
15
45
20
35
35
40
35
40
35
50
35
10
3
7
7
9
7
9
7
10
5
2,500
1,750
2,000
2,000
2,500
2,000
2,000
2,000
2,500
1,750
450
60
245
245
360
245
360
245
500
150
18.00%
3.43%
12.25%
12.25%
14.40%
12.25%
18.00%
12.25%
20.00%
8.57%
Total 21,000 2,860 131.40
Result: Simple Average ROI = Total ROI 10 = 131.40 10 = 13.14%.
Weighted Average ROI = Total Cash Inflow Total Investment = [2,86021,000](`000s) = 13.62%.
(b) What is lean manufacturing? Briefly describe the lean/JIT system. [5]
Answer:
Just in time (JIT) philosophy was first developed in Japan. Toyota introduced it in 50‘s and
later, other companies in Japan have adopted it.
Event Prob Cum Prob Random
Numbers
3 0.10 0.10 00-09
5 0.20 0.30 10-29
7 0.40 0.70 30-69
9 0.20 0.90 70-89
10 0.10 1.00 90-99
Answer to PTP_Final_Syllabus 2008_Dec2014_Set 1
Academics Department, The Institute of Cost Accountants of India (Statutory Body under an Act of Parliament) Page 8
The overriding feature of JIT is that materials or parts are generated in the exact quantity
required and just at the time they are needed. A classic JIT system consists of a series of
manufacturing units each delivering to one another in successive stages of production. The
amount delivered by each unit to the next unit is exactly what the needs for the next
production period (usually one day). There are no safety margins in the form of buffer stock,
live storage or work-in-progress. JIT is a sophisticated approach in eliminating wastage in the
process of manufacturing in different stages, say, from the production design stage to the
stage of delivery of finished product. JIT is sometimes regarded as an inventory control
technique or a purchasing method. It aims at eliminating all activities which do not add
‗value‘ to the product.
JIT seeks to achieve the following goals :
• Elimination of non value added activities
• Zero inventory
• Zero defects
• Batch size of one
• Zero Breakdown
• A 100% on time delivery service
Schonberger defines JIT as being ‗to produce and deliver finished goods just in time to be
sold, sub assemblies just in time to be assembled into finished goods, fabricated parts just in
time to go into sub assemblies and purchased materials just in time to be transformed into
fabricated parts‘.
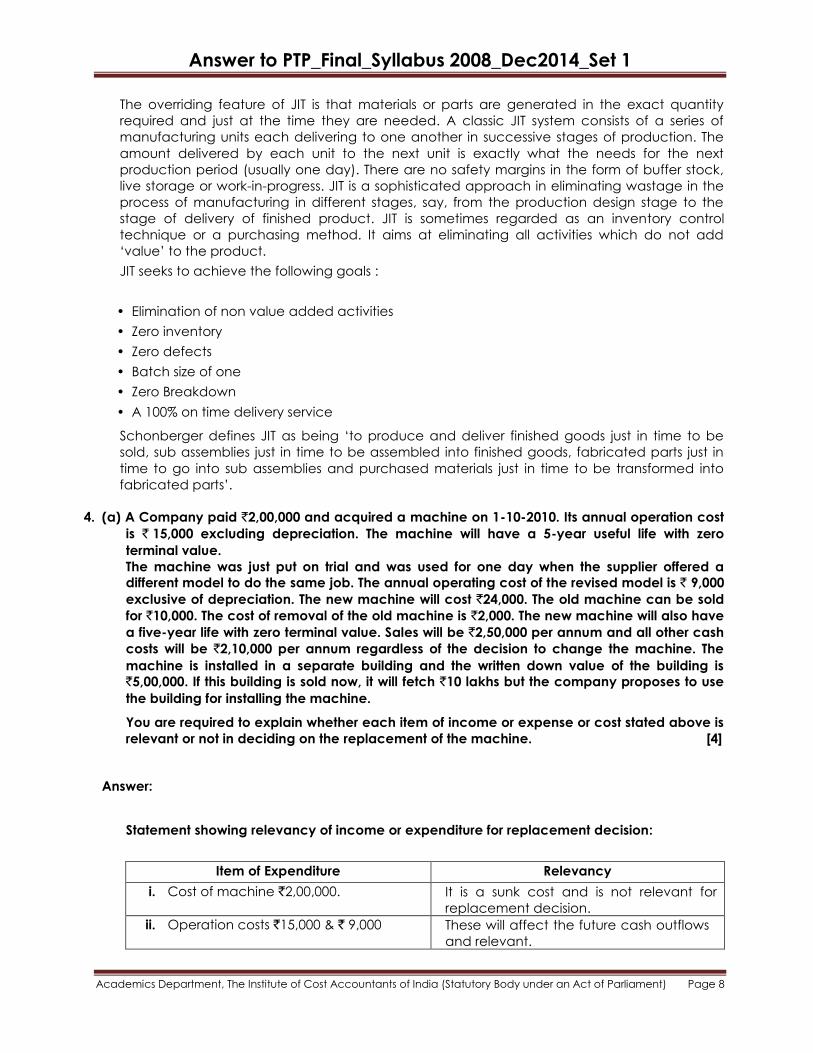
4. (a) A Company paid `2,00,000 and acquired a machine on 1-10-2010. Its annual operation cost
is ` 15,000 excluding depreciation. The machine will have a 5-year useful life with zero
terminal value.
The machine was just put on trial and was used for one day when the supplier offered a
different model to do the same job. The annual operating cost of the revised model is ` 9,000
exclusive of depreciation. The new machine will cost `24,000. The old machine can be sold
for `10,000. The cost of removal of the old machine is `2,000. The new machine will also have
a five-year life with zero terminal value. Sales will be `2,50,000 per annum and all other cash
costs will be `2,10,000 per annum regardless of the decision to change the machine. The
machine is installed in a separate building and the written down value of the building is
`5,00,000. If this building is sold now, it will fetch `10 lakhs but the company proposes to use
the building for installing the machine.
You are required to explain whether each item of income or expense or cost stated above is
relevant or not in deciding on the replacement of the machine. [4]
Answer:
Statement showing relevancy of income or expenditure for replacement decision:
Item of Expenditure Relevancy
i. Cost of machine `2,00,000. It is a sunk cost and is not relevant for
replacement decision.
ii. Operation costs `15,000 & ` 9,000 These will affect the future cash outflows
and relevant.
Answer to PTP_Final_Syllabus 2008_Dec2014_Set 1
Academics Department, The Institute of Cost Accountants of India (Statutory Body under an Act of Parliament) Page 9
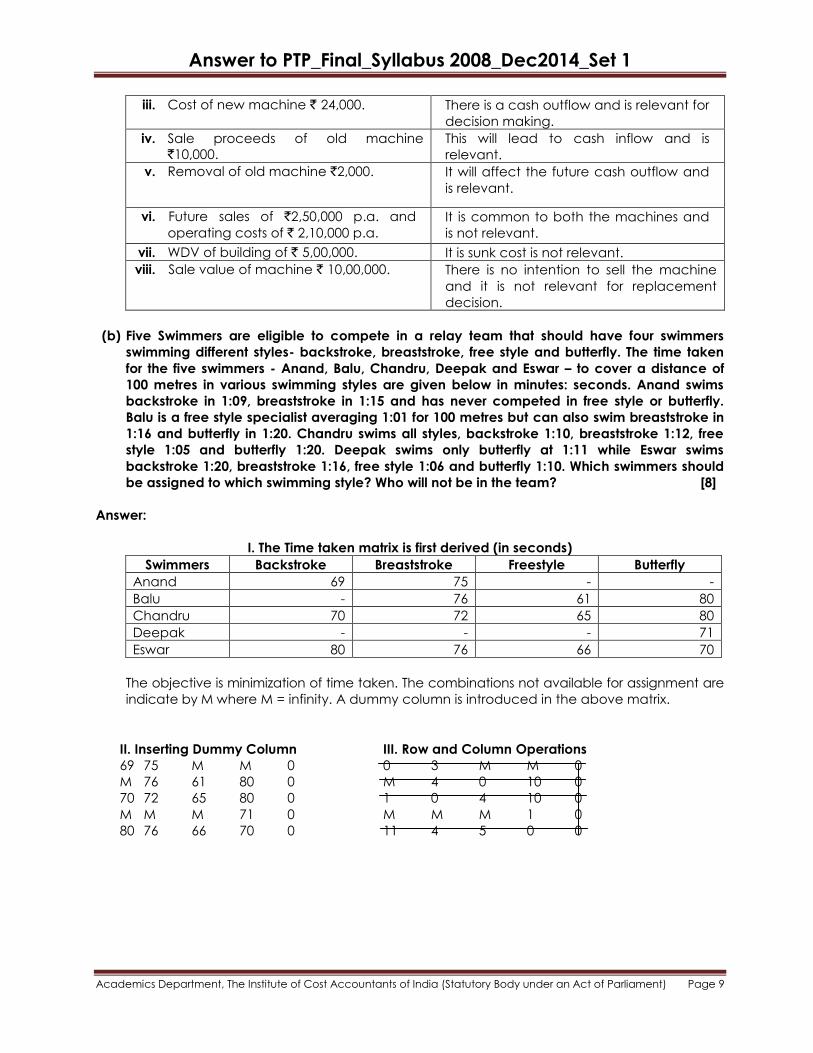
iii. Cost of new machine ` 24,000. There is a cash outflow and is relevant for
decision making.
iv. Sale proceeds of old machine
`10,000.
This will lead to cash inflow and is
relevant.
v. Removal of old machine `2,000. It will affect the future cash outflow and
is relevant.
vi. Future sales of `2,50,000 p.a. and
operating costs of ` 2,10,000 p.a.
It is common to both the machines and
is not relevant.
vii. WDV of building of ` 5,00,000. It is sunk cost is not relevant.
viii. Sale value of machine ` 10,00,000. There is no intention to sell the machine
and it is not relevant for replacement
decision.
(b) Five Swimmers are eligible to compete in a relay team that should have four swimmers
swimming different styles- backstroke, breaststroke, free style and butterfly. The time taken
for the five swimmers - Anand, Balu, Chandru, Deepak and Eswar – to cover a distance of
100 metres in various swimming styles are given below in minutes: seconds. Anand swims
backstroke in 1:09, breaststroke in 1:15 and has never competed in free style or butterfly.
Balu is a free style specialist averaging 1:01 for 100 metres but can also swim breaststroke in
1:16 and butterfly in 1:20. Chandru swims all styles, backstroke 1:10, breaststroke 1:12, free
style 1:05 and butterfly 1:20. Deepak swims only butterfly at 1:11 while Eswar swims
backstroke 1:20, breaststroke 1:16, free style 1:06 and butterfly 1:10. Which swimmers should
be assigned to which swimming style? Who will not be in the team? [8]
Answer:
I. The Time taken matrix is first derived (in seconds)
Swimmers Backstroke Breaststroke Freestyle Butterfly
Anand 69 75 - -
Balu - 76 61 80
Chandru 70 72 65 80
Deepak - - - 71
Eswar 80 76 66 70
The objective is minimization of time taken. The combinations not available for assignment are
indicate by M where M = infinity. A dummy column is introduced in the above matrix.
II. Inserting Dummy Column III. Row and Column Operations
69 75 M M 0 0 3 M M 0
M 76 61 80 0 M 4 0 10 0
70 72 65 80 0 1 0 4 10 0
M M M 71 0 M M M 1 0
80 76 66 70 0 11 4 5 0 0
Answer to PTP_Final_Syllabus 2008_Dec2014_Set 1
Academics Department, The Institute of Cost Accountants of India (Statutory Body under an Act of Parliament) Page 10
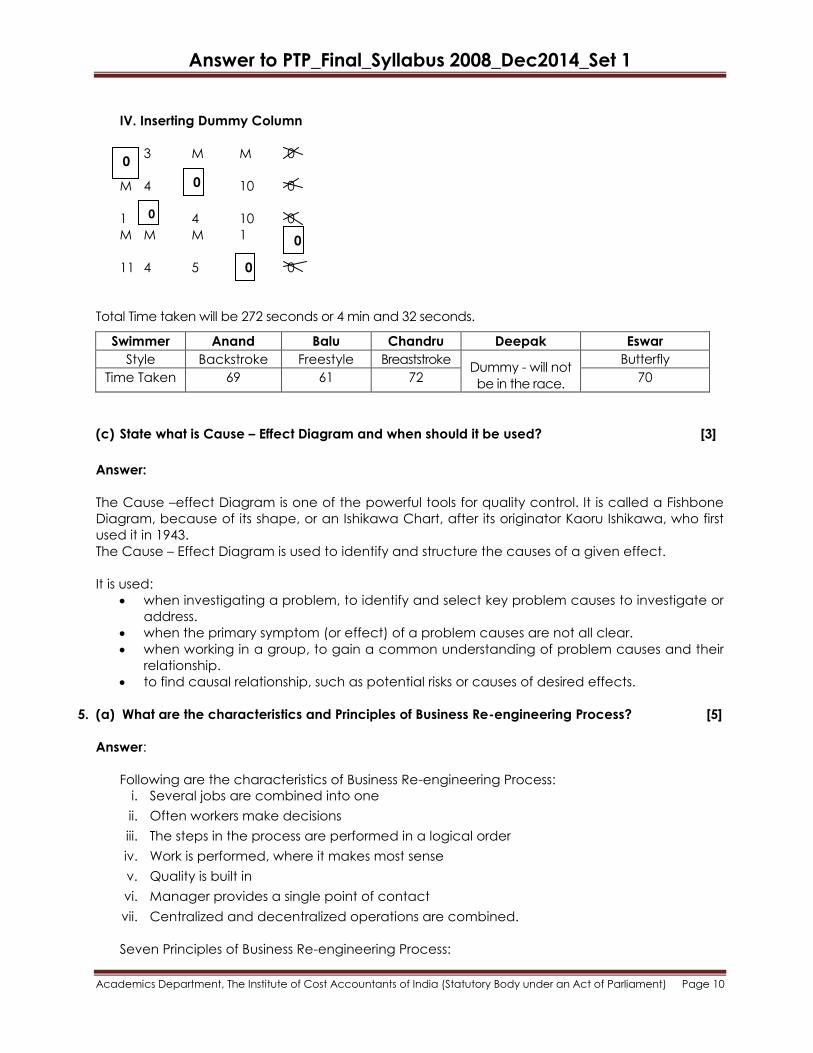
IV. Inserting Dummy Column
3 M M 0
M 4 10 0
1 4 10 0
M M M 1
11 4 5 0
Total Time taken will be 272 seconds or 4 min and 32 seconds.
Swimmer Anand Balu Chandru Deepak Eswar
Style Backstroke Freestyle Breaststroke Dummy - will not
be in the race.
Butterfly
Time Taken 69 61 72 70
(c) State what is Cause – Effect Diagram and when should it be used? [3]
Answer:
The Cause –effect Diagram is one of the powerful tools for quality control. It is called a Fishbone
Diagram, because of its shape, or an Ishikawa Chart, after its originator Kaoru Ishikawa, who first
used it in 1943.
The Cause – Effect Diagram is used to identify and structure the causes of a given effect.
It is used:
when investigating a problem, to identify and select key problem causes to investigate or
address.
when the primary symptom (or effect) of a problem causes are not all clear.
when working in a group, to gain a common understanding of problem causes and their
relationship.
to find causal relationship, such as potential risks or causes of desired effects.
5. (a) What are the characteristics and Principles of Business Re-engineering Process? [5]
Answer:
Following are the characteristics of Business Re-engineering Process:
i. Several jobs are combined into one
ii. Often workers make decisions
iii. The steps in the process are performed in a logical order
iv. Work is performed, where it makes most sense
v. Quality is built in
vi. Manager provides a single point of contact
vii. Centralized and decentralized operations are combined.
Seven Principles of Business Re-engineering Process:
0
0
0
0
0
Answer to PTP_Final_Syllabus 2008_Dec2014_Set 1
Academics Department, The Institute of Cost Accountants of India (Statutory Body under an Act of Parliament) Page 11
i. Processes should be designed to achieve a desired outcome rather than focusing on
existing tasks.
ii. Personnel who use the output from a process should perform the process
iii. Information processing should be included in the work, which produces the information
iv. Geographically dispersed resources should be treated, as if they are centralized
v. Parallel activities should be linked rather than integrated.
vi. Doers should be allowed to be self-managing
vii. Information should be captured once at source.
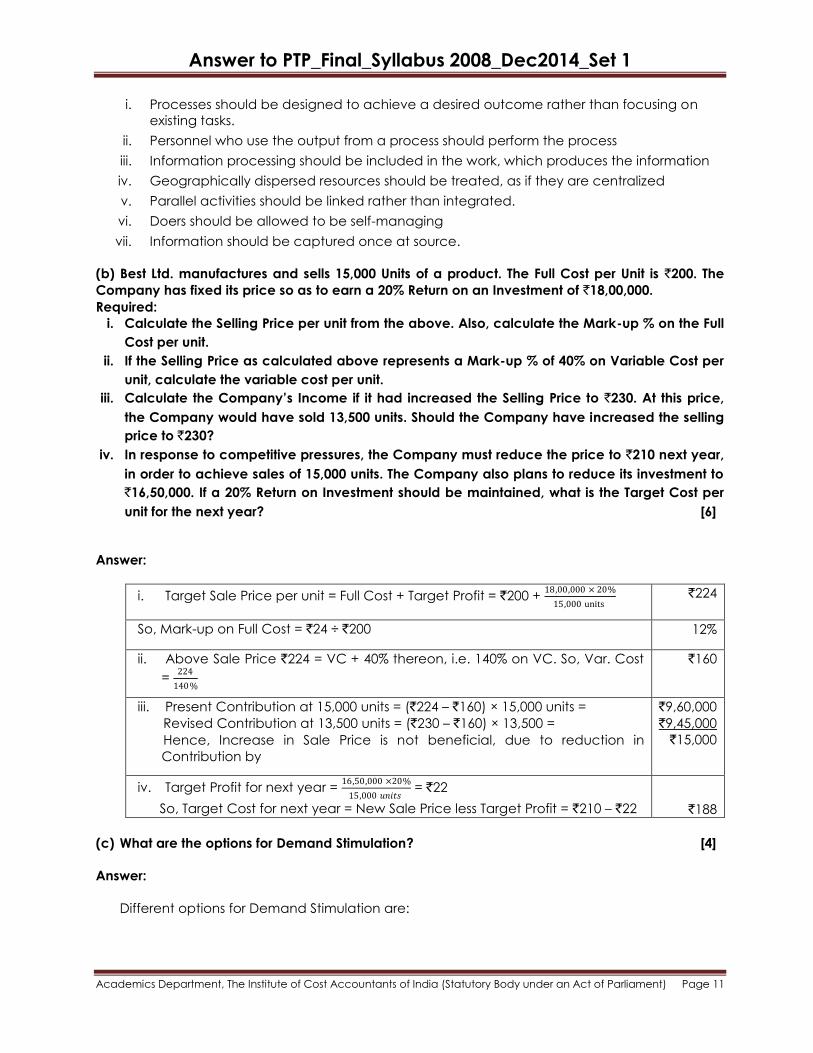
(b) Best Ltd. manufactures and sells 15,000 Units of a product. The Full Cost per Unit is `200. The
Company has fixed its price so as to earn a 20% Return on an Investment of `18,00,000.
Required:
i. Calculate the Selling Price per unit from the above. Also, calculate the Mark-up % on the Full
Cost per unit.
ii. If the Selling Price as calculated above represents a Mark-up % of 40% on Variable Cost per
unit, calculate the variable cost per unit.
iii. Calculate the Company’s Income if it had increased the Selling Price to `230. At this price,
the Company would have sold 13,500 units. Should the Company have increased the selling
price to `230?
iv. In response to competitive pressures, the Company must reduce the price to `210 next year,
in order to achieve sales of 15,000 units. The Company also plans to reduce its investment to
`16,50,000. If a 20% Return on Investment should be maintained, what is the Target Cost per
unit for the next year? [6]
Answer:
i. Target Sale Price per unit = Full Cost + Target Profit = `200 + 18,00,000 × 20%
15,000 units `224
So, Mark-up on Full Cost = `24 ÷ `200 12%
ii. Above Sale Price `224 = VC + 40% thereon, i.e. 140% on VC. So, Var. Cost
= 224
140%
`160
iii. Present Contribution at 15,000 units = (`224 – `160) × 15,000 units =
Revised Contribution at 13,500 units = (`230 – `160) × 13,500 =
Hence, Increase in Sale Price is not beneficial, due to reduction in
Contribution by
`9,60,000
`9,45,000
`15,000
iv. Target Profit for next year = 16,50,000 ×20%
15,000 𝑢𝑛𝑖𝑡𝑠 = `22
So, Target Cost for next year = New Sale Price less Target Profit = `210 – `22 `188
(c) What are the options for Demand Stimulation? [4]
Answer:
Different options for Demand Stimulation are:
Answer to PTP_Final_Syllabus 2008_Dec2014_Set 1
Academics Department, The Institute of Cost Accountants of India (Statutory Body under an Act of Parliament) Page 12
Pricing: Varying (lowering) pricing to increase demand in periods when demand is less than
peak e.g., off-season rates for hotels.
Promotion: Advertising, direct marketing, bulk purchase discounts, bonus, free offers are used
to shift demand.
Back ordering: By postponing delivery on current orders, demand is shifted to period when
capacity is not fully utilized.
New demand creation: A new, but complementary demand is created for a product or
service when restaurant customers have to wait, they are frequently diverted into a
complementary service the bar.
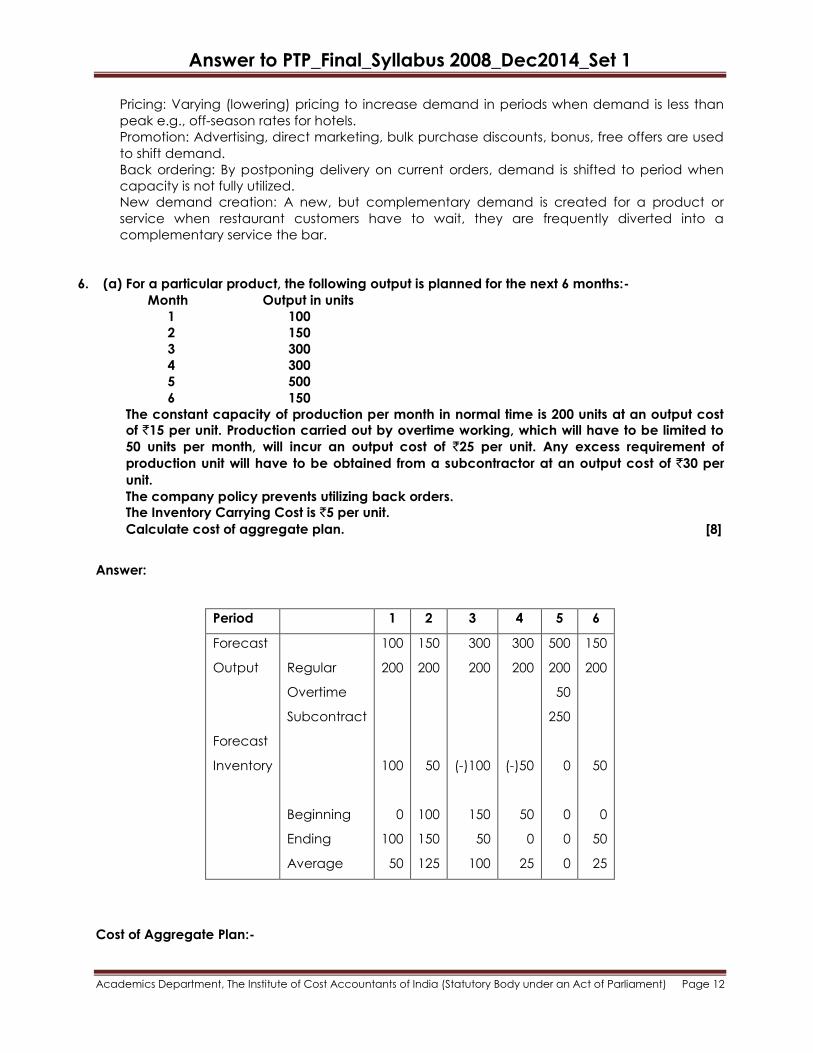
6. (a) For a particular product, the following output is planned for the next 6 months:-
Month Output in units
1 100
2 150
3 300
4 300
5 500
6 150
The constant capacity of production per month in normal time is 200 units at an output cost
of `15 per unit. Production carried out by overtime working, which will have to be limited to
50 units per month, will incur an output cost of `25 per unit. Any excess requirement of
production unit will have to be obtained from a subcontractor at an output cost of `30 per
unit.
The company policy prevents utilizing back orders.
The Inventory Carrying Cost is `5 per unit.
Calculate cost of aggregate plan. [8]
Answer:
Period 1 2 3 4 5 6
Forecast
Output
Forecast
Inventory
Regular
Overtime
Subcontract
Beginning
Ending
Average
100
200
100
0
100
50
150
200
50
100
150
125
300
200
(-)100
150
50
100
300
200
(-)50
50
0
25
500
200
50
250
0
0
0
0
150
200
50
0
50
25
Cost of Aggregate Plan:-
Answer to PTP_Final_Syllabus 2008_Dec2014_Set 1
Academics Department, The Institute of Cost Accountants of India (Statutory Body under an Act of Parliament) Page 13
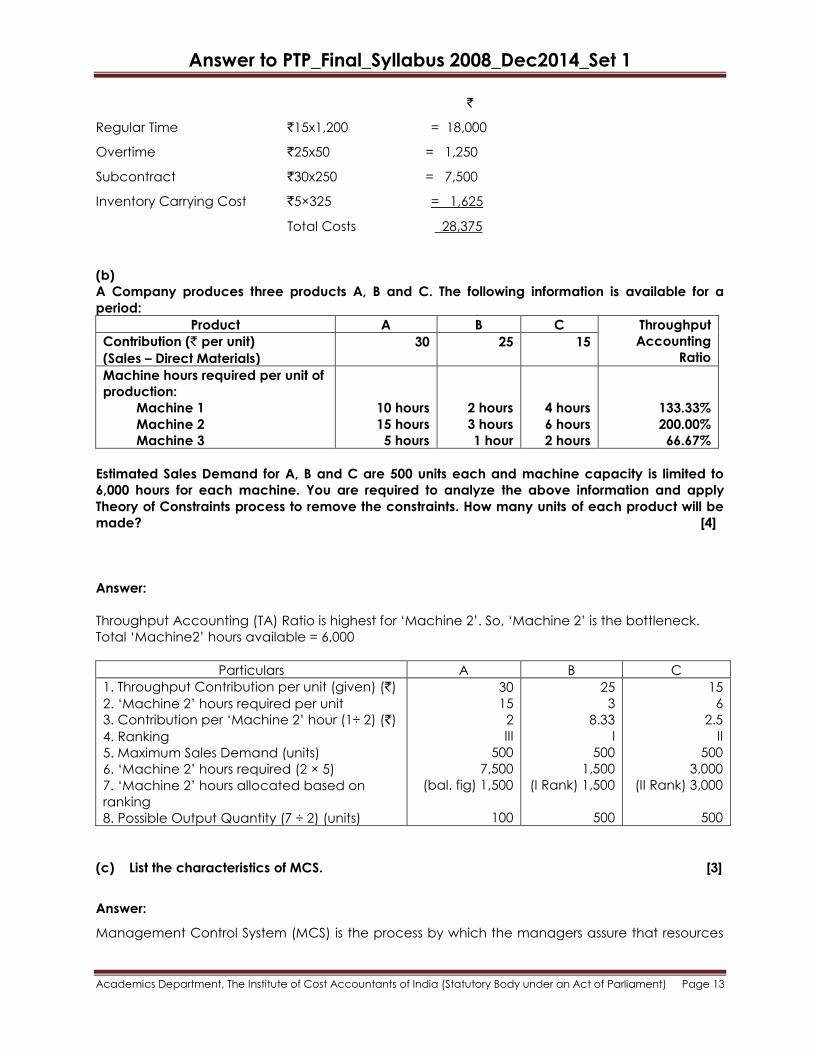
`
Regular Time `15x1,200 = 18,000
Overtime `25x50 = 1,250
Subcontract `30x250 = 7,500
Inventory Carrying Cost `5×325 = 1,625
Total Costs 28,375
(b)
A Company produces three products A, B and C. The following information is available for a
period: Product A B C Throughput
Accounting
Ratio
Contribution (` per unit)
(Sales – Direct Materials)
30 25 15
Machine hours required per unit of
production:
Machine 1
Machine 2
Machine 3
10 hours
15 hours
5 hours
2 hours
3 hours
1 hour
4 hours
6 hours
2 hours
133.33%
200.00%
66.67%
Estimated Sales Demand for A, B and C are 500 units each and machine capacity is limited to
6,000 hours for each machine. You are required to analyze the above information and apply
Theory of Constraints process to remove the constraints. How many units of each product will be
made? [4]
Answer:
Throughput Accounting (TA) Ratio is highest for ‗Machine 2‘. So, ‗Machine 2‘ is the bottleneck.
Total ‗Machine2‘ hours available = 6,000
Particulars A B C
1. Throughput Contribution per unit (given) (`)
2. ‗Machine 2‘ hours required per unit
3. Contribution per ‗Machine 2‘ hour (1’ 2) (`)
4. Ranking
5. Maximum Sales Demand (units)
6. ‗Machine 2‘ hours required (2 × 5)
7. ‗Machine 2‘ hours allocated based on
ranking
8. Possible Output Quantity (7 ÷ 2) (units)
30
15
2
III
500
7,500
(bal. fig) 1,500
100
25
3
8.33
I
500
1,500
(I Rank) 1,500
500
15
6
2.5
II
500
3,000
(II Rank) 3,000
500
(c) List the characteristics of MCS. [3]
Answer:
Management Control System (MCS) is the process by which the managers assure that resources
Answer to PTP_Final_Syllabus 2008_Dec2014_Set 1
Academics Department, The Institute of Cost Accountants of India (Statutory Body under an Act of Parliament) Page 14
are obtained and used effectively in the accomplishment of organizational objectives. It is a step
by which top management ensures that the company‘s objectives are achieved.
Characteristics of a Management Control System (MCS):
i. MCS is all pervasive and it is a continuous exercise.
ii. Functional areas like Research, Marketing, Advertising, Production etc., must be
decided upon and adjusted continuously.
iii. MCS has a periodicity. It is regular and is disciplined.
iv. Coordination amongst different departments is needed.
v. In MCS the emphasis is on both planning and control.
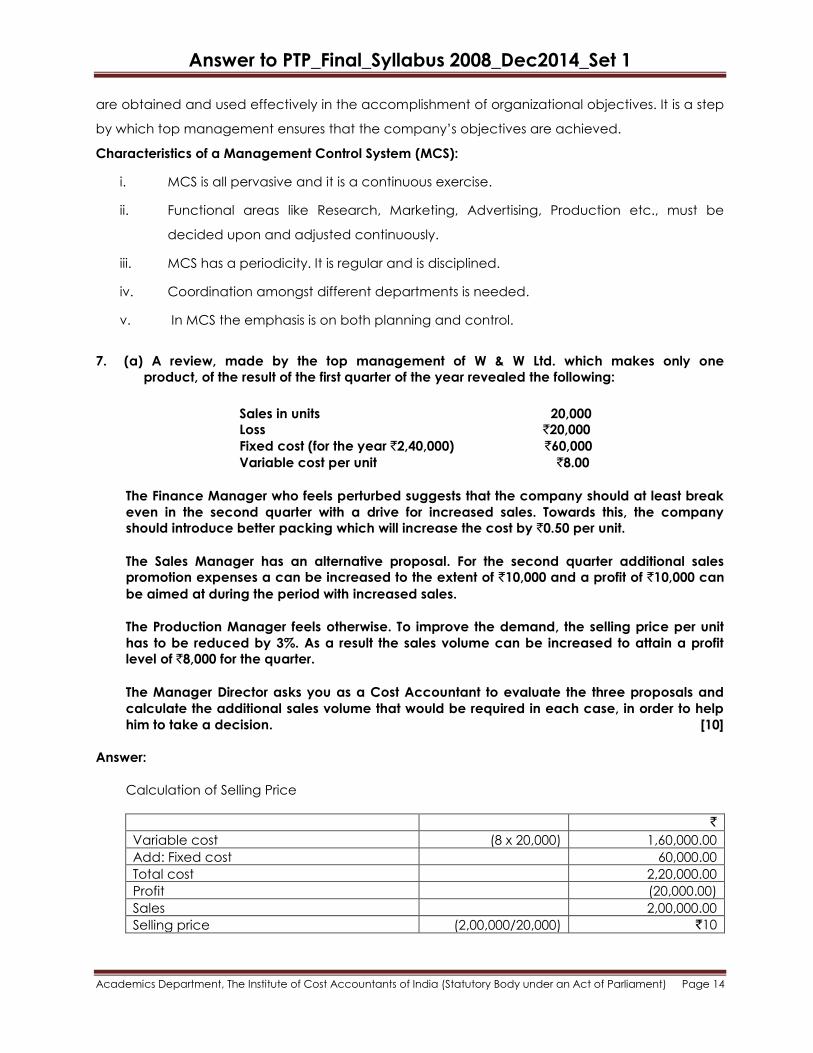
7. (a) A review, made by the top management of W & W Ltd. which makes only one
product, of the result of the first quarter of the year revealed the following:
Sales in units 20,000
Loss `20,000
Fixed cost (for the year `2,40,000) `60,000
Variable cost per unit `8.00
The Finance Manager who feels perturbed suggests that the company should at least break
even in the second quarter with a drive for increased sales. Towards this, the company
should introduce better packing which will increase the cost by `0.50 per unit.
The Sales Manager has an alternative proposal. For the second quarter additional sales
promotion expenses a can be increased to the extent of `10,000 and a profit of `10,000 can
be aimed at during the period with increased sales.
The Production Manager feels otherwise. To improve the demand, the selling price per unit
has to be reduced by 3%. As a result the sales volume can be increased to attain a profit
level of `8,000 for the quarter.
The Manager Director asks you as a Cost Accountant to evaluate the three proposals and
calculate the additional sales volume that would be required in each case, in order to help
him to take a decision. [10]
Answer:
Calculation of Selling Price
`
Variable cost (8 x 20,000) 1,60,000.00
Add: Fixed cost 60,000.00
Total cost 2,20,000.00
Profit (20,000.00)
Sales 2,00,000.00
Selling price (2,00,000/20,000) `10
Answer to PTP_Final_Syllabus 2008_Dec2014_Set 1
Academics Department, The Institute of Cost Accountants of India (Statutory Body under an Act of Parliament) Page 15
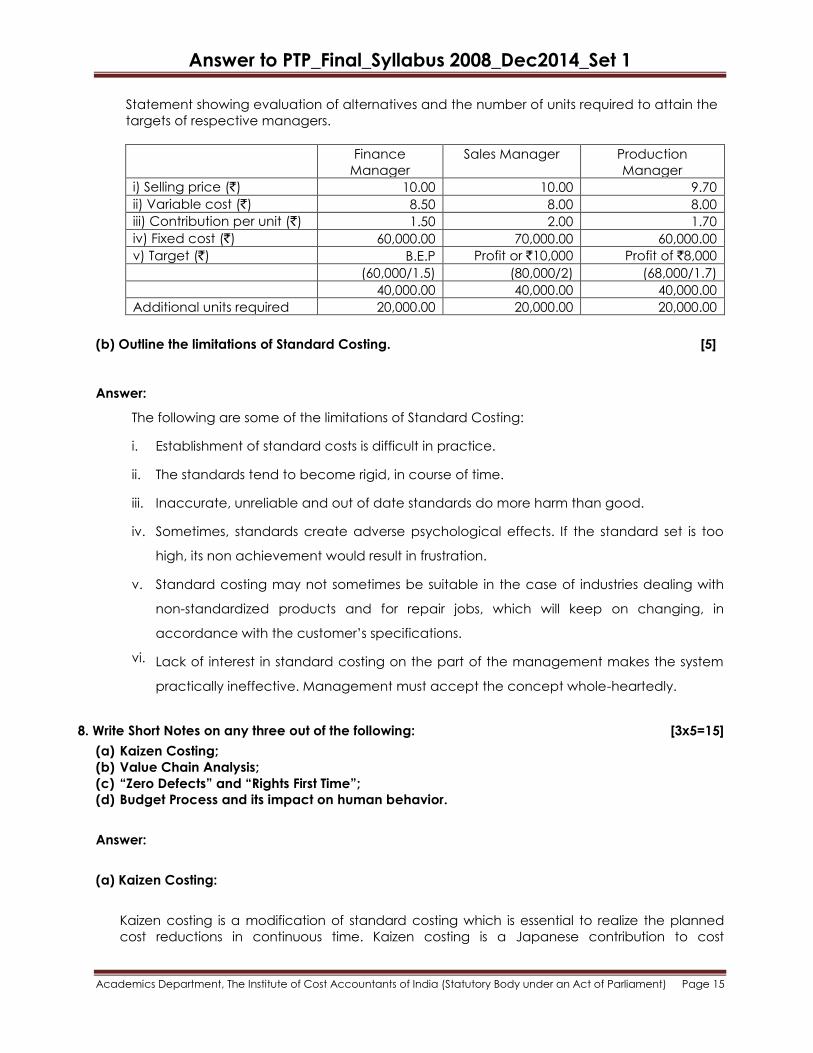
Statement showing evaluation of alternatives and the number of units required to attain the
targets of respective managers.
Finance
Manager
Sales Manager Production
Manager
i) Selling price (`) 10.00 10.00 9.70
ii) Variable cost (`) 8.50 8.00 8.00
iii) Contribution per unit (`) 1.50 2.00 1.70
iv) Fixed cost (`) 60,000.00 70,000.00 60,000.00
v) Target (`) B.E.P Profit or `10,000 Profit of `8,000
(60,000/1.5) (80,000/2) (68,000/1.7)
40,000.00 40,000.00 40,000.00
Additional units required 20,000.00 20,000.00 20,000.00
(b) Outline the limitations of Standard Costing. [5]
Answer:
The following are some of the limitations of Standard Costing:
i. Establishment of standard costs is difficult in practice.
ii. The standards tend to become rigid, in course of time.
iii. Inaccurate, unreliable and out of date standards do more harm than good.
iv. Sometimes, standards create adverse psychological effects. If the standard set is too
high, its non achievement would result in frustration.
v. Standard costing may not sometimes be suitable in the case of industries dealing with
non-standardized products and for repair jobs, which will keep on changing, in
accordance with the customer‘s specifications.
vi. Lack of interest in standard costing on the part of the management makes the system
practically ineffective. Management must accept the concept whole-heartedly.
8. Write Short Notes on any three out of the following: [3x5=15]
(a) Kaizen Costing;
(b) Value Chain Analysis;
(c) “Zero Defects” and “Rights First Time”;
(d) Budget Process and its impact on human behavior.
Answer:
(a) Kaizen Costing:
Kaizen costing is a modification of standard costing which is essential to realize the planned
cost reductions in continuous time. Kaizen costing is a Japanese contribution to cost
Answer to PTP_Final_Syllabus 2008_Dec2014_Set 1
Academics Department, The Institute of Cost Accountants of India (Statutory Body under an Act of Parliament) Page 16
accounting. Kaizen costing is continuous improvement applied to cost reduction in the
manufacturing stage of a product‘s life. Like that of standard costing programme, the aim of
Kaizen costing is to remove inefficiencies from production processes.
Kaizen costing tracks the cost reduction plans on a monthly basis. The Kaizen costing targets are
expressed in the physical resources terms. If the head of a group fails to achieve the Kaizen
costing target by 1 percent, review by senior will start. Resource consumption is very tightly
controlled in many Japanese firms. Thus the planned cost reductions are planned and
monitored through Kaizen cost targets in terms of physical resources.
While implementing the concept of Kaizen, following few rules are to be remembered:
List down your own problems.
Grade your problems as to minor, difficult and major.
Select the smallest minor problem and start with it . After tackling this, move on to next
graded problem and so on.
Know and always remember, improvement is a part of daily routine.
Never accept status quo.
Never reject any idea before trying it .
Share the experiments with colleagues.
Eliminate already tried but failed experiments, while sharing the problems with your
colleagues.
Never hide problems, always highlight them.
(b) Value Chain Analysis: Value Chain depicts how customer value accumulates along a chain
of activities that lead to an end product or service. It is described as the internal processes or
activities a company performs to design, produce, market, deliver and support its product.
Value Chain Analysis requires a strategic framework or focus for organizing internal and
external information and for summarizing findings and recommendations. It requires a team
effort. Management accountants of today has to collaborate with engineering, production,
marketing, distribution and service professionals to focus on the strength, weakness,
opportunities and threats identified in the value chain analysis results. This helps the firms to
better understand which segments, distribution channels, price points, product differentiation,
selling propositions will yield them the greatest competitive advantage. The analysis involves
the following steps:
a) Internal cost analysis – to determine the sources of profitability and relative cost positions
of internal value-creating processes.
b) Internal differentiation analysis - to understand the sources of differentiation within internal
value creating processes.
c) Vertical linkage analysis – to understand the relationship and associated costs among
external suppliers and customers in order to maximize the value delivered to customers
and to minimize cost.
(c) “Zero Defects” and “Rights First Time”:
The man who prompted these two words is Phillip Crosby.
As per him, ―Zero Defects‖ does not mean that mistakes never happen. Rather it means there
is no allowable number of errors built into a product or process and that it is to be got right first
time. He believes that management should take prime responsibility for quality and worker
Answer to PTP_Final_Syllabus 2008_Dec2014_Set 1
Academics Department, The Institute of Cost Accountants of India (Statutory Body under an Act of Parliament) Page 17
only blindly follow their managers. As per him, the Quality Management must satisfy the
following criteria:
• Quality is conformance to requirements;
• Quality prevention is preferable to quality inspection;
• Zero defects is quality performance standard;
• Quality is required to be measured in monetary terms;
The following are the important steps in Quality Improvement:
• Get committed to quality;
• Raise quality awareness amongst all employees;
• Train supervisors in Quality improvement;
• Hold on to ―Zero Defects‖ days;
• Calculate the cost of (poor) quality;
• Recognize participants‘ efforts;
• Do it all over again-quality improvements actions do never end.
(d) Budget Process and its impact on human behavior:
The Budget Process affects Human Behaviour in three aspects:
(i) Formulation of Budgets: The Budget Process may be top-down, determined wholly by top
management. This may engender a feeling of budgets being thrust upon employees
who perceive them as pressure devices. As a result, their full enthusiasm may not be
forthcoming in implementing it. In case the budget is formulated with a bottom-up
approach, involving employees, commitment for meeting the budget can be assured.
(ii) Fixing targets: Sales production and other targets that are fixed should be challenging
but attainable so as to bring out the best efforts of individuals. If targets are so high, as to
be unattainable, it may be demotivating for the employees: in some cases it may also
lead to manipulation of data to ensure conformity with budget.
However such manipulations will have adverse effects in the long run. A common
practice of sales manager is to dump stocks on their dealers at the year end to meet
sales targets, perhaps giving unduly long credit.
(iii) Evaluation of performance: The evaluation of performance should be done in a
constructive manner and not in a vindictive style. While variances may be thrown up by
the system, the causative factors may not be known readily. Hence it is necessary to
analyze the reasons for variance and ensure proper accountability.