Embed Size (px)
Citation preview
Answer to PTP_Final_Syllabus 2012_Jun2014_Set 1
Academics Department, The Institute of Cost Accountants of India (Statutory Body under an Act of Parliament) Page 1
Paper 15 - Business Strategy and Strategic Cost Management
Whenever necessary, suitable assumptions should be made and indicate in answer by
the candidates.
Working Notes should be form part of your answer
Section A
Question No. 1 & 2 are compulsory. Answer any two questions from the rest.
1. From peak sales of over 27,000 units in the January-March 2012 quarter to under 4,000 in
the three months to December 2013, Tata Motors' Nano hasn't quite lived up to the hype and
expectations built up since its launch in mid-2009. To combat with the situation now it launched
Nano Twist, a 'smart city car' costing just under Rs. 2.36 lakhs.
Answer the following questions :
(a) What is strategic decision? What are its characteristics? 5
(b) Strategic decisions are complex in nature – explain. 5
(c) Explain how this strategic decision will help Tata Motors to repositioning themselves in the
market . 5
Answer :
(a) Strategic decisions are the decisions that are concerned with whole environment in
which the firm operates, the entire resources and the people who form the company and the
interface between the two.
The characteristics of strategic decision are as follows :
(i) Strategic decisions are likely to affect the long-term direction of an organisation.
(ii) Strategic decisions are normally about trying to achieve some advantage for the
organisation.
(iii) Strategic decisions are likely to be concerned with the scope of an organisation’s
activities: Does (and should) the organisation concentrate on one area of activity, or does
it have many? The issue of scope of activity is fundamental to strategic decisions because
it concerns the way in which those responsible for managing the organisation conceive its
boundaries. It is to do with what they want the organisation to be like and to be about.
(iv) Strategy is to do with the matching of the activities of an organisation to the environment
in which it operates.
(v) Strategy can also be seen as 'stretching' an organisation's resources and competences to
create opportunities or capitalise on them. It is not just about countering environmental
threats and taking advantage of environmental opportunities; it is also about matching
organisational resources to these threats and opportunities. There would be little point in
trying to take advantage of some new opportunity if the resources needed were not
available or could not be made available, or if the strategy was rooted in an inadequate
resource-base.
(vi) Strategic decisions therefore often have major resource implications for an organisation. In
the 1980s a number of UK retail firms had attempted to develop overseas with little success
and one of the major reasons was that they had underestimated the extent to which their
resource commitments would rise and how the need to control them would take on quite
different proportions. Strategies, then, need to be considered not only in terms of the
extent to which the existing resource-base of the organisation is suited to the
environmental opportunities but also in terms of the extent to which resources can be
obtained and controlled to develop a strategy for the future.
Answer to PTP_Final_Syllabus 2012_Jun2014_Set 1
Academics Department, The Institute of Cost Accountants of India (Statutory Body under an Act of Parliament) Page 2
(vii) Strategic decisions are therefore likely to affect operational decisions, to ‗set off waves of
lesser decisions‘.
(viii) The strategy of an organisation will be affected not only by environmental forces and
resource availability, but also by the values and expectations of those who have power in
and around the organisation. In some respects, strategy can be thought of as a reflection
of the attitudes and beliefs of those who have the most influence on the organisation.
Whether a company is expansionist or more concerned with consolidation, and where the
boundaries are drawn for a company‘s activities, may say much about the values and
attitudes of those who influence strategy -- the stakeholders of the organisation. The beliefs
and values of these stakeholders will have a more or less direct influence on the
organisation.
(b) Strategy is the direction and scope of an organisation over the long term, which
achieves advantage for the organisation through its configuration of resources within a
changing environment, to meet the needs of markets and fulfil stakeholder expectations.
Strategic decisions are, then, often complex in nature: it can be argued that what distinguishes
strategic management from other aspects of management in an organisation is just this
complexity. The complexity arises for at least three reasons. First, strategic decisions usually
involve a high degree of uncertainty: they may involve taking decisions on the basis of views
about the future which it is impossible for managers to be sure about. Second, strategic
decisions are likely to demand an integrated approach to managing the organisation. Unlike
functional problems, there is no one area of expertise, or one perspective that can define or
resolve the problems. Managers, therefore, have to cross functional and operational boundaries
to deal with strategic problems and come to agreements with other managers who, inevitably,
have different interests and perhaps different priorities. This problem of integration exists in all
management tasks but is particularly problematic for strategic decisions. Third, as has been
noted above, strategic decisions are likely to involve major change in organisations. Not only is it
problematic to decide upon and plan those changes, it is even more problematic actually to
implement them. Strategic management is therefore distinguished by a higher order of
complexity than operational tasks.
(c) Tata developed the Nano car world‘s cheapest car. Tata want to provides car to all
common man but unfortunately that didn‘t go down with buyers too well. From starting Tata
Nano car faced trouble in factory establishment and many other issues. But now Tata comes
out stronger on other side and ready to offer Nano automatic transmission.
With the new Nano Twist, and the Nano eMax a few months back, Nano portfolio stands true to
its brand essence: of a youthful, exciting car offering great value but, at the same time, builds in
a different set of features to suit differing customer needs.
Focus on youth: The attempt over the past year has been to attract youngsters. To build a
youthful and aspirational value around the brand, Tata Motors through its 'awesomeness'
branding and marketing campaign worked with fashion designer Masaba Gupta on the launch
of the Twist. The makeover campaign is an attempt to get youngsters to look at the Nano as a
fashion accessory. The company promises more on-ground activities and showcases at colleges
to woo the youth.
Fresh positioning: From a people's car and the world's cheapest, the Nano is now positioned as
the smart city car for young achievers. While the perception of a cheap car has still not gone
away, the profile of the consumer has tremendously improved — along with the features in the
car. Based on market research, Tata Motors has segmented potential customers into first-time
Answer to PTP_Final_Syllabus 2012_Jun2014_Set 1
Academics Department, The Institute of Cost Accountants of India (Statutory Body under an Act of Parliament) Page 3
buyers, those looking for a replacement or an additional car and others who want more
features and performance. Near-term plans include a variant with automated transmission to
strengthen the smart city car positioning.
With all the significant product changes, it is a really easy-to drive car, great to manoeuvre, with
a distinct individuality and colour and offering what no car can in this price range — a great
style, entertainment and music, industry-leading power steering and more. The repositioning will
make the product cater to a larger number of customer segments.
2. Hero Honda joint venture formed in 1984 is a classic case of strategic alliance involving
the Indian company Hero Group and Japanese automobile major Honda Motorcycle. The
alliance has been terminated with the entire 26% stake of Honda Motorcycle in the venture
bought by the Hero Group. Selling out of the venture gives the Japanese company the freedom
to go it alone in the world's second largest market for two-wheelers.
(a) Is joint venture the only way to enter into strategic alliance? 5
(b) Alliances are not new, but in the competitive landscape, distinguishing features are
emerging. Identify these features. 5
(c) What are the key success factors for managing an alliance? In the light of these key
success factors, identify the reasons for the termination of this successful joint venture.
5
Answer:
(a) No, joint venture is not only a way to enter into a strategic alliance. Apart from joint
venture, Strategic alliances may be in the form of -
Management contract.
Franchising
Supply or purchase agreement
Marketing and distribution agreement
Agreement to provide technical services
Licensing of know-how, technology, design, patent, etc.
(b) All alliances involve some measure of inter-corporate integration. In the new emerging
competitive environment the companies are finding innovative ways of alliances with features
meeting their requirements. Trading alliances are only a bit more complicated than traditional
buy-sell relationship. Normally the objectives of such trading alliances include the need to
secure supplies of product, buy or exchange skills/technology and exploit market networks. The
main features of such alliance are management at arm's length, implementation at a fast pace,
exclusivity, limited time frames with options to renew based on certain well-defined milestones.
On the other hand, partnerships involving an integration of business resources can take the form
of functional alliances. Functional alliances are usually joint ventures or equity-based
partnerships. They are characterised by management integration, open-ended collaboration,
separate joint-venture entity and long-term commitment.
(c) The key success factors for managing alliance are under:
Mutual Trust: Mutual trust at senior management level carry ventures through turbulent times.
Ability to compromise: When there are two strong companies, the ability to compromise is
not easy to achieve. If you expect to receive some valuable technology, production or
marketing know how from a partner, you must be willing to give something.
Favourable business condition: Launching an alliance when favourable business conditions
exist makes a venture life considerably easier for its partners.
Answer to PTP_Final_Syllabus 2012_Jun2014_Set 1
Academics Department, The Institute of Cost Accountants of India (Statutory Body under an Act of Parliament) Page 4
Alliance Autonomy: The autonomy mandates a high degree of responsibility and good
judgment by the ventures management.
Reasons for termination of successful joint venture are as under:
Different cultures, may quickly find the variations in their behavioral norms are creating
breeding ground for misunderstanding, poor follow-through, and eventual distrust.
Joint ventures are also potential for conflicts. They may result in disputes between or among
partners due to varied interests.
Slow down in decision making by partners.
Changes in the business environment in two countries and changes in partner strength.
Life cycle of joint ventures.
3. It has been known for many years that the returns from diversification are often poor.
Why do managers still persist with it as a strategy? 10
Answer:
The statement made is true. It is a fact that the returns from diversification are often poor, yet
many managers seem to still persist with it.
In diversification, an enterprise takes up new products or business which may be related or
unrelated to its existing business. Diversification, in particular, involves a high degree of risk, as it
amounts to manufacturing new products or entering into new markets, unfamiliar to the
organization.
One simple answer comes from the innate tendency of some entrepreneurs and entrepreneurial
managers, to seize opportunities as they arise, in the belief that they can overcome the resulting
challenges and hence firmly believe in diversifying.
The difference between justified confidence and hubris can be difficult to perceive, particularly
when you have taken risks before and had gained success thereby. Some of those opportunities
are genuine. If every manager were to eschew diversification because the odds were against its
succeeding, then many profitable openings would remain unexplored.
Society and many companies would arguably be poorer if managers do not go in for
diversification. The proper function of the manager, one might argue, is to take (properly
assessed) risks rather than to avoid them. 'Betting the firm' on a diversification is not necessarily a
sound strategy but a trial and error approach. This approach may have something to commend
it, if the errors are affordable. One final point is that the failure rate of diversification is not infact
as dreadful as a Porter made it out to be.
Most major organizational initiatives carry a failure rate of around 7Q%.The success rate for
diversification is pretty well at par. It is better than the success rates for new products, of which 9
out of 10 fail, according to commonly cited marketing folklore. It is also important to understand
what it takes to manage a certain growth rate. Depending on where the existing business is in
terms of the industry life cycle stage, a firm may need to get into other businesses for sustained
future returns, as in case of companies in the tobacco business.
Further, if the products are not doing too well in the traditional lines, managers should explore
diversification.
Answer to PTP_Final_Syllabus 2012_Jun2014_Set 1
Academics Department, The Institute of Cost Accountants of India (Statutory Body under an Act of Parliament) Page 5
Diversification should also be resorted to in cases where the organization enjoy considerable
resource strength and would like to expand its operation by looking at new businesses.
To conclude, we can say that diversification is a high risk strategy. Yet we should go for it, in tune
with the adage " No risk, no gain."
4. Discuss how competitive forces shape strategy? 10
Answer:
The essence of strategy formulation is coping with competition. Yet it is easy to view competition
too narrowly and too pessimistically. While one sometimes hears executives complaining to the
contrary, intense competition in an industry is neither coincidence nor bad luck.
Moreover, in the fight for market share, competition is not manifested only in the other players.
Rather, competition in an industry is rooted in its underlying economics, and competitive forces
exist that go well beyond the established combinations in a particular industry. Customers,
suppliers, potential entrants, and substitute products are all competitors that may be more or less
prominent or active depending on the industry.
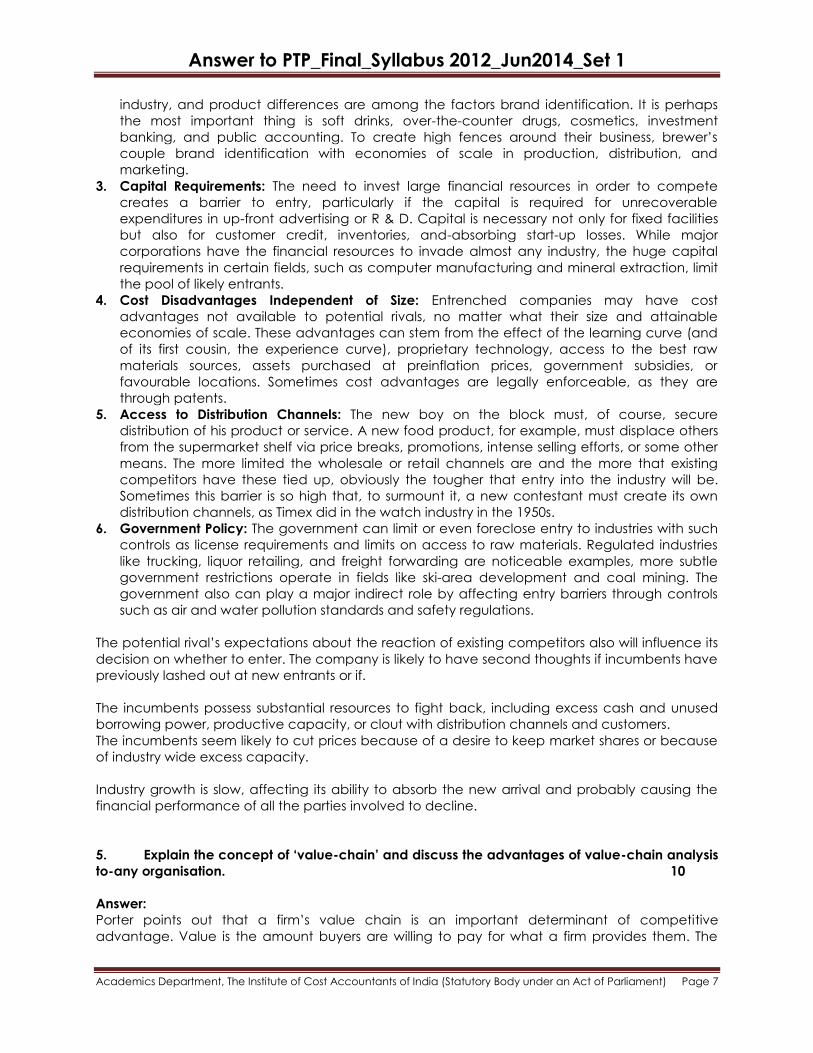
The state of competition in an industry depends on five basic forces, which are diagrammed in
figure. The collective strength of these forces determines the ultimate profit potential of an
industry. It ranges from intense in industries like tires, metal cans, and steel, where no company
earns spectacular returns on investment, to mild in industries like oil-field services and equipment,
soft drinks, and toiletries, where there is room for quite high returns.
In the economists ―perfectly competitive‖ industry, jockeying for position is unbridled and entry
to the industry very easy. This kind of industry structure, of course, offers the worst prospect for
long-run profitability. The weaker the forces collectively, however, the greater the opportunity for
superior performance.
Whatever their collective strength, the corporate strategist‘s goal is to find a position in the
industry where his or her company can best defend itself against these forces or can influence
them in its favour. The collective strength of the forces may be painfully apparent to all the
antagonists, but to cope with them, the strategist must delve below the surface and analyse the
sources of competition. For example, what makes the industry vulnerable to entry? What
determines the bargaining power of suppliers?
Knowledge of these underlying sources of competitive pressure provides the groundwork for a
strategic agenda of action. They highlight the critical strengths and weaknesses of the
company, animate the positioning of the company in its industry, clarify the areas where
strategic changes may yield the greatest payoff, and highlight the places where industry trends
promise to hold the greatest significance as either opportunities or threats.
Understanding these sources also proves to be of help in considering areas for diversification.
Contending Forces: The strongest competitive force or forces determine the profitability of an
industry and so are of greatest importance in strategy formulation. For example, even a
company with a strong position in an industry unthreatened by potential entrants will earn low
returns if it faces a superior or a lower cost substitute product as the leading manufacturers of
vacuum tubes and coffee percolators have learned to their sorrow. In such a situation, coping
with the substitute product becomes the number one strategic priority.

Answer to PTP_Final_Syllabus 2012_Jun2014_Set 1
Academics Department, The Institute of Cost Accountants of India (Statutory Body under an Act of Parliament) Page 6
Different forces take on prominence, of course, in shaping competition in each industry. In the
ocean going tanker industry the key force is probably the buyers (the major oil companies),
while in tires it is powerful OEM buyers coupled with tough competitors. In the steel industry the
key forces are foreign competitors and substitute materials.
Every industry has an underlying structure, or a set of fundamental economic and technical
characteristics, that gives rise to these competitive forces. The strategist, wanting to position his
company to cope best with its industry environment or to influence that environment in the
company‘s favour, must learn what makes the environment tick.
A few characteristics are critical to the strength of each competitive force.
Threat of Entry: New entrants to an industry bring new capacity, the desire to gain market share,
and often substantial resources. Companies diversifying through acquisition into the industry from
other markets often leverage their resources to cause a shape-up, as Philip Morris did with Miller
beer.
The seriousness of the threat of entry depends on the barriers present and on the reaction from
existing competitors that the entrant can expect. If barriers to entry are high and a newcomer
can expect sharp retaliation from the entrenched competitors, obviously he will not pose a
serious threat of entering.
There are six major sources of barriers to entry:
1. Economies of Scale: These economies determine entry by forcing the aspirant either to
come in on a large scale or to accept a cost disadvantage. Scale economies in production,
research, marketing, and service are probably the key barriers to entry in the mainframe
computer industry, as Xerox and GE sadly discovered. Economies of scale can also act as
hurdles in distribution, utilisation of the sales force, financing and nearly any other part of a
business.
2. Product Differentiation: Brand identification creates a barrier by forcing entrants to spend
heavily to overcome customer loyalty. Advertising, customer service, being first in the
Potential entrants
Industry Competitors
Revilary among existing firms
Substitutes
Buyers Suppliers
Threat of substitutes products
or services
Bargaining power of buyers
Bargaining power of buyers
Forces driving Industry competition:
Threat of new entrants
Answer to PTP_Final_Syllabus 2012_Jun2014_Set 1
Academics Department, The Institute of Cost Accountants of India (Statutory Body under an Act of Parliament) Page 7
industry, and product differences are among the factors brand identification. It is perhaps
the most important thing is soft drinks, over-the-counter drugs, cosmetics, investment
banking, and public accounting. To create high fences around their business, brewer‘s
couple brand identification with economies of scale in production, distribution, and
marketing.
3. Capital Requirements: The need to invest large financial resources in order to compete
creates a barrier to entry, particularly if the capital is required for unrecoverable
expenditures in up-front advertising or R & D. Capital is necessary not only for fixed facilities
but also for customer credit, inventories, and-absorbing start-up losses. While major
corporations have the financial resources to invade almost any industry, the huge capital
requirements in certain fields, such as computer manufacturing and mineral extraction, limit
the pool of likely entrants.
4. Cost Disadvantages Independent of Size: Entrenched companies may have cost
advantages not available to potential rivals, no matter what their size and attainable
economies of scale. These advantages can stem from the effect of the learning curve (and
of its first cousin, the experience curve), proprietary technology, access to the best raw
materials sources, assets purchased at preinflation prices, government subsidies, or
favourable locations. Sometimes cost advantages are legally enforceable, as they are
through patents.
5. Access to Distribution Channels: The new boy on the block must, of course, secure
distribution of his product or service. A new food product, for example, must displace others
from the supermarket shelf via price breaks, promotions, intense selling efforts, or some other
means. The more limited the wholesale or retail channels are and the more that existing
competitors have these tied up, obviously the tougher that entry into the industry will be.
Sometimes this barrier is so high that, to surmount it, a new contestant must create its own
distribution channels, as Timex did in the watch industry in the 1950s.
6. Government Policy: The government can limit or even foreclose entry to industries with such
controls as license requirements and limits on access to raw materials. Regulated industries
like trucking, liquor retailing, and freight forwarding are noticeable examples, more subtle
government restrictions operate in fields like ski-area development and coal mining. The
government also can play a major indirect role by affecting entry barriers through controls
such as air and water pollution standards and safety regulations.
The potential rival‘s expectations about the reaction of existing competitors also will influence its
decision on whether to enter. The company is likely to have second thoughts if incumbents have
previously lashed out at new entrants or if.
The incumbents possess substantial resources to fight back, including excess cash and unused
borrowing power, productive capacity, or clout with distribution channels and customers.
The incumbents seem likely to cut prices because of a desire to keep market shares or because
of industry wide excess capacity.
Industry growth is slow, affecting its ability to absorb the new arrival and probably causing the
financial performance of all the parties involved to decline.
5. Explain the concept of ‘value-chain’ and discuss the advantages of value-chain analysis
to-any organisation. 10
Answer:
Porter points out that a firm‘s value chain is an important determinant of competitive
advantage. Value is the amount buyers are willing to pay for what a firm provides them. The
Answer to PTP_Final_Syllabus 2012_Jun2014_Set 1
Academics Department, The Institute of Cost Accountants of India (Statutory Body under an Act of Parliament) Page 8
total revenue reflects the value. Creating value for buyers that exceeds the cost of doing so is
the goal of any generic strategy.
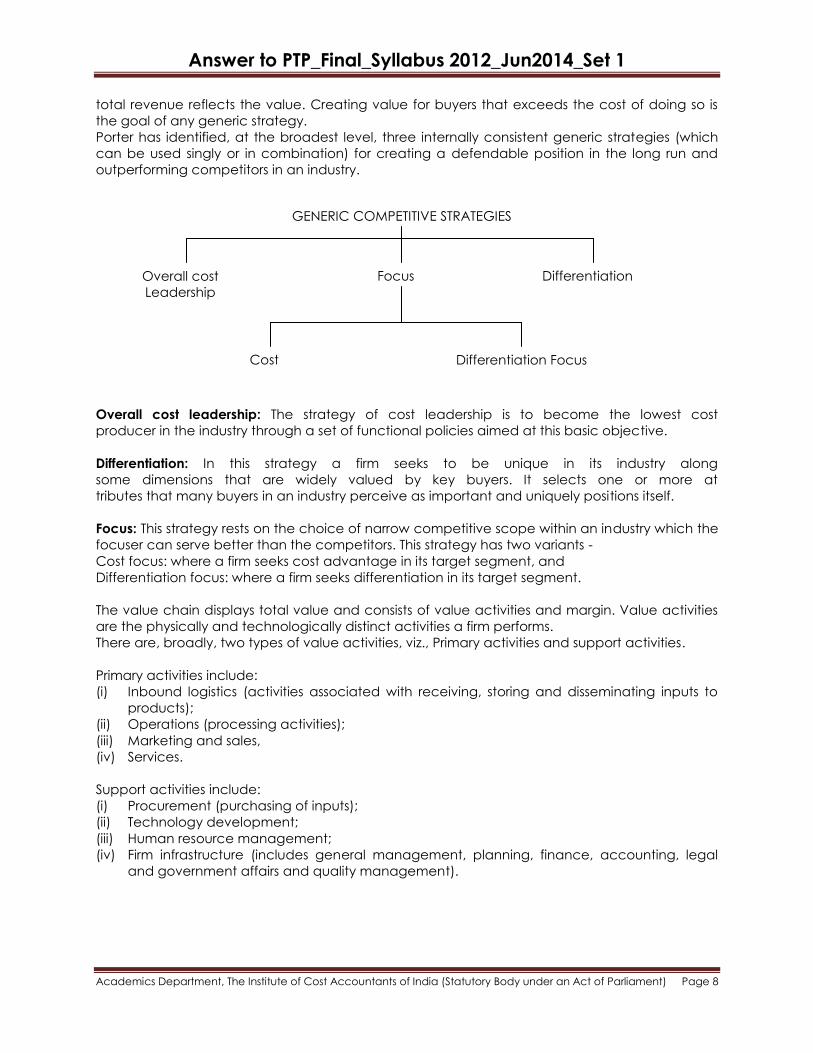
Porter has identified, at the broadest level, three internally consistent generic strategies (which
can be used singly or in combination) for creating a defendable position in the long run and
outperforming competitors in an industry.
Overall cost leadership: The strategy of cost leadership is to become the lowest cost
producer in the industry through a set of functional policies aimed at this basic objective.
Differentiation: In this strategy a firm seeks to be unique in its industry along
some dimensions that are widely valued by key buyers. It selects one or more at
tributes that many buyers in an industry perceive as important and uniquely positions itself.
Focus: This strategy rests on the choice of narrow competitive scope within an industry which the
focuser can serve better than the competitors. This strategy has two variants -
Cost focus: where a firm seeks cost advantage in its target segment, and
Differentiation focus: where a firm seeks differentiation in its target segment.
The value chain displays total value and consists of value activities and margin. Value activities
are the physically and technologically distinct activities a firm performs.
There are, broadly, two types of value activities, viz., Primary activities and support activities.
Primary activities include:
(i) Inbound logistics (activities associated with receiving, storing and disseminating inputs to
products);
(ii) Operations (processing activities);
(iii) Marketing and sales,
(iv) Services.
Support activities include:
(i) Procurement (purchasing of inputs);
(ii) Technology development;
(iii) Human resource management;
(iv) Firm infrastructure (includes general management, planning, finance, accounting, legal
and government affairs and quality management).
GENERIC COMPETITIVE STRATEGIES
Overall cost
Leadership
Focus Differentiation
Cost Differentiation Focus

Answer to PTP_Final_Syllabus 2012_Jun2014_Set 1
Academics Department, The Institute of Cost Accountants of India (Statutory Body under an Act of Parliament) Page 9
Firms create value for their customers through performing activities mentioned in the value chain
above. To gain competitive advantage over its rivals, a firm must either provide comparable
buyer value by performing the activities more efficiently than its competitors (cost leadership) or
perform activities in a unique way that creates greater buyer value and command a premium
price (differentiation). Firms gain competitive advantage from conceiving of new ways to
conduct activities, employing new procedures, new technologies or different inputs. However, a
firm is more than the sum of its activities. A firm‘s value chain is an interdependent system of
network of activities, connected by linkages. Linkages occur when the way in which one activity
is performed affects the cost or effectiveness of other activities. Linkages often create trade-off
in performing different activities which must be optimised, e.g. a more costly product design can
reduce after-sales service costs.
Careful management of linkage can be a decisive source of competitive advantage. Gaining
competitive advantage requires that a firm‘s value chain is managed as system rather than a
collection of separate parts. Reconfiguring the value chain, by relocating, reordering,
regrouping or even eliminating the activities is often at the root of a major improvement in
competitive position.
A company‘s value chain for competing in a particular industry is embedded in a larger stream
of activities that is called the value system. This includes the value chains of suppliers, distribution
channels and the buyers. A firm should strive to understand not only its own value chain activities
but also of the competitors‘, distributors‘ and suppliers. Ultimately, firm gains competitive
advantage by performing strategically important activities more cheaply or better than its rivals.
FIRM INFRASTRUCTURE (e.g., finance, planning)
HUMAN RESOURCE MANAGEMENT
TECHNOLOGY DEVELOPMENT
PROCUREMENT
Inbound Logistics
Operations (Manufacturing)
Outbounding logistics
Marketing and Sales
After Sales Service
Sup
po
rt A
ctiv
itie
s M
AR
GIN
Answer to PTP_Final_Syllabus 2012_Jun2014_Set 1
Academics Department, The Institute of Cost Accountants of India (Statutory Body under an Act of Parliament) Page 10
Section B
Question No. 6 is compulsory. Answer any two questions from the rest.
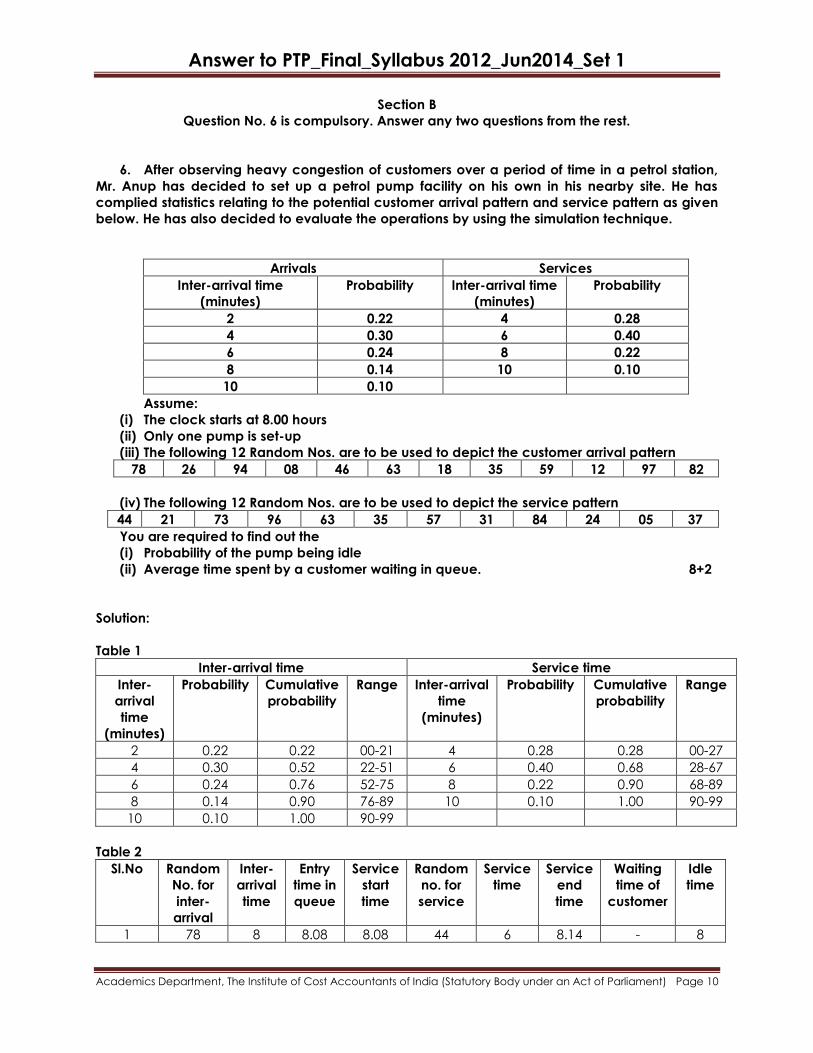
6. After observing heavy congestion of customers over a period of time in a petrol station,
Mr. Anup has decided to set up a petrol pump facility on his own in his nearby site. He has
complied statistics relating to the potential customer arrival pattern and service pattern as given
below. He has also decided to evaluate the operations by using the simulation technique.
Arrivals Services
Inter-arrival time
(minutes)
Probability Inter-arrival time
(minutes)
Probability
2 0.22 4 0.28
4 0.30 6 0.40
6 0.24 8 0.22
8 0.14 10 0.10
10 0.10
Assume:
(i) The clock starts at 8.00 hours
(ii) Only one pump is set-up
(iii) The following 12 Random Nos. are to be used to depict the customer arrival pattern
78 26 94 08 46 63 18 35 59 12 97 82
(iv) The following 12 Random Nos. are to be used to depict the service pattern
44 21 73 96 63 35 57 31 84 24 05 37
You are required to find out the
(i) Probability of the pump being idle
(ii) Average time spent by a customer waiting in queue. 8+2
Solution:
Table 1
Inter-arrival time Service time
Inter-
arrival
time
(minutes)
Probability Cumulative
probability
Range Inter-arrival
time
(minutes)
Probability Cumulative
probability
Range
2 0.22 0.22 00-21 4 0.28 0.28 00-27
4 0.30 0.52 22-51 6 0.40 0.68 28-67
6 0.24 0.76 52-75 8 0.22 0.90 68-89
8 0.14 0.90 76-89 10 0.10 1.00 90-99
10 0.10 1.00 90-99
Table 2
Sl.No Random
No. for
inter-
arrival
Inter-
arrival
time
Entry
time in
queue
Service
start
time
Random
no. for
service
Service
time
Service
end
time
Waiting
time of
customer
Idle
time
1 78 8 8.08 8.08 44 6 8.14 - 8
Answer to PTP_Final_Syllabus 2012_Jun2014_Set 1
Academics Department, The Institute of Cost Accountants of India (Statutory Body under an Act of Parliament) Page 11
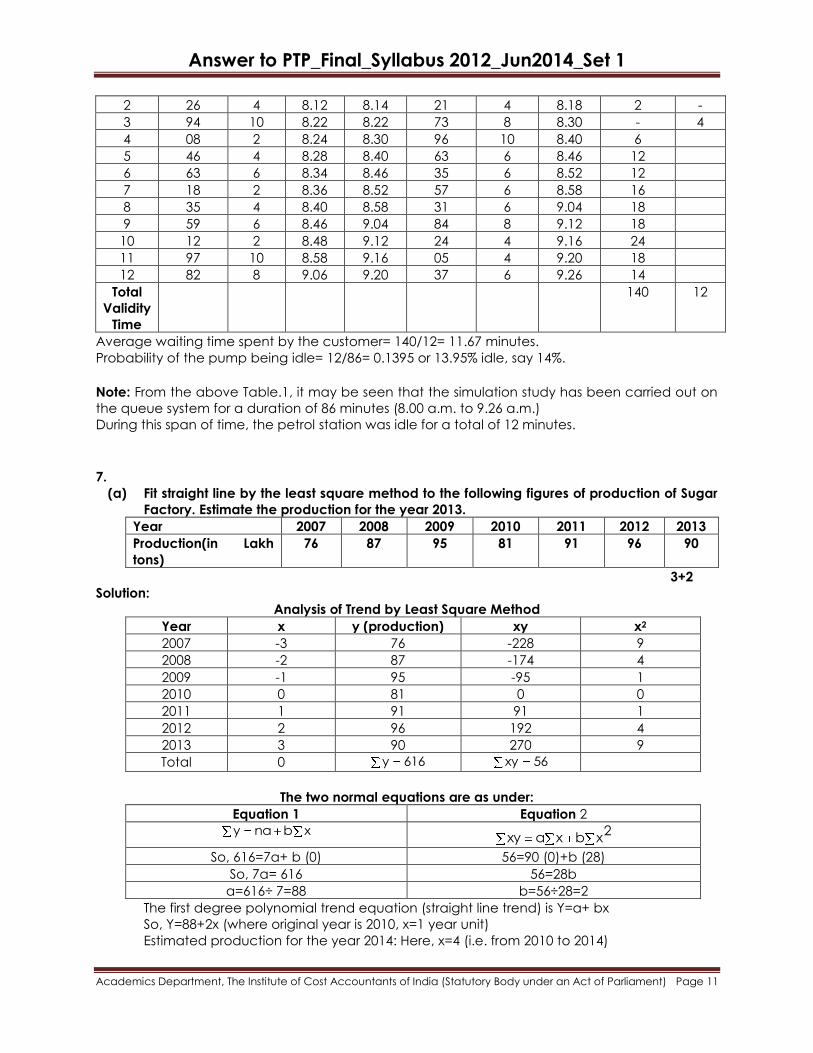
2 26 4 8.12 8.14 21 4 8.18 2 -
3 94 10 8.22 8.22 73 8 8.30 - 4
4 08 2 8.24 8.30 96 10 8.40 6
5 46 4 8.28 8.40 63 6 8.46 12
6 63 6 8.34 8.46 35 6 8.52 12
7 18 2 8.36 8.52 57 6 8.58 16
8 35 4 8.40 8.58 31 6 9.04 18
9 59 6 8.46 9.04 84 8 9.12 18
10 12 2 8.48 9.12 24 4 9.16 24
11 97 10 8.58 9.16 05 4 9.20 18
12 82 8 9.06 9.20 37 6 9.26 14
Total
Validity
Time
140 12
Average waiting time spent by the customer= 140/12= 11.67 minutes.
Probability of the pump being idle= 12/86= 0.1395 or 13.95% idle, say 14%.
Note: From the above Table.1, it may be seen that the simulation study has been carried out on
the queue system for a duration of 86 minutes (8.00 a.m. to 9.26 a.m.)
During this span of time, the petrol station was idle for a total of 12 minutes.
7.
(a) Fit straight line by the least square method to the following figures of production of Sugar
Factory. Estimate the production for the year 2013.
Year 2007 2008 2009 2010 2011 2012 2013
Production(in Lakh
tons)
76 87 95 81 91 96 90
3+2
Solution:
Analysis of Trend by Least Square Method
Year x y (production) xy x2
2007 -3 76 -228 9
2008 -2 87 -174 4
2009 -1 95 -95 1
2010 0 81 0 0
2011 1 91 91 1
2012 2 96 192 4
2013 3 90 270 9
Total 0 616y 56xy
The two normal equations are as under:
Equation 1 Equation 2
xbnay 2xbxaxy
So, 616=7a+ b (0) 56=90 (0)+b (28)
So, 7a= 616 56=28b
a=616÷ 7=88 b=56÷28=2
The first degree polynomial trend equation (straight line trend) is Y=a+ bx
So, Y=88+2x (where original year is 2010, x=1 year unit)
Estimated production for the year 2014: Here, x=4 (i.e. from 2010 to 2014)
Answer to PTP_Final_Syllabus 2012_Jun2014_Set 1
Academics Department, The Institute of Cost Accountants of India (Statutory Body under an Act of Parliament) Page 12
So, Y=88+2(4); 88+8=96.
Hence, production for the year 2014= 96 lakh tons.
(b) State the assumptions on which cost-volume profit analysis is based. 5
Answer:
It is essential that while preparing or interpreting CVP information, one must be aware of the
underlying assumptions on which the information has been prepared. The important assumptions
are:
(i) All other variables remain constant.
(ii) A single product or constant sales mix.
(iii) Total cost and total revenue are linear functions of output.
(iv) Profits are calculated on a variable costing basis.
(v) The analysis applies only to the relevant range only.
(vi) Costs can be accurately divided into their fixed and variable elements.
(vii) The analysis applies only to a short term time horizon.
(viii) Complexity related fixed costs do not change.
If these assumptions are not recognized, serious error may result incorrect conclusions may be
drawn from the analysis.
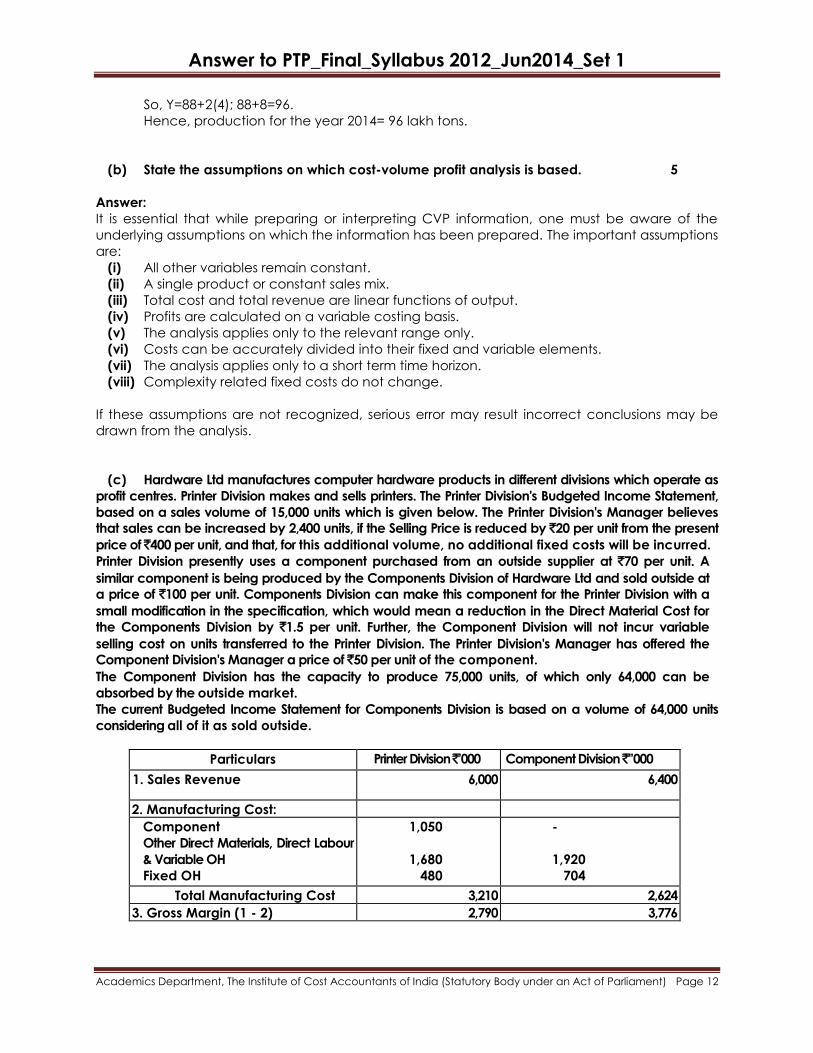
(c) Hardware Ltd manufactures computer hardware products in different divisions which operate as
profit centres. Printer Division makes and sells printers. The Printer Division's Budgeted Income Statement,
based on a sales volume of 15,000 units which is given below. The Printer Division's Manager believes
that sales can be increased by 2,400 units, if the Selling Price is reduced by `20 per unit from the present
price of ̀ 400 per unit, and that, for this additional volume, no additional fixed costs will be incurred.
Printer Division presently uses a component purchased from an outside supplier at `70 per unit. A
similar component is being produced by the Components Division of Hardware Ltd and sold outside at
a price of `100 per unit. Components Division can make this component for the Printer Division with a
small modification in the specification, which would mean a reduction in the Direct Material Cost for
the Components Division by `1.5 per unit. Further, the Component Division will not incur variable
selling cost on units transferred to the Printer Division. The Printer Division's Manager has offered the
Component Division's Manager a price of `50 per unit of the component.
The Component Division has the capacity to produce 75,000 units, of which only 64,000 can be
absorbed by the outside market.
The current Budgeted Income Statement for Components Division is based on a volume of 64,000 units
considering all of it as sold outside.
Particulars Printer Division ̀ ’000 Component Division ̀ '’000
1. Sales Revenue 6,000 6,400
2. Manufacturing Cost:
Component
Other Direct Materials, Direct Labour
& Variable OH
Fixed OH
1,050
1,680
480
-
1,920
704
Total Manufacturing Cost 3,210 2,624
3. Gross Margin (1 - 2) 2,790 3,776
Answer to PTP_Final_Syllabus 2012_Jun2014_Set 1
Academics Department, The Institute of Cost Accountants of India (Statutory Body under an Act of Parliament) Page 13
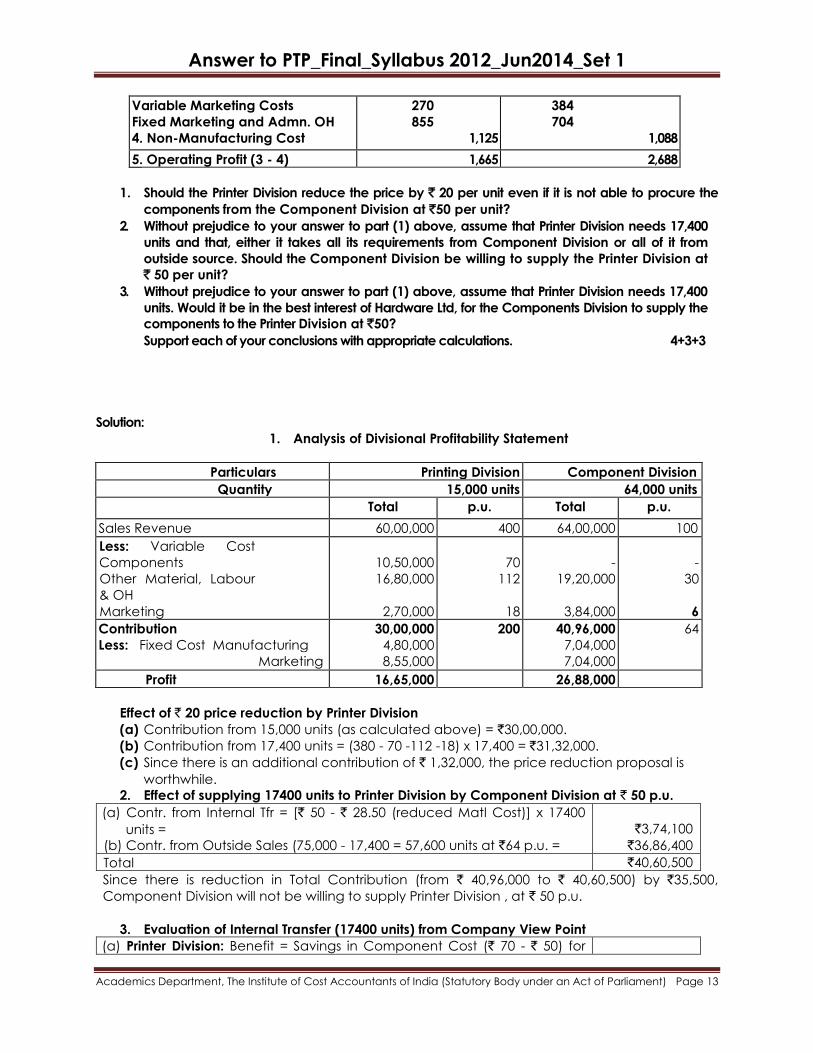
Variable Marketing Costs
Fixed Marketing and Admn. OH
4. Non-Manufacturing Cost
270
855
1,125
384
704
1,088
5. Operating Profit (3 - 4) 1,665 2,688
1. Should the Printer Division reduce the price by ̀20 per unit even if it is not able to procure the
components from the Component Division at `50 per unit?
2. Without prejudice to your answer to part (1) above, assume that Printer Division needs 17,400
units and that, either it takes all its requirements from Component Division or all of it from
outside source. Should the Component Division be willing to supply the Printer Division at
` 50 per unit?
3. Without prejudice to your answer to part (1) above, assume that Printer Division needs 17,400
units. Would it be in the best interest of Hardware Ltd, for the Components Division to supply the
components to the Printer Division at `50?
Support each of your conclusions with appropriate calculations. 4+3+3
Solution:
1. Analysis of Divisional Profitability Statement
Particulars Printing Division Component Division
Quantity 15,000 units 64,000 units
Total p.u. Total p.u.
Sales Revenue 60,00,000 400 64,00,000 100
Less: Variable Cost
Components
Other Material, Labour
& OH
Marketing
10,50,000
16,80,000
2,70,000
70
112
18
-
19,20,000
3,84,000
-
30
6
Contribution
Less: Fixed Cost Manufacturing
Marketing
30,00,000
4,80,000
8,55,000
200 40,96,000
7,04,000
7,04,000
64
Profit 16,65,000 26,88,000
Effect of ` 20 price reduction by Printer Division
(a) Contribution from 15,000 units (as calculated above) = `30,00,000.
(b) Contribution from 17,400 units = (380 - 70 -112 -18) x 17,400 = `31,32,000.
(c) Since there is an additional contribution of ` 1,32,000, the price reduction proposal is
worthwhile.
2. Effect of supplying 17400 units to Printer Division by Component Division at ` 50 p.u.
(a) Contr. from Internal Tfr = [` 50 - ` 28.50 (reduced Matl Cost)] x 17400
units =
(b) Contr. from Outside Sales (75,000 - 17,400 = 57,600 units at `64 p.u. =
`3,74,100
`36,86,400
Total `40,60,500
Since there is reduction in Total Contribution (from ` 40,96,000 to ` 40,60,500) by `35,500,
Component Division will not be willing to supply Printer Division , at ` 50 p.u.
3. Evaluation of Internal Transfer (17400 units) from Company View Point
(a) Printer Division: Benefit = Savings in Component Cost (` 70 - ` 50) for
Answer to PTP_Final_Syllabus 2012_Jun2014_Set 1
Academics Department, The Institute of Cost Accountants of India (Statutory Body under an Act of Parliament) Page 14
17,400 units =
(b) Component Division: Loss of Contribution as per above =
`3,48,000
`35,500
Net Benefit of Company as a whole `3,12,500
Hence, Internal Transfer of 17,400 units at ` 50 p.u. is beneficial from the overall Company
viewpoint
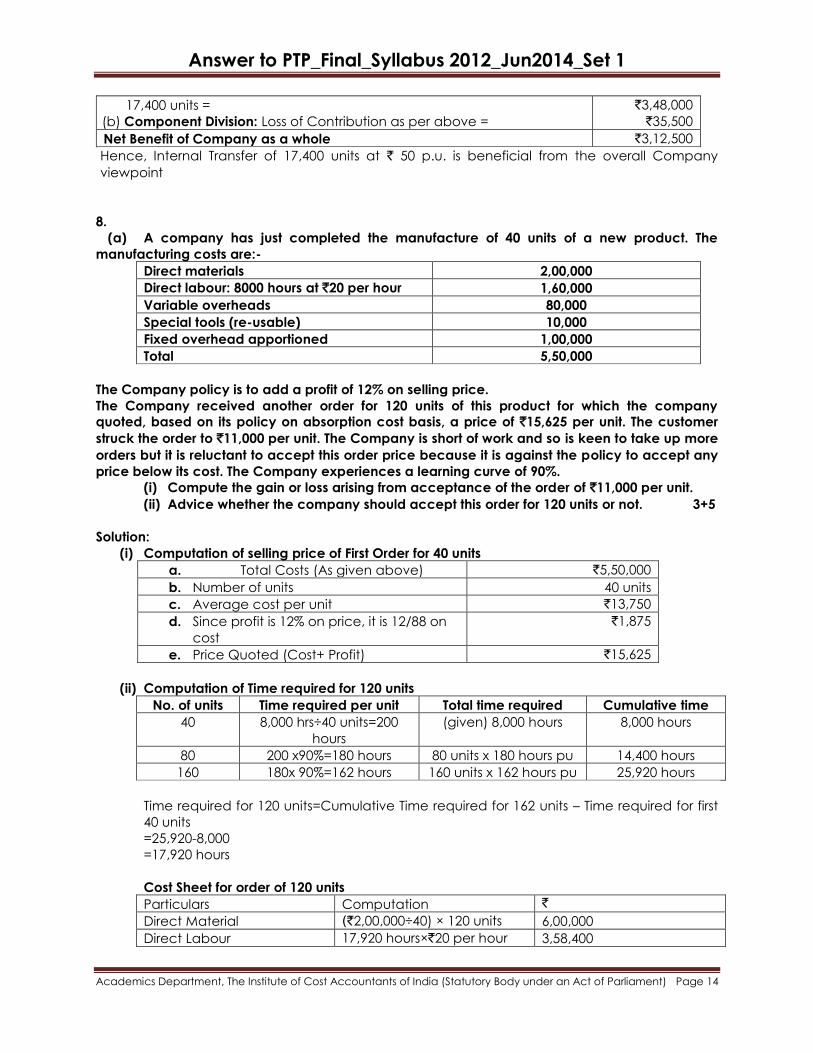
8.
(a) A company has just completed the manufacture of 40 units of a new product. The
manufacturing costs are:-
Direct materials 2,00,000
Direct labour: 8000 hours at `20 per hour 1,60,000
Variable overheads 80,000
Special tools (re-usable) 10,000
Fixed overhead apportioned 1,00,000
Total 5,50,000
The Company policy is to add a profit of 12% on selling price.
The Company received another order for 120 units of this product for which the company
quoted, based on its policy on absorption cost basis, a price of `15,625 per unit. The customer
struck the order to `11,000 per unit. The Company is short of work and so is keen to take up more
orders but it is reluctant to accept this order price because it is against the policy to accept any
price below its cost. The Company experiences a learning curve of 90%.
(i) Compute the gain or loss arising from acceptance of the order of `11,000 per unit.
(ii) Advice whether the company should accept this order for 120 units or not. 3+5
Solution:
(i) Computation of selling price of First Order for 40 units
a. Total Costs (As given above) `5,50,000
b. Number of units 40 units
c. Average cost per unit `13,750
d. Since profit is 12% on price, it is 12/88 on
cost
`1,875
e. Price Quoted (Cost+ Profit) `15,625
(ii) Computation of Time required for 120 units
No. of units Time required per unit Total time required Cumulative time
40 8,000 hrs÷40 units=200
hours
(given) 8,000 hours 8,000 hours
80 200 x90%=180 hours 80 units x 180 hours pu 14,400 hours
160 180x 90%=162 hours 160 units x 162 hours pu 25,920 hours
Time required for 120 units=Cumulative Time required for 162 units – Time required for first
40 units
=25,920-8,000
=17,920 hours
Cost Sheet for order of 120 units
Particulars Computation `
Direct Material (`2,00,000÷40) × 120 units 6,00,000
Direct Labour 17,920 hours×`20 per hour 3,58,400

Answer to PTP_Final_Syllabus 2012_Jun2014_Set 1
Academics Department, The Institute of Cost Accountants of India (Statutory Body under an Act of Parliament) Page 15
Variable Overheads 17,920 hours×`10 per hour 1,79,200
Special Tools-(Re-usable) Hence, Relevant Cost is Nil Nil
Fixed Overheads Idle Capacity – Not relevant Nil
Total Cost 11,37,600
Cost per unit `11,37,600÷120 9,480
Price offered 11,000
Hence, Profit per unit 1,520
Total profit from 120 units `1,520×120 units 1,82,400
Decision: The order should be accepted.
(b) Difference in operating speeds of machines may lead to higher WIP inventory. How does
a JIT system resolve this issue? 5
Answer:
At times, there may be huge differences between the operating speeds of different machines,
e.g. process I Machinery may produce 180 components per hour whereas process II Machinery
may finish only 135 units per hour. This difference in operating speeds affects cost in the following
manner:-
(a) Piling up of WIP Inventory: Work-in-process inventory builds up in front of the slowest
machines. In the above case, after four hours of work, there will be a WIP of 180
components. This is because, process I would have produced 180x4=720
components whereas process II would have finished only 135 x 4=540 units in the four-
hour period.
(b) Delayed Tracing of Defectives: Defective components or parts produced by an
upstream machine (e.g. Process I) may not be discovered until the next downstream
machine operator (e.g. Process II) finds them later. By that time, the upstream
machine may have created more defective parts, all of which must now be
destroyed or reworked.
In JIT philosophy, there are two ways to resolve the above problems:-
(i) Kanban Card: It is a notification card that a downstream machine sends to each
upstream machine that feeds it with parts, authorizing the production of just enough
components to fulfill the production requirements. This is also known as a ―pull‖
system, since these cards are initiated at the end of the production process, pulling
work authorizations through the production system. WIP cannot pile up since it can
be created only with kanban Authorization.
(ii) Working Cells: A Working Cell is a small cluster of machines, which can be run by a
single machine operator. The establishment of Working Cell has the following
advantages:-
(a) The individual machine takes each output part from machine to machine within
the cell, and thus there is no way for WIP to build up between machines.
(b) The operator can immediately identify defective output (Which otherwise is
difficult) for each machine of the cell. The smaller machines used in a machine
cell are generally much simpler than the large, automated machinery they
replace. Hence, Maintenance costs are reduced.
(c) It is much easier to reconfigure the production facility when it is necessary to
produce different products, avoiding the large expense of carefully repositioning
and aligning the equipments.
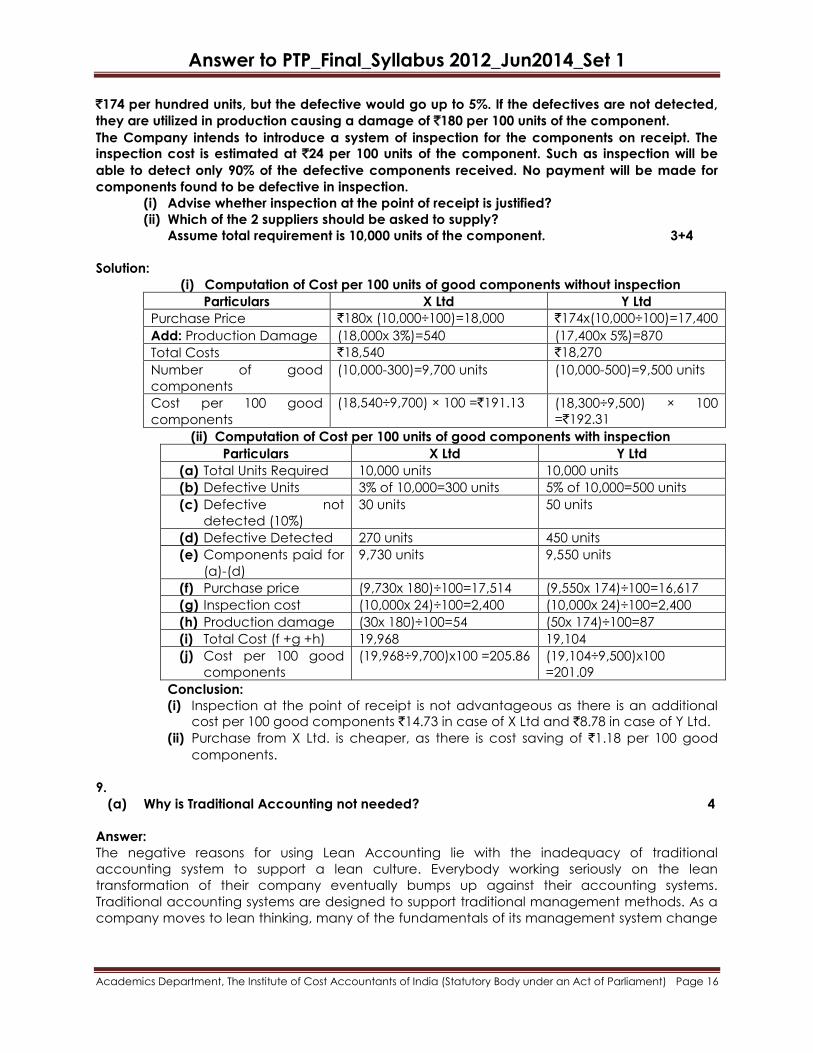
(c) A Company manufactures a single product, which requires two components. The
company purchases one of the components from two suppliers: X Ltd. and Y Ltd. The price
quoted by X Ltd is `180 per hundred units of the component and it is found that on an average
3% of the total receipt from this supplier is defective. The corresponding quotation from Y Ltd is
Answer to PTP_Final_Syllabus 2012_Jun2014_Set 1
Academics Department, The Institute of Cost Accountants of India (Statutory Body under an Act of Parliament) Page 16
`174 per hundred units, but the defective would go up to 5%. If the defectives are not detected,
they are utilized in production causing a damage of `180 per 100 units of the component.
The Company intends to introduce a system of inspection for the components on receipt. The
inspection cost is estimated at `24 per 100 units of the component. Such as inspection will be
able to detect only 90% of the defective components received. No payment will be made for
components found to be defective in inspection.
(i) Advise whether inspection at the point of receipt is justified?
(ii) Which of the 2 suppliers should be asked to supply?
Assume total requirement is 10,000 units of the component. 3+4
Solution:
(i) Computation of Cost per 100 units of good components without inspection
Particulars X Ltd Y Ltd
Purchase Price `180x (10,000÷100)=18,000 `174x(10,000÷100)=17,400
Add: Production Damage (18,000x 3%)=540 (17,400x 5%)=870
Total Costs `18,540 `18,270
Number of good
components
(10,000-300)=9,700 units (10,000-500)=9,500 units
Cost per 100 good
components
(18,540÷9,700) × 100 =`191.13 (18,300÷9,500) × 100
=`192.31
(ii) Computation of Cost per 100 units of good components with inspection
Particulars X Ltd Y Ltd
(a) Total Units Required 10,000 units 10,000 units
(b) Defective Units 3% of 10,000=300 units 5% of 10,000=500 units
(c) Defective not
detected (10%)
30 units 50 units
(d) Defective Detected 270 units 450 units
(e) Components paid for
(a)-(d)
9,730 units 9,550 units
(f) Purchase price (9,730x 180)÷100=17,514 (9,550x 174)÷100=16,617
(g) Inspection cost (10,000x 24)÷100=2,400 (10,000x 24)÷100=2,400
(h) Production damage (30x 180)÷100=54 (50x 174)÷100=87
(i) Total Cost (f +g +h) 19,968 19,104
(j) Cost per 100 good
components
(19,968÷9,700)x100 =205.86 (19,104÷9,500)x100
=201.09
Conclusion:
(i) Inspection at the point of receipt is not advantageous as there is an additional
cost per 100 good components `14.73 in case of X Ltd and `8.78 in case of Y Ltd.
(ii) Purchase from X Ltd. is cheaper, as there is cost saving of `1.18 per 100 good
components.
9.
(a) Why is Traditional Accounting not needed? 4
Answer:
The negative reasons for using Lean Accounting lie with the inadequacy of traditional
accounting system to support a lean culture. Everybody working seriously on the lean
transformation of their company eventually bumps up against their accounting systems.
Traditional accounting systems are designed to support traditional management methods. As a
company moves to lean thinking, many of the fundamentals of its management system change
Answer to PTP_Final_Syllabus 2012_Jun2014_Set 1
Academics Department, The Institute of Cost Accountants of India (Statutory Body under an Act of Parliament) Page 17
and traditional accounting control, and measurement methods become unsuitable. Some
example of this are:
Traditional Accounting systems are large, complex processes requiring a great deal
of non-value work. Lean companies are anxious to eliminate this kind of non-value
work.
They provide measurements and reports like labour efficiency and overhead
absorption that motivate large batch production and high inventory levels. These
measurements are suitable for mass production-style organizations but actively
harmful to companies with lean aspirations.
The traditional accounting systems have no good way to identify the financial
impact of the lean improvements taking place throughout the company. On the
contrary, the financial reports will often show that bad things are happening when
very good lean change is being made. One example of this is that traditional
reporting shows a reduction in profitability when inventory is reduced. Lean
companies always make significant inventory reductions and the accounting reports
show negative results.
Traditional accounting reports use technical words and methods like ―overhead
absorption‖, ―gross margin‖, and many others. These reports are not widely
understood within most organizations. This may be acceptable when the financial
reports are restricted to senior managers, but a lean company will seek to empower
the entire work force. Clear and understandable reporting is require so that people
can readily use the reports for improvement and decision making.
Traditional companies use standard product (or service) costs which can be
misleading when making decisions related to quoting, profitability, make/buy,
sourcing, product rationalization, and so forth. Lean Companies seek to have a
clearer understanding of the true costs associated with their processes and value
streams.
There are of course traditional methods for overcoming some of these issues and
problems. Indeed, few of the methods of lean accounting are new ideas. They are
mostly adoptions of methods that have been used for many years, and have been
codified into a lean management system designed to support the needs of lean thinking
organizations.
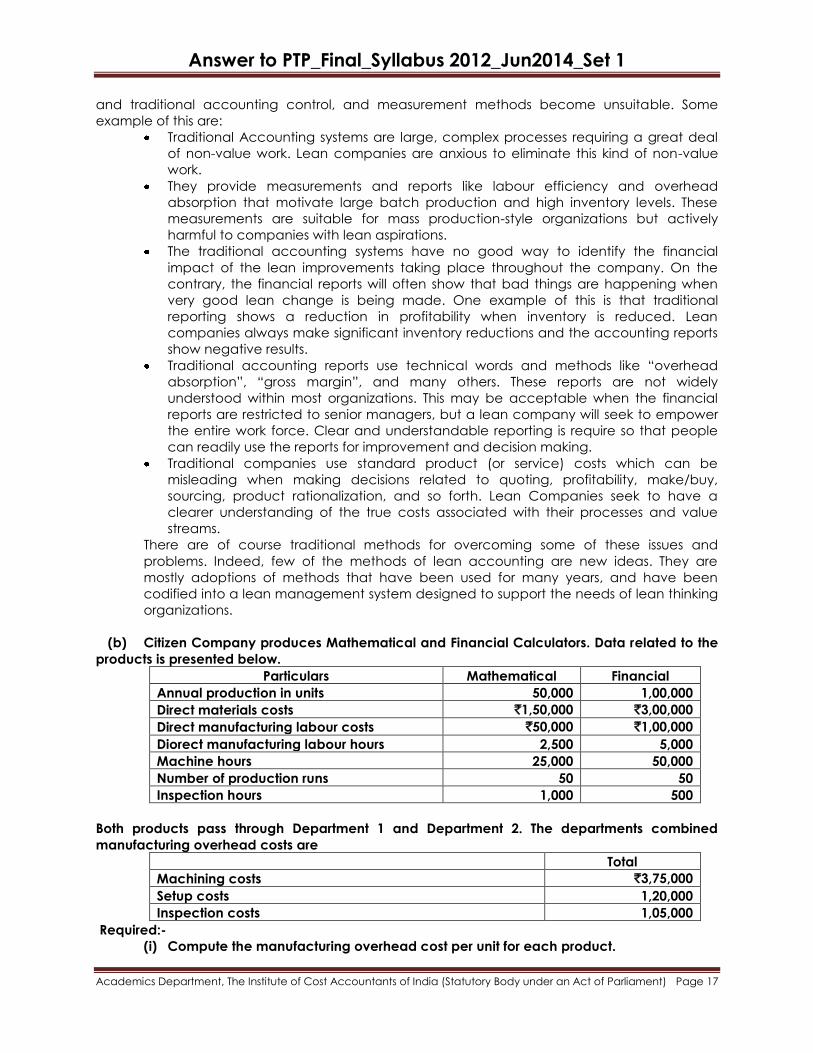
(b) Citizen Company produces Mathematical and Financial Calculators. Data related to the
products is presented below.
Particulars Mathematical Financial
Annual production in units 50,000 1,00,000
Direct materials costs `1,50,000 `3,00,000
Direct manufacturing labour costs `50,000 `1,00,000
Diorect manufacturing labour hours 2,500 5,000
Machine hours 25,000 50,000
Number of production runs 50 50
Inspection hours 1,000 500
Both products pass through Department 1 and Department 2. The departments combined
manufacturing overhead costs are
Total
Machining costs `3,75,000
Setup costs 1,20,000
Inspection costs 1,05,000
Required:-
(i) Compute the manufacturing overhead cost per unit for each product.
Answer to PTP_Final_Syllabus 2012_Jun2014_Set 1
Academics Department, The Institute of Cost Accountants of India (Statutory Body under an Act of Parliament) Page 18
(ii) Compute the manufacturing cost per unit for each product. 3+3
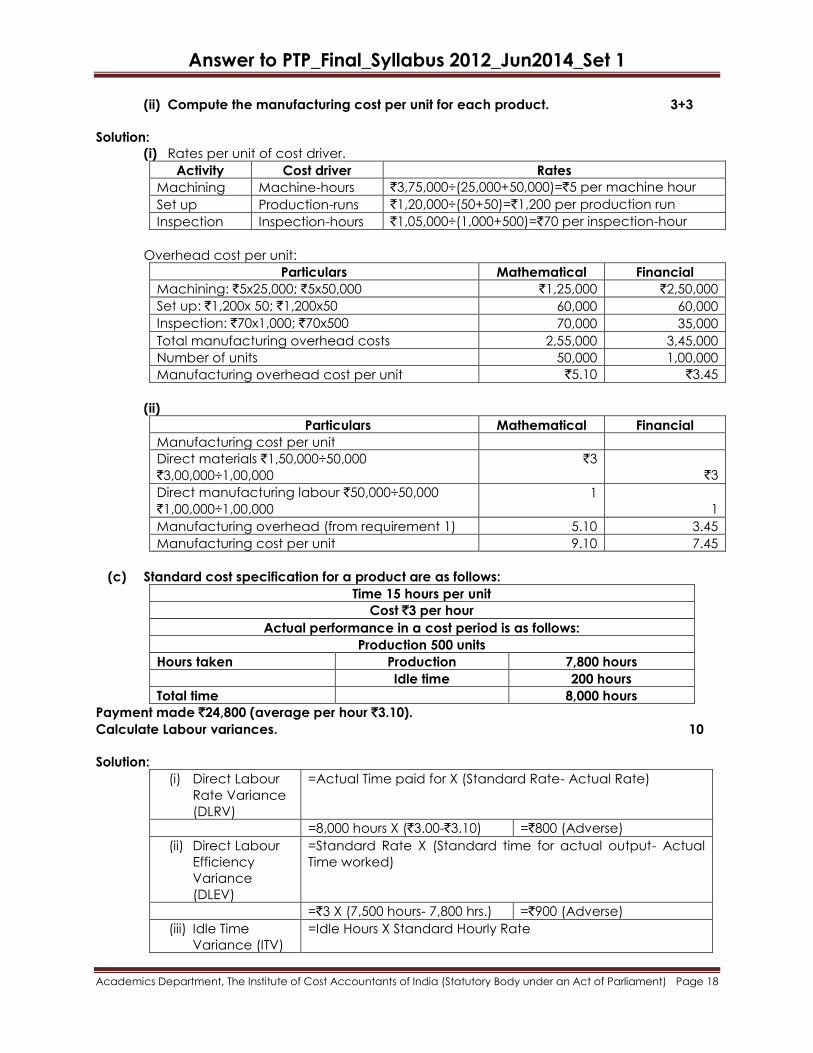
Solution:
(i) Rates per unit of cost driver.
Activity Cost driver Rates
Machining Machine-hours `3,75,000÷(25,000+50,000)=`5 per machine hour
Set up Production-runs `1,20,000÷(50+50)=`1,200 per production run
Inspection Inspection-hours `1,05,000÷(1,000+500)=`70 per inspection-hour
Overhead cost per unit:
Particulars Mathematical Financial
Machining: `5x25,000; `5x50,000 `1,25,000 `2,50,000
Set up: `1,200x 50; `1,200x50 60,000 60,000
Inspection: `70x1,000; `70x500 70,000 35,000
Total manufacturing overhead costs 2,55,000 3,45,000
Number of units 50,000 1,00,000
Manufacturing overhead cost per unit `5.10 `3.45
(ii)
Particulars Mathematical Financial
Manufacturing cost per unit
Direct materials `1,50,000÷50,000
`3,00,000÷1,00,000
`3
`3
Direct manufacturing labour `50,000÷50,000
`1,00,000÷1,00,000
1
1
Manufacturing overhead (from requirement 1) 5.10 3.45
Manufacturing cost per unit 9.10 7.45
(c) Standard cost specification for a product are as follows:
Time 15 hours per unit
Cost `3 per hour
Actual performance in a cost period is as follows:
Production 500 units
Hours taken Production 7,800 hours
Idle time 200 hours
Total time 8,000 hours
Payment made `24,800 (average per hour `3.10).
Calculate Labour variances. 10
Solution:
(i) Direct Labour
Rate Variance
(DLRV)
=Actual Time paid for X (Standard Rate- Actual Rate)
=8,000 hours X (`3.00-`3.10) =`800 (Adverse)
(ii) Direct Labour
Efficiency
Variance
(DLEV)
=Standard Rate X (Standard time for actual output- Actual
Time worked)
=`3 X (7,500 hours- 7,800 hrs.) =`900 (Adverse)
(iii) Idle Time
Variance (ITV)
=Idle Hours X Standard Hourly Rate
Answer to PTP_Final_Syllabus 2012_Jun2014_Set 1
Academics Department, The Institute of Cost Accountants of India (Statutory Body under an Act of Parliament) Page 19
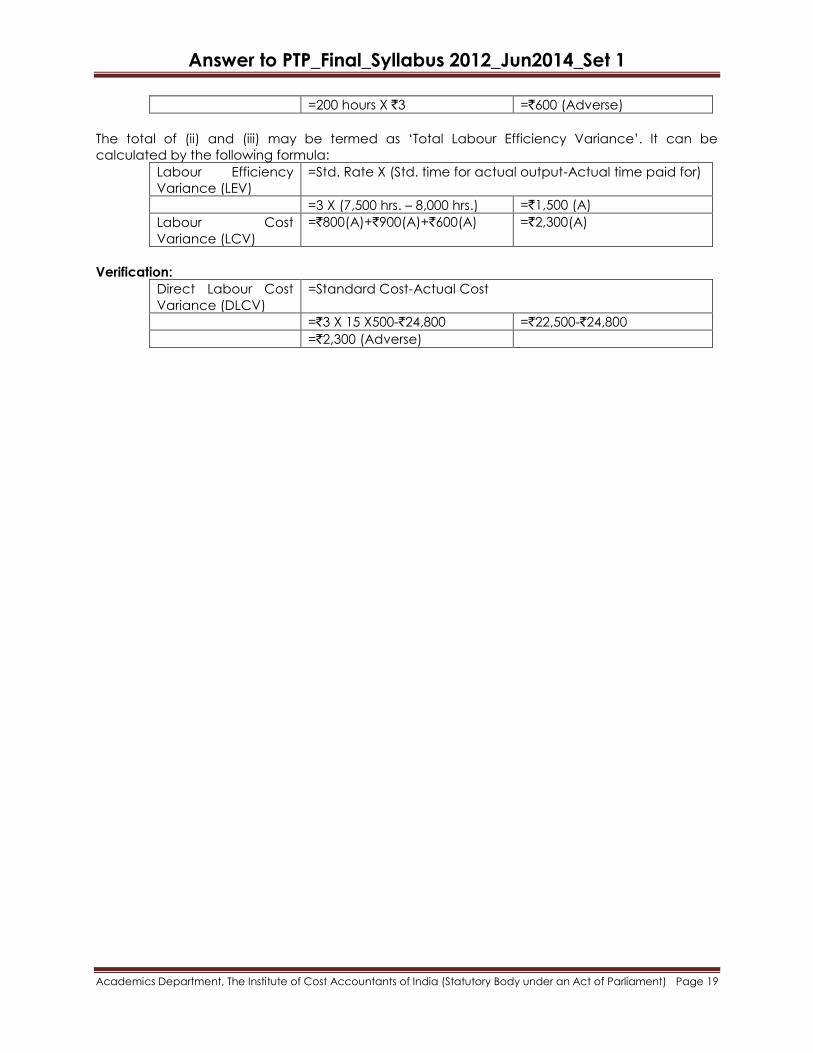
=200 hours X `3 =`600 (Adverse)
The total of (ii) and (iii) may be termed as ‗Total Labour Efficiency Variance‘. It can be
calculated by the following formula:
Labour Efficiency
Variance (LEV)
=Std. Rate X (Std. time for actual output-Actual time paid for)
=3 X (7,500 hrs. – 8,000 hrs.) =`1,500 (A)
Labour Cost
Variance (LCV)
=`800(A)+`900(A)+`600(A) =`2,300(A)
Verification:
Direct Labour Cost
Variance (DLCV)
=Standard Cost-Actual Cost
=`3 X 15 X500-`24,800 =`22,500-`24,800
=`2,300 (Adverse)