Embed Size (px)
Citation preview
Answer to PTP_Intermediate_Syllabus 2012_Dec2014_Set 1
Academics Department, The Institute of Cost Accountants of India (Statutory Body under an Act of Parliament) Page 1
Paper – 10: Cost & Management Accountancy
Time Allowed: 3 Hours Full Marks:100
QUESTION 1, which is compulsory.
Section-A has three questions, Attempt any two.
Section-B has three questions, Attempt any two.
Section-C has four questions, Attempt any three.
(Working Notes should form part of the answer.)
Question.1
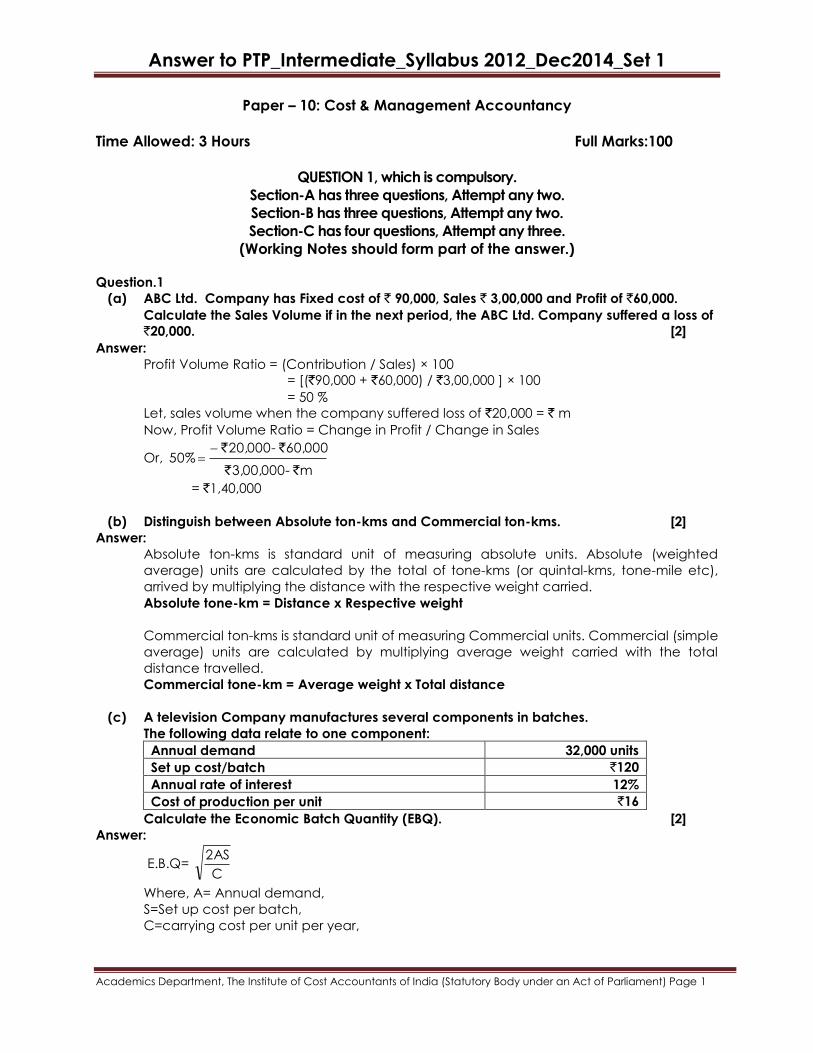
(a) ABC Ltd. Company has Fixed cost of ` 90,000, Sales ` 3,00,000 and Profit of `60,000.
Calculate the Sales Volume if in the next period, the ABC Ltd. Company suffered a loss of
`20,000. [2]
Answer:
Profit Volume Ratio = (Contribution / Sales) × 100
= [(`90,000 + `60,000) / `3,00,000 ] × 100
= 50 %
Let, sales volume when the company suffered loss of `20,000 = ` m
Now, Profit Volume Ratio = Change in Profit / Change in Sales
Or, m - 3,00,000
60,000 - 20,000 50%
``
``
= `1,40,000
(b) Distinguish between Absolute ton-kms and Commercial ton-kms. [2]
Answer:
Absolute ton-kms is standard unit of measuring absolute units. Absolute (weighted
average) units are calculated by the total of tone-kms (or quintal-kms, tone-mile etc),
arrived by multiplying the distance with the respective weight carried.
Absolute tone-km = Distance x Respective weight
Commercial ton-kms is standard unit of measuring Commercial units. Commercial (simple
average) units are calculated by multiplying average weight carried with the total
distance travelled.
Commercial tone-km = Average weight x Total distance
(c) A television Company manufactures several components in batches.
The following data relate to one component:
Annual demand 32,000 units
Set up cost/batch `120
Annual rate of interest 12%
Cost of production per unit `16
Calculate the Economic Batch Quantity (EBQ). [2]
Answer:
E.B.Q= C
2AS
Where, A= Annual demand,
S=Set up cost per batch,
C=carrying cost per unit per year,
Answer to PTP_Intermediate_Syllabus 2012_Dec2014_Set 1
Academics Department, The Institute of Cost Accountants of India (Statutory Body under an Act of Parliament) Page 2
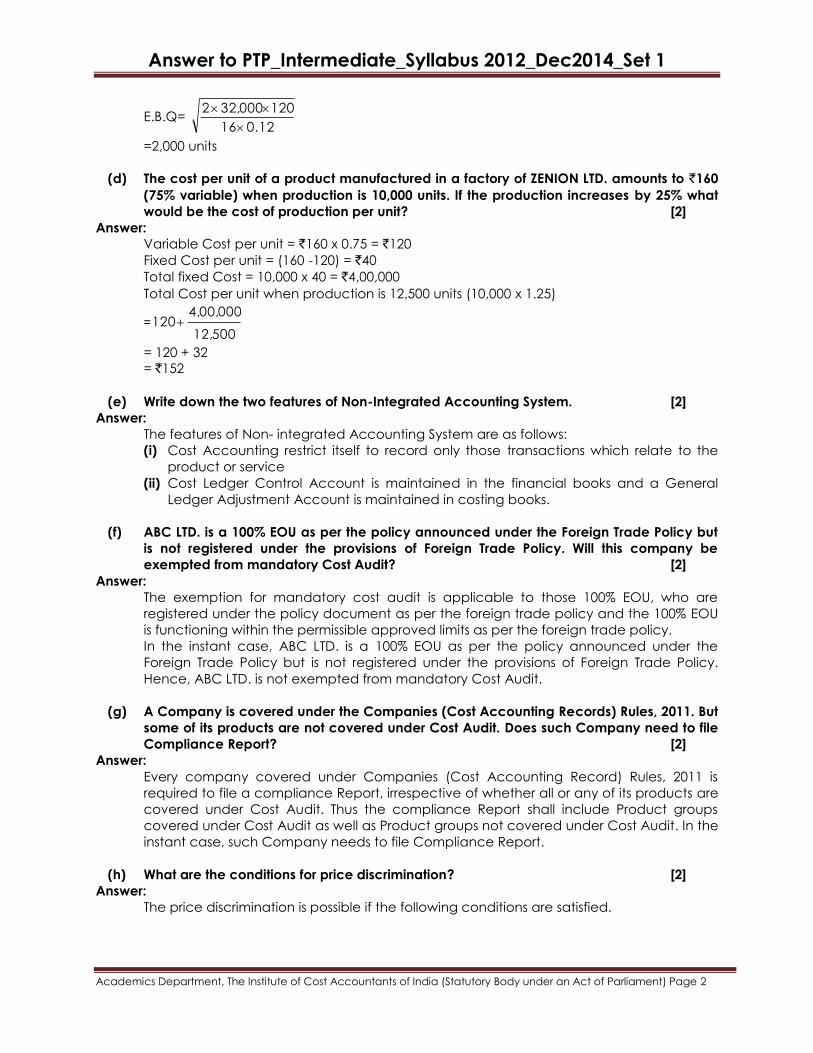
E.B.Q= 0.1216
12032,0002
=2,000 units
(d) The cost per unit of a product manufactured in a factory of ZENION LTD. amounts to `160
(75% variable) when production is 10,000 units. If the production increases by 25% what
would be the cost of production per unit? [2]
Answer:
Variable Cost per unit = `160 x 0.75 = `120
Fixed Cost per unit = (160 -120) = `40
Total fixed Cost = 10,000 x 40 = `4,00,000
Total Cost per unit when production is 12,500 units (10,000 x 1.25)
=12,500
4,00,000 120
= 120 + 32
= `152
(e) Write down the two features of Non-Integrated Accounting System. [2]
Answer:
The features of Non- integrated Accounting System are as follows:
(i) Cost Accounting restrict itself to record only those transactions which relate to the
product or service
(ii) Cost Ledger Control Account is maintained in the financial books and a General
Ledger Adjustment Account is maintained in costing books.
(f) ABC LTD. is a 100% EOU as per the policy announced under the Foreign Trade Policy but
is not registered under the provisions of Foreign Trade Policy. Will this company be
exempted from mandatory Cost Audit? [2]
Answer:
The exemption for mandatory cost audit is applicable to those 100% EOU, who are
registered under the policy document as per the foreign trade policy and the 100% EOU
is functioning within the permissible approved limits as per the foreign trade policy.
In the instant case, ABC LTD. is a 100% EOU as per the policy announced under the
Foreign Trade Policy but is not registered under the provisions of Foreign Trade Policy.
Hence, ABC LTD. is not exempted from mandatory Cost Audit.
(g) A Company is covered under the Companies (Cost Accounting Records) Rules, 2011. But
some of its products are not covered under Cost Audit. Does such Company need to file
Compliance Report? [2]
Answer:
Every company covered under Companies (Cost Accounting Record) Rules, 2011 is
required to file a compliance Report, irrespective of whether all or any of its products are
covered under Cost Audit. Thus the compliance Report shall include Product groups
covered under Cost Audit as well as Product groups not covered under Cost Audit. In the
instant case, such Company needs to file Compliance Report.
(h) What are the conditions for price discrimination? [2]
Answer:
The price discrimination is possible if the following conditions are satisfied.
Answer to PTP_Intermediate_Syllabus 2012_Dec2014_Set 1
Academics Department, The Institute of Cost Accountants of India (Statutory Body under an Act of Parliament) Page 3
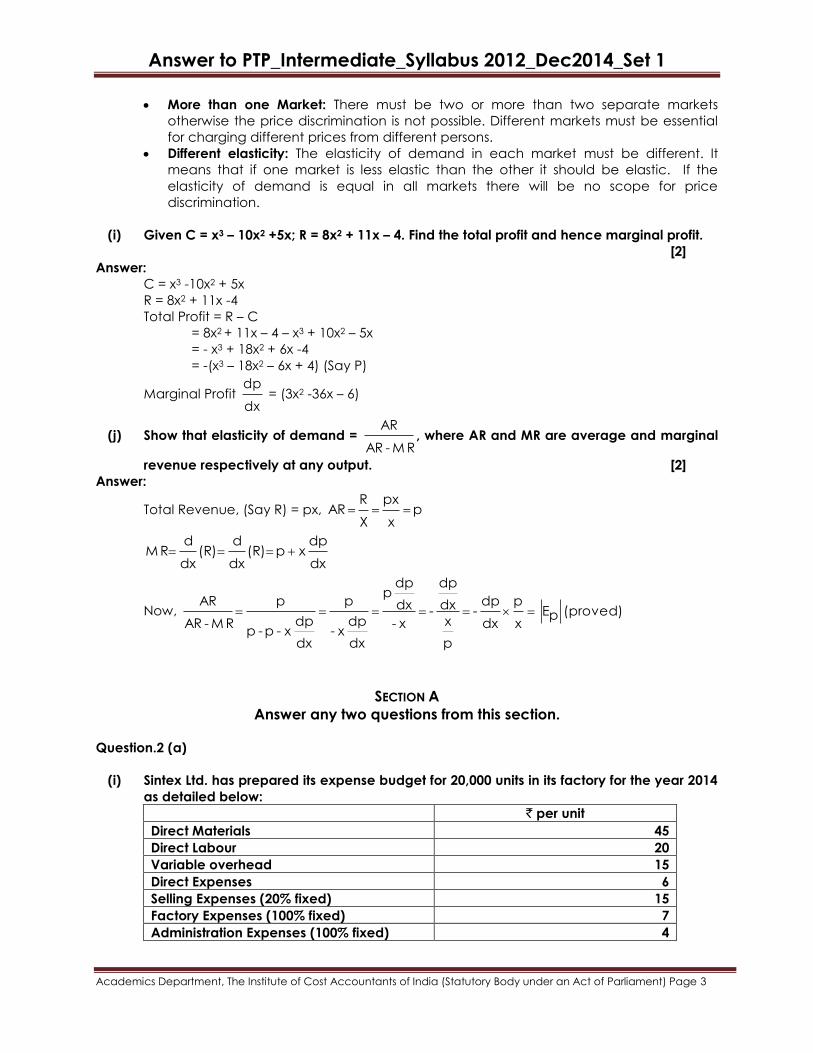
More than one Market: There must be two or more than two separate markets
otherwise the price discrimination is not possible. Different markets must be essential
for charging different prices from different persons.
Different elasticity: The elasticity of demand in each market must be different. It
means that if one market is less elastic than the other it should be elastic. If the
elasticity of demand is equal in all markets there will be no scope for price
discrimination.
(i) Given C = x3 – 10x2 +5x; R = 8x2 + 11x – 4. Find the total profit and hence marginal profit.
[2]
Answer:
C = x3 -10x2 + 5x
R = 8x2 + 11x -4
Total Profit = R – C
= 8x2 + 11x – 4 – x3 + 10x2 – 5x
= - x3 + 18x2 + 6x -4
= -(x3 – 18x2 – 6x + 4) (Say P)
Marginal Profit dx
dp = (3x2 -36x – 6)
(j) Show that elasticity of demand = M R - AR
AR, where AR and MR are average and marginal
revenue respectively at any output. [2]
Answer:
Total Revenue, (Say R) = px, p x
px
X
R AR
dx
dp x p (R)
dx
d (R)
dx
d M R
Now, (proved) pE x
p
dx
dp -
p
x
dx
dp
- x-
dx
dpp
dx
dpx-
p
dx
dp x - p- p
p
M R - AR
AR
SECTION A
Answer any two questions from this section.
Question.2 (a)
(i) Sintex Ltd. has prepared its expense budget for 20,000 units in its factory for the year 2014
as detailed below:
` per unit
Direct Materials 45
Direct Labour 20
Variable overhead 15
Direct Expenses 6
Selling Expenses (20% fixed) 15
Factory Expenses (100% fixed) 7
Administration Expenses (100% fixed) 4
Answer to PTP_Intermediate_Syllabus 2012_Dec2014_Set 1
Academics Department, The Institute of Cost Accountants of India (Statutory Body under an Act of Parliament) Page 4
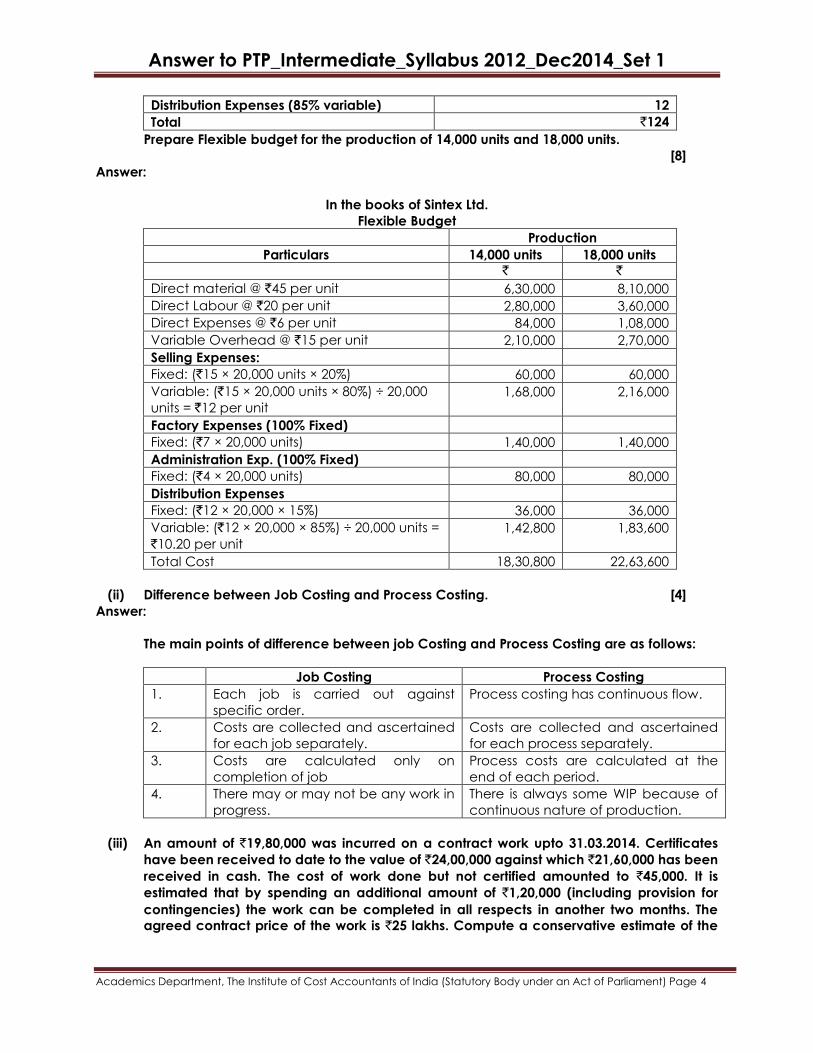
Distribution Expenses (85% variable) 12
Total `124
Prepare Flexible budget for the production of 14,000 units and 18,000 units.
[8]
Answer:
In the books of Sintex Ltd.
Flexible Budget
Production
Particulars 14,000 units 18,000 units
` `
Direct material @ `45 per unit 6,30,000 8,10,000
Direct Labour @ `20 per unit 2,80,000 3,60,000
Direct Expenses @ `6 per unit 84,000 1,08,000
Variable Overhead @ `15 per unit 2,10,000 2,70,000
Selling Expenses:
Fixed: (`15 × 20,000 units × 20%) 60,000 60,000
Variable: (`15 × 20,000 units × 80%) ÷ 20,000
units = `12 per unit
1,68,000 2,16,000
Factory Expenses (100% Fixed)
Fixed: (`7 × 20,000 units) 1,40,000 1,40,000
Administration Exp. (100% Fixed)
Fixed: (`4 × 20,000 units) 80,000 80,000
Distribution Expenses
Fixed: (`12 × 20,000 × 15%) 36,000 36,000
Variable: (`12 × 20,000 × 85%) ÷ 20,000 units =
`10.20 per unit
1,42,800 1,83,600
Total Cost 18,30,800 22,63,600
(ii) Difference between Job Costing and Process Costing. [4]
Answer:
The main points of difference between job Costing and Process Costing are as follows:
Job Costing Process Costing
1. Each job is carried out against
specific order.
Process costing has continuous flow.
2. Costs are collected and ascertained
for each job separately.
Costs are collected and ascertained
for each process separately.
3. Costs are calculated only on
completion of job
Process costs are calculated at the
end of each period.
4. There may or may not be any work in
progress.
There is always some WIP because of
continuous nature of production.
(iii) An amount of `19,80,000 was incurred on a contract work upto 31.03.2014. Certificates
have been received to date to the value of `24,00,000 against which `21,60,000 has been
received in cash. The cost of work done but not certified amounted to `45,000. It is
estimated that by spending an additional amount of `1,20,000 (including provision for
contingencies) the work can be completed in all respects in another two months. The
agreed contract price of the work is `25 lakhs. Compute a conservative estimate of the
Answer to PTP_Intermediate_Syllabus 2012_Dec2014_Set 1
Academics Department, The Institute of Cost Accountants of India (Statutory Body under an Act of Parliament) Page 5
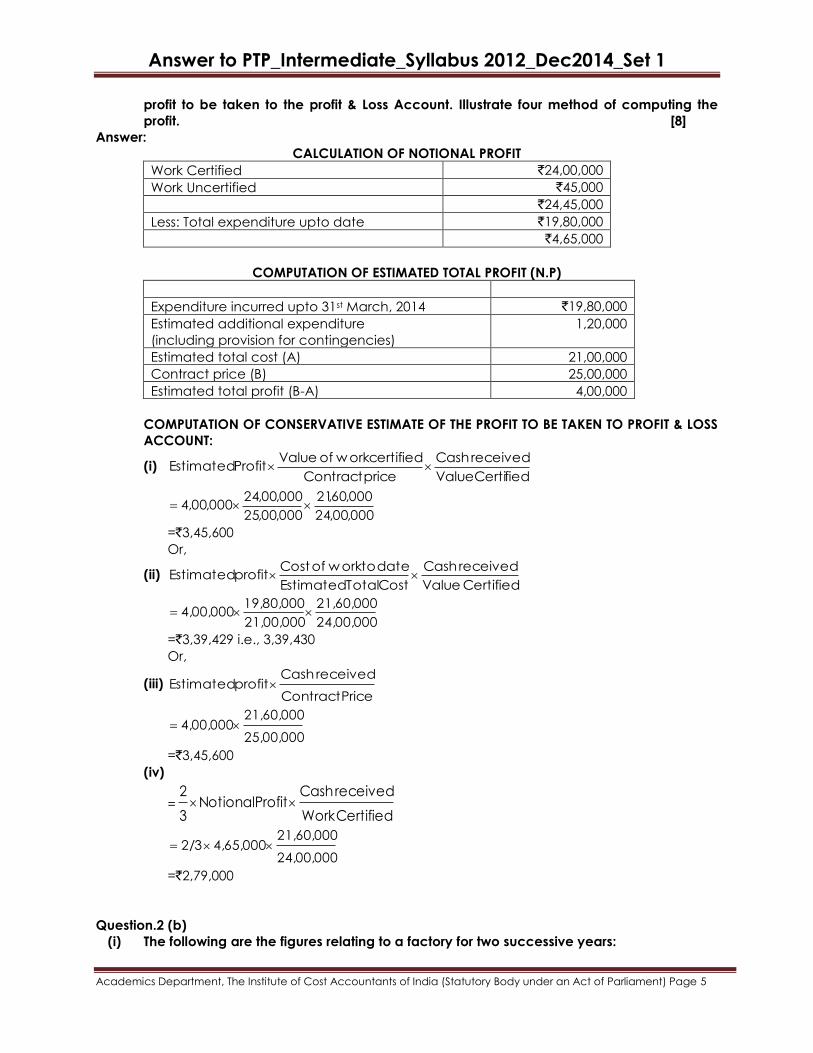
profit to be taken to the profit & Loss Account. Illustrate four method of computing the
profit. [8]
Answer:
CALCULATION OF NOTIONAL PROFIT
Work Certified `24,00,000
Work Uncertified `45,000
`24,45,000
Less: Total expenditure upto date `19,80,000
`4,65,000
COMPUTATION OF ESTIMATED TOTAL PROFIT (N.P)
Expenditure incurred upto 31st March, 2014 `19,80,000
Estimated additional expenditure
(including provision for contingencies)
1,20,000
Estimated total cost (A) 21,00,000
Contract price (B) 25,00,000
Estimated total profit (B-A) 4,00,000
COMPUTATION OF CONSERVATIVE ESTIMATE OF THE PROFIT TO BE TAKEN TO PROFIT & LOSS
ACCOUNT:
(i) fiedValueCerti
received Cash
price Contract
certified w orkof Value Profit Estimated
000,00,24
000,60,21
000,00,25
000,00,24000,00,4
=`3,45,600
Or,
(ii) Certified Value
received Cash
Cost Total Estimated
date to workof Costprofit Estimated
24,00,000
21,60,000
21,00,000
19,80,0004,00,000
=`3,39,429 i.e., 3,39,430
Or,
(iii) Price Contract
received Cashprofit Estimated
25,00,000
21,60,0004,00,000
=`3,45,600
(iv)
=Certified Work
received CashProfit Notional
3
2
24,00,000
21,60,0004,65,0002/3
=`2,79,000
Question.2 (b)
(i) The following are the figures relating to a factory for two successive years:
Answer to PTP_Intermediate_Syllabus 2012_Dec2014_Set 1
Academics Department, The Institute of Cost Accountants of India (Statutory Body under an Act of Parliament) Page 6
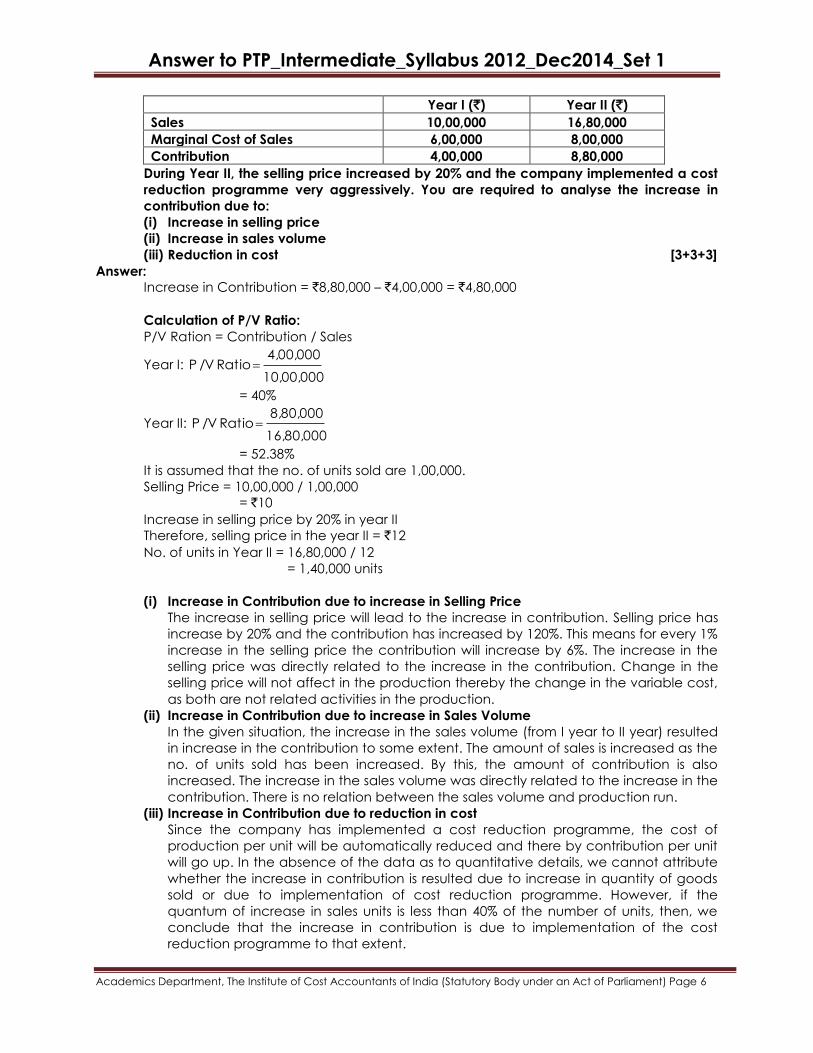
Year I (`) Year II (`)
Sales 10,00,000 16,80,000
Marginal Cost of Sales 6,00,000 8,00,000
Contribution 4,00,000 8,80,000
During Year II, the selling price increased by 20% and the company implemented a cost
reduction programme very aggressively. You are required to analyse the increase in
contribution due to:
(i) Increase in selling price
(ii) Increase in sales volume
(iii) Reduction in cost [3+3+3]
Answer:
Increase in Contribution = `8,80,000 – `4,00,000 = `4,80,000
Calculation of P/V Ratio:
P/V Ration = Contribution / Sales
Year I: 10,00,000
4,00,000 Ratio /V P
= 40%
Year II: 16,80,000
8,80,000 Ratio /V P
= 52.38%
It is assumed that the no. of units sold are 1,00,000.
Selling Price = 10,00,000 / 1,00,000
= `10
Increase in selling price by 20% in year II
Therefore, selling price in the year II = `12
No. of units in Year II = 16,80,000 / 12
= 1,40,000 units
(i) Increase in Contribution due to increase in Selling Price
The increase in selling price will lead to the increase in contribution. Selling price has
increase by 20% and the contribution has increased by 120%. This means for every 1%
increase in the selling price the contribution will increase by 6%. The increase in the
selling price was directly related to the increase in the contribution. Change in the
selling price will not affect in the production thereby the change in the variable cost,
as both are not related activities in the production.
(ii) Increase in Contribution due to increase in Sales Volume
In the given situation, the increase in the sales volume (from I year to II year) resulted
in increase in the contribution to some extent. The amount of sales is increased as the
no. of units sold has been increased. By this, the amount of contribution is also
increased. The increase in the sales volume was directly related to the increase in the
contribution. There is no relation between the sales volume and production run.
(iii) Increase in Contribution due to reduction in cost
Since the company has implemented a cost reduction programme, the cost of
production per unit will be automatically reduced and there by contribution per unit
will go up. In the absence of the data as to quantitative details, we cannot attribute
whether the increase in contribution is resulted due to increase in quantity of goods
sold or due to implementation of cost reduction programme. However, if the
quantum of increase in sales units is less than 40% of the number of units, then, we
conclude that the increase in contribution is due to implementation of the cost
reduction programme to that extent.
Answer to PTP_Intermediate_Syllabus 2012_Dec2014_Set 1
Academics Department, The Institute of Cost Accountants of India (Statutory Body under an Act of Parliament) Page 7
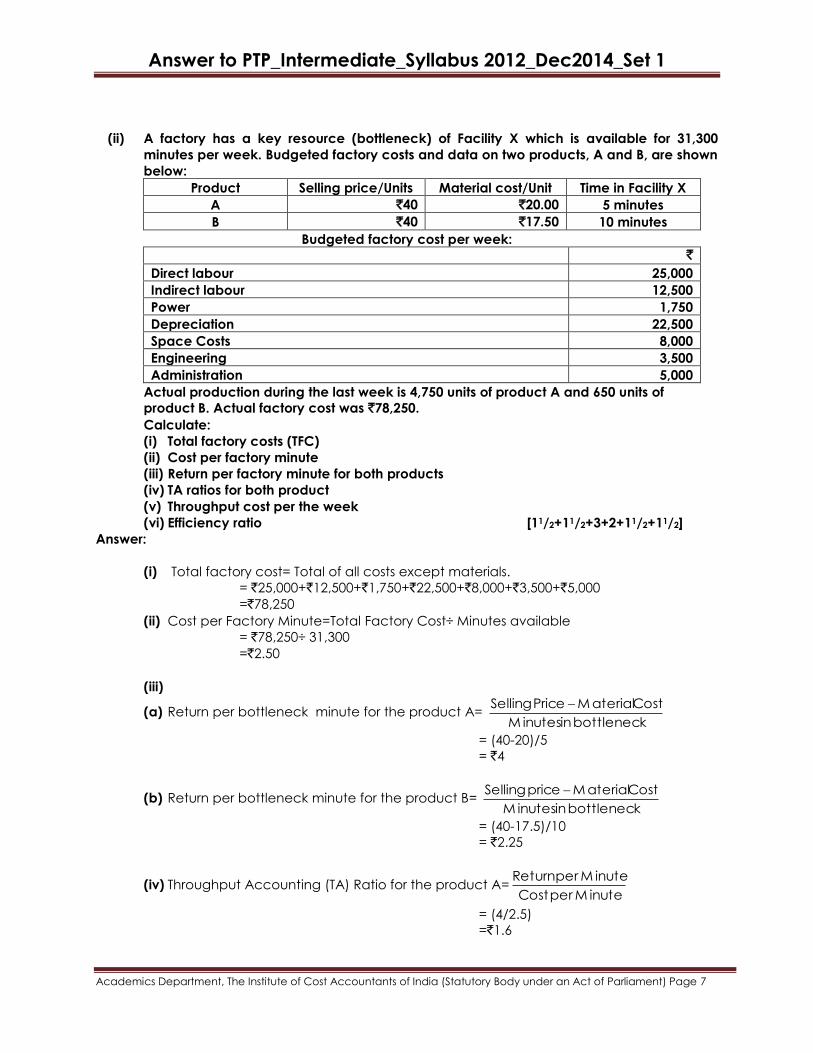
(ii) A factory has a key resource (bottleneck) of Facility X which is available for 31,300
minutes per week. Budgeted factory costs and data on two products, A and B, are shown
below:
Product Selling price/Units Material cost/Unit Time in Facility X
A `40 `20.00 5 minutes
B `40 `17.50 10 minutes
Budgeted factory cost per week:
`
Direct labour 25,000
Indirect labour 12,500
Power 1,750
Depreciation 22,500
Space Costs 8,000
Engineering 3,500
Administration 5,000
Actual production during the last week is 4,750 units of product A and 650 units of
product B. Actual factory cost was `78,250.
Calculate:
(i) Total factory costs (TFC)
(ii) Cost per factory minute
(iii) Return per factory minute for both products
(iv) TA ratios for both product
(v) Throughput cost per the week
(vi) Efficiency ratio [11/2+11/2+3+2+11/2+11/2]
Answer:
(i) Total factory cost= Total of all costs except materials.
= `25,000+`12,500+`1,750+`22,500+`8,000+`3,500+`5,000
=`78,250
(ii) Cost per Factory Minute=Total Factory Cost÷ Minutes available
= `78,250÷ 31,300
=`2.50
(iii)
(a) Return per bottleneck minute for the product A= bottleneck in M inutes
Cost M aterialPrice Selling
= (40-20)/5
= `4
(b) Return per bottleneck minute for the product B= bottleneck in M inutes
Cost M aterialprice Selling
= (40-17.5)/10
= `2.25
(iv) Throughput Accounting (TA) Ratio for the product A=M inute per Cost
M inute per Return
= (4/2.5)
=`1.6
Answer to PTP_Intermediate_Syllabus 2012_Dec2014_Set 1
Academics Department, The Institute of Cost Accountants of India (Statutory Body under an Act of Parliament) Page 8
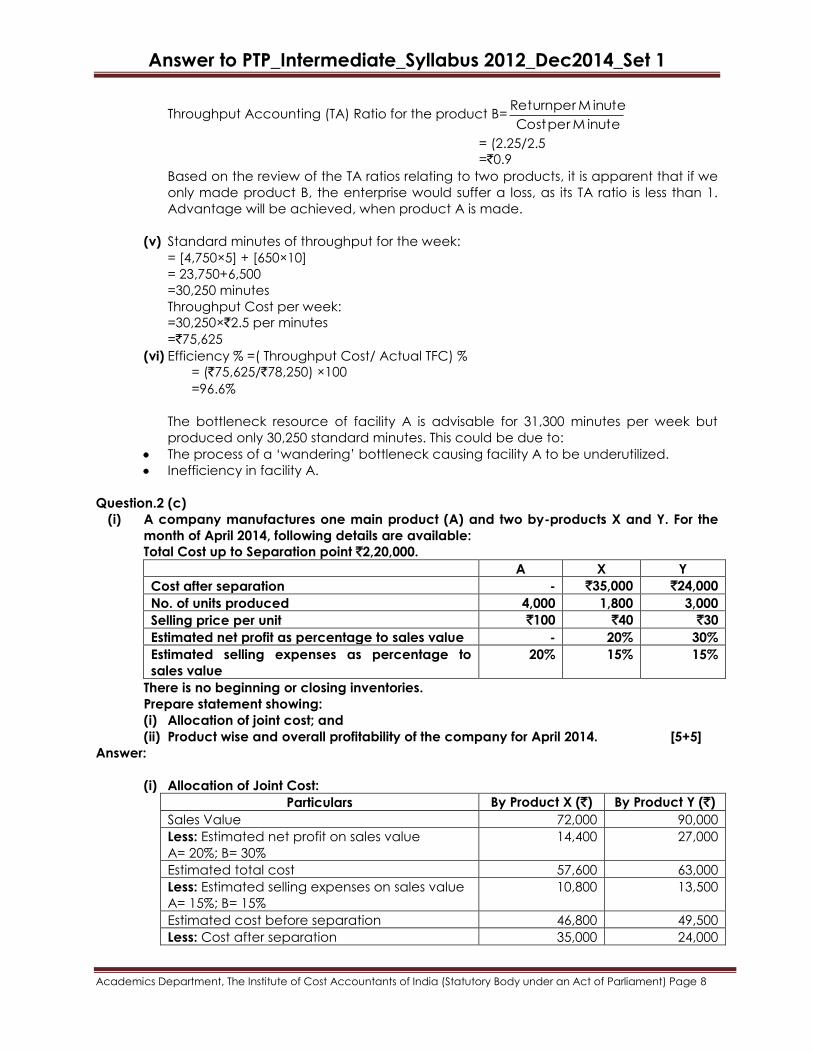
Throughput Accounting (TA) Ratio for the product B=M inute per Cost
M inute per Return
= (2.25/2.5
=`0.9
Based on the review of the TA ratios relating to two products, it is apparent that if we
only made product B, the enterprise would suffer a loss, as its TA ratio is less than 1.
Advantage will be achieved, when product A is made.
(v) Standard minutes of throughput for the week:
= [4,750×5] + [650×10]
= 23,750+6,500
=30,250 minutes
Throughput Cost per week:
=30,250×`2.5 per minutes
=`75,625
(vi) Efficiency % =( Throughput Cost/ Actual TFC) %
= (`75,625/`78,250) ×100
=96.6%
The bottleneck resource of facility A is advisable for 31,300 minutes per week but
produced only 30,250 standard minutes. This could be due to:
The process of a „wandering‟ bottleneck causing facility A to be underutilized.
Inefficiency in facility A.
Question.2 (c)
(i) A company manufactures one main product (A) and two by-products X and Y. For the
month of April 2014, following details are available:
Total Cost up to Separation point `2,20,000.
A X Y
Cost after separation - `35,000 `24,000
No. of units produced 4,000 1,800 3,000
Selling price per unit `100 `40 `30
Estimated net profit as percentage to sales value - 20% 30%
Estimated selling expenses as percentage to
sales value
20% 15% 15%
There is no beginning or closing inventories.
Prepare statement showing:
(i) Allocation of joint cost; and
(ii) Product wise and overall profitability of the company for April 2014. [5+5]
Answer:
(i) Allocation of Joint Cost:
Particulars By Product X (`) By Product Y (`)
Sales Value 72,000 90,000
Less: Estimated net profit on sales value
A= 20%; B= 30%
14,400 27,000
Estimated total cost 57,600 63,000
Less: Estimated selling expenses on sales value
A= 15%; B= 15%
10,800 13,500
Estimated cost before separation 46,800 49,500
Less: Cost after separation 35,000 24,000
Answer to PTP_Intermediate_Syllabus 2012_Dec2014_Set 1
Academics Department, The Institute of Cost Accountants of India (Statutory Body under an Act of Parliament) Page 9
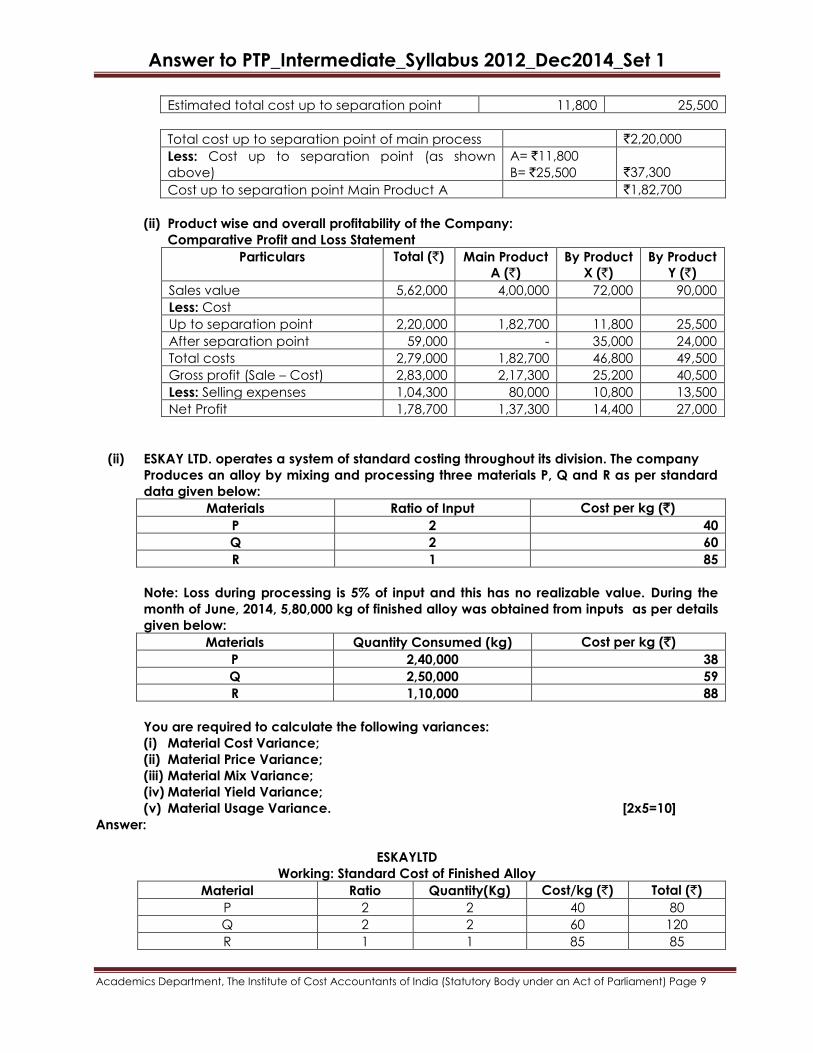
Estimated total cost up to separation point 11,800 25,500
Total cost up to separation point of main process `2,20,000
Less: Cost up to separation point (as shown
above)
A= `11,800
B= `25,500
`37,300
Cost up to separation point Main Product A `1,82,700
(ii) Product wise and overall profitability of the Company:
Comparative Profit and Loss Statement
Particulars Total (`) Main Product
A (`)
By Product
X (`)
By Product
Y (`)
Sales value 5,62,000 4,00,000 72,000 90,000
Less: Cost
Up to separation point 2,20,000 1,82,700 11,800 25,500
After separation point 59,000 - 35,000 24,000
Total costs 2,79,000 1,82,700 46,800 49,500
Gross profit (Sale – Cost) 2,83,000 2,17,300 25,200 40,500
Less: Selling expenses 1,04,300 80,000 10,800 13,500
Net Profit 1,78,700 1,37,300 14,400 27,000
(ii) ESKAY LTD. operates a system of standard costing throughout its division. The company
Produces an alloy by mixing and processing three materials P, Q and R as per standard
data given below:
Materials Ratio of Input Cost per kg (`)
P 2 40
Q 2 60
R 1 85
Note: Loss during processing is 5% of input and this has no realizable value. During the
month of June, 2014, 5,80,000 kg of finished alloy was obtained from inputs as per details
given below:
Materials Quantity Consumed (kg) Cost per kg (`)
P 2,40,000 38
Q 2,50,000 59
R 1,10,000 88
You are required to calculate the following variances:
(i) Material Cost Variance;
(ii) Material Price Variance;
(iii) Material Mix Variance;
(iv) Material Yield Variance;
(v) Material Usage Variance. [2x5=10]
Answer:
ESKAYLTD
Working: Standard Cost of Finished Alloy
Material Ratio Quantity(Kg) Cost/kg (`) Total (`)
P 2 2 40 80
Q 2 2 60 120
R 1 1 85 85
Answer to PTP_Intermediate_Syllabus 2012_Dec2014_Set 1
Academics Department, The Institute of Cost Accountants of India (Statutory Body under an Act of Parliament) Page 10
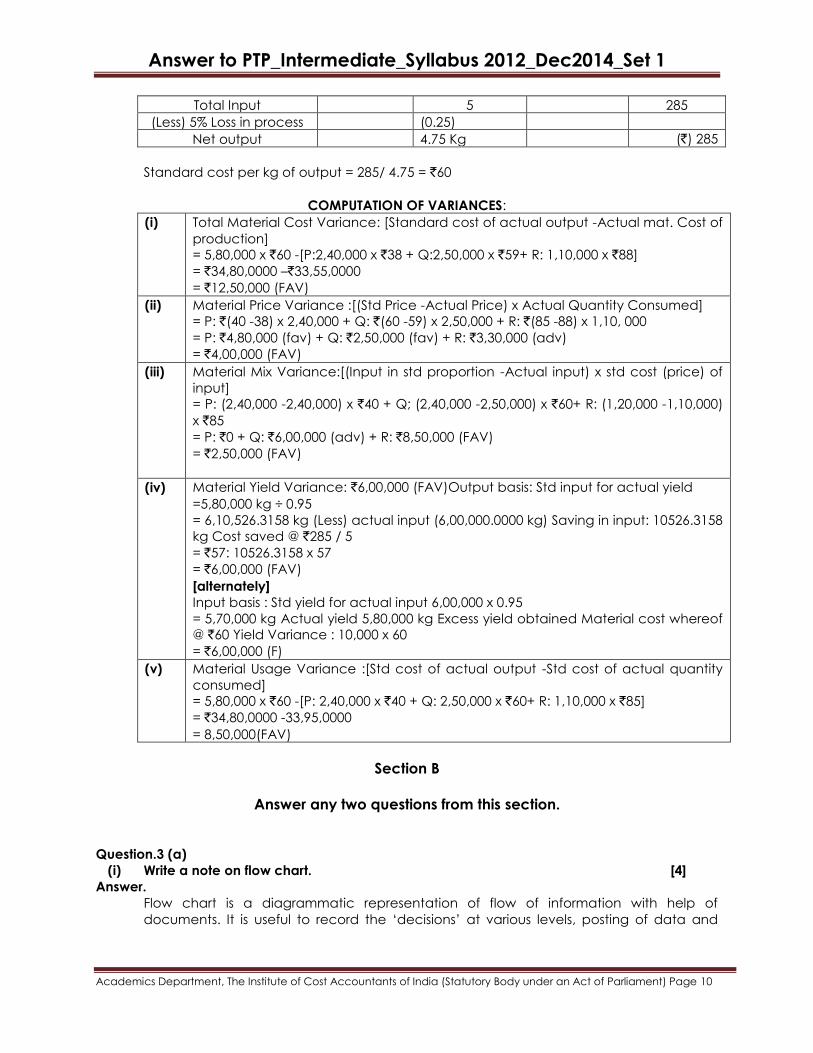
Total Input 5 285
(Less) 5% Loss in process (0.25)
Net output 4.75 Kg (`) 285
Standard cost per kg of output = 285/ 4.75 = `60
COMPUTATION OF VARIANCES:
(i) Total Material Cost Variance: [Standard cost of actual output -Actual mat. Cost of
production]
= 5,80,000 x `60 -[P:2,40,000 x `38 + Q:2,50,000 x `59+ R: 1,10,000 x `88]
= `34,80,0000 –`33,55,0000
= `12,50,000 (FAV)
(ii) Material Price Variance :[(Std Price -Actual Price) x Actual Quantity Consumed]
= P: `(40 -38) x 2,40,000 + Q: `(60 -59) x 2,50,000 + R: `(85 -88) x 1,10, 000
= P: `4,80,000 (fav) + Q: `2,50,000 (fav) + R: `3,30,000 (adv)
= `4,00,000 (FAV)
(iii) Material Mix Variance:[(Input in std proportion -Actual input) x std cost (price) of
input]
= P: (2,40,000 -2,40,000) x `40 + Q; (2,40,000 -2,50,000) x `60+ R: (1,20,000 -1,10,000)
x `85
= P: `0 + Q: `6,00,000 (adv) + R: `8,50,000 (FAV)
= `2,50,000 (FAV)
(iv) Material Yield Variance: `6,00,000 (FAV)Output basis: Std input for actual yield
=5,80,000 kg ÷ 0.95
= 6,10,526.3158 kg (Less) actual input (6,00,000.0000 kg) Saving in input: 10526.3158
kg Cost saved @ `285 / 5
= `57: 10526.3158 x 57
= `6,00,000 (FAV)
[alternately]
Input basis : Std yield for actual input 6,00,000 x 0.95
= 5,70,000 kg Actual yield 5,80,000 kg Excess yield obtained Material cost whereof
@ `60 Yield Variance : 10,000 x 60
= `6,00,000 (F)
(v) Material Usage Variance :[Std cost of actual output -Std cost of actual quantity
consumed]
= 5,80,000 x `60 -[P: 2,40,000 x `40 + Q: 2,50,000 x `60+ R: 1,10,000 x `85]
= `34,80,0000 -33,95,0000
= 8,50,000(FAV)
Section B
Answer any two questions from this section.
Question.3 (a)
(i) Write a note on flow chart. [4]
Answer.
Flow chart is a diagrammatic representation of flow of information with help of
documents. It is useful to record the „decisions‟ at various levels, posting of data and

Answer to PTP_Intermediate_Syllabus 2012_Dec2014_Set 1
Academics Department, The Institute of Cost Accountants of India (Statutory Body under an Act of Parliament) Page 11
recording of transactions on documents. Flow chart is used to indicate the analysis of
systems and documents detailed as under:
The number of copies of each document.
Movement of each document through different departments, sequence of such
movements, and final destination of every copy.
The operations like giving approval, putting initial, done on the documents along with
brief description and reason for the same.
Thus flow chart helps us in following ways:
Identifies the division of responsibilities in different departments.
Locates the source document whose error may have far reaching consequences;
Points out the occurrence of clerical error at each stage;
Provides a bird‟s eye view of the system and acts as efficient documentation for the
auditors;
It is the most efficient tool for doing actual analysis.
However details are sometimes omitted from a flow chart and as a result it may not give
the desired result. Failure to standardize the symbols and incomplete nature of chart are
also responsible for not having the desired results.
(ii) Sufficient details should be available in Cost Records, on Packing Materials. Explain.
[4]
Answer:
In addition to details on Raw Materials and other inputs the Cost Records must also show
–
Quantity and Cost of packing materials e.g., tins, cartons, gunny bags, other
materials etc.
Details of wastages, spoilage, rejections and losses of packing materials, with reasons
thereof. Scrap value of wastage, if any, should be suitably adjusted in respect of
normal and abnormal losses.
Wages and other expenses incurred in packing of products – both product-wise and
size-wise.
Proper allocation of packing expenses for various products, i.e., those which are
covered by the Rules and other products.
Question.3 (b)
(i) As a Cost Auditor, describe different measures to rectify imbalance in production
facilities. [5]
Answer.
Different measures for rectifying imbalances in production facilities could be listed as
below:
Outsource/ sub-contract outside the company that part of the job, which is
restricting the production.
Introduce shift working among the operatives.
Replacing entire existing plant by a new automatic plant, in case there is consistent
imbalance in the production facilities.
Idle equipment should be sold so that entire attention can be focused on the critical
equipment.
Install balancing equipment with higher output potential.
(ii) A company is exporting 80% of its sales and 20% is domestic sale. Can this company be
exempted from the mandatory cost audit? [3]
Answer to PTP_Intermediate_Syllabus 2012_Dec2014_Set 1
Academics Department, The Institute of Cost Accountants of India (Statutory Body under an Act of Parliament) Page 12
Answer.
The exemption from mandatory cost audit is available only to those 100% EOUs who are
registered under the policy document as per the Foreign Trade Policy and which are
functioning within the permissible approved limit as per the said Policy. The DTA
(Domestic Tariff Area) sales should not exceed the permissible limits as per the policy in
force.
If the percentage of domestic sales is within the DTA limit, the company will be exempted
from mandatory cost audit. It may be noted that if DTA sales for any year exceeds the
permissible limits, then the exemption from cost audit available to the unit shall be
withdrawn and the unit will be subjected to cost audit in accordance with the provisions
of applicable rules/orders starting with the year in which exemption stood withdrawn and
for every subsequent year thereafter.
Question.3 (c)
“It is not possible to merge Cost Audit with Financial Audit to have a Composite Audit.”
Discuss. [8]
Answer:
Even though there are considerable areas of overlapping between cost and financial
records, a composite audit requirement between the two is not feasible on the following
grounds:
Different information systems – It is difficult to collect the accounting information
required for cost ad financial audit purposes, in a single format.
Objective of audit – The main objective of financial audit is to express an opinion on
the truth and fairness of the information contained in the financial statements. But the
main objective of cost audit is to verify the cost statements and see whether a true
and fair cost of production and of marketing has been worked out.
Focus of audit – Cost Audit focuses on review of information in respect of each cost
element in detail. Hence, the focus of audit and review of information is much
different from that of financial audit.
Classification of accounting data – Financial Accounts present data under the
natural accounting heads. However, Cost Records present information based on
product lines and cost-centres.
Confidentiality – The Financial Audit Report is too general and is made public as per
the requirements of the Companies Act, 1956. The Cost Auditor Report may contain
certain information which the Company considers confidential.
Applicability – The maintenance of Cost Accounting Records by all types of industries
may also not be practicable. At present, small-scale industrial undertakings are
exempted from maintaining Cost Accounting Records, even of they belong to
industry which is required to maintain Cost Records.
Toll of management – Cost Audit can be considered as tool of internal management
by a Company to operate effectively in a competitive environment by disclosing
weaknesses in a cost accounting system and disclosing inefficiencies at all levels of
organization. On the other hand, Financial Audit can give a picture of the overall
results only.
Extensive nature – The Cost Auditor does not have to state only whether the Cost
Statements reflect a true and fair view, but has to go much beyond and express his
opinion also on propriety and efficiency aspects.
Section C
Answer any three questions from this section.
Answer to PTP_Intermediate_Syllabus 2012_Dec2014_Set 1
Academics Department, The Institute of Cost Accountants of India (Statutory Body under an Act of Parliament) Page 13
Question.4 (a)
Why does demand curve slopes downward? How many methods can be used to
measure the Elasticity of Demand? [7+1]
Answer:
Demand curve slopes downward from left to right (Negative Slope).
There are many causes for downward sloping of demand curve:-
Law of Diminishing Marginal utility - As the consumer buys more and more of the
commodity, the marginal utility of the additional units falls. Therefore the consumer is
willing to pay only lower prices for additional units. If the price is higher, he will restrict
its consumption.
Principle of Equi-Marginal Utility - Consumer will arrange his purchases in such a way
that the marginal utility is equal in all his purchases. If it is not equal, they will alter their
purchases till the marginal utility is equal.
Income effect - When the price of the commodity falls, the real income of the
consumer will increase. He will spend this increased income either to buy additional
quantity of the same commodity or other commodity.
Substitution effect - When the price of tea falls, it becomes cheaper. Therefore the
consumer will substitute this commodity for coffee. This leads to an increase in
demand for tea.
Different uses of a commodity - Some commodities have several uses. If the price of
the commodity is high, its use will be restricted only for important purpose. For e.g.
when the price of tomato is high, it will be used only for cooking purpose. When it is
cheaper, it will be used for preparing jam, pickle etc...
Psychology of people - Psychologically people buy more of a commodity when its
price falls. In other word it can be termed as price effect.
Tendency of human beings to satisfy unsatisfied wants.
The elasticity of demand can be measured by using three methods.
Question.4 (b)
(i) Explain going rate pricing. [5]
Answer.
A method of pricing adopted by small firms – which are price followers – is known as
going rate pricing. Under this system, a firm sets its price according to the general pricing
structure in the industry or according to the price set by the price leader. In a sense,
each firm has “monopoly” power over its produce and it can, if it chooses, fix a
monopoly price and face all the consequences of monopoly. In practice, however, it
prefers the easier and more practical method of choosing price going in the market. It
will change its price only when other firms do the same. Such a price policy is useful and
safe to a firm under certain circumstances. For instance, the firm may not have an
accurate idea of its costs or it may like to play safe and not provoke the larger firm to go
for cut-throat competition. Besides, it is difficult for each firm to calculate the full
implication of change in costs and prices and it is much better to follow the same
pattern of pricing adopted by others. Even a large firm may be satisfied with going rate
pricing lest a change in price by it unnecessarily disturbs the whole market. No firm
would like to “spoil” the common market by reducing the price.
(ii) The demand function is x = 80 + 2P + 5P2 where 'x' is the demand for the commodity at
Price 'P'. Find the elasticity of demand at P = 5 [3]
Answer to PTP_Intermediate_Syllabus 2012_Dec2014_Set 1
Academics Department, The Institute of Cost Accountants of India (Statutory Body under an Act of Parliament) Page 14
Answer:
Determination of Elasticity of Demand
X = 80 + 2P + 5P2
Marginal Quantity demanded dx
dy= 2 + 10P
Average Quantity demanded = 2 5p p
80
p
2p 5 2p 80
p
X
2p 25p 80
10p) (2 p
2 5p p
80
10p 2
p
x /
dp
dx Ep
At, P = 5
43
52
215
260
10 125 80
50)5(2 Ep
Question.4 (c)
What are the pricing policies for introduction stage of a new product? [8]
Answer:
There are two alternative price strategies which a firm introducing a new product can
adopt, viz., skimming price policy and penetration pricing policy.
A. Skimming Price Policy:
When the product is new but with a high degree of consumer acceptability, the firm
may decide to charge a high mark up and, therefore, charge a high price. The system
of charging high prices for new products is known as price skimming for the object is to
“skim the cream” from the market. There are many reasons for adopting a high mark-up
and, therefore, high initial price:
The demand for the new product is relatively inelastic. The high prices will not stop
the new consumers from demanding the product. The new product, novelty,
commands a better price. Above all, in the initial stage, there is hence cross elasticity
of demand is low.
If life of the product promises to be a short one, the management may fix a high
price so that it can get as much profit as possible and, in as short a period as possible.
Such an initially high price is also suitable if the firm can divide the market into
different segments based on different elasticity‟s. The firm can introduce a cheaper
model in the market with lower elasticity.
High initial price may also be needed in those cases where there is heavy investment
of capital and when the costs of introducing a new product are high. The initial price
of a transistor radio was ` 500 or more (now ` 50 or even less); electronic calculators
used to cost ` 1,000 or more, they are now available for ` 100 or so.
B. Penetration Price Policy:
Instead of setting a high price, the firm may set a low price for a new product by adding
a low mark-up to the full cost. This is done to penetrate the market as quickly as possible.
The assumptions behind the low penetration price policy are:
The new product is being introduced in a market which is already served by well-
known brands. A low price is necessary to attract gradually consumers who are
already accustomed to other brands.
The low price will help to maximize the sales of the product even in the short period.
The low price is set in the market to prevent the entry of new products.
Answer to PTP_Intermediate_Syllabus 2012_Dec2014_Set 1
Academics Department, The Institute of Cost Accountants of India (Statutory Body under an Act of Parliament) Page 15
Penetration price policy is preferred to skimming price under three conditions:
In the first place, skimming price offering a high margin will attract many rivals to enter
the market. With the entry of powerful rivals into the market, competition will be
intensified, price will fall and profits will be competed away in the long run. A firm will
prefer a low penetration price if it fears the entry of powerful rivals with plenty of capital
and new technology. For a low penetration price, based on extremely low mark-up will
be least profitable and potential competitors will not be induced to enter the market.
Secondly, a firm will prefer low penetration price strategy if product differentiation is low
and if rival firms can easily imitate the product. In such a case, the objective of the firm
to fix low price is to establish a strong market based and build goodwill among
consumers and strong consumer loyalty.
Finally, a firm may anticipate that its main product may generate continuing demand for
the complementary items. In such a case, the firm will follow penetration pricing for its
new product, so that the product as well as its complements will get a wider market.
Question.4 (d)
(i) The cost function „c‟ of a firm = 3 5x 2
x- 3
x3
1 , find the level at which the marginal cost
and the average variable cost attain their respective minimum. [4]
Answer:
3 5x 2
x- 3
x3
1c
Marginal Cost = dc
dx=
1
33x2 – 2x + 5
= x2 – 2x + 5 („y‟ say)
dy
dx = 2x – 2 = 0
... x = 1
2
2
d y
dx= 2, which is positive
... Marginal cost is minimum value at x = 1
Average Variable Cost = 1
3x2 – x + 5 (y say)
0 1 -x 3
2 Cost) Variable (Average
dx
dy
=> 2
3x = 1
... x =
3
2
2
2
d y
dx =
2
3, positive
... Average Variable Cost is minimum at output x =
3
2
Answer to PTP_Intermediate_Syllabus 2012_Dec2014_Set 1
Academics Department, The Institute of Cost Accountants of India (Statutory Body under an Act of Parliament) Page 16
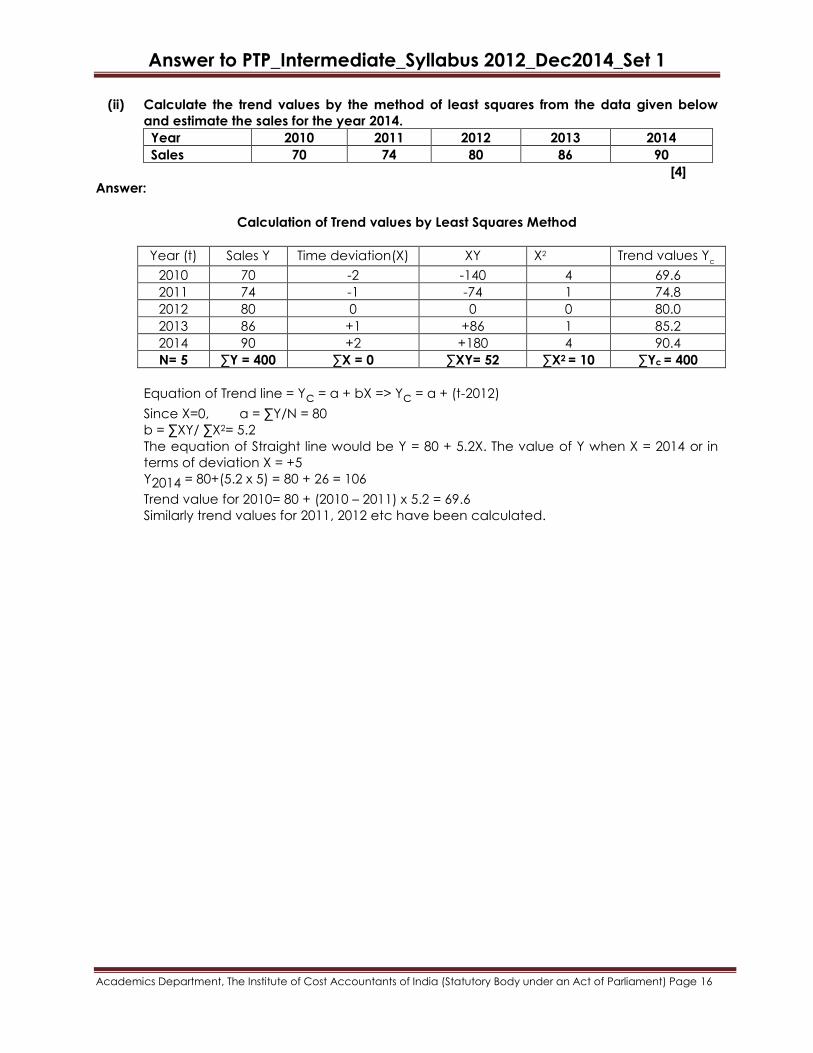
(ii) Calculate the trend values by the method of least squares from the data given below
and estimate the sales for the year 2014.
Year 2010 2011 2012 2013 2014
Sales 70 74 80 86 90
[4]
Answer:
Calculation of Trend values by Least Squares Method
Year (t) Sales Y Time deviation(X) XY X2 Trend values Yc
2010 70 -2 -140 4 69.6
2011 74 -1 -74 1 74.8
2012 80 0 0 0 80.0
2013 86 +1 +86 1 85.2
2014 90 +2 +180 4 90.4
N= 5 ∑Y = 400 ∑X = 0 ∑XY= 52 ∑X2 = 10 ∑Yc = 400
Equation of Trend line = Yc = a + bX => Yc = a + (t-2012)
Since X=0, a = ∑Y/N = 80
b = ∑XY/ ∑X2= 5.2
The equation of Straight line would be Y = 80 + 5.2X. The value of Y when X = 2014 or in
terms of deviation X = +5
Y2014 = 80+(5.2 x 5) = 80 + 26 = 106
Trend value for 2010= 80 + (2010 – 2011) x 5.2 = 69.6
Similarly trend values for 2011, 2012 etc have been calculated.