Embed Size (px)
Citation preview
ContentsIntroduction
Answers
Teachers’ Notes
Copymaster
Answers and Teachers’ Notes
2
3
8
31
2
This book is one of three in the Figure It Out series that have proportional reasoning as their focus:Proportional Reasoning, Level 3+ and Proportional Reasoning, Level 3–4+ (Books One and Two).In these books, students explore the meaning of fractions and ratios and learn how to use themto make comparisons in a wide variety of contexts.
The books have been developed to support teachers whose students are moving on to the earlyproportional and advanced proportional stages of the Number Framework (stages 7 and 8). Likethe other “plus” books in the Figure It Out series, these should be suitable for students needingextension. The level 3–4+ books are intended for use with students in year 6 but could be usedat other levels at the discretion of the teacher.
The books aim to set activities in real-life and imaginary contexts that should appeal to students.The real-life contexts reflect many aspects of life in New Zealand, and the young people portrayedin illustrations and photos reflect our ethnic and cultural diversity.
The activities may be used as the focus for teacher-led lessons, for students working in groups, orfor independent activities. But bear in mind that the Figure It Out series is a resource, not a setof textbooks. This means that if you are setting an activity to be done independently, you shouldcheck that you have done whatever prior teaching is needed.
Teachers sometimes say that their students have difficulty understanding the words on the page.We are very mindful of this and try to keep written instructions as brief and as clear as possible,but to create a context and pose questions, some words must be used. It is important thatmathematical language and terminology be deliberately taught.
The Answers section of the Answers and Teachers’ Notes that accompany each student book includesfull answers and explanatory notes. Students can use them for self-marking, or you can use themfor teacher-directed marking. The teachers’ notes for each activity include achievement objectives,a commentary on the mathematics involved, and suggestions on teaching approaches. Althoughthe notes are directed at teachers, able students can use them as a self-help resource. TheAnswers and Teachers’ Notes are also available on Te Kete Ipurangi (TKI) atwww.tki.org.nz/r/maths/curriculum/figure/
Where applicable, each page starts with a list of the equipment needed. Encourage the studentsto be responsible for collecting this equipment and returning it at the end of the session.
Ask your students to write down how they did their investigations or found solutions, drawingdiagrams where appropriate. Discussion of strategies and answers is encouraged in many activities,and you may wish to ask your students to do this even where the instruction is to write down theanswer.
The ability to communicate findings and explanations, and the ability to work satisfactorilyin team projects, have also been highlighted as important outcomes for education. Mathematics education provides many opportunities for students to develop communicationskills and to participate in collaborative problem-solving situations.
Mathematics in the New Zealand Curriculum, page 7
Students will have various ways of solving problems or presenting the process they have used andthe solution. You should acknowledge successful ways of solving questions or problems, and wheremore effective or efficient processes can be used, encourage your students to consider their merits.
Introduction
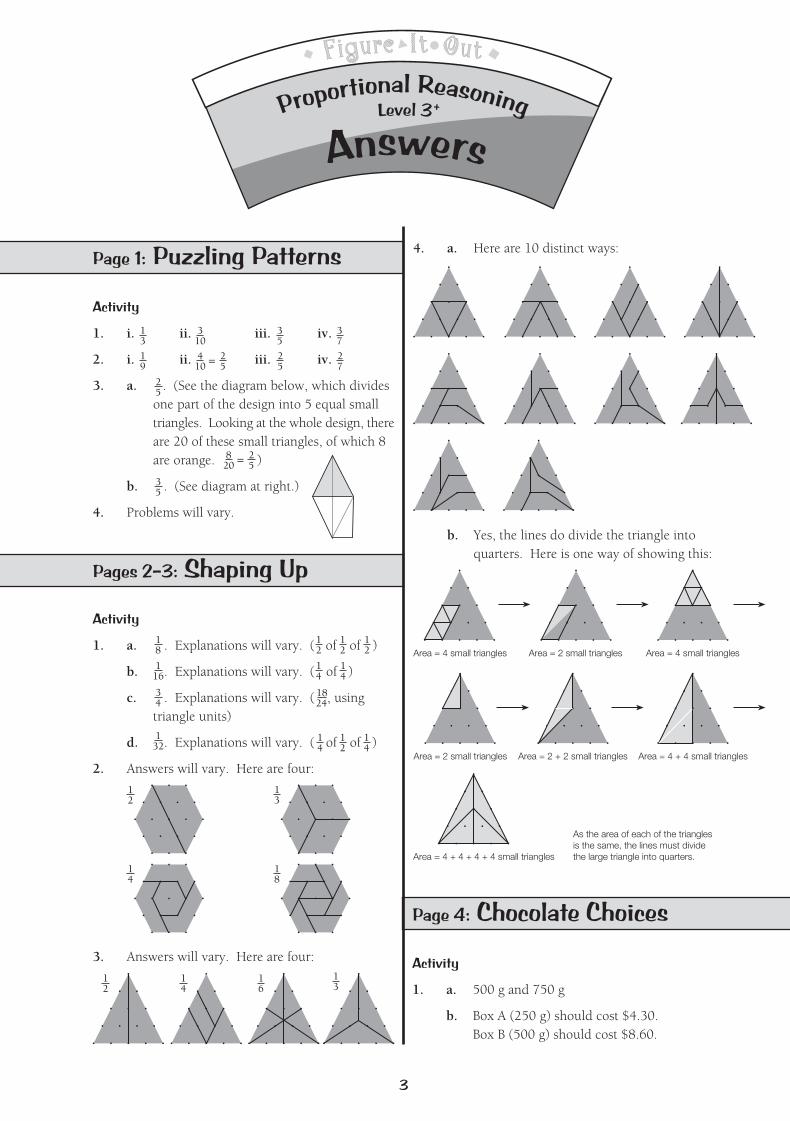
Figure It Out
Activity
1. a. . Explanations will vary. ( of of )
b. . Explanations will vary. ( of )
c. . Explanations will vary. ( , using triangle units)
d. . Explanations will vary. ( of of )
2. Answers will vary. Here are four:
3. Answers will vary. Here are four:
4. a. Here are 10 distinct ways:
b. Yes, the lines do divide the triangle into quarters. Here is one way of showing this:
AnswersProportional ReasoningLevel 3+
As the area of each of the trianglesis the same, the lines must dividethe large triangle into quarters.
Area = 2 + 2 small triangles
Area = 4 small triangles Area = 2 small triangles
Activity
1. i. ii. iii. iv.
2. i. ii. iii. iv.
3. a. . (See the diagram below, which divides one part of the design into 5 equal small triangles. Looking at the whole design, thereare 20 of these small triangles, of which 8 are orange. )
b. . (See diagram at right.)
4. Problems will vary.
3
Page 1: Puzzling Patterns
13
310
35
37
19
25
410
25
27=
25
25
820 =
35
Pages 2–3: Shaping Up
18
116
34
132
12
12
12
14
14
1824
14
12
14
13
14
18
12
14
13
16
Area = 4 small triangles
Area = 4 + 4 small triangles
Area = 4 + 4 + 4 + 4 small triangles
Area = 2 small triangles
Activity
1. a. 500 g and 750 g
b. Box A (250 g) should cost $4.30.Box B (500 g) should cost $8.60.
Page 4: Chocolate Choices
12
4
Activity
1. 3-star clusters:of a 6-pack; of an 8-pack; of a 12-pack;of a 20-pack.
4-star clusters:or of a 6-pack; of an 8-pack; of a 12-
pack; of a 20-pack.5-star clusters:
of a 6-pack; of an 8-pack; of a 12-pack;of a 20-pack.
2. Many answers are possible. They include: twenty-four 6-packs; twelve 12-packs; six 6-packs +six 8-packs + three 20-packs.
3. 16 x 3-star clusters. ( of 144 = 48)9 x 4-star clusters. ( of 144 = 36)12 x 5-star clusters. (144 – 48 – 36 = 60)
4. . (12 x 9 = 108, and 108 is of 144.)
Page 5: Star Clusters
Activity
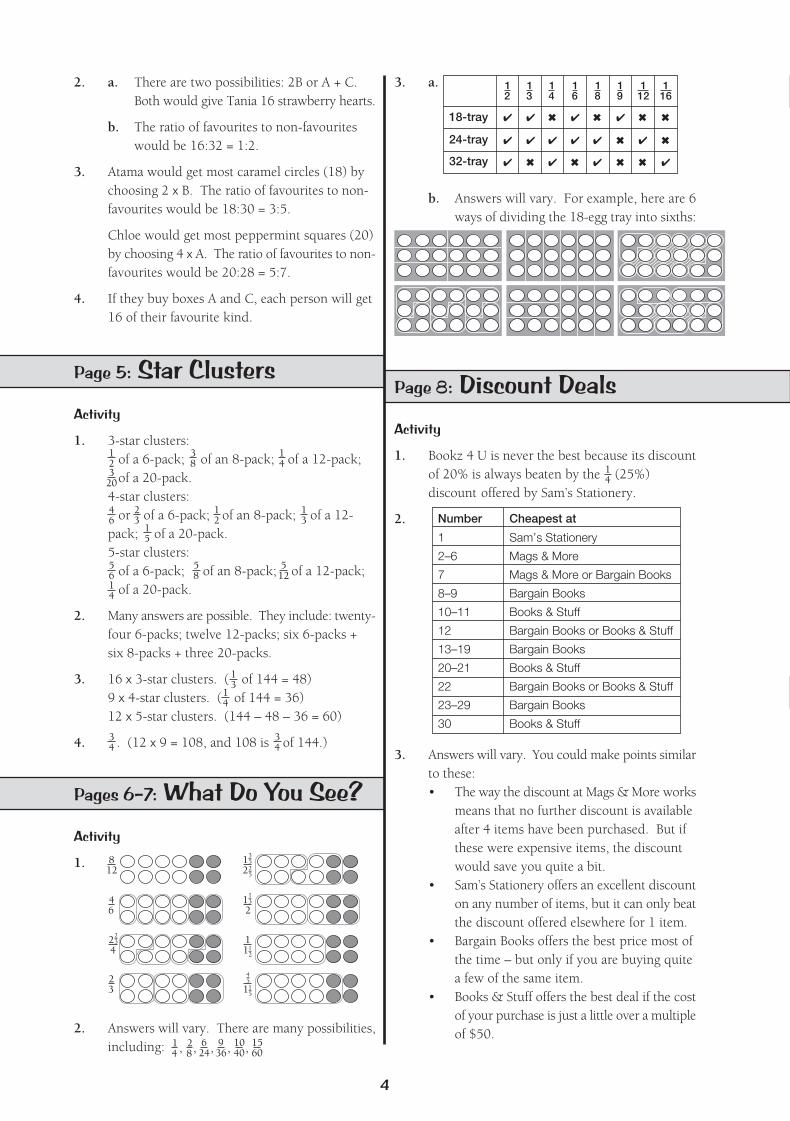
1. Bookz 4 U is never the best because its discountof 20% is always beaten by the (25%) discount offered by Sam’s Stationery.
2.
Page 8: Discount Deals
3. Answers will vary. You could make points similarto these:• The way the discount at Mags & More works
means that no further discount is availableafter 4 items have been purchased. But if these were expensive items, the discount would save you quite a bit.
• Sam’s Stationery offers an excellent discounton any number of items, but it can only beatthe discount offered elsewhere for 1 item.
• Bargain Books offers the best price most ofthe time – but only if you are buying quitea few of the same item.
• Books & Stuff offers the best deal if the costof your purchase is just a little over a multipleof $50.
12
38
14
320
46
23
12
13
15
56
58
512
14
13
14
34
34
Pages 6–7: What Do You See?
Activity
1. 812
12
46
12
11
24
23
123
2. Answers will vary. There are many possibilities,including: 1
4624, 2
8, , 936, 10
40, 1560
3. a.
18-tray
24-tray
32-tray
12
13
14
16
18
19
112
116
�
�
�
�
�
�
�
�
�
�
�
�
�
�
�
�
�
�
�
�
�
�
�
�
b. Answers will vary. For example, here are 6ways of dividing the 18-egg tray into sixths:
14
Number Cheapest at
1
2–6
7
8–9
10–11
12
13–19
20–21
22
23–29
30
Sam’s Stationery
Mags & More
Mags & More or Bargain Books
Bargain Books
Books & Stuff
Bargain Books or Books & Stuff
Bargain Books
Books & Stuff
Bargain Books or Books & Stuff
Bargain Books
Books & Stuff
2. a. There are two possibilities: 2B or A + C. Both would give Tania 16 strawberry hearts.
b. The ratio of favourites to non-favourites would be 16:32 = 1:2.
3. Atama would get most caramel circles (18) by choosing 2 x B. The ratio of favourites to non-favourites would be 18:30 = 3:5.
Chloe would get most peppermint squares (20)by choosing 4 x A. The ratio of favourites to non-favourites would be 20:28 = 5:7.
4. If they buy boxes A and C, each person will get16 of their favourite kind.
3525
13
12
4515
5
Activity
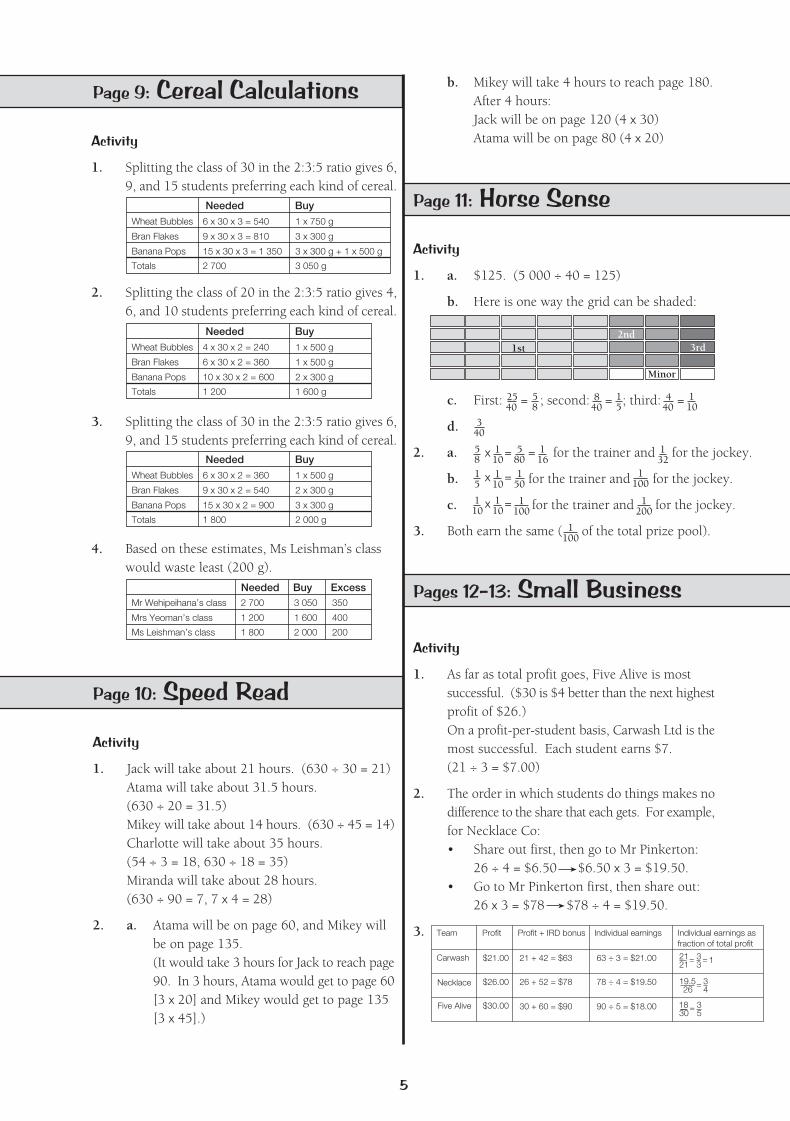
1. Jack will take about 21 hours. (630 ÷ 30 = 21)Atama will take about 31.5 hours.(630 ÷ 20 = 31.5)Mikey will take about 14 hours. (630 ÷ 45 = 14)Charlotte will take about 35 hours.(54 ÷ 3 = 18, 630 ÷ 18 = 35)Miranda will take about 28 hours.(630 ÷ 90 = 7, 7 x 4 = 28)
2. a. Atama will be on page 60, and Mikey will be on page 135.(It would take 3 hours for Jack to reach page90. In 3 hours, Atama would get to page 60[3 x 20] and Mikey would get to page 135 [3 x 45].)
Page 10: Speed Read
2. Splitting the class of 20 in the 2:3:5 ratio gives 4,6, and 10 students preferring each kind of cereal.
NeededWheat Bubbles
Buy4 x 30 x 2 = 240 1 x 500 g
Bran Flakes 6 x 30 x 2 = 360 1 x 500 g
Banana Pops 10 x 30 x 2 = 600 2 x 300 g
Totals 1 200 1 600 g
3. Splitting the class of 30 in the 2:3:5 ratio gives 6,9, and 15 students preferring each kind of cereal.
NeededWheat Bubbles
Buy6 x 30 x 2 = 360 1 x 500 g
Bran Flakes 9 x 30 x 2 = 540 2 x 300 g
Banana Pops 15 x 30 x 2 = 900 3 x 300 g
Totals 1 800 2 000 g
4. Based on these estimates, Ms Leishman’s class would waste least (200 g).
Needed ExcessMr Wehipeihana’s class 2 700 3 050
Mrs Yeoman’s class 1 200 1 600
Ms Leishman’s class 1 800 2 000
Buy350
400
200
Page 11: Horse Sense
Activity
1. a. $125. (5 000 ÷ 40 = 125)
b. Here is one way the grid can be shaded:
1st2nd
Minor
3rd
c. First: = ; second: = ; third: =
d.
2. a. for the trainer and for the jockey.
b. for the trainer and for the jockey.
c. for the trainer and for the jockey.
3. Both earn the same ( of the total prize pool).
2540
58
440
110
840
15
340
58
=x 110
580
= 116
132
15
=x 110
150
1100
=x 110
110
1100
1200
1100
Pages 12–13: Small Business
Activity
1. As far as total profit goes, Five Alive is most successful. ($30 is $4 better than the next highestprofit of $26.)On a profit-per-student basis, Carwash Ltd is themost successful. Each student earns $7.(21 ÷ 3 = $7.00)
2. The order in which students do things makes nodifference to the share that each gets. For example,for Necklace Co:• Share out first, then go to Mr Pinkerton:
26 ÷ 4 = $6.50 $6.50 x 3 = $19.50.• Go to Mr Pinkerton first, then share out:
26 x 3 = $78 $78 ÷ 4 = $19.50.
3. Individual earnings asfraction of total profit
Team Profit Profit + IRD bonus Individual earnings
Carwash
Necklace
Five Alive
$21.00
$26.00
$30.00
21 + 42 = $63
26 + 52 = $78
30 + 60 = $90
63 ÷ 3 = $21.00
78 ÷ 4 = $19.50
90 ÷ 5 = $18.00
2121
33= = 1
19.526
34=
1830
35=
Activity
1. Splitting the class of 30 in the 2:3:5 ratio gives 6,9, and 15 students preferring each kind of cereal.
NeededWheat Bubbles
Buy6 x 30 x 3 = 540 1 x 750 g
Bran Flakes 9 x 30 x 3 = 810 3 x 300 g
Banana Pops 15 x 30 x 3 = 1 350 3 x 300 g + 1 x 500 g
Totals 2 700 3 050 g
Page 9: Cereal Calculations b. Mikey will take 4 hours to reach page 180.After 4 hours:Jack will be on page 120 (4 x 30)Atama will be on page 80 (4 x 20)
6
Activity
1. a. Answers will vary. (Example: the maximumheart rate for a 10-yr-old would be220 – 10 = 210 beats per min.)
b. Answers will vary. For a 10-yr-old, the zoneswould be:Easy 126–147 beats per minModerate 147–168 beats per minRace pace 168–179 beats per min
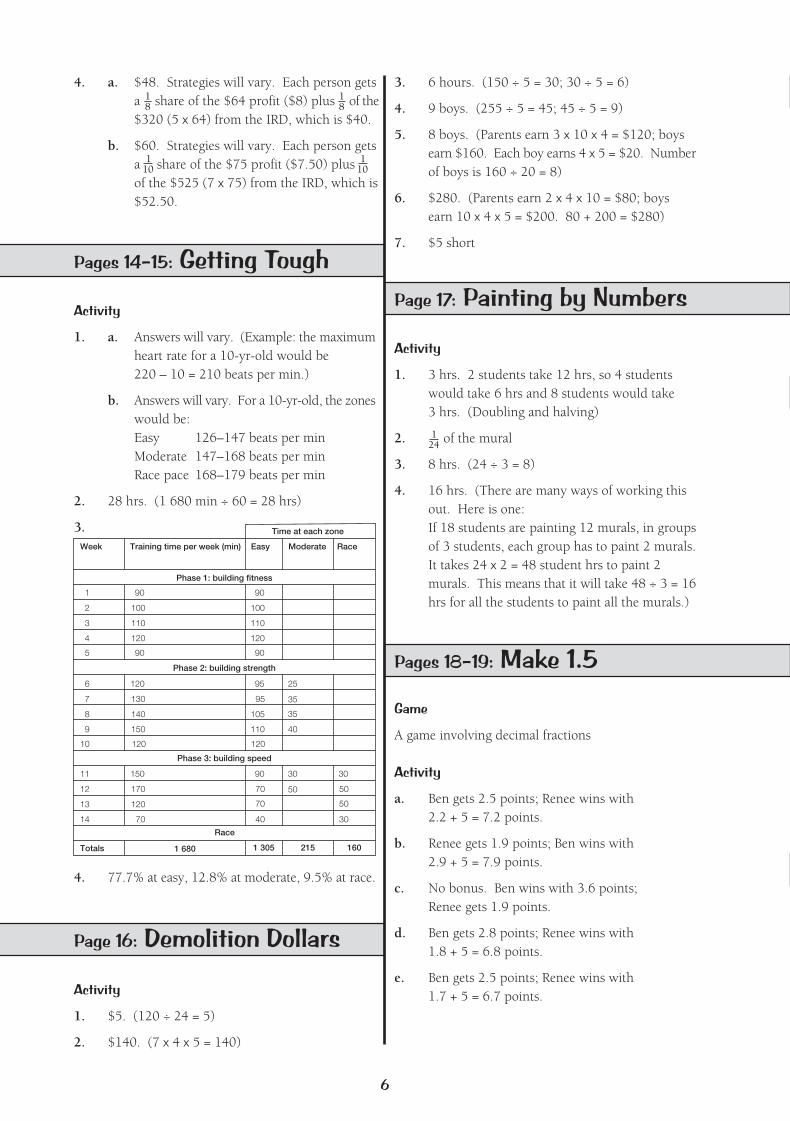
2. 28 hrs. (1 680 min ÷ 60 = 28 hrs)
3.
Pages 14–15: Getting Tough
Activity
1. 3 hrs. 2 students take 12 hrs, so 4 students would take 6 hrs and 8 students would take 3 hrs. (Doubling and halving)
2. of the mural
3. 8 hrs. (24 ÷ 3 = 8)
4. 16 hrs. (There are many ways of working this out. Here is one:If 18 students are painting 12 murals, in groupsof 3 students, each group has to paint 2 murals.It takes 24 x 2 = 48 student hrs to paint 2 murals. This means that it will take 48 ÷ 3 = 16hrs for all the students to paint all the murals.)
Page 17: Painting by Numbers
Week
Time at each zone
Totals
Training time per week (min) Easy Moderate Race
Phase 1: building fitness
Phase 2: building strength
Phase 3: building speed
Race
1 680 1 305 215 160
1 90 90
2 100 100
3 110 110
4 120 120
5 90 90
6 120 95
7 130
8 140 105
9 150 110
10 120 120
25
95 35
35
40
11 150 90
12 170
13 120 70
14 70 40
30
70 50
30
50
30
50
4. 77.7% at easy, 12.8% at moderate, 9.5% at race.
Page 16: Demolition Dollars
Activity
1. $5. (120 ÷ 24 = 5)
2. $140. (7 x 4 x 5 = 140)
124
Pages 18–19: Make 1.5
Game
A game involving decimal fractions
Activity
a. Ben gets 2.5 points; Renee wins with2.2 + 5 = 7.2 points.
b. Renee gets 1.9 points; Ben wins with2.9 + 5 = 7.9 points.
c. No bonus. Ben wins with 3.6 points; Renee gets 1.9 points.
d. Ben gets 2.8 points; Renee wins with1.8 + 5 = 6.8 points.
e. Ben gets 2.5 points; Renee wins with1.7 + 5 = 6.7 points.
4. a. $48. Strategies will vary. Each person getsa share of the $64 profit ($8) plus of the$320 (5 x 64) from the IRD, which is $40.
b. $60. Strategies will vary. Each person getsa share of the $75 profit ($7.50) plus of the $525 (7 x 75) from the IRD, which is$52.50.
18
110
18
3. 6 hours. (150 ÷ 5 = 30; 30 ÷ 5 = 6)
4. 9 boys. (255 ÷ 5 = 45; 45 ÷ 5 = 9)
5. 8 boys. (Parents earn 3 x 10 x 4 = $120; boys earn $160. Each boy earns 4 x 5 = $20. Numberof boys is 160 ÷ 20 = 8)
6. $280. (Parents earn 2 x 4 x 10 = $80; boys earn 10 x 4 x 5 = $200. 80 + 200 = $280)
7. $5 short
110
7
Activity
1. 24 min. A double strip diagram shows that it takes this long for Kelvin to get 1 complete lap ahead of Ian (4 laps to 3):
Page 21: Tiring Teamwork
Activity
1. a. 6 cm. (Compare bases: the base of the smallest picture is = of the base of the medium picture. This means that height Awill be of the height of the medium picture. x 9 = 6 cm.)
b. 30 cm. (Compare bases: the base of the largest picture is = = 3 times thebase of the medium picture. This means that height B must be 3 x 9 = 30 cm.)
2. i. and vi. iii. and v.
206
103
13
13
2. 40 min. After this time, Ian is 1 complete lap ahead of Kate (5 laps to 4):
3. 15 min. This is a little harder to see on a strip diagram, but after 30 min, Kelvin is exactly 2 lapsahead of Kate (5 laps to 3), so after 15 min, he must be exactly 1 lap ahead (2 laps to 1 ).
4. Answers will vary. Possible factors include mechanical problems, sickness or injury, accidents,weather conditions, road/track conditions.
0 5 10 15 20 25 30 35 40 Min
KelvinIan
0 5 10 15 20 25 30 35 40 Min
KateIan
12
12
0 5 10 15 20 25 30 35 40 Min
KelvinKate
Activity
1. a. 25 km
Pages 22–23: The Great Race
b. Pedal Power Plus travels 150 km. SunlightSprinter travels 420 km. (PPP’s first scheduled stop is at 11.00 a.m., which meansthat it has travelled for 6 hrs, covering25 km each hr. SS starts at 6.00 a.m. and doesn’t stop until 8.00 p.m., 14 hrs later. 14 x 30 = 420 km)
c. PPP will travel 375 km (15 x 25 = 375).SS will travel 420 km. (See answer to question 1b above.)
2. a. Practical activity
b. PPP wins, by 1 hr and 20 min. (PPP arrives at 10.00 a.m. on Monday. SS arrivesat 11.20 a.m.)
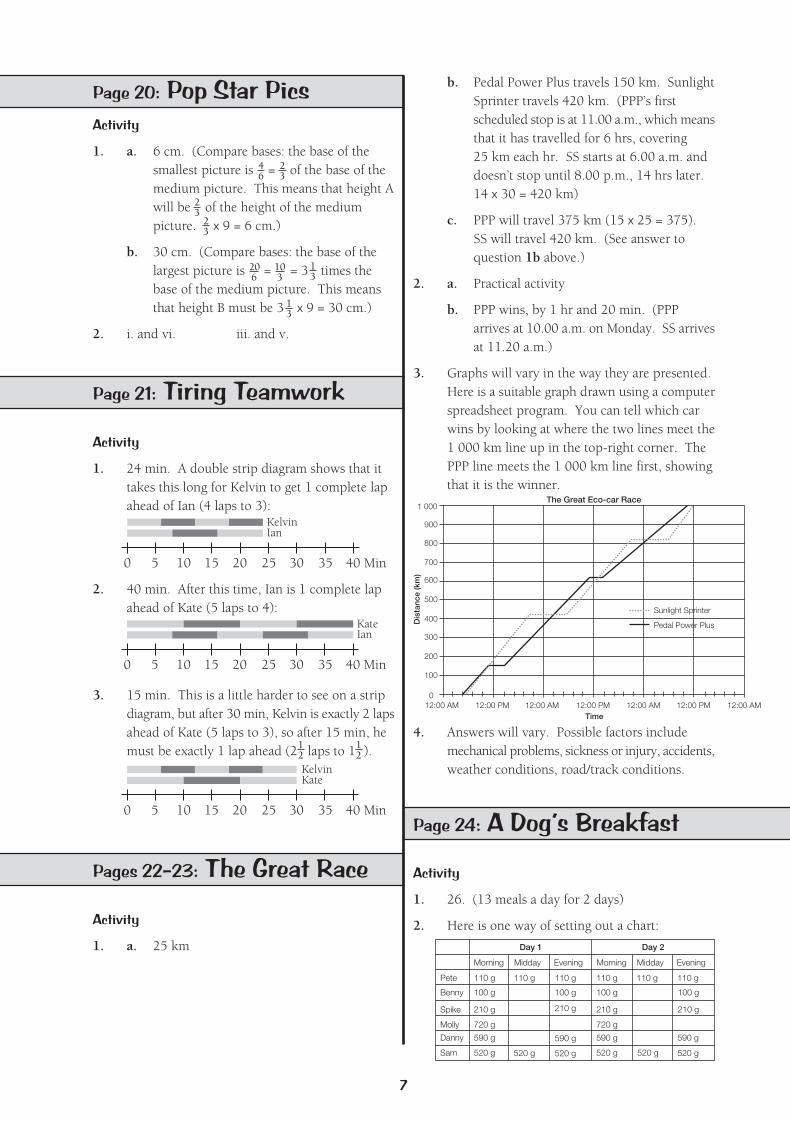
3. Graphs will vary in the way they are presented.Here is a suitable graph drawn using a computerspreadsheet program. You can tell which car wins by looking at where the two lines meet the1 000 km line up in the top-right corner. The PPP line meets the 1 000 km line first, showingthat it is the winner.
The Great Eco-car Race1 000
900
800
700
600
500
400
300
200
100
012:00 AM 12:00 PM 12:00 AM 12:00 PM 12:00 AM 12:00 PM 12:00 AM
Time
Dis
tanc
e (k
m)
Page 24: A Dog’s Breakfast
Activity
1. 26. (13 meals a day for 2 days)
2. Here is one way of setting out a chart:
Day 1
Sam
Danny
Molly
Spike
Benny
Pete
Morning Midday Evening
Day 2
520 g
590 g
720 g
210 g
100 g
110 g
Morning Midday Evening
110 g
520 g
210 g
100 g
110 g 110 g 110 g 110 g
520 g
590 g
720 g
210 g
100 g
520 g
210 g
100 g
590 g
46
23
23
23
Page 20: Pop Star Pics
Sunlight Sprinter
Pedal Power Plus
590 g
520 g 520 g
Figure It Out
Teachers’ NotesProportional Reasoning
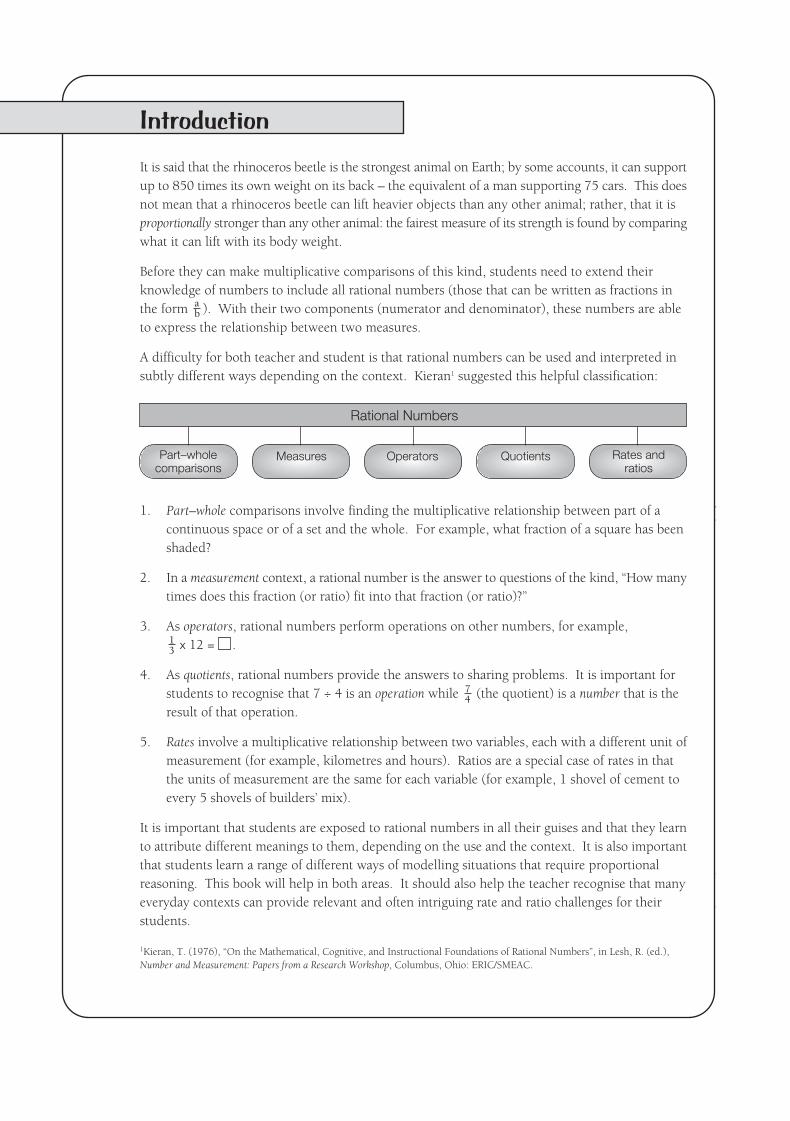
Overview of Level 3+
Title Content
Puzzling Patterns
Shaping Up
Chocolate Choices
Star Clusters
What Do You See?
Discount Deals
Cereal Calculations
Speed Read
Horse Sense
Small Business
Getting Tough
Demolition Dollars
Painting By Numbers
Make 1.5
Pop Star Pics
Tiring Teamwork
The Great Race
A Dog’s Breakfast
1
2–3
4
5
6–7
8
9
10
11
12–13
14–15
16
17
18–19
20
21
22–23
24
10
11
12
13
14
15
16
17
18
19
20
21
22
24
25
26
27
30
Page instudents’
book
Page inteachers’
book
Exploring fractions in relation to area
Using spatial reasoning to find fractions of areas
Using ratios to compare subsets
Finding fractions of sets
Exploring visuals models for fractions
Comparing discounts written in different forms
Solving problems that involve ratios andlarge numbers
Solving problems involving rates
Renaming, adding, and multiplying fractions
Finding and comparing proportions of wholenumber amounts
Interpreting information expressed as percentages
Solving problems involving rates
Solving problems involving rates
Finding and comparing proportions
Using ratio in an enlargement context
Comparing the relative positions of twomoving objects
Working with the time/distance/speed relationship
Using percentages in relation to body mass
1. Part–whole comparisons involve finding the multiplicative relationship between part of a continuous space or of a set and the whole. For example, what fraction of a square has beenshaded?
2. In a measurement context, a rational number is the answer to questions of the kind, “How manytimes does this fraction (or ratio) fit into that fraction (or ratio)?”
3. As operators, rational numbers perform operations on other numbers, for example,x 12 = .
4. As quotients, rational numbers provide the answers to sharing problems. It is important for students to recognise that 7 ÷ 4 is an operation while (the quotient) is a number that is the result of that operation.
5. Rates involve a multiplicative relationship between two variables, each with a different unit ofmeasurement (for example, kilometres and hours). Ratios are a special case of rates in that the units of measurement are the same for each variable (for example, 1 shovel of cement to every 5 shovels of builders’ mix).
It is important that students are exposed to rational numbers in all their guises and that they learnto attribute different meanings to them, depending on the use and the context. It is also importantthat students learn a range of different ways of modelling situations that require proportionalreasoning. This book will help in both areas. It should also help the teacher recognise that manyeveryday contexts can provide relevant and often intriguing rate and ratio challenges for theirstudents.
It is said that the rhinoceros beetle is the strongest animal on Earth; by some accounts, it can supportup to 850 times its own weight on its back – the equivalent of a man supporting 75 cars. This doesnot mean that a rhinoceros beetle can lift heavier objects than any other animal; rather, that it isproportionally stronger than any other animal: the fairest measure of its strength is found by comparingwhat it can lift with its body weight.
Before they can make multiplicative comparisons of this kind, students need to extend theirknowledge of numbers to include all rational numbers (those that can be written as fractions inthe form ). With their two components (numerator and denominator), these numbers are ableto express the relationship between two measures.
A difficulty for both teacher and student is that rational numbers can be used and interpreted insubtly different ways depending on the context. Kieran1 suggested this helpful classification:
Introduction
9
ab
1Kieran, T. (1976), “On the Mathematical, Cognitive, and Instructional Foundations of Rational Numbers”, in Lesh, R. (ed.),Number and Measurement: Papers from a Research Workshop, Columbus, Ohio: ERIC/SMEAC.
74
13
Rational Numbers
Measures Operators Quotients Rates andratios
Part–wholecomparisons
ACEAAAAMAP
Page 1: Puzzling PatternsAchievement Objectives
• find fractions equivalent to one given (Number, level 4)
• find a given fraction or percentage of a quantity (Number, level 4)
• describe the features of 2-dimensional and 3-dimensional objects, using the language of geometry (Geometry, level 3)
Number Framework Links
Use this activity to help students consolidate and apply their knowledge of fractions (stages 6and 7).
Activity
In this whole-to-part activity, students are given a number of shapes and asked to work out whatfraction of each has been shaded. This task is easier than part-to-whole problems of the kind “Thistriangle is one-sixth of my shape, so what might my shape look like?”
If your students need the support of materials, encourage them to use pattern blocks to make thedesigns in this activity. Using blocks, they can explore or confirm the simple equivalence relationshipsthat exist between the areas of the different shapes. For example: 2 triangles = 1 rhombus,1 rhombus + 1 triangle = 1 trapezium, 3 triangles = 1 trapezium, 2 rhombuses = 1 trapezium +1 triangle. Once these relationships are understood, they can be reversed and expressed as fractions.For example: 1 triangle = of a trapezium; 1 rhombus = of a trapezium. Students need tounderstand also that the areas of the rhombus and the trapezium (and the hexagon) can be expressedin terms of multiples of the area of the equilateral triangle. This means that area problems involvingthese blocks can always be recreated or expressed using only the triangle. The parts of questions1 and 2 can all be solved using this kind of approach, but some students will need the actual patternblocks.
Question 3a can be solved using two different approaches, and it would be useful to have thestudents share these. Some will image the whole design divided into equal triangles (each the sizeof half an equilateral triangle) and then count the number of orange triangles out of the total to givethe fraction . A variation on this approach would be to use the equilateral triangle as the smallestunit of area, in which case the total area of the design is 8 triangles + 4 half-triangles = 10. Theorange area is therefore .
Students using the other approach will recognise that the windmill design is made up of 4 identicalblades, so whatever part of one is orange ( ), that part of the whole will be orange.
Some students may view the question as a ratio problem. If they do this, the orange to non-orangeratio is 1:1 or 2:3, which is the same as 2 parts out of 5 or .
10
Students can work out question 3b using similar strategies to those for question3a, but encourage them to use their earlier answers and make the deduction that1 – = . (The whole minus the orange piece leaves the non-orange piece.)
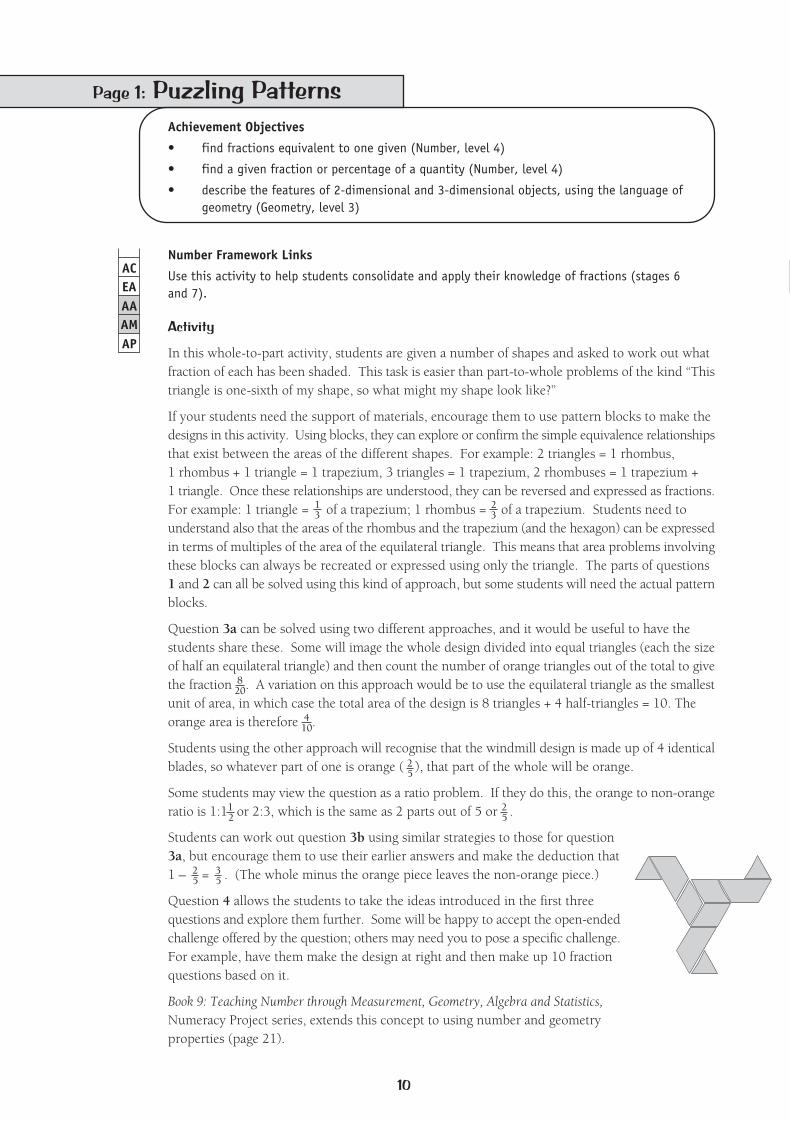
Question 4 allows the students to take the ideas introduced in the first threequestions and explore them further. Some will be happy to accept the open-endedchallenge offered by the question; others may need you to pose a specific challenge.For example, have them make the design at right and then make up 10 fractionquestions based on it.
Book 9: Teaching Number through Measurement, Geometry, Algebra and Statistics,Numeracy Project series, extends this concept to using number and geometryproperties (page 21).
13
23
820
410
25
12
25
25
35
ACEAAAAMAP
11
Pages 2–3: Shaping UpAchievement Objectives
• find fractions equivalent to one given (Number, level 4)
• find a given fraction or percentage of a quantity (Number, level 4)
Number Framework Links
Use this activity to help students consolidate and apply their knowledge of fractions(stages 7 and 8).
Activity
In question 1 of this activity, students use the properties of geometrical shapes to work out whatpart of their areas are white. Dots and lines give additional structure to the shapes and allow fora variety of strategies. Students must explain how they arrived at their solutions. Strategies thatinvolve multiplication of fractions belong at stage 8 on the Number Framework; strategies basedon counting belong at a lower stage.
It is important that you allow for the sharing of strategies so that students who rely on countingare exposed to other, more efficient strategies. Give your students an opportunity to do this wheneveryone has had a chance to solve question 1. Students need to know that any strategy that worksis valid, while at the same time, they get a feel for what constitutes an efficient strategy. In thiscontext, an efficient strategy is one that makes use of symmetry and multiplication to avoidunnecessarily counting. The extra lines on the question 1 diagrams are there to provide clues aboutwhat some of these more efficient strategies might be.
In question 1a, students could simply count the number of smaller squares (16) that make up thelarge square. They could then look at the white part and see that it covers of 4 squares, which isthe same as 2 smaller squares, so or of the large square is white. Alternatively, they couldrecognise that the square has been divided in half and then in half again and again (as shown bythe lines). This means that the area of the white square is of of = of the area of the largesquare. Other multiplicative strategies are possible.
Question 1b can be completed in the same way as question 1a. If we count all the triangles, thenthe white triangle is of the large triangle. Alternatively, we can see that the large triangle hasbeen divided into quarters and the middle quarter has been divided into quarters again, and oneof those quarters is white: of = .
Extension
Question 4 can be extended further by considering part-to-whole shapes. Take a shape (for example,a hexagon) and ask “If this shape is of another shape that I have hidden, what might my shape look like?What shape(s) could be made? How many different solutions are there? How do you know you have themall?” The aim is to encourage the students to search for all solutions rather than stopping at one.Get them to make up a problem of their own, similar to the one above, and swap it with a classmate.But before doing this, they need to make sure that they have answers for their questions, particularly:“How many different solutions are there? How do I know?”
12
216
18
12
12
12
18
116
14
14
116
15
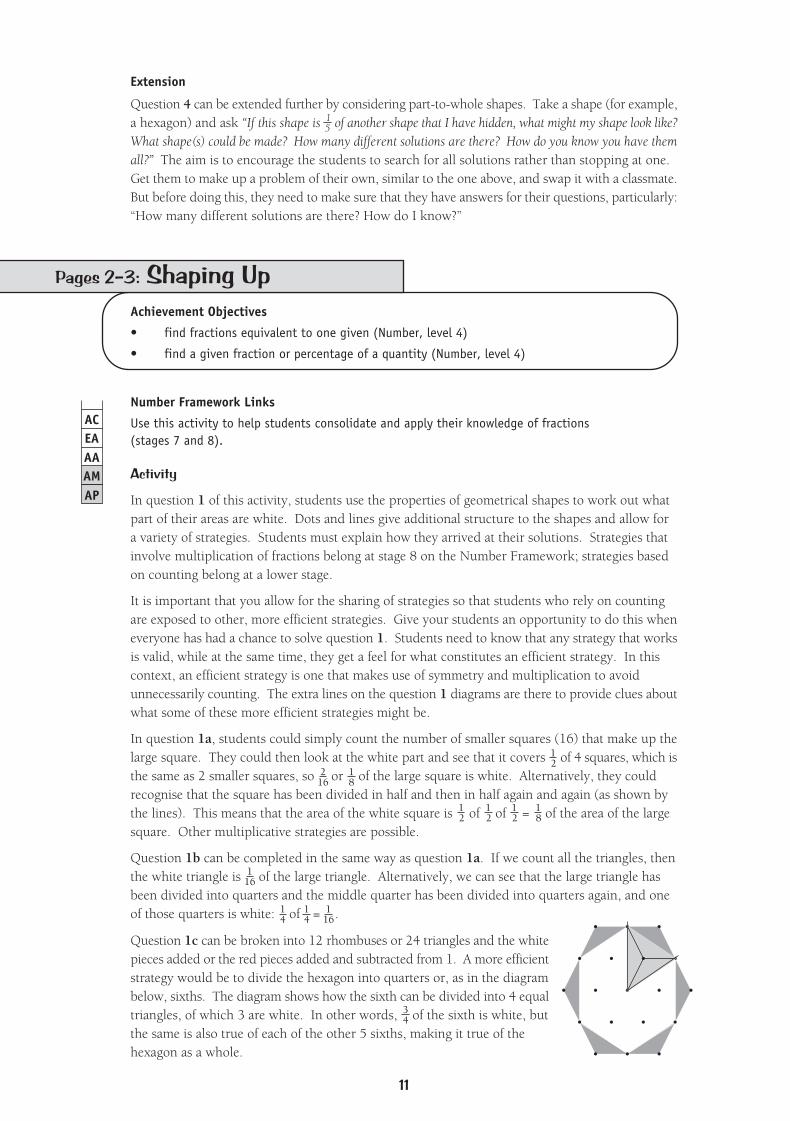
Question 1c can be broken into 12 rhombuses or 24 triangles and the whitepieces added or the red pieces added and subtracted from 1. A more efficientstrategy would be to divide the hexagon into quarters or, as in the diagrambelow, sixths. The diagram shows how the sixth can be divided into 4 equaltriangles, of which 3 are white. In other words, of the sixth is white, butthe same is also true of each of the other 5 sixths, making it true of thehexagon as a whole.
34
ACEAAAAMAP
12
Page 4: Chocolate ChoicesAchievement Objectives
• find fractions equivalent to one given (Number, level 4)
• find a given fraction or percentage of a quantity (Number, level 4)
Number Framework Links
Use this activity to help students learn to express fractions as ratios and to express ratios in theirsimplest form by dividing by common factors (stages 6 and 7).
Activity
Question 1 involves straightforward proportional thinking and can be solved either by countingchocolates and comparing numbers or by making connections between the sizes of the boxes. Inquestion 1a, the students might notice that if they turned box A 90 degrees, it would fit twice intobox B, so 2A = B. Box B would fit neatly over the top of box C, leaving 12 chocolates uncoveredat the bottom, which is the number of chocolates in box A, so C = B + A or C = 3A. Once theyknow the relationship between the sizes of the boxes, it’s easy for them to determine the weightand cost of each.
Question 2 requires the students to work out Tania’s best option. This can be done by countingthe strawberry hearts for each combination of boxes that will make up 1 kg. Box A gives Tania 3:9(or ), box B gives her 8:16 (or ), and box C gives her 13:23 (or ).
If your students have had little experience working with ratios, you will need to show them carefullyhow the ratio 3:9 (favourites to non-favourites) can equally well be expressed as the fraction(favourites out of total number of chocolates in the box).
There are four combinations of boxes that will make up 1 kg: 4 of box A (4A), 2 of box A and 1of box B (2A + B), 2 of box B (2B), or 1 of box A plus 1 of box C (A + C). The last two of theseoptions will give Tania the same number of strawberry hearts: 16. Expressed as a ratio of favouritesto non-favourites, this is 16:32 or 1:2.
Give your students time to explain their strategies. Make sure they understand that the ratios 16:32and 1:2 are identical. They may think that the ratio 16:32 contains within itself the number ofchocolates and 1:2 doesn’t. This is a misconception. A ratio never means anything without itscontext. To make sense of the 16:32 (or 1:2), we need to know the “story” that goes with thenumbers: in this case, the strawberry hearts and the number of chocolates in the boxes.
The rectangle in question 1d has been divided into quarters, then each quarter has been dividedin half and each half divided into quarters, one of which is white. This means that the area of thewhite triangle is x x = of the whole rectangle.
In questions 2 and 3, the students divide the shapes into equal-sized pieces and the name the partsas fractions.
Question 4a poses a challenge that could occupy students for some time. They are likely to thinkthat they have run out of possibilities once they have found four or five different ways of dividingthe triangle into quarters, yet the question says that there are at least 10. The trick is to stop thinkingof symmetrical divisions and to realise that a dot doesn’t always have to be joined to its closestneighbour. The triangle in question 4b is a further case of division into quarters. There are variousways of showing that the areas of the four parts are equal; one is demonstrated step by step in theAnswers.
14
12
14
132
312
824
1336
312
ACEAAAAMAP
13
Question 3 doesn’t introduce any new information or processes but gives students a chance to applyand consolidate the ideas they have met in question 2. They may find it useful to collate theinformation and answers for both questions in a table.
In question 4, the students need to work out which combination of boxes would give each of thethree friends the same number of favourite chocolates. Encourage them to make use of the workthey have already done. There are only four combinations to be considered, and they know fromquestion 2 that both 2B and A + C give Tania 16 of her favourites. The only remaining task is tofind which of these two combinations also gives Atama and Chloe 16 of their favourites.
Page 5: Star ClustersAchievement Objectives
• find fractions equivalent to one given (Number, level 4)
• find a given fraction or percentage of a quantity (Number, level 4)
• find and justify a word formula which represents a given practical situation (Algebra, level 4)
• devise and use problem-solving strategies to explore situations mathematically (MathematicalProcesses, problem solving, level 4)
Number Framework Links
Use this activity to help students consolidate and apply their knowledge of fractions (stages 6 and 7).
Activity
Question 1 has 12 parts to it, so your students may find it helpful if they create a suitable table andthen complete it as they work out each fraction:
Clusters
312
36 =
6 stars 8 stars 12 stars 20 stars
3 star
4 star
5 star
Packets
12
46 = 2
3
56
38
48 = 1
2
58
= 14
412 = 1
3
512
320
420 = 1
5
520 = 1
4
Students should find it easy to come up with numerous answers for question 2 without needingany system. You may, however, like to suggest an approach that will help them find many solutionsat the same time as they create meaning for algebraic representation and substitution.
Suggest using this shorthand: A (for one 6-star packet), B (8 stars), C (12 stars), and D (20 stars).We can see that 144 is divisible by 6 (24A packets make 144), and 8 (18B packets make 144), and12 (12C packets make 144). Also, B + C = D and 2A = C, so by substitution, we can get manymore solutions:6D + 2C = 1445D + 3C + B = 144 (replacing 1D with one B + C)4D + 4C + 2B = 144 (replacing 1D with one B + C)3D + 5C + 3B = 144 (replacing 1D with one B + C)and so on until we end up with 8C + 6B = 144.
We know that 12C = 144 and 2A = C, so we can keep replacing 1C with 2A to get another groupof solutions:2A + 11C = 144 (replacing 1C with 2A)4A + 10C = 144 (replacing 1C with 2A)6A + 9C = 144 (replacing 1C with 2A)and so on until we end up with 24A = 144.
ACEAAAAMAP
14
Other combinations such as 6A + 6B + 3D can provide the starting point for further lists ofpossibilities.
Question 3 asks students to calculate of 144 and of 144. They should share their strategies forthese calculations. Those who know their basic facts are at stage 7 and more likely to use the shortform of division.
Question 4 requires students to express in its simplest form. Although these numbers lie outsidethe range of known facts for many students, they have been working with 144 in questions 2 and3 and should have little trouble finding a strategy that they can use to simplify the fraction. Thosewho remember that 144 = 12 x 12 have access to the most efficient strategy of all, the one thatavoids finding the product 12 x 9 and sees that Anita is in effect using just 9 stars out of every 12,so she uses = of the total.
13
14
108144
912
34
Pages 6–7: What Do You See?Achievement Objectives
• find fractions equivalent to one given (Number, level 4)
• find a given fraction or percentage of a quantity (Number, level 4)
Number Framework Links
Use this activity to help students consolidate and apply their knowledge of equivalent fractions(stage 7), using reunitising as a strategy (stage 8).
Activity
This activity models a classroom situation in which a number of students share different ways ofviewing the shaded part of a rectangle. It doesn’t matter that three of the contributions seemunlikely; they make excellent subjects for discussion. Take particular care with the last two; yourstudents may not have come across such fractions before, but if they study the illustrations, theywill start to put meaning to the tricky notion of a fraction divided by a fraction. Study them carefullybefore introducing this activity to your students and think of ways of rewording or teasing out thespeech bubbles. For example, you could expand the last speech bubble to read: “I can see groupsof 6 squares. There are 3 of these groups. 2 of them are shaded. That’s 2 out of 3 .”
When they come to do question 1, the students should draw on the understanding that they havegained from the discussion of the ideas presented in the speech bubbles, particularly the last two.
In question 2, the students write a number of equivalent fractions. Although they are only askedfor “at least six”, there are in fact an infinite number of possibilities. Encourage them to find at leastone that is a fraction divided by a fraction (for example, 1 / 4 ). Students who have encounteredalgebraic notation may be able to say that all the equivalent fractions can be represented by theterm .
The simplest way of finding out whether an egg tray can be divided into a particular kind of fractionis to check if the denominator is a factor of the number of eggs in the tray (stage 7). In question3b, the students need to draw egg trays and then divide them up accordingly. Some may like thechallenge of finding just how many different ways the trays can be divided into sixths and eighths.
13
x4x
13
18
12
ACEAAAAMAP
15
Page 8: Discount DealsAchievement Objectives
• increase and decrease quantities by given percentages, including mark up, discount, and GST (Number, level 5)
• express a fraction as a decimal, and vice versa (Number, level 4)
• express a decimal as a percentage, and vice versa (Number, level 4)
Number Framework Links
Use this activity to help students consolidate and apply their knowledge of fractions, decimals, andpercentages (stages 7 and 8).
Activity
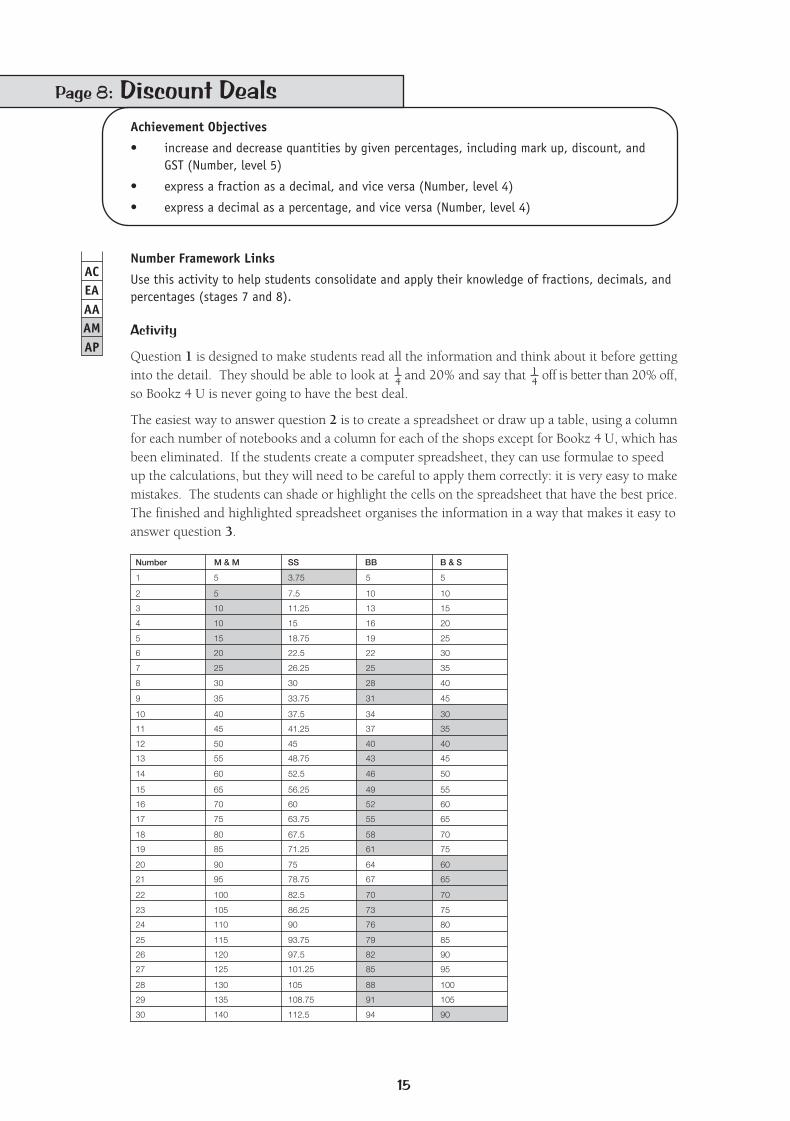
Question 1 is designed to make students read all the information and think about it before gettinginto the detail. They should be able to look at and 20% and say that off is better than 20% off,so Bookz 4 U is never going to have the best deal.
The easiest way to answer question 2 is to create a spreadsheet or draw up a table, using a columnfor each number of notebooks and a column for each of the shops except for Bookz 4 U, which hasbeen eliminated. If the students create a computer spreadsheet, they can use formulae to speedup the calculations, but they will need to be careful to apply them correctly: it is very easy to makemistakes. The students can shade or highlight the cells on the spreadsheet that have the best price.The finished and highlighted spreadsheet organises the information in a way that makes it easy toanswer question 3.
14
14
Number M & M SS BB B & S
1 5 3.75 5 5
2 5 7.5 10 10
3 10 11.25 13 15
4 10 15 16 20
5 15 18.75 19 25
6 20 22.5 22 30
7 25 26.25 25 35
8 30 30 28 40
9 35 33.75 31 45
10 40 37.5 34 30
11 45 41.25 37 35
12 50 45 40 40
13 55 48.75 43 45
14 60 52.5 46 50
15 65 56.25 49 55
16 70 60 52 60
17 75 63.75 55 65
18 80 67.5 58 70
19 85 71.25 61 75
20 90 75 64 60
21 95 78.75 67 65
22 100 82.5 70 70
23 105 86.25 73 75
24 110 90 76 80
25 115 93.75 79 85
26 120 97.5 82 90
27 125 101.25 85 95
28 130 105 88 100
29 135 108.75 91 105
30 140 112.5 94 90
ACEAAAAMAP
16
Page 9: Cereal CalculationsAchievement Objectives
• explain satisfactory algorithms for addition, subtraction and multiplication (Number, level 4)
• share quantities in given ratios (Number, level 5)
Number Framework Links
Use this activity to help students:
• consolidate their knowledge of basic facts (stage 6)
• gain confidence in using partitioning strategies for addition and multiplication(stages 6 and 7)
• apply their knowledge of ratio and proportion (stage 7).
Activity
This activity has an unusual number of details and dimensions. These include:• 3 classes of different size• 3 camps of different length• 3 cereals, each available in 2 sizes• a standard serving• a 3-part ratio to be applied to cereal consumption• a requirement that wastage be minimised• numerous calculations involving x and +• the summarising and interpretation of results.
Given this complexity of information, students are likely to need help working out how the partsrelate to each other and how to bring so many facts together to answer the questions.
Students may have difficulty interpreting the way the discounts are to be applied, and you mayneed to clarify these points by discussion:• One notebook at Mags & More will cost $5, but thanks to their discount, 2 books will also
cost $5. Three or 4 books will cost a total of $10. All further books will cost a further $5.• The off discount at Sam’s Stationery effectively means that the cost of each book is $3.75.• The 40% discount at Bargain Books means that for all books after the first 2, the cost is $3.
(40% of $5 is $2.)
The discount at Books & Stuff means a saving of $20 on every 10 books bought. $20 is the costof 4 books at their regular price, so 10 end up costing the same as 6. Rather remarkably, it ischeaper to buy 10 books than it is to buy 7–9. When entering the information in a spreadsheet,the students should keep adding $5 for each book until they get to 10. At that point, they deduct$20 from the cost and then start adding $5 to this new total for every additional book. They deducta further $20 when the number of books gets to 20 and 30.
As long as the students have constructed a spreadsheet or table, question 3 becomes a matter oflooking at some well-organised information. After 10 books, a pattern emerges:• For numbers that end in 0 or 1, Books & Stuff has the best price.• For numbers that end in 2, Books & Stuff and Bargain Books are equally the best.• For numbers that end in 3–9, Bargain Books has the best price.
ExtensionStudents could cut out and collect newspaper advertisements or flyers illustrating different typesof discount or different discounts being offered on the same or a similar item. They could thencompare them, making a display of their findings.
14
ACEAAAAMAP
17
Page 10: Speed ReadAchievement Objectives
• share quantities in given ratios (Number, level 5)
• write and solve problems involving decimal multiplication and division (Number, level 4)
Number Framework Links
Use this activity to help students consolidate and apply their knowledge of ratios and proportion(stages 6 and 7).
Activity
In this activity, students need to calculate how long it will take Jack and each of his friends to read630 pages, given information about their reading speeds. To help them, all speeds except Jack’sare visualised as double number lines.
The book suggests that a calculator could be used for this activity, but there is nothing in it thatstudents couldn’t reasonably be expected to manage using familiar number strategies. If you decidethat calculators are not to be used, you will need to make this clear from the beginning.
Each part of question 1 can be solved by working out the number of pages the person reads in 1hour and dividing 630 by this number. But the parts can all be solved in a variety of ways, andyour students are more likely to develop their proportional reasoning skills if you don’t give thema formula to follow. Here are examples of possible strategies:Jack: 30 x 20 = 600 and 30 x 1 =30. Time taken = 21 hours.Atama: 20 x 30 = 600 and 20 x 1 = 20, leaving 10, which is half of 20. Time taken = 31.5 hours.Mikey: 45 x 10 = 450 and 630 – 450 = 180, 45 x 2 = 90, so 45 x 4 =180. Time taken = 14 hours.Charlotte: 630 ÷ 9 = 70, so the time taken would be half of this, which is 35 hours.Miranda: 630 ÷ 90 = 7, so she must take 7 x 4 = 28 hours.
Once they are started, however, they will find that the numbers are user-friendly and that the tableon the page gives them an excellent pattern to follow. If your students need a lot of guidance, workthrough question 1 with them step by step and then leave them to do questions 2 and 3 bythemselves or with a classmate. You may need to discuss what kind of table is needed for the finalquestion.
Here is a suggested approach for question 1:1. Interpret the ratio.2. Apply the ratio to the number of students in the class.3. Work out quantities needed for each cereal and enter them in the table.4. Decide what packet(s) to buy.5. Add up the Needed and Buy columns. These two totals are required for question 4.
As mentioned above, the numbers in this activity have been chosen so that students can multiplyand add them using familiar strategies, such as place-value partitioning and rounding andcompensation. Discourage them from using calculators.
ExtensionStudents could investigate the prices of different-sized packets of their favourite cereals in thesupermarket and compare the price per unit. They should think about how to compare the pricesand decide what the best deal is. They could also do a comparative pricing survey of several differentcereals or brands.
ACEAAAAMAP
18
Page 11: Horse SenseAchievement Objectives
• find fractions equivalent to one given (Number, level 4)
• express quantities as fractions or percentages of a whole (Number, level 4)
Number Framework Links
Use this activity to help students consolidate and apply their knowledge of fractions and proportions(stage 7).
Activity
This activity is based on a real-life context: prize pools. Although the book suggests that a calculatorcan be used, students are likely to learn more about proportional reasoning if they manage withoutone. Answers expressed as fractions will picture the ratios better than decimals.
Question 1a provides a visual model of the prize pool and asks students to work out the value ofeach cell ($125). They might do this using a partitioning strategy: 40 x 100 = 4 000, leaving 1 000;40 x 20 = 800, leaving 200; 40 x 5 = 200. So one cell is worth 100 + 20 + 5 = $125. Alternatively,they might note that the grid has 5 rows worth $5,000, so 1 row of 8 cells must be worth $1,000.8 x 100 + 8 x 20 + 8 x 5 = $1,000, so again 1 cell is worth 100 + 20 + 5 = $125.
In question 1b, students shade blocks of cells to represent the value of the first three prizes. Todo this, they first need to work out how many lots of $125 equate to the value of each prize.Perhaps the simplest strategy is to use repeated doubling to establish that 2 cells are worth $250,4 are worth $500, and 8 are worth $1,000. Using this information, students should be able to seethat the winner ($3,125) is represented by 3 x 8 + 1 = 25 cells, and the second and third place-getters ($1,000 and $500) by 8 and 4 cells respectively.
In question 1c, students work out what fraction of the prize pool goes to each of the three place-getters. This is the same as working out what part of the grid has been shaded for each of the threeplacings. All three fractions can be expressed with 40 as the denominator, but you should beencouraging your students to always simplify fractions if possible.
The 3 unshaded cells should tell the students that the answer for question 1d is . At this point,you could ask them why the grid was divided into 40 rather than 20 or 50 or some other number.The reason is, of course, that 40 is the lowest common denominator of the four fractions, , ,
, and .
Students with more advanced proportional reasoning skills may realise that it is possible to use thereading time for one person to find the reading time for another. For example, Mikey reads 90pages in 2 hours, which is twice Miranda’s speed, so Miranda must take twice as long as Mikey:2 x 14 = 28 hours. Jack reads 1 times as fast as Atama, so Atama must take 1 times as long asJack: 1 x 21 = 31 hours.
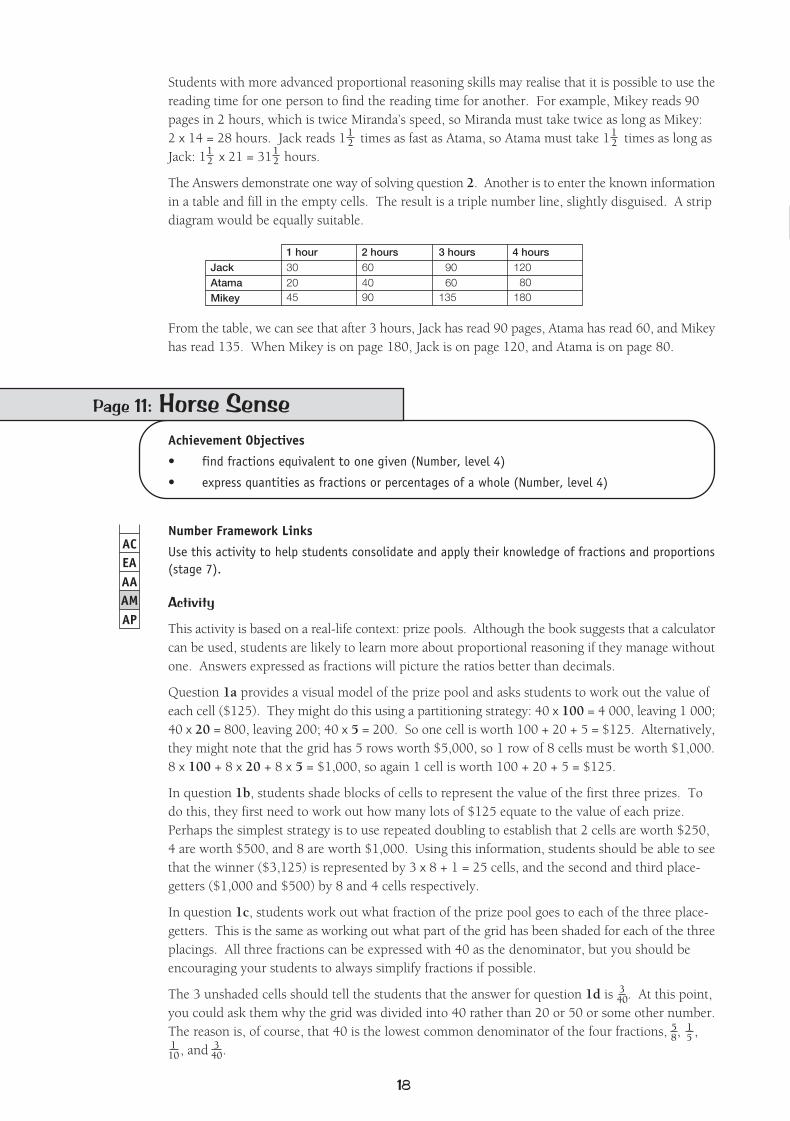
The Answers demonstrate one way of solving question 2. Another is to enter the known informationin a table and fill in the empty cells. The result is a triple number line, slightly disguised. A stripdiagram would be equally suitable.
12
12
12
12
From the table, we can see that after 3 hours, Jack has read 90 pages, Atama has read 60, and Mikeyhas read 135. When Mikey is on page 180, Jack is on page 120, and Atama is on page 80.
1 hour 2 hours 3 hoursJack
4 hours
AtamaMikey
302045
604090
9060
135
12080
180
340
58
15
110
340
ACEAAAAMAP
19
Pages 12–13: Small BusinessAchievement Objectives
• write and solve problems which involve whole numbers and decimals and which require a choice of one or more of the four arithmetic operations (Number, level 3)
• find a given fraction or percentage of a quantity (Number, level 4)
Number Framework Links
Use this activity to help students
• consolidate their knowledge of basic facts (stage 6)
• consolidate and apply their knowledge of fractions (stages 6 and 7)
• develop their ideas about proportion (stage 7).
Activity
Using this imaginative (and unlikely!) business scenario, students explore the difference betweengroup and individual profit and calculate and compare different profits.
Before they get far with question 1, they need to address the question posed by the thought bubble:“How do you measure success?” It is clear that the Five Alive group had the largest group profit($4 more than any of the other three teams), but when the $30 is shared between the 5 membersof the team, this amounts to $6 each, which is less than the $7 per person earned by the membersof the Carwash Ltd team. So if success is the profit earned by the individual members of the team,Carwash Ltd is most successful. Students are likely to see the second measure of success as themost valid one.
Question 2 is about order: does it make a difference whether we divide and then multiply or multiplyand then divide? Students will find that no matter which of the four sets of results they use, theyget the same answer regardless of the order of the operations. For example, Five Alive:
• Option 1: Each person gets 30 ÷ 5 = $6; when tripled by the 2-for-1 offer, this becomes6 x 3 = $18.
• Option 2: The group profit, once tripled by the 2-for-1 offer, is 30 x 3 = 90; when shared between 5 people, this becomes 90 ÷ 5 = $18.
You could discuss with your students whether showing that this is true for one group is enoughto prove that it is always true. (It’s not. They could have a rogue result. They should check thefigures for the other three groups for a greater degree of certainty.)
Question 3 asks students to look at the amount each person receives (including the bonus) andcompare this with the original profit for the whole team. The result in each case is best expressedby a fraction. If the four fractions are left as improper fractions, an interesting pattern can be seen:
. You could challenge your students to think about why this pattern occurs. The reasonsare these: the top number says that the profit has been tripled; the bottom number says that it isshared among that number of people. So the fraction is independent of the dollar value of theprofit: if the profit is doubled and there are 7 people to share it, the fraction is .
For question 2, students need to calculate the trainer’s fraction; they can then halve it for the jockey.They first must know that 10% is the same as . The Answers show how the answers can beworked out by multiplying two fractions then simplifying.
Once students have solved question 2, they can use their solutions to provide the answer to question3. No further calculation is needed.
110
32
33
34
35, , ,
27
ACEAAAAMAP
20
Pages 14–15: Getting ToughAchievement Objectives
• express a decimal as a percentage, and vice versa (Number, level 4)
• find a given fraction or percentage of a quantity (Number, level 4)
Number Framework Links
Use these activities to help students consolidate their knowledge of basic facts (stage 6) and usethem in conjunction with percentages (stage 7).
Activity
This activity illustrates the way that a training programme for an endurance event is often constructed.It gives students practice at interpreting information expressed as percentages, finding a percentageof a quantity (of time), and rounding. If your students are not very familiar with percentages, youshould do some pre-teaching. You will also need to make a decision on whether you want themto use calculators for the first three questions. If not, discuss with them the kinds of strategies thatthey will need. If yes, make sure that they know how to enter percentages on a calculator. Evenif theirs has a % key, expect them to enter percentages as decimals: 0.8 for 80%, 0.25 for 25%, 0.05for 5%. By insisting on this, you will reinforce the understanding that the decimal and percentageforms are mathematically identical, you will be saving the students unnecessary keystrokes, andyou will ensure that they are able to do percentage calculations on any calculator, not just one witha % key.
In question 1a, students work out their own maximum heart rate. This is expressed as maximumheartbeats per minute. Using the given formula, a 9-year-old’s maximum heart rate would be220 – 9 = 211 beats/min.
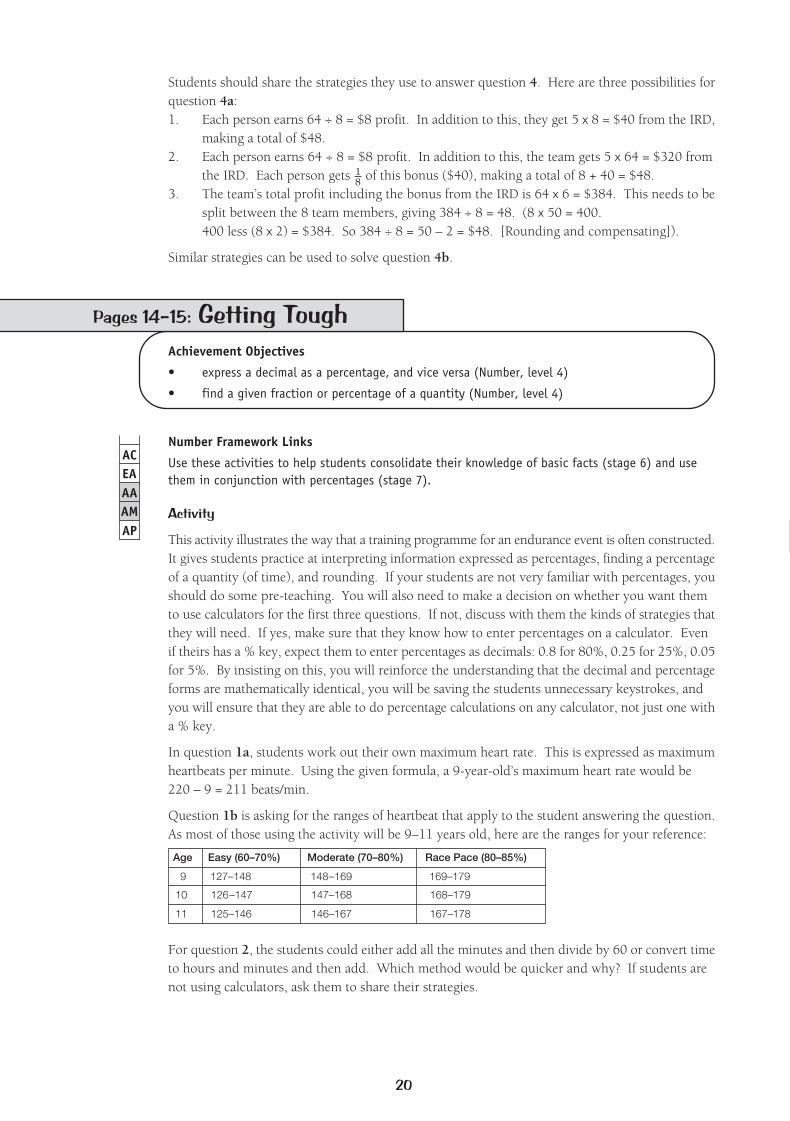
Question 1b is asking for the ranges of heartbeat that apply to the student answering the question.As most of those using the activity will be 9–11 years old, here are the ranges for your reference:
Students should share the strategies they use to answer question 4. Here are three possibilities forquestion 4a:1. Each person earns 64 ÷ 8 = $8 profit. In addition to this, they get 5 x 8 = $40 from the IRD,
making a total of $48.2. Each person earns 64 ÷ 8 = $8 profit. In addition to this, the team gets 5 x 64 = $320 from
the IRD. Each person gets of this bonus ($40), making a total of 8 + 40 = $48.3. The team’s total profit including the bonus from the IRD is 64 x 6 = $384. This needs to be
split between the 8 team members, giving 384 ÷ 8 = 48. (8 x 50 = 400.400 less (8 x 2) = $384. So 384 ÷ 8 = 50 – 2 = $48. [Rounding and compensating]).
Similar strategies can be used to solve question 4b.
18
For question 2, the students could either add all the minutes and then divide by 60 or convert timeto hours and minutes and then add. Which method would be quicker and why? If students arenot using calculators, ask them to share their strategies.
Age Easy (60–70%) Moderate (70–80%) Race Pace (80–85%)
9
10
11
127–148
126–147
125–146
148–169
147–168
146–167
169–179
168–179
167–178
ACEAAAAMAP
21
Page 16: Demolition DollarsAchievement Objectives
• write and solve problems which involve whole numbers and decimals and which require a choice of one or more of the four arithmetic operations (Number, level 3)
• find and justify a word formula which represents a given practical situation (Algebra, level 4)
Number Framework Links
Use this activity to help students:
• consolidate their knowledge of basic facts (stage 6) and advanced multiplicative strategies (stage 7)
• develop strategies for solving problems involving rates and proportion (stage 7).
Activity
This activity requires students to work through a series of problems, each of which has one missingdetail that can be deduced using proportional reasoning. The speech bubble and the answer toquestion 1 contain information that is needed for answering questions 2–7; questions 2–6 are notinterdependent, but question 7 relies on correct answers for questions 2 and 6.
The activity is rich with potential for proportional reasoning. Each part can be solved in a varietyof different ways, and the numbers are such that there is no need for a calculator. Those who likethe challenge of a puzzle may be able to work through each step independently, but you may preferto discuss it first with your students before setting them to work in pairs or small groups. Makesure that you give them the opportunity to share their strategies.
Question 3 asks students to convert the percentage amounts to their minute equivalents, roundedto the nearest 5 minutes. They should begin by drawing up a suitable table. This should be similarto the one in the student book but with the third column split into 3 so that there is a separatecolumn for each training zone. If the information is organised in this way, it becomes very easyto answer the last question.
The calculations required for question 3 all involve user-friendly numbers, so there is no particularneed for calculators. By using number strategies, students will gain experience and confidence atworking with percentages and their fraction equivalents. For example: 25% of 140 is the same as
of 140. 140 = 100 + 40. of 100 = 25 and of 40 = 10, so of 140 = 25 + 10 = 35.
Make sure that you remind students to round to the nearest 5 minutes. This is partly to keep thenumbers simple, but it also reflects the fact that it is unlikely that a training programme of this kindwould be organised in blocks of 19 minutes or 51 minutes (for example). When a number is exactlyhalfway between two 5s, it is standard practice to round up. In this situation, another number willhave to be rounded down so that the total minutes remain the same. This means that the numbersin the Answers may be up to 5 minutes different from your students’ answers, depending on theorder in which they did the parts.
Question 4 asks for the proportion of time Maree will spend in each of the zones. As long as theyhave completed a table as suggested for question 3, all that the students need to do is put the totalfor each of the three zones (in turn) over the total minutes for the entire training programme,calculate the results as decimals, and interpret these as percentages. A calculator is definitely neededfor these calculations.
14
14
14
14
ACEAAAAMAP
22
Page 17: Painting by NumbersAchievement Objective
• share quantities in given ratios (Number, level 5)
Number Framework Links
Use this activity to introduce students to the concept of inverse proportion (stages 7 and 8).
Activity
This activity introduces students to inverse proportion. This is the kind of relationship that existsbetween two quantities when an increase in one means a decrease in the other. Students knowwithout being told that such relationships exist, and when you introduce this activity, you couldbegin by drawing out that knowledge.
Examples of inverse relationships include: the more fully the taps are turned on, the less time ittakes to fill the bath; the faster you bike, the shorter the journey; the slower you type, the longerthe document takes; the more expensive an item, the fewer you can buy; the bigger the files, thefewer that will fit on a disk; the thicker you apply the paint, the smaller the area you can cover.
An important idea about inverse relationships is that they can only exist when they relate to a thirdthing that is fixed in size or quantity: a bath to be filled, a journey to be completed, a documentto be typed, an amount of money to be spent, a disk to be filled, a can of paint to be applied. Ifyou had an endless supply of money, the relationship between cost and number would no longerbe an inverse one: you could buy as much or as many of something as you wanted, no matter whatthe cost.
The following paragraphs suggest one way of reasoning out the answer to each question:
For question 1, we know that the boys worked 24 hours in total and earned $120. Using a halvingstrategy, 120 ÷ 24 = 60 ÷ 12 = 5, so the pay rate is $5 per hour.
The calculation for question 2 is 7 x 4 x 5 = $ . 28 x 5 = 14 x 10 = $140 (doubling and halving).Alternatively, students may realise that 1 boy working for 4 hours earns $20, so 7 boys workingfor 4 hours will earn 7 x 20 = $140.
The weekly target mentioned in question 3 is $150. This represents 30 hours’ work. If 5 boysworked for a total of 30 hours, they each worked for 6 hours (6 x 5 = 30).
In week 4 (question 4), the boys earned $225 in 5 hours, so in 1 hour they must have earned225 ÷ 5 = $45. If the boys earned $45 in 1 hour, there must have been 9 boys working(5 x 9 = 45).
In question 5, we know how many parents worked, so one approach is to begin by finding outwhat the parent contribution was. The 3 parents worked for 4 hours at a rate of $10 per hour, sothey earned 3 x 4 x 10 = $120 of the total of $280. This means the boys earned 280 – 120 = $160.The boys also worked for 4 hours, so each hour they earned 160 ÷ 4 = $40. This means that 8boys worked that day (5 x 8 = $40).
In question 6, we have all the details we need to go straight to the answer: the boys earn$(10 x 4 x 5) and the parents earn $(2 x 4 x 10). 10 x 20 + 8 x 10 = 200 + 80 = $280.
Question 7 requires students to add together the totals for the 6 weekends:120 + 140 + 150 + 225 + 280 + 280 = $1,195. So Braydn’s team is short of its target by $5.
23
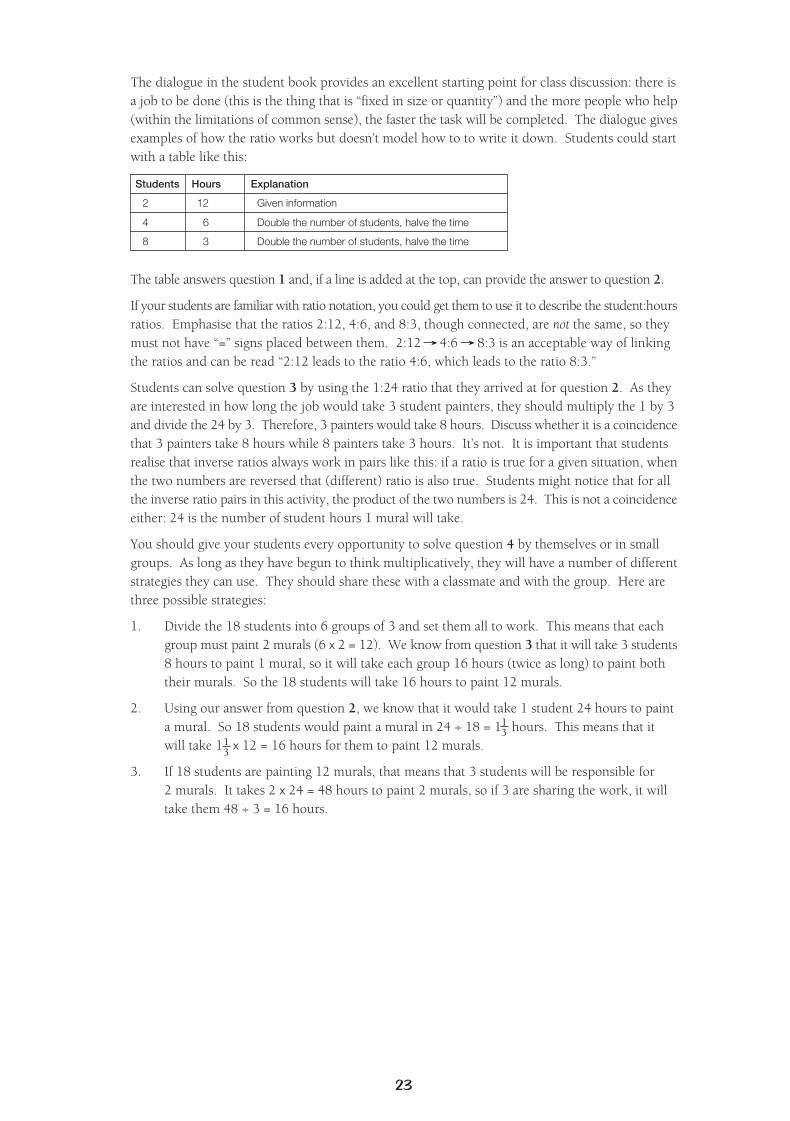
The dialogue in the student book provides an excellent starting point for class discussion: there isa job to be done (this is the thing that is “fixed in size or quantity”) and the more people who help(within the limitations of common sense), the faster the task will be completed. The dialogue givesexamples of how the ratio works but doesn’t model how to to write it down. Students could startwith a table like this:
The table answers question 1 and, if a line is added at the top, can provide the answer to question 2.
If your students are familiar with ratio notation, you could get them to use it to describe the student:hoursratios. Emphasise that the ratios 2:12, 4:6, and 8:3, though connected, are not the same, so theymust not have “=” signs placed between them. 2:12 4:6 8:3 is an acceptable way of linkingthe ratios and can be read “2:12 leads to the ratio 4:6, which leads to the ratio 8:3.”
Students can solve question 3 by using the 1:24 ratio that they arrived at for question 2. As theyare interested in how long the job would take 3 student painters, they should multiply the 1 by 3and divide the 24 by 3. Therefore, 3 painters would take 8 hours. Discuss whether it is a coincidencethat 3 painters take 8 hours while 8 painters take 3 hours. It’s not. It is important that studentsrealise that inverse ratios always work in pairs like this: if a ratio is true for a given situation, whenthe two numbers are reversed that (different) ratio is also true. Students might notice that for allthe inverse ratio pairs in this activity, the product of the two numbers is 24. This is not a coincidenceeither: 24 is the number of student hours 1 mural will take.
You should give your students every opportunity to solve question 4 by themselves or in smallgroups. As long as they have begun to think multiplicatively, they will have a number of differentstrategies they can use. They should share these with a classmate and with the group. Here arethree possible strategies:
1. Divide the 18 students into 6 groups of 3 and set them all to work. This means that each group must paint 2 murals (6 x 2 = 12). We know from question 3 that it will take 3 students8 hours to paint 1 mural, so it will take each group 16 hours (twice as long) to paint both their murals. So the 18 students will take 16 hours to paint 12 murals.
2. Using our answer from question 2, we know that it would take 1 student 24 hours to painta mural. So 18 students would paint a mural in 24 ÷ 18 = 1 hours. This means that it will take 1 x 12 = 16 hours for them to paint 12 murals.
3. If 18 students are painting 12 murals, that means that 3 students will be responsible for2 murals. It takes 2 x 24 = 48 hours to paint 2 murals, so if 3 are sharing the work, it will take them 48 ÷ 3 = 16 hours.
Students Hours Explanation
2 Given information
4
8
12
6
3
Double the number of students, halve the time
Double the number of students, halve the time
13
13
ACEAAAAMAP
24
Pages 18–19: Make 1.5Achievement Objectives
• write and solve problems which involve whole numbers and decimals and which require a choice of one or more of the four arithmetic operations (Number, level 3)
• express quantities as fractions or percentages of a whole (Number, level 4)
• find fractions equivalent to one given (Number, level 4)
Number Framework Links
Use this activity to:
• help students consolidate their basic addition facts (stages 5 and 6) and whole number strategiesand apply these to decimal numbers (stage 7)
• introduce the idea that proportions can be compared (stage 8).
Game
This game is designed to give students practice at adding decimals. The range of numbers used(all expressed to 1 decimal place) reinforces students’ knowledge of basic number facts at the sametime as it strengthens their understanding of place value.
If your students have had only a little experience of decimals, you may find it worthwhile to dosome pre-teaching using The Value of Place Value (Book 5: Teaching Addition, Subtraction, and PlaceValue, Numeracy Project series, page 48).
The game is similar to games that students may already be familiar with and is straightforward tolearn and play. But it is a good idea to introduce it to the whole group using another target number(for example, 1.7). If you do this, you can make sure that everyone understands the rules, knowsthe aim of the game, and is aware of the mathematical strategies needed. Some students will beable to use known facts to handle all the additions. Others may use tidy number and/or doublingstrategies. For example: you have 0.9 and are trying to make 1.7. 0.9 + 0.1 = 1, and0.1 + 0.7 = 0.8, so 0.8 is the card needed.
Make sure, too, that everyone knows how to score the game. Players can only earn points if theyget rid of all their cards before the other player. The points they earn are the total of the numberson the cards left in their opponent’s hand plus the 5 bonus points. The 15 points total to win agame is only a suggestion. Working to that total, the bonus points alone will ensure that the firstplayer to win 3 rounds wins the game. The winner may even reach the total of 15 in 2 rounds iftheir opponent is left with a number of high cards each time.
Activity
The activity is an extension to the game (not a necessary part of it) that involves adding multipledecimal numbers and determining which of two proportions is greater. This latter skill will be newto a number of students, and you will need to think about how to introduce it. Mixing Numbers(Book 7: Teaching Fractions, Decimals, and Percentages, Numeracy Project series, pages 34–35) suggestsone approach. Fraction Strips (Numeracy Project material master 7-7, available at www.nzmaths.co.nz)provides another approach. All the proportions encountered in questions a–e can be found on thismaterial master and easily compared one with another. A third approach is to express each pairof proportions as fractions over a common denominator. It is then immediately obvious which isthe greater.
ACEAAAAMAP
25
Page 20: Pop Star PicsAchievement Objective
• There are no directly applicable achievement objectives, but enlargement appears under thesuggested learning experiences for Geometry, levels 3 and 4.
Number Framework Links
Use this activity to help students learn to solve problems involving fractions, proportions, and ratios(stage 8).
Activity
This activity introduces ratio in an enlargement context. Students learn that by comparing knownlengths, they can find missing lengths. They also learn how to test whether one figure is anenlargement of another.
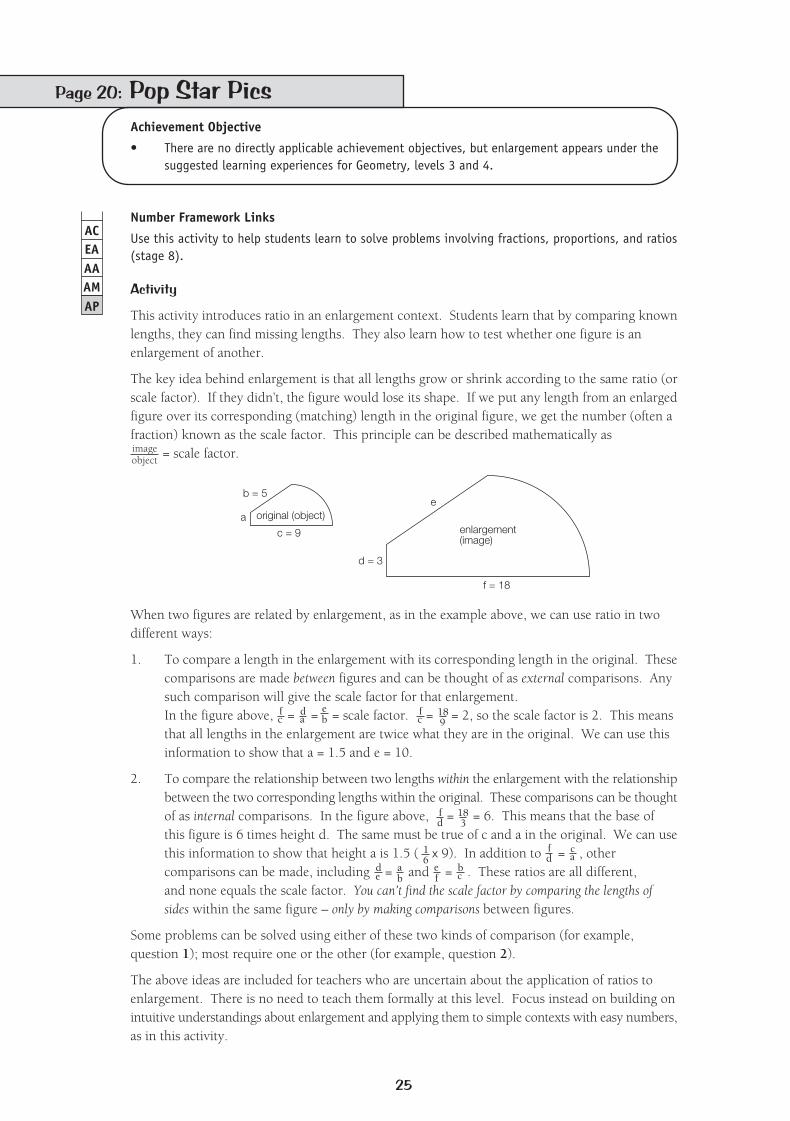
The key idea behind enlargement is that all lengths grow or shrink according to the same ratio (orscale factor). If they didn’t, the figure would lose its shape. If we put any length from an enlargedfigure over its corresponding (matching) length in the original figure, we get the number (often afraction) known as the scale factor. This principle can be described mathematically as
= scale factor.
When two figures are related by enlargement, as in the example above, we can use ratio in twodifferent ways:
1. To compare a length in the enlargement with its corresponding length in the original. Thesecomparisons are made between figures and can be thought of as external comparisons. Any such comparison will give the scale factor for that enlargement.In the figure above, = = = scale factor. = = 2, so the scale factor is 2. This means that all lengths in the enlargement are twice what they are in the original. We can use this information to show that a = 1.5 and e = 10.
2. To compare the relationship between two lengths within the enlargement with the relationshipbetween the two corresponding lengths within the original. These comparisons can be thoughtof as internal comparisons. In the figure above, = = 6. This means that the base of this figure is 6 times height d. The same must be true of c and a in the original. We can usethis information to show that height a is 1.5 ( x 9). In addition to = , other comparisons can be made, including = and = . These ratios are all different, and none equals the scale factor. You can’t find the scale factor by comparing the lengths of sides within the same figure – only by making comparisons between figures.
Some problems can be solved using either of these two kinds of comparison (for example,question 1); most require one or the other (for example, question 2).
The above ideas are included for teachers who are uncertain about the application of ratios toenlargement. There is no need to teach them formally at this level. Focus instead on building onintuitive understandings about enlargement and applying them to simple contexts with easy numbers,as in this activity.
a
b = 5
c = 9
original (object)enlargement(image)
f = 18
d = 3
e
fc
da
eb
fc
189
fd
183
ca
16
fd
de
ab
ef
bc
imageobject
ACEAAAAMAP
26
Page 21: Tiring TeamworkAchievement Objective
• use equipment appropriately when exploring mathematical ideas (Mathematical Processes, problem solving, level 4)
Number Framework Links
Use this activity to help students learn to solve problems with the use of fractions, proportions, andratios (stages 7 and 8).
Activity
This problem-solving activity requires students to work out how long it would take walkers walkingat different speeds to lap each other. Give your students every chance to solve the problemsthemselves, working in pairs or groups of no more than four. There are at least three strategiesthat they could use: a circular diagram, a double strip diagram, and a table.
The student book suggests using a circular diagram with counters to represent the walkers.Alternatively, students could mark a copy of the copymaster, using a pencil. A teaching clock facewould serve the same purpose as long as the hands can be moved independently to represent thetwo walkers.
If they use a circular diagram, students may find it easier to focus on where the slower walker iswhen the fastest walker completes a lap rather than plot minute-by-minute progress as suggestedin the student book. In question 1, Kelvin takes 6 minutes and Ian 8 minutes, so where wouldIan be when Kelvin has completed a circuit? Expressed differently, if Ian takes 8 minutes to do 1lap, where is he after 6 minutes? After 6 minutes, he has completed or of a lap. After 12minutes, Kelvin has completed 2 laps and Ian 2 x = 1 laps.
In question 1, students can use ratio in either of the two ways outlined above:
1. By comparing the base of the small rectangle with that of the medium rectangle, it can be seen that the scale factor must be = . In other words, all lengths in the small rectangle are of what they are in the medium rectangle. This means that height A must be
x 9 = 6 cm. Similarly, by comparing the base of the large rectangle with the base of the medium rectangle, we can see that the scale factor for this enlargement is = = 3 . So height B must be 3 x 9 = 27 + 3 = 30 cm.
2. Comparing the height of the medium rectangle with its base, it can be seen that the height:baseratio is = = 1 . In other words, the height is 1 times the base. The same must be truein the small rectangle, so height A must be 1 x 4 = 6 cm. Similarly, height B must be1 x 20 = 30 cm.
Students may need help to understand what question 2 means and to realise that they have to findwhich pairs of pictures have the same height:width or width:height ratio. Encourage your studentsto find their own strategies for solving this problem and to share them. The simplest strategy islikely to be to express each ratio in its simplest form (either using ratio notation, as below, or as afraction):i. 4:6 = 2:3 ii. 9:15 = 3:5 iii. 5:6 = 5:6iv 7:8 = 7:8 v. 12.5:15 = 25:30 = 5:6 vi. 6:9 = 2:3.
From the above, it is obvious that i and vi both have the same width:height ratio, as do iii and v,so these must be the pairs.
46
23
23
23
206
103
13
13
96
32
12
12
12
12
68
34
34
12
ACEAAAAMAP
27
Pages 22-23: The Great RaceAchievement Objectives
• write and solve problems which involve whole numbers and decimals and which require a choice of one or more of the four arithmetic operations (Number, level 3)
• read and interpret everyday statements involving time (Measurement, level 3)
• choose and construct quality data displays (frequency tables, bar charts, and histograms) to communicate significant features in measurement data (Statistics, level 4)
Number Framework Links
Use this activity to help students:
• consolidate and apply a range of multiplicative strategies (stage 7)
• solve problems with the use of fractions, proportions, and ratios (stages 7 and 8).
Activity
Like the previous activity, this one requires students to compare the progress of two objects (thistime, cars) moving at different speeds. It is more straightforward in that the race takes place on astraight track but more complex in that each car stops and starts for various periods and one changesspeed part-way through.
After 24 minutes, Kelvin will have completed 4 laps and Ian 4 x = 3 laps, so at that point, Kelvinis exactly 1 lap ahead of Ian.
The Answers show how the same information can be pictured using a double strip diagram.
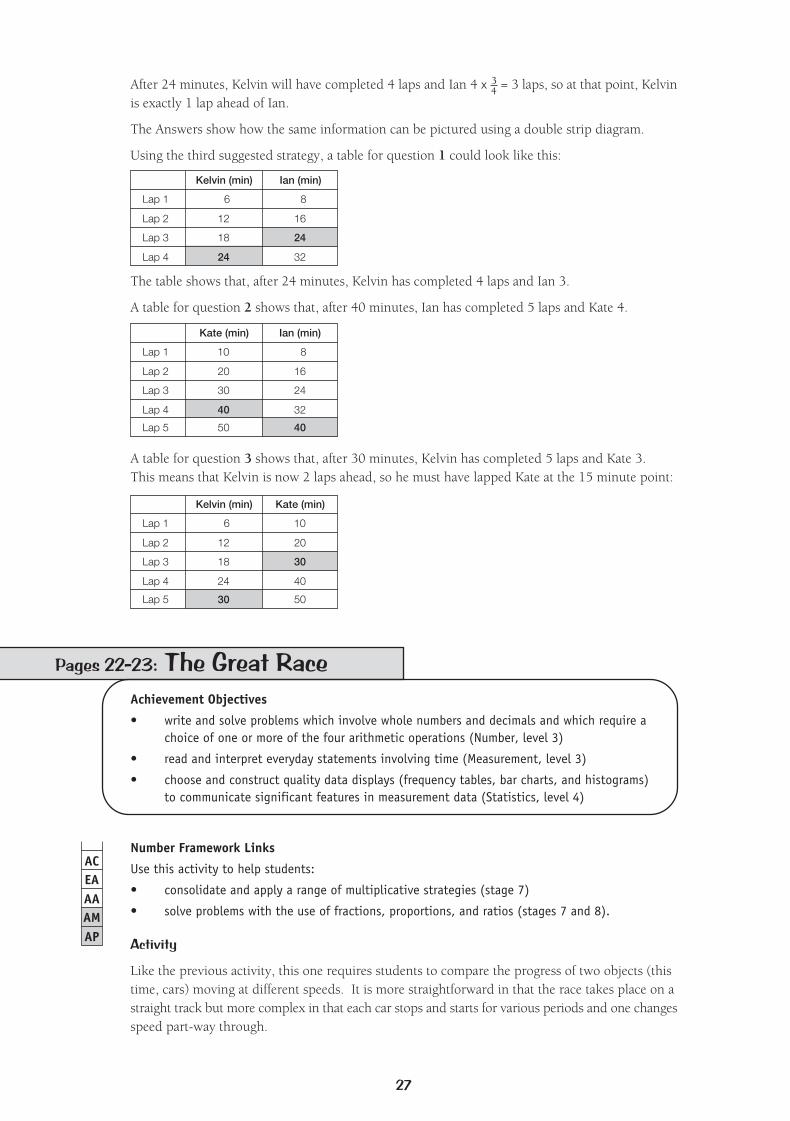
Using the third suggested strategy, a table for question 1 could look like this:
34
Kelvin (min)
Lap 1
Lap 2
Lap 3
12
18
Ian (min)
Lap 4 24
6
16
24
32
8
The table shows that, after 24 minutes, Kelvin has completed 4 laps and Ian 3.
A table for question 2 shows that, after 40 minutes, Ian has completed 5 laps and Kate 4.
Kate (min)
Lap 1
Lap 2
Lap 3
20
30
Ian (min)
Lap 4 40
10
16
24
32
8
A table for question 3 shows that, after 30 minutes, Kelvin has completed 5 laps and Kate 3.This means that Kelvin is now 2 laps ahead, so he must have lapped Kate at the 15 minute point:
Kelvin (min)
Lap 1
Lap 2
Lap 3
12
18
Kate (min)
Lap 4 24
20
30
40
Lap 5
6
30
10
50
Lap 5 50 40
28
Because there are quite a few details to absorb, students need to make sure that they read theinformation carefully and interpret it correctly. One way of making sure that they do this is to putthem in groups of three as for question 2 and have them read the activity through and then recountthe details to each other without referring to the book. Other members of the group can then askquestions (especially about meaning), supply missing details, and correct errors. At the end, everydetail is cross-checked against the book, and the group is ready to go. Alternatively, you may wantto get everyone together for a final sharing and briefing.
The race starts at 5:00 a.m., but Sunlight Sprinter (SS) only operates from 6:00 a.m., so Pedal PowerPlus (PPP) is able to get a 1 hour head start. As PPP travels 25 km in 1 hour, the answer to question1a is 25 km.
Questions 1b and 1c require students to work out how many hours each car spends travelling andto multiply these by the number of kilometres they cover each hour. Students should not usecalculators for these calculations.
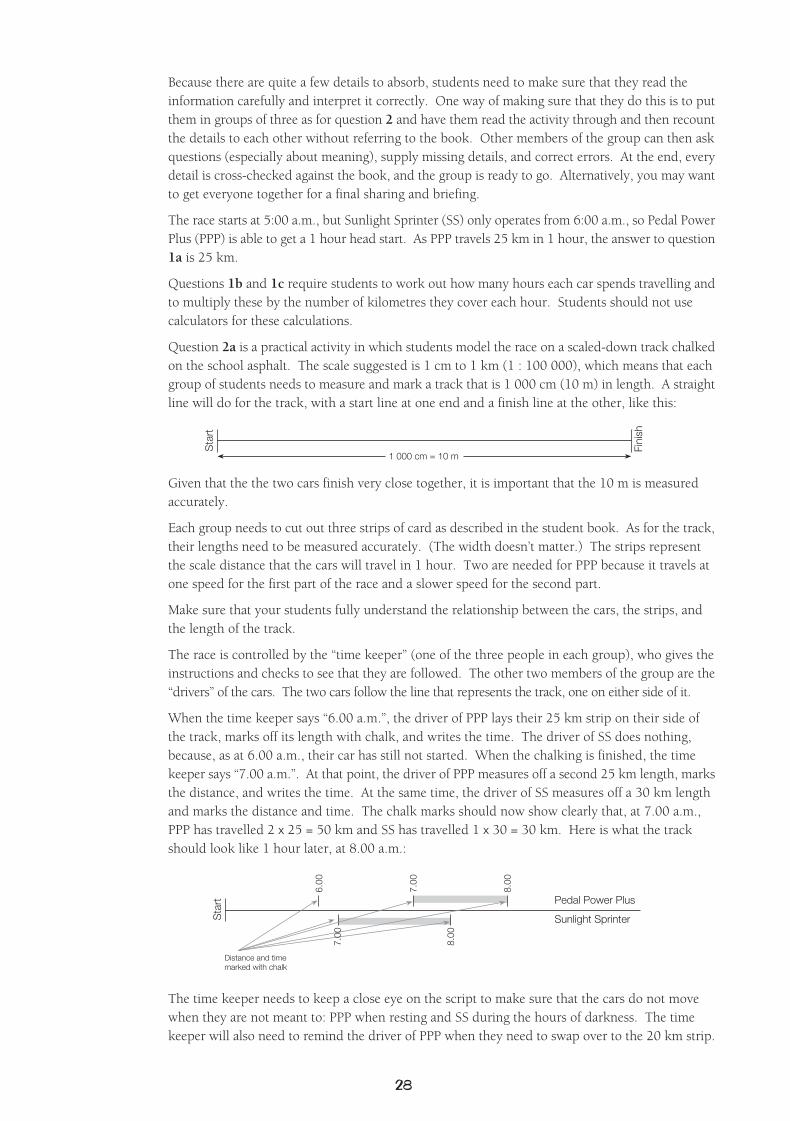
Question 2a is a practical activity in which students model the race on a scaled-down track chalkedon the school asphalt. The scale suggested is 1 cm to 1 km (1 : 100 000), which means that eachgroup of students needs to measure and mark a track that is 1 000 cm (10 m) in length. A straightline will do for the track, with a start line at one end and a finish line at the other, like this:
Sta
rt
Fini
sh
1 000 cm = 10 m
Given that the the two cars finish very close together, it is important that the 10 m is measuredaccurately.
Each group needs to cut out three strips of card as described in the student book. As for the track,their lengths need to be measured accurately. (The width doesn’t matter.) The strips representthe scale distance that the cars will travel in 1 hour. Two are needed for PPP because it travels atone speed for the first part of the race and a slower speed for the second part.
Make sure that your students fully understand the relationship between the cars, the strips, andthe length of the track.
The race is controlled by the “time keeper” (one of the three people in each group), who gives theinstructions and checks to see that they are followed. The other two members of the group are the“drivers” of the cars. The two cars follow the line that represents the track, one on either side of it.
When the time keeper says “6.00 a.m.”, the driver of PPP lays their 25 km strip on their side ofthe track, marks off its length with chalk, and writes the time. The driver of SS does nothing,because, as at 6.00 a.m., their car has still not started. When the chalking is finished, the timekeeper says “7.00 a.m.”. At that point, the driver of PPP measures off a second 25 km length, marksthe distance, and writes the time. At the same time, the driver of SS measures off a 30 km lengthand marks the distance and time. The chalk marks should now show clearly that, at 7.00 a.m.,PPP has travelled 2 x 25 = 50 km and SS has travelled 1 x 30 = 30 km. Here is what the trackshould look like 1 hour later, at 8.00 a.m.:
Sta
rt
6.00
7.00
8.00
8.00
Distance and timemarked with chalk
The time keeper needs to keep a close eye on the script to make sure that the cars do not movewhen they are not meant to: PPP when resting and SS during the hours of darkness. The timekeeper will also need to remind the driver of PPP when they need to swap over to the 20 km strip.
Pedal Power Plus
Sunlight Sprinter
7.00
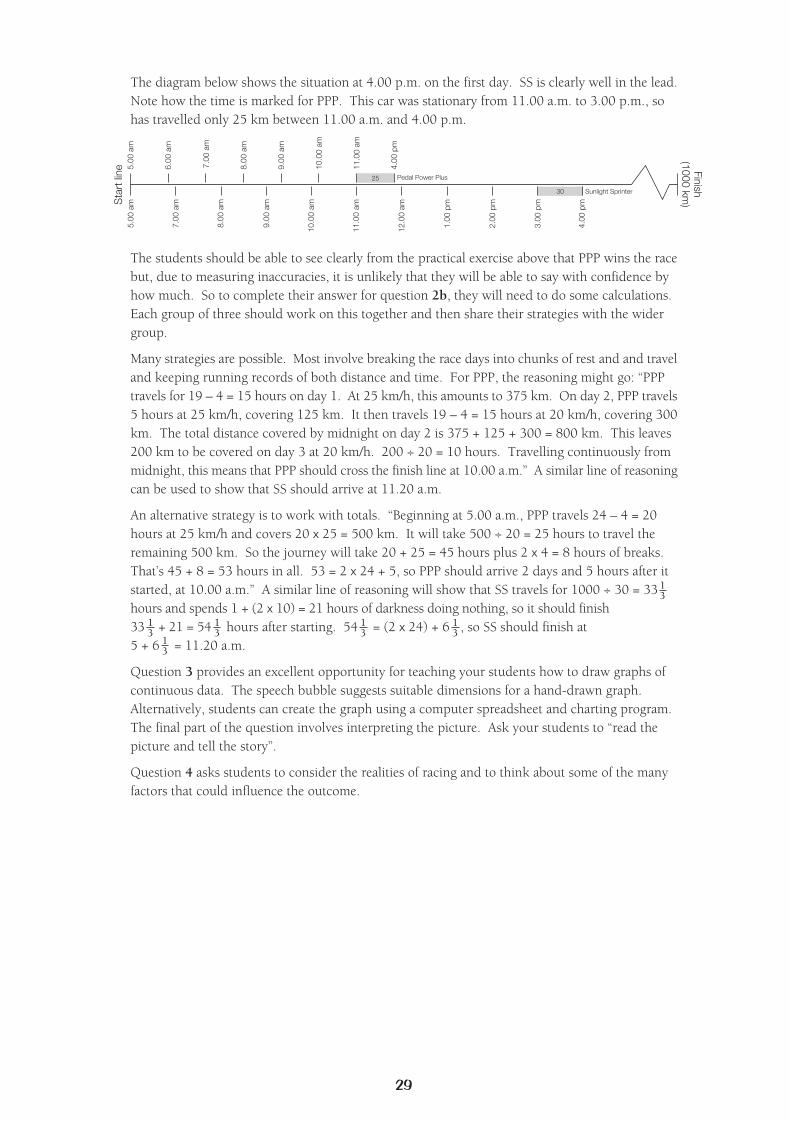
29
The students should be able to see clearly from the practical exercise above that PPP wins the racebut, due to measuring inaccuracies, it is unlikely that they will be able to say with confidence byhow much. So to complete their answer for question 2b, they will need to do some calculations.Each group of three should work on this together and then share their strategies with the widergroup.
Many strategies are possible. Most involve breaking the race days into chunks of rest and and traveland keeping running records of both distance and time. For PPP, the reasoning might go: “PPPtravels for 19 – 4 = 15 hours on day 1. At 25 km/h, this amounts to 375 km. On day 2, PPP travels5 hours at 25 km/h, covering 125 km. It then travels 19 – 4 = 15 hours at 20 km/h, covering 300km. The total distance covered by midnight on day 2 is 375 + 125 + 300 = 800 km. This leaves200 km to be covered on day 3 at 20 km/h. 200 ÷ 20 = 10 hours. Travelling continuously frommidnight, this means that PPP should cross the finish line at 10.00 a.m.” A similar line of reasoningcan be used to show that SS should arrive at 11.20 a.m.
An alternative strategy is to work with totals. “Beginning at 5.00 a.m., PPP travels 24 – 4 = 20hours at 25 km/h and covers 20 x 25 = 500 km. It will take 500 ÷ 20 = 25 hours to travel theremaining 500 km. So the journey will take 20 + 25 = 45 hours plus 2 x 4 = 8 hours of breaks.That’s 45 + 8 = 53 hours in all. 53 = 2 x 24 + 5, so PPP should arrive 2 days and 5 hours after itstarted, at 10.00 a.m.” A similar line of reasoning will show that SS travels for 1000 ÷ 30 = 33hours and spends 1 + (2 x 10) = 21 hours of darkness doing nothing, so it should finish33 + 21 = 54 hours after starting. 54 = (2 x 24) + 6 , so SS should finish at5 + 6 = 11.20 a.m.
Question 3 provides an excellent opportunity for teaching your students how to draw graphs ofcontinuous data. The speech bubble suggests suitable dimensions for a hand-drawn graph.Alternatively, students can create the graph using a computer spreadsheet and charting program.The final part of the question involves interpreting the picture. Ask your students to “read thepicture and tell the story”.
Question 4 asks students to consider the realities of racing and to think about some of the manyfactors that could influence the outcome.
The diagram below shows the situation at 4.00 p.m. on the first day. SS is clearly well in the lead.Note how the time is marked for PPP. This car was stationary from 11.00 a.m. to 3.00 p.m., sohas travelled only 25 km between 11.00 a.m. and 4.00 p.m.
Sta
rt li
ne Finish(1000 km
)
Pedal Power Plus
5.00
am
5.00
am
6.00
am
7.00
am
8.00
am
9.00
am
10.0
0 am
11.0
0 am
4.00
pm
7.00
am
8.00
am
9.00
am
10.0
0 am
11.0
0 am
12.0
0 am
1.00
pm
2.00
pm
3.00
pm
4.00
pm
Sunlight Sprinter30
25
13
13
13
13
13
13
ACEAAAAMAP
30
Page 24: A Dog’s BreakfastAchievement Objectives
• express a decimal as a percentage, and vice versa (Number, level 4)
• solve practical problems involving decimals and percentages (Number, level 5)
Number Framework Links
Use this activity to help students consolidate and apply their knowledge of fractions, proportions,and ratios (stage 7).
Activity
This activity gives students practice at finding percentages of amounts using a calculator androunding.
In question 1, they need to add up the number of meals the dogs have in 1 day and then doublethis to give the number needed for 2 days.
In question 2, they need to calculate the daily food allowance for each dog and divide this by thenumber of times the dog is to be fed. For example, Danny the Dane’s daily allowance is 2% of 59 kg.0.02 x 59 = 1 180 g. 1 180 ÷ 2 = 590 g per meal. A more efficient strategy would be to use thefact that Danny’s daily allowance is 2% of his body weight and he gets this in two instalments. Thismeans that he must get 1% (half of 2%) of his body weight each morning and evening. 1% of59 kg is 0.59 kg or 590 g.
Make sure that your students know how you expect them to solve percentage problems on acalculator. Insist that they enter percentages directly as their decimal equivalents. This reinforcesthe fact that, for example, 4% = 0.04 and means that the students will not be at a loss when theyhave to use a calculator without a % key. Teach them how to read a decimal as a percentage (forexample, 1.2 as 120%). Discourage them from multiplying by . By learning good practices atthis stage, they will come to understand the meaning of percentages and how to work with themas numbers.
Note that the activity uses kilograms as the unit for mass while the answers use grams. Ask yourstudents for their views on the reason for this apparent inconsistency. The reason is that the gramunit is most suited to small weights, particularly those less than a couple of kg, while the kg unitis most suited to bigger weights, particularly those that are over a couple of thousands of grams.This is partly because all those zeros on bigger weights become a nuisance (Sam the St Bernardwith a weight of 78 000 g!) and partly because we are not usually interested in finding or writingthe weights of heavier things accurate to the last gram.
The question calls for answers to be rounded to the nearest 10 g. Check that everyone understandshow to do this, making sure that they understand the convention of rounding up when the numberis halfway between two 10s.
Many students are very interested in pets and may like to use this activity as a springboard forextension work. They could investigate local kennels, including how they manage the feedingprocess, ensure hygiene, allow for exercise, and what they charge. Or they could investigate whatdaily food allowance is recommended for cats and survey friends and classmates to find out howmuch their cats weigh and how much food they are fed.
1001
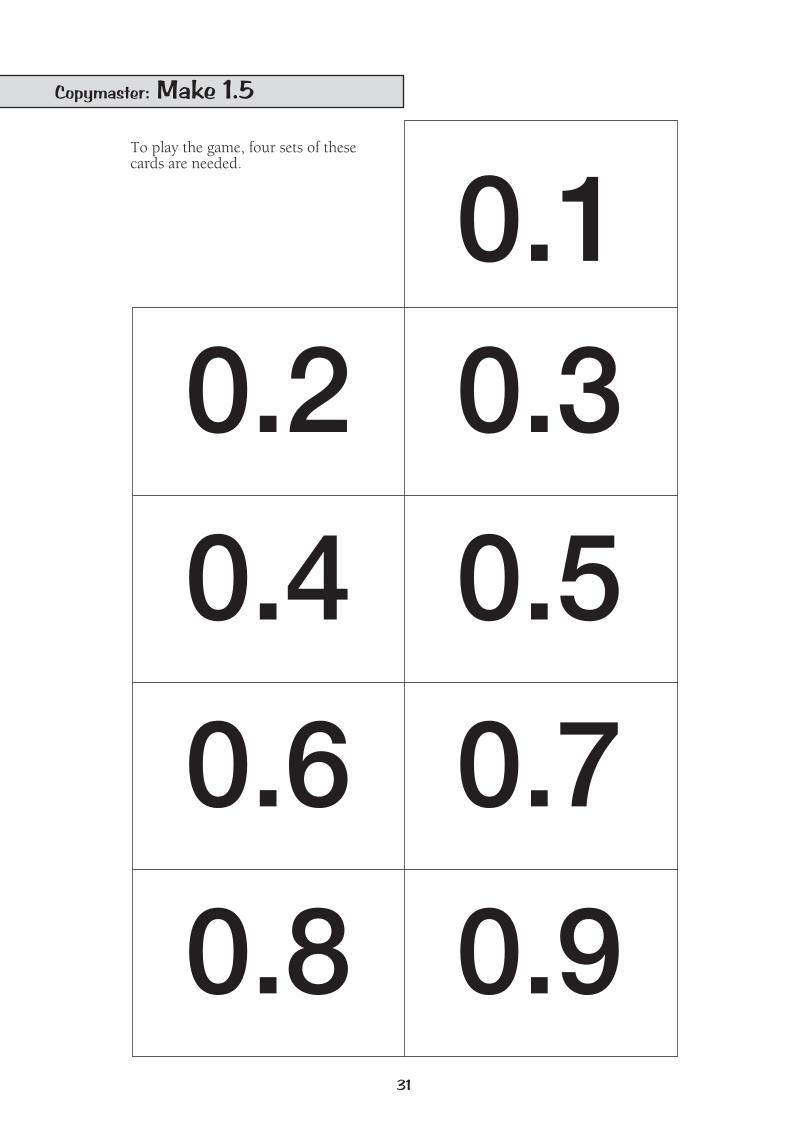
0.10.30.2
0.4
0.6
0.8
0.5
0.7
0.931
Copymaster: Make 1.5
To play the game, four sets of thesecards are needed.
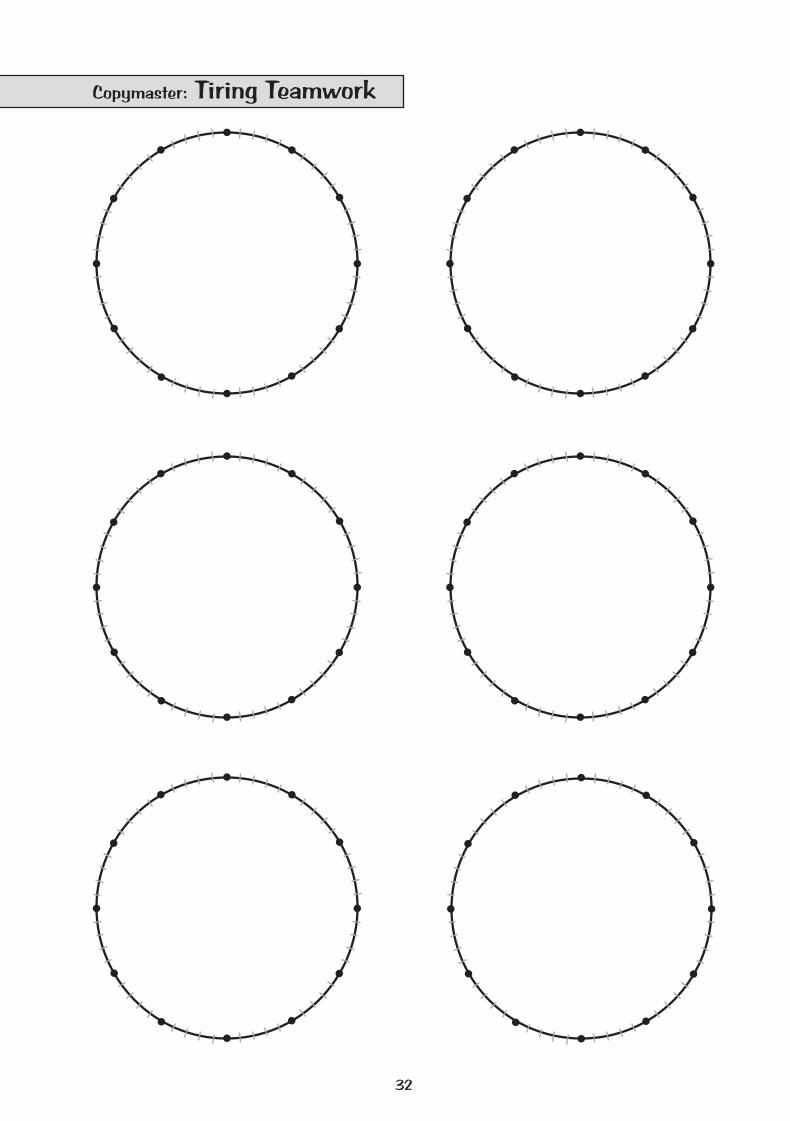
32
Copymaster: Tiring Teamwork
Acknowledgments
Learning Media and the Ministry of Education would like to thank Deb Gibbs, MasseyUniversity College of Education, for developing these teachers’ notes.
The photographs of the students on the cover are by Mark Coote and Adrian Heke.The illustration on the cover is by Donovan Bixley.
All other illustrations and diagrams are by Bunkhouse graphic design.
All these images are copyright © Crown 2006.
Series Editor: Susan RocheEditor: Ian ReidDesigner: Bunkhouse graphic design
Published 2006 for the Ministry of Education byLearning Media Limited, Box 3293, Wellington, New Zealand.www.learningmedia.co.nz
Copyright © Crown 2006All rights reserved. Enquiries should be made to the publisher.
Dewey number 512ISBN 0 7903 1339 1PDF ISBN 0 7903 1349 9Item number 31339Students’ book item number 31338