Embed Size (px)
Citation preview
Biogeosciences Discuss., 4, 993–1057, 2007www.biogeosciences-discuss.net/4/993/2007/© Author(s) 2007. This work is licensedunder a Creative Commons License.
BiogeosciencesDiscussions
Biogeosciences Discussions is the access reviewed discussion forum of Biogeosciences
Methane hydrate stability andanthropogenic climate changeD. Archer
Department of the Geophysical Sciences, University of Chicago, Chicago, USA
Received: 20 March 2007 – Accepted: 25 March 2007 – Published: 3 April 2007
Correspondence to: D. Archer ([email protected])
993
Abstract
Methane frozen into hydrate makes up a large reservoir of potentially volatile carbonbelow the sea floor and associated with permafrost soils. This reservoir intuitivelyseems precarious, because hydrate ice floats in water, and melts at Earth surfaceconditions. The hydrate reservoir is so large that if 10% of the methane were released5
to the atmosphere within a few years, it would have an impact on the Earth’s radiationbudget equivalent to a factor of 10 increase in atmospheric CO2.
Hydrates are releasing methane to the atmosphere today in response to anthro-pogenic warming, for example along the Arctic coastline of Siberia. However most ofthe hydrates are located at depths in soils and ocean sediments where anthropogenic10
warming and any possible methane release will take place over time scales of millen-nia. Individual catastrophic releases like landslides and pockmark explosions are toosmall to reach a sizable fraction of the hydrates. The carbon isotopic excursion at theend of the Paleocene has been interpreted as the release of thousands of Gton C, pos-sibly from hydrates, but the time scale of the release appears to have been thousands15
of years, chronic rather than catastrophic.The potential climate impact in the coming century from hydrate methane release is
speculative but could be comparable to climate feedbacks from the terrestrial biosphereand from peat, significant but not catastrophic. On geologic timescales, it is conceiv-able that hydrates could release much carbon to the atmosphere/ocean system as we20
do by fossil fuel combustion.
994

1 Methane in the carboncycle
1.1 Sources of methane
1.1.1 Juvenile methane
Methane, CH4, is the most chemically reduced form of carbon. In the atmosphereand in parts of the biosphere controlled by the atmosphere, oxidized forms of carbon5
are most stable, such as CO2, the carbonate ions in seawater, and CaCO3 minerals.Methane is therefore a transient species in our atmosphere; its concentration mustbe maintained by ongoing release. One source of methane to the atmosphere is thereduced interior of the Earth, via volcanic gases and hydrothermal vents. Reducingpower can leak from the interior of the Earth in other forms, such as molecular hydro-10
gen, which creates methane from CO2. The other source of reduced carbon is fromphotosynthesis, harvesting energy from sunlight. By far the greatest portion of themethane was generated originally from photosynthesis, rather than juvenile releasefrom the Earth.
Photosynthesis does not produce methane directly, because methane as a gas has15
little use in the biochemical machinery. Most biomolecules utilize carbon in an inter-mediate oxidation state, such as carbohydrates made up of multiples of the unit CH2Owith zero oxidation state, or on the reduced end of the spectrum lipids with an oxidationstate near –2. Once produced, biomolecules can be post-processed into methane byone of two general pathways. One is biological, mediated by bacteria at low tempera-20
tures, and the other is abiological, occurring spontaneously at elevated temperatures.
1.1.2 Biogenic methane
Biogenic methane is a product of organic matter degradation. Microbial respirationtends to utilize the partner electron acceptor which will maximize the energy yield fromthe organic matter. In the presence of molecular oxygen, O2, oxic respiration is the25
995
most energetically lucrative, and this is the pathway that is followed. With the depletionof O2, respiration proceeds using electron acceptors in the order NO−
3 , Mg2+, Fe2+,
then SO2−4 . Of these, SO2−
4 has potentially the highest availability, because seawater
contains high concentrations of SO2−4 . Once the SO2−
4 is depleted, mathanogenesis
can begin. Fresh water has less SO2−4 than seawater, so methanogenesis begins di-5
agenetically earlier in fresh water systems. These pathways can be distinguished bytheir isotopic signatures of δ13C and δD in the methane (Sowers, 2006; Whiticar andFaber, 1986) . In sulfate-depleted salt water, the dominant pathway is the reduction ofCO2 by molecular hydrogen, H2. H2 is produced bacterially by fermentation of organicmatter, and is ubiquitous in marine sediments, implicated in many other diagenetic re-10
actions such as iron, manganese, and nitrate reduction (Hoehler et al., 1999). Carbonisotopic values range from –60 to –100‰ while δD is typically –175 to –225‰. In freshwaters, the dominant pathway appears to be by the splitting of acetate into CO2 +CH4. Acetate, CH3COO−, can be produced from molecular hydrogen, H2, and CO2(Hoehler et al., 1999). The H2 is produced by fermentation of organic matter (Hoehler15
et al., 1998). The isotopic signature is –40 to –50 in δ13C, and –300 to –350‰ in δD.Ultimately, by conservation of oxidation state, if the source of reducing power is organicmatter, then a maximum of 50% of the organic carbon can be converted to methane(Martens et al., 1998), by the reaction
2CH2O− > CO2 + H2O20
In sediments, biogenic methane production at the Blake Ridge is inferred to takeplace hundreds of meters below the depth where SO2−
4 is depleted. , as indicated by
linear gradients in SO2−4 and CH4 as they diffuse toward their mutual annihiliation at
the methane sulfate boundary (Egeberg and Barth, 1998). At other locations methano-genesis is inferred to be occurring throughout the sulfate-rich zone, but methane only25
accumulates to high concentrations when sulfate is gone (D’Hondt et al., 2004; D’Hondtet al., 2002). Biological activity has been inferred to take place as deep as 800 metersbelow the sea floor (D’Hondt et al., 2002, 2004; Wellsbury et al., 2002).
996

1.1.3 Thermogenic methane
As temperatures increase to about 110◦C degrees (Milkov, 2005), methane is pro-duced, abiologically, from photosynthetically-produced organic matter. This thermo-genic methane is distinguished by carbon isotopic values of about –30‰ (Whiticarand Faber, 1986), in contrast with the much lighter values, –60 to –110‰ of biogenic5
methane. Thermogenic methane is often associated with petroleum, coal, and otherforms of fossil carbon. Petroleum is converted to methane if the deposits have everbeen buried deeper than the “oil window” of 7–15 km depth (Deffeyes, 2001). Most ofthe hydrates in the ocean derive from biogenic methane, but the Gulf of Mexico (Milkov,2005) and the Siberian gas fields (Grace and Hart, 1986) are examples of hydrate sys-10
tems dominated by thermogenic methane.Thermogenic methane is also accompanied by other small organic compounds such
as ethane (Milkov, 2005). In addition to serving as a tracer for the origin of the methane,these compounds affect the thermodynamics of hydrate formation. Pure methaneforms Type I structural hydrates, while the inclusion of a few percent of ethane or H2S15
favors Type II structure. Type II hydrates are stable to 5–10◦C warmer, or perhaps100 m deeper in the geothermal gradient in warmer temperatures (Sloan, 1998).
1.2 Radiative impacts of methane release
1.2.1 Atmospheric release
CO2 is the dominant anthropogenic greenhouse gas in the atmosphere, because the20
anthropogenic perturbation to the CO2 concentration is much larger than the anthro-pogenic change in CH4. However, the higher concentration of CO2 means that on aper-molecule basis, CO2 is a less potent greenhouse gas than CH4. Figure 1 showsthe direct radiative impact of changes in CO2 and CH4 concentrations. The most sig-nificant practical distinction between the gases is that CO2 is more concentrated in25
the atmosphere than is methane. For this reason, the strongest absorption bands of
997
CO2 already absorb most of the outgoing longwave light from the ground. An increasein CO2 concentration tends to make the absorption bands a bit wider, but they can-not get any more intense. Methane is less concentrated than CO2, and its absorptionbands less saturated, so a single molecule of additional methane has a larger impacton the radiation balance than a molecule of CO2, by about a factor of 24 (Wuebbles5
and Hayhoe, 2002). Methane has an indirect radiative effect, as its oxidation in thestratosphere produces water vapor (Hansen et al., 2005). The radiative impact of CH4follows the concentration to roughly the 1/3 power, while the CO2 impact follows the logof the concentration. To get an idea of the scale, we note that a doubling of methanefrom present-day concentration would be equivalent to 60 ppm increase in CO2 from10
present-day, and 10 times present methane would be equivalent to about a doublingof CO2. A release of 500 Gton C as methane (order 10% of the hydrate reservoir) tothe atmosphere would have an equivalent radiative impact to a factor of 10 increase inatmospheric CO2.
Once methane is released to the oxic, sunlit atmosphere, it oxidizes to CO2 on a15
time scale of about a decade. Ultimately, the oxidizing power comes from O2, but thereactive compound OH is a necessary intermediate, following the reaction
CH4 + OH− > CH3 + H2O
where CH3 produced is a reactive radical compound, quickly reacting with water vaporand other gases to form ultimately CO2. OH is produced by photolysis, the absorption20
of light energy by the severing of a chemical bond. Ozone photolyzes in the tropo-sphere to yield OH, as does H2O2 and NO2. In the absence of sunlight, such as in icecores, no OH is produced, and CH4 and O2 are able to coexist with negligible reactionfor hundreds of thousands of years.
The implication of the short lifetime of methane in the atmosphere is that the con-25
centration of methane at any given time is determined by the rate of methane emissionover the past few decades. If emission is steady with time, then the steady-state atmo-
998
spheric concentration can be expressed as
Inventory [mol]=Emission flux[mol/year]. Atmospheric lifetime [years]
One uncertainty in this equation is how strongly the methane lifetime may depend onthe methane source flux. If the methane oxidation rate is limited by the supply rate ofOH, then an increase in the methane source flux could increase the methane lifetime in5
the atmosphere. In atmospheric photochemical models, a doubling of the source fluxresults in more than a doubling of the concentration (Pavlov et al., 2000).
The concentration of OH, and hence the lifetime and steady-state concentration ofmethane, could theoretically be affected by anthropogenic emissions of combustionproducts such as the nitrogen oxides NOx, hydrocarbons, and carbon monoxide. In10
another atmospheric chemistry model (Wang and Jacob, 1998), the concentrations ofseveral of gases have undergone order-one changes, but the effects of these changeson the OH concentration appear to largely cancel each other out.
If the methane is released quickly, on a time scale that is short compared to theatmospheric lifetime, the methane concentration spikes upward, decaying back toward15
the steady-state concentration. We will refer to a fast release as a “catastrophic”methane release, as opposed to a long-term ongoing or “chronic” release. If therecord of methane concentration recorded in an ice core is smoothed by too muchtime-averaging, then the maximum concentration of the event may not be recorded inice cores (Thorpe et al., 1996). The current inventory of methane in the atmosphere is20
about 3 Gton C. Therefore, the release of 1 Gton C of methane catastrophically to theatmosphere would raise the methane concentration by 33%. 10 Gton C would tripleatmospheric methane.
1.2.2 Radiative impact of methane oxidized in the ocean
Once the methane is oxidized to CO2, it still acts as a greenhouse gas, albeit with25
less intensity. CO2 equilibrates between the atmosphere and the ocean on a timescale of hundreds of years (Archer, 2005). Depending on the magnitude of the CO2
999
release, i.e. the pH perturbation of the ocean, the equilibrium between the atmosphereand the ocean finds 15–30% of the CO2 release remains in the atmosphere. Thispartitioning will apply whether the methane is oxidized in the atmosphere or in the oxicocean. If the methane is oxidized in the atmosphere, the initial condition has moreCO2 in the atmosphere than at equilibrium, and the excess CO2 will invade the ocean.5
Methane oxidized in the ocean will increase the inventory of CO2 in the ocean, leadingto gradual degassing of 15–30% over the coming centuries. The final distribution of theCO2 between the atmosphere and ocean will be the same regardless of whether thesource of the CO2 is in the atmosphere or the ocean.
Excess CO2 in the atmosphere is gradually neutralized by dissolution of carbonate10
and silicate rocks, on time scales that range as long as 400 kyr (Archer, 2005). So,while methane is a transient species in the atmosphere, CO2 accumulates. For thisreason, the impact of a slow, ongoing methane release might be to have greater radia-tive forcing from the accumulated CO2 than from the increased methane concentration,even while the methane release is ongoing (Fig. 2 from Archer and Buffett, 2005, see15
also Harvey and Huang, 1995; Schmidt and Shindell, 2003).There exists an alternate pathway for methane oxidiation which does not produce
CO2, but rather bicarbonate ion HCO−3 . This is anaerobic oxidation of methane (AOM)
(Boetius et al., 2000),
SO2−4 + CH4 → HCO−
3 + HS− + H2O20
The fate of the released alkalinity is often to precipitate as CaCO3. Authigenic CaCO3has been used as a tracer for the locations of CH4 emissions at Hydrate Ridge (Teichertet al., 2003, 2005), and invoked as an active player in the life cycle of an emission field(Luff et al., 2005). A young vent site should have an irregular, patchy distribution ofcarbonates, while an old site has become paved over with large flat CaCO3 slabs,25
which tend to seal off the methane emission (Sager et al., 1999).
1000

2 The geology of methane hydrate
2.1 Methane production
The majority of the hydrate deposits on Earth are composed of biogenic methane, asindicated by its isotopic composition and the lack of other short hydrocarbons such asethane. Most of the organic matter raining to the sea floor decomposes in the few cen-5
timeters of the sediment, called the zone of early diagenesis. However, the productionof methane from this decaying organic matter is usually inhibited by the presence ofdissolved sulfate, providing a more energetically favorable respiration pathway.
Sulfate is removed from pore waters deeper in the sediment by reaction with methane(anaerobic oxidation of methane, AOM, described above) . This reaction prevents10
sulfate and methane from coexisting at high concentrations in sediment porewa-ters. Typically both species diffuse toward their mutual annihilation at a well-definedmethane/sulfate boundary (Borowski et al., 1996, 1999; D’Hondt et al., 2004). Afterthe depletion of sulfate, methane can be produced from solid organic carbon, or byreaction of dissolved organic carbon, notably acetate, carried into the methanogenesis15
zone by diffusion or pore water advection. Wellsbury et al. (1997) found that heatingsediment in the lab, up to 60◦C, stimulates the bacterial production of acetate. At BlakeRidge, the concentration of acetate reaches very high concentrations, supplying 10%of the reduced carbon necessary for methane production (Egeberg and Barth, 1998).
Bacterial abundances and metabolic rates of methanogenesis, acetate formation,20
and AOM are extremely high at the base of the hydrate and gas zone, rivaling metabolicrates at the sediment surface (Parkes et al., 2000). Bacterial activity is detected withinthe hydrate zone as well Orcutt et al. (2004).
1001
2.2 Methane transport
2.2.1 Diffusion
Once formed, methane moves within the sediment column by diffusion, porewater flow,or migration of bubbles. The time scale for diffusion depends on the length scale as
T [s] = ∆x2[m2]/D[m2/s]5
where D is a diffusion coefficient, of order 10−9, 10−6, and 10−4 m2/s for a solute, forheat, and for pressure, respectively. Heat can diffuse approximately 100 m in about 300years (Fig. 3). Solutes such as dissolved methane diffuse more slowly, while a pressureperturbation, such as would result from melting of hydrate to methane bubbles, diffusesaway more quickly.10
Diffusion is slow enough to insulate most of the hydrate reservoir from anthropogenicwarming in the coming century. Methane released to the dissolved phase, such asproposed by (Sultan et al., 2004), is unlikely to have much impact on climate for thisreason also.
2.2.2 Aqueous flow15
Pore water flow has the potential to determine the distribution of hydrates within thesediment column. One source of fluid flow is the compaction of sediment as it is buriedand subjected to increasing lithostatic pressure. The degree of compaction of sedimentgrains is a conserved diagnostic of the maximum lithostatic pressure they have endured(Flemings et al., 2003). Subducting sediments in active margins expel water more20
quickly than passive margins. Formation of hydrates at the surface and dissolution atdepth apparently also acts as a source of upward flowing pore fluid at Hydrate Ridge(Suess et al., 1999).
Pore water flow can be focused by layers of high permeability in sediments (Aoki etal., 2000; Flemings et al., 2003; Hovland et al., 1997). Lateral flow steered by sedi-25
1002

ment permeability predicts expulsion of fluid near the base of the continental slope offof New Jersey, consistent with the observed patterns of porewater seeps, and leadingto nucleation of landslides from the base of the slope, consistent with the observationof submarine canyons on continental margins (Dugan and Flemings, 2000). Fluid flowof methane-bearing porewater might be regulated by the formation of authigenic car-5
bonate, blocking and steering the channels of flow (Luff et al., 2005). Focused fluideffluent from the sediment into the ocean generates a structure known as a mud vol-cano (Dimitrov, 2002). There are approximately 1800 mud volcanos around the world,above and below sea level, mostly centered in a belt called the mud volcano belt be-ginning in the Mediterranean Sea and winding across Asia to Indonesia. Submarine10
mud volcanos are often associated with methane hydrates (see below).
2.2.3 Gas migration
In addition to pore water flow, methane is able to move as a gas. In cohesive sedi-ments, bubbles expand by fracturing the sediment matrix, resulting in elongated shapes(Boudreau et al., 2005). Bubbles tend to rise because they are less dense than the wa-15
ter they are surrounded by, even at the 200+ atmosphere pressures in sediments ofthe deep sea. If the pressure in the gas phase exceeds the lithostatic pressure inthe sediment, fracture and gas escape can occur (Flemings et al., 2003). Modeledand measured (Dickens et al., 1997) pressures in the sediment column at Blake Ridgeindicate that this may be going on.20
There is a differential-pressure mechanism which begins to operate when the bub-bles occupy more than about 10% of the volume of the pore spaces (Hornbach et al.,2004). If a connected bubble spans a large enough depth range, the pressure of thepore water will be higher at the bottom of the bubble than it is at the top, because ofthe weight of the pore water over that depth span. The pressure inside the bubble25
will be more nearly constant over the depth span, because the compressed gas is notas dense as the pore water is. This will result in a pressure gradient at the top andthe bottom of the bubble, tending to push the bubble upward. Hornbach et al. (2004)
1003
postulated that this mechanism might be responsible for allowing methane to escapefrom the sediment column, and calculated the maximum thickness of an interconnectedbubble zone, before the bubbles would break through the overlying sediment column.In their calculations, and in in stratigraphic deposits (they refer to them as “basin set-tings”) the thickness of the bubble column increases as the stability zone gets thicker.5
It takes more pressure force to break through a thicker stability zone, so a taller columnof gas is required. In compressional settings, where the dominant force is directedsideways by tectonics, rather than downward by gravity, the bubble layer is never asthick, reflecting an easier path to methane escape.
There are multiple lines of evidence that gas can be transported through the hy-10
drate stability zone, without freezing into hydrate. Seismic studies at Blake Ridge haveobserved the presence of bubbles along faults in the sediment matrix (Taylor et al.,2000). Faults have been correlated with sites of methane gas emission from the seafloor (Aoki et al., 2000; Zuhlsdorff and Spiess, 2004; Zuhlsdorff et al., 2000). Seismicstudies often show “wipeout zones” where the bubble zone beneath the hydrate sta-15
bility zone is missing, and all of the layered structure of the sediment column withinthe stability zone is smoothed out. These are interpreted to be areas where gas hasbroken through the structure of the sediment to escape to the ocean (Hill et al., 2004;Riedel et al., 2002; Wood et al., 2002). Bubbles associated with seismic wipeout zonesare observed within the depth range which should be within the hydrate stability zone,20
assuming that the temperature of the sediment column is the steady-state expressionof the local average geothermal gradient (Gorman et al., 2002). This observation hasbeen explained by assuming that upward migration of the fluid carries with it heat, main-taining a warm channel where gas can be transported through what would otherwisebe thermodynamically hostile territory (Taylor et al., 2000; Wood et al., 2002).25
The potential for gas migration through the stability zone is one of the more signifi-cant uncertainties in forecasting the ocean hydrate response to anthropogenic warming(Harvey and Huang, 1995).
1004
2.3 Physical chemistry of methane hydrate
2.3.1 Thermodynamics
If the methane dissolved concentration reaches the saturation value for hydrate forma-tion at the local temperature and pressure conditions, methane and water will freezetogether into methane hydrate or clathrate deposits. Thermodynamically, the stability5
of hydrate is determined by the temperature and by the availability of methane. Thephase boundary is usually drawn assuming the presence of bubbles of pure methane,so that the partial pressure of methane is determined by the total fluid pressure. Thepartial pressure of methane dissolved in oxic seawater is vanishingly small, but if hy-drate would be stable given the presence of methane bubbles, we call that the phase10
boundary of hydrate stability in Fig. 4. At atmospheric pressure, hydrate is never stableat Earth surface temperatures. At water depths of 100 m, hydrate would form at about–20◦C, while at 500 m depth, the melting temperature approaches in situ temperatures.This minimum stability depth is somewhat shallower in the high-latitude oceans, about200 m in the Arctic Ocean, because the upper water column is colder (Fig. 4). In some15
locations, such as under the sealed-off ice complex in Siberia, or in rapidly depositingor low permeability sediments, the fluid pressure can be influenced by the weight ofsolids, and the fluid pressure will approach the lithostatic pressure rather than the hy-drostatic pressure. The stability depth for hydrate in permafrost in the lithostatic case isabout 200 m (Buffett, 2000), but hydrate has been inferred to exist shallower than that,20
sealed into “ice-bonded” permafrost (Dallimore and Collett, 1995).
2.3.2 Kinetics
Hydrate can persist metastably, several degrees above its thermodynamic melting tem-perature, because of the energy barrier of nucleating small bubbles of methane gas(Buffett and Zatsepina, 1999). Rapid depressurization such as occurs during core re-25
trieval does lead to melting of hydrate (Circone et al., 2000). The dissolution of hydrates
1005
appears to be diffusion controlled (Rehder et al., 2004). In general, kinetic effects areprobably of secondary importance for predicting the hydrate response to anthropogenicclimate change, because the thermal forcing takes place on such long time scales.
Lab experiments show that hydrate can nucleate from the pure aqueous phase,with no bubbles required, helping the creation of hydrate from advective or biogenic5
methane (Buffett and Zatsepina, 2000). Several studies (Clennell et al., 2000; Clennellet al., 1999; Lorenson, 2000) predict inhibition of hydrate formation in fine-grained sed-iment caused by the high activation energy of forming small crystals in the hydrophobicsmall cavities of the pore water. This would explain the characteristic textures of hy-drate: as pore-filling cement in coarse-grained sediment, but as irregularly shaped10
masses of pure hydrate in fine-grained sediment, and predicts that hydrates shouldform first or predominantly in sandy sediments (Lorenson, 2000; Winters et al., 2004).
2.4 Mechanisms of methane release
2.4.1 Deep ocean temperature change
The time-dependence of changes in the inventory of methane in the hydrate reservoir15
depends on the time scales of temperature and chemical processes acting. Figure 5shows the approximate time scales for altering the temperatures of the ocean, as afunction of depth. There is evidence from paleotracers (Martin et al., 2005) and frommodeling (Archer et al., 2004) that the temperature of the deep sea is sensitive to theclimate of the Earth’s surface. In general, the time scale for changing the temperature20
of the ocean increases with depth. There are significant regional variations in theventilation time of the ocean, and in the amount of warming that might be expected inthe future. As has already been mentioned, the Arctic is expected to warm particularlystrongly, because of the albedo feedback from melting Artic ice cap. Temperatures inthe North Atlantic appear to be sensitive to changes in ocean circulation such as during25
Dansgaard Oeschger climate events (Dansgaard et al., 1989).As described above, the top of the hydrate stability zone is at 200-600 m water depth,
1006

depending on the temperature of the water column and the solubility of the hydrate un-der the local chemical conditions (sulfide, hydrocarbons). Within the sediment column,the temperature increases with depth along the geothermal temperature gradient, 30–50◦C/km (Harvey and Huang, 1995). The shallowest sediments that could contain hy-drate only have a thin hydrate stability zone, and the stability zone thickness increases5
with water depth. A change in the temperature of the deep ocean will act as a changein the upper boundary condition of the sediment temperature profile. Warming of theoverlying ocean does not put surface sediments into undersaturation, but the warmeroverlying temperature propagates downward until a new profile with the same geother-mal temperature gradient can be established. How long this takes is a strong (second10
order) function of the thickness of the stability zone, but the time scales are in generallong. In 1000 years the temperature signal should have propagated about 180 m in thesediment (Fig. 3). In the steady state, an increase in ocean temperature will decreasethe thickness of the stability zone. Dickens et al. (2001) calculated that the volume ofthe stability zone ought to decrease by about a factor of 2 with a temperature increase15
of 5◦C.After an increase in temperature of the overlying water causes hydrate to melt at
the base of the stability zone, the fate of the released methane is difficult to predict.The increase in pore volume and pressure could provoke gas migration through thestability zone (see Gas Migration section) or a landslide, or the bubbles could remain20
enmeshed in the sediment matrix. Hydrate is carried to the base of the stability zoneby the accumulation of sediment at the sea floor, so melting of hydrate at the stabilityzone takes place continuously, not just associated with ocean warming.
2.4.2 Pockmarks
The sediment surface of the world’s ocean has holes in it called pockmarks (Hill et25
al., 2004; Hovland and Judd, 1988), interpreted to be the result of catastrophic orcontinuous escape of gas to the ocean. Pockmarks off of Norway are accompanied byauthigenic carbonate deposits associated with anerobic oxidation of methane (Hovland
1007
et al., 2005). Pockmarks range in size from meters to kilometers (Hovland et al., 2005),with one 700 km2 example on the Blake Ridge (Kvenvolden, 1999). If the Blake Ridgepockmark is the result of a catastrophic explosion, it might have released less thana Gton C as methane (assuming a 500 m thick layer of 4% methane yields 1 Gton).Pockmark methane emission is most significant as an ongoing “chronic” source rather5
than single “catastrophic” releases.
2.4.3 Landslides
Another mechanism for releasing methane from the sediment column is by submarinelandslides. These are a normal, integral part of the ocean sedimentary system (Hamp-ton et al., 1996; Nisbet and Piper, 1998) . Submarine landslides are especially preva-10
lent in river deltas, because of the high rate of sediment delivery, and the presence ofsubmarine canyons. The tendency for slope failure can be amplified if the sedimentaccumulates more quickly than the excess porosity can be squeezed out. This canlead to instability of the sediment column, causing periodic Storegga-type landslidesoff the coast of Norway (see below), in the Mediterranean Sea (Rothwell et al., 2000) or15
potentially off the East coast of the United States (Dugan and Flemings, 2000). Maslinet al. (2004) find that 70% of the landslides in the North Atlantic over the last 45 kyroccurred within the time windows of the two meltwater peaks 15–13 and 11–8 kyr ago.These could have been driven by deglacial sediment loading or warming of the watercolumn triggering hydrate melting.20
Warming temperatures or sea level changes may trigger the melting of hydrate de-posits, provoking landslides (Driscoll et al., 2000; Kvenvolden, 1999; Vogt and Jung,2002). Paul (1978) calculates that landslides can release up to about 5 Gton C asmethane, enough to alter the radiative forcing by about 0.2 W/m2. The origin of theseestimates is discussed in the section on the Storegga Slide, below.25
1008
2.4.4 Fate of methane released as bubbles
Methane released from sediments in the ocean may reach the atmosphere directly, orit may dissolve in the ocean. Bubbles are not generally a very efficient means of trans-porting methane through the ocean to the atmosphere. (Rehder et al., 2002) comparedthe dissolution kinetics of methane and argon, and found enhanced lifetime of methane5
bubbles below the saturation depth in the ocean, about 500 meters, because a hydratefilm on the surface of the methane bubbles inhibited gas exchange. Bubbles dissolvemore slowly from petroleum seeps, where oily films on the surface of the bubble in-hibits gas exchange, also changing the shapes of the bubbles (Leifer and MacDonald,2003). On a larger scale, however, (Leifer et al., 2000) diagnosed that the rate of bub-10
ble dissolution is limited by turbulent transport of methane-rich water out of the bubblestream into the open water column. The magnitude of the surface dissolution inhibitionseems small; in the (Rehder et al., 2002) study a 2 cm bubble dissolves in 30 m abovethe stability zone, and only 110 m below the stability zone. Acoustic imaging of thebubble plume from Hydrate Ridge showed bubbles surviving from 600–700 m water15
depth where they were released to just above the stability zone at 400 m (Heeschenet al., 2003). One could imagine hydrate-film dissolution inhibition as a mechanism toconcentrate the release of methane into the upper water column, but not really as amechanism to get methane through the ocean directly to the atmosphere.
Methane can reach the atmosphere if the methane bubbles are released in waters20
that are only a few tens of meters deep, as in the case of melting ice complex per-mafrost in Siberia (Shakhova et al., 2005; Washburn et al., 2005; Xu et al., 2001) orduring time periods of lower sea level (Luyendyk et al., 2005). If the rate of methanerelease is large enough, the rising column of seawater in contact with the bubbles maysaturate with methane, or the bubbles can be larger, potentially increasing the escape25
efficiency to the atmosphere.
1009
2.4.5 Fate of methane hydrate in the water column
Pure methane hydrate is buoyant in seawater, so floating hydrate is another potentialway to deliver methane from the sediment to the atmosphere (Brewer et al., 2002).In sandy sediment, the hydrate tends to fill the existing pore structure of the sediment,potentially entraining sufficient sediment to prevent the hydrate / sediment mixture from5
floating, while in fine-grained sediments, bubble and hydrate grow by fracturing the co-hesion of the sediment, resulting in irregular blobs of bubbles (Boudreau et al., 2005;Gardiner et al., 2003) or pure hydrate. Brewer et al. (2002) and Paull et al. (2003) triedthe experiment of stirring surface sediments from Hydrate Ridge using the mechanicalarm of a submersible remotely operated vehicle, and found that hydrate did manage10
to shed its sediment load enough to float. Hydrate pieces of 0.1 m survived a 750 mascent through the water column. Paull et al. (2003) described a scenario for a subma-rine landslide, in which the hydrates would gradually make their way free of the turbiditycurrent comprised of the sediment/seawater slurry.
2.4.6 Oxidation of dissolved methane in the ocean15
Methane is unstable to bacterial oxidation in oxic seawater. Rehder et al. (1999) in-ferred an oxidation lifetime of methane in the high-latitude North Atlantic of 50 years.Clark et al. (2000) correlated methane emission from Coal Point in California with amethane maximum in the water column extending into the Pacific Ocean. Methane ox-idation is faster in the deep ocean near a particular methane source where its concen-20
tration is higher (turnover time 1.5 years), than in the surface ocean (turnover time ofdecades) (Valentine et al., 2001). Water column concentration and isotopic measure-ments indicate complete water-column oxidation of the released methane at HydrateRidge (Grant and Whiticar, 2002; Heeschen et al., 2005).
An oxidation lifetime of 50 years leaves plenty of time for methane gas to evaporate25
into the atmosphere. Typical gas-exchange time scales for gas evasion from the sur-face ocean would be about 3–5 m per day. A surface mixed layer 100 m deep would
1010
approach equilibrium (degas) in about a month. Even a 1000-m thick winter mixed layerwould degas about 30% during a three-month winter window. The ventilation time ofsubsurface waters depends on the depth and the fluid trajectories in the water (Luytenet al., 1983), but 50 years is enough time that a significant fraction of the methanedissolving from bubbles might reach the atmosphere before it is oxidized.5
2.5 Stratigraphic-type sedimentary hydrate deposits
The most common hydrate deposits on Earth are in the ocean, and are the product oflargely one-dimensional processes of organic carbon burial, bacterial methanogenesis,and methane transport in slow fluid flow. Following the terminology of Milkov (2002),we will refer to these as stratigraphic-type hydrate deposits.10
In the steady state, the maximum concentration of hydrate is found at the base ofthe stability zone, with bubbles found below (Davie and Buffett, 2001). Typical con-centrations of hydrate are a few percent of pore volume, and the amount of bubblesbelow the stability zone is also a few percent by volume. The layer of bubbles is clearlyapparent in seismic sections of the subsurface sediment. Temperature contours within15
the sediment column tend to parallel the sea floor, and so the layer of bubbles tendsto parallel the sea floor as well. For this reason, the bubble layer below the base ofthe stability zone is referred to as a “bottom simulating reflector” or BSR. Because itis remotely detectable, the distribution of the BSR is one of the best indications of thedistribution of hydrates in sediments.20
Most of the hydrate deposits on Earth correspond to the stratigraphic type, and hencethe estimates of the global inventory of hydrates are based on the physics or on the ob-served distribution of these types of deposits. Estimates range from 500 to 10 000 GtonC as methane in hydrate globally. The estimates can be compared according to twometrics. One is the area of the sea floor where hydrates can be found, and the other is25
the inventory of methane, as hydrate and in some tabulations as bubbles, per squaremeter. Milkov (2004) does a detailed and very thorough comparison of these charac-teristics of estimates, leaving no need for more than a summary of his results here.
1011
The first piece of the estimate is the area of the sea floor, between 500 and 3000 mdepth, that has high concentration of hydrates. MacDonald (1990) assumed a high-hydrate slope area fraction of 10%. Borowski et al. (1999) estimate that 30% of thisarea could contain hydrates, based on the proportion of cores where porewater sulfatereaches zero within 50 m of the sea floor. Milkov (2004) views Borowski’s 30% as5
an upper limit, and takes 10% as his best estimate of the high-hydrate slope areafraction. The Buffett and Archer (2004) model predicts nonzero column inventories ofmethane hydrate or bubbles in 16% of the area between 500–3000 m, but in much ofthat area the abundance of methane is unmeasurably small. (Its presence is of interestthermodynamically, however.) If we take >0.25% over 200 m as a detectability cutoff,10
the model predicts 13% of the sea floor to fit that definition.Many studies estimate the area containing hydrates based on the organic carbon
concentration of surface sediments. The critical cutoff organic carbon concentration istypically taken as 1% (Kvenvolden, 1999) or 0.5% (Harvey and Huang, 1995), whichcorrespond respectively to about 15% or 30% of the area of sea floor between 500 and15
3000 m (based on results from the sediment diagenesis model (Archer et al., 2002)used in (Buffett and Archer, 2004). Gornitz and Fung (1994) used high chlorophyllconcentrations from CZCS images as correlates to the 0.5–1% organic carbon con-centration in sediments. This assumption neglects the role of depth and oxygen indetermining the organic carbon degradation, but the satellite data generates a map20
that looks very similar to sedimentary organic carbon maps. The areas of the sea floorrepresented by the CZCS cutoffs was 13% and 32%, similar to the organic carbon ar-eas for >1% and >0.5%. The surface organic carbon method is appealing becauseof the general correspondence between surface organic carbon and seismic indica-tions of hydrates below, but there are some caveats. The critical quantity in the Buffett25
and Archer (2004) model is the advective flux of organic carbon to the methanogene-sis zone, which increases with increasing carbon concentration, but also depends onsedimentation rate, a boundary condition which must be accounted for in some way.Sediment surface organic carbon concentrations neglects the possibility that condi-
1012
tions might have changed in the millions of years it takes for surface sediments to beadvected to the methanogenesis zone (Fehn et al., 2000). In spite of these caveats,sediment organic carbon concentrations capture the general trend from oligotrophic toeutrophic, nearshore to pelagic, in the ocean that also drive methane hydrate formation.
Another metric by which global methane inventory estimates can be compared is5
the volume fraction of methane hydrate, within the porewater, averaged over the depthrange of the hydrate stability zone. Kvenvolden (1988) assumed 10%. Milkov arguesfor a value of 1.2%. The Buffett and Archer (2004) predicts about 1.5%. Data fromthe Blake Ridge range from 2–4% (Borowski, 2004; Paull et al., 2000). Values fromHydrate Ridge are lower, closer to 1%. The current data is probably too sparse to10
distinguish between 1% and say 3% as a global average hydrate porewater volumefraction, but the 10% volume fraction assumed in earlier studies like the influentialKvenvolden (1988) now seems to be high, if Blake Ridge or Hydrate Ridge is taken tobe representative of the broader ocean.
There are two studies, Buffett and Archer (2004), and Klauda and Sandler (2005),15
based on mechanistic models of the sedimentary methane cycle. Both studies arebased on the 1-D column model of Davie and Buffett (2001). The two studies differin their global estimates by a factor of twenty. Klauda and Sandler (2005) estimate76 000 Gton C in hydrate, while Buffett and Archer (2004) predict 3000 Gton C in hy-drate (plus 2000 Gton C in bubbles). Both studies show a reasonable fit to data from20
the Blake Ridge. The difference can be traced to differences in the sediment accu-mulation rate, and carbon conversion efficiencies, by the two studies. The Klauda andSandler (2005) calculation assumes a uniform accumulation rate of sediment through-out the entire ocean, of 10 cm/yr, too high for the deep sea by an order of magnitudeand more. For this reason, the Klauda and Sandler (2005) model predicts that most of25
the hydrates in the ocean ought to exist in abyssal sediments, rather than restricted tothe continental margins, as observed (in seismic studies, for example).
Uncertainty in the areal coverage of methane hydrate sediment results in a factor ofthree uncertainty in our estimate of the global hydrate reservoir size. The average hy-
1013
drate fraction is also unknown to within a factor of three, resulting in perhaps a factor often overall. A potential range of hydrate inventories must span about 500–3000 Gton C,with the inclusion of bubble methane adding perhaps a similar amount. The uncertaintyrange will be reduced in the future by (1) improvement in techniques for estimating theconcentration of methane, both as hydrate and as bubbles, ideally by seismic methods5
that provide regional coverage, and (2) by continued deep core sampling within hydrateregions, to constrain the variability in methane concentrations.
For comparison, the inventory of fossil fuels, mostly coal, is thought to be about5000 Gton C (Rogner, 1997), comparable to the hydrate reservoir. The inventory ofdissolved oxidized carbon in the ocean (CO2, HCO−
3 , and CO=3 ) is about 38 000 Gton10
C. This sounds comfortably larger than the hydrate reservoir, but an addition of CO2of this magnitude on a fast time scale would be a sizable perturbation to the pH of theocean (Archer et al., 1997). The ocean contains about 2× 10¹⁷ moles of oxygen, whichcould be completely depleted by reaction with about 1000 Gton C in methane.
2.6 Structural-type sedimentary hydrate deposits15
In stratographic-type hydrate deposits, hydrate concentration is highest near the baseof the stability zone, often hundreds of meters below the sea floor. In shallower wa-ters, where the stability zone is thinner, models predict smaller inventories of hydrate.Therefore, most of the hydrates in stratographic-type deposits tend to be deep. In con-trast with this, in a few parts of the world, transport of presumably gaseous methane20
through faults or permeable channels, results in hydrate deposits that are abundant atshallow depths in the sediment column, closer to the sea floor. These “structural-type”deposits could be vulnerable to temperature-change driven melting on a faster timescale than the stratographic deposits are expected to be.
The Gulf of Mexico is basically a leaky oil field (MacDonald et al., 1994, 2002, 2004;25
Milkov and Sassen, 2000, 2001, 2003; Sassen et al., 2001a, 2003; Sassen and Mac-Donald, 1994). Natural oil seeps leave slicks on the sea surface that can be seenfrom space. Large chunks of methane hydrate have been found on the sea floor in
1014
contact with seawater (Macdonald et al., 1994). One of the three chunks they sawhad vanished when they returned a year later; presumably it had detached and floatedaway.
Collett and Kuuskraa (1998) estimate that 500 Gton C might reside as hydrates inthe Gulf sediments, but Milkov (2001) estimates only 5 Gton C. In the CCSM model5
under doubled CO2 (after 80 years of 1%/year CO2 increase, from C. Bitz, personalcommunication), waters at 500 m depth in the Gulf warm about 0.75◦C, and 0.2◦ at1000 m. In situ temperatures at 500 m are much closer to the melting temperature,so the relative change in the saturation state is much more significant at 500 m thandeeper. The equilibrium temperature change in the deep ocean to a large, 5000 Gton10
C fossil fuel release could be 3◦C (Archer et al., 2004). Milkov and Sassen (2003) sub-jected a 2-dimensional model of the hydrate deposits in the Gulf to a 4◦C temperatureincrease and predicted that 2 Gton C from hydrate would melt. However, there no ob-servations to suggest that methane emission rates are currently accelerating. Sassenet al. (2001b) find no molecular fractionation of gases in near-surface hydrate deposits15
that would be indicative of partial dissolution, and suggests that the reservoir may infact be growing.
Other examples of structural deposits include the summit of Hydrate Ridge (Torres etal., 2004; Trehu et al., 2004b) and the Niger Delta (Brooks et al., 2000). The distributionof hydrate at Hydrate Ridge indicates up-dip flow along sand layers (Weinberger et al.,20
2005). Gas is forced into sandy layers where it accumulates until the gas pressureforces it to vent to the surface (Trehu et al., 2004a). Trehu et al. (2004b) estimate that30–40% of pore space in occupied by hydrate, while gas fractions are 2–4%. Methaneemerges to the sea floor with bubble vents and subsurface flows of 1 m/s, and in regionswith bacterial mats and vesicomyid clams (Torres et al., 2002). Further examples of25
structural deposits include the Peru Margin (Pecher et al., 2001) and Nankai Trough(Nouze et al., 2004).
1015
2.6.1 Mud volcanos
As described above, mud volcanos are produced by focused upward fluid flow into theocean. Mud volcanos often trap methane in hydrate deposits that encircle the chan-nels of fluid flow (Milkov, 2000; Milkov et al., 2004). The fluid flow channels associatedwith mud volcanoes are ringed with the seismic images of hydrate deposits, with au-5
thigenic carbonates, and with pockmarks (Dimitrov and Woodside, 2003) indicative ofanoxic methane oxidation. Milkov (2000) estimates that mud volcanoes contain at most0.5 Gton C of methane in hydrate; about 100 times his estimate of the annual supply.
2.7 Land deposits
The term permafrost is intended to distinguish whether water is frozen, but it is defined10
in terms of temperature: a two-year mean annual temperature below 0◦C. It has beenestimated that permafrost covers 20% of the terrestrial surface of the Earth. High-latitude northern permafrost is observed to be warming (Smith et al., 2005) and thaw-ing (Camill, 2005; Payette et al., 2004). Ice near the surface can melt in the summer,in what is called the “active zone”. Observations show that the active zone is getting15
thicker (Sazonova et al., 2004). When surface ice melts, soils collapse in a processcalled thermokarst (Nelson et al., 2002), and buildings fall down (Stockstad, 2004).This process has had a dizzying impact on the subarctic landscape (Kolbert, 2005;Pearce, 2005; Stockstad, 2004). Model projects 30–40% increase in active zone thick-ness by 2100 (Stendel and Christensen, 2002), and a comparable decrease in the total20
area of permafrost soils (Anisimov and Nelson, 1996). Melting is projected to be mostintense in the marginal permafrost zone in the south (Anisimov and Nelson, 1996) andalong the Arctic ocean (Nelson et al., 2002).
1016
2.7.1 Peat decomposition
Permafrost soils contain relict organic matter which survived decomposition becauseof the freezing temperatures. Fossil mammoths, still edible after all these years, areexamples of this phenomenon (Herz, 1904). Peat deposits are a substantial reservoirof carbon, are estimated to be 350–450 Gton C (Stockstad, 2004). With a thaw will5
come accelerated decomposition of this organic matter, increasing the flux of CO2and CH4 (Liblik et al., 1997; Rivkina et al., 2004; Rivkina et al., 2000). Soil that hasbeen frozen for thousands of years still contains viable populations of methanotrophicbacteria (Rivkina et al., 2004). The flux of methane from peat soils to the atmospherealso depends on the location of the water table, which controls the thickness of the oxic10
zone (Bubier et al., 1995, 2005; Liblik et al., 1997).If 20% of the peat reservoir converted to methane, released over 100 years, this
would release 0.7 Gton C per year, doubling the atmospheric methane concentration.
2.7.2 Melting hydrates
There is also the possibility that methane is trapped in hydrate deposits, and might15
potentially be released upon melting of the permafrost. Permafrost soil need not nec-essarily be continuous filled ice, it must simply be below the freezing point of purewater. If the pores are open, in contact with the atmosphere, the pressure in the porespaces will be hydrostatic with the fluid being the atmosphere. In this case, it will bevirtually impossible to achieve high enough pressures of methane to form hydrates un-20
der any reasonable temperature. However, if the pore space is closed, sealed, by icemost likely, then the lithostatic pressure will come to bear on the pore spaces, and anyregion of high-purity methane in the gas phase will be stable for hydrates. Minable nat-ural gas deposits are often at high pressure, for this reason. The Messoyakh gas field,producing gas for 13 years in Western Siberia, is thought to be mostly hydrate (Krason,25
2000). A profile of permafrost from the Mackenzie Delta showed massive, visible hy-drate at ∼350 m, and inferred invisible pore-water hydrate crystals as shallow as about
1017
120 m, in solidly ice-bonded sediment (Dallimore and Collett, 1995). The stability zoneis below ∼250 m here. Total amounts of hydrate methane in permafrost soils are verypoorly known, with estimates ranging from 7.5 to 400 Gton C (estimates compiled by(Gornitz and Fung, 1994).
There is a special case called the ice complex in Siberia (Gavrilov et al., 2003; Hub-5
berten and Romanovskii, 2001; Romankevich, 1984). The ice complex is a sealedhorizon of ice that was formed when sea level was as much as 120 m lower than today,during the last glacial maximum. Liquid ground water flowing through the permafrostfroze, creating a sealed layer up to 60–80 m thick, onshore and offshore under as muchas 100 m water depth. Bottom water temperatures are near freezing in these locations,10
and so they currently do not provide much impetus to melt at the surface, althoughsurface melting may accelerate with future high-latitude warming. However, 0◦C isconsiderably warmer than surface air temperatures during glacial time. A geothermprojected down from 0◦C intersects the melting temperature at a much shallower depththan would a geotherm from a glacial surface temperature. For this reason, most of15
the melting of the submerged ice complex since deglaciation has been on the bottomof the ice, not on the top.
Melting is also driven by lateral invasion of the coastline, a melt-erosion processcalled thermokarst erosion (Gavrilov et al., 2003). The ice melts where it is exposedto the ocean along the coast, collapsing the land into the sea and leaving more ice20
exposed to melting. The Siberian coast has receded by 100–500 km in 7500 years(Hubberten and Romanovskii, 2001), after the sea level finished its deglacial rise (seeFig. 6 in Hubberten and Romanovskii, 2001). Entire islands have melted within his-torical times in the past centuries (Romankevich, 1984). Emission of hydrate-meltmethane has been documented along the Siberian coastline. Coastal melting has re-25
sulted in 2500% supersaturation concentrations of methane relative to the atmospherein Siberian shelf waters (Shakhova et al., 2005). Two surveys of methane concentra-tion, taken 1 year apart, differed in their methane inventory by a factor of five. Whetherthis difference is due to differences in water circulation or methane degassing is un-
1018

known. Surface waters over the North Slope of Alaska were similarly supersaturated(Kvenvolden, 1999). The potential for methane release to the environment from per-mafrost hydrate melting has not been extensively discussed, but given the magnitudeof the potential hydrate reservoir, and the long time scale for melting, one could imag-ine a chronic, ongoing release of methane that would rival the release of methane from5
decomposing peat (Table 1).
2.8 Hydrates as fossil fuel
Another pathway by which hydrate carbon might reach the atmosphere to affect climateis if it is combusted as a fossil fuel. Estimates of the total inventory of methane in hy-drate deposits globally are very high, but probably only a small fraction of the hydrate10
reservoir would be extractable (Milkov and Sassen, 2002). The largest methane reser-voir, the stratographic disseminated deposit, is the least attractive economically. Theconcentration of methane is generally too low for economical extraction. The sedimentsof the Blake Ridge are impermeable (Kvenvolden, 1999), making extraction even moreunlikely, while sediments in the Nankia Trough are more permeable and hence easier15
to extract (Milkov and Sassen, 2002), which the Japanese intend to do (Kerr, 2004).The other class of oceanic deposits is the structurally focused deposits, such as foundin the Gulf of Mexico (Milkov and Sassen) and mud volcanos (Milkov, 2000). Milkov andSassen (2001) estimates that the Gulf of Mexico contains 40 times as much hydratemethane as conventional subsurface reservoir methane in that area.20
The most likely near-term targets for methane hydrate extraction are deposits associ-ated with permafrost soils on land and in the shallow ocean. The Soviets drilled at least50 wells in a field called Messoyakha, in which thermogenic methane is trapped undera dome of 450-m thick permafrost, one-third of it frozen into hydrates (Krason, 2000).The Soviets extracted gas from Messoyakha for 13 years, injecting hot water and/or so-25
lutes (methanol and CaCl2) to destabilize hydrate and release methane. Subsequently,an international consortium lead by the Japanese drilled a series of wells on the northcoast of Alaska, in a field called Mallik (Chatti et al., 2005; Kerr, 2004). Hydrates here
1019
are in a sandstone layer 1000 m down, below mudstones. The hydrate-bearing sed-iments were more permeable there than had been expected so that methane couldbe extracted most economically by simply reducing the pressure. Methane moved viafractures, and more fractures could be broken with pressure spiking.
The prognosis for methane hydrate mining is that perhaps hydrate methane could5
supply order 10% of methane extration rate in order 10 years, by analogy to coal-bed methane 30 years ago (Grauls, 2001; Kerr, 2004). Methane hydrates could bea significant source of fossil energy, but not limitless as might be inferred from thelarge estimates of total methane inventory in the global hydrate reservoir. Most of thehydrates are probably impractical to extract.10
The possibility of geological hazard from methane drilling has been discussed in ageneral way (Chatti et al., 2005; Grauls, 2001; Kvenvolden, 1999) but the likelihoodof methane extraction causing slope instability still seems rather speculative. Somehave considered replacing CH4 hydrates with CO2 hydrates, sequestering CO2 andmaintaining the stability of the continental slope in the process (Warzinski and Holder,15
1998). The Storegga slide (next section) was investigated in order to determine thesafety of extracting gas from the Ormen Lange gas field within the Storegga slide area.
3 Observations from the past
3.1 The Storegga landslide
3.1.1 Observations20
One of the largest exposed submarine landslides in the ocean is the Storegga Slidein the Norwegian continental margin (Bryn et al., 2005; Mienert et al., 2000, 2005].The slide excavated on average the top 250 m of sediment over an swath hundredsof kilometers wide, stretching half-way from Norway to Greenland. There have beencomparable slides on the Norwegian margin every approximately 100 kyr, roughly syn-25
1020
chronous with the glacial cycles (Solheim et al., 2005). The last one, Storegga proper,occurred about 8150 years ago, after deglaciation. It generated a tsunami in whatis now the United Kingdom (Smith et al., 2004). The Storegga slide area containsmethane hydrate deposits as indicated by a seismic BSR (Bunz and Mienert, 2004;Mienert et al., 2005; Zillmer et al., 2005a, b) corresponding to the base of the HSZ at5
200–300 m, and pockmarks (Hovland et al., 2005) indicating gas expulsion from thesediment.
3.1.2 Inferences
The slide was presumably triggered by an Earthquake, but the sediment column musthave been destabilized by either or both of two mechanisms. One is the rapid accu-10
mulation of glacial sediment shed by the Fennoscandian ice sheet (Bryn et al., 2005).As explained above, rapid sediment loading traps pore water in the sediment columnfaster than it can be expelled by the increasing sediment load. At some point, the sedi-ment column floats in its own porewater (Dugan and Flemings, 2000). This mechanismhas the capacity to explain why the Norwegian continental margin, of all places in the15
world, should have landslides synchronous with climate change.The other possibility is the dissociation of methane hydrate deposits by rising ocean
temperatures. Rising sea level is also a player in this story, but a smaller one. Risingsea level tends to increase the thickness of the stability zone, by increasing the pres-sure. A model of the stability zone shows this effect dominating for deeper in the water20
column (Vogt and Jung, 2002); the stability zone is shown increasing by about 10 m forsediments in water depth below about 750 m. Shallower sediments are more impactedby long-term temperature changes, reconstructions of which show warming of 5–6◦Cover a thousand years or so, 11–12 kyr ago. The landslide occurred 2–3 kyr after thewarming (Fig. 6 from Mienert et al., 2005). The slide started at a few hundred meters25
water depth, just off the continental slope, just where Mienert calculates the maximumchange in HSZ. Sultan et al. (2004) predict that warming in the near-surface sedimentwould provoke hydrate to dissolve by increasing the saturation methane concentration.
1021
This form of dissolution differs from heat-driven direct melting, however, in that it pro-duces dissolved methane, rather than methane bubbles. Sultan et al. (2004) assertthat melting to dissolved methane increases the volume, although laboratory analysesof volume changes upon this form of melting are equivocal, an in any case the volumechanges are much smaller than for thermal melting that produces bubbles.5
The amount of methane released by the slide can be estimated from the volume ofthe slide and the potential hydrate content. Hydrate just outside the slide area hasbeen estimated by seismic methods to fill as much as 10% of the pore water volume,in a layer about 50 m thick near the bottom of the stability zone (Bunz and Mienert,2004). If these results were typical of the entire 104 km2 area of the slide, the slide10
could have released 1–2 Gton C of methane in hydrate. Paul (1978) assumed 10%hydrate fraction and predicted 5 Gton C methane released. If 5 Gton C CH4 reached theatmosphere all at once, it would raise the atmospheric concentration by about 2.5 ppmof methane, relative to a present-day concentration of about 1.7 ppm, trapping about0.2 W/m2 of greenhouse heat. The methane radiative forcing would subside over a time15
scale of a decade or so, as the pulse of released methane is oxidized to CO2, and theatmospheric methane concentration relaxes toward the long-term steady state value.The radiative impact of the Storegga landslide would then be comparable in magnitudebut opposite in sign to the eruption of a large volcano, such as the Mt. Pinatubo eruption(–2 W/m2), but it would last for longer (10 years for methane and 2 for a volcano).20
It is tantalizing to a paleoclimatologist to wonder if there could be any connectionbetween the Storegga landslide and the 8.2 kyr climate event (Alley and Agustsdottir,2005), which is presumed to have been triggered by fresh water release to the NorthAtlantic. However, ice cores record a 0.75 ppm drop in methane concentration duringthe 8.2 k event, not a rise. The shutdown of convection in the North Atlantic would25
have, if anything, cooled the overlying waters.
1022
3.1.3 Implications
Much of our knowledge of the Storegga landslide is due to research sponsored by theNorwegian oil industry, who are interested in tapping the Ormen Lange gas field withinthe headlands of the Storegga slide, but are concerned about the geophysical hazardof gas extraction (Bryn et al., 2005). The Norwegians do not want to trigger another5
Storegga landslide. The conclusion that rapid glacial sediment loading is a cause ofthe slides would seem to indicate that drilling should be safe until another ice age wereto start depositing new sediment on the sea floor. On the other hand, the modelingresults of Mienert et al. (2005) in Fig. 4 raise a suspicion that warming and melting ofhydrates had something to do with the slide. Several thousand years elapsed between10
the warming and the landslide. This tends to argue against concern for such eventsin the coming century. Estimates of potential methane emission range from 1–5 GtonC, which is significant but not apocalyptic. The increase in tsunami hazard might beequally concerning.
3.2 Paleocene Eocene thermal maximum15
3.2.1 Observations
About 55 million years ago, the δ13C in the ocean and on land decreased by 2.5–5‰ ona time scale of less than 10 kyr, then recovered in parallel on a time scale of ∼140 kyr(Kennett and Stott, 1991) (Fig. 7 from Zachos et al., 2001). The δ18O of CaCO3 fromintermediate depths in the ocean decreased by 2–3‰ indicative of a warming of about20
5◦C. The timing of the spikes is to a large extent synchronous. Planktonic foraminiferaand terrestrial carbon records record the δ13C perturbation a bit before the benthicsdo, suggesting that the carbon spike invaded the deep ocean from the atmosphere(Thomas et al., 2002). Similar events, although less well documented, have beendescribed from other times in geologic history (Hesselbo et al., 2000; Jenkyns, 2003).25
1023
3.2.2 Inferences
The spike in δ18O can only be attributed to temperature change in the water column.Planktonic δ18O can also be fractionated by changes in freshwater forcing, reflectedin salinity. The salinity of the deep sea is more uniform than that at the surface, sothe δ18O of benthic foraminifera is more directly interpretable as temperature. There is5
usually an offset between the δ18O recorded by foraminifera and the true equilibriumvalue, called a vital effect. Single-species reconstructions of δ18O tend to reduce theimpact of these vital effects. The δ18O of the whole ocean changes when ice sheetsgrow, but there were no ice sheets at this time. δ18O in chemical reactions with rocks,but not on short time scales such as seen here. The δ18O record is most easily inter-10
preted as a temperature change, at a depth of several kilometers in the ocean, fromabout 8◦ to about 14◦C, in a few thousand years.
The lightening of the carbon isotope is attributed to the release of some amount ofisotopically light carbon to the atmosphere. However it is not clear where the carboncame from, or how much of it there was. The magnitude of the carbon shift depends15
on where it was recorded. The surface change recorded in CaCO3 in soils (Koch etal., 1992) and in some planktonic foraminifera (Thomas et al., 2002) is twice as large achange as is reported for the deep sea. Land records may be affected by changes inplant fractionation, driven by changing hydrological cycle (Bowen et al., 2004). Oceanrecords may be affected by CaCO3 dissolution (Zachos et al., 2005) and the resulting20
necessity to use multiple species.We can estimate the change in the carbon inventory of the ocean by specifying
an atmospheric pCO2 value, a mean ocean temperature, and insisting on equilib-rium with CaCO3 (Zeebe and Westbroek, 2003). The ocean was warmer, prior tothe PETM event, than it is today. Climate modelers assume atmospheric pCO2 val-25
ues of about 560 ppm at this time (Huber et al., 2002). The present-day inventoryof CO2 in the ocean is about 40 000 Gton C. According to simple thermodynamics,neglecting changes in the biological pump or circulation of the ocean, the geological
1024

steady-state inventory for late Paleocene, pre-PETM time could have been on the orderof 50 000 Gton C.
The lighter the isotopic value, the smaller the amount of carbon that must be releasedto explain the isotopic shift (Fig. 8). Candidate sources include methane, which canrange in its isotopic composition from –30 to –110‰. If the ocean δ13C value is taken at5
face value, and the source was methane at –60‰ then 2000 Gton C would be requiredto explain the isotopic anomaly. If the source were thermogenic methane or organiccarbon at δ13C of about –25‰ then 10 000 Gton C would be required.
Buffett and Archer (2004) find that the steady-state hydrate reservoir size in theocean is extremely sensitive to the temperature of the deep sea. At the temperature of10
Paleocene time, they predict less than a thousand Gton C in the ocean. As the oceantemperature decreases, the stability zone gets thinner and covers less area. Theirmodel was able to fit 6000 Gton C in the Arctic Ocean, however, using 6◦ temperaturesfrom CCSM (Huber et al., 2002) (which may be too cold) and assuming that the basinhad been anoxic (supported by the presence of North Slope fossil fuels). Invoking the15
Arctic here solves a number of problems. It is easier to imagine a large temperaturechange in an isolated, polar basin than it is in the whole ocean. This makes it easierto get a large synchronous release such as observed. Also, if methane is released inthe Arctic, even if it oxidized in the water column, it would be found in planktonic trop-ical forams before benthic, as observed in the ocean cores (which come from places20
outside the Arctic). Bubbles released from the sea floor mostly dissolve before reach-ing the atmosphere (see section), and half the methane reservoir is bubbles (Buffettand Archer, 2004), so it is not easy to imagine getting methane from the main oceansediments to the plankton before it reaches the deep sea.
Marine organic matter has an isotopic composition of –20‰ and would require 600025
Gton to explain the isotopic anomaly. Svensen et al. (2004) proposed that lava in-trusions into organic-rich sediments could have caused the isotopic shift. They citeevidence that the isotopic composition of methane produced from magma intrusionshould be –35 to –50‰ requiring therefore 2500–3500 Gton C to explain the isotope
1025
anomaly in the deep ocean. The area of the volcanic complex appears to be about50 000 km2 and the depth range in the sediment about 2 km. If this volume contains1% organic carbon, it would contain 1250 Gton C. CaCO3 could also release CO2, of aheavier isotopic composition. This volcanic intrusion seems like a feasible alternativeexplanation for the carbon source.5
Comets are not well constrained in their isotopic compositions, but cometary dusttends to be about –45‰ (Kent et al., 2003). Kent calculates that an 11 km cometcontaining 20–25% organic matter, a rather large icy tarball, could deliver 200 GtonC, enough to decrease the δ13C of the atmosphere and upper ocean by 0.4‰. It isunlikely that a comet could deliver thousands of Gton C however. An impact strike to a10
carbonate platform or an organic-rich sediment of some sort could release carbon, butit would take a very large crater to release thousands of Gton C.
Volcanic carbon has an isotopic composition of –7‰ requiring a huge carbon releaseof 20,000 Gton C. Excess carbon emissions have been attributed to superplume cyclesin the mantle and flood basalt volcanism (Larson, 1991) However, these events tend15
to take millions of years to play out (Dickens et al., 1995). Bralower et al. (1997) andSchmitz et al. (2004) find evidence of increased volcanism during the PETM interval,but view the volcanism as rearranging ocean circulation, triggering methane release,rather than a major primary source of carbon itself, presumably because the potentialvolcanic carbon source is too slow.20
Acidification of the ocean by invasion of CO2 caused an extinction of calcifying or-ganisms in the ocean (Kennett and Stott, 1991) and a shoaling of the depth of CaCO3preservation in the Atlantic (Zachos et al., 2005) although curiously not in the Pacific(Zachos et al., 2003). The magnitude of the CCD shift in the Atlantic, if taken as rep-resentative of the whole ocean, would be suggestive of a large carbon addition, on the25
order of 5000 Gton C or more (Archer et al., 1997).A large carbon release is also supported by the warming inferred from the δ18O
spike. The temperature can be altered by both CH4 and CO2. Schmidt and Shindell(2003) calculated that the steady-state atmospheric CH4 concentration during the pe-
1026
riod of excess emission (ranging from 500–20 000 years) would be enough to explainthe temperature change. However, the atmospheric methane concentration anomalywould go away a few decades after the excess emission ceased. At this point thetemperature anomaly would die away, namely, as soon as the carbon isotopic compo-sition stopped plunging negative, the oxygen isotopic composition should recover. The5
carbon isotopic composition should remain light for hundreds of thousands of years(Kump and Arthur, 1999) until it reapproached a steady-state value. The record showsinstead that the oxygen and carbon isotopic anomalies recovered in parallel. This sug-gests that CO2 is the more likely greenhouse warmer rather than CH4. (It could be thatthe time scale for the pCO2 to reach steady state might be different than the time scale10
for the isotopes to equilibrate, analogous to the equilibration of the surface ocean bygas exchange: isotopes take longer. However, in the (Kump and Arthur, 1999) modelresults, pCO2 seems to take longer to equilibrate than δ13C. The first-order result isthat the CO2 and δ13C timescales are much more similar than the CH4 and δ13C timescales would be.)15
A warming of 5◦C would require somewhere between one and two doublings of theatmospheric CO2 concentration, if the climate sensitivity is in the range of 2.5–5◦C.Beginning from 600 ppm, we would increase the pCO2 of the atmosphere to some-where in the range of 1200–2400 ppm. The amount of carbon required to achieve thisvalue for hundreds of thousands of years (after equilibration with the ocean and with20
the CaCO3 cycle) would be of order 20 000 Gton C. This would imply a mean isotopiccomposition of the spike of mantle isotopic composition, not isotopically light methane.
The bottom line conclusion about the source of the carbon isotopic excursion is thatit is still not clear. There is no clear evidence in favor of a small, very isotopicallydepleted source of carbon. Mechanistically, it is easier to explain a small release than25
a large one, and this is why methane has been a popular culprit for explaining theδ13C shift. Radiative arguments argue for a larger carbon emission, corresponding toa less fractionated source than pure biogenic methane. Thermogenic methane mightdo, such as the explosion of a larger Gulf of Mexico, if there were a thermogenic deposit
1027
that large. Or perhaps it was some combination of sources, an initial less-fractionatedsource such as marine organic matter or a comet, followed by hydrate release.
3.2.3 Implications
The PETM is significant to the present-day because it is a close analog to the potentialfossil fuel carbon release if we burn all the coal. There is about 5000 Gton of C in5
coal, while oil and traditional natural gas deposits are hundreds of Gton each (Rogner,1997). The recovery timescale from the PETM (140 kyr) is comparable to the modelpredictions, based on the mechanism of the silicate weathering thermostat (400 kyrtimescale Berner et al., 1983).
The magnitude of the warming presents something of a problem. 5000 Gton of fossil10
fuel release will warm the deep ocean by perhaps 2–4◦, based on paleoclimate recordsand model results (Martin et al., 2007). The warming during the PETM was 5◦, and thiswas from a higher initial CO2, so that a further spike of only 2000 Gton (based onmethane isotopic composition) would have only a tiny radiative impact, much less than5◦. One possibility is our estimates for the climate sensitivity is underestimated by a15
factor of 2 or more. However, one might have expected a decreased climate sensitivityfor an ice-free world than for the ice-age climate of today.
Another possibility is that the PETM was driven by two sources of carbon, totalingmaybe 10 000 Gton C. At most 10% of this carbon could have had an initial δ13C of –60‰ if the rest were volcanic carbon at –7‰. The implication would be that the hydrate20
reservoir at that time did not amplify the initial carbon release (analogous to our fossilfuel CO2) by more than 10%. However, there are no strong ideas for where that other9000 Gton C could have come from.
Perhaps the land δ13C shift is correct, and perhaps it was thermogenic methane, sothe hydrate release could have been 8000 Gton C. In this case we can attribute all of25
the temperature change to the radiative effect of the released carbon, mostly as theaccumulated CO2. The Archer and Buffett (2005) model predicted a regime in modelspace where the hydrate reservoir would be unstable, periodically melting down. The
1028
time period between meltdowns was determined by the time scale of methane accu-mulation in the reservoir. The critical parameters to the model are the time scale for amelting relaxation to the equilibrium size, and the fraction of the reservoir which meltsat all. If most of the reservoir equilibrates quickly, then you get periodic meltdowns.Tauntingly, there are several tiny “after shocks” of the PETM, all about 2 million years5
apart, such as an ELMO event (Lourens et al., 2005). The trouble then is that themodel, tuned to periodic meltdowns during the PETM, predicts that the hydrate reser-voir today, larger because the ocean is colder, should periodically melt down even moreseverely today.
Could some external agent of warming, not CO2, have driven temperatures up? The10
δ13C could be showing us methane release, but the temperature would be attributedto something else, something no one has thought of yet. The difficulty here would bethat the decay of the temperature spike follows so closely the decay of the δ13C spike.This tends to steer us back to the path of CO2 as the proximate agent of temperaturechange.15
At present, the PETM serves as a cautionary tale about the long duration of a releaseof new CO2 to the atmosphere (Archer, 2005). However, our current understanding ofthe processes responsible for the δ13C spike is not strong enough to provide any newconstraint to the stability of the methane hydrate reservoir in the immediate future.
3.3 Santa Barbara Basin and the clathrate gun hypothesis20
Kennett et al. (2003) and Nisbet (2002) argue that methane from hydrates is responsi-ble for the initial deglacial rise in the Greenland methane record. Kennett et al. (2000)found episodic negative δ13C excursions in benthic foraminifera in the Santa BarbaraBasin, which they interpret as reflecting release of hydrate methane during warm cli-mate intervals. Biomarkers for methanotrophy are found in greater abundance, and25
indicate greater rates of reaction, during warm intervals in the Santa Barbara Basin(Hinrichs et al., 2003) and in the Japanese coastal margin (Uchida et al., 2004). Can-
1029
nariato and Stott (2004) however argued that these results could have arisen fromcontamination or subsequent diagenetic overprints.
The isotopic ratio of D/H in ice core methane indicates a freshwater source, ratherthan a marine source, apparently ruling out much of a role for marine hydrate methanerelease (Sowers, 2006). The timing of the deglaciation methane rise was also more5
easily explained by wetland degassing than by catastrophic methane release (Brooket al., 2000). The interhemispheric gradient of methane tells us that the deglacialincrease in atmospheric methane arose from high Northern latitudes (Dallenbach etal., 2000). The deglacial methane rise could therefore be attributed to methanogenesisfrom thawing organic matter decomposition or from high-latitude wetlands. Regardless10
of the source of the methane, the climate forcing from the observed methane record istoo weak to argue for a dominant role for methane in the glacial cycles.
4 Risks for the future
4.1 Capacity for doomsday
There is so much methane as hydrates on Earth that it seems like a perfect ingredi-15
ent for a climate doomsday scenario. Hydrate is unstable at Earth surface conditions,both because of the low atmospheric methane concentration and because most ofthe Earth’s surface is warmer than the freezing point of methane hydrate at one at-mosphere pressure. The hydrate reservoir contains thousands of Gton C of methane,enough that releasing a small fraction of the methane directly to the atmosphere, within20
a time window that is short relative to the atmospheric lifetime of methane, could in-crease the methane concentration of the atmosphere by a factor of 100 to 1000 overpre-anthropogenic values. Methane absorbs infrared light between about 1250 and1350 cm−1, a frequency range at which terrestrial radiation is less intense than it isin the absorption band of the CO2 bending mode, about 600–700 cm−1. A massive25
increase in methane concentration therefore has a smaller impact on the radiative bal-
1030
ance of the Earth than would a comparable increase in CO2, but nevertheless thegreenhouse forcing from the methane increase could be catastrophic, equivalent toincreasing CO2 by a factor of 10 or more. The methane hydrate reservoir thereforehas the potential to warm Earth’s climate to Eocene hothouse-type conditions, withinjust a few years. The potential for planetary devastation posed by the methane hydrate5
reservoir therefore seems comparable to the destructive potential from nuclear winteror from a bolide impact. Fortunately, most of the hydrate reservoir seems insolatedfrom the climate of the Earth’s surface, so that any melting response will take place ontime scales of millennia or longer.
4.2 Permafrost deposits10
The Siberian margin is one example of a place where methane hydrate is melting to-day, presumably at an accelerated rate in response to anthropogenic warming. Thisis a special case, where subsurface hydrates are exposed to the ocean by lateral ero-sion of coastline. The coastline is receding at rates of tens of meters per year in partsof Siberia and Alaska, but this is an ongoing process that began with the sea level15
rise of the deglaciation (Hubberten and Romanovskii, 2001). The melting of hydratesin this region releases methane in an ongoing, chronic way, potentially increasing thesteady-state methane concentration of the atmosphere, along with other ongoing an-thropogenic methane fluxes. No mechanism has been proposed whereby a significantfraction of the Siberian permafrost hydrates could release their methane catastrophi-20
cally.
4.3 Structural deposits
The most vulnerable hydrate deposits in the ocean appear to be the structural type,in which methane gas flows in the subsurface, along faults or channels, perhaps toaccumulate to high concentrations in domes or underneath impermeable sedimentary25
layers. The structural deposits have two distinguishing characteristics that may affect
1031
their potential for methane release. First, they produce “massive” methane hydrates,displacing the sediment to generate large chunks of hydrate, potentially filling tens ofpercent of the volume of the sediment (Trehu et al., 2004b), as opposed to just a fewpercent in the stratigraphic-type hydrate deposits. The significance of this is that a largechunk of hydrate is more likely to survive an ascent to the sea surface, if it escapes the5
sediment column as a result of a submarine landslide (Brewer et al., 2002; Paull et al.,2003) or simply by breaking off from the sediment surface (Macdonald et al., 1994).The other important characteristic of structural hydrate deposits is that the hydratecan be found at shallower depths in the sediment, in general, than is typical for thestratigraphic-type deposits. Methane hydrates are found at the sediment surface in the10
Gulf of Mexico (Macdonald et al., 1994) and Hydrate Ridge. Hydrate deposits of thesecharacteristics is also often associated with mud volcanos.
The proximity of structural hydrate deposits to the waters of the ocean allows themto be affected by anthropogenic warming without waiting thousands of years for heatto diffuse into the sediment column (Fig. 3). However, these deposits are still covered15
with hundreds of meters of ocean water. Throughout most of the ocean, the stabilitydepth is of order 500–700 m, shoaling to perhaps 200 m in the Arctic. Surface warmingis expected to take order a century to reach these depths. Presumably any melting re-sponse to this gradual warming would be gradual as well, slower than the atmosphericlifetime of methane and therefore by our definition a chronic methane release rather20
than a catastrophic one.
4.4 Stratigraphic deposits
Most of the hydrate deposits on Earth are of the stratigraphic-type, which implies thatthe hydrate is (1) typically dilute and (2) generally located near the base of the stabilityzone in the sediment, which can be hundreds of meters below the sea floor. Warming25
of the ocean can propagate into the sediment column, but this thick layer of thermalinsulation guarantees that most of the anthropogenic effect on temperature will takethousands of years. Melting of hydrates in response to warming will tend to occur pri-
1032
marily below the stability zone, where bubbles of methane will be produced in a processanalogous to the ongoing melting of hydrates to produce the bubble-layer (BSR). Thefate of gas bubbles released in subsurface sediment is still very uncertain. The gascould remain in place, or it could escape through the cold trap of the stability zone, orit could destabilize the sediment column, provoking submarine landslides. A landslide5
could release methane as hydrate, which may reach the atmosphere, and bubbles,which probably would not. A landslide methane release would certainly be abrupt, butit would not be climatically catastrophic because the amount of methane in any givenlandslide could only be a tiny fraction of the global methane inventory. A slide the sizeof the Storegga slide off of Norway could potentially release enough methane to affect10
climate comparably to a large volcanic eruption, although it would be a warming ratherthan a cooling, and it would last a decade rather than a few years. As it happens,there was no increase in atmospheric methane during the time interval of the Storeggalandslide itself, but rather a decrease associated with the 8.2 k climate event, a coolingevent triggered by a sudden meltwater release to the ocean.15
4.5 Century-timescale response
On the timescale of the coming century, it appears that most of the hydrate reservoir willbe insulated from anthropogenic climate change. The exceptions are hydrate in per-mafrost soils, especially those coastal areas, and in shallow ocean sediments wheremethane gas is focused by subsurface migration. The most likely response of these20
deposits to anthropogenic climate change is an increased background rate of chronicmethane release, rather than an abrupt release. Methane gas in the atmosphere isa transient species, its loss by oxidation continually replenished by ongoing release.An increase in the rate of methane emission to the atmosphere from melting hydrateswould increase the steady-state methane concentration of the atmosphere.25
The potential rate of methane emission from hydrates is more speculative than therate from other methane sources such as the decomposition of peat in thawing per-mafrost deposits, or anthropogenic emission from agricultural, livestock, and fossil fuel
1033
industries, but the potential rates appear to be comparable between these sources.
4.6 Geological-timescale response
On geologic time scales, the strongest climate impact appears to be from CO2,the oxidation product of any released methane. Methane is a transient species inthe atmosphere, with a lifetime of about a decade. CO2 accumulates in the atmo-5
sphere/ocean/terrestrial biosphere carbon pool, and persists to affect climate for hun-dreds of thousands of years (Archer, 2005). If a pool of methane is released overa timescale of thousands of years, the climate impact from the accumulating CO2concentration may exceed that from the steady-state increase in the methane con-centration (Archer and Buffett, 2005, see also Harvey and Huang, 1995; Schmidt and10
Shindell, 2003). After the emission stops, methane drops quickly to a lower steadystate, while the CO2 persists (Schmidt and Shindell, 2003).
If hydrates melt in the ocean, much of the methane would probably be oxidized inthe ocean rather than reaching the atmosphere directly as methane. This reduces thecentury-timescale climate impact of melting hydrate, but on timescales of millennia and15
longer the climate impact is the same regardless of where the methane is oxidized.Methane oxidized to CO2 in the ocean will equilibrate with the atmosphere within afew hundred years, resulting in the same partitioning of the added CO2 between theatmosphere and the ocean regardless of its origin.
Archer and Buffett (2005) find an amplifying positive feedback among atmospheric20
CO2, the temperature of the deep ocean, and the release of carbon from methanehydrate to more atmospheric CO2. They find that if the melting kinetics of the reservoirare assumed to be too fast, or the release fraction too high, then the reservoir becomesunstable, melting down spontaneously in ways that are not obvious in the δ13C record.The rate and extent to which methane carbon can escape the sediment column in25
response to warming is, as we have seen, very difficult to constrain at present. Itdepends on the stability of the sediment slope to sliding, and on the permeability of thesediment and the hydrate stability zone cold trap to bubble methane fluxes. They find
1034
that in a worst-case scenario, after thousands or hundreds of thousands of years, themethane hydrate reservoir could release as much carbon as fossil fuel emissions.
Acknowledgements. I appreciate helpful reviews by E. Nisbet, B. Buffett, E. Thomas, A. Trehu,and two other anonymous reviewers. This work was supported by the National Science Foun-dation and the German Advisory Council on Global Change (WBGU).5
References
Alley, R. B. and Agustsdottir, A. M.: The 8 k event: cause and consequences of a majorHolocene abrupt climate change, Quat. Sci. Rev., 24(10–11), 1123–1149, 2005.
Anisimov, O. A. and Nelson, F. E.: Permafrost distribution in the Northern Hemisphere underscenarios of climate change, Global Planet. Change, 14, 59–72, 1996.10
Aoki, Y., Shimizu, S., Yamane, T., Tanaka, T., Nakayama, K., Hayashi, T., and Okuda, Y.:Methane hydrate accumulation along the western Nankai Trough, in: Gas Hydrates: Chal-lenges for the Future, 136–145, 2000.
Archer, D.: Fate of fossil-fuel CO2 in geologic time, J. Geophys. Res. Oceans, C09S05,doi:10.1029/2004JC002625, 2005.15
Archer, D., Kheshgi, H., and Maier-Riemer, E.: Multiple timescales for neutralization of fossilfuel CO2, Geophys. Res. Lett., 24, 405–408, 1997.
Archer, D., Martin, P., et al.: The importance of ocean temperature to global biogeochemistry,Earth Planet. Sci. Lett., 222, 333–348, 2004.
Archer, D. E. and Buffett, B.: Time-dependent response of the global ocean clathrate reser-20
voir to climatic and anthropogenic forcing, Geochem., Geophys., Geosys., 6(3), Q03002,doi:10.1029/2004GC000854, 2005.
Archer, D. E., Morford, J. L., et al.: A model of suboxic sedimentary diagenesis suitablefor automatic tuning and gridded global domains, Global Biogeochem. Cycles, 16, 1017,doi:10.1029/2000GB001288, 2002.25
Berner, R. A., Lasaga, A. C., et al.: The carbonate-silicate geochemical cycle and its effecton atmospheric carbon dioxide over the past 100 million years, Am. J. Sci., 283, 641–683,1983.
Boetius, A., Ravenschlag, K., et al.: A marine microbial consortium apparently mediating anaer-obic oxidation of methane, Nature, 407, 6804, 623–626, 2000.30
1035
Borowski, W. S.: A review of methane and gas hydrates in the dynamic, stratified system of theBlake Ridge region, offshore southeastern North America, Chem. Geol., 205(3–4), 311–346,2004.
Borowski, W. S., Paull, C. K., et al.: Marine pore-water sulfate profiles indicate in situ methaneflux from underlying gas hydrate, Geology, 24(7), 655–658, 1996.5
Borowski, W. S., Paull, C. K., et al.: Global and local variations of interstitial sulfate gradientsin deep-water, continental margin sediments: Sensitivity to underlying methane and gashydrates, Mar. Geol., 159(1–4), 131–154, 1999.
Boudreau, B. P., Algar, C., et al.: Bubble growth and rise in soft sediments, Geology, 33(6),517–520, 2005.10
Bowen, G. J., Beerling, D. J., et al.: A humid climate state during the Palaeocene/Eocenethermal maximum, Nature, 432(7016), 495–499, 2004.
Bralower, T. J., Thomas, D. J., et al.: High-resolution records of the late Paleocene thermalmaximum and circum-Caribbean volcanism: Is there a causal link?, Geology, 25(11), 963–966, 1997.15
Brewer, P. G., Paull, C., et al.: Measurements of the fate of gas hydrates during transit throughthe ocean water column, Geophys. Res. Lett., 29(22), 2081, doi:10.1029/2002GL014727,2002.
Brook, E. J., Harder, S., et al.: On the origin and timing of rapid changes in atmosphericmethane during the last glacial period, Global Biogeochem. Cycles, 14(2), 559–572, 2000.20
Brooks, J. M., Bryant, W. R., et al.: The nature of gas hydrates on the Nigerian continentalslope, in Gas Hydrates: Challenges for the Future, 76–93, 2000.
Bryn, P., Berg, K., et al.: Explaining the Storegga Slide, Mar. Petroleum Geol., 22(1–2), 11–19,2005.
Bubier, J., Moore, T., et al.: A comparison of methane flux in a boreal landscape between a dry25
and a wet year, Global Biogeochem. Cycles, 19(1), GB1023, doi:10.1029/2004GB002351,2005.
Bubier, J. L., Moore, T. R., et al.: Ecological Controls on Methane Emissions from a North-ern Peatland Complex in the Zone of Discontinuous Permafrost, Manitoba, Canada, GlobalBiogeochem. Cycles, 9(4), 455–470, 1995.30
Buffett, B. and Archer, D. E.: Global inventory of methane clathrate: Sensitivity to changes inenvironmental conditions, Earth Planetary Sci. Lett., 227, 185–199, 2004.
Buffett, B. A.: Clathrate hydrates, Annual Review of Earth and Planetary Sciences, 28, 477–
1036

507, 2000.Buffett, B. A. and Zatsepina, O. Y.: Metastability of gas hydrate, Geophys. Res. Lett., 26(19),
2981–2984, 1999.Buffett, B. A. and Zatsepina, O. Y.: Formation of gas hydrate from dissolved gas in natural
porous media, Mar. Geol., 164(1–2), 69–77, 2000.5
Bunz, S. and Mienert, J.: Acoustic imaging of gas hydrate and free gas at the Storegga Slide,J. Geophys. Res.-Solid Earth, 109(B4), B04102, doi:10.1029/2003JB002863, 2004.
Camill, P.: Permafrost thaw accelerates in boreal peatlands during late-20th century climatewarming, Climatic Change, 68(1–2), 135–152, 2005.
Cannariato, K. G. and Stott, L. D.: Evidence against clathrate-derived methane release to10
Santa Barbara Basin surface waters?, Geochemistry Geophysics Geosystems, 5, Q05007,doi:10.1029/2003GC000600, 2004.
Chatti, I., Delahaye, A., et al.: Benefits and drawbacks of clathrate hydrates: a review of theirareas of interest, Energy Conversion and Management, 46(9–10), 1333–1343, 2005.
Circone, S., Stern, L. A., et al.: Methane hydrate dissociation rates at 0.1 MPa and tempera-15
tures above 272 K, in Gas Hydrates: Challenges for the Future, 544–555, 2000.Clark, J. F., Washburn, L., et al.: Dissolved hydrocarbon flux from natural marine seeps to the
southern California Bight, J. Geophys. Res.-Oceans, 105(C5), 11 509–11 522, 2000.Clennell, M. B., Henry, P., et al.: Formation of natural gas hydrates in marine sediments. Gas
hydrate growth and stability conditioned by host sediment properties, in: Gas Hydrates:20
Challenges for the Future, 887–896, 2000.Clennell, M. B., Hovland, M., et al.: Formation of natural gas hydrates in marine sediments 1.
Conceptual model of gas hydrate growth conditiond by host sediment properties, J. Geophys.Res. B, 104, 22 985–23 003, 1999.
Collett, T. S. and Kuuskraa, V. A.: Hydrates contain vast store of world gas resources, Oil and25
Gas Journal, 96, 90–95, 1998.D’Hondt, S., Jorgensen, B. B., et al.: Distributions of microbial activities in deep subseafloor
sediments, Science, 306(5705), 2216–2221, 2004.D’Hondt, S., Rutherford, S., et al.: Metabolic activity of subsurface life in deep-sea sediments,
Science, 295(5562), 2067–2070, 2002.30
Dallenbach, A., Blunier, T., et al.: Changes in the atmospheric CH4 gradient between Green-land and Antarctica during the Last Glacial and the transition to the Holocene, Geophys. Res.Lett., 27, 1005–1008, 2000.
1037
Dallimore, S. R. and Collett, T. S.: Intrapermafrost Gas Hydrates from a Deep Core-Hole in theMackenzie Delta, Northwest-Territories, Canada, Geology, 23(6), 527–530, 1995.
Dansgaard, W., White, J. W. C., et al.: The abrupt termination of the Younger Dryas climateevent, Nature, 339, 532–534, 1989.
Davie, M. K. and Buffett, B. A.: A numerical model for the formation of gas hydrate below the5
seafloor, J. Geophys. Res., 106(B1), 497–514, 2001.Deffeyes, K. S.: Hubbert’s Peak: The Impending World Oil Shortage, Princeton University
Press, Princeton, NJ, 2001.Dickens, G. R.: The potential volume of oceanic methane hydrates with variable external con-
ditions, Org. Geochem., 32, 1179–1193, 2001.10
Dickens, G. R., O’Heill, J. R., et al.: Dissociation of oceanic methane hydrate as a cause ofthe carbon isotope excursion at the end of the Paleocene, Paleoceanography, 19, 965–971,1995.
Dickens, G. R., Paull, C. K., et al.: Direct measurement of in situ methane quantities in a largegas-hydrate reservoir, Nature, 385(6615), 426–428, 1997.15
Dimitrov, L. and Woodside, J.: Deep sea pockmark environments in the eastern Mediterranean,Marine Geology, 195(1–4), 263–276, 2003.
Dimitrov, L. I.: Mud volcanoes – the most important pathway for degassing deeply buried sedi-ments, Earth-Sci. Rev., 59(1–4), 49–76, 2002.
Driscoll, N. W., Weissel, J. K., et al.: Potential for large-scale submarine slope failure and20
tsunami generation along the US mid-Atlantic coast, Geol., 28(5), 407–410, 2000.Dugan, B. and Flemings, P. B.: Overpressure and fluid flow in the New Jersey continental slope:
Implications for slope failure and cold seeps, Science, 289, 288–291, 2000.Egeberg, P. K. and Barth, T.: Contribution of dissolved organic species to the carbon and
energy budgets of hydrate bearing deep sea sediments (Ocean Drilling Program Site 99725
Blake Ridge), Chem. Geol., 149(1–2), 25–35, 1998.Fehn, U., Snyder, G., et al.: Dating of pore waters with I-129: Relevance for the origin of marine
gas hydrates, Science, 289(5488), 2332–2335, 2000.Flemings, B. P., Liu, X., et al.: Critical pressure and multiphase flow in Blake Ridge gas hy-
drates, Geology, 31, 1057–1060, 2003.30
Flemings, P. B., Stump, B. B., et al.: Flow focusing in overpressured sandstones: Theory,observations, and applications, Am. J. Sci., 302, 827–855, 2002.
Gardiner, B. S., Boudreau, B. P., et al.: Growth of disk-shaped bubbles in sediments, Geochim-
1038
ica Et Cosmochimica Acta, 67(8), 1485–1494, 2003.Gavrilov, A. V., Romanovskii, X. N., et al.: Reconstruction of ice complex remnants on the
eastern Siberian Arctic Shelf, Permafrost and Periglacial Processes, 14(2), 187–198, 2003.Gorman, A. R., Holbrook, W. S., et al.: Migration of methane gas through the hydrate stability
zone in a low-flux hydrate province, Geology, 30(4), 327–330, 2002.5
Gornitz, V. and Fung, I.: Potential distribution of methane hydrate in the world’s oceans, GlobalBiogeochem. Cycles, 8, 335–347, 1994.
Grace, J. D. and Hart, G. F.: Giant Gas-Fields of Northern West Siberia, Aapg Bulletin-American Association of Petroleum Geologists, 70(7), 830–852, 1986.
Grant, N. J. and Whiticar, M. J.: Stable carbon isotopic evidence for methane oxidation in10
plumes above Hydrate Ridge, Cascadia Oregon Margin, Global Biogeochem. Cycles, 16(4),1124, doi:10.1029/2001GB001851, 2002.
Grauls, D.: Gas hydrates: importance and applications in petroleum exploration, Marine andPetroleum Geology, 18(4), 519–523, 2001.
Hampton, M. A., Lee, H. J., et al.: Submarine landslides, Reviews of Geophysics, 34(1), 33–59,15
1996.Hansen, J., Sato, M., et al.: Efficacy of climate forcings, Journal of Geophys. Res.-Atmos.,
110(D18), D18104, doi:10.1029/2005JD005776, 2005.Harvey, L. D. D. and Huang, Z.: Evaluation of the potential impact of methane clathrate desta-
bilization on future global warming, J. Geophys. Res., 100, 2905–2926, 1995.20
Heeschen, K. U., Collier, R. W., et al.: Methane sources, distributions, and fluxes from coldvent sites at Hydrate Ridge, Cascadia Margin, Global Biogeochem. Cycles, 19(2), GB2016,doi:10.1029/2004GB002266, 2005.
Heeschen, K. U., Trehu, A. M., et al.: Distribution and height of methane bubble plumes onthe Cascadia Margin characterized by acoustic imaging, Geophys. Res. Lett., 30(12), 1643,25
doi:10.1029/2003GL016974, 2003.Herz, O. F.: Frozen mammoths in Siberia, Ann. Rep. Smithsonian Inst., 1904, 611–625, 1904.Hesselbo, S. P., Grocke, D. R., et al.: Massive dissociation of gas hydrate during a Jurassic
oceanic anoxic event, Nature, 406(6794), 392–395, 2000.Hill, J. C., Driscoll, N. W., et al.: Large-scale elongated gas blowouts along the30
US Atlantic margin, Journal of Geophysical Research-Solid Earth, 109(B9), B09101,doi:10.1029/2004JB002969, 2004.
Hinrichs, K. U., Hmelo, L. R., et al.: Molecular fossil record of elevated methane levels in late
1039
pleistocene coastal waters, Science, 299(5610), 1214–1217, 2003.Hoehler, T. M., Albert, D. B., et al.: Acetogenesis from CO2 in an anoxic marine sediment,
Limnol. Oceanogr., 44(3), 662–667, 1999.Hoehler, T. M., Alperin, M. J., et al.: Thermodynamic control on hydrogen concentrations in
anoxic sediments, Geochimica Et Cosmochimica Acta, 62(10), 1745–1756, 1998.5
Hornbach, M. J., Saffer, D. M., et al.: Critically pressured free-gas reservoirs below gas-hydrateprovinces, Nature, 427(6970), 142–144, 2004.
Hovland, M., Gallagher, J. W., et al.: Gas hydrate and free gas volumes in marine sediments:Example from the Niger Delta front, Marine and Petroleum Geology, 14(3), 245–255, 1997.
Hovland, M. and Judd, A.: Seabed pockmarks and seepages: impact on geology, biology, and10
the marine environment, Graham & Trotman, London, 1988Hovland, M., H. Svensen, et al.: Complex pockmarks with carbonate-ridges off mid-Norway:
Products of sediment degassing, Marine Geology, 218(1-4), 191-206, 2005.Hubberten, H. W. and Romanovskii, N. N.: Terrestrial and offshore permafrost evolution of the
Laptev sea region during the last Pleistocene-Holocene glacial-eustatic cycle, in Permafrost15
response on economic develoopment, environmental security and natural resources editedby R. Paepa and V. Melnikov, Klewer, 43–60, 2001.
Huber, M., L.,, et al.: Early Paleogene oceans and climate: A fully coupled modeling approachusing the National Center for Atmospheric Research Community Climate System Model, inCauses and consequences of globally warm climates in the Early Paleogene edited by S.20
L. Wing, P. D. Gingerich, B. Schmitz and E. Thomas, Geological Society of America, 25–47,2002.
Jenkyns, H. C.: Evidence for rapid climate change in the Mesozoic-Palaeogene greenhouseworld, Philosophical Transactions of the Royal Society of London Series a-MathematicalPhysical and Engineering Sciences, 361(1810), 1885–1916, 2003.25
Kennett, J. P., Cannariato, K. G., et al.: Carbon isotopic evidence for methane hydrate instabilityduring quaternary interstadials, Science, 288(5463), 128–133, 2000.
Kennett, J. P., K. G.,, et al.: Methane hydrates in Quaternary climate change: The clathrate gunhypothesis, AGU, 2003
Kennett, J. P. and Stott, L. D.: Abrupt deep sea warming, paleoceanographic changes and30
benthic extinctions at the end of the Paleocene, Nature, 353, 319–322, 1991.Kent, D. V., Cramer, B. S., et al.: A case for a comet impact trigger for the Paleocene/Eocene
thermal maximum and carbon isotope excursion, Earth Planet. Sci. Lett., 211(1–2), 13–26,
1040

2003.Kerr, R. A.: Energy – Gas hydrate resource: Smaller but sooner, Science, 303(5660), 946–947,
2004.Klauda, J. B. and S. I. Sandler: Global distribution of methane hydrate in ocean sediment,
Energy & Fuels, 19(2), 459-470, 2005.5
Koch, P. L., Zachos, J. C., et al.: Coupled isotopic change in marine and continental carbonreservoirs near the Paleocene/Eocene boundary, Nature, 358, 319–322, 1992.
Kolbert, E.: The Climate of Man, The New Yorker, April 25, 56–71, 2005.Krason, J.: Messoyakh gas field (W. Siberia) – A model for development of the methane hydrate
deposits of Mackenzie Delta, in Gas Hydrates: Challenges for the Future, 173–188, 2000.10
Kump, L. R. and Arthur, M. A.: Interpreting carbon-isotope excursions: carbonates and organicmatter, Chem. Geol., 161, 181–198, 1999.
Kvenvolden, K. A.: Methane Hydrate – a Major Reservoir of Carbon in the Shallow Geosphere,Chemical Geology, 71(1–3), 41–51, 1988.
Kvenvolden, K. A.: Potential effects of gas hydrate on human welfare, Proc. Natl. Acad. Sci.15
USA, 96, 3420–3426, 1999.Larson, R. L.: Geological consequences of superplumes, Geology, 19, 963–966, 1991.Leifer, I., Clark, J. F., et al.: Modifications of the local environment by natural marine hydrocar-
bon seeps, Geophys. Res. Lett., 27(22), 3711–3714, 2000.Leifer, I. and MacDonald, I.: Dynamics of the gas flux from shallow gas hydrate deposits:20
interaction between oily hydrate bubbles and the oceanic environment, Earth Planet. Sci.Lett., 210(3–4), 411–424, 2003.
Levitus, S., Conkright, M. E., et al.: Distribution of nitrate, phosphate, and silicate in the world’soceans, Prog. Oceanogr., 31, 245–273, 1993.
Liblik, L. K., Moore, T. R., et al.: Methane emissions from wetlands in the zone of discontinu-25
ous permafrost: Fort Simpson, Northwest Territories, Canada, Global Biogeochem. Cycles,11(4), 485–494, 1997.
Lorenson, T. D.: Microscopic character of marine sediment containing disseminated gas hy-drate – Examples from the slake ridge and the middle America Trench, in Gas Hydrates:Challenges for the Future, 189–194, 2000.30
Lourens, L. J., Sluijs, A., et al.: Astronomical pacing of late Palaeocene to early Eocene globalwarming events, Nature, 435(7045), 1083–1087, 2005.
Luff, R., Greinert, J., et al.: Simulation of long-term feedbacks from authigenic carbonate crust
1041
formation at cold vent sites, Chem. Geol., 216(1–2), 157–174, 2005.Luyendyk, B., Kennett, J., et al.: Hypothesis for increased atmospheric methane input from hy-
drocarbon seeps on exposed continental shelves during glacial low sea level, Mar. PetroleumGeol., 22(4), 591–596, 2005.
Luyten, J. R., Pedlosky, J., et al.: The ventilated thermocline, J. Phys. Ocean., 13, 292–309,5
1983.MacDonald, G.: Role of methane clathrates in past and future climates, Clim. Change, 16,
247–281, 1990.MacDonald, I. R., Bohrmann, G., et al.: Asphalt volcanism and chemosynthetic life in the
Campeche Knolls, Gulf of Mexico, Science, 304(5673), 999–1002, 2004.10
Macdonald, I. R., Guinasso, N. L., et al.: Gas Hydrate That Breaches the Sea-Floor on theContinental-Slope of the Gulf-of-Mexico, Geology, 22(8), 699–702, 1994.
MacDonald, I. R., Leifer, I., et al.: Transfer of hydrocarbons from natural seeps to the watercolumn and atmosphere, Geofluids, 2(2), 95–107, 2002.
Martens, C. S., Albert, D. B., et al.: Biogeochemical processes controlling methane in gassy15
coastal sediments - Part 1. A model coupling organic matter flux to gas production, oxidationand transport, Continental Shelf Research, 18(14–15), 1741–1770, 1998.
Martin, P., Archer, D., et al.: Role of deep sea temperatures in the carbon cy-cle during the last glacial, Paleoceanography, PA2015, doi:10.1029/2003PA000914,doi:10.1029/2003PA000914, 2005.20
Maslin, M., Owen, M., et al.: Linking continental-slope failures and climate change: Testing theclathrate gun hypothesis, Geology, 32(1), 53–56, 2004.
Mienert, J., Andreassen, K., et al.: Changes of the hydrate stability zone of the Norwegianmargin from glacial to interglacial times, in Gas Hydrates: Challenges for the Future, 200–210, 2000.25
Mienert, J., Vanneste, M., et al.: Ocean warming and gas hydrate stability on the mid-Norwegian margin at the Storegga Slide, Marine and Petroleum Geology, 22(1–2), 233–244,2005.
Milkov, A. V.: Worldwide distribution of submarine mud volcanoes and associated gas hydrates,Mar.Geol., 167(1–2), 29–42, 2000.30
Milkov, A. V.: Global estimates of hydrate-bound gas in marine sediments: how much is reallyout there?, Earth-Sci. Rev., 66(3–4), 183–197, 2004.
Milkov, A. V.: Molecular and stable isotope compositions of natural gas hydrates: A re-
1042

vised global dataset and basic interpretations in the context of geological settings, OrganicGeochem., 36(5), 681–702, 2005.
Milkov, A. V. and Sassen, R.: Thickness of the gas hydrate stability zone, Gulf of Mexico conti-nental slope, Marine and Petroleum Geology, 17(9), 981–991, 2000.
Milkov, A. V. and Sassen, R.: Estimate of gas hydrate resource, northwestern Gulf of Mexico5
continental slope, Mar. Geol., 179(1–2), 71–83, 2001.Milkov, A. V. and Sassen, R.: Economic geology of offshore gas hydrate accumulations and
provinces, Marine and Petroleum Geology, 19(1), 1–11, 2002.Milkov, A. V. and R.,: Two-dimensional modeling of gas hydrate decomposition in the north-
western Gulf of Mexico: significance to global change assessment, Global and Planetary10
Change, 36(1–2), 31–46, 2003.Milkov, A. V., Vogt, P. R., et al.: Geological, geochemical, and microbial processes at the
hydrate-bearing Hakon Mosby mud volcano: a review, Chem. Geol., 205(3–4), 347–366,2004.
Nelson, F. E., Anisimov, O. A., et al.: Climate change and hazard zonation in the circum-Arctic15
permafrost regions, Natural Hazards, 26(3), 203–225, 2002.Nisbet, E. G.: Have sudden large releases of methane from geological reservoirs occurred
since the Last Glacial Maximum, and could such releases occur again?, Philosophical Trans-actions of the Royal Society of London Series a-Mathematical Physical and EngineeringSciences, 360(1793), 581–607, 2002.20
Nisbet, E. G. and Piper, D. J. W.: Giant submarine landslides, Nature, 392(6674), 329–330,1998.
Nouze, H., Henry, P., et al.: Large gas hydrate accumulations on the eastern Nankai Troughinferred from new high-resolution 2-D seismic data, Geophys. Res. Lett., 31(13), L13308,doi:10.1029/2004GL019848, 2004.25
Orcutt, B. N., Boetius, A., et al.: Life at the edge of methane ice: microbial cycling of carbonand sulfur in Gulf of Mexico gas hydrates, Chem. Geol., 205(-3-4), 239–251, 2004.
Parkes, R. J., Cragg, B. A., et al.: Recent studies on bacterial populations and processes insubseafloor sediments: A review, Hydrogeol. J., 8(1), 11–28, 2000.
Paul, A. Z.: The effect of benthic biological processes on the CO2 carbonate system, in The30
Fate of Fossil Fuel CO2 in the Oceans edited by a. M. A. Andersen N.R., Plenum Press, 345,1978.
Paull, C. K., Brewer, P. G., et al.: An experiment demonstrating that marine slumping is a
1043
mechanism to transfer methane from seafloor gas-hydrate deposits into the upper oceanand atmosphere, Geo-Marine Lett., 22(4), 198–203, 2003.
Paull, C. K., Lorenson, T. D., et al.: Comparisons of in situ and core gas measurements in ODPLeg 164 bore holes, in Gas Hydrates: Challenges for the Future, 23–31, 2000.
Pavlov, A. A., Kasting, J. F., et al.: Greenhouse warming by CH4 in the atmosphere of early5
Earth, J. Geophys. Res.-Planets, 105(E5), 11 981–11 990, 2000.Payette, S., Delwaide, A., et al.: Accelerated thawing of subarctic peatland permafrost over the
last 50 years, Geophys. Res. Lett., 31, L18208, doi:10.1029/2004GL020358, 2004.Pearce, F.: Climate warning as Siberia melts, New Scientist, Aug. 11, 2005.Pecher, I. A., Kukowski, N., et al.: The link between bottom-simulating reflections and methane10
flux into the gas hydrate stability zone – new evidence from Lima Basin, Peru Margin, EarthPlanet. Sci. Lett., 185(3–4), 343–354, 2001.
Rehder, G., Brewer, P. W., et al.: Enhanced lifetime of methane bubble streams within the deepocean, Geophys. Res. Lett., 29(15), 1731, doi:10.1029/2001GL013966, 2002.
Rehder, G., Keir, R. S., et al.: Methane in the northern Atlantic controlled by microbial oxidation15
and atmospheric history, Geophys. Res. Lett., 26(5), 587–590, 1999.Rehder, G., S. H.,, et al.: Dissolution rates of pure methane hydrate and carbon-dioxide hydrate
in undersaturated seawater at 1000-m depth, Geochimica Et Cosmochimica Acta, 68(2),285–292, 2004.
Riedel, M., G. D.,, et al.: Seismic investigations of a vent field associated with gas hy-20
drates, offshore Vancouver Island, Journal of Geophys. Res.-Solid Earth, 107(B9), 2200,doi:10.1029/2001JB000269, 2002.
Rivkina, E., Laurinavichius, K., et al.: Microbial life in permafrost, Adv. Space Res., 33, 1215–1221, 2004.
Rivkina, E. M., Friedmann, E. I., et al.: Metabolic activity of permafrost bacteria below the25
freezing point, Appl. Environ. Microbiol., 66(8), 3230–3233, 2000.Rogner, H.-H.: An assessment of world hydrocarbon resources, Annu. Rev. Energy Environ.,
22, 217–262, 1997.Romankevich, E. A.: Geochemistry of Organic Matter in the Ocean, Springer, New York, 1984Rothwell, R. G., Reeder, M. S., et al.: Low sea-level stand emplacement of megaturbidites in30
the western and eastern Mediterranean Sea, Sedimentary Geology, 135(1–4), 75–88, 2000.Sager, W. W., Lee, C. S., et al.: High-frequency near-bottom acoustic reflection signatures of
hydrocarbon seeps on the Northern Gulf of Mexico continental slope, Geo-Mar. Lett., 18(4),
1044
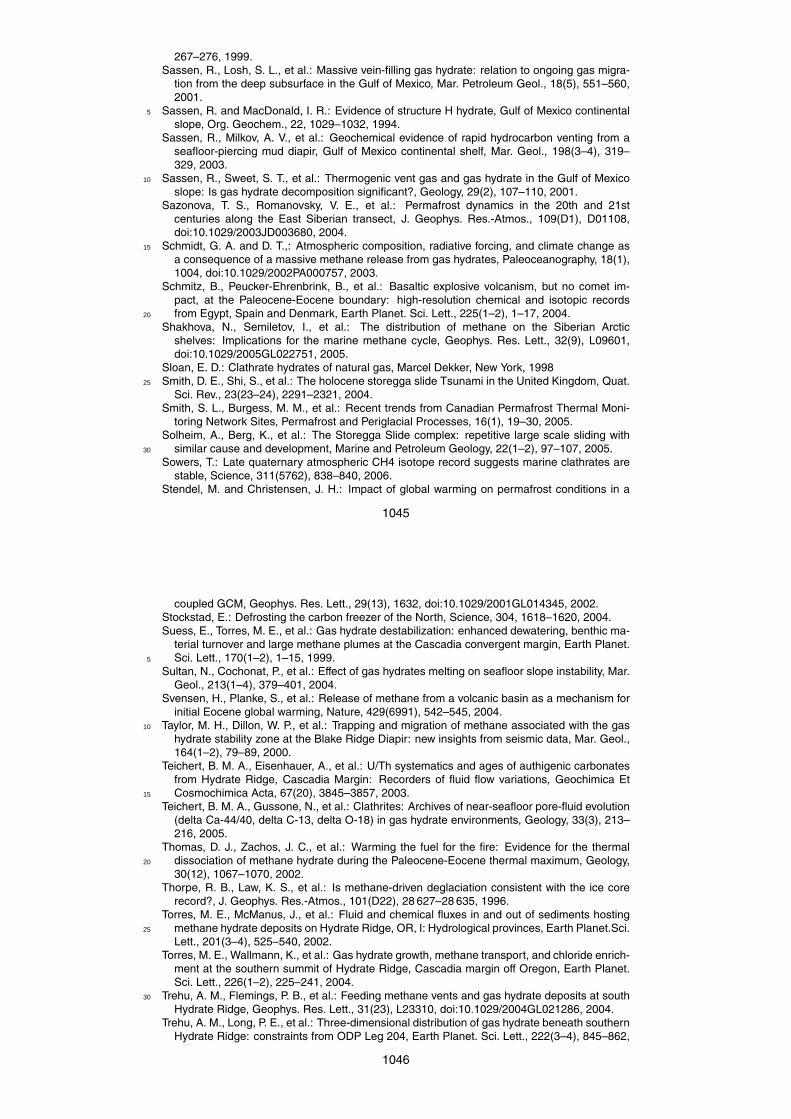
267–276, 1999.Sassen, R., Losh, S. L., et al.: Massive vein-filling gas hydrate: relation to ongoing gas migra-
tion from the deep subsurface in the Gulf of Mexico, Mar. Petroleum Geol., 18(5), 551–560,2001.
Sassen, R. and MacDonald, I. R.: Evidence of structure H hydrate, Gulf of Mexico continental5
slope, Org. Geochem., 22, 1029–1032, 1994.Sassen, R., Milkov, A. V., et al.: Geochemical evidence of rapid hydrocarbon venting from a
seafloor-piercing mud diapir, Gulf of Mexico continental shelf, Mar. Geol., 198(3–4), 319–329, 2003.
Sassen, R., Sweet, S. T., et al.: Thermogenic vent gas and gas hydrate in the Gulf of Mexico10
slope: Is gas hydrate decomposition significant?, Geology, 29(2), 107–110, 2001.Sazonova, T. S., Romanovsky, V. E., et al.: Permafrost dynamics in the 20th and 21st
centuries along the East Siberian transect, J. Geophys. Res.-Atmos., 109(D1), D01108,doi:10.1029/2003JD003680, 2004.
Schmidt, G. A. and D. T.,: Atmospheric composition, radiative forcing, and climate change as15
a consequence of a massive methane release from gas hydrates, Paleoceanography, 18(1),1004, doi:10.1029/2002PA000757, 2003.
Schmitz, B., Peucker-Ehrenbrink, B., et al.: Basaltic explosive volcanism, but no comet im-pact, at the Paleocene-Eocene boundary: high-resolution chemical and isotopic recordsfrom Egypt, Spain and Denmark, Earth Planet. Sci. Lett., 225(1–2), 1–17, 2004.20
Shakhova, N., Semiletov, I., et al.: The distribution of methane on the Siberian Arcticshelves: Implications for the marine methane cycle, Geophys. Res. Lett., 32(9), L09601,doi:10.1029/2005GL022751, 2005.
Sloan, E. D.: Clathrate hydrates of natural gas, Marcel Dekker, New York, 1998Smith, D. E., Shi, S., et al.: The holocene storegga slide Tsunami in the United Kingdom, Quat.25
Sci. Rev., 23(23–24), 2291–2321, 2004.Smith, S. L., Burgess, M. M., et al.: Recent trends from Canadian Permafrost Thermal Moni-
toring Network Sites, Permafrost and Periglacial Processes, 16(1), 19–30, 2005.Solheim, A., Berg, K., et al.: The Storegga Slide complex: repetitive large scale sliding with
similar cause and development, Marine and Petroleum Geology, 22(1–2), 97–107, 2005.30
Sowers, T.: Late quaternary atmospheric CH4 isotope record suggests marine clathrates arestable, Science, 311(5762), 838–840, 2006.
Stendel, M. and Christensen, J. H.: Impact of global warming on permafrost conditions in a
1045
coupled GCM, Geophys. Res. Lett., 29(13), 1632, doi:10.1029/2001GL014345, 2002.Stockstad, E.: Defrosting the carbon freezer of the North, Science, 304, 1618–1620, 2004.Suess, E., Torres, M. E., et al.: Gas hydrate destabilization: enhanced dewatering, benthic ma-
terial turnover and large methane plumes at the Cascadia convergent margin, Earth Planet.Sci. Lett., 170(1–2), 1–15, 1999.5
Sultan, N., Cochonat, P., et al.: Effect of gas hydrates melting on seafloor slope instability, Mar.Geol., 213(1–4), 379–401, 2004.
Svensen, H., Planke, S., et al.: Release of methane from a volcanic basin as a mechanism forinitial Eocene global warming, Nature, 429(6991), 542–545, 2004.
Taylor, M. H., Dillon, W. P., et al.: Trapping and migration of methane associated with the gas10
hydrate stability zone at the Blake Ridge Diapir: new insights from seismic data, Mar. Geol.,164(1–2), 79–89, 2000.
Teichert, B. M. A., Eisenhauer, A., et al.: U/Th systematics and ages of authigenic carbonatesfrom Hydrate Ridge, Cascadia Margin: Recorders of fluid flow variations, Geochimica EtCosmochimica Acta, 67(20), 3845–3857, 2003.15
Teichert, B. M. A., Gussone, N., et al.: Clathrites: Archives of near-seafloor pore-fluid evolution(delta Ca-44/40, delta C-13, delta O-18) in gas hydrate environments, Geology, 33(3), 213–216, 2005.
Thomas, D. J., Zachos, J. C., et al.: Warming the fuel for the fire: Evidence for the thermaldissociation of methane hydrate during the Paleocene-Eocene thermal maximum, Geology,20
30(12), 1067–1070, 2002.Thorpe, R. B., Law, K. S., et al.: Is methane-driven deglaciation consistent with the ice core
record?, J. Geophys. Res.-Atmos., 101(D22), 28 627–28 635, 1996.Torres, M. E., McManus, J., et al.: Fluid and chemical fluxes in and out of sediments hosting
methane hydrate deposits on Hydrate Ridge, OR, I: Hydrological provinces, Earth Planet.Sci.25
Lett., 201(3–4), 525–540, 2002.Torres, M. E., Wallmann, K., et al.: Gas hydrate growth, methane transport, and chloride enrich-
ment at the southern summit of Hydrate Ridge, Cascadia margin off Oregon, Earth Planet.Sci. Lett., 226(1–2), 225–241, 2004.
Trehu, A. M., Flemings, P. B., et al.: Feeding methane vents and gas hydrate deposits at south30
Hydrate Ridge, Geophys. Res. Lett., 31(23), L23310, doi:10.1029/2004GL021286, 2004.Trehu, A. M., Long, P. E., et al.: Three-dimensional distribution of gas hydrate beneath southern
Hydrate Ridge: constraints from ODP Leg 204, Earth Planet. Sci. Lett., 222(3–4), 845–862,
1046

2004.Uchida, M., Shibata, Y., et al.: Episodic methane release events from Last Glacial marginal
sediments in the western North Pacific, Geochemistry Geophysics Geosystems, 5, Q08005,2004.
Valentine, D. L., Blanton, D. C., et al.: Water column methane oxidation adjacent to an area5
of active hydrate dissociation, Eel River Basin, Geochimica Et Cosmochimica Acta, 65(16),2633–2640, 2001.
Vogt, P. R. and Jung, W. Y.: Holocene mass wasting on upper non-Polar continental slopes –due to post-Glacial ocean warming and hydrate dissociation?, Geophys. Res. Lett., 29(9),1341, doi:10.1029/2001GL013488, 2002.10
Wang, Y. and Jacob, D. J.: Anthropogenic forcing on tropospheric ozone and OH since prein-dustrial times, J. Geophys. Res., 103, 31 123–31 135, 1998.
Warzinski, R. and G.,: Gas clathrate hydrates, Energy & Fuels, 12(2), 189–190, 1998.Washburn, L., J. F.,, et al.: The spatial scales, distribution, and intensity of natural marine
hydrocarbon seeps near Coal Oil Point, California, Marine and Petroleum Geology, 22(4),15
569–578, 2005.Weinberger, J. L., Brown, K. M., et al.: Painting a picture of gas hydrate distribution with thermal
images, Geophys. Res. Lett., 32(4), L04609, doi:10.1029/2004GL021437, 2005.Wellsbury, P., K.,, et al.: Deep marine biosphere fuelled by increasing organic matter availability
during burial and heating, Nature, 388(6642), 573–576, 1997.20
Wellsbury, P., Mather, I., et al.: Geomicrobiology of deep, low organic carbon sediments in theWoodlark Basin, Pacific Ocean, Fems Microbiology Ecology, 42(1), 59–70, 2002.
Whiticar, M. J. and Faber, E.: Methane Oxidation in Sediment and Water Column Environments– Isotope Evidence, Organic Geochemistry, 10(4–6), 759–768, 1986.
Winters, W. J., Pecher, I. A., et al.: Physical properties and rock physics models of sedi-25
ment containing natural and laboratory-formed methane gas hydrate, American Mineralogist,89(8–9), 1221–1227, 2004.
Wood, W. T., Gettrust, J. F., et al.: Decreased stability of methane hydrates in marine sedimentsowing to phase-boundary roughness, Nature, 420(6916), 656–660, 2002.
Wuebbles, D. and Hayhoe, K.: Atmospheric methane and global change, Earth-Sci. Rev., 57,30
177–210, 2002.Xu, W. Y., Lowell, R. P., et al.: Effect of seafloor temperature and pressure variations on
methane flux from a gas hydrate layer: Comparison between current and late Paleocene
1047
climate conditions, J. Geophys. Res.-Solid Earth, 106(B11), 26 413–26 423, 2001.Zachos, J. C., Pagani, M., et al.: Trends, rhythms, and abberations in global climate 65 Ma to
Present, Science, 292, 686–693, 2001.Zachos, J. C., Rohl, U., et al.: Rapid acidification of the ocean during the Paleocene-Eocene
thermal maximum, Science, 308(5728), 1611–1615, 2005.5
Zachos, J. C., Wara, M. W., et al.: A transient rise in tropical sea surface temperature duringthe Paleocene-Eocene Thermal Maximum, Science, 302(5650), 1551–1554, 2003.
Zeebe, R. E. and Westbroek, P.: A simple model for the CaCO3 saturation state of theocean: The “Strangelove”, the “Neritan”, and the “Cretan” Ocean, Geochemistry GeophysicsGeosystems, 4, 1104, doi:10.1029/2003GC000538, 2003.10
Zillmer, M., Flueh, E. R., et al.: Seismic investigation of a bottom simulating reflector andquantification of gas hydrate in the Black Sea, Geophys. J. Int., 161(3), 662–678, 2005.
Zillmer, M., Reston, T., et al.: Imaging and quantification of gas hydrate and freegas at the Storegga slide offshore Norway, Geophys. Res. Lett., 32(4), L04308,doi:10.1029/2004GL021535, 2005.15
Zuhlsdorff, L. and Spiess, V.: Three-dimensional seismic characterization of a venting site re-veals compelling indications of natural hydraulic fracturing, Geology, 32(2), 101–104, 2004.
Zuhlsdorff, L., Spiess, V., et al.: Implications for focused fluid transport at the northern Cascadiaaccretionary prism from a correlation between BSR occurrence and near-sea-floor reflectivityanomalies imaged in a multi-frequency seismic data set, I. J. Earth Sci., 88(4), 655–667,20
2000.
1048
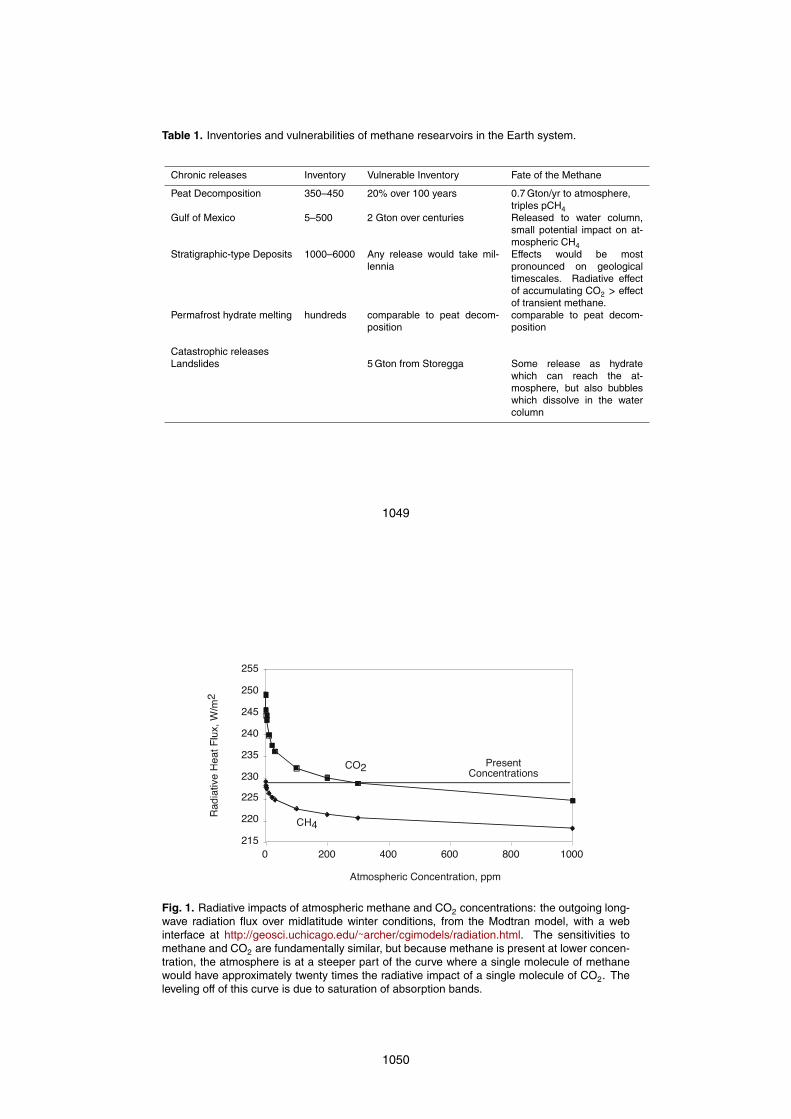
Table 1. Inventories and vulnerabilities of methane researvoirs in the Earth system.
Chronic releases Inventory Vulnerable Inventory Fate of the Methane
Peat Decomposition 350–450 20% over 100 years 0.7 Gton/yr to atmosphere,triples pCH4
Gulf of Mexico 5–500 2 Gton over centuries Released to water column,small potential impact on at-mospheric CH4
Stratigraphic-type Deposits 1000–6000 Any release would take mil-lennia
Effects would be mostpronounced on geologicaltimescales. Radiative effectof accumulating CO2 > effectof transient methane.
Permafrost hydrate melting hundreds comparable to peat decom-position
comparable to peat decom-position
Catastrophic releasesLandslides 5 Gton from Storegga Some release as hydrate
which can reach the at-mosphere, but also bubbleswhich dissolve in the watercolumn
1049
215
220
225
230
235
240
245
250
255
0 200 400 600 800 1000
Atmospheric Concentration, ppm
CO2
CH4
PresentConcentrations
Figure 1
Fig. 1. Radiative impacts of atmospheric methane and CO2 concentrations: the outgoing long-wave radiation flux over midlatitude winter conditions, from the Modtran model, with a webinterface at http://geosci.uchicago.edu/∼archer/cgimodels/radiation.html. The sensitivities tomethane and CO2 are fundamentally similar, but because methane is present at lower concen-tration, the atmosphere is at a steeper part of the curve where a single molecule of methanewould have approximately twenty times the radiative impact of a single molecule of CO2. Theleveling off of this curve is due to saturation of absorption bands.
1050
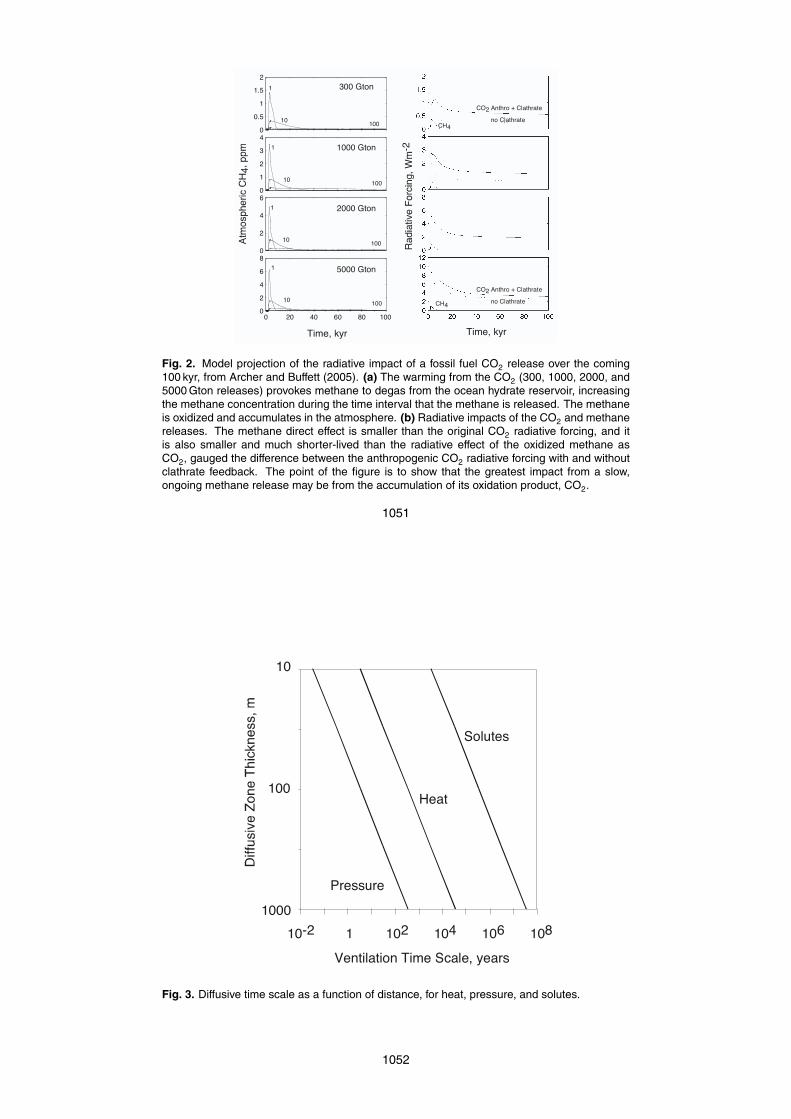
0
0.5
1
1.5
2
0
1
2
3
4
0
2
4
6
0 20 40 60 80 1000
2
4
6
8
Time, kyr Time, kyr
1
10 100
1
10 100
1
10 100
1
10 100
CO2 Anthro + Clathrate
no ClathrateCH4
CO2 Anthro + Clathrate
no ClathrateCH4
300 Gton
1000 Gton
2000 Gton
5000 Gton
Figure 2
Fig. 2. Model projection of the radiative impact of a fossil fuel CO2 release over the coming100 kyr, from Archer and Buffett (2005). (a) The warming from the CO2 (300, 1000, 2000, and5000 Gton releases) provokes methane to degas from the ocean hydrate reservoir, increasingthe methane concentration during the time interval that the methane is released. The methaneis oxidized and accumulates in the atmosphere. (b) Radiative impacts of the CO2 and methanereleases. The methane direct effect is smaller than the original CO2 radiative forcing, and itis also smaller and much shorter-lived than the radiative effect of the oxidized methane asCO2, gauged the difference between the anthropogenic CO2 radiative forcing with and withoutclathrate feedback. The point of the figure is to show that the greatest impact from a slow,ongoing methane release may be from the accumulation of its oxidation product, CO2.
1051
10
100
10001 102 10810610410-2
Ventilation Time Scale, years
Solutes
Heat
Pressure
Figure 3
Fig. 3. Diffusive time scale as a function of distance, for heat, pressure, and solutes.
1052

Depth(km
)
Depth(km
)Depth
(km)
Depth(km
)
Figure4
Fig. 4. The methane stability zone in surface sediments. Hydrate solubility temperature isgiven by the long-dashed line. Offshore water column temperatures are from Levitus (1993),given by the solid black lines. Nearshore, the sea floor impinges on the water column, so thattemperature follows the geotherm (short dashes). The thickness of the stability zone (heavysolid lines) increases with ocean depth.
1053
0
1
2
3
4
50.1 1 10 100 1000
SurfaceThermocline
Intermediate
Deep
Ventilation Time Scale, years
a
Figure 5
Fig. 5. Rough estimate of the ventilation time of the ocean as a function of ocean depth.Shallow waters warm in response to climate change more quickly than deep waters. Ventilationtimes of the real ocean vary laterally, as well; the North Atlantic, for example, ventilates morequickly than the ocean average because of the pathway of subsurface flow in the ocean.
1054
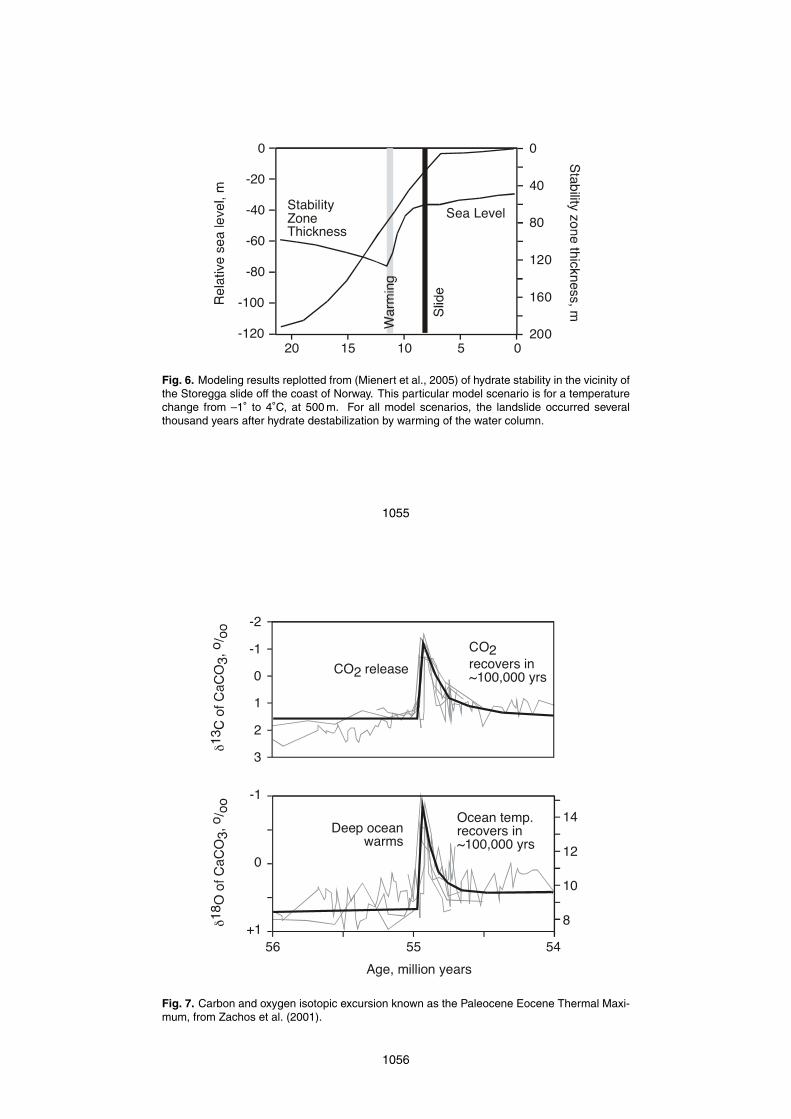
Figure 6
Sea LevelStabilityZoneThickness
0
-20
-40
-60
-80
-100
-12020 15 10 5 0
0
40
80
120
160
200
Fig. 6. Modeling results replotted from (Mienert et al., 2005) of hydrate stability in the vicinity ofthe Storegga slide off the coast of Norway. This particular model scenario is for a temperaturechange from –1◦ to 4◦C, at 500 m. For all model scenarios, the landslide occurred severalthousand years after hydrate destabilization by warming of the water column.
1055
Figure 7
-1
0
+1
3
2
1
0
-1
-2
545556Age, million years
CO2 release
Deep oceanwarms
8
10
12
14
CO2recovers in~100,000 yrs
Ocean temp.recovers in~100,000 yrs
Fig. 7. Carbon and oxygen isotopic excursion known as the Paleocene Eocene Thermal Maxi-mum, from Zachos et al. (2001).
1056
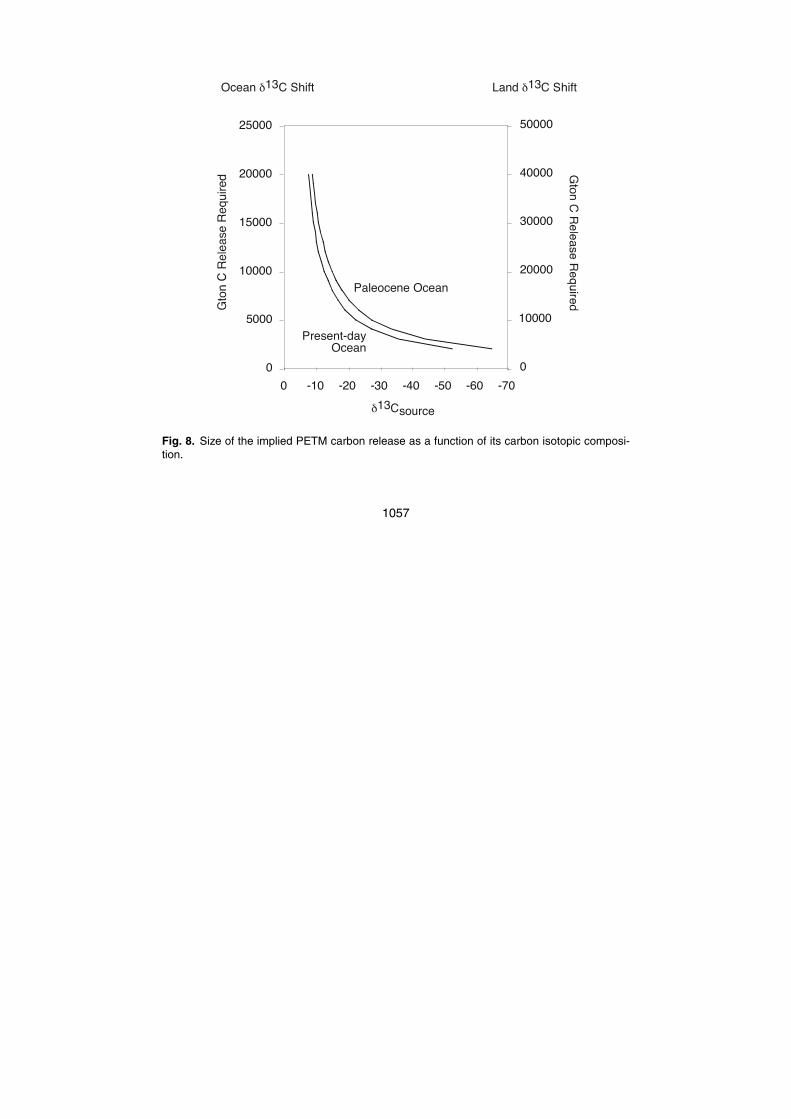
-70-60-50-40-30-20-1000
5000
10000
15000
20000
25000
δ13Csource
Present-dayOcean
Paleocene Ocean
Figure 8
0
10000
20000
30000
40000
50000
Ocean δ13C Shift Land δ13C Shift
Fig. 8. Size of the implied PETM carbon release as a function of its carbon isotopic composi-tion.
1057