Embed Size (px)
Citation preview

Changes in Rider Anthropometricsg p&
The Effects on Rail Car DesignThe Effects on Rail Car Design
APTA Rail ConferenceAPTA Rail ConferencePhiladelphia, PA
June 4, 2013

AgendaAgenda
• Problem Statement• Background Knowledge• Research Approach• Preliminary Findings• Conclusions• Future Recommendations
Tuesday June 4th 2013 2

Problem StatementProblem Statement
• The rail industry currently uses the AW0 4 rating scale to• The rail industry currently uses the AW0-4 rating scale to design cars that withstand passenger loading. – AW0: total car weight with no passengers in a revenue service
ready condition– AW1: AW0 + full seated passenger load– AW2: AW1 + Standing passenger load of 4 people per m2g p g p p p– AW3: AW1 + Standing passenger load of 6 people per m2
– AW4: AW1 + Standing passenger load of 8 people per m2
Tuesday June 4th 2013 3
Problem StatementProblem Statement
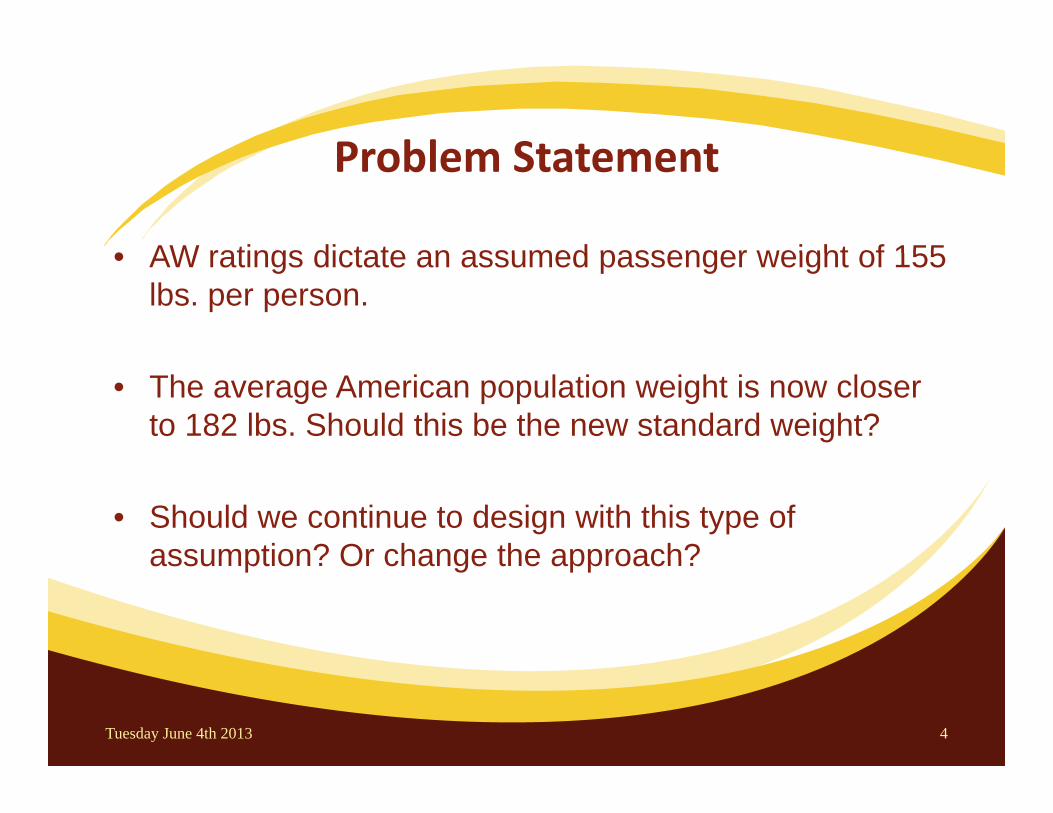
• AW ratings dictate an assumed passenger weight of 155• AW ratings dictate an assumed passenger weight of 155 lbs. per person.
• The average American population weight is now closer to 182 lbs. Should this be the new standard weight?
• Should we continue to design with this type of assumption? Or change the approach?assumption? Or change the approach?
Tuesday June 4th 2013 4

BackgroundBackground
CDC SurveyUS D f H l h
Anthropometryh i h d fiUS Department of Health
and Human Services collects, analyzes and
The science that defines physical measures of a person's size, form, and
reports statistics about population measurement data.
functional capacities.
This is used in various fieldsContinuous collection of surveys, reports published
This is used in various fields that require a human element to be considered h d hevery 4 years. when designing the given
system.
Tuesday June 4th 2013 5

ApproachApproach
Tuesday June 4th 2013 6

ApproachApproach
• Using CDC data and a statistical analysis we can see the effect of this rising population weight.
• Compare the total car weight found using an assumed average passenger weight with a random selection weight.
• Is there a significant difference between an assumed 182 lbs. per person and a scenario with randomly generated weights?
Tuesday June 4th 2013 7

AssumptionsAssumptions
There is a constant ratio between a person’s depth and breadth that can be correlated to
the increase or decrease in weight.
The CDC data follows a normal distributionThe CDC data follows a normal distribution.
Tuesday June 4th 2013 8
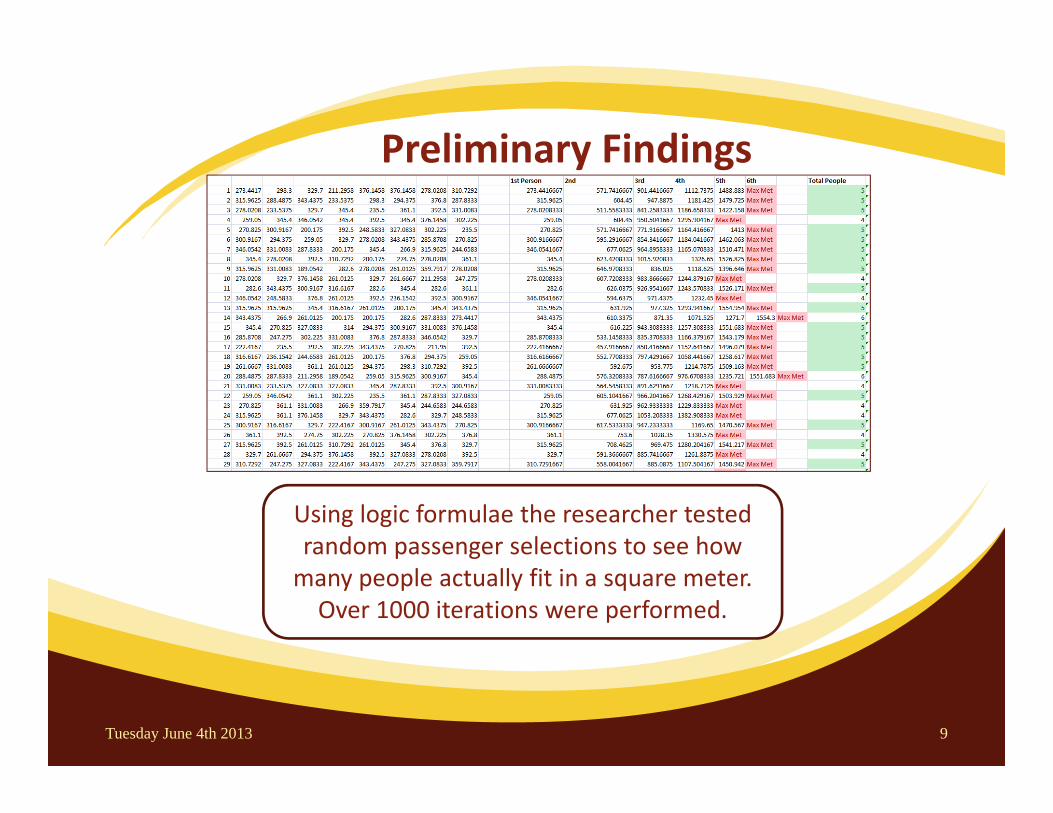
Preliminary FindingsPreliminary Findings
Using logic formulae the researcher tested random passenger selections to see how many people actually fit in a square meter. Over 1000 iterations were performed.
Tuesday June 4th 2013 9

Preliminary FindingsPreliminary Findings
We most frequently see 5 people per m2 of standing space.
Resulting in a total average weight of 88.9 lbs./sq. ft.
Tuesday June 4th 2013 10

Preliminary FindingsPreliminary Findings
The standing passenger weights were found to follow a normal distribution.
Tuesday June 4th 2013 11

Preliminary FindingsPreliminary FindingsHow does this compare to the current AW based design
and a simple increase to 182 lbs. per passenger?
AW2
AW3
SB/BD 20.83 20 19.17 18.33 17.5 16.67 15.83 15 14.17
25 64.3 67.0 69.9 73.1 76.6 80.4 84.7 89.4 94.6
24 67.0 69.8 72.8 76.2 79.8 83.8 88.2 93.1 98.6
23 69 9 72 8 76.0 79 5 83 3 87 4 92 0 97 1 102 8
AW4
23 69.9 72.8 76.0 79.5 83.3 87.4 92.0 97.1 102.8
22 73.1 76.2 79.5 83.1 87.0 91.4 96.2 101.5 107.5
21 76.6 79.8 83.3 87.0 91.2 95.7 100.8 106.4 112.6
20 80.4 83.8 87.4 91.4 95.7 100.5 105.8 111.7 118.319 84.7 88.2 92.0 96.2 100.8 105.8 111.4 117.6 124.5
It is a lower total weight for standing passengers! ( h d t AW3)
The current design assumptions ignore the changes in body area as weight increases or decreases When the
18 89.4 93.1 97.1 101.5 106.4 111.7 117.6 124.1 131.4
17 94.6 98.6 102.8 107.5 112.6 118.3 124.5 131.4 139.1
(when compared to AW3)body area as weight increases or decreases. When the research used this additional packing factor to reflect a more realistic scenario, the increase in weight became
balanced by the increase of body area.
Tuesday June 4th 2013 12

Preliminary FindingsPreliminary Findings
But standees only make up part of AW3 at 182 lbs.
the train…how is the total train
weight affected by the increase? Random Scenario Basedg y
AW3 at 155 lbs.
Scenario Based
Tuesday June 4th 2013 13
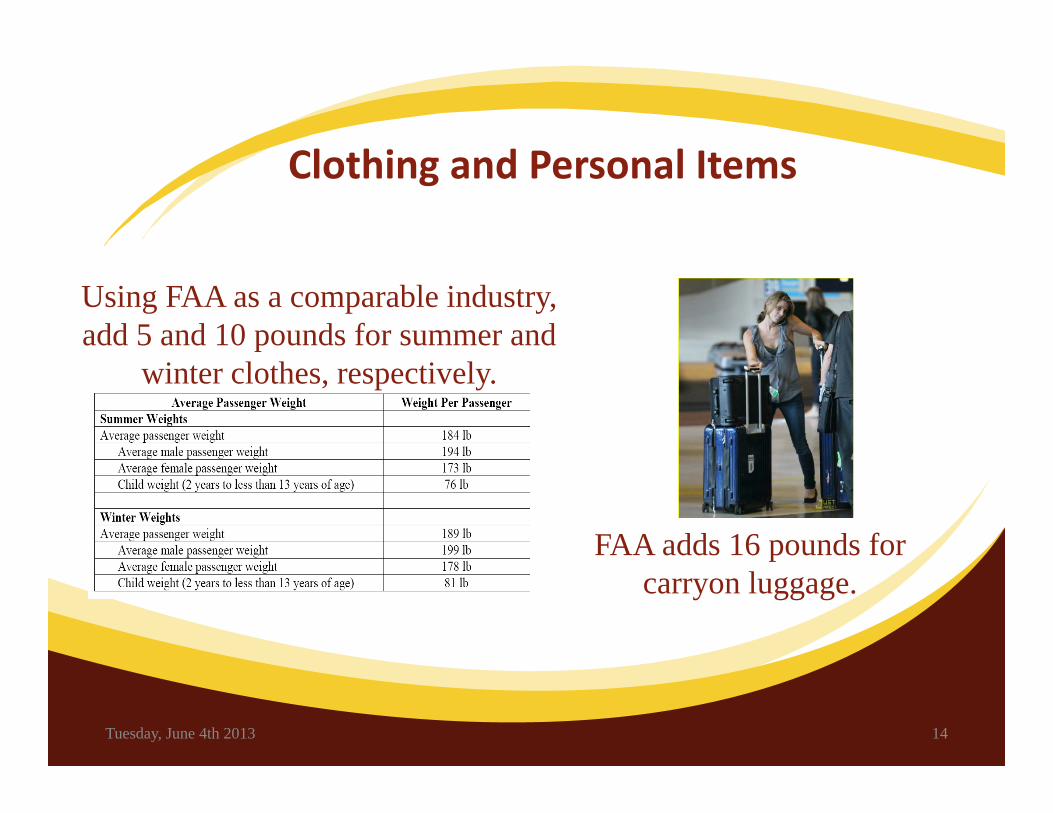
Cl hi d lClothing and Personal Items
Using FAA as a comparable industry, add 5 and 10 pounds for summer and
winter clothes, respectively.
FAA adds 16 pounds for pcarryon luggage.
Tuesday, June 4th 2013 14

Cl hi d lClothing and Personal Items
Assume 7 pounds for year round clothinground clothing
Most commuters have a large back or purse. Reduce “carryon
luggage” to 10 pounds
Tuesday, June 4th 2013 15

Recommended ApplicationHypothetical Train CarSeating Capacity of 75
Recommended Application
g p yStanding Space 312.15 ft2
Car Weight 105,000 lbs.
Tuesday June 4th 2013 16

Recommended ApplicationHypothetical Train CarSeating Capacity of 75
Recommended Application
g p yStanding Space 312.15 ft2
Car Weight 105,000 lbs.
182182182182
=150,464.33 lbs=150,464.33 lbs=150,464.33 lbs=150,464.33 lbs
6745 lb. increase6745 lb. increase6745 lb. increase6745 lb. increase
Tuesday June 4th 2013 17

Recommended ApplicationHypothetical Train CarSeating Capacity of 75
Recommended Application
g p yStanding Space 312.15 ft2
Car Weight 105,000 lbs.
182182182182 89898989
=146,431.35 lbs.=146,431.35 lbs.=146,431.35 lbs.=146,431.35 lbs.
2712 lb increase2712 lb increase2712 lb increase2712 lb increase
Tuesday June 4th 2013 18

Recommended ApplicationHypothetical Train CarSeating Capacity of 75
Recommended Application
g p yStanding Space 312.15 ft2
Car Weight 105,000 lbs.
199199199199 106106106106
=153,012.9 lbs=153,012.9 lbs=153,012.9 lbs=153,012.9 lbs
9293 lb. increase9293 lb. increase9293 lb. increase9293 lb. increase
Tuesday June 4th 2013 19

ConclusionsConclusions
• Average standing passenger weight 89 lbs/ft2 and a mode of ½ passenger per square footmode of ½ passenger per square foot.
• Assuming 182 lbs. the total would be 91 lbs/ft2, a difference of approx. 2 lbs., multiplied by total standing space of the car can create a significant amount of weight unaccounted for.g
• Using AW3 assumptions we would see 103.2 lbs/ft2, approx 14.2 lbs. greater than what would “typically” be seen.
Tuesday June 4th 2013 20

ConclusionsConclusions
Additi l i ht f l thi d l it h ld• Additional weight of clothing and personal items should be considered with any weight increase, this research used 17 pounds.p
• As an industry we must design for not only today’s population but tomorrow’s as well
Tuesday June 4th 2013 21

Future RecommendationsFuture Recommendations
• Although in using the suggested formula any increase in weight or size of passenger should be accounted for, data should be revisited to determine the seated passenger weight.
H th i d t th t ll d t i l t• How can the industry ensure that all data is always current and relative?
• Possible solution is an APTA standard required review every• Possible solution is an APTA standard, required review every 5 years closely aligns with CDC timeline for new data reports.
• Second possible solution is to decide as an industry on aSecond possible solution is to decide as an industry on a safety factor percentage to be built into RFPs.
Tuesday June 4th 2013 22

Thank You
Samantha SmithAPTA Program Manager Technical ServicesAPTA Program Manager- Technical Services
Questions?Questions?
Tuesday June 4th 2013 23