Embed Size (px)
Citation preview
=
rkfsbopfqv=lc=jf`efd^k=
=
Working Paper ==
Anti-Competitive Effects of Common Ownership
José Azar Charles River Associates (CRA)
Martin C. Schmalz Stephen M. Ross School of Business
University of Michigan
Isabel Tecu
Charles River Associates (CRA)
Ross School of Business Working Paper Working Paper No. 1235
April 2015
This work cannot be used without the author's permission. This paper can be downloaded without charge from the
Social Sciences Research Network Electronic Paper Collection: ÜííéWLLëëêåKÅçãL~Äëíê~ÅíZ=OQOTPQR=
Anti-Competitive Effects Of Common
Ownership
Jose Azar, Martin C. Schmalz, and Isabel Tecu
April 21, 2015
Abstract
Many natural competitors are jointly held by a small set of large diversified insti-
tutional investors. In the US airline industry, taking common ownership into account
implies increases in market concentration that are 10 times larger than what is “pre-
sumed likely to enhance market power” by antitrust authorities. We use within-route
variation over time to identify a positive effect of common ownership on ticket prices.
A panel-IV strategy that exploits BlackRock’s acquisition of Barclays Global Investors
confirms these results. We conclude that a hidden social cost – reduced product market
competition – accompanies the private benefits of diversification and good governance.
JEL Classification: L41, L10, G34
Keywords: Competition, Ownership, Diversification, Pricing, Antitrust, Governance, Prod-
uct Market1
1Azar: Charles River Associates, [email protected]; Schmalz: University of Michigan Stephen M. Ross Schoolof Business, 701 Tappan Street, R5456, Ann Arbor, MI 48109-1234, USA, tel: 734 763 0304, fax: 734 936 0279,[email protected]; Tecu: Charles River Associates, [email protected]. Schmalz is grateful for generous finan-cial support through an NTT Fellowship from the Mitsui Life Financial Center. Many people have contributedthoughts and suggestions to this paper. For particularly detailed feedback, we thank Cindy Alexander, SusanAthey, Jonathan Berk, Alon Brav, Severin Borenstein, John Coates, Peter Cramton, Daniel Crane, VicenteCunat (discussant), Martino DeStefano, Alex Edmans, Einer Elhauge, Daniel Ferreira (discussant), ToddGormley, Daniel Greenfield (discussant), Charles Hadlock, Dirk Jenter, Louis Kaplow, Ryan Kellogg, HanKim, Kai-Uwe Kuhn, Francine Lafontaine, Maggie Levenstein, Robert Levinson, Evgeny Lyandres (discus-sant), Gregor Matvos, Holger Muller, David Reitman, Nancy Rose, Farzad Saidi (discussant), Amit Seru,Jesse Shapiro, Andrei Shleifer, Yossi Spiegel, Jeremy Stein, Scott Stern, Sheridan Titman (discussant), GlenWeyl, Toni Whited, and Alminas Zaldokas. We also thank several mutual fund managers, a corporate gover-
1 Introduction
A long theoretical literature in industrial organization recognizes that common ownership
of natural competitors by the same investors reduces incentives to compete: the benefits of
competing aggressively to one firm – gains in market share – come at the expense of firms that
are part of the same investors’ portfolio (Rotemberg, 1984; Gordon, 1990; Gilo, 2000; O’Brien
and Salop, 2000; Gilo, Moshe, and Spiegel, 2006). Theory thus predicts that common owner-
ship pushes product markets toward monopolistic outcomes, implying a deadweight loss for
the economy and particularly adverse consequences for consumers. The empirical literature
and regulatory practice have focused on the special case of full mergers and acquisitions.
By contrast, it is an open empirical question with important policy implications whether
common ownership that is attained by partial acquisitions of firms by large asset manage-
ment companies that require no regulatory approval also decreases competitiveness of the
product market in significant ways. This paper provides a first answer to this question, in
two steps. We first ask: how large are current levels of common ownership, and what are
the implications for market concentration? Second, do present-day common ownership levels
adversely affect product market competition?
To approach the first question, note that highly diversified pension funds, mutual funds,
and other institutional investors now hold a high (70%-80%) and increasing share of US
publicly traded firms (McCahery, Starks, and Sautner, 2014; Rydqvist, Spizman, and Stre-
bulaev, 2014), reflecting the benefits they generate for retail investors. Because several asset
management companies are also extremely large, the same asset management company is
nance and proxy voting executive, the general counsel, and a board member of very large asset managementcompanies, the pricing manager of a major airline, our colleagues, and seminar/conference participants atBoston College, Charles River Associates, Goethe Universitat Frankfurt, Harvard University (Economics/ HBS Finance), Humboldt Universitat Berlin, McGill Desautels, Tilburg University, United States De-partment of Justice, UNC Chapel Hill, Universitat Mannheim, Universiteit van Amsterdam, University ofMichigan (finance; business economics/industrial organization; Center for Finance, Law, and Public Pol-icy), Western University, London Business School Summer Symposium on Corporate Finance and CorporateGovernance, LSE Adam Smith Workshop, LSE Economic Networks and Finance Conference, 2015 NBERCorporate Finance (Chicago), and the Utah Winter Finance Conference for helpful comments, suggestions,and discussions, and Oliver Richard for help and advice on the DB1B data. Schmalz is grateful for generousfinancial support through an NTT Fellowship from the Mitsui Life Financial Center. Bret Herzig providedresearch assistance. All errors are our own. The copyright is with the authors. The views expressed herein arethe views and opinions of the authors and do not reflect or represent the views of Charles River Associatesor any of the organizations with which the authors are affiliated.
1
often the single largest shareholder of several firms in the same industry. Table 1 provides ex-
amples.2 The potential scale of the resulting problem for product market competition spans
across all industries and economies with tradable securities.
For a quantitative evaluation, we focus on the airline industry as a laboratory. The avail-
ability of high-quality route-level price and quantity data enables us to more cleanly identify
the effect of common ownership on product prices than would be possible in firm-level stud-
ies across industries. Treating each route as a market, we first calculate measures of market
concentration that take into account the network of cash flow and control rights that con-
stitute the airlines’ shareholders’ economic interests. Such “modified Herfindahl-Hirschman
indexes” (MHHIs) were developed by Bresnahan and Salop (1986) and O’Brien and Salop
(2000), and are accepted tools in regulators’ assessment of competitive risks imposed by
cross-ownership and common ownership by “activist” investors. We use them also for the
measurement of anti-competitive incentives of other owners, irrespective of their investment
style.
We find that the anti-competitive incentives implied by common ownership concentration
alone – which come on top of those implied by the traditional HHI measure of market
concentration and are measured on the same scale – are more than 10 times larger than
what the FTC/DOJ 2010 horizontal merger guidelines presume “to be likely to enhance
market power.” They are also 10 times larger than the HHI-limit beyond which the burden
of proof shifts from the regulator to the involved private parties to show that the implied
concentration is not likely to enhance market power. The magnitude of common ownership
concentration furthermore dwarfs the time-series variation in HHI. These magnitudes suggest
that it is reasonable to expect an effect of common ownership on product prices.
2Possibly because institutional ownership in 1976 was relatively low and rarely created meaningful com-mon ownership links (Demsetz and Lehn, 1985; Demsetz, 1986), the Hart-Scott-Rodino (HSR) AntitrustImprovements Act of 1976 allows institutional investors to hold and exercise up to 15% of voting securi-ties of any one company without notifying antitrust authorities. HSR does not specify limits on holdingsof non-voting securities or limits to industry ownership. The assumption underlying HSR appears to bethat institutional investors that claim to hold the stock solely for “investment” are “passive” owners of thesecurities in the sense that they don’t affect the behavior of the portfolio firms. Interestingly, however, thelargest institutional investors say themselves that a passive investment strategy has nothing to do with theirbehavior as an owner, as we document in section 6. Online Appendix Table A.1 shows that institutional“passive” ownership in some firms is already close to the 15% HSR threshold: the top 5 shareholders ofUnited Airlines hold 49.5% of the vote shares. Craig (2013) and The Economist, December 7, 2013, reportthat BlackRock is the single largest shareholder of one fifth of all American firms.
2
We next test whether these anti-competitive incentives do indeed translate into mea-
surable effects on product market competition. Specifically, we examine whether changes in
common ownership concentration over time in a given route are associated with changes in
ticket prices in the same route. Our first set of regressions can be thought of an analysis,
spanning more than a decade, of the effect on product prices of partial mergers that are
quasi-continuously consummated and dissolved among (almost) all players of the industry.
For example, theory predicts that the entrance of an independent player (a firm not owned
by the same set of investors who own the incumbent airlines) makes competition more ag-
gressive. By contrast, competition softens in a route when incumbent airlines’ owners buy
significant ownership and control stakes in a thus-far independent carrier serving the same
route. Online Appendix B provides a stylized example to illustrate this strategy.
Using fixed-effect panel regressions, we find that ticket prices are approximately 3-5%
higher on the average US airline route than would be the case under separate ownership. This
effect of common ownership alone (“MHHI delta”) comes on top of the effect of the traditional
HHI measure of market concentration and other commonly used measures of competition
at the route-time level as well as controls for institutional ownership. Moreover, the effect
is of the same magnitude as the effect of the traditional HHI which implicitly assumes
separate ownership, as predicted by theory. The effect is economically large: the industry’s
average net profit margin is 1% to 2.4% (IATA, 2008). Fixed effects difference out alternative
explanations at the firm-, route-, firm-route, or firm-time level, such as better governance or
more pressure to increase margins effectuated by large institutions, or financial constraints of
carriers. We also find that quantity is negatively related to the MHHI delta, indicating that
the price effects are not driven by increased demand that institutional shareholders correctly
foresee (a reversed causality argument): increased demand would cause higher, not lower,
quantity.
To further address such reverse causality and endogeneity concerns, we exploit a natural
experiment created by BlackRock’s acquisition of Barclays Global Investors (BGI) in 2009.
Because airline stocks constituted only a small fraction of the merging parties’ portfolios, we
assume that the event happened for reasons unrelated to route-level differences in expected
changes of US airline ticket prices. By contrast to an event study, this panel-IV strategy
uses only variation in common ownership across routes that is implied by the hypothetical
combination of the two parties’ portfolios as of the quarter before the announcement of the
3
acquisition. (We do not use the actual increase in common ownership that accompanied the
acquisition.) We control, among others, for route-carrier fixed effects and local economic
conditions to reduce the probability that contemporaneous shocks significantly affect our
analysis. The panel-IV estimates indicate at least 10% higher ticket prices due to common
ownership, compared to a world in which firms are separately owned or in which firms ignored
their owners’ anti-competitive incentives. The same estimates imply that the acquisition of
BGI by BlackRock alone increased US airline ticket prices by about 0.6% on average across
routes.
These results indicate that current levels of common ownership of firms by diversified
institutional investors can indeed raise significant anti-competitive concerns. Formal merg-
ers between natural competitors are not the only way leading to joint asset ownership and
elevated levels of effective market power. Shareholders can achieve a similar effect – while
avoiding involvement by antitrust authorities – through the creation of common ownership
links. Especially if these findings were to prove empirically relevant also in other industries,
several policy implications arise. First, measures of market concentration that take common
ownership into account (such as the MHHI) should be taken into account to assess the com-
petitive risks of proposed mergers and acquisitions, and to assess the competitive risks caused
by present-day ownership structures. Second, our results show that consolidation in the as-
set management industry can adversely affect competition in the product markets of their
portfolio companies. Therefore, when antitrust authorities evaluate such propositions, the
potential benefits to shareholders need to be weighed against the potential loss of consumer
surplus – not just for consumers of asset management products, but also for consumers of
the products produced by the merging parties’ portfolio firms.
Our results move ownership by large, diversified institutional investors into the focus
of the corporate governance debate. For example, it was recently shown that institutional
asset managers – previously presumed to be “passive” shareholders – in fact actively and
regularly “engage” with their portfolio companies “behind the scenes” (Carleton, Nelson,
and Weisbach, 1998; Becht, Bolton, and Roell, 2007; McCahery, Starks, and Sautner, 2014;
Dimson, Karakas, and Li, forthcoming; Appel, Gormley, and Keim, 2014; Mullins, 2014), but
less is known about the content of such communications. Investigating these practices may
help policy makers understand whether such communication aids the translation of anti-
competitive incentives into anti-competitive outcomes, and whether such communication
4
should be scrutinized for compliance with HSR. That said, it is important to recognize that
investors need not explicitly communicate their interests to management for the documented
outcomes to materialize. All necessary information is public and readily understood by the
decision makers of portfolio firms. As a consequence, similar to traditional work in the
industrial organizations literature, the present paper analyzes incentives and outcomes, but
does not contribute direct evidence of the mechanism that implements the incentives. We do,
however, provide circumstantial evidence that asset managers “engage” with portfolio firms
about product market strategy, which suggests that “active ownership” by “passive” investors
can indeed be part of the mechanism. Also we point out that large “passive” investors’
executives serve on the board of portfolio firms – it appears plausible that directors elected
by and representing the largest shareholders are able to reduce the incidence of breakdowns
of cooperative arrangements and undesirable price wars between their commonly owned
firms. Of course, to achieve that end, the owner need not micro-management the portfolio
firm’s competition, but merely communicate the economic incentives arising from common
ownership.
A more benign – and likely – interpretation of our results is that owners generally need
to push their firms to aggressively compete, because managers will otherwise enjoy a “quiet
life” (Bertrand and Mullainathan, 2003) with little competition and high margins. Only
shareholders with undiversified portfolios have an incentive to engage to that effect, while
only large shareholders have enough clout to do so. However, the largest shareholders of most
firms tend to have diversified portfolios and therefore reduced incentives to push for more
competition, whereas smaller undiversified investors don’t have the power to change firm
policy without the support of their larger peers. It is important to realize again that it is both
unlikely and unnecessary that shareholders give their portfolio firms explicit directions with
respect to the desired intensity of competition in particular markets. Instead, the mechanism
in our context is no more complicated than in the established I/O literature (e.g., Kim
and Singal, 1993). Managers are already keen to find more cooperative product market
arrangements with their competitors. Common ownership simply may be the nudge that
helps them find more stable cooperative arrangements and thus help create a “healthier”
industry; see also Rotemberg and Saloner (1986).
At a conceptual level, our analysis suggests that in the presence of powerful diversified
shareholders, “good governance” (if narrowly defined as the frictionless implementation of
5
shareholder interests, see Shleifer and Vishny, 1997) can have large social costs in terms of
a loss of product market competitiveness. The benefits of diversification, good governance,
and competitive product markets can therefore not be studied in isolation.
The paper proceeds as follows. The next section relates this paper to the existing lit-
erature. Section 3 reviews the theory of O’Brien and Salop (2000) and their derivation of
the MHHI, and develops the empirical hypotheses. Section 4 describes the data and doc-
uments the anti-competitive incentives implied by common ownership, our first key result.
Section 5.1 explains the panel regressions and presents their results. Section 5.2 describes
the panel-instrumental-variable approach and results based on the BlackRock-BGI acquisi-
tion. In section 6, we discuss potential mechanisms that may help bring about the observed
market outcomes that are consistent with the firms’ largest investors. Section 7 concludes.
2 Related Literature
To our knowledge our paper is the first to empirically identify an effect of common
ownership on product market prices in general, and the first to document an effect of a
combination of asset management companies on portfolio firms’ product prices in particular.
Our analysis builds on a large but mostly theoretical literature on the competitive effects of
cross-ownership and common ownership. Reynolds and Snapp (1986) extend classic oligopoly
models to allow firms to hold shares in competitors. Bresnahan and Salop (1986) introduce
the MHHI as a way to quantify the competitive effects of horizontal joint ventures. O’Brien
and Salop (2000) develop a more general version of the MHHI that also applies to the case
in which shareholders invest in several natural competitors, and which we use in this paper.
Empirically, many papers have studied networks of common ownership generated by
diversified institutional investors (see, e.g., Faccio and Lang, 2002; Davis, 2008; Vitali,
Glattfelder, and Battiston, 2011; Azar, 2012; Davis, 2013), but few have focused on product
market outcomes. The closest paper in that respect is Azar (2012), who studies the effect
of common ownership on firm-level profit margins. Azar (2012) also introduces the policy
“trilemma” between shareholder diversification, shareholder value maximization, and prod-
uct market competition. He and Huang (2014) examine the relation between a binary com-
mon ownership dummy and firm-level market shares and several corporate finance variables.
They find results consistent with increased efficiency due to common ownership, but cannot
6
examine effects on product prices due to data limitations. Ownership matters for product
market competition in our paper, whereas ownership matters for bargaining outcomes in
Cramton, Mehran, and Tracy (2010). Our paper is also sharply distinguished from work on
corporate equity ownership (“cross-ownership”) and its product market consequences (e.g.,
Allen and Phillips, 2000; Nain and Wang, 2013): we study common ownership of firms by
industry outsiders.
The second stream of related literature concerns institutional investors’ involvement in
corporate governance (e.g., Aggarwal and Samwick, 1999; Hartzell and Starks, 2003; Matvos
and Ostrovsky, 2008; Cronqvist and Fahlenbrach, 2009; Harford, Jenter, and Li, 2011; Ka-
plan and Minton, 2012; Massa and Zaldokas, 2013; Katz and McIntosh, 2013; Kempf, Man-
coni, and Spalt, 2013; Schwartz-Ziv and Wermers, 2014). In particular, it is well known
that “activist” investors implement changes in executive compensation, turnover, and other
corporate decisions, see especially Brav, Jiang, Partnoy, and Thomas (2008); Brav, Jiang,
and Kim (2011); Jiang, Li, and Wang (2012). The key distinction to this literature is that
we document product market effects that are driven by a set of investors that is tradition-
ally labelled as “passive,” and traditionally thought of as affecting only broad governance
questions.
Third, the present paper relates to the empirical literature on the effect of market struc-
ture on pricing in the airline industry. Brueckner, Lee, and Singer (2013) provide a compre-
hensive study of the effect of market characteristics on fares; see also Goolsbee and Syverson
(2008) and Dai, Liu, and Serfes (2014). Several earlier papers study the price effect of airline
mergers and other route characteristics (Borenstein, 1990; Werden, Joskow, and Johnson,
1991; Kim and Singal, 1993; Borenstein and Rose, 1994, 1995; Peters, 2006; Luo, 2014).
Forbes and Lederman (2009, 2010) study the effect of vertical integration in the airline in-
dustry on renegotiation costs and operating performance. Our paper differs starkly as our
empirical approach holds merger activity and other market characteristics constant and es-
timates the price impact of the competitors’ ownership structure. Benmelech and Bergman
(2008) study corporate finance questions using the airline industry as a laboratory.
Lastly, our results contribute an empirical answer to the question “Do firm boundaries
matter?” (Mullainathan and Scharfstein, 2001). Our results suggest that common ownership
links have the effect of blurring formal firm boundaries. A group of firms owned by diversified
shareholders will tend to act as a single entity (see Rotemberg, 1984; Farrell, 1985; Hansen
7
and Lott, 1996; Rubin, 2006, for a theoretical treatment).
3 Theory and Hypotheses Development
3.1 Review of O’Brien and Salop (2000)
O’Brien and Salop (2000) develop a model of oligopoly in which firms maximize a
weighted sum of the portfolio profits accruing to their shareholders, where a shareholder’s
weight in a firm’s objective function is proportional to the fraction of the control of the firm
held by that shareholder. The model predicts a positive relationship between markups and
common ownership concentration. Because we use this measure in our empirical analysis, we
provide a brief review of the model, and in particular of the derivation and interpretation of
the modified Herfindahl-Hirschman Index (MHHI) in a Cournot setting.
An industry has N firms and M owners. Ownership and control rights may differ, so
that a given shareholder may have a higher or lower share of the control of the firm than her
ownership share (i.e., cash-flow rights). (Control and ownership do differ in practice in many
cases, see Adams and Ferreira (2008) for a review.) The ownership share of firm j accruing
to investor i is βij, and the control share of firm j held by owner i is γij. Total portfolio
profits of investor i are given by πi =∑
k βikπk, where πk are the profits of portfolio firm k.
Firm j implements these incentives by maximizing a weighted average of its shareholders’
portfolio profits, where the weights are given by the control weights γij,
maxxj
Πj =M∑i=1
γij
N∑k=1
βikπk, (1)
where xj is the strategy of firm j. To facilitate the interpretation of this formula, we change
the order of the sums, take πk out of the second sum, and divide by∑
i βijγij to rewrite the
objective function as
maxxj
Πj = πj +∑k 6=j
∑i γijβik∑i γijβij
πk. (2)
The interpretation of this formula is that firm j maximizes its own profits plus a linear
combination of the profits of other firms in which its shareholders hold stakes. The weight
8
firm j puts on the profits of firm k in its objective function relative to its own profits is given
by∑i γijβik∑i γijβij
. The latter ratio provides an economically meaningful measure of how connected
two firms are in terms of interlocking shareholdings. Note that the weights are asymmetric.
The weight firm j gives firm k in its objective function will in general be different from the
weight firm k gives firm j. Note also that the price effects predicted below are unilateral and
need not be coordinated across firms.
The objective function (2) reflects shareholders’ incentives. Under the assumption that
firms, by and large, act in their shareholders’ interests, it seems a reasonable starting point
to predict firm behavior. Whether this maximization problem helps describe actual firm be-
havior is the empirical question we address in this paper. Developing alternative models that
also incorporate several corporate governance frictions (Dasgupta, Piacentino, and Zhang,
2011) and compensation schemes (Kraus and Rubin, 2010) may be an interesting subject for
future research. Similarly, endogenizing vote buying (Dekel, Jackson, and Wolinsky, 2008;
Posner and Weyl, 2013; Eso, Hansen, and White, 2014) in a context with common ownership
is left for future research.
Applying the model to a Cournot setting, the objective function of firm j is given by
maxxj
Πj =M∑i=1
γij
N∑k=1
βik [P (X)xk − Ck(xk)] , (3)
where P (X) is the inverse demand function for the homogeneous good, xk is the quantity
produced by firm k, and Ck(k) are the associated costs.3 The first-order conditions are
M∑i=1
γij
{βij[P (X) − C ′
j(xj)]
+N∑k=1
βikP′(X)xk
}= 0. (4)
This equation represents a weighted average of the first-order conditions for the maximiza-
tion of the profits of each shareholder, where the weights are the control shares γij. Each
shareholder balances the benefit of a marginal increase in quantity, βij[P (X) − C ′
j(xj)],
with the cost in terms of reduced prices,∑N
k=1 βikP′(X)xk. Note that the expression for the
cost implies the shareholders internalize the effect of reduced prices on the profits of all the
3Although airlines set prices, one can think of the Cournot model of quantity competition as a reasonableway to model the strategic interaction of firms in airline markets, given that airlines need to make capacitycommitments. Kreps and Scheinkman (1983) show that price competition with quantity pre-commitmentyields a Cournot outcome. Several authors have since derived similar results under milder assumptions.
9
firms in their portfolios, see also Hansen and Lott (1996).
It can be shown by algebraic manipulation of the first-order conditions that in equilibrium
the market share-weighted average markup in the industry is given by
∑j
sjP − C ′
j(xj)
P=
1
η
[∑j
∑k
sjsk
∑i γijβik∑i γijβij
], (5)
where η is the price elasticity of demand and sj is the market share of firm j. We thus see
that in a classic Cournot setting, with separately owned firms, the market share-weighted
average markup is proportional to the Herfindahl-Hirschman Index (HHI), equal to∑
j s2j .
This provides a theoretical justification for the use of the HHI as a measure of market power
in a setting without common ownership. Under more general ownership structures, O’Brien
and Salop (2000) propose using the MHHI, defined as
MHHI =∑j
∑k
sjsk
∑i γijβik∑i γijβij
, (6)
as a measure of market power. By simple algebra, MHHI can then be rewritten as
MHHI = HHI +∑j
∑k 6=j
sjsk
∑i γijβik∑i γijβij
. (7)
The second term in the last expression is the difference between the MHHI and the HHI,
referred to as the MHHI delta. The MHHI delta is a measure of the anticompetitive incentives
due to common ownership. For example, consider two firms that have 50% market share each.
The HHI is 5,000 on a scale of 0 (perfect competition) to 10,000 (monopoly). If the firms
are separately owned, the MHHI delta is 0 and the MHHI equals the HHI, 5,000. If the two
owners swap 50% of their shares and thus jointly are a monopolist, the HHI is still 5,000,
but the effective market concentration, reflected by a MHHI of 10,000, is identical to that
of a monopoly. Thus, the MHHI reflects the economically meaningful market concentration.
Online Appendix C provides further examples of MHHI calculations to aid with intuition.
3.2 Discussion
On a first look, it might appear that the computational complexity of the implementation
of these incentives is rather high in our setting. However, while the predicted variation in
10
prices is at the route-level, the agent setting product market strategy only needs to keep
track of firm-pair level variation in common ownership to determine the optimal level of
competition in every route. We already know from the existing literature (e.g., Li and Netes-
sine, 2011) that airline managers manually set route-level prices while explicitly taking into
account the identity of their competitors. That is, rather than keeping thousands of different
degrees of optimal competitive aggressiveness in mind, the pricing manager only assesses how
aggressive her shareholders would want to compete with a small set of competitors, which
implies route-level variation in the intensity of competition. Incentives of course can be easily
inferred from airlines’ own and their competitors’ largest investors. The ownership structure
is public information, and moreover frequently communicated in engagement meetings, see
section 6. Our interviews with pricing managers moreover indicate that they are well aware
of their competitors’ owners. In sum, the computational complexity of implementing the
shareholders’ objective is not substantially different than in the setting of existing studies.
3.3 Hypotheses Development
The question we address is whether common ownership concentration has additional
explanatory power for product prices, over and above the impact of market concentration
that ignores common ownership links generated by large institutional investors. We use the
MHHI delta to measure common ownership concentration, and the classic HHI to measure
market concentration without common ownership. If anti-competitive shareholder incentives
matter for portfolio firms’ product market strategy, we should see a price impact of the MHHI
delta, both at the market-carrier and at the market level (assuming a homogenous good in
every market). If, on the other hand, corporate governance, or informational frictions, or the
fear of an antitrust backlash entirely prevent shareholders from implementing a mechanism
that reflects these incentives, we should see no price impact. This latter consideration informs
the null hypothesis:
H0: Common ownership by diversified institutions, as measured by the MHHI delta, has
no effect on market-carrier-level and market-level ticket prices.
If, on the other hand, economic incentives matter for economic outcomes, at least to some
non-trivial extent, the alternative interpretation should find support in the data.
H1: Common ownership by diversified institutions, as measured by the MHHI delta, has
11
a positive effect on market-carrier-level and market-level ticket prices.
4 Data
4.1 Data Sources
4.1.1 Airline Pricing and Market Shares
Following the literature, the markets we consider are origin-destination airport pairs
in the United States, regardless of direction. We construct fares and passenger shares for
each market using the publicly available Department of Transportation’s Airline Origin and
Destination Survey (DB1B) database, which contains a quarterly 10% sample of airline
tickets for the period 2001Q1-2013Q1.
The DB1B database includes the origin, destination, and price paid for a ticket, as well
as how many passengers traveled on that ticket. In addition, it contains the operating and
marketing carrier for each separate coupon of a ticket. To construct prices and the number
of passengers at the carrier level, we assign a ticket to the marketing carrier (rather than the
operating carrier), and we exclude tickets with multiple ticketing carriers from the analysis.4
We limit our analysis on markets with an average of at least 20 passengers a day. We retain
over 1 million observations at the carrier-market-quarter level. We also apply a number of
other filters to screen out tickets that cannot readily be assigned to a particular market, or
that contain unreliable information, as described in detail in the Online Appendix.
Table 2 shows the summary statistics for our sample, both at the carrier-market and at
the market level. The average 2008-CPI-adjusted fare per passenger across markets is $217.
Average quarterly passengers are about 3,720 per carrier and market and about 18,323 per
market. The HHIs are calculated based on passenger shares of ticketing carriers, and average
about 5,200 across markets. On average, around two thirds of passengers in a given market
use connecting flights.
4We thus abstract away from frictions associated with imperfect vertical integration (Forbes and Leder-man, 2009, 2010), which is of lesser concern to our setting compared to the importance of painting a realisticpicture of competition between any two airport pairs. Relatedly, note that alliances, over and above directaffiliations, are typically between domestic and foreign carriers but not between domestic carriers (Bruecknerand Whalen, 2000). In rare exceptions, such as the codeshare agreement between US Airways and UnitedAirlines, we ensure in an untabulated robustness check that combining the market shares of both companiesas if they were a single entity does not significantly affect the results.
12
We ensure robustness to a number of additional control variables that capture market
characteristics not captured by the HHI measure of market concentration. We use the T100
data published by the US Department of Transportation to construct the number of nonstop
carriers serving the market, and whether Southwest or other low-cost carriers (LCCs) are
serving the market nonstop. On average, our sample markets contain 0.8 nonstop carriers.
Southwest is competing nonstop in 9% of the markets, and other LCCs are competing nonstop
in 8% of the markets. We also map the airport-pairs that define each market to metropolitan
areas and compute population and per capita personal income for these metro areas from
the Bureau of Economic Analysis as controls. For each market in our sample, we calculate
the geometric mean across the metro areas at the endpoints to capture the population and
income per capita in the market, following the airline literature (see, e.g., Brueckner, Lee,
and Singer (2013)). The average “market population” is 2.3 million and the average “market
income” is about $41,000. The fraction of institutional ownership in the airline industry is
similar to that reported in other studies, e.g., Rydqvist, Spizman, and Strebulaev (2014).
Note that we report cash flow rights, not control rights. As a result, institutional ownership
can exceed 100% in a few cases because of the presence of preferred (non-voting) shares.
4.1.2 Data on Airline Ownership
To construct the common ownership network for the airline industry, we start with in-
stitutional holdings from the Thomson-Reuters Spectrum dataset on 13F filings. This data
set includes investments in all US publicly traded stocks by institutional investors manag-
ing more than $100 million. The Thomson-Reuters data identify institutional investors by
SEC filing, assigning them a manager number.5 It includes information on the fraction of the
shares that are voting shares. We restrict the data to holdings of at least 0.5% (adding voting
and non-voting shares) of shares outstanding. Holdings are not observed during bankruptcy
periods. During the bankruptcies of American Airlines, Delta Airlines, Northwest Airlines,
5The largest asset management companies accumulate votes at the aggregate level, similar to voting trustsas described by Becht, Bolton, and Roell (2007). Davis and Kim (2007) provide evidence of proxy voting bymutual funds at the family level. Funds with higher costs and lower benefits of implementing own corporategovernance initiatives are more likely to vote with ISS recommendations (Iliev and Lowry, 2012). Note thatcoordinating corporate governance activities at the family level can be consistent with fulfilling the assetmanager’s fiduciary duty toward all of the the fund family’s investors individually: the equilibrium outcomecan benefit all investors, even if each individual owner would choose a slightly different policy. The assetmanager merely serves as a coordinating device.
13
United Airlines, and US Airways, we repeat the last observed value for percentage of shares
owned. Because pricing may differ during bankruptcy (Borenstein and Rose, 1995), we also
estimate specifications excluding bankruptcy periods. The results are qualitatively similar,
and we include them in the Online Appendix. Note also that Phillips and Sertsios (2013)
don’t find statistically significant price effects from bankruptcy.
We also use data on non-institutional ownership that we hand-collect from SEC Proxy
statements, available from the SEC website, if they hold 5% or more of outstanding shares
in any company in our sample. Although rare cases of significant ownership stakes by non-
institutional investors exist, they are restricted to a single firm and therefore do not induce
common ownership links.
Following Hartzell and Starks (2003), for use as controls, we also calculate the share
of institutional ownership, institutional ownership concentration (measured as the HHI of
the institutional ownership shares), and the fraction of total institutional ownership that
is owned by the top five institutional owners in the firm. For the market-level regressions,
we calculate a passenger-weighted average of the institutional ownership variables. As the
summary statistics show, in the average route, institutional investors hold 77% of the shares
of the carriers in the route, similar to the average institutional ownership of firms outside
the airline industry as reported by McCahery, Starks, and Sautner (2014). The top five
institutional investors hold around 44% of the total institutional holdings, reflected by an
average institutional ownership concentration in the average route of 678 HHI points.
To give a sense of who these investors are, the size of their ownership stakes, and the
extent to which their ownership interests overlap, we provide the top 10 shareholders and
their ownership percentage as of the first quarter of 2013 for a sample of airlines in Online
Appendix Table A.1. Note that the top 5 shareholders of United Airlines – the third-largest
US airline – alone hold 49.5% of ownership rights. Out of the largest seven shareholders of
United Airlines, who hold 60% of the vote share, five are also among the largest 10 sharehold-
ers of Southwest and Delta Air Lines, the largest and second-largest carrier, respectively. We
use differences across airlines and time of different investors’ ownership stakes, and variation
of market shares of these airlines across routes and time for our identification.
14
4.2 Networks of Common Ownership
The data on market share, as well as ownership and control rights the institutional in-
vestors hold in each airline, enable us to reconstruct the network of interlocking shareholdings
and product market incentives that characterizes each market we analyze. Specifically, we
calculate the control share for shareholder i in firm j, γij, as the percentage of the sole vot-
ing shares of firm j held by institution i.6 We calculate the ownership share of shareholder
i in firm j, βij, as the percentage of all shares (voting and non-voting) of firm j held by
institution i. We exclude shareholdings with voting and non-voting shares of less than 0.5%
of outstanding. Doing so amounts to assuming that institutions with less than 0.5% have
no weight in the objective function of the firm. An untabulated robustness check shows this
filter does not affect the results. The online appendix contains a more detailed description
and an illustration of the resulting ownership network.
4.3 Quantifying Economic Incentives Using the MHHI
We calculate the MHHI for each route for each quarter between 2001Q1 and 2013Q1.
Figure 1 shows the average MHHI and average HHI across routes over time for that period.
These figures are much more than summary statistics of the data – they are meaningful
results with direct policy implications. The differences between the MHHI and the HHI,
called MHHI delta, are a measure of the market concentration that is generated by common
6According to our interviews with industry insiders, and as further substantiated by asset managers’ publicstatements reflected in section 6, although the formal authority to vote proxies rests with fund managers,in practice, fund managers of the largest mutual fund companies almost always follow the recommendationof the fund family’s corporate governance and proxy office. Index funds in particular usually outsource alldecision making with respect to voting, thus making their proxies available to the active side of the fundfamily. We also hand-checked proxy voting guidelines of most large fund management companies and inalmost all cases found statements indicating that corporate governance is implemented centrally on behalfof all active and passive funds of the family. We therefore calculate the MHHIs using fund family holdingsrather than individual funds’ holdings. Whether MHHIs based on fund-level holdings would be smaller orlarger than MHHIs based on family-level holdings is not clear ex ante; it depends on the relative degreeof diversification of smaller versus larger funds within the family. If less diversified shareholders are splitinto many specialized funds, whereas diversified shareholders have only a few funds (or vote at the familylevel), MHHIs calculated at the fund level are larger, and the MHHI delta we present in this paper is anunderestimate. We do not consider the possibility of smaller block holders forming coalitions as suggested byZwiebel (1995), because we have no hard data that suggests such block formation in our setting. Interviewswith asset managers indicate that antitrust concerns prevent them from discussing proxy voting with otherinvestors at a high frequency.
15
ownership alone. The average MHHI delta was around 2,000 at the beginning of the period,
declined to around 1,000 in 2006-2007 when several diversified shareholders reduced their
exposure to the industry amid its low profitability, and then increased to about 2,200 in
2013.
The variation over time is driven both by changes in (firm-pair level) common ownership
and by (route-firm-pair level) changes in market shares. For example, the decrease before 2009
can be generated by well-diversified investors selling shares (maybe mechanically because
they follow a passive investment strategy and airline market values dropped), and getting
replaced by investors that focus on one particular airline company. The stark increase in
MHHI delta in 2009 coincides with BlackRock’s acquisition of Barclays Global Investors.
According to the DOJ/FTC 2010 Horizontal Merger Guidelines, in highly concentrated
markets (i.e., markets with an HHI greater than 2,500), mergers involving changes in the
HHI of more than 200 points are “presumed likely to enhance market power.” Thus, the
average MHHI delta in the airline industry generated by common ownership by institutional
investors in 2013Q1 implies increases in concentration, compared to conventionally measured
levels of concentration, that are more than 10 times higher than the threshold that would
likely generate antitrust concerns according to the guidelines. This threshold also marks the
point beyond which, if two parties were intending to merge, the burden of proof that the
merger does not lead to enhanced market power is on the merging parties (as opposed to
the regulator). If one were to consequentially apply this logic also to changes of market
concentration that are due to common ownership, asset managers would have to prove that
the common ownership links that they generate do not affect market prices.
Figure 2 shows histograms of the distribution of MHHI deltas across routes in 2001Q1
and in 2013Q1. These distributions reflect the cross-sectional variation in common ownership
links across routes that we use in our identification. Across the entire sample, about 5% of
routes have an MHHI delta of close to zero – that is, there is no common ownership. That is
the case either if only one carrier serves the route, or if the route is served by two carriers, one
of which is a private company, whose shares are not owned by the same institutional investors
that own the publicly traded carriers. For example, JetBlue was not publicly traded in 2001,
went public in 2002, and became owned by similar investors as legacy carriers thereafter.
Thus, routes served by JetBlue may be part of the zero-MHHI delta group in 2001, but
move to positive-MHHI delta groups after the IPO. Such changes of ownership are part of
16
the route-level variation in MHHI delta we use. The 10th percentile is at 122 HHI points, the
25th at 691, the 75th at 2,332, and the 90th percentile is at 3132 HHI points. The highest
MHHI deltas are over 5,000 HHI points, meaning common ownership alone adds an amount
to market concentration equivalent to reducing the number of firms competing in a market
from two equal-sized ones (HHI=5,000) to one (HHI=10,000), creating a monopoly. The
correlation between MHHI delta and HHI is negative, both in the pooled sample, and in the
cross-section. In sum, on average common ownership adds about as much concentration as
going from four roughly equal-sized carriers to two equal-sized carriers would add.
In sum, the incentives for anti-competitive behavior implied by current levels of common
ownership, as measured by the MHHI delta, are an order of magnitude larger than the
implications for market power recognized by conventional measures that are measured on
the same scale. Whether firms implement these incentives is the empirical question we address
in the following sections.
5 Empirical Methodology and Results
Having documented that MHHI deltas are very large, we now know that common own-
ership links across airlines create significant anticompetitive incentives. In this section, we
investigate whether firms set prices consistent with these incentives.
Figure 3 plots the average airfare against the average MHHI delta for each market in
our sample, where the average is taken across all quarters in our sample period. A linear
fit indicates a positive raw correlation between airfares and MHHI delta across markets. Of
course, we do not infer a causal effect from that raw correlation. Many factors could impact
the level of airfares across markets that may also be correlated with common ownership in
a given market. We attempt to provide clean evidence by using variation of airfares and
the MHHI delta in the same market over time, while controlling for other changes, as the
following section explains.
17
5.1 Panel Regressions of Product Prices and Quantities on Com-
mon Ownership
5.1.1 Panel Regression Methodology
In our main specification, we regress the logarithm of average price for carrier j in route
i at time t on the MHHI delta, the HHI, additional controls, time-fixed effects, and market-
carrier fixed effects:
log (pijt) = β · MHHI deltait + γ ·HHIit + θ ·Xijt + αt + νij + εijt, (8)
where pijt is the average price for carrier j in route i at time t, MHHI deltait is the MHHI
delta in route i at time t (it is the difference between MHHI and HHI – not the time variation
in MHHI), Xijt is a vector of controls, αt are time fixed effects (at the quarterly frequency),
and νij are market-times-carrier fixed effects.
Additionally, we run regressions aggregated at the market level:
log (pit) = β · MHHI deltait + γ ·HHIit + θ ·Xit + αt + νi + εit, (9)
where pit is the average price in route i at time t. Following Goolsbee and Syverson (2008), we
weight the market-carrier-level regressions by average passengers for the market and carrier
over time and cluster standard errors at the market level. For the market-level regressions,
we weight by average passengers in the market over time and cluster standard errors at the
market level as well.7 As controls, we include various market characteristics that the HHI
does not capture: the number of non-stop carriers operating in a route, an indicator for
whether Southwest operates non-stop in a route, an indicator for whether another low-cost
carrier (LCC) operates in a route, geometric average of the population in the two endpoints
of a route, the geometric average of per capita income in the two endpoints in a route,
the share of passengers in the market that travel using connecting flights, and the share of
passengers for the market carrier that travel using connecting flights (in the market-carrier-
level regressions).
In addition, we control for variables that capture the effect (if any) on airline ticket pricing
7Whereas we stick to this literature standard in the reported result, we do ensure that the results arerobust to two-way clustering (untabulated).
18
of institutional ownership per se. Following Hartzell and Starks (2003), we include the share
of institutional ownership, institutional ownership concentration (measured as the HHI of
the institutional ownership shares), and the fraction of total institutional ownership that is
owned by the top five institutional owners in the firm. For the market-level regressions, we
calculate a passenger-weighted average of the institutional ownership variables.8
5.1.2 Panel Regression Results
Results from our basic specifications are reported in Table 3. The first specification reports
results from a regression of log average fare by carrier market on the MHHI delta, HHI,
market-carrier fixed effects, and year-quarter fixed effects. We find a large and significant
positive effect of MHHI delta on average fares across all specifications. The coefficient of 0.201
in the first specification implies that an increase in the MHHI delta from 0 to 2,200 (current
levels of MHHI delta) would be associated with an increase in average fares of 4.9%. Going
from the 10th to the 90th percentile of routes by MHHI delta indicates an even larger effect:
6.7%. Going from the 25th to the 75th percentile increases prices by 3.7%. The effect of HHI
is almost identical as the effect of MHHI delta, as predicted by the model. (Also, regressing
prices on MHHI (rather than MHHI delta and HHI separately) produces coefficients around
0.21.)
In the next specification, we control for additional market characteristics: the number of
nonstop carriers, a Southwest nonstop presence indicator, and other LCC nonstop presence
indicators, average population of the endpoints, average income per capita of the endpoints,
average share of passengers traveling using connecting flights in the market, and average share
of passengers traveling using connecting flights for a given carrier in a given market. The
coefficients of both the HHI and the MHHI delta are lower than in the specification without
controls, but are still positive and statistically and economically significant. The coefficients
on the control variables have the expected signs: a larger number of nonstop competitors,
8While throughout the paper the HHI and MHHI are expressed on a scale of 0 to 10,000, we use a scaleof 0 to 1 for the regressions to make the coefficients more readable. The HHIs are potentially endogenous.However, Gayle and Wu (2012) show that simultaneity bias is negligible, and therefore the literature ingeneral does not instrument (Morrison, 2001; Gayle and Wu, 2012; Brueckner, Lee, and Singer, 2013). Inunreported robustness tests, we nevertheless check if the assumption that HHIs are exogenous affects ourresults. We find that the coefficient on common ownership is slightly higher when we instrument HHI withlagged HHI.
19
Southwest’s and other LCC’s nonstop presence, and a larger end-point population are all
associated with lower fares. In the third specification, we add institutional ownership and
institutional ownership concentration controls. The coefficients of both the HHI and the
MHHI delta are essentially unchanged. A higher fraction of institutional ownership is as-
sociated with lower average fares. A higher level of institutional ownership concentration
(measured using either the institutional ownership Herfindahl or the fraction of institutional
holdings held by the top five institutions) is associated with higher average fares.
Notice that the effect is identified not at the firm level, but across markets, whereas
a single firm operates in many different markets. Therefore, an improvement in firm-level
monitoring due to common ownership by diversified institutional investors (Edmans, Levit,
and Reilly, 2014) or internal capital markets (Stein, 1997) cannot explain the results. More
generally, because the time variation to be explained is at the route level, a firm-level omitted
variable cannot drive our results. Relatedly, because we employ route-fixed effects, market
power on specific routes exerted through frequent-flyer programs (Lederman, 2007) is differ-
enced out in our regressions.
Specifications (4) to (6) are analogous to specifications (1) to (3), but aggregated at the
market level instead of at the market-carrier level. We find qualitatively similar results, but
the coefficients of both the MHHI delta and the HHI are higher. One possible reason is that
specifications (4) to (6) do not control for market-carrier-specific factors, which may affect
prices in the entire market. For example, whether a route is between two hubs of a given
carrier would not be controlled for. Another possibility is that the higher number of fixed
effects in the market-carrier-level regressions exacerbate measurement error and therefore
lead to more severe attenuation bias.
These results indicate that common ownership concentration, measured as MHHI delta,
has a statistically significant and economically sizable effect on airline ticket prices. The
effect is of a similar economic magnitude as the effect of the traditional HHI measure of mar-
ket concentration. Several potential omitted variables are differenced out with fixed effects,
but reverse causality may remain a concern. The next subsection addresses this and other
alternative explanations that could generate the above findings.
20
5.2 The Effect of a Combination of Asset Managers on Product
Prices of Portfolio Firms (Panel-IV)
To address reverse causality and other endogeneity concerns, we exploit a plausibly exoge-
nous change in route-level MHHIs. To do so, we need an event that changed airline ownership,
but happened for reasons orthogonal to developments in route-level pricing strategy within
the US airline industry, and therefore can be used to construct a panel-IV design. We first
outline why BlackRock’s acquisition of Barclays Global Investors constitutes such an event,
and then explain the methodology in more detail.
5.2.1 BlackRock’s Acquisition of Barclays Global Investors
Following the financial crisis that began in 2007, Barclays tried for several months to
strengthen its balance sheet. On March 16, 2009, Barclays made public that it had received
a $4 billion bid by CVC Capital Partners for its iShares family of exchange-traded funds. The
CVC offer contained a go-shop clause, however, that enabled Barclays to solicit competing
offers. A bid by BlackRock to acquire not only iShares, but all of iShares’ parent division
Barclays Global Investors (BGI), for $13.5 billion was announced on June 11, 2009. The bid
was successful and the acquisition was formally completed in December 2009, creating the
largest asset management company globally.
The long history of Barclays’ attempt to sell iShares to investors other than BlackRock
suggests the divestment decision was not primarily driven by considerations regarding how
the iShares portfolio would combine with BlackRock’s in terms of potential product market
effects. Moreover, US airline stocks of course comprised only a small share of BGI’s portfolio,
which makes it unlikely that they were pivotal in BlackRock’s decision to acquire BGI. As a
result, the BGI acquisition provides a presumably exogenous source of variation in common
ownership of US air carriers.
While airlines made up only a small part of the merging parties’ portfolios, both Barclays
and BlackRock were among the largest owners in several airlines. Because their percentage
ownership were not identical across airlines, however, the acquisition affected common own-
ership in some routes more than others. These considerations are at the core of our panel-IV
methodology.9
9Rather than exploiting multiple exogenously-induced mergers, we exploit a single merger with different
21
5.2.2 Panel-IV Methodology
As explained above, the acquisition of Barclays BGI generated variation across routes in
common ownership. We exploit this variation to identify the effect of common ownership on
airline prices as follows. We start by calculating the MHHI delta in the quarter before the ac-
quisition was announced, 2009Q1, for each airline market. We then calculate a counterfactual
MHHI delta for the same period with the only difference being that we treat the holdings
of BlackRock and Barclays as if they had been held by a single entity already. (Notice that
neither a hypothetical merger of two equity portfolios nor any other transfer of ownership
affects market shares, and thus the traditional HHI measure of market concentration. The
introductory example presented in Online Appendix B attempts to clarify this point.) We
call the difference between the latter MHHI delta and the former MHHI delta the “implied
change in the MHHI delta.” We construct an panel-IV strategy based on this implied change
in MHHI delta. The reason is that between the pre- and post-period, many changes can oc-
cur in portfolios and market shares, some of which might be endogenous. The sum of these
changes constitutes in the actual change in the MHHI delta. We want to use only variation
that is not endogenous. If BGI acquisition were the only change, the actual change in the
MHHI delta would be exactly the same as the implied change. If the other changes are small
relative to the BGI acquisition, it will not be exactly the same, but the correlation between
the two will be high, resulting in a strong instrument.
We show below that the implied change in the MHHI delta is in fact a strong predictor
of the actual changes in the MHHI delta. Thus, we can think of the implied change in the
MHHI delta as a “treatment” variable, which measures a given route’s level of exposure
to the acquisition event. As the pre-period, we use the first quarter before the announce-
ment, 2009Q1. Because the merger is consummated only in December 2009, and price effects
are unlikely to manifest themselves immediately (see a discussion below), we use 2011Q1,
2012Q1, and 2013Q1 as the post-periods (we follow the literature by using the same quarter
as the pre-period to rule out effects of seasonality).
In a discrete-treatment version, we divide markets into terciles according to their implied
impacts across geographic markets. Doing so, we follow Hastings and Gilbert (2005); Dafny, Duggan, andRamanarayanan (2012) and many predecessors in the industrial organization literature, inside and outsidethe airline industry. We use only the largest of consolidation events in the asset management industry amongothers for transparency and to be able to assess whether a single acquisition in the asset management industrycan have significant consequences for the product markets of portfolio firms.
22
changes in their MHHI deltas. We assign markets in the top tercile to the treatment group,
and markets in the bottom tercile to the control group. In a continuous-treatment version,
we use the implied change in MHHI delta as a continuous treatment variable. The relative
benefit of the discrete-treatment specification is that it might mitigate concerns related
to measurement error and is easier to understand and graphically illustrate, whereas the
benefit of the continuous-treatment version is that it makes use of more variation. We use
the treatment status interacted with a post-period indicator as an instrument for the actual
MHHI delta. The instrument is equal to zero in the pre-period for all markets. In the discrete-
treatment version, the instrument is equal to one in the post-period if the market is in the
treatment group, and equal to zero in the post-period if the market is in the control group.
In the continuous-treatment version, the instrument is equal to the value of the continuous
treatment variable in the post-period.10
Figure 4 shows the distribution of the implied change of MHHI delta across routes. The
mean and median across routes of the implied change is 91 HHI points; the implied change is
larger than 100 HHI points in more than 2,000 routes; the largest implied increase is 281 HHI
points. These are non-trivial changes in market concentration, for which we can reasonably
expect to find increases in market prices. The DOJ/FTC Horizontal Merger Guidelines
state that “Mergers resulting in highly concentrated markets [HHI over 2,500] that involve
an increase in the HHI of between 100 points and 200 points potentially raise significant
competitive concerns and often warrant scrutiny.” Thus, regulators would likely scrutinize
the merger of two airlines with the same effect on market concentration, but they do not
currently scrutinize the effect on concentration of portfolio industries induced by the merger
of two asset management firms, as long as the latter are labeled as “passive” investors.
Discussion
Several significant events occurred in the airline industry during the time period around
the BlackRock-BGI acquisition. Although none of them is likely to have caused the acquisi-
tion, we nevertheless examine their effect on our estimates. First, the Delta and Northwest
10Note that because we include route-carrier fixed effects, our specification is equivalent to specificationin differences, instrumenting the actual change in the MHHI delta between the pre- and post-periods withthe implied change in the MHHI delta (i.e., without interacting the treatment variable with a post-perioddummy). We checked that running the specification in differences indeed yields the same numerical resultsas corresponding the fixed-effects specifications (in the regressions with only one post-period).
23
merger was announced in April 2008 and became effective in September 2008. Second, the
United and Continental merger was announced in May 2010 and became effective in Oc-
tober 2010. The mergers potentially directly affected markets that had a sizable share of
both merging partners. We thus control for the merging parties’ shares in the quarter before
the merger. In addition, American Airlines filed for bankruptcy in November 2011. Markets
that had a positive share of American Airlines in any quarter between 2009Q1 and 2013Q1
were potentially directly affected by the American Airlines bankruptcy, and we thus control
for American’s maximum share in a market between 2009 and 2013. In addition, the US
economy was emerging from recession around the time of the BGI acquisition. (The NBER
recession ended in June 2009.) We control for the potentially different effect of macroeco-
nomic conditions across routes by including the (geometric) average income per capita and
of population of the two endpoints of the route. We also verify that there is no detectable
geographical pattern in treatment and control routes.
5.2.3 Panel-IV Results
Figure 5 shows the time series of average ticket prices in the treatment and control
markets, respectively. The graph clearly shows that ticket prices in the treatment and control
markets co-move very closely with each other until the post-merger integration of BGI is
completed. That is to say, the parallel-pre-trends assumption is satisfied. By 2011Q1, almost
precisely one year after the consummation of the acquisition in December 2009, prices in
“treated” markets start to increase relative to the prices of “control” markets, indicating a
positive effect of the implied increase in common ownership on ticket prices.11 We now turn
to a quantitative analysis of this effect.
Table 4 first presents the first-stage regressions of MHHI delta on the instrument (“Treat
× Post”) and several control variables. The first four columns use the discrete “treatment”
versus “control” specification; columns (5) to (8) contain the results using all information
from the distribution of MHHI deltas, that is, the continuous treatment specification. The
11The delay in the price response to an increase in common ownership is similar to the time it takesfor increased market concentration implied by full mergers to affect product prices. Specifically, Werden,Joskow, and Johnson (1991) consider price effects 6-18 months after announcement and 3-15 months afterconsummation; Borenstein (1990)’s post-period is four quarters after the merger. Outside the airline industry,the effects measured by Ashenfelter, Hosken, and Weinberg (2013) gradually manifest themselves over 33months after the merger, etc..
24
first three columns of each set of results use MHHI delta at a particular point of time as
the outcome variable; the fourth column averages across these three periods. The results
reject the concern of a weak instrument. Specifically, the within-R-squared (not taking into
account the explanatory power of fixed effects) is higher than 53% in all cases.
Table 4 (continued) reports the second-stage results of the panel-IV estimation, using
treatment times post-period as an instrument (i.e., the instrumented MHHI delta) for the
actual MHHI delta in panel regressions. Specifications (1) to (4) report results using the
discrete-treatment variable, and specifications (5) to (8) report results using the continuous-
treatment variable. Consistent with the timing illustrated in Figure 5, we find no signifi-
cant effect of MHHI delta on airfares in 2011Q1, but positive and significant coefficients for
2012Q1, 2013Q1, and for all three periods combined. The estimated effect of the MHHI delta
on average fares for the post-periods 2012Q1 and 2013Q1 is around 0.5 for the years after
2012Q1 and thus markedly higher than for the panel regressions reported previously. Multi-
plying the estimate with the average MHHI delta across routes indicates that ticket prices
are at least 10% higher because of common ownership alone, compared to a counterfactual
world in which firms are separately owned, or in which firms ignore the anti-competitive
incentives of their shareholders.
The fact that common ownership below HSR thresholds is currently effectively unregu-
lated is an important feature for the interpretation of these results. Our estimates for the
effect of common ownership are comparable to the highest estimates from studies of full
airline mergers. For example, Kim and Singal (1993) find that airline mergers during the
less tightly regulated period 1985-1988 (all approved by the Department of Transportation)
increased airfares in affected routes by 9.4% compared to routes that were unaffected by
the merger. Studies of airline mergers in other periods (regulated by the DOJ/FTC) find
only small price increases; see, e.g., Borenstein (1990); Luo (2014). It is not surprising that
unregulated increases in common ownership, as implemented by an acquisition in the asset
management industry and measured in the present paper, have stronger effects on product
prices than mergers that have been scrutinized by antitrust authorities.
Separate ownership may be deemed unrealistic in a world with 80% institutional owner-
ship and an extremely skewed size distribution of asset managers, which suggests an alter-
native frame to gauge economic significance. Given that the average implied MHHI delta is
about 91 HHI points, our estimates indicate that ticket prices on the average airline route in
25
the U.S. increased by about 0.6% as a direct result of the BlackRock-BGI acquisition. The
results using the continuous treatment are of a similar magnitude as the results using the
discrete treatment.
Robustness
For robustness, we show OLS results using the same sample as in the IV regressions
in Table 5. This analysis can be informally viewed as a “non-instrumented” execution of
the event study. The OLS estimates of the effect of the MHHI delta on fares are positive
and significant in all specifications. The coefficient on MHHI delta is higher than in the IV
results for 2011Q1, but lower in 2012Q1, 2013Q1, and in the specification including all three
post-periods. In sum, qualitatively similar results obtain in the non-instrumented version
of the event study. The fact that we find a positive an statistically significant coefficient
already for prices measured in 2011Q1 in this analysis is due to the difference between
actual changes in MHHI delta and implied changes. The previous analysis of the BlackRock-
BGI acquisition used only information that was available before the announcement of the
acquisition to compute implied changes in market concentration. The analysis presented
here uses the actual changes of ownership concentration that occurred in the history of this
industry, which may or may not be related to the BlackRock-BGI acquisition and exogenous
to airline competition.
5.3 Robustness Checks for Panel Regressions
This section discusses various robustness checks of the main results, focusing on the panel
regressions which have greater scope. As discussed previously, carrier-level, route-level, and
firm-route-level explanations for our findings are mechanically differenced out with fixed
effects in the various panel regressions. We already addressed reverse causality concerns
with the panel-IV, but wish to provide additional test of the reverse causality hypothesis.
To illustrate one variation of the hypothesis, suppose that institutional investors correctly
predict demand in particular routes, and buy shares of airlines with high market shares
in those routes.12 A decrease in quantity would speak against that explanation. The first
12Another variation of the reverse causality argument is that pre-merger talks might soften airline com-petition; institutions might know of these talks and accumulate shares, and a positive correlation between
26
test investigates whether the price increases due to common ownership are accompanied by
reductions in market-level demand, as predicted by theory.13
Online Appendix Table F.1 shows results for the regressions of passenger volume on
common ownership. The first specification includes as controls only HHI, MHHI delta, year-
quarter fixed effects, and market fixed effects. The second specification adds additional mar-
ket structure controls, and the third specification includes all the controls used in the price
regressions. In all specifications, both the HHI and the MHHI delta have a negative and sig-
nificant effect on market passengers, although the magnitude of the coefficients is less stable
across specifications. The coefficient on the HHI ranges from -0.486 to -0.657, whereas the
coefficient on MHHI delta is -0.633 in the specification without controls, and -0.269 in the
most saturated specification.
Measuring price conditional on carrier-market fixed effects is the best measure of margins
available. (Of course, route-level costs are not measurable.) As a result, the literature is
primarily concerned with price effects. However, the robustness test on quantity helps discern
between alternative theories. It indicates that increasing demand and reverse causality are
not the driver of the price effects. The economic magnitude on passenger volume on the
average route under present-day common ownership concentration relative to a scenario
with separate ownership is calculated as follows. We multiply the estimated coefficient on
the MHHI delta on quantity by the average MHHI delta across markets. Given an average
MHHI delta across routes of 2,200 in 2013Q1, and a coefficient of around -.27 in a regression
of the number of passengers on MHHI delta with all controls suggests that market passengers
in the average route are about 6% lower than they would be under separate ownership. Note
also that the quantity estimates imply a reasonable elasticity of route-level demand: dividing
prices and MHHI delta might occur.13According to theory, an increase in equilibrium prices implies market-level quantity decreases. At the
market-carrier level, however, quantity could increase or decrease. To see why, consider a market with twocarriers, each of which has constant marginal costs. Assume the marginal cost for the second carrier is slightlyhigher than that of the first carrier. Under separate ownership, the two carriers produce (approximately) theCournot equilibrium quantities. Now consider the case in which the same shareholder owns both carriers. Inthis case, it is in the interest of the shareholder to have the first carrier produce the monopoly quantity, andthe second carrier to produce zero, because the first carrier has lower production costs (Farrell and Shapiro,1990). Thus, although an increase in common ownership has a negative effect on quantity for the marketas a whole, at the carrier level, the effect can go either way: quantity could increase for the first carrierand decline for the second carrier. Because of this ambiguity in theoretical predictions, we run the quantityregressions at the market level only.
27
the coefficient from the quantity regressions with controls, -0.269, by the coefficient from the
price regressions with controls, 0.212, implies an elasticity of demand of -1.3. This estimate
is very close to existing estimates. For example, the IATA (2008) report estimates a price
elasticity of -1.4. Note also that the price and quantity effect imply a decrease in revenues,
which is consistent with an equilibrium of profit-maximizing behavior with market power.
(If instead revenues increased due to price increases, the firm could increase revenues and
increase costs at the same time.) As a final test of reverse causality, we ran a dynamic
specification including the contemporaneous MHHI delta and HHI, one lag of MHHI delta
and HHI, and one lead of the MHHI delta and HHI, including all controls, at the market-
carrier level. We find a negative correlation between future MHHI delta on prices, which
suggests that ownership changes are not primarily driven by ticket price changes (i.e., reverse
causality).
We next provide several robustness tests for the price regressions. We investigate whether
the effect of the MHHI delta is similar over time, by interacting both the MHHI delta and the
HHI with year dummies. Online Appendix Figure F.1 shows the results for a specification
at the market level with weights and all additional controls. The effect of MHHI delta on
fares is positive and statistically significant in most years. The effect of the HHI on fares
is very similar in magnitude in almost all years. One reason why the MHHI delta effect
is insignificant in 2006 and 2007 may be that both Delta Air Lines and Northwest were
bankrupt during all of 2006 and some of 2007. These bankruptcies may confound the effect
of MHHI delta, not only because an airline may compete differently during bankruptcy,
but also because shareholders have no de jure control rights during these times. It seems
plausible that firms do not primarily focus on the maximization of diversified shareholders’
interests by putting weight on other firms’ profits in such periods. To further investigate the
impact of bankruptcies on our estimates, in Online Appendix Table F.2 we exclude quarters
in which one of the major sample airlines was in bankruptcy from the sample, retaining only
the periods 2001Q4-2002Q2 and 2007Q2-2011Q3. The estimates remain similar.
Next, we investigate whether there are route-level differences in the effect of common
ownership on ticket prices, and in particular whether there is an interaction between the
degree of concentration measured by HHI and the effect of MHHI delta. Such an interaction
effect could arise because it might be more difficult to enforce soft competition among a
large number of relatively small competitors (that is, in low-HHI routes), compared to a
28
route in which only two players are present and have similar market shares (HHI in an
intermediate range, e.g. 5,000). On the other end of the spectrum, there might be great
scope in increasing monopolistic profits by creating common ownership in markets in which
a small number of players still competes with a large player (i.e., markets with an HHI close
to 10,000). On the other hand, there might be fewer such opportunities, making the effect
more difficult to estimate. We investigate these hypotheses by running a price regression
on MHHI delta interacted with a fifth-order polynomial of HHI, as well as all previously
considered controls.14
The resulting average marginal effects of MHHI delta as a function of HHI (on a scale
from 0 to 1), along with 95% confidence intervals of the effect, are depicted in Online Ap-
pendix Figure F.2. Consistent with the above hypothesis that frictions prevent a significant
of common ownership in markets with many similarly-sized competitors, the effect of MHHI
delta only becomes significant above an HHI of approximately 2,500 (the threshold between
“moderately concentrated” and “highly concentrated” markets according to the horizontal
merger guidelines; an HHI of 2,500 obtains, for example, when four firms each have 25%
market share). For an intermediate range of HHI values, from roughly 2,500 to 9,000, the
effect of MHHI delta on ticket prices is approximately 0.2 to 0.3. At the right tail, for HHIs
over 9,000, the point estimate for the MHHI delta coefficient is about 0.5, but the estimate
becomes imprecise and statistically indistinguishable from zero. These results indicate that
the effect of MHHI delta is robust in magnitude and significance across a large number of
routes. Moreover, the results appear consistent with the hypothesis that the efforts to soften
competition motivated by common ownership are concentrated in markets with a manage-
able number of competitors. This result is similar in spirit to the findings by Giroud and
Mueller (2010) and Giroud and Mueller (2011), who find that governance interventions are
more relevant in less competitive markets.
A further robustness checks that may be informative about the corporate governance
mechanism that implements the anti-competitive shareholder incentives is as follows. In the
baseline specification reported previously, we calculate the MHHI delta using all shareholders
larger than 0.5%. We now relax that restriction and include all shareholders present in the
Thomson database. Including all shareholders has a minimal effect on the estimated coeffi-
cients. We then estimate specifications including, for a given carrier at each quarter, only the
14We thank Severin Borenstein for this suggestion.
29
largest 10, largest 5, largest 3, and with only the single largest shareholder in the calculation
of the MHHI delta. These specifications assign control rights equal to zero if the shareholder
is not among the top N shareholders, but keeps ownership rights for all shareholders. This
specification is thus based on MHHI deltas calculated under the assumption that only the
largest N shareholders influence corporate strategy to the level of product pricing. The re-
sults are shown in Table 6. Generally speaking, disregarding control rights by shareholders
below the top five only slightly attenuates the results, but they remain highly statistically
significant. Specifically, if we ignore control rights by shareholders outside the top 10, the
coefficient on MHHI delta is 0.130 in the market-carrier-level specification and 0.194 in the
market-level specification, both significant at the 1% level. Comparing these estimates to
the baseline regressions, we deduce that ignoring control rights outside the top 10 does not
significantly alter the conclusions. Taking into account control rights by only the top five
shareholders produces a coefficient on MHHI delta of 0.124 in the market-carrier specifica-
tion and a coefficient of 0.170 in the market-level specification. Taking into account control
rights of only the largest three shareholders attenuates the results some more. Although
further attenuated, even common ownership by the single largest shareholder alone has a
significant effect on prices in all specifications. The coefficient is 0.0685 in the market-carrier
specification and 0.0788 in the market-level specification; both coefficients are significant
at the 1% level. As a placebo test, we also run specifications that assume that only share-
holders with less than 0.5% exercise control. These regressions do not result in significant
coefficients with robust sign for MHHI delta. In sum, these results suggest that the control
rights of the largest five to ten shareholders are most relevant for the implementation of the
anti-competitive effects of common ownership regarding product pricing.
In untabulated tests, we include distance times time fixed effect interactions to ensure
that the estimated effect of the MHHI delta is not generated by differences in price changes
over time in longer and shorter routes, for example, due to a differential response to oil price
changes. The results are similar to those of regressions without distance-time interactions.
We also run specifications with carrier-time fixed effects, which difference out time-varying
financial distress, or heterogeneous effects of firm-level oil price hedging policies on price
setting behavior, which might be correlated with MHHI delta for some reason. The effects
stay highly statistically significant. This result indicates specifically that the results cannot
stem from firm(-pair)-level financial conditions, combined with correlated selling of shares by
30
common owners. To ensure robustness to nonlinearities in the response of prices to market
concentration, we also run specifications (untabulated) controlling for a fifth-order polyno-
mial in the HHI. Estimates of the effect of MHHI delta on prices are very similar to those
in the reported baseline specification. As a further untabulated robustness test, we find that
the effect of MHHI delta is almost unchanged when we use the Evans and Kessides (1994)
variables to measure multi-market contact, and also when we control for nonstop competi-
tion in adjacent markets that connect the same city pairs, similar to Brueckner, Lee, and
Singer (2013).
5.4 Remaining Limitations
This subsection points out the two main limitations we see with our results. A first
concern with the panel-IV estimates can be that some other shock differentially affected
different airline routes after the 2009 recession, thus causing the divergence in prices. For
example, it could be that routes that are used mostly for business travel are more affected
by the economic recovery than routes flown by leisure passengers (irrespective of the fact
that the pre-2009 trends are parallel), that different airlines had heterogeneous exposure to
the more affected routes, and that BlackRock and BGI in 2009Q1 just happened to own
unusually large blocks of shares in these carriers and these carriers alone, compared to other
investors.
Note that we employ route-fixed effects, which difference out a simple business-versus-
leisure effect on prices. However, a slight variation of the argument could be that the hetero-
geneity across routes changes over time, in ways that happen to be correlated with BlackRock
and BGI’s pre-acquisition ownership as described above. The route-fixed effects would then
not absorb such an effect. To account for that possibility, we control for economic conditions
in departure and destination cities. However, this control could be imperfect. Similarly, there
could be a hidden geographical pattern in the treated and control routes that we were unable
to detect, but which is correlated with time-changing economic conditions we don’t measure
and the implied increase in common ownership, as detailed above. In sum, because we do not
have an instrument for time-varying exposure to economic recovery, this alternative remains
a limitation.
A second limitation concerns the alternative hypothesis that the price increases are in-
31
deed due to common ownership, but reflect an increase in the quality of the good delivered
rather than anti-competitive pricing. That is, for atheoretical reasons, common owners could
coordinate quality increases across carriers specifically in routes their airlines serve. Leaving
aside our finding of decreased quantity under common ownership, which contradicts that
hypothesis, this explanation could be a reasonable alternative hypothesis. Ideally, we would
therefore like to control for quality in our regressions. Whereas flight delay data exist at the
route level, to our knowledge, no paper in the literature examining effects of competition on
airline ticket prices uses such data as controls. A likely reason is, as Forbes, Lederman, and
Tombe (2015) (in a paper focused on quality in the airline industry) explain: “the volume of
the available data is so large that we are unable to estimate regressions that include all the
airlines for a longer time period.” As a result, this hypothesis remains a limitation of our
analysis as much as it is a limitation to existing studies on competition and product prices in
the airline industry. Future work may address this concern, maybe by focusing on industries
with products that are even more homogenous than airline tickets.
6 Institutional Background: Passive Investors, but Ac-
tive Owners
The focus of this paper is on documenting unilateral anti-competitive incentives implied
by common ownership of firms, and on studying whether observed market prices are con-
sistent with the implementation of these incentives. However, because the institutional and
legal environment of our setting may be less well understood, a brief discussion how such
incentives could get implemented is in place, as well as an indication of whether our conclu-
sions have the potential to be generalizable. To that end, we provide new evidence regarding
the ubiquitous nature of common ownership. Second, we provide accounts by insiders of the
asset management industry about the nature of voting and engagement between investors
and their portfolio firms, shedding light specifically on corporate governance activities by
so-called “passive” investors. We report legal scholars’ assessments of the legality of such
communications and other related problems in Online Appendix G.
32
6.1 Ubiquity of Common Ownership
Table 1 provides a list of the largest shareholders, along with their ownership percent-
age, of some of the most well-known firms in the United States. The overlap of shareholders
across natural competitors is substantial. For example, BlackRock is the largest shareholder
of each of the nation’s largest three banks (JPMorgan Chase, Bank of America, and Citi-
group); Vanguard, State Street, and Fidelity are among the top six shareholders in each of
these banks as well. BlackRock is also the largest shareholder of both Apple and Microsoft.
The top five shareholders of CVS and Walgreens are identical. These examples illustrate
that large institutional investors, possibly as a mechanical effect of their size and portfolio
diversification, generally tend to hold firms that are natural competitors. Craig (2013) and
The Economist, December 7, 2013, report that BlackRock is the single largest shareholder
of one fifth of all American firms. We conclude that the airline industry is not an unusual
case with respect to their ownership structure.
6.2 Passive Investment, Active Ownership
The large diversified institutional investors that are the largest shareholders of the above
firms are commonly labelled as “passive” investors. When using such labels, however, it is
important to distinguish between these investors’ investment strategy and their corporate
governance policies. For example, Vanguard explains their corporate governance engage-
ments under the title “passive investors, not passive owners” (Booraem, 2014); the Financial
Times, in an article titled “passive investment, active ownership,” quotes the former head of
corporate governance at TIAA-CREF as saying: “Having a passive investment strategy has
nothing to do with your behaviour as an owner” (Scott, 2014); and BlackRock’s chairman
and CEO, Laurence D. Fink, does not tire to emphasize that “We are an active voice, ...”
(Benoit, 2014). The distinction between passive investment and active ownership becomes
more important as these investors’ size and activity level increases.
The asset managers’ fiduciary duty obliges them to vote in shareholder elections. As a
result, they are not only an active voice, they also determine executive compensation, reten-
tion, and the election of directors. The combined effect can be consistent with incentivizing
the CEO to not only maximize the own firm’s performance, but also take industry perfor-
mance or specific competitors’ profits into account. For example, whereas CEOs are rarely
33
fired (Taylor, 2010), CEO pay (Bertrand and Mullainathan, 2001) and turnover (Eisfeldt
and Kuhnen, 2013; Jenter and Kanaan, forthcoming) in industrial firms is known to depend
not only on individual firm performance but also on industry performance. Such schemes
are consistent with the incentives of shareholders that are diversified across firms within
the same industry, but inconsistent with relative performance evaluation (if “performance”
is measured for each firm in isolation). Moreover, complying with shareholder demands to
soften competition can act as a coordinating device that increases all firms’ profits and stock
price, even if a one-shot deviation would be profitable to an individual firm. As a result,
even if CEOs were entirely incentivized based on their own firm’s performance, following the
largest shareholders’ suggestions can be consistent with CEO incentives.
The institutional investors, being the largest investors of most firms, state that their
voting rights give them substantial power in designing contracts according to their incentives.
The head of corporate governance at State Street Global Advisors is quoted by Scott (2014),
referring to voting power of SSgA’s passive funds: “The option of exercising our substantial
voting rights in opposition to management provides us with sufficient leverage and ensures
our views and client interests are given due consideration.” A different industry expert is
quoted in the same article “They are generally such large investors and have such large
positions that their vote is worth a lot. The last thing companies want is to have big investors
vote against them.” To illustrate the breadth of involvement in shareholder elections, consider
that in 2012, BlackRock alone voted on 129,814 proposals at 14,972 shareholder meetings.
Importantly, the largest among institutional investors almost always form their own opin-
ions about every item on the ballot, and coordinate the voting of all of their funds at the
family level, as in a voting trust. For example, Vanguard “[has] an experienced team of an-
alysts that independently evaluates each proposal and casts our funds’ votes in accordance
with our voting guidelines.” Similarly, Laurence D. Fink, chairman and CEO of BlackRock,
emphasizes that “we reach our voting decisions independently of proxy advisory firms” (Con-
don and Bhaktavatsalam, 2012).
Engagement is not limited to these particular examples. In a recent survey, McCahery,
Starks, and Sautner (2014) find that “the majority of institutional investors ... are willing to
engage in shareholder activism” or “behind-the-scenes” corporate governance, see also Appel,
Gormley, and Keim (2014); Dimson, Karakas, and Li (forthcoming); Mullins (2014); see
Carleton, Nelson, and Weisbach (1998); Becht, Bolton, and Roell (2007) for case studies. The
34
nature of engagement activities comprises a variety of tools. BlackRock’s Proxy Voting and
Shareholder Engagement FAQ (updated February 2014) serve as an example: “We engaged
with roughly 1,500 companies around the world in 2012. When we engage successfully and
companies adjust their approach, most observers are never aware of that engagement. [...] We
typically only vote against management when direct engagement has failed. [...] Engagement
encompasses a range of activities from brief conversations to a series of one-on-one meetings
with companies.” In personal communication, a corporate governance executive characterizes
the relationship between engagement and voting as “the carrot and the stick,” respectively.
As with voting, engagement is by no means limited to fund families that predominantly
host actively managed funds. To the contrary, the economic incentive to engage in corporate
governance activities is greater for index funds (because they have longer horizons), and they
often have more voting power, because they tend to be larger. To illustrate, Vanguard finds
that “Because our funds own a significant portion of many companies (and in the case of
index funds are practically permanent holders of companies), we have a vested interest in
ensuring that these companies’ governance ... practices support the creation of long-term
value for investors.” As a consequence, Vanguard also has “hundreds of direct discussions
[with portfolio firms] every year.”
It is difficult to imagine that the same principal who votes on a CEO’s retention decision
would at the same time be unable to influence other aspects of firm policy, including those
that do not appear on the ballot. Yet, because behind-the-scenes engagement is private,
it is difficult to know precisely which topics are discussed during engagement. BlackRock’s
2011 Corporate Governance and Responsible Investment Annual Review makes this explicit:
“Most of our engagements are nuanced and sensitive; ... We are extremely unlikely to use
the media, make a statement at a shareholder meeting, propose a shareholder resolution or
employ other public means in our engagement process.” Vanguard is more straightforward,
indicating that “Through engagement, we’re able to put issues on the table for discussion
that aren’t on the proxy ballot.” More explicitly, the former legal counsel of a very large
asset management firm tells us in personal communication that “high on the list of topics”
discussed in engagement meetings is how portfolio firms can “throw the switch from develop-
ing market share to instead exercise market power to get margins up” in particular markets.
“Antitrust considerations are generally not on the radar” during such conversations.
All that said, it is neither necessary nor likely that owners micro-manage competition
35
of their portfolio firms. Whereas airlines are known to micro-manage competition intensity
across routes taking the identity of their competitors into account (see, e.g., Li and Netessine,
2011), investors only need to remind their firms of their interests, i.e., to help identify the
competitors which whom competition is least beneficial. That is, there is no additional
operational complication in our setting, compared to what the literature has documented,
even if the effects were implemented deliberately. However, the most likely interpretation of
the evidence is that firms, absent engagement, attempt to limit competition – their profits and
survival depend on it. The challenge is that price coordination is fragile. Common ownership
is a natural coordination device that may help make cooperative arrangements more stable
(Kuhn, 2001) and make undesirable price wars less frequent. It appears plausible that board
members that are elected by the same asset management firm – or even are executives of the
asset manager that is the largest shareholder – are able to limit the frequency and extent of
price wars between commonly owned firms.
6.3 Summary
In sum, although communication is not necessary to implement unilateral anti-competitive
incentives that arise from publicly known common ownership links, the above evidence sug-
gests that frequent and active communication, explicitly also about product market strategy,
does take place between the largest investors and their portfolio firms. We also find it im-
plausible that the worlds’ largest and most powerful investors are unaware of or unable to
maximize their economic incentives - the evidence above certainly suggests a significant de-
gree of sophistication. “The bottom line is that we believe that the vast majority of boards
and management teams are appropriately focused on the same long-term value objectives as
we are.” (Booraem, 2014, on behalf of Vanguard).
7 Conclusion
This paper presents evidence of anti-competitive incentives and price effects caused by
common ownership of firms by diversified institutional investors. Specifically, we document
that, in the airline industry, a modified index of market concentration that takes common
ownership into account (the MHHI) indicates levels of market concentration that far exceed
36
those indicated by the conventional measure of market concentration (the HHI), which does
not take common ownership into account. The difference between average MHHI and HHI,
“MHHI delta,” represents market concentration that is solely due to common ownership.
Such an increase in concentration is implemented by simple unregulated acquisitions of stock
by common shareholders. The resulting overlapping ownership interests are economically
equivalent to partial mergers, and they are large in magnitude: MHHI delta is more than 10
times larger than what would be presumed “to be likely to enhance market power” in the
case of a traditional merger, according to the Horizontal Merger Guidelines formulated by the
US Antitrust Agencies. In other words, the cumulation of many relatively small overlapping
ownership interests results a very large increase in market concentration.
Consistent with investors’ economic incentives and established economic theory, we find
that when firms don’t have incentives to compete, they don’t. Specifically, we use more than
10 years of market-firm-level panel data from the airline industry to show that common own-
ership has a large and significant positive effect on product prices. We then exploit variation
in common ownership concentration generated by the merger of two large asset managers
that arguably occurred for reasons unrelated to route-level differences in US airline ticket
prices, and find similar effects. In sum, we find that product prices are 3-11% higher because
of common ownership, compared to a counterfactual world in which firms are separately
owned, or in which firms entirely ignore their owners’ anti-competitive incentives caused by
common ownership. Further, we estimate that the single acquisition of BGI by BlackRock
caused U.S. airline ticket prices to increase by 0.6% on average across routes. These results
imply a large deadweight loss, i.e., decreased efficiency, for the macroeconomy due to common
ownership.
Tackling the competitive risks due to common ownership presents non-trivial challenges
to regulators, not only from a political standpoint but also from a conceptual perspective.
Specifically, this paper points to a policy trilemma. Diversification combined with the axiom
that well-governed firms implement shareholders’ incentives implies a decline of product
market competition, and an associated deadweight loss for the economy. The three goals
of (i) perfect shareholder diversification, (ii) firms’ maximization of shareholder interests,
and (iii) preservation of competitive product markets cannot be simultaneously achieved.
The first two goals benefit shareholders. Indeed, the increase of institutional ownership over
the last decades presumably reflects the benefits generated for shareholders. By contrast,
37
the consequence of a decline in product market competition is a social cost that has thus
far been largely ignored. What is the optimal tradeoff between the above three goals is an
interesting question for future study.
One direct policy implication arises, however, at a more practical level: empirical mea-
sures of market concentration should take ownership into account. This can be accomplished
by calculating MHHIs, which are already used instead of HHIs by antitrust authorities in
cases in which owners are considered to be “active.” We suggest to use MHHIs also in the
context of the largest owners of most public companies, who consider themselves “passive
investors, not passive owners.” Doing so would make immediately clear that consolidation in
the asset management industry has potentially large anti-competitive effects, even compared
to mergers of natural competitors in the product market itself. Under this new measure, the
consistent application of existing rules would also imply that mergers of large asset manage-
ment companies require proof of absence of anti-competitive effects on the product market
of any of the portfolio companies.
Of course, before bold action is taken by regulators, further study is needed to establish
the applicability of our results to other industries, to estimate optimal reporting thresholds,
to determine the optimal size of asset management companies, and so on. Similarly, studies
of the effect of common ownership on corporate policies other than pricing are left for future
research. The present paper merely intends to start the debate.
38
References
Adams, R., and D. Ferreira (2008): “One share-one vote: The empirical evidence,”
Review of Finance, 12(1), 51–91.
Aggarwal, R. K., and A. A. Samwick (1999): “Executive compensation, strategic com-
petition, and relative performance evaluation: Theory and evidence,” The Journal of Fi-
nance, 54(6).
Allen, J. W., and G. M. Phillips (2000): “Corporate equity ownership, strategic al-
liances, and product market relationships,” The Journal of Finance, 55(6), 2791–2815.
Appel, I., T. Gormley, and D. Keim (2014): “Passive Investors, Not Passive
Owners,” Discussion paper, Available at SSRN: http://ssrn.com/abstract=2475150 or
http://dx.doi.org/10.2139/ssrn.2475150.
Ashenfelter, O. C., D. S. Hosken, and M. C. Weinberg (2013): “The Price Effects
of a Large Merger of Manufacturers: A Case Study of Maytag-Whirlpool,” American
Economic Journal: Economic Policy, 5(1), 239–261.
Azar, J. (2012): “A new look at oligopoly: Implicit collusion through portfolio diversifica-
tion,” Ph.D. thesis, Princeton University.
Becht, M., P. Bolton, and A. Roell (2007): “Corporate law and governance,” Hand-
book of Law and Economics, 2, 829–943.
Benmelech, E., and N. K. Bergman (2008): “Liquidation values and the credibility
of financial contract renegotiation: Evidence from US airlines,” The Quarterly Journal of
Economics, 123(4), 1635–1677.
Benoit, D. (2014): “BlackRock’s Larry Fink: Typical Activists Are Too Short-Term,”
The Wall Street Journal, http://blogs.wsj.com/moneybeat/2014/01/16/blackrocks-larry-
fink-typical-activists-are-too-short-term/tab/print/.
Bertrand, M., and S. Mullainathan (2001): “Are CEOs rewarded for luck? The ones
without principals are,” Quarterly Journal of Economics, pp. 901–932.
39
(2003): “Enjoying the quiet life? Corporate governance and managerial preferences,”
Journal of Political Economy, 111(5), 1043–1075.
Booraem, G. (2014): “Passive investors, not passive owners,” retrieved on September 26,
2014 at https://personal.vanguard.com/us/insights/article/proxy-commentary-042013.
Borenstein, S. (1990): “Airline mergers, airport dominance, and market power,” The
American Economic Review, 80(2).
Borenstein, S., and N. L. Rose (1994): “Competition and Price Dispersion in the US
Airline Industry,” The Journal of Political Economy, 102(4), 653–683.
(1995): “Bankruptcy and Pricing Behavior in the U.S. Airline Markets,” The Amer-
ican Economic Review, 85(2), 397–402.
Brav, A., W. Jiang, and H. Kim (2011): “The real effects of hedge fund activism: Pro-
ductivity, risk, and product market competition,” Discussion paper, National Bureau of
Economic Research.
Brav, A., W. Jiang, F. Partnoy, and R. Thomas (2008): “Hedge fund activism,
corporate governance, and firm performance,” The Journal of Finance, 63(4), 1729–1775.
Bresnahan, T. F., and S. C. Salop (1986): “Quantifying the competitive effects of
production joint ventures,” International Journal of Industrial Organization, 4(2), 155–
175.
Brueckner, J. K., D. Lee, and E. S. Singer (2013): “Airline competition and domestic
US airfares: A comprehensive reappraisal,” Economics of Transportation, 2(1), 1–17.
Brueckner, J. K., and W. T. Whalen (2000): “The Price Effects of International Airline
Alliances*,” The Journal of Law and Economics, 43(2), 503–546.
Carleton, W. T., J. M. Nelson, and M. S. Weisbach (1998): “The Influence of
Institutions on Corporate Governance through Private Negotiations: Evidence from TIAA-
CREF,” The Journal of Finance, 53(4), 1335–1362.
40
Condon, C., and S. V. Bhaktavatsalam (2012): “Fink Leverages BlackRock’s
$3.5 Trillion in Shareholder Push,” Bloomberg, retrieved on September 26, 2014
at http://www.bloomberg.com/news/2012-01-19/fink-leverages-blackrock-s-3-3-trillion-in-
shareholder-push.html.
Craig, S. (2013): “The Giant of Shareholders, Quietly Stirring,” The New York Times.
Cramton, P., H. Mehran, and J. Tracy (2010): “Bargaining with a Shared Interest:
The Impact of Employee Stock Ownership Plans on Labor Disputes,” Discussion paper,
University of Maryland, Department of Economics-Peter Cramton.
Cronqvist, H., and R. Fahlenbrach (2009): “Large shareholders and corporate poli-
cies,” Review of Financial Studies, 22(10), 3941–3976.
Dafny, L., M. Duggan, and S. Ramanarayanan (2012): “Paying a Premium on Your
Premium? Consolidation in the US Health Insurance Industry,” American Economic Re-
view, 102(2), 1161–85.
Dai, M., Q. Liu, and K. Serfes (2014): “Is the Effect of Competition on Price Disper-
sion Nonmonotonic? Evidence from the US Airline Industry,” Review of Economics and
Statistics, 96(1), 161–170.
Dasgupta, A., G. Piacentino, and J. Zhang (2011): The Wall Street walk when block-
holders compete for flows. Paul Woolley Centre for the Study of Capital Market Dysfunc-
tionality; Financial Markets Group.
Davis, G. F. (2008): “A new finance capitalism? Mutual funds and ownership re-
concentration in the United States,” European Management Review, 5(1), 11–21.
(2013): “After the corporation,” Politics & Society, 41(2), 283–308.
Davis, G. F., and E. H. Kim (2007): “Business ties and proxy voting by mutual funds,”
Journal of Financial Economics, 85(2), 552–570.
Dekel, E., M. O. Jackson, and A. Wolinsky (2008): “Vote buying: General elections,”
Journal of Political Economy, 116(2), 351–380.
41
Demsetz, H. (1986): “Corporate control, insider trading, and rates of return,” The Amer-
ican Economic Review, pp. 313–316.
Demsetz, H., and K. Lehn (1985): “The structure of corporate ownership: Causes and
consequences,” The Journal of Political Economy, pp. 1155–1177.
Dimson, E., O. Karakas, and X. Li (forthcoming): “Active ownership,” Review of Fi-
nancial Studies.
Edmans, A., D. Levit, and D. Reilly (2014): “Governance and Comovement Unter
Common Ownership,” Working Paper.
Eisfeldt, A. L., and C. M. Kuhnen (2013): “CEO turnover in a competitive assignment
framework,” Journal of Financial Economics, 109(2), 351–372.
Eso, P., S. Hansen, and L. White (2014): “A Theory of Vote-Trading and Information
Aggregation,” .
Evans, W. N., and I. N. Kessides (1994): “Living by the” Golden Rule”: Multimarket
contact in the US airline industry,” The Quarterly Journal of Economics, pp. 341–366.
Faccio, M., and L. H. Lang (2002): “The ultimate ownership of Western European
corporations,” Journal of Financial Economics, 65(3), 365–395.
Farrell, J. (1985): “Owner-consumers and efficiency,” Economics Letters, 19(4), 303–306.
Farrell, J., and C. Shapiro (1990): “Asset ownership and market structure in oligopoly,”
Rand Journal of Economics, 21(2), 275–292.
Forbes, S. J., and M. Lederman (2009): “Adaptation and vertical integration in the
airline industry,” The American Economic Review, 99(5), 1831–1849.
Forbes, S. J., and M. Lederman (2010): “Does vertical integration affect firm perfor-
mance? Evidence from the airline industry,” The RAND Journal of Economics, 41(4),
765–790.
42
Forbes, S. J., M. Lederman, and T. Tombe (2015): “Quality Disclosure Programs
and Internal Organizational Practices: Evidence from Airline Flight Delays,” American
Economic Journal: Microeconomics.
Gayle, P., and C.-Y. Wu (2012): “A re-examination of incumbents’ response to the threat
of entry: Evidence from the airline industry,” Working Paper.
Gilo, D. (2000): “The anticompetitive effect of passive investment,” Michigan Law Review,
pp. 1–47.
Gilo, D., Y. Moshe, and Y. Spiegel (2006): “Partial cross ownership and tacit collu-
sion,” The RAND Journal of Economics, 37(1), 81–99.
Giroud, X., and H. M. Mueller (2010): “Does corporate governance matter in compet-
itive industries?,” Journal of Financial Economics, 95(3), 312–331.
(2011): “Corporate governance, product market competition, and equity prices,”
The Journal of Finance, 66(2), 563–600.
Goolsbee, A., and C. Syverson (2008): “How do incumbents respond to the threat of
entry? Evidence from the major airlines,” The Quarterly Journal of Economics, 123(4),
1611–1633.
Gordon, R. H. (1990): “Do publicly traded corporations act in the public interest?,”
Discussion paper, National Bureau of Economic Research.
Hansen, R. G., and J. R. Lott (1996): “Externalities and corporate objectives in a world
with diversified shareholder/consumers,” Journal of Financial and Quantitative Analysis,
31(01), 43–68.
Harford, J., D. Jenter, and K. Li (2011): “Institutional cross-holdings and their effect
on acquisition decisions,” Journal of Financial Economics, 99(1), 27–39.
Hartzell, J. C., and L. T. Starks (2003): “Institutional investors and executive com-
pensation,” The Journal of Finance, 58(6), 2351–2374.
Hastings, J. S., and R. J. Gilbert (2005): “Market Power, Vertical Integration and the
Wholesale Price of Gasoline*,” The Journal of Industrial Economics, 53(4), 469–492.
43
He, J., and J. Huang (2014): “Product Market Competition in a World of Cross Owner-
ship: Evidence from Institutional Blockholdings,” Available at SSRN.
IATA (2008): “Air Travel Demand,” IATA Economics Briefing, (9), 7.
Iliev, P., and M. Lowry (2012): “Are Mutual Funds Active Voters?,” Unpublished Paper,
Pennsylvania State University.
Jenter, D., and F. Kanaan (forthcoming): “CEO turnover and relative performance
evaluation,” Journal of Finance.
Jiang, W., K. Li, and W. Wang (2012): “Hedge funds and Chapter 11,” The Journal of
Finance, 67(2), 513–560.
Kaplan, S. N., and B. A. Minton (2012): “How has CEO turnover changed?,” Interna-
tional Review of Finance, 12(1), 57–87.
Katz, D. A., and L. A. McIntosh (2013): “The Mainstreaming of Shareholder Activism
in 2013,” New York Law Journal.
Kempf, E., A. Manconi, and O. G. Spalt (2013): “Distracted Shareholders and Cor-
porate Actions,” Available at SSRN 2356163.
Kim, E. H., and V. Singal (1993): “Mergers and Market Power: Evidence from the Airline
Industry,” The American Economic Review, 83(3), 549–569.
Kraus, A., and A. Rubin (2010): “Reducing managers’ incentives to cannibalize: Manage-
rial stock options when shareholders are diversified,” Journal of Financial Intermediation,
19(4), 439–460.
Kreps, D. M., and J. A. Scheinkman (1983): “Quantity precommitment and Bertrand
competition yield Cournot outcomes,” The Bell Journal of Economics, pp. 326–337.
Kuhn, K.-U. (2001): “Fighting collusion by regulating communication between firms,” Eco-
nomic Policy, 16(32), 167–204.
44
Lederman, M. (2007): “Do enhancements to loyalty programs affect demand? The im-
pact of international frequent flyer partnerships on domestic airline demand,” The RAND
Journal of Economics, 38(4), 1134–1158.
Li, J., and S. Netessine (2011): “Partnering with Competitors–An Empirical Analysis
of Airline Alliances and Multimarket Competition,” Discussion paper, Working Paper.
INSEAD, France. 1–37.
Luo, D. (2014): “The Price Effects of the Delta/Northwest Airline Merger,” Review of
Industrial Organization, 44(1), 27–48.
Massa, M., and A. Zaldokas (2013): “Blocks in Multiple Firms,” Working Paper.
Matvos, G., and M. Ostrovsky (2008): “Cross-ownership, returns, and voting in merg-
ers,” Journal of Financial Economics, 89(3), 391–403.
McCahery, J., L. Starks, and Z. Sautner (2014): “Behind the Scenes: The Corporate
Governance Preferences of Institutional Investors,” Working Paper.
Morrison, S. A. (2001): “Actual, adjacent, and potential competition: Estimating the full
effect of Southwest Airlines,” Journal of Transport Economics and Policy, pp. 239–256.
Mullainathan, S., and D. Scharfstein (2001): “Do firm boundaries matter?,” Ameri-
can Economic Review, pp. 195–199.
Mullins, W. (2014): “The governance impact of index funds: Evidence from regression
discontinuity,” Work. Pap., Sloan Sch. Manag., Mass. Inst. Technol.
Nain, A., and Y. Wang (2013): “The Product Market Impact of Minority Stake Acquisi-
tions,” Available at SSRN 2180996.
O’Brien, D. P., and S. C. Salop (2000): “Competitive effects of partial ownership:
Financial interest and corporate control,” Antitrust Law Journal, pp. 559–614.
Peters, C. (2006): “Evaluating the Performance of Merger Simulation: Evidence from the
US Airline Industry,” Journal of Law and Economics, 49(2), 627–649.
45
Phillips, G., and G. Sertsios (2013): “How do firm financial conditions affect product
quality and pricing?,” Management Science, 59(8), 1764–1782.
Posner, E. A., and E. G. Weyl (2013): “Quadratic Voting as Efficient Corporate Gov-
ernance,” University of Chicago Law Review, Forthcoming.
Reynolds, R. J., and B. R. Snapp (1986): “The competitive effects of partial equity
interests and joint ventures,” International Journal of Industrial Organization, 4(2), 141–
153.
Rotemberg, J. (1984): “Financial transaction costs and industrial performance,” .
Rotemberg, J. J., and G. Saloner (1986): “A supergame-theoretic model of price wars
during booms,” The American Economic Review, pp. 390–407.
Rubin, A. (2006): “Diversification and corporate decisions,” Corporate Ownership and Con-
trol, 3, 209–212.
Rydqvist, K., J. Spizman, and I. Strebulaev (2014): “Government policy and owner-
ship of equity securities,” Journal of Financial Economics, 111, 70–85.
Schwartz-Ziv, M., and R. Wermers (2014): “Do Mutual Funds Have a Say on Pay?,”
Working Paper.
Scott, M. (2014): “Passive investment, active ownership,” Financial Times, retrieved on-
line on September 26, 2014 at http://www.ft.com/intl/cms/s/0/7c5f8d60-ba91-11e3-b391-
00144feabdc0.html.
Shleifer, A., and R. W. Vishny (1997): “A Survey of Corporate Governance,” Journal
of Finance, 52(2), 737–783.
Stein, J. C. (1997): “Internal capital markets and the competition for corporate resources,”
The Journal of Finance, 52(1), 111–133.
Taylor, L. A. (2010): “Why are CEOs rarely fired? Evidence from structural estimation,”
The Journal of Finance, 65(6), 2051–2087.
46
Vitali, S., J. B. Glattfelder, and S. Battiston (2011): “The network of global
corporate control,” PloS one, 6(10), e25995.
Werden, G. J., A. S. Joskow, and R. L. Johnson (1991): “The effects of mergers on
price and output: Two case studies from the airline industry,” Managerial and Decision
Economics, 12(5), 341–352.
Zwiebel, J. (1995): “Block investment and partial benefits of corporate control,” The Re-
view of Economic Studies, 62(2), 161–185.
47
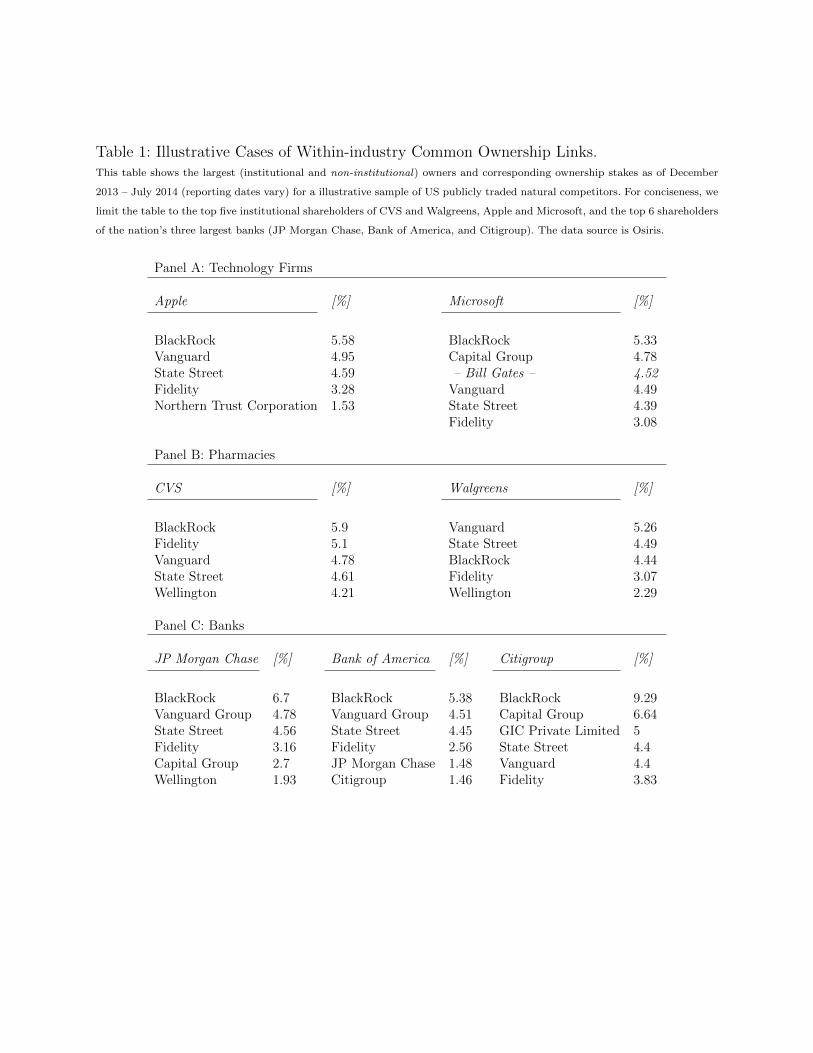
Table 1: Illustrative Cases of Within-industry Common Ownership Links.This table shows the largest (institutional and non-institutional) owners and corresponding ownership stakes as of December
2013 – July 2014 (reporting dates vary) for a illustrative sample of US publicly traded natural competitors. For conciseness, we
limit the table to the top five institutional shareholders of CVS and Walgreens, Apple and Microsoft, and the top 6 shareholders
of the nation’s three largest banks (JP Morgan Chase, Bank of America, and Citigroup). The data source is Osiris.
Panel A: Technology Firms
Apple [%] Microsoft [%]
BlackRock 5.58 BlackRock 5.33Vanguard 4.95 Capital Group 4.78State Street 4.59 – Bill Gates – 4.52Fidelity 3.28 Vanguard 4.49Northern Trust Corporation 1.53 State Street 4.39
Fidelity 3.08
Panel B: Pharmacies
CVS [%] Walgreens [%]
BlackRock 5.9 Vanguard 5.26Fidelity 5.1 State Street 4.49Vanguard 4.78 BlackRock 4.44State Street 4.61 Fidelity 3.07Wellington 4.21 Wellington 2.29
Panel C: Banks
JP Morgan Chase [%] Bank of America [%] Citigroup [%]
BlackRock 6.7 BlackRock 5.38 BlackRock 9.29Vanguard Group 4.78 Vanguard Group 4.51 Capital Group 6.64State Street 4.56 State Street 4.45 GIC Private Limited 5Fidelity 3.16 Fidelity 2.56 State Street 4.4Capital Group 2.7 JP Morgan Chase 1.48 Vanguard 4.4Wellington 1.93 Citigroup 1.46 Fidelity 3.83
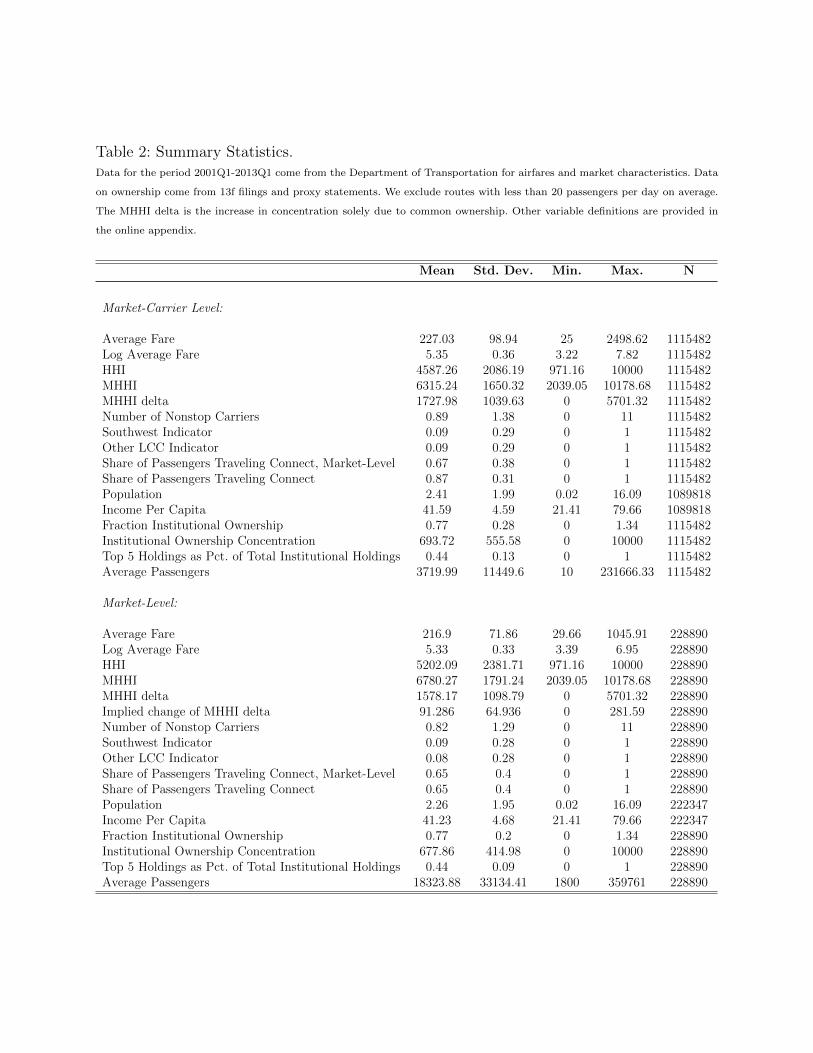
Table 2: Summary Statistics.Data for the period 2001Q1-2013Q1 come from the Department of Transportation for airfares and market characteristics. Data
on ownership come from 13f filings and proxy statements. We exclude routes with less than 20 passengers per day on average.
The MHHI delta is the increase in concentration solely due to common ownership. Other variable definitions are provided in
the online appendix.
Mean Std. Dev. Min. Max. N
Market-Carrier Level:
Average Fare 227.03 98.94 25 2498.62 1115482Log Average Fare 5.35 0.36 3.22 7.82 1115482HHI 4587.26 2086.19 971.16 10000 1115482MHHI 6315.24 1650.32 2039.05 10178.68 1115482MHHI delta 1727.98 1039.63 0 5701.32 1115482Number of Nonstop Carriers 0.89 1.38 0 11 1115482Southwest Indicator 0.09 0.29 0 1 1115482Other LCC Indicator 0.09 0.29 0 1 1115482Share of Passengers Traveling Connect, Market-Level 0.67 0.38 0 1 1115482Share of Passengers Traveling Connect 0.87 0.31 0 1 1115482Population 2.41 1.99 0.02 16.09 1089818Income Per Capita 41.59 4.59 21.41 79.66 1089818Fraction Institutional Ownership 0.77 0.28 0 1.34 1115482Institutional Ownership Concentration 693.72 555.58 0 10000 1115482Top 5 Holdings as Pct. of Total Institutional Holdings 0.44 0.13 0 1 1115482Average Passengers 3719.99 11449.6 10 231666.33 1115482
Market-Level:
Average Fare 216.9 71.86 29.66 1045.91 228890Log Average Fare 5.33 0.33 3.39 6.95 228890HHI 5202.09 2381.71 971.16 10000 228890MHHI 6780.27 1791.24 2039.05 10178.68 228890MHHI delta 1578.17 1098.79 0 5701.32 228890Implied change of MHHI delta 91.286 64.936 0 281.59 228890Number of Nonstop Carriers 0.82 1.29 0 11 228890Southwest Indicator 0.09 0.28 0 1 228890Other LCC Indicator 0.08 0.28 0 1 228890Share of Passengers Traveling Connect, Market-Level 0.65 0.4 0 1 228890Share of Passengers Traveling Connect 0.65 0.4 0 1 228890Population 2.26 1.95 0.02 16.09 222347Income Per Capita 41.23 4.68 21.41 79.66 222347Fraction Institutional Ownership 0.77 0.2 0 1.34 228890Institutional Ownership Concentration 677.86 414.98 0 10000 228890Top 5 Holdings as Pct. of Total Institutional Holdings 0.44 0.09 0 1 228890Average Passengers 18323.88 33134.41 1800 359761 228890
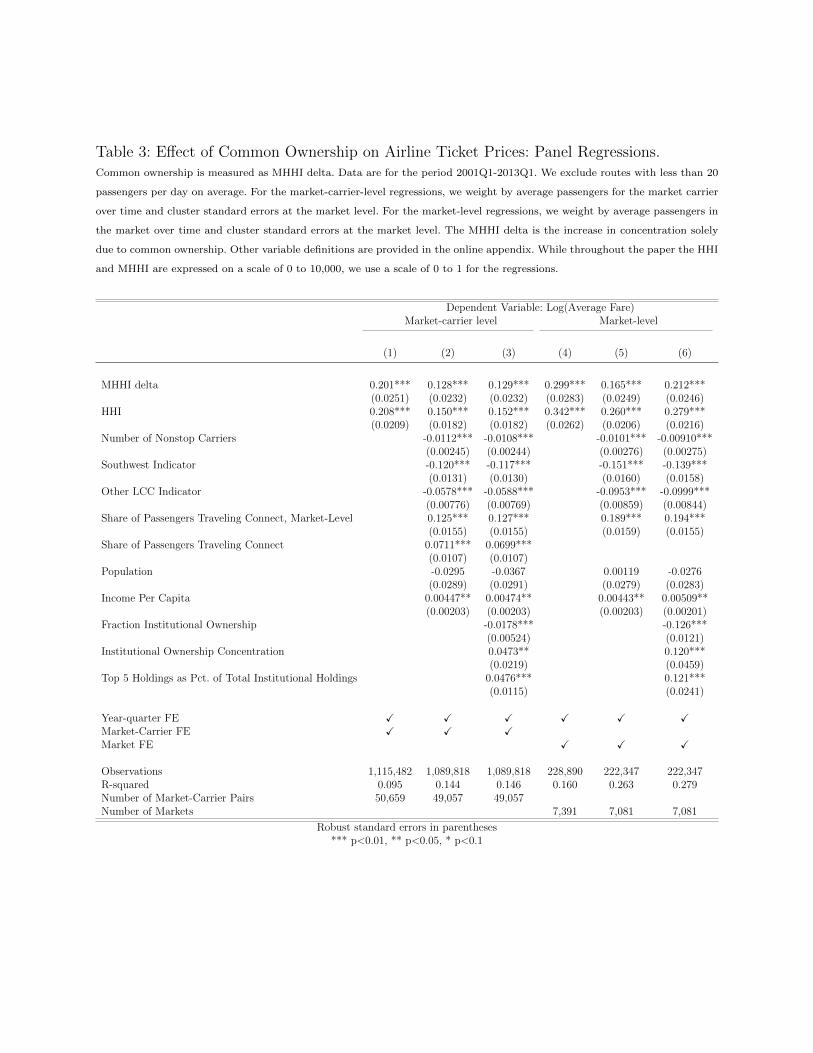
Table 3: Effect of Common Ownership on Airline Ticket Prices: Panel Regressions.Common ownership is measured as MHHI delta. Data are for the period 2001Q1-2013Q1. We exclude routes with less than 20
passengers per day on average. For the market-carrier-level regressions, we weight by average passengers for the market carrier
over time and cluster standard errors at the market level. For the market-level regressions, we weight by average passengers in
the market over time and cluster standard errors at the market level. The MHHI delta is the increase in concentration solely
due to common ownership. Other variable definitions are provided in the online appendix. While throughout the paper the HHI
and MHHI are expressed on a scale of 0 to 10,000, we use a scale of 0 to 1 for the regressions.
Dependent Variable: Log(Average Fare)Market-carrier level Market-level
(1) (2) (3) (4) (5) (6)
MHHI delta 0.201*** 0.128*** 0.129*** 0.299*** 0.165*** 0.212***(0.0251) (0.0232) (0.0232) (0.0283) (0.0249) (0.0246)
HHI 0.208*** 0.150*** 0.152*** 0.342*** 0.260*** 0.279***(0.0209) (0.0182) (0.0182) (0.0262) (0.0206) (0.0216)
Number of Nonstop Carriers -0.0112*** -0.0108*** -0.0101*** -0.00910***(0.00245) (0.00244) (0.00276) (0.00275)
Southwest Indicator -0.120*** -0.117*** -0.151*** -0.139***(0.0131) (0.0130) (0.0160) (0.0158)
Other LCC Indicator -0.0578*** -0.0588*** -0.0953*** -0.0999***(0.00776) (0.00769) (0.00859) (0.00844)
Share of Passengers Traveling Connect, Market-Level 0.125*** 0.127*** 0.189*** 0.194***(0.0155) (0.0155) (0.0159) (0.0155)
Share of Passengers Traveling Connect 0.0711*** 0.0699***(0.0107) (0.0107)
Population -0.0295 -0.0367 0.00119 -0.0276(0.0289) (0.0291) (0.0279) (0.0283)
Income Per Capita 0.00447** 0.00474** 0.00443** 0.00509**(0.00203) (0.00203) (0.00203) (0.00201)
Fraction Institutional Ownership -0.0178*** -0.126***(0.00524) (0.0121)
Institutional Ownership Concentration 0.0473** 0.120***(0.0219) (0.0459)
Top 5 Holdings as Pct. of Total Institutional Holdings 0.0476*** 0.121***(0.0115) (0.0241)
Year-quarter FE X X X X X XMarket-Carrier FE X X XMarket FE X X X
Observations 1,115,482 1,089,818 1,089,818 228,890 222,347 222,347R-squared 0.095 0.144 0.146 0.160 0.263 0.279Number of Market-Carrier Pairs 50,659 49,057 49,057Number of Markets 7,391 7,081 7,081
Robust standard errors in parentheses*** p<0.01, ** p<0.05, * p<0.1
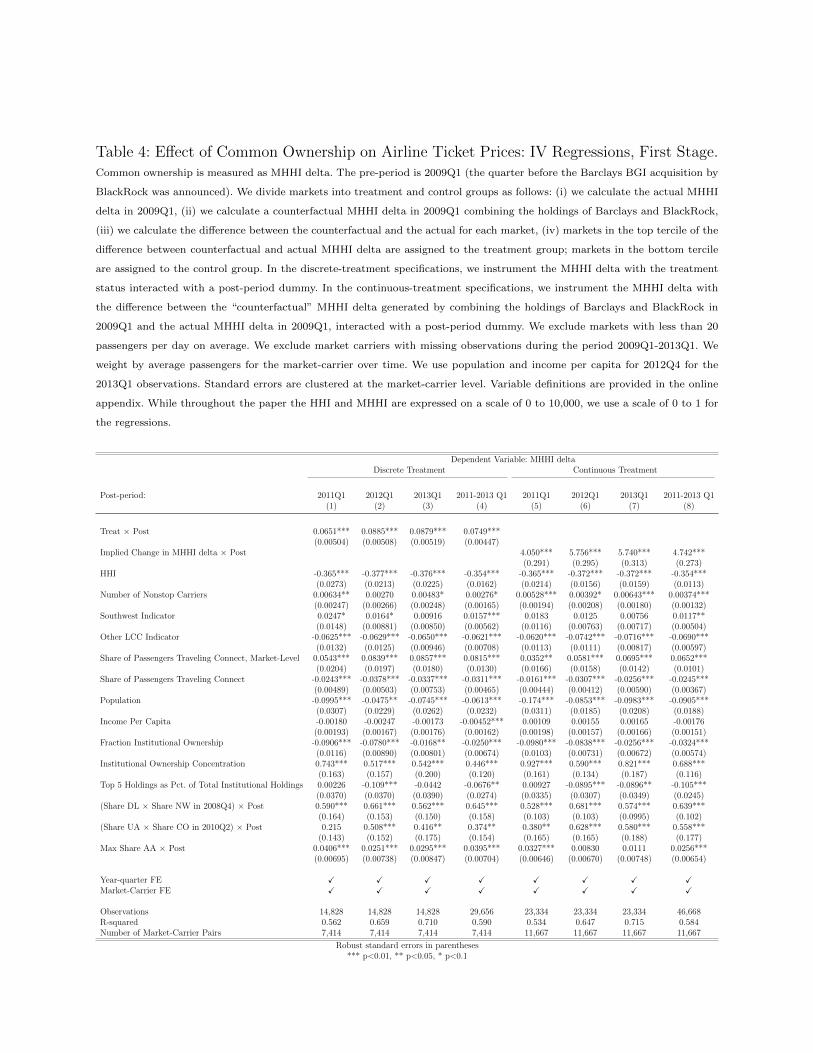
Table 4: Effect of Common Ownership on Airline Ticket Prices: IV Regressions, First Stage.Common ownership is measured as MHHI delta. The pre-period is 2009Q1 (the quarter before the Barclays BGI acquisition by
BlackRock was announced). We divide markets into treatment and control groups as follows: (i) we calculate the actual MHHI
delta in 2009Q1, (ii) we calculate a counterfactual MHHI delta in 2009Q1 combining the holdings of Barclays and BlackRock,
(iii) we calculate the difference between the counterfactual and the actual for each market, (iv) markets in the top tercile of the
difference between counterfactual and actual MHHI delta are assigned to the treatment group; markets in the bottom tercile
are assigned to the control group. In the discrete-treatment specifications, we instrument the MHHI delta with the treatment
status interacted with a post-period dummy. In the continuous-treatment specifications, we instrument the MHHI delta with
the difference between the “counterfactual” MHHI delta generated by combining the holdings of Barclays and BlackRock in
2009Q1 and the actual MHHI delta in 2009Q1, interacted with a post-period dummy. We exclude markets with less than 20
passengers per day on average. We exclude market carriers with missing observations during the period 2009Q1-2013Q1. We
weight by average passengers for the market-carrier over time. We use population and income per capita for 2012Q4 for the
2013Q1 observations. Standard errors are clustered at the market-carrier level. Variable definitions are provided in the online
appendix. While throughout the paper the HHI and MHHI are expressed on a scale of 0 to 10,000, we use a scale of 0 to 1 for
the regressions.
Dependent Variable: MHHI deltaDiscrete Treatment Continuous Treatment
Post-period: 2011Q1 2012Q1 2013Q1 2011-2013 Q1 2011Q1 2012Q1 2013Q1 2011-2013 Q1(1) (2) (3) (4) (5) (6) (7) (8)
Treat × Post 0.0651*** 0.0885*** 0.0879*** 0.0749***(0.00504) (0.00508) (0.00519) (0.00447)
Implied Change in MHHI delta × Post 4.050*** 5.756*** 5.740*** 4.742***(0.291) (0.295) (0.313) (0.273)
HHI -0.365*** -0.377*** -0.376*** -0.354*** -0.365*** -0.372*** -0.372*** -0.354***(0.0273) (0.0213) (0.0225) (0.0162) (0.0214) (0.0156) (0.0159) (0.0113)
Number of Nonstop Carriers 0.00634** 0.00270 0.00483* 0.00276* 0.00528*** 0.00392* 0.00643*** 0.00374***(0.00247) (0.00266) (0.00248) (0.00165) (0.00194) (0.00208) (0.00180) (0.00132)
Southwest Indicator 0.0247* 0.0164* 0.00916 0.0157*** 0.0183 0.0125 0.00756 0.0117**(0.0148) (0.00881) (0.00850) (0.00562) (0.0116) (0.00763) (0.00717) (0.00504)
Other LCC Indicator -0.0625*** -0.0629*** -0.0650*** -0.0621*** -0.0620*** -0.0742*** -0.0716*** -0.0690***(0.0132) (0.0125) (0.00946) (0.00708) (0.0113) (0.0111) (0.00817) (0.00597)
Share of Passengers Traveling Connect, Market-Level 0.0543*** 0.0839*** 0.0857*** 0.0815*** 0.0352** 0.0581*** 0.0695*** 0.0652***(0.0204) (0.0197) (0.0180) (0.0130) (0.0166) (0.0158) (0.0142) (0.0101)
Share of Passengers Traveling Connect -0.0243*** -0.0378*** -0.0337*** -0.0311*** -0.0161*** -0.0307*** -0.0256*** -0.0245***(0.00489) (0.00503) (0.00753) (0.00465) (0.00444) (0.00412) (0.00590) (0.00367)
Population -0.0995*** -0.0475** -0.0745*** -0.0613*** -0.174*** -0.0853*** -0.0983*** -0.0905***(0.0307) (0.0229) (0.0262) (0.0232) (0.0311) (0.0185) (0.0208) (0.0188)
Income Per Capita -0.00180 -0.00247 -0.00173 -0.00452*** 0.00109 0.00155 0.00165 -0.00176(0.00193) (0.00167) (0.00176) (0.00162) (0.00198) (0.00157) (0.00166) (0.00151)
Fraction Institutional Ownership -0.0906*** -0.0780*** -0.0168** -0.0250*** -0.0980*** -0.0838*** -0.0256*** -0.0324***(0.0116) (0.00890) (0.00801) (0.00674) (0.0103) (0.00731) (0.00672) (0.00574)
Institutional Ownership Concentration 0.743*** 0.517*** 0.542*** 0.446*** 0.927*** 0.590*** 0.821*** 0.688***(0.163) (0.157) (0.200) (0.120) (0.161) (0.134) (0.187) (0.116)
Top 5 Holdings as Pct. of Total Institutional Holdings 0.00226 -0.109*** -0.0442 -0.0676** 0.00927 -0.0895*** -0.0896** -0.105***(0.0370) (0.0370) (0.0390) (0.0274) (0.0335) (0.0307) (0.0349) (0.0245)
(Share DL × Share NW in 2008Q4) × Post 0.590*** 0.661*** 0.562*** 0.645*** 0.528*** 0.681*** 0.574*** 0.639***(0.164) (0.153) (0.150) (0.158) (0.103) (0.103) (0.0995) (0.102)
(Share UA × Share CO in 2010Q2) × Post 0.215 0.508*** 0.416** 0.374** 0.380** 0.628*** 0.580*** 0.558***(0.143) (0.152) (0.175) (0.154) (0.165) (0.165) (0.188) (0.177)
Max Share AA × Post 0.0406*** 0.0251*** 0.0295*** 0.0395*** 0.0327*** 0.00830 0.0111 0.0256***(0.00695) (0.00738) (0.00847) (0.00704) (0.00646) (0.00670) (0.00748) (0.00654)
Year-quarter FE X X X X X X X XMarket-Carrier FE X X X X X X X X
Observations 14,828 14,828 14,828 29,656 23,334 23,334 23,334 46,668R-squared 0.562 0.659 0.710 0.590 0.534 0.647 0.715 0.584Number of Market-Carrier Pairs 7,414 7,414 7,414 7,414 11,667 11,667 11,667 11,667
Robust standard errors in parentheses*** p<0.01, ** p<0.05, * p<0.1
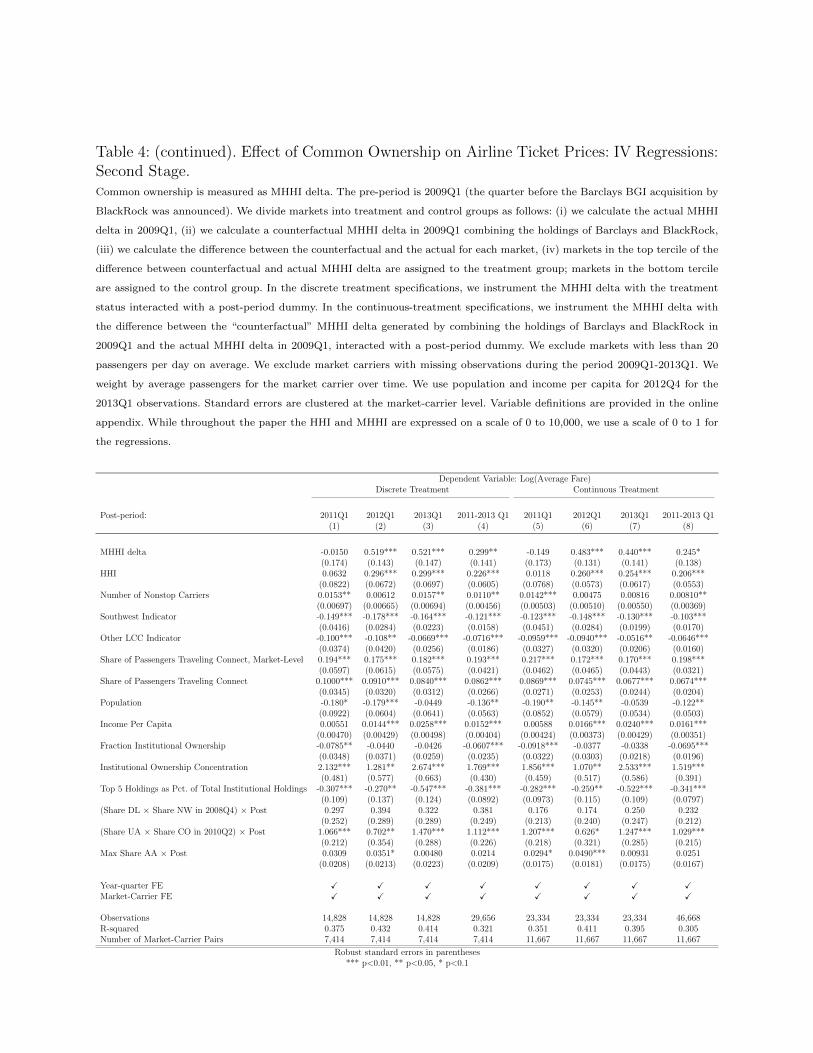
Table 4: (continued). Effect of Common Ownership on Airline Ticket Prices: IV Regressions:Second Stage.Common ownership is measured as MHHI delta. The pre-period is 2009Q1 (the quarter before the Barclays BGI acquisition by
BlackRock was announced). We divide markets into treatment and control groups as follows: (i) we calculate the actual MHHI
delta in 2009Q1, (ii) we calculate a counterfactual MHHI delta in 2009Q1 combining the holdings of Barclays and BlackRock,
(iii) we calculate the difference between the counterfactual and the actual for each market, (iv) markets in the top tercile of the
difference between counterfactual and actual MHHI delta are assigned to the treatment group; markets in the bottom tercile
are assigned to the control group. In the discrete treatment specifications, we instrument the MHHI delta with the treatment
status interacted with a post-period dummy. In the continuous-treatment specifications, we instrument the MHHI delta with
the difference between the “counterfactual” MHHI delta generated by combining the holdings of Barclays and BlackRock in
2009Q1 and the actual MHHI delta in 2009Q1, interacted with a post-period dummy. We exclude markets with less than 20
passengers per day on average. We exclude market carriers with missing observations during the period 2009Q1-2013Q1. We
weight by average passengers for the market carrier over time. We use population and income per capita for 2012Q4 for the
2013Q1 observations. Standard errors are clustered at the market-carrier level. Variable definitions are provided in the online
appendix. While throughout the paper the HHI and MHHI are expressed on a scale of 0 to 10,000, we use a scale of 0 to 1 for
the regressions.
Dependent Variable: Log(Average Fare)Discrete Treatment Continuous Treatment
Post-period: 2011Q1 2012Q1 2013Q1 2011-2013 Q1 2011Q1 2012Q1 2013Q1 2011-2013 Q1(1) (2) (3) (4) (5) (6) (7) (8)
MHHI delta -0.0150 0.519*** 0.521*** 0.299** -0.149 0.483*** 0.440*** 0.245*(0.174) (0.143) (0.147) (0.141) (0.173) (0.131) (0.141) (0.138)
HHI 0.0632 0.296*** 0.299*** 0.226*** 0.0118 0.260*** 0.254*** 0.206***(0.0822) (0.0672) (0.0697) (0.0605) (0.0768) (0.0573) (0.0617) (0.0553)
Number of Nonstop Carriers 0.0153** 0.00612 0.0157** 0.0110** 0.0142*** 0.00475 0.00816 0.00810**(0.00697) (0.00665) (0.00694) (0.00456) (0.00503) (0.00510) (0.00550) (0.00369)
Southwest Indicator -0.149*** -0.178*** -0.164*** -0.121*** -0.123*** -0.148*** -0.130*** -0.103***(0.0416) (0.0284) (0.0223) (0.0158) (0.0451) (0.0284) (0.0199) (0.0170)
Other LCC Indicator -0.100*** -0.108** -0.0669*** -0.0716*** -0.0959*** -0.0940*** -0.0516** -0.0646***(0.0374) (0.0420) (0.0256) (0.0186) (0.0327) (0.0320) (0.0206) (0.0160)
Share of Passengers Traveling Connect, Market-Level 0.194*** 0.175*** 0.182*** 0.193*** 0.217*** 0.172*** 0.170*** 0.198***(0.0597) (0.0615) (0.0575) (0.0421) (0.0462) (0.0465) (0.0443) (0.0321)
Share of Passengers Traveling Connect 0.1000*** 0.0910*** 0.0840*** 0.0862*** 0.0869*** 0.0745*** 0.0677*** 0.0674***(0.0345) (0.0320) (0.0312) (0.0266) (0.0271) (0.0253) (0.0244) (0.0204)
Population -0.180* -0.179*** -0.0449 -0.136** -0.190** -0.145** -0.0539 -0.122**(0.0922) (0.0604) (0.0641) (0.0563) (0.0852) (0.0579) (0.0534) (0.0503)
Income Per Capita 0.00551 0.0144*** 0.0258*** 0.0152*** 0.00588 0.0166*** 0.0240*** 0.0161***(0.00470) (0.00429) (0.00498) (0.00404) (0.00424) (0.00373) (0.00429) (0.00351)
Fraction Institutional Ownership -0.0785** -0.0440 -0.0426 -0.0607*** -0.0918*** -0.0377 -0.0338 -0.0695***(0.0348) (0.0371) (0.0259) (0.0235) (0.0322) (0.0303) (0.0218) (0.0196)
Institutional Ownership Concentration 2.132*** 1.281** 2.674*** 1.769*** 1.856*** 1.070** 2.533*** 1.519***(0.481) (0.577) (0.663) (0.430) (0.459) (0.517) (0.586) (0.391)
Top 5 Holdings as Pct. of Total Institutional Holdings -0.307*** -0.270** -0.547*** -0.381*** -0.282*** -0.259** -0.522*** -0.341***(0.109) (0.137) (0.124) (0.0892) (0.0973) (0.115) (0.109) (0.0797)
(Share DL × Share NW in 2008Q4) × Post 0.297 0.394 0.322 0.381 0.176 0.174 0.250 0.232(0.252) (0.289) (0.289) (0.249) (0.213) (0.240) (0.247) (0.212)
(Share UA × Share CO in 2010Q2) × Post 1.066*** 0.702** 1.470*** 1.112*** 1.207*** 0.626* 1.247*** 1.029***(0.212) (0.354) (0.288) (0.226) (0.218) (0.321) (0.285) (0.215)
Max Share AA × Post 0.0309 0.0351* 0.00480 0.0214 0.0294* 0.0490*** 0.00931 0.0251(0.0208) (0.0213) (0.0223) (0.0209) (0.0175) (0.0181) (0.0175) (0.0167)
Year-quarter FE X X X X X X X XMarket-Carrier FE X X X X X X X X
Observations 14,828 14,828 14,828 29,656 23,334 23,334 23,334 46,668R-squared 0.375 0.432 0.414 0.321 0.351 0.411 0.395 0.305Number of Market-Carrier Pairs 7,414 7,414 7,414 7,414 11,667 11,667 11,667 11,667
Robust standard errors in parentheses*** p<0.01, ** p<0.05, * p<0.1
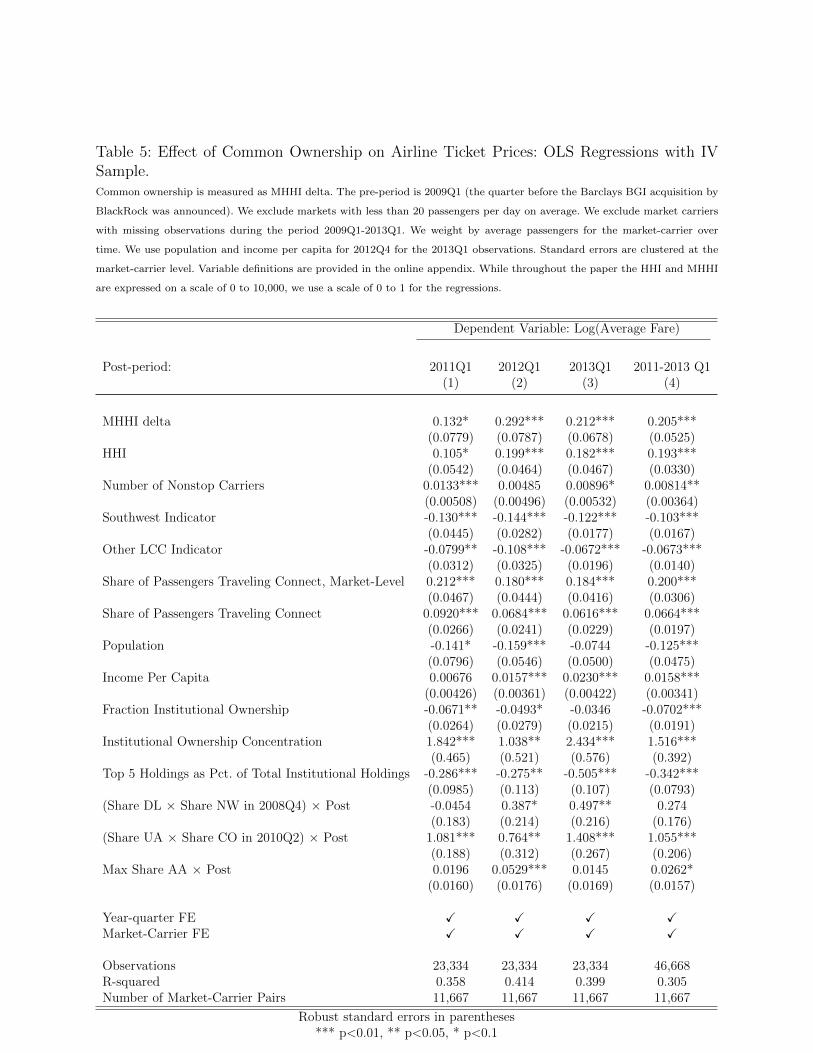
Table 5: Effect of Common Ownership on Airline Ticket Prices: OLS Regressions with IVSample.Common ownership is measured as MHHI delta. The pre-period is 2009Q1 (the quarter before the Barclays BGI acquisition by
BlackRock was announced). We exclude markets with less than 20 passengers per day on average. We exclude market carriers
with missing observations during the period 2009Q1-2013Q1. We weight by average passengers for the market-carrier over
time. We use population and income per capita for 2012Q4 for the 2013Q1 observations. Standard errors are clustered at the
market-carrier level. Variable definitions are provided in the online appendix. While throughout the paper the HHI and MHHI
are expressed on a scale of 0 to 10,000, we use a scale of 0 to 1 for the regressions.
Dependent Variable: Log(Average Fare)
Post-period: 2011Q1 2012Q1 2013Q1 2011-2013 Q1(1) (2) (3) (4)
MHHI delta 0.132* 0.292*** 0.212*** 0.205***(0.0779) (0.0787) (0.0678) (0.0525)
HHI 0.105* 0.199*** 0.182*** 0.193***(0.0542) (0.0464) (0.0467) (0.0330)
Number of Nonstop Carriers 0.0133*** 0.00485 0.00896* 0.00814**(0.00508) (0.00496) (0.00532) (0.00364)
Southwest Indicator -0.130*** -0.144*** -0.122*** -0.103***(0.0445) (0.0282) (0.0177) (0.0167)
Other LCC Indicator -0.0799** -0.108*** -0.0672*** -0.0673***(0.0312) (0.0325) (0.0196) (0.0140)
Share of Passengers Traveling Connect, Market-Level 0.212*** 0.180*** 0.184*** 0.200***(0.0467) (0.0444) (0.0416) (0.0306)
Share of Passengers Traveling Connect 0.0920*** 0.0684*** 0.0616*** 0.0664***(0.0266) (0.0241) (0.0229) (0.0197)
Population -0.141* -0.159*** -0.0744 -0.125***(0.0796) (0.0546) (0.0500) (0.0475)
Income Per Capita 0.00676 0.0157*** 0.0230*** 0.0158***(0.00426) (0.00361) (0.00422) (0.00341)
Fraction Institutional Ownership -0.0671** -0.0493* -0.0346 -0.0702***(0.0264) (0.0279) (0.0215) (0.0191)
Institutional Ownership Concentration 1.842*** 1.038** 2.434*** 1.516***(0.465) (0.521) (0.576) (0.392)
Top 5 Holdings as Pct. of Total Institutional Holdings -0.286*** -0.275** -0.505*** -0.342***(0.0985) (0.113) (0.107) (0.0793)
(Share DL × Share NW in 2008Q4) × Post -0.0454 0.387* 0.497** 0.274(0.183) (0.214) (0.216) (0.176)
(Share UA × Share CO in 2010Q2) × Post 1.081*** 0.764** 1.408*** 1.055***(0.188) (0.312) (0.267) (0.206)
Max Share AA × Post 0.0196 0.0529*** 0.0145 0.0262*(0.0160) (0.0176) (0.0169) (0.0157)
Year-quarter FE X X X XMarket-Carrier FE X X X X
Observations 23,334 23,334 23,334 46,668R-squared 0.358 0.414 0.399 0.305Number of Market-Carrier Pairs 11,667 11,667 11,667 11,667
Robust standard errors in parentheses*** p<0.01, ** p<0.05, * p<0.1
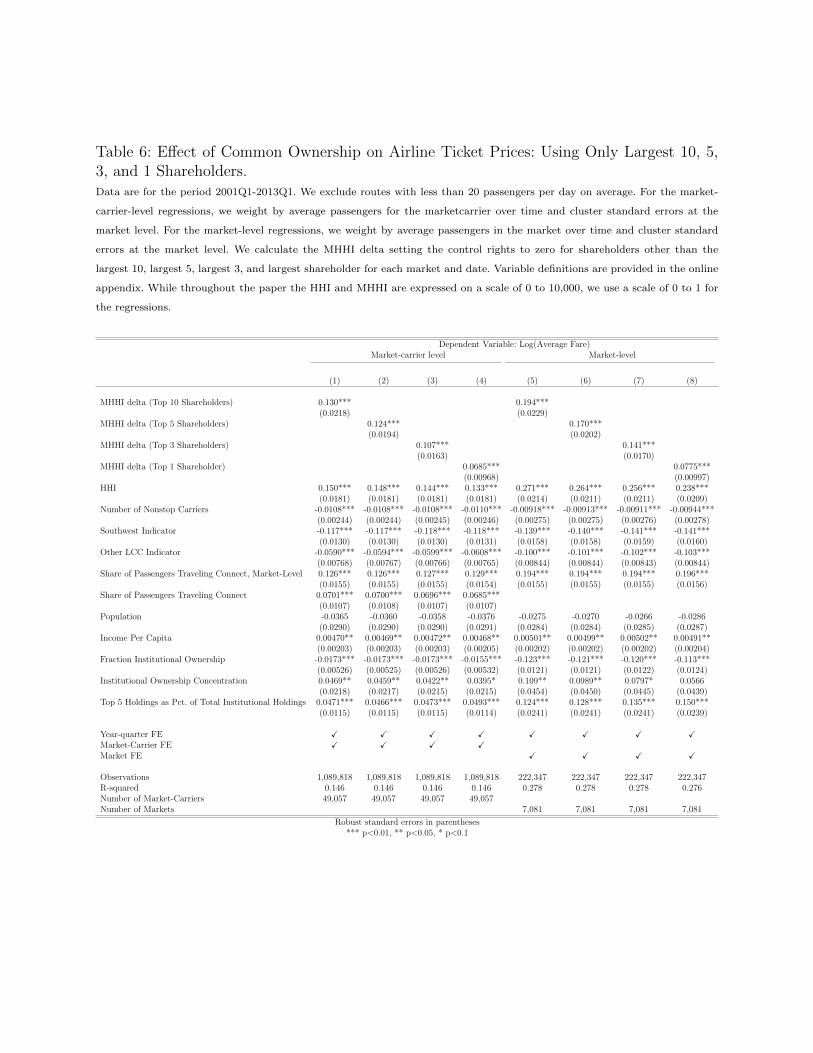
Table 6: Effect of Common Ownership on Airline Ticket Prices: Using Only Largest 10, 5,3, and 1 Shareholders.Data are for the period 2001Q1-2013Q1. We exclude routes with less than 20 passengers per day on average. For the market-
carrier-level regressions, we weight by average passengers for the marketcarrier over time and cluster standard errors at the
market level. For the market-level regressions, we weight by average passengers in the market over time and cluster standard
errors at the market level. We calculate the MHHI delta setting the control rights to zero for shareholders other than the
largest 10, largest 5, largest 3, and largest shareholder for each market and date. Variable definitions are provided in the online
appendix. While throughout the paper the HHI and MHHI are expressed on a scale of 0 to 10,000, we use a scale of 0 to 1 for
the regressions.
Dependent Variable: Log(Average Fare)Market-carrier level Market-level
(1) (2) (3) (4) (5) (6) (7) (8)
MHHI delta (Top 10 Shareholders) 0.130*** 0.194***(0.0218) (0.0229)
MHHI delta (Top 5 Shareholders) 0.124*** 0.170***(0.0194) (0.0202)
MHHI delta (Top 3 Shareholders) 0.107*** 0.141***(0.0163) (0.0170)
MHHI delta (Top 1 Shareholder) 0.0685*** 0.0775***(0.00968) (0.00997)
HHI 0.150*** 0.148*** 0.144*** 0.133*** 0.271*** 0.264*** 0.256*** 0.238***(0.0181) (0.0181) (0.0181) (0.0181) (0.0214) (0.0211) (0.0211) (0.0209)
Number of Nonstop Carriers -0.0108*** -0.0108*** -0.0108*** -0.0110*** -0.00918*** -0.00913*** -0.00911*** -0.00944***(0.00244) (0.00244) (0.00245) (0.00246) (0.00275) (0.00275) (0.00276) (0.00278)
Southwest Indicator -0.117*** -0.117*** -0.118*** -0.118*** -0.139*** -0.140*** -0.141*** -0.141***(0.0130) (0.0130) (0.0130) (0.0131) (0.0158) (0.0158) (0.0159) (0.0160)
Other LCC Indicator -0.0590*** -0.0594*** -0.0599*** -0.0608*** -0.100*** -0.101*** -0.102*** -0.103***(0.00768) (0.00767) (0.00766) (0.00765) (0.00844) (0.00844) (0.00843) (0.00844)
Share of Passengers Traveling Connect, Market-Level 0.126*** 0.126*** 0.127*** 0.129*** 0.194*** 0.194*** 0.194*** 0.196***(0.0155) (0.0155) (0.0155) (0.0154) (0.0155) (0.0155) (0.0155) (0.0156)
Share of Passengers Traveling Connect 0.0701*** 0.0700*** 0.0696*** 0.0685***(0.0107) (0.0108) (0.0107) (0.0107)
Population -0.0365 -0.0360 -0.0358 -0.0376 -0.0275 -0.0270 -0.0266 -0.0286(0.0290) (0.0290) (0.0290) (0.0291) (0.0284) (0.0284) (0.0285) (0.0287)
Income Per Capita 0.00470** 0.00469** 0.00472** 0.00468** 0.00501** 0.00499** 0.00502** 0.00491**(0.00203) (0.00203) (0.00203) (0.00205) (0.00202) (0.00202) (0.00202) (0.00204)
Fraction Institutional Ownership -0.0173*** -0.0173*** -0.0173*** -0.0155*** -0.123*** -0.121*** -0.120*** -0.113***(0.00526) (0.00525) (0.00526) (0.00532) (0.0121) (0.0121) (0.0122) (0.0124)
Institutional Ownership Concentration 0.0469** 0.0459** 0.0422** 0.0395* 0.109** 0.0989** 0.0797* 0.0566(0.0218) (0.0217) (0.0215) (0.0215) (0.0454) (0.0450) (0.0445) (0.0439)
Top 5 Holdings as Pct. of Total Institutional Holdings 0.0471*** 0.0466*** 0.0473*** 0.0493*** 0.124*** 0.128*** 0.135*** 0.150***(0.0115) (0.0115) (0.0115) (0.0114) (0.0241) (0.0241) (0.0241) (0.0239)
Year-quarter FE X X X X X X X XMarket-Carrier FE X X X XMarket FE X X X X
Observations 1,089,818 1,089,818 1,089,818 1,089,818 222,347 222,347 222,347 222,347R-squared 0.146 0.146 0.146 0.146 0.278 0.278 0.278 0.276Number of Market-Carriers 49,057 49,057 49,057 49,057Number of Markets 7,081 7,081 7,081 7,081
Robust standard errors in parentheses*** p<0.01, ** p<0.05, * p<0.1
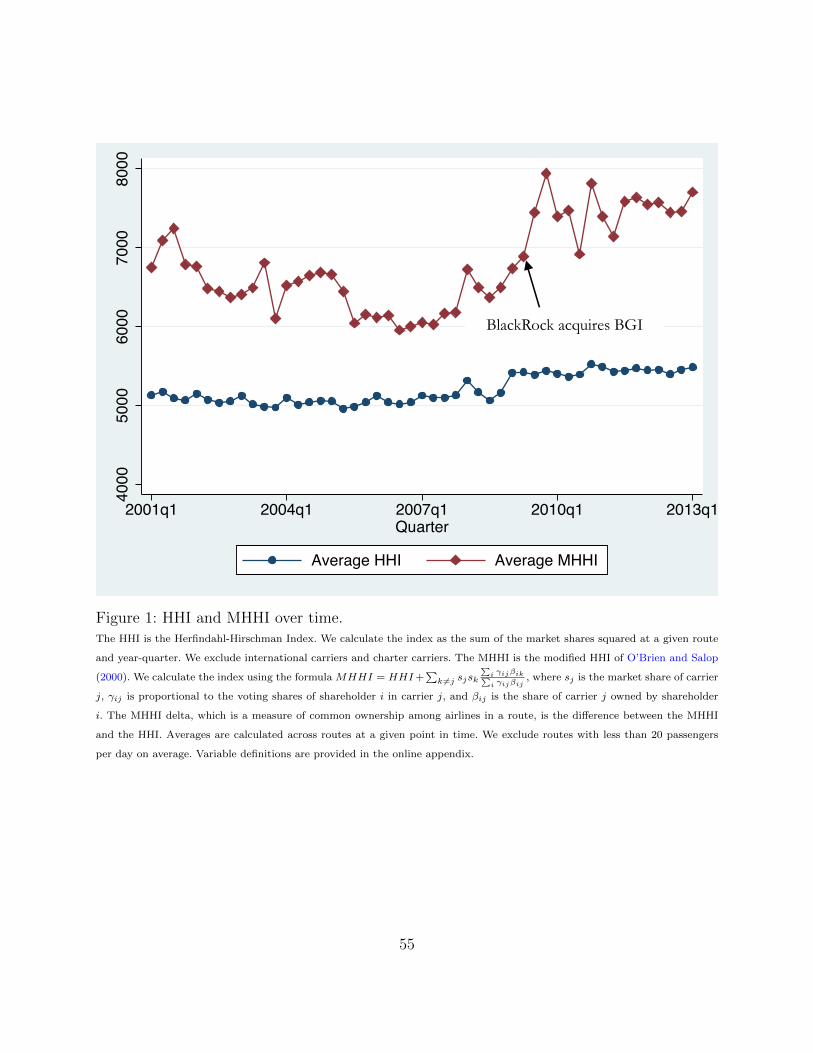
4000
5000
6000
7000
8000
2001q1 2004q1 2007q1 2010q1 2013q1Quarter
Average HHI Average MHHI
BlackRock acquires BGI
Figure 1: HHI and MHHI over time.The HHI is the Herfindahl-Hirschman Index. We calculate the index as the sum of the market shares squared at a given route
and year-quarter. We exclude international carriers and charter carriers. The MHHI is the modified HHI of O’Brien and Salop
(2000). We calculate the index using the formula MHHI = HHI+∑k 6=j sjsk
∑i γijβik∑i γijβij
, where sj is the market share of carrier
j, γij is proportional to the voting shares of shareholder i in carrier j, and βij is the share of carrier j owned by shareholder
i. The MHHI delta, which is a measure of common ownership among airlines in a route, is the difference between the MHHI
and the HHI. Averages are calculated across routes at a given point in time. We exclude routes with less than 20 passengers
per day on average. Variable definitions are provided in the online appendix.
55
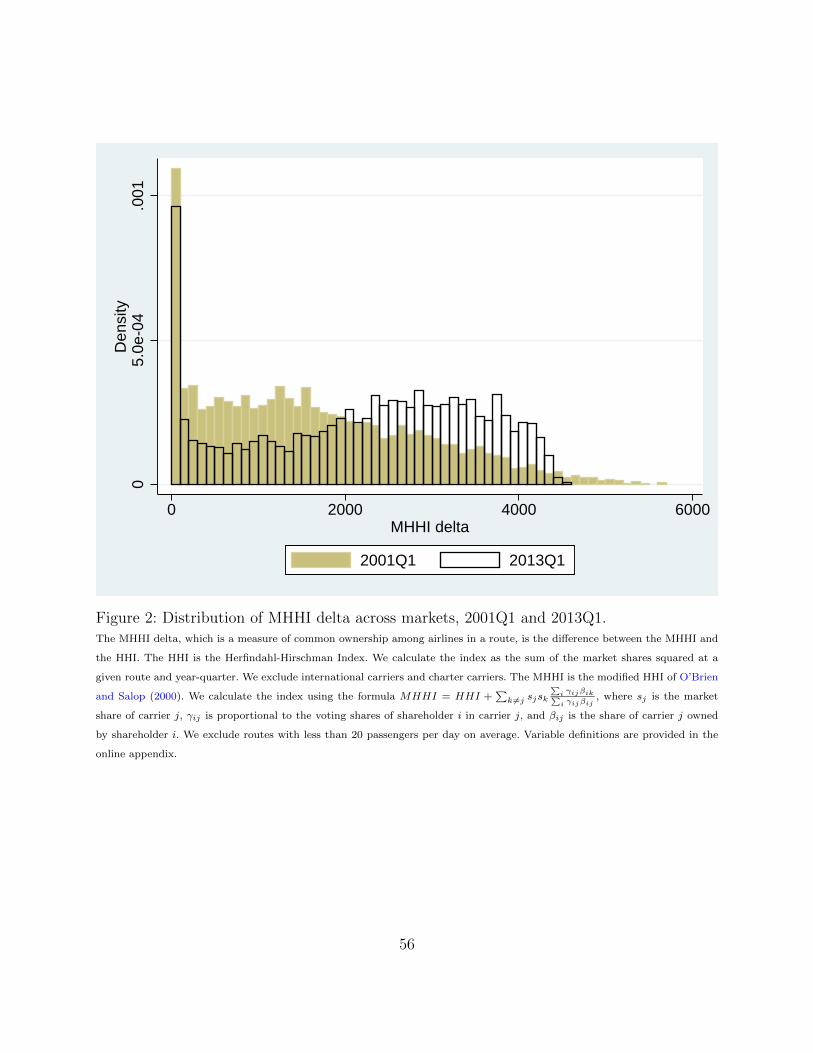
05.
0e-0
4.0
01D
ensi
ty
0 2000 4000 6000MHHI delta
2001Q1 2013Q1
Figure 2: Distribution of MHHI delta across markets, 2001Q1 and 2013Q1.The MHHI delta, which is a measure of common ownership among airlines in a route, is the difference between the MHHI and
the HHI. The HHI is the Herfindahl-Hirschman Index. We calculate the index as the sum of the market shares squared at a
given route and year-quarter. We exclude international carriers and charter carriers. The MHHI is the modified HHI of O’Brien
and Salop (2000). We calculate the index using the formula MHHI = HHI +∑k 6=j sjsk
∑i γijβik∑i γijβij
, where sj is the market
share of carrier j, γij is proportional to the voting shares of shareholder i in carrier j, and βij is the share of carrier j owned
by shareholder i. We exclude routes with less than 20 passengers per day on average. Variable definitions are provided in the
online appendix.
56
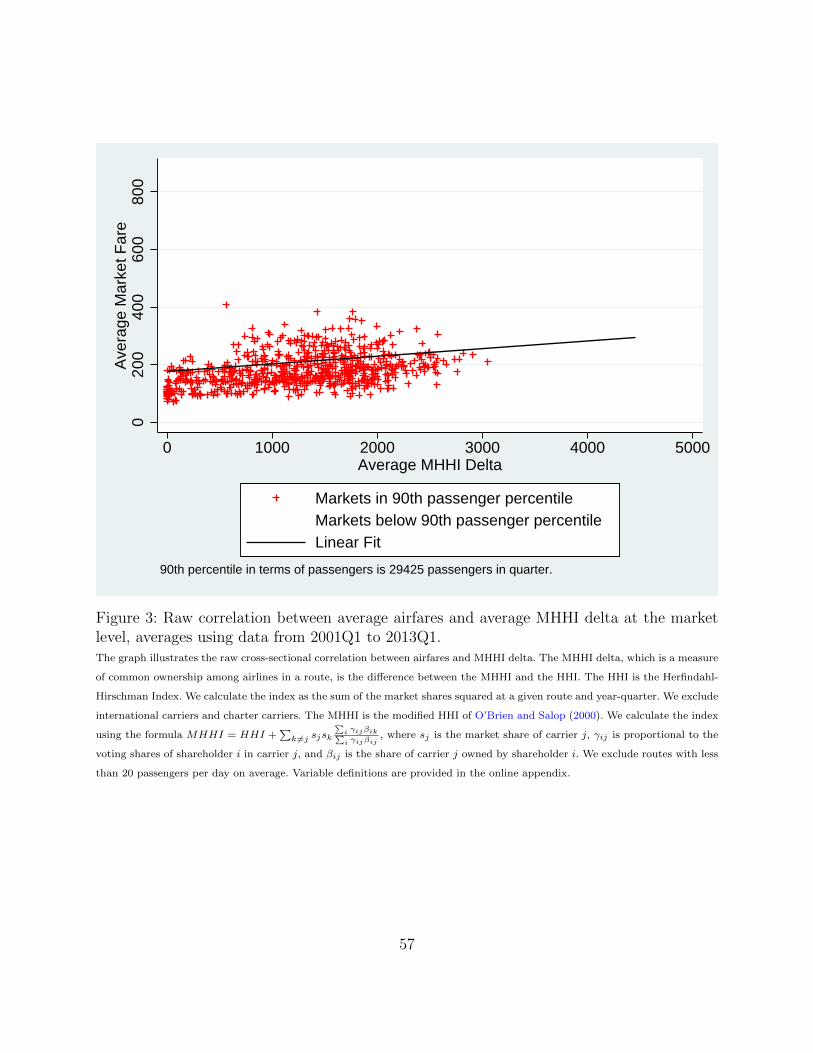
020
040
060
080
0A
vera
ge M
arke
t Far
e
0 1000 2000 3000 4000 5000Average MHHI Delta
Markets in 90th passenger percentileMarkets below 90th passenger percentileLinear Fit
90th percentile in terms of passengers is 29425 passengers in quarter.
Figure 3: Raw correlation between average airfares and average MHHI delta at the marketlevel, averages using data from 2001Q1 to 2013Q1.The graph illustrates the raw cross-sectional correlation between airfares and MHHI delta. The MHHI delta, which is a measure
of common ownership among airlines in a route, is the difference between the MHHI and the HHI. The HHI is the Herfindahl-
Hirschman Index. We calculate the index as the sum of the market shares squared at a given route and year-quarter. We exclude
international carriers and charter carriers. The MHHI is the modified HHI of O’Brien and Salop (2000). We calculate the index
using the formula MHHI = HHI +∑k 6=j sjsk
∑i γijβik∑i γijβij
, where sj is the market share of carrier j, γij is proportional to the
voting shares of shareholder i in carrier j, and βij is the share of carrier j owned by shareholder i. We exclude routes with less
than 20 passengers per day on average. Variable definitions are provided in the online appendix.
57
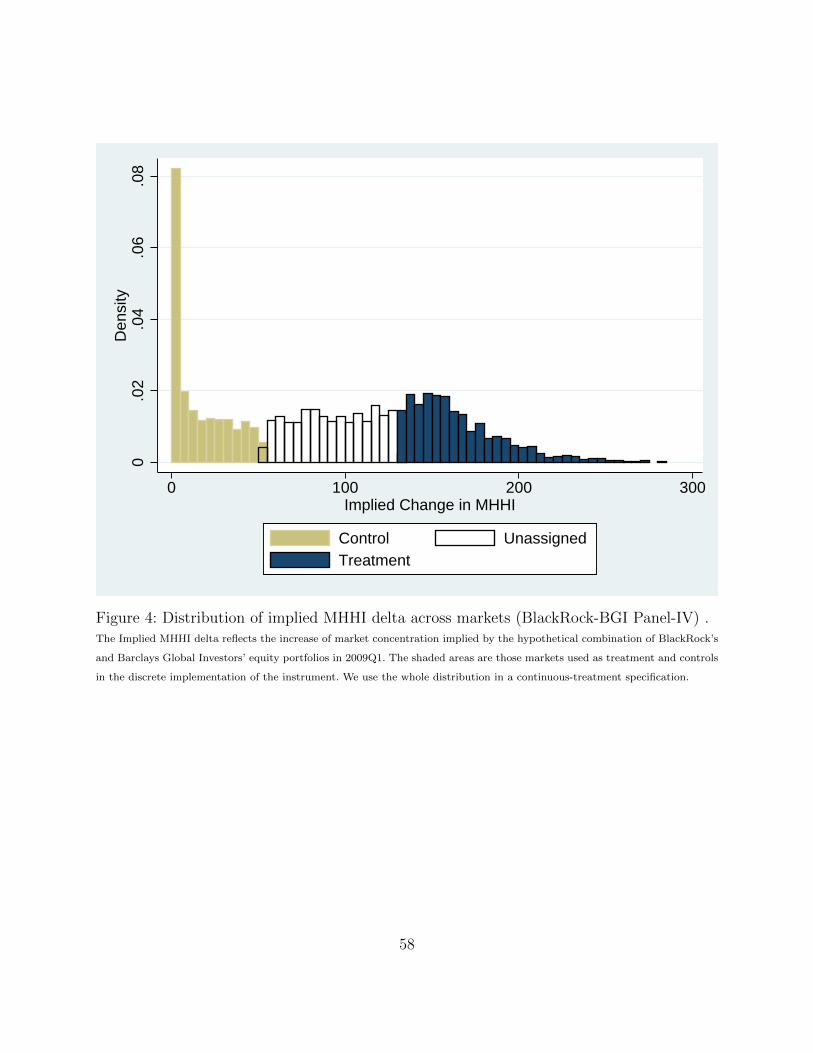
0.0
2.0
4.0
6.0
8D
ensi
ty
0 100 200 300Implied Change in MHHI
Control UnassignedTreatment
Figure 4: Distribution of implied MHHI delta across markets (BlackRock-BGI Panel-IV) .The Implied MHHI delta reflects the increase of market concentration implied by the hypothetical combination of BlackRock’s
and Barclays Global Investors’ equity portfolios in 2009Q1. The shaded areas are those markets used as treatment and controls
in the discrete implementation of the instrument. We use the whole distribution in a continuous-treatment specification.
58
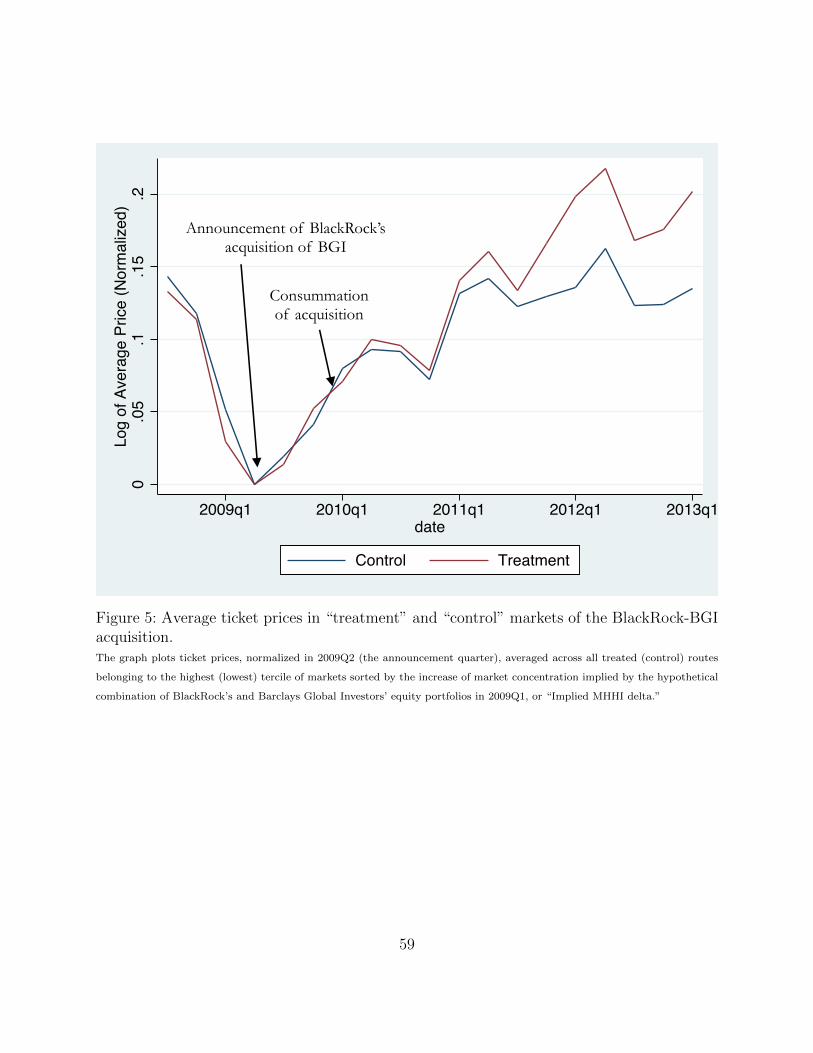
0.0
5.1
.15
.2Lo
g of
Ave
rage
Pric
e (N
orm
aliz
ed)
2009q1 2010q1 2011q1 2012q1 2013q1date
Control Treatment
Consummation of acquisition
Announcement of BlackRock’s acquisition of BGI
Figure 5: Average ticket prices in “treatment” and “control” markets of the BlackRock-BGIacquisition.The graph plots ticket prices, normalized in 2009Q2 (the announcement quarter), averaged across all treated (control) routes
belonging to the highest (lowest) tercile of markets sorted by the increase of market concentration implied by the hypothetical
combination of BlackRock’s and Barclays Global Investors’ equity portfolios in 2009Q1, or “Implied MHHI delta.”
59