Embed Size (px)
Citation preview
Anti-Hypertensive Drug Demand in Latin America
William H. Dow
University of California, Berkeley
January 2009
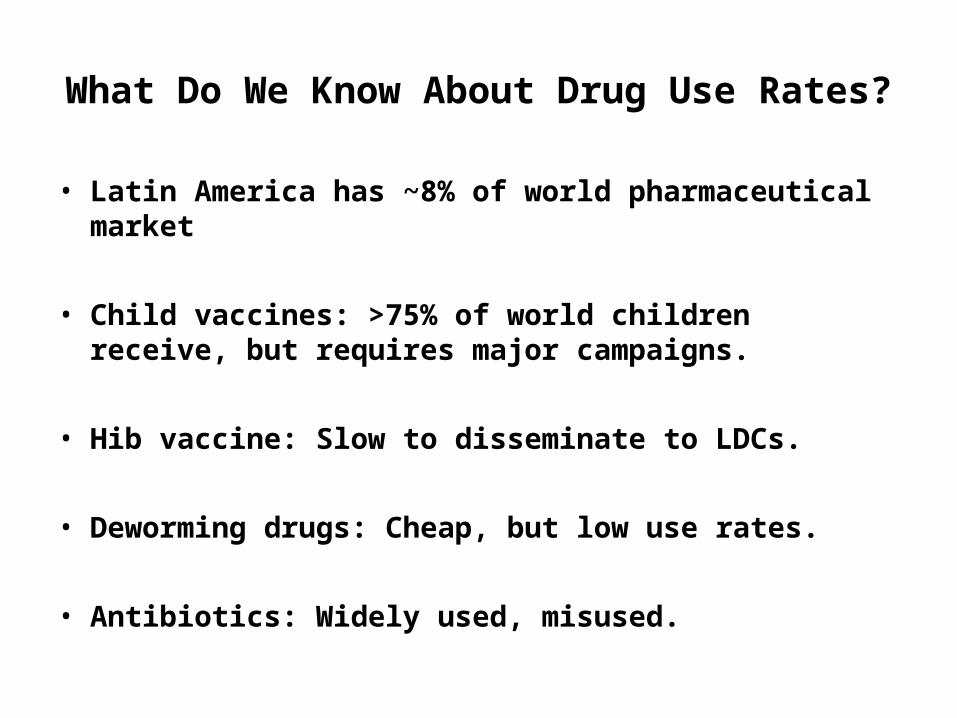
What Do We Know About Drug Use Rates?
• Latin America has ~8% of world pharmaceutical market
• Child vaccines: >75% of world children receive, but requires major campaigns.
• Hib vaccine: Slow to disseminate to LDCs.
• Deworming drugs: Cheap, but low use rates.
• Antibiotics: Widely used, misused.
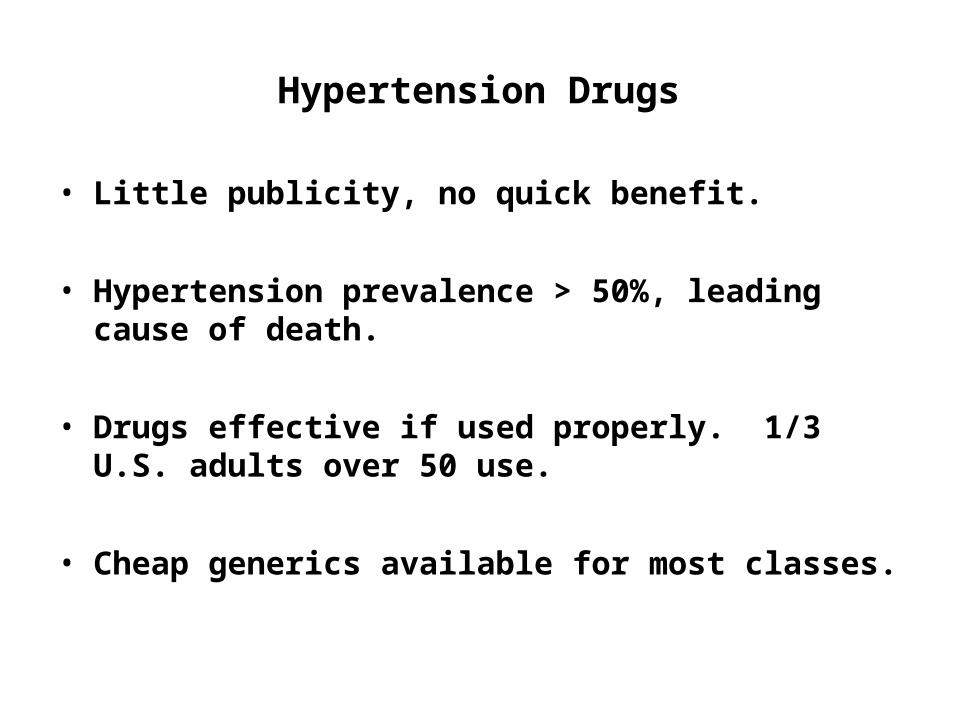
Hypertension Drugs
• Little publicity, no quick benefit.
• Hypertension prevalence > 50%, leading cause of death.
• Drugs effective if used properly. 1/3 U.S. adults over 50 use.
• Cheap generics available for most classes.
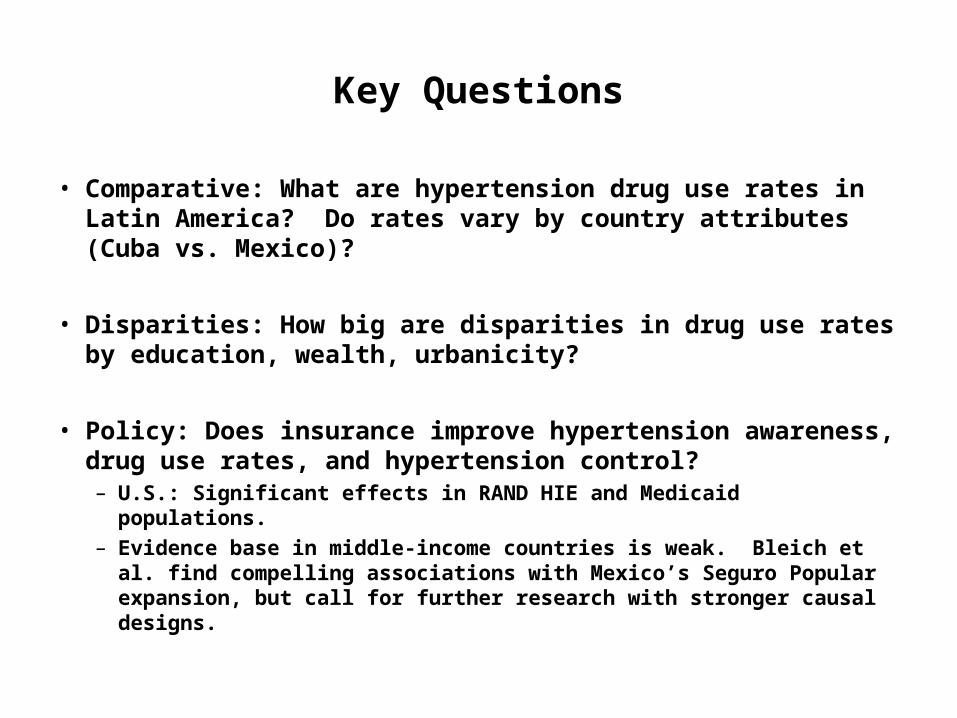
Key Questions
• Comparative: What are hypertension drug use rates in Latin America? Do rates vary by country attributes (Cuba vs. Mexico)?
• Disparities: How big are disparities in drug use rates by education, wealth, urbanicity?
• Policy: Does insurance improve hypertension awareness, drug use rates, and hypertension control?– U.S.: Significant effects in RAND HIE and Medicaid populations.– Evidence base in middle-income countries is weak. Bleich et al. find
compelling associations with Mexico’s Seguro Popular expansion, but call for further research with stronger causal designs.
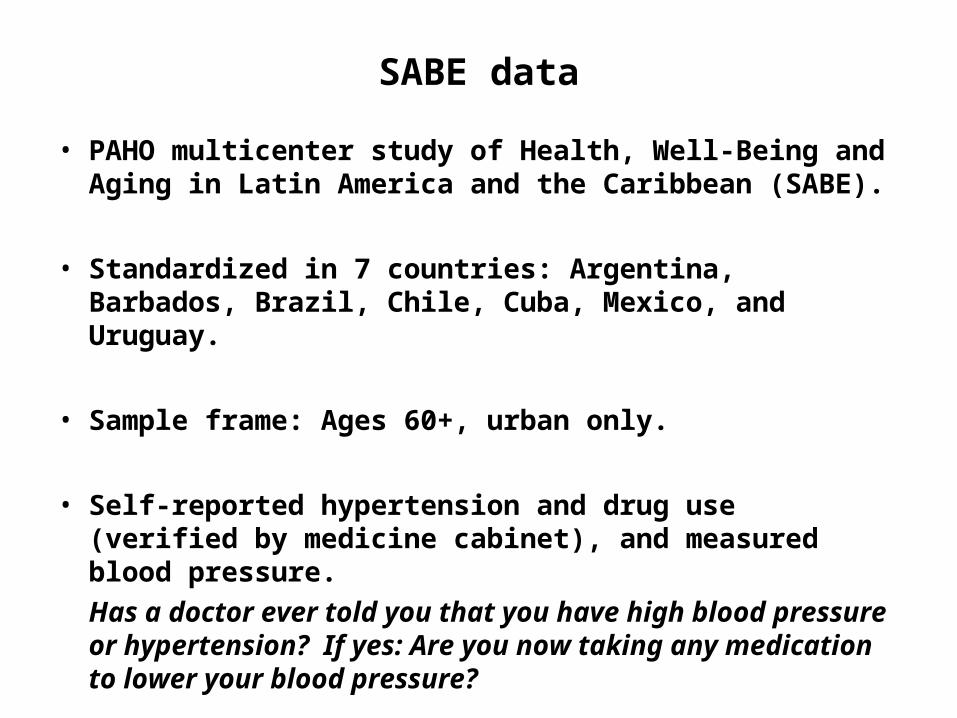
SABE data
• PAHO multicenter study of Health, Well-Being and Aging in Latin America and the Caribbean (SABE).
• Standardized in 7 countries: Argentina, Barbados, Brazil, Chile, Cuba, Mexico, and Uruguay.
• Sample frame: Ages 60+, urban only.
• Self-reported hypertension and drug use (verified by medicine cabinet), and measured blood pressure.
Has a doctor ever told you that you have high blood pressure or hypertension? If yes: Are you now taking any medication to lower your blood pressure?
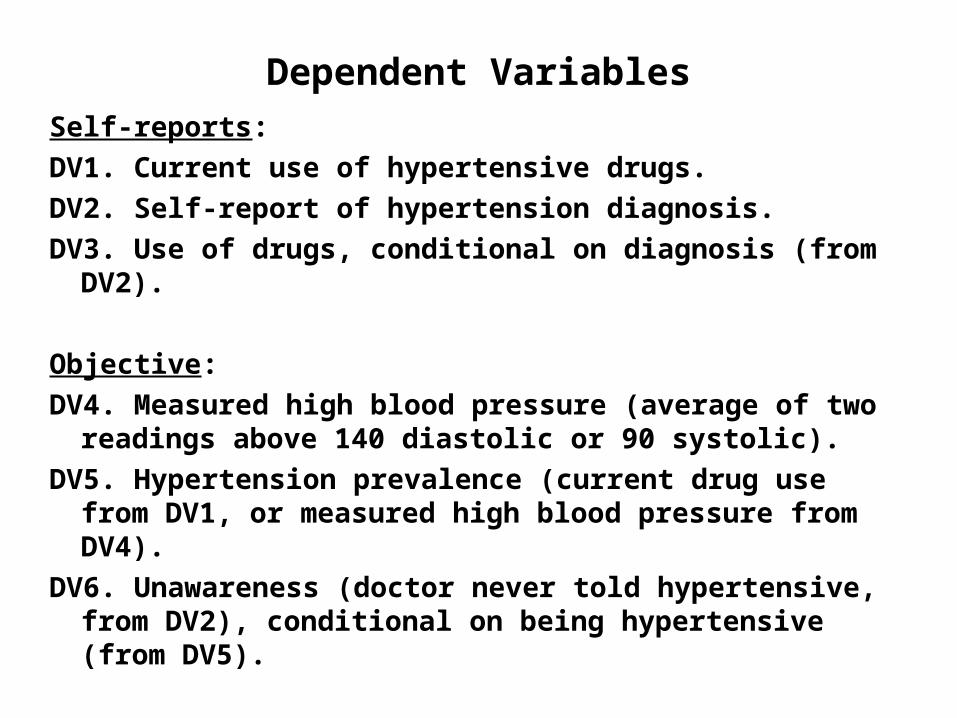
Dependent Variables
Self-reports:
DV1. Current use of hypertensive drugs.
DV2. Self-report of hypertension diagnosis.
DV3. Use of drugs, conditional on diagnosis (from DV2).
Objective:
DV4. Measured high blood pressure (average of two readings above 140 diastolic or 90 systolic).
DV5. Hypertension prevalence (current drug use from DV1, or measured high blood pressure from DV4).
DV6. Unawareness (doctor never told hypertensive, from DV2), conditional on being hypertensive (from DV5).
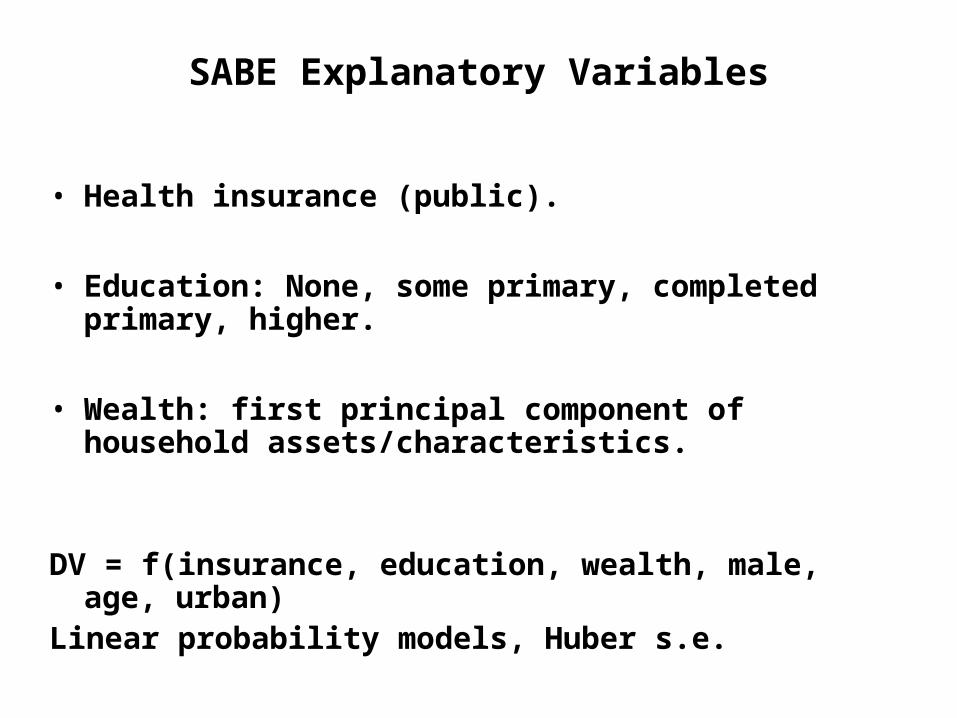
SABE Explanatory Variables
• Health insurance (public).
• Education: None, some primary, completed primary, higher.
• Wealth: first principal component of household assets/characteristics.
DV = f(insurance, education, wealth, male, age, urban)Linear probability models, Huber s.e.

Costa Rican CRELES Data
• Nationally representative survey in 2005 of 2,800 Costa Ricans ages 60+. – 2005 data may be slightly higher drug use from secular trends, but
not by much.
– Only use urban sample for this paper.
• Drug utilization measured from “medicine cabinet” (may bias up or down). – Modify drug coding to exclude drugs from anti-hypertensive
definition if person did not self-report a hypertension diagnosis.
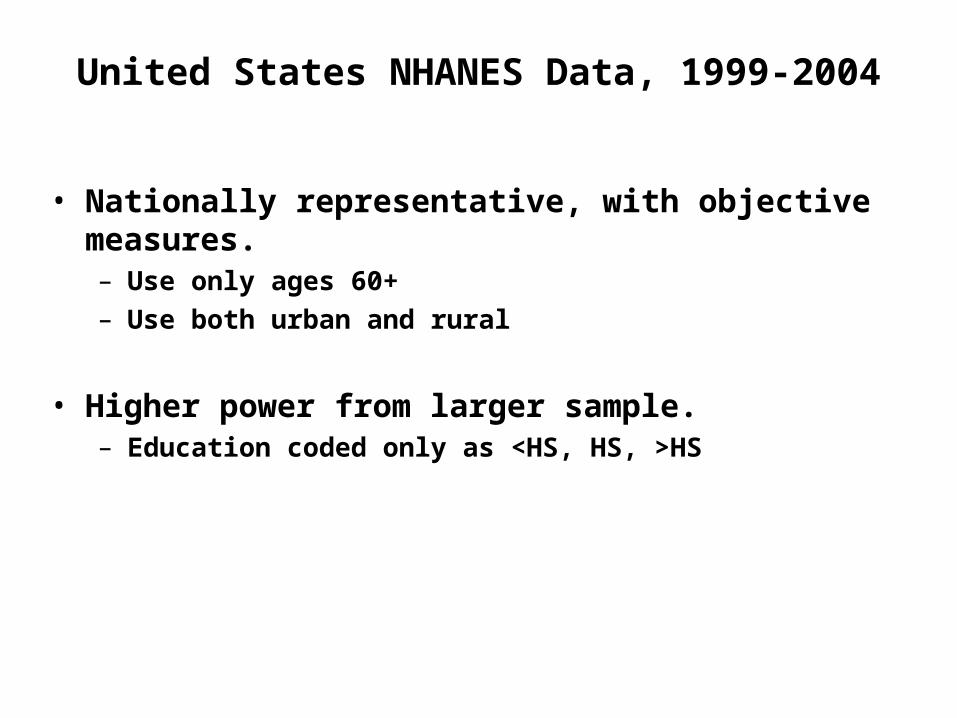
United States NHANES Data, 1999-2004
• Nationally representative, with objective measures.– Use only ages 60+
– Use both urban and rural
• Higher power from larger sample.– Education coded only as <HS, HS, >HS
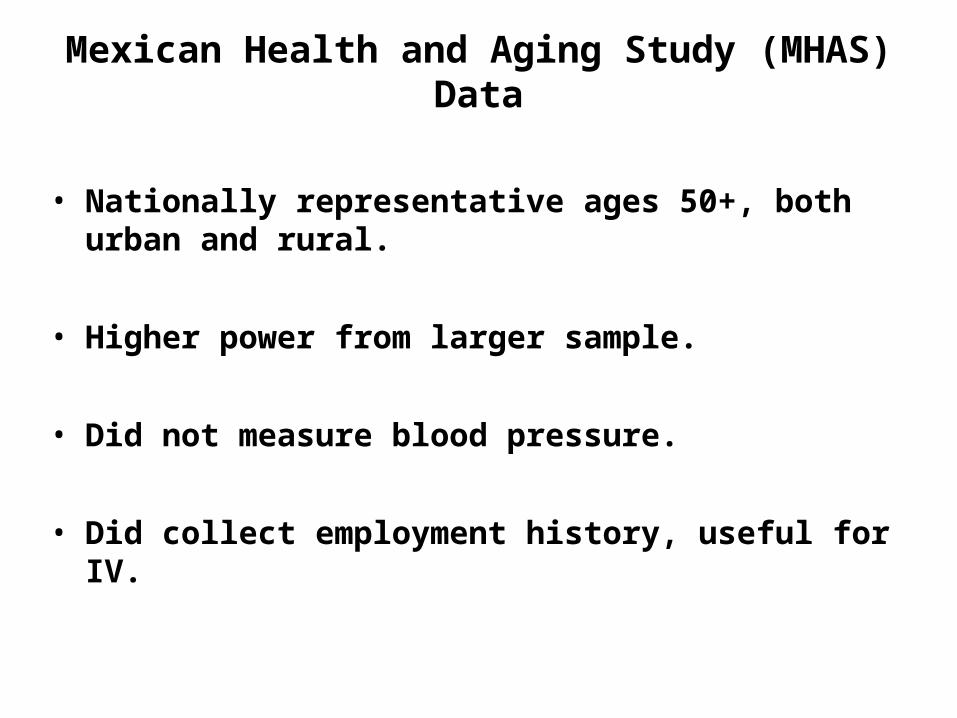
Mexican Health and Aging Study (MHAS) Data
• Nationally representative ages 50+, both urban and rural.
• Higher power from larger sample.
• Did not measure blood pressure.
• Did collect employment history, useful for IV.
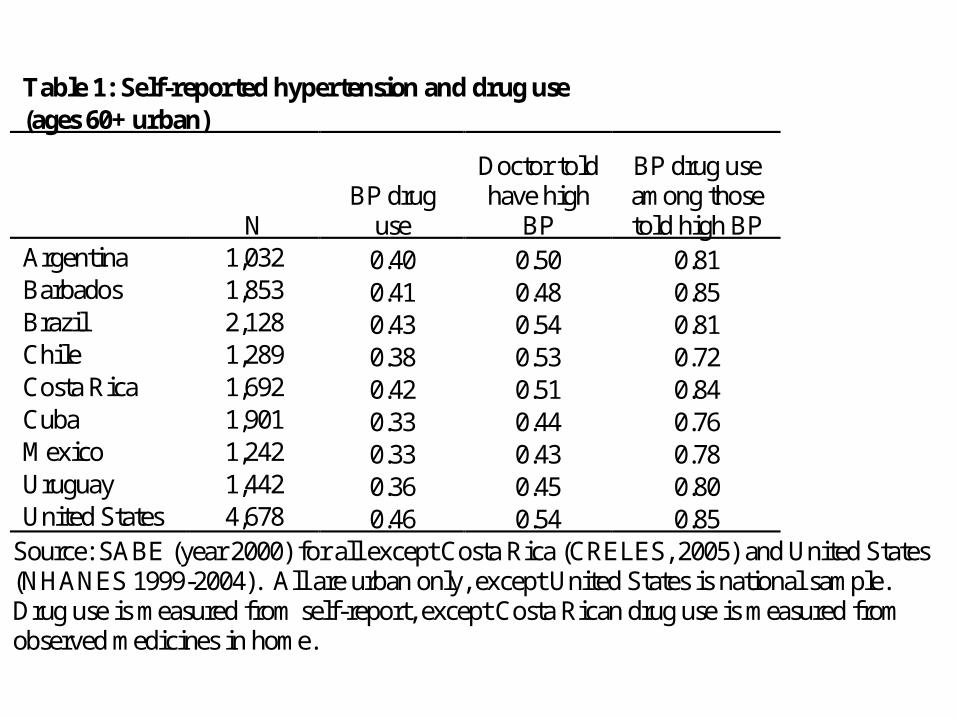
Table 1: Self-reported hypertension and drug use (ages 60+ urban)
N BP drug
use
Doctor told have high
BP
BP drug use among those told high BP
Argentina 1,032 0.40 0.50 0.81 Barbados 1,853 0.41 0.48 0.85 Brazil 2,128 0.43 0.54 0.81 Chile 1,289 0.38 0.53 0.72 Costa Rica 1,692 0.42 0.51 0.84 Cuba 1,901 0.33 0.44 0.76 Mexico 1,242 0.33 0.43 0.78 Uruguay 1,442 0.36 0.45 0.80 United States 4,678 0.46 0.54 0.85
Source: SABE (year 2000) for all except Costa Rica (CRELES, 2005) and United States (NHANES 1999-2004). All are urban only, except United States is national sample. Drug use is measured from self-report, except Costa Rican drug use is measured from observed medicines in home.
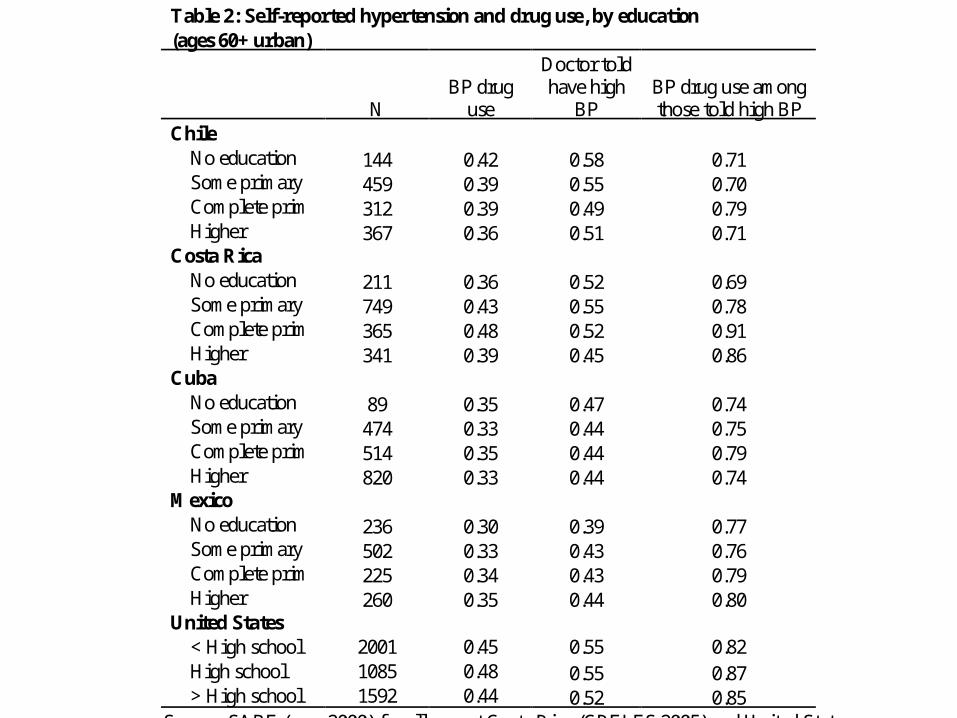
Table 2: Self-reported hypertension and drug use, by education (ages 60+ urban)
N BP drug
use
Doctor told have high
BP BP drug use among those told high BP
Chile No education 144 0.42 0.58 0.71 Some primary 459 0.39 0.55 0.70 Complete prim 312 0.39 0.49 0.79 Higher 367 0.36 0.51 0.71 Costa Rica No education 211 0.36 0.52 0.69 Some primary 749 0.43 0.55 0.78 Complete prim 365 0.48 0.52 0.91 Higher 341 0.39 0.45 0.86 Cuba No education 89 0.35 0.47 0.74 Some primary 474 0.33 0.44 0.75 Complete prim 514 0.35 0.44 0.79 Higher 820 0.33 0.44 0.74 Mexico No education 236 0.30 0.39 0.77 Some primary 502 0.33 0.43 0.76 Complete prim 225 0.34 0.43 0.79 Higher 260 0.35 0.44 0.80 United States < High school 2001 0.45 0.55 0.82 High school 1085 0.48 0.55 0.87 > High school 1592 0.44 0.52 0.85
Source: SABE (year 2000) for all except Costa Rica (CRELES 2005) and United States (NHANES 1999-2004). All are urban only, except United States is national sample. Drug use is measured from self-report, except Costa Rican drug use is measured from observed medicines in home.
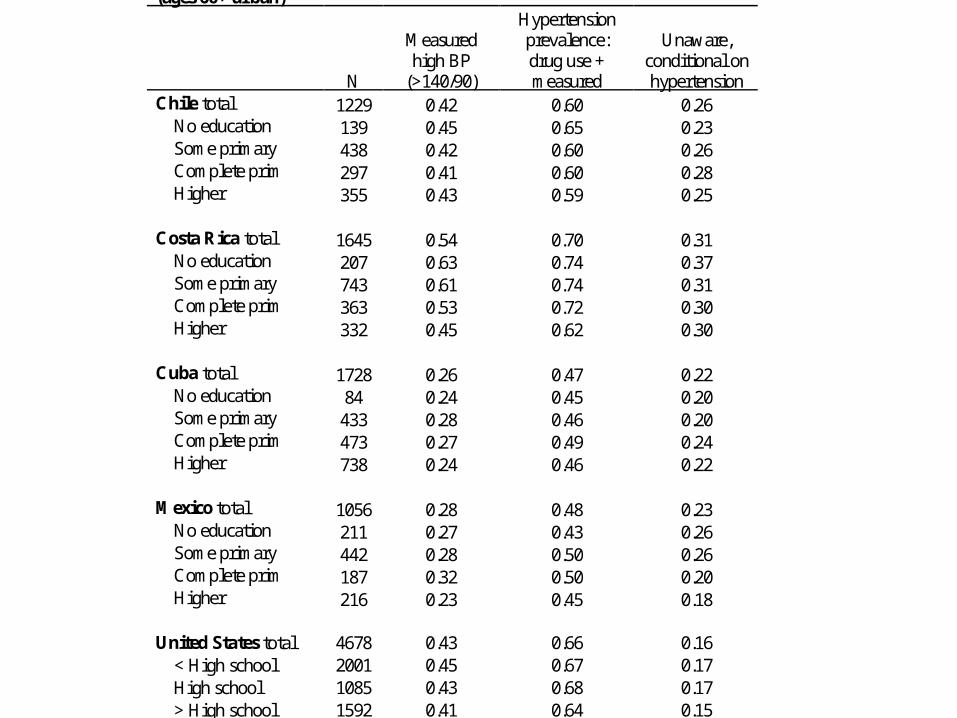
Table 3: Objective hypertension measures, by education (ages 60+ urban)
N
Measured high BP
(>140/90)
Hypertension prevalence: drug use + measured
Unaware, conditional on hypertension
Chile total 1229 0.42 0.60 0.26 No education 139 0.45 0.65 0.23 Some primary 438 0.42 0.60 0.26 Complete prim 297 0.41 0.60 0.28 Higher 355 0.43 0.59 0.25 Costa Rica total 1645 0.54 0.70 0.31 No education 207 0.63 0.74 0.37 Some primary 743 0.61 0.74 0.31 Complete prim 363 0.53 0.72 0.30 Higher 332 0.45 0.62 0.30 Cuba total 1728 0.26 0.47 0.22 No education 84 0.24 0.45 0.20 Some primary 433 0.28 0.46 0.20 Complete prim 473 0.27 0.49 0.24 Higher 738 0.24 0.46 0.22 Mexico total 1056 0.28 0.48 0.23 No education 211 0.27 0.43 0.26 Some primary 442 0.28 0.50 0.26 Complete prim 187 0.32 0.50 0.20 Higher 216 0.23 0.45 0.18 United States total 4678 0.43 0.66 0.16 < High school 2001 0.45 0.67 0.17 High school 1085 0.43 0.68 0.17 > High school 1592 0.41 0.64 0.15
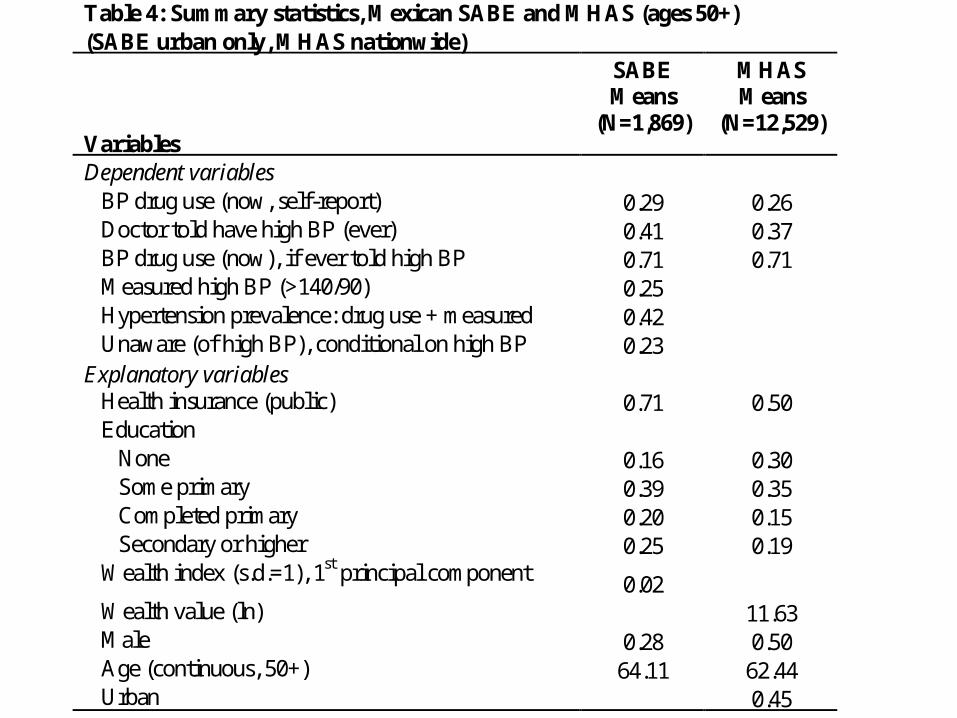
Table 4: Summary statistics, Mexican SABE and MHAS (ages 50+) (SABE urban only, MHAS nationwide)
Variables
SABE Means
(N=1,869)
MHAS Means
(N=12,529)
Dependent variables BP drug use (now, self-report) 0.29 0.26 Doctor told have high BP (ever) 0.41 0.37 BP drug use (now), if ever told high BP 0.71 0.71 Measured high BP (>140/90) 0.25 Hypertension prevalence: drug use + measured 0.42 Unaware (of high BP), conditional on high BP 0.23 Explanatory variables Health insurance (public) 0.71 0.50 Education None 0.16 0.30 Some primary 0.39 0.35 Completed primary 0.20 0.15 Secondary or higher 0.25 0.19 Wealth index (s.d.=1), 1st principal component 0.02
Wealth value (ln) 11.63 Male 0.28 0.50 Age (continuous, 50+) 64.11 62.44 Urban 0.45
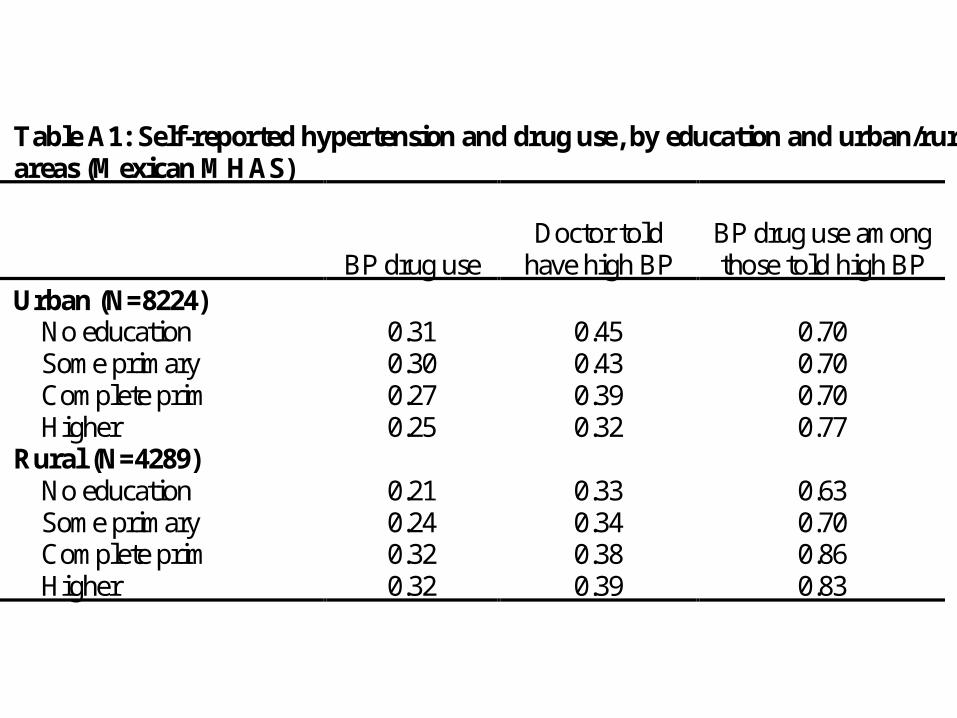
Table A1: Self-reported hypertension and drug use, by education and urban/rural areas (Mexican MHAS)
BP drug use Doctor told
have high BP BP drug use among those told high BP
Urban (N=8224) No education 0.31 0.45 0.70 Some primary 0.30 0.43 0.70 Complete prim 0.27 0.39 0.70 Higher 0.25 0.32 0.77 Rural (N=4289) No education 0.21 0.33 0.63 Some primary 0.24 0.34 0.70 Complete prim 0.32 0.38 0.86 Higher 0.32 0.39 0.83
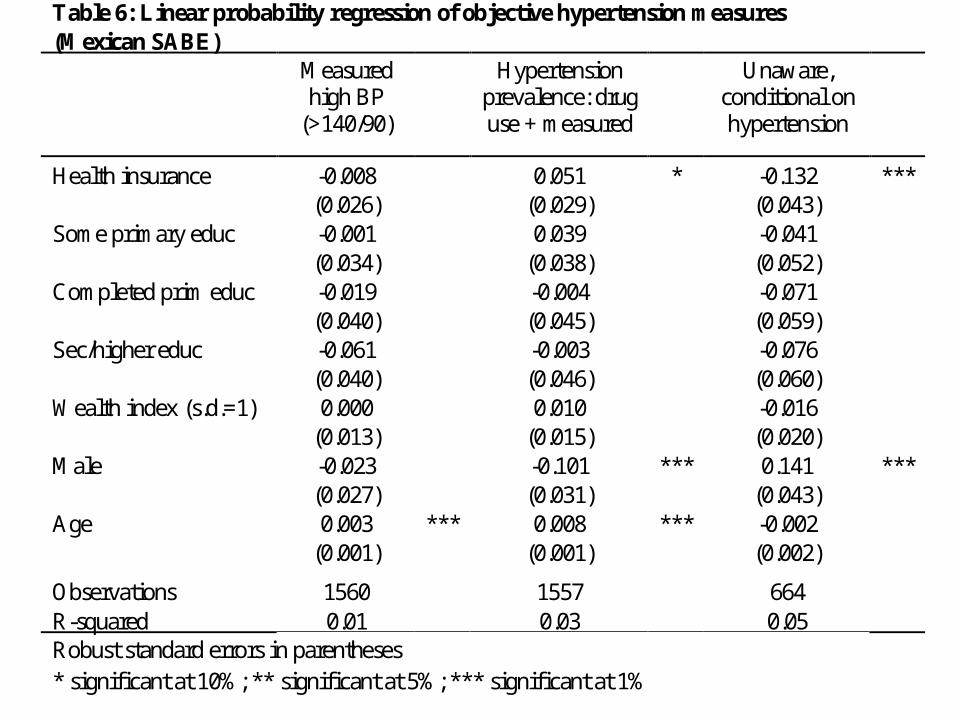
Table 6: Linear probability regression of objective hypertension measures (Mexican SABE) Measured
high BP (>140/90)
Hypertension prevalence: drug use + measured
Unaware, conditional on hypertension
Health insurance -0.008 0.051 * -0.132 *** (0.026) (0.029) (0.043) Some primary educ -0.001 0.039 -0.041 (0.034) (0.038) (0.052) Completed prim educ -0.019 -0.004 -0.071 (0.040) (0.045) (0.059) Sec/higher educ -0.061 -0.003 -0.076 (0.040) (0.046) (0.060) Wealth index (s.d.=1) 0.000 0.010 -0.016 (0.013) (0.015) (0.020) Male -0.023 -0.101 *** 0.141 *** (0.027) (0.031) (0.043) Age 0.003 *** 0.008 *** -0.002 (0.001) (0.001) (0.002)
Observations 1560 1557 664 R-squared 0.01 0.03 0.05 Robust standard errors in parentheses * significant at 10%; ** significant at 5%; *** significant at 1%
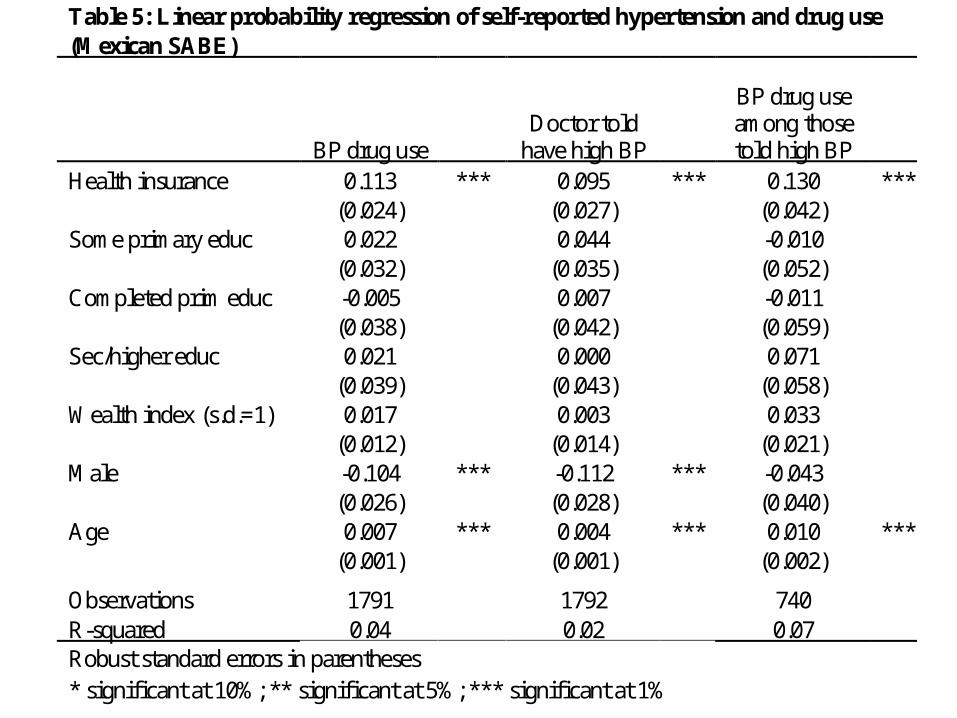
Table 5: Linear probability regression of self-reported hypertension and drug use (Mexican SABE)
BP drug use Doctor told
have high BP
BP drug use among those told high BP
Health insurance 0.113 *** 0.095 *** 0.130 *** (0.024) (0.027) (0.042) Some primary educ 0.022 0.044 -0.010 (0.032) (0.035) (0.052) Completed prim educ -0.005 0.007 -0.011 (0.038) (0.042) (0.059) Sec/higher educ 0.021 0.000 0.071 (0.039) (0.043) (0.058) Wealth index (s.d.=1) 0.017 0.003 0.033 (0.012) (0.014) (0.021) Male -0.104 *** -0.112 *** -0.043 (0.026) (0.028) (0.040) Age 0.007 *** 0.004 *** 0.010 *** (0.001) (0.001) (0.002)
Observations 1791 1792 740 R-squared 0.04 0.02 0.07 Robust standard errors in parentheses * significant at 10%; ** significant at 5%; *** significant at 1%
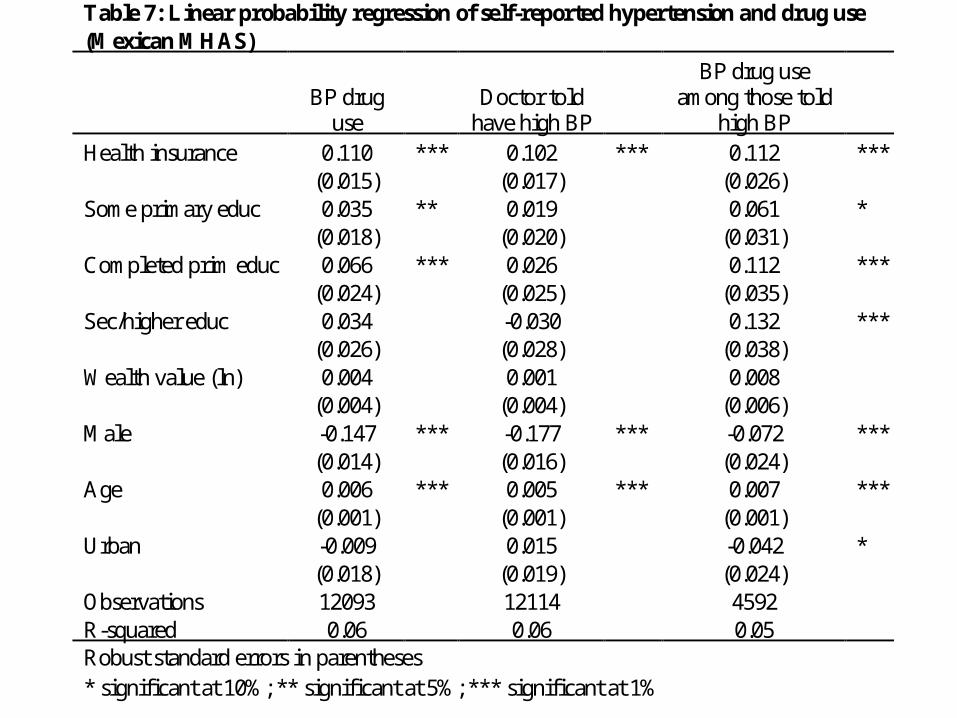
Table 7: Linear probability regression of self-reported hypertension and drug use (Mexican MHAS)
BP drug use
Doctor told have high BP
BP drug use among those told
high BP Health insurance 0.110 *** 0.102 *** 0.112 *** (0.015) (0.017) (0.026) Some primary educ 0.035 ** 0.019 0.061 * (0.018) (0.020) (0.031) Completed prim educ 0.066 *** 0.026 0.112 *** (0.024) (0.025) (0.035) Sec/higher educ 0.034 -0.030 0.132 *** (0.026) (0.028) (0.038) Wealth value (ln) 0.004 0.001 0.008 (0.004) (0.004) (0.006) Male -0.147 *** -0.177 *** -0.072 *** (0.014) (0.016) (0.024) Age 0.006 *** 0.005 *** 0.007 *** (0.001) (0.001) (0.001) Urban -0.009 0.015 -0.042 * (0.018) (0.019) (0.024) Observations 12093 12114 4592 R-squared 0.06 0.06 0.05 Robust standard errors in parentheses * significant at 10%; ** significant at 5%; *** significant at 1%
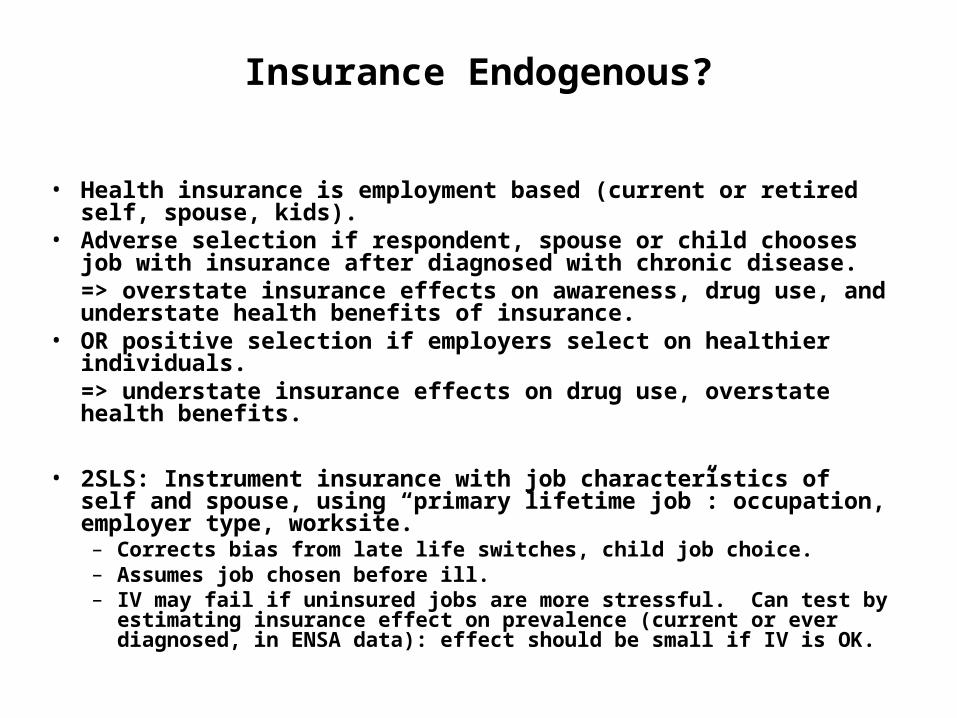
Insurance Endogenous?
• Health insurance is employment based (current or retired self, spouse, kids).
• Adverse selection if respondent, spouse or child chooses job with insurance after diagnosed with chronic disease. => overstate insurance effects on awareness, drug use, and understate health benefits of insurance.
• OR positive selection if employers select on healthier individuals.=> understate insurance effects on drug use, overstate health benefits.
• 2SLS: Instrument insurance with job characteristics of self and spouse, using “primary lifetime job”: occupation, employer type, worksite.– Corrects bias from late life switches, child job choice. – Assumes job chosen before ill.– IV may fail if uninsured jobs are more stressful. Can test by estimating
insurance effect on prevalence (current or ever diagnosed, in ENSA data): effect should be small if IV is OK.
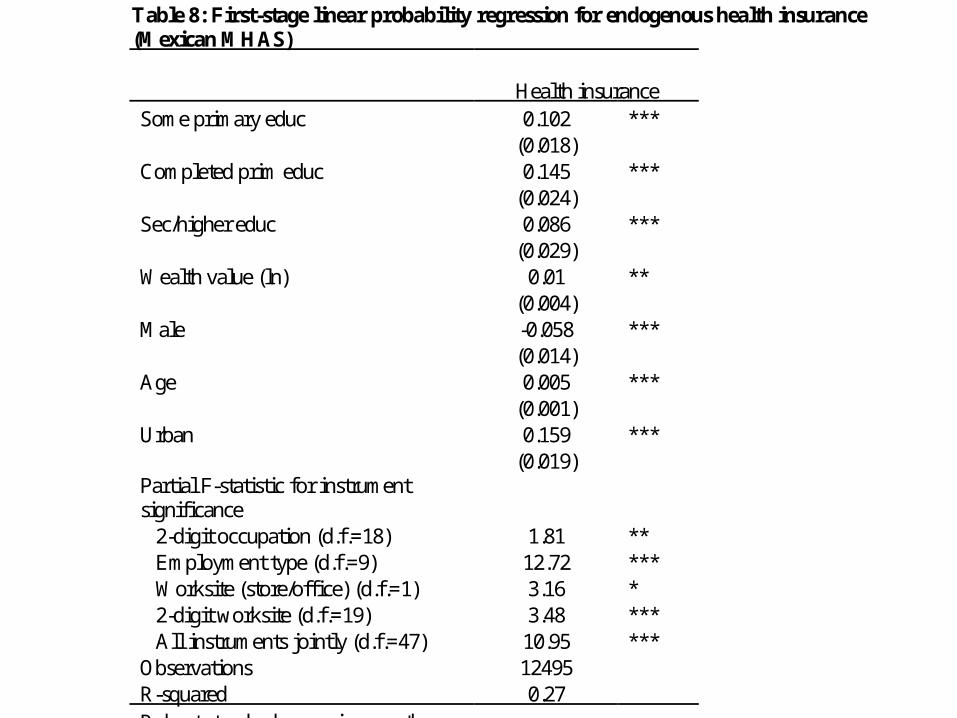
Table 8: First-stage linear probability regression for endogenous health insurance (Mexican MHAS)
Health insurance Some primary educ 0.102 *** (0.018) Completed prim educ 0.145 *** (0.024) Sec/higher educ 0.086 *** (0.029) Wealth value (ln) 0.01 ** (0.004) Male -0.058 *** (0.014) Age 0.005 *** (0.001) Urban 0.159 *** (0.019) Partial F-statistic for instrument significance 2-digit occupation (d.f.=18) 1.81 ** Employment type (d.f.=9) 12.72 *** Worksite (store/office) (d.f.=1) 3.16 * 2-digit worksite (d.f.=19) 3.48 *** All instruments jointly (d.f.=47) 10.95 *** Observations 12495 R-squared 0.27 Robust standard errors in parentheses * significant at 10%; ** significant at 5%; *** significant at 1%
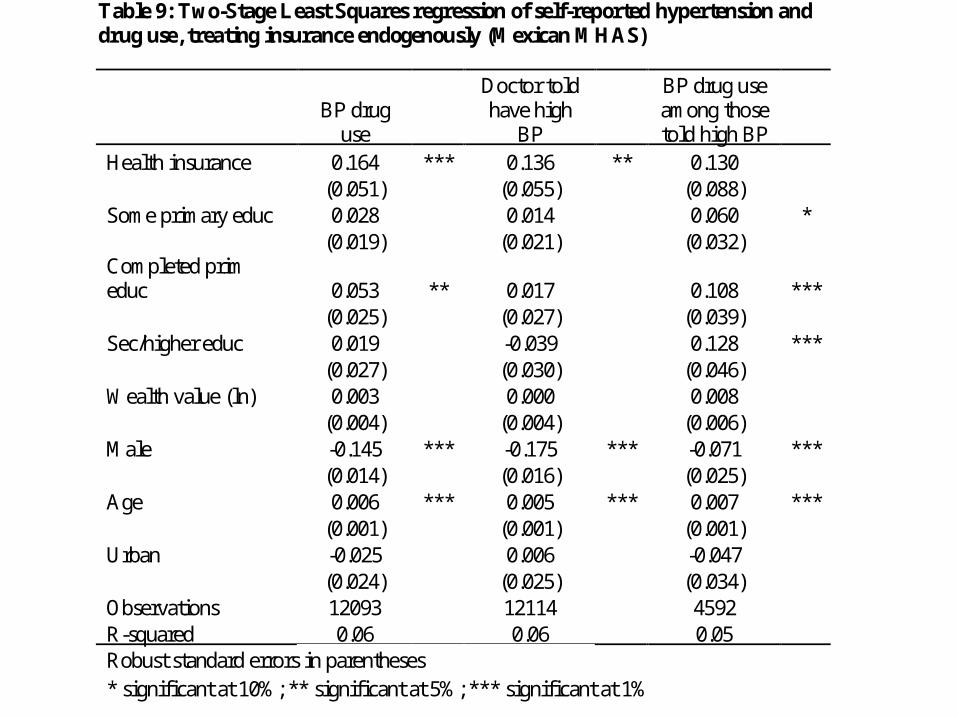
Table 9: Two-Stage Least Squares regression of self-reported hypertension and drug use, treating insurance endogenously (Mexican MHAS)
BP drug use
Doctor told have high
BP
BP drug use among those told high BP
Health insurance 0.164 *** 0.136 ** 0.130 (0.051) (0.055) (0.088) Some primary educ 0.028 0.014 0.060 * (0.019) (0.021) (0.032) Completed prim educ 0.053 ** 0.017 0.108 *** (0.025) (0.027) (0.039) Sec/higher educ 0.019 -0.039 0.128 *** (0.027) (0.030) (0.046) Wealth value (ln) 0.003 0.000 0.008 (0.004) (0.004) (0.006) Male -0.145 *** -0.175 *** -0.071 *** (0.014) (0.016) (0.025) Age 0.006 *** 0.005 *** 0.007 *** (0.001) (0.001) (0.001) Urban -0.025 0.006 -0.047 (0.024) (0.025) (0.034) Observations 12093 12114 4592 R-squared 0.06 0.06 0.05 Robust standard errors in parentheses * significant at 10%; ** significant at 5%; *** significant at 1%
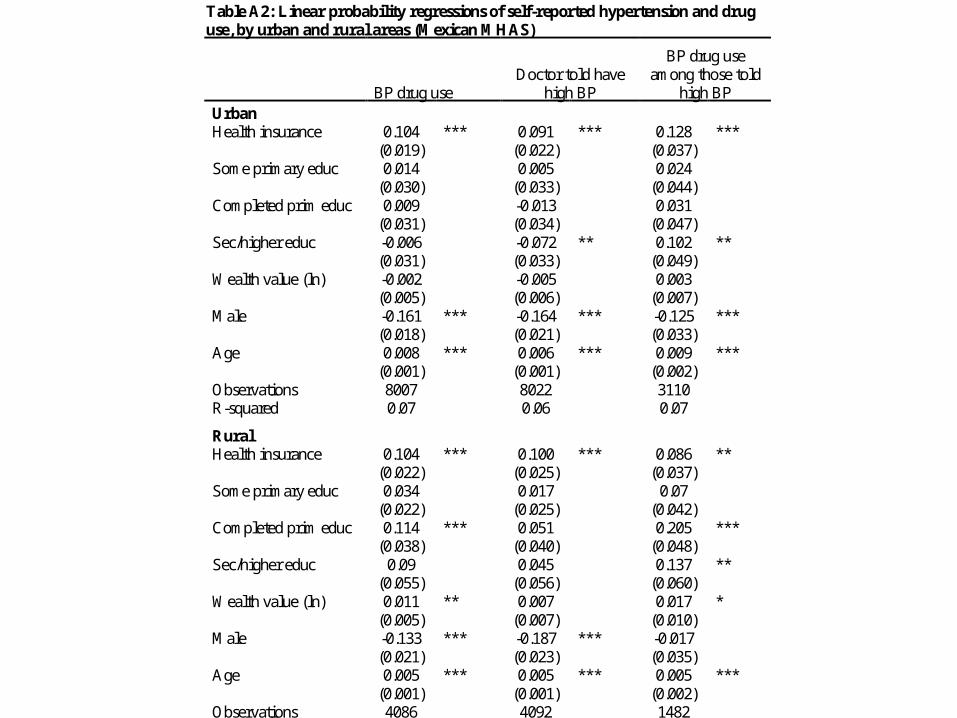
Table A2: Linear probability regressions of self-reported hypertension and drug use, by urban and rural areas (Mexican MHAS)
BP drug use Doctor told have
high BP
BP drug use among those told
high BP Urban Health insurance 0.104 *** 0.091 *** 0.128 *** (0.019) (0.022) (0.037) Some primary educ 0.014 0.005 0.024 (0.030) (0.033) (0.044) Completed prim educ 0.009 -0.013 0.031 (0.031) (0.034) (0.047) Sec/higher educ -0.006 -0.072 ** 0.102 ** (0.031) (0.033) (0.049) Wealth value (ln) -0.002 -0.005 0.003 (0.005) (0.006) (0.007) Male -0.161 *** -0.164 *** -0.125 *** (0.018) (0.021) (0.033) Age 0.008 *** 0.006 *** 0.009 *** (0.001) (0.001) (0.002) Observations 8007 8022 3110 R-squared 0.07 0.06 0.07
Rural
Health insurance 0.104 *** 0.100 *** 0.086 ** (0.022) (0.025) (0.037) Some primary educ 0.034 0.017 0.07 (0.022) (0.025) (0.042) Completed prim educ 0.114 *** 0.051 0.205 *** (0.038) (0.040) (0.048) Sec/higher educ 0.09 0.045 0.137 ** (0.055) (0.056) (0.060) Wealth value (ln) 0.011 ** 0.007 0.017 * (0.005) (0.007) (0.010) Male -0.133 *** -0.187 *** -0.017 (0.021) (0.023) (0.035) Age 0.005 *** 0.005 *** 0.005 *** (0.001) (0.001) (0.002) Observations 4086 4092 1482 R-squared 0.06 0.06 0.06
Summary• Hypertension drug use remarkably high in Latin America, despite
little publicity and no quick benefit.
• Drug use rates similar across countries, and across SES within countries: even 30% of uneducated poor.– Costa Rica curiously has largest urban education differentials of any country. – In Mexico, education gradients larger in rural areas.
• Insurance has big effects on drug use, increasing it 11 percentage points (on mean of 29%).
• Health benefits of insurance are less clear: awareness is higher, but no effect on current measured hypertension control in Mexican SABE.
• Useful to expand analysis to other diseases.