Embed Size (px)
Citation preview
I ' 1
Anti Submarine Warfare Planning - Phase I1
Karl A. Bertsche, Herbert Guffarth, Leonard Karg
Information and Communication Systems EADS, Dornier GmbH
Friedri c hs hafen Germany Postal Address: 8 8039 Fri edri chshafen/German y E-mai 1 address: karl. bertsche @ dornier.eads.net
Mr. Bertsche is presently developing a planning instrument for the German Naval Support Command for using active towed array sonar in the military OR-Section of Domier GmbH (a subsidiary of the European Aeronautic Defence and Space Company, EADS ). He has written object oriented Programs conceming minefield efectiveness, and an analysis tool for the sustainability of German forces as well as a dynamic infantry combat model (AMIRIS). His recent work includes the development of an analysis tool for the develop- ment of Anti Submarine Wagare Screens (AS W) for the Fleet Command of the German Navy . He was previously a nuclear engineer at Babcock & Wilcox in Virginia, U.S.A. He has a Masters of Engineering degree in nuclear engineering from New York University.
ABSTRACT
One major task of naval forces is to protect convoys which replenish allies and own forces overseas. A threat to such convoys are submarine attacks using torpedoes. In order to pro- tect a convoy against submarine attacks, the navy employs frigates, destroyers and helicop- ters equipped with sonar for this task. In order to determine the effectiveness of submarine detection of such assets, the German Fleet Command in Gliicksburg contracted Dornier GmbH in 1989 to investigate this matter. The results of this study which were published in 1990 led to the development of the NATO Experimental Tactical Procedure 176 (AXP YEXTAC 176). This tactical procedure was applied and tested in NATO exercises. The results of these tests and exercises showed that some basic modifications of the EXTAC 176 were necessary.
The German Fleet Command therefore initiated a second study to improve the methodology and expand the application ranges of the following parameters:
0 Increased range of escort speeds 0 Increased range of convoy speeds 0 Increased ranges of beam sector depth
In order to facilitate the ASW screen planning method (application of the EXTAC 176 pro- cedure) a PC based model was developed. This model allows the user to input basidscreen parameters, which includes convoy depth and width, convoy bearing, convoy speed of ad- vance, submarine speed, torpedo firing range and torpedo speed. Based on these parameters the tactical symbol for a convoy is placed near the centre of the screen. A red line sur- rounding the convoy shows the torpedo danger zone with respect to the convoy position and convoy dimensions. If the speed of advance of the convoy is greater than the expected sub-
1

1
marine speed, limiting lines of approach, coloured in red which are tangent to the torpedo danger zone, will also appear.
In order to protect the convoy against possible submarine attacks, frigates, destroyers and helicopters are deployed to patrol certain areas relative to the convoys position. The detec- tion probability of a submarine is computed based on the relative position, sector width, sector depth, escort speed and the effective sonar detection range. On the bases of these de- tection probabilities the available assets can be deployed in such a fashion in order to opti- mise the protection scheme for a convoy.
INTRODUCTION
Anti Submarine Warfare Planning is one of the major tasks for naval forces. In the past cou- ple of years an improved method for generating ASW Screens with surface vessels and heli- copters was developed for the German navy and led to a NATO experimental tactical pro- cedure EXTAC 176.
The objective is to go from a NATO experimental tactical procedure to a NATO Allied tac- tical procedure.
SITUATION
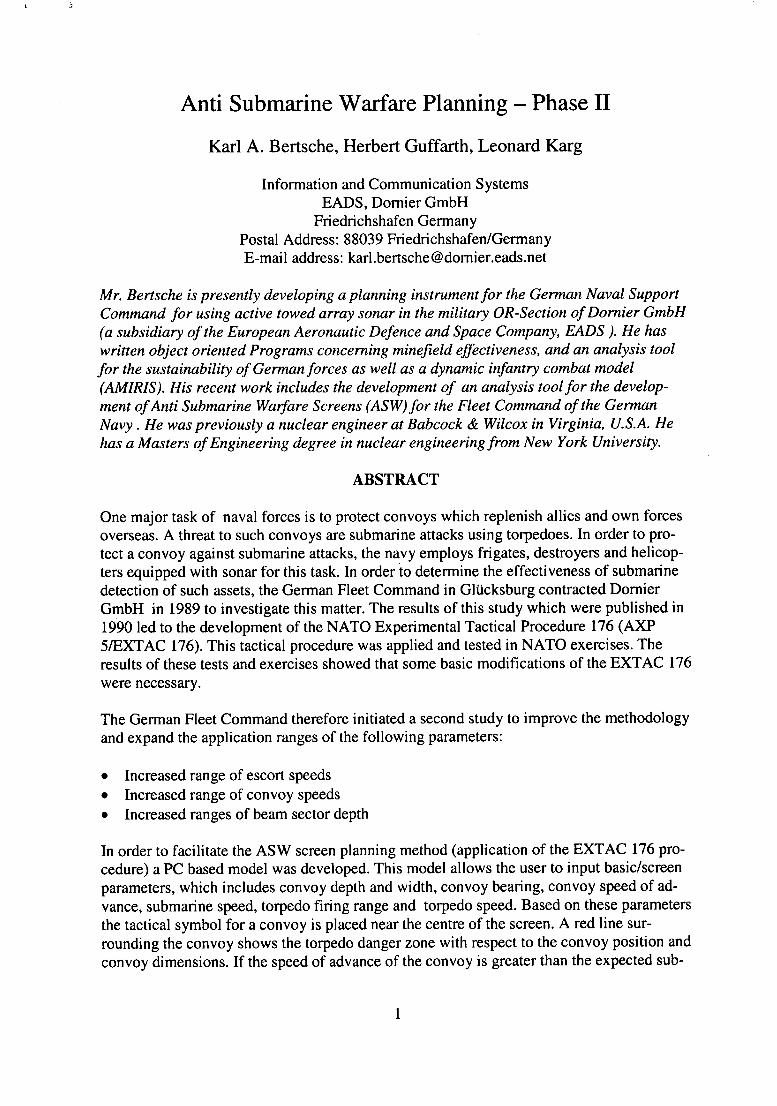
Figure 1. shows the situation where task force TG 200.1 coming from the western Atlantic and is attempting to reach a port either in the Mediterranean Sea or in Spain or northern Europe. This task force may be threatened by submarines. Therefore escort surface ships are deployed to detect any potential threat well in advance of the convoys position.
Example:
,,Operation Atlantic”
I
13 - / Biskaya $A ordeaux
L I
‘QO
I Case blaac?*p P Es-Suira
Madeire: - Kanarische lnseln
f I- Fig. 1: Initial Situation
2

I

Figure 2. shows the different patrolling sectors of the different screening units. For this par- ticular situation the screens consist of 2 frigates, 1 destroyer and 2 helicopters. The red cir- cular shaped line around the convoy indicates the torpedo danger zone. The red tangential lines are the limiting lines of approach (LLOA), which only appear if the submarine speed is less than the speed of advance of the convoy.
Examole:
,,Operation Atlantic"
Planning TG 200.1
Screen Units: 2 Frigates 1 Destroyer 2 Helicopters
. .
1111 Y.lM.. I :,MO*
Fig. 2: Possible Screen Configuration
BACKGROUND
The present accepted NATO method for determining the size of screen sectors in ASW op erations is the ATP 1 method. Since the application of this procedure has proved to be very cumbersome for ASW planning and the required screen sector areas were also very large to patrol, the German Fleet Command was looking for a more effective method to perform the ASW planning of search and screening operations. In order to achieve this goal, (EADS) Domier GmbH was contracted to perform studies to improve the methodology and to possi- bly automate the process on a PC.
The results of the study showed that the method could significantly be improved. This new method as compared to ATP 1 will increases the angle coverage (sector width) by about 33% at a reduced sector depth of 4000 yd maintaining the same probability of detection as in ATP 1.
The improvement is especially pronounced when the sector screen is located at 90' or 270" from the main line of advance. At this angular location a 12" increase (46 % improvement) of angular coverage is achieved by the new method. Also a significant decrease in patrolling area is reached by the new method.
3


METHODOLOGY
The graph below shows the dependence of probability of detection of a screen sector with respect to the predicted sonar range. The calculated curves were derived at a standard screen sector inner radius of 15000 yd.
BDOR DORNIER
ig. 3: Probability of detection vs. Predicted Sonar Range at 15000 yd
In this particular case the predicted sonar range of 5000 yd and a probability of detection of 80 % for a screen sector will yield to an angular coverage (sector width) of 40" for the indi- cated conditions.
L
Fig. 4: Probability of detection vs. Screen Sector Inner Radius
4

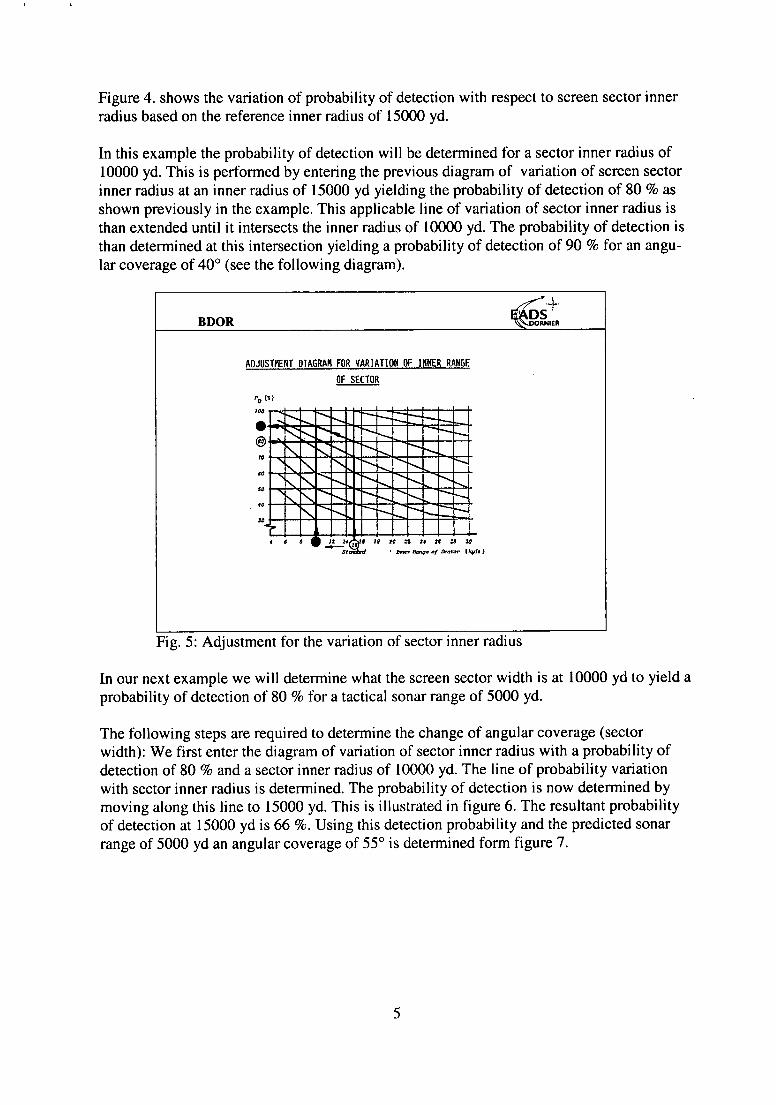
Figure 4. shows the variation of probability of detection with respect to screen sector inner radius based on the reference inner radius of 15000 yd.
In this example the probability of detection will be determined for a sector inner radius of 10000 yd. This is performed by entering the previous diagram of variation of screen sector inner radius at an inner radius of 15000 yd yielding the probability of detection of 80 % as shown previously in the example. This applicable line of variation of sector inner radius is than extended until it intersects the inner radius of 10000 yd. The probability of detection is than determined at this intersection yielding a probability of detection of 90 % for an angu- lar coverage of 40" (see the following diagram).
BDOR
ADJIISTNENT OIAGRAB FOR VARIATION OF INNER RRNI,E OF SECTOR
Fig. 5: Adjustment for the variation of sector inner radius
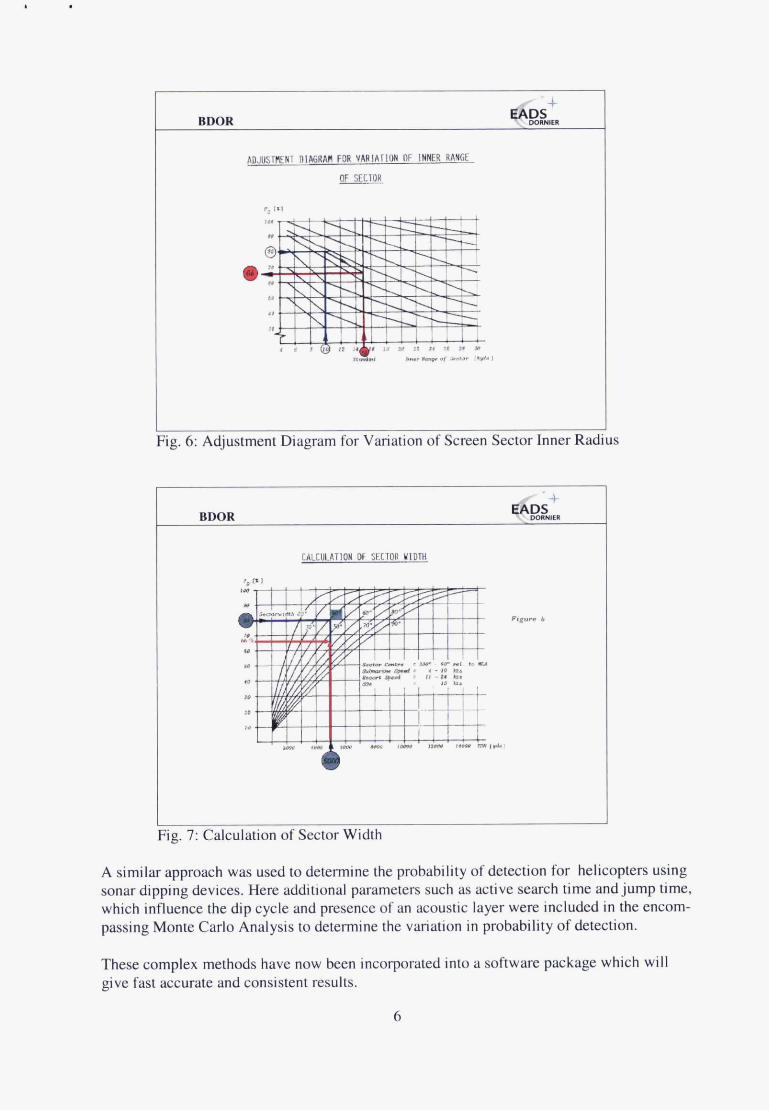
In our next example we will determine what the screen sector width is at 10000 yd to yield a probability of detection of 80 % for a tactical sonar range of 5000 yd.
The following steps are required to determine the change of angular coverage (sector width): We first enter the diagram of variation of sector inner radius with a probability of detection of 80 % and a sector inner radius of 10000 yd. The line of probability variation with sector inner radius is determined. The probability of detection is now determined by moving along this line to 15000 yd. This is illustrated in figure 6. The resultant probability of detection at 15000 yd is 66 %. Using this detection probability and the predicted sonar range of 5000 yd an angular coverage of 55" is determined form figure 7.
5

I
Fig. 6: Adjustment Diagram for Variation of Screen Sector Inner Rad
BDOR
1s
4 Fig. 7: Calculation of Sector Width
A similar approach was used to determine the probability of detection for helicopters using sonar dipping devices. Here additional parameters such as active search time and jump time, which influence the dip cycle and presence of an acoustic layer were included in the encom- passing Monte Carlo Analysis to determine the variation in probability of detection.
These complex methods have now been incorporated into a software package which will give fast accurate and consistent results.
6
PILOT SYSTEM
In order to obtain consistent results and to simplify the planning procedure a tool was devtl- oped to perform all computations and graphical representations. The tool developed was simply called the “SCREENPLANNER.
This work was supervised by the German Fleet Command and carried out by EADS Dornier Section BDOR.
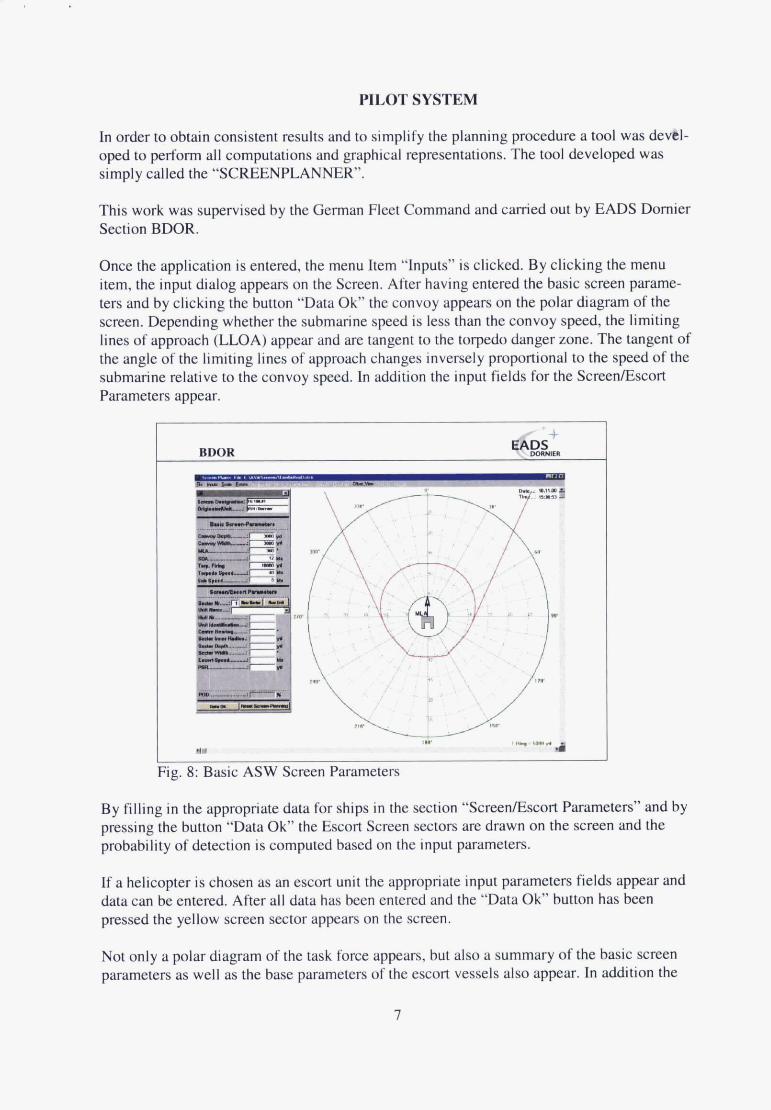
Once the application is entered, the menu Item “Inputs” is clicked. By clicking the menu item, the input dialog appears on the Screen. After having entered the basic screen parame- ters and by clicking the button “Data Ok” the convoy appears on the polar diagram of the screen. Depending whether the submarine speed is less than the convoy speed, the limiting lines of approach (LLOA) appear and are tangent to the torpedo danger zone. The tangent of the angle of the limiting lines of approach changes inversely proportional to the speed of the submarine relative to the convoy speed. In addition the input fields for the Screen/Escort Parameters appear.
‘t BDOR
I Fig. 8: Basic ASW Screen Parameters
By filling in the appropriate data for ships in the section “ScreenlEscort Parameters” and by pressing the button “Data Ok” the Escort Screen sectors are drawn on the screen and the probability of detection is computed based on the input parameters.
If a helicopter is chosen as an escort unit the appropriate input parameters fields appear and data can be entered. After all data has been entered and the “‘Data Ok” button has been pressed the yellow screen sector appears on the screen.
Not only a polar diagram of the task force appears, but also a summary of the basic screen parameters as well as the base parameters of the escort vessels also appear. In addition the
relative positions of the screen units with respect to the convoy are displayed and also given in the appropriate operational form.
S " d * G . n ......................................... U .- *ID-
.......................................... MY. nu. .m- " a
--. I.. .......................................... .......................................... .......................................... I -., --U. -P ---a m -a
*mnl(.w. ml- I ~ I I U S w.DIu. IIII-lyI*sIIUs*Lu.. na. ,Y*IIII*l *.llD . 1DD) . lO*HI . 11%. sx * m
aar.~.- . ~ . ~ - ~ ~ ~ ................ -- -. ---.__---
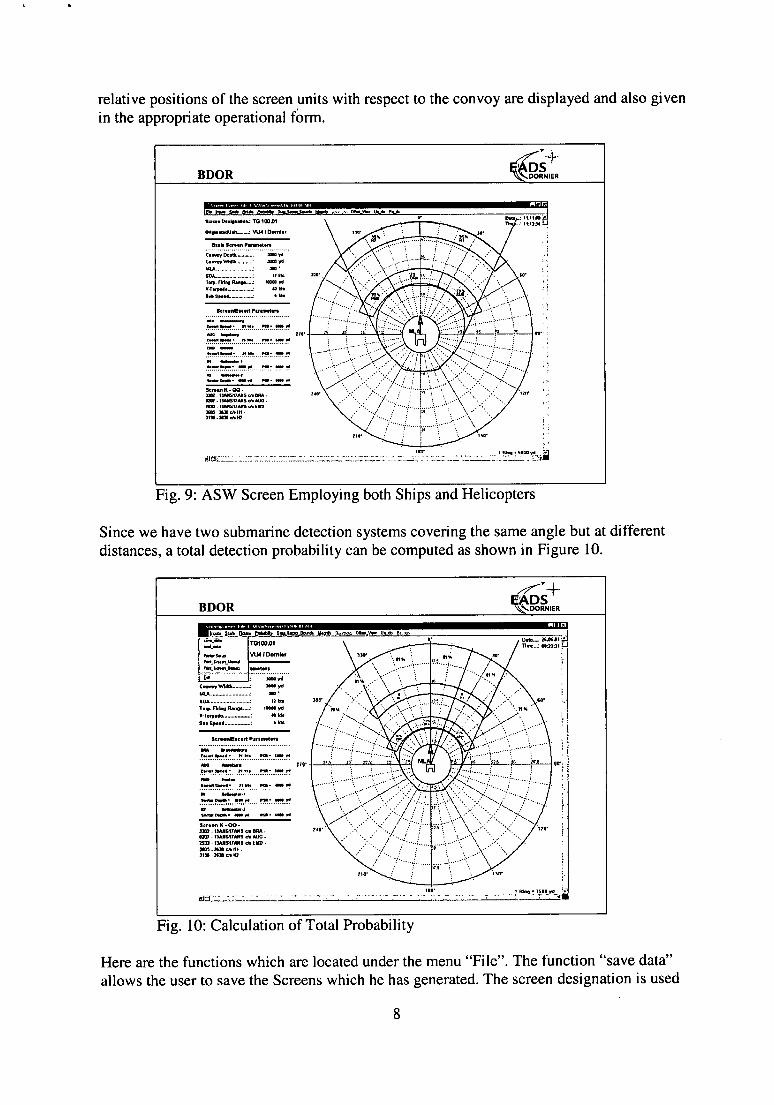
Fig. 9: ASW Screen Employing both Ships and Helicopters
Since we have two submarine detection systems covering the same angle but at different distances, a total detection probability can be computed as shown in Figure 10.
V.14.dO .................. : ULI. S..S* ., ................. : S h
.......................................... s....e.r.n Pnan..."
Y .- I W C I . n". - . e * *
*Io -. *"I. nn. e.**)*
E r . l P I . nu. - .U*
I --.< --. ."* -.*an* I) -.,
..........................................
......................................... m -- ..........................................
..........................................
sewn n . w. lml - I U l S l I U I 0. mln . m, . I l l*S,,UI a AUG. UZ4. I Y N I S I I M d EMU. 1601 .rem * M I . IIJ.I"III
Fig. 10: Calculation of Total Probability
Here are the functions which are located under the menu "File". The function "save data" allows the user to save the Screens which he has generated. The screen designation is used
8
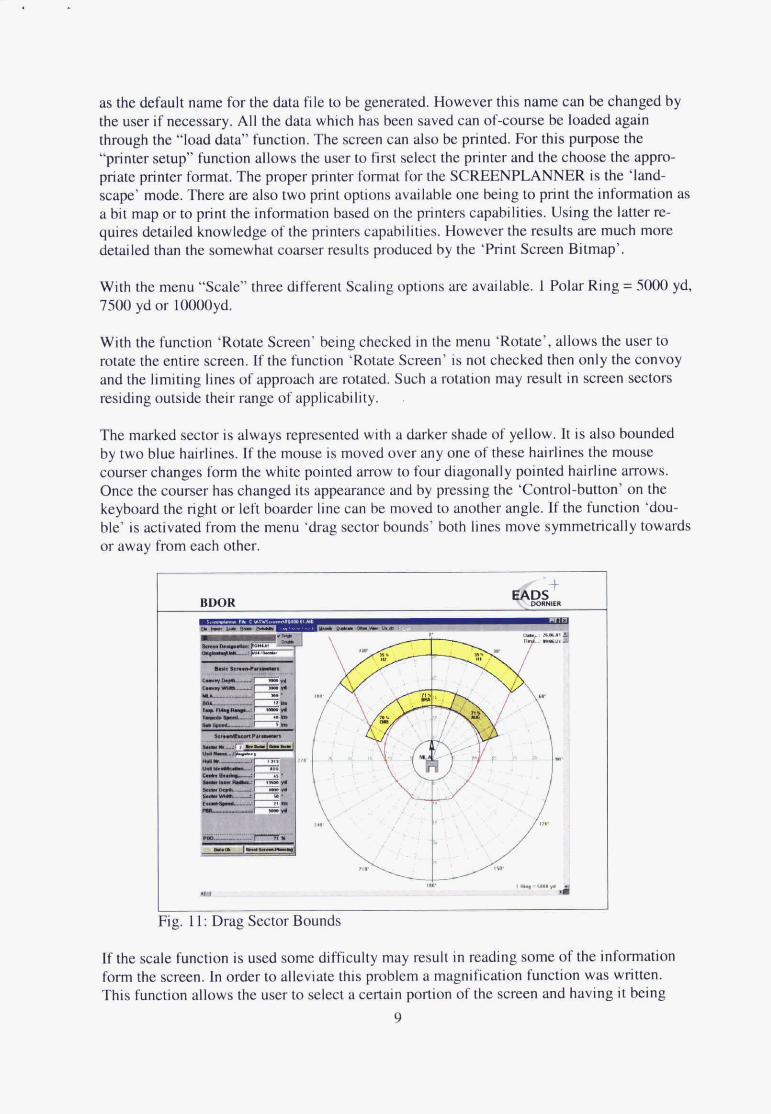
as the default name for the data file to be generated. However this name can be changed by the user if necessary. All the data which has been saved can of-course be loaded again through the “load data” function. The screen can also be printed. For this purpose the “printer setup’’ function allows the user to first select the printer and the choose the appro- priate printer format. The proper printer format for the SCREENPLANNER is the ‘land- scape’ mode. There are also two pnnt options available one being to print the information as a bit map or to print the information based on the printers capabilities. Using the latter re- quires detailed knowledge of the printers capabilities. However the results are much more detailed than the somewhat coarser results produced by the ‘Print Screen Bitmap’.
With the menu “Scale” three different Scaling options are available. 1 Polar Ring = 5000 yd. 7500 yd or 10000yd.
With the function ‘Rotate Screen’ being checked in the menu ‘Rotate’, allows the user to rotate the entire screen. If the function ‘Rotate Screen’ is not checked then only the convoy and the limiting lines of approach are rotated. Such a rotation may result in screen sectors residing outside their range of applicability.
The marked sector is always represented with a darker shade of yellow. It is also bounded by two blue harlines. If the mouse is moved over any one of these hairlines the mouse courser changes form the white pointed arrow to four diagonally pointed hairline arrows. Once the courser has changed its appearance and by pressing the ‘Control-button’ on the keyboard the right or left boarder line can be moved to another angle. If the function ‘dou- ble’ is activated from the menu ‘drag sector bounds’ both lines move symmetrically towards or away from each other.
I Fig. 11: Drag Sector Bounds
If the scale function is used some difficulty may result in reading some of the information form the screen. In order to alleviate this problem a magnification function was written. This function allows the user to select a certain portion of the screen and having it being
9
displayed four times larger. By pressing the menu ‘Magnify’ the Courser changes form white pointed arrow to two crossed hairlines. With this changed courser the user moves the mouse to the area of interest and by pressing the left mouse button a dashed rectangle pears which can be extended over the area. By releasing the left button of the mouse the magni- fied window appears. It contains all the function of the main window and further planning can take place in the magnified window.
In order to facilitate the planning process two functions were generated. One function merely duplicates the sector which is marked. And places the duplicate 5” to the left and 1000 yd further from the convoy than original sector.
During the duplication process the user is asked if he wants to change the unit for the dupli- cated sector. If the answer is yes the ‘combo box’ containing the different assets appear on the input viewer. From this combo box a different ship may be chosen. The user has the chance, at this time, to make any additional changes to the other inputs of the sector if he wishes to. The position of the new sector can be changed by either entering the proper val- ues for ‘center bearing’ and ‘sector inner radius’ or by moving the sector with the mouse. Here the mouse courser changes form a white left pointed arrow to a hand with a pointed index finger once the courser is moved over the screen sector. By pressing the control but- ton on the keyboard and by simultaneously pressing the left mouse button, the newly copied sector can be moved anywhere on the planning screen.
The duplicating function ‘mirror-sector’ places the screen sector directly on the opposite side of the mainline of advance (MLA).
Another function to improve the representation of the screen, was the the function shift. This allows the user to obtain a larger area and gives him more flexibility in performing his screen planning. However the screen can also be shifted Up or to the left or right side of the screen.
Two additional but very important function were the ‘undo’ and ‘redo’ functions. These are important if mistakes are made during the planning process. With ‘undo’ only changes on the planning surface are affected. For example if a screen has been shifted, changed in size of possibly has been deleted, the ‘undo’ function allows such changes to be undone. In- cluded in this function are also changes with respect to scale, rotate, duplicate and shift screen. The number of ‘undo steps’ have been limited to 10 steps but could if required be extended to possibly 20 or more steps.
10