Embed Size (px)
Citation preview
Antimicrobial Usage in Secondary Care in Wales 2007-2016 November 2017
Laura Evans , Robin Howe 13/11/2017

2
Contents Section 1: Introduction ........................................................................................................................... 3
Background ......................................................................................................................................... 3
Welsh Antimicrobial Resistance Programme Surveillance Unit ..................................................... 3
Surveillance of Antimicrobial Usage in Secondary Care ................................................................. 3
Section 2: Key Points of Interest ............................................................................................................. 4
Section 3: Methods ................................................................................................................................. 5
Hospitals .............................................................................................................................................. 5
Pharmacy data .................................................................................................................................... 5
Antimicrobial Groups .......................................................................................................................... 6
Data presented ............................................................................................................................... 6
Data Interpretation ............................................................................................................................. 7
Box Plots .......................................................................................................................................... 7
Section 4: All Wales Antimicrobial Usage in Secondary Care ................................................................. 8
All Drugs .............................................................................................................................................. 8
Individual Drugs .................................................................................................................................. 9
Co-amoxiclav ..................................................................................................................................... 10
Cephalosporins.................................................................................................................................. 10
Fluoroquinolones .............................................................................................................................. 11
Piperacillin/Tazobactam ................................................................................................................... 11
Carbapenems .................................................................................................................................... 12
Co-trimoxazole .................................................................................................................................. 12
Aminoglycosides ............................................................................................................................... 13
Tetracyclines ..................................................................................................................................... 14

3
Section 1: Introduction
Background
Welsh Antimicrobial Resistance Programme Surveillance Unit
This report from the Welsh Antimicrobial Resistance Programme Surveillance Unit regarding
antimicrobial usage in secondary care is aimed at providing an overview of hospital antimicrobial
usage in Wales. The report has had to be selective in what is presented, and concentrates on the
major acute hospitals and district general hospitals in Wales.
Surveillance of Antimicrobial Usage in Secondary Care
While the use of antimicrobials has revolutionised our ability to treat infections it is associated
inevitably with the risk of development and spread of antimicrobial resistance leading to infections
that are increasingly difficult to treat, and antimicrobial-associated adverse events, importantly
Clostridium difficile infection (CDI).
It has been estimated that 20-50% of antimicrobial use, both in the Community and in Hospitals, is
“inappropriate”. This means that patients and society may be exposed to a significant unnecessary
risk of resistant infections and CDI. In addition there is a financial cost, not only in terms of
unnecessary antimicrobial use, but also the additional cost of treating resistant infections and CDI. A
key step in improvement of antimicrobial use is the surveillance and assessment of current
antimicrobial usage. This can be achieved using a number of complementary methods including:
Gross surveillance of antimicrobial usage at hospital, specialty or ward/unit level: This can provide comparative information regarding the choice and quantity of agents used, but does not address the indications or appropriateness of antimicrobial use. The current report provides such data at the hospital level and can be used to stimulate more detailed analysis.
Point Prevalence Survey (PPS): In this type of survey, the prescription chart of every patient in a ward or hospital on a set day is checked to see if an antibiotic has been prescribed, and the reasons for the prescription are recorded. This local information about which antibiotics are used and why can be used to target interventions. The Welsh Antimicrobial Resistance Programme is engaged with ECDC, an EU-funded collaboration that, among other projects, supports hospitals in performing comparative PPSs across Europe.
Local unit/ward audits: Audit can be used to explore in detail the indications, dose, duration etc. of antimicrobial prescriptions in order to identify areas for improvement.
It is hoped that access to this data will support:
Audit patterns of antimicrobial usage
Audit of compliance to guidelines and formularies
Monitoring the outcomes of interventions.
Educational programs
4
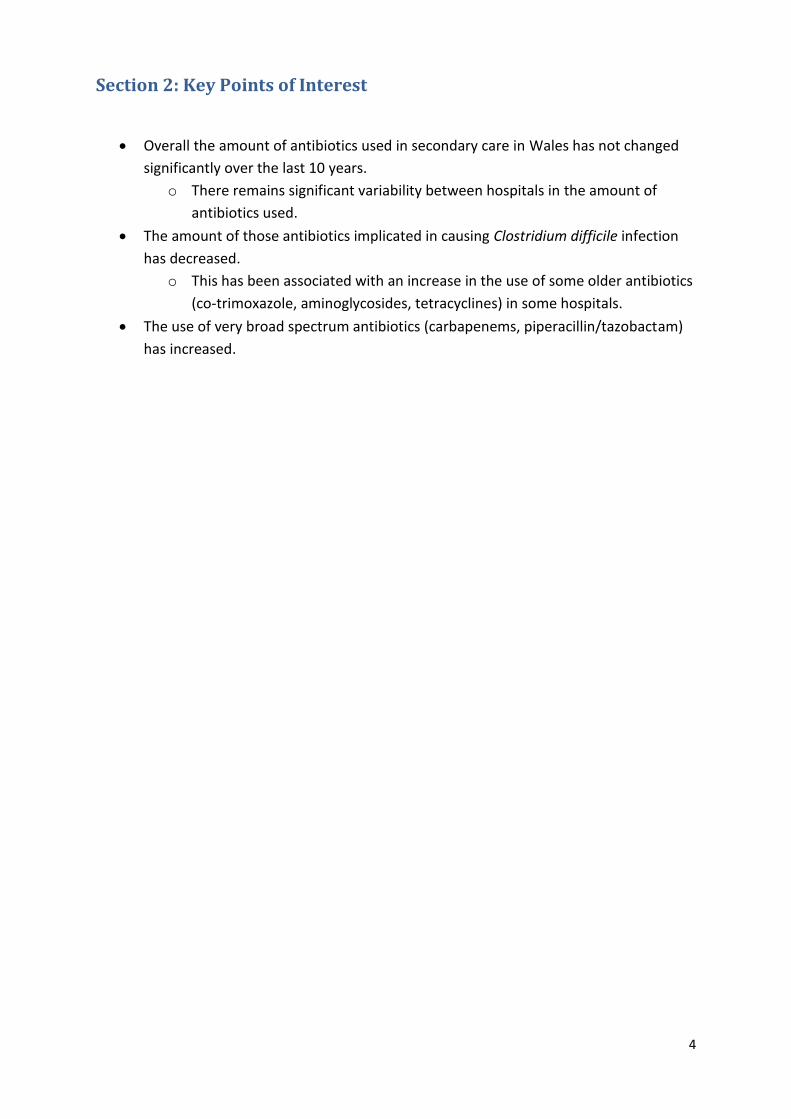
Section 2: Key Points of Interest
Overall the amount of antibiotics used in secondary care in Wales has not changed
significantly over the last 10 years.
o There remains significant variability between hospitals in the amount of
antibiotics used.
The amount of those antibiotics implicated in causing Clostridium difficile infection
has decreased.
o This has been associated with an increase in the use of some older antibiotics
(co-trimoxazole, aminoglycosides, tetracyclines) in some hospitals.
The use of very broad spectrum antibiotics (carbapenems, piperacillin/tazobactam)
has increased.
5
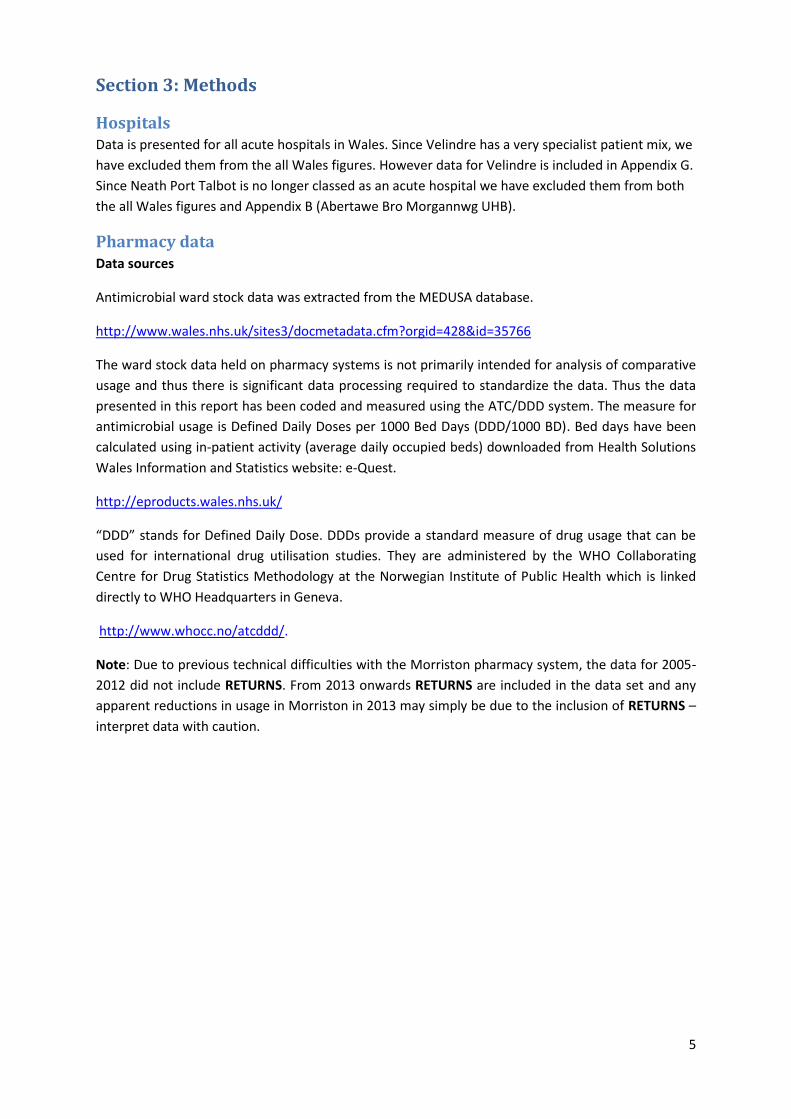
Section 3: Methods
Hospitals Data is presented for all acute hospitals in Wales. Since Velindre has a very specialist patient mix, we
have excluded them from the all Wales figures. However data for Velindre is included in Appendix G.
Since Neath Port Talbot is no longer classed as an acute hospital we have excluded them from both
the all Wales figures and Appendix B (Abertawe Bro Morgannwg UHB).
Pharmacy data Data sources
Antimicrobial ward stock data was extracted from the MEDUSA database.
http://www.wales.nhs.uk/sites3/docmetadata.cfm?orgid=428&id=35766
The ward stock data held on pharmacy systems is not primarily intended for analysis of comparative
usage and thus there is significant data processing required to standardize the data. Thus the data
presented in this report has been coded and measured using the ATC/DDD system. The measure for
antimicrobial usage is Defined Daily Doses per 1000 Bed Days (DDD/1000 BD). Bed days have been
calculated using in-patient activity (average daily occupied beds) downloaded from Health Solutions
Wales Information and Statistics website: e-Quest.
http://eproducts.wales.nhs.uk/
“DDD” stands for Defined Daily Dose. DDDs provide a standard measure of drug usage that can be
used for international drug utilisation studies. They are administered by the WHO Collaborating
Centre for Drug Statistics Methodology at the Norwegian Institute of Public Health which is linked
directly to WHO Headquarters in Geneva.
http://www.whocc.no/atcddd/.
Note: Due to previous technical difficulties with the Morriston pharmacy system, the data for 2005-
2012 did not include RETURNS. From 2013 onwards RETURNS are included in the data set and any
apparent reductions in usage in Morriston in 2013 may simply be due to the inclusion of RETURNS –
interpret data with caution.

6
Antimicrobial Groups Data is presented for the following antimicrobials/antimicrobial groups (ATC code):
Tetracyclines e.g. oxytetracycline (J01AA)
Broad spectrum penicillins (BSP) e.g. amoxicillin (J01CA)
Beta-lactamase sensitive penicillins e.g. penicillin V (J01CE)
Beta-lactamase resistant penicillins e.g. flucloxacillin (J01CF)
Beta-lactam/beta-lactamase inhibitor combinations (J01CR) o Co-amoxiclav (J01CR02) o Piperacillin/tazobactam (J01CR05)
All cephalosporins (J01D)
First generation cephalosporins e.g. cefalexin (J01DB)
Second generation cephalosporins e.g. cefuroxime (J01DC)
Third generation cephalosporins e.g. cefotaxime (J01DD)
Carbapenems e.g. imipenem (J01DH)
Trimethoprim & sulphonamides (J01E)
Macrolides e.g. erythromycin (J01FA)
Lincosamides & streptogramins e.g. clindamycin (J01F)
Aminoglycosides e.g. gentamicin (J01GB)
Fluoroquinolones e.g. ciprofloxacin (J01MA)
Glycopeptides e.g. vancomycin (J01XA)
Polymyxins e.g. colistin (J01XB)
Fusidic Acid (J01XC)
Imidazole derivatives e.g. metronidazole (J01XD)
Nitrofuran derivatives e.g. nitrofurantoin (J01XE)
Other antibacterials e.g. linezolid (J01XX)
Rifampicin (J04AB)
Data presented
Pharmacy systems are primarily designed to support stock control and distribution and may be
differently configured in different Trusts/Hospitals. In order to increase comparability, the
antimicrobial usage data presented in this report only includes the following “issue types” from
pharmacy:
In-patient Scripts (IP Scripts)
Patients’ Own Medications (POMs) or One Stop Medications
Returns
To Take Away (TTA)/Discharge Scripts
Ward Requisitions
The main objective of this report is to show trends in antimicrobial usage within the hospital. Thus
the dataset does not include the issue types A&E scripts, Clinics, Day cases, Day hospital, OP scripts
and Sales usage. We are unable to resolve returns against their original issue type, and only present
IP scripts, POMs, returns, TTAs and ward requisitions. Therefore, data presented may be an under
representation of true hospital usage if returns were for OP scripts etc. Conversely, the data may
represent an over estimate of true in hospital use depending on the amount of POMs and TTA
medication taken out of hospital.
7
Note 1: Only data for oral and parenteral antimicrobial usage are included in this report; it DOES
NOT include topical, inhaled, rectal or genital preparation usage.
Note 2: The data set for Bronglais hospital is incomplete, and does not include data for the clinical
decisions unit (CDU). CDU issues are dispensed to the A&E issue point and cannot be identified and
separated from A&E issues. Therefore, the data presented in this report is an UNDERESTIMATE of
usage at Bronglais hospital. The data for all other clinical decisions units are included in the relevant
hospital data sets.
Data Interpretation In interpreting the data presented in this report it is important to appreciate the ways in which the
data is collated and the factors that may drive variability in antimicrobial usage between hospitals.
Important issues that should be considered include:
Data applicability. As noted above, the data is drawn from Pharmacy computer systems that are designed primarily for stock control, and which are configured slightly differently in different units. These differences may mean that some antimicrobials that are used out-of-hospital are included in the data.
The usage of antimicrobials is standardised against a denominator of patient activity (i.e. 1000 bed days) but may also be influenced by patient case-mix in different hospitals. Thus a hospital which treats significant numbers of immunocompromised patients might be expected to use comparatively larger amounts of broad-spectrum antimicrobials.
The usage of antimicrobials should normally reflect the antimicrobial policies of each unit. For example the usage of piperacillin/tazobactam rather than an alternative broad spectrum agent may be a reflection of the hospital policy for the treatment of patients presenting with neutropenic sepsis.
The data presented can be used to identify changes in usage and monitor the effect of interventions.
When interpreting graphs it is important to note that the y-axis scales vary between graphs and care should be used in interpretation.
Box Plots
Each all Wales chart shows a series of box plots over time. The dark blue line represents the mean
usage for Wales. The box plots show the distribution of usage between the hospitals. The box
represents the interquartile range where the middle 50% of the data sit, i.e. where the bulk of
hospitals lie. The larger the box the more spread out the data is. The light blue line represents the
median or mid-point of the data. Often this is a more representative value for average as the mean
can be skewed by outliers. The upper and lower tails represent the maximum and minimum values
respectively.

8
Section 4: All Wales Antimicrobial Usage in Secondary Care
All Drugs
Usage across secondary care can be measured with different denominators. The Antimicrobial
Resistance Programme uses “/1000 bed days” as the standard denominator. An alternative and
equally valid denominator would be “/1000 admissions.” Figures 1a and 1b give the total usage of
antimicrobial groups listed in the methods section (ie oral and parenteral antibacterials) over the last
10 years using each of these denominators.
Using the denominator of bed days, the usage has not significantly changed over the last 10 years,
and has risen slightly from 2015. The mean usage for Wales for 2016 was 1077.5 DDD/1000 BD, 3%
higher than in 2015. The hospital with the lowest usage was Singleton with 722.9 DDD/1000 BD,
compared to Royal Glamorgan with 1447.6 DDD/1000 BD, twice as much as Singleton.
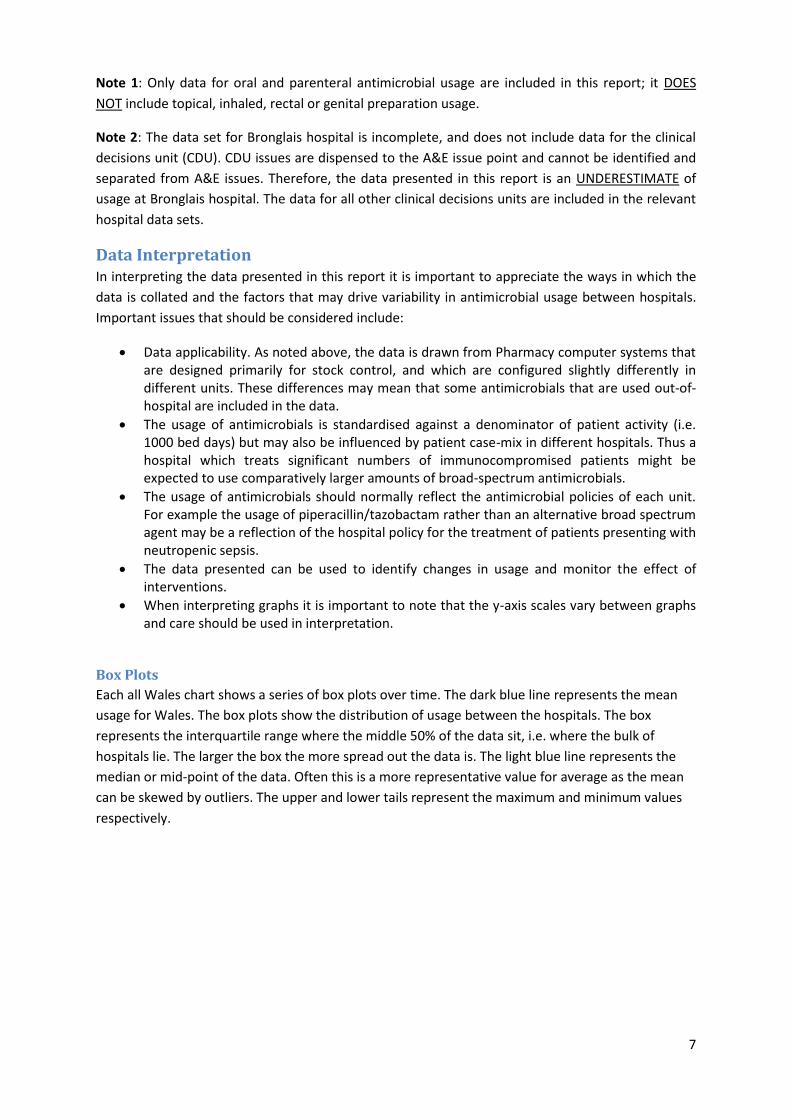
Using the denominator of admissions, usage has not significantly changed over the last 10 years. The
mean usage for Wales for 2016 was 5111.9 (DDD/1000 admissions) in line with 2015. The hospital
with the lowest usage was Singleton with 3256.4 DDD/1000 admissions, and the hospital with the
highest usage was University Hospital Llandough with 7029.0 DDD/1000 admissions.
The data presented describes the number of defined daily doses that are used in the hospitals of
Wales, but it should be noted that this does not necessarily correlate to the number of patients who
are treated with antibiotics or the number of infections that are treated, as patients may be
appropriately treated with either a single antibiotic or a combination of antibiotics for an infection.
Information regarding the number of patients treated with antibiotics can be sourced from the
annual Point Prevalence Survey performed across Wales each November.
Figure 1a: All Wales Antimicrobial Usage (DDD/1000 Bed days) (See data interpretation for an
explanation on how to read the graph).
400
600
800
1000
1200
1400
1600
2007 2008 2009 2010 2011 2012 2013 2014 2015 2016
DD
D/1
00
0 B
ed
Day
s
Year
9
Figure 1b: All Wales Antimicrobial Usage (DDD/1000 Admissions)
Individual Drugs
Information is presented for individual drugs (or drug groups) selected as they are agents that have
been implicated in Clostridium difficile infection (CDI) (co-amoxiclav, cephalopsorins,
fluoroquinolones), broad-spectrum antibiotics that can increase selection of further resistance
(piperacillin/tazobactam, carbapenems), or agents that may be used as alternatives to those agents
implicated in CDI, or broad-spectrum agents (co-trimoxazole, aminoglycosides, tetracyclines).
Over the last 5-10 years, hospitals and Health Boards have modified their antibiotic policies to
attempt to reduce the use of agents that may promote CDI or resistance. This can be a significant
challenge, so that reduction in one class of antibiotics will often lead to increased use of alternative
agents.
The appendices show information for these agents for each of the acute hospitals in the Health
Boards.
2000
3000
4000
5000
6000
7000
8000
9000
2013 2014 2015 2016
DD
D/1
00
0 A
dm
issi
on
s
Year
10
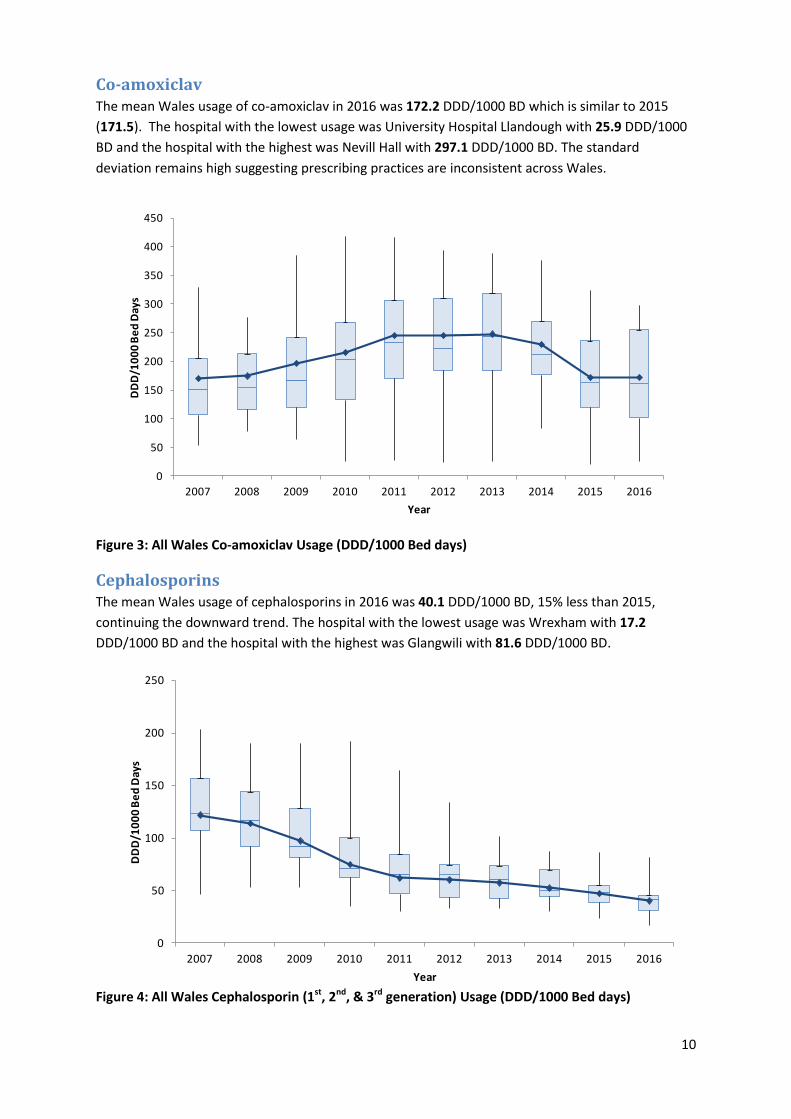
Co-amoxiclav The mean Wales usage of co-amoxiclav in 2016 was 172.2 DDD/1000 BD which is similar to 2015
(171.5). The hospital with the lowest usage was University Hospital Llandough with 25.9 DDD/1000
BD and the hospital with the highest was Nevill Hall with 297.1 DDD/1000 BD. The standard
deviation remains high suggesting prescribing practices are inconsistent across Wales.
Figure 3: All Wales Co-amoxiclav Usage (DDD/1000 Bed days)
Cephalosporins The mean Wales usage of cephalosporins in 2016 was 40.1 DDD/1000 BD, 15% less than 2015,
continuing the downward trend. The hospital with the lowest usage was Wrexham with 17.2
DDD/1000 BD and the hospital with the highest was Glangwili with 81.6 DDD/1000 BD.
Figure 4: All Wales Cephalosporin (1st, 2nd, & 3rd generation) Usage (DDD/1000 Bed days)
0
50
100
150
200
250
300
350
400
450
2007 2008 2009 2010 2011 2012 2013 2014 2015 2016
DD
D/1
00
0 B
ed
Day
s
Year
0
50
100
150
200
250
2007 2008 2009 2010 2011 2012 2013 2014 2015 2016
DD
D/1
00
0 B
ed
Day
s
Year
11
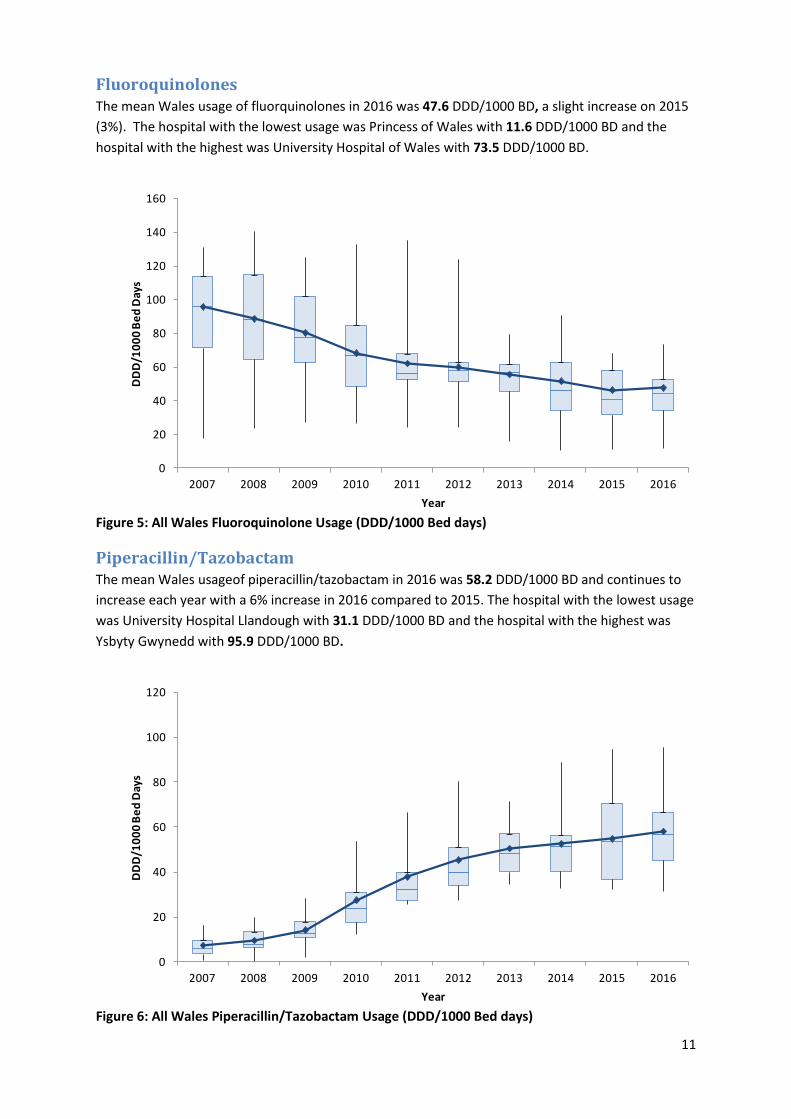
Fluoroquinolones The mean Wales usage of fluorquinolones in 2016 was 47.6 DDD/1000 BD, a slight increase on 2015
(3%). The hospital with the lowest usage was Princess of Wales with 11.6 DDD/1000 BD and the
hospital with the highest was University Hospital of Wales with 73.5 DDD/1000 BD.
Figure 5: All Wales Fluoroquinolone Usage (DDD/1000 Bed days)
Piperacillin/Tazobactam The mean Wales usageof piperacillin/tazobactam in 2016 was 58.2 DDD/1000 BD and continues to
increase each year with a 6% increase in 2016 compared to 2015. The hospital with the lowest usage
was University Hospital Llandough with 31.1 DDD/1000 BD and the hospital with the highest was
Ysbyty Gwynedd with 95.9 DDD/1000 BD.
Figure 6: All Wales Piperacillin/Tazobactam Usage (DDD/1000 Bed days)
0
20
40
60
80
100
120
140
160
2007 2008 2009 2010 2011 2012 2013 2014 2015 2016
DD
D/1
00
0 B
ed
Day
s
Year
0
20
40
60
80
100
120
2007 2008 2009 2010 2011 2012 2013 2014 2015 2016
DD
D/1
00
0 B
ed
Day
s
Year
12
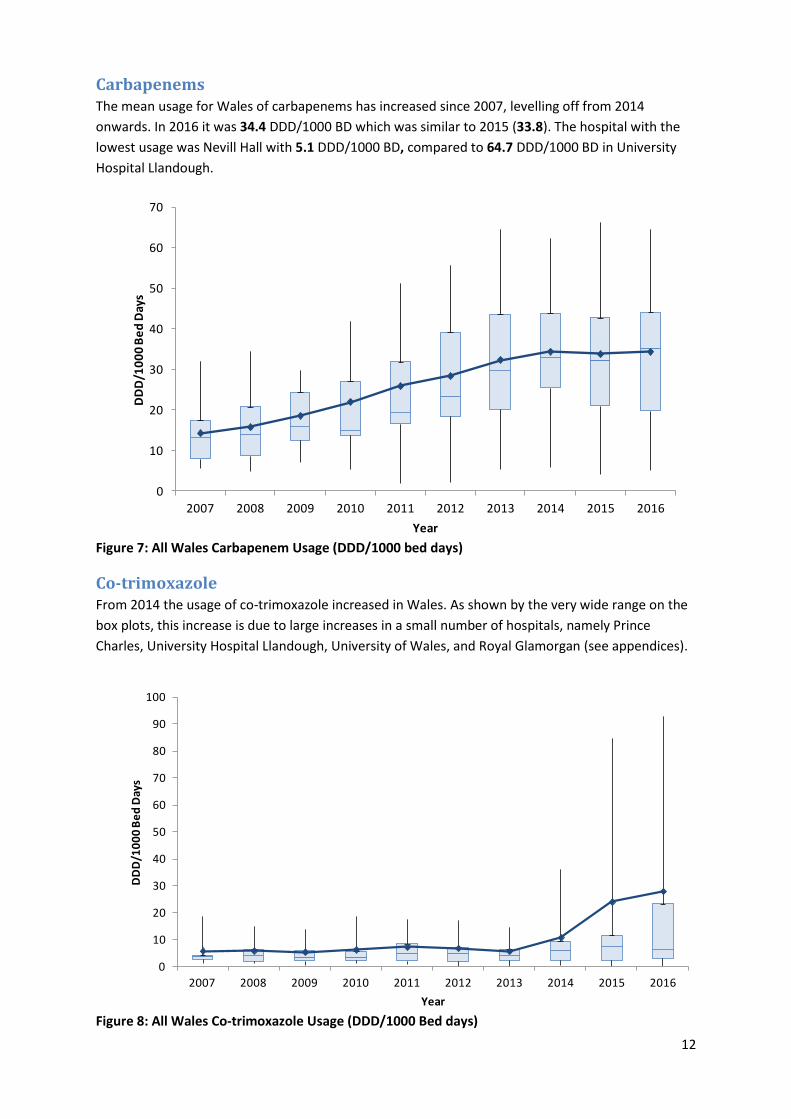
Carbapenems The mean usage for Wales of carbapenems has increased since 2007, levelling off from 2014
onwards. In 2016 it was 34.4 DDD/1000 BD which was similar to 2015 (33.8). The hospital with the
lowest usage was Nevill Hall with 5.1 DDD/1000 BD, compared to 64.7 DDD/1000 BD in University
Hospital Llandough.
Figure 7: All Wales Carbapenem Usage (DDD/1000 bed days)
Co-trimoxazole From 2014 the usage of co-trimoxazole increased in Wales. As shown by the very wide range on the
box plots, this increase is due to large increases in a small number of hospitals, namely Prince
Charles, University Hospital Llandough, University of Wales, and Royal Glamorgan (see appendices).
Figure 8: All Wales Co-trimoxazole Usage (DDD/1000 Bed days)
0
10
20
30
40
50
60
70
2007 2008 2009 2010 2011 2012 2013 2014 2015 2016
DD
D/1
00
0 B
ed
Day
s
Year
0
10
20
30
40
50
60
70
80
90
100
2007 2008 2009 2010 2011 2012 2013 2014 2015 2016
DD
D/1
00
0 B
ed
Day
s
Year
13
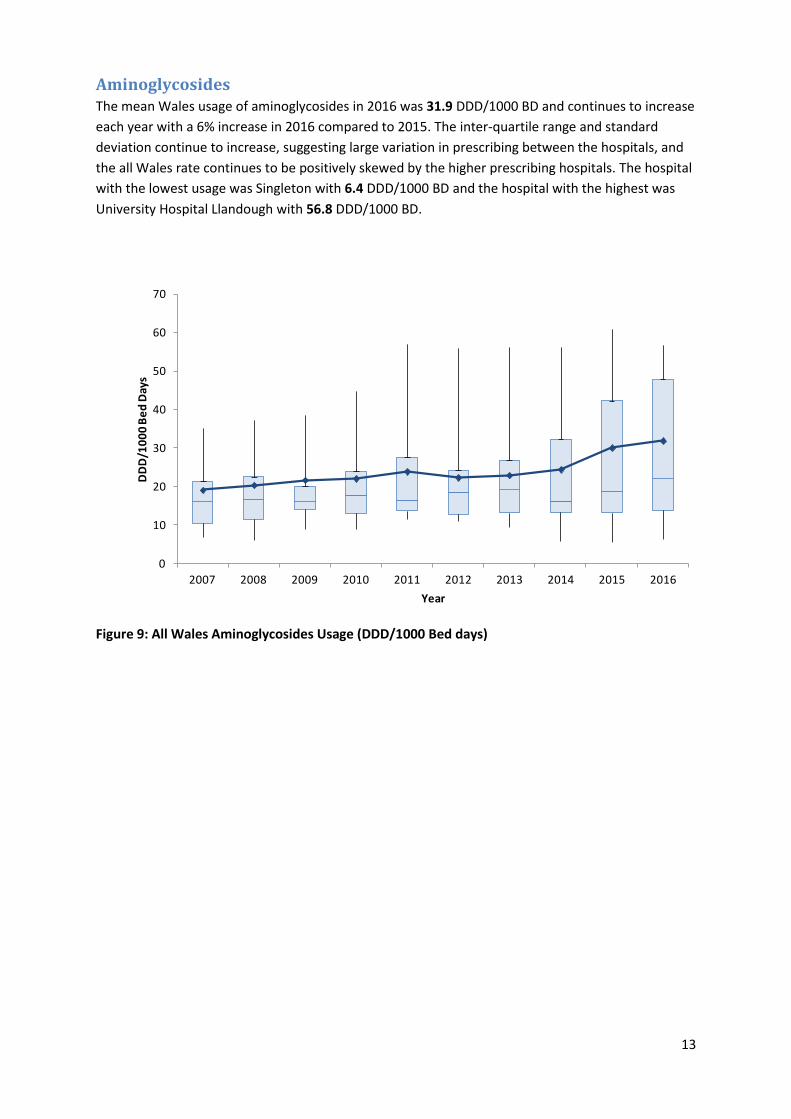
Aminoglycosides The mean Wales usage of aminoglycosides in 2016 was 31.9 DDD/1000 BD and continues to increase
each year with a 6% increase in 2016 compared to 2015. The inter-quartile range and standard
deviation continue to increase, suggesting large variation in prescribing between the hospitals, and
the all Wales rate continues to be positively skewed by the higher prescribing hospitals. The hospital
with the lowest usage was Singleton with 6.4 DDD/1000 BD and the hospital with the highest was
University Hospital Llandough with 56.8 DDD/1000 BD.
Figure 9: All Wales Aminoglycosides Usage (DDD/1000 Bed days)
0
10
20
30
40
50
60
70
2007 2008 2009 2010 2011 2012 2013 2014 2015 2016
DD
D/1
00
0 B
ed
Day
s
Year
14
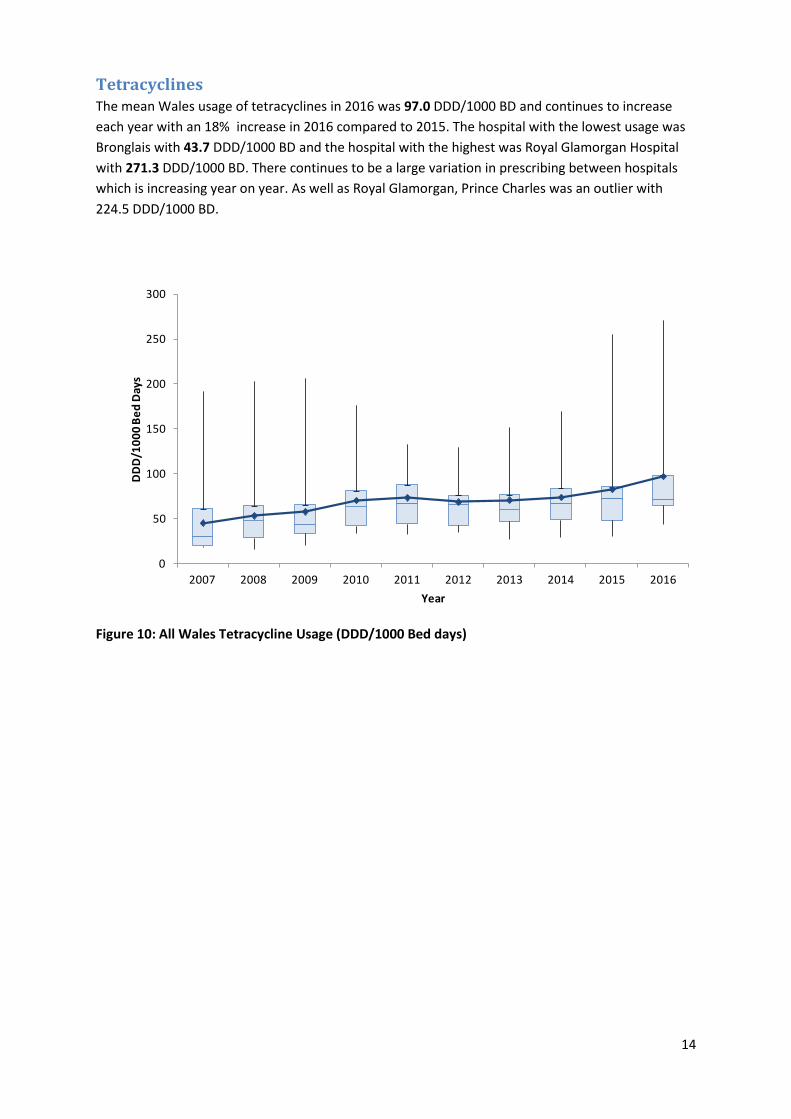
Tetracyclines The mean Wales usage of tetracyclines in 2016 was 97.0 DDD/1000 BD and continues to increase
each year with an 18% increase in 2016 compared to 2015. The hospital with the lowest usage was
Bronglais with 43.7 DDD/1000 BD and the hospital with the highest was Royal Glamorgan Hospital
with 271.3 DDD/1000 BD. There continues to be a large variation in prescribing between hospitals
which is increasing year on year. As well as Royal Glamorgan, Prince Charles was an outlier with
224.5 DDD/1000 BD.
Figure 10: All Wales Tetracycline Usage (DDD/1000 Bed days)
0
50
100
150
200
250
300
2007 2008 2009 2010 2011 2012 2013 2014 2015 2016
DD
D/1
00
0 B
ed
Day
s
Year