Embed Size (px)
Citation preview

1
Antimicrobial Use (AMU) Surveillance in Public Hospitals and Clinics
Hospital Authority Antibiotics Dispensing Data (2014 - 2016)
October 2019

2
Background
• The Hong Kong Strategy and Action Plan on Antimicrobial Resistance 2017-2022 was issued in July 2017
• Activity 3.2.1 suggests collecting antibiotic dispensing data from Hospital Authority (HA) and monitor antibiotic use in public hospitals and clinics
3
Data Scopes
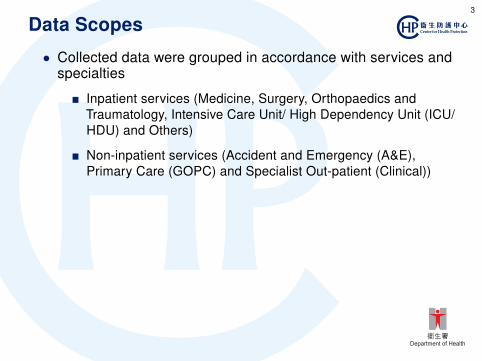
• Collected data were grouped in accordance with services and specialties
• Inpatient services (Medicine, Surgery, Orthopaedics and Traumatology, Intensive Care Unit/ High Dependency Unit (ICU/ HDU) and Others)
• Non-inpatient services (Accident and Emergency (A&E), Primary Care (GOPC) and Specialist Out-patient (Clinical))

4
Methodology and Analysis • Data covered section 5.1 of the British National Formulary (BNF) • Relevant items under the following classes of the World Health
Organization (WHO) Anatomical Therapeutic Chemical (ATC) classification system were included:
• J01 (Antibacterials for Systemic Use);
• A07AA (Antibiotics of Intestinal Antiinfectives, under Antidiarrheals,
Intestinal Antiinflammatory/ Antiinfective Agents, e.g. nystatin and
rifaximin); and
• P01AB (Nitroimidazole derivatives of Agents against Amoebiasis
and Other Protozoal Diseases under Antiprotozoals, e.g.
metronidazole and tinidazole through oral or rectal administration)
• Selected broad spectrum antibiotics dispensed to various
specialties were also examined because of their importance for
treatment of resistant infections in human

5
Methodology and Analysis Quantification of Antibiotic Usage
Defined Daily Dose (DDD)
• Defined as the assumed average maintenance dose per day for a drug used for its main indication in adults
• Commonly used across many overseas health authorities for comparison of drug usage
DDD per 1,000 patient-days
• A standardised unit commonly used internationally to measure antibiotic used in inpatient service
DDD per 1,000 attendances
• A standardised unit commonly used internationally to measure antibiotic used in non-inpatient service

6
Results (1) - Overall Dispensing
Service Type
Non-inpatient Service Inpatient Service
Service DDD per 1,000 Service DDD per 1,000 Year Antimicrobial†‡ Antimicrobial†‡
Volume* attendances§¶ Volume** patient-days§¶
2014 15,542,052 4,716,010 303.44 6,490,394 6,752,180 1,040.33 2015 15,806,229 4,958,607 313.71 6,611,605 6,994,498 1,057.91 2016 16,095,392 5,209,270 323.65 6,966,631 7,449,988 1,069.38
* In terms of attendances † In terms of DDD ‡ Rounded to the nearest integer § Rounded to two decimal places ¶ Due to rounding, figures may not precisely reflect the absolute figures ** In terms of patient-days

7
Results (2) - Five Most Dispensed Groups in Public Hospitals
ATC Pharmacological Subgroup Antimicrobial dispensed in DDD
Code Description Year Year Year Percentage change
2014* 2015* 2016* (2014 vs 2016)†‡
J01C Beta-Lactam 7,222,226 7,671,541 8,168,394 13.10%
Antibacterials, Penicillins J01M Quinolone Antibacterials 963,473 998,429 1,010,965 4.93% J01F Macrolides, Lincosamides 933,319 883,291 954,777 2.30%
and Streptogramins J01D Other Beta-Lactam 962,700 928,124 927,997 -3.60%
Antibacterials J01A Tetracyclines 446,934 535,124 643,337 43.94%
* Rounded to the nearest integer † Rounded to two decimal places ‡ Due to rounding, figures may not precisely reflect the absolute figures
8
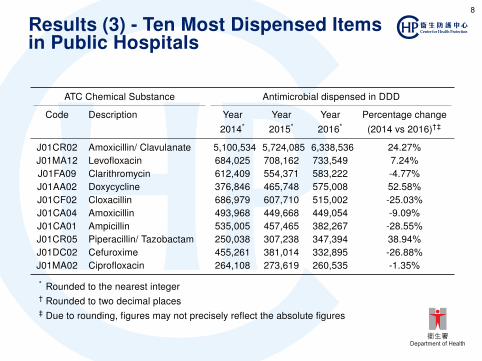
Results (3) - Ten Most Dispensed Items in Public Hospitals
ATC Chemical Substance Antimicrobial dispensed in DDD
Code Description Year Year Year Percentage change
2014* 2015* 2016* (2014 vs 2016)†‡
J01CR02 Amoxicillin/ Clavulanate 5,100,534 5,724,085 6,338,536 24.27% J01MA12 Levofloxacin 684,025 708,162 733,549 7.24% J01FA09 Clarithromycin 612,409 554,371 583,222 -4.77% J01AA02 Doxycycline 376,846 465,748 575,008 52.58% J01CF02 Cloxacillin 686,979 607,710 515,002 -25.03% J01CA04 Amoxicillin 493,968 449,668 449,054 -9.09% J01CA01 Ampicillin 535,005 457,465 382,267 -28.55% J01CR05 Piperacillin/ Tazobactam 250,038 307,238 347,394 38.94% J01DC02 Cefuroxime 455,261 381,014 332,895 -26.88% J01MA02 Ciprofloxacin 264,108 273,619 260,535 -1.35%
* Rounded to the nearest integer † Rounded to two decimal places ‡ Due to rounding, figures may not precisely reflect the absolute figures
9
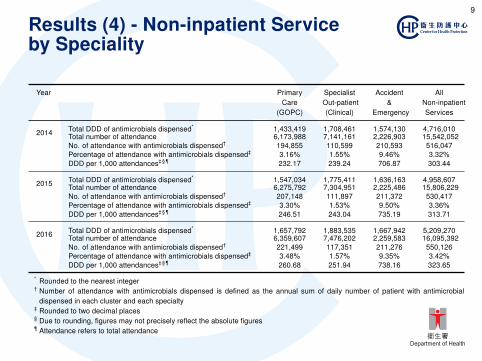
Results (4) - Non-inpatient Service by Speciality
Year Primary Specialist Accident All Care Out-patient & Non-inpatient
(GOPC) (Clinical) Emergency Services
2014 Total DDD of antimicrobials dispensed*
Total number of attendance No. of attendance with antimicrobials dispensed†
Percentage of attendance with antimicrobials dispensed‡
DDD per 1,000 attendancesद
1,433,419 6,173,988 194,855 3.16% 232.17
1,708,461 7,141,161 110,599 1.55% 239.24
1,574,130 2,226,903 210,593 9.46% 706.87
4,716,010 15,542,052 516,047 3.32% 303.44
2015 Total DDD of antimicrobials dispensed*
Total number of attendance No. of attendance with antimicrobials dispensed†
Percentage of attendance with antimicrobials dispensed‡
DDD per 1,000 attendancesद
1,547,034 6,275,792 207,148 3.30% 246.51
1,775,411 7,304,951 111,897 1.53% 243.04
1,636,163 2,225,486 211,372 9.50% 735.19
4,958,607 15,806,229 530,417 3.36% 313.71
2016 Total DDD of antimicrobials dispensed*
Total number of attendance No. of attendance with antimicrobials dispensed†
Percentage of attendance with antimicrobials dispensed‡
DDD per 1,000 attendancesद
1,657,792 6,359,607 221,499 3.48% 260.68
1,883,535 7,476,202 117,351 1.57% 251.94
1,667,942 2,259,583 211,276 9.35% 738.16
5,209,270 16,095,392 550,126 3.42% 323.65
* Rounded to the nearest integer † Number of attendance with antimicrobials dispensed is defined as the annual sum of daily number of patient with antimicrobial
dispensed in each cluster and each specialty ‡ Rounded to two decimal places § Due to rounding, figures may not precisely reflect the absolute figures ¶ Attendance refers to total attendance
10
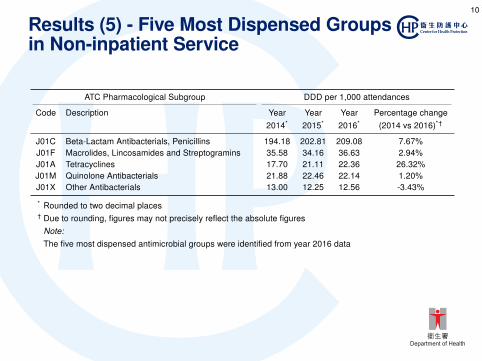
Results (5) - Five Most Dispensed Groups in Non-inpatient Service
ATC Pharmacological Subgroup DDD per 1,000 attendances
Code Description Year Year Year Percentage change
2014* 2015* 2016* (2014 vs 2016)*†
J01C Beta-Lactam Antibacterials, Penicillins 194.18 202.81 209.08 7.67% J01F Macrolides, Lincosamides and Streptogramins 35.58 34.16 36.63 2.94% J01A Tetracyclines 17.70 21.11 22.36 26.32% J01M Quinolone Antibacterials 21.88 22.46 22.14 1.20% J01X Other Antibacterials 13.00 12.25 12.56 -3.43%
* Rounded to two decimal places † Due to rounding, figures may not precisely reflect the absolute figures
Note:
The five most dispensed antimicrobial groups were identified from year 2016 data

11
Results (6) - Ten Most Dispensed Items in Non-Inpatient Service
ATC Chemical Substance DDD per 1,000 attendances
Code Description Year Year Year Percentage change
2014* 2015* 2016* (2014 vs 2016)*†
J01CR02 Amoxicillin/ Clavulanate 121.68 138.45 150.11 23.37% J01FA09 Clarithromycin 24.29 22.71 24.48 0.78% J01CA04 Amoxicillin 25.47 22.86 22.11 -13.18% J01CF02 Cloxacillin 24.93 22.10 19.22 -22.88% J01AA02 Doxycycline 13.94 17.55 19.10 36.99% J01CA01 Ampicillin 18.28 15.81 13.89 -24.03% J01MA12 Levofloxacin 12.66 13.15 13.50 6.63% J01XE01 Nitrofurantoin 12.51 11.82 12.05 -3.73% J01MA02 Ciprofloxacin 8.76 8.94 8.27 -5.51% J01EE01 Sulfamethoxazole/ Trimethoprim 8.21 7.84 8.04 -2.10%
* Rounded to two decimal places † Due to rounding, figures may not precisely reflect the absolute figures
Note:
The ten most dispensed antimicrobials were identified from year 2016 data
12
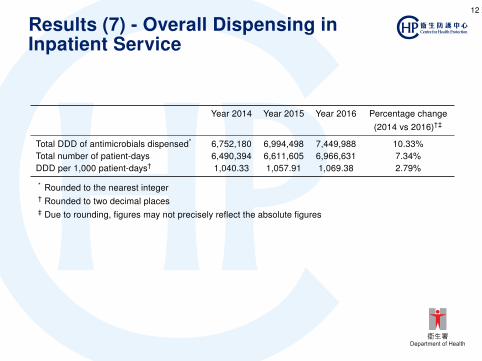
Results (7) - Overall Dispensing in Inpatient Service
Year 2014 Year 2015 Year 2016 Percentage change
(2014 vs 2016)†‡
Total DDD of antimicrobials dispensed* 6,752,180 6,994,498 7,449,988 10.33% Total number of patient-days 6,490,394 6,611,605 6,966,631 7.34% DDD per 1,000 patient-days† 1,040.33 1,057.91 1,069.38 2.79%
* Rounded to the nearest integer † Rounded to two decimal places ‡ Due to rounding, figures may not precisely reflect the absolute figures
13
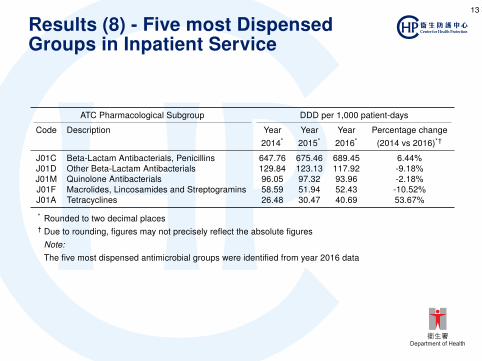
Results (8) - Five most Dispensed Groups in Inpatient Service
ATC Pharmacological Subgroup DDD per 1,000 patient-days
Code Description Year Year Year Percentage change
2014* 2015* 2016* (2014 vs 2016)*†
J01C Beta-Lactam Antibacterials, Penicillins 647.76 675.46 689.45 6.44% J01D Other Beta-Lactam Antibacterials 129.84 123.13 117.92 -9.18% J01M Quinolone Antibacterials 96.05 97.32 93.96 -2.18% J01F Macrolides, Lincosamides and Streptogramins 58.59 51.94 52.43 -10.52% J01A Tetracyclines 26.48 30.47 40.69 53.67%
* Rounded to two decimal places † Due to rounding, figures may not precisely reflect the absolute figures
Note:
The five most dispensed antimicrobial groups were identified from year 2016 data

14
Results (9) - Top Ten Most dispensed in Inpatient Service
ATC Chemical Substance DDD per 1,000 patient-days
Code Description Year Year Year Percentage change
2014* 2015* 2016* (2014 vs 2016)*†
J01CR02 Amoxicillin/ Clavulanate 494.48 534.78 563.03 13.86% J01MA12 Levofloxacin 75.07 75.68 74.11 -1.29% J01CR05 Piperacillin/ Tazobactam 38.47 46.45 49.85 29.60% J01AA02 Doxycycline 24.68 28.48 38.42 55.66% J01DC02 Cefuroxime 54.47 43.03 35.13 -35.51% J01CF02 Cloxacillin 46.15 39.09 29.51 -36.06% J01FA09 Clarithromycin 36.20 29.54 27.17 -24.95% J01DH02 Meropenem 19.94 24.00 26.04 30.60% J01DD04 Ceftriaxone 23.83 22.80 23.98 0.61% J01CA01 Ampicillin 38.65 31.40 22.78 -41.06%
* Rounded to two decimal places † Due to rounding, figures may not precisely reflect the absolute figures
Note:
The ten most dispensed antimicrobials were identified from year 2016 data
15
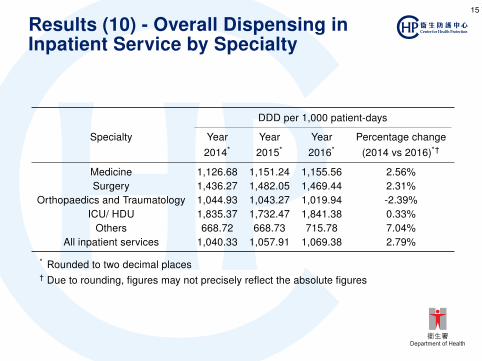
Results (10) - Overall Dispensing in Inpatient Service by Specialty
DDD per 1,000 patient-days
Specialty Year Year Year Percentage change
2014* 2015* 2016* (2014 vs 2016)*†
Medicine 1,126.68 1,151.24 1,155.56 2.56% Surgery 1,436.27 1,482.05 1,469.44 2.31%
Orthopaedics and Traumatology 1,044.93 1,043.27 1,019.94 -2.39% ICU/ HDU 1,835.37 1,732.47 1,841.38 0.33%
Others 668.72 668.73 715.78 7.04% All inpatient services 1,040.33 1,057.91 1,069.38 2.79%
* Rounded to two decimal places † Due to rounding, figures may not precisely reflect the absolute figures

16
Results (11) - Broad Spectrum Antimicrobials Dispensed in Inpatient Service
WHO ATC DDD per 1,000 patient-days
Pharmacological Subgroup Chemical Substance Year Year Year Percentage change 2014* 2015* 2016* (2014 vs 2016)*†
Penicillins Beta-Lactam Antibacterials,
Piperacillin/ Tazobactam 38.47 46.45 49.85 29.60%
Antibacterials Other Beta-Lactam
Meropenem 19.94 24.00 26.04 30.60%
Other Antibacterials Vancomycin‡ 11.40 12.59 13.26 16.30%
Antibacterials Other Beta-Lactam
Cefoperazone/ Sulbactam 4.69 4.63 4.47 -4.71%
Antibacterials Other Beta-Lactam
Ceftazidime 2.72 3.35 3.31 21.82%
Antibacterials Other Beta-Lactam
Cefepime 2.28 3.20 3.29 44.61%
Other Antibacterials Colistin 2.47 2.47 2.01 -18.76% Other Antibacterials Linezolid 1.68 1.57 1.71 1.70%
Antibacterials Other Beta-Lactam
Imipenem and Cilastatin 1.78 1.68 1.29 -27.22%
Other Antibacterials Daptomycin 0.53 0.75 0.84 58.84% Other Antibacterials Teicoplanin 0.09 0.09 0.07 -28.74%
Total 86.03 100.76 106.13 23.36% * Rounded to two decimal places † Due to rounding, figures may not precisely reflect the absolute figures ‡ Only parenteral vancomycin (WHO ATC Chemical Substance Code J01XA01) was
included for analysis Note: Antimicrobials are ordered by descending order of dispensed quantity in year 2016

17
Results (12) - Broad Spectrum Antimicrobials Dispensed in Inpatient Service by Specialty
DDD per 1,000 patient-days
Specialty Year Year Year Percentage change
2014* 2015* 2016* (2014 vs 2016)*†
Medicine 110.08 131.62 137.22 24.66% Surgery 77.62 92.78 101.90 31.27%
Orthopaedics and Traumatology 42.19 49.93 59.81 41.75% ICU/ HDU 643.94 597.66 635.69 -1.28%
Others 46.13 52.64 53.11 15.12% All inpatient services 86.03 100.76 106.13 23.36%
* Rounded to two decimal places † Due to rounding, figures may not precisely reflect the absolute figures

18
Discussions (1) - Overall
• Overall increased dispensing quantity (in DDD/1,000 attendances or patient-days) from 2014-2016
• Percentage increase in non-inpatient (in DDD/1,000 attendances) was greater than that of inpatient (in DDD/1,000 patient-days)
• The five most dispensed antibiotic groups in both hospitals and clinics were antibiotics commonly used to treat common bacterial infections in both hospitals and clinics. They are usually prescribed as first-line treatment for suspected bacterial infections.
19
Discussions (2) - Broad Spectrum Antimicrobials
• The 11 locally-important broad spectrum antimicrobials accounted for about 9.92% of the overall dispensing quantity in inpatient service in 2016
• ICU/HDU has the highest rate of dispense of these broad spectrum antibiotics
• It is not an unexpected observation as ICU/ HDU is the specialty in which more vulnerable patients and more patients with resistant infections are being treated
20
Discussions (3) - Broad Spectrum Antimicrobials
• In 2016 piperacillin/ tazobactam and meropenem were among the 10 most commonly dispensed antibiotics in inpatient service
• The two broad spectrum antimicrobials were found to have dispensed around 30% more in 2016 when compared with that of 2014
• Being recognised as last resort antimicrobials for treating resistant bacterial infections, colistin was found to have percentage decrease of 18.76% when compared with 2014

21
Limitations
• Clinical data needed to be converted before analysis and surveillance
• Information on indications is not available in dispensing data
• Analysis is based on dosage form1 and route of administration2
• The analysis assumes that amount of antibiotics dispensed equals to amount of antibiotics consumed
• Results cannot be used to just the appropriateness of use
1Common dosage forms include: tablet, solid for oral suspension, injectable, etc
2Common routes of administration include: oral, injection, etc
22
Way Forward
• Antibiotic Stewardship Programme should be enhanced to expand its present coverage to advocate further on appropriate use of antibiotics in HA
• Antibiotics are precious resources for human health and modern medicines and every member of the society should make efforts to preserve it effectiveness against bacterial infection

23
What can I do to combat AMR? For General Public
• Proper use of antibiotics • Do not demand antibiotics from your doctor
• Follow your doctor’s advice when taking antibiotics
• Do not stop taking antibiotics by yourselves even if you are
feeling better
• Do not take leftover antibiotics
• Do not share your antibiotics with others
• Do not self-purchase antibiotics without a prescription
• Practise frequent hand hygiene, especially before eating and
taking medicine, and after going to the toilet
• Ensure your vaccination is up-to-date
• Maintain cough etiquette, wear a mask if you have respiratory
symptoms
24
What can I do to combat AMR? For Healthcare Workers
• Antibiotics are precious resources against infections. Healthcare workers play an essential role in preserving them:
• Prescribe antibiotics in accordance with therapeutic guidelines in
consideration of clinical situations • Educate your patients
� To take antibiotics as prescribed and always complete the full
course of medication
� Discuss about the importance of appropriate antibiotic use and the
dangers of AMR where appropriate
� Talk about how to prevent infections and their spread. For example,
vaccination, maintain good personal hygiene and hand hygiene
• Apply best practice of infection prevention and control, and to
practise frequent hand hygiene
• Receive seasonal influenza vaccine