Embed Size (px)
Citation preview

Antitrust Analysis for the Internet Upstream Market:
a BGP Approach
Alessio D’Ignazio1 & Emanuele Giovannetti2
Working Paper Number 37
1 Faculty of Economics, University of Cambridge 2 School of Economics, University of Cape Town and University of Rome ‘ La Sapienza’
Antitrust Analysis for the Internet UpstreamMarket: a BGP Approach
Alessio D’Ignazio∗& Emanuele Giovannetti†
April 2006
Abstract
In this paper we study concentration in the European Internet up-stream access market. The possibility of measuring market concentrationdepends on a correct definition of the market itself; however, this is notalways possible, since, as it is the case of the Internet industry, very oftenAntitrust authorities lack reliable pricing and traffic data. This difficultymotivates our paper. We present an alternative approach based on theinference of the Internet Operators interconnection policies using micro-data sourced from their Border Gateway Protocol tables.
We assess market concentration following a two step process: firstlywe propose a price-independent algorithm for defining both the verticaland geographical relevant market boundaries, then we calculate marketconcentration indexes using two novel metrics. These assess, for eachundertaking, both its role in terms of essential network facility and ofwholesale market dominance. The results, applied to four leading InternetExchange Points in London, Amsterdam, Frankfurt and Milan, show thatsome vertical segments of these markets are highly concentrated, whileothers are extremely competitive. According to the Merger Guidelinessome of the estimated market concentration values would immediatelyfall within the special attention category.
1 IntroductionMarket power is usually associated to the ability of a firm to raise prices abovemarginal costs, or above their competitive level, without loss of profits. Compe-tition authorities are interested in market power because of its potential effectsin reducing welfare, at least from a static point of view.1
In this paper we attempt to measure the extent of market power character-ising the Internet upstream access in Europe. The structure of the Internet is
∗Faculty of Economics, University of Cambridge.†School of Economics, University of Cape Town, and University of Rome ’La Sapienza’1However its impact on the dynamic and productive efficiency is controversial, because of
the role of market power as an incentive to innovate.
1
indeed highly hierarchical, with a relatively small number of upstream providers(the Internet backbones -IBPs-) that face the interconnection demand arisingfrom a much larger number of downstream operators of smaller dimensions (In-ternet Service Providers -ISPs-). Our attempt is also related to the ongoingdebate on the possibility of introducing some form of regulation in the Internetupstream access market, whose mechanisms are blamed by many countries tobe the cause of the persistence of the digital divide.2
It is clear that the possibility of correctly measuring market power dependson a correct definition of the market itself; however, this is not always possi-ble, since very often the antitrust authorities lack reliable data. This is indeedwhat seems to happen for the proposed mergers between Internet backbones.After the early antitrust cases (1998, MCI and WorldCom merger; 2000, MCI-WorldCom and Sprint), new guidelines were introduced in July 2002. Theirapplicability is however still very problematic for the assessment of the Inter-net upstream connectivity market, where both interconnection agreements andtraffic flows are sealed under confidentiality agreements.This difficulty motivates our paper. We present an alternative approach to
define the relevant market and assess market concentration in the upstreamInternet access by using publicly available data. In particular, our analysis isbased on the inference of interconnection policies, expressing the real bargainingpower of each ISP: these can be essentially grouped into (1) paid transit, acontractual relation characterised by non linear pricing, a typical discriminationpractice and (2) peering, a bilateral free interconnection decision based on areciprocal agreement, again an open form of discrimination formally expressed inthe peering policy of every provider. The inference is obtained from the BorderGateway Protocol (BGP) output data (the BGP is a set of “instructions” thatrules the transmission of traffic packets over the Internet). We use two differentmetrics as proxies for each ISP’s traffic flows: one of these measures infersthe number of the ISP’s downstream customers, and the other its centrality or“degree of unavoidability”.We assess market concentration in the European upstream Internet market
following a two step process: firstly we determine the relevant market applyingthe vertical and geographical relevant market definition algorithms and criteria;then we calculate market concentration indexes, for the Internet Upstream Rout-ing taking place in Europe, via four leading Internet Exchange Points (IXPs):3
the London Internet Exchange Point (LINX), The Deutsche Commercial Inter-net Exchange Point (DECIX), the Amsterdam Internet Exchange Point (AM-SIX) and the Milan Internet Exchange Point (MIX).Interestingly, our measures prove to be very close to the one calculated with
actual traffic data,4 indicating a potential application of this approach to theantitrust and regulation authorities guidelines. The results show that some
2For a review of this debate see Giovannetti and Ristuccia (2005).3 IXPs are independent organizations composed by Internet Service Providers, where they
can route their traffic in a cost effective and technically efficient way.4These data were obtained for research purposes from the London Internet Exchange Point
under confidentiality and a non disclosure agreement.
2

vertical segments of these markets are highly concentrated, while others areextremely competitive. According to the Merger Guidelines [U.S. Departmentof Justice (1997)], some of the estimated market concentration values wouldimmediately fall within the special attention category.The rest of the paper is organised as follow: section 2 describes some of
the early antitrust inquires for the Internet backbone in the EU and the US.Section 3 discusses the new Regulatory framework for the market of electroniccommunication issued in 2002 by the Commission and section 4 revises someearly related studies. Section 5 describes more recent studies on which we baseour classification algorithms while section 6 provides the actual classification,discusses how to use these algorithms to evaluate market concentration acrossthe European IXPs, and suggests how to define the relevant vertical marketboundaries. Section 7 applies the vertical and geographical relevant market def-inition to calculate market concentration in various European Internet upstreammarkets. Finally section 8 concludes the paper.
2 Early Antitrust analysis for the backbone mar-ket
The Internet backbone market witnessed an extremely rapid transformation inthe last ten years, also because of a large wave of mergers and acquisitions. Thisprocess led to growing concerns relating to possible abuse of market power, oneexpression of which has been identified in the different interconnection chargeslevied to small and larger providers, a process started in 1997 by UUNET’sdecision of setting minimum traffic requirements for free peering with smallerISP’s.An early analysis was provided by Cave (1999) who analyzed the possible
problems and/or desirability of having some degree of market power and ahierarchical structure in the Internet backbone.The two most relevant antitrust cases discussed in the industry have been the
merger between MCI and WorldCom in 1998 and the rejected proposed mergerbetween MCI-WorldCom and Sprint in 2000. In both cases the identification ofthe relevant market posed difficult but interesting questions due to the lack ofreliable data.During the 1998 MCI WorldCom merger analysis the European Commis-
sion5 included in the backbone market all the providers which were able toobtain global connectivity either through private or public peering, needing notransit contracts. This definition was subsequently modified: only the providers
5On the 11th of January 2000, the European Commission received a notification by whichMCI-WorldCom would merge with Sprint by an exchange of shares. After an extensive in-vestigation into the merger proposal on the 28th of June 2000 the Commission adopted thedecision that “ The notified concentration consisting of the merger between MCI-WorldComand Sprint is declared incompatible with the common market and the functioning of the EEAAgreement.” [Official Journal of the European Commission (2000)]
3
reaching global connectivity exclusively via private peering were included in thebackbone market (see Buccirossi et al., 2005).The three relevant markets affected by the proposed merger were identi-
fied as being: 1) the provision of host to point of presence connectivity, 2) theprovision of Internet access services and 3) the provision of top-level or univer-sal connectivity. The investigation, concentrated in this last product market.One of the main issues at stake, and a major source of disagreement betweenthe Commission and the two defendant companies, concerned the hierarchicalnature of the Internet. The Commission stressed that a hierarchical structurewas clearly exposed by the evidence that top level providers achieve their con-nectivity entirely by settlement-free peering mainly at private peering points,whereas smaller providers need to purchase transit from top-tier networks toachieve global connectivity.6 The Commission defined the relevant market asthe one composed by the providers equipped with a set of peering agreementswith 100% settlements free connectivity across the Internet and found that onlyfive top-level networks, MCI WorldCom, Sprint, AT&T, Cable & Wireless andGTE, satisfied these criteria. Consequently the antitrust authorities defined themarket participants as those who peer both with MCI and Sprint and by addingnetworks accessible directly rather than through a third party, a total of seven-teen players were considered for the analysis of the market for top level Internetconnectivity. Any other Internet provider, left outside this market definition,would require to purchase transit from at least one of the top five providers toachieve global connectivity.The proposed new merged entity would have had a market share between [37-
51]% in terms of traffic flows, against the next competitor’s one not larger than15%. The Commission concluded that the proposed merger would have led tothe emergence of a top level network provider, able to act almost independentlyof its competitors and customers and to determine its own, and its competitors,prices and the technical developments in the industry. Another relevant issue,decisive in appraising the competitive effects of the merger, was its effects onpotential entry in the industry. Since the peering rules require an entrant to be ofconsiderable size, the Commission found that the merger would have generateda formidable barrier for potential entrants in the top tier backbone market.Following these considerations, in July 2000, the proposed merger between
MCI-WorldCom and Sprint has been abandoned after the block imposed not
6The dominant position of WorldCom had been attained through a very active acquisitionpolicy. In the Civil Action brought by Department of Justice of the United States [U.S.Department of Justice (DoJ) 2000a] against the acquisition of Intermedia Communications byWorldCom are described some of the more than 60 acquisitions operated by this company:in 1995 WorldCom acquired the network service operations of Williams Telecommunicationsin 1996, through the acquisition of MFS Communications Company, WorldCom obtained thecontrol of UUNET, the world largest Internet backbone provider. In 1998 WorldCom acquiredCompuserve a leading Internet provider and ANS, AOL’s primary Internet backbones network.Other acquired backbones were GridNet, Unicom-Pipex, InNet, NL Net and Metrix Interlink.As a result of the leadership position reached in these years the WorldCom acquisition ofMCI in September 1998 has been accompanied by the imposition, by the US DoJ and the EUCommission, for MCI to divest its Internet assets to Cable & Wireless.
4

only in the EU but also by the U.S. Department of Justice (DoJ). The FederalTrade Commission considers Market concentration as the fundamental para-meter when assessing the competitive impact of a proposed merger. Indeed,following the U.S. Horizontal Merger Guidelines , “A merger is unlikely to cre-ate or enhance market power or to facilitate its exercise unless it significantlyincreases concentration and results in a concentrated market, properly definedand measured. Mergers that either do not significantly increase concentrationor do not result in a concentrated market ordinarily require no further analy-sis.”7 The results of the DoJ merger analysis found that “the proposed mergerof WorldCom and Sprint will cause significant harm to competition in many ofthe nation’s most important telecommunications markets. By combining two ofthe largest telecommunications firms in these markets, the proposed acquisitionwould substantially lessen competition in violation of Section 7 of the ClaytonAct... For millions of residential and business consumers throughout the nation,the merger will lead to higher prices, lower service quality, and less innovationthan would be the case absent its consummation. The United States thereforeseeks an order permanently enjoining the merger.” This motivation was basedon the role of backbone market concentration as expressed by the HHI, calcu-lated on the traffic shares, which was, before the merger, approximately 1850;and it would have risen, because of the merger, by approximately 1150 pointsto circa 3000. [U.S. Department of Justice (DoJ) 2000b].8
3 New Regulatory Framework and the Commis-sion’s guidelines
The regulatory interest in the backbone market remained high and, after apublic consultation on the Review of the Electronic Communications Sector,the Commission proposed in July 2000 a package of measures introducing anew regulatory framework for electronic communication networks and services.This was intended to provide a lighter regulatory touch where markets have be-come more competitive while supporting sustainable and affordable prices andprotecting basic consumers rights.9 The application of the Regulatory frame-work was then essentially described, also in its relevant operational aspects, in
7 In detail, the FTC uses the Hirschman-Herfindahl Index ("HHI") of market concentration.The HHI is calculated by summing the squares of the individual market shares of all theparticipants and multiplied by ten thousands. The guidelines focus on two figures: pre-mergerHHI concentration index level, and post-merger HHI concentration increments. When thepost-merger HHI is below 1000, the guidelines consider the market as being non concentrated,and no further analysis is required. When the post-merger HHI ranges between 1000 and 1800the guidelines consider these markets as moderately concentrated. In this case further scrutinyis required only if the merger would increase the HHI of more than 100 points. Finally, whenpost-merger HHI is above 1800 the markets are considered highly concentrated. In this casean increase in the HHI of more than 50 points will start raising concerns, while an increase ofmore than 100 points is considered as potentially dangerous for the increase of market powerit will entail.
8 http://www.usdoj.gov/atr/cases/f5000/5051.pdf9The final test was published on the 4th of February 2002, (See Official Journal 2002)
5

the “Guidelines on market analysis and assessment of significant market powerunder the Community regulatory framework for electronic communications net-works and services” published on the 11th of July 2002.The Commission’s guidelines focus only on issues related to (i) market de-
finition; and (ii) the assessment of significant market power (SMP) within themeaning of Article 14 of the framework Directive, that individuated SMP whena firm “enjoys a position of economic strength affording it the power to be-have to an appreciable extent independently of its competitors, customers andultimately consumers”.
3.1 Market Definition: Assessing Vertical Market Bound-aries
The concept of relevant market is a key issue for antitrust analysis, since it iscentral to the assessment of market power. Indeed, article 81 in the Treaty ofRome, states that the limitation of competition is to be assessed on the relevantmarket; while the article 82 defines market dominance in relation to marketshares, and the merger control is based on the dominant position in relation tomarket shares.Among different market definitions, two have received most attention from
the literature. One approach focussed on the “economic markets”, market forgoods resembling each other where the law of one price was supposed to operate.However Werden and Froeb (1994) and Scheffman and Spiller (1987) argued thatthis concept of economic market was inadequate to antitrust analysis. The aimof the second approach was to define the relevant market as instrumental to itsapplications in the antitrust analysis. The leading definition of relevant market,adopted by the European Commission, hence, is based on the characteristics ofsubstitutability among products, expressed by the cross-price elasticities: therelevant market is the set of products and geographic regions which in someway constrain the pricing behaviour of the firms providing the product underscrutiny; this means that the relevant market is the set of commodities whichare, in respect to consumers’ preferences, good substitutes of each other, so thata price change in one of them will provoke a demand change in the other.Whenever assessing whether or not a given set of products or services in a
given geographical area constitutes a relevant market, for competition policypurposes, one has therefore to assess the existence, and strength, of competi-tive constraints on the price-setting behaviour of the producers of this set ofcommodities. A relevant market is then composed by the set including all ofthe commodities for which, if taken as a whole, the excluded ones do not havecompetitive effects on them. These competitive constraints can either arise fromthe demand-side of the market through demand substitution of the commodi-ties under analysis or from the supply-side substitution, either through existingor potential competitors.10 Supply-side substitutability indicates whether sup-
10Clearly potential competitors substitution will take a longer time interval than the existingcompetitors’ one.
6

pliers other than those offering the commodity in question start offering therelevant commodities, themselves, or whether they react to the initial priceincrease by changing the price of their related commodities.The usual, empirical way of assessing demand and supply-side substitution
is to apply the so-called ‘hypothetical monopolist test’. This test asks whatwould happen if there were a small but significant, lasting increase in the priceof a given product or service, assuming that the prices of all other productsor services remain constant. This test is also known as ‘SSNIP’ (small butsignificant non transitory increase in price) and its importance lies primarilyin its use as a conceptual tool for assessing evidence of competition, based onsubstitutability, between different products or services.The nature of the SSNIP test is recursive. It starts by considering an initial
set of products that are thought to define the market and simulate an increasein their price; in practice, the Commission’s guidelines suggest that the NationalRegulatory Authorities should normally consider reactions to a permanent priceincrease of between 5 and 10%. Suppose that the price increase is unprofitable,since consumers are substituting other products for the one the price of whichincreased: in this case the test has to be re-carried, with reference to the setof commodities composed by the initial one and by all those other commoditieswhich the test found as relevant substitutes in its previous rounds.The SSNIP test should be repeated considering an increasing set of products
up to the point where a relative price increase within the geographic and productmarkets defined will not lead consumers to switch to readily available substitutesor to suppliers located in other areasThe SSNIP approach has however some limitation. In particular, one of the
identified problems is that the test outcome depends on the initial price levelconsidered. Indeed, apart from the special case of a constant price elasticitydemand function, the size of the demand reaction to a price increase will neces-sarily depend on the existing price level. If this starting price level is already atthe Monopoly level, (the optimal price in terms of profit maximization), thenany further price increase will lead to a profit loss. In these circumstances, wherea firm has already exercised market power, a situation known as the ‘cellophanefallacy’, the SSNIP test would lead to a larger market extension than in the casewere initial prices were set at a competitive level.One further problem in applying the SSNIP test arises when there are forms
of discrimination, which generates separate markets for the same commodity,depending on the customer’s characteristics. Discrimination is however an es-sential feature characterising Internet Interdomain routing, our object of study.Indeed, as we argued before, interconnection agreements usually take the formof transit or peering. While transit is a contractual relation rife with discrimi-nation practices, starting from its typical non-linear pricing structure, peeringis a bilateral interconnection decision based exclusively on discrimination andformally expressed in the peering policy of every provider.Finally another major limitation lies in the data unavailability to perform
the SSNIP Test. Again, this is particularly true in the Upstream Internet rout-ing, and further motivates us in the construction of price-independent market
7

structure indicators.
3.2 Supplying Universal Connectivity
Final users express a demand for Internet Connectivity, and ISPs’s role is tosupply it. This implies generating both incoming traffic, by demanding contentsstored at a given off-net location, and outgoing traffic exporting contents storedin its own routes. To supply this service ISPs will need to be able to cover thetotal set of IP addresses. Universal connectivity is indeed the ISPs’ productionoutput. The inputs required to produce this output will be three: 1) ISP’sown routes, and Off-net routes accessed: 2) through peering agreements and3) though transit agreements via an upstream provider. In this setting theproblem of market definition should be assessed in terms on demand elasticitiesfor input factor, i.e, the traditional role played by consumer’s preferences andtheir cross-elasticities of substitution is now played by ISPs and their inputdemand functions cross-elasticities.In this setting, a change in relative input prices, for example a reduction in
transit prices, will modify the initial input demand to a different ratio betweentransit and peering.11 However, this traditional microeconomic approach isnow inapplicable since the technological decision is constrained by the number,and identity, of willingly peering partners. This implies that, while a Smallbut Significant Non- transitory Increase in Price for transit might induce anISP to substitute some of its existing Transit routes with new Peering ones,it might well be that this switch will be constrained by the unwillingness ofthe other ISPs to peer with it. These difficulties led us to introduce a marketsegmentation algorithm (developed in Section 5), based on a classification ofISPs which reflects the existence of bilateral peering refusals.
3.3 Market Definition: Assessing Geographic market -boundaries
Traditionally, the process of defining the boundaries of the geographic marketproceeds along the same lines as those discussed above in relation to the assess-ment of the demand and supply-side substitution in response to a relative priceincrease. In the electronic communications sector, the European Commissionguidelines indicate two main criteria to determine the geographical scope of therelevant market: (a) the area covered by a network; (b) the existence of legaland other regulatory instruments. On the basis of these criteria, geographicmarkets can be considered to be local, regional, national or covering territoriesof two or more countries. For the specific market of Internet upstream accessin particular, linguistic differences should play a minor role in segmenting the
11 In Economics, it is usually assumed that the exact combination of inputs, in our casepeering and transit agreements, is derived by a cost minimizing choice conditional to a givenlevel of output. This depends, of course, upon the functional form of the production functiondescribing the technology, which uses these inputs (transit and peering agreements) to producethe ISP output: Universal connectivity.
8
geography of Interconnection. The European Commission guidelines also statethat the relevant geographic market comprises an area in which the undertak-ings concerned are involved in the supply and demand of the relevant productsor services, and the conditions of competition are similar or sufficiently homo-geneous; moreover the area must be distinguished from neighbouring areas inwhich the prevailing conditions of competition are appreciably different.Once again, the application of these criteria to the Internet upstream market
seems at least problematic. Hence, in this paper we follow a different approachto define the geographical borders of the Internet Upstream Market. We firststart by looking at the features characterising the European IXPs in terms ofthe distribution of their members within the different hierarchies of the Internet.Universal connectivity in the Internet is achieved through the interconnectionbetween all the hierarchies in the Internet, from the very bottom (end users andInternet Access Providers, or IAP) to the very top (Tier-1 providers), throughthe middle hierarchies. An ISP in the middle of the Internet hierarchy needsto be connected to at least one Tier-1 to provide universal connectivity. Hence,two different IXPs will not be considered as geographically separated markets ifone IXP is characterized, for example, by the presence of Tier 1 providers whilethe other IXP does not have Tier 1 among its members. Indeed, in this casethe two IXPs could complement each other, and therefore the market is notgeographically separated. In particular, we will consider as independent loca-tions the area having an IXP, that can provide Universal connectivity throughthe presence of at least one Tier—1 Member. In conclusion, contrary to theguidelines suggestions, similarity in competition implies duplication of accessmodalities at different locations, indicating therefore geographically separatedmarkets, while structural differences amongst IXPs will indicate, through accesscomplementarities, a single geographical market.
3.4 Significant Market Power
Once the market definition problem has been addressed, the next step is toassess the existence of significant market power. According to Article 14 ofthe framework Directive,12 an ISP is “deemed to have significant market powerif, either individually or jointly with others, it enjoys a position equivalent todominance, that is to say a position of economic strength affording it the powerto behave to an appreciable extent independently of competitors customers andultimately consumers.”Often, the lack of evidence or of records of past behaviour or conduct will
mean that the market analysis will have to be based mainly on a prospective as-sessment. In these cases, a dominant position is found by reference to a numberof criteria and its assessment is usually based on existing market conditions; inparticular, market shares are often used as a proxy for market power. Althougha high market share alone is not sufficient to establish the possession of signifi-cant market power (dominance), it is unlikely that a firm without a significant12This is the definition that the Court of Justice case-law ascribes to the concept of dominant
position in Article 82 of the Treaty of Rome.
9

share of the relevant market would be in a dominant position. Thus, the guide-lines stress that firms with market shares of no more than 25% are not likely toenjoy a (single) dominant position on the market concerned. In the Commis-sion’s decision making practice, single dominance concerns normally arise in thecase of firms with market shares of over 40%, although the Commission may, insome cases, have concerns about dominance even with lower market shares.13
Concerning the methods used for measuring market size and market shares, theCommission’s guidelines state that both volume sales and value sales provideuseful information for market measurement.14 These data are however usuallyunavailable for the upstream Internet connectivity market.
3.5 Exploring of the backbone through Cyber-geography:Early Studies
The analysis of the Internet Upstream Routing, understanding its boundaries,traffic flows, prices, market shares and revenues is particularly challenging bothfor the lack of satisfactory statistical data and for the elusiveness, due to the non-dedicated connection modes of the Internet Protocols, of the traffic exchangedamong operators.The public nature of the Internet and the routing protocols on which it is
based often allow, however, the analysis of the paths followed by informationpackets from origin to destination through the Internet. An entire branch ofresearch, Cybergeography, is devoted to the mapping of this physical-virtualworld. The Cooperative Association for Internet Data Analysis, (CAIDA) con-structed a global Internet topology focussing on measuring the performance ofspecific paths through the Internet. Claffy et al. (1999), using samples cover-ing 20,588 end destinations, determined the frequency with which an individualbackbone provider (identified by an Autonomous system number, AS) appearedin a path and the relative depth of those appearances, both in terms of numberof backbones and the number of hops crossed from the source. In their findings,CerfNet/AT&T, Cable & Wireless (which purchased Internet MCI’s backbonein 1998), Sprint, and UUNET played a major role in transporting packets acrossthe Internet. Cossa (2000) considered a dataset from Boardwatch magazine In-ternet Service Providers Directory, 1999’s edition, showing the breakdown of8,950 backbone connections from 5,078 Internet service providers per majorbackbone. With these data she evaluated the impact of the MCI WorlCom-Sprint merger in terms of market concentration. Cossa also calculated the HHIbased on the number of upstream backbone connections and showed that thepre-merger HHI increased from 1450 up to 2090 as a result of a merger betweenthe two companies. In the next sections we describe more recent algorithms and
13According to established case-law, very large market shares – in excess of 50 % – are inthemselves evidence of the existence of a dominant position.14 In particular, in the case of bulk products, preference is given to volume, whereas in the
case of differentiated products (i.e. branded products), sales in value and their associatedmarket share will often be considered to reflect better the relative position and strength ofeach provider.
10
concepts as we will use them to construct Market concentration indicators forthe European Internet Upstream Routing Market.
4 Recent studies on how to infer the EconomicRelationship between two ISPs
A growing body of literature in the networking community works on definingthe economic position of an ISP, by evaluating the type of relationships it haswith other ISPs. Since the business part of this relationship is decided at abilateral level and kept private, one has to infer the type of relationship fromthe network connectivity structure resulting from the available data on interISP interconnection or Upstream routing. In this section we briefly describedatasets and algorithms used to explore this inter-ISPs connectivity structures,which we will then utilize to assess market concentration.
4.1 Actual Internet Routing
The main part of the actual Internet traffic exchanges (routing) happens at IProuters. These have a table, whose role is to match an IP address contained inthe header of a data packet to the link leaving the router in the right direction.Through these tables each Autonomous System — or AS- (ASes are Internetoperators consisting in either a single network or a group of networks thatis controlled by a common network administrator) announces, via the BorderGateway Protocol (BGP), to a neighboring AS a list of paths made of moreAS-nodes leading to a final destination AS. The implementation of the routingpolicy determines which BGP information in an ISP is generated, passed on andto whom of the connected neighbors: which path is being presented.The interplay of all the ASes individual routing policies results in the global
connectivity map for data transmissions across the Internet. This paper ismotivated by the belief that no reliable empirical alternative exists to this mi-crorouting analysis for the study of the upstream Internet market structure, andfor its antitrust analysis.
4.2 Business Relationships
There are three15 basic types of business relationships that shape ISPs Up-stream routing policies: Customer-Provider, Provider-Customer and Peer-Peer.It is widely assumed in the current literature that these three types of businessrelationships sufficiently capture various contracts and agreements arising inthe Internet. Although this is an oversimplification, the basic business relation-ships provide a relatively close approximation in practice. These basic types ofbusiness relationships are explained as follows:
15The Computer Science Literature also considers a fourth type of relation, among Siblings,where both AS belong to the same ISP. The ISP partitions his network to ease the technicalmanagement by hiding internal information for each of the separate AS.
11

Customer-Provider/Provider-Customer: in this relations both parties as-sume asymmetric roles; the provider sells the reachability of IP addresses, theability to transit all traffic to any destination, while the customer pays for thisconnectivity.Peer-Peer: usually, both parties exchange the traffic for their customers only
— routes to their providers and other peers are not revealed to each other. Thisis because peer-peer connectivity is usually not paid, and there is no incentiveto share one’s other paid connectivity.
4.3 Type of Relationship Inference from BGP Graphs
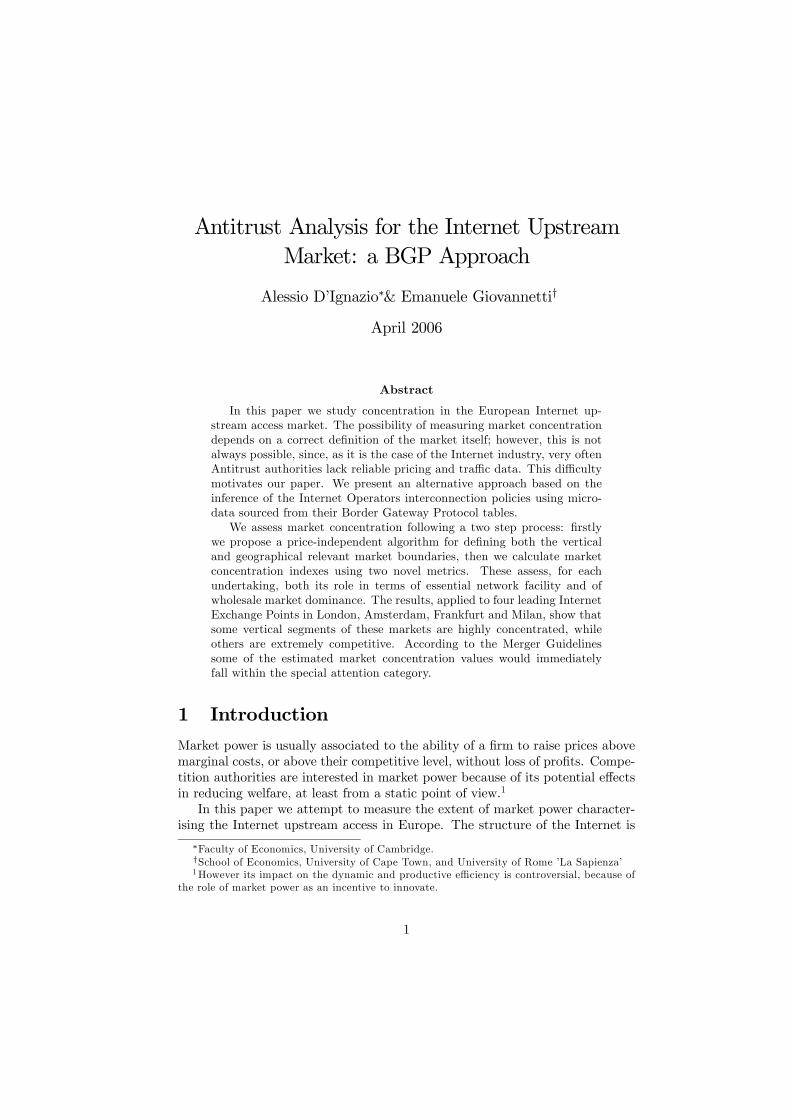
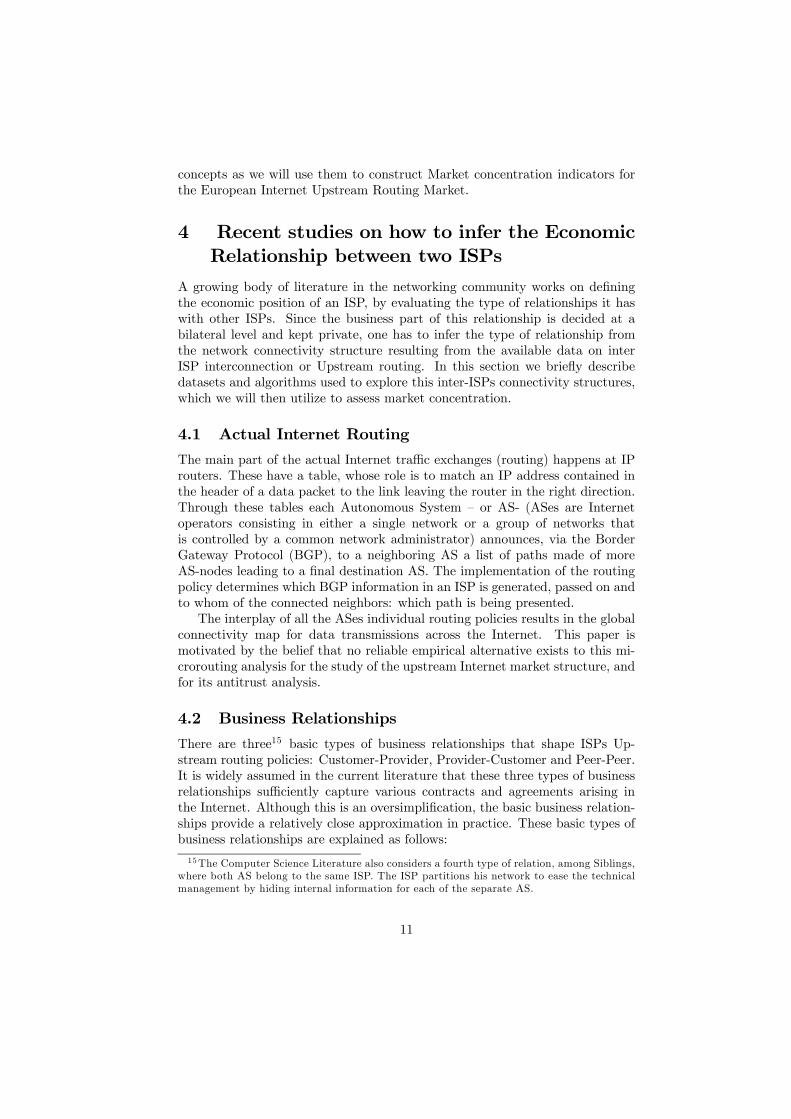
In this paper we suggest that the most useful way to learn about the economictype of relationship between two ASes is by examining BGP dataset. Some ASespublish their BGP path tables, and from this collection of paths it is possibleto derive a network graph of the Internet that describes the connectivity atthe AS level. In the analysis of the BGP path tables, one central assumption,first formulated by Gao (L. Gao, 2001), is made to infer relationship types.This assumption states that all paths are free of relationship-valleys. Intuitivelyspeaking, one can imagine a particular path to describe the trail of ISPs thatan IP data packet has to traverse to reach its destination network. This path ofASes will start at an ISP who is a customer of the next “upstream” provider ofIP connectivity, who in turn is a customer of the next provider. Following thischain of customers, at some point we will reach the peak in the hierarchy of ASthat participate in this path, and from there on we expect the IP data packetto descend a chain of provider to customer relations between ISPs till it reachesthe ultimate destination. The important observation in this description is thatin any path there is only one consecutive chain of upstream and one consecutivechain of downstream ISPs present. Figuratively speaking, we assume that thereare no valleys in these hills of upstream/downstream chains. The Figure 1 showsa set of valid paths and an invalid valley.The intuition behind this assumption is that such a valley would imply that a
customer is transferring traffic from one of his providers to another provider andpays the first one for receiving the traffic and the second to have it forwarded tothe destination. Since doing so would be economically irrational, we can assumethat occurrences of such routing policy patterns are mis-configurations and anyISP has great incentive to rectify this situation quickly.The next assumption about AS path constraints states that peering is not
transitive. Hence for each AS path, there is only one peering link possible, andthis can only be at the peak of the path, exactly between the upstream andthe downstream AS chains. This constraint follows from the idea that the onlytraffic an ISP would accept from a peer is the traffic from that peer and the oneof his customers. If an ISP were to accept traffic from the providers of a peer,then the ISP would actually perform a transit function for the providers of thepeer. Since nobody pays the ISP for this transit traffic, we can expect the ISPsto refuse such traffic by filtering out routes that a peer might advertise withdestinations that are not contained in his AS, or his set of customers (not only
12
the immediate customers, but all the further customers down the line as well).
4.4 Internet Service Providers Classification
Historically, it was common to classify ISPs into a strict hierarchy of Tiers,whereby the ISPs within one tier were considered equally relevant in terms ofnetwork transport capacity and economic bargaining power. In the followingsections we will use a ASes classification derived from the ranking obtainedfrom CAIDA’s AS-relationship inference/ranking algorithm. Using the inferredrelationships, a ranking is derived based on the dimension of the set of customersof each AS. Since the relationship inference algorithm relies on valley-free pathrelationships, we can assume that in the direction of a customer, down to theend of an AS path, all ASes are themselves customers of the previous AS. Thisleads to a tree, or “customer cone”, as it is referred to by Dimitropoulos et.al(2005) containing the set of customers, including all the customers of these.The ASes16 are then ranked, based on the dimension of this customer cone.
5 Vertical Boundaries and Market Concentra-tion within the Euro-IX Members
5.1 Data description
IXPs17 are independent organizations composed by Internet Service Providers,where they can route their Upstream traffic in a cost effective and technicallyefficient way.The data used for the empirical analysis were collected in subsequent steps.
Firstly we obtained the lists of ISPs members for each Internet Exchange Pointparticipating at the Trade Association Euro-IX.18 Then, for each IXP, and foreach IXP’s member, we obtained two sets of measures useful to assess its positionwithin the Internet: the first metrics, provided by CAIDA, associates a rank toeach AS by looking at their location in the Internet hierarchy. The rank isderived from the AS customer cone, defined as the AS itself plus its customers,
16For technical reasons, large ISPs operate using multiple ASes (e.g. UUNET uses 13), andit would be a misrepresentation to rank each of these ASes separately, since they belong to thesame company. The CAIDA ranking aggregates ASes with company names that are similar inthe ARIN database (two names are considered similar, if they are identical, except for the lastseveral characters). We rely on this grouping to consider rankings of ISPs, instead of rankingsof ASes only, since it improves the representation of the ranking, despite some shortcomings.17 IXPs play an absolutely crucial role in the Internet traffic Routing. As an example it
is sufficient to think that more than 90% of the Internet UK traffic is routed through theLINX-IX in London.18AIX, AMS-IX, BCIX, BIX, BNIX, CATNIX, CIXP, DE-CIX, Equinix * +, ESPANIX,
FICIX, GIGAPIX, GN-IX, INEX, JPNAP * +, LINX, LIPEX, LIX, LoNAP, MaNAP, MIX,MSK-IX, NaMeX, NDIX, Netnod *, NIX, NIX.CZ, NOTA +, PARIX, RoNIX, SIX, TIX,TOPIX, VIX, XchangePoint *, where* indicates IXPs with multiple unconnected locationsand + indicates IXPs located outside of Europe.
13

plus its customers’ customers, and so on.19 We then used the algorithm devisedby Huber et al (2004) to infer the relationships between pair of ASes (providerto customer, customer to provider, peering, sibling, no relationship) within eachIXPs.The second metrics is derived from the BGP tables displayed by Oregon
Routeviews Project.20 Following Shimbel (1953) we calculated a measure ofbetweenness (centrality) for each AS v (see Brandes, 2001 for a survey on thealgorithms used to compute betweenness). In particular, the betweenness forAS v is given by the number of BGP paths - between any pair of ASes — thattraverse v. Formally,
( ) ( )∑∈≠≠
=Vtvssts vvB σ
(1)
where σst (υ) = σts (ν) is the number of shortest paths from the AS s to theAS t on which the AS v lies on. High betweenness indicates both that an ASnode can reach other ASes on relatively short paths, and that this AS has acertain degree of market power over the others, since it may be costly to avoidthe central ASes and follow other paths in order to deliver packets over theInternet. This parameter clearly captures and measures the economic conceptof partial essential facility for central ASes. We calculated the betweenness, forevery AS, with respect to the population of other ASes of the IXP it is a memberof. This means that the betweenness we calculate is defined only by looking atthe paths involving ISPs members for each IXP; hence, it provides additionaluseful information on the partial bottlenecks, centrality of given members withinan IXP and not within the Internet as a whole.
5.2 Market Power and Market Concentration
The most widely used measure of market power enjoyed by a certain firm ioperating in the market M is provided by the Lerner index Li = mi
ε , where mi
is the market share of firm i and is the market elasticity of demand. The indexof overall market power is then given by
∑∑ ===i
i
iii
HHImLmLεε
2
(2)
19The customer cone can be defined using three different precision levels: the AS cone, theAS prefix customer cone, the AS /24 prefix customer cone. The AS cone indicates the sizeof the customer cone in terms of number of ASes; this is a rough measure, since individualAS sizes can be very different. Since each AS advertises a different number of prefixes, andthe smallest bit of a prefix is the /24, the others two measures provide greater accuracy inassessing the size of the customer cone. For full details see the CAIDA relevant web page at(http://www.caida.org/analysis/topology/rank_as/index.xml).20For the full details, see the University of Oregon routeviews project webpage at
http://www.routeviews.org/
14
where HHI =X
im2i is the Herfindahl-Hirschman Index of concentration.
From (2) it is clear that the HHI, and hence the pattern of market shareswill provide useful insights to assess the degree of market power. Our unit ofanalysis is again the Internet Exchange Point, where a large share of UpstreamInternet Routing is exchanged.We devised two different proxies21 for the market share mi :
• The first measure is directly obtained from the customer cone metrics: themarket share for each AS is obtained as the ratio of its customer cone andthe sum of all the customer cones of the IXP members.
• The second measure is derived from the betweenness of an AS. In partic-ular, the proxy for firm i’s market share is obtained comparing its relativebetweenness, or degree of unavoidability, within the IXP: this is computedby dividing the betweenness value for the AS i by the sum of the between-ness values for all the ASes considered. Formally,
( ) ( )
( )∑=
vs
ss vB
vBvBRel
(3)
where Bs (ν) is defined in (1).
This last measure focuses on the presence of essential facilities, often the rootcause of the presence of market power. In particular, the Internet is ambivalentabout the presence of essential facilities: its nature, the protocols which definethe routing procedures, are indeed meant to avoid predefined paths, makingtherefore easier to avoid essential facilities or bottlenecks. However how success-ful traffic routing is in avoiding bottlenecks depends essentially on the designof the interconnections among ISPs, and on its hierarchical structure. Usuallyunderstanding the presence of an essential facility requires an assessment of howeasy it is to duplicate a given input. In the specific context of the Internet, thismeans an assessment of how easy is it to bypass a given route, or a node, man-aged by an AS that refuses peering and requires a transit charge, a paid input.The betweenness parameter expressly captures the presence of partially essen-tial facilities in Internet outing by focussing on how, avoidable or non avoidable,certain nodes are.A first question that needs to be addressed is the following: are these proxies
a reasonable approximation of the effective market share within the IXP? Inorder to address this question, we obtained confidential traffic data at LINX forthe period October 2004-November 2004. We then calculated the market sharefor each LINX member using both inbound traffic and outbound traffic; hence
21 Ideally, market shares within the IXP are derived by looking at the traffic flows. Sincethese data are confidential we use the metrics introduced in the previous sections.
15
we computed the HHI index, finding a very strong correspondence with the HHIindex calculated using the CAIDA customer cone metrics.22
There is no immediate sensible comparison between the market share calcu-lated by the CAIDA rank and the one calculated using the betweenness data.Indeed, while the first is targeted to capture the market share in terms of theestablished market position and, more explicitly, the pattern of traffic flows,the second is meant to capture the relevance within the IXP from an essentialfacility point of view. Table 1 shows the calculations for the two concentrationmeasures for all IXPs under analysis. We ranked the different IXPs accordingto their CAIDA customer cone metrics-related HHI.According to HHI index using the CAIDA rank-based proxy market shares
the fifteen least concentrated IXPs are AMS-IX, LINX, DE-CIX, EQUINIX,NOTA, NETNOD, PARIX, BNIX, VIX, EXCHANGEPOINT, NAMEX, LIPEX,TIX, MIX AND BCIX. This order, as we can see from table 2, is not reflectedwhen the HHI concentration index is calculated according to the betweenness.These ranking asymmetries are important in showing the different aspects
of concentration captured by the two complementary proposed indexes. This isnatural for the antitrust analysis of complex network industries where concen-tration can only be captured along different dimensions, in this case customerbase, and network centrality.In this first step of the analysis we considered the entire memberships of
the IXP as if they were part of the same market and calculated the newlyproposed concentration indexes accordingly. This is clearly not the case giventhe difference in ranking amongst the ASes member s of any given IXP. Inthe next section we address this problem by introducing the vertical marketboundaries within these memberships.
5.3 Vertical Boundaries
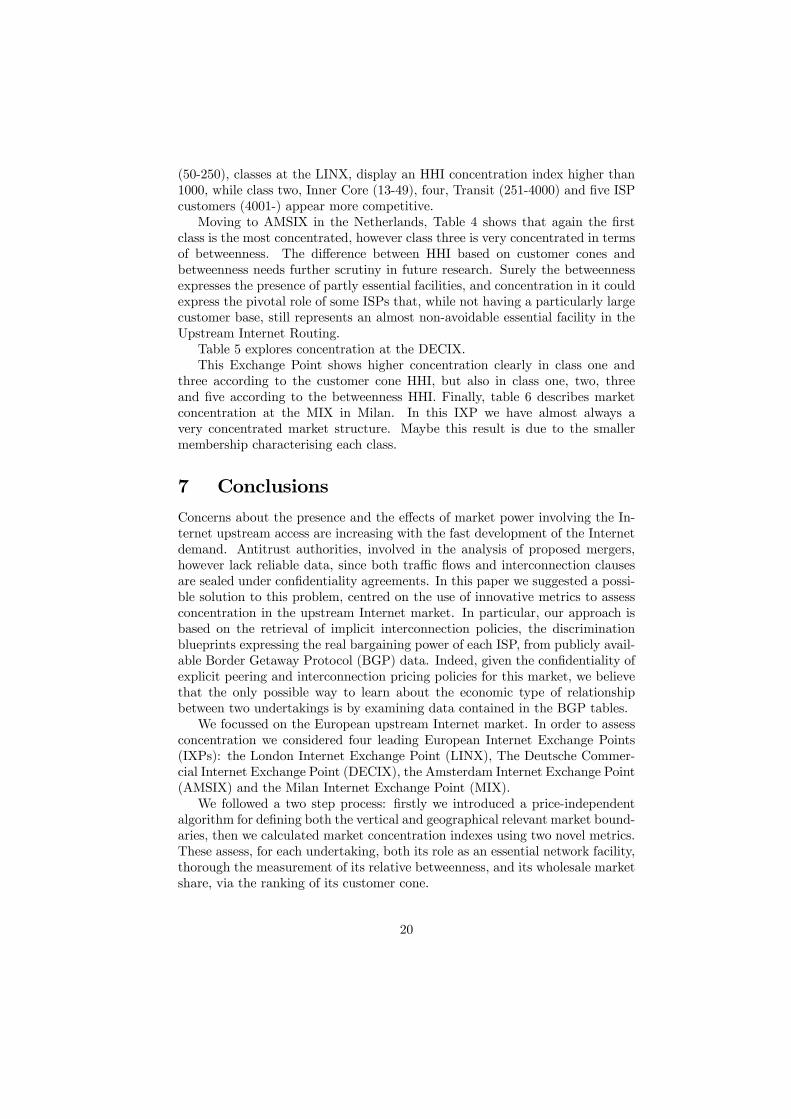
In this section we use the CAIDA rank measure, introduced before, to derivethe ASes’ distribution over a set of vertically separated classes, by looking atjumps in their customer cones values. In particular, we group all ASes into fourmajor groups according to their CAIDA ranking reported below:
(a) “Tier 1”(Rank 1-12): this set contains the ISPs that are located at the top ofthe Internet hierarchy. Most of the providers in this class are the so calledInternet backbones of Tier 1. Tier 1 providers distinguish themselves fromany other ISP, by not paying for transit traffic to any other ISP. They onlyhave peers and customers. To achieve global path reachability they peer
22 0.021 is the effective HHI, while the indexes calculated with CAIDA customer cone, andbetweenness are 0.024, and 0.05 respectively. Moreover, the market share squares calculatedwith the CAIDA customer cone showed the highest correlation (0.74) with the squares ofeffectives market shares, (the correlation is instead 0.33 for the betweenness based proxies).This is a positive result indicating that it is sensible to calculate the HHI index by usingthe CAIDA rank-based proxy market shares, and also that these proxies are probably a goodapproximation of the effective market shares.
16

with other ISPs in this class.23
(b) Core composed by those ASes ranking between 13 and 250. This group canbe subdivided into two sub groups:
(i) “Inner core”(Rank 13 — 49): most of the ISPs included in thisclass need to buy transit from one or more tier 1 ISPs to reach allpaths, but only from those, and are able to contain a large proportionof their traffic within their own and their customers’ networks. Thisset contains many important ISPs, such as Korea Telecom, FranceTelecom, Tiscali. It also contains the largest university, CaliforniaState University (a network of dozens of campuses); and
(ii) “Outer Core”(Rank 50 — 250): this set contains many large play-ers, who are not transit providers, such as HP, Microsoft, Apple, butalso significant ISPs such as Peer 1 Network Inc., Hutchison GlobalCommunications, CHINA UNICOM, Bell South.net, as well as largeacademic networks such as the ones of the UK, Germany and China.A few universities with the largest address space allocations also fallinto this class, such as Harvard and MIT .
(c) Transit composed by those ranking between 251and 4000; this group canbe divided into three sub groups:
(i) Regional Transit(Rank 251 — 1000): this set contains many regionallyrelevant ISPs, such as Road Runner (US), Telecom Argentina S.A,Nextra Austria, Asia Online New Zealand, States of Michigan, Geor-gia, Arkansas, Minnesota, etc. Some larger universities can also befound here, such as The University of Texas at Austin, Stanford, andthe University of British Columbia .
(ii) Local Transit (Rank 1001 — 2500): the ISPs listed in this set con-tains many locally relevant transit players, e.g. Boston Data Cen-ters Inc., OmanTel, Tiscali Belgium, Portland - Metro Area Net-work (P-MAN), ARBINET-THEXCHANGE, INC., Danish networkfor Research and Education, many universities, such as Yale, Emory,University of Virginia, and the University of New Mexico. The #/24-number in the customer cone drops by 72% within this class.
(iii) Campus Level(Rank 2501 — 4000): this class contains many corpo-rate campus level network (e.g. Cray Inc., Wachovia OperationalServices Corporation, Morgan Stanley Dean Witter, BASF Corpo-ration, Oracle Corporation Datacenter, Wal-Mart Stores, Inc.) aswell as many university campus (e.g. Mount Sinai School of Medi-cine, Bradley University, Brigham Young University, Bates College,Georgia State University, University of Salzburg), networks and a
23 1 This class actually contains about 18 known ISPs, but in the CAIDA ranking, severalof these ISPs are ranked significantly below number 12 (e.g. British Telecom = rank 36 andAOL Transit Data Network = rank 48).
17

few smaller ISPs with local reach (e.g. China Information Broad-cast Network Ltd.Co., China Enterprise Communications Ltd., ADCTelecommunications Inc., Skyrr ISP Network) . And finally we havethe
(d) ISP customers (Rank below 4000). Most of these ISPs do not have anyfurther customers, are leafs in the hierarchy. Some of these ISPs, do havecustomers, up to one dozen, but are more likely to have between 1-5 cus-tomers, if they have any. The networks grouped in this list are manysmall customer ISPs (e.g. BusinessOnline AG - German ISP, Wave2WaveCommunications, Inc., FreiNet GmbH, Pacific Information Exchange, Inc.,Kabel Deutschland Breitband Service GmbH, Belize TelecommunicationsLimited, Startec Global Communications, TSI Telecommunication Ser-vices, Northeast Telecom Inc.), a few companies (e.g. DuPont, First Citi-zens Bank, Hotels.com, Deloitte Consulting) and some universities, schoolsand public institutions (e.g. University of the Aegean, Innsbrucker Kom-munalbetriebe AG, National Dong Hwa University, The Open Universityof Hong Kong, University of Tehran).
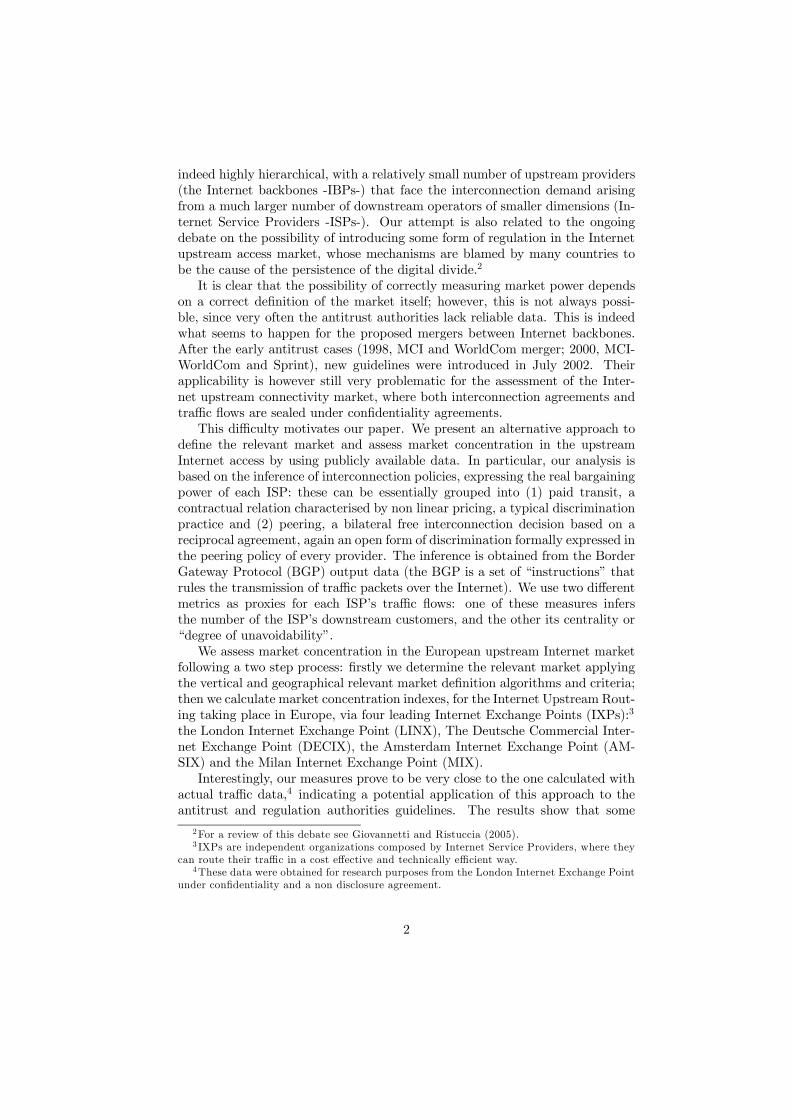
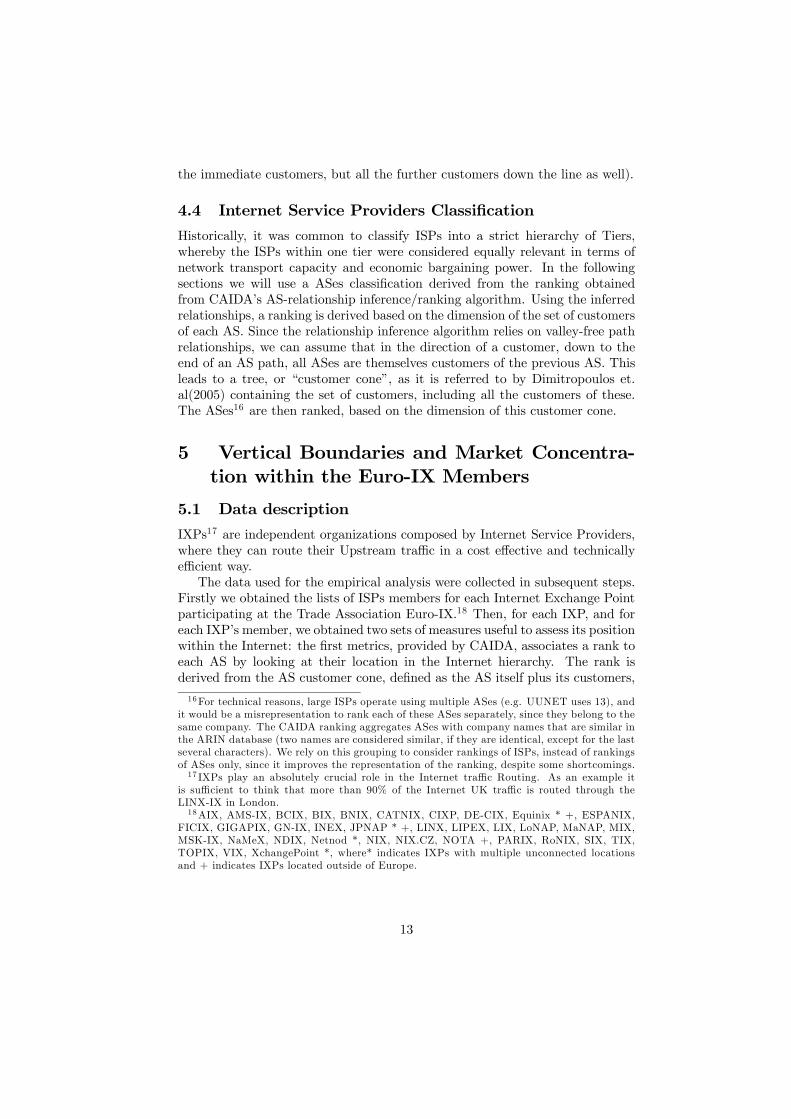
In Figures 2a - 2d we are able to show the vertical hierarchical compositionfor all IXPs members of the Euro-IX, by classifying their ISPs members intoone of the four categories introduced above.From the Figures 2a, to 2d, above we notice that less than 50% of the IXPs
(16 out of 35 of the Euro-IX ) have ISPs members belonging to the Tier1 class.This outcome is relevant since it shows that the largest percentage of IXPs isnot independently able to forward packets to the entire Internet, i.e. it does notallow direct universal connectivity.It is also interesting to point out that the IXPs with a small number of
members are consistently characterized by a higher percent of ASes belongingfrom the lowest hierarchies in the Internet (ISP customers). Given the hierar-chical structure that governs the Internet, it is presumably sensible to assumethat a balanced IXP is characterized by a distribution of ASes over the fourclasses following a pyramidal structure: the Tier 1 providers should representthe smallest percentage, then a greater share of the members should be consti-tuted by the Core providers, and then the largest share by Transit and ISPscustomers providers. Such a balanced structure, however, seems to be a featureof a small set of IXPs. Among the largest IXPs, it seems fairly satisfied, withthe only exception of MSK-IX and EXCHANGE POINT. On the other hand,small IXPs seem characterised by consistently different distributions, with fewexceptions (BNIX, ESPANIX, CIXP, FICIX, NETNOD).The bulk of IXPs is low-hierarchy biased, with more than 90% of members
belonging to classes of Transit and ISP customers. The opposite situation char-acterizes only a few IXPs, where the percentage of providers in the first classesis greater than 20% (NOTA, PARIX, CIXP, EQUINIX, ESPANIX).
18

6 Market Concentration, by vertical and geo-graphical classification.
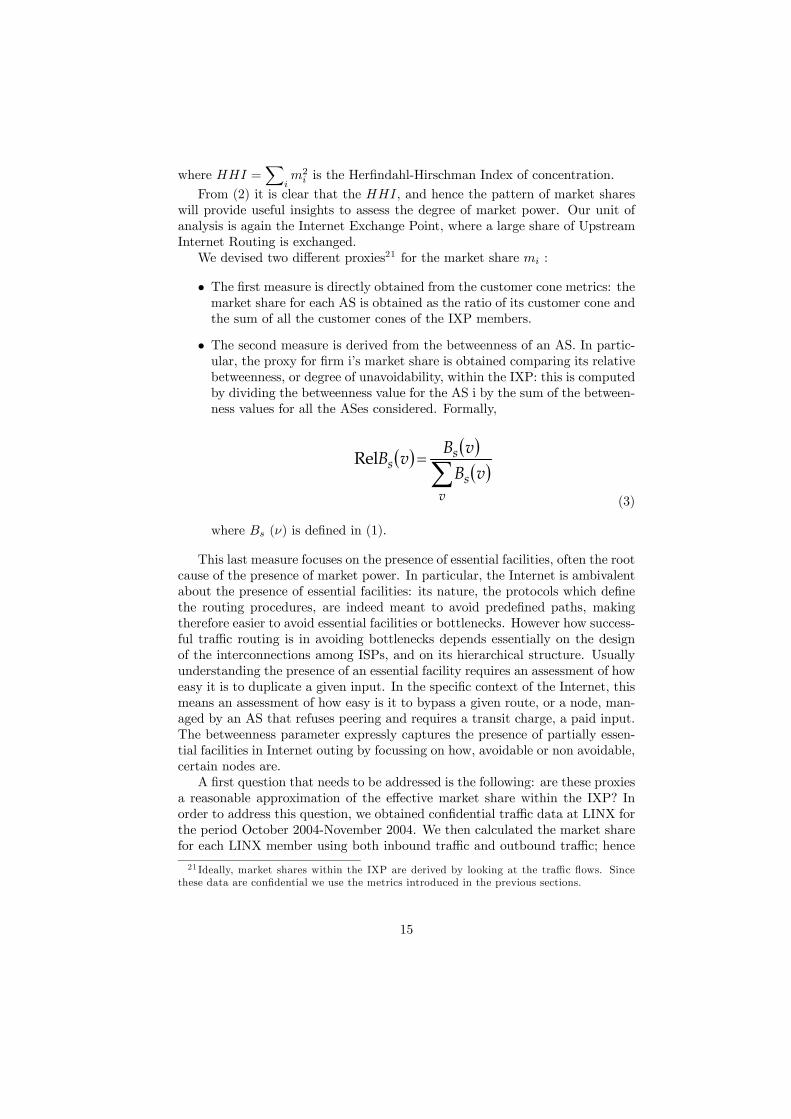
Having introduced the vertical market classification algorithm we finally need toconsider the problem of drawing the geographic market boundaries before beingable to perform our empirical analysis of the Upstream Internet Routing Euro-pean market. Should we demarcate markets following the national boundariesor is this concept not appropriate for the Internet upstream connections?In this section we suggest that the most appropriate criterion for geographic
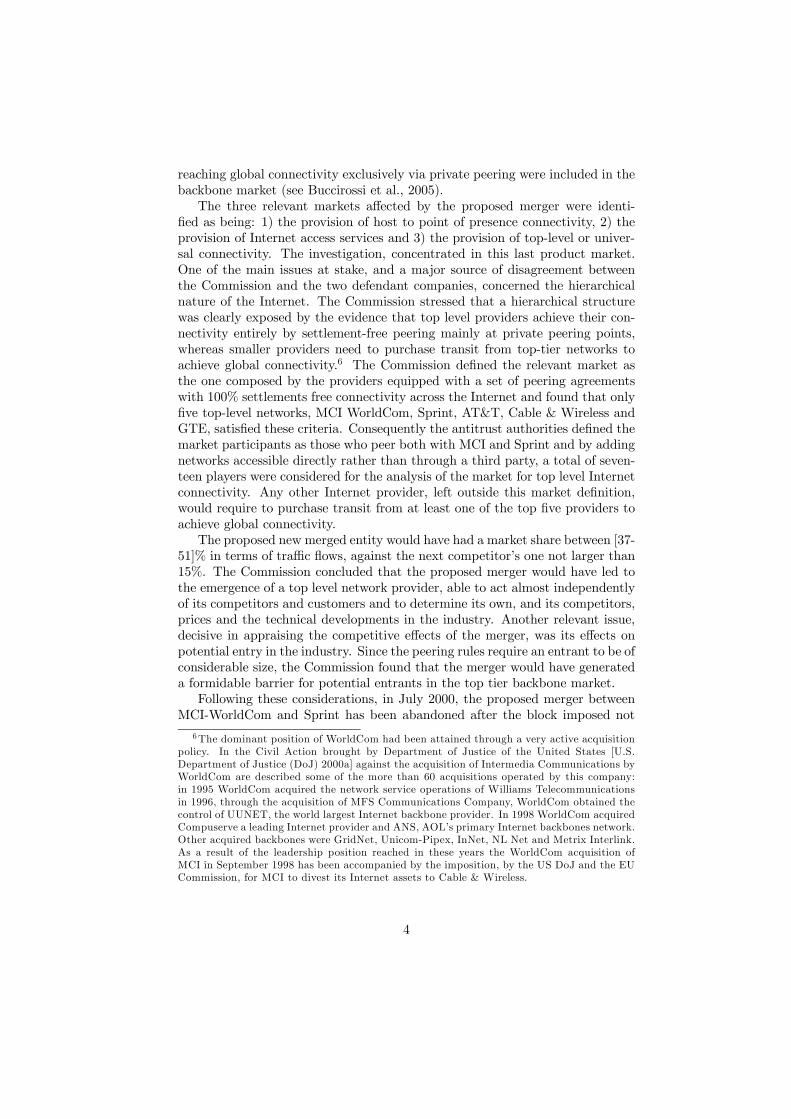
demarcation is to identify the IXPs that are independently able to supply uni-versal connectivity, i.e. IXPs having, among their members, ISPs falling intothe Tier 1 class. Figure 3 maps the full geographical distribution of the ISPtypologies across IXPs in Europe. The first clear element from this map is thatnot all locations have Tier 1 class providers, being therefore unable to provideindependently Universal connectivity, at least within their IXPs memberships.As a result locations related to an IXP unable to provide universal connec-
tivity should not be considered as independent markets.In the following we focus our attention to a restricted set of geographically
independent locations where IXPs have, indeed, the possibility to operate ascentres for universal connectivity, without having to connect with another Ex-change Point. We consider four of the major IXPs: namely the LINX, DECIX,MIX and AMSIX. Each one of them, having Tier 1 class members, is consideredas an independent geographic market allowing direct universal connectivity to itsmembers. For each one of these IXPs we calculate the two specific HHI marketconcentration indexes discussed in the previous sections, the customer cones andthe betweenness one. Moreover, these indexes are also decomposed according tofive24 vertical-hierarchical classes: Tier1 (rank 1-12), Inner Core (rank 13-49),Outer Core (rank 50-250), Transit (rank 251-4000), and ISP customers (rank4001-). As a result we obtain location & layer specific concentration indexesor, in other words, concentration indexes for the relevant market. The resultswe obtain, shown in the Tables 3, 4, 5 and 6 below are significantly differentfrom the aggregate ones and we believe they provide a step forward towards theapplication of the Commission’s guidelines in assessing location & class specificmarket concentration for the Internet Upstream Routing at European IXPs.Table 3 shows the calculations for the LINX IXP.The first column of Table 3, shows the number of IXP’s members belonging
to each single class, while the second and third columns, provide the two dif-ferent HHI indexes, the first calculated on the customer cone “market shares”and the second on the betweenness ratios. According to the Merger Guidelines,[U.S. Department of Justice (1997)], some of the market concentration valuesestimated in Table 3 would immediately fall within the special attention cate-gory, in particular we can see that both the first, Tier1, and third, Outer Core
24For this application we have subdivided the original Core class introduced above into twoclasses: Inner Core (composed by ASes ranking between 13 and 49) and Outer Core (composedby ASes ranking between 50 and 250), leaving the other classes unchanged.
19
(50-250), classes at the LINX, display an HHI concentration index higher than1000, while class two, Inner Core (13-49), four, Transit (251-4000) and five ISPcustomers (4001-) appear more competitive.Moving to AMSIX in the Netherlands, Table 4 shows that again the first
class is the most concentrated, however class three is very concentrated in termsof betweenness. The difference between HHI based on customer cones andbetweenness needs further scrutiny in future research. Surely the betweennessexpresses the presence of partly essential facilities, and concentration in it couldexpress the pivotal role of some ISPs that, while not having a particularly largecustomer base, still represents an almost non-avoidable essential facility in theUpstream Internet Routing.Table 5 explores concentration at the DECIX.This Exchange Point shows higher concentration clearly in class one and
three according to the customer cone HHI, but also in class one, two, threeand five according to the betweenness HHI. Finally, table 6 describes marketconcentration at the MIX in Milan. In this IXP we have almost always avery concentrated market structure. Maybe this result is due to the smallermembership characterising each class.
7 ConclusionsConcerns about the presence and the effects of market power involving the In-ternet upstream access are increasing with the fast development of the Internetdemand. Antitrust authorities, involved in the analysis of proposed mergers,however lack reliable data, since both traffic flows and interconnection clausesare sealed under confidentiality agreements. In this paper we suggested a possi-ble solution to this problem, centred on the use of innovative metrics to assessconcentration in the upstream Internet market. In particular, our approach isbased on the retrieval of implicit interconnection policies, the discriminationblueprints expressing the real bargaining power of each ISP, from publicly avail-able Border Getaway Protocol (BGP) data. Indeed, given the confidentiality ofexplicit peering and interconnection pricing policies for this market, we believethat the only possible way to learn about the economic type of relationshipbetween two undertakings is by examining data contained in the BGP tables.We focussed on the European upstream Internet market. In order to assess
concentration we considered four leading European Internet Exchange Points(IXPs): the London Internet Exchange Point (LINX), The Deutsche Commer-cial Internet Exchange Point (DECIX), the Amsterdam Internet Exchange Point(AMSIX) and the Milan Internet Exchange Point (MIX).We followed a two step process: firstly we introduced a price-independent
algorithm for defining both the vertical and geographical relevant market bound-aries, then we calculated market concentration indexes using two novel metrics.These assess, for each undertaking, both its role as an essential network facility,thorough the measurement of its relative betweenness, and its wholesale marketshare, via the ranking of its customer cone.
20

The results show that some vertical segments of these markets are highlyconcentrated and would hence fall within the special attention category accord-ing to the Merger Guidelines [U.S. Department of Justice (1997)]. The measuresof market concentration obtained using our two different metrics tend to moveclosely together, although with different concentration indexes. This result re-inforces the rationale to look at both these dimensions of market concentration.This is expected in the framework of network industries, where a relevant no-tion of market concentration needs to be captured along more than one singledimension. In our case the two dimensions considered are wholesale customerbase, and network centrality.Finally, market power can be a transient phenomenon, and market concen-
tration may change rapidly in highly innovative sectors, such as the Internet.This clearly implies that the tasks of identifying the relevant market and to as-sess its concentration need to be re-evaluated regularly. Our proposed indicatorscan be of particular use for repeated antitrust analysis since they are not basedon ad hoc information gathering but on existing algorithms applied to regularlyupdated databases. As a result we think that no reliable empirical alternativeexists to the analysis of the micro-routing decisions, based on the retrieval ofBGP policies, for the study of the upstream Internet, routing, market structure,and for its antitrust analysis.
References[1] Brandes, U. (2001). “A Faster Algorithm for Betweenness Centrality”.
Journal of Mathematical Sociology, vol. 25, 163-177.
[2] Buccirossi, P., Ferrari, L. and Siciliani, P. (2005) “Competition in the In-ternet Backbone Market”. World Competition 28/2, 235-254.
[3] Cave, M. (1999). "Interconnection and the Internet: Competition andRegulation Issues at Local Access and Backbone Levels" OECD, WorkingParty on Telecommunication and Information Services
[4] Claffy, K., Tracie, E. McRobb, M. &D. (1999), “Internet Tomogra-phy”, Nature 7 January 1999.
[5] Cossa, B. (2000) “Economic and policy analysis of mergers among Internetbackbone providers” Master of Science in Technology and Policy Thesis,Massachusetts Institute of Technology.
[6] Dimitropoulos, X.; Krioukov, D.; Huffaker, B.; Claffy, KC; Riley, G. (2005)“Inferring AS Relationships: Dead End or Lively Beginning?”
[7] Gao, L. (2001) “On Inferring Autonomous System Relationships in theInternet”. In IEEE/ACM trans. Networking.
21

[8] Giovannetti, E. Ristuccia, C.A. (2005) “Estimating Market Power in theInternet backbone using the I.P. transit Band-X database,” Telecommuni-cations Policy, vol 29 pp 269-284.
[9] Huber, B.; Leinen, S.; O’Dell, R.; Wattenhofer, R. (2004) “Inferring ASRelationships Beyond Counting Edges” D-INFK Tech Report Nr. 446.
[10] Official Journal Of the European Commission (2000), Regulation (EEC) N4046/89, Merger Procedure, Bruxelles, European Commission, DGXIII
[11] Scheffman, D. T. and Spiller, P. T. (1987). "Geographic Market Definitionunder the U.S. Department of Justice Merger Guidelines," Journal of Law& Economics, University of Chicago Press, vol. 30(1), 123-147.
[12] Shimbel. A. (1953). Structural parameters of communication networks. Bul-letin of Mathematical Biophysics, vol. 15, 501-507.
[13] U.S. Department of Justice (1997), The Horizontal Merger Guideline, is-sued April 2, 1992 and revised April 8, 1997; originally issued as part ofUS Department of Justice Merger Guidelines, June 14 1984.
[14] U.S. Department of Justice (2000a), Civil Action No. 1:00CV02789 againstWorldCom and Intermedia.
[15] U.S. Department of Justice (2000b), Civil Action No. against WorldComand Sprint
[16] Werden, G. J. and Froeb, L. M. (1994). "The Effects of Mergers in Differ-entiated Products Industries: Logit Demand and Merger Policy," Journalof Law, Economics and Organization, Oxford University Press, vol. 10(2),407-426.
22

Figure 1: Examples of valid paths
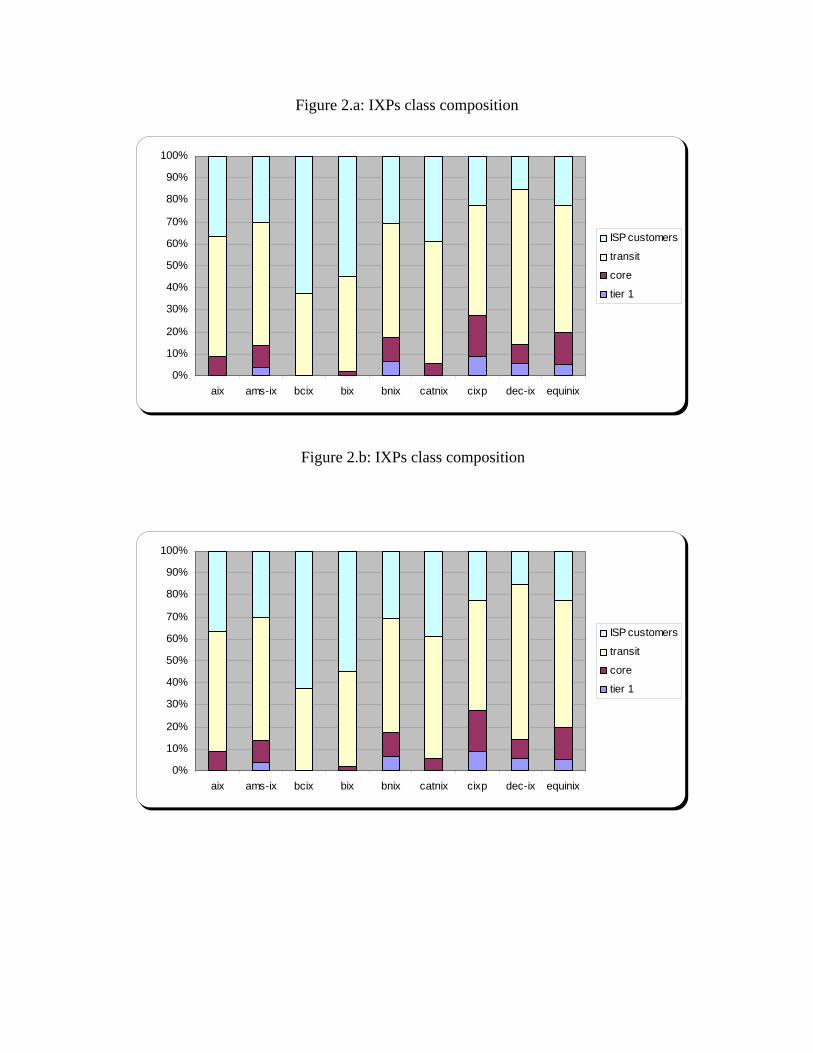
Figure 2.a: IXPs class composition
0%
10
20
30
40
50
60
70
80
90
10
a a b b b c c d e
%
%
%
%
%
%
%
%
%
0%
ix ms-ix cix ix nix atnix ixp ec-ix quinix
ISP customers
tr tansi
core
tier 1
Figure 2.b: IXPs class composition
0%
10%
20%
30%
40%
50%
60%
70%
80%
90%
100%
aix ams-ix bcix bix bnix catnix cixp dec-ix equinix
ISP customers
transit
core
tier 1
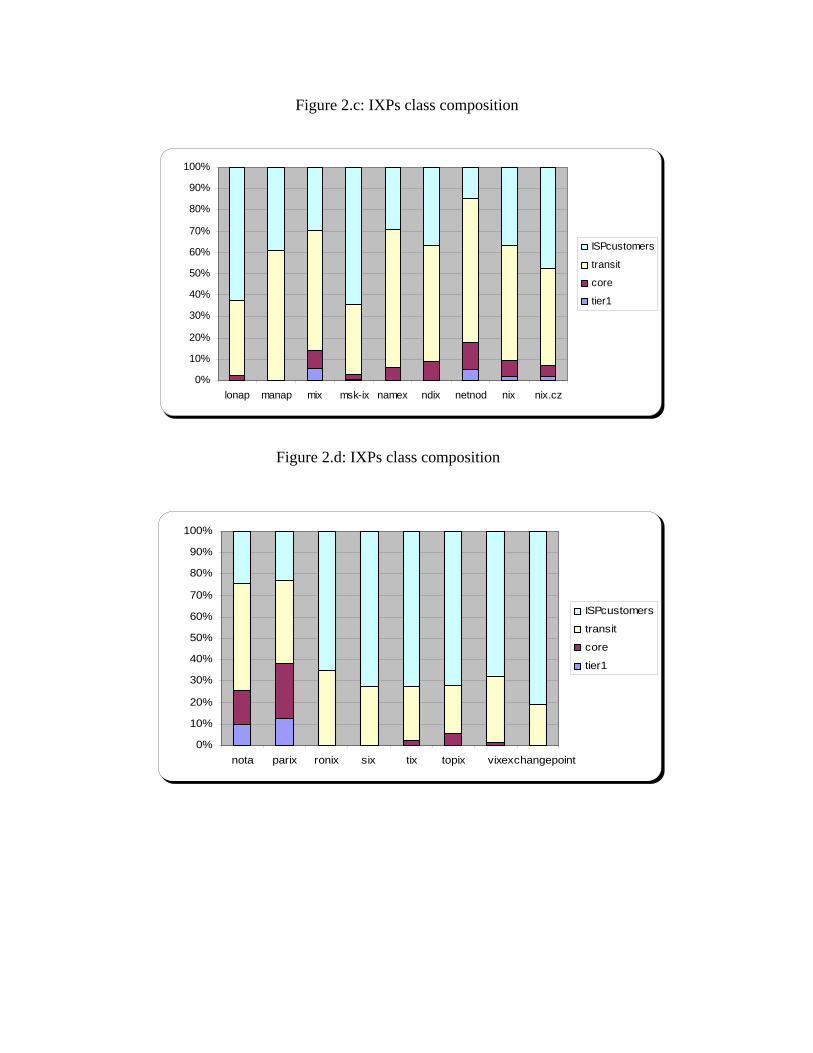
Figure 2.c: IXPs class composition
0%
10%
20%
30%
40%
50%
60%
70%
80%
90
100
%
%
lonap manap mix msk-ix namex ndix netnod nix nix.cz
ISPcustomers
transit
core
tier1
Figure 2.d: IXPs class composition
0%
10%
20%
30%
40%
50%
60%
70%
80%
90%
100%
nota parix ronix six tix topix vixexchangepoint
ISPcustomers
transit
core
tier1
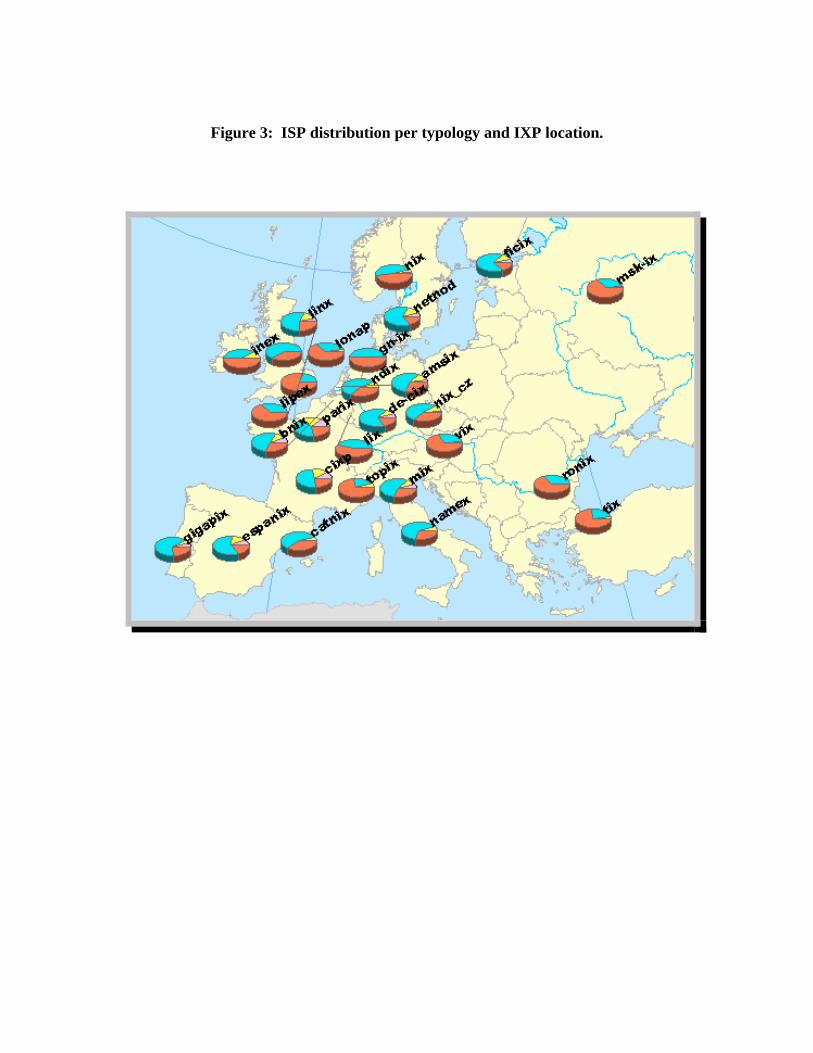
Figure 3: ISP distribution per typology and IXP location.
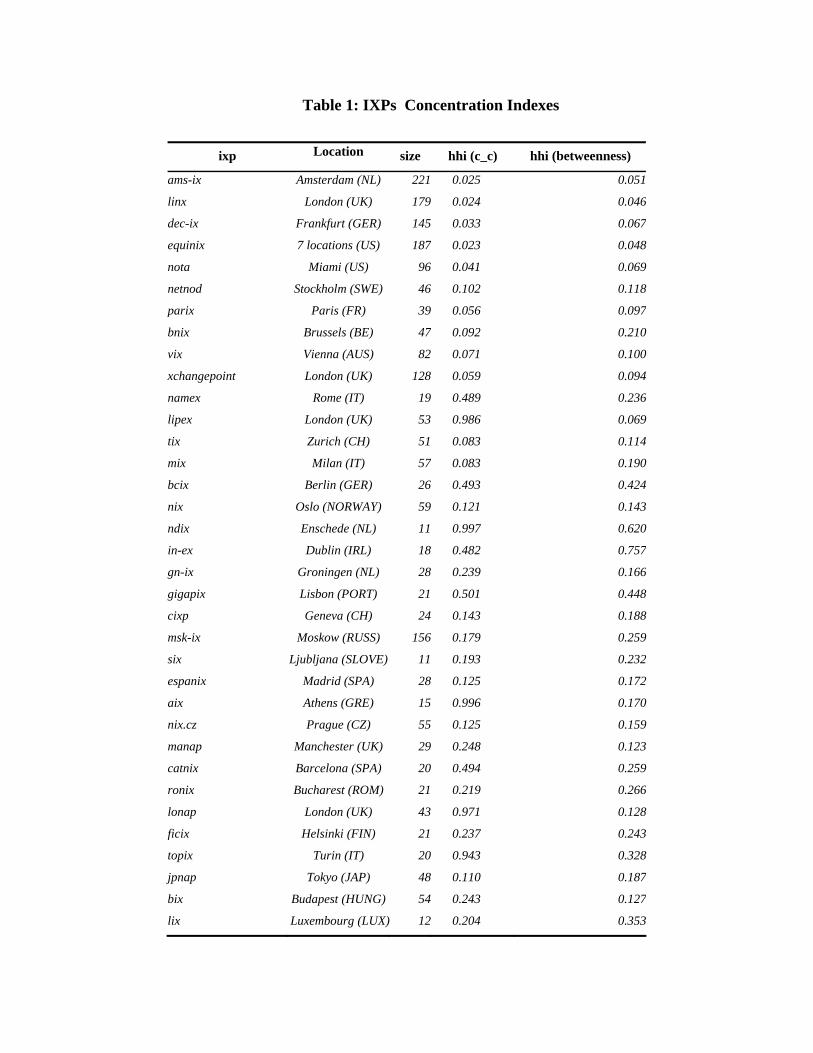
Table 1: IXPs Concentration Indexes
ixp Location size hhi (c_c) hhi (betweenness)
ams-ix Amsterdam (NL) 221 0.025 0.051
linx London (UK) 179 0.024 0.046
dec-ix Frankfurt (GER) 145 0.033 0.067
equinix 7 locations (US) 187 0.023 0.048
nota Miami (US) 96 0.041 0.069
netnod Stockholm (SWE) 46 0.102 0.118
parix Paris (FR) 39 0.056 0.097
bnix Brussels (BE) 47 0.092 0.210
vix Vienna (AUS) 82 0.071 0.100
xchangepoint London (UK) 128 0.059 0.094
namex Rome (IT) 19 0.489 0.236
lipex London (UK) 53 0.986 0.069
tix Zurich (CH) 51 0.083 0.114
mix Milan (IT) 57 0.083 0.190
bcix Berlin (GER) 26 0.493 0.424
nix Oslo (NORWAY) 59 0.121 0.143
ndix Enschede (NL) 11 0.997 0.620
in-ex Dublin (IRL) 18 0.482 0.757
gn-ix Groningen (NL) 28 0.239 0.166
gigapix Lisbon (PORT) 21 0.501 0.448
cixp Geneva (CH) 24 0.143 0.188
msk-ix Moskow (RUSS) 156 0.179 0.259
six Ljubljana (SLOVE) 11 0.193 0.232
espanix Madrid (SPA) 28 0.125 0.172
aix Athens (GRE) 15 0.996 0.170
nix.cz Prague (CZ) 55 0.125 0.159
manap Manchester (UK) 29 0.248 0.123
catnix Barcelona (SPA) 20 0.494 0.259
ronix Bucharest (ROM) 21 0.219 0.266
lonap London (UK) 43 0.971 0.128
ficix Helsinki (FIN) 21 0.237 0.243
topix Turin (IT) 20 0.943 0.328
jpnap Tokyo (JAP) 48 0.110 0.187
bix Budapest (HUNG) 54 0.243 0.127
lix Luxembourg (LUX) 12 0.204 0.353
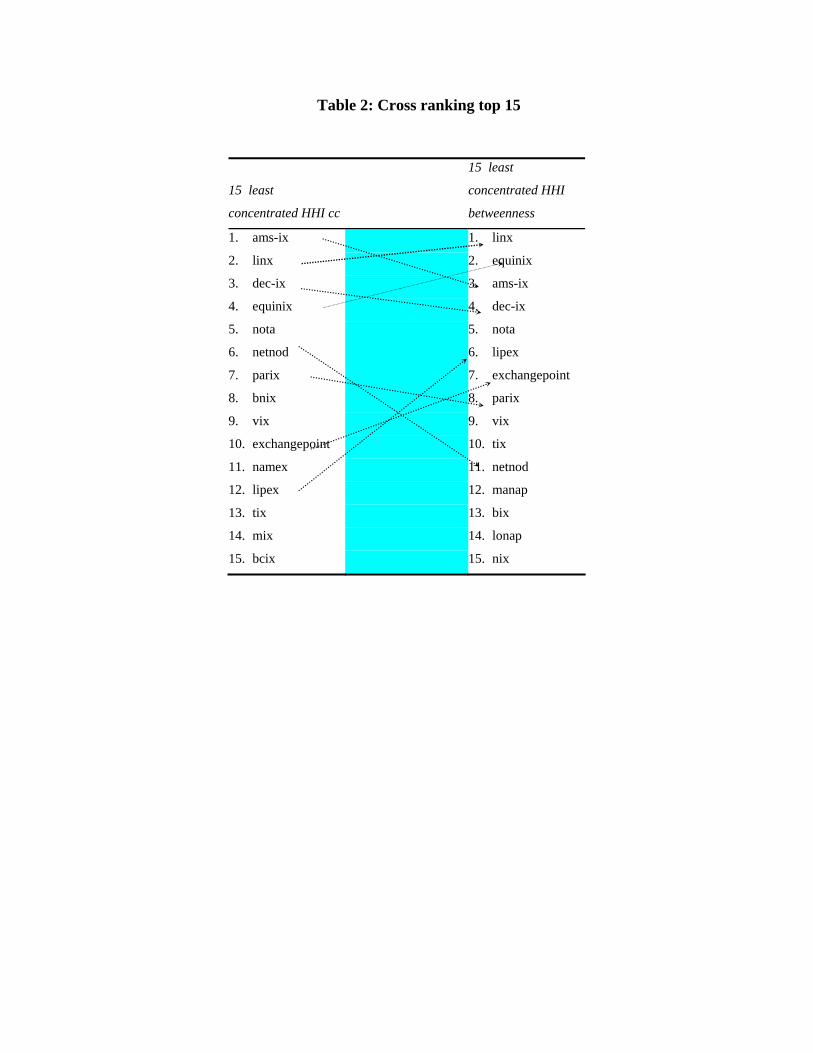
Table 2: Cross ranking top 15
15 least
concentrated HHI cc
15 least
concentrated HHI
betweenness
1. ams-ix 1. linx
2. linx 2. equinix
3. dec-ix 3. ams-ix
4. equinix 4. dec-ix
5. nota 5. nota
6. netnod 6. lipex
7. parix 7. exchangepoint
8. bnix 8. parix
9. vix 9. vix
10. exchangepoint 10. tix
11. namex 11. netnod
12. lipex 12. manap
13. tix 13. bix
14. mix 14. lonap
15. bcix 15. nix
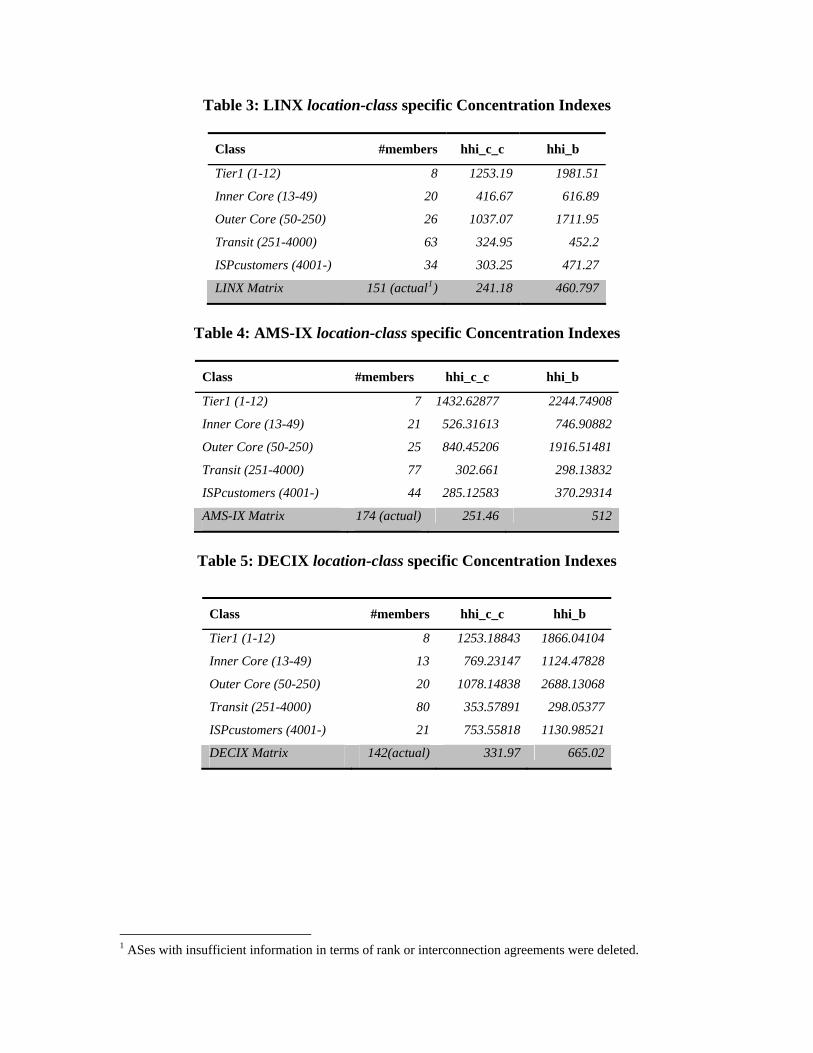
Table 3: LINX location-class specific Concentration Indexes
Class
#members
hhi_c_c
hhi_b
Tier1 (1-12) 8 1253.19 1981.51
Inner Core (13-49) 20 416.67 616.89
Outer Core (50-250) 26 1037.07 1711.95
Transit (251-4000) 63 324.95 452.2
ISPcustomers (4001-) 34 303.25 471.27
LINX Matrix 151 (actual1) 241.18 460.797
Table 4: AMS-IX location-class specific Concentration Indexes
Class
#members
hhi_c_c
hhi_b
Tier1 (1-12) 7 1432.62877 2244.74908
Inner Core (13-49) 21 526.31613 746.90882
Outer Core (50-250) 25 840.45206 1916.51481
Transit (251-4000) 77 302.661 298.13832
ISPcustomers (4001-) 44 285.12583 370.29314
AMS-IX Matrix 174 (actual) 251.46 512
Table 5: DECIX location-class specific Concentration Indexes
Class
#members
hhi_c_c
hhi_b
Tier1 (1-12) 8 1253.18843 1866.04104
Inner Core (13-49) 13 769.23147 1124.47828
Outer Core (50-250) 20 1078.14838 2688.13068
Transit (251-4000) 80 353.57891 298.05377
ISPcustomers (4001-) 21 753.55818 1130.98521
DECIX Matrix 142(actual) 331.97 665.02
1 ASes with insufficient information in terms of rank or interconnection agreements were deleted.
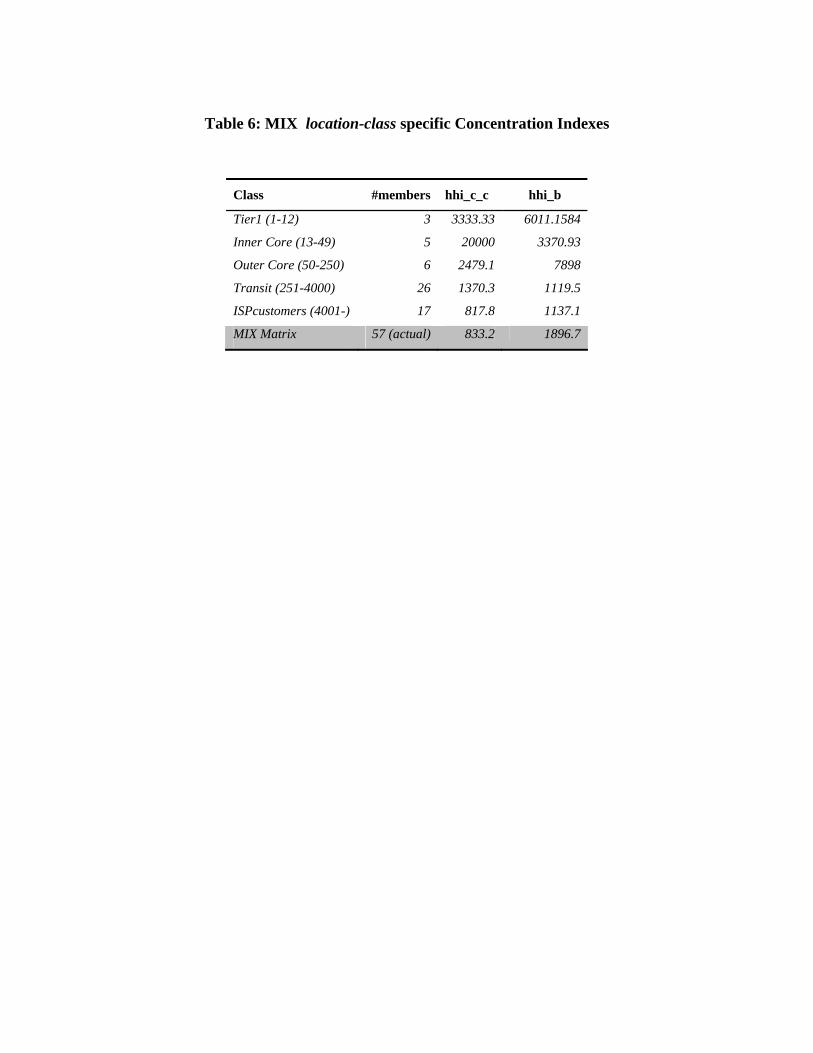
Table 6: MIX location-class specific Concentration Indexes
Class
#members
hhi_c_c
hhi_b
Tier1 (1-12) 3 3333.33 6011.1584
Inner Core (13-49) 5 20000 3370.93
Outer Core (50-250) 6 2479.1 7898
Transit (251-4000) 26 1370.3 1119.5
ISPcustomers (4001-) 17 817.8 1137.1
MIX Matrix 57 (actual) 833.2 1896.7