Embed Size (px)
Citation preview

1
Journal of Economic Psychology, 26(6): 797-826.
A Consumer Behavior Approach to Modeling Monopolistic Competition
Antony Davies
Thomas Cline
March 2005
__________________________ Antony Davies is Assistant Professor of Economics, Finance, and Statistics at the John F. Donahue Graduate School
of Business, Duquesne University, Pittsburgh, PA and Research Fellow at the Mercatus Center’s Capitol Hill
Campus. Thomas W. Cline is Associate Professor of Business and Economics at the Alex G. McKenna School of
Business and Economics at Saint Vincent College, Latrobe, PA. The authors thank Rajdeep Grewal (of Penn State
University), Darrel Muehling, and David Sprott (both of Washington State University), and two anonymous referees
for helpful and critical comments from on the earlier versions of this article. Please direct comments to

2
A Consumer Behavior Approach to Modeling Monopolistic Competition
In this paper, we attempt to integrate research on consumer information processing and the
consumer choice process with the goal of proposing a general framework for modeling consumer
behavior in monopolistically competitive industries. Following a pattern of inductive reasoning,
we posit a set of consumer behavior propositions that is consistent with observed results from
context effects experiments and the phased decision-making literature. We propose that, faced
with many competing brands in a monopolistically competitive environment, consumers can be
said to construct consideration sets on the basis of non-compensatory rules and subsequently
choose from among competing brands within a consideration set on the basis of compensatory
rules. We identify five product-market characteristics that consumers use as heuristics to
maximize the probability of making the optimal brand choice while minimizing the cost of
acquiring and processing information about competing brands. We propose that consumers use
memory and stimuli based information to evolve their unique perceptions of these product-
market characteristics. As a follow-up to our inductive approach, we show that the empirically
documented context effects are consistent with our behavioral propositions. Finally, we use the
propositions to explain several classic cases of consumer behavior observed in the beer, ice-
cream, and automobile industries.
JEL Classification: D43
PsychINFO Classification: 3900
APA Keywords: Marketing, Brand Preference, Consumer Attitudes, Consumer Behavior

3
A Consumer Behavior Approach to Modeling Monopolistic Competition
1. Introduction
Within the psychology and consumer behavior literatures, there exists a wealth of
experimental data focusing on consumer choice in the presence of “brands” (i.e., heterogeneous
variations on a product). Much of the experimental findings, including the attraction effect, the
substitution effect, the compromise effect, the lone-alternative effect, and the polarization effect,
are collectively known as context effects. To date, the literature on context effects and the
consumer choice process remains largely empirical in nature. Lacking is a theoretical foundation
that attempts to explain, in terms of consumer behavior, why context effects exist. In concluding
their seminal work on the attraction and substitution effects, Huber and Puto (1983, p. 41)
remark that context effects “could be specified as a part of a general framework.” Simonson
(1989, p. 159) similarly challenged researchers.
While the marketing literature has devoted much effort to detecting context effects, the
mainstream economic literature has remained relatively silent on the topic. Our hope is to create
a bridge between these two disciplines by offering a theoretical framework that attempts to
explain the empirical observations. We believe that evidence from the context effects and
consumer choice experiments suggest a compelling framework within which economists can
create rich models of consumer behavior in monopolistic competition and marketing researchers
can refine their experiments in context effects. In this paper we develop a general framework that
is consistent with the phased decision-making literature and empirical evidence from published
context effects experiment. In developing the general framework, we suggest a possible
integration among three disparate streams of research: consumer information processing, context
4
effects, and the consumer choice process. Our general framework rests on four important
premises.
1. In a monopolistically competitive environment, consumers may be uncertain about the
attributes of some or all of the brands, and may be unaware (and cognizant of their
unawareness) of the existence of some brands. In an attempt to maximize the likelihood
of making the best purchase decision while minimizing the cost of acquiring and
processing information necessary for that decision, consumers can rely on heuristics (cf.,
Bettman 1979; Bettman, Johnson, and Payne 1991; Biehal and Chakravarti 1986;
Nedungadi 1990).
2. Consumer choice involves sequential stages that result from consumers’ attempts to
resolve uncertainty. This notion of phased decision-making is well documented (cf.,
Kardes et. al. 1993; Bettman 1979; Biehal and Chakravarti 1986).
3. Consumers rely on available information (which maybe be imperfect, incomplete, and/or
obsolete) to construct their perceptions of product-markets (the set of all competing
brands known to the consumer juxtaposed according to the perceived similarity of salient
attributes and the anticipated impact of those attributes on the consumer’s utility; for a
review of this research stream see Alba, Hutchinson, and Lynch 1991; Kardes 1994).
4. Consumers’ perceptions of product-markets influence their subsequent consideration and
choice (cf., Day, Shocker, and Srivastava 1979; Ratneshwar and Shocker 1991).
We identify five salient characteristics of product-markets that consumers can use as choice
heuristics: cluster size, cluster variance, cluster frontier, granularity, and brand variance. These
5
product-market characteristics provide information for a non-compensatory short-listing of
brands and subsequent compensatory comparison of short-listed brands.1
We organize the remainder of the paper as follows. In the next section, we explain the need
for the framework, review pertinent literature, and present the core propositions. Next, we show
how our framework is consistent with observed context effects and demonstrate strategic
applications of the framework. Finally, we offer concluding remarks on the implications of our
framework for future research.
2. *eed for a Framework
For perfectly competitive and monopoly industries, the consumer choice process is relatively
trivial. In the case of perfect competition, competitive forces assure the consumer that the
attributes of one brand are identical to the attributes of all other brands. In the case of monopoly,
there is only one brand about which the consumer must glean attribute information.
Monopolistically competitive industries, however, present a special problem for the consumer
vis-à-vis information gathering. Not only are there many brands from which to choose, but each
brand’s attribute combination differs from that of every other brand in some (potentially) non-
trivial fashion. Because the number of brands can be large, as consumers attempt to make
optimal decisions, they must trade-off an increase in the probability of purchasing a “wrong”
brand (i.e., a brand that does not maximize utility) for a decrease in the costs of information
gathering and processing. At one extreme, the consumer can purchase the first brand s/he
encounters, thus incurring a significant risk of having made a sub-optimal purchase decision. At
the other extreme, the consumer can collect enough information to minimize the risk of a sub-
1 Non-compensatory evaluation involves drawing a “line in the sand” that separates brands into those deemed “acceptable” and “unacceptable.”
For example, a consumer in the bond market may remove from consideration all bonds with less than an A rating. Compensatory evaluation
involves weighing tradeoffs in attributes of different brands. For example, a consumer in the bond market may tradeoff a Aaa rating for a Aa rating in exchange for an extra half-point in interest.

6
optimal decision, but only at considerable cost. Toward which extreme the consumer tends
depends consumer involvement, i.e., the extent to which a consumer is willing and able to
evaluate brand attributes. The framework we propose assumes consumer choice situations in
which selecting a sub-optimal brand is costly enough to warrant sufficient involvement, but not
so costly as to require complete information.
Modeling consumer choice requires examining both the various stages of consumer decision-
making and the factors that influence these stages (Howard and Sheth 1969; Narayana and
Markin 1975; Silk and Urban 1978; Urban 1975). In the case of high consumer involvement, the
consumer choice process typically involves three distinct stages: product-market perception,
consideration, and choice. The consumer forms a product-market perception—the mental
juxtapositioning of brands according to salient attributes (cf., Biehal and Chakravarti 1986;
Kardes et al. 1993; Shocker et al. 1991)—by relying on memory and other physically present
information (Lynch and Srull 1982). The consumer perceives the product-market as a collection
of known brands that the consumer has utility-ranked according to salient attributes and based on
incomplete information and imperfect experience. Given the perceived product-market, the
consumer next uses non-compensatory screening to form a consideration set (Bettman, Johnson,
and Payne 1991; Bettman and Park 1980) from among the set of all perceived brands.2 Finally,
given the consideration set, the consumer uses compensatory evaluation to arrive at a final
choice (Bettman 1979; Johnson and Meyer 1984; Lussier and Olshavsky 1979; Payne 1982).
Consistent with contemporary research on decision-making (cf., Deighton 1984; Ha and
Hoch 1989; Hoch and Deighton 1989; Hoch and Ha 1986), we propose that consumers follow an
iterative choice process of: (1) product-market perception, (2) consideration of a single subset of
2 For example, a consumer might immediately split the automobile product-market into two sets: compact cars and SUV’s, and not consider
compact cars. Similarly, a consumer might immediately split the housing product-market into three sets: apartments, one- and two-bedroom
houses, and three- or more-bedroom houses, and consider only one- or two-bedroom houses. In an empirical study, Hauser (1978) attributed 78% of explained variance in brand choice to consideration and only 22% to preferences among the considered brands.
7
brands within the perceived product-market, (3) choice of one brand from among the
consideration set, (4) consumption/experience of the chosen brand, and (5) adjustment of
product-market perception on the basis of the consumption/experience. Through this repetitive
process, consumers iteratively adjust their perceived product-markets according to their
consumption experiences.
Next, we propose that consumers, faced with the two unacceptable extremes of gathering no
product-market information and gathering all product-market information, will utilize heuristics
in an attempt to wring maximal information from the product-market at minimal cost.
3. Incomplete Information and Imperfect Experience
Let the true brand universe be the positioning of all existing brands according to their true
(as opposed to perceived) determinant attributes.3 Assuming that the cost of gathering complete
information about all existing brands is prohibitive, consumers will not observe the true brand
universe, but will mentally construct estimated brand universes based on available information.
Estimated brand universes differ from the true brand universe due to external uncertainties: (1)
partial information—consumers may be unaware of all the brands in the true universe, (2)
measurement error—consumers may measure brands’ attributes inaccurately or may be unaware
of a particular attribute,4 and (3) obsolete information—consumers may fail to update their
mental pictures of the true brand universe as quickly as the brand universe evolves (cf., Burke
and Srull 1988; Krugman 1965).
3 Determinant attributes, by definition, have no impact on consumer choice. However, what attributes are considered salient may vary across consumers. For example, a car buyer who does not understand the concept of “torque” will find engine torque ratings to be non-salient, while a
car buyer who is also a mechanic may find torque ratings salient. 4 This may arise from, among other things, involvement (Petty and Cacioppo 1990). Peter and Olsen (1997) describe this as “misinterpretation of the environment.”
8
Let the utility a consumer derives from consuming a brand be determined by the consumer’s
true utility function. Consumers do not observe their true utility functions because of the
prohibitive cost of acquiring detailed experience with all attributes of all brands and instead
make purchase decisions on the basis of their estimated utility functions. Estimated utility
functions differ from true utility functions due to internal uncertainties5: (1) absolute utility
error—consumers may be uncertain as to the future consequences of their purchase decisions
(e.g., Will the fact that automobile airbags reduce injury bring me peace-of-mind?), and (2)
relative utility error—consumers may be uncertain about the relative influence or weight of each
attribute on their utility functions (e.g., Will the peace-of-mind that airbags bring be as important
as the feeling of power obtained via high engine performance?; cf., Simonson, 1989). Consumers
with more experience will have estimated utility functions that are closer to their true utility
functions.6
Following the phased decision-making literature (cf., Biehal and Chakravarti 1986; Kardes et
al. 1993; Shocker et al. 1991), we describe the first stage of the consumer choice process,
product-market perception, as the consumer’s attempt to generate an estimated brand universe on
the basis of available information about brands, and to generate an estimated utility function on
the basis of past consumption experience.
4. The Iterative Choice Process
Because information/experience gathering is costly, consumers will curtail
information/experience gathering at some point and make purchase decisions on the basis of
5 This explains, for example, why consumers would be interested in reading a connoisseur’s reviews of various wines instead of simply going out
and trying the wines themselves. 6 The internal and external uncertainties correspond to Manski’s (1977) sources of uncertainty in stochastic utility models: non-observable
characteristics, non-observable variations in utility, measurement errors, and functional misspecification. While Manski describes these errors as
components of a regression error that reflects imperfectly modeled utility, they can be interpreted as components of a choice error that reflect imperfectly anticipated utility.

9
incomplete information and imperfect experience (cf., Kahneman 1973; Klinger 1975; Brucks
1985; Janiszewski 1988; Park and Young 1986). Through the information and experience
gleaned from consumption, consumers may realize that they have misestimated the true brand
universe and/or their true utility functions (see Hawkins and Hoch 1992; Hoch and Deighton
1989; Hoch and Ha 1986 for similar expositions). Thus, consumers are able to re-evaluate their
estimated brand universes and estimated utility functions “in an ongoing process of adaptation”
to their environment (Ratneshwar and Shocker 1991, p. 292; also see Srivastava, Alpert, and
Shocker 1984).7 This gives us our first proposition:
P1 Consumer choice follows an iterative process in which consumers use experience gained
from consumption to reduce the deviations of their estimated brand universes from the
true brand universe and the deviations of their estimated utility functions from their true
utility functions.
5. Compensatory and *on-Compensatory Choice Strategies
Whereas compensatory models hold that consumers will trade-off one attribute for another,
non-compensatory models maintain that consumers will choose only those brands in which all
(conjunctive), at least one (disjunctive), or the most important (lexicographic) criterion exceeds
some lower limit (cf., Bettman 1979). Researchers have suggested that, rather than a single
process, consumers are likely to use a combination of processes in many choice situations (e.g.,
Bettman and Park 1980). A non-compensatory strategy might be used to reduce quickly, and at
low cognitive cost, the choice alternatives to a manageable number by rejecting those brands that
lack one or two key criteria (Peter and Olson 1996). For example, in looking for housing, one
7 Consumers can also rely on the reported experiences of other consumers to adjust their estimated brand universes and estimated utility functions (cf., Earl and Potts 2004).

10
person may begin by considering only apartments with three or more bedrooms, whereas another
may begin by considering only suburban locations.
P2 Consumers employ non-compensatory strategies in the consideration stage of the choice
process, and compensatory strategies in the choice stage of the choice process.
6. Clustering
By mentally grouping similar objects, consumers’ information processing efficiency and
cognitive stability are enhanced (cf., Cohen and Basu 1987; Lingle, Altom, and Medin 1984;
Sujan and Bettman 1989). We propose that consumers attempt to minimize the effects of
uncertainty by dividing the estimated brand universe into “clusters”—groups of brands
positioned closely in an attribute space (cf., Cooper and Inoue 1996; Green and Srinivasan 1990;
Harshman et al. 1982).8 The consideration stage of the choice process can be characterized as the
selecting of one cluster from among competing clusters, while the choice stage can be
characterized as the choosing of a single brand from within the considered cluster. Thus, the
probability of choice is more properly described as the probability of choice-given-consideration
(cf., Kardes et al. 1993). Finally, we can imagine a consumer considering, in addition to all
perceived clusters, a “null cluster” that represents no purchase or a delayed purchase decision.
P3 Consumers mentally group brands into clusters according to perceived similarities. In
the consideration phase of the choice process, consumers select one cluster from among
competing clusters and the null (“no purchase”) cluster. In the choice-given-
consideration phase, consumers select one brand from within the considered cluster.
8 Consumers will not, on average, impose non-compensatory limits that do not also mark cluster boundaries. The argument for this is reverse-
causal: firms have positioned their brands, a priori, on the basis of consumer segments. Thus, to the extent that consumer segments bifurcate at certain attribute levels, brands will follow.

11
7. Product-market Characteristics
We identify five characteristics of the consumer’s perceived product-market that could be
useful to consumers in constructing heuristics: cluster size, cluster variance, cluster frontier,
brand variance, and granularity.
a. Cluster Size
Let the number of brands the consumer groups into a single cluster be the cluster size. A
change in cluster size can imply a change in internal and/or external uncertainties. Larger cluster
size may be an indication of lesser external uncertainty concerning the cluster because: (1)
observing more brands implies (ceteris paribus) that a greater proportion of the true universe is
observed (reduced partial information), (2) observing more brands with similar attributes (i.e.,
brands in the same cluster) can provide confirmation that the consumer has correctly observed
attribute levels (reduced measurement error), and (3) observing more brands in a specific cluster
can imply a lesser probability of brands altering their attributes; the cluster may be stable over
time (reduced obsolete information).9
Consumers may also take the number of brands in a cluster as a proxy for the demand for
brands in that cluster (cf., Dhar and Glazer 1996; Medin, Goldstone, and Markman 1995;
Nosofsky 1987). Thus, a larger cluster size can imply less internal uncertainty concerning the
cluster because observing more brands implies greater consumer demand within the cluster, and
greater demand implies that consumers’ preferences are being satisfied within the cluster. This is
consistent with evidence that consumers make use of other people’s experience when making
purchase decisions (cf. Earl and Potts 2004; and Pinske and Slade 1998).
9 For example, consumers may have believed that the VHS format would supplant the Betamax format because there were a greater number of brands using the VHS format. Similarly, despite being user-friendlier and employing a more powerful microprocessor, in the 1980’s the
Macintosh brand lost substantial market share to IBM clones. One possible explanation is that there were a large number of brands in the IBM
clone cluster and so consumers took this as a signal of greater survival probability for the cluster. All other things equal, a reduction in external uncertainty increases the relative demand for brands within the cluster for risk-averse consumers.

12
[Insert Figure 1 here]
Additionally, people have inherent motives to justify their decisions to others and to
themselves (Baumeister 1982; Schlenker 1980; Blau 1964), to bolster self-esteem (Hall and
Lindzey 1978), to alleviate cognitive dissonance (Festinger 1957), and/or to reduce anticipation
of regret (Bell 1982). Cluster size can help consumers seek (1) to justify their behavior to others
in order to verify that they have not succumbed to external uncertainties, and (2) to confirm their
behavior to themselves in order to verify that they have not succumbed to internal uncertainties.
In sum, observing a larger cluster can imply (1) more brand information (i.e., less external
uncertainty) and (2) more affirmation by other consumers (i.e., less internal uncertainty).
Due to cognitive constraints, consumers are likely first to compartmentalize alternatives (i.e.,
“shortlist”) and subsequently resort to detailed analysis of the shortlist (Bronnenberg and
Vanhonacker 1996; Gensch 1987; Kardes et al 1993; Shocker et al 1991). Cluster size provides a
ready heuristic for initial shortlisting and hence we expect cluster size to directly influence
consideration. This line of reasoning is consistent with the “portfolio effect” (Kahn et al. 1987)
which suggests that individuals exhibit a tendency toward selecting that group of objects with the
largest number of elements because it is thought to give them greater flexibility in making the
final choice (see also Sivakumar 1995). We do not, however, expect cluster size to influence the
choice stage because, at this stage, a consumer is likely to resort to more involved decision-
making and is less likely to resort to heuristics (cf., Chaiken 1980; Petty, Cacioppo, and
Schumann 1983).
P4 The probability of a consumer considering brands within a given cluster increases as the
perceived size of the cluster increases, ceteris paribus.10
10 In cases of lower consumer involvement, one might argue the reverse of P4. Specifically, increasing the number of brands in a cluster increases the quantity of information the consumer would need to process were the consumer to select the cluster. With low consumer involvement, the

13
b. Cluster Variance
Let the average dispersion of brands around the cluster center be the cluster variance.11 A
change in cluster variance can imply a change in internal and external uncertainties. Consumers
may interpret larger cluster variance as an indication of greater external uncertainty because
observing a greater variance among brands within a cluster could indicate that (1) there are
brands within the cluster of which the consumer is unaware (i.e., there is more “space” between
known brands where one could surmise unobserved brands existing), (2) consumers have
incorrectly grouped inherently disparate brands into the same cluster (i.e., the brands actually
comprise two low-variance clusters rather than one high-variance cluster), (3) consumers have
erroneously measured some of the attributes (i.e., if the attributes were correctly measured, the
disparity among the brands would be less), and (3) the brands’ attributes are changing as firms
search for improved brand positions (i.e., the cluster represents a new grouping of brands such
that firms are exploring disparate niches within the new cluster). Consumers may also interpret
larger cluster variance as an indication of greater internal uncertainty because: (1) observing a
greater variance among brand attributes within a cluster implies greater uncertainty regarding the
consequences of a purchase, and (2) high cluster variance may increase error in estimating the
utility of consumption by sending-out confusing signals about attribute weights. 12
[Insert Figure 2 here]
In summary, greater cluster variance can imply greater perceived internal and external
uncertainties. Two possible mechanisms explain the link between uncertainty and decision-
anticipated cognitive cost of processing that information can be high enough (relative to the expected reward from avoiding a sub-optimal
choice), that the likelihood of the consumer considering the cluster declines. 11 For a cluster comprised of n brands with k attributes located at
1 1
1( ,..., )Ka a through 1( ,..., )- -
Ka a where n
ka is the value of the kth attribute of the
nth brand, the center of the cluster is 1( ,..., )c c
Ka a where 1
1
=
= ∑-
c n
k k
n
a a-
, and the variance of the cluster is ( )2
1 1
1 - Kn c
k k
n k
v a a- K = =
= −+∑∑ .
12 For example, a consumer who otherwise knows nothing about computers and observes three computer brands with microprocessor speeds of
1.8 GHz, 2 GHz, and 2.2 GHz can be more confident of the utility she can expect to gain from her brand choice than she would have been had
she observed three brands with speeds of 1 GHz, 2 GHz, and 3 GHz. Greater dissimilarity among brands in a cluster, ceteris paribus, implies a
greater potential opportunity cost to inadvertently selecting a sub-optimal brand.
14
making. The omission-detection perspective suggests that when consumers become sensitive to
missing information, they form moderate judgments (Kardes and Sanbonmatsu 1993;
Sanbonmatsu et al 1997; Sanbonmatsu, Kardes, and Herr 1992; Sanbonmatsu, Kardes, and
Sansone 1991; Huber and McCann 1982; Johnson and Levin 1985; Ross and Creyer 1992). The
accessibility-diagnosticity model suggests that, in addition to being able to access information,
the diagnosticity of information is important in decision-making (Fazio, Powell, and Williams
1989; Feldman and Lynch 1988; Herr, Kardes, and Kim 1991; Lynch, Marmorstein, and
Weigold 1988). In these terms, we expect high cluster variance to make the focal attribute less
diagnostic and hence render the overall cluster less attractive. In addition, the diagnosticity
hypothesis in the research on similarity processes and categorization (cf., Tversky 1977; Tversky
and Gati 1982) suggests that the diagnostic value of attributes is determined by and determines
the similarity between brands. Typically, cluster variance should decrease as the similarity
between brands in the cluster increases. Thus, clusters with lower variance should be preferable
(also see Medin, Goldstone, and Markman 1995; Markman and Medin 1995).
P5 The probability of a consumer considering brands within a given cluster decreases as the
perceived variance of the cluster increases, ceteris paribus.
c. Brand Extrapolation and the Cluster Frontier
Let the cluster frontier be the combination of attribute values such that each attribute value is
equal to the maximum of the attribute values over all brands in the cluster.13 Let the cluster
origin be the combination of attribute values such that each attribute value is equal to the
minimum of the attribute values over all brands in the cluster.14 By weighting attributes
according to their importance (i.e. the utility they yield), a brand’s distance from the cluster
13 A cluster frontier is a segment-specific case of an ideal point (Kamakura and Rajendra 1986). An ideal point is conceptualized as a universal
preference, specified at the individual or household level. Cluster frontiers articulate various ideal points at the customer segment level. 14 For example, in a three-brand three-attribute cluster with brands positioned at (2,1,4), (3,4,3), and (5,2,2), the cluster frontier is positioned at
(5,4,4) and the cluster origin is positioned at (2,1,2).
15
origin will be directly proportional to the utility the consumer expects from consuming the
brand.15 It is possible for a cluster’s frontier to be either occupied (i.e., the consumer is aware of
the existence of a brand within the cluster that combines the best attributes of all the known
brands) or unoccupied (i.e., the consumer imagines the possibility, but does not observe the
existence, of a brand that combines the best attributes of all the known brands within the cluster).
Based on their estimated brand universes, consumers can use the positions of observed
brands within clusters as signals for the positions of additional unobserved brands within those
clusters. We refer to this phenomenon as brand extrapolation.16 Consumers may believe that
some attributes cannot be traded, or that they can be traded but with diminishing returns. We call
these perceived restrictions technological constraints.17 Awareness of technological constraints
(brought about by familiarity and knowledge) limits the degree to which consumers perform
brand extrapolation (cf., Alba and Hutchinson 1987; Brucks 1985; Simonson, Huber, and Puto
1988; Sujan 1985). The failure to correctly identify technological constraints is an instance of
external uncertainty and is more likely to happen with novice consumers than with expert
consumers (Figure 3). Because brand extrapolation is costly, it is likely that the consumer will
first develop a short-list of brands, and then apply brand extrapolation to the short-list (Batra and
Ray 1986; Cacioppo and Petty 1982; Park and Young 1986; Yalch and Elmore-Yalch 1984).
Thus, we posit that brand extrapolation occurs in the choice stage and not the consideration stage
of the decision-making process.
P6 Consumers will mentally combine the different perceived attributes from different known
brands within the considered cluster to infer the attributes of a (possibly unobserved)
15 This argument follows Netz and Taylor (2002). Note that, by construction, the axes of the product-market space measure the utility obtained
from the attributes. 16 For example, a consumer who observes a thin crust / 3-cheese pizza at one restaurant and thick crust / 5-cheese pizza at another restaurant can
expect the existence of both (1) a thin crust / 5-cheese pizza, and (2) a thick crust / 3-cheese pizza, even if this consumer has not yet encountered
these brands. 17 For example, a consumer who observes an 8-cylinder / 20-mpg car and a 4-cylinder / 50-mpg car understands that additional power comes at a
price of diminished mileage, and so may not expect to observe an 8-cylinder / 50-mpg.
16
best brand. The inferred cluster frontier will combine the best attributes from each
perceived brand within the cluster subject to perceived technological constraints.
[Insert Figure 3 here]
P7 The probability of a consumer choosing a brand, given that the consumer is considering
the brand’s cluster, decreases as the perceived distance between the brand and the
cluster frontier increases, ceteris paribus.
d. Brand Variance
In the presence of external uncertainties, consumers may not be certain about the true
attributes of brands. For example, a car may be advertised as getting 25 mpg, but mileage varies
based on driving habits and, in any event, is merely an average measure for cars of a specific
model, not a measure for a particular car. Thus, consumers are likely to treat “25 mpg” as the
mean of a distribution. The case of fuzzy, non-numeric information is even stronger (Deighton
1984; Ha and Hoch 1989; Hoch 1988; Hoch and Deighton 1989; Hoch and Ha 1986). We call
the variance of a consumer’s estimate of the attribute measures for a brand the brand variance.
[Insert Figures 4]
We posit that brand variance negatively moderates the effect of a brand’s distance from the
cluster frontier on brand choice. Figure 4 shows a consumer’s perception of the attributes of
three brands under conditions of low and high brand variance. The consumer is aware that the
true attribute levels for the brands lie somewhere within the squares, yet the consumer is unaware
of the exact levels of the brand’s attributes and so is unable to extrapolate an exact cluster
frontier. With a perception of the upper and lower limits for the attributes of the brands, the
consumer can extrapolate the upper and lower limits for the cluster frontier. The frontier squares
in Figures 4 show the ranges within which the consumer would expect to find the cluster

17
frontiers. Given low brand variance (Figure 4a), if the consumer were to select Brand B or C
instead of Brand A, the worst that could happen would be that the true locations of Brands A, B,
C, and the cluster frontier would be those shown by the dots within the squares. Despite the
uncertainty, and following P7, the consumer is more likely to choose Brand A over Brand B or C,
though perhaps not as readily as in the case of zero brand variance.
Given high brand variance (Figure 4b), if the consumer were to select Brand B or C instead
of Brand A, the worst that could happen would be that the true locations of Brands A, B, C, and
the cluster frontier would be those shown by the dots within the squares. In this high brand
variance case, Brand A ends up being, a posteriori, a sub-optimal choice to Brands B and C. The
literature suggests that, in the face of high brand variance, consumers are less likely to make
inferences, and are more likely to adjust their judgments for uncertainty (Dick, Chakravarti, and
Biehal 1990; Holland et al 1986; Cialdini et al. 1973; Sanbonmatsu, Kardes, and Sansone 1991;
Simmons and Lynch 1991).
P8 A brand’s distance from the cluster frontier has a greater effect on the probability of
choice-given-consideration under conditions of low (vs. high) brand variance, ceteris
paribus.
e. Granularity
Finally, we propose that cross-cluster heuristics (P4 and P5) are attenuated (augmented) as a
consumer is less (more) able to identify individual brands as belonging to well-defined clusters.
Granularity can be described as the “signal to noise” ratio the consumer perceives in relative
brand positions.18
P9 Increased granularity augments the positive effect of cluster size and the negative effect
of cluster variance on the probability of consideration, ceteris paribus.
18 Granularity can be operationalized as the ratio of the “between” to “within” cluster variances.
18
8. Consideration and Choice as Lotteries
We can model the two-stage choice process as a compound lottery wherein a brand is a
lottery over a set of attribute payoffs, and a cluster is a lottery over a set of brands. Let the actual
attributes of the nth brand within the m
th cluster be represented by the vector xm,n, and the
consumer’s expectation of the brand’s attributes be ,m nx . The utility the consumer obtains from
consuming this brand is ( ),m nu x .19 At the consideration stage, the consumer does not weigh
tradeoffs in the attributes of individual brands, but rather selects one cluster via non-
compensatory screening. As such, we propose that the consumer will regard the “attributes” of a
cluster as the average of the expected attributes of the observed brands within the cluster (i.e. the
cluster center).20 The consumer observes -m brands within cluster m, perceives the average of
these brands’ attributes, mx , and perceives a variance among the brands’ attribute levels of 2
ms .21
The consumer knows that, because s/he has not observed all the brands that exist, the consumer’s
perception of the cluster center, mx , is measured with error. The greater the error with which the
cluster center is measured, the less effective is the cluster-based non-compensatory screening
because of the increased probability of erroneously selecting a sub-optimal cluster. Following the
central limit theorem, the perceived variance of the cluster center about the true (unobserved)
cluster center is 2 /m ms - .
19 We make the standard assumptions that u is continuous and twice differentiable. 20 One might argue that the consumer should use the “best” brand as being representative of the cluster. At the consideration stage, the consumer
seeks to characterize the entire cluster for the purpose of selecting one cluster over another. Characterizing the cluster according to the attributes
of any single brand requires that the consumer weigh attribute tradeoffs between brands so as to determine the best single brand. This behavior,
while possible, eliminates the consideration phase entirely and so is likely to occur only in situations in which the consumer would tend not to
follow a two-stage choice process – for example, in cases in which the actual number of brands in the universe is small enough to obviate the
need for choice heuristics. 21 Let 2
mσ denote the “population” cluster variance – i.e. the cluster variance that one would measure if one could observe all the brands that exist
in the cluster at all the points in time that the brands existed (the latter to allow for the possible movement of brands within the cluster). The
observed cluster variance, 2
ms , is a sample estimate for 2
mσ , and we have 2 2limm
m m-
s σ→∞
= .

19
In the language of utility expectation, the consumer regards each cluster as a lottery. This is
not to imply that the consumer expects to randomly select a brand from a cluster. At the
consideration stage, the consumer is regarding each cluster, m, as a brand with attributes mx ,
knowing that, at the choice stage, s/he will (likely) end up consuming a brand with attributes
different from those of mx . Because the cognition required for determining the brand to be
consumed at the choice stage is absent at the consideration stage, selecting a cluster is analogous
to choosing a lottery where the expected attribute set, mx , is the expected payoff of the lottery
(cf. Varian 1992, pp. 172-174). The utility of the lottery’s expected payoff is ( )mu x . The
expected utility of the lottery is the utility the consumer expects to receive from cluster m,
( ),
1
m-
m m i
i
u u x=
=∑ . The second-order Taylor expansion yields ( ) ( ) ( )1
'' var2
m m mu u x u x ε+� where
ε is the deviation of the perceived cluster center, mx , from the actual cluster center. We have
shown already that the variance of this error is 2 /m ms - . Noting that, for the risk-averse
consumer, ( )'' 0mu x < , we substitute into the Taylor expansion and obtain the following:
( )2
2
1'' 0
2
m mm
m m
u su x
- -
∂− >
∂� (1)
( )2
1 1'' 0
2
mm
m m
uu x
s -
∂<
∂� (2)
These results are, respectively, P4 and P5.
The choice phase can be similarly described wherein the consumer regards each brand as a
lottery. At the choice stage, the consumer selects a brand on the basis of perceived (i.e. expected)
attributes, knowing that the brand’s true attributes may differ from the expected. The utility of
the lottery’s expected payoff is the utility the consumer would receive from consuming the

20
brand’s expected attributes, ( ),m nu x . The expected utility of the lottery is the utility the
consumer expects to receive from the brand, ,m nu . Let 2
,m nθ be the measure of brand variance for
brand n within cluster m. Applying the second-order Taylor expansion and assuming risk-
aversion, we have:
( ),
,2
,
1'' 0
2
m n
m n
m n
uu x
θ
∂<
∂� (3)
which is consistent with P8.
These results indicate the possible existence of a fundamental link between decision-making
under uncertainty and monopolistic competition wherein uncertainty provides a channel by
which firms can use brand positioning to impact consumers’ expected utilities not simply via
influencing perceived attribute levels but also by influencing the uncertainties associated with
those perceptions.
9. Product Market Characteristics and the Three-Stage Iterative Choice Process
Figure 5 summarizes the iterative three-stage choice process proposed by our framework.
The consumer, faced with incomplete information, employs heuristics in an attempt to minimize
the cognitive cost of decision-making plus the expected opportunity cost of consuming a sub-
optimal brand via consideration and choice. After consuming the chosen product, the consumer
revises information about both the product’s attributes and the utility gleaned from the attributes.
The consumer then adapts his/her perception of the product-market via mentally repositioning
the consumed brand and, possibly, reforming clusters. The consumer bases the next purchase
decision on this revised mental mapping of the product-market.
[Insert Figure 5 here]
21
10. Context Effects and Brand Universe Characteristics
Earlier studies focused on demonstrating the existence of context effects (Huber and Puto
1993; Kahn, Moore, and Glazer 1987; Simonson and Tversky 1992). Subsequent investigations
have examined reasons for context effects (Simonson and Tversky 1992; Wedell 1991;
Wernerfelt 1995), the antecedents to context effects (Mishra, Umesh, and Stem 1993; Sen 1998),
and the use of context effects in strategy formulation (Lehmann and Pan 1994; Pan and Lehmann
1993). Though these frameworks provide meaningful insights into specific context effects, they
all have a common limitation—none of these frameworks is useful in explaining all context
effects. We contend that one of the main contributions of our framework is that it can provide
meaningful explanation for all context effects.
a. Attraction Effect, Substitution Effect, and Proportionality
The attraction effect refers to the ability of a newly introduced, completely dominated brand
(a “decoy”) to increase the share of existing brands positioned close to it (Huber, Payne, and
Puto 1982; Huber and Puto 1983; Mishra, Umesh, and Stem 1993; Ratneshwar, Shocker, and
Stewart 1987; Sen 1998; Simonson and Tversky 1992; Wedell 1991; Heath and Chatterjee
1995). Within the context of our general framework, we can explain the attraction effect as
follows. Consumers regard the brand universe as being comprised of two clusters, one with two
brands (the target and decoy) and the other with one (the competitor), P4 suggests that the
probability of consideration for brands in the target cluster increases when the decoy is
introduced. Thus, P4 suggests an increase in the probability of consideration (and hence the
unconditional probability of choice) for the target. Alternatively, an argument could be made
that, because the introduction of the decoy increases the variance of the target brand’s cluster, by
P2, the probability of consideration for the cluster may decrease. Accordingly, our framework

22
suggests that the attraction effect should only be observed if the increase in the probability of
consideration caused by the increase in the number of brands in the cluster exceeds the decrease
in the probability of consideration caused by the increase in the cluster variance (Figure 6a)
Huber and Puto (1983) note that when the decoy brand is positioned such that it
asymmetrically dominates the target brand, local substitution effects occur. Describing it as the
negative substitution effect, Huber and Puto (1983, p. 38) observe that the decoy “takes share
predominantly from similar items” and that the substitution effect is “highly sensitive to the
positioning of the new item.” Figure 6b shows the introduction of an asymmetrically dominated
decoy into the target brand’s cluster. Prior to the addition of the decoy, the target brand was
located at the cluster frontier (when there is only one brand in a cluster, that brand is the
frontier). Because the decoy asymmetrically dominates the target brand, the introduction of the
decoy pushes the cluster frontier such that the frontier is even with the target on one attribute and
with the decoy on the other.22 The movement of the frontier away from the target brand
decreases the probability of choice-given-consideration for the target brand (P7). The substitution
effect arises when the increase in the probability of consideration (due to the increase in the size
of the cluster—P4) is outweighed by the combination of a decrease in the probability of
consideration (due to the increase in the cluster variance—P5) and a decrease in the probability
of choice-given-consideration for the target brand (due to the movement of the frontier—P7). If
the increase in the probability of consideration through P4 exactly balances with the decreases in
probabilities through P5 and P7, then we have what Huber and Puto describe as proportionality,
the simultaneous occurrence of the attraction and substitution effects resulting in a proportionally
equal decline in the demand for all other brands upon the entrance of a new brand. In summary,
22 This assumes no technological constraints. Huber and Puto’s experiments appear to have been devoid of technological constraints.

23
the manifestation of cluster size, cluster variance, and brand variance in various combination
results in either the attraction effect, the substitution effect, or in proportionality.23
[Insert Figure 6 here]
b. Extremeness Aversion: the Compromise Effect
Simonson and Tversky (1992) distinguish between two types of extremeness aversion. The
first form is the compromise effect, which has been observed to occur symmetrically in a three-
brand product-market. For example, adding brand z to the choice set of existing brands x and y
increases the preference for brand y. In a symmetric manner, adding brand x to the choice set of
existing brands y and z increases the preference for brand y (see Figure 7a). Brand extrapolation
provides a possible explanation for the compromise effect (see Figure 7b). Let us assume that the
three brands belong to a single cluster. When the consumer is presented with brands x and y, the
consumer extrapolates the cluster frontier indicated in Figure 7b. Adding brand z causes the
consumer to mentally reposition the cluster frontier to the right. The new cluster frontier is
positioned farther from brand x than from brand y (because brand y is more similar to the new
brand z than is brand x). According to P7, the preference for brand y relative to brand x will
increase. Similarly, if the market first consists only of brands y and z, adding brand x moves the
cluster frontier up in Figure 7b. The new cluster frontier is positioned farther from brand z than it
is from brand y, and, again by P7, the preference for brand y relative to brand z will increase.
[Insert Figure 7 here]
The presence of symmetric technological constraints may exacerbate the compromise effect.
As Figure 8a shows, when symmetric technological constraints exist, the frontier is at a less
extreme position, thereby heightening the compromise effect by reducing the distance of the
23 Parducci’s (1965) range-frequency theory is one of the first to be used to explain the attraction effect, though with not much success. Due to
space limitations and the low explanatory power of the theory, we do not survey this research. For details, see Heath and Chatterjee 1995; Huber,
Payne, and Puto 1982; Huber and Puto 1983; Ratneshwar, Shocker, and Stewart 1987; Sen 1998; Simonson and Tversky 1992; and Wedell 1991.

24
cluster frontier from brand y. In the case of asymmetric technological constraints (see Figure 8b),
brand y may not end up as the closest brand to the frontier. Novice consumers are unlikely to be
aware of technological constraints and, even in the presence of these constraints, the novice
consumers are likely to use the cognitively simpler model presented in Figure 7. Experts,
however, are likely to be aware of technological constraints and are more likely to use the model
in Figure 8 (see Alba and Hutchinson 1987). As a result, symmetric constraints could augment
the attraction effect for “expert consumers.” Conversely, asymmetric constraints could result in
the preferred brand not being centered between the two extreme brands (see Sen 1998).
[Insert Figure 8 here]
c. Extremeness Aversion: the Polarization Effect
The second form of extremeness aversion is the asymmetric case of polarization in which
adding brand x to the existing choice set of brands y and z increases the preference for y,
however, adding brand z to the existing choice set of brands x and y does not increase the
preference for y (see also Simonson 1989; Tversky and Simonson 1993). These differential
effects have puzzled researchers using the context of price and quality.24 First, it is possible that
the consumers differentially view and weight price and quality, resulting in an asymmetric
cluster frontier (as in Figure 8b). Such a construction of the cluster frontier is also possible in the
presence of asymmetric technological constraints for a price-quality relationship (Grewal,
Monroe, and Krishnan 1998; Parker 1995; Rao and Monroe 1989; Urbany et al 1997; Zeithaml
1988). As price increases, so do perceptions of quality, but at a decreasing rate, which results in
an asymmetric cluster frontier (Dodds, Monroe, and Grewal 1991; Kalyanarum and Winer 1995;
Tellis and Gaeth 1990). Therefore, it is possible that the effect may be heightened for novices in
comparison to experts. Thus, perceptions about the relationship between price and quality may
24 Simonson and Tversky (1992, p. 292) note, “We have no definite answer for this question.” Our framework offers two viable explanations.

25
result in differential context effects concerning the price-quality relationship (see also
Lichtenstein and Burton 1989).
Second, in comparison to price, quality is more difficult to assess, resulting in a higher brand
variance. Taken together with the ease in determining price, this results in asymmetric brand
variances (Boulding and Kirmani 1993; Hoch and Deighton 1989; Simonson and Tversky 1992).
Figure 9 shows this phenomenon for a two-brand (x and y) two-attribute (price and quality)
product-market in which an entrant brand (z) affects consumers’ desires for existing brands x and
y. In Figure 9a, the solid dots represent the estimated brand positions, the hollow dot represents
the perceived cluster frontier, and the rectangles indicate brand variance. The consumer is
uncertain about the true prices and qualities of brands x and y, but believes that the true levels of
these attributes lie within the rectangles.25 In Figure 9a, the consumer perceives that brands x and
y are equidistant from the perceived cluster frontier, therefore (by P7) the consumer has, ceteris
paribus, no clear preference for either brand. In Figure 9b, brand z has entered the market.
Because brand z is positioned to the right of brand y on the quality attribute, it is, relative to the
consumer’s experience and knowledge, of unprecedented quality. The consumer will respond to
this supposed unprecedented quality in one of three ways: (1) the consumer will accept the brand
z’s quality claim as true, (2) the consumer will be suspect of brand z’s quality claim (i.e., the
consumer will attach a larger brand variance to z than that attached to brands x and y), or (3) the
consumer will become suspect of the quality claims for all brands (i.e., the consumer will attach
larger brand variances to x, y, and z). The first and second responses are consistent with the
compromise effect. The third response is consistent with the polarization effect.
25 Although often there is zero uncertainty regarding price, for higher priced products (e.g. cars) price is partially uncertain. For example, despite
a clearly delineated sticker price, because of hidden fees and the ability to negotiate, car buyers are never exactly sure of the price of a car until
the sale is finalized.

26
In Figure 9b, the addition of brand z—a brand with a claim of unprecedented quality—causes
the consumer to become suspect of the quality claims of all brands. This results in an increase in
brand variances for all brands along the quality dimension. While the consumer does not know
the true locations of the brands nor of the cluster frontier, the consumer perceives that the best
possible scenario for x and y (i.e., positions in which brands x and y are located as close as
possible to the cluster frontier) are shown in Figure 9b. The uncertainty concerning quality
increases the possibility that the true location of brand x is actually quite close to the true
location of the cluster frontier. Meanwhile, the increase in uncertainty did little to change the
consumer’s perception of the distance between brand y and the cluster frontier.
[Insert Figure 9 here]
11. Strategic Applications and the Link to Monopolistic Competition
Our framework suggests strategies for firms competing in monopolistic competition. For
example, consider seven representative firms in a monopolistically competitive industry in which
consumers perceive brands to be positioned according to two salient attributes: price and quality.
As is shown in Figure 10, the product-market is separated into two clusters: a cluster of three
(representative) brands that exhibit low quality but also low price, and a cluster of four
(representative) brands that exhibit high quality but also high price.
Brand x’s manufacturer has several options for increasing demand for brand x.
1. Reposition the brand (Figure 10a). Brand x can improve the quality in an attempt to move
closer to the cluster frontier.26 According to P7, we can expect this strategy to increase the
probability of choice-given-consideration for brand x while leaving the probability of
26 This is the strategy American automobile manufacturers employed in response to foreign competition in the 1970’s and 1980’s.

27
consideration unchanged. In total, the manufacturer can expect to see an increase in the
probability of choice for brand x.
2. Introduce a dominated brand (Figure 10b). Brand x’s manufacturer can introduce a new
brand (brand y) that is positioned close to brand x but is dominated by brand x on both
attributes.27 According to P4, we can expect this strategy to increase the probability of
consideration for all brands in the cluster while leaving the probability of choice-given-
consideration unchanged.28 In total, the manufacturer can expect to see an increase in the
probability of choice (i.e. demand) for brand x.
3. Articulate a technological constraint (Figure 10c). Through advertising, brand x’s
manufacturer can explain that a technological constraint restricts the price/quality
tradeoff within the cluster.29 According to P7, the technological constraint will increase
the probability of choice-given-consideration for brand x while leaving the probability of
consideration unchanged.
[Insert Figure 10 here]
Each of these strategies, potentially, will increase the probability of choice for brand x and,
therefore, increase the demand for brand x. The increase in demand results in short-run economic
profits until such time as competitors undermine or duplicate the strategy brand x employed.
This framework provides a link between traditional models of monopolistic competition and
the consumer choice literature. In traditional models of monopolistic competition, short-run
profit taking is explained as resulting from a shock (e.g. advertising, product innovation) that
27 This is the strategy that the Miller Brewing Company employed in introducing its Red Dog brand. Market analysts claimed that Red Dog
would simply siphon market share away from Miller’s leading brand, Miller Lite. Instead, following the introduction of Red Dog, Miller Lite’s
market share increased. 28 This assumes that the introduction of Red Dog does not increase the cluster variance. As Miller positioned Red Dog to be similar to Miller Lite,
it is reasonable to assume that any impact on cluster variance was minimal. In fact, for the consumer who perceives Miller Lite to be positioned
toward the center of the cluster, positioning Red Dog close to Miller Lite could have decreased the cluster variance thereby providing an
additional boost to the probability of consideration for the cluster. 29 Ben & Jerry’s employed this strategy when they launched a series of ads suggesting that their ice-cream was high in calories, but pointing out
that that was the tradeoff one made in obtaining quality taste in ice-cream.

28
increases the demand for one brand relative to another. In the long-run, either the shock wears
off (e.g. consumers’ memory of the ad fades) or the shock is duplicated for other firms (e.g.
competitors duplicate the product innovation), resulting in a return to zero profits for all firms.
This framework provides detail as to how the shocks can occur via perceived brand positioning.
Following the Ben and Jerry’s example above, advertising that causes consumers to believe in
the existence of a technological constraint leads to an increase in demand for Ben and Jerry’s and
a decrease in demand for the competing brands within Ben & Jerry’s cluster. For the short-run,
Ben & Jerry’s experiences economic profit while their competitors (within the cluster)
experience economic loss. Interestingly, the model would predict no change in demand for
brands outside Ben & Jerry’s cluster. The alteration in relative demands would persist in the
short-run until either (a) consumers, via consumption experience or garnering more information
about heretofore unknown brands, determine that the technological constraint is unreal, or (b)
competing brands reposition themselves closer to the (new) cluster frontier (either via actual
changes in their attributes or advertising aimed at altering consumers’ beliefs about their
attributes). Thus, in the long-run, we can expect demand for Ben & Jerry’s to fall (relative to
their competitors), and demand for the other cluster competitors to rise (relative to Ben &
Jerry’s).
[Insert Figure 11 here]
12. Conclusion
In this paper, we draw on more than twenty years of theoretical and empirical literature on
consumer behavior and context effects to suggest a theoretical framework for modeling strategic
behavior in monopolistically competitive industries. We define five characteristics of product-

29
markets that can serve as heuristics in the choice process, and show that these heuristics impact
the consumer’s probabilities of consideration and choice-given-consideration for brands in the
product-market. Finally, we postulate that consumers will use experiences garnered from their
consumption decisions to attenuate external and internal uncertainties, thereby causing their
perceived product-markets to evolve iteratively.
The framework opens the door to a broader application of context effects. For example, there
is much economic literature on voter preferences that would benefit from application of context
effects in which political candidates are seen as competing brands with different attributes. A
possible counter-intuitive result from this research (along the lines of the attraction effect) would
be that some candidates could benefit more by donating to a competitor’s campaign than by
increasing their own campaign efforts. For example, when a candidate is well-known,
contributing a fixed amount of dollars to the campaign of a lesser known, though similar (i.e.
within the same cluster) competitor, could increase the probability of consideration for the
candidate by more than would spending those same dollars on the candidate’s own campaign.
The argument here is that the elasticity of the probability of consideration (i.e. the relative
change in the probability of consideration given a change in campaign spending) for the
candidate is greater than the elasticity of the probability of choice-given-consideration. Another
possibly counter-intuitive result from this research (along the lines of tradeoff contrast) is that
some candidates could benefit from being specific about their positions on topics while others
might benefit from being deliberately unclear because one candidate’s lack of clarity might push
the cluster frontier farther away from all candidates such that, while the probability of choice-
given-consideration falls for all, the probability might increase for some relative to others.
30
Another intriguing application is in the realm of stock price analysis where stocks can be
viewed as brands with salient attributes of price, risk, and various financial measures.
Interestingly, the dot-com market bubble can be modeled as an increase in the number of brands
in the technology cluster. Our model predicts that an increase in the number of tech stocks would
increase the probability of consideration for all stocks in the tech cluster.
The framework provides a background for further research into the implications of risk-
preference on consumer choice. Consumers who are risk preferential may exhibit behavior that
violates some of the framework’s propositions. For example, a risk preferential consumer may
exhibit a greater probability of consideration for smaller rather than larger clusters. Also, a risk
averse consumer may exhibit a greater probability of choice-given-consideration for brands with
low variance even if they are positioned further away from the cluster frontier than other brands
with higher variances.
Lastly, the framework and referenced empirical work suggest that some utility models would
benefit from explicitly accounting for uncertainties with regard to product attributes (i.e. brand
variance) and uncertainties with regard to mental clustering of brands (i.e. cluster variance). In
the presence of non-extreme consumer involvement and many competing brands, treating utility
as determinate may lead to incorrect conclusions as uncertainty and the consumer’s response to
uncertainty, vis-à-vis the consideration-choice process, play significant roles. Further, the
framework suggests that utility maximization might be considered as an on-going, stochastic,
adaptive process in which consumers use evidence gleaned from past consumption to mitigate
uncertainty and refine heuristics for use in future consumption decisions.

31
References
Ajzen, Icek and Martin Fishbein (1977), “Attitude-Behavior Relations: A Theoretical Analysis and Review of
Empirical Research,” Psychological Bulletin, 84, 888-918.
Alba, Joseph W. and J. Wesley Hutchinson (1987), “Dimensions of Consumer Expertise,” Journal of Consumer
Research, 13 (March), 411-454.
_____, _____, and John G. Lynch (1991), “Memory and Decision-making,” in Handbook of Consumer Behavior,
eds., T. S. Robertson and H. H. Kassarjain, Englewood Cliffs, NJ: Prentice Hall.
Amemiya, Takeshi (1975), “Qualitative Models,” Annals of Economic and Social Measurement,” 4, 363-372.
Anderson, J. R. (1981), Foundations of Information Integration Theory, New York, NY: Academic Press.
Anderson, Simon P, André de Palma, and Jacques-François Thisse, (1992), Discrete Choice Theory of Product
Differentiation, MIT Press.
Andrews, Rick L. and T. C. Srinivasan (1995), “Studying Consideration Effects in Empirical Choice Models Using
Scanner Panel Data,” Journal of Marketing Research, 32 (February), 30-41.
Batra, R., and M. L. Ray (1986), “Affective Responses Mediating Acceptance of Advertising,” Journal of Consumer
Research, 13, 234-249.
Beatty, Sharon E. and Scott M. Smith (1987), “External Search Effort: An Investigation Across Several Product
Categories,” Journal of Consumer Research, 14 (June), 83-95.
Ben-Akiva, M. (1973), “Stucture of Pasenger Travel Demand Models,” Ph.D. dissertation, Department of Civil
Engineering, MIT.
Bettman, James R. (1979), An Information Processing Theory of Consumer Choice, Reading, MA: Addison-Wesley.
_____, Eric J. Johnson, and John W. Payne (1991), “Consumer Decision-making,” in Handbook of Consumer
Behavior, eds., T. S. Robertson and H. H. Kassarjain, Englewood Cliffs, NJ: Prentice Hall.
_____ and C. Whan Park (1980), “Effects of Prior Knowledge and Experience and Phase of Choice Process on
Consumer Decision Processes,” Journal of Consumer Research, 7 (December), 267-279.
Biehal, Gabriel and Dipankar Chakravarti (1986), “Consumers Use of Memory and External Information in Choice:
Macro and Micro Perspectives,” Journal of Consumer Research, 13 (March), 382-405.
Boulding, William and Amna Kirmani (1993), “A Consumer-Side Experimental Examination of Signaling Theory:
Do Consumers Perceive Warranties as Signals of Quality,” Journal of Consumer Research, 20 (June), 111-123.
Bronnenberg, Bart J. and Wilfried R. Vanhonacker (1996), “Limited Choice Sets, Local Price Response, and
Implied Measures of Price Competitiveness,” Journal of Marketing Research, 33 (May), 163-173.
Bruke, R. R. and T. K. Srull (1988), “Competitive Interferences and Consumer Memory for Advertising,” Journal of
Consumer Research, 15, 55-68.
Brucks, M. (1985), “The Effect of Product Class Knowledge on Information Search Behavior,” Journal of
Consumer Research, 12, 1-6.
Caprara, Gian Vittorio, and Philip G. Zimbardo (1997), “Politicians’ Uniquely Simple Personalities,” -ature, 385
(February), 493.

32
Cacioppo, John T. and Robert E. Petty (1982), “The Need for Cognition,” Journal of Personality and Social
Psychology, 42, 116-131.
Chaiken, Shelly (1980), “Heuristic versus Systematic Information Processing and the Use of Source versus Message
Cues in Persuasion,” Journal of Personality and Social Psychology, 39 (November), 752-766.
Chisholm, Darlene C., and George Norman (2004), “Spatial Competition and Market Share: An Application to
Motion Pictures,” working paper, Tufts University.
Cialdini, R. B., J. E. Vincent, S. K. Lewis, J. Catalan, D. Wheeler, and B. L. Darby (1975), “Reciprocal Concessions
Procedures for Inducing Compliance: The Door-In-The-Face Technique,” Journal of Personality and Social
Psychology, 31, 206-215.
Cohen, Joel B. and Kunal Basu (1987), “Alternative Models of Categorization: Towards a Contingent Processing
Framework,” Journal of Consumer Research, 13 (March), 455-473.
Cooper, Lee G. and Akihiro Inoue (1996), “Building Market Structures from Consumer Preferences,” Journal of
Marketing Research, 33 (October), 293-306.
Day, George S., Allan D. Shocker, and Rajendra K. Srivastava (1979), “Customer-Oriented Approach to Identifying
Product-Markets,” Journal of Marketing, 43 (Fall), 8-19.
Deighton, John (1984), “The Interaction of Advertising and Evidence,” Journal of Consumer Research, 11, 763-
770.
Dhar, Ravi and Rashi Glazer (1996), “Similarity in Context: Cognitive Representation and Violation Preference and
Perceptual Invariance in Consumer Choice,” Organization Behavior and Human Decision Processes, 67 (3),
280-293.
Dick, A., Dipankar Chakravarti, and G. Biehal (1990), “Memory-Based Inferences During Choice,” Journal of
Consumer Research, 17, 82-93.
Dickson, Peter R. and James L. Ginter (1987), “Market Segmentation, Product Differentiation, and Marketing
Strategy,” Journal of Marketing, 51 (April), 1-10.
Dodds, William B., Kent B. Monroe, and Dhruv Grewal (1991), “Effects of Price, Brand, and Store Information on
Buyers’ Product Evaluations,” Journal of Marketing Research, 28 (August), 307-319.
Earl, Peter E., and Jason Potts (2004), “The Market for Preferences,” Cambridge Journal of Economics, 28 (July),
619-633.
Fazio, Russell H., Martha C. Powell, and Carol J. Williams (1989), “The Role of Attitude Accessibility in Attitude
to Behavior Process,” Journal of Consumer Research, 16 (December), 280-288.
Feldman, Jack M. and John G. Lynch (1988), “Self-Generated Validity and Other Effects of Measurement on Belief,
Attitude, Intention, and Behavior,” Journal of Applied Psychology, 73 (August), 421-435.
Fujita, Masahisa, Paul Krugman, and Anthony J. Venables (1999), The Spatial Economy: Cities, Regions, and
International Trade, MIT Press, Cambridge, MA.
Gensch, Dennis (1987), “A Two-Stage Disaggregate Attribute Choice Model,” Marketing Science, 6 (Summer),
223-231.
Green, Paul E. and V. Srinivasan (1990), “Conjoint Analysis in Marketing: New Developments with Implications
for Research and Practice,” Journal of Marketing, 53 (October), 3-19.
33
Grewal, Dhruv, Kent B. Monroe, and R. Krishnan (1998), “The Effect of Price-Comparison Advertising on Buyers’
Perceptions of Acquisition Value, Transaction Value, and Behavioral Intentions,” Journal of Marketing, 62
(April), 46-59.
Ha, Young-Won and Stephen J. Hoch (1989), “Ambiguity, Processing Strategy, and Advertising-Evidence
Interactions,” Journal of Consumer Research, 16 (December), 354-360.
Hannah, D. and Brian Strenthal (1984), “Detecting and Explaining the Sleeper Effect,” Journal of Consumer
Research, 11, 632-642.
Harris, R. J. (1977), “Comprehension of Pragmatic Implications in Advertising,” Journal of Applied Psychology, 62,
603-608.
Harshman, Richard A., Paul E. Green, Yoram Wind, and Margaret E. Lundy (1982), “A Model for the Analysis of
Asymmetric Data in Marketing Research,” Marketing Science, 1 (Spring), 205-242.
Hauser, John R. (1978), Testing the Accuracy, Usefulness, and Significance of Probabilistic Models: An
Information Theoretic Approach,” Operations Research, 26 (May/June), 406-421.
_____ and _____ (1990), “An Evaluation Cost Model of Consideration Set,” Journal of Consumer Research, 16
(March), 393-408.
Hawkins, S. A. and Stephen J. Hoch (1992), “Low Involvement Learning: Memory without Evaluation,” Journal of
Consumer Research, 19, 212-225.
Heath, Timothy B. and Subminal Chatterjee (1995), “Asymmetric Decoy Effects on Lower-Quality versus Higher-
Quality Brands: Meta-analytic and Experimental Evidence,” Journal of Consumer Research, 22 (December),
268-284.
Heide, Jan B. and Allen Weiss (1995), “Vendor Consideration and Switching Behavior for Buyers in High-
Technology Markets,” Journal of Marketing, 59 (July), 30-43.
Herr, Paul M., Frank R. Kardes, and John Kim (1991), “Effects of Word-of-Mouth and Product Attribute
Information on Persuasion: An Accessibility-Diagnosticity Perspective,” Journal of Consumer Research, 17
(March), 454-462.
Hoch, Stephen J. and John Deighton (1989), “Managing What Consumers Learn from Experience,” Journal of
Marketing, 53 (April), 1-20.
_____ and Young-Won Ha (1986), “Consumer Learning: Advertising and the Ambiguity of Product Experience,”
Journal of Consumer Research, 13 (September), 221-233.
Holbrook, Morris B. and William J. Havlena (1988), “Assessing the Real-to-Artificial Generalizability of
Multiattribute Attitude Models in Tests of New Product Design,” Journal of Marketing Research, 25
(February), 25-35.
Holland, J. H., K. J. Holyoak, R. E. Nisbett, and P. T. Thagard (1986), Induction: Processes of Inference, Learning,
and Discovery, Cambridge, MA: MIT Press.
Howard, John A. and Jagdish N. Sheth (1969), The Theory of Buyer Behavior, New York, NY: Wiley.
Hoyer W. D. (1984), “An Examination of Consumer Decision-making for a Common Repeat Purchase Product,”
Journal of Consumer Research, 11, 822-829.
_____ and S. P. Brown (1990), “Effects of Brand Awareness on Choice for a Common , Repeat Purchase Product,”
Journal of Consumer Research, 17, 141-148.

34
Huber, Joel and J. McCann (1982), “The Impact of Inferential Beliefs on Product Evaluations,” Journal of
Marketing Research, 19, 324-333.
_____, John W. Payne, and Christopher Puto (1982), “Adding Asymmetrically Dominated Alternatives: Violations
of Regularity and the Similarity Hypothesis,” Journal of Consumer Research, 9 (June), 90-98.
____ and Christopher Puto (1983), “Market Boundaries and Product Choice: Illustrating Attraction and Substitution
Effects,” Journal of Consumer Research, 10 (June), 31-44.
Janiszewski, C. (1988), “Preconscious Processing Effort: The Independence of Attitude Formation and Conscious
Thought,” Journal of Consumer Research, 15, 199-209.
Johnson, Eric J. and Robert J. Meyer (1984), “Compensatory Choice Models of Noncompensatory Processes: The
Effect of Varying Context,” Journal of Consumer Research, 11, 528-541.
Johnson, R. D. and I. P. Levin (1985), “More than Meets the Eye: The Effect of Missing Information on Purchase
Evaluations,” Journal of Consumer Research, 12, 169-177.
Kahneman, Daniel (1973), Attention and Effort, Englewood Cliffs, NJ: Prentice Hall.
Kalyanarum, Gurumurthy and Russell S. Winer (1995), “Empirical Generalizations from Reference Price
Research,” Marketing Science, 14 (3), G161-G169.
Kardes, Frank R. (1994), “Consumer Judgment and Decision Processes,” in Handbook of Social Cognition, eds., R.
S. Wyer and T. K. Srull, Hillsdale, NJ: Lawrence Erlbaum Associates.
_____ (1993), “Consumer Inference: Determinants Consequences, and Implications for Advertising,” in Advertising
Exposure, Memory, and Choice, ed., A. A. Mitchell, Hillsdale, NJ: Lawrence Erlbaum Associates.
_____, Paul Herr, and Deborah Marlino (1989) “Some New Light on Substitution and Attraction Effects,” Advances
in Consumer Research, 16, 203-208.
_____, Gurumurthy Kalyanaram, Murali Chandrashekaran, and Ronald J. Dornoff (1993), “Brand Retrieval,
Consideration Set Composition, Consumer Choice, and the Pioneering Advantage,” Journal of Consumer
Research, 20 (June), 62-75.
_____ and David Sanbonmatsu (1993), “Direction of Comparison, Expected Feature Correlation, and the Set-Size
Effect in Preference Judgment,” Journal of Consumer Research, 2 (1), 39-54.
Kisileus, Jolita and Brian Strenthal (1984), “Detecting and Explaining Vividness Effect s In Attitudinal Judgments,”
Journal of Marketing Research, 21 (February), 54-64.
_____ and _____ (1986), “Examining the Vividness Controversy: An Availability-Valence Interpretation,” Journal
of Consumer Research, 12, 418-431.
Klinger, E. (1975) , “Consequences of Commitment to and Disengagement from Incentives,” Psychological Review,
82, 1-25.
Krugman, H. E. (1965), “The Impact of Television Advertising: Learning Without Involvement,” Public Opinion
Quarterly, 29, 349-356.
Lehmann, Donald R. and Yigang Pan (1994), “Context Effects, New Brand Entry, and Consideration Sets,” Journal
of Marketing Research, 31 (August), 364-374.

35
Lichtenstein, Donald R. and Scot Burton (1989), “The Relationship Between Perceived and Objective Price-
Quality,” Journal of Marketing Research, 26 (November), 429-443.
Lingle,, John H., Mark W. Altom, and Douglas L. Medin (1984), “Of Cabbages and Kings: Assessing the
Extendibility of Natural Object Concept Models to Social Things,” in Handbook of Social Cognition, Vol. 1,
eds., Robert S. Wyer and Thomas K. Srull, Hillsdale, NJ: Erlbaum, 71-118.
Lussier, D. A. and R. W. Olshavsky (1979), “Task Complexity and Contingent Processing in Brand Choice,”
Journal of Consumer Research, 6, 154-165.
Lynch, John, G. Jr., and Thomas K. Srull (1982), “Memory and Attentional Factors in Consumer Choice: Concepts
and Research Methods,” Journal of Consumer Research, 9 (June), 18-37.
_____, Dipankar Chakravarti, and Anusree Mitra (1991), “Contrast Effects in Consumer Judgments: Changes in
Mental Representation or in the Anchoring of Rating Scales,” Journal of Consumer Research, 18 (December),
284-297.
_____, Howard Marmorstein, and Michael F. Weigold (1988), “Choice from Sets Including Remembered Brands:
Use of Recall Attributes and Prior Overall Evaluations,” Journal of Consumer Research, 15 (September), 169-
184.
Maheswaran, D., D. M. Mackie, and S. Chaiken (1992), “Brand Name as a Heuristic Cue: The Effects of Task
Importance and Expectancy Confirmation on Consumer Judgments,” Journal of Consumer Psychology, 1, 317-
336.
Manski, C.F. (1977), “The Structure of Random Utility Models,” Theory and Decision, 8, 229-254.
Markman, Arthur B. and Douglas L. Medin (1995), “Similarity and Alignment in Choice,” Organization Behavior
and Human Decision Processes, 63(2), 117-130.
Mazursky, David and Yaacov Schul (1988), “The Effect of Advertisement Encoding on the Failure Time to
Discount Information: Implications for the Sleeper Effect,” Journal of Consumer Research, 15, 24-36.
Medin, Douglas L., Robert L. Goldstone, and Arthur B. Markman (1995), “Comparison and Choice: Relations
Between Similarity Processes and Decision Processes,” Psychonomic Bulletin and Review, 2 (1), 1-19.
Meyer, Robert J. (1981), “A Model of Multiattribute Judgments Under Attribute Uncertainty and Information
Constraints,” Journal of Marketing Research, 18, 428-441.
_____ (1987), “The Learning of Multiattribute Judgment Policies,” Journal of Consumer Research, 14, 155-173.
Mishra, Sanjay, U. N. Umesh, and Donald E. Stem (1993), “Antecedents of Attraction Effect: An Information-
Processing Approach,” Journal of Marketing Research, 30 (August), 331-349.
Moore, D. L., D. Hausknecht, and K. Thamodaran (1986), “Time Compression, Response Opportunity, and
Persuasion,” Journal of Consumer Research, 13, 85-99.
Moore, William L. and Don R. Lehmann (1980), “Individual Difference in Search Behavior for a Nondurable,”
Journal of Consumer Research, 7, 296-307.
Moorthy, Sridhar, Brian T. Ratchford, and Debabrata Talukdar (1997), “Consumer Information Search Revisited:
Theory and Empirical Analysis,” Journal of Consumer Research, 23 (March), 263-277.
Narayana, Chem L. and Ron J. Markin (1975), “Consumer Behavior and Product Performance: An Alternative
Conceptualization,” Journal of Marketing, 39 (October), 1-6.

36
Nedungadi, Prakash (1990), “Recall and Consumer Consideration Sets: Influencing Choice without Altering Brand
Evaluation,” Journal of Consumer Research, 17 (December), 263-276.
Netz, Janet S., and Taylor A. Beck (2002), “Maximum or Minimum Differentiation? An Empirical Investigation
into the Location of Firms,” Review of Economics and Statistics, 84, 162-175.
Nosofsky, R. M. (1987), “Attention and Learning Processes in Identification and Categorization of Integral Stimuli,”
Journal of Experimental Psychology: Learning, Memory, and Cognition, 13 (1), 87-108.
Olshavsky, Richard W. and D. H. Granbois (1979), “Consumer Decision-making - Fact or Fiction?” Journal of
Consumer Research, 6, 93-100.
Pan, Yigang and Donald R. Lehmann (1993), “The Influence of New Brand Entry on Subjective Brand Judgments,”
Journal of Consumer Research, 20 (June), 76-86.
Parducci, Allen (1965), “Category Judgment: A Range-Frequency Model,” Psychological Monographs, 77 (2,
Whole No. 565).
Park, C. W. and S. M. Young (1986), “Consumer Response to Television Commercials: The Impact of Involvement
and Background Music on Brand Attitude Formation,” Journal of Marketing Research, 23, 11-24.
Parker, Philip M. (1995), ““Sweet Lemons”: Illusory Quality, Self Deceivers, Advertising, and Price,” Journal of
Marketing Research, 32 (August), 291-307.
Payne, John W. (1982), “Contingent Decision Behavior,” Psychological Bulletin, 92, 382-402.
Petty, Richard E. and John T. Cacioppo (1990), “Involvement and Persuasion: Tradition versus Integration,”
Psychological Bulletin, 107, 367-374.
_____, _____, and David Schumann (1983), “Central and Peripheral Routes to Advertisement Effectiveness: The
Moderating Role of Involvement,” Journal of Consumer Research, 10 (September), 135-146.
Pinksy, Joris, and Margaret E. Slade (1998), “Contracting in Space: An Application of Spatial Statistics to Discrete-
Choice Models,” Journal of Econometrics, 85, 125-154.
Punj, Girish N. and Richard Staelin (1983), “A Model of Consumer Information Search for New Automobiles,”
Journal of Consumer Research, 9 (March), 366-380.
Rao, Akshay R. and Kent B. Monroe (1989), “The Effect of Price, Brand Name, and Store Name on Buyers’
Subjective Product Assessment: An Integrative View,” Journal of Marketing Research, 26 (August), 351-357.
Ratchford, Brain T. and Narasimhan Srinivasan (1993), “An Empirical Investigation of Return to Search,”
Marketing Science, 12 (Winter), 73-87.
Ratneshwar S. and Shelly Chaiken (1991), “Comprehension’s Role in Persuasion: The Case of Its Moderating Effect
on the Persuasion Impact of Source Cues,” Journal of Consumer Research, 28, 281-295.
_____ and Alan D. Shocker (1991), “Substitution in Use and the Role of Usage Context in Product Category
Structures,” Journal of Marketing Research, 28 (August), 281-295.
Ratneshwar, Srinivasan, Allan D. Shocker, and David W. Stewart (1987), “Towards Understanding the Attraction
Effect: The Implications of Product Stimulus Meaningfulness and Familiarity,” Journal of Consumer Research,
13 (March), 520-533.
Roberts, John H. and James M. Lattin (1991), “Development and Testing of a Model of Consideration Set
Composition,” Journal of Marketing Research, 28 (November), 429-440.
37
Ross, W. T. and E. H. Creyer (1992), “Making Inference about Missing Information: The Effect of Existing
Information,” Journal of Consumer Research, 19, 14-25.
Sanbonmatsu, David M. and Frank R. Kardes (1988), “The Effect of Psychological Arousal on Information
Processing and Persuasion,” Journal of Consumer Research, 15, 379-385.
_____, Frank R. Kardes, Steven S. Posavac, and David C. Houghton (1997), “Contextual Influences on Judgment
Based on Limited Information,” Organizational Behavior and Human Decision Processes, 69 (March), 251-
264.
_____, _____, and Paul M. Herr (1992), “The Role of Prior Knowledge and Missing Information in Multiattribute
Evaluation,” Organizational Behavior and Human Decision Processes, 51 (February), 76-91.
_____, _____, and Carole Sansone (1991), “Remembering Less and Inferring More: The Effects of Timing of
Judgment on Inferences about Unknown Attributes,” Journal of Personality and Social Psychology, 61
(October), 546-554.
Schmalensee, Richard (1982), “Product Differentiation Advantages to Pioneering Brands,” American Economic
Review, 72 (June), 159-180.
Schul, Yaacov and David Mazursky (1990), “Conditions Facilitating Successful Discounting in Consumer Decision-
making,” Journal of Consumer Research, 16, 442-451.
Sen, Sankar (1998), “Knowledge, Information Mode, and the Attraction Effect,” Journal of Consumer Research, 25
(June), 64-77.
Shimp, T. A., E. W. Stuart, and R. W. Engle (1991), “A Program of Classical Conditioning Experiments Testing
Variations in the Conditioned Stimulus and Contents,” Journal of Consumer Research, 18, 1-12.
Shocker, Allan D., Moshe Ben-Akiva, Bruno Boccara, and Prakash Nedungadi (1991), “Consideration Set
Influences on Customer Decision-Making and Choice: Issues, Models, and Suggestion,” Marketing Letters, 2
(August), 181-198.
Shugan, Steven M. (1980), “The Cost of Thinking,” Journal of Consumer Research, 7 (September), 99-111.
Silk, Alvin J. and Glenn L. Urban (1978), “Pre-Test-Evaluation of New Packaged Goods: A Model and
Measurement Methodology,” Journal of Marketing Research, 15 (May), 171-191.
Simmons, C. J. and John G. Lynch (1991), “Inference Effects without Inference Making? Effects of Missing
Information on Discounting and Use of Presented Information,” Journal of Consumer Research, 17, 477-491.
Simonson, Itamar (1989), “Choice Based on Reason: The Case of Attraction and Compromise Effects,” Journal of
Consumer Research, 16 (September), 158-174.
_____ and Amos Tversky (1992), ““Choice in Context: Tradeoff Contrast and Extremeness Aversion,” Journal of
Marketing Research, 29 (August), 281-295.
_____, Joel Huber and John W. Payne (1988), “The Relationship Between Prior Knowledge and Information
Acquisition Order,” Journal of Consumer Research, 14, 566-578.
Sivakumar, K. (1995), “Role of Price and Quality Tiers on the Cluster Effect in Bran Choice,” Marketing Letters, 6
(4), 265-273.
Slovic, Paul (1995), “The Construction of Preference,” American Psychologist, 50 (May), 364-371.

38
Smith, Wendell (1956), “Product Differentiation and Market Segmentation as Alternative Marketing Strategies,”
Journal of Marketing, 21 (July), 3-8.
Srinivasan, Narasimhan and Brian T. Ratchford (1991), “An Empirical Test of a Model of External Search for
Automobiles,” Journal of Consumer Research, 18 (September), 233-242.
Srivastava, Rajendra K., Mark I. Alpert, and Allan D. Shocker (1984), “A Customer-Oriented Approach to
Determining Market Structures,” Journal of Marketing, 48 (Spring), 32-45.
Sujan, Mita (1985), Consumer Knowledge: Effects on Evaluation Strategies Mediating Consumer Judgments,”
Journal of Consumer Research, 12, 31-46.
_____ and James R. Bettman (1989), “The Effects of Brand Positioning Strategies Mediating Consumer
Judgments,” Journal of Marketing Research, 26 (November), 454-467.
Tellis, Gerard J. and Gary J. Gaeth (1990), “Nest Value, Price-Seeking, and Price Aversion: The Impact of
Information and Learning on Consumer Choice,” Journal of Marketing, 54 (April), 34-45.
Tversky, Amos (1977), “Features of Similarity,” Psychological Review, 84 (4), 327-352.
_____ and I. Gati (1982), “Similarity, Seperability, and Triangle Inequality,” Psychological Review, 89, 123-154.
_____ and Itamar Simonson (1993), “Context-Dependent Preferences,” Management Science, 39 (October), 1179-
1189.
Tybout, Alice M., Bobby J. Calder, and Brian Strenthal (1981), “Using Information Processing Theories to Design
Marketing Strategies,” Journal of Marketing Research, 18 (February), 73-79.
Urban, Glen L. (1975), “PERCEPTOR: A Model for Brand Positioning,” Management Science, 21 (April), 858-871.
Urbany, Joel E. (1986), “An Experimental Examination of Economics of Information,” Journal of Consumer
Research, 13, 257-271.
_____, Peter R. Dickson, W. L. Wilkie (1989), “Buyer Uncertainty and Information Search,” Journal of Consumer
Research, 16, 208-215.
_____, William O. Bearden, Ajit Kaicker, and Melinda Smith-de Borrero (1997), “Transaction Utility Effects When
Quality is Uncertain,” Journal of the Academy of Marketing Science, 25 (1), 45-55.
Varian, Hal (1992), Microeconomic Analysis, W.W. Norton & Company, London.
Wedell, Douglas H. (1991), “Distinguishing Among Models of Contextually Induced Preference Reversals,”
Journal of Experimental Psychology, 17 (4), 767-778.
Wernerfelt, Birger (1995), “A Rational Reconstruction of Compromise Effect,” Journal of Consumer Research, 21
(March), 627-633.
Yalch, R. F. and R. Elmore-Yalch (1984), “The Effect of Numbers on Route to Persuasion,” Journal of Consumer
Research, 11, 522-527.
Zeithaml, Valarie A. (1988), “Consumer Perceptions of Price, Quality, and Value: A Means End Model and
Synthesis of Evidence,” Journal of Marketing, 52 (July), 2-22.

39
FIGURE 1
Larger Cluster Size Implies Less External Uncertainty
Larger cluster size implies less internal uncertainty
Fewer brands
unobserved
Less external
uncertainty
Less error in
estimated brand
universe
Confirmation of
observed attribute
levels
Attribute levels
more stable over
time
More brands
in a cluster
More
brands in
a cluster
More
consumers in
the cluster
Consumers
obtain utility in
the cluster
Less
internal
uncertainty
Less error in
estimated
utility function
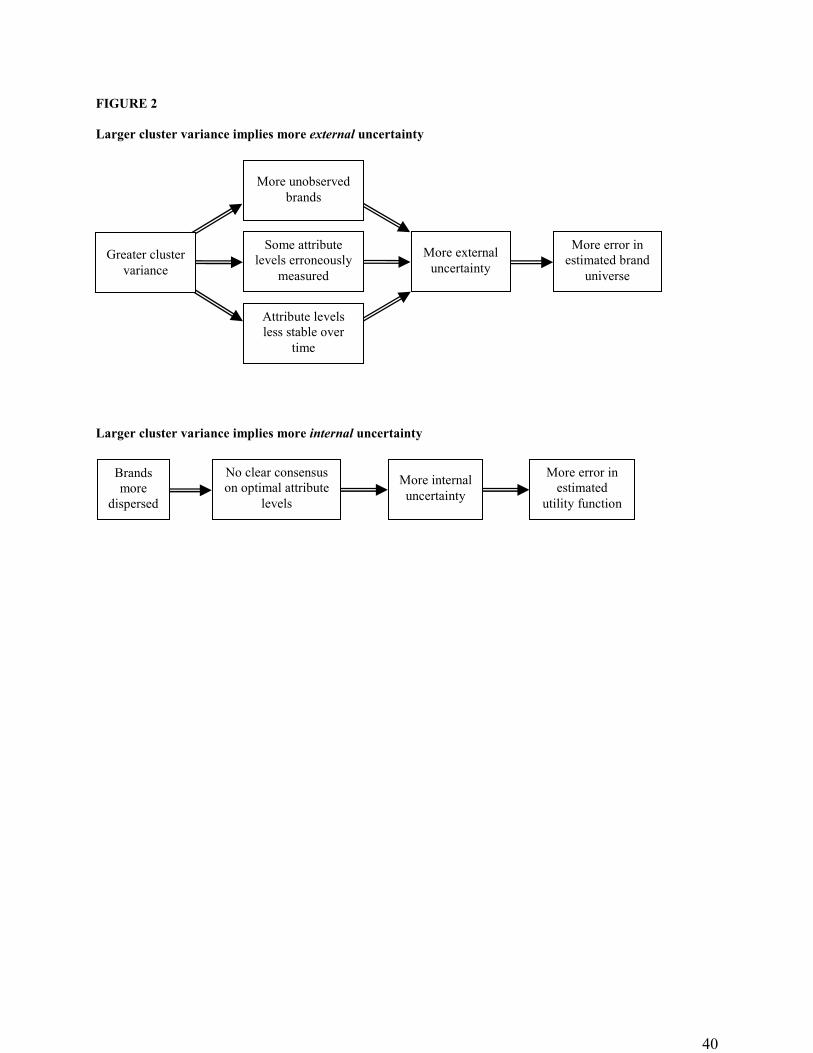
40
FIGURE 2
Larger cluster variance implies more external uncertainty
Larger cluster variance implies more internal uncertainty
More unobserved
brands
More external
uncertainty
More error in
estimated brand
universe
Some attribute
levels erroneously
measured
Attribute levels
less stable over
time
Greater cluster
variance
Brands
more
dispersed
No clear consensus
on optimal attribute
levels
More internal
uncertainty
More error in
estimated
utility function

41
FIGURE 3
Brand Extrapolation and Cluster Frontier
Brand C
Cluster frontier in the absence of
technological constraints combines the best
attribute levels of brands in the cluster.
Attribute 1
Attribute 2
Brand A
Brand B
Cluster frontier given perceived
technological constraints.
Cluster origin.

42
FIGURE 4
Attribute 2
Brand C Brand C
Frontier
Attribute 1
Brand A
Brand B
Attribute 2
Attribute 1
Brand A
Frontier Brand B
a. Low Brand Variance b. High Brand Variance

FIG
UR
E 5
Th
e It
era
tiv
e C
ho
ice
Pro
cess
, U
nce
rta
inty
, a
nd
Per
ceiv
ed P
rod
uct
-Ma
rket
Ch
ara
cter
isti
cs
Extern
al U
nce
rtainty
• Par
tial Info
rmatio
n
• M
easu
remen
t Error
• Obso
lete Info
rmation
Tru
e B
ran
d
Un
iver
se
Est
ima
ted
Bra
nd
Un
iver
ses
Est
ima
ted
Uti
liti
es
Per
ceiv
ed P
rod
uct
-Ma
rket
Ch
ara
cter
isti
cs
• C
lust
er S
izes
• C
lust
er V
ari
an
ces
• C
lust
er F
ron
tier
s
• B
ran
d V
ari
an
ces
• G
ran
ula
rity
Intern
al U
nce
rtainty
• Abso
lute E
rror Utility
• Relativ
e Error Utility
Co
nsi
der
ati
on
Bra
nd
in
form
ati
on
mit
iga
tes
exte
rna
l u
nce
rta
inty
Co
nsu
mp
tio
n e
xp
erie
nce
mit
iga
tes
inte
rna
l u
nce
rta
inty
Ch
oic
e-G
iven
-
Co
nsi
der
ati
on
Tru
e U
tili
ties

44
FIGURE 6
a. The Attraction Effect (Zero Brand Variance)
b. Proportionality
Target
Attribute 2
Attribute 1
Competitor
Decoy
Cluster Frontier (after
introduction of decoy)
Cluster Frontier (before
introduction of decoy)
Consumer perceives two brands
in the target’s cluster.
Attribute 1
Attribute 2
Target
Competitor
Decoy
According to P4, the decoy increases the number of brands
in the target’s cluster and so increases the probability of
consideration for the target brand.
According to P7, because the decoy has not increased the
distance between the target brand and the target brand’s
cluster frontier, the probability of choice-given-
consideration has not changed for the target brand.
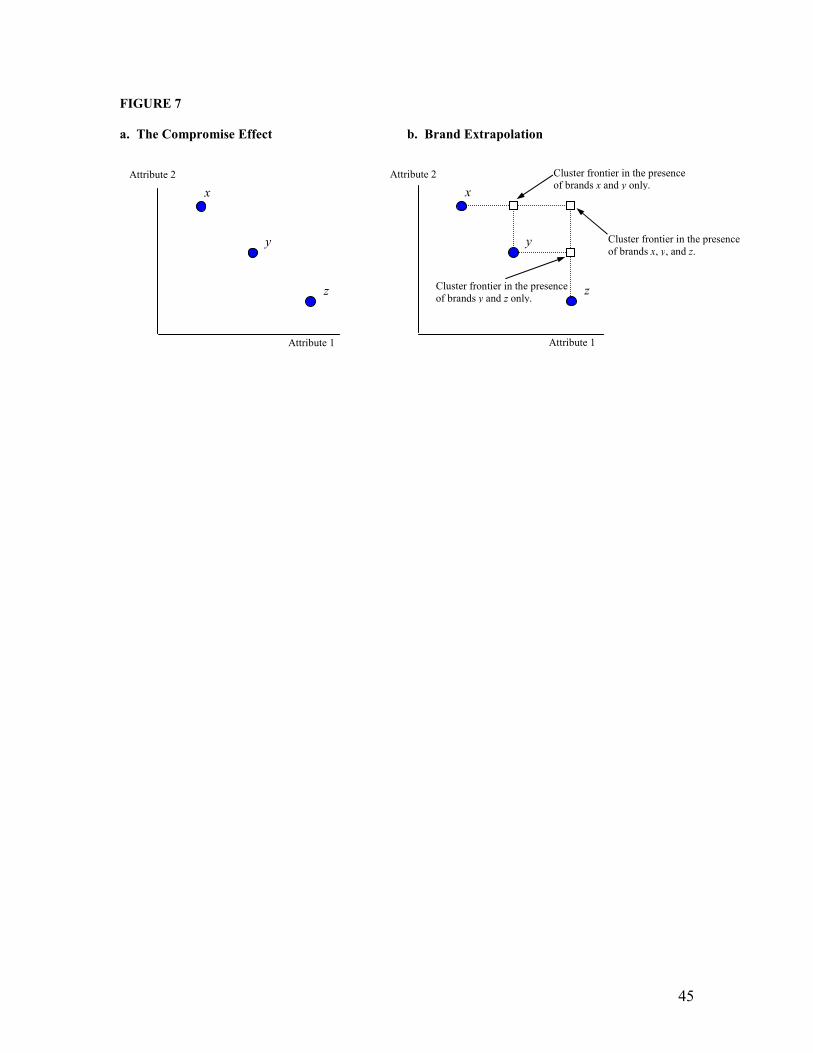
45
FIGURE 7
a. The Compromise Effect b. Brand Extrapolation
y
x
y
z
x
z Cluster frontier in the presence
of brands y and z only.
Cluster frontier in the presence
of brands x and y only.
Attribute 1
Attribute 2
Attribute 1
Attribute 2
Cluster frontier in the presence
of brands x, y, and z.

46
FIGURE 8
a. Symmetrical Technological Constraints b. Asymmetrical Technological Constraints
x x
y y
z z Technological constraints
symmetrically limit
tradeoffs in attribute levels.
Cluster frontier in the presence
of brands x, y, and z.
Attribute 1
Attribute 2
Attribute 1
Attribute 2 Cluster frontier in the presence
of brands x, y, and z.
Technological constraints
asymmetrically limit tradeoffs in
attribute levels.

47
FIGURE 9
a. Two brand market b. The Polarization Effect
y
Price (inverse scale) Cluster frontier
x
z
y
Price (inverse scale)
Quality Quality
Cluster frontier
x

48
FIGURE 10
a. Increasing Brand Demand by Repositioning Closer to the Cluster Frontier
b. Increasing Brand Demand by Introducing a Dominated Brand
c. Increasing Brand Demand by Articulating a Technological Constraint
Quality
Price (inverse scale)
x
y x
Quality
Price (inverse scale)
Quality
Price (inverse scale)
x

49
FIGURE 11
Impact of Brand Positioning on Demand
MR
MR’
D
D’
MC Haagen Dazs
Breyers
2. The constraint moves the
perceived cluster frontier.
Ben & Jerry’s
1. Advertising creates the
impression of a
technological constraint.
Taste
Calories
Quantity
Price
3. Via P7, the probability of choice
for Ben & Jerry’s increases
resulting in an increase in demand
for Ben & Jerry’s.