Embed Size (px)
Citation preview

“SCHOOL ATTENDANCE INITIATIVE”
SCHOOL PARTICIPATION CAMPAIGN IMPLEMENTED BY UNICEF ROMANIA
SUMMATIVE EVALUATION - FINAL REPORT
Evaluation team (in alphabetical order): Veronica Gabriela Chirea
Mariana Dogaru Olivia Maria Jidveian
Roxana Mihail, Team Leader Marian Popa
EVALUATION PERIOD: MAY-DECEMBER 2015 REPORT DATE: JUNE 2017
BUCHAREST, ROMANIA, JUNE 2017

Page 2 of 198
CONTENTS LIST OF FIGURES .................................................................................................................................5
LIST OF TABLES ..................................................................................................................................7
LIST OF ANNEXES ...............................................................................................................................9
LIST OF ACRONYMS .......................................................................................................................... 10
1. EXECUTIVE SUMMARY .................................................................................................................. 11
1.1 OVERVIEW OF THE “SCHOOL ATTENDANCE INITIATIVE” ................................................................. 11
1.2 EVALUATION OBJECTIVES AND INTENDED AUDIENCE ..................................................................... 11
1.3 EVALUATION METHODOLOGY .......................................................................................................... 12
1.4 MOST IMPORTANT FINDINGS AND CONCLUSIONS .......................................................................... 12
1.5 MAIN RECOMMENDATIONS ............................................................................................................. 14
2. OBJECT OF EVALUATION ............................................................................................................... 16
2.1 SAI LOGICAL MODEL AND EXPECTED RESULTS CHAIN (INPUTS, OUTPUTS, OUTCOMES) ............... 16
2.2 CONTEXT OF KEY SOCIAL, POLITICAL, ECONOMIC, DEMOGRAPHIC AND INSTITUTIONAL FACTORS:
GOVERNMENT STRATEGIES AND PRIORITIES ......................................................................................... 21
2.3 SAI COMPONENTS ............................................................................................................................ 26
2.3.1 Geographical context ................................................................................................................. 27
2.3.2 Human, financial and logistics resources involved ................................................................... 30
2.4 KEY STAKEHOLDERS INVOLVLED IN THE SCHOOL ATTENDANCE INITIATIVE .................................... 31
2.5 IMPLEMENTATION STATUS OF THE EVALUATION OBJECT .............................................................. 33
3. EVALUATION PURPOSE, OBJECTIVES AND SCOPE .......................................................................... 52
3.1 DEFINING THE PURPOSE OF SUMMATIVE EVALUATION IN RELATION TO FORMATIVE EVALUATIONS
................................................................................................................................................................ 52
3.2 EVALUATION OBJECTIVES AND QUESTIONS, SCOPE AND LIMITATIONS .......................................... 53
3.2.1 Evaluation objectives ................................................................................................................. 53
3.2.2 Evaluation questions. Scope of the evaluation .......................................................................... 54
3.3 EVALUATION CRITERIA. ADOPTED PERFORMANCE STANDARDS ..................................................... 57
3.4 GENDER AND HUMAN RIGHTS ISSUES ............................................................................................. 58
4. METHODOLOGY ........................................................................................................................... 58
4.1 DATA COLLECTION METHODS, ANALYSIS METHODS, RATIONALE FOR SELECTION AND LIMITATIONS
................................................................................................................................................................ 58

Page 3 of 198
4.2. DATA SOURCE TRIANGULATION, DIVERSITY OF PERSPECTIVES, DATA ACCURACY AND
OVERCOMING DATA SOURCE LIMITATIONS ........................................................................................... 69
4.3 SAMPLING FRAME – COVERED AREA AND POPULATION, RATIONALE FOR SELECTION, SELECTION
MECHANISMS, SAMPLING LIMITATIONS ................................................................................................ 70
4.3.1 Setting up the control group of schools .................................................................................. 70
4.3.2 Analysis based on the data collected by ARACIP in the National Educational Risk Map (NERM)
............................................................................................................................................................ 71
4.3.3 Analysis based on 2013-2014 data reported by educational establishments ........................... 77
4.3.4 Sampling limitations. Conclusions ............................................................................................. 77
4.3.5 Pupil sampling ............................................................................................................................ 79
4.4 CONSULTATIONS WITH PARTNERS AND BENEFICIARIES - STRATEGY, TOOLS, ACTIVITIES ............... 80
4.5 EVALUATION METHODS EMPLOYED AND THEIR APPROPRIATENESS FOR PURPOSE AND
EVALUATION QUESTIONS ....................................................................................................................... 82
4.6 EVALUATION METHODS EMPLOYED AND ANALYSIS OF GENDER AND HUMAN RIGHTS, INCLUDING
CHILDREN’S RIGHTS ................................................................................................................................ 87
4.7 DATA QUALITY ASSURANCE .............................................................................................................. 88
4.8 ETHICAL SAFEGUARDS REGARDING PROTECTION OF CONFIDENTIALITY, DIGNITY, THE RIGHTS AND
WELFARE OF CHILDREN AND RESPECT FOR THE VALUES OF BENEFICIARY COMMUNITIES .................. 89
5. FINDINGS ..................................................................................................................................... 91
5.1 EVALUATION FINDINGS IN RELATION TO THE SYSTEMIC ANALYSIS AND DATA INTERPRETATION . 91
5.2 FINDINGS RELATED TO EVALUATION CRITERIA: RELEVANCE, EFFECTIVENESS, EFFICIENCY,
SUSTAINABILITY AND COHERENCE ....................................................................................................... 129
5.2.1 Relevance ................................................................................................................................. 129
5.2.2 Effectiveness ............................................................................................................................ 147
5.2.3 Efficiency .................................................................................................................................. 164
5.2.4 Sustainability ............................................................................................................................ 170
5.2.5 Coherence ................................................................................................................................ 172
5.3 DATA GAPS, LIMITATIONS AND UNANTICIPATED FINDINGS .......................................................... 175
6. CONCLUSIONS AND LESSONS LEARNED ....................................................................................... 176
6.1 CONCLUSIONS RELATED TO KEY EVALUATION QUESTIONS ........................................................... 176
6.2 STRENGTHS AND WEAKNESSES (AT POLICY, MODEL, COMPONENT, PROJECT, PARTNER AND
BENEFICIARY LEVELS) ............................................................................................................................ 184
6.3 OPPORTUNITIES FOR UPSCALING/REPLICATION/USE OF LESSONS LEARNED AFTER THE END OF THE
MODEL AND RELEVANCE FOR NATIONAL AND REGIONAL PUBLIC POLICIES . .................................... 188

Page 4 of 198
7. RECOMMENDATIONS ................................................................................................................. 190
7.1 THE PROCESS FOLLOWED IN DEVELOPING RECOMMENDATIONS IN CONSULTATION WITH
BENEFICIARIES ....................................................................................................................................... 190
7.2 RECOMMENDATIONS FIRMLY BASED ON EVIDENCE AND CONCLUSIONS ..................................... 190
7.3 IDENTIFICATION OF TARGET GROUPS FOR RECOMMENDATIONS ................................................. 190
7.4 POSSIBLE LIMITATIONS IN IMPLEMENTING RECOMMENDATIONS ................................................ 196
8. GENDER AND HUMAN RIGHTS IMPLICATIONS, INCLUDING CHILDREN’S RIGHTS. TRANSPARENT
INFORMATION FOR TACKLING GENDER EQUALITY AND HUMAN RIGHTS ASPECTS, INCLUDING
CHILDREN’S RIGHTS ....................................................................................................................... 196

Page 5 of 198
LIST OF FIGURES
2. EVALUATION OBJECTIVE
Figure 2 1 Logical framework diagram of UNICEF’s School Attendance Initiative 18
Figure 2 2 Dropout rates, 2010-2011 23
Figure 2 3 Early school leaving rates by area of residence and region (2012) 23
Figure 2 4 Key indicators for 2014, "Education and Training Monitor 2014” 24
4 EVALUATION METHODOLOGY
Figure 4 1 Map with the location of SAI schools and schools in the control sample 78
Figure 4 2 Map of people in Romania at risk of poverty (2013) 78
Figure 4 3 Map of poverty risk rates and people (thousands) below poverty line, by county 82
5 FINDINGS
Figure 5 1 Existence of institutional development plan 94
Figure 5 2 Existence of school management plan 94
Figure 5 3 Existence of quality assurance plan 94
Figure 5 4 Existence of national minority integration/support plan 95
Figure 5 5 Existence of community network for dropout prevention and control 95
Figure 5 6 Existence of school mediator 96
Figure 5 7 Existence of school counsellor/psychologist 96
Figure 5 8 Existence of resource teacher 96
Figure 5 9 General model of school data analysis 99
Figure 5 10 Absence rate evolution, by educational level and total, in SAI schools 100
Figure 5 11 Unexcused absence rate evolution, by educational level and total, in SAI schools 101
Figure 5 12 Variation in total absence rate difference (difference between year 3 and year 1) 102
Figure 5 13 Evolution of school dropout rates in SAI schools between the first and last SAI years 104
Figure 5 14 Variation of the differential total dropout rate between year 3 and year 1 of the campaign 105
Figure 5 15 Repetition rate evolution between the first and last SAI years in SAI schools 107
Figure 5 16 School record evolution for pupils in the target group 108
Figure 5 17 School record evolution for pupils in the target group, by gender 109
Figure 5 18 General evolution of absences for pupils in the target group 109
Figure 5 19 Absences for pupils in the target group, by grade 110
Figure 5 20 Factorial ANOVA for the number of absences in SAI year 1 110
Figure 5 21 Factorial ANOVA for the number of absences in SAI year 2 111
Figure 5 22 Factorial ANOVA for the number of absences in SAI year 3 111
Figure 5 23 GPA evolution for pupils in the target group, by SAI year 112
Figure 5 24 GPA for pupils in the target group, by grade 112
Figure 5 25 Factorial ANCOVA for GPA variation in relation to gender and grade, in year 1 (covariant: no. of absences) 113
Figure 5 26 Factorial ANCOVA for GPA variation in relation to gender and grade, in year 2 (covariant: no. of absences) 113
Figure 5 27 Factorial ANCOVA for GPA variation in relation to gender and grade, in year 3 (covariant: no. of absences) 113
Figure 5 28 General model of data analysis at individual level 115
Figure 5 29 Assessment on parent education courses by parents and SAI schools 117
Figure 5 30 Assessment on SAI effects by parents of pupils in SAI schools 117
Figure 5 31 Level of satisfaction with the cooperation with implementing partners and other structures 118
Figure 5 32 Explanatory model of school attachment for pupils in SAI schools 123
Figure 5 33 Country recommendations from the National Strategy on Social Inclusion and Poverty Reduction 2015-2020. 130
Figure 5 34 Pupils’ options regarding the highest level of education they wish to attain 134

Page 6 of 198
Figure 5 35 Frequency of pupils’ assessments on the impact of the School Attendance Initiative on school and family practices135
Figure 5 36 Frequency of pupils’ assessments on current school practices 136
Figure 5 37 Frequency of parents’ assessments on their attitude towards learning and school and regarding their children’s
performance 136
Figure 5 38 Frequency of pupils’ answers regarding factors that influence their school participation and/or performance 148
Figure 5 39 Frequency of teachers’ assessments regarding reasons for involvement 152
Figure 5 40 Frequency of teachers’ assessments regarding involvement in projects and in the School Attendance Initiative 155
Figure 5 41 Frequency of teachers’ assessments regarding the quality of the training courses in which they participated during
SAI 158
Figure 5 42 SAI school principals’ assessment of practices implemented in schools - part one 168
Figure 5 43 SAI school principals’ assessment of practices implemented in schools - part two 169
Figure 5 44 Frequency of assessments by teachers from SAI schools regarding school climate and practices 169

Page 7 of 198
LIST OF TABLES
2. OBJECT OF EVALUATION
Table 2 1 Summary matrix of the evaluation process 19
4. EVALUATION METHODOLOGY
Table 4 1 Evaluation levels according to the Kirkpatrick model 60
Table 4 2 Summary of instruments used for quantitative evaluation methods 64
Table 4 3 Summary of instruments used for qualitative evaluation methods 64
Table 4 4 School enrolment level in SAI and sampled educational establishments 71
Table 4 5 Methods used in the evaluation process and their classification according to paradigm and evaluation level 82
5. FINDINGS
Table 5 1 Principals’ assessment of external institutional support received by SAI schools compared to control
schools 92
Table 5 2 Teachers’ assessment of external institutional support received by SAI schools compared to control
schoolsl 93
Table 5 3 Dropout control procedures in SAI and control schools (principals) 96
Table 5 4 Dropout control procedures in SAI and control schools (teachers) 97
Table 5 5 Support procedures for pupils with difficulty adapting in SAI and control schools (principals) 97
Table 5 6 Support procedures for pupils with difficulty adapting in SAI and control schools (teachers) 97
Table 5 7 Absence control and pupil support procedures in SAI and control schools, as evaluated by teachers 97
Table 5 8 Comparison of internal and external appearance indicators in SAI and control schools 98
Table 5 9 Mean absence rate* by SAI year, educational level and total. 100
Table 5 10 Mean unexcused absence rate* 101
Table 5 11 Unexcused absence rate 101
Table 5 12 T-test of the difference between the average share of Roma and Romanian pupils and absence rate
evolution between SAI year 3 and SAI year 1 103
Table 5 13 Relationship between the school's ethnic environment and absence rate decrease/increase 103
Table 5 14 Comparison of absence rates between SAI and control schools 103
Table 5 15 Dropout rates* by SAI year and educational level 104
Table 5 16 School dropout rates in primary and lower secondary education 105
Table 5 17 Comparison of dropout rates between SAI and control schools 106
Table 5 18 Repetition rates* by SAI year and educational level 106
Table 5 19 Share of pupils promoted from one level to the next 107
Table 5 20 Popularity of the School Attendance Initiative with students from SAI and control schools 115
Table 5 21 Assessment on training courses during SAI, by teachers from SAI and control schools 116
Table 5 22 Use of ICT in the educational process, comparison between SAI and control schools 118
Table 5.23 SAI teachers’ self-assessment of skills acquired during the Initiative (share of answer choices selected).
119
Table 5 24 Comparison of teaching skill assessments 120
Table 5 25 Pupils’ assessment of school climate 121
Table 5 26 Pupils’ assessment of relationships with classmates 121
Table 5 27 Pupils’ assessment of relationships with teachers 122

Page 8 of 198
Table 5 28 In the last year, the school has organised activities with many guests (chi-square=105.32, p<0.001,
Cramer’s phi=0.39) 124
Table 5 29 In the last year, I have participated in sporting activities (chi-square=50.30, p<0.001, Cramer’s phi=0.27)
124
Table 5 30 In the last year, I have participated in trips organised by the school (chi-square=34.27, p<0.001, Cramer’s
phi=0.22) 124
Table 5 31 In the last year, we have been visited by personalities at school (chi-square=76.63, p<0.001, Cramer’s
phi=0.34) 124
Table 5 32 Statements regarding conditions created in the schools involved in the School Attendance Initiative to
contribute to the prevention and reduction of school absenteeism and dropout - SAI schools 137
Table 5 33 Statements regarding conditions created in the schools involved in the School Attendance Initiative to
contribute to the prevention and reduction of school absenteeism and dropout - SAI and control schools 137
Table 5 34 Number of communities involved in SAI, by county 145
Table 5 35 The relationship between the distribution of selected communities by Euroregion and the rate of poverty
per Euroregion 146
Table 5 36 Pupils’ assessments contributing to the identification of risk factors regarding school participation 148
Table 5 37 School principals’ statements regarding the motivation to become involved in SAI 150
Table 5 38 Teachers’ statements regarding the motivation to become involved in SAI 151
Table 5 39 Principals’ assessments regarding the SAI involvement of different actors and/or agents of change 153
Table 5 40 Teachers’ assessments regarding the SAI involvement of different actors and/or agents of change 154
Table 5 41 Principals’ assessments regarding the collaboration with implementing partners 155
Table 5 42 Principals’ assessments regarding the efficiency of different intervention components 156
Table 5 43 School principals’ assessments regarding their own learning outcomes achieved during SAI 156
Table 5 44 Teachers’ assessments regarding the quality of the training courses in which they participated during SAI
157
Table 5 45 Differences regarding learning outcomes achieved by teachers in SAI schools by participating in SAI
courses and those achieved by teachers in the control group by participating in courses outside SAI 159
Table 5 46 Difference between the assessments of pupils in SAI schools and those of pupils from control schools
regarding new school practices 160
Table 5 47 SAI school principals’ assessment of practices implemented in schools - part one 166
Table 5 48 SAI school principals’ assessment of practices implemented in schools - part two 168

Page 9 of 198
LIST OF ANNEXES Annex 1 -Terms of Reference
Annex 2- List of interviewed people
List of school principals involved in the School Attendance Initiative
List of school principals from the control group
List of interviewed teachers
List of pupils from the interview sample
List of interviewed parents
List of resource people and interviewed MoE representatives
List of people representing the interviewed implementing partners
Annex 3 - List of documents consulted and bibliography
Annex 4 - Evaluation methodology
Annex 5 – Evaluators’ resumes
Annex 6- 6.1 Reports of SAI and control school visits
6.2 Reports of visits to implementing partners
Annex 7 - Case studies
Annex 8 - Theory of Change

Page 10 of 198
LIST OF ACRONYMS
HBS Household Budget Survey
RCAR Roma Civic Alliance of Romania
ARACIP Romanian Agency for Quality Assurance in Pre-University Education
TTH Teacher Training House
CEDU Education 2000+ Centre
CREAC County Resource and Educational Assistance Centre
CRIPS Resource and Information Centre for Social Professions
GDSACP General Directorate for Social Assistance and Child Protection
EU European Union
EC European Commission
NERM National Educational Risk Map
NIS National Institute of Statistics
IES Institute of Education Sciences
CSI County School Inspectorate
MoE Ministry of National Education
OECD Organisation for Economic Co-operation and Development
PAS Community Mobilisation Networks
IDP Institutional Development Plan
PISA Programme for International Student Assessment
SOP HRD Sectoral Operational Programme for Human Resource Development
AIER Annual Internal Evaluation Report
SAI School Attendance Initiative
SAC School of Arts and Crafts
SEN Special Educational Needs
SPAS Public Social Assistance Services
ToC Theory of Change
TOR Terms of Reference for Independent External Evaluators
UN United Nations
UNEG United Nations Evaluation Group
UNESCO United Nations Educational, Scientific and Cultural Organisation UNICEF United Nations Children's Fund
EPA Educational Priority Area

Page 11 of 198
1. EXECUTIVE SUMMARY
1.1 OVERVIEW OF THE SCHOOL ATTENDANCE INITIATIVE
The School Attendance Initiative was carried out by UNICEF, in partnership with the Ministry of Education
and Scientific Research, with the overall goal of testing a complex intervention programme for reducing
absenteeism, school dropout and early school leaving, in disadvantaged communities, selected from all
over the country. The Initiative was implemented in successive stages, between 2010 and 2015, and
included a variable number of schools. In the final stage, the Initiative targeted 32 schools in 19 counties.
In accordance with the project’s Terms of Reference, these schools were assessed under the evaluation
programme which is the object of this report.
The intervention had the following components:
(1) Improving school management; (2) Improving teachers’ educational and methodological skills; (3) Strengthening the parent-school relationship; (4) Parent education; (5) Offering positive and successful role models, especially for Roma children; (6) Developing a network of community actors to prevent school dropout; (7) Training school mediators and Romani language teachers.
The implementing partners of the intervention were:
(1) The Institute of Education Sciences (IES) (2) The Ministry of National Education and Scientific Research (MNESR), via the Directorate-
General for Education in Minority Languages, Parliament Relations and Social Partners (DGEMLPRSP);
(3) The Resource and Information Centre for Social Professions (CRIPS); (4) HOLT Romania; (5) “Împreună” Community Development Agency.
PURPOSE OF THE EVALUATION
The general purpose of the evaluation was to assess the specific intervention programmes of the implementing partners and the impact of the Initiative on absenteeism and school dropout, from the perspective of target schools and groups (pupils, teaching staff, parents).
1.2 EVALUATION OBJECTIVES AND INTENDED AUDIENCE
The evaluation aimed at the following general objectives:
(1) Identify the impact of the School Attendance Initiative, carried out between 2011 and 2015, regarding school dropout and absenteeism, on the 32 schools included in the evaluation.
(2) Identify the efficiency and effectiveness of the Initiative from the perspective of all intervention components.
(3) Identify transferable examples of good practice and provide lessons learned for the implementation of the new integrated model of social services in Bacău County.

Page 12 of 198
(4) Identify certain limitations and constraints for the implementation of SAI components in schools, families, communities.
(5) Generate relevant information for decision-makers, supporting local, regional and national policy development to prevent and diminish school dropout and absenteeism.
The evaluation focused on finding answers to the following questions:
(1) How effective has SAI been in reducing the risk of dropping out and dropout rates in the schools involved?
(2) Have SAI interventions produced management changes in the schools involved, regarding the implementation of strategies for school dropout prevention/control and the development of school-community partnerships?
(3) Has SAI produced changes in the instructional strategies used by teachers in their day-to-day activities?
(4) Has SAI produced changes in the teacher-pupil relationship and the teacher-parent relationship?
(5) Has SAI produced changes in parents’ attitude towards education? (6) Has SAI produced changes regarding parents’ involvement in school life? (7) Has SAI produced changes in the community so as to contribute to the reduction of
school absenteeism and dropout? (8) Are SAI interventions sustainable in the schools involved?
1.3 EVALUATION METHODOLOGY
Evaluation paradigms included both a quantitative approach (school information, standardised questionnaire results) and a qualitative approach (field observations, interviews, focus groups, case studies).
The evaluation model was based on longitudinal analyses, conducted during implementation years, and comparative ones: between categories of subjects (pupils-parents-principals-teachers), between SAI schools and those in the control group, which was set up after SAI completion. Whenever possible, results were verified using the triangulation method.
Information sources were highly diverse, including: people (pupils, teaching staff, parents, school mediators, community members, representatives of intervention partners; schools (summarised and individual school data, management documents, administrative information, etc.); a variety of documents (partner reports, public statistical sources, etc.).
Evaluation techniques consisted of: questionnaires, interview guides, focus group guides, observation sheets, analysis of school records.
1.4 MOST IMPORTANT FINDINGS AND CONCLUSIONS
The presentation of evaluation results will be structured according to the main categories investigated:
Institutional infrastructure (human resources and procedures developed/operationalised during the Initiative, in order to fulfil SAI goals). Both the principals and the teachers of the schools participating in the Initiative consider that their schools enjoy more external institutional support than the schools from the control group. This refers to the relationship with parents, local community, the GDSACP, the mayoralty, the Roma Inspectorate within the CSI and CREAC. Compared to the schools in the control group, participating schools showed: better school management documentation, the more frequent presence of a community network to prevent and control school dropout, more school mediators, more

Page 13 of 198
school counsellors/psychologists, the presence of a warning system for children at risk of dropping out, support procedures for children at risk of dropping out, functional absence control procedures. Results support the conclusion that the schools where the School Attendance Initiative was implemented have a better institutional infrastructure for school absenteeism and dropout control upon SAI completion than the schools from the control group.
School-level results (data regarding school absenteeism and dropout or other aspects derived from these objectives - grade repetition, successful completion of school levels). The absenteeism rate in the schools participating in the Initiative stagnated during the three years under evaluation. It is lower in primary education (21%) and higher in lower secondary education (54%). Unexcused absences experience an upward trend in lower secondary education, but remain at the same level in primary school. A comparison of absenteeism rates between Roma and Romanian children shows a downward trend in favour of Roma children. Regarding school dropout, results indicate a downward trend during SAI implementation years: from 4% to 2% in primary education, and from 7% to 6% in lower secondary education. A comparison of dropout rates between SAI schools and those from the control group indicate a somewhat higher rate in the former, but the difference is below the statistical significance threshold. Repetition rates remained at a relatively constant level during implementation years (2-3% in primary education and 7% in lower secondary education). The same stagnating situation is observed also in regards to the rate of successful completion of educational levels.
Analysis of the target group set up in each school, based on criteria developed by UNICEF. Of the 296 pupils from the analysed sample, enrolled in the first SAI year, only 96 were reported as having promoted the grade in the third year. During this entire period, the total number of dropout cases is 41, representing 13.85% of the children enrolled at the start of the Initiative. The number of absences in the case of pupils from the target group, although on a slight upward trend, does not reach a statistical significance level, which justifies the conclusion that things stagnated. School performance (GPA) increased progressively during SAI implementation years, but this variation does not reach a statistical significance threshold.
Analysis of SAI impact on individual perception (principals, teaching staff, pupils, parents). The popularity of the School Attendance Initiative reaches a level of 98% among pupils. SAI school teachers appreciate training courses more than teachers from control schools. The parents of pupils from SAI schools have overwhelmingly positive assessments regarding the activities they have participated in. The use of information technology in the teaching process is higher in SAI schools, as compared to the control group. Teachers from SAI schools state they have acquired instructional skills they did not possess before the Initiative. The rate of acquired instructional skills is higher in SAI schools than in control group schools. Pupils’ assessment of the school environment, relationships with their classmates and with their teachers is significantly more positive in SAI schools, as compared to those in the control group. Extracurricular activities have a higher frequency in the schools participating in the Initiative.
The results presented warrant the following conclusions:
Absence and dropout rates have not decreased, nor have they increased during SAI implementation, as was the general trend in the Romanian education system. In half of the schools participating in the Initiative, a decrease in absence and dropout rates has been reported. This trend is present mainly in the schools with a greater proportion of Roma children. The fact that the SAI impact on absences and dropout has not reached the

Page 14 of 198
estimated level shows that there are root (social, economic) causes to this phenomenon that SAI interventions could not mitigate.
SAI interventions have produced positive management changes in the schools involved, regarding the implementation of strategies for school dropout prevention/control and for the development of school-community partnerships.
SAI has produced positive changes regarding the educational strategies used by teachers in their day-to-day activities.
SAI has produced positive changes in the teacher-pupil relationship and the teacher-parent relationship.
SAI has improved parents’ attitude towards education and their involvement in school life.
The positive changes observed constitute a convincing premise as to the sustainability of SAI impact.
The positive results and the examples of good practice observed indicate the fact that the success of the educational intervention is determined by the following factors: the timely identification of absenteeism situations which may lead to dropout; the systematic and continuous monitoring of the “individual cases”; a prompt and appropriate intervention through social and/or medical/health care services; individualisation by necessity and specificity, doubled by the development of a personalised “future trajectory” for each case of “recovered pupil”, using counselling services and family involvement. All the factors listed can be enhanced by the national and county authorities’ approval of common action plans for the concerted implementation of optimised services, by integrating educational, health, training/employment, social and other endeavours.
1.5 MAIN RECOMMENDATIONS
The most important recommendations that can be synthesised based on evaluation findings are as follows:
Carrying out such an intervention programme requires a complete four-year intervention
cycle. For each community, the intervention cycle needs to be superimposed on an
educational stage (for example, primary/lower secondary/upper secondary education).
Continuing microgrants and supplementing them with study microcredits for pupils selected
based on transparent procedures.

Page 15 of 198
In schools with a high number of pupils, it is recommended, on the one hand, to increase
absence monitoring and control measures and, on the other hand, to allocate additional
human and material resources in order to constantly support the said measures.
A better coordination of interventions, actions, projects, and other endeavours that involve
the school ethos is necessary.
Updating training modules by adding new examples and lessons learned, coupled with
facilitating open access to the www.ise.training.ro platform to all interested teachers, as well
as to principals and school mediators, by type of interest and training.
Applying and constantly checking school attendance monitoring mechanisms, coupled with
concrete measures addressing the cases concerned. Measures must be flexible and address
specific cases, adapting to each situation since the “one size fits all” principle has been
proven not to work in this context.
A complex diagnosis of the needs/necessities of the school, in the context of the community
it represents. Based on this diagnosis, key focus points must be set for the intervention,
depending on the vulnerabilities and specificities of each community. The implementation
programme (including components and resources employed) thus has to be adequately
adapted to the needs of the learning community. This involves the need to develop a
“community profile”, with strengths and weaknesses, credible and complex enough,
assumed by community members, which can form the basis for every future intervention.
Dynamic adaptation of the intervention plan to the actual evolution of the situation in each
school community, from one year to the next.

Page 16 of 198
2 OBJECT OF EVALUATION
2.1 SAI LOGICAL MODEL AND EXPECTED RESULTS CHAIN (INPUTS, OUTPUTS, OUTCOMES)
The School Attendance Initiative was built upon the “Educational Priority Areas” model, initially piloted
between 2003 and 2006 in an urban school from Giurgiu County and afterwards, in the 2009-2010 school
year, in five schools from Călărași County, in urban and rural areas. This intervention model has
generated major changes in the public perception of the real and urgent need for concerted action to
address the vulnerable points of the education system, placed within a social context.1
Starting with 2010, the strategic partnership between the Ministry of Education and UNICEF has focused
on the rising school dropout and absenteeism phenomena, especially on preventing and reducing these
phenomena in school communities. From the very beginning, UNICEF has been a strategic partner to the
Ministry of National Education and has systematically promoted equal rights to education, responding to
the challenges caused by the global economic crisis. The Initiative launch was facilitated by a national
conference on school dropout, held in 2010. The over 100 participants represented public institutions,
non-governmental organisations, and academia.
Due to this ample representation, the Initiative was built from the very start upon the different
perspectives presented during the conference, with the purpose of promoting an integrated approach.
UNICEF took upon itself the role of organiser to guide the action and strategic reflection process,
stimulating interventions and the cross-sectoral and public-private dialogue, with a view to optimising
public policies in the field.
School dropout and the dropout rate have the following meanings:
The pupil in a school dropout situation is the one who does not attend full-time compulsory education, being over two years older than the age of the respective class2. The dropout rate is defined by the Ministry of Education and Scientific Research as “representing the difference between the number of pupils enrolled at the start of the school year and the number on
1 The articulation of the model within the Romanian context, the way in which principles were applied, the structuring of interventions, actions, activities and results are included in the extensive evaluation report titled “Pilot Intervention Programme Based on Priority Intervention Areas”, published in 2006 under the auspices of: the Ministry of National Education, UNICEF Romania, the Institute of Education Sciences. The School Attendance Initiative was thought out following the same principle: “The purpose of educational priority areas, involving the principle of positive discrimination, is to support educational action in areas where economic and social conditions are an obstacle to children’s academic achievement”. See: I.Jigau, Mihaela (coordinator). Buzău, Alpha MDN, 2006, page 7 Download: http://www.unicef.ro/wp-content/uploads/zone-prioritare-de-educatie.pdf. 2 The official definition of school dropout is detailed in the Regulations on the Organisation and Operation of Pre-University Educational
Establishments, Article 68(5) (ROFPREU, 2005, modified 2011.18.
The purpose of the Initiative was to prevent and reduce school dropout, and increase
school participation rates, focusing on children from the most disadvantaged
backgrounds.

Page 17 of 198
record at the end of the same school year3. This rate allows for the evaluation of the internal efficiency of the education system, being equally important for pupil flow analyses and projections within a particular educational level. The Initiative was designed and implemented to promote respect for the fundamental right to education of all children and the principle of equity by assisting the most vulnerable children (Roma children, children with disabilities/SEN, children from rural areas, children from poverty-stricken families).
Initially planned to be implemented in 70 communities from 30 counties, over a period of two school
years, SAI was carried out, in its first stage, during the 2010-2011 school year, in 38 communities from 16
counties with the highest dropout rates.
Considering the recommendations made following the evaluation process carried out at the end of the
first SAI year, important changes were made in the intervention approach, the most important one being
the extension of the intervention period to one educational cycle of four years, considering the fact that,
in education, the effects of interventions are noticeable in the medium and long term and that schools’
institutional development projects are also developed over a period of four school years. Therefore, the
intervention year 2010-2011 was considered a pilot year and the Initiative was implemented in 2011-
2015 as follows: 103 communities in the 2011-2012 school year, 93 communities in the 2012-2013 school
year, 75 communities in the 2013-2014 school year, and 32 communities in the 2014-2015 school year.
The Initiative was extended following an intrinsically logical model, based on a set of quantitative and
qualitative result indicators with clearly defined targets and on resources developed during project
implementation and which fit within four categories: contractual (which require collaboration
mechanisms meant to allow easy and efficient access to the communities involved in the Initiative),
educational (meant to ensure quality learning and cooperation activities), human (the involvement in the
Initiative of people capable of directing and supporting the schools and communities to achieve the SAI
goal), time (although the Initiative developed organically, through the projects conceived and carried out
by each partner and through monitoring and evaluation activities, efficient time management was
ensured). The logical framework diagram of the project is presented in Figure 2.1, and the summary
matrix of the evaluation process in Table 2.1 Additional information can be found in paragraph 4.4
3 Report on the State of the National Education System, 2009:66
Context
In Romania, approximately 400,000 children don't go to school every day.
Against the background of the economic crisis, absenteeism, dropout and early school leaving rates have increased.
The National Education Law provides for compulsory education of ten years.

Page 18 of 198
Goal: to prevent and reduce school dropout, and increase the school participation rate, focusing on children from
the most disadvantaged backgrounds.
INPUTS ACTIVITIES OUTPUTS OUTCOMES
CONTRACT RESOURCES
1. Partnerships with the
Ministry of Education
2. Partnerships with local
and county authorities
3. Partnerships with the
civil society
4. Contracts with
beneficiary schools
MATERIAL RESOURCES
1. School equipment 2. Educational materials 3. Training packs 4. Resources for various activities (guidelines, working tools, data sheets, movies, DVDs, etc.)
HUMAN RESOURCES
1. Trainers 2. Researchers 3. Parent educators 4. Local experts (social assistance clerks/social workers, CREAC experts, GDSACP experts, etc.) 5. Community organisers 6. Volunteers
TIME RESOURCES
1. 1 year of piloting 2. 4 years of implementation 3. Intervention in a school for maximum 3 years
SCHOOL-LEVEL ACTIVITIES
1. Training of principals and the
management team for institutional
management
2. Training of principals and
teachers for inclusive education and
multiculturalism
3. Training of teachers for
curriculum development and use of
active-participatory methods in
activities with pupils
4. Training of school mediators and
Romani language teachers
5. Organising extracurricular
activities with pupils
6. Identifying and monitoring
children at risk of dropout
FAMILY-LEVEL ACTIVITIES
1. Parent education sessions
2. Support groups for the
improvement of cooperation
between school and parents
COMMUNITY-LEVEL ACTIVITIES
1. Training of local experts and
social assistance clerks/social
workers
2. PAS Community Mobilization
Networks
3. Promoting positive Roma role
models
CROSS-CUTTING ACTIVITIES
1. Raising awareness of the
importance of education
2. Developing inter-institutional
partnerships for the purpose of
reducing school dropout
3. Studies regarding the impact of
parent education on school culture,
transition from the lower level to
the upper one, resilience in
disadvantaged schools, access to
education for children with
disabilities
Over 250 schools in 39 counties and Bucharest involved in this intervention model. More than 3,750 principals and teachers who followed different training programmes; 177 school mediators who followed training programmes. 83 trained Romani language teachers. 250 social assistance clerks or social workers trained. Approximately 4,800 parents (direct beneficiaries). Over 80,800 pupils (direct beneficiaries). N CREAC specialists trained to become parent educators N parent education sessions N studies performed within the Initiative DVD with resources for different disciplines and for extracurricular activities, useful for teachers working with pupils at risk of dropout. Guidelines for school principals to prevent and fight school dropout. Guidelines for social assistance clerks/social workers. Guidelines for school consortia N community networks to prevent school dropout Inventory of Roma human resources. Number of identified at-risk
children who need social
support; for whom a social
inquiry was performed; number
of identified children not
enrolled in school.
Number of children helped by
Community Support Networks.
Studies regarding the impact of
parent education on school
culture, transition from the lower
level to the upper one, resilience
in disadvantaged schools, access
to education for children with
disabilities.
A 50-60% decrease in
school dropout and
absenteeism in the
schools benefiting
from SAI
Friendlier schools
Parents with improved
abilities to
communicate with
their children
Communities that
cooperate and act in
an integrated manner
to reduce school
dropout and
absenteeism
Pupils with a high self-
esteem and desire to
learn
Parents with increased
confidence in the role
of education for their
children’s future
Recommendations
based on evidence to
influence public
policies
Improved inter
institutional
cooperation in the
communities
benefiting from SAI.
Figure 2 1 Logical framework diagram of UNICEF’s School Attendance Initiative

Page 19 of 198
Table 2 1 Summary matrix of the evaluation process
Performance against evaluation criteria
Relevance Efficiency Effectiveness Impact Sustainability Coherence
SAI logical model Methods and instruments used to collect data
Inputs
Contract resources
Document analysis Document analysis sheets Contracts, projects, implementation plans Document analysis Document analysis sheets Contracts, projects, implementation plans
Analysis of documents that highlight SAI implementation and development phases: development of new partnerships with a view to implementing the Initiative, community selection and revalidation reports, size of the Initiative in terms of number of impacted schools, levels and areas of intervention. The information collected is correlated with the recommendations from interim evaluation reports and analysed in relation to the theory of change.
Material resources Individual and group interviews Questionnaires Visit observations Document analysis Focus on implementing partners, school principals, teachers, parents and pupils
Human resources
Time resources
Activities/ Interventions
At school level
Individual and group interviews Questionnaires Visit observations Document analysis Focus on implementing partners, school principals, teachers, parents and pupils
At family level
At community level
Cross-cutting
Outputs resulting from activities/ interventions
At school level Individual and group interviews Questionnaires Visit observations Document analysis Focus on implementing partners, school principals,
At family level
At community level
Cross-cutting
Expected outcomes
50-60% decrease in school dropout and absenteeism in SAI communities
Questionnaires, document analysis, interviews Analysis of data regarding absenteeism,
Collection and analysis of information about the existence of procedural practices at
Friendlier, more welcoming schools
Parents with improved parenting skills who

Page 20 of 198
communicate better with their children
teachers, parents and pupils
school dropout and pupil promotion Analysis of strategies, public policies influenced by the implementation of the Initiative.
school and community levels that can contribute, in a real and sustainable manner, to the transition of these communities from the intervention stage to that of preventing absenteeism and school dropout.
Mobilised communities, that act in an integrated manner to prevent school dropout
Evidence-based recommendations that influence public policies
Inter-institutional cooperation, intensified in the SAI communities
SAI relevance – The extent to which the objectives set and the proposed implementation plan properly address the problems identified (both at SAI
level and at the level of implementing partners and beneficiary communities).
SAI efficiency - How well available resources have been used to turn the proposed activities into the expected outcomes.
SAI effectiveness - SAI in general and the projects of implementing partners and beneficiary communities have reached their target goals, the
communities involved have obtained real benefits from the interventions.
SAI impact - The overall effect of the benefits brought by the Initiative and by the projects of the partners and beneficiary communities on a greater
number of people, institutions and communities than the main beneficiaries.
SAI sustainability - The positive outcomes of Initiative and of the projects carried out by implementing partners and beneficiary communities are likely
to continue even after the external financing period is over.
SAI coherence - SAI was based on a theory of change. Using interim evaluations, in the 2010-2015 implementation period, to improve and refine the
theory of change, the Initiative grew organically.
Page 21 of 198
2.2 CONTEXT OF KEY SOCIAL, POLITICAL, ECONOMIC, DEMOGRAPHIC AND INSTITUTIONAL
FACTORS: GOVERNMENT STRATEGIES AND PRIORITIES
According to the data presented in the “Strategy for Reducing Early School Leaving in Romania”, the Romanian economy has suffered significantly in 2009, forcing the government to borrow massively in order to maintain financial stability. In 2009, the government introduced measures to protect the poor and other vulnerable groups. Overall, the fiscal deficit reached a maximum of 7.5% of the GDP in 2009, and the Romanian economy went down by 9% cumulatively between 2009 and 2010, which forced the country to implement a difficult budgetary consolidation programme in 2010-2012.
In spite of the significant decrease, the poverty rate in Romania continues to be among the highest in
the EU (40.4% in 2013). A large part of the poverty-stricken population is found in two of the poorest
regions: the northeast and the southwest of Romania4. Poverty strongly affects certain demographic
groups, including ethnic minorities. A 2010 World Bank study showed that the most disadvantaged
group is that of Roma citizens, whose poverty rate reaches up to 67%. Over 50% of Roma citizens and
60% of Roma communities live on less than EUR 3.3/day and 21% of them on less than EUR 1.65/day.
Predictably, this directly affects social and economic opportunities available to Roma children.5
Romania faces demographic challenges that require a balance between educational and economic policy
reforms. The Romanian population has decreased significantly over the last two decades and is rapidly
aging. Since 2002, the population has dropped by 1.6 million people (7.2%), mostly because of low birth
rates and emigration. If these trends continue, the number of pupils will decrease by 40% by 2025,
showing an urgent need for educational reforms that focus on quality, efficiency, equity, and relevance.
In Romania, the education sector forms an integral part of the Government’s strategy to reach the
Europe 2020 targets. The EU targets are centred on improving educational outcomes, given their
influence on economic growth, via productive employment, skills development, professional training
and maintaining pupils in the system. To reach these targets, the total indicative allocation for Thematic
Objective 10 (European Structural and Investment Funds) – Investing in education, training and
vocational training for skills and lifelong learning – is EUR 1,654,073,699, and this objective involves
interventions in the following areas:
Reduction of early school leaving,
Increasing participation in lifelong learning, tertiary education and vocational and technical training.
Despite the introduction, in 2010, of a per capita financing mechanism at the pre-university education
level, there are great discrepancies in the way this is implemented:
Approximately 65.8% of the public spending on education goes to the two richest quintiles of the society, and 9.9% to the poorest quintile.
Approximately 61.2% of the public funds dedicated to education are spent in urban areas.6
The development of UNICEF’s School Attendance Initiative started from:
The conviction that all children have equal rights to education;
4The National Strategy for Lifelong Learning, 2015-2020 5 The Strategy for Reducing Early School Leaving in Romania 6 The Strategy for Reducing Early School Leaving in Romania
Page 22 of 198
Knowledge of the situation of the Romanian education system and the role of education in society,
at that date, namely:
o In Romania, approximately 400,000 children don't go to school every day.7
o Quality education is one of the most profitable investments that a country can make8. o The children who do not go to school today represent the unskilled workforce of the next
10-15 years. o Education is the best and
most sustainable way out of poverty and marginalisation.
o The 2008 Annual Report on
the State of Education
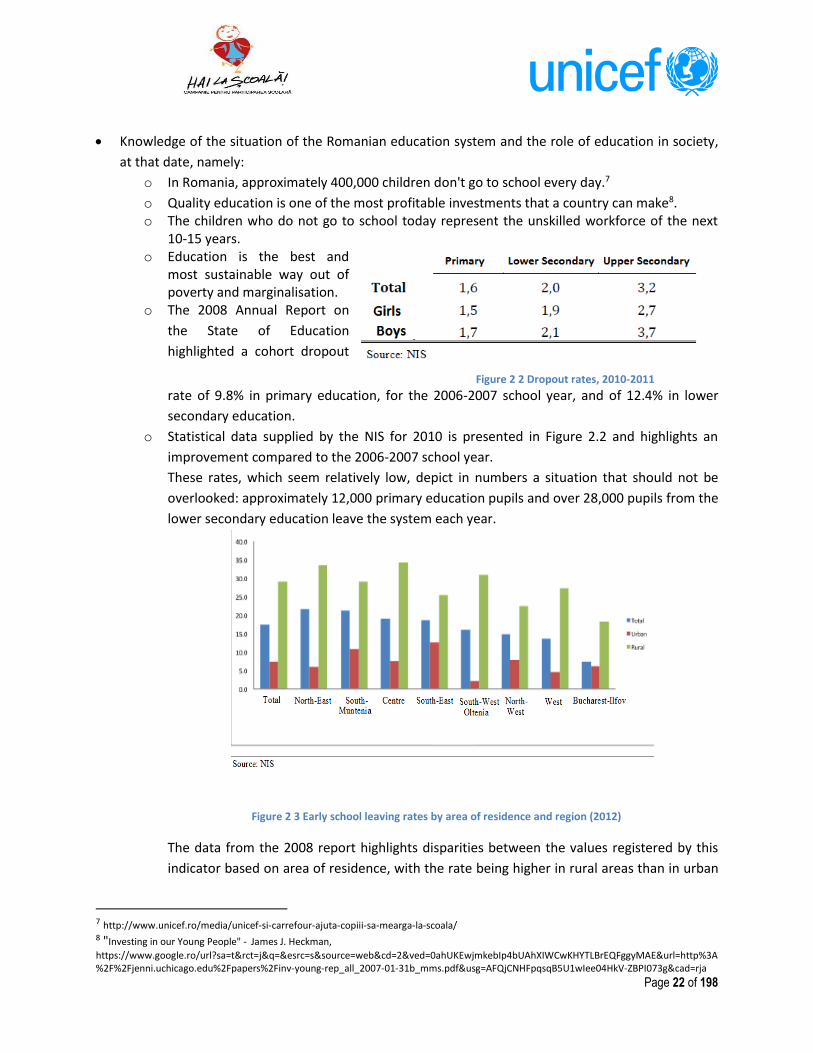
highlighted a cohort dropout
rate of 9.8% in primary education, for the 2006-2007 school year, and of 12.4% in lower
secondary education.
o Statistical data supplied by the NIS for 2010 is presented in Figure 2.2 and highlights an
improvement compared to the 2006-2007 school year.
These rates, which seem relatively low, depict in numbers a situation that should not be
overlooked: approximately 12,000 primary education pupils and over 28,000 pupils from the
lower secondary education leave the system each year.
The data from the 2008 report highlights disparities between the values registered by this
indicator based on area of residence, with the rate being higher in rural areas than in urban
7 http://www.unicef.ro/media/unicef-si-carrefour-ajuta-copiii-sa-mearga-la-scoala/ 8 "Investing in our Young People" - James J. Heckman,
https://www.google.ro/url?sa=t&rct=j&q=&esrc=s&source=web&cd=2&ved=0ahUKEwjmkebIp4bUAhXIWCwKHYTLBrEQFggyMAE&url=http%3A%2F%2Fjenni.uchicago.edu%2Fpapers%2Finv-young-rep_all_2007-01-31b_mms.pdf&usg=AFQjCNHFpqsqB5U1wIee04HkV-ZBPI073g&cad=rja
Figure 2 2 Dropout rates, 2010-2011
Figure 2 3 Early school leaving rates by area of residence and region (2012)

Page 23 of 198
ones. Figure 2.3 shows that even the developed regions cannot eliminate early school
leaving in the rural population.
Even though almost half of school-age children live in rural areas, they represent only
approximately 24% of pupils in upper secondary education. The school dropout rate was
1.5 higher in rural areas than in urban ones. Over 25% of people from rural areas completed
primary education or have not completed any level of formal education, while in urban
areas, only 2.6% have similar education levels.
Data from the Household Budget Survey (HBS)9 show that one of the main dropout causes,
identified by both educational actors and families, are financial difficulties. The Roma
population is the most vulnerable to these difficulties, and things are even worse for the
girls in this ethnic group due to precarious living conditions and early marriage traditions.
An analysis of the survey data also indicates that:
A person has a 38% higher risk of poverty if they are Roma, as compared to a
non-Roma person similar in age, level of education, household composition,
community composition, and geographical location;
A Roma child has a 37% higher risk of poverty than a non-Roma child.10
The dropout rate only partially explains the early school leaving phenomenon, which the
Europe 2020 strategy considers a factor that has a negative influence on smart and
sustainable growth.
o The PISA11 international study shows that 40% of Romanian 15-year-olds are semi-literate. o According to the Roma Inclusion Barometer (OSF, 2007), 23% of Roma respondents have no
education, 27% completed primary education, 33% completed lower secondary education, while 95% of the Roma respondents that enrolled in upper secondary education have not finished their studies, compared to 2%, 11%, 24% and 60%, respectively, in the case of the other ethnic minorities taken as a whole.
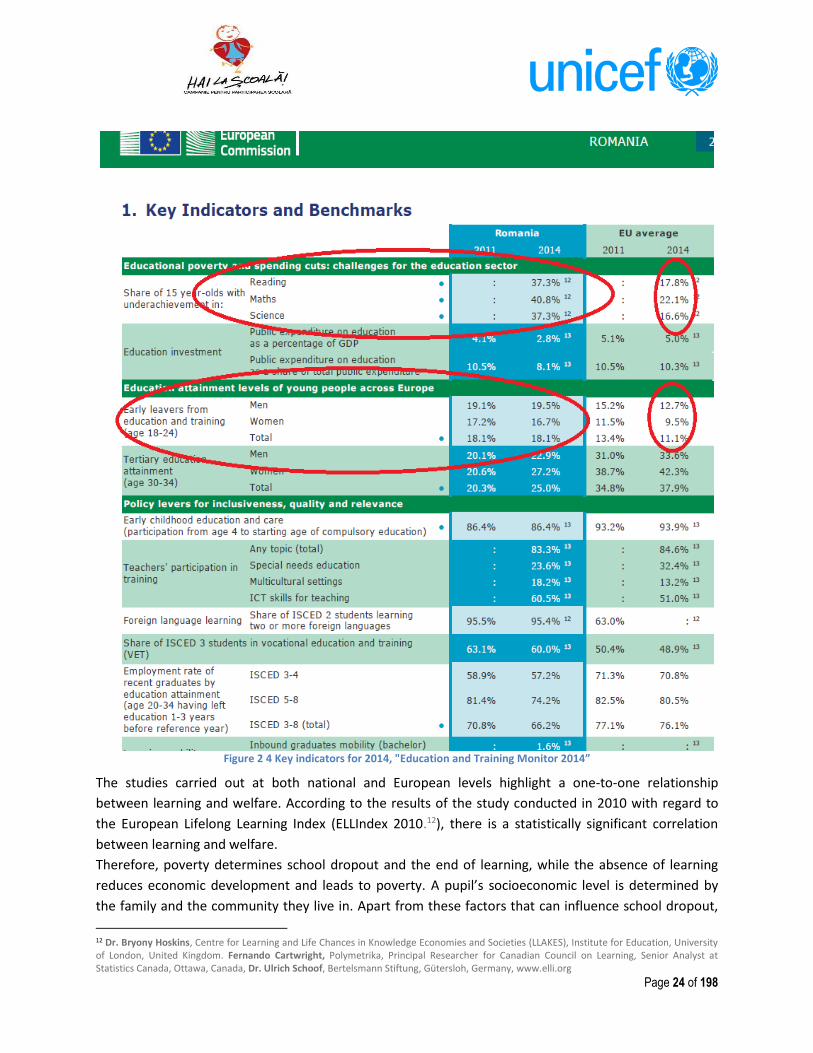
o Against the background of the economic crisis, absenteeism, dropout and early school
leaving rates have increased. According to data from the European Commission’s "Education
and Training Monitor 2012" (http://ec.europa.eu/education/tools/et-monitor_en.htm), in
2010 the early school leaving rate was 18.4% in Romania. Sadly, after four years, the
national situation is not much better. According to the same monitor, for 2015, the early
school leaving rate was 18.1% in 2014, the same as in 2011 and 7% higher than the 2014
European mean and 6.8% higher than the national target for 2020. This fact highlights the
need for interventions via projects and/or campaigns like the one initiated and implemented
by UNICEF.
9 National Institute of Statistics, http://statistici.insse.ro/shop/?page=tempo3&lang=ro&ind=BUF108I 10 Diagnostics and Policy Advice for Supporting Roma Inclusion in Romania, World Bank, February 28
http://documents.worldbank.org/curated/en/482181468095640499/Raport-final 11 "Education and Training Monitor 2012" (http://ec.europa.eu/education/tools/et-monitor_en.htm)
Page 24 of 198
Figure 2 4 Key indicators for 2014, "Education and Training Monitor 2014”
The studies carried out at both national and European levels highlight a one-to-one relationship
between learning and welfare. According to the results of the study conducted in 2010 with regard to
the European Lifelong Learning Index (ELLIndex 2010.12), there is a statistically significant correlation
between learning and welfare.
Therefore, poverty determines school dropout and the end of learning, while the absence of learning
reduces economic development and leads to poverty. A pupil’s socioeconomic level is determined by
the family and the community they live in. Apart from these factors that can influence school dropout,
12 Dr. Bryony Hoskins, Centre for Learning and Life Chances in Knowledge Economies and Societies (LLAKES), Institute for Education, University of London, United Kingdom. Fernando Cartwright, Polymetrika, Principal Researcher for Canadian Council on Learning, Senior Analyst at Statistics Canada, Ottawa, Canada, Dr. Ulrich Schoof, Bertelsmann Stiftung, Gütersloh, Germany, www.elli.org

Page 25 of 198
there is also the one related to school, which can be non-inclusive, unwelcoming and non-stimulating.
These were the conclusions and/or assessments considered during the Initiative while selecting the
beneficiary communities and in the design, types and levels of intervention.
The analysis of the documents “Reducing early school leaving: Key messages and policy support. Final
Report of the Thematic Working Group on Early School Leaving", November 2013, EU Commission, and
the “Strategy for Reducing Early School Leaving in Romania” highlights the fact that UNICEF’s SAI
interventions represented a solution that was theoretically supported at both national and European
levels and partially verified in practice via the EPA model. In the documents mentioned, it is noted that,
in order to reduce early school leaving (and implicitly absenteeism and school dropout, which influence
the high rates of early school leaving), three types of measures can be taken:
1. Prevention measures, whose purpose is to reduce the risk of early school leaving before the
first problems show up, and which consisted of:
o Ensuring a good quality early childhood education system, beneficial to all children, and
especially to those coming from disadvantaged areas;
o Diversifying the educational offer, by expanding educational and vocational training
opportunities beyond the age when compulsory education ends;
o Promoting active desegregation policies and granting additional support to schools from
disadvantaged areas or that have a large number of pupils coming from socially and
economically disadvantaged areas;
o Highlighting the value of linguistic diversity and supporting the children that have a
different mother tongue, in order to improve the language skills necessary for the
learning process;
o More intense parent involvement, by intensifying their collaboration with the school
and by creating a partnership between schools and parents, to contribute to a better
motivation of pupils;
o Improving the flexibility and permeability of educational pathways, for example by
modularising courses or alternating learning hours with practice hours;
o Strengthening vocational training pathways and improving their appeal and flexibility.
2. Intervention measures with the purpose of reducing the early school leaving risk, by
improving the quality of education and training within educational institutions, through a
prompt reaction to the first signs of pupils’ early school leaving. These measures can be
undertaken both at school and individual levels:
o School-level measures:
Transforming schools into learning communities, by creating a comfortable
environment that inspires and encourages freedom to think, thus motivating
young people to continue their education and training;
Perfecting systems that can identify the first signs of risk;
A close relationship with parents and other relevant organisations outside the
school (for example, community-based services in the area);

Page 26 of 198
Continuously sustaining and supporting teaching staff’s efforts in their work
with pupils from at-risk groups, which is a basic condition for the effectiveness
of the measures undertaken at the institutional level.
o Individual-level measures:
Mentoring, which helps pupils overcome learning difficulties, be they social or
personal;
Adapting teaching to pupils’ needs by consolidating individual learning
approaches and by granting support to pupils in at-risk groups;
Consolidating a guidance and counselling system to support pupils in choosing
the right career, in the transition process from one educational level to the next,
or from the education system to employment;
Ensuring access to financial support for young people whose economic
circumstances might make them drop out of school.
3. Compensation measures that help young people reintegrate into an educational program: o “Second Chance” school reintegration programs;
o Ensuring different reintegration paths within the established educational and vocational
training system;
o Recognising and validating already assimilated knowledge, including skills acquired
through informal learning, outside of the established methods, which helps strengthen
young people’s self-confidence and self-perception and facilitates their educational
reintegration.
SAI interventions fall within the category of prevention and intervention measures.
2.3 SAI COMPONENTS
In 2011, a new law on education came into force (National Education Law no. 1/2011), reasserting the
right to equal and non-discriminatory access to all levels of education (primary and secondary
education, higher education, as well as lifelong learning) for all Romanian citizens and foreign nationals
whose stay in the country is officially recognised. According to the same law, compulsory education is
free of charge and comprises the primary and lower secondary levels. Although, in Romania, education
is offered free of charge to all children, there are additional school-related costs that not all parents can
afford. These costs have led to social and economic inequalities, especially for children from vulnerable
families, from the rural areas and the Roma communities, which the economic crisis has increased. To
reduce or address such inequalities, the Ministry of National Education, with the support of its strategic
partners, is analysing and applying new support and/or remedial programmes for children from low-
income families. UNICEF is one of the main strategic partners to the Ministry of National Education in
promoting equal rights to education and, since 2010, it has taken on the role of organiser to guide the
reflection and strategic action process, by fostering cross-sectoral and public-private dialogue and
interventions with a view to improving public policies on education and school participation, with its
School Attendance Initiative.

Page 27 of 198
In order to obtain the expected SAI results (reducing absenteeism and school dropout by 50-60%,
preventive educational practices, active community participation in civic activities regarding school
and education, parents who communicate better with their children and collaborate more efficiently
with the school) at the four levels presented in the SAI logical model (Figure 2.1), the activities carried
out focused on seven components:
(1) Improving school management via training activities on strategic planning for school principals.
(2) Improving teachers’ educational and methodological skills so they can meet the needs of the pupils
at high risk of school dropout.
(3) Strengthening the parent-school relationship.
(4) Parent education to improve the relationship between parents and children.
(5) Offering positive and successful Roma role models, especially for Roma children, and changing their
attitude towards education and self-development;
(6) Developing a network of community actors to prevent school dropout.
(7) Training school mediators and Romani language teachers.
Subsequently, to these components was added: early childhood education and inclusion of
children/pupils with disabilities/SEN.
2.3.1 Geographical context
The pilot communities and schools where the intervention took place in 2010-2011 were selected
focusing on the most marginalised communities, considering: social exclusion, precarious school
participation/attendance, families at risk, high dropout rates in the 2008-2009 school year and in 2009-
2010, respectively.
The selection was performed in several stages:
Selection of 15 counties with the highest recorded dropout rate according to the data published by the National Institute of Statistics (NIS) for the mentioned years;
Requesting the list of schools with the biggest absenteeism and school dropout problems from the School Inspectorates (CSI) of the selected counties;
Developing an information collection instrument (school sheet) and collecting from the CSIs the information regarding the schools on the list;
Developing a grid for field visits aimed at collecting the following data categories: o General characteristics of the communities (or of the neighbourhood, in the case of
urban areas); number of inhabitants, ethnic distribution, socioeconomic situation, degree of isolation, type of Roma community, dynamics of inter-ethnic relationships within the community;
o The school network in the respective community: number of kindergartens, schools/subordinate structures, SAC/high schools, vocational schools;
o Characteristics of the visited school unit: pupil population, human resources (number, qualification, turnover, commute, years spent in school, average age, participation in continuous training programmes, etc.), learning conditions (infrastructure, equipment, laboratories, teaching materials, etc.), specialised teaching staff (counsellor, psychologist, support teaching staff), support from the local authorities (current expenses, transport, investments), existence of a doctor's office in school;
o Children who have dropped out, children at risk of dropping out, community children who have never attended school;

Page 28 of 198
o Family circumstances of the children who have dropped out/are at risk of dropping out/have never attended school.
Field visits conducted by representatives of the implementing partner (Institute of Education Sciences) to the local communities indicated by the CSIs and participation in meetings with school actors (management team, specialised personnel, extracurricular activities coordinator);
Drawing up reports for each school visited and selecting pilot communities. Thirty communities and schools were thus selected to implement the EPA system. Eight more
communities from Botoșani and Suceava counties (one extra county) affected by floods were added
subsequently.
Over the following two years of SAI implementation, the same community selection model was used,
selecting 103 new communities from 37 counties, and 93 new communities from 33 counties,
respectively. In the first three years of the Initiative, 234 communities benefited from interventions.
Starting with the 2013-2014 school year, the community selection process for SAI implementation
changed, mainly based on the revalidation of schools that had received interventions in the past. The
revalidation methodology consisted of:
Cross-checking revalidations performed by each implementing partner; each community was evaluated based on specific criteria developed by each partner institution/organisation and considered relevant for the intervention performed;
Special revalidation grids, developed by each implementing partner, were used, comprising indexes and indicators specific for the activities carried out;
The score received by each community/school represented a weighted mean of the assessments made by implementing partners; depending on the different impact of each action (interventions being carried out at school, family and community levels) in relation to the general goal of the Initiative, a weight was established for the evaluation performed by each partner, with each line of intervention receiving a weight of minimum 30%. The following weightings were used:
School-level intervention: MoE (10%), IES (30%);
Family-level intervention: IES (10%), HOLT (20%);
Community-level intervention: CRIPS (20%), “Impreună” Agency (10%). In the year 2013-2014, 75 communities were selected using the new method and, in 2014-2015, 32 of
these were revalidated.
Regarding the information presented in the technical report on the revalidation of schools included in
the Initiative in the 2013-2014 school year, there is a series of inaccuracies and inconsistencies between
that information, the lists of the schools benefiting from SAI up to the respective date and the list of the
ones selected in 2013-2014. According to the report, 176 schools were considered for revalidation,
whereas the analysis of the lists of schools selected in the three years shows that, during those three
years, 234 schools benefited from SAI and that, even though the condition was (according to the report)
that no new schools would be included in the group of selected schools, there was a newly selected
school (Rădeni-Drăgoi Elementary and Middle School, Vaslui County). This inconsistency might be due
to the fact that, on the various lists, different names were used for municipalities (just the village or just
the commune was mentioned, or both the village and the commune were mentioned), or the name of
the subordinate school structure was mentioned, without specifying that it was a subordinate unit, or
the name of the coordinating school was used, even though the intervention was carried out in the

Page 29 of 198
subordinate unit. In other situations, according to in-situ visit findings, even though subordinate
schools were selected in the pilot group, the interventions were also or only carried out in coordinating
schools. This was a good thing when absenteeism problems were common, yet it was not good when
absenteeism and dropout problems were specific to the subordinate school but the intervention was
mainly carried out in the coordinating school, where the problems were not so serious (for example, the
Coordinating School no. 2 in Botoșani and the Subordinate School no. 3 in Botoșani).
The selected communities benefited from the intervention during a different number of years, as
follows:
159 communities - one year of intervention;
44 communities - two years of intervention;
32 communities - three years of intervention.
The number of communities by county where interventions were carried out, in the 39 impacted
counties and Bucharest (the Initiative was not implemented in Cluj and Bistrița Năsăud counties), varied
between two for four counties (Harghita, Hunedoara, Maramureș, and Timiş) and twelve for one county
(Botoșani).
During this Initiative, pilot schools/communities benefited from: training for principals and teachers,
funding of school/community-level activities, visits from UNICEF representatives and/or implementing
partners, visits during which curricular and/or extracurricular activities were carried out, supported by
representatives of the implementing partners that were visiting. Using learning outcomes, the
beneficiaries of training activities organised and carried out high-quality curricular activities in schools,
schools became friendlier, more attractive extracurricular activities were held, part of them also
involving parents and/or local community representatives, parent education courses were organised,
trips with pupils and parents, creativity development workshops, the work with special needs children
was improved, exchanges of experience were carried out between schools, children at risk of dropout
were identified and monitored both at school and community levels, Institutional Development Plans
were improved, etc.
Annex 6 (Intervention Map) contains the list of schools that benefited from SAI interventions, the years
when the respective schools were involved in the Initiative, as well as the implementing partners that
contributed to the intervention.
Apparently, there are inconsistencies between the claims regarding the number of schools benefiting
from SAI (over 250) and the list of schools on the Intervention Map (235). These inconsistencies are
caused first of all by the fact that, certainly (according to the lists of participants in the different courses
or training activities), in the case of subordinate schools marked on the intervention map with a
different colour, both these schools and their coordinating schools benefited from SAI. Adding
coordinating schools to the initial list, the number goes up to 250 schools. Furthermore, the analysis of
the documents provided by UNICEF found that the interventions were not always limited to the selected
schools. For example, the training carried out in the Initiative by the Directorate for Minorities under
the Ministry of Education was addressed to a much larger number of principals, school mediators and
Romani language teachers than the ones working in the SAI schools (from the list of the 65 school
mediators trained in 2011-2012, only 24 work in the pilot schools). This is only an example, but most
implementing partners carried out activities that also involved people outside the pilot schools, so the
Page 30 of 198
intervention was extended to a much greater number of communities. It was also noted that some
communities also benefited from interventions in the years when they were no longer or not yet in the
target group. This contributed to ensuring sustainable interventions in those schools (for example: the
parent education courses carried out by Holt Constanța in the 2011-2012 school year for schools that
were not in the target group in the 2010-2011 school year).
2.3.2 Human, financial and logistics resources involved
For the smooth running of the Initiative, UNICEF assigned the necessary human resources for the design,
management, monitoring and revision of the activities carried out both directly, at the level of
implementing partners, and by delegation of tasks to the communities involved in SAI.
The SAI implementation model was designed based on data collected from studies and surveys and was
updated according to the situation on the ground and lessons learned.
Thus, in order to adapt the interventions to the needs of pilot communities, UNICEF carried out an
inventory of the human resources available at community level and selected, based on those findings,
the relevant implementing partners with the required skills to develop local teams of resource
professionals (social workers, school and health mediators, promoters).
For a good SAI management, each implementing partner had to develop and submit to UNICEF for
approval projects specific to the interventions for which they had been selected as partners. The
structure of application forms allows for completion of all the necessary information so that projects can
be evaluated based on relevance, efficiency, effectiveness, impact, and sustainability.
In the first SAI years, pilot schools were funded based on priority lists, filled in by school teams and
regarding school equipment or activities proposed for SAI implementation in the respective
communities (for example organising trips, competitions, workshops, etc.). In the last two years, when
the Initiative involved revalidated communities where school principals had been trained to design
development plans, community schools were financed based on microgrant projects. This contributed
to teaching those involved how to design projects via concrete activities, thus ensuring a better quality
of the activities carried out as each proposed activity had to lead to a result that would cover
institutional development goals.
For the good monitoring of the interventions carried out by implementing partners, they were tasked
with preparing regular reports on the implementation status of their projects. In the first year of
implementation, the main partner, the Institute of Education Sciences, submitted monthly reports,
which was very time consuming and led to difficulties in getting an overview of the project
implementation (an activity carried out throughout a year, broken up into twelve consecutive images
that were difficult to link). This deficiency was remedied in the following years when, depending on the
duration of the projects implemented by partners, there was a maximum of three reports per year.
In the processes of both interim and final external evaluation of SAI implementation, there were some
difficulties in chronologically ordering events and interventions in consecutive school years because,
although the communities had been selected for interventions during school years, the applications
submitted by implementing partners considered shorter implementation periods or, if they focused on
one-year periods, they considered calendar years both for design and reporting.

Page 31 of 198
In the evaluation process, document analysis was also hindered by the fact that there was no standard
reporting format.
At the level of implementing partners, the projects submitted showed that they were realistically
adapted to institutional implementation capabilities. In the case of IES, which had the most important
contribution to SAI, each year, 20-25 people from the institution were involved in the Initiative and,
after its expansion, a network of area/county experts (selected from the CREAC personnel) was created
for each component of the intervention.
The other implementing partners also selected, trained and used resource people outside of their own
personnel.
The Resource and Information Centre for Social Professions (C.R.I.P.S.) intervened in the selected
communities with a team of county experts selected from within the GDSACPs, which were trained to
carry out intervention-specific activities.
Holt Iași created a network of parent educators made up of experts from the County Resource and
Educational Assistance Centres (CREAC) and of teachers from pilot schools, which had initially received
training and were subsequently accredited, following practical tests (parent education courses).
The Împreună Agency selected and trained a network of young Roma people to promote the “What do you want to be when you grow up?” documentary, made by the Agency in the regions where the project activities were being carried out. The involvement of young facilitators sought to offer “accessible” local role models to pupils from every targeted region. The RENINCO Romania Association carried out both training courses and field visits for the study
contemplated in the project, using external collaborators with experience in the area concerned.
For the proper performance of the interventions, when implementing partners lacked the experience or
the human resources to carry out certain types of activities, or to develop the necessary tools for
carrying out certain activities, UNICEF turned to organisations which intervened in the Initiative in a
cross-cutting manner. This approach built upon the principle of complementarity improved the quality
of the intervention process.
No complete information was given regarding the funds allocated for each intervention and for each
category of activities so as to be able to make a detailed assessment of financial resources and the way
they were used. The analysis of projects submitted by partners, which also contain budget chapters,
shows that realistic funds were requested and that, with the funds allocated, for example, for one day of
training for one person, the costs are lower than those of similar activities in projects like SOP HRD,
Erasmus+ or Lifelong Learning.
During the visits made to the schools involved in SAI, the interviewed teachers and principals indicated
that the funds allocated for carrying out local activities were insufficient for their proper performance
and for involving a large number of pupils, and were non-stimulating for the teachers involved.
2.4 KEY STAKEHOLDERS INVOLVED IN THE SCHOOL ATTENDANCE INITIATIVE
For the interventions in schools and communities, UNICEF collaborated with different implementing
partners:
The Institute of Education Sciences (IES), with an important role throughout the duration of SAI through interventions at school and community levels on three components: management,

Page 32 of 198
teaching, and parent counselling, developing materials, instruments, guidelines and useful documents for the Initiative and for the education reform in Romania. IES supported schools in identifying and monitoring children at risk of dropping out.
The Ministry of National Education, with an important role throughout the duration of SAI through interventions on the management component - training principals, training and coordinating school mediators, Romani language teachers and teachers of other disciplines who teach in schools with a Roma population (training for multicultural education). Also, the Ministry of Education, via the Directorate for Minorities, developed and printed Romani language textbooks and drew up other textbooks, guidelines and instruments necessary for activities carried out with Roma pupils.
The Education 2000+ Centre, having a similar role to that of IES in the first year of the Initiative (2010-2011) and cross-cutting interventions in the second and third SAI years for the development and functioning of school consortia.
The Resource and Information Centre for Social Professions (C.R.I.P.S.) participated in the Initiative throughout its entire duration, aiming at setting up active community networks in the local communities, with the purpose of raising awareness, improving and/or solving the problems of at-risk children. CRIPS had an important role in identifying children at social risk of school dropout.
Holt Iași was involved in the Initiative for four years (2011-2015), setting up a network of parent educators and monitoring and supporting them to carry out parent education activities with the parents of the children from the target group.
The Împreună Community Development Agency played an important part in making a positive change in the attitudes of children, parents and the community towards education and in increasing the self-respect of pupils and parents in precarious socioeconomic circumstances. The Agency was an implementing partner for four years, starting with the 2011-2012 school year.
The RENINCO Romania Association participated in the Initiative during 2013-2015 for the purpose of ensuring access to good-quality inclusive education for all children, focusing on children with disabilities and special educational needs at preschool level.
The Roma Civic Alliance of Romania (RCAR) participated in a mainly social component, aiming, by means of a campaign, at informing Roma families about the importance of education and school participation opportunities available to Roma and non-Roma children in order to increase the school participation rate. The duration of the intervention was one school year, 2010-2011.
The PEACE CORPS participated with volunteers in 2011-2012, in 11 SAI schools.
Apart from the implementing partners that ran direct or indirect interventions (with county
experts/parent educators/area experts) in the pilot schools, there were other partners that were
involved at a cross-cutting level.
Amare Rromentza had interventions related to intercultural education and made an animated film to promote diversity.
The foundation Roma Education Fund Romania performed advocacy to promote public policies for disadvantaged groups.
The Federation of NGOs for Children developed and is managing the Education Platform.
The Soros Romania Foundation, in collaboration with UNICEF, revised and updated the Guide for School Board Members.

Page 33 of 198
2.5 IMPLEMENTATION STATUS OF THE EVALUATION OBJECT
In designing and implementing the Initiative:
The starting point was the hypothesis that absenteeism and school dropout are complex phenomena, determined by a multitude of factors, such as:
o Poor support provided, both locally and centrally, to schools from socioeconomically disadvantaged areas;
o Authorities focusing more on requests addressed to schools for the reduction of negative phenomena and less on realistic mechanisms for prevention and mitigation;
o Limited experience in schools regarding the identification of children at high dropout risk and the development of specific interventions;
o Reduced support on the part of community/county actors to schools facing absenteeism and school dropout problems;
o The socioeconomic status of the local population and pupils’ families.
A model was used for choosing solutions based on data and evidence;
The intervention was handled with a cross-sectoral approach on the following levels:
School level (preschool, primary and lower secondary educational establishments) - aiming at promoting community educational interventions, based on an adapted Educational Priority Areas (EPA) model, in the disadvantaged communities with the highest dropout rates, with a focus on the following areas of intervention:
o Management, o Teaching, o Parent counselling, o School mediator training, o Intercultural education, o Inclusive education.
Family and individual levels - aiming at promoting, reducing and reversing school dropout using parent education, with a focus on the following areas of intervention:
o Parent education, o Successful role models.
Individual pupil level - aiming at identifying and monitoring pupils at risk of school dropout and developing and maintaining a positive self-image.
Community level - aiming at involving professionals from other systems that may contribute to diminishing school dropout (social workers, medical staff, local authorities);
o Education system level: o Aiming at:
influencing public policies regarding the concept of child-friendly school;
developing and implementing integrated intervention strategies: social assistance, health, education;
o Contributing to the setting of the new generation of indicators regarding the quality of education, which focus primarily on child welfare and the safety of the school environment.

Page 34 of 198
Using interim evaluations, in the 2010-2015 implementation period, to improve and refine the theory of
change, the Initiative grew organically. Therefore, the intervention year 2010-2011 was considered a
pilot year and the Initiative was implemented in 2011-2015, involving:
o 103 communities in the 2011-2012 school year; o 93 communities in the 2012-2013 school year; o 75 communities in the 2013-2014 school year; o 32 communities in the 2014-2015 school year.
Characteristics of SAI Implementation in the 2010-2011 School Year
School-Level Interventions
Interventions consisted of:
Training of principals; Training of teaching staff; Training of school mediators (in the schools that had mediators); Transforming the school into a welcoming environment.
These interventions were carried out in 24 schools from 12 counties by the Institute of Education
Sciences (IES) and in 6 schools from 3 counties by the Education 2000+ Centre (CEDU).
Furthermore, in order to develop Roma human resources or those working with Roma pupils, the MoE
drew up the School Mediator’s Guide and the Romani language textbook (for tenth grade) and provided
training to:
Principals of the pilot schools, in order to optimise work with Roma children and parents (according to the information from the report on the MoE intervention, but without presenting a list of participants);
School mediators of the pilot schools (only in the case of the schools that had mediators) and of other schools in Romania;
Romani language teachers and potential Roma language and history teachers.
The interventions carried out by IES and CEDU pursued the following objectives:
o Increasing the rate of participation in education and reducing the risk of school dropout for children coming from socioeconomically disadvantaged backgrounds or for children with learning difficulties;
o Producing positive changes in children from the target group, both at cognitive level and at the level of attitudes, behaviours and motivation;
o Increasing their chances of accessing secondary education and employment; o Developing the school's institutional capacities in order to ensure/improve the quality of
educational services offered to children and other members of the community; o Professional and personal development of the school's teaching staff by organising continuous
training programs, in a traditional format as well as by means of IES learning platform (www.training.ise.ro);
o Diversifying school functions and increasing school’s role in the community, especially by activating the relationship with the parents of children at high risk of school dropout or with those that have children who are dropouts/out of school;

Page 35 of 198
o Improving the school's material resources (infrastructure quality, providing classrooms, laboratories, computer labs and school workshops with equipment and school furniture), with the project’s direct contribution in the amount of USD 2,000;
o Supporting school efforts to attract financial resources from other local, county or national sources.
The thematic areas addressed were:
The management of the educational establishment (strategies to prevent/fight school dropout, ensure quality, develop school partnerships using educational projects);
Curriculum (curricular adaptation, classroom management in an inclusive environment, motivational strategies, extracurricular activities);
Parent counselling/involvement (subjects like: hygiene and health, children's rights, school dropout, career counselling, conflict negotiation, domestic violence, family education of children, lifestyle quality, motivation, early childhood education, teamwork, interculturalism, diversity, discipline, self-knowledge).
School interventions aimed two target groups:
The main target group, made up of vulnerable groups of pupils (pupils at high risk of school dropout/failure and children/young people who are dropouts or out of school);
The secondary target group, made up of school actors (school population, teaching staff, management team, support personnel) and community actors (parents, local authority representatives, informal leaders, etc.).
The following types of activities were carried out:
Identifying pupils at risk and the types of risk they face (support needs);
Identifying the needs of school actors and establishing common intervention strategies: school-family-community;
Assessing training needs, developing the training curriculum and course materials (for teaching staff, parents, management team);
Preparing the resources and the virtual space for training (on the online platform: www.training.ise.ro);
Organising and carrying out training sessions: o Training sessions at national and area levels for teaching staff. Teacher training was
carried out by discipline, usually with the participation of one teacher from each school per discipline. Teacher training also included workshops for each discipline (such as classroom observation and activities with pupils, carried out by IES representatives) to present examples of good practice that teachers had to apply to their activities and give feedback. The subjects addressed were:
Transforming classes into attractive teaching activities; Approaching teaching from an intercultural angle; Designing and carrying out extracurricular activities to attract pupils at dropout
risk back to school; School as the centre of the community; Developing the resource centre for parents; A friendly curriculum for a friendly school;
o Training sessions in every school for the management team. The subjects addressed were: designing and implementing strategies to fight school
dropout;
The school development plan in the context of the new national education law;

Page 36 of 198
Attracting funds for the implementation of educational programs; Developing partnership relations with local authorities and other schools;
o Three training sessions in each school, for the parent counselling component. The subjects addressed referred to:
Making parents responsible for the education of their own children; Developing resource centres for parents, in each school;
Developing a common monitoring/evaluation system for project results;
Revising intervention strategies after interim evaluations;
Attracting new local, county and national partners;
Interventions to improve learning conditions - providing equipment and teaching materials or small school furniture;
Developing resource centres to support extracurricular activities with pupils, with parents and for other school initiatives.
In the 2010-2011 school year, the following products were developed for school interventions:
o Tools to identify pupils at risk of school dropout; o The school sheet; o Ten training modules; o Support material (DVD) for curriculum implementation: Romanian, English, maths, science, civic
culture, history, music education, primary education, aiming primarily at methods that can be used to apply the school curriculum so that pupils can acquire the minimum basic skills required by the mandatory curriculum;
o Support material for educational management (CD); o Support material for parents (CD); o Support material that presents methods for combining teaching activities with extracurricular
activities (2 DVDs with Origami and 2 DVDs with ECO activities); o Online platform.
Family interventions that consisted of:
Parent involvement; Support for parents through counselling and one-on-one discussions.
To the interventions at this level, carried out directly and indirectly by IES and CEDU under the Parent
Counselling component, were added interventions carried out by the Roma Civic Alliance of Romania
(RCAR) in the “Learning for Life” project, a mainly social project.
The goal of the project was to inform Roma families, by means of a campaign, about the importance of
education and school participation opportunities available to Roma and non-Roma children in order to
increase the school participation rate. The target group comprised 24 Roma communities in 12 counties.
The activities carried out were:
o 24 preparatory meetings with all relevant local actors: school, mayoralty, school inspectorate, school and health mediators, Roma leaders/experts;
o 24 “Roma Parents’ Forum” community meetings, where the parents of the identified Roma children were invited to present their problems and have community talks on subjects like the benefits of Roma children’s participation in education, the fight against school segregation based on ethnicity, and quality education for Roma children. This activity and the previous one were community-level interventions;

Page 37 of 198
o Facilitating the school enrolment/re-enrolment, in mixed classes, of 1,335 Roma children from the identified communities;
o Distributing 2,400 school bags with school supplies and raincoats to pupils enrolled or re-enrolled in school;
o Monitoring enrolled/re-enrolled children's educational trajectory regarding their adaptation to the school environment and school attendance.
SAI results for the 2010-2011 school year stimulated the expansion of the Initiative to a duration of
more than two years:
o 60% of children at risk of dropping out improved their school participation; o In 50% of the schools, dropout rates decreased by 15-40% compared to the rates registered in the
previous two years; o School principals’ increased capacity to prevent and reduce the school-related causes of dropout
and absenteeism; o Increased teacher ability to adapt teaching methods to the needs of children at risk; o Improved school mediator skills in applying methods to reduce and prevent dropout; o Increased parent awareness of the importance of education; o Increased recognition by local authorities of the potential of education for community
development; o More welcoming schools due to provision of equipment and teaching materials.
Community interventions consisted of:
Involvement of decision-makers; Community mobilisation.
The largest part of these interventions was carried out by the implementing partner Resource and
Information Centre for Social Professions (C.R.I.P.S.), via their social and educational project titled
“Community networks for improving access to education, preventing school dropout and (re)integrating
children from flood-affected communities into school”.
The project, which was implemented in eight communities from two counties, had the following
objectives:
o Strengthening the role of school for: Efforts to prevent and fight post-traumatic stress caused by floods; Preventing school dropout.
o Laying the foundations, through actions centred on one of the key institutions in the local communities (the SCHOOL), for setting up active community networks within the local communities, with the purpose of raising awareness, improving and/or solving the problems of children at risk.
The activities were organised by three CRIPS representatives and two resource persons (one person per
county) and consisted of:
o Identifying the training needs of the people involved in the project on behalf of the pilot schools; o Adapting the training curriculum to the identified needs; o Holding a 20-hour training session in Sinaia, with the participation of two resource people, 16
teachers/principals from the eight schools, on the following subjects: Preventing and fighting post-traumatic stress: types of activities that can be carried out in
school; Mobilising parents, teaching staff, community volunteers as well as other professionals in
order to identify and analyse problems for a better protection of children affected by flooding;

Page 38 of 198
Identifying children at risk of school dropout and methods to re(integrate) them into school; The role of teaching staff in preventing and fighting child neglect, abuse and exploitation.
Communication with the family – particularly with parents from vulnerable groups, with grandparents/family members taking care of children whose parents are abroad.
o Organising and carrying out practical activities related to the subjects tackled during the course, in the pilot schools, with the support of resource people:
Identifying, based on questionnaires supplied by CRIPS, and monitoring the children at risk of school dropout;
Increasing school appeal and children’s interest in going to school. o Holding a-20 hour training session in Sinaia for two resource people, 24 representatives of pilot
schools and local authorities managing pilot schools. The subjects addressed were: Mobilising the community to fight and improve the effects of floods on the population,
especially on children and families; The role of the community in general and of different professional groups in particular in
preventing all forms of child exploitation and neglect and in fighting school dropout; Monitoring children at risk of school dropout through the community network. Activities at the level of every participating school and local authorities:
Drawing up Dropout Prevention and School (Re)Integration Plans in all the schools from the target group;
Drawing up Dropout Prevention Plans at the level of local authorities;
Monitoring children at risk of school dropout using individual monitoring sheets.
Organising, in collaboration with the local authority, cultural, educational, sports activities (based on the initiatives of the teachers and community representatives participating in training courses), engaging primarily children at risk, parents and volunteers.
The following were generated during the project:
o Two course modules; o A questionnaire for identifying the risk of dropout; o A monitoring sheet for children at risk of dropping out of school; o Eight dropout prevention plans at the level of schools; o Eight dropout prevention plans at the level of mayoralties. 540 pupils at risk of dropping out of school were identified and monitored.
Characteristics of SAI Implementation in the 2011-2012 School Year
School-Level Interventions
The EPA intervention model was extended to 103 more schools in 37 counties and Bucharest.
Considering the lessons learned in the first year of implementation and the recommendations from the
SAI evaluation report for the 2010-2011 school year, measures were taken to improve SAI
implementation in the 2011-2012 school year. For example:
o School-level interventions were carried out only by IES as an implementing partner; o IES selected from CREAC:
o 38 resource people at county level; o Four resource people at area/regional level for the management component.
The recommendations from the aforementioned evaluation report, which led to these improvement
measures, are:

Page 39 of 198
o Distribute areas of intervention based on the specific skills and expertise of implementing partners, so that one partner is in charge of a particular type of intervention in the entire geographical area covered by the Initiative. Based on the results achieved by implementing partners in the first SAI year, it is recommended to use them as follows: o IES - at school level, in three areas - management, teaching and parent counselling; o CEDU 2000+ - at school level - training necessary for the implementation of the new
provisions of the Education Law, school consortia; o CRIPS - at community level, to create connections between schools, other institutions
responsible for reducing school dropout and absenteeism, and the local authorities; o MoE - training Roma human resources, school mediators and principals on inter-culturalism
and inclusive education. o Designate resource people at county level to coordinate and monitor the implementation of SAI
interventions. These people, knowing the particularities of each community and residing in the area, will be able to constantly follow the progress in the development of activities and will be able to counsel the principals that will request their support, all this with reduced financial resources.
EPA intervention goals and key areas of intervention were the same as in the 2010-2011 school year.
To the types of activities carried out in the 2010-2011 year were added:
o Concluding partnership agreements with the schools involved in the Initiative; o Carrying out work sessions with the Peace Corps volunteers and local facilitators from the
project; o Organising the “Joy of Learning” creative contest for pupils, which had five sections:
o Written text; o Drawing or collage; o Mock-up; o Photography; o Something else-anything to tap into children's creativity and talent diversity.
The following training activities were organised and carried out by IES:
o Management component: o 28 training sessions: two one-day national sessions, eight regional sessions (Brașov,
Bucharest, Timiș and Suceava) for principals, and 18 local sessions; o Monitoring visits carried out by four regional experts to each of the educational
establishments; o Teaching component (face-to-face sessions + school applications + online meetings (experience
sharing, coaching) + in-class demonstrations): o 109 direct and online training sessions: one national, 52 regional and 56 local; o 104 direct training sessions: 14 national, 4 regional, 86 local;
o Parent counselling component: o Two regional training sessions; o Two monthly meetings in every school; on average, six counselling sessions, training and
information organised in every school, and over 350 teachers and support personnel involved in activities with parents.
IES developed the following products in the 2011-2012 school year:
o Tools for experience sharing between schools participating in the EPA project; o Partnership agreement with the school; o An article in the Journal of Pedagogy no. 4/2011;

Page 40 of 198
o The study regarding the development of a virtual learning community around the parent counselling component – “Building a Virtual Community of Practice - A Case Study on Parents` Counsellors in Romanian Disadvantaged Areas” (Țibu S., Botnariuc P.);
o Working guide for preventing and fighting school dropout. Guide for school principals. Materials developed in the previous year were revised and substantial improvements were made
(according to the interviewed teachers’ statements) to the learning platform.
Training programmes were set up by the MoE and IES (in collaboration) to develop Roma human
resources and those working in schools with over 40% Roma pupils or preschoolers and/or in schools
with absenteeism and/or dropout issues.
For the targeted principals (108 people in 97 schools), three 3-day training sessions were held in Sinaia.
The subjects covered were: Roma history, specific communication, inclusive education, Roma customs
and their impact on the Roma educational process, education for Roma people and absenteeism and
dropout, the absenteeism and school dropout situation in Romania and Europe.
Two seven-day training sessions were carried out in Costinești in June and August 2012 for 65 school
mediators. Priority was given to Roma school mediators or potential school mediators with no classes,
from the schools involved in the School Attendance Initiative. The subjects covered were: Roma history;
communication; traditions; the Romani language; inclusive education; Roma education; school mediator
legislation.
Apart from the materials developed the previous year, the school mediator sheet was also drawn up.
Family-Level Interventions
At family level, the Initiative witnessed an important development in 2011-2012, with the newly added
Parenting Skills Development component, whose main goal was to prevent, reduce and reverse school
dropout using parent education.
The new implementing partners Holt Constanța and Holt Iași were responsible for implementing this
component.
The key areas of the intervention were:
Training of trainers to create a national network in the field of parent education; Organising parent education courses in the selected communities, in order to improve
communication between parent and child; Changing the way teachers interact with parents and pupils, in order to reduce school dropout; Using parent education to improve the relationship between teacher, pupil and parent, thus
increasing school appeal. The “Parent education – a new attitude to reduce school dropout” project, whereby Holt Constanța
proposed an educational intervention in an informal context, using parent education as a means for the
personal development of teachers and for improving the quality of the teacher-pupil and parent-pupil
relationships and thus increase school appeal and reduce school dropout, pursued the following
objectives:
Training and certifying 76 teachers via five parent education courses;
Reducing school dropout in 38 schools from 16 counties of the country, by having the 76 teachers apply the results of the parent education course.
According to the project, the target group had to include two teachers from each of the 38 pilot schools
involved in the Initiative in the 2010-2011 school year.

Page 41 of 198
The “Developing a network of parent educators“ project, implemented by Holt Iași, set out to develop a
national network of parent educators/trainers from 21 CREAC - as resource people for developing
parent education programmes aimed at parents from vulnerable groups, and had the following
objectives:
Developing a network of 42 parent educators/trainers from 21 CREAC;
Organising 42 parent education courses in the 21 counties;
Developing a local parent education training pack by CREAC. Training activities were carried out:
In October-November of 2011, in the form of: o Five courses in Botoșani, Constanța, Sibiu, Călimănești and Sf. Gheorghe in the case of
Holt Constața. According to attendance lists, in this course participated 76 teachers from 36 pilot schools from 2010-2011 (Dobromir and Clejani schools were not represented) and teachers from two schools that were not pilot schools (The Elie Radu High School in Botoșani and the Gheorghe Banea Middle School in Măcin). There were also exceptions allowing two teachers from the same school to attend.
o Two courses in Târgu Ocna and Predeal in the case of Holt Iași (42 participants).
In May-June of 2012, in the form of two courses in Sinaia, organised by Holt Iași (40 participants).
The subjects covered in the eight training modules were: How to be a better parent; How to manage
stress and anger; How to communicate more efficiently with your child; How to accompany your child
on their development path; How to be a trustworthy partner in the relationship with your child; How to
approach primary-school child discipline in a positive manner; How to prevent abuse and its effects on
the child; Closing and next steps. Apart from these subjects, the first day also covered aspects regarding
adult education and learning styles.
For the proper implementation of projects, the following were drawn up:
Parent portfolio;
Parent educator portfolio;
Website/online platform to monitor and disseminate training activities - in the case of Holt Iași. The database available on the platform included, for monitoring purposes, all data related to parent education courses organised by parent educators. The platform:
o Was and is used by parent educators to enter parent registration forms, course attendance lists and satisfaction questionnaires completed by parents.
o Provides online support for expanding the network of parent educators at national level. o Also contains: the list of certified parent educators, presentation materials, studies,
research, information for educators and parents, communication system within the parent educators network, etc.
The Parent Educator’s Manual (vol. 2 - for parents of children in primary school) and volume 3 (for parents of children in lower secondary school).
"Parent education in Romania”, developed by Holt Iași experts in collaboration with UNICEF. After participating in training courses, some of the teachers from the pilot schools from the year 2010-
2011, trained by Holt Constanța, carried out parent education courses with the parents of the pupils
from those schools. Of the CREAC parent educators trained by Holt Iași, 26 held parent education
courses in 2011 in the schools participating in the Initiative in the 2011-2012 school year.
The outcomes of this component for the 2011-2012 school year were:

Page 42 of 198
76 and 42 resource people, respectively, in the parent education field;
21 CREAC involved in the intervention;
More than 1,200 people participating in parent education courses.
Apart from parent education, UNICEF representatives carried out visits to the Roma communities in
order to raise parents' awareness of the importance of education.
The key areas of intervention under this component were:
Discussions with Roma leaders, in an attempt to change parents’ perception of education; Connecting the families of children at risk of dropping out of school with resources available in
the community; Identifying out-of-school children in the selected communities; Facilitating school enrolment and participation for the children identified;
Community-Level Interventions
Community mobilisation aimed at engaging professionals from other systems that may contribute to
reducing school dropout (social workers, medical staff, local authorities) was achieved via the following
key areas of intervention:
Creating an inventory of human resources available in the community, to set up a local team of resource professionals (social workers, school and health mediators, promoters); The goals of this inventory were:
Identifying Roma human resources, from schools and communities, who can contribute to improving pupils’ school participation;
Creating a database of Roma human resources available in the 141 schools benefiting from SAI in 2010-2012;
Raising awareness at school board level, among SAI schools with high shares of Roma pupils, regarding the important role of Roma human resources in preventing and fighting absenteeism and school dropout;
Facilitating the active collaboration of identified Roma human resources within the communities.
131 of the 141 schools which had been sent requests for information submitted data,
synthesised as follows:
58 school mediators, of whom 21 are employed by local councils, 20 by CSIs, 10 by CREAC and seven are employed in projects and by NGOs,
49 Romani language teachers, of whom 25 are full-time teachers, 14 work half-time and ten work less than half-time,
20 health mediators,
11 local experts on Roma issues,
Nine Roma teachers who teach subjects other than the Romani language or Roma history and traditions.
Preparing a set of tools addressed to social workers for monitoring and preventing dropout. Training community professionals. Promoting the best dropout prevention practices, implemented locally to consolidate the
participation of local authorities and formal and informal leaders in reducing school dropout.

Page 43 of 198
CRIPS played an important part in implementing community mobilisation components in 2011-2012 as
well. The activities carried out by CRIPS to implement the component in the 103 new communities
were:
Drawing up the “Community mobilisation to prevent and fight school dropout” guide; additions and modifications were made, as suggested by the UNICEF project coordinator.
Developing a model for training county experts as local trainers (agenda, course materials, trainer's manual), including the concepts of the first two local activities that they will have to implement.
Drawing up the Initial Community Assessment grid, in collaboration with UNICEF.
Selecting county experts from the GDSACPs.
Developing a collaboration agreement model between UNICEF, the GDSACP and CRIPS.
Training experts for their role as local trainers, in Sinaia, module 1, two sessions of 18 and 19 participants, respectively.
Organising and carrying out four local training and community mobilisation activities.
Developing and updating the web page www.mobilizarecomunitara.ro.
Making a video to raise awareness, on the one hand, of the issues tackled by the CRIPS intervention (the child who leaves school because of poverty, child labour or because s/he doesn’t find school appealing and s/he is not adequately supervised and guided by the family) and, on the other hand, of the solutions available in every community.
Organising three regional summative evaluation seminars in Bucharest, Timișoara and Suceava, having, as guests, local trainers and representatives of: CSI, CRJAE, GDSACP, the media and members of community networks.
A new intervention component, developed and implemented by a new implementing partner, the
“Împreună” Community Development Agency, starting with 2011 via the “What do you want to be when
you grow up?” project, was Promoting Positive Roma Role Models.
The component focused on a positive change in the attitudes of children, parents and the community
towards education, by promoting positive, successful role models of people of different professions
from within the Roma population. For that purpose, the following objectives were pursued:
Making a documentary about 15 Roma professionals that were successful in life due to education;
Organising screenings of this documentary in the schools with a large number of Roma children, to promote successful role models belonging to the Roma minority;
Promoting the importance of education in the selected communities, to increase the value given to education among Roma youth.
The main target group included vulnerable groups of pupils, stakeholders from the 30 selected schools
(school children, 15 teachers, management team, support personnel) and community actors (parents,
local authority representatives, informal leaders, etc.). To these were added the same stakeholder
categories from other schools where the results of this partner's activity were presented, as well as
students from three universities.
The activities carried out were:
o Selection of the 15 successful Roma role models; o Establishing the working methodology; o Interviews with the people selected and their transcription; o Making the documentary film;

Page 44 of 198
o Designing the brochure; o Disseminating the documentary film in 30 schools across the country, with the
participation of the characters in the film as guests; o Setting up the photography exhibition.
Apart from the documentary and the brochure entitled “What do you want to be when you grow up?
Stories about the power of dreaming and the need to dream”, another product was the publication
“About us”, by Chiriţoiu, A., Ivasiuc, A., Bucharest, 2012.
During the 2011-2012 SAI implementation, a very important part was played by the UNICEF consultant,
who visited all SAI communities, communicated and worked with the schools, pupils’ families and
community representatives, and carried out an inventory of the human resources available in the
communities in order to set up a local team of resource professionals (social workers, school and health
mediators, promoters).
The PEACE CORPS, a new partner, ran interventions in 12 schools, of which 11 were SAI beneficiaries in
2010-2011 or 2011-2012 and one school came from outside SAI (Scarlat Longhin School of Arts and
Crafts in Bacău), with volunteers involved in carrying out extracurricular activities.
The interventions centred on the selected communities were coupled with cross-cutting interventions:
The Education 2000+ Centre conducted a cross-cutting intervention in 2011-2012, carrying out activities aimed mainly at schools’ management teams, in order to boost their collaboration with other local schools within school consortia.
The Amare Romentza Association carried out a campaign in 31 communities of the 141 aimed by SAI in 2010-2012, more precisely in the Roma communities, addressed to Roma parents, teachers and principals, to promote intercultural education and the Romani language.
The foundation Roma Education Fund Romania carried out a series of workshops on the following subjects: Roma inclusion strategy; school after school; desegregation policies; early childhood development policies; structural funds and financing priorities in education; secondary legislation to the Law on education.
Characteristics of SAI Implementation in the 2012-2013 School Year
SAI was implemented in 93 communities. Regarding school, family and community interventions, under
all components, no new implementing partners were involved. Starting with that year, the parent
education component was developed only by Holt Iași.
Intervention objectives remained the same on all levels and components.
School-Level Interventions
IES held training activities in three centres: Bucharest, Bacău and Braşov.
Management component:
• Developing and applying a self-assessment tool for SAI activities (16 principals sent the completed questionnaire to the person in charge of this component). The synthesis of the answers to these questionnaires was used as an introduction to the face-to-face training programme.
• Management training for all school principals or representatives of the management team:

Page 45 of 198
Four regional specific training sessions were organised, focusing on support for the planning, development and evaluation of the activities carried out in the Initiative, in an integrated and coherent manner.
The main training areas: concept operationalisation; activity budgeting; evaluation methods and techniques; using evaluation findings to support school development.
• Providing feedback on strategic and operational planning instruments at school level (three schools).
• Regional experts carried out consulting activities for the school management on how to develop the strategic institutional documents, and organised joint activities with the managers and project teams from the EPA schools, at county level, with the participation of CSI and TTH representatives, of local authorities and other members of the community - local launch of the School Attendance Initiative.
Teaching component:
The training activities covered the same subjects as those from the previous school year, and were carried out using the DVD made in 2011-2012 as teaching material.
In total, 129 one-day face-to-face training activities were carried out in the three centres. Local training activities were carried out in seven counties and in Bucharest. Interaction on the online learning platform, where ideas for reflection were launched on all
forums. Interactions took place both in the section devoted to the schools involved in SAI in the 2011-2012 school year and also in the section dedicated to the schools involved in SAI the previous year.
A draft Guide on Building a Friendly School was drawn up - a resource dedicated to teachers, with many examples of good practice and illustrations made during the local meetings in February-March.
The activity of county experts: o Selecting - together with school principals - the teachers participating in the training; o Assisting school principals with boosting teachers’ motivation to participate in the
training; o Supplying the teaching staff with a socio-emotional skill development programme for
carrying out activities with the pupils (a programme that contains six emotional skills sessions and six social skills sessions, as well as a “therapeutic story” at the end).
Parent Counselling component:
Eight training sessions were carried out in the three centres: Bucharest, Braşov, Bacău. The practical guide “EPA Parents in My School!” was designed. The certification form for the parent counselling course was filled in. The activity of the county experts consisted of:
o Discussions with the school mediators involved in facilitating/organising activities with parents with a view to identifying ways to stimulate parents’ involvement in the school life.
o Making an indicative planning of visits to the homes of the children from the target group, together with other local community representatives.
o Discussions with form teachers and educational/school counsellors with a view to identifying parents’ needs in their relationship with school and with their own children, and selecting attractive activities for the parents of children in the target group.
o Selecting the person in charge of activities with parents in the school. o Identifying resource people in the community.

Page 46 of 198
In October-November of 2012, the Ministry of Education organised three training sessions for EPA
school principals in Sinaia. In order to ensure consistent interventions, an EPA project representative
participated in the second and third sessions.
Apart from these courses, the Ministry of National Education and its Directorate for Minorities:
Organised, in collaboration with UNICEF: o Two seven-day training sessions for 30 Roma school mediators at a time (60 school
mediators in total); o Summer courses in the Romani language and Romani teaching methodology, with a
duration of fourteen days, for potential Roma language and history teachers (55 teachers);
Developed and published the First Grade Mathematics textbook in the Romani language.
Family-Level Interventions
In the case of family interventions, the implementing partner Holt Iași, together with the network of
parent educators set up the previous year, continued the project started in 2011-2012 (same goals,
same types of activities).
The activities carried out in the field of parent education were:
Parent education courses carried out by the parent educators in the network. By the end of 2012, each of the over 40 parent educators having participated in the theoretical training courses organised a parent education course for parents in one of the schools participating in UNICEF’s Initiative. Holding those courses was a condition for their certification as parent educators. Each year, every parent educator must carry out at least one educational course with parents, in order to be re-certified by Holt Romania.
Support by Holt Iași to parent educators for carrying out and monitoring their courses.
Courses carried out by Holt Iași for one representative of each of the 51 schools benefiting from SAI (51 parent educators from 51 EPA schools, with theoretical training, in two rounds - 23 educators in the first round, held in Vatra Dornei, and 28 parent educators in the second round, in Târgoviște).
Data collection for the study regarding the impact of parent education on parents and children.
Community-Level Interventions
CRIPS interventions were carried out similarly to those implemented in the previous years. The main activities carried out by CRIPS and/or local trainers were:
Training and supervising local trainers, so that they can develop the necessary skills to train social assistance clerks/social workers at SPAS level and resource people within the community - three modules held in several rounds, in Sinaia, in November of 2012, and in Bucharest, in February and June of 2013.
Organising and carrying out two county seminars on “Community PAS networks”, aimed at improving the school-SPAS-community relationship. A seminar was held in each county in the last quarter of 2012 and another one in the second quarter of 2013.
Activities for the creation and/or development of PAS networks in the communities.
Activities to identify and monitor children at risk of school dropout.
The “Împreună” Community Development Agency continued to promote positive Roma role models via
visits to over 50 participating communities. A Roma youth network was set up in order to disseminate

Page 47 of 198
the film. At first, this network consisted of 12 people that participated in a four-day training course at
Predeal in September.
Cross-cutting interventions were also carried out under the Initiative:
In December of 2012, 700 copies were printed of the “Practical guide to promoting the intercultural component and ethnic diversity in preschool education”, first developed under a SOP HRD project and later revised in the Initiative, as a cross-cutting intervention by Amare Romentza. The guide was distributed to kindergartens, central authorities and research institutes.
The Federation of Non-Governmental Organisations for Children launched the educational platform, which provides a framework for aligning common strategies and interventions, it facilitates access to information, resources and working tools, it promotes national intervention models carried out in partnership, and it manages a catalogue regarding the map of socio-educational programmes and services.
UNICEF developed and printed, in collaboration with the associations “Education for all with you” and ProsperYoung.com, a guide for pupils and volunteers called “Volunteering for school participation”.
Characteristics of SAI Implementation in the 2013-2014 School Year
In the 2013-2014 school year, SAI was aimed at 75 schools. That year, one more implementing partner
joined the Initiative, namely the RENINCO Romania Association. The organisation’s project, titled
“Inclusive education in kindergartens and research on the school integration of children with
disabilities”, was carried out in 2013-2015 and its goal was to ensure access to quality inclusive
education for all children, focusing on preschool children with disabilities and special educational needs.
The RENINCO intervention moved in five directions:
• teacher training, • learner monitoring, • research (theoretical and in the field), • development and dissemination of material and publications, • development of the SEN strategy in inclusive contexts, having as target groups: kindergartens attached to SAI schools, primary and secondary schools
involved in UNICEF’s Initiative (only in the research carried out with the IES team in 2015), children
and youth with disabilities from the area covered by SAI.
School-Level Interventions
A new element in 2013-2014 was the fact that the schools re-certified for SAI interventions were tasked
with submitting microgrant projects in order to receive funding.
Within the Management component, apart from eight training sessions (two national and six regional)
the following activities were carried out:
• School board capacity building (using the “School Board Guide for Non-Tertiary Education” and two training sessions for Board members);
• The study “Financing the Pre-graduate Education System Based on the Standard Cost: A Current Assessment from the Equity Perspective (research report)”;
• ARACIP promotion of the “child welfare” concept, with the new generation of standards on the quality of education (September of 2014).

Page 48 of 198
In the case of the Teaching component, the activities were carried out as in the previous years: face-to-
face training courses, visits to schools and demonstration activities, online learning activities. The new
elements were:
Introducing new materials in schools, for courses and activities related to Financial Education, SEN (work with children with disabilities), and ‘Song, play and joy’;
Creating a space for consultations and educational dialogue on the platform, using forum resources and interaction opportunities for religion and foreign language teachers.
The Parent Counselling component also continued the work started in the previous years (two national
seminars in Iași and Bucharest for principals, county facilitators and school representatives, and seven
regional training activities). Additionally, the “EPA parents in my school” guide was developed,
containing practical parent counselling activities based on good practices from the previous years and
feedback from county facilitators and people in charge of parent counselling in schools.
The intervention of RENINCO as a partner was carried out via: three training sessions in Sibiu, Iași and
Bucharest, to develop inclusive practices for resource people from kindergartens within SAI schools (69
kindergartens); training the Network of inclusive kindergartens; two work seminars with a group of
decision-makers, managers and professionals, to set out the content (of courses and the National
Strategy for the Education of People with Special Educational Needs in the Context of Inclusive
Education) and to highlight the priorities.
The Ministry of Education organised two seven-day courses to train school mediators, a 14-day summer
school for Romani language teachers, and three two-day seminars to evaluate the activity of school
mediators. Second, third and fourth grade mathematics textbooks were edited in the Romani language.
A guide for teachers working in communities with Roma pupils was developed in collaboration with
UNICEF, titled “Educational Rromanipen”.
Family-Level Interventions
The implementing partner for the family-level intervention through parent education, Holt Iași, did not
carry out training activities to expand the network of parent educators that year, but focused on
supporting parent educators in carrying out and monitoring their courses. Most of parent education
courses were carried out in schools. In order to support these activities, Holt Iași made 1,224 parent
packs.
By October 31st, 2013, parent educators had carried out 346 parent education sessions, with 888
participating parents. Most of these courses had been held in the previous school year.
Community-Level Intervention
The activities carried out by CRIPS were similar to those implemented in the previous year. In that
school year, CRIPS no longer organised county seminars with its county experts, but focused on the
intervention at the level of the Local Public Authority and the Public Social Assistance Service, by:
• Identifying the capacity to implement legal provisions on school dropout prevention and control;
• Identification, by the county expert, of the social assistance clerks/social workers involved in the provision of social assistance locally;

Page 49 of 198
• Information and ANC-certified training of social assistance clerks/social workers on the prevention and control of school dropout and the development of social and civic skills (two 2-day modules in 2013-2014, 56 clerks successfully completed the course);
• Carrying out awareness-raising, information, prevention and control activities regarding school dropout.
In order to increase the quality of its activities, the “Împreună” Community Development Agency
developed a large amount of educational and/or awareness-raising materials for the Initiative’s target
population:
The film “What do you want to be when you grow up?” was followed by the film “Ilie’s story”, presenting the life stories of four young Roma and their families. In the 25 minutes of the film, the young people talk about their high school events, the importance of parental help and especially about how important it is to have a dream and to fight for it.
The CD “Children will be children - Stories for parents”, that takes listeners to the universe of childhood, where stories of fairies, kings and queens blend with real stories that we can come across in Roma communities. The CD can be considered challenging for both parents and children, because those ten songs talk in an overwhelming manner about the importance of parents, family and school.
Using these additional materials, the "Împreună" Community Development Agency continued its
campaign according to the initial project.
In that school year, Amare Romentza made the first bilingual animated movie, to promote diversity and
fight discrimination. A guide for the educational use of the animated movie was also developed. This
material was disseminated in partnership with the CSI and TTH.
Characteristics of SAI in the 2014-2015 School Year
There were no major changes, compared to the previous year, in the interventions ran in the selected 32
communities.
IES no longer organised training sessions under the Management component, but focused on the
following:
• Using the https://calitate.aracip.eu application and the ARACIP database for monitoring purposes (including to register experts in the application);
• Developing and disseminating the study “The cost of non-investment in education in Romania”; • Implementing the research project titled “Quality Circle. Practices to ensure and improve the
quality of schools in socioeconomically disadvantaged areas”, to identify strengths and areas of improvement for:
o Integrating SAI activities into strategic and operational management; o Using SAI expertise and resources for institutional development and quality
improvement; o Extending SAI results horizontally, vertically and by developing new partnerships,
programmes and activities. • Preparing the programme titled “Social inclusion through the provision of integrated services at
community level” (Bacău County).

Page 50 of 198
In the case of the Teaching component, the following activities continued: face-to-face courses, school
visits to support and/or assist certain learning activities, use of the learning platform, cooperation with
county experts.
Under the Parent Counselling component, regional training sessions were carried out, good practices
were collected and shared in a creative and attractive manner for both teachers and parents (stories,
films, testimonials, journals, pictures, etc.), experience exchange activities with parents were organised,
and school-family partnerships were developed.
The Ministry of National Education, with its Directorate for Minorities, carried out a two-day
multicultural education course for non-Roma teachers and for those who do not teach the Romani
language.
The RENINCO Romania Association continued its activities meant to contribute to ensuring access to
quality inclusive education for all children, focusing on preschool children with disabilities and SEN.
These activities were: a training course for the teachers of kindergartens within the schools involved in
the Initiative, developing a situation analysis based on research (the theoretical research was carried out
in the previous year) regarding access to education for children with disabilities in SAI schools, from
kindergarten to eighth grade (Methodology completion - November of 2014, Field data collection -
November-March of 2015, Analysis, interpretation, developing the research report - April-June of 2015).
For field data collection, a detailed monitoring sheet was developed, paired with a system of indicators
monitoring inclusive education in kindergartens.
Family-level interventions were aimed at:
Running a quasi-experimental ante and post facto study to highlight the effects of parent education
(as an independent variable introduced gradually in schools) and to produce data for the
development of a public policy on parent education and children's school participation, a study
carried out by the implementing partner Holt Iași;
Developing an intervention model focusing on parent education in all the 32 schools involved in SAI
in 2014-2015, aimed at the prevention of school dropout and absenteeism.
Parent education courses were organised for teachers in every school, with parent educators from the
network as trainers, and also courses for the parents of pupils at risk of dropping out of school, held by
the teachers who had previously participated in parent education courses.
In community interventions, CRIPS repeated the county seminar “Community networks to prevent
school dropout”, but with only one seminar per county (in 2012-2013, there were two seminars per
county). Two sessions were organised, to supervise the implementation of project activities. At the local
level, with the support and involvement of county experts, children at risk of school dropout who
experienced social difficulties were monitored, and activities were organised for the development of
PAS community networks so as to identify and support children at risk of dropping out of school or those
out of school.
The "Împreună" Community Development Agency continued its activities to promote education as a
means of being successful in life, among Roma and non-Roma children and parents from SAI schools.
These activities were carried out in the 32 communities involved in SAI. Each community was visited
Page 51 of 198
twice by project team members, who, via the activities carried out, promoted the educational kit
developed by the Împreună Agency to advance diversity. The target group was made up of Roma and
non-Roma pupils from lower secondary grades, and teachers from the respective schools also
participated in these activities. During these visits, meetings and two-hour activities were held with
parents. The educational kit was promoted on several occasions in order to influence the Ministry of
National Education to decide on using the respective kit in all the Romanian schools with pupils from
vulnerable groups.
Within the School Attendance Initiative, in the 2014-2015 school year, the following were developed
and printed:
A guide to entourage positive reactions titled “A positive approach to child behaviour”, developed by Holt Iași, coordinated by UNICEF, and addressed to teachers ad professionals working with children.
“The pupil’s guide - A personal development journal”, developed by UNICEF in collaboration with the ProsperYoung.com Association.
The “School board guide - for non-tertiary educational establishments”, resulting from UNICEF’s collaboration with the Soros Romania Foundation.
The activities carried out by UNICEF and implementing partners targeted the following categories of
beneficiaries:
Over 250 schools in 39 counties and Bucharest involved in this intervention model;
More than 3,750 principals and teachers who followed different training programmes;
177 school mediators who followed training programmes;
83 trained Romani language teachers;
250 social assistance clerks or social workers trained;
Approximately 4,800 parents (direct beneficiaries).
Over 80,800 pupils (direct beneficiaries).
SAI interventions were not limited to the three previously mentioned levels, but they also aimed at
influencing/changing public policy in the field of education, and consisted of:
Adoption by the MoE and ARACIP of the methodology to identify children at high risk of dropping out of school and integrating that methodology into school participation monitoring policies (the child’s roadmap);
Including the materials developed during SAI in the curriculum proposed for the new initial teacher training system, the master’s degree in teaching;
Including the SAI model in the projects promoted by the MoE as having a significant contribution to dropout prevention;
Integrating the learning activities developed during SAI into the national curriculum for the teachers who work with pupils at risk of dropping out of school.
Influencing public policies regarding the child-friendly school concept and the new indicators regarding the quality of education, which focus primarily on child welfare and the safety of the school environment.
Page 52 of 198
3. EVALUATION PURPOSE, OBJECTIVES AND SCOPE
3.1 DEFINING THE PURPOSE OF SUMMATIVE EVALUATION IN RELATION TO FORMATIVE
EVALUATIONS
The summative evaluation of SAI was designed so as to capitalise on the diverse and complex experience acquired by the main actors and beneficiaries of SAI interventions, at the level of the 32 schools participating in the Initiative for three years and of intervention partners. The ‘national’ nature of the final evaluation is given by the territorial coverage, with the 32 school communities, and by the areas of intervention, as it was thought out by means of the organic model it assumed. The ‘summative’ nature comes from the final position of the evaluation stage, after intervention implementation stages, aiming mainly at the effects, outcomes and impact elements which can be highlighted at the end of the intervention stage. Having been designed as a summative evaluation, it sets out to also highlight the meaningful contribution of annual formative evaluations carried out during SAI, as representative milestones for the organic development of SAI.
Considering that the summative evaluation was carried out immediately after SAI implementation, it:
Aimed mainly at analysing the implementation of the components from the perspective of outcomes compared to initial objectives (structured annually based on the projects proposed by each implementing partner);
Sought to quantify outcomes by:
o Carrying out a quantitative and qualitative performance analysis;
o Identifying the lessons learned (good practices and limitations) after the implementation of the interventions, in order to formulate conclusions and recommendations for specific public policies, for the sustainability of SAI achievements as well as for replicating the identified elements of success on a different track.
The summative evaluation was meant to cover a complete four-year learning cycle (2011-2015). UNICEF
and its partners set out to evaluate the way in which the components of the School Attendance Initiative
reached their proposed objectives, both collectively and separately, in the current context of the
Romanian education system.
The main beneficiaries of the summative evaluation are the Ministry of National Education, UNICEF and
its implementing partners.
The summative evaluation of the interventions carried out during UNICEF’s School
Attendance Initiative, between September 2001 and June 2015, aims at estimating the
impact elements of the SAI model in:
Addressing the challenges faced by the group of children defined as “at risk of school dropout” (girls and boys);
Accessing inclusive and quality education.

Page 53 of 198
UNICEF will use the summative evaluation evidence to promote and offer technical assistance to the
Ministry of National Education in developing and modifying the educational policies regarding the
prevention of school dropout, absenteeism and early school leaving (for example, by using a uniform
definition of school dropout, by introducing specific action plans for the prevention of absenteeism,
dropout and early school leaving in the institutional development plan of every school) and will
contribute to the national efforts to achieve the targets set for Romania under the EU 2020 Strategy.
Additionally, the findings of the summative evaluation will be used by UNICEF as documentation for the
pilot project in Bacău County, a project that combines interventions in education, social protection and
health to prevent and reduce school dropout and the separation of children from their families and to
increase access to education, medical care and social protection services at community level.
All partners will benefit from the conclusions and recommendations they need to continue their own
research, interventions, and advocacy activities. The secondary evaluation audience consists of county
and local authorities.
The local authorities will use the findings of the evaluation for an integrated approach to preventing
school absenteeism and dropout (for example, by effectively employing the community
networks/community advisory boards committees, involving the social worker in the prevention of
school dropout).
UNICEF and its partners will be in charge of result dissemination and ensuring that all stakeholders are
informed.
In conclusion, the main goal of this evaluation was to identify the impact of the School Attendance Initiative on dropout prevention and reduction as well as on reducing absenteeism rates in the communities where interventions were carried out.
3.2 EVALUATION OBJECTIVES AND QUESTIONS, SCOPE AND LIMITATIONS
3.2.1 Evaluation objectives
In order to achieve the aforementioned goal, the summative evaluation set the following general objectives:
GO1. Identify the impact of the School Attendance Initiative, carried out between 2011 and 2015, regarding school dropout and absenteeism, on the 32 schools included in the evaluation.
GO2. Identify the efficiency and effectiveness of the Initiative from the perspective of all intervention components.
GO3. Identify transferable examples of good practice and provide lessons learned, for the implementation of the new integrated model of social services in Bacău County.
GO4. Identify certain limitations and constraints regarding the implementation of SAI components in schools, families, communities.
GO5. Generate relevant information for decision-makers, supporting local, regional and national policy development to prevent and diminish school dropout and absenteeism.

Page 54 of 198
The specific objectives, subsequent to general objectives, aim at evaluating SAI impact regarding all the
components of the Theory of Change (ToC) that the School Attendance Initiative13 is based on, and
regarding the aspects mentioned in the Terms of Reference for Independent External Evaluators (TOR)14:
Evaluating SAI development, dynamics and outcomes for the entire duration of SAI implementation (2011-2015);
Observing the different components implemented in the Initiative during September 2010 - September 2015, with a results-based approach;
Identifying the main achievements of SAI implementation, in relation to objectives, opportunities and limitations encountered in the implementation, and to the lessons learned from the evaluations of implementing partners;
Highlighting the most efficient elements that could be placed at the core of future broad interventions;
Choosing elements of success that should be integrated in relevant public policies;
Identifying the complementarity with other initiatives and sustainability opportunities, in the current national context of education and in accordance with European guidelines;
Evaluating SAI outcomes also from a gender and ethnic perspective, and assessing whether the intervention offered improvements (Has SAI approached gender and ethnic disparities regarding school dropout, absenteeism and the participation phenomena in an effective and efficient manner?);
Analysing the ethical aspects considered and promoted by SAI.
The specific objectives15 aim at identifying the most important functional elements of the School Attendance Initiative, rolled out by UNICEF Romania, in light of all the factors that may lead to adapting and strengthening the SAI strategy, involving both its sustainability and the potential for developing the model into a new dimension (the integrated model of social services at county level).
In this context, the evaluation set out to measure the outcomes and value of the intervention compared
to a group of witness schools (a control group), with similar characteristics to those included in the
Initiative, but in which the UNICEF intervention was not carried out.
3.2.2 Evaluation questions. Scope of the evaluation
Considering the specific needs of the beneficiary, via the terms of reference, the summative evaluation
sought to analyse the outcomes and the impact produced by SAI activities. That required the
operationalisation, analysis and interpretation, according to TOR16, of the following aspects:
SAI dynamics and outcomes, from 2011 to its completion in June 2015;
SAI performance, especially regarding the effectiveness and efficiency of the actions implemented by partners, in relation to the objectives of their intervention projects;
The extent to which the ethical aspects were considered and promoted in the Initiative;
The opportunities and constraints encountered while implementing the activities.
13 Annex 8 14 Annex 1 15 Annex 4 Evaluation Methodology, pages 4-5 16 Annex 1, Terms of Reference (TOR), page 17

Page 55 of 198
The evaluation findings, in terms of the aspects documented in the quantitative and qualitative analysis, were used in three directions, to:
Identify relevant key lessons for developing future interventions inspired by the School Attendance Initiative;
Formulate recommendations based on data, to inform/influence educational policies aimed at reducing and fighting the school dropout phenomenon and at increasing school participation, including through the integrated school-family-community intervention;
Create a collection of “lessons learned” and relevant good practices that could contribute, via specific actions and measures, to the decrease of absenteeism and school dropout at the county or national level.
The evaluation focused on the following questions, aimed at formulating answers to the questions of the Terms of Reference for Independent External Evaluators (TOR) and of Annex B of the aforementioned document17, as follows:
1. How effective has SAI been in reducing the risk of dropping out and dropout rates in the schools involved?
2. Have SAI interventions produced management changes in the schools involved, regarding the implementation of strategies for school dropout prevention/control and the development of school-community partnerships?
3. Has SAI produced changes in the instructional strategies used by teachers in their day-to-day activities?
4. Has SAI produced changes in the teacher-pupil relationship and the teacher-parent relationship?
5. Has SAI produced changes in parents’ attitude towards education?
6. Has SAI produced changes regarding parents’ involvement in school life?
7. Has SAI produced changes in the community so as to contribute to the reduction of school absenteeism and dropout?
8. Are SAI interventions sustainable in the schools involved?
The eight evaluation questions were formulated so as to allow, using the analysis of the data collected, the summative evaluation of SAI, based on the evaluation criteria (relevance, efficiency, effectiveness, impact, sustainability, and coherence) and to answer the 31 questions grouped by evaluation criteria in the Terms of Reference18 and the 36 questions grouped by SAI components19.
The analysis of the questions formulated determined two directions: the systemic analysis and interpretation of the qualitative and quantitative data collected from schools participating in the Initiative, and analysis and interpretation of SAI evidence, linked to TOR criteria (relevance, effectiveness, efficiency, sustainability).
3.2.3 Evaluation limitations
17 Annex 1, pages 18-20, and Annex B to Annex 5. 18 Annex 1, pages 18-20 19 Annex 1 TOR-Annex B
Clarification:
The summative evaluation set out to offer conclusions in terms of impact or changes brought about by SAI in those situations where reference data was available or additionally collected, regarding:
The previous SAI stages (related to the initial evaluation of the schools involved in the Initiative and/or previous formative evaluations);
The schools in the control group.
Page 56 of 198
Although the methodology developed for the summative evaluation ensures the degree of objectivity
and plausibility of the conclusions imposed by the requirements of the Terms of Reference, it is
necessary to indicate below certain aspects that may influence their validity. In that sense, the aspects
mentioned in TOR20 are:
Incomplete official data regarding the participation of Roma children in education;
Fragmented and incoherent official data regarding children with special educational needs (some official data includes only children that have a disability certificate, others also include other children with special educational needs without a disability certificate).
Teacher turnover - it is possible that, in certain schools, some of the teachers or principals who were trained in various training programmes during SAI no longer work in those schools.
The complexity of complementary interventions ran by SAI implementing partners, as well as of SAI global targets.
There are also other aspects, apart from those signalled in TOR.
o The conclusions of the formative evaluations carried out during SAI highlighted the fact that the
assessment of the effectiveness and efficiency of certain intervention components can be greatly
influenced by aspects pertaining to the local context, and not to the intervention itself. For
example, school management turnover - the change of principals, in this case - has direct and
multiple effects both on the global effectiveness of the school management component
(management training participants, IDP developers, active feedback involvement, etc.) and, in
certain cases, on the school's further participation and involvement in the Initiative.
o One of the visible SAI outcomes is the production of multiple series of data, indexes and indicators
on different levels of the education system. It is necessary to point out, on the one hand, the
incomplete nature of some of the data series and, on the other hand, the quality distortions
identified in the data necessary to assess the efficiency of the interventions.
o Some of these distortions are due to the interpretation that the people in charge give to the indexes
and indicators reported at the moment of monitoring and reporting. In many situations, the actors
involved interpret the term “school dropout” or the criteria used in this project to define school
absenteeism differently. In this case, we think that one of the limitations of the final evaluation
should be considered not so much the insufficiency of data or a possible conceptual ambiguity, as
the impossibility to estimate or control the consistency of reporting agents’ interpretation of the
meaning of the terms “dropout”, “absence monitoring”, “monitoring mechanisms”, etc.
o Another aspect that should be mentioned is the fact that, at the moment of SAI completion, the
assessment of SAI impact on direct beneficiaries is influenced, in a way that is difficult to estimate,
by the aspects pertaining to the medium- and long-term effects of some of the components (for
example, the training component), effects that may crystallise differently over time, including after
the intervention implementation period covering a level of education.
o Also, it is important to mention the fact that the actual SAI participation of the 32 schools
considered in the summative evaluation was of three years, which does not represent a full level of
20 Annex 1, page 18

Page 57 of 198
education for these communities, from the perspective of the specific ethos and possibilities to
realistically assess changes at this level.
3.3 EVALUATION CRITERIA. ADOPTED PERFORMANCE STANDARDS
According to the requirements comprised in the Terms of Reference21, the summative evaluation considered from the very beginning the relevance, effectiveness, efficiency and sustainability criteria with regard to results, added value, and consistency.
Relevance of SAI and its interventions In the analysis, while formulating the conclusions and identifying the lessons learned, the emphasis was on the following aspects:
The added value of the SAI intervention, in relation to:
o The needs of the children at risk of absenteeism and school dropout, coming from vulnerable groups;
o National priorities, identified in international standards, centred on ensuring educational equity;
o Limited resources both in the education system and in the other systems (social assistance, child protection, etc.).
Assessing the opportunities of the intervention model, in light of the information offered by specialised literature and the current experience of other initiatives in progress, and in light of the limited resources in the context of the economic crisis;
The extent to which the model implemented in the intervention tackles the key problems affecting children from vulnerable groups, relevant to SAI, in view of the minimum financial resource allocation (realistic allocation) and the maximum impact expected;
The relevance of the intervention, from the perspective of the gender and ethnicity analysis.
In regard to SAI assessment from the perspective of outcomes and effectiveness criteria, the analysis focused on assessing the degree of achievement of SAI-specific objectives, looking at:
Whether the intervention set results-oriented objectives for itself (specific, measurable, attainable, relevant and time-bound);
The indicators planned to monitor the intervention performance and the way in which they were used;
The extent to which the results reached correspond to the objectives set;
Whether or not the intervention reached the children in the target group, and especially:
o The main limitations that did not allow the intervention to reach these groups of children (only if that is the case);
o The changes produced by each component of the intervention;
o The factors that could explain the success of the intervention.
The effect-used resources relationship (efficiency of the intervention) sought to estimate the way in which the available (human, material and time) resources were used so that the activities carried out during SAI participation could reach the expected results. In assessing the extent to which the different activities turned the available resources into expected results, the focus was on identifying:
21 Annex 1, pages 18-20

Page 58 of 198
The real (total) cost of the intervention in the case of the children at risk of school dropout and absenteeism;
The extent to which the resources were optimally used in the Initiative so as to obtain results; for that purpose, a comparison will be made with other education interventions similar to the different SAI components (LLP, Erasmus+, SOP HRD);
The sustainability of the intervention, that is, continuing to obtain the positive results of intervention components and the flow of benefits, after external financing ceases, is assessed based on the following aspects:
Financial sustainability, for example whether the intervention or its influences on children from
the most vulnerable groups can continue even after UNICEF support is withdrawn.
Identifying the sustainable effects on the children who benefited from SAI;
The possibility of replicating the intervention model, with or without subsequent adaptations, in other schools with a high rate of absenteeism and school dropout.
Also, the aspects regarding the value added by SAI were addressed by comparing the situation in similar schools in which there was no UNICEF intervention under the School Attendance Initiative.
Last but not least, assessments were made regarding the consistency among the different SAI components, the level of knowledge of all the components included in the integrated intervention model across schools, local communities and other stakeholders, as well as to the synergy between the different components of the intervention.
3.4 GENDER AND HUMAN RIGHTS ISSUES
The summative evaluation set out to systematically and transparently reflect the aspects regarding gender and human rights issues, as projected at the level of each SAI component and intervention.
The conclusions and recommendations formulated for these two specific issues in the formative evaluation at the end of each SAI year were analysed and integrated.
4. METHODOLOGY
4.1 DATA COLLECTION METHODS, ANALYSIS METHODS, RATIONALE FOR SELECTION AND
LIMITATIONS
The evaluation methodology designed for the summative evaluation aimed, on the one hand, at
collecting information on implemented processes and the outcomes, effects and benefits obtained
under the School Attendance Initiative and, on the other hand, at analysing and interpreting this data in
the sense of identifying medium- and long-term perspectives for national policies and programmes
meant to reduce school dropout and absenteeism in Romanian non-tertiary education pupils.
The complexity of the final evaluation designed for this initiative is given by the social and educational
context of the School Attendance Initiative, a context characterised by:
Diversity of:
Intervention components;
Implementing partners, regarding:

Page 59 of 198
The different institutional and organisational skills of implementing partners and
implementing agents, respectively22;
Intervention implementation, monitoring and evaluation;
The levels of involvement in SAI activities of the teams from target schools and
communities;
Specific issues related to different groups of beneficiaries.
In this context, in order to reach the objectives of the summative evaluation, with optimum use of
human and time resources allocated for the activities, the methodological challenge consisted of
selecting and using the most adequate analysis methods in order to capitalise, explore and exploit all the
data sources available at the end of SAI.
For the summative evaluation of the School Attendance Initiative, the proposed evaluation methodology
sought to:
Combine, in a balanced manner, quantitative and qualitative evaluation methods so as to use
complementary methods and sources and to ensure data objectivity and validity.
Pursue, as far as possible, those key aspects of the intervention that aim at respecting human
and children's rights and ensuring equal opportunities as provided for in:
o The Convention on the Rights of the Child and UNICEF guidelines regarding the
participation of children in programmes, evaluations and research;
o National Education Law no. 1/2011, as subsequently amended and supplemented;
o Law no. 272/2004 regarding the protection and promotion of children's rights.
The methodological approach to the summative evaluation considered a specific combination of
quantitative and qualitative methods, for the purpose of achieving complementarity and balance.
The quantitative analysis methods were selected and used in accordance with the Terms of Reference23
to synthesise and present the data collected and to formulate empirically supported conclusions.
Quantitative methods involved the analysis of the data obtained via:
Application of questionnaires to principals, teachers, pupils and parents from the 32 schools
involved in the summative evaluation, to establish the number of direct and indirect SAI
beneficiaries;
Application of questionnaires to principals, teachers, pupils and parents from the schools in the
control group, to set the basis for comparison;
Comparative analysis of the data from interim and final reports, meetings, consultations and
documents presented by implementing partners with official data (the 2014 Eurydice report -
Tackling Early Leaving from Education and Training in Europe: Strategies, Policies and
Measures), as well as with data available from other studies, referring to the education system,
evaluations and studies developed in similar projects implemented by other
institutions/organisations.
22Parent educators; trainers, school inspectors, county/regional experts, CREAC/DGASPS experts, school/health mediators, social assistance clerks, etc. 23 Annex 1 pages 22-24

Page 60 of 198
Using qualitative methods, the information obtained during field visits and meetings with different types
of stakeholders involved in SAI was capitalised. These activities were carried out by the members of the
evaluation team as follows:
Following discussions conducted with:
o Intervention beneficiaries (pupils at risk of dropping out, parents and teachers of these
pupils, principals of the 32 schools involved in the summative evaluation);
o The people involved in implementing the different components (teachers, primary
school teachers and educators of the 32 schools involved in the evaluation, pupils,
parents, school mediators, social assistance clerks/workers, DGASPS representatives,
CREAC representatives, etc.);
o MoE representatives;
Based on participatory or non-participatory observations.
The information was analysed and subsequently organised by subject, with a view to developing the
planned analyses and case studies.
With the help of qualitative methods, the various areas of SAI intervention were studied in depth to
describe all aspects that could be relevant for understanding the Initiative. The information supplied,
mainly, by the beneficiaries generated specific data that complemented the data identified using
quantitative methods.
Using qualitative methods:
Descriptions were made regarding SAI organisation and functioning and the learning
experiences of the people involved in the Initiative, thus offering a more complex image of the
Initiative;
The priority was finding plausible answers to the following questions:
o How did SAI interventions work?
o What is the perception of SAI participants (how pleased they were with SAI development
or results; what everyone's role was; the main critical points and their causes; the main
strength and weaknesses of the intervention; success elements of the intervention)?
o How were SAI activities carried out in schools?
In order to address the training component of SAI, the evaluation model of the training programmes,
created in 1959 by Donald Kirkpatrick and later developed by Hamblin, was specifically
operationalised24.
This model structures the evaluation of training programmes into four levels: Table 4 1 Evaluation levels according to the Kirkpatrick model
Level 1: Reaction Identifying the participants’ reaction to the training programme. (The data collected at the end of the
training cycle, complemented by other data collected ad hoc, was analysed)
Level 2: Learning Evaluating the degree of achievement of the training programme's learning objectives
24 See: A.C. Hamblin (1974). A C., “Evaluation and Control of Training”, McGraw Hill. Also: Warr P., Bird M. and Rackcam N., (1978). “Evaluation of Management Training”. London: Gower and Bramley, P. (1996). “Evaluating training effectiveness” Maidenhead: McGraw-Hill.
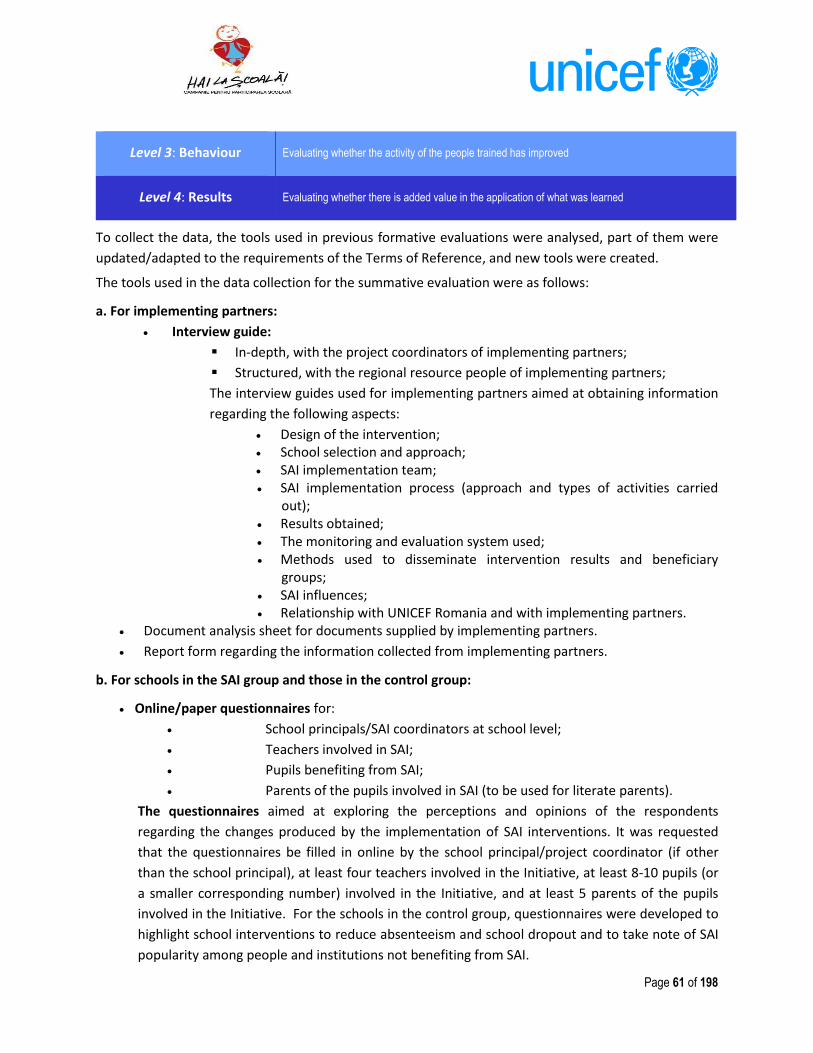
Page 61 of 198
Level 3: Behaviour Evaluating whether the activity of the people trained has improved
Level 4: Results Evaluating whether there is added value in the application of what was learned
To collect the data, the tools used in previous formative evaluations were analysed, part of them were
updated/adapted to the requirements of the Terms of Reference, and new tools were created.
The tools used in the data collection for the summative evaluation were as follows:
a. For implementing partners:
Interview guide:
In-depth, with the project coordinators of implementing partners;
Structured, with the regional resource people of implementing partners;
The interview guides used for implementing partners aimed at obtaining information
regarding the following aspects:
Design of the intervention; School selection and approach; SAI implementation team; SAI implementation process (approach and types of activities carried
out); Results obtained; The monitoring and evaluation system used; Methods used to disseminate intervention results and beneficiary
groups; SAI influences; Relationship with UNICEF Romania and with implementing partners.
Document analysis sheet for documents supplied by implementing partners.
Report form regarding the information collected from implementing partners.
b. For schools in the SAI group and those in the control group:
Online/paper questionnaires for:
School principals/SAI coordinators at school level;
Teachers involved in SAI;
Pupils benefiting from SAI;
Parents of the pupils involved in SAI (to be used for literate parents).
The questionnaires aimed at exploring the perceptions and opinions of the respondents
regarding the changes produced by the implementation of SAI interventions. It was requested
that the questionnaires be filled in online by the school principal/project coordinator (if other
than the school principal), at least four teachers involved in the Initiative, at least 8-10 pupils (or
a smaller corresponding number) involved in the Initiative, and at least 5 parents of the pupils
involved in the Initiative. For the schools in the control group, questionnaires were developed to
highlight school interventions to reduce absenteeism and school dropout and to take note of SAI
popularity among people and institutions not benefiting from SAI.
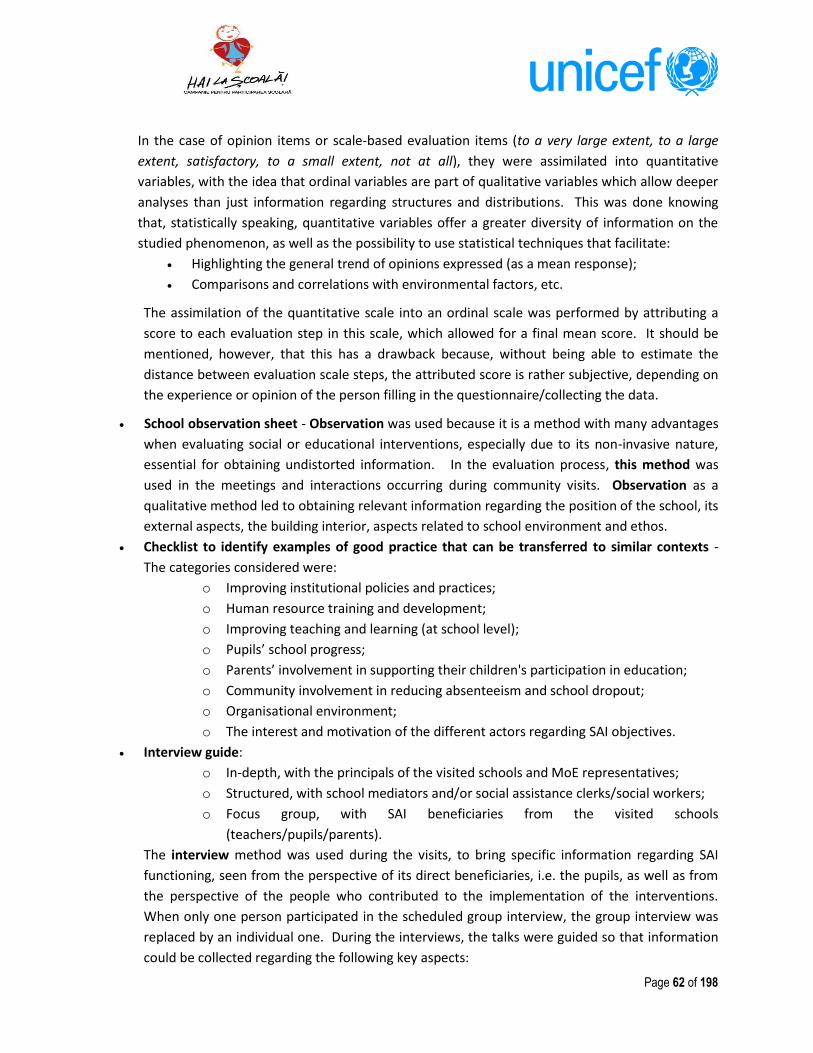
Page 62 of 198
In the case of opinion items or scale-based evaluation items (to a very large extent, to a large
extent, satisfactory, to a small extent, not at all), they were assimilated into quantitative
variables, with the idea that ordinal variables are part of qualitative variables which allow deeper
analyses than just information regarding structures and distributions. This was done knowing
that, statistically speaking, quantitative variables offer a greater diversity of information on the
studied phenomenon, as well as the possibility to use statistical techniques that facilitate:
Highlighting the general trend of opinions expressed (as a mean response);
Comparisons and correlations with environmental factors, etc.
The assimilation of the quantitative scale into an ordinal scale was performed by attributing a
score to each evaluation step in this scale, which allowed for a final mean score. It should be
mentioned, however, that this has a drawback because, without being able to estimate the
distance between evaluation scale steps, the attributed score is rather subjective, depending on
the experience or opinion of the person filling in the questionnaire/collecting the data.
School observation sheet - Observation was used because it is a method with many advantages
when evaluating social or educational interventions, especially due to its non-invasive nature,
essential for obtaining undistorted information. In the evaluation process, this method was
used in the meetings and interactions occurring during community visits. Observation as a
qualitative method led to obtaining relevant information regarding the position of the school, its
external aspects, the building interior, aspects related to school environment and ethos.
Checklist to identify examples of good practice that can be transferred to similar contexts -
The categories considered were:
o Improving institutional policies and practices;
o Human resource training and development;
o Improving teaching and learning (at school level);
o Pupils’ school progress;
o Parents’ involvement in supporting their children's participation in education;
o Community involvement in reducing absenteeism and school dropout;
o Organisational environment;
o The interest and motivation of the different actors regarding SAI objectives.
Interview guide:
o In-depth, with the principals of the visited schools and MoE representatives;
o Structured, with school mediators and/or social assistance clerks/social workers;
o Focus group, with SAI beneficiaries from the visited schools
(teachers/pupils/parents).
The interview method was used during the visits, to bring specific information regarding SAI
functioning, seen from the perspective of its direct beneficiaries, i.e. the pupils, as well as from
the perspective of the people who contributed to the implementation of the interventions.
When only one person participated in the scheduled group interview, the group interview was
replaced by an individual one. During the interviews, the talks were guided so that information
could be collected regarding the following key aspects:

Page 63 of 198
Participants’ perception regarding the quality and usefulness of the training
activities;
Use of the active methods learned during curricular and extracurricular activities;
Preparation of institutional development plans (IDP) by principals, according to
requirements, and integration of the intervention into the IDP;
Execution and usefulness of the following types of activities:
Parent counselling; parent education;
Actions carried out within the community network;
Participating in the “Joy of Learning” contest;
Using the learning platform developed by IES;
Experience exchange between schools;
Policy on institutional development through project involvement;
Awarding microgrants;
The “What do you want to be when you grow up?” caravan campaign;
Intervention relevance for the individual needs of each school;
Motivation for SAI involvement.
The main goal of the interviews was, on the one hand, the detailed capture of the
respondents’ perceptions, experiences and reactions and, on the other hand, the validation
of the information obtained from document analysis.
Data checklist regarding the characteristics of participating schools that are relevant to SAI
(initial, interim and final data).
Forms for:
Reports on the information collected in the visited schools;
Descriptions/presentations of examples of good practice.
c. For SAI:
Intervention map – detailing, by year, the intervention components that the schools involved in
the Initiative benefited from25
Five case studies
The case studies sought to present specific particularities, relevant for SAI implementation, at
the level of school communities. This method is applied to identify cause-effect relationships
that can explain the studied phenomenon and to give a descriptive picture of the evaluated
initiative that outlines the profile necessary for understanding the intervention. It also seeks to
identify the examples of “good practice” and “lessons learned” in the Initiative.
The five case studies addressed mainly aspects regarding:
Modifying institutional policies and practices;
Human resource training and development;
Improving teaching and learning (at school level);
Pupils’ school progress;
25 Annex 6

Page 64 of 198
Parents’ involvement in supporting their children's participation in education;
Improving the relationship between parents and children;
Increasing children’s self-esteem and educational aspirations;
Community involvement in reducing absenteeism and school dropout;
Attitude and behaviour of the actors involved;
Organisational environment;
The interest and motivation of the different actors regarding SAI objectives;
Stakeholder collaboration.
Policies for reducing absenteeism and school dropout influenced by the School Attendance
Initiative.
The model instruments used to collect information for the summative evaluation of SAI are presented in
the annexes to this report.
The following tables contain information regarding the number and type of instruments used to collect
data from the 32 communities involved in the Initiative, from implementing partners and from the
schools in the control group.
Table 4 2 Summary of instruments used for quantitative evaluation methods
Instrument used Number of completed
questionnaires26 Questionnaire for school principals involved in SAI 32
Questionnaire for school principals from the control group 2827
Questionnaire for teachers involved in SAI 278
Questionnaire for teachers from the control group 271
Questionnaire for pupils of SAI schools 396
Questionnaire for pupils of the schools in the control group 287
Questionnaire for parents of the pupils from SAI schools 250
Questionnaire for parents of the pupils from the schools in the control
group 266
Table 4 3 Summary of instruments used for qualitative evaluation methods
Instrument used Number of interviews
Number of participants
Guide for in-depth interview with the project coordinators of
implementing partners 9
13
Guide for interview with resource people 4 4
Guide for in-depth interview with the principals of the schools
involved in the project and with MoE representatives 33
3328
Guide for interview with school principals from the control group 29 34
Guide for structured interview with school mediators and/or social
assistance clerks/social workers 7 7
Guide for focus group interview with teachers from SAI schools 32 268
Guide for focus group interview with pupils from SAI schools 32 361
Guide for focus group interview with parents of the pupils from SAI
schools 32 243
26All data collected can be found in the xls files from Annex 6 - Database 27Two of the principals from the 29 control schools visited (the schools in Gropeni and Lisa) did not complete their questionnaires and, in the case of the school in Tătărăștii de Sus, both the principal and the vice-principal completed the questionnaire. 2832 interviews with project managers or coordinators from SAI schools and one interview with a MoE representative

Page 65 of 198
Reference indicators and benchmarks
In order to evaluate SAI, considering both the logical matrix of the interventions and that of the
evaluation process, several categories of indicators were defined:
Input indicators, meant to highlight whether the existing resources made possible the execution
of the activities (contractual arrangements, material, human and time resources):
o The school’s area of residence (urban/rural) and location - data collection via questions
4 and 5 of the questionnaire for school principals;
o Schools’ facilities - data collection via questions 8, 9 and 10 of the questionnaire for
school principals, question 4 of the questionnaire for teachers, the observation sheet,
questions asked during interviews with principals and teachers;
o School population - information collected via question 6 of the questionnaire for school
principals;
o Available human resources - data collection via: questions 11 and 12 of the
questionnaire for school principals, question 10 of the questionnaire for teachers,
questions asked during interviews with representatives of implementing partners,
county experts, community representatives;
o Teaching materials, available and used in SAI interventions - information collected via:
Questions asked during interviews/meetings with school principals, teachers,
pupils, parents, representatives of implementing partners, UNICEF
representatives;
Document analysis: materials received from UNICEF, reports from implementing
partners and schools;
Motivation/need for SAI involvement - information collected via: questions 14
and 16 of the questionnaire for school principals, question 13 of the
questionnaire for teachers, questions for teachers, principals, community
representatives during interviews;
Motivation for parent participation in SAI activities - information collected via
question 22 of the questionnaire for parents;
Causes of absenteeism and school dropout from pupils’ perspective -
information collected via questions 9, 10, 11 and 12 of the questionnaire for
pupils.
Process indicators meant to highlight the way in which SAI interventions/activities were carried
out:
o Level of satisfaction of participants in activities/courses - information collected via:
Question 9 on the questionnaire for teachers, question 20 of the questionnaire
for parents, questions asked during interviews with principals, teachers, school
mediators, parents, pupils;
Analysis of the reports from implementing partners;
o Content of the activities/interventions - information collected via:

Page 66 of 198
Participation in two meetings of implementing partners and discussions with
representatives of implementing partners, county experts (CREAC, GDSACP);
Analysis of the documents supplied by UNICEF, implementing partners and
participating schools (reports, training packs, implementation plans, materials
developed for activities, materials developed during activities and observed
during school visits);
Participation in the meeting that evaluated the activity of the county experts
belonging to the implementing partner CRIPS.
o Participation and level of involvement in SAI of the different actors/beneficiaries -
information collected via: question 15 of the questionnaire for school principals,
questions 7 and 8 of the questionnaire for teachers, question 16 of the questionnaire for
pupils, questions 19 and 23 of the questionnaire for parents, questions asked during
interviews with implementing partners, principals, teachers, parents, pupils, community
representatives, county experts.
o Perception of the collaboration with implementing partners and local community
representatives during SAI - information collected via: question 17 of the questionnaire
for principals, question 14 of the questionnaire for teachers, questions to interview
participants (implementing partners, principals, teachers, community representatives,
local/county experts).
Output indicators, to assess whether the activities were carried out according to expectations
and whether they produced the expected outputs:
o Number of activities organised during interventions at every level (school, family,
community, cross-cutting) - information collected via reports and Power Point
Presentations from implementing partners;
o Number of participants in activities - information collected from lists of participants,
reports and Power Point Presentations from implementing partners;
o Number of schools involved in SAI;
o Types of interventions at the level of the schools involved SAI;
o Number of principals, teachers, local/county experts, community representatives, social
assistance clerks and social workers, parent educators trained in the fields in which
training was carried out during SAI (management, teaching, parent counselling, skill
development for working with children with disabilities and/or special needs,
multicultural education, Romani language teaching, parent education, etc.);
o Number of pupils at risk of dropping out of school identified and monitored;
o Number of parents participating in parent counselling activities;
o Number of parents benefiting from parent education courses;
o Number of training packs developed;
o Number of studies performed;
o Number of parent and parent educator portfolios developed;
o Number of people participating in activities organised to understand the importance of
education and to increase pupils’ and parents’ self-respect and self-confidence;

Page 67 of 198
o Number of guides developed.
All this information was collected from the analysis of the materials supplied by UNICEF,
implementing partners and SAI schools and from all the types of interviews conducted.
Outcome indicators, meant to highlight the changes produced in the target groups
o Absenteeism rate and its variation from the start of SAI to its conclusion - data supplied
by UNICEF for the schools involved in the Initiative for three years;
o School dropout rate and its variation from the start of SAI to its conclusion - data
supplied by UNICEF for the schools involved in the Initiative for three years;
o Parents with improved skills in communicating with their children - information
collected from the perception of parents and pupils, question 9 of the questionnaire for
pupils, question 11 from the questionnaire for parents, questions asked during
interviews with pupils and parents;
o Parents with increased confidence in the role of education in the future of their children
- information collected via question 11 of the questionnaire for parents, question 9 of
the questionnaire for pupils, question 19 of the questionnaire for school principals,
question 5 of the questionnaire for teachers, questions asked during interviews with
school principals, teachers, pupils, parents;
o Operational PAS networks - information collected via questions 12 and 19 of the
questionnaire for school principals, question 10 of the questionnaire for teachers,
questions asked during interviews with school principals, teachers, community
representatives, CRIPS representatives and during the summative evaluation session
aimed at the intervention ran by CRIPS, GDSACP representatives and county trainers;
o Pupils who understand the role of education and want to continue their studies -
information collected via: question 19 of the questionnaire for school principals,
question 5 of the questionnaire for teachers, questions 8, 9 and 13 of the questionnaire
for pupils, questions asked during interviews with principals, teachers and pupils;
o Teachers with improved teaching skills - information collected from the perceptions of
what they learned and, in the case of the school principal, also of what teachers learned,
via: question 19 of the questionnaire for school principals, question 14 of the
questionnaire for teachers, questions asked during interviews with principals, teachers,
IES representatives;
o Principals with improved management skills - information collected from their own
perceptions via question 18 of the questionnaire for school principals;
o Procedural resources developed in schools: statements from school principals and
teachers regarding the existence of procedures for school dropout control, support
procedures for pupils with difficulties adapting, procedures for absence control, pupil
support procedures - information collected via: question 20 of the questionnaire for
school principals and question 15 of the questionnaire for teachers;
Impact indicators meant to highlight long-term changes produced by SAI at the level of the
individual, the institutions involved and the system:

Page 68 of 198
o Friendly and welcoming SAI schools, indicator that contains the following predictors:
Pupils’ perception of school climate;
School safety, general level of satisfaction with school;
Extent to which they feel rejected at school;
Relationship with classmates;
Relationship with teachers;
Attachment to school.
Information collected via questions 7 and 8 of the questionnaire for pupils and from
interviews with pupils and parents.
o Improved teaching practices in schools - information collected via questions 7, 8 and 9
of the questionnaire for pupils, questions asked during interviews with principals,
teachers, pupils, parents and from the analysis of pupils’ school results;
o Number and content of evidence-based recommendations to influence public policies -
information collected via documents/materials supplied by UNICEF and implementing
partners, and from interviews with implementing partners;
o Improved interinstitutional cooperation in SAI communities - information collected via
interviews with implementing partners, school principals, local community
representatives, county experts and from meetings with UNICEF representatives.
Since much of the information collected reflects perceptions and is affected by errors, in order to
evaluate SAI outcomes and impact, a control group was used, made up of 29 schools not involved in SAI,
and benchmark indicators were developed.
The indicators developed are:
o Institutional infrastructure which includes:
o External institutional support manifested by:
Parents;
Community;
SPAS;
GDSACP;
Mayoralty;
Minority inspectors from CSIs;
CREAC counsellors.
Information is collected via questionnaires for school principals and teachers.
o Procedural resources developed in schools (described under outcome indicators);
o Internal and external aspect of the school;
o Teacher satisfaction with the training activities in which they participated;
o Use of ICT in the teaching activity;
o Teaching skills developed by teachers during training activities;
o Pupils’ perception of school climate;
o Pupils’ perception of their relationship with classmates;
o Pupils’ perception of their relationship with teachers;

Page 69 of 198
o Extracurricular activities carried out.
4.2 DATA SOURCE TRIANGULATION, DIVERSITY OF PERSPECTIVES, DATA ACCURACY AND
OVERCOMING DATA SOURCE LIMITATIONS
The methodological design of the summative evaluation aimed at the School Attendance Initiative
considered the complexity of the intervention from the perspective of participants, actors, partners,
intervention period, so as to ensure a diversity of perspectives from both actors and beneficiaries.
The adopted methodology includes a mix of combined quantitative and qualitative methods, so as to
highlight the complexity of the educational reality observed in the 32 schools at the end of their three-
year participation in the School Attendance Initiative.
Therefore, in designing the final evaluation, it became necessary to adopt and respect the Triangulation
Principle, expressed via a strategy to approach data starting from the premise that the educational
reality is not only multiple and diverse, but also subject to the influence of a multitude of factors
impossible to completely classify and quantify. In turn, these factors, acting over time in different ratios,
manners and configurations at the level of learning communities, outline the dynamics of the
educational reality that is determined by the broader social context. In order to explore these complex
dynamics, it is necessary to combine several theoretical and methodological approaches, as well as to
generate, explore and capitalise on several data sources, for the purpose of creating a valid and faithful
picture of the investigated educational reality29.
In this context, for the summative evaluation of the School Attendance Initiative, data source
triangulation involved several dimensions:
Time dimension - the data series were collected at different moments of the schools’
participation in the Initiative (initially, during and at the end);
Spatial dimension - the data series covered all the 32 schools participating in the Initiative for
three years, representing 19 counties and coming from both rural and urban areas;
Comparative dimension - the data series collected “at the end” were also gathered from the
schools in the control group, having been selected based on the same validation criteria as
those applied to SAI schools;
Dynamic dimension - data from the analysis of observation reports on the climate in the visited
schools, of applied questionnaires, of in-depth interviews, of case studies performed was
designed and analysed in the wide context of indicator values based on the reports and internal
monitoring carried out during SAI.
29To get a brief picture of the concept also adopted in applied monitoring and evaluation studies, we consulted: UNAIDS Monitoring and Evaluation Fundamentals. An Introduction to Triangulation (2010) which mentions: “Triangulation extended beyond its mathematical roots in the 1970s, when it began to be used as a sociological method. In this new sector, triangulation was defined as a process of combining data from different sources to study a particular social phenomenon. In 1978, Norman Denzin identified four basic types of triangulation: (1) data triangulation: the use of multiple data sources in a single study; (2) investigator triangulation: the use of multiple investigators/researchers to study a particular phenomenon; (3) theory triangulation: the use of multiple perspectives to interpret the results of a study; and (4) methodological triangulation: the use of multiple methods to conduct a study.” (p. 13)

Page 70 of 198
The dimensions presented and endorsed in the summative evaluation confirm that the evaluation team
adopted Michael Quinn Patton’s thesis: “Different kinds of data may yield somewhat different results
because different types of inquiry are sensitive to different real-world nuances.”30 These results are
considered complementary and regarded as centrepieces of the puzzle represented by the complex
educational reality of the educational community determined by the wider context of the social reality.
All the data series were “cleansed” via verification, interrogation, supplementation and modification, as
applicable. The limitations observed concern the difficulties in identifying the pupil as a “person” within
a population, in terms of individual data relative to global indicators. This makes is difficult to monitor
“cases” along educational pathways, and individual benefits following interventions.
4.3 SAMPLING FRAME – COVERED AREA AND POPULATION, RATIONALE FOR SELECTION,
SELECTION MECHANISMS, SAMPLING LIMITATIONS
The sampling technique was used, on the one hand, to select the schools in the control group and, on
the other hand, to develop pupil samples for the application of questionnaires.
4.3.1 Setting up the control group of schools
The sampling of educational establishments in the control group started from:
The objectives of UNICEF’s School Attendance Initiative
Concerns for reducing school dropout/early school leaving/absenteeism rates at school level, in
relation to European, national and regional levels.
The existence of data sets collected following the same rules, for the Romanian schools:
Data from 2007-2009, collected by ARACIP in the 2008-2009 school year from all the
educational establishments, in order to analyse the National Educational Risk Map (NERM)
and identify the risk factors that influence pupils’ results, so as to support schools in getting
better results with their pupils.
The data reported to ARACIP by educational establishments for the 2013-2014 school year
with the purpose of verifying whether sampled educational establishments were within the
declared limits of school dropout.
The philosophy of the School Attendance Initiative aims at an integrated intervention at the level of
community, family and school to reduce school dropout. Even though it is closely monitored at
European level, Romania is among the countries with the highest rates.
The control group of schools was set up using the selection criteria for the schools involved in the School
Attendance Initiative, and the following was analysed:
The data from 2007-2009 collected by ARACIP in 2008-2009. This data was collected for 7,841
educational establishments based on a questionnaire applied by 42 county operators. Because one
of the current major problems in Romanian education is data reporting by school principals, 455
schools were invalidated, with data from 7,386 educational establishments remaining. The
validation required a high number of corrections and 5.8% of exclusions of highly problematic cases
30 Michael Quinn Patton (2002). Qualitative Research and Evaluation Methods. 3rd. edition. Thousand Oaks, California. Sage Publications, page 248

Page 71 of 198
that would have greatly influenced the evaluation. This data set was used to select the schools in the
control group.
The data reported by educational establishments on the ARACIP platform and made public via the
Annual Internal Evaluation Report (AIER) for the 2013-2014 school year on the http://aracip.eu/
platform. This data set was used to validate the selection performed with the aforementioned data.
It was decided to use the two databases because they are the only ones with data collected
nationally, following the same rules and criteria, and validated. Comparing the data specific to the
same schools in different years allowed for a better selection of the schools in the control group,
and for a confirmation that schools with the same characteristics were being considered.
The analysis was performed on three categories of indicators that may influence school results:
Context indicators,
Process indicators,
Outcome indicators.
The analysis relative to the 2007-2009 data aimed at the schools involved in the Initiative in 2014-2015
(the Group of schools from the School Attendance Initiative) and at the schools that had indicator values
close to those of the schools from the School Attendance Initiative. From the analysis carried out, 30
schools with data within the same range were selected for the control group and were processed with
data collection instruments similar to those applied in SAI schools.
The condition was that the control group should not contain educational establishments where UNICEF
had carried out SAI-specific activities, in any of the SAI years.
4.3.2 Analysis based on the data collected by ARACIP in the National Educational Risk Map (NERM)
Thirty educational establishments of the 32 from the SAI group were identified in the database. Data
collected in 2007-2010 was not validated for three schools from the School Attendance Initiative group,
due to a lack of rigour in data reporting, pointing to a management that lacked professional maturity.
The schools missing from the analysis are: Todireni Technological High School (Botoșani), Crucea
Secondary School (Iași) and Slobozia Bradului Secondary School (Vrancea).
Data was invalidated because of both some data gaps (the schools did not fill in all the requested
headings) and completion errors (wrong number of pupils or absences reported, number of training
hours for teachers that exceeded the duration of holidays and weekends available in a school year).
The analysis was performed on the aforementioned three categories of indicators.
Regarding the area of residence, the SAI group comprised 37.5% of urban schools (12 of 32) and 62.5%
of rural schools. Based on similar indicator values, only 20% of the schools from urban areas could be
selected (6 out of 30), because the other urban schools that fell within indicator values did not comply
with the criterion of non-participation in UNICEF’s Initiative in the previous years.
The school enrolment level looks as follows: Table 4 4 School enrolment level in SAI and sampled educational establishments
The group of SAI schools and the control group
Secondary schools
Arts and crafts schools Technological high schools
Situation in the 2008-2009 school year
Group of SAI schools - 32 schools 28 3 1

Page 72 of 198
Control group - 30 schools 23 631 1
Group of SAI schools - 32 schools 87.5% 9.37% 3.13%
Control group - 30 schools 76.66% 20% 3.34%
Situation in the 2013-2014 school year
Group of SAI schools - 32 schools 28 3 1
Control group - 30 schools 29 0 1
Group of SAI schools - 32 schools 87.5% 9.37% 3.13%
Control group - 30 schools 96.66% 0% 3.34%
To highlight the way in which the control group was put together, below are listed the value ranges of
context, process and outcome indicators both for the schools in the SAI group, that had valid data in the
2009 study, and for the schools in the control group.
The indicator values corresponding to all these schools are presented in Annex 4.
4.3.2.1 Context indicators
Context indicators considered:
The family environment:
Family’s average level of education;
Share of pupils with a medium and high economic status;
Share of pupils from families where both parents are present;
Share of pupils not belonging to vulnerable groups;
Home-to-school travel time.
School conditions and resources:
Human resources:
o Share of training/professional development hours
o Share of hours taught by certified teachers.
The family’s level of education is calculated according to the average number of school years, the
reference values being 8 years/12 years/16 years - corresponding to secondary school/high
school/higher education.
At the level of context indicators, the family’s average level of education for schools in:
The SAI group ranges between 8.4 years (Nicolae Titulescu Primary and Secondary School in
Buzău) and 12 years (Primary and Secondary School No. 3 in Râmnicu Sărat);
The control group, ranges between 8.2 years (Bodești Primary and Secondary School in Iași
County) and 12.7 years (Mihai Viteazu Primary and Secondary School in Călărași).
31All six educational establishments turned into secondary schools (Corbii Mari School of Arts and Crafts, Celaru School of Arts
and Crafts, Stornești School of Arts and Crafts, Bodești School of Arts and Crafts, Gheorghești School of Arts and Crafts, Gropeni
School of Arts and Crafts), the Văleni Agricultural High School turned into Văleni Technical High School.

Page 73 of 198
The family’s level of education was calculated as a weighted mean in each school and was composed of:
the total number of pupils for whom the education level was calculated, the number of pupils enrolled
at the beginning of each school year, the number of pupils whose parents completed higher education,
the number of pupils whose parents completed upper secondary education, number of pupils whose
parents completed lower secondary education.
The share of pupils with a medium and high economic status in the schools from:
The SAI group ranges between 8.92% (Slobozia Deal Secondary School) and 100% (Secondary
School No.3 in Râmnicu Sărat);
The control group ranges between 6.77 and 99.20, which means that 0.8% of the pupils in the
Malu Spart Primary and Secondary School from Giurgiu County and 93.23% of those in the
Stornești School of Arts and Crafts from Iași County are poor.
The economic status of the family is an aggregate indicator, comprising the sum of pupils who are
eligible for need-based student grants and pupils with both parents unemployed.
The share of pupils from two-parent families excludes pupils living in single-parent families, and in the
case of the schools in:
The SAI group, the values of this indicator range between 74.63% and 100%, i.e. the highest
percentage of pupils not belonging to two-parent families is 25.37%, in the Nedelcu Chercea
Primary and Secondary School from Brăila, whereas the Primary and Secondary School No. 3 in
Râmnicu Sărat has no pupils registered as belonging to a single-parent family;
The control group, the highest percentage of pupils belonging to single-parent families is 34.39%
(Mihai Andrei Primary and Secondary School in Buhuși) and the lowest is 0% (Malu Spart
Primary and Secondary School in Giurgiu County).
It is worth mentioning that not all school principals consider the families where one of the parents is
abroad as being part of this category, which generates an unequal perception in this regard.
After developing and identifying educational risk factors, approved under Ministerial Order No
6517/2012, the Romanian Agency for Quality Assurance defines disorganised families as single-parent
ones and those where one of the parents is abroad, while also defining the vulnerable groups of pupils
so that the school can identify additional support measures to assist them in the learning process. This
data is collected annually using the support application https://calitate.aracip.eu and is operationalised
into several groups of pupils, as follows:
Children with SEN;
Children in the care of relatives;
Roma pupils;
Pupils placed in family or residential care.
Pupils not belonging to vulnerable groups are those not meeting any of the aforementioned criteria.
The indicators referring to vulnerable groups vary between 0% and 100% for the schools in the SAI
group, and between 0% and 90.89% for those in the control group.
The limit values of pupils belonging to vulnerable groups, exposed to the risk of absenteeism and early
school leaving, according to ARACIP are:

Page 74 of 198
For schools in the SAI group: 0% in the case of the Primary and Secondary School No. 3 in
Râmnicu Sărat, Buzău County, and 100% in the case of the Fântânele Cojasca Primary and
Secondary School, Dâmbovița County;
For schools in the control group: 0% for seven schools (Primary and Secondary School No. 1, in
Gura Văii, Bacău County, Corbii Mari School of Arts and Crafts, Dâmbovița County, Malu Spart
Primary and Secondary School, Giurgiu County, Primary and Secondary School No.1 in Găneasa,
Ilfov County, Stornești School of Arts and Crafts, Iași County, Bodești Primary and Secondary
School, Iași County, Bodești School of Arts and Crafts, Neamț County) and 90.89% for the Sfântu
Nicolae Primary and Secondary School in Mizil, Prahova County.
The travel time from home to school is an indicator that influences pupils’ results, as well as a premise
of absenteeism and school dropout. This indicator was determined as a weighted mean according to
the average time expressed and it considered the number of pupils spending under 30 minutes, those
spending between 30 and 60 minutes, and those spending more than 60 minutes.
In the schools from the SAI group, the travel time, declared in 2009, is between 15 minutes in
the case of ten schools (Prejmer Primary and Secondary School, Brașov County, Fântânele
Cojasca Primary and Secondary School, Dâmbovița County, Cilibia Primary and Secondary
School, Buzău County, Râmnicu Sărat Primary and Secondary School No. 3, Buzău County,
Sărulești Primary and Secondary School, Călărași County, Liești School of Arts and Crafts No. 2
Galați County, Dragomirești Primary and Secondary School, Neamț County, Contești Primary and
Secondary School, Teleorman County, Culciu Mare Primary and Secondary School, Satu Mare
County, “Prince Ion Ghica and Princess Aristița Ghica” Primary and Secondary School in Sihlea,
Vrancea County) and 46.5 minutes in the case of the Hornești School of Arts and Crafts, Bacău
County.
In the schools from the control group, the travel time is between 15 minutes in the case of
seven schools (Gura Văii Primary and Secondary School No. 1, Bacău County, Lisa Primary and
Secondary School, Brașov County, Florica Primary and Secondary School, Buzău County, Modelu
Primary and Secondary School No. 1, Călărași County, Celaru School of Arts and Crafts, Dolj
County, Coșoveni Primary and Secondary School, Dolj County, Malu Spart Primary and
Secondary School, Giurgiu County) and 38.3 minutes in the case of Gheorghești School of Arts
and Crafts, Vaslui County.
School conditions and resources
Regarding human resources, the average annual number of training/professional development hours,
in the case of schools from:
The SAI group, varies between 0 (Vicovu de Sus Primary and Secondary School, Suceava County)
and 24.41 (Prejmer Primary and Secondary School, Brașov County);
The control group, varies between 0 (Lisa Primary and Secondary School, Brașov County, Cenad
Primary and Secondary School, Timiș County) and 12.61 (Văleni Technological High School, Olt
County).
The share of hours taught by new teachers highlights employment continuity, which is a supportive
factor for good results. Employment continuity is understood both from the perspective of the teacher
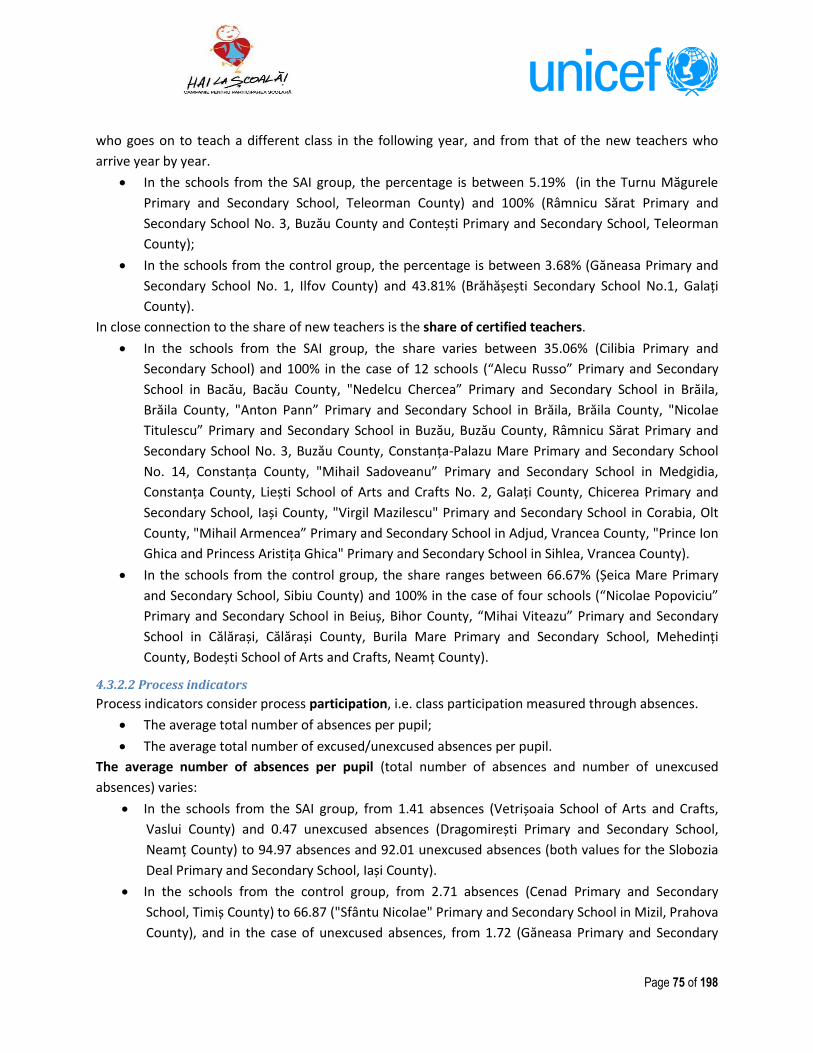
Page 75 of 198
who goes on to teach a different class in the following year, and from that of the new teachers who
arrive year by year.
In the schools from the SAI group, the percentage is between 5.19% (in the Turnu Măgurele
Primary and Secondary School, Teleorman County) and 100% (Râmnicu Sărat Primary and
Secondary School No. 3, Buzău County and Contești Primary and Secondary School, Teleorman
County);
In the schools from the control group, the percentage is between 3.68% (Găneasa Primary and
Secondary School No. 1, Ilfov County) and 43.81% (Brăhășești Secondary School No.1, Galați
County).
In close connection to the share of new teachers is the share of certified teachers.
In the schools from the SAI group, the share varies between 35.06% (Cilibia Primary and
Secondary School) and 100% in the case of 12 schools (“Alecu Russo” Primary and Secondary
School in Bacău, Bacău County, "Nedelcu Chercea” Primary and Secondary School in Brăila,
Brăila County, "Anton Pann” Primary and Secondary School in Brăila, Brăila County, "Nicolae
Titulescu” Primary and Secondary School in Buzău, Buzău County, Râmnicu Sărat Primary and
Secondary School No. 3, Buzău County, Constanța-Palazu Mare Primary and Secondary School
No. 14, Constanța County, "Mihail Sadoveanu” Primary and Secondary School in Medgidia,
Constanța County, Liești School of Arts and Crafts No. 2, Galați County, Chicerea Primary and
Secondary School, Iași County, "Virgil Mazilescu" Primary and Secondary School in Corabia, Olt
County, "Mihail Armencea” Primary and Secondary School in Adjud, Vrancea County, "Prince Ion
Ghica and Princess Aristița Ghica" Primary and Secondary School in Sihlea, Vrancea County).
In the schools from the control group, the share ranges between 66.67% (Șeica Mare Primary
and Secondary School, Sibiu County) and 100% in the case of four schools (“Nicolae Popoviciu”
Primary and Secondary School in Beiuș, Bihor County, “Mihai Viteazu” Primary and Secondary
School in Călărași, Călărași County, Burila Mare Primary and Secondary School, Mehedinți
County, Bodești School of Arts and Crafts, Neamț County).
4.3.2.2 Process indicators
Process indicators consider process participation, i.e. class participation measured through absences.
The average total number of absences per pupil;
The average total number of excused/unexcused absences per pupil.
The average number of absences per pupil (total number of absences and number of unexcused
absences) varies:
In the schools from the SAI group, from 1.41 absences (Vetrișoaia School of Arts and Crafts,
Vaslui County) and 0.47 unexcused absences (Dragomirești Primary and Secondary School,
Neamț County) to 94.97 absences and 92.01 unexcused absences (both values for the Slobozia
Deal Primary and Secondary School, Iași County).
In the schools from the control group, from 2.71 absences (Cenad Primary and Secondary
School, Timiș County) to 66.87 ("Sfântu Nicolae" Primary and Secondary School in Mizil, Prahova
County), and in the case of unexcused absences, from 1.72 (Găneasa Primary and Secondary

Page 76 of 198
School, Ilfov County) to 59.44 ("Sfântu Nicolae" Primary and Secondary School in Mizil, Prahova
County).
4.3.2.3 Outcome indicators
Regarding outcome indicators, the following was considered:
School flow:
o Share of pupils promoted at the end of the school year;
o Share of pupils from basic educational levels (primary and lower secondary) promoted
at the end of the school year;
o Share of pupils who continue their education (don't drop out), by unit.
Promotion rate:
o Promotion rate at lower secondary level;
o Grades over 7 at lower secondary level;
o Lower secondary level average grade.
The share of children who do not leave school varies:
In the schools from the SAI group from 0% for six schools (Primary and Secondary School No. 2
from Botoșani, Filipeștii de Târg Primary and Secondary School, Prahova County, Chicerea
Primary and Secondary School, Iași County, Odoreu Primary and Secondary School, Satu Mare
County, Bunești Primary and Secondary School, Vâlcea County, "Prince Ion Ghica and Princess
Aristita Ghica" Primary and Secondary School in Sihlea, Vrancea County) to 23.85% for the
Râmnicu Sărat Primary and Secondary School No. 3, Buzău County.
In the schools from the control group, from 4.11% for “Nicolae Popoviciu” Primary and
Secondary School in Beiuș, Bihor County, to 39.49% for Gura Văii Primary and Secondary School,
Bacău County.
In 2007-2009, according to the statements of educational establishments and the data collected, the
declared dropout rate for schools in the SAI group varied between 0% and 23.85%. The 0% value is
explained both by the different ways of defining school dropout and by the schools’ proven inability to
report the data. The data collected by ARACIP in the 2008-2009 school year cannot be called into
question for the SAI schools, since the main problem of the Romanian education system is that school
dropout is interpreted and attributed to children who give up school and have exceeded by two years
the age of pupils in that particular level. Based on the definition of school dropout, school principals did
not include among dropouts the children who left school at that moment. Those pupils showed up in
the reports made in 2010-2011 unless they returned to school in 2009-2011.
That is why we tend to believe that, in reality, both in the case of the schools involved in the School
Attendance Initiative and in the case of those from the control group, dropout rates were much higher
than the ones collected by ARACIP in 2008-2009.
The promotion rate at lower secondary level varies:
In the case of SAI schools, from 58.13% for the Sărulești Primary and Secondary School, Călărași
County, to 99.03% for the Dragomirești Primary and Secondary School, Neamț County.

Page 77 of 198
In the case of the schools from the control group, from 60.51% for the Gura Văii Primary and
Secondary School, Bacău County, to 95.89% for “Nicolae Popoviciu” Primary and Secondary
School in Beiuș, Bihor County.
The school’s lower secondary level average grade varies:
In the case of SAI schools, from 4.96 for the Râmnicu Sărat Primary and Secondary School No.3,
Buzău County, to 7.69 for the “Nicolae Titulescu” Primary and Secondary School in Buzău,
Buzău County
In the case of the schools from the control group, from 4.69 for the Bodești Primary and
Secondary School, Iași County, to 7.23 for the “Mihai Viteazul” Primary and Secondary School in
Călărași, Călărași County.
The data presented shows that there are small differences between the schools from the control group
and those involved in SAI, which does not affect the credibility of the control group.
4.3.3 Analysis based on 2013-2014 data reported by educational establishments
The purpose of this analysis was to validate the selection of the schools in the control group, done using
data collected by ARACIP in 2008-2009. The ARACIP database contains data collected for the 2013-2014
school year from all the schools in the control group and from 29 of the 32 SAI schools. The schools with
missing data are: Crucea Secondary School, Iași County, Dragomirești Secondary School, Neamț County,
and Turnu Măgurele Secondary School No. 4, Teleorman County. In the case of the three schools
mentioned, the information requested either was not filled in at all or was partially filled in. From the
comparative analysis of the data collected for the 2013-2014 school year, it resulted that the selection
of the schools in the control group, based on data collected in 2008-2009, was correct and that these
schools are a relevant control group for evaluating the impact of the School Attendance Initiative.
4.3.4 Sampling limitations. Conclusions
There are sampling limitations, determined by:
The data reporting manner:
Some data is incomplete
Both in the 2008-2009 school year and the 2013-2014 school year, the educational establishments
showed a lack of rigour in data reporting – therefore, in 2009, ARACIP invalidated the data from 400
schools and, in 2013-2014, the Annual Internal Evaluation Reports (AIER) made public according to
the law do not contain the data requested for all the schools (in the case of the schools from the SAI
group, reports were not received from three schools).
Some data has errors
The data belonging to some of the SAI educational establishments was not validated because of lack
of rigour in reporting.
The evaluation process - the accuracy of the data reported in the applied evaluation tools/ individual or group
discussions carried out with UNICEF-authorised evaluators;
The existence of other programmes, meant to decrease absenteeism and/or early school leaving rates, which
were not reported because they were not known, especially in the schools where the principals were newly
appointed.

Page 78 of 198
The following figures present:
The map with the location of SAI schools (marked in red) and of those in the control sample (marked in blue);
The map of people at risk of poverty in Romania (2013);
The map of poverty risk rates and people (thousands) below poverty line, by county.
Figure 4 1 Map with the location of SAI schools and schools in the control sample
Figure 4 2 Map of people at risk of poverty in Romania (2013)

Page 79 of 198
It is noticeable that, although in the selection and revalidation of the schools from the SAI group and of those in the
control group the “poverty rate” criterion was not an essential one, the location of the schools from the two groups
follows pretty much the distribution of the counties with high poverty rates and that of people (thousands) below
poverty line.
4.3.5 Pupil sampling
Sampling methodology
A sampling frame with the list of pupils was previously set up for each school
A primary sample list was randomly selected (using the SPSS procedure: Select Cases/Random
Sample/Approximately 20% of all cases) from the sampling frame of each school. The pupils from
this list were to be called to fill in the questionnaires. Approximately 20% of the school’s sampling
frame was selected for practical reasons, so as to get a number of pupils that could be evaluated in
the available time.
In order to cope with the situation in which pupils from the primary list were not available at the
time of visit, a secondary (reserve) list was made. The names and the order of pupils on the
secondary list were also randomly selected, using the same procedure.
Replacing a pupil from the primary list was done as follows:
o The first unavailable pupil from the primary list is replaced with the first pupil on the
secondary list
Figure 4 3 Map of poverty risk rates and people (thousands) below poverty line, by county
Poverty rates vary greatly and are the highest in the Northeast and along the southern border
The largest number of poor people is in the Northeast, but some low rate areas also have many poor people
Source: World Bank staff estimates based on the 2011 Population and Housing Census and 2012 EU-SILC data collected by the Romanian National Institute of Statistics (NIS). Note: Poverty risk defined by the EU standard as 60% of the national median equalised disposable income after social transfers

Page 80 of 198
o The next unavailable pupil from the primary list is replaced with the second pupil on the
secondary list, and so on.
The lists of pupils were sent to schools a few days before the visit, to ensure a high degree of
compliance. In general, the evaluation process followed the samples resulting from this procedure, but
there were also times when actual conditions on the ground required small deviations. Nevertheless, we
believe that, given the specific context of the evaluation in each school, we did out best to comply with
the sampling framework.
A similar procedure was used to sample pupils from the target group of the 32 SAI schools, to collect
data on school progress during the Initiative. The only difference was that, in that case, no reserve list
of names was necessary, because the information considered was found in school records.
4.4. CONSULTATIONS WITH PARTNERS AND BENEFICIARIES - STRATEGY, TOOLS, ACTIVITIES
Strategy
The process of consulting the partners of the School Attendance Initiative started with contacting them
via telephone, followed by contact via written message, to set the visit date and the necessary
conditions for carrying out these activities in good conditions.
In the case of beneficiary schools, an online questionnaire was developed, where the principals of the
respective schools selected the time when they would be available for in situ dialogues. After the data
filled in by principals was analysed, a visit plan was set up and, using it as a base for discussions, each
evaluator contacted the people in charge of the schools they would visit and negotiated the exact visit
date. The requests for documents and visit agendas were sent to school principals via e-mail.
There were times when, from the setting of the date to the moment of the visit, the principal that had
previously been contacted was replaced (for example: the SAI school from Vetrișoaia and the school
from the control group in Gheorghești). In such cases, the visits were conducted with difficulty.
Tools
a. The tools used during consultations with implementing partners were:
Guide for in-depth interview with project coordinators;
Document analysis sheet, for documents supplied by partners;
In situ visit report form.
b. The tools used during consultations with the beneficiaries of the School Attendance Initiative were:
Four types of questionnaires (for school principals/school-level SAI coordinators; teachers
involved in SAI, pupils benefiting from SAI and parents of those pupils);
Observation sheet for the visited school;
Checklist to identify transferable examples of good practice;
Three categories of interview guides: (i) in depth, for the principals of the schools in question;
(ii) structured, for school mediators and social assistance clerks/social workers; (iii) focus group
with SAI beneficiaries from the visited schools (teachers/pupils/parents);
Checklist of the data regarding SAI-relevant characteristics of participating schools;
Visit report form.

Page 81 of 198
Activities
The activities carried out during consultations with the partners and beneficiaries of the School
Attendance Initiative consisted of:
Activities to prepare the visits: printing questionnaires, drawing up visit maps,
requesting, prior to the visit, the documents that the evaluator wanted to consult during
the visit, analysis of the documents received from UNICEF or from the institutions to be
visited, for a better preparation of the visit.
In the case of implementing partners, these documents were:
Projects submitted to UNICEF;
Activity reports;
Lists of participants in the events organised by the implementing
partner;
Teaching materials used;
Studies, relevant documents developed during SAI;
Where applicable, a password was requested to gain access to the
learning platform of the implementing partner.
In the case of beneficiaries, the documents requested generally consisted of:
Institutional development plans;
Microgrant projects for the last two years when school financing was
based on such projects;
Teaching materials used in the activities carried out during SAI;
Lists of participants in parent education or parent counselling activities;
Monitoring sheets for children at risk of dropping out of school;
Contracts or documents to highlight the functioning of PAS;
Annual/biannual SAI implementation plans;
Activity reports;
Lists of teachers that participated in training during SAI;
Any other documents or proof showing the traceability of SAI activities.
a. Activities carried out with implementing partners:
In-depth interview with project coordinators and project team members;
Analysis of the documents supplied by partners.
b. Activities carried out with SAI beneficiaries:
Questionnaire application for each group of SAI beneficiaries (principals/school-level SAI
coordinators; teachers; pupils and parents);
In-depth interview with the principals of the visited schools;
Structured interview with school mediators and social assistance clerks/social workers;
Focus group with the teachers involved in SAI;
Focus group with the pupils involved in SAI;
Focus group with the parents involved SAI;

Page 82 of 198
Observation of the visited school;
Identifying transferable examples of good practice;
Document analysis.
After performing the visits, the evaluators completed visit reports and entered in the database the
content of the questionnaires filled in by pupils, parents, teachers, and the principal.
There were times when, although the visit had been set in advance and the information regarding the
documents requested had been transmitted several days before, on the day of the visit those
documents were not ready and/or the pupils or teachers were not present for the interview (for
example: Gheorghe Naum School in Brăila, where the principal did not present any document or
subsequently send the documents requested on previous occasions and did not mobilise the pupils;
therefore, the interviews were conducted individually, with pupils who were taking their re-sits, on the
school hallways; School No. 3 from Botoșani, where the only teacher deeply involved in the Initiative
was the school’s project coordinator, who did her best to have the meeting go well, but was not
supported by the school principal or by her colleagues; the School in Vicovu de Sus, a case similar to the
school from Botoşani with the difference that, although the school principal had been expected for
several hours to participate in the discussions, she left the school building). At the other end of the
spectrum, we find the school and local community representatives from Todireni, Medgidia, Turnu
Măgurele, Constanța, Odoreu, Culciu Mare.
4.5 EVALUATION METHODS EMPLOYED AND THEIR APPROPRIATENESS FOR PURPOSE AND
EVALUATION QUESTIONS
General presentation
The data collection methods were developed based on two main criteria: the evaluation paradigm and
the evaluation level.
Given the complexity of the School Attendance Initiative, we considered that the most adequate
strategy would be to approach the evaluation from a dual perspective: quantitative and qualitative. This
strategy could guarantee a more sensitive coverage of the SAI impact on the communities considered.
Regarding the evaluation level, we looked at information related, on the one hand, to the school entity
under intervention and, on the other hand, to individual entities (principals, teachers, pupils, parents).
In line with this vision, the methods used in the evaluation process can be classified by two major
criteria: the assumed paradigm (quantitative/qualitative) and the evaluation level (school/individuals -
principals, teachers, pupils, parents). A summary of the methods is presented in Table 4.3
Table 4 5 Methods used in the evaluation process and their classification according to paradigm and evaluation level
Instruments Quantitative Qualitative
Individual School Individual School
Questionnaire for principals* YES YES - -
Questionnaire for pupils* YES - - -
Questionnaire for teachers* YES - - -
Questionnaire for parents* YES - - -

Page 83 of 198
Guide for interview with the school principal* - - YES YES
Guide for interview with the school team - - YES -
Guide for interview with the school mediator - - YES -
Guide for interview with parents/pupils - - YES -
Guide for interview with implementing partners - - YES -
Visit observation sheet - YES - YES
Note: The mark * indicates the instruments that had different versions for SAI schools and for those in the control group
Summary description of instruments in terms of their appropriateness for purpose
Questionnaire for principals
It is made up of open questions, with open answers, and questions with limited answer options
(YES/NO; scaled answer, expressing an agreement on a five-point Likert-type scale).
The main categories of information considered are:
Identification details of the school and the principal
Implementation conditions for teaching activities, the strategy and school policy
Teachers
Impact of the School Attendance Initiative on the school, teachers, pupils, parents
Aspects regarding the evolution of school performance, absenteeism and dropout
Motivation for SAI involvement and assessment on implementation components
Level of SAI involvement
The version for the principals in the control group does not contain questions specific to
participation in the School Attendance Initiative, but it assesses the popularity of this Initiative.
Questionnaire for teachers
It is made up of open questions, with open answers, and questions with limited answer options
(YES/NO; scaled answer, expressing an agreement on a five-point Likert-type scale).
The main categories of information considered are:
Identification details of the school
Implementation conditions for activities teaching, the strategy and school policy
Self-assessment of their own strategies in approaching the teaching and learning process
(using active methods, using ICT in the teaching process)
Implementation conditions for educational activities
Level of SAI involvement
Aspects regarding the evolution of school performance, absenteeism and dropout
Assessment on the training activities in which they were involved during SAI
Assessment on SAI impact at school and personal level
The version for the teachers from the schools in the control group does not contain questions
specifically regarding the School Attendance Initiative, but it assesses SAI popularity.
Questionnaire for pupils
It is made up of open questions, with open answers, and questions with limited answer options
(YES/NO; scaled answer, expressing an agreement on a five-point Likert-type scale).
The main categories of information considered are:

Page 84 of 198
Identification details
Assessment on SAI impact at school level
Assessment on the relationship with school, teachers, classmates
Aspects regarding the evolution of school performance, absenteeism and dropout
SAI involvement
The version for the pupils from the schools in the control group does not contain specific questions
regarding the School Attendance Initiative.
Questionnaire for parents
It is made up of open questions, with open answers, and questions with limited answer options
(YES/NO; scaled answer, expressing an agreement on a five-point Likert-type scale).
The main categories of information considered are:
Identification details and characteristics of the respondent (family status, level of education,
etc.)
Attitude towards education and the role of school in child development
Aspects regarding child rearing, care and education
Aspects regarding parent education
Involvement in the School Attendance Initiative
The version for the parents of pupils from the schools in the control group does not contain specific
questions regarding the School Attendance Initiative.
Guide for interview with the school principal
The guide is structured on the following main categories of information:
Identification details
Aspects regarding the implementation of SAI components in school (cooperation with
partners, cooperation with the local community, relationship with parents, etc.)
SAI impact on absenteeism and school dropout
Community-specific aspects that influence school commitment
Guide for interview with the school team
The guide is structured on the following main categories of information:
Identification details
Design of the intervention at school level
Relationship with implementing partners
Assessment of intervention outcomes
Guide for interview with the school mediator
The guide is structured on the following main categories of information:
Identification details
Personal involvement in SAI
Assessment of the activities in which they participated (utility, level of interest)
SAI impact on pupils
Guide for interview with parents/pupils
The guide is structured on the following main categories of information:

Page 85 of 198
Identification details
Awareness of SAI activities
Personal participation in SAI activities
SAI assessment
Guide for interview with implementing partners
The guide is structured on the following main categories of information:
Identification details
Design of the project
Relationship with schools
Implementing team
Implementing procedure
Assessment of outcomes
Dissemination
Relationship with UNICEF.
Visit observation sheet
It is a structured instrument meant for systematic observation during school visits. The main
components of the sheet are as follows:
School identification and location details
Descriptive information (years of SAI involvement, number of pupils, teaching settings, etc.)
External appearance (access road, building, yard, etc.)
Internal appearance (classrooms, equipment, information offer)
Visit and interview findings
In order to answer the evaluation questions mentioned in chapter 3.2, the following data was collected
and analysed:
1. How effective has SAI been in reducing the risk of dropping out and dropout rates in the schools involved?
In order to get an answer to this question, the analysis focused mainly on evaluating SAI effectiveness, by analysing the data collected in schools with regard to:
School attendance;
Absenteeism rate;
School dropout rate;
School results;
Number of pupils at risk of dropping out of school.
2. Have SAI interventions produced management changes in the schools involved, regarding the implementation of strategies for school dropout prevention/control and the development of school-community partnerships?
In order to answer this question, the evaluation identified and examined institutional changes in the schools and communities involved, especially with regard to:
Educational policies initiated;

Page 86 of 198
Strategies adopted by schools to prevent/fight school dropout and the way they are reflected in the schools’ strategic planning documents;
The efficient approach to gender and ethnic disparities related to absenteeism and school dropout;
Quality of the school environment (friendly school);
School's interest in promoting an inclusive environment, by adapting actions to pupils’ needs;
School's interest in developing school-community partnerships;
School's interest in getting resource people (promoters, county experts, social assistance clerks/social workers, school mediators - where necessary, etc.) involved in school life.
3. Has SAI produced changes in the instructional strategies used by teachers in their day-to-day activities?
In order to identify answers to this question, the following were analysed:
Interactions between pupils and teachers, as well as interactions between pupils;
Teachers’ interaction with pupils’ parents and other representatives of school partners;
Extracurricular activities developed by school;
4. Has SAI produced changes in the teacher-pupil relationship and the teacher-parent relationship?
In order to identify answers to this question, the following were analysed:
Interactions between pupils and teachers, as well as interactions between pupils;
Teachers’ interaction with pupils’ parents and other representatives of school partners;
Extracurricular activities developed by school;
5. Has SAI produced changes in parents’ attitude towards education?
Answers to this question were identified by analysing the following aspects:
Parents motivating pupils to continue their studies;
Parents’ involvement in activities organised by the school;
Parents’ participation in parent education activities;
Level of information held by parents that allows them to make their children gain an interest in school and to improve the parent-child relationship;
6. Has SAI produced changes regarding parents’ involvement in school life?
In order to identify answers to this question, the following were analysed:
Interactions between parents and school representatives;
Interactions between parents and school mediators;
Parents’ involvement in activities organised by the school;
7. Has SAI produced changes in the community so as to contribute to the reduction of school absenteeism and dropout?
Regarding changes produced by SAI at community level, the analysis considered the following aspects:
Community mobilisation by creating and using institutional teams/resource people at the local level;
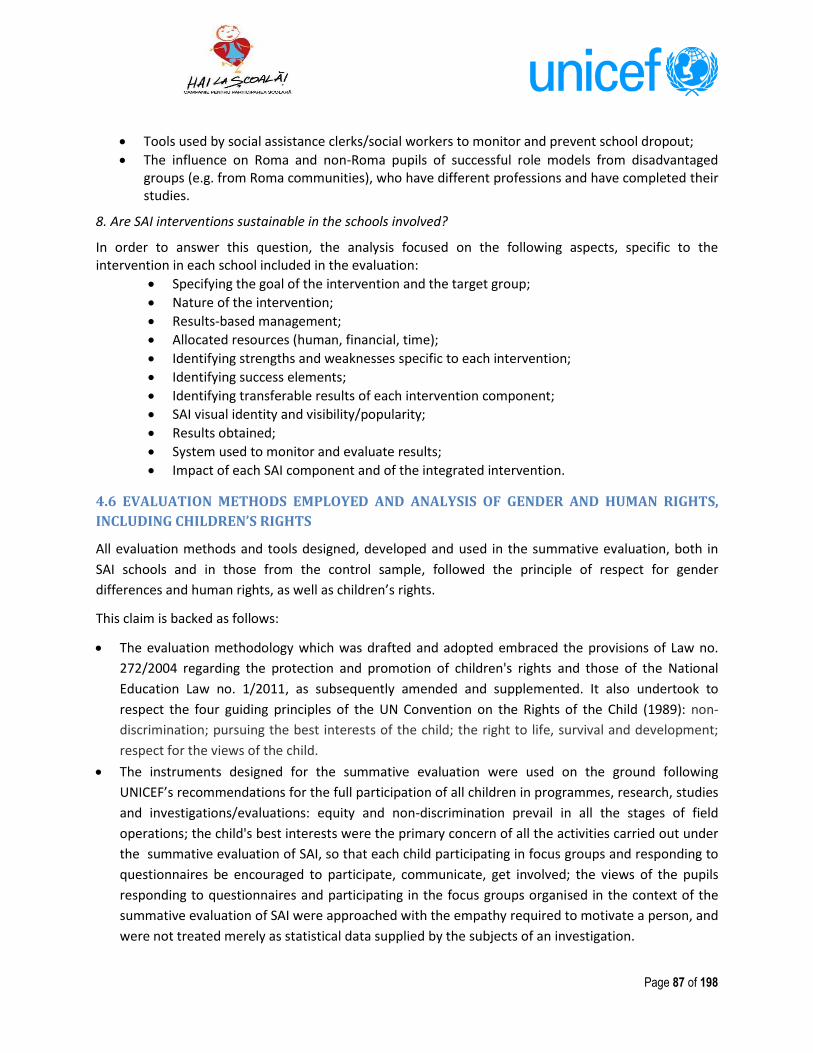
Page 87 of 198
Tools used by social assistance clerks/social workers to monitor and prevent school dropout;
The influence on Roma and non-Roma pupils of successful role models from disadvantaged groups (e.g. from Roma communities), who have different professions and have completed their studies.
8. Are SAI interventions sustainable in the schools involved?
In order to answer this question, the analysis focused on the following aspects, specific to the intervention in each school included in the evaluation:
Specifying the goal of the intervention and the target group;
Nature of the intervention;
Results-based management;
Allocated resources (human, financial, time);
Identifying strengths and weaknesses specific to each intervention;
Identifying success elements;
Identifying transferable results of each intervention component;
SAI visual identity and visibility/popularity;
Results obtained;
System used to monitor and evaluate results;
Impact of each SAI component and of the integrated intervention.
4.6 EVALUATION METHODS EMPLOYED AND ANALYSIS OF GENDER AND HUMAN RIGHTS,
INCLUDING CHILDREN’S RIGHTS
All evaluation methods and tools designed, developed and used in the summative evaluation, both in
SAI schools and in those from the control sample, followed the principle of respect for gender
differences and human rights, as well as children’s rights.
This claim is backed as follows:
The evaluation methodology which was drafted and adopted embraced the provisions of Law no.
272/2004 regarding the protection and promotion of children's rights and those of the National
Education Law no. 1/2011, as subsequently amended and supplemented. It also undertook to
respect the four guiding principles of the UN Convention on the Rights of the Child (1989): non-
discrimination; pursuing the best interests of the child; the right to life, survival and development;
respect for the views of the child.
The instruments designed for the summative evaluation were used on the ground following
UNICEF’s recommendations for the full participation of all children in programmes, research, studies
and investigations/evaluations: equity and non-discrimination prevail in all the stages of field
operations; the child's best interests were the primary concern of all the activities carried out under
the summative evaluation of SAI, so that each child participating in focus groups and responding to
questionnaires be encouraged to participate, communicate, get involved; the views of the pupils
responding to questionnaires and participating in the focus groups organised in the context of the
summative evaluation of SAI were approached with the empathy required to motivate a person, and
were not treated merely as statistical data supplied by the subjects of an investigation.

Page 88 of 198
The strategy used in the analysis of SAI documents, publications, reports and products, performed
for the summative evaluation, did not particularly focus on the gender perspective, but approached
it inclusively.
In the case of all the evaluation instruments designed for the summative evaluation (school observation
sheet, opinion questionnaires, focus group structure, guides for interviews with implementing partners),
in the application stage, all participants were prepared and informed according to protocol, regarding
the context, the purpose and the objectives of the evaluation, and the consent of the people involved
was requested with regard to the application of instruments.
During the summative evaluation of SAI, the development of case studies, aimed at getting a
comprehensive picture of the ethos in five of the educational communities that participated in SAI,
sought to document the “natural” reflection, in the field, of the way in which the principles endorsed by
SAI and by its summative evaluation were put into practice in the daily school life.
Since the very model of organic development that the School Attendance Initiative was based on is
centred on human rights, and in particular on the right of every child to education, this also constituted
the main reflection of the adopted principles, at the level of the summative methodology.
As regards gender equality and related matters, the analysis of SAI documents and products highlighted
the fact that the relevant aspects were related to the potential for the further development of gender
studies, which the School Attendance Initiative activated: the organic development model actively
supported the right to education for the disadvantaged groups, especially for Roma children, but also for
the socially disadvantaged; it included in SAI activities a variety of partners and beneficiaries; it
constantly promoted multicultural elements, in the sense of identifying and accepting differences; it
constantly supported the inclusive educational approach, centred on dialogue, sharing experiences,
active communication and cultivating the “wellbeing” of children, pupils, parents, participants in
general, as a stimulus for participation and involvement in activities and actions.
4.7 DATA QUALITY ASSURANCE
Being aware of the fact that the value of the findings and conclusions of the evaluation depend on the
quality of the data collected, we paid attention to validity (in terms of content and construct) and
reliability (error control).
Content validity refers to the degree to which the findings of the evaluation process cover all relevant
aspects of the targeted reality. This type of validity is not quantifiable by statistical indicators, but relies
on arguments and qualitative assessments. In our case, the most important arguments in support of
content validity are the following:
The development of measurement instruments reflects the aspects generally recognised as being
relevant for explaining school absenteeism and dropout;
While developing the instruments, we considered the specifications of the Terms of Reference,
which describe the main directions that the evaluation process must follow;

Page 89 of 198
Instrument development considered the Kirkpatrick model32, which is widely recognised for
evaluating the efficiency of intervention processes in the educational environment.
Construct validity indicates the extent to which the instruments measure the targeted reality and
nothing else, and the arguments we bring in support of this type of validity are as follows:
o All instruments developed are dedicated to evaluating an educational reality;
o Even when they do not refer specifically to school absenteeism and dropout (key concepts of SAI),
the data and information requested refer to aspects generally recognised as being connected to the
efficiency of the educational process, and, implicitly, to the targeted concepts.
Measurement reliability was an important aspect considered. In essence, reliability describes the extent
to which the data obtained in the measuring process is affected by error. From this perspective, three
essential aspects were considered: prevention, control and evaluation of measurement errors.
o Prevention was considered in the stage of instrument development and item generation. We
strongly sought that the questions be as clear and explicit as possible, to be understood by
respondents.
o Control was manifested during the application of instruments, by ensuring optimum application
conditions, clear and standardised instructions, as well as support for respondents during
application, to limit the number of non-responses. The fact that all questionnaires were applied
using the pencil and paper technique was an advantage, even though they were also developed for
online application.
o The evaluation of the measurement error considered two aspects. On the one hand, we calculated
the effect of common method variance (the degree to which results are affected by the form of
questions and by personal bias). On the other hand, when we used scores computed by adding up
answers to several items, we calculated the internal consistency index, Cronbach’s Alpha (which is
reported when appropriate). Furthermore, statistical mean-based analyses are accompanied by the
numerical or graphic expression of the standard error or confidence level.
In spite of all error prevention and control measures, we cannot claim that the data obtained is error-
free. Therefore, we reckon that, in the case of quantitative measurements, certain inflationary effects
are manifested due to social desirability, impossible to completely eliminate in such evaluations. Also,
even though the instruments were conceived so as to be accessible, there were situations where they
were difficult to understand by respondents with an extremely low level of education. These limitations
of quantitative measurements could be compensated using qualitative evaluations.
4.8 ETHICAL SAFEGUARDS REGARDING PROTECTION OF CONFIDENTIALITY, DIGNITY, THE
RIGHTS AND WELFARE OF CHILDREN AND RESPECT FOR THE VALUES OF BENEFICIARY
COMMUNITIES
A major concern of the evaluation team was that, during the collection of data from the School
Attendance Initiative beneficiaries (both in the stage of questionnaire application and during focus
groups), the ethical criteria regarding the protection of confidentiality, dignity, the rights and welfare of
32 See: A.C. Hamblin (1974). A C., “Evaluation and Control of Training”, McGraw Hill. Also: Warr P., Bird M. and Rackcam N.,
(1978). “Evaluation of Management Training”. London: Gower and Bramley, P. (1996). “Evaluating training effectiveness” Maidenhead: McGraw-Hill.

Page 90 of 198
children and also the values of the beneficiaries be respected. To that end, the entire evaluation
process complied with the basic principles of the UNICEF Procedure for Ethical Standards and with the
UNEG Norms and Standards for Evaluation.
Therefore, all independent evaluators, members of the team involved in the summative evaluation, also
consulted, as early as in the document research stage, the “UNICEF Procedure for Ethical Standards in
Research, Evaluation and Data Collection & Analysis” and respected the underlying principles, in all the
development stages of this evaluation.
The Technical Proposal, the Summative Evaluation Methodology, and the draft evaluation tools were
submitted for approval to the contractor - UNICEF - which validated the documentation proposed by the
summative evaluation team even from the perspective of commitment to ethical principles.
During all the field activities (organising school visits, communicating with SAI and control group schools,
applying questionnaires, organising focus groups, conducting structured interviews with implementing
partners) and in all the stages of developing and analysing databases, the integrity and safety of the
underage and vulnerable subjects were ensured completely and permanently. Therefore, the
application of questionnaires and the focus groups were performed in the school with the approval of
the principal, in a secure and familiar environment for the pupils, with no disruptive or pressure factors.
During the application of evaluation instruments, the standard application protocols were respected.
No violations, deviations or complaints from participants, teachers or principals were reported.
During data processing and analysis, data anonymity was ensured, and all measures were taken so that
each of the participating children be considered a “person” and not just a respondent or data supplier.
During the entire evaluation process, all the activities of the evaluation team were carried out
respecting a set of values and principles:
Impartiality, independence and objectivity;
Moral, social and professional responsibility;
Moral and professional integrity;
Confidentiality;
Respect for the law;
Respect for personal autonomy;
Honesty and fairness;
Respect and tolerance.
In the process of consulting the pupils - beneficiaries of the School Attendance Initiative, the evaluation
team respected and applied a set of conduct rules, such as:
Respecting the dignity of each pupil;
Excluding all forms of discrimination;
Ensuring equal opportunities;
Not involving pupils in activities of political bias and religious proselytism;
Protecting pupils’ physical, mental and moral health (in accordance with the provisions of Law
no. 272/2004 regarding the protection and promotion of children's rights, as subsequently
amended and supplemented).

Page 91 of 198
In the process of consulting the parents - beneficiaries of the School Attendance Initiative, the
evaluation team respected and applied a set of conduct rules, such as:
Establishing a relationship of mutual trust, and open and accessible communication;
Offering the explanations necessary for understanding the content of the questionnaires
applied;
Respecting the confidentiality of the data supplied and the right to individual and family privacy.
In the process of consulting the teachers involved in the School Attendance Initiative, the evaluation
team respected and applied a set of conduct rules, such as: respect, honesty, solidarity, cooperation,
fairness, tolerance, avoiding denigration, confidentiality.
5. FINDINGS
5.1. EVALUATION FINDINGS IN RELATION TO THE SYSTEMIC ANALYSIS AND DATA
INTERPRETATION
The main challenge that the evaluation process must face is highlighting a causal impact of the School
Attendance Initiative on school absenteeism and dropout, in the 32 schools analysed. If we consider the
usual criteria imposed by the scientific methodology to assume a causal inference, this goal is difficult to
pursue formally in the existing methodological context, which is essentially non-experimental.
Nevertheless, we assess that the complex approach of this evaluation, which was based on different
paradigms (quantitative/qualitative) and aimed at different levels of analysis (school/individual
participants) and at different categories of individual participants (principals, teachers, pupils, parents),
is able to highlight a structure of associations and differences that are relevant to SAI impact. The nature
of the impact is analysable using the specifications of the Kirkpatrick model33 (1994), which refers to the
following types of effects of an educational intervention programme:
Reactions (satisfaction with the intervention programme);
Learning (principles, facts or skills acquired);
Behaviour/procedures (changes in the behaviour/procedures);
Results (changes in performance).
School-level analysis
Institutional infrastructure
In the context of our analysis, we define institutional infrastructure as being any kind of human and
procedural resource developed/operationalised during the implementation of the School Attendance
Initiative, in order to achieve all the SAI objectives. We include here, on the one hand, the support
received by the school from external factors (parents, mayoralty, local bodies with educational
responsibilities) and, on the other hand, procedural resources developed at school level (institutional
development project, school management plan, quality assurance plan, minority integration/support
plan, community network to fight school dropout, a school mediator, a school counsellor/psychologist
33 33 See: A.C. Hamblin (1974). A C., “Evaluation and Control of Training”, McGraw Hill. Also: Warr P., Bird M. and Rackcam N., (1978). “Evaluation of Management Training”. London: Gower and Bramley, P. (1996). “Evaluating training effectiveness” Maidenhead: McGraw-Hill.

Page 92 of 198
and a resource teacher available, friendly school environment, etc.). In principle, these factors were
supposed to exist even before the School Attendance Initiative, but one of the SAI objectives was to
foster their development where they did not exist, and to optimise their integrated operation at the
school level, where they did exist.
Considering these aspects, the impact of SAI in schools can be classified at level 3 of the Kirkpatrick
model (institutional procedures). Our opinion is that identifying an impact at this level can be an
argument regarding the sustainability of SAI impact. The main sources of useful information for this
analysis are the questionnaires applied to principals and teachers, whose results allow for a comparative
analysis between different sources. It is obvious that a simple comparison of the answers to the
questions in the questionnaire cannot be interpreted as undeniable proof of SAI's effect. Nevertheless,
the existence of systematic differences, not just statistically significant but also important in terms of
size, can be associated with SAI participation.
Table 5.1 summarises principals’ assessment of the support received by the school from external factors,
a comparison between schools from the SAI group and the control group. Mean assessments are above
the mean scale value in the case of SAI schools. Compared to the schools in the control group, the
supportive factors that are not statistically significant are parents, SPAS representatives, and the
mayoralty. The principals of SAI schools claim to be more satisfied than those of the schools in the
control group with the support received from the local community, GDSACP representatives, the CSI
Roma inspector, and CREAC counsellors. The same comparative analysis of SAI and control school
teachers’ answers also produced results in favour of SAI schools, but the differences are statistically
significant even for the supportive factors that were below the threshold in the case of principals.
Table 5 1 Principals’ assessment of external institutional support received by SAI schools compared to control schools
SAI Control t(34) p(35)
Cohen's
d (36) Mean Std. Dev. Mean Std. Dev.
Parents 3.63 0.79 3.78 0.85 0.714 0.47 .19
Local community 4.13 0.79 4.56 0.58 2.344 0.02 .61
SPAS representatives 4.03 0.76 3.81 1.02 0.944 0.35 .25
GDSACP representatives 4.23 0.68 2.96 1.60 3.948 <.0001 1.07
Mayoralty 4.63 0.61 4.23 1.27 1.448 0.15 .41
CSI Roma inspector 4.61 0.62 3.73 1.20 3.172 0.00 .95
CREAC counsellors 4.38 0.66 3.52 1.45 2.74 0.01 .78
The answers offered by teachers to the same questions confirm the fact that SAI schools received
greater support from external factors than those from the control group (Table 5.2). This finding
supports the conclusion that the UNICEF intervention is associated with a better perception of the
school’s ability to develop functional relationships with external supportive factors.
34 “t” represents the value of the statistical test for the mean difference between SAI group and control group. The value in itself is not interpreted
in any way. 35 “p” represents the statistical significance level of the “t” test. If the value of p is below or equal to 0.05, the conclusion is that the difference is
statistically significant (such a result has too small a probability to be considered as a result of the hazard). 36 “Cohen's d” is an indicator that describes “how large” the difference between means is; the interpretation thresholds are as follows: 0.2 = small difference (negligible); 0.5 = medium difference; 0.8 = large difference. In all the cases, the effect size indicator offers more useful information
that the statistical significance threshold (p).

Page 93 of 198
Table 5 2 Teachers’ assessment of external institutional support received by SAI schools compared to control schools
SAI CONTROL t p
Cohen's
d Mean N Std. Dev. Mean N Std. Dev.
Parents 3.02 267 0.704 2.95 238 0.781 1.040 .299 0.23
Local community 3.11 272 0.758 3.08 239 0.911 .367 .714 0.24
SPAS representatives 3.03 224 0.702 2.57 221 0.939 5.814 .000 0.23
GDSACP representatives 2.96 227 0.816 2.30 187 1.176 6.726 .000 0.28
Mayoralty 3.32 263 0.765 3.17 226 1.028 1.862 .063 0.23
CSI Roma inspector 3.26 248 0.810 2.53 176 1.111 7.867 .000 0.25
CREAC counsellors 3.33 251 0.687 2.55 203 1.199 8.783 .000 0.21
Regarding the support components for preventing and fighting absenteeism and dropout developed in schools, the findings of the analysis are presented in the following figures. As can be seen, principals’ and teachers' assessments regarding the existence of all institutional infrastructure components converge, both in SAI schools and in control schools. This convergence reinforces the confidence in the findings and in the fact that they describe reality. Overall, in SAI schools, all the evaluated components are assessed as being more present than in the control group. The chi-square37 test, applied separately to the answers of principals and teachers from SAI group versus the control group, is not always significant, but even in these cases, the effect size index (Cramer's phi38) is relevant (it exceeds the 0.25 level). In the case of some of the components (for example, the existence of the community network that prevents and fights school dropout, that of the school mediator, the counsellor and the resource teacher), SAI schools are doing much better than those in the control group (Cramer's phi index has values that reach or exceed the large effect level, i.e. 0.40). In conclusion, we can state that, overall, in the schools where the School Attendance Initiative was implemented, there is, at the end of SAI, a better institutional infrastructure for school absenteeism and dropout control than in the schools from the control group. However, it is worth mentioning that in none of the schools, including the SAI group, can we find all the institutional infrastructure components, and in one of them these are still being developed. Among the missing components, we mention in particular the community network for support and dropout control, the plan to integrate and support minorities, the school mediator, and the resource teacher. We can assess that these deficiencies explain, at least partially, the absence of a better evolution in school absenteeism and dropout indicators.
37 “chi-square” is a statistical test that compares the configuration of answers from SAI schools and the Control group. The value of the test is not
interpretable, but it is considered statistically significant if the corresponding “p” value is below 0.05. 38 ”Cramer’s phi” is the effect size indicator for the chi-square test (similar to Cohen’s d”). The interpretation thresholds are as follows: 0..10 = small effect; 0.25 = medium effect; 0.40 = large effect

Page 94 of 198
Questionnaire for principals teachers
Chi-square=.073, p>.05, Cramer’s phi=.04 Chi-square=25.66, p<.001, Cramer’s phi=.66
Figure 5 1 Existence of institutional development plan
Questionnaire for principals teachers
Chi-square=.074, p>.05, Cramer’s phi=.11 Chi-square=.119, p<.05, Cramer’s phi=.04
Figure 5 2 Existence of school management plan
Questionnaire for principals teachers
Chi-square=.067, p>.05, Cramer’s phi=.03 Chi-square=3.48, p>.05, Cramer’s phi=.24
Figure 5 3 Existence of quality assurance plan

Page 95 of 198
Questionnaire for principals
teachers
Chi-square=8.52, p=.014, Cramer’s phi=.38 Chi-square=2.11, p>.05, Cramer’s phi=.19 Figure 5 4 Existence of national minority integration/support plan
Questionnaire for principals
teachers
Chi-square=10.64, p=.005, Cramer’s phi=.42 Chi-square=43.46, p<.0005, Cramer’s phi=.86 Figure 5 5 Existence of community network for dropout prevention and control
Questionnaire for principals teachers
Chi-square=12.01, p=.005, Cramer’s phi=.45 Chi-square=77.76, p<.0005, Cramer’s phi=1.15
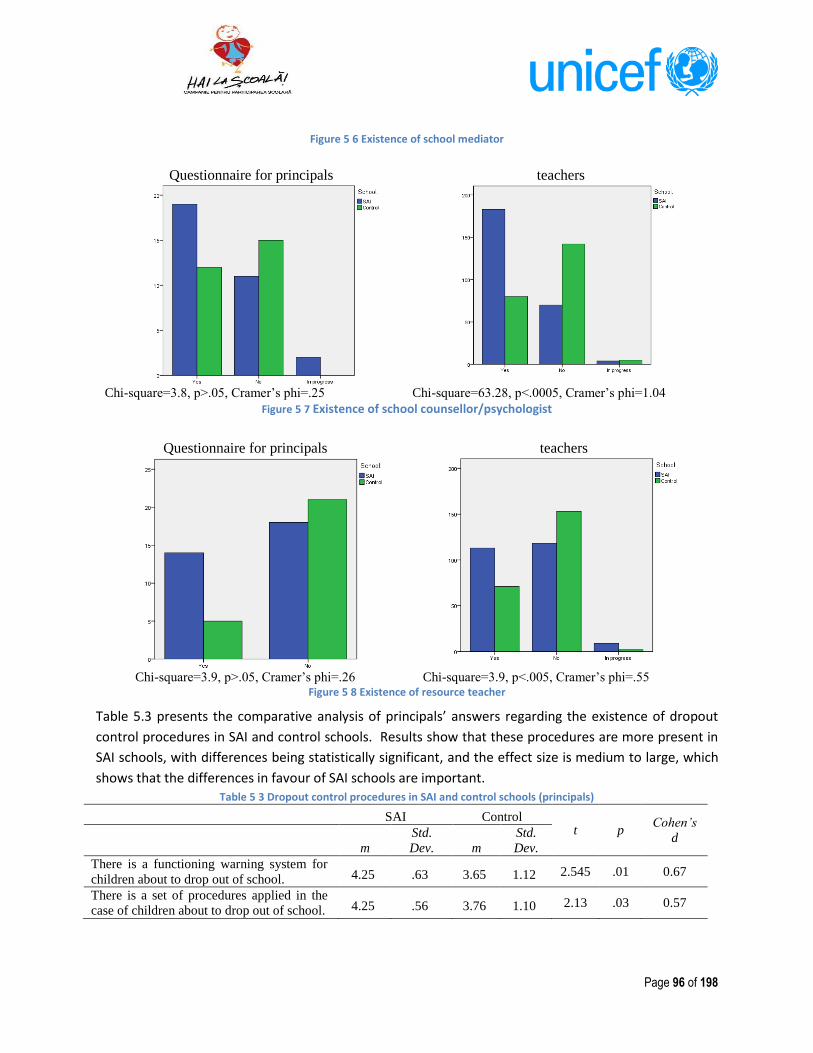
Page 96 of 198
Figure 5 6 Existence of school mediator
Questionnaire for principals teachers
Chi-square=3.8, p>.05, Cramer’s phi=.25 Chi-square=63.28, p<.0005, Cramer’s phi=1.04
Figure 5 7 Existence of school counsellor/psychologist
Questionnaire for principals teachers
Chi-square=3.9, p>.05, Cramer’s phi=.26 Chi-square=3.9, p<.005, Cramer’s phi=.55 Figure 5 8 Existence of resource teacher
Table 5.3 presents the comparative analysis of principals’ answers regarding the existence of dropout
control procedures in SAI and control schools. Results show that these procedures are more present in
SAI schools, with differences being statistically significant, and the effect size is medium to large, which
shows that the differences in favour of SAI schools are important. Table 5 3 Dropout control procedures in SAI and control schools (principals)
SAI Control t p
Cohen’s
d m
Std.
Dev. m
Std.
Dev.
There is a functioning warning system for
children about to drop out of school. 4.25 .63 3.65 1.12 2.545 .01 0.67
There is a set of procedures applied in the
case of children about to drop out of school. 4.25 .56 3.76 1.10 2.13 .03 0.57

Page 97 of 198
Table 5.4 presents teachers’ opinions about the same dropout control procedures. Even though teachers
have slightly more negative assessments than principals, in their case as well, those from SAI schools
presented a more positive assessment compared to the answers of teachers in the control group.
Table 5 4 Dropout control procedures in SAI and control schools (teachers)
SAI CONTROL
t p
Cohen's
d m
Std.
Dev. m
Std.
Dev. m
Std.
Dev.
There is a functioning warning system for
children about to drop out of school. 3.31 253 0.757 2.87 218 0.972 5.582 .000 0.23
There is a set of procedures applied in the
case of children about to drop out of
school.
3.34 261 0.663 2.92 224 0.953 5.659 .000 0.20
Similar conclusions result also from the analysis regarding the existence of procedures to support newly enrolled pupils or those with learning difficulties (Table 5.5).
Table 5 5 Support procedures for pupils with difficulty adapting in SAI and control schools (principals)
SAI Control t p
Cohen’s
d m
Std.
Dev. m
Std.
Dev.
A clear strategy is being implemented
to support newly enrolled children in
class and at school. 4.34 .60 3.96 .77 2.11 .03 0.55
Remedial education programmes are
being implemented for pupils in need. 4.15 .67 3.38 1.29 2.9 .005 0.76
Teachers’ opinions on support procedures (Table 5.6) are similar to those of principals. Table 5 6 Support procedures for pupils with difficulty adapting in SAI and control schools (teachers)
SAI CONTROL
t p
Cohen's
d m
Std.
Dev. m
Std.
Dev. m
Std.
Dev.
A clear strategy is being
implemented to support newly
enrolled children in class and at
school.
3.34 262 0.685 2.96 232 0.997 4.970 .000 0.21
Remedial education programmes
are being implemented for pupils in
need.
3.33 262 0.638 2.79 227 1.060 6.972 .000 0.19
In turn, teachers from SAI schools assess the existence of absence control and pupil support procedures more positively than teachers in the control schools (Table 5.7). The indicator measuring the difference effect size does not have high values, but the tendency is systematically in favour of SAI schools.
Table 5 7 Absence control and pupil support procedures in SAI and control schools, as evaluated by teachers
SAI CONTROL
t p Cohen’s
d
Mean N
Std.
Dev. Mean N
Std.
Dev.
Pupil attendance is monitored. 3.84 270 0.363 3.55 237 0.772 5.550 <.001 0.09
Absence reasons are checked. 3.81 269 0.396 3.66 239 0.526 3.651 <.001 0.10
Dropout reasons are checked. 3.73 268 0.452 3.55 240 0.632 3.747 <.001 0.12

Page 98 of 198
The teaching staff systematically
monitors and checks pupils’ results. 3.74 268 0.442 3.63 240 0.533 2.445 <.001 0.12
The teaching staff follows the pupils’
individual progress and compares
projected performance with the real
one.
3.66 270 0.527 3.44 240 0.590 4.400 <.001 0.14
Personalised intervention plans are
prepared, setting objectives for the
areas of intervention identified in the
pupil’s results analysis.
3.44 269 0.618 3.00 239 0.791 7.070 <.001 0.18
Teachers are involved in setting the
objectives and the next stages of the
intervention plan.
3.50 270 0.602 3.09 239 0.820 6.446 <.001 0.17
Pupils are involved in setting the
objectives and the next stages of the
intervention plan.
3.18 270 0.755 2.74 238 0.866 6.092 <.001 0.24
Parents are involved in setting the
objectives and the next stages of the
intervention plan.
2.96 270 0.799 2.65 238 0.882 4.236 <.001 0.27
One of the most important aspects considered by the School Attendance Initiative was fostering an
increase in the school’s attractiveness to pupils (“friendly school”). In order to assess this aspect, we
compared visit sheet evaluations carried out by evaluation team members. For that purpose, we
integrated evaluations regarding the internal and external appearance of schools into two summative
indicators (internal appearance and external appearance). The comparison result is illustrated in Table
5.8
Table 5 8 Comparison of internal and external appearance indicators in SAI and control schools
SAI Control t p
Cohen’s
d Mean
Std.
Dev. Mean
Std.
Dev. Internal appearance
(Cronbach’s Alpha39=.91) 37.91 12.16 30.79 12.96 2.21 .03 0.57
External appearance
(Cronbach’s Alpha=.89 16.50 5.18 14.59 7.12 1.15 .25 0.31
As can be seen, the assessment of both aspects, internal and external appearance, are in favour of SAI
schools, although only the differences in terms of internal appearance reach the statistical significance
threshold, but with an effect size that exceeds the medium level. This was visible, during the visits to SAI
schools, in the aesthetic, functional and informational quality of the common areas (hallways) and
classrooms.
School-level results
This section of the report is dedicated to level 4 of the Kirkpatrick model, referring to the results
observed with regard to the main SAI objectives (school absenteeism and dropout) or other aspects
derived from these objectives (repetition, promotion from one educational level to the next).
39 Cronbach’s Alpha is a statistical indicator of measurement reliability, which takes values between 0 and 1. The closer the value is to 1, the more we can trust that the measurement is reliable. The usually recommended minimum threshold is 0.7.

Page 99 of 198
The analysis of SAI impact in schools is based on a set of statistical indicators supplied to the evaluation
team by UNICEF, in cooperation with the Institute of Education Sciences, which requested official
information from all the schools where the School Attendance Initiative was carried out. These
statistical indicators cover all the years when each school was involved in the Initiative, during 2011-
2015. Each school was involved in SAI for three years, but they were not always consecutive. Whilst SAI
years 2 and 3 were rolled out for all schools in the same calendar years, year 1 was rolled out for some
schools in different calendar years.
For comparison purposes, apart from the 32 schools selected by UNICEF for the summative evaluation
(which we will henceforth call “the SAI group”), an equivalent number of schools that were not
subjected to the intervention were selected (henceforth called “the control group”). Considering that
the schools in the control group were selected in the year of the summative evaluation, there is no
information in this group equivalent to that of the SAI group for the first two years of the Initiative. For
the schools in the control group, the evaluation team requested from principals, during the visit, general
statistical indicators regarding school absenteeism and dropout for the last year before the evaluation.
Therefore, the impact of the Initiative on the SAI group schools can be analysed longitudinally, whereas
the comparison of the schools in the SAI group with those in the control group is possible only for the
last SAI year (see the model in Figure 5.9) and only within the limits of the available information.
Figure 5 9 General model of school data analysis
The evolution of absenteeism
The evolution of absenteeism rates in the schools included in the School Attendance Initiative is
presented in Table 5.9. The first observation that can be made is that the absence rate in lower
secondary education is almost three times higher than in primary education. Regarding the evolution
during the Initiative, data indicates a slightly increasing trend in absence rates between the first and last
SAI years, but this increase is not statistically significant and the effect size is modest, except in lower

Page 100 of 198
secondary education, where it exceeds the medium level. In other words, we can conclude that
absenteeism rates were stagnant. Table 5 9 Mean absence rate* by SAI year, educational level and total
Year 1 Year 2 Year 3
F(40) p Eta
squared** Mean Std.
Dev.
Mean Std.
Dev.
Mean Std.
Dev.
Primary 20.20 19.94 21.29 23.82 21.74 25.88 .07 .93 .05
Lower
secondary
54.89 52.45 59.66 50.11 60.59 54.97 1.76 .18 .10
Total 34.81 30.85 38.62 40.10 38.26 39.56 .62 .54 .04
* Absence rate = number of absences per school/pupils enrolled in that year
**Eta squared is an effect size indicator, with the following interpretation thresholds:
small effect = .01, medium effect = .06, large effect = .014
Figure 5.10 is a graphic representation of the absence rate evolution from Table 5.9.
20.2 21.29 21.74
54.8959.66 60.59
34.8138.62 38.26
0
10
20
30
40
50
60
70
Year 1 Year 2 Year 3
Primary Lower Sec. Total
Figure 5 10 Absence rate evolution, by educational level and total, in SAI schools
The analysis of unexcused absences, which represent approximately 2/3 of the total absence rate, leads
to similar conclusions (Table 5.10, Figure 5.11). As in the case of absence rates, the unexcused absence
rate witnessed a slight upward trend during SAI years, without reaching the statistical significance
threshold. This is with the exception of lower secondary education, where the increase (from 29.54% to
36.52%) reaches the statistical significance threshold and the effect size index (0.19) exceeds the “high”
threshold.
40 ”F” is the value of the Repeated Measures ANOVA statistical test. In our case, this procedure analyses the extent
to which absence rate averages from the three SAI years differ (vary) from one another. The bigger the differences,
the more the value of the test increases. When the statistical significance (p) is less than 0.05, we are dealing with a
significant variation of the means. Partial eta squared (the effect size) shows how large the differences are (how
large the variation of the means is during SAI).
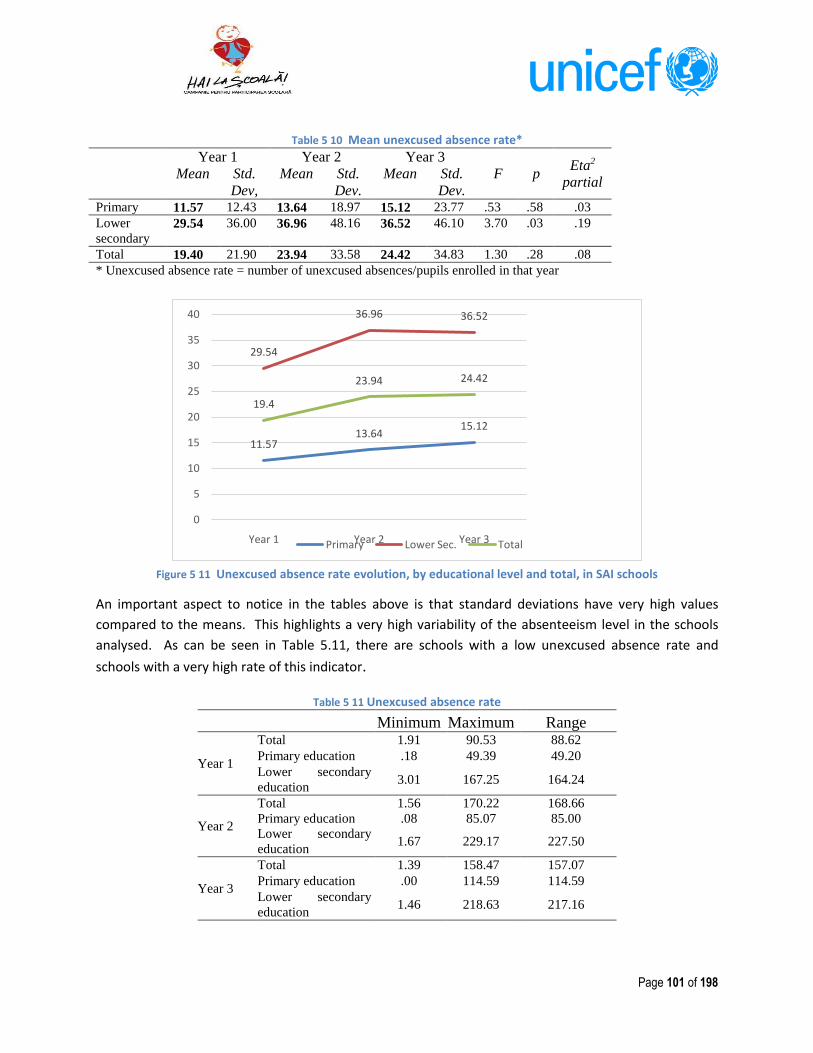
Page 101 of 198
Table 5 10 Mean unexcused absence rate*
Year 1 Year 2 Year 3
F p Eta2
partial Mean Std.
Dev,
Mean Std.
Dev.
Mean Std.
Dev. Primary 11.57 12.43 13.64 18.97 15.12 23.77 .53 .58 .03
Lower
secondary 29.54 36.00 36.96 48.16 36.52 46.10 3.70 .03 .19
Total 19.40 21.90 23.94 33.58 24.42 34.83 1.30 .28 .08
* Unexcused absence rate = number of unexcused absences/pupils enrolled in that year
11.5713.64
15.12
29.54
36.96 36.52
19.4
23.94 24.42
0
5
10
15
20
25
30
35
40
Year 1 Year 2 Year 3Primary Lower Sec. Total
Figure 5 11 Unexcused absence rate evolution, by educational level and total, in SAI schools
An important aspect to notice in the tables above is that standard deviations have very high values
compared to the means. This highlights a very high variability of the absenteeism level in the schools
analysed. As can be seen in Table 5.11, there are schools with a low unexcused absence rate and
schools with a very high rate of this indicator.
Table 5 11 Unexcused absence rate
Minimum Maximum Range
Year 1
Total 1.91 90.53 88.62
Primary education .18 49.39 49.20
Lower secondary
education 3.01 167.25 164.24
Year 2
Total 1.56 170.22 168.66
Primary education .08 85.07 85.00
Lower secondary
education 1.67 229.17 227.50
Year 3
Total 1.39 158.47 157.07
Primary education .00 114.59 114.59
Lower secondary
education 1.46 218.63 217.16

Page 102 of 198
In order to tailor the analysis, we have chosen a graphic representation of the difference between the
total absence rate in year 3 and the total absence rate in year 1 (Figure 5.12). As can be seen, in the case
of most schools, the differences are around 0. However, there are schools where the absence rate grew
very much in the third SAI year, as compared to year 1: Liești Secondary School No. 2(41) and Botoșani
Secondary School No. 3.
Figure 5 12 Variation in total absence rate difference (difference between year 3 and year 1)
Both schools mentioned have particular characteristics and one of them (the school in Liești) will be
analysed in a case study. But even without them it is obvious that, while in some schools absence rates
decreased in year 3, in other schools absence rates increased, as compared to year 1. Calculating the
difference between year 3 and year 1, we found that the differential absence rate decreased in 15 of the
schools and increased in the other 17.
Trying to explain this difference, we compared the two categories of schools in light of other variables:
area (urban/rural), distance to the closest city, quality of internal school environment, quality of external
environment, budget allocated per pupil, etc. Of all the variables analysed, only two proved to have a
connection with the downward trend of the number of absences: the number of pupils enrolled and
pupils' ethnic ratio.
Regarding the total number of pupils enrolled, it is higher in the case of the schools where absence rates
increased in year 3 compared to year 1 (t=2.01, p=.05, Cohen's d=.70). This result suggests that the
absence problem is managed less efficiently in schools with a higher number of pupils. As a result, we
can conclude that the number of pupils is a risk factor for the level of absenteeism and, in larger schools,
absence control has to get more attention.
Regarding the relationship between pupils’ ethnic ratio and the decrease/increase in absence rates
between year 1 and year 3, results are presented in Table 5.12. As can be seen, if we consider the share
of Roma pupils and that of Romanian pupils separately in relation to the decrease/increase in absence
rates, the conclusions are as follows:
- The average share of Roma pupils is higher in schools where absence rates decreased in year 3
compared to year 1.
41We must clarify that, given the particular situation in Liești School, its data on absenteeism and dropout was not included in the statistical analysis.

Page 103 of 198
- The average share of Romanian pupils is lower in schools where absence rates decreased in year
3 compared to year 1.
Table 5 12 T-test of the difference between the average share of Roma and Romanian pupils and absence rate evolution between SAI year 3 and SAI year 1
Percentage
of pupils
Absence rate
Year 3 - Year 1 Mean Std. Dev. t p
Cohen's
d
Roma Decreases 56.83 36.80
3.49 .001 1.50 Increases 19.82 20.05
Romanian Decreases 39.67 34.381
3.42 .001 1.25 Increases 77.06 24.628
These results support the conclusion that, in schools with a higher share of Roma pupils, more attention was given to absence control, which led to a significant decrease in absence rates during SAI implementation (Cohen's d>1). A similar conclusion is reached if we analyse the relationship between the pupils' ethnic composition on three levels (multicultural schools, Romanian only, Roma only) and absence rate decrease/increase.
Table 5 13 Relationship between the school's ethnic environment and absence rate decrease/increase
The school’s ethnic environment
Multicultural Romanian
only
Roma
only
Total
Absence rate
Decreases 13 0 2 15
Increases 11 6 0 17
Total 24 6 2 32 Chi-square=8.07, df=2, p=.01, Cramer's phi=.50 (high effect size)
Results of the chi-square test for the data in Table 5.13 indicate that the category of schools where
absence rates decreased in year 3 compared to year 1 includes more schools with a multicultural
environment (13) plus the two schools with only Roma pupils. In the category of schools where absence
rates increased, there are 11 schools with a multicultural environment plus six schools with only
Romanian pupils. These results do not negate the fact that absenteeism is relatively higher in schools
with a higher share of Roma pupils, but they convincingly support the conclusion that in these schools
absence rates witnessed a downward trend during SAI implementation.
The comparative analysis of absence rates between the schools in the SAI group and those in the control
group is presented in table 5.14. Results show that, although the absence rate has higher nominal values
for SAI schools, the differences are not statistically significant and the effect size has very small values. Table 5 14 Comparison of absence rates between SAI and control schools
SAI Control t p
Cohen's
d Mean
Std.
Dev. Mean
Std.
Dev. Primary education
22.77 26.77 22.94 35.97 .014 .98 .00
Lower secondary education 63.01 41.89 54.80 31.92 1.81 .07 .20
Total 39.74 31.74 39.87 30.02 .87 .37 .00

Page 104 of 198
Evolution of school dropout
School dropout rates showed a downward trend in the schools subject to SAI interventions compared to
SAI schools taken as a whole (Table 5.15). For primary education, data indicates a 50% decrease in
school dropout rates (from a 0.04 annual rate in SAI year 1 to 0.02 in year 3), and for secondary
education, a 14.3% decrease (from 0.07 to 0.06). Overall, dropout rates decreased by 20% (from 0.05 to
0.04) in SAI schools. The Repeated Measures ANOVA longitudinal test indicates a significant variation
only for primary education and overall values, with a high level of the effect size index, which indicates a
decrease that can be considered statistically significant. In lower secondary education, the decrease is
not statistically significant, but the effect size is not negligible, which suggests a downward trend that
cannot be ignored.
Table 5 15 Dropout rates* by SAI year and educational level
Year 1 Year 2 Year 3
F p Eta2 Mean Std.
Dev.
Mean Std.
Dev.
Mean Std.
Dev. Primary .04 .05 .02 .03 .02 .04 2.60 .09 .14
Lower
secondary .07 .08 .05 .06 .06 .06 .83 .44 .05
Total .05 .05 .03 .04 .04 .05 3.66 .03 .19
*Dropout rate = number of dropouts/pupils enrolled
A more intuitive picture of the data in the above table is summarised in Figure 5.13, which presents the
evolution of dropout rates between the first and last SAI years, in each educational level and overall. As
can be seen, there is a downward trend on all levels, with the most marked one in primary education
(50%).
0.04
0.02
0.07
0.06
0.05
0.04
0
0.01
0.02
0.03
0.04
0.05
0.06
0.07
0.08
Year 1 Year 3Primary Lower Sec. Total
Figure 5 13 Evolution of school dropout rates in SAI schools between the first and last SAI years

Page 105 of 198
For comparison, below is presented the situation of school dropout at national level during the implementation period of the School Attendance Initiative (Table 5.16). As can be seen, national school dropout levels are clearly superior to those seen in SAI schools.
Table 5 16 School dropout rates in primary and lower secondary education
2011/2012 2012/2013 2013/2014
Primary education
Total 1.6 1.1 1.2
Urban 1.6 0.9 1.1
Rural 1.5 1.3 1.4
Lower secondary education
Total 1.9 1.7 1.8
Urban 1.8 1.4 1.5
Rural 2.1 2.1 2.1
Source: Data computed based on information from NIS, 2009-2015. Adapted table, taken from the “Report on the
state of non-tertiary education in Romania”, Institute of Education Sciences, 2015 (pending publication).
As in the case of absenteeism, we analysed the differential dropout rate (the difference between
dropout rates in the last and first SAI years). The variation of this indicator, presented in Figure 5.14,
shows a much higher uniformity than in the case of absenteeism. Nevertheless, the box-plot highlights
in the upper side two schools where the dropout rate increased excessively in SAI year three, and in the
lower side two schools where in year three the dropout rate is much lower than the mean distribution.
Figure 5 14 Variation of the differential total dropout rate between SAI year 3 and SAI year 1
To explain the differential dropout rate (why in some schools dropout rate decreases and in others it
increases, compared to the first SAI year), we analysed the relationship between this variable and other
available variables. Of all the associations tested, the only ones that proved statistically significant were
the number of pupils enrolled in SAI year 1 (r=-0.37, p=0.03), the number of unexcused absences in year

Page 106 of 198
3 (r=0.38, p=0.03) and, to some extent, the repetition rate in year 3 (r=0.31, p=0.08). This means that the
dropout rate had an upward trend in year 3 compared to year 1 in the schools with a smaller number of
pupils enrolled in the first SAI year and in the schools with a higher number of unexcused absences and
a higher number of repeaters in SAI year 3. There were no significant associations of the differential
dropout rate with variables that describe the ethnic composition of the school.
Regarding the comparison of dropout rates between SAI schools and control schools (Table 5.17),
nominal values are slightly higher for SAI schools, but the differences do not reach statistical significance
neither for primary or lower secondary education nor for the cumulative rate of both educational levels.
Table 5 17 Comparison of dropout rates between SAI and control schools
SAI Control
t p Cohen's
d Mean
Std.
Dev. Mean
Std.
Dev. Primary education .028 .044 .018 .031 1.00 .32 .25
Lower secondary education .063 .072 .047 .055 .982 .33 .26
Total .042 .053 .031 .037 .908 .36 .24
Repetition rate
Repetition represents a state which describes a pupil's school performance. It can result either from
poor grades or from an incomplete academic record due to a high number of absences, or from both
reasons. In any case, repetition represents one of the important precursors of school dropout, which is
why it was included in our analysis.
Data regarding SAI schools (Table 5.18) show that, although the mean values of the repetition rate
during SAI years did not change in a statistically significant way (the Repeated Measures ANOVA test is
not significant, which can be explained by the relatively small sample of schools), the effect size
approaches the “medium” threshold, at least in primary education and overall (both educational levels
combined).
Table 5 18 Repetition rates* by SAI year and educational level
Year 1 Year 2 Year 3
F p Eta2 Mean Std.
Dev.
Mean Std.
Dev.
Mean Std.
Dev.
Primary .03 .04 .04 .04 .02 .03 .94 .40 .05
Lower
secondary .07 .07 .08 .06 .07 .07 .18 .83 .01
Total .05 .04 .05 .05 .04 .04 .77 .46 .04
Repetition rate = number of repeaters/pupils enrolled
Data for primary schools in the SAI group indicate a 33.3% decrease in the repetition rate in year 3
compared to SAI year 1 (from 0.03 to 0.02) and 20% for both educational levels combined (from 0.05 to
0.04). For lower secondary education, the repetition rate remained practically unchanged during the
Initiative (Figure 5.15).

Page 107 of 198
0.03
0.02
0.07 0.07
0.05
0.04
0
0.01
0.02
0.03
0.04
0.05
0.06
0.07
0.08
Year 1 Year 3Primary Lower Sec. Total
Figure 5 15 Repetition rate evolution between the first and last SAI years in SAI schools
Promotion by educational level
The continuity of schooling from one level to the next represents one of the major challenges of the
educational process, and, implicitly, of the School Attendance Initiative. Table 5.19 summarises the
percentages reported by SAI schools for pupils who successfully passed from the primary to the lower
secondary level and for those who passed from lower secondary level to high school.
Table 5 19 Share of pupils promoted from one level to the next
Year 1 Year 2 Year 3
F p Eta2 Mean Std.
Dev.
Mean Std.
Dev.
Mean Std.
Dev.
Gr 4→5 90.52% 15.89 91.51% 13.08 91.15% 11.17 .20 .81 .02
Gr 8→9 76.59% 27.69 76.52% 26.24 75.03% 26.49 .21 .81 .01
Difference 14.90% 18.74 15.05% 20.16 16.19% 25.30 .08 .92 .01
As can be seen, the analysis of data variation during the three SAI years (Repeated Measures ANOVA)
does not reach the level of statistical significance, and the effect size barely reaches the small level.
Most probably, this is due to the relatively small number of schools in the SAI group and to highly
heterogeneous data from one school to the other. Nevertheless, we consider that numerical values
support several conclusions. The average promotion rate from fourth to fifth grade is higher than that
from eighth to ninth grade, in each of the three SAI years. Furthermore, whilst the promotion rate from
fourth to fifth grade was on a slight upward trend (from 90.52% to 91.15%), the promotion rate from
eighth to ninth grade marks a slight downward trend (from 76.59% to 75.03%). As a result, the
difference in promotion rates between the two milestones grows progressively, from 14.90% in the first
year to 15.05% in year 2 and 16.19% in year 3 of the Initiative. This suggests that pupils’ aspiration to
continue their studies beyond lower secondary education witnessed a slight downward trend during SAI
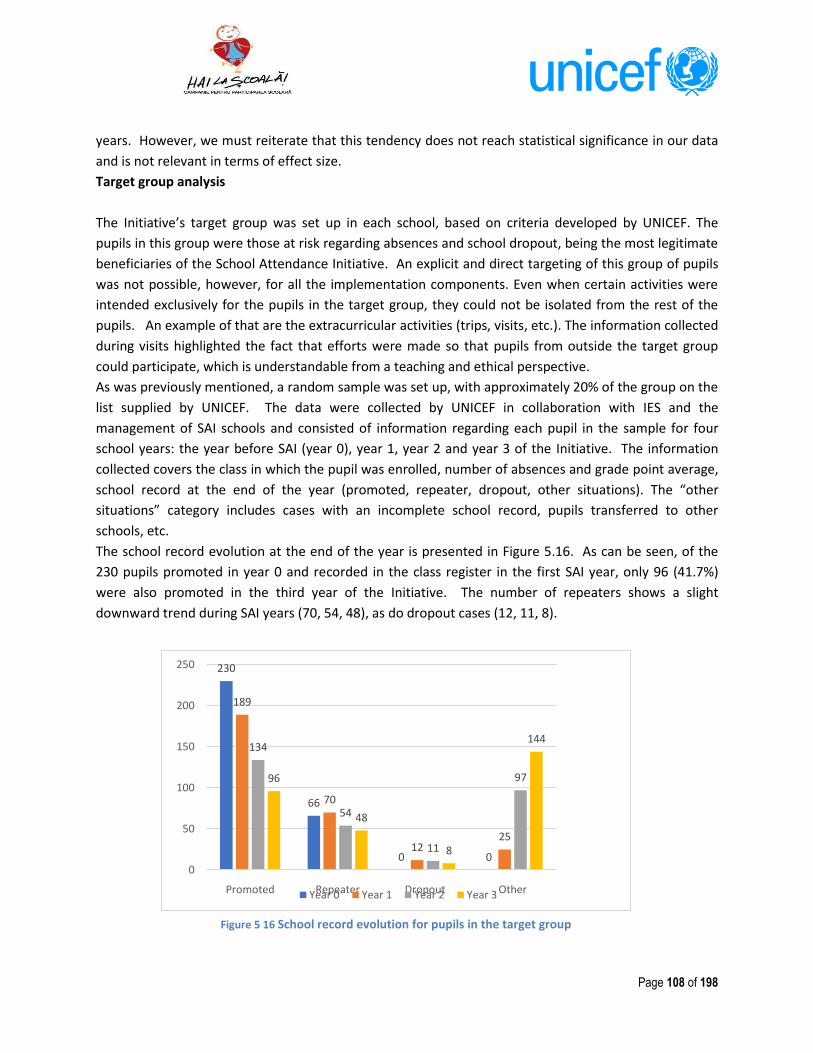
Page 108 of 198
years. However, we must reiterate that this tendency does not reach statistical significance in our data
and is not relevant in terms of effect size.
Target group analysis
The Initiative’s target group was set up in each school, based on criteria developed by UNICEF. The
pupils in this group were those at risk regarding absences and school dropout, being the most legitimate
beneficiaries of the School Attendance Initiative. An explicit and direct targeting of this group of pupils
was not possible, however, for all the implementation components. Even when certain activities were
intended exclusively for the pupils in the target group, they could not be isolated from the rest of the
pupils. An example of that are the extracurricular activities (trips, visits, etc.). The information collected
during visits highlighted the fact that efforts were made so that pupils from outside the target group
could participate, which is understandable from a teaching and ethical perspective.
As was previously mentioned, a random sample was set up, with approximately 20% of the group on the
list supplied by UNICEF. The data were collected by UNICEF in collaboration with IES and the
management of SAI schools and consisted of information regarding each pupil in the sample for four
school years: the year before SAI (year 0), year 1, year 2 and year 3 of the Initiative. The information
collected covers the class in which the pupil was enrolled, number of absences and grade point average,
school record at the end of the year (promoted, repeater, dropout, other situations). The “other
situations” category includes cases with an incomplete school record, pupils transferred to other
schools, etc.
The school record evolution at the end of the year is presented in Figure 5.16. As can be seen, of the
230 pupils promoted in year 0 and recorded in the class register in the first SAI year, only 96 (41.7%)
were also promoted in the third year of the Initiative. The number of repeaters shows a slight
downward trend during SAI years (70, 54, 48), as do dropout cases (12, 11, 8).
230
66
0 0
189
70
1225
134
54
11
9796
48
8
144
0
50
100
150
200
250
Promoted Repeater Dropout OtherYear 0 Year 1 Year 2 Year 3
Figure 5 16 School record evolution for pupils in the target group

Page 109 of 198
Promoted Repeater Dropout Other Promoted Repeater Dropout Other
BOYS GIRLS
Year 0 123 43 0 0 107 23 0 0
Year 1 99 41 9 17 90 29 3 8
Year 2 68 31 5 62 66 23 6 35
Year 3 53 27 4 82 43 21 4 62
0
20
40
60
80
100
120
140
Year 0 Year 1 Year 2 Year 3
Figure 5 17 School record evolution for pupils in the target group, by gender
Regarding the evolution of absences (Figure 5.18), we note an upward trend, starting with the first SAI
year, for both boys and girls. Boys have a systematically higher number of absences than girls, but there
is a statistically significant difference only in SAI year two. The Repeated Measures ANOVA test on the
evolution in the number of absences during SAI does not reach statistical significance and the increase
effect is not important. We attribute this tendency to the increase in pupils’ age, which causes, on the
one hand, an increase in the level of personal independence and, on the other hand, increased
involvement in household support activities.
Year 0 Year 1 Year 2 Year 3
BOYS 40.56 64.45 93.73 132.62
GIRLS 31.92 42.49 61.87 123.68
0
20
40
60
80
100
120
140
160
180
Figure 5 18 General evolution of absences for pupils in the target group

Page 110 of 198
Figure 5.19 extends the absence analysis to the class in which the pupils were enrolled in each
SAI year.
M F M F M F M F M F M F M F M F M F
Grade 0 Grade 1 Grade 2 Grade 3 Grade 4 Grade 5 Grade 6 Grade 7 Grade 8
Year 0 4 34.48 45.81 15.63 30.95 30.77 52.12 60.18 37.14 121.92 37 134.89 83.83 72.45 75.63 398.67
Year 1 13 6 42.03 72 38.88 55.1 76.61 91.36 174.71 69.96 204.2 136.56 129.18 153.47 103.28 157.18
Year 2 34.22 80 56.16 57.63 40.15 143.65 115 57.43 146 85.95 189.22 200.21 126.3 131.58
Year 3 403.67 232.5 16.82 130 59.67 57.33 118.46 150.33 139.67 67.14 289.67 170.75 106.06 91.67
050
100150200250300350400450
*
* Value generated by four second graders with a very high number of absences, one of whom was declared a
dropout and the others as repeaters, in that year. Figure 5 19 Absences for pupils in the target group, by grade
As can be seen, the higher the school grade, the higher the number of absences.
To better understand the evolution in the number of absences, we have analysed their variation
according to gender and grade, for each SAI year (factorial ANOVA). The results are presented in the
tables and images below.
Source: df F Sig.
Partial
Eta
Squared
Observed
Power*
Corrected Model 15 3.215 0.000 0.152 0.999
Gender 1 0.058 0.809 0.000 0.057
Grade 7 4.590 0.000 0.107 0.994
Gender*Grade 7 1.699 0.109 0.042 0.692
*Only the “Grade” factor has a significant impact on the
number of absences. There is no cumulative statistical effect
of the grade and gender on the evolution of absences.
Up to fourth grade, boys have more absences than girls, while
in fifth and sixth grades the situation is reversed. In seventh
and eighth grade, girls have once again more absences than
boys.
Figure 5 20 Factorial ANOVA for the number of absences in SAI year 1

Page 111 of 198
Source: df F Sig.
Partial
Eta
Squared
Observed
Power*
Corrected
Model 13 1.810 0.045 0.120 0.894
Gender 1 0.084 0.773 0.000 0.060
Grade 6 2.579 0.020 0.082 0.841
Gender*Grade 6 1.057 0.390 0.035 0.411
*Only the “Grade” factor has a significant impact on the
number of absences. There is no cumulative statistical
effect of the grade and gender on the evolution of
absences.
As in year 1, boys have a higher number of absences than
girls in grades 4, 5 and 6.
Figure 5 21 Factorial ANOVA for the number of absences in SAI year 2
Source: df F Sig. Partial Eta
Squared
Observed
Power*
Corrected Model 13 2.036 0.022 0.161 0.928
Intercept 1 56.899 0.000 0.292 1.000
Gender 1 0.755 0.386 0.005 0.139
Grade 6 2.888 0.011 0.112 0.882
Gender*Grade 6 0.854 0.531 0.036 0.329
*As in the first two SAI years, absences vary significantly only in
terms of grade, not gender or their interaction.
Figure 5 22 Factorial ANOVA for the number of absences in SAI year 3
The GPA for pupils in the target group (Figure 5.23) has a slightly progressive evolution starting with the
first SAI year. As in the case of absences, with GPA, the evolution also does not reach statistical
significance.

Page 112 of 198
6.93
6.68
6.93
7.12
6.2
6.3
6.4
6.5
6.6
6.7
6.8
6.9
7
7.1
7.2
7.3
Year 0 Year 1 Year 2 Year 3
Figure 5 23 GPA evolution for pupils in the target group, by SAI year
(The GPAs were calculated only for lower secondary school pupils, because primary school pupils receive descriptive grades).
The analysis of the GPA depending on the school grade of pupils in the target group is presented in
Figure 5.24. Generally, GPA variation is low in all grades, except 8th grade, where there is a slight
progressive increase during SAI.
Year 0 Year 1 Year 2 Year 3
5 7.35 6.55 7.37 6.92
6 6.64 7.00 6.73 7.60
7 6.85 6.64 7.00 6.76
8 6.49 6.69 7.27
9 6.11 6.58
5.005.506.006.507.007.508.008.509.00
Figure 5 24 GPA for pupils in the target group, by grade
To better understand the variation in school performance, we have analysed the evolution of the GPA
depending on gender and grade, with control of the number of absences (factorial ANOVA). The results
of the analysis are presented in the figures below.

Page 113 of 198
Source: df F Sig. Partial Eta
Squared
Observed
Power*
Corrected Model 8 2.050 0.049 0.165 0.801
Gender 1 4.559 0.035 0.049 0.560
Grade 3 2.073 0.110 0.065 0.514
Gender*Grade 3 0.110 0.954 0.004 0.069
No. of absences 1 6.162 0.015 0.065 0.690
In SAI year 1, the score varies significantly only in relation to the
gender factor. The girls have systematically higher GPAs than boys,
even though, after 6th grade, school performance tends to
decrease progressively.
Figure 5 25 Factorial ANCOVA for GPA variation in relation to gender and grade, in year 1 (covariant: no. of absences)
Source: df F Sig. Partial Eta
Squared
Observed
Power*
Corrected Model 8 4.095 0.001 0.349 0.986
Gender 1 8.342 0.005 0.120 0.811
Grade 3 2.014 0.121 0.090 0.493
Gender*Grade 3 0.132 0.949 0.006 0.073
No. of absences 1 13.774 0.000 0.184 0.955
In SAI year 2, school performance varies significantly only in relation
to gender, girls having higher GPAs than boys.
Figure 5 26 Factorial ANCOVA for GPA variation in relation to gender and grade, in year 2 (covariant: no. of absences)
Source: df F Sig. Partial Eta
Squared
Observed
Power*
Corrected Model 8 3.817 0.001 0.337 0.979
Gender 1 4.746 0.033 0.073 0.573
Grade 3 1.304 0.282 0.061 0.331
Gender*Grade 3 1.254 0.298 0.059 0.319
No. of absences 1 9.999 0.002 0.143 0.875
In SAI year 3, school performance varies significantly only in relation
to gender, girls having higher GPAs than boys (however, the
differences are very small in 5th and 7th grades).
Figure 5 27 Factorial ANCOVA for GPA variation in relation to gender and grade, in year 3 (covariant: no. of absences)
In conclusion, the data in the target group sample does not show a significant evolution during SAI. Of
the 296 pupils from the analysed sample, enrolled in the first SAI year, only 96 were reported as having

Page 114 of 198
promoted the grade in the third year. During this entire period, the total number of school dropouts is
41, representing 13.85% of the children enrolled at the start of the Initiative. However, we cannot help
but raise the possibility of a certain relativity of the numbers reported by schools, especially regarding
dropout. This is determined by several factors: the interest to limit “negative” reporting, the
interpretability of school dropout, the difficulty in following up with the pupils leaving town, many times
going abroad where they can continue their studies without this being registered in their place of
residence.
Regarding the number of absences in the case of pupils from the target group, although on a slight
upward trend, it does not reach the statistical significance level, which justifies the conclusion that
things stagnated. An analysis of the source of absence variation has highlighted the fact that age
(reflected in “school grade”) is a factor with a significant impact, but gender is not.
In regards to school performance (GPA), this sees a progressive increase during SAI years, but this
variation does not reach a statistical significance threshold The analysis of factors that impact GPA
(controlling the effect of the number of absences) shows that gender has a statistically significant effect,
while school grade does not.
Analysis of individual impact (principals, teaching staff, pupils, parents)
The School Attendance Initiative set for itself to reach not only institutional outcomes and changes, but
also changes at the level of all the actors involved in the teaching and learning process, school
managers, teachers, pupils, parents. This objective is based on the reasoning that the reduction in
school absenteeism and dropout can be achieved (i) only if all the educational actors promote education
and pursue these objectives within their programmes, and (ii) if individual skills and competencies are
developed, to attract and maintain pupils in school. This intervention model does not ignore material
resources, it only supports the fact that, even in conditions of scarce resources, progress can be made in
reducing school absenteeism and dropout.
The evaluation process pursued a variety of aspects referring to the impact of the School Attendance
Initiative at individual level, using various methods, quantitative (questionnaires) and qualitative
(interviews, focus groups). Below we will present the most important findings resulting from the analysis
of individual data. The general model for the quantitative analysis is presented in Figure 5.28. We will
analyse the aspects of the individual impact of the Initiative at the level of each group of people and,
where there is equivalent information, we will compare categories of respondents within the group of
SAI schools or within the same category from the SAI group and the control group. Also, we will support
quantitative results with qualitative information, when available.

Page 115 of 198
Figure 5 28 General model of data analysis at individual level
In relation to the Kirkpatrick mode, the conclusions in this section of the analysis are relevant mainly for
reactions, learning and behaviour. By highlighting them, convincing arguments can be brought
regarding SAI’s ability to have produced sustainable effects that can regenerate by themselves in the
future.
SAI popularity
SAI popularity refers to the extent to which it is known and has remained in the conscience of the
participants as an activity with a clear identity and objectives. It should be mentioned, in passing, that
the name of the Initiative has also contributed to this goal, for a simple, direct and mobilising expression
of identity was used in Romanian: Hai la şcoală! [Let’s Go to School!].
The popularity issue does not apply to principals and teachers, who were not only subjects but also
agents involved in its implementation, but mostly to pupils and parents. Of the 394 pupils in SAI
schools, 388 (98.47) state they have heard of the School Attendance Initiative, and of the 246 parents of
the pupils in these schools, 237 (96.3%) state they have heard of the School Attendance Initiative. We
find it significant that SAI popularity exceeded the limits of the schools where it was carried out.
Therefore, of the 284 questioned pupils from the control schools, 89 (31.33%) declare they have heard
of this initiative. Also, 98 (42.2%) of the teachers in the control schools (232) state they have heard of
the School Attendance Initiative.
Table 5 20 Popularity of the School Attendance Initiative with students from SAI and control schools
Have you heard of the
School Attendance
Initiative?
School Total
SAI Control YES 388 89 477
NO 6 195 201
Total 394 284 678
Chi-square=356.6, p<0,0005, Cramer's phi=0.073

Page 116 of 198
These summary numbers confirm what the evaluation team could find during school visits when,
frequently, principals or teachers from the control schools had words of appreciation regarding this
initiative, which they had learned about from their colleagues in the schools participating in the
Initiative. They expressed their wish that their schools also be included in such programmes. With very
few exceptions, in the visited SAI schools we could find visible signs of the Initiative, in the displays
inside the school or even outside it. All these are convincing signs of the fact that, for participating
schools, the School Attendance Initiative was a reference point in their activity. Many times, principals
and teachers mentioned during interviews the fact that they would like SAI, with all its components, to
continue.
Satisfaction with SAI training activities
During the School Attendance Initiative, teachers participated in many training activities organised by
implementing partners. In the same period, the teachers from the control group also benefited from
various courses, some of them with similar goals, others different from the ones in the School
Attendance Initiative. Table 5.21 presents a summary of the satisfaction evaluation regarding these
courses by the two categories of teachers. Overall, teachers in both groups of schools manifest a pretty
high level of appreciation, but in all cases, the teachers in the SAI group are more satisfied with the
quality of the courses than their colleagues from the schools in the control group. It is worth noting that
the values of the effect size are pretty high, which proves that the differences are important.
Table 5 21 Assessment on training courses during SAI, by teachers from SAI and control schools
SAI CONTROL
Mean N Std.
Dev. Mean N
Std.
Dev. t p
Cohen's
d Subject 4.63 237 0.51 4.35 224 0.70 4.97 <.005 0.46 Methods presented 4.61 236 0.53 4.35 223 0.62 4.79 <.005 0.45 Trainer performance 4.66 231 0.53 4.30 221 0.70 6.25 <.005 0.58 Experience exchange with
other participants 4.65 235 0.60 4.27 222 0.70 6.24 <.005 0.58
Organisation 4.73 237 0.47 4.23 224 0.64 9.52 <.005 0.89 Atmosphere 4.78 238 0.44 4.40 223 0.63 7.59 <.005 0.70 GLOBAL INDICATOR
(Cronbach’s Alpha=.89) 27.79 238 2.85 25.76 224 3.32 7.06 <.005 0.66
In turn, the parents of pupils from the schools participating in the School Attendance Initiative, rate
highly the activities from the parent education courses they participated in (Figure 5.29), which they
consider “useful” and “relevant” almost unanimously to a very great and great extent.

Page 117 of 198
Figure 5 29 Assessment on parent education courses by parents and SAI schools
The parents of pupils in SAI schools appreciate positively, in their vast majority, the experience they had
during SAI, as shown in the charts below (Figure 5.30).
Figure 5 30 Assessment on SAI effects by parents of pupils in SAI schools

Page 118 of 198
School principals’ assessment of their satisfaction with the cooperation with implementing partners and
institutional support structures is shown in Figure 5.31. As can be seen, the results don’t point out any
important differences. Regarding implementing partners, they did not always promote their identity
during the activities carried out in schools, which lowered their presence in the minds of the
participants. During the visits, the most frequently mentioned, next to UNICEF, perceived as the
“Initiative owner”, were the Institute of Education Sciences (IES) and the Holt-Iași Association.
Figure 5 31 Level of satisfaction with the cooperation with implementing partners and other structures
Use of ICT in the educational process
One of the important implementation components of the School Attendance Initiative was the
promotion of an education based on modern and active methods. In this category of methods falls also
the integration of information technology in teaching and learning activities. The questionnaires applied
to teachers include a set of items that refer to the use of ICT in class to: prepare lessons, carry out
lessons, evaluate pupils, communicate with parents, communicate with colleagues, manage
data/statistics, educational software. Table 5.22 contains the comparative analysis of the answers to
items and the summative score (Cronbach’s Alpha=0.83), between SAI schools and those in the control
group.
Table 5 22 Use of ICT in the educational process, comparison between SAI and control schools
SAI CONTROL
Use of ICT for: Mean N Std.
Dev. Mean N
Std.
Dev. t p
Cohen’s
d Pupil evaluation 3.43 262 0.96 3.03 229 1.10 1.775 .07 0.39

Page 119 of 198
Lesson preparation 4.16 269 0.77 4.04 235 0.81 5.493 <.001 0.16
Lesson delivery 3.78 269 0.81 3.37 231 0.85 4.274 <.001 0.49
Communication with
parents 3.04
256 1.08 2.64
222 1.14 3.893 <.001 0.36
Communication with
classmates 4.00
263 0.94 3.52
231 1.04 5.434 <.001 0.49
Data/statistics
management 4.29
263 0.86 3.78
230 1.07 5.913 <.001 0.53
Educational software 3.45 259 1.03 3.02 233 1.06 4.578 <.001 0.41
Summative score
(Cronbach’s Alpha=.83) 25.33 272 5.26 22.67 238 5.48 5.573 <.001 0.50
Results indicate a higher and statistically significant level of ICT use in SAI schools, in all types of
activities (except “pupil evaluation”), but also in the summative score. In turn, effect size indicators
highlight differences around the medium level. The conclusion we can draw is that ICT is present to a
greater extent in SAI schools than in those in the control group.
Teaching skills acquired during SAI
Table 5.23 and the chart accompanying it present the assessments of teachers from SAI schools
regarding the improved skills acquired during the School Attendance Initiative. As can be seen, they
assess, in a cumulative share of over 90%, that they have better skills than before SAI. Table 5 23 SAI teachers’ self-assessment of skills acquired during the Initiative (share of answer choices selected).

Page 120 of 198
(1 = not applicable; 2 = not at all; 3 = to a very small extent; 4 = to a great extent; 5 = to a very great extent)
0 1 2 3 4 5 I create a more favourable learning environment for
pupils .4 0 0 1.1 43.3 50
I use various teaching methods more efficiently 1.1 0 0 2.3 44.5 52.1
I support pupils with SEN better 9.4 .4 1.5 7.1 45.5 36.1
I support pupils at risk of dropout better 1.1 0 0 3.7 44.4 50.7
I collaborate better with pupils’ families .8 0 .4 4.5 49.2 45.1
I monitor more efficiently the pupils at risk of dropping
out 1.5 .4 .4 3.4 45.7 49.7
I identify dropout risk factors better 1.5 0 .4 2.6 47.2 48.3
Average % 2.26 0.40 0.68 3.53 45.69 47.43
The comparative analysis of teaching skill assessment by teachers in the SAI group and those in the
control group is presented in table 5.24. The results indicate the fact that all averages are in favour of
teachers from SAI schools, yet differences are pretty small. The aspects that reach the significance level
and also have a minimum effect size level are: stimulating pupils’ independent activities and stimulating
group/team learning. Overall, teachers in SAI schools state they are more satisfied with their
professional results than those in the control schools.
Table 5 24 Comparison of teaching skill assessments
SAI CONTROL
t p
Cohen’
s
d Mean N
Std.
Dev. Mean N
Std.
Dev.
Frequently, in your class, teaching is
predominant 3.41 270 0.936 3.46 239 0.938 0.558 0.570 0.05
Frequently, in your class, independent
learning activities for pupils are
predominant
3.70 272 0.821 3.48 238 0.922 2.837 0.005 0.25
Frequently, in your class, group/team
learning activities for pupils are
predominant
3.98 272 0.671 3.75 239 0.791 3.541 0.000 0.31
You start lessons by presenting the
objectives 4.40 272 0.623 4.28 239 0.836 1.859 0.064 0.16

Page 121 of 198
You give examples and explanations
during lessons 4.73 272 0.470 4.70 239 0.485 0.592 0.554 0.05
You create situations for pupils to apply
what they have been taught 4.53 271 0.536 4.48 239 0.715 0.912 0.362 0.08
You check the correctness of pupils’
activities/answers/ homework 4.63 271 0.588 4.60 239 0.540 0.577 0.564 0.05
You comment on pupils’ answers 4.43 271 0.651 4.35 239 0.740 1.312 0.190 0.12
You are pleased with the results of your
professional activity 4.21 271 0.500 4.07 239 0.554 3.151 0.002 0.28
SAI impact on pupils
Assessment of school climate
The degree to which pupils in the SAI and control groups appreciate the general school climate is
presented in Table 5.25. As can be seen, the pupils from SAI schools have higher appreciation averages,
both globally and on each indicator. It is also worth noting the effect size, which reaches the medium
value for the global score. This data allows us to conclude that the climate in SAI schools is assessed as
being better than in control schools.
Table 5 25 Pupils’ assessment of school climate
SAI CONTROL
t p Cohen’s
d
Mean Std.
Dev. Mean
Std.
Dev.
GLOBAL score (Cronbach’s Alpha=.70) 15.59 1.56 14.84 1.55 6.8 0.00 0.54
INDICATORS
School climate is pleasant 4.67 0.56 4.44 0.66 4.805 .000 0.37
I feel safe at school 4.76 0.52 4.54 0.79 8.084 .000 0.33
I am generally satisfied with school 4.66 0.68 4.47 0.72 2.504 .000 0.28
I feel rejected at school 1.59 1.24 1.39 0.92 2.477 .024 0.18
Regarding classmate relationships, the data in Table 5.26 does not indicate significant differences
between the two groups of schools.
Table 5 26 Pupils’ assessment of relationships with classmates
SAI CONTROL
t p
Cohen’
s
d
Mean
Std.
Dev. Mean
Std.
Dev.
GLOBAL score (Cronbach’s Alpha=.72) 21.34 3.65 20.97 3.86 1.245 .21 .10
INDICATORS
I feel very well with my schoolmates 4.66 0.64 4.61 0.63 0.953 .341 0.07
I am satisfied with my classmates 4.45 0.76 4.34 0.72 3.333 .070 0.14
In the last year, some classmates have
said bad things about me 2.31 1.45 2.22 1.31 3.530 .382 0.07
In the last year, some classmates have
laughed at me 2.05 1.38 1.86 1.18 0.888 .055 0.15
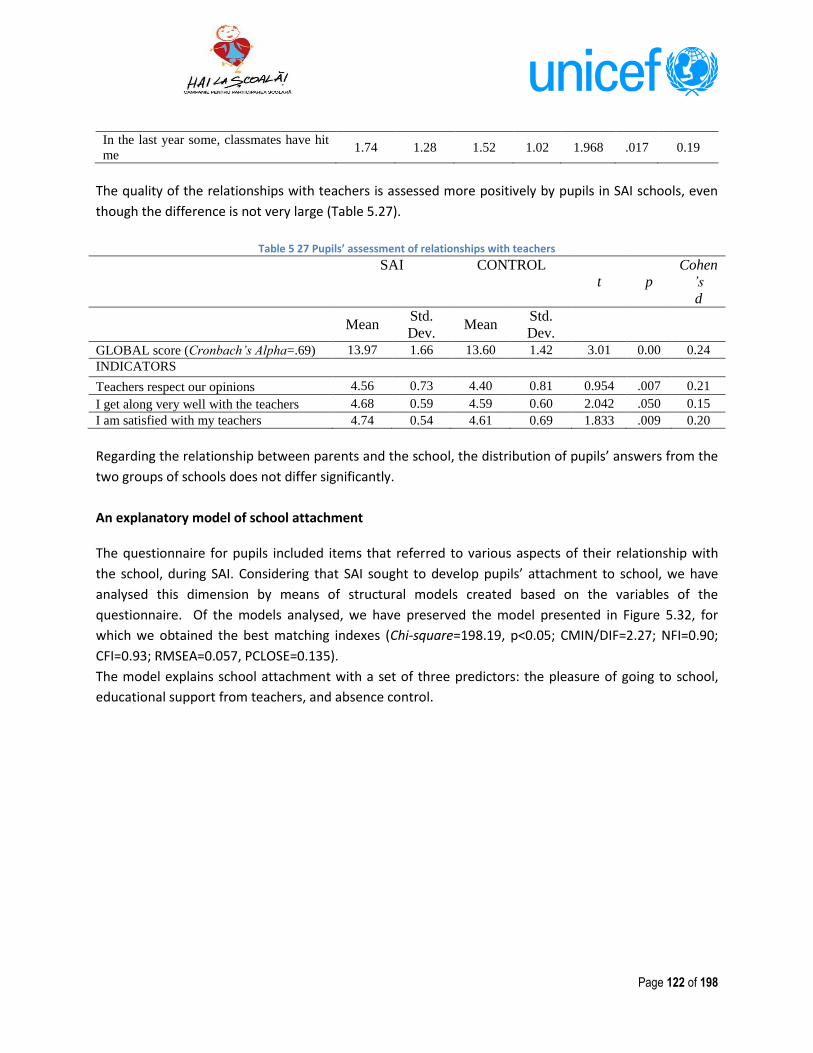
Page 122 of 198
In the last year some, classmates have hit
me 1.74 1.28 1.52 1.02 1.968 .017 0.19
The quality of the relationships with teachers is assessed more positively by pupils in SAI schools, even
though the difference is not very large (Table 5.27).
Table 5 27 Pupils’ assessment of relationships with teachers
SAI CONTROL
t p
Cohen
’s
d
Mean
Std.
Dev. Mean
Std.
Dev.
GLOBAL score (Cronbach’s Alpha=.69) 13.97 1.66 13.60 1.42 3.01 0.00 0.24
INDICATORS
Teachers respect our opinions 4.56 0.73 4.40 0.81 0.954 .007 0.21
I get along very well with the teachers 4.68 0.59 4.59 0.60 2.042 .050 0.15
I am satisfied with my teachers 4.74 0.54 4.61 0.69 1.833 .009 0.20
Regarding the relationship between parents and the school, the distribution of pupils’ answers from the
two groups of schools does not differ significantly.
An explanatory model of school attachment
The questionnaire for pupils included items that referred to various aspects of their relationship with
the school, during SAI. Considering that SAI sought to develop pupils’ attachment to school, we have
analysed this dimension by means of structural models created based on the variables of the
questionnaire. Of the models analysed, we have preserved the model presented in Figure 5.32, for
which we obtained the best matching indexes (Chi-square=198.19, p<0.05; CMIN/DIF=2.27; NFI=0.90;
CFI=0.93; RMSEA=0.057, PCLOSE=0.135).
The model explains school attachment with a set of three predictors: the pleasure of going to school,
educational support from teachers, and absence control.

Page 123 of 198
Figure 5 32 Explanatory model of school attachment for pupils in SAI schools
This statistical model includes variables measured by the questionnaire applied to pupils in the SAI
group and highlights a predictive mechanism for school attachment. As can be seen, school attachment
is predicted to the highest extent by educational support (beta regression coefficient = 0.60)42, followed
by the pleasure of going to school (beta = 0.43), and by absence control (beta = 0.29). Furthermore,
educational support also has an indirect effect on school attachment, as it determines an increase in the
pleasure of going to school (beta = 0.69). Also, absence control has, apart from a direct effect on school
attachment, an indirect one, being a predictor of educational support (beta = 0.54).
The utility of this model rests, on the one hand, on the fact that it highlights an explanatory mechanism
for school attachment, and on the other hand, on the fact that it identifies intervention directions to
increase school attachment. The model is proof that one of the key factors in this process is the
supportive relationship between teachers and pupils, paired with the other two variables, absence
control and the pleasure of going to school. We must clarify that this model does not cover all the
42 The beta regression coefficient is a standardised indicator, which can be understood as a correlation coefficient,
and shows how tight the relationship between a predictor (educational support) and a criterion (school attachment)
is. Its maximum value is 1.

Page 124 of 198
factors determining school attachment as it was created solely on the basis of the variables obtained by
applying the questionnaire.
Extracurricular activities
The analysis of pupils’ answers to the questions regarding the organisation of extracurricular activities
shows that they were held to a higher degree in SAI schools than in control ones, as indicated by the
comparative analyses in the tables below:
Table 5 28 In the last year, the school has organised activities with many guests (chi-square=105.32, p<0.001, Cramer’s
phi=0.39)
SAI Control YES 64.1% 35.9%
NO 28.9% 71.1%
Table 5 29 In the last year, I have participated in sporting activities (chi-square=50.30, p<0.001, Cramer’s phi=0.27)
SAI Control YES 71.2% 28.8%
NO 29.5% 70.5%
Table 5 30 In the last year, I have participated in trips organised by the school (chi-square=34.27, p<0.001, Cramer’s phi=0.22)
SAI Control YES 65% 35%
NO 40.3% 59.7%
Table 5 31 In the last year, we have been visited by personalities at school (chi-square=76.63, p<0.001, Cramer’s phi=0.34)
SAI Control YES 70.8% 29.2%
NO 36.4% 63.6%
FINDINGS RELATED TO EVALUATION QUESTIONS
Next, we intend to present the evaluation findings from the perspective of the eight evaluation
questions specified in the Methodology approved by UNICEF.
1. How effective has SAI been in reducing the risk of dropping out and dropout rates in the schools
involved?
The school data analysis for the SAI group, during the three SAI years, leads to the following
conclusions:
Overall, in SAI schools, both absence rates and unexcused absence rates did not decrease
as expected. Practically, according to data supplied by schools, absence rates remained

Page 125 of 198
constant during SAI years. This conclusion was also partially confirmed in the interviews
conducted during school visits.
The differential analysis of absence rates between the first and last SAI years leads to more
nuanced findings. Of the 32 evaluated schools, in 15 absence rates decreased, while in the
other 17 they increased (evidently, the extent of the decrease/increase varies between
schools). The only variables available that could explain the classification of schools in one
of these two categories were: the number of pupils (absence rates increased in schools
with a higher number of pupils); ethnic composition (absence rates decreased in the
schools with a higher percentage of Roma children). This may suggest the fact that, in
schools with a higher percentage of Roma pupils, the effort to reduce absenteeism rates
was greater.
Comparing absence rates in SAI schools to those of control schools did not lead to any
significant differences.
During SAI, dropout rates showed a general downward trend in SAI schools, especially
between the first and last SAI years. The highest decrease was in primary education (50%).
Lower secondary education experienced a 14.3% decrease and both school levels together
had a 20% decrease in the school dropout rate.
As in the case of absences, there are SAI schools where dropout rates decreased, while in
others they increased. The analysis of the factors associated with these situations led to
the conclusion that the factors associated with an increase in dropout rates are a higher
number of pupils in school, a higher rate of unexcused absences, and a higher number of
repeaters. We have not found any effect of pupils’ ethnic composition.
A comparison of dropout rates between SAI schools and control schools shows that the
values are relatively higher in SAI schools, but the differences are not statistically
significant.
In SAI schools, repetition rates witnessed a slight downward trend in primary education,
but remained unchanged in lower secondary education and overall.
In SAI schools, rates of promotion from fourth to fifth grade showed a slight upward
tendency between the first and last SAI years (90.52% to 91.16%).
Rates of promotion from eighth grade to ninth grade decreased slightly, from 76.59% to
75.03%. Both differences are very small, of no statistical significance, so it can be said that
we have a stagnant evolution in these respects.
The analysis of the data collected for the pupil sample from the target group, regarding
absenteeism, dropout and school performance, leads to the following conclusions:
Of the 230 pupils in the target group sample enrolled in year 1 of the Initiative, only 96
successfully completed year 3, which represents 41.7%.
Dropout cases witnessed a downward trend in the three SAI years, namely: 12, 11, 8. The
difference between the first and last years represents a 66.6% decrease.
Overall, in the target group sample, 41 pupils were declared as having dropped out of
school, which represents 13.85%.

Page 126 of 198
This downward trend is also found in regard to the number of repetition cases reported for
the target group during SAI years: 70, 54, 48. The difference between the first and last
years represents a 68% decrease.
The average number of absences for pupils in the target group sample increased between
year 1 and year 3 of the Initiative. For boys, from 64.45 to 132.6 and for girls from 42.49 to
123.68. Overall, the number of absences grows as pupils advance to higher grades, but
there is also a gender effect on that variation. Up to fourth grade, boys have more absences
than girls. Between fifth and sixth grades the ratio is reversed, and in seventh and eighth
grades boys have once again more absences than girl.
The GPA for pupils in the target group was on a slight upward trend during SAI years, from
6.68 to 7.12. In each SAI year, girls get higher GPAs than boys.
2. Have SAI interventions produced management changes in the schools involved, regarding the
implementation of strategies for school dropout prevention/control and the development of
school-community partnerships?
The aspects referring to management quality were evaluated during school visits, via interviews
with principals and teachers, but also via questionnaires, and are detailed in the quantitative
analysis above. A synthesis of the most important conclusions is presented here:
All the management components investigated (institutional development plan,
management plan, quality assurance plan, minority integration/support plan, network for
dropout prevention/control) are found in a higher proportion in SAI schools compared to
control schools. The difference is always statistically significant and is assessed in the same
way, both by principals and by teachers.
Nevertheless, a detailed analysis for each of these management components shows that
there are also SAI schools where some of these components do not exist or are only being
developed.
o Institutional development plan: in three schools it is in development.
o Quality assurance plan: it does not exist in one school; in three schools it is in
development.
o Minority integration/support plan: it does not exist in ten schools (where there
are no minority pupils), in five schools it is in development.
o Community network for dropout prevention and control: in four schools it does
not exist, in two schools it is in development.
SAI schools have school mediators, school counsellors and resource teachers to a greater
extent than schools in the control group. Nevertheless, these functions are missing from
some of the SAI schools, as follows: school mediator - 10 schools; school
counsellor/psychologist - 11 schools; resource teacher - 18 schools. In the principals’
opinions, this situation is caused mainly by the lack of financial resources.
Information received from principals and teachers converges in the following conclusions:

Page 127 of 198
o In SAI schools, the warning system for children at risk of dropout is present to a
higher degree than in control schools.
o In SAI schools, more procedures are applied for children about to drop out of
school than in control schools.
o In SAI schools, strategies to support newly enrolled pupils are applied to a
higher degree than in control schools.
o In SAI schools, remedial education programmes are implemented to a higher
degree than in control schools.
Absence control and educational support procedures for pupils are more active in SAI
schools than in control schools. These procedures include: absence monitoring, verifying
absence and dropout reasons, monitoring school results, following individual progress,
personalised intervention plans.
The quality of the school environment is assessed more positively in SAI schools compared
to control schools.
The pupils in SAI schools state they are more satisfied with the school climate than those in
control schools.
3. Has SAI produced changes in the instructional strategies used by teachers in their day-to-day
activities?
Overall, teachers in SAI schools assess that the training programmes held during the School
Attendance Initiative contributed substantially to an improvement of their teaching skills
(ability to create a more favourable learning environment, using a variety of teaching
methods), to approaching pupils at risk of dropout (identification, support, monitoring) and
to their ability to relate to parents (collaboration with the family). For all the indicators
mentioned, 90% of the answers received are at the level of “to a great extent” and “to a
very great extent”.
Comparative data regarding the use of information technology in the educational process,
in SAI and control schools, are systematically in favour of SAI schools.
The teachers in SAI schools assess their own educational skills approximately in the same
way as those in control schools. Differences were found in favour of SAI schools only in
reference to fostering pupils’ independent activities and group/team learning.
4. Has SAI produced changes in the teacher-pupil relationship and the teacher-parent relationship?
The assessment of relationships with classmates in the case of pupils from SAI schools is
better than in the case of those in control schools.
Pupils’ assessment of their relationships with teachers does not differ between SAI and
control schools.
The assessment of the parent-school relationship does not differ between the pupils in SAI
schools and those in control schools.

Page 128 of 198
The pupils in SAI schools have reported at a higher degree than those in control schools
that they participate in extracurricular activities: trips, sporting activities, meetings with
personalities, other activities.
5. Has SAI produced changes in parents’ attitude towards education?
The parents of pupils in SAI schools have expressed positive assessments regarding SAI
activities, especially parent education courses, both during interviews and in their
questionnaire answers.
More than 90% of the parents assess the utility of parent education courses as “very high”
or “high”.
The “attractiveness” of the courses received a similar assessment, only a little lower, which
suggests that the way in which they were carried out could benefit from improvements.
Parents assess that after participating in parent education courses they have a more
positive opinion about the importance of school, they pay more attention to their
children’s education, they have a better relationship with the school and with their
children. In all these cases, over 90% of answers received range between “to a very great
extent” and “to a great extent”.
6. Has SAI produced changes regarding parents’ involvement in school life?
In order to identify answers to this question, the following were analysed:
Interactions between parents and school representatives;
Interactions between parents and school mediators;
Parents’ involvement in activities organised by the school.
The data collected indicates:
An increase in interactions between parents and school representatives;
Improved relationships between parents and school mediators, where the latter are
available;
Parents’ increased involvement in activities organised by the school.
7. Has SAI produced changes in the community so as to contribute to the reduction of school
absenteeism and dropout?
Referring to the changes produced by SAI within the community, the analysis has led to the following findings:
There is a better community mobilisation, by creating and using institutional
teams/resource individuals at the local level;
The successful role models from disadvantaged social groups had a persistent echo with
pupils and their parents, as highlighted during the interviews conducted.
8. Are SAI interventions sustainable in the schools involved?
Regarding the sustainability of SAI effects, we can make the following observations:

Page 129 of 198
There are intervention components that will echo more persistently in the lives of SAI schools, especially the activities aimed at optimising school management and the training activities for teachers, school mediators, and social assistance clerks/social workers.
The integrated approach to absenteeism and school dropout, within the School Attendance Initiative, has been taken up by the “Strategy for Reducing Early School Leaving in Romania”, thus creating the premise for replicating this model on a large scale. For such a replication to be successful, attention must be paid to the specificities of each school and school community, and intervention levels must be prioritised according to their specific needs.
The model implemented in the Initiative has influenced policies and secondary legislation in education:
o It has influenced MoE and ARACIP methodology to identify children at high risk of school dropout;
o The concept of friendly school has influenced the new generation of indicators regarding education quality, which are more centred on child welfare and the safety of the school environment.
Some components need continuous support to maintain their impact. We are referring here to parent education and to organisational and institutional aspects (the institution of the school mediator, community cooperation);
The turnover of teachers in SAI schools who have received training under the Initiative poses a risk to ensuring the sustainability of SAI outcomes.
5.2 FINDINGS RELATED TO EVALUATION CRITERIA: RELEVANCE, EFFECTIVENESS,
EFFICIENCY, SUSTAINABILITY AND COHERENCE
According to the requirements comprised in the Terms of Reference, the evaluation followed the criteria
of relevance, effectiveness, efficiency, sustainability and coherence.
5.2.1 Relevance
In order to answer the questions in the Terms of Reference regarding SAI relevance, the aspects
considered were:
1. The extent to which SAI supported and/or was complementary to national and international
priorities and policies concerning school participation.
The National Strategy on Social Inclusion and Poverty Reduction for 2015-2020 specifies:
In order to ensure complementarity and coordination with other measures within the ample field of
social inclusion, the Strategy incorporates elements from sectoral strategies and other specific areas,
such as fighting child poverty, reducing Roma discrimination and integrating marginalised communities,
and responds to the country specific recommendations formulated by the European Commission, while
also being developed in accordance with the National Reform Programme and the Convergence
The objective of the Romanian Government is that all citizens are provided with equal
opportunities to participate in society, to feel valued and appreciated, to live in dignity, and
that their basic needs are met and their differences respected. In this context, the main
outcomes envisaged by the Strategy are the social inclusion of vulnerable groups and lifting
580,000 people out of poverty or social exclusion by 2020 compared with 2008, which is the
target committed to by Romania for reaching the objectives of the Europe 2020 Strategy.

Page 130 of 198
Programme for 2012-2016. Figure 5.33 presents a comparison between the Recommendation of the
European Council on the 2015 National Reform Programme of Romania, which includes a Council
opinion on the 2015 Convergence Programme of Romania, and the Social Inclusion Strategy and Action
Plan43.
Country Specific Recommendations (Sub) Section in the Social Inclusion Strategy
Pursue the National Health Strategy 2014-2020 to
address poor accessibility, low funding and resource
scarcity issues.
2.5.1. Improving Health Equity and Financial Protection
2.5.3. Increasing the Access of Vulnerable Groups to Quality
Healthcare
Strengthen active labour market measures, in particular
for unregistered young people and the long-term
unemployed. Ensure that the National Employment
Agency is adequately staffed. Develop, in consultation
with social partners, clear guidelines for setting the
minimum wage. Strengthen undeclared work verification
and control systems and take steps forward in equalising
retirement ages for women and men.
2.1.4. Building the Institutional Capacity and Resources of the
Public Employment Service
2.1.2. Reducing Informal Employment and Increasing the
Productivity of Small and Medium-Sized Farms
2.1.3. Reducing In-Work Poverty
2.2.5. Protecting Elderly People at Risk of Poverty or Social
Exclusion
4. Building Institutional Capacity to Reduce Poverty and
Promote Social Inclusion
Increase the quality of early childhood education and
care, in particular for Roma children. Adopt the National
Strategy for Reducing Early School Leaving.
2.4.5. Increasing Access to Quality Education for Children from
Vulnerable Groups
2.4.2. Increasing Participation and Improving Outcomes in
Primary and Secondary Education for All Children
2.4.1. Improving the Early Childhood Education and Care
System
Introduce the minimum social insertion income.
2.2.1. Improving the Performance of the Social Assistance
System
2.1.5. Increasing Employment Rates for Vulnerable
Groups/Roma
4. Building Institutional Capacity to Reduce Poverty and
Promote Social Inclusion
Figure 5 33 Country recommendations from the National Strategy on Social Inclusion and Poverty Reduction 2015-2020
With its goal to prevent and reduce school dropout and increase school participation rates, focusing
on children from the most disadvantaged backgrounds, and via its intervention levels and
components, the School Attendance Initiative has contributed to achieving national and European
priorities and policies regarding school participation.
The necessity of SAI interventions is reflected by the high levels of dropout rates (1.6% for primary
education and 2% for lower secondary education in 2010-2011, and 1.2% for primary education and
1.8% for lower secondary education in 2013-2014) and early school leaving rates (18.4% in 2010 and
18.1% in 2014). These rates are well above the European mean and much higher than European and
43 National Strategy on Social Inclusion and Poverty Reduction for 2015-2020, page 7

Page 131 of 198
national targets for 2020. The European average rate of early school leaving was 13.4% in 2011 and
11.1% in 2014, and the 2020 targets are: 11.3% for Romania and less than 10% for Europe.
The indicator considered in the official European documents is early school leaving, an indicator
erroneously translated into Romanian as “early school dropout”. This translation sometimes causes
confusion when collecting and interpreting information. This is why we find it necessary to make the
following clarification:
The term “school dropout” is used in Great Britain and in Anglo-Saxon countries with a negative connotation. Using the notion “early school leaving” (ESL) is preferred, as stated in a document drafted by the Canadian institution Youth Action and Policy Association (YAPA) (Access and Equity manual for working with young people, page 635), because not all early school leavers have dropped out, but they may have made a conscious decision to pursue other goals such as employment or a different training, perhaps they have chosen to learn a trade, to do an apprenticeship.
A document drafted by the European Commission mentions that the term “early school leaving” (ESL) includes all forms of leaving education and training before completing the second level of education according to ISCED or before obtaining an equivalent vocational certificate, while the term “school dropout” has a more restrictive meaning as it refers to discontinuing a course in general or vocational education (Commission staff working paper, Reducing early school leaving, Accompanying document to the Proposal for a Council Recommendation on policies to reduce early school leaving, 2012, page 5). Most of the time, however, these terms overlap and are used as synonyms.
One of the oldest definitions belongs to Morrow (1987, 342-355), according to which “a dropout is any student previously enrolled in a school, who is no longer actively enrolled as indicated by fifteen days of consecutive unexcused absences, who has not satisfied local standards for graduation and for whom no formal request has been received signifying enrolment in another state-licensed educational institution”.
The EUROSTAT definition explains the fact that an early school leaver is a person aged 18 to 24, who has completed at most lower secondary education and is not pursuing any other form of education or training. The definition was endorsed by all the education ministers of EU Member States during the Council in 2003 (see Early school leaving in Europe guide, 2011, page. 1).
The OECD definition enunciates that an early school leaver is a person aged 20 to 24 years, who has not attained upper secondary education and who is not enrolled in education.
The European Commission definition presents early school leavers as those who have not completed upper secondary education (Council recommendation on policies to reduce early school leaving, 28
June 2011, 2011/C 191/01, page 2), those who have not completed compulsory schooling or have not
gained qualification certificates (Commission staff working paper, Reducing early school leaving, Accompanying document to the Proposal for a Council Recommendation on policies to reduce early school leaving, page 5). Therefore, early school leavers are those who have only achieved pre-primary, primary, lower secondary or a short upper secondary education of less than two years (according to the ISCED classification - level 0, 1, 2 or 3 short), including those who have pursued vocational education which did not lead to a certificate of completion equivalent to upper secondary education.
The UNESCO definition explains the fact that school dropout or early school leaving suppose leaving formal education (offered by school) without completing the level or programme.
The definition from the European Council Recommendation of 28 June 2011 on policies to reduce school dropout (for the implementation of the Europe 2020 Strategy), according to which the term “early school leaving” is used in connection with those who leave education and training with only lower secondary education or less, and who are no longer in education or training.
In Romania, regarding the definition of the school dropout phenomenon, opinions are divided. Some specialists (Viadero, 2001, 22-35; Finn, 1989, 117-142) claim that school dropout is when the pupil leaves school early before completing compulsory schooling or a sufficient level allowing for their

Page 132 of 198
future integration into the labour market. Others, such as Neamţu (2003, 15-60), believe that school dropout is the behaviour of definitive evasion, which consists of ceasing to attend school, leaving the education system irrespective of the level reached, before obtaining a qualification, or completing professional training, or before the educational stage initiated is finalised. From an economic point of view, for Neamţu (2003, 15-60), school dropout is an indicator of the efficiency of the education system, so if the school dropout index is high, the education system is inefficient. In that sense, school dropout and early school leaving create the conditions for the failure of social integration, because they reduce the chances for professional achievement and limit the integration into the labour market.
The school dropout rate is defined by the Ministry of Education in the 2009 Report on the State of the National Education System, page 66, as “representing the difference between the number of pupils enrolled at the start of the school year and the number on record at the end of the same school year. This allows for the evaluation of the internal efficiency of the education system, and is also important for pupil flow analyses and projections within a particular educational level.”
In the 2010 Report on the State of the National Education System, page 59, the rate of early school leaving is presented as: “The share of the population between the ages of 18 and 24, with lower secondary education or less, not pursuing any form of education and professional training, in the total population aged 18-24”. The indicator can also be considered in the category of those regarding continuous professional training.
2. The extent to which SAI has responded to the following priorities: prevention and reduction of
absenteeism and school dropout in primary and lower secondary education, prevention of early
school leaving, increasing school participation rates and school performance in preschool,
primary and lower secondary education, and the social inclusion of the most vulnerable groups.
The information presented in the previous sub-chapter highlights the fact that the SAI target regarding
the reduction of dropout rates was reached for primary education (a 50% reduction compared to before
the Initiative) but not for lower secondary education, where the reduction only reached 14.3%. It is
worth noting that even though, apparently, this target was not entirely reached, the situation in the SAI
schools analysed in the summative evaluation is much better, from the perspective of school dropout,
than the national situation (in the 2013-2014 school year, for which we also have national data, in SAI
schools, dropout rates were 0.2% in primary education and 0.5% in lower secondary education, whereas
nationally they were 1.2% in primary schools and 1.8% in lower secondary schools).
The results obtained during SAI regarding absenteeism are not good, highlighting an increase in
unexcused absences by pupil in SAI year 3 compared to year 1, both in primary and in lower secondary
education (from 11.57 to 15.12 for primary schools and from 29.54 to 36.52 in lower secondary schools).
The average number of unexcused absences per pupil varied greatly from one school to another; for
example, in SAI year 3, there was a school (Filipeşti Târg) with no unexcused absences in primary
education, and other schools where the average number of absences per pupil was over 110. The
schools with a very high number of unexcused absences, which have strongly affected the average in the
group of schools analysed, are: Lieşti School, and School No. 3 in Botoşani. The statistical analysis does
not lead to any explanation for the irregularities found in these schools. During the visits carried out in
the schools mentioned, it was found that, in SAI year 3, those schools were confronted with disruptive
factors, independent from SAI interventions. In Lieşti School, the high number of absences is caused by
the reaction of the Roma community to an accident which led to the death of a little girl from the

Page 133 of 198
community, and to another one being injured as they were heading to school. Even though the one who
caused the accident was also from the Roma community, the Roma leader ordered the community to
stop sending children to school. The attempts made by the school team, the Galaţi County School
Inspectorate and the local public authority did not yield any results. In the case of participation or
social campaigns, it is considered that each person “saved” is a victory for the campaign. In the case of
the Lieşti School, even in the conditions of SAI year 3, we can still talk about a victory, because three
Roma children were brought to school (going around the entire village so that their destination could
not be guessed) by a grandmother and a parent (who understood the importance of education).
School No. 3 in Botoşani is a subordinate structure of School No. 2 from the same city. In SAI year 3, for
economic reasons and because its school population had decreased, School No. 3 was moved into the
building of School No. 2 and it was then that it lost its identity. The space allocated during SAI to
meetings with parents and extracurricular activities with pupils disappeared, and the team from School
No. 3 was absorbed by the team of School No. 2, which does not have the same vision of education,
although many teachers from School No. 2 participated, instead of some teachers from School No. 3, in
training sessions organised under SAI. In the discussions held during the school visit, a discrepancy was
noted between the distant and critical manner the school principal talked about the Roma school
population, coming from School No. 3, and about their parents, and the warm, enthusiastic and caring
manner in which the school-level SAI coordinator talked about “her children”, with whom she had done
so many beautiful and interesting things. Another finding, highlighting the fact that losing a school’s
identity and the lack of involvement of the entire school team led to negative SAI results, was that the
majority of the pupils who participated in interviews and described in detail the activities in which they
had participated were former School No. 3 pupils, currently high school pupils (a reduction in the early
school leaving rate of that school). Two of them were married by their parents in lower secondary
school, they are expecting a baby and they are nevertheless continuing their studies (the girl is in tenth
grade and the boy in ninth grade). The example of School No. 3 highlights the fact that a campaign can
be successful only if all the stakeholders want that.
The case of Vicovu de Sus School is proof that without school team and local community involvement no
positive results can be obtained in a campaign. Political interference in the appointment of the principal,
namely replacing a principal who was strongly involved in school life and had an inclusive vision with the
principal of the local high school (who refused to participate in the interview), who didn’t have classes in
the school and only visited it occasionally, divided the school team and fragmented SAI interventions.
The lack of support, even obstacles created by the mayoralty (ceasing funding for a school mediator)
and the mayor’s negative attitude towards the Roma population (according to the statements of the
project coordinator from the school and of the Roma parents participating in the interview), an attitude
shared by some of the teachers, alienated Roma parents from the school. All this was found out during
the school visit, when the only parents participating in the meeting were the Roma members of the
community, who came to present the situation and complain about discrimination. The information
they presented was supported by convincing examples. Because of all this, the Vicovu de Sus School
had, in the last SAI year, just like the Lieşti School, a much higher school dropout rate than the other SAI
schools, as can be seen in Figure 5.14.

Page 134 of 198
The promotion rate from one educational level to the next increased very little in the case of promotion
from primary to lower secondary education (from 90.52% in SAI year one to 91.15% in year 3) and
decreased in the case of promotion from lower secondary to high school education (from 76.59% to
75.03%). In this respect, we cannot talk about a highly performing initiative, but because consistent
mutations can be recorded at this level after much longer periods of intervention, it is worth considering
and appreciating as relevant results in terms of prevention the fact that out of the pupils who completed
the questionnaire, with 95.36% in primary or lower secondary education, only 14.5% declared that the
highest level of education they wished to attain was the lower secondary one, as can be seen in Figure
5.34.
Figure 5 34 Pupils’ options regarding the highest level of education they wish to attain
The eight pupils who selected “other level” were referring to vocational school.
In the “Strategy for Reducing Early School Leaving in Romania”, one of the measures to prevent
absenteeism, school dropout and early school leaving is more intense parent involvement, by
intensifying parents’ collaboration with the school and creating partnerships between schools
and parents, which may contribute to better pupil motivation, and the following are mentioned
among the intervention measures aimed at reducing the phenomena:
o Transforming schools into learning communities, by creating a comfortable environment that
inspires and encourages freedom of thought, thus motivating young people to continue their
education and training.
o Perfecting systems that can identify the first signs of risk.

Page 135 of 198
o A close relationship between parents and other relevant organisations outside the school (for
example: local community services).
In view of these measures, the statements made in the questionnaires both by pupils (388
respondents) and parents (247 respondents) regarding the school’s educational practices and pupil-
parent relationships and by school principals and teachers (278 respondents) regarding the existence of
identification and monitoring mechanisms for pupils at risk of dropout and the functioning of PAS
networks are considered indicators that highlight the relevance of SAI in developing prevention and
intervention mechanisms for the phenomena concerned.
The following figures and tables present the answer frequency or percentage of total answers to the
questionnaire questions about conditions created in schools to contribute to preventing and reducing
absenteeism and school dropout. They show that most respondents think that the school has, to a
great extent, created prevention and intervention conditions for reducing school dropout.
Figure 5 35 Frequency of pupils’ assessments on the impact of the School Attendance Initiative on school and family practices

Page 136 of 198
Figure 5 36 Frequency of pupils’ assessments on current school practices
Figure 5 37 Frequency of parents’ assessments on their attitude towards learning and school and regarding their children’s performance

Page 137 of 198
Table 5 32 Statements regarding conditions created in the schools involved in the School Attendance Initiative to contribute
to the prevention and reduction of school absenteeism and dropout - SAI schools
In the school where you work, there is:
Aspects considered Percentage of total answers
teachers principals
Institutional development project 96.14% 90.63%
School management plan 98.48% 90.63%
Quality assurance plan 96.91% 87.50%
National minority integration/support plan 62.87% 48.28%
Community network for dropout prevention and control 85.08% 80.65%
Even though the percentage of positive answers to the questions presented in Table 5.32 differ for
teachers and principals, with those given by principals being more credible as they have management
responsibilities, percentages are similar for the first three procedural resources and highlight the
existence of these resources which are important for carrying out quality educational activities. Major
differences show up with regard to the national minority integration/support plan, but even so, the
percentage resulting from the statements of principals from control schools is lower than the one
declared by principals from SAI schools, which highlights the fact that SAI reached relevant outcomes
regarding the provision of procedural resources developed in schools. Table 5 33 Statements regarding conditions created in the schools involved in the School Attendance Initiative to contribute
to the prevention and reduction of school absenteeism and dropout - SAI and control schools
In the school where you work, there is:
Aspects considered Percentage of total answers
Principals of SAI
schools
Principals of control schools
Institutional development project 90.63% 92.86%
School management plan 90.63% 96.43%
Quality assurance plan 87.50% 82.14%
National minority integration/support plan 48.28% 22.22%
Community network for dropout prevention and control 80.65% 11.54%
From the statements given by school principals, it can be said that the relevance of the management
component under the school-level intervention is not very high. However, the answers are affected by
error because three of the principals who received training were replaced and the new principals did not
get such training, did not know how to carry out such projects, or did not know that they existed at
school level. In order to triangulate the collection and analysis of the data regarding the existence in
schools of procedural resources contributing to the prevention and/or reduction of school absenteeism
and dropout, we analysed the institutional development plans and annual internal evaluation reports
that were public and/or those that we were supplied with during school visits. The analysis of these
documents revealed that 59.37% of schools planned and implemented SAI activities.
The outcomes reached by SAI stakeholders with regard to the identification, monitoring and support of
children at risk of school dropout emphasise SAI relevance from this perspective. By means of the
activities carried out in 2011-2015, 11,703 children were identified and monitored as being at risk of

Page 138 of 198
dropping out of school, of which 10,262 were identified via the EPA intervention and 1,441 were
identified by SPAS networks. For 5,214 children identified and monitored, social assistance clerks/social
workers performed social inquiries (they took the necessary measures to perform relationship, social
and economic evaluations of the family in order to develop and implement Service Plans that respond to
every situation individually). Such plans were made for 2,590 pupils, and services were offered to 3,082
of them.
During the interviews with parents and pupils, it became clear that one of the interventions most
appreciated by teachers and parents was parent education. It was also appreciated by children, for the
effects it produced. Most children stated they were getting along better with their parents, which made
them better people and made them want to learn and not skip school.
3. The extent to which SAI was relevant for the Europe 2020 Strategy in aspects regarding
education, and the extent to which it contributed to achieving national education targets under
the Europe 2020 Strategy.
Europe 2020 is the EU strategy for economic growth for the next ten years. In a world of constant
change, the EU wants to become a smart, sustainable and inclusive economy. These three priorities
support each other and are able to help the EU and Member States obtain a high level of employment,
productivity and social cohesion.
Smart growth implies improving the EU performance in the following areas:
Education (encouraging the learning and skill development process);
Research and innovation (creating new products and services to generate economic growth and
new jobs and help us cope with social challenges);
Digital society (using information and communication technologies).
The EU targets for smart growth are:
A level of public and private investment in research and development equal to 3% of the EU’s
GDP; better conditions for research, development and innovation;
A 75% employment rate for the population between 20 and 64 years of age, by 2020 (by
creating favourable employability conditions, especially for women, young people, the elderly,
unskilled workers and legal immigrants);
Better educational outcomes, especially:
o Reducing the rate of early school leavers to less than 10%;
o Increasing to at least 40% the share of the population aged 30 to 34 having completed
tertiary or equivalent education.
Important initiatives to foster smart growth:
1. Digital Agenda for Europe, by means of which it sets out to create a single digital market, based on
fast and ultra-fast Internet and interoperable applications:
By 2013: universal access to broadband Internet;
By 2020: universal access to much faster Internet (at least 30 Mbps);
By 2020: an Internet speed of over 100 Mbps in over 50% of households in Europe.
2. Innovation Union, by which it sets out to:

Page 139 of 198
Redirect research, development and innovation policies to areas that pose major challenges to
society (climate change, efficient use of energy and resources, demographic change, population
health, etc.);
Reinforce all the links in the innovation chain, from basic research to marketing.
3. Youth on the Move, by which it sets out to:
Help students/pupils and trainees study abroad;
Better equip young people for the job market;
Improve the performance of European universities and make them more internationally
attractive;
Improve all levels of education and training (academic excellence, equal opportunities, etc.).
Inclusive growth - An economy with a high employment rate, ensuring economic, social and territorial
cohesion.
Inclusive growth implies:
A higher employment rate - better and more jobs, especially for women, young people and
workers over 55;
Increasing the ability to anticipate and manage change via investments in professional training
and skill development;
Modernising labour markets and social security systems;
Guaranteeing access to the benefits of economic growth to all.
The EU targets for inclusive economic growth are:
A 75% employment rate for the population between 20 and 64 years of age, by 2020 (by
creating favourable employability conditions, especially for women, young people, the elderly,
unskilled workers and legal immigrants);
Better educational outcomes, especially:
o Reducing the rate of early school leavers to less than 10%;
o Increasing to at least 40% the share of the population aged 30 to 34 having completed
tertiary or equivalent education.
Lifting at least 20 million people out of poverty and social exclusion.
The major initiatives to foster inclusive growth are:
1. An agenda for new skills and jobs, by means of which it sets out to:
Help citizens acquire new skills, adapt to labour market changes and retrain;
Modernize labour markets, increase work productivity and employment rates, reduce
unemployment and ensure the sustainability of European social models.
2. European Platform against Poverty, by means of which it seeks to:
Ensure economic, social and territorial cohesion;
Guarantee the respect for fundamental rights of people experiencing poverty and social
exclusion and enable them to live in dignity and take an active role in society;
Support measures that favour community integration, training and employability and access to
social protection.

Page 140 of 198
Comparing the characteristics of the Europe 2020 Strategy with the levels and components of
interventions under the School Attendance Initiative, we find that, with all its interventions and
components, SAI contributes to the implementation, in Romania, of some of the provisions of the
educational strategy.
Therefore, considering its goal, SAI aims at two of the three initiatives of the strategy, which are smart
growth and inclusive growth.
With its goal and school interventions, SAI tackles the Smart Growth priority in the field of education
(fostering the learning process) and the target of this priority: better educational outcomes, especially
reducing the rate of early school leavers to less than 10%.
The activities carried out under SAI fall within those of the Youth on the Move initiative, by means of
which it seeks: to improve all levels of education and training (academic excellence, equal opportunities)
and indirectly to better equip young people for the job market (better equipped youth, in friendly
schools, in inclusive environments, where teachers mediate the learning process and help pupils
develop their creativity and autonomy, with better employment opportunities). Family and community
interventions address the Inclusive Growth priority and its targets: better educational outcomes by
reducing the rate of early school leavers to less than 10% and lifting at least 20 million people out of
poverty and social exclusion.
Family and community activities fall within those specific to the European Platform against Poverty,
setting out to: ensure social cohesion; contribute to the respect for the fundamental rights of people
experiencing poverty and social exclusion and to creating the conditions for young people to be able, by
means of education, to live in dignity and take an active role in society; support measures that favour
community integration and access to social protection. The interventions of the implementing partners
CRIPS, Together and Holt equally contribute to these targets. An important role in the Inclusive Growth
intervention, apart from the contribution to the Smart Growth initiative, is played by the Ministry of
National Education, with its Directorate for Minorities, by training school principals, school mediators
and teachers (both those teaching the Romani language and those teaching other subjects and having
received training on multicultural education). During the visit to the Lieşti School, one of the teachers
participating in the interview stated that if she had received that multicultural education course before
the accident, she would have known how to approach the Roma people and the school would not have
had to deal with the absenteeism and school dropout problems it went through that year.
The fact that SAI communities were selected from the most disadvantaged ones allowed this initiative to
address the Inclusive Growth priority in a relevant manner.
SAI outcomes:
More than 3,750 principals and teaching staff who followed different training programmes;
177 school mediators who followed training programmes;
83 trained Romani language teachers;
250 social workers trained;
Almost 4,800 parents (direct beneficiaries);
Over 80,800 pupils (direct beneficiaries).
These outcomes contribute to implementing and reaching the targets of the Europe 2020 strategy.

Page 141 of 198
By setting the target of reducing absenteeism and school dropout rates by 50-60% compared to the
rates at the start of the Initiative and by means of its outcomes, even though the target was only
reached for primary education, SAI has contributed, even if very little, to the achievement of Romania’s
target for education: reducing the early school leaving rate to less than 11.3% by 2020.
4. The extent to which SAI was in line with UNICEF’s regional priorities regarding “The inclusion of
all children in quality education”;
Every child in school;
Every child learning;
Every child enrolled in early childhood education on time;
Every child supported by efficient and effective governance;
Every child in school. In many cases, poverty combined with inequalities related to gender, age, skills,
linguistic, ethnic and religious minorities, refugees, migrants, children obliged to work, social norms,
cultural practices and conflict, all make access to education difficult and lead to social exclusion. The
education systems must be able to identify children at risk of dropping out of school and manage
diversity so as to respond to the needs of all children, at the same time respecting their identity. SAI’s
consistency with this priority was ensured as follows:
o Improving the information collection process, to allow identification of children at risk of
dropping out of school and/or of those who have never been to school.
o Developing monitoring and support mechanisms for children identified at risk of school dropout;
o Supporting schools and teachers to adopt inclusive practices and develop interventions that
prevent and decrease school absenteeism and dropout;
o Improving local and cross-sectoral collaboration to reduce local school absenteeism and
dropout;
o Improving parents’ knowledge and skills in raising and communicating with their children.
Every child learning. SAI’s consistency with this priority was ensured via interventions in:
o Promoting a school culture that fosters learning and respects diversity.
o Training teachers so as to focus on pupils’ learning experience using differentiated instruction
and sensitive teaching methods that address the unique needs and different learning styles of
the pupils.
o Improving the skills of the teachers involved in early childhood education, especially for applying
inclusive practices and working with children with SEN.
o Professional guidance and training for the entire personnel of SAI schools: teachers, principals,
school mediators.
o Parent education, so that parents support and become actively involved in their children’s
learning process.
Every child enrolled in early childhood education on time. SAI addressed this priority to a small extent as
the intervention was carried out only in the last two years of implementation, with the training of
teachers from the kindergarten structures of SAI schools, parent counselling, and parent education. The

Page 142 of 198
number of communities where this intervention was carried out was small, compared to the national
needs.
Every child supported by efficient and effective governance. For a campaign the size of the School
Attendance Initiative (implemented in 250 communities, during a period of five years, with a total
budget of USD 3,472,422) to represent an investment in quality and inclusion, the efficiency of the
budget allocated to each intervention and to each partner and community involved had to be ensured.
During SAI implementation, although the role that UNICEF can play in reforming the education system is
limited and the total budget allocated was rather small for major changes in education (equivalent to
the budget of two SOP HRD flagship projects), due to the efforts of the UNICEF team and the teams of
implementing partners, the following principles referring to the ‘Every child supported by efficient and
effective governance’ priority were pursued:
o The allocation, due to SAI involvement, of additional resources (to those ensured by the Ministry of
National Education and by local communities) to certain schools with greater needs from
disadvantaged areas;
o Improved management skills for school principals due to training, experience exchange and
coordination mechanisms;
o Improved management mechanisms and level of responsibility in education, by means of a better
use of information, transparency and participation of parents, communities, education beneficiaries,
civil society;
o Development of the necessary mechanisms to ensure that the pupils from SAI schools are included
in the decision-making process regarding their own learning;
o Skill development in the case of the staff involved in education.
5. The extent to which SAI design and implementation were relevant to the prevention of
absenteeism, school dropout and early school leaving and to the reduction of school absenteeism
and dropout:
Of the measures specified in published papers regarding prevention and reduction of school
absenteeism and dropout, the following were considered when designing and implementing the School
Attendance Initiative:
o For prevention:
o Ensuring a good quality early childhood education system, beneficial to all children, and
especially to those coming from disadvantaged areas, by means of participation to
training activities within the educational components and via access to quality inclusive
education for all children;
o Promoting active desegregation policies and granting additional support to schools from
disadvantaged areas or that have a large number of pupils coming from socially and
economically disadvantaged areas, by selecting for SAI involvement the schools from
the most disadvantaged areas;
o Highlighting the value of linguistic diversity and supporting the children that have a
different mother tongue, in order to improve the language skills necessary for the
Page 143 of 198
learning process, by training teachers for inclusive education and by training principals
and teachers for multicultural education;
o A more intense parent involvement, by intensifying parents’ collaboration with the
school and creating partnerships between schools and parents, can contribute to a
better pupil motivation, by training teachers for parent counselling, by designing,
supporting and monitoring such activities in SAI schools and via parent education
courses for parents and the training of parent educators;
o Improving the flexibility and permeability of learning paths, for example by alternating
learning hours with practice hours and with extracurricular activities.
o For interventions aimed at reduction:
o School-level measures:
Transforming schools into learning communities, by creating a comfortable
environment that inspires and encourages freedom of thought, thus motivating
young people to continue their education and training - training teachers to
transform schools into “friendly schools”.
Perfecting systems that can identify the first signs of risk - developing
procedures to identify, monitor and support pupils at risk of dropping out of
school, both with the intervention of the Institute of Education Sciences and
with CRIPS intervention.
A close relationship between parents and other relevant organisations outside
the school (for example, local community services) - via parent counselling
activities, by involving parents in common parent-pupil activities and by forming
community networks to identify and reduce school dropout risk situations.
Continuously sustaining and supporting teachers’ efforts in their work with
pupils from risk groups, which is a basic condition for the effectiveness of the
measures undertaken at the institutional level - by organising face-to-face and
online training sessions for teachers, through visits and demonstration activities
in schools.
o Individual-level measures:
Mentoring, which helps pupils overcome learning, social or personal difficulties.
Adapting teaching to pupils’ needs by consolidating individual learning
approaches and by granting support to pupils at risk.
Consolidating a guidance and counselling system to support pupils in choosing
the right career, in the transition process from one educational level to the next,
or from the education system to employment.
6. The extent to which SAI design and implementation was relevant to increasing cultural sensitivity
and to inclusive approaches in kindergartens and schools, especially for children with disabilities,
Roma children, those from rural areas and from poor communities.

Page 144 of 198
In order to enhance cultural sensitivity, both the principals and teachers of different subjects received
multicultural education classes, organised by the Directorate for Minorities under the Ministry of
National Education. Inclusion subjects were addressed within the teaching and counselling components,
both implemented by the Institute of Education Sciences. The Institute of Education Sciences supplied
courses to primary school teachers working with children with disabilities. As a result of those courses,
such classes were included in the educational plan in some of the SAI schools, and in other schools, part
of the children with disabilities were integrated into classes with children without such problems (for
example: School No. 4 in Turnu Măgurele).
Starting with the 2013-2014 school year, training activities were carried out within SAI for
school/kindergarten teachers to ensure access to quality inclusive education for all children, focusing on
children with disabilities and with special educational needs in preschool education. Such courses were
given to kindergarten teachers in all the kindergarten structures of SAI schools, in the last two years.
Inclusive approaches aiming at Roma children and other groups of disadvantaged children were
developed following the intervention of the Împreună Community Development Agency and the Roma
Civic Alliance of Romania. The Împreună Agency intervened to bring a positive change to pupils’ and
parents’ attitude towards education and to develop children's self-respect, and the Roma Civic Alliance
ran a mainly social intervention, informing Roma families about the importance of education and about
school participation opportunities available to disadvantaged children.
Aspects regarding multiculturalism and inclusion were also addressed during cross-cutting interventions
ran by Amare Romentza and the Roma Education Fund foundation. The former carried out multicultural
education interventions and made an animated film to promote diversity, and the latter did advocacy
work to promote public policies for disadvantaged groups.
7. The extent to which the selection methodology was relevant to the selection of the most
disadvantaged schools and to identifying children at risk of dropout.
Several stages of information collection and validation were completed in the first and second years of
SAI, in order to select the schools. It began with collecting data from the NIS regarding the counties
with the biggest school dropout problems. Then, county inspectorates were contacted, in the respective
counties, to offer lists of schools in the county with such problems. Specific information was collected
for those schools, which, according to the literature, can indicate absenteeism, school dropout and early
school leaving problems. Visits were then made to the schools and new information was collected,
using a visit sheet, and on the basis of all the information collected, the selection process was finalised.
This methodology allowed for the selection of the most disadvantaged schools, which were in dire need
of support. In the last two SAI years, in order to focus the intervention on a smaller number of schools,
so that the resources that SAI was based on could be used more effectively and efficiently and
considering SAI’s exit strategy, it passed from a selection process to one of revalidation, which involved
all implementing partners, in different proportions. This process not only considered the needs of the
schools, but also the school team’s desire to produce positive changes.
As a result of the annual selection or revalidation processes, approximately 250 schools (235 schools +
related structures or coordinating schools) were involved in SAI for one, two or three years.
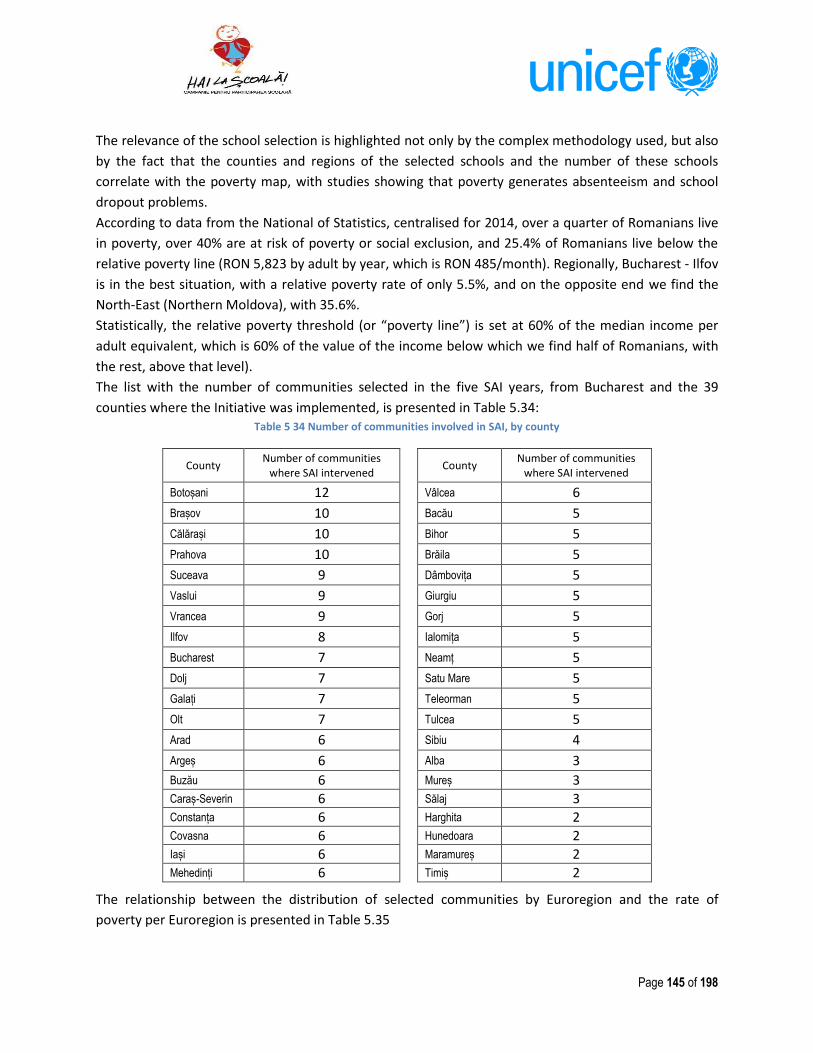
Page 145 of 198
The relevance of the school selection is highlighted not only by the complex methodology used, but also
by the fact that the counties and regions of the selected schools and the number of these schools
correlate with the poverty map, with studies showing that poverty generates absenteeism and school
dropout problems.
According to data from the National of Statistics, centralised for 2014, over a quarter of Romanians live
in poverty, over 40% are at risk of poverty or social exclusion, and 25.4% of Romanians live below the
relative poverty line (RON 5,823 by adult by year, which is RON 485/month). Regionally, Bucharest - Ilfov
is in the best situation, with a relative poverty rate of only 5.5%, and on the opposite end we find the
North-East (Northern Moldova), with 35.6%.
Statistically, the relative poverty threshold (or “poverty line”) is set at 60% of the median income per
adult equivalent, which is 60% of the value of the income below which we find half of Romanians, with
the rest, above that level).
The list with the number of communities selected in the five SAI years, from Bucharest and the 39
counties where the Initiative was implemented, is presented in Table 5.34: Table 5 34 Number of communities involved in SAI, by county
County Number of communities
where SAI intervened County
Number of communities where SAI intervened
Botoșani 12 Vâlcea 6
Brașov 10 Bacău 5
Călărași 10 Bihor 5
Prahova 10 Brăila 5
Suceava 9 Dâmbovița 5
Vaslui 9 Giurgiu 5
Vrancea 9 Gorj 5
Ilfov 8 Ialomița 5
Bucharest 7 Neamț 5
Dolj 7 Satu Mare 5
Galați 7 Teleorman 5
Olt 7 Tulcea 5
Arad 6 Sibiu 4
Argeș 6 Alba 3
Buzău 6 Mureș 3 Caraș-Severin 6 Sălaj 3 Constanța 6 Harghita 2 Covasna 6 Hunedoara 2 Iași 6 Maramureș 2 Mehedinți 6 Timiș 2
The relationship between the distribution of selected communities by Euroregion and the rate of
poverty per Euroregion is presented in Table 5.35

Page 146 of 198
Table 5 35 The relationship between the distribution of selected communities by Euroregion and the rate of poverty per Euroregion
Position Euroregion Number of
communities
Percentage of the total number of SAI
communities Position Euroregion
At-risk-of-poverty or social exclusion rate in 2009, INSSE and
Eurostat data
Relative poverty rate in 2014, NIS data
1 North-East 46 19.57% 1 North-East 52.9% 35.6%
2 South Muntenia
46 19.57% 2 South-East 42.4% 33.3%
3 South-East 38 16.17% 3 South-West 52.9% 29.7%
4 South-West 31 13.19% 4 West 30.1% 26.8%
5 Centre 28 11.91% 5 South Muntenia
48.1% 25.5%
6 West 16 6.81% 6 North-West 35.2% 21.9%
7 North-West 15 6.38% 7 Centre 33.2% 20%
8 Bucharest Ilfov 15 6.38% 8 Bucharest Ilfov 41.9% 5.5%
The selection of the children in the target group was carried out using both the EPA model and the CRIPS
model. The two selection models are complementary and allowed for the expansion of the number of
children identified using the EPA model, from 10,262 to 11,703.
8. What is the evidence that the School Attendance Initiative has produced for policy development
or adjustment?
SAI contribution to policy development and/or adjustment was as follows:
The methodology to identify children at high risk of school dropout, taken up by the MoE
and ARACIP and integrated into school participation monitoring policies (pupil’s roadmap);
The materials developed during SAI were included in the curriculum proposed for the new
initial teacher training system, the master’s degree in teaching;
The SAI model is included in the projects promoted by the MoE as having a significant
contribution to preventing school dropout;
The latest revision of the national curriculum integrated the learning activities developed
during SAI for teachers working with pupils at risk of dropping out of school;
SAI has influenced:
o Public policies regarding the concept of child-friendly school;
o The new generation of indicators regarding the quality of education, which focus
primarily on child welfare and the safety of the school environment.
9. What elements has the School Attendance Initiative model produced that can be considered by
the national factors interested in education?
The main SAI-specific elements that were considered at the national level are the aforementioned ones,
namely: public policies regarding the concept of child-friendly school and the new generation of
indicators regarding the quality of education, which focus primarily on child welfare and the safety of
the school environment.

Page 147 of 198
10. Was SAI relevant from an ethnic and gender perspective for reducing school dropout and
absenteeism, considering the gender and ethnic context of the participating schools?
SAI design and implementation took into account the possible effects of gender differences that the
activities could have on boys and girls. The training activities with teachers insisted on gender
difference awareness, even more so since the majority of SAI schools had a total or partial Roma school
population and ethnic traditions are strongly influenced by gender differences (many of the Roma girls
are not allowed to go to lower secondary school because parents are afraid they will get kidnapped).
Such aspects were strongly debated especially in the multicultural education courses. Both in these
courses and in the parent education ones, teachers were trained to optimally approach gender equality
with parents and pupils.
The ethnic perspective was relevant during SAI, all the more so since the Initiative mainly focused on
promoting access to education for Roma children.
11. Was SAI relevant for promoting an integrated approach to school absenteeism and dropout?
As was mentioned in the section regarding evidence of SAI contribution to policy development and/or
adjustment, SAI’s integrated and multidimensional model, based on various forms of intervention at the
level of school principals, teachers, school mediators, pupils, parents and community representatives, is
included in the projects promoted by the MoE as having a significant contribution to preventing school
dropout.
5.2.2 Effectiveness
1. Do SAI outcomes fall within the objectives set in the logical framework of the intervention?
Due to the fact that UNICEF no longer uses objective-based management, but results-based
management, no objectives are formulated in the logical framework of the intervention. The framework
mentions categories of inputs, specific activities for intervention levels, activity outputs, and expected
outcomes. Considering that the question refers to SAI’s expected outcomes, the analysis of the data
collected highlights the fact that most of the expected outcomes were achieved.
The school dropout rate registered a decrease, but the target was reached only in primary education.
On average, the absenteeism rate increased, but there are schools where it decreased to the level of the
target set.
Referring to the concept of friendly school, according to children’s statements, it was achieved. The
data that supports this statement is presented in Tables 5.25, 5.26 and 5.27, and in Figures 5.35 and
5.36, highlighting the fact that the assessments of pupils from SAI schools regarding the school climate,
the relationships with classmates and teachers are much more positive than those of pupils in the
control schools.
The conclusion that the school has become friendly and that the number of school factors that could
increase the risk of school absenteeism has decreased is also reached by analysing children’s answers to
the question that aims to identify dropout risk factors. The following table and figure present the
answer frequency to the question mentioned, which shows that although 28% of children have siblings
who have not finished school, 50% have friends who did not finish school and 56% have friends who

Page 148 of 198
think school is a waste of time, only 9.71% state they get bored at school, and to 90.33% of them, the
people who have made their dreams come true with education are motivating role models. The talks
had during the interviews with the children and parents involved in SAI brought out the strong influence
that the Împreună Agency had on helping them assimilate successful role models. This data and the
talks with children during interviews highlight the fact that something positive has happened in school,
which makes the unfavourable environment the children live in (friends and siblings who do not
appreciate school) not have a significant influence on their attitude towards learning.
Table 5 36 Pupils’ assessments contributing to the identification of risk factors regarding school participation
Think about your life and activities in and outside school and choose, for the following statements, the answer that best suits your opinion.
Aspects considered YES NO Number of answers
I have health problems 52 341 393
I have siblings who did not finish school 110 282 392
I have friends who did not finish school 197 192 389
My parents participate in school life 293 95 388
My family considers school a waste of time 27 361 388
I have friends who consider school a waste of time 140 250 390
I get bored at school 34 350 384
The people/personalities who have studied and have made their dreams come true are role models to me and they inspire me
346 37 383
The textbooks/guides/books that I have to learn from are easy for me to understand
345 46 391
The textbooks/guides/books that I have to learn from help my learning
369 20 389
Figure 5 38 Frequency of pupils’ answers regarding factors that influence their school participation and/or performance
Page 149 of 198
The outcomes regarding parenting skills and improved parent-child relationships have also been
achieved to a significant extent. The achievement of these outcomes is assessed only based on the
perceptions of children, parents and school principals. Both parents and children stated in the
questionnaires and during interviews that their child-parent communication had improved. Of the
389 children who completed the questionnaire, 376 (96.66%) declared that the relationship with
their parents had improved, and 69.63% of the 247 parents who answered the questionnaire stated
they got along “very well” with their children, while 26.32% declared they got along “well” with their
children. There are, however, three parents who stated they did not get along at all with their
children.
Pupils’ and parents’ statements regarding their relationships are all the more important as 75% of
the school principals and 53% of the teachers who answered the question regarding the causes that
determined them to get involved in SAI stated that their involvement was “to a very great extent”
aimed at improving pupil-parent relationships. From the principals’ perspective, although the desire
to improve parent-child relationships was very strong, only 62.5% thought that parent education
was effective “to a very great extent” in improving parent-child relationships. Principals’ answer
percentages are similar to those of parents, and thus we can assess that the parent-child
relationship improved in 60-65% of the cases.
Although not mentioned in the logical framework of the Initiative, parents’ cooperation with the
school and their involvement in school life are very important for reducing school absenteeism and
dropout, and that attitude was to be developed during SAI by the counselling component of the
school-level intervention. Apart from the interventions ran by the Institute of Education Sciences,
the Împreună Community Development Agency and the extracurricular activities organised in
schools also contributed to the development and improvement of this relationship.
During the interviews with parents, it was found that many of them did not distinguish between the
activities carried out under the Counselling component and parent education activities, but
whatever the case, they were very much appreciated. Pupils’ statements regarding parent
participation in school life (Table 5.36) highlight the fact that the Parent Counselling intervention
had positive results.
Considering the fact that effectiveness refers to the extent to which the interventions reached their
objectives and that, apart from the objectives of the Initiative and of implementing partners’
projects, each school had its own objectives, it was considered important to identify the needs and
motivation of beneficiary schools for getting involved in SAI, the way in which these schools
perceived the SAI involvement of implementing partners and local community representatives, and
only afterwards their perception of SAI outcomes.
The following tables and figures highlight the most important components, which addressed the
needs of the schools and determined schools’ involvement in the School Attendance Initiative.

Page 150 of 198
Table 5 37 School principals’ statements regarding the motivation to become involved in SAI
Think about the school where you work and select, for the following situations, the extent to which you agree with the following statements: When joining the School Attendance Initiative, you think that the following intervention components were very important for the school:
Needs considered - answers from principals
To a very great
extent
To a great
extent
To a small
extent
To a very small
extent
Not at all
Not applicable
Number of
answers Improving school management by training principals in strategic planning
21 9 2 0 0 0 32
Improving teachers’ educational and methodological skills so they can meet the needs of the pupils at high risk of school dropout
25 7 0 0 0 0 32
Improving the parent - school relationship
22 10 0 0 0 0 32
Parent education to improve the relationship between parents and children
24 8 0 0 0 0 32
Offering positive and successful Roma role models, especially for Roma children, and changing their attitude towards education and self-development
21 9 1 0 0 1 32
Developing a network of community actors to prevent school dropout
19 8 1 0 0 0 28
Training school mediators 23 3 2 0 1 3 32
Training Romani language teachers 17 2 0 1 1 9 30
Participation in the School Attendance Initiative was done in the hopes of improving the school’s situation regarding the teacher - pupil relationship
22 9 1 0 0 0 32
Participation in the School
Attendance Initiative was done in
the hopes of improving the school’s
situation regarding the teacher -
parent relationship
26 6 0 0 0 0 32
Participation in the School
Attendance Initiative was done in
the hopes of improving the school’s
situation regarding the pupil - parent
relationship
22 10 0 0 0 0 32
Participation in the School
Attendance Initiative was done in
the hopes of improving the school’s
situation regarding the relationship
between local community
representatives and the school
16 12 4 0 0 0 32
Participation in the School
Attendance Initiative was done in
the hopes of improving the situation
19 12 0 0 0 0 31

Page 151 of 198
regarding teachers’ educational
activities
Participation in the School
Attendance Initiative was done in
the hopes of improving the situation
regarding school participation
23 9 0 0 0 0 32
Participation in the School
Attendance Initiative was done in
the hopes of improving the school’s
situation regarding teachers’
management skills
21 10 1 0 0 0 32
It can be seen that the need that most principals mentioned was related to school absenteeism and
dropout (the SAI outcome) and the most frequent expectation was an improvement in teacher-parent
relationships (an output of the parent counselling component).
Teachers’ expectations differ from those of principals and their needs are distributed equally between
“to a very great extent” and “to a great extent”. Teachers’ expectations show that the biggest desire for
improvement concerns the teacher-pupil relationship. Table 5 38 Teachers’ statements regarding the motivation to become involved in SAI
Think about the school where you work and select, for the following situations, the extent to which you agree with the following
statements:
Expectations of SAI involvement - teachers’
answers
To a very
great
extent
To a great
extent
To a small
extent
To a very
small
extent
Not at
all
Not
applicabl
e/Do not
know
Number of
answers
Participation in the School Attendance
Initiative was done in the hopes of improving
the school’s situation regarding the teacher -
pupil relationship
154 102 7 1 0 2 266
Participation in the School Attendance
Initiative was done in the hopes of improving
the school’s situation regarding the teacher -
parent relationship
143 114 6 2 0 1 266
Participation in the School Attendance
Initiative was done in the hopes of improving
the school’s situation regarding the pupil -
parent relationship
141 115 9 0 0 1 266
Participation in the School Attendance
Initiative was done in the hopes of improving
the school’s situation regarding the
relationship between local community
representatives and the school
132 115 15 2 1 2 267
Participation in the School Attendance
Initiative was done in the hopes of improving
the situation regarding teachers’ educational
activities
147 102 12 2 0 3 266
Participation in the School Attendance
Initiative was done in the hopes of improving 161 102 3 0 1 1 268

Page 152 of 198
the situation regarding school participation
Participation in the School Attendance
Initiative was done in the hopes of improving
the school’s situation regarding teachers’
management skills
143 97 18 3 1 3 265
Figure 5 39 Frequency of teachers’ assessments regarding reasons for involvement
Teachers’ and principals’ assessments regarding the way in which different actors and/or agents of
change got involved in SAI, correlated with the needs and expectations of schools allow for another
interpretation of the results perceived by them. The following tables and figure present the principals’
and teachers’ perceptions regarding the SAI involvement of different actors.

Page 153 of 198
Table 5 39 Principals’ assessments regarding the SAI involvement of different actors and/or agents of change
Think about the school where you work and select, for the following situations, the extent to which you agree with the
following statements:
Involvement - answers from school
principals
To a very
great extent
To a
great
extent
To a small
extent
To a very
small
extent
Not at
all
Not
applicable/No
collaboration
During SAI, the school was also involved
in other local programmes and/or
projects
10 14 8 0 0 0
During SAI, the school was also involved
in other regional programmes and/or
projects
6 14 5 1 4 2
During SAI, the school was also involved
in other national programmes and/or
projects
6 13 2 3 6 2
During SAI, the school was also involved
in other international programmes
and/or projects
4 3 3 2 14 6
Teachers showed an interest in
participating in the School Attendance
Initiative activities
17 13 1 1 0 0
Pupils showed an interest in participating
in the School Attendance Initiative
activities
19 12 1 0 0 0
Parents showed an interest in
participating in the School Attendance
Initiative activities
8 16 7 1 0 0
The local community showed an interest
in participating in the School Attendance
Initiative activities
11 14 6 1 0 0
SPAS representatives (social assistance
clerks/social workers) showed an
interest in participating in the School
Attendance Initiative activities
7 17 7 0 0 1
GDSACP representatives showed an
interest in participating in the School
Attendance Initiative activities
9 17 5 0 0 1
The CSI showed an interest in
participating in the School Attendance
Initiative activities
19 10 1 0 0 2
CREAC representatives showed an
interest in participating in the School
Attendance Initiative activities
18 12 1 0 0 1

Page 154 of 198
Table 5 40 Teachers’ assessments regarding the SAI involvement of different actors and/or agents of change
Think about the school where you work and select, for the following situations, the extent to which you agree with the following
statements:
Involvement - answers from
teachers
To a very
great
extent
To a great
extent
To a small
extent
To a very
small
extent
Not at all
Not
applicable/No
collaboration
Number of
answers
During SAI, the school was also
involved in other local
programmes and/or projects
74 146 17 7 13 8 265
During SAI, the school was also
involved in other regional
programmes and/or projects
56 126 36 9 21 18 266
During SAI, the school was also
involved in other national
programmes and/or projects
55 94 30 11 42 29 261
During SAI, the school was also
involved in other international
programmes and/or projects
34 60 33 15 66 46 254
Teachers showed an interest in
participating in the School
Attendance Initiative activities
119 141 3 0 0 1 264
Pupils showed an interest in
participating in the School
Attendance Initiative activities
125 131 9 0 0 2 267
Parents showed an interest in
participating in the School
Attendance Initiative activities
84 139 35 3 0 6 267
The local community showed an
interest in participating in the
School Attendance Initiative
activities
75 136 43 2 2 8 266
SPAS representatives (social
assistance clerks/social workers)
showed an interest in
participating in the School
Attendance Initiative activities
60 129 37 9 0 23 258
GDSACP representatives showed
an interest in participating in the
School Attendance Initiative
activities
84 135 24 3 1 14 261
The CSI showed an interest in
participating in the School
Attendance Initiative activities
105 119 23 1 0 14 262
CREAC representatives showed
an interest in participating in the
School Attendance Initiative
activities
74 146 17 7 13 8 265
In the case of these answers, both principals and teachers assessed that pupils were those who got most
involved in SAI at school level.

Page 155 of 198
Figure 5 40 Frequency of teachers’ assessments regarding involvement in projects and in the School Attendance Initiative
Additionally, school principals assess the collaboration with implementing partners as presented in
Table 5.41: Table 5 41 Principals’ assessments regarding the collaboration with implementing partners
Think about the school where you work and select, for the following situations, the extent to which you agree with the
statements: You think that the components of the intervention were efficient for the school.
Assessment of the collaboration with implementing
partners and other actors involved
To a very
great
extent
To a
great
extent
To a
small
extent
To a very
small
extent
Not at
all
Not
applicable/No
collaboration
During the project I collaborated very well with UNICEF 29 3 0 0 0 0
During the project I collaborated very well with IES 30 2 0 0 0 0
During the project I collaborated very well with Holt Iași 26 6 0 0 0 0
During the project I collaborated very well with the
“Împreună” Community Development Agency 23 6 0 0 0 1
During the project I collaborated very well with the RENINCO
Association 21 4 0 0 2 3
During the project I collaborated very well with the CSI 24 7 0 0 0 1
During the project I collaborated very well with CREAC 21 7 2 0 0 1
During the project I collaborated very well with the MESR 20 7 2 0 1 2

Page 156 of 198
(Directorate for Minorities)
During the project I collaborated very well with the school
mediator 13 6 1 0 1 9
During the project I collaborated very well with SPAS 14 10 7 0 0 1
During the project I collaborated very well with GDSACP 16 15 1 0 0 0
During the project I collaborated very well with
trainers/facilitators/ resource people at county level 26 5 0 0 0 0
The collaboration with IES was appreciated the most, followed by that with UNICEF, Holt Iași, and county
experts.
Principals’ and teachers’ assessments regarding the efficiency of different intervention components are
as follows: Table 5 42 Principals’ assessments regarding the efficiency of different intervention components
Think about the school where you work and select, for the following situations, the extent to which you agree with the
statements: You think that the components of the intervention were efficient for the school.
Assessment of efficiency - answers from principals
To a very
great
extent
To a great
extent
To a
small
extent
To a very
small
extent
Not at
all
Not
applicable
Improving school management by training principals in
strategic planning 20 11 0 0 0 1
Improving teachers’ educational and methodological
skills so they can meet the needs of the pupils at high
risk of school dropout
25 7 0 0 0 0
Improving the parent - school relationship 21 9 2 0 0 0
Parent education to improve the relationship between
parents and children 20 10 2 0 0 0
Offering positive and successful Roma role models,
especially for Roma children, and changing their
attitude towards education and self-development
15 12 5 0 0 0
Developing a network of community actors to prevent
school dropout 12 12 2 0 1 0
Training school mediators 11 8 0 1 1 5
Training Romani language teachers 9 5 0 1 1 12
Intercultural education/Specific communication with
Roma people in the community and school space 18 5 3 0 0 2
A connection is found between the assessments regarding the collaboration with implementing partners
and the component considered by principals as the most effective (the teaching component), followed
by the counselling and management components.
At a personal level, principals state that, by getting involved in SAI, they have achieved the following
learning outcomes:
Table 5 43 School principals’ assessments regarding their own learning outcomes achieved during SAI
Think about your activity and select, for the following situations, the extent to which you agree with the statements:
Principals’ learning outcomes To a very
great extent
To a great
extent
To a small
extent
To a very
small
extent
Not at
all
Not applicable/
No
collaboration

Page 157 of 198
Following participation in the School
Attendance Initiative, I have the necessary
skills to develop a school development
strategy
17 14 1 0 0 0
Following participation in the School
Attendance Initiative, I have the necessary
skills to draw up a school development
plan
18 13 1 0 0 0
Following participation in the School
Attendance Initiative, I have the necessary
skills to develop a plan to integrate and
reduce school dropout
17 15 0 0 0 0
Following participation in the School
Attendance Initiative, I have the necessary
skills to implement a school development
plan
18 13 1 0 0 0
Following participation in the School
Attendance Initiative, I have the necessary
skills to efficiently involve stakeholders in
the life of the school that I run
15 17 0 0 0 0
Following participation in the School
Attendance Initiative, I have the necessary
skills to develop a more efficient
management team
21 11 0 0 0 0
Following participation in the School
Attendance Initiative, I have the necessary
skills to collaborate efficiently with the
pupils’ families
17 12 1 0 0 0
Following participation in the School
Attendance Initiative, I have the necessary
skills to collaborate efficiently with the
local community
20 12 0 0 0 0
According to the statements, the most important outcomes concern the skills for an efficient
collaboration with the local community, which emphasises the effects caused by the integrated
approach of the SAI intervention.
In teachers’ case, the questions referred first of all to their satisfaction with the way in which training
sessions had been carried out and then with what they had learned. The teachers’ answers are
presented in the following tables and diagrams.
Table 5 44 Teachers’ assessments regarding the quality of the training courses in which they participated during SAI
Regarding the courses in which you participated during the School Attendance Initiative, you think that:
Aspects considered
To a very
great
extent
To a
great
extent
To a small
extent
To a very
small
extent
Not at all
Not
applicable
because I did
not
participate
They were very useful subject-wise 153 81 3 0 0 19
They were very useful from the 149 82 5 0 0 19

Page 158 of 198
Regarding the courses in which you participated during the School Attendance Initiative, you think that:
Aspects considered
To a very
great
extent
To a
great
extent
To a small
extent
To a very
small
extent
Not at all
Not
applicable
because I did
not
participate
perspective of the methods presented
They were very useful from the
perspective of the trainer(s)’s work 159 67 4 1 0 19
They were very useful from the
perspective of the experience exchange
with other participants
162 67 5 0 0 20
They were well organised 175 59 3 0 0 19
The atmosphere was very pleasant 189 46 3 0 0 19
Teachers appreciate most the atmosphere of the courses, the way in which they were organised and the
possibility of experience exchange with other teachers. It is worth noticing the fact that only one teacher
assessed one aspect as having been achieved “to a very small extent” and that the number of those who
assessed different aspects of the courses “to a small extent” was very small (between five and three
teachers - between 1.97% and 1.17%), considering that during interviews a large number of teachers
made negative comments about courses organised under other programmes.
Figure 5 41 Frequency of teachers’ assessments regarding the quality of the training courses in which they participated
during SAI
Teachers’ answers show their positive assessment of the courses in which they participated (“They
enjoyed them” - level 1 - Reaction in Kirkpatrick’s model). The assessment corresponds to a mean score
of 4.68 out of a maximum of 5. Teachers in the control group who benefited from training courses asses
their quality with a score of 4.34. The effectiveness of the courses that the teachers participated in can

Page 159 of 198
be noted, at the level of perceptions, from the statements of participating teachers, pupils and
principals.
The next table shows, by means of teachers’ statements, what the teachers from SAI schools
(participants in SAI courses) have learned and are applying compared with those from control schools
(participants in different courses, in the same period as SAI implementation).
The biggest differences regarding what teachers are applying in schools from what they have learned
during courses refer to: monitoring pupils at risk of dropping out of school, organising trips and
extracurricular activities with pupils and parents. Considering that SAI sought to reduce school
absenteeism and dropout and that monitoring pupils at risk is very important for achieving that goal, the
perceptions of teachers in the SAI group and of those in the control group highlight SAI effectiveness at
the level of school practices.
Table 5 45 Differences regarding learning outcomes achieved by teachers in SAI schools by participating in SAI courses and
those achieved by teachers in the control group by participating in courses outside SAI
Your participation in the School Attendance Initiative was reflected in:
Learning outcomes after participating in courses were reflected in (multiple answers are allowed):
SAI-Control percentage difference
Aspects considered
Percentage of total answers from SAI
teachers
Percentage of total answers from teachers in
the control group
Applying to the curricular activity the active methods learned during training by me and/or my colleagues
82.30% 81.60% 0.70%
Organising extracurricular activities with pupils
81.60% 62.10% 19.50%
Organising extracurricular activities with parents
46.20% 24.10% 22.10%
Organising extracurricular activities with pupils and parents
53.80% 33.00% 20.80%
Participating in activities organised within the local community
45.90% 31.80% 14.10%
Participating in/Organising exchange programmes with other schools involved in SAI
45.10% 25.30% 19.80%
Monitoring pupils at risk of school dropout
63.90% 16.50% 47.40%
Organising/Teaching parent education courses
23.30% 5.00% 18.30%
Organising trips with pupils at risk of dropout/Participating in such trips
48.10% 22.60% 25.50%
Other activities 10.50% 6.90% 3.60%
Teachers’ statements correlate with those of pupils and highlight SAI effectiveness regarding the added
value of the new school practices, determined by teachers’ participation in courses (Table 5.46).

Page 160 of 198
Table 5 46 Difference between the assessments of pupils in SAI schools and those of pupils from control schools regarding new school practices
Think about your life and activities in and outside school and choose, for the following statements, the answer that best suits your opinion.
Aspects considered by pupils benefiting from SAI
Percentage of affirmative
answers from pupils benefiting
from SAI
Percentage of affirmative
answers from pupils in the control group
Percentage difference
In this school year, I like school more because we have some group activities
95.64% 84.56% 11.08%
In this school year, I like school more because, apart from textbooks, we are also using materials that make learning easier
93.62% 83.80% 9.82%
In this school year, I like school more because we have access to computers connected to the Internet
70.66% 64.56% 6.10%
In this school year, I like school more because we can ask questions during class activities
86.22% 66.67% 19.55%
In this school year, I like school more because we get teacher support when we have learning problems
90.26% 87.68% 2.58%
In this school year, I like school more because we have a variety of activities during class
87.47% 88.42% -0.95%
In this school year, I like school more because we have leisure activities
84.58% 78.80% 5.78%
In this school year, I like school more because we work on projects
88.49% 78.95% 9.54%
Excepting the answers about the variety of activities during class, a greater percentage of pupils
participating in the School Attendance Initiative think school practices have improved than in the control
group. The biggest differences refer to pupils’ wish to ask questions, work in groups, use teaching aids,
and work on projects.
All this data highlights the effectiveness of teacher training activities under the School Attendance
Initiative.
2. Has SAI reached children at risk of absenteeism and school dropout?
In the five years of implementation, over 80,000 children benefited from SAI, of whom 11,703 children
were identified as being at risk of dropout. All the children identified at risk of dropout were monitored
and involved in the SAI activities carried out in schools. The parents of these children were also
considered during SAI. During interviews, it was found that, although they had been invited to
participate in parent education, parent counselling and extracurricular activities, over 40% of the
parents of children at risk of dropout chose not to participate in such activities. Even some of the
parents from this category who did participate in activities dedicated to them do not admit that their
children have school participation problems. For example, in the case of Vetrișoaia School, according to

Page 161 of 198
the lists of children at risk of school dropout, ten mothers of children in this group answered
questionnaires and participated in interviews. Of those ten, only one mother assessed the following
statement as true “to a very great extent”: “My child/children does/do not have absence problems”,
and seven mothers did not agree with that statement “at all”. A similar example is that of parents from
Odoreu, where only one parent recognised their children’s absenteeism problems, five considered the
absence statement to be true “to a small extent” and two of the parents denied it completely.
Many of the child responders and parents deny the problems (that they actually have) regarding school
results, or are satisfied with these results, even though they are not good. Of the 393 pupils who
answered the questionnaire, of whom over 80% were pupils from the target group, with promotion
problems, only eight pupils did not agree “at all” with the statement: “I am satisfied with my school
results”, and of the 241 parents who assessed the following statement: “My child/children has/have
very good school results”, only seven did not agree with it “at all”.
3. Were SAI components effective in reducing the equity gap regarding school participation, in
relation to the objectives of each component?
Each intervention component of the School Attendance Initiative sought to fulfil the equal rights to
education of the children from SAI schools. Apart from the children at risk of dropout who were
identified and monitored, all the children in the schools involved benefited from SAI interventions.
Hence:
o The management and teaching components aimed at training principals and teachers in
order to improve school practices benefiting all the pupils.
o The parent counselling and parent education components targeted all the parents and
both the parents of children who had problems with school results and absenteeism and
the parents of children without such problems participated in the activities carried out
under these components. The activities aimed at involving all parents (irrespective of
social conditions, education, gender, children’s school results) in school life and in
solving absenteeism and school dropout problems;
o The community involvement campaign contributed to identifying additional cases of
children at risk of dropping out of school and to carrying out 5,214 social inquiries, 2,590
intervention plans and to offering social services to 3,082 children.
o Through all its components, SAI pursued UNICEF’s regional priorities, regarding the
“Inclusion of all children in quality education”, as presented in this report.
4. Were the SAI elements integrated into or considered for the later revision of public policies?
As was mentioned in previous paragraphs, the SAI elements were considered and/or integrated into
public policies: The methodology to identify children at high risk of school dropout was taken up by the MoE
and ARACIP and integrated into school participation monitoring policies (pupil’s roadmap);
The materials developed during SAI were included in the curriculum proposed for the new initial
teacher training system, the master’s degree in teaching;

Page 162 of 198
The SAI model is included in the projects promoted by the MoE as having a significant
contribution to preventing school dropout;
The latest revision of the national curriculum integrated the learning activities developed during
SAI for teachers working with pupils at risk of dropping out of school;
SAI has influenced public policies regarding the concept of child-friendly school and the new
indicators regarding the quality of education, which focus primarily on child welfare and the
safety of the school environment.
5. Were there any SAI elements or actions identified that could be considered good practices and
shared at national or international level?
The integrated approach to absenteeism and school dropout problems, aiming both at the
educational level and at the social level and involving a wide range of actors to solve these
problems, represents the main example of good practice developed by SAI. In the last years,
many projects that sought to reduce school absenteeism and dropout were implemented,
being financed from different funds/programmes. Most of these projects considered
interventions on two or three levels (pupils, teachers, school). Even in the case of those few
projects which identified social status and/or parents’ education among the causes of school
dropout, the intervention only aimed at informing parents about the importance of
education or informing the local authorities about the school problems. The fact that these
limited types of interventions were not effective and efficient is reflected in the high
national rates of school dropout (which have increased in the last years instead of
decreasing) and early school leaving.
The instruments for identifying and monitoring children at risk of dropout are examples of
good practice that could be explored nationally and/or at European level (in the Erasmus+
programme).
Parent education courses. Both teachers’ and principals’ statements show the need for
developing parent education skills for all form teachers in the country so that they can carry
out parent education activities with parents.
Practical extracurricular activities that involve parents and pupils.
The active participatory teaching-learning activities that the teachers participating in
educational courses have adopted.
Activities carried out after watching the “What do you want to be when you grow up” film.
Multicultural education courses organised and carried out by the Directorate for Minorities
of the Ministry of Education.
6. Was the intervention necessary to reduce school dropout in the selected communities?
SAI outcomes regarding:
the 50% reduction of the school dropout rate in primary education;
the 14.3% reduction of the school dropout rate in lower secondary education,

Page 163 of 198
highlight the necessity of the intervention to reduce school dropout in the selected communities. Even
though for lower secondary education the target established by SAI was not reached, the effects of the
Initiative were beneficial, all the more so since the effects of interventions in education cannot be
observed immediately. The comments from principals and teachers of the schools involved in SAI
highlight its utility. A few examples of such comments are presented as follows:
A+ for the development and impeccable implementation of the Initiative, as well as for the professionalism, competence and experience of all those involved, who have made this initiative an extremely useful and pleasant experience for us all. Truly wonderful people, who do what they do from the heart. Congratulations, and I am sure we will meet again and will hear only good news about other projects, which you will probably initiate.
It was an honour and a privilege to be part of this project. We wish to continue our collaboration with UNICEF and be able to share our experience with others. We thank you!
The School Attendance Initiative, in its three years of implementation, has changed our school life profoundly. We have worked a lot, but have made achievements we never thought possible. We have grown so attached to this project that now, at the end of it all, we feel we miss it very much. We miss the wonderful people we have met, we miss the activities, we miss the meetings with other schools, we miss the IES meetings, we miss the county facilitator. Time and daily activities will fill probably these gaps, but you can be sure of one thing, we will continue what we have learned, and the Filipeștii de Târg School will always respond to any request, for any kind of campaign, for the benefit of its pupils.
Thank you UNICEF and its partners for the support and attention given to this school during the School Attendance Initiative, which has added value, contributing to the improvement of school results and of the school image in the community.
I consider it extremely necessary to continue in a different way (another project, another intervention) for reducing school absenteeism and dropout, in order to maintain the effects of the School Attendance Initiative.
Early school leaving cannot be eliminated, but by continuing such campaigns, the number of pupils affected by this scourge can be much reduced.
We wish to maintain a good collaboration, and carry out other activities in partnership with UNICEF in the future.
Had they not participated in the Initiative, many children would not have left the commune because of material deprivation.
The School Attendance Initiative changes educational activities in schools for the better, it creates a bridge between pupils, parents and school.
I have had a pleasant experience in this initiative and I have met, during “subject teaching”
courses, an exceptional trainer, a teacher dedicated to his profession.
The School Attendance Initiative has greatly helped reduce school dropout.
It is the first project I have loved working on.
With its integrated approach, the Initiative also included pupils with outstanding learning results and has motivated them to continue. There are numerous examples of pupils who, in spite of having outstanding school results, risk not continuing their studies for various reasons (special needs families, material and financial needs, etc.).

Page 164 of 198
The project had a positive outcome through the activities carried out with children from the
target group and their parents. The parents were deeply satisfied and want the project to
continue.
Our project within the School Attendance Initiative had a positive outcome. The children at risk
of school dropout and those in difficult material circumstances have improved their school
performance, thus avoiding leaving school. The children have appreciated these project
activities very much and want the project to continue.
I would like to confess that my involvement in this initiative has helped me become better
professionally, I have become more empathetic, I have met wonderful people, very involved IES
trainers, UNICEF Romania representatives who love their work.
I am happy to say that all the activities I have participated in have enriched my soul, and I thank
you for that!
We thank all the trainers for everything they have done for our children. Now, both I and the
children see the school as a home... as a house of our own, with Romanian and Roma children,
brothers who live in harmony!
The Initiative has given an opportunity to everyone, irrespective of their social standing, state of
health, ethnicity or religion; it has given equal opportunities to all children.
Explaining and bringing parents to classes to see the pleasant environment in which the school
activities are being carried out, what we have learned to do and what we have done during the
Initiative has led to a reduction in school dropout.
Classes organised based on what appeals most to children with problems and a closer
relationship with parents - improvements due to the Initiative - have contributed significantly to
a reduction in school absenteeism and dropout.
During the Initiative, children from disadvantaged or Roma families are helped to integrate
better in the class group and participate in activities they would otherwise not be able to carry
out for lack of financial resources.
The entire Initiative seemed well organised to me, with absenteeism being a major risk factor in
our community when the Initiative started. The main strength is the positive outcome of the
Initiative.
At first, I was reluctant. But after all my ideas came to life and I could acquire everything I
needed to carry out the activities I had planned, it was a real pleasure, especially since both the
children and the parents liked the activities.
They were three beautiful years, with accomplishments, with the “Joy of Learning” - the contest
which rewarded our work and brought us hope to continue our educational projects.
In the class where I taught, after the parent-pupil activities, pupils improved their interest in the
educational process and were present in greater numbers, thus absenteeism was reduced.
I am looking forward to the next campaign...
5.2.3 Efficiency
1. Did SAI use resources in the most efficient way so as to obtain the expected equity outcomes?

Page 165 of 198
In the first years of the Initiative, especially in 2012-2013, the involvement of a very high number of
communities led to great expenses, so each SAI school/community had a small amount of money at its
disposal to carry out the activities necessary to obtain the expected SAI outcomes. Because of the high
number of schools involved, in some schools, where no additional sponsors could be found and where
the local authorities did not get sufficiently involved, the interventions were limited to testing methods,
not producing sustainable change. In the case of some schools, insufficient funding led to positive
discrimination in the involvement of pupils in extracurricular activities, which disadvantaged the pupils
with no school performance problems, who, for lack of funding, could not participate in SAI trips, thus
leading to arguments and discontent among them. Insufficient human resources (for the large number
of communities) with implementing partners made “in situ” school monitoring and consultancy difficult.
In order to improve the efficiency of the activities and obtain the expected outcomes, implementing
partners developed county networks of resource people, and UNICEF, considering the recommendations
of interim evaluation reports, reduced the annual number of communities involved (75 in 2013-2014
and 32 in 2014-2015) and decided to implement the Initiative in some communities for more than one
year.
Even under these conditions, the teachers and school principals participating in the interviews,
organised during school visits, stated that the funds allocated to schools so that the activities could be
carried out in good conditions and in order to involve a large number of pupils in these activities were
insufficient, considering the complexity and scale of the intervention (both from the perspective of the
components and of the high number of pupils at risk of school dropout) and the ambitious outcomes
expected.
2. Was SAI efficient from the perspective of the costs required to produce the expected effects on
children at risk of absenteeism and school dropout?
The SAI target of reducing school dropout rates was reached only for primary education (a 50%
reduction compared to the rates before the Initiative). In the case of lower secondary education, there
was a 14.3% reduction of the rate. Although, in lower secondary education, the decrease in dropout
rate is much smaller than the target, the situation in the SAI schools analysed in the summative
evaluation is much better than at national level (for example, in the 2013-2014 school year, the school
dropout rate for lower secondary education was 0.5% in SAI schools and 1.8% nationally).
SAI outcomes regarding absenteeism are not as expected. The average number of unexcused absences
per pupil increased in year 3 of implementation compared to year 1 (from 11.57 to 15.12 in primary
education and from 29.54 to 36.52 in lower secondary education). The answers given by participants in
the focus group interviews conducted during school visits show that the high number of unexcused
absences is mainly caused by the fact that some parents send their children to work or keep them at
home to take care of siblings, or leave the country and take the children without setting their school
record straight. A very important cause of this behaviour is poverty, which cannot be
addressed/decreased only by interventions such as those under the Initiative.
In order to achieve the expected SAI outcomes, two of the very important lines of action consisted of:

Page 166 of 198
Training sessions for school principals, teachers, mediators, social assistance clerks/social
workers, parent education sessions, etc.;
School and local community activities where the individuals trained could apply what they had
learned, in order to transform schools into friendly schools, to increase pupils’ and parents’
interest in education and, ultimately, to reduce absenteeism and school dropout.
Regarding the cost-efficiency of principal and teacher training, it can be considered that compared to
other interventions of this kind, the cost per day of teacher training was smaller (for example: the courses
organised by the Ministry of National Education for school mediators cost on average USD 62.39/day for one person, for Romani
language teachers USD 63.45/day for one person, the evaluation seminars for the activity of school mediators, with the
participation of CREAC managers, inspector and school principals cost on average USD 83.49/day for one person; the courses
organised by IES cost on average USD 67/day for one person) than the one charged in SOP HRD projects
(approximately EUR 120/day for one person, including course preparation costs, accommodation and meal for trainers and
course participants, trainers’ salaries and the teaching materials supplied to trainees) and in the Erasmus+ projects (a
course fee of EUR 70/day, to which are added the actual travel and subsistence costs, varying according to the country where
the training takes place).
The information supplied by UNICEF regarding SAI costs shows that these were as follows: USD 321,000
in the 2010-2011 school year, USD 796,000 in the 2011-2012 school year, USD 1,007,000 in the 2012-
2013 school year, USD 811,000 in the 2013-2014 school year and USD 537,422 in the 2014-2015 school
year, which adds up to USD 3,472,422 for the entire Initiative. Considering the number of schools
involved and the duration of their involvement which varied from one to three years, the average
implementation cost per year for one school is USD 10,123.68. This represents less than the average
amount which the European Commission assigns annually to a Romanian school that implements an
Erasmus+ partnership in education, namely EUR 19,600. If the expenses for project meetings in other
countries are deducted, the amount left for project implementation, locally, is approximately EUR
12,000/year, and the activities carried out in these projects do not cover such a wide range as those in
the School Attendance Initiative and do not involve such a high number of pupils and stakeholders. In
the case of Erasmus+ mobility projects for training purposes, the costs, including travel, subsistence and
organisation expenses, add up, on average, to EUR 270/day for one teacher, and EUR 150 for one pupil.
The aforementioned highlight the fact that from a cost perspective, although SAI did not fully reach its
target, it was an efficient intervention in terms of the outcomes reached for children at risk of school
dropout.
3. Were the resources available invested in a strategic and sustainable manner?
Considering the fact that a high number of teachers were trained both in teaching methods and in
parent counselling and parent education areas, it is expected that there be sustainable improvements at
least in the 32 schools that were involved in the intervention for three years. The practices already
implemented in schools, according to principals’ and teachers’ statements, can be considered
arguments to that effect.
Table 5 47 SAI school principals’ assessment of practices implemented in schools - part one

Page 167 of 198
Think about the school where you work and select, for the following situations, the extent to which you agree with the following statements:
Aspects considered by principals To a very
great extent
To a great extent
To a small extent
To a very small extent
Not at all
Not applicable/No collaboration
School climate is pleasant 19 13 0 0 0 0
I feel very well with my colleagues 25 7 0 0 0 0
Parents participate in the school life 5 11 15 1 0 0
The local community supports the school activity 11 15 5 1 0 0
SPAS representatives support the school activity 9 13 8 0 0 1
GDSACP representatives support the school activity
11 15 4 0 0 2
The school has a good relationship with the mayoralty
22 8 2 0 0 0
The Roma inspector within the CSI supports the school activity
21 8 2 0 0 1
CREAC advisors support the school activity 15 14 3 0 0 0
The teaching staff trained by RENINCO supports the activities dedicated to children with SEN/disabilities
13 10 4 0 0 5
The teaching staff trained by IES supports the activities dedicated to children with SEN/disabilities
14 8 6 0 0 4
There is a functioning warning system for children about to drop out of school.
11 17 3 0 0 1
There is a set of procedures applied in the case of children about to drop out of school.
10 20 2 0 0 0
A clear strategy is being implemented to support newly enrolled children in class and at school.
13 17 2 0 0 0
Remedial education programmes are being implemented for pupils in need
10 17 5 0 0 0

Page 168 of 198
Figure 5 42 SAI school principals’ assessment of practices implemented in schools - part one
Table 5 48 SAI school principals’ assessment of practices implemented in schools - part two
Think about the school where you work and assess the frequency with which the following occurs:
Aspects considered by principals Very
frequently Frequently Rarely Very rarely Not at all
Not applicable
Pupil attendance is monitored 23 8 1 0 0 0
Absence reasons are checked. 21 11 0 0 0 0
Dropout reasons are checked. 19 13 0 0 0 0
The teaching staff systematically monitors and checks pupils’ results.
19 13 0 0 0 0
The teaching staff follows the pupils’ individual progress and compare projected performance with the real one.
10 18 4 0 0 0
Personalised intervention plans are prepared, setting objectives for the areas of intervention identified in the pupil’s results analysis.
8 18 6 0 0 0
The teaching staff has access to school equipment, necessary to educational and support activities
23 9 0 0 0 0

Page 169 of 198
Figure 5 43 SAI school principals’ assessment of practices implemented in schools - part two
Figure 5 44 Frequency of assessments by teachers from SAI schools regarding school climate and practices

Page 170 of 198
Even though the prerequisites for improved and sustainable practices were set, the lack of funding for
carrying out activities like the ones under the Initiative and teacher overload question the sustainability
of the intervention.
Teachers’ comments regarding the problems they faced during the Initiative or the suggestions for
improvement areas for such campaigns question the sustainability of interventions without additional
sources of funding. Examples of such comments are as follows:
We have managed with the resources made available in the project, but in order to continue on the same path we need more resources.
The difficulty in obtaining teaching materials was a problem.
Overload and the small value of the microgrant were problems during SAI implementation.
Lack of time/loaded schedule.
The strength of the Initiative was the microgrant funding, which allowed us to carry out many activities.
The free time teachers spent working on the projects should have been rewarded in one way or another.
A more consistent financial involvement and material support in the future.
It is necessary to assign funding for extracurricular activities.
5.2.4 Sustainability
1. Are there any SAI elements that could continue once UNICEF’s support ceases?
Starting from the skills developed by principals, teachers and mediators from SAI schools, the
components of the intervention that could continue once UNICEF’s support ceases are:
o Identifying and monitoring children at risk of dropping out of school;
o Designing and carrying out attractive learning activities, adapted to pupils’ needs;
o Carrying out educational activities to build up self-respect, resilience and the will to
continue studying (activities that can be organised during advisory class);
o School mediators’ work
Apart from these activities, depending on teachers’ will to get involved and on their motivation tools
(not necessarily material ones), the following activities could continue in certain SAI schools:
o Extracurricular activities for pupils and parents;
o Parent education and parent counselling activities during lectures with parents and/or
advisory classes.
These activities are less probable than the ones previously mentioned, even though teachers have
developed the skills to carry them out, because of:
o Lacking financial and professional stimuli for teachers, who have low wages;
o Lacking material resources to organise extracurricular activities that appeal to pupils and
parents.
The sustainability of SAI effects remains, primarily, a problem related to the short- and medium-term
allocation of financial, human and material resources to replicate the outcomes and effects, based on
emulation and the enthusiasm of those involved.

Page 171 of 198
2. Has the model generated sufficient evidence to influence policies and secondary legislation?
The integrated approach to school absenteeism and dropout within the School Attendance Initiative
represented an element of innovation for Romania, which was taken up by the “Strategy for Reducing
Early School Leaving in Romania”. The model implemented and the evidence generated under the
Initiative influenced the MoE and ARACIP methodology for identifying children at high risk of school
dropout, and the concept of friendly school used in the Initiative influenced the new generation of
indicators regarding the quality of education, which focus primarily on child welfare and the safety of
the school environment.
Although enough evidence was collected during the Initiative, highlighting the necessity of the school
mediator for an efficient communication between the school, Roma pupils and their parents and for
reducing absenteeism and school dropout, and although both the principals (93.8% of the principals
questioned) and the teachers consider the work of these mediators very useful or useful (91.4% of the
teachers questioned), no influences were reported regarding consistent regulations and financing for
hiring school mediators in all the schools with Roma population.
At the level of perception, the multicultural education courses organised by the Ministry of National
Education, with its Directorate for Minorities, were very appreciated by school principals and teachers.
The beneficiaries of these courses stated they should be organised at national level for all teachers
working in multicultural schools and/or in schools where the population belongs entirely to one
ethnicity.
3. Is the model nationally replicable, by developing policies, secondary legislation and
methodological tools?
During the summative evaluation, the analysis of the data collected via questionnaires and interviews,
and of data supplied by UNICEF and implementing partners showed significant differences, at the level
of school communities, in the ways in which SAI interventions were received and developed. This finding
led to the conclusion that, for the successful replication of the SAI model, it is necessary to prioritise the
levels of intervention depending on the specific needs of each school. That requires a complex diagnosis
of the school needs, in the context of the community it represents, and based on that diagnosis, the
focus points of the intervention have to be established, depending on the vulnerabilities but also on the
specificities of each community.
4. Have national, county and local authorities assumed ownership of this initiative in order to
ensure its sustainability?
From the data analysed, no general conclusion can be drawn regarding the (national/county/local)
authorities’ ownership of the Initiative. It was found that, in the communities where the mayor or other
local authority representatives had connections to the school (current or former teachers in that
school/they studied there, teachers or school principals were members of the Local Council), the local
authorities were deeply involved in the Initiative and supported its implementation, with both material
and human resources. It is the case of authorities such as those in Todireni, Odoreu, Medgidia. There
were also situations where the local authorities were not involved at all in the Initiative, or even

Page 172 of 198
discredited it (for example: Culciu Mare, Vicovu de Sus). Most principals and teachers in the target
schools assess their collaboration with the CSIs as very good or good. There is one school (in Vetrişoaia)
which did not collaborate at all with the CSI for SAI implementation.
The collaboration with the Ministry of National Education was strongly felt through the Directorate for
Minorities, which was an implementing partner in the project and assumed ownership of the Initiative,
being involved in the training of principals and other teachers in intercultural education, of school
mediators and Romani language teachers. Even though Directorate representatives show a lot of
enthusiasm and will to determine changes by transforming multicultural schools into inclusive ones,
without funding, the intervention at this level cannot be sustainable.
5. Should the SAI intervention model be scaled-up?
The success reached by SAI on different levels and intervention components highlights the necessity to
scale it up nationally, with the aforementioned condition: prioritising the levels of intervention based on
the specific needs of each school and community assessed during a complex and complete diagnosis.
6. Has the SAI model generated a feeling of belonging at local, county and central levels (schools,
communities, local government, county authorities, ministries, etc.)?
As mentioned earlier, certain authorities consider they are an integral part of the Initiative, others do
not.
7. Has the intervention managed to empower the main stakeholders (children, parents) to better
claim their rights (improved access to: quality education, social services, community support
networks, parent education services, school-family partnerships, etc.)?
The analysis of the data collected does not show that this Initiative focused on empowering the main
stakeholders to better claim their rights, but on understanding the equal rights to education for all
children. SAI did not seek to claim anything, but to increase self-respect and trust in the role of the
school in pupils’ futures, to instil respect for multiculturalism and to create a feeling of joy about it.
5.2.5 Coherence
1. Was SAI carried out, from the design stage to the last stage of implementation, according to a
theory of change?
The theory of change, which defines all transformations necessary to achieve a particular long-term
goal, refers to both process and product44:
The process of theory development, in workshops and work groups with specialists and
stakeholders;
44 Theory of Change TECHNICAL PAPERS, A Series of Papers to Support Development of Theories of Change Based on Practice in the Field, By
Dr. Dana H. Taplin, Dr. Heléne Clark, Eoin Collins, and David C. Colby , April 2013 , www.actknowledge.org

Page 173 of 198
The product of the aforementioned process, a document of the model of change which shows
how and why a goal will be achieved.
Considering that, it can be said that, although the product was developed after more than two years of
implementation, SAI was carried out, in all its stages, according to a theory of change, because starting
from the SAI goal to improve school participation, the process involved setting up workshops, work
groups, consultations during which the intervention paths and the necessary intermediate outcomes
were identified.
A current debate issue is the one regarding which of the components of the theory of change is the most
valuable: the process of reflection on the activities, which leads to hypotheses, creates transparency and
builds consensus, or the product, a solid and comprehensive plan, with a plausible potential to produce
the desired changes.
The theory of change adopted in the Initiative was based on an organic development of the
interventions. Starting from the hypothesis that social systems respect laws similar to those of natural
systems, it can be considered that to the principle of minimum action, on which the evolution of
physical systems is based, corresponds, for evolving/changing organisations/institutions, the principle of
minimum change: there is an appropriate time when a minimum change places the organisation on the
path to achieving its intended goal. The local communities involved in SAI had some common
problems, but also a multitude of different characteristics, which made their paths to reaching the
common goal different, and the interventions in those communities not identical. It happens that, on
the path identified towards change, an intermediate area appears, where a new change might be
necessary, a synchronisation of details. Such an area may differ from one community to the other,
which is why, in our opinion, the fact that the “product” Theory of Change was developed at the stage
when similar communities were selected for interventions implemented for several years was
opportune.
In the “process” Theory of Change, UNICEF and implementing partners started with a goal, then
identified the approaches and types of intervention needed to reach that goal. As is necessary in any
theory of change, the steps to take were substantiated with causal criteria and indicators were
established. The theory of change was developed for: designing a complex and successful initiative,
evaluating the outcomes reached at the right moment and via an adequate evaluation process, and
explaining why some interventions worked better than others.
Apart from the Theory of Change, a logical framework of the Initiative was also designed to: allow a
quick visualisation of what was happening in the Initiative, prove that inputs, outputs and outcomes
were identified for the interventions, and summarise a theory of change and a complex intervention
based on categories.
2. Were formative evaluations used to adjust the model?
Three independent formative evaluations were carried out (for the following implementation years:
2010-2011, 2011-2012 and 2012-2013). Each of these evaluations concluded with a report containing

Page 174 of 198
recommendations that were largely considered in the following SAI years. For example, based on
report recommendations, the following changes/improvements were made:
A more intense collaboration between implementing partners;
Distributing areas of intervention based on the specific skills and expertise of
implementing partners, so that one partner is in charge of a particular type of
intervention in the entire geographical area covered by the Initiative;
Designating resource people at county level for each type of intervention;
Financing schools based on microgrant projects;
Developing the product “Theory of Change” and the logical framework of the
Initiative;
Implementing SAI for a period of more than one year in some schools;
Reducing the number of schools where SAI was to be implemented, for a more
efficient use of material, human and financial resources.
3. Were the self-assessments carried out by implementing partners and UNICEF used to adjust the
model?
Each implementing partner carried out monitoring and self-assessment activities and/or activities to
evaluate the satisfaction and learning outcomes of the people participating in their courses. The reports
sent to UNICEF also mention self-assessment results. Meetings were organised each year, with the
participation of UNICEF, implementing partners and, sometimes, the project managers/coordinators of
SAI schools. These meetings analysed the strengths and areas for improvement regarding the quality of
the interventions, and the final reports mentioned recommendations for each implementing partner.
The monitoring and self-evaluation activities planned and carried out annually by partners’ organisations
were a beneficial organisational exercise, because they channelled the efforts for the respective year
towards updating the activities based on the feedback received.
4. Did the process of change management work adequately?
Because the change sought by the Initiative was complex, it was carried out in several stages:
Awareness of the need for change and generating interest in initiating change within the identified
school communities;
Diagnosis of the situation based on the information gathered and analysed;
Identification of implementing “forces”/partners that are able to support the change;
Developing change alternatives, choosing the optimum alternative.
These stages are involved in the management of change.
UNICEF’s desire to produce change in a large number of school communities caused some of the change
management stages to be neglected. For example, the documents presented and the data collected via
questionnaires and interviews did not show that the internal factors favourable to change and those
opposing change had been identified in the selected school communities, therefore no “personalised”
intervention alternatives were established for such factors.

Page 175 of 198
Regarding change implementation, it seemed chaotic in the first years and was structured in the last two
years, when SAI communities were less numerous. In the first years of implementation, the
representatives of the school communities benefiting from the intervention did not understand the
intervention philosophy, they did not know (except for the teachers who had participated in courses
under the teaching component, the principals and the school mediators) which activity they had
participated in belonged to which component, who the implementing partners were, what the goals of
the projects implemented by these partners under the Initiative were, and what the expected outcomes
were. Also, in the first years of SAI implementation, the school communities selected received different
interventions and did not know the connection between the various intervention components. These
shortcomings led to the fact that, in some local communities benefiting from SAI, the people in charge
of the change were not prepared and dedicated to a long-term process.
A real improvement in the management of change was registered starting with the 2013-2014 school
year, when the “Theory of Change” document was developed, the collaboration between implementing
partners improved, change was tackled via comprehensive interventions in all the selected school
communities and schools were funded based on microgrant projects. All these, and the monitoring,
assessment and self-assessment activities carried out on every level, for every component, allowed for
the development of two important stages in the management of change:
Detecting and eliminating shortcomings;
Strengthening the new behavioural values that support the changes performed.
Considering the complexity of SAI interventions, two of the four change management strategies were
used:
The empirical-rational strategy, based on understanding the fact that people will follow their own interest once they have discovered it, and change is performed as a result of communicating information and offering incentives.
The normative-re-educative strategy, based on the fact that people will adhere to the new norms and cultural values, and change is performed by redefining and reinterpreting existing norms and values, and by developing new commitments.
5.3 DATA GAPS, LIMITATIONS AND UNANTICIPATED FINDINGS
The strength of the School Attendance Initiative was undoubtedly the complex, multidimensional
approach.
One of the SAI weaknesses was, in our opinion, a certain inflexibility of the intervention, in a few main
aspects:
The intervention programme was identical for all schools included in the Initiative. This strategy
was justified by the assumption hat the selected schools had similar characteristics in terms of
implementation needs. Unfortunately, this principle condition is not entirely confirmed by the
reality on the ground. There are differences between schools which made SAI impact very
different from school to school.
The implementation programme was applied identically to all schools during the entire
Initiative. In reality, the evolution of conditions in some schools, and especially the answer to
the implementation programme would have imposed a dynamic adaptation to some

Page 176 of 198
components or others. An example is the community from Lieşti, where the death of a Roma
child in a traffic accident, which occurred on his way to school, led to a long boycott of the
school by the Roma community.
In our opinion, designing an intervention as ample as the one aimed by the School Attendance Initiative
has better chances of success if based on an in-depth diagnosis of the respective school and community.
Based on this diagnosis, the needs and vulnerabilities of each school could be more precisely identified,
so that the implementation programme can also be adequately designed in terms of the components
and resources involved. Additionally, a dynamic progress evaluation should lead to operative changes
during the process.
6. CONCLUSIONS AND LESSONS LEARNED
6.1 CONCLUSIONS RELATED TO KEY EVALUATION QUESTIONS
The summative evaluation of the School Attendance Initiative considered building benchmarks, based
on quantitative and qualitative data and evidence, to outline answers to evaluation questions designed
according to the methodology developed based on the terms of reference, as follows:
1. How effective has SAI been in reducing the risk of dropping out and dropout rates in the schools
involved?
In the 32 schools involved in the Initiative for three years, benefiting from all the intervention
components, the risk of school dropout and dropout rates were moderately reduced. While the
mechanisms implemented and endorsed by school management to monitor school attendance have led
to visible success and have significantly contributed to raising awareness, at this level, of the problem of
absenteeism and school dropout, the decrease in the values of the indicators monitored continues to
be, to a significant extent, a consequence of a series of factors which do not depend primarily on the
school and on the efforts of the school community.
Therefore, if the SAI target was to reduce dropout risk from 5% to 2% in 60% of SAI communities, the
summative evaluation highlighted the following aspects, which must be correlated in order to assess
their reference to the SAI target:
Compared to the schools in the control group, in all SAI schools, both the principals and the
teachers who answered the questionnaires assessed that all the SAI components (defined in the
summative evaluation by the “institutional infrastructure” indicator) which targeted parents,
the local community, SPAS and GDSACP representatives, the mayoralty, the Roma inspector
within the CSI and CREAC counsellors made a difference in preventing and fighting school
absenteeism and dropout;
In SAI schools, compared to control schools, the components that make a statistically significant
difference are: the existence of the community network for dropout prevention and control, the
existence of the school mediator, the counsellor and the resource teacher;
None of the schools (either SAI or, even less so, those in the control group) have all the
components of the “institutional infrastructure” indicator. Among the missing components,

Page 177 of 198
which have not worked (or which the respondents do not mention), the summative evaluation
has identified the following: the community network for dropout prevention and control; the
minority integration and support plan; the school mediator and the resource teacher.
In conclusion, reaching the target set by the logical model of the Initiative for 2014-2015 – a 50%
decrease in school absenteeism and dropout compared to 2011-2012 – cannot be reported as achieved
in all the participating schools, for reasons which do not derive directly from SAI implementation, but
which concern the specific socioeconomic context. For example, as the qualitative analysis supported
by a case study has pointed out, in a school where 11 pupils at risk of school dropout had been
identified, reported and monitored, all 11 were reported as having dropped out at the end of the school
year because, according to the statements of the parents/guardians/families, the pupils had moved
abroad with their parents (Horgeşti - Bacău County).
Also, regarding the evolution of school dropout during SAI participation, examples can be identified
among participating schools where, in the last SAI year, dropout rates were much lower than the
average dropout rate, for example the secondary school in Slobozia Bradului, Vrancea County. The
qualitative analysis of the different data categories highlighted a constant coherence and consistency
between the actions and activities of the school implementation team, made up of: the school principal,
the SAI coordinator in the school, the school mediator, the Roma inspector and the county SAI
coordinator. The activities carried out in the School Attendance Initiative were constantly supported by
the mayoralty and the doctor and nurse from the clinic.
The actions and activities planned and carried out were coordinated and there was a beneficial
complementarity between those carried out by SAI and other programmes implemented by the school
and community; for example, the mothers of children from the SAI target group also participated in the
courses organised via the “Second Chance” programme (largely because they received financial
incentives for participating!), and completed them successfully. In the case of this community with a
predominantly Roma population, parent literacy contributed significantly to creating a positive learning
atmosphere to support education and especially the possibilities offered by education. From this
perspective, the school team’s self-identification by referring to the school as “the Slobozia Bradului
University” because it is able to offer something to everyone, according to their educational needs, is
emblematic of the role and position that the school acquires within the community by implementing
projects that truly respond to the needs of the respective community.
2. Have SAI interventions produced management changes in the schools involved, regarding the
implementation of strategies for school dropout prevention/control and the development of school-
community partnerships?
In the 32 schools participating in the School Attendance Initiative, changes were identified at the level of
management practices regarding mostly the routine use of mechanisms for the systematic reporting of
school dropout, mechanisms which were adopted and largely “internalised”. Nevertheless, strategic
planning documents (the IDP and action plans) are not yet used as routine and efficient work tools by
the management team in all schools.

Page 178 of 198
Under educational policies, the Institutional Development Project represents the school management’s
development strategy, which, according to the requirements of the standards of quality, is developed as
a team, together with the beneficiaries, pupils and parents. The Annual Internal Evaluation Report
(AIER), which is a document that examines the school situation and the activities meant to improve the
quality implemented and/or projected to be implemented, was also analysed within the same area.
Therefore, if the school management projects institutional development via improvements in the quality
of the educational services supplied, the projection document (the IDP) and the reporting document
(AIER) are directly connected. The purpose of the analysis was to assess whether the objectives of the
School Attendance Initiative were reflected in the design of the school’s institutional development, or if
the essence of the Initiative, the intervention to reduce school dropout and early school leaving,
remained strictly within the time and action limits of the Initiative, or if it was fully embraced by the
school. Hence, analysis criteria were established, which aimed at identifying the school’s concern, in
and outside the Initiative, for the situation of children from vulnerable groups. Institutional
development projects and operational plans were analysed, which represent the medium-term
development strategy and the implementation plans, which, according to the standards of quality, have
to be made public. Of the 32 schools, six did not make their IDP public (18.75%). A total of 25 of the 32
schools (78.12%) have mentions regarding the two issues, either as strategic targets, objectives or as
activities. One SAI effect is that many of the schools mention pupils with SEN or special needs from a
point of view that coincides with the present European perspective, not restricted to children with
disabilities, thus expanding the scope towards vulnerable children. Of all the schools, six have no
mention of children from vulnerable groups, even though the IDP was being implemented even during
the Initiative. Also, in some situations where the set goal is to reduce school absenteeism, the proposed
activities only refer to provision of school equipment and creating a friendly environment, not to an
integrated intervention. Also, again as an effect of the Initiative, there are three schools which suggest
parent-level interventions within the scope of reducing school dropout.
According to the law on quality, AIERs are developed each school year and presented to the
beneficiaries, being made public. The reports available according to the calendar were analysed, namely
AIER for 2013-2014 and AIER for 2014-2015, made public on the ARACIP platform (www.aracip.eu). The
quality improvement activities implemented in those years were examined, as well as the activities
proposed for implementation in the consecutive school year. Thus, the 2014-2015 AIER contains
activities that were designed to be implemented in the 2015-2016 school year.
In the context of immature understanding and implementation of the quality management system
specific to the Romanian education system, about 59.37% of schools (19 out of 32) have SAI activities
among their implemented activities. We can say that the ones that have mentioned such activities are
prevalent. The schools that do not see SAI activities as an integral part of their actions to increase
education quality account for 40.62% (13 out of 32). Of the schools which have introduced SAI activities
into the school’s education quality analysis, three have no continuity, in the sense that the 2014-2015
AIER no longer mentions anything about this kind of activities, and one school mentions them in 2014-
2015 without having mentioned them a year before. Nevertheless, we can say that in 59% of schools,
SAI has produced this effect, even though timidly and many times implemented reluctantly and with
logical fallacies. However, the concern for vulnerable pupils is or should be a part of the economy of

Page 179 of 198
offering quality educational services, especially since SAI included the management component,
implemented by the Institute of Education Sciences as a partner.
The school visits, questionnaires, focus groups, in-depth interviews and case studies have significantly
highlighted the concern of most of the management teams for reorganising the school environment in
order to transform the institution into a “friendly school” for everyone: pupils, parents, future pupils.
The extracurricular activities organised in the Initiative have significantly contributed to achieving this
objective.
Through the vision and mission assumed, many of the schools visited already identify themselves as
“inclusive schools”. This is the first step, setting the target to pursue, a step which is due to the school’s
participation in this Initiative and which was not visible in the control schools. Many successful efforts
were identified, regarding initiatives to adapt the school’s actions to the pupils’ needs. Nevertheless, the
present educational design, the constraints regarding the way in which the school curriculum is
perceived, the lack of flexibility in managing financial, human and material resources, all substantially
diminish the emergence of these initiatives.
Very many of the SAI schools have stated that, at the end of the Initiative they will initiate partnership
projects either within the community or with other schools. This openness is largely due to SAI
participation, the requirement to write a project for the microgrant received being a beneficial
incentive, as recognised by respondents.
Therefore, all 32 schools have set out and achieved projects to obtain microgrants, this being a condition
of participation renewal, via annual validation. This target was achieved largely due to the
determination of project management teams to continue to participate in the Initiative.
In the schools visited, the resource people most often mentioned by the management team, having
gained that status by their participation in the Initiative, are in this order: the school mediator, the
promoter, the county expert, the psychoeducational counsellor, the resource teacher, the Romani
language teacher. These are still perceived as “school people”, an educational resource, available to a
smaller or greater extent. Next, on second place, are the social assistance clerk/social worker, the
community nurse, the doctor, the local or proximity police officer, the mayoralty representative within
the school board, etc. These are still perceived as “outsiders” and the development of common actions,
partnerships and other endeavours requires effort, dedication, time and resources which are not
systematically available in schools. Planning common activities and coordinating actions involve human
and material resources first and foremost. Successful examples can be identified in the 32 SAI schools,
where the collaboration initiatives worked well because there was support by means of the resources
supplied by the Initiative.
We can say that there were changes in the management culture, but especially in the organisational
culture, because, apart from the usual, daily activities, the effect of SAI actions led to group cohesion, to
implementing group traditions and rituals meant to change/alter the organisational culture (for
example, the teachers in the Bunești Secondary School, Vâlcea County, invited the parents of Roma

Page 180 of 198
children to discussions and served them cookies, juice, coffee, which then extended to all the school
meetings).
3. Has SAI produced changes in the instructional strategies used by teachers in their day-to-day
activities?
Teachers’ participation in the courses organised under the Initiative is not enough to radically change
current mentality and practices. Related to the SAI target, whereby “teachers adopt a pupil-centred
approach and apply different methods, adapted to working with children at risk and those with SEN”,
the participants in the training courses organised under the Initiative appreciate both the usefulness of
the courses in which they participated and the skills acquired.
Therefore, the self-assessment of the skills acquired during the Initiative, according to the answers to
question 14 of the questionnaire for SAI teachers, shows that the average percentage of participants
who assess that they practice what they have learned in the Initiative “to a very great extent” is 47.69%,
and of those who assess that they apply the SAI learning outcomes “to a very great extent” or “to a
great extent” is 93.72%. These mean values result from the assessment of the following aspects
considered45:
Create a more favourable learning environment for pupils (141 teachers of 267, who answered
“to a very great extent”, which represents 52.81% of the total number of respondents, while
the percentage of those who answered “to a very great extent” or “to a great extent” is
98.50%);
Use a variety of teaching methods more efficiently (138 teachers of 265, who answered “to a
very large great extent”, which represents 52.08% of the total number of respondents, while
the percentage of those who answered “to a very great extent” or “to a great extent” is
96.60%);
Support the children at risk of dropout better (136 teachers of 268, who answered “to a very
great extent”, which represents 50.75% of the total number of respondents, while the
percentage of those who answered “to a very great extent” or “to a great extent” is 95.15%);
Monitor these pupils more efficiently, identify the dropout risk factors better (130 teachers of
267, who answered “to a very great extent”, which represents 48.69% of the total number of
respondents, while the percentage of those who answered “to a very great extent” or “to a
great extent” is 94.38%);
Have the ability to support children with SEN better (96 teachers of 266, who answered “to a
very great extent”, which represents 36.09% of the total number of respondents - it is worth
mentioning that of the 266 respondents, 25 answered that they had no pupils with SEN, and if
these teachers are subtracted from the total number of respondents, the percentage of those
who answered “to a very great extent” goes up to 39.83%). The percentage of those who
answered “to a very great extent” or “to a great extent” is 81.58%);
45The frequency of teachers’ assessments is included in the “Charts for the questionnaire for SAI teachers” folder, Question 14, of Annex 6 - Database
Page 181 of 198
Have a better collaboration with the family (120 teachers of 266, who answered “to a very great
extent”, which represents 45.11% of the total number of respondents, while the percentage of
those who answered “to a very great extent” or “to a great extent” is 98.50%);
Identify the school dropout risk factors better (128 teachers of 265, who answered “to a very
great extent”, which represents 48.30% of the total number of respondents, while the
percentage of those who answered “to a very great extent” or “to a great extent” is 95.47%);
In order to maximise results, it is necessary to systematically monitor the activities and initiatives
following course participation, to give continuous feedback, and to mobilise and motivate constantly.
The selection methods for the teachers who participated in the SAI courses presented no problems
since, according to the comment of one of the interviewed school principals, “only those who did not
want to didn’t participate or did not get involved”. The aspects that could have optimised the inclusion,
by the teachers participating in the courses, of the educational innovation elements in their day-to-day
activities had to do with the necessary continuous support, monitoring and feedback, recognising and
validating the results obtained via training credits, the need to communicate in professional networks
and continue to share the success and experiences acquired.
The involvement of the teachers in the training platform www.ise.ro, in the section dedicated to EPA
schools, and the participation in the contest titled “The Joy of Learning” were not systematic enough to
convince that a true “critical mass” of teachers was created, one able to change the educational
strategies used currently in class, in order to substantially decrease school absenteeism and dropout.
The duration of teacher involvement and participation in the Initiative is insufficient to identify ample
and deep changes regarding the extended use of educational strategies and elements of novelty
promoted via the courses organised under the Initiative. This stage can identify examples of “successful”
practices as well as contexts which prove that they work efficiently. The next stage should be the
capitalisation of these successful experiences by communicating in a network of professionals and by
expanding these experiences.
4. Has SAI produced changes in the teacher-pupil relationship and the teacher-parent relationship?
In most visited schools, the pupils’ and teachers’ answers converged with regard to the increased
identification and knowledge of school attendance problems and of the most frequent causes of school
dropout.
SAI participation has significantly facilitated the knowledge and recognition, by both teachers and
parents, of the problems regarding the two aspects addressed by SAI.
The SAI extracurricular activities organised in schools represented one of the strengths of the
interventions. This was due to the fact that the choice of these extracurricular activities, their design,
organisation and development belonged to the school’s teachers and management team and was able
to satisfy needs specific to the ethos of the respective school, and also to idea of involving both the
parents and the pupils not only in the dialogue but also in joint actions and activities.

Page 182 of 198
Nevertheless, in most schools, the interactions with other school partner representatives were not
frequent enough to stay “memorable” and thus be reflected in the answers to questionnaires, focus
groups and interviews.
In order for it to be more than just a successful initiative, any change of this kind requires support over
time, systematic repetition, promotion, resources and strengthening through continuity. Joint activities
redefined the relationship between teachers, and between teachers and parents. According to their
focus group statements, they felt more involved and that their opinions were considered. Therefore,
the implementation of joint activities (teachers-parents) aiming at the wellbeing of the child can lead to
the strengthening of the team of teachers, as well as to an improvement in the teacher-parent
relationship.
5. Has SAI produced changes in parents’ attitude towards education?
Parent participation in the parent education courses held under SAI is recognised by the questionnaire
respondents and the participants in the focus groups and interviews as one of the strengths of SAI
interventions.
A visible consequence at school level was the involvement of a larger number of parents in the school
activities in general and in parent education courses in particular, through a “contamination effect”,
noticeable at community level after a “successful” event organised by the school, for example an
extracurricular activity that involved parents and children from different classes, both from the target
group and outside it.
The qualitative data collected from direct feedback from parents participating in focus groups suggests
that radical changes in parents’ attitudes about motivating children to continue studying were recorded
especially in the cases where several interventions came together beneficially, for example parents and
children watching the “What do you want to be when you grow up” movie together in the caravan
campaign organised by the “Împreună” Community Development Agency, correlated with parents’
participation in parent education courses.
Examples can be identified, to a smaller or greater extent, in every participating school, but they must
be promoted and disseminated continuously, considering that, in most schools, “negative heroes”
continue to be more visible than positive role models.
Parent education continues to be a major challenge in rural communities, where the social capital of
most families does not value educational progress. Starting with the basic knowledge regarding the
optimum ways of caring for their own children and continuing with the lack of direction, perspective,
educational aspirations for their children, parents’ education remains a determining factor in supporting
the interest for learning.
Visibly, in the respondents’ perceptions, as they resulted from questionnaires and focus group
participation, SAI managed to pave the way, showing that “it can be done” and “how it can be done”,
but the actions must be supported continuously in every school community in order to see substantial
lasting effects at the level of the collective mentality. However, SAI has proven to us that a fine-tuning,
based on the specificities of the school and/or the community/school population selected as target

Page 183 of 198
group, is imperative. For example, in the communities with traditional Roma population (Bunești
Secondary School), tradition is stronger than any conviction that education is good, and children are no
longer allowed to go to school (the girls starting with fifth grade and the boys with sixth or seventh
grade, even though, in the focus group, the pupils all declared, almost in unison, what they wanted to
become when they grew up, which shows that their vision for the future differs from that of the adults,
who see them in a traditional way, within the community).
6. Has SAI produced changes regarding parents’ involvement in school life?
Where the school mediator was recognised and appreciated by the community, and where s/he became
systematically and continuously involved in school life during the Initiative, respondents also indicated
as a positive result a better involvement of the parents in school life, in the school activities and in
school.
The fact that the school was also perceived by parents as becoming “friendlier” was reflected in parents’
participation in common activities with children, activities where a cup of warm tea and a slice of cake
sometimes meant more than just formal hospitality, it meant facilitating openness and real involvement,
according to possibilities, in activities about which they learned almost as much as their children.
For the pupils in SAI’s target group, especially those in fifth and sixth grades, which seem to be the most
“vulnerable” moments in terms of school dropout, the fact that they could carry out school activities
with their parents, in a friendly environment, represented first and foremost an important element of
psychological support, marking the support for participation, education and investment in that field.
The changes focused exclusively on the period of SAI implementation, especially the period of grant
implementation, and did not bring SAI sustainability to the forefront, so parents’ and teachers’
perceptions cover only this period. However, judging from the statements made during focus groups,
parents regret the Initiative has ended. Some think that the road does not end with the completion of
SAI, but it must go on. For that purpose, some schools have identified sources of funding to continue
the actions, especially those involving common parent-child-teacher activities (for example, the Conțești
Secondary School, Teleorman County, which is an example of good practice in that sense).
7. Has SAI produced changes in the community so as to contribute to the reduction of school
absenteeism and dropout?
Of the SAI interventions, the promotion of successful role models to pupils in the target group, via the
educational kit and, in some cases, the watching of the “What do you want to be when you grow up?”
film by pupils and parents together, followed by the systematically guided debate, had the most visible
effects on Roma and non-Roma pupils from poor communities.
Creating and motivating joint teams and also the social assistance clerks/social workers to monitor and
prevent school dropout was an aspect very rarely identified by respondents. These activities do not yet
represent a real community resource, they are too little known and too rare to play a significant role in
the ethos of most schools.

Page 184 of 198
Evidently, where the school’s position within the community makes it a “pole of transformation”, for
example where the school has managed to attract projects, trained human resources, social
programmes and the community has recognised the school’s role (for example, feedback from teachers
and parents: “Slobozia Bradului University”), community response is positive and visible, exactly in the
proactive sense of the School Attendance Initiative.
The involvement of local authorities occurred mainly during grant implementation, by ensuring pupils’
transport in order to stay within the amounts allocated (for example, Secondary School No. 2 in Caracal).
The qualitative data indicated that local authority has a mainly administrative involvement (ensures
transport, human resources, if necessary) or is distant when it does not understand its purpose in
education.
8. Are SAI interventions sustainable in the schools involved?
Most respondents stated that SAI involvement was truly beneficial for the school, indicating a variety of
reasons and arguments. Nevertheless, the element that significantly built up participation enthusiasm
was, in most cases, the microgrant, and especially the possibility to adequately decide its use for the
school needs in the context of SAI participation.
Under these circumstances, the sustainability of SAI effects remains, to a great extent, a problem of
assigning, in the short and medium term, financial, human and material resources to replicate the
results and effects.
Also, one of the most visible effects of SAI participation was emulation, the enthusiasm to try new
things, experiences, events, to create new educational circumstances (some of the “successful”
extracurricular activities!). Replicating these experiences of real, non-academic, strongly emotional but
also very educational learning is, to a great extent, a challenge that questions the sustainability of these
“positive side-effects” of SAI interventions.
SAI durability and sustainability aim mostly, according to the opinions of those in schools, at the
microgrant segment, the activities carried out with parents and pupils, those that were most attractive,
almost completely bypassing durability and sustainability in other areas: appeal of the lessons, strategic
planning. Therefore, we can state that sustainability is polarised only into the activities carried out
through microgrants or those that require visible costs.
6.2 STRENGTHS AND WEAKNESSES (AT POLICY, MODEL, COMPONENT, PROJECT, PARTNER
AND BENEFICIARY LEVELS)
Beneficiary level
Both quantitative evidence and qualitative observations converge in supporting the
identification of visible (measurable and determinable) intervention effects in SAI schools, at
the end of the three-year participation. These effects can be identified: in parents’ and pupils’
participation in common school activities; the transformation of the school into a “friendly

Page 185 of 198
school”; the moderate decrease in the annual dropout rate for a significant percent of the
pupils in the target group.
The investment in the form of microgrants, that required schools to write project proposals, has
produced in most SAI schools effects such as: awareness of the importance of SAI participation
for the school community; trust in the school’s ability to keep getting involved in projects; the
shared feeling at the level of the school team, of “property”, holding, “ownership” by the
community of certain methods that can change the school climate, can influence absenteeism
and can put pressure on the school dropout phenomenon.
In the schools where, next to the principal (the same one for the entire duration of the school’s
participation in SAI), there was a school coordinator and they both cooperated efficiently with
the county SAI coordinator, the success rate for the SAI activities was visibly higher.
At the end of SAI participation, the activities that showed the greatest number of visible positive
effects were those that involved children, with or without parents, in a diversity of
extracurricular activities organised in schools, depending on the needs identified, based on the
joint decision of the team and the participants and carried out via a common effort.
The perceptions of a high number of teachers participating in SAI courses regarding the
efficiency of these courses were generally positive, but one of the objections identified
concerned the lack of continuity of SAI courses, as well as the lack of subsequent support
regarding feedback to the application of lessons learned in the specific educational context of
each school/community. According to the perception of some focus group participants, a
course participation plan would have been necessary, so that they could know from the
beginning what courses they would be attending, what was the order of these courses, what
they would have to implement after training, etc. The suggestion received was that these
courses be available as “training packs”, to be accessed depending on the needs and
specificities of the beneficiary, for optimum results.
Teachers also need support and “supportive” feedback regarding the “different”, non-routine initiatives
they take, even more so for the ones they initiate or develop starting from an initiative like SAI (for
example, starting from the ideas presented in the technological education courses or Origami courses).
Considering that the current supply of courses for teachers on the training market is perceived
as being sufficiently diverse to respond to a variety of professional development interests, when
they are being consulted about professional training options, teachers opt for a combination of
training activities, such as: courses + mentoring, where the main characteristics are planning for
a reasonable amount of time (for example, “blended learning” for the duration of a school year)
and especially flexibility and adaptation to the school’s specific issues.
There are qualitative arguments, identified in case studies and through qualitative data
synthesised from participation in focus groups and in-depth interviews, which state that in
schools, the educational poverty46 indicator can be improved through monitoring, in its
46In its annual publication, “Education and Training Monitor 2015”, the European Commission points out the fact that Romania is among the six Member States that received specific recommendations, in 2015, regarding the

Page 186 of 198
educational participation component, via concrete, coordinated, targeted action (for example,
by monitoring and systematically reporting pupils at risk of dropping out, coupled with a
systematic and constant communication with parents/guardians); but the educational
performance component of the “educational poverty” indicator can be positively influenced in
school only by educational measures applied systematically, for a period of time that is relevant
for individual school progress (for example, carrying out individual learning plans for one school
year/educational level; systematically monitoring plan implementation and adjustment,
according to the case; passing the plans and progress-related information from one educational
level to the next, based on the principle that “monitoring is for the pupil’s progress”).
Family level
Parent education courses, aimed mainly at the parents of pupils in the target group, responded
to a dire need, both educational and social. The educational investment proved to be very
efficient both in the case of families with several school-age children and in that of single-parent
families. In both situations, children are at risk of dropping out of school, as defined for the
target group of the Initiative, and the qualitative data support aspects regarding the efficiency of
educational investment in the situations identified, which have those characteristics.
The “parents’ corner” initiative, organised in schools, coupled with the transformation of
“lectures with parents” and the classic “parent-teacher conferences” into elements of parent-
school partnerships, contributed significantly to the opening of the school to the community,
also by transforming it into a “friendly school” for both pupils and parents.
With the activities implemented in school, parents became aware of their role in supporting
their own children’s school participation, and, implicitly, in reducing school dropout.
The parent-school relationship has improved, generating a positive reciprocal perception,
modified on both sides, especially in the schools where parents were valued by the school and
encouraged to take up their role as supporters of their children’s school participation (for
example, in the Conțești School, Teleorman County, there are photos on the school hallways of
children’s parents and guardians who support school participation).
Community level
Where the school mediator has a very close relationship with the school (school employee or
member of the school team), the specific activities carried out have visibly stronger and more
sustainable effects. The efficiency of the school mediator’s work grows significantly in the case
of a systematic collaboration with the social worker, the community nurse (doctor’s office) and
the school counsellor. The good practice examples stimulated by SAI activities indicate the fact
that this collaboration gives positive results even in the case of multi-ethnic communities and in
poor ones.
need to intensify efforts for the integration of disadvantaged pupils into education systems. In this context, the concept of “educational poverty” is defined as “the share of young people failing to reach minimum standards in education” (op. cit., page 18).

Page 187 of 198
The local authority’s awareness of the existing absenteeism and school dropout problems, even
though support for reducing them is treated superficially, not in depth.
The first steps were taken in understanding the need for a partnership between the school and
the local community, for the benefit of the latter (some municipalities supported the schools
during the Initiative by ensuring pupils’ transport in the microgrant activities carried out).
However, there is still much room for improvement regarding the integrated involvement of the
local community in issues that are perceived as belonging exclusively to the school, and,
implicitly, attributing the responsibility only to it.
Cross-cutting level
The monitoring and self-evaluation activities planned and carried out annually by the partners’
organisations were a beneficial organisational exercise, because they channelled the efforts for
the respective year towards updating the activities based on the feedback received.
Within the “Teaching - Teacher Training” component, developing continuous teacher training
activities opened up opportunities to develop school and class initiatives and to continue the
EPA vision online.
The activities that enjoyed true success in the participating schools were school demonstrations
(“demonstration lessons” including with guests from other schools) carried out by trainers and
experts with the pupils from EPA schools, and subsequently analysed in the participating school.
Team training activities are considered to bear the most visible effect.
The project-based activities initiated during SAI had real motivational effects on the participants,
due to their dynamic nature, by supporting pupils’ and participating teachers’ “commitment” to
learning, by blending the curricular-extracurricular and formal-informal elements towards
achieving a goal (subject, project outputs).
According to the evaluations collected, of all the continuous teacher training activities carried
out in SAI, those built on cross-cutting subjects (community projects, ECO, ICT, Friendly School,
‘Song, play and fun’, Origami) gave the most visible learning satisfactions, representing a clear
innovative element.
The SAI experience shows that the most efficient continuous teacher training method remains
“blended learning”, whereby the training process starts with the face-to-face stage followed by
facilitated interactions online.
The online component itself had the smallest effect in relation to objectives and expectations at
the level of the activities organised under the “Teaching” sub-component, given that it was
expected that it would regulate the interactions on the platform, not be received with
reluctance by teachers. At the start of SAI, the problem identified was the lack of digital working
skills, since the problem was not lack of access but the non-use of this tool for actual learning.
Subsequently, the motivation to interact constantly, regularly, “significantly” on the platform
remains a problem. There is a clear need to integrate training into the online platform, in a true,
complex and most of all assumed “individual training project”.

Page 188 of 198
Among the difficulties to implementing SAI activities (identified in the “Teaching - Teacher
Training” sub-component) is the reduced willingness of many teachers in EPA schools to get
involved, at first. Teachers, in particular those who commute, seem to be “at risk of dropping
out”, almost as much as the pupils. In these situations, the mental clichés regarding the
possibility to change something for pupils at risk of school dropout are hard to cancel, and
trainers mention the fact that, if cooperation is not achieved after the third school
visit/interaction, the probability of reaching the expected impact decreases substantially. There
is need for: more training time, a longer duration of the intervention, constant support,
maintaining enthusiasm, coaching and professional incentives.
The very different training experiences, due to the different contexts, have confirmed the need
to approach school and learning from a pragmatic perspective for the child, which implies an
effort to compensate for the shortcomings in the teachers’ initial training, which is currently
centred on delivering scientific content. This can be achieved only by changing the approach,
which must become truly concerned with solving the problem of “why the child cannot
understand” It is necessary that each teacher become aware of this approach, then adopt it and
finally support it actively, including at the level of school management.
The School Attendance Initiative has facilitated the creation of a multitude of educational
resources that respond to the training needs of the teachers working with pupils at risk of school
dropout and to the learning needs of this group of pupils. The challenge remains the efficient
use of these resources, especially teachers’ willingness, openness, and desire to systematically
use them in the day-to-day life of the school, in order to achieve concrete results regarding the
reduction of school dropout in the case of pupils identified as at risk.
The first steps have been taken for the school to understand that its problems must be solved in
partnership with entities and groups of people, that it must step outside its limits (self)imposed
by traditional mentalities and practices.
6.3 OPPORTUNITIES FOR UPSCALING/REPLICATION/USE OF LESSONS LEARED AFTER THE
END OF THE MODEL AND RELEVANCE FOR NATIONAL AND REGIONAL PUBLIC POLICIES
The multiple and diverse educational resources created by SAI were assessed by the direct users as
interesting, useful and efficient in the context of EPA schools. The quantitative analysis of the answers
to the questionnaires, correlated with the qualitative data from the available sources support the
statement that the expected SAI outcome regarding “teachers with optimised work habits and new
teaching methods for pupils at risk of dropout” was achieved in the case of the respondents who
participated in the SAI training courses, where they internalised the experience and confirmed that they
had actually used the indicated resources in class, after the completion of the courses.
School coaching is very necessary. The next step should be to systematise continuous teacher
training courses for activities with pupils at risk of school dropout. Medium-term professional
training plans are necessary, with the specific purpose of reducing absenteeism and school
dropout.

Page 189 of 198
Another dimension is that of initial teacher training. The training experiences catalysed by the
activities organised for teachers in the School Attendance Initiative highlight the need for the
teaching master’s programme to reflect the educational specificities of working with pupils at
risk of school dropout. The need has been identified, expertise is available, educational
resources have been created and successfully tested, now it is necessary to recognise it within
the public policy aimed at solving the identified problem.
An important lesson learned is that of monitoring as a means of control and reduction of
absenteeism: optimised school attendance and participation outcomes are correlated with the
individual monitoring of “the cases”. Where the principal, the school mediator, the Romani
language teacher and the school teachers establish close, direct relationships with the family
and the pupil at risk of dropping out, the probability of containing and decreasing the
phenomenon grows significantly.
This finding is consistent with successful educational programmes, with strong social and
societal dimensions, which work under similar conditions to those of the School Attendance
Initiative. For example, the “Beat the Odds Schools” (www.beattheoddsinstitute.org)
programme, a multi-school programme of the research-action type, built for the purpose of
demonstrating that “demographics are not destiny”, starts from this basic principle: “Emphasize
the achievement of every student in every classroom and take responsibility for that
performance. No excuses.” This is the first of six “keys to success”, as defined in this
programme, which can serve as inspiration, given the success reported in the USA, for example,
to continue the EPA model and the School Attendance Initiative, in a different stage, focusing on
the school as the “core” of a complex, social and educational network.

Page 190 of 198
7. RECOMMENDATIONS
71. THE PROCESS FOLLOWED IN DEVELOPING RECOMMENDATIONS IN CONSULTATION
WITH BENEFICIARIES
The entire process of developing the recommendations considered all the aspects for the correct and
transparent reflection of SAI experiences as lived by participants, beneficiaries, implementing partners,
in order to positively and efficiently capitalise on these experiences following the end of SAI, but
especially with the aim of using the lessons learned in the School Attendance Initiative to implement the
new integrated model of social services in Bacău County.
7.2 RECOMMENDATIONS FIRMLY BASED ON EVIDENCE AND CONCLUSIONS
Each of the recommendations formulated by the evaluation team is the result of one or more
conclusions or lessons learned identified based on the triangulation of resulting data and information,
and on the quantitative and qualitative analyses performed.
7.3 IDENTIFICATION OF TARGET GROUPS FOR RECOMMENDATIONS
In four years, from 2011 to 2015, the School Attendance Initiative developed, carried out, adopted,
validated, and adapted various components and resources, which reached, in the peak stage of SAI, in
different proportions and combinations, according to the organic development model assumed via the
theory of change adopted by the Initiative, a total of 178 school communities. The components and
resources created in the intervention are characterised by great diversity, complementarity and
complexity, aspects highlighted even by the Intervention Map.
Thus, according to the Logical Model of the intervention, 116 measurable results were reached in 2014-
2015 alone as outputs of the different SAI components and partners.
In 32 of all the communities where one or several components were implemented, the SAI summative
evaluation identified all the components and resources developed under the Initiative, these
communities having the common denominator of having “participated in SAI for three consecutive
years”. All the conclusions, lessons learned and recommendations formulated as a result of the final
evaluation are focused on these 32 communities.
Next, the summative evaluation identified target group levels for the formulated recommendations:
I. The level of national authorities
Both in-depth interviews with SAI partners and with a representative of the decision-makers, involved
throughout SAI implementation, and the feedback collected at the meeting with SAI school principals,
organised at the end of the project, generated positive reception and support for continuing or
extending many of the practices and lessons learned.
The School Attendance Initiative has managed to generate, both in the target group and in the actors
involved, two types of effects that could be highlighted through the qualitative analyses carried out in
the summative evaluation: “emulation” and “contagion”. These effects can be drivers of success for
initiatives similar to those carried out in SAI.

Page 191 of 198
To replicate these effects at system level, the non-directive, partnership-based, motivational approach is
essential, by exemplifying the “best practices that work”. For public policy developers they can be
useful benchmarks for adopting the following aspects:
The SAI logical model can be successfully replicated if it is assumed that the practices with the
highest “success” rate in terms of increasing school participation have been those that have met
three basic requirements: community commitment, family cooperation and preventive
educational practices (analysis of feedback from implementing partners).
The multitude of educational resources developed by the implementing partners and by all the
actors involved in SAI along the years can stimulate the “contagion” effect, if they are adopted
and capitalised through public policies aimed both at inclusive education and at social inclusion
(analysis of feedback from implementing partners).
The cross-cutting interventions developed in SAI have created good practice models that can be
promoted both nationally and regionally, as follows:
o The Communication Strategy developed during SAI, Communication for Development
(C4D, 2011), is an exercise that proved efficient for at least two targets: 1. Optimising
SAI visibility at national level; 2. Making communication between SAI partners and
schools more efficient. This model can be used in any of the national strategies adopted
in the fields of education and social protection.
o The educational kit for promoting diversity, titled “What do you want to be when you
grow up?”, the educational Rromanipen, and the Romani language textbooks are all
useful resources for all the communities in Romania, but also in Balkan countries with
challenges related to Roma education, and can be promoted and developed through
regional multilateral partnerships;
o The “Joy of Learning” contest and the www.ise.training.ro platform already proved to be
resources capable of generating user emulation and instilling the desire to develop,
explore and carry on actions which have proved that “it can be done” in “educational
priority areas” as well.
o Countless studies and research developed throughout SAI, based on quantitative
databases and numerous qualitative data, relevant to the Romanian context, already
constitute fundamental benchmarks that cover a great need for knowledge aimed at
future developments related to access to education, inclusive education, extracurricular
educational resources, teaching practices that support the individualisation of learning
and the focus on results, etc.
Maybe the most important “lesson learned” by the different groups of stakeholders in the
School Attendance Initiative is the need to “integrate” and make common efforts more efficient,
using complementary public services: education, social, health. Thus, identifying and
operationalising the optimum cooperation mechanisms should be “priority zero” in all action
plans corresponding to the adopted national strategies.
II. The level of regional and local authorities
The experiences identified from the conclusions and lessons learned highlight that, in the future, in
order to achieve the expected outcomes, it is essential to plan and implement in the field a

Page 192 of 198
complete four-year intervention cycle, in all the school communities involved. In every community,
it is necessary to overlap the intervention cycle with an educational level (for example, the
primary/lower secondary/upper secondary education). This general intervention management
aspect is fundamental because:
o All the components of the “institutional infrastructure” indicator addressed by the
intervention must work simultaneously, comparably, as one and completely, in each
community involved, in order to get optimum results.
o All inputs and outputs developed during campaign involvement must be ultimately aimed at
the pupils in the target group, those at risk of dropping out of school. Once the pupils have
been identified, this aspect involves continuous, systematic monitoring throughout an entire
educational level, not just annual reporting.
Of the activities aimed at school management teams, the one regarding project development for
annual microgrants was carried out in all the communities selected for the summative evaluation.
This achievement was due to the common decision of management teams to participate in SAI and
to maintain the continuity of this participation. In addition, according to the SAI logical model, the
inputs represented by contractual commitments made to obtain grants proved functional and
beneficial to achieving the target set. Furthermore, all the principals who answered the
questionnaire and participated in the in-depth interview assessed the microgrant project as very
useful and highlighted the need to continue that practice.
For that matter, the effectiveness of granting inputs in the form of financial incentives is
theoretically and practically confirmed at international level. For example, Harvard Family Research
Project, in Vol. XV, Nb. 1, Spring 2010 (source: www.hfrp.org/evaluation/the-evaluation-
exchange/current_issue/scaling_impact), in the context of the discussion about the scaling-up of
intervention programmes, confirms the adequacy of the respective practice: “... a small amount of
money can make a big difference in people’s lives” and exemplifies using the practice of
microcredits (“the idea of giving very small loans to people in poverty to spur entrepreneurship and
self-employment”). The microgrant principle can be transferred and adapted to the social context
of a school at the centre of an active network.
Based on SAI’s positive outcomes, the possibility to continue microgrants and, ultimately,
supplement them with study microcredits for pupils selected according to transparent procedures
could be explored, with the aim of maintaining in school the pupils who are nearing the end of
compulsory education, so they can join the labour market or continue their studies. This way, the
commitment of the community to access a microgrant and use it according to its own choice,
respecting the needs of the school, can be capitalised and further supported.
The analysis carried out highlighted the fact that, in schools, the issue of absences is more difficult to
manage when there is a high number of pupils enrolled. In other words, in the case of “big schools”
(with a high number of pupils enrolled), since the number of pupils can be a risk factor in
absenteeism, it is necessary, on the one hand, to increase absence monitoring and control

Page 193 of 198
measures, and on the other hand, to allocate additional human and material resources to constantly
support these measures.
Related to the aforementioned aspect, regarding the relationship between pupils’ ethnic ratio and
the decrease/increase in absence rates during SAI, the analysis showed that in schools with a
significant proportion of Roma pupils, more attention was paid to absence control, which favoured a
significant reduction in the absence rate throughout the school’s SAI participation. These
conclusions support the recommendation to strengthen team activities in the future, carried out by
form teachers, school counsellors and mediators who, based on absence monitoring, can develop
the action plan according to the conditions in each school, implement it but also have the freedom
to adapt it according to necessities. These aspects imply constant support and cooperation from
local and regional authorities, for example from the school inspector for Roma pupils and others.
It is functionally important that, in the communities where other interventions were also carried
out, apart from the ones under SAI, the effects were amplified. This finding confirms a natural state
of osmosis between different interventions, necessary and identifiable within a system, in this case
the education system. For example, schools were identified where the “Second Chance”
programme was successfully carried out, involving even parents of pupils in the SAI target group
(such as: Slobozia Bradului, Vrancea County), and respectively, schools where the “School after
School” programme was carried out simultaneously and successfully (for example: “Alecu Russo”
Secondary School, Bacău County). In these situations, the effects of both categories of interventions
were visibly enhanced, and this finding is supported by qualitative and quantitative data.
At the level of the learning community, a better coordination of interventions, actions, projects and
other endeavours that involve the school ethos is necessary. The school is a living organism that
acts, reacts, interacts, and the inter- and intra-institutional cooperation can only become efficient
when there is awareness and consistency at the level of organisations regarding the decisions
related to all the interventions that are in progress in a particular moment. These findings support
the recommendation to monitor the improved development of the school’s management planning
documents (the IDP, specific action plans, etc.), coupled with continuous counselling and feedback
from the CSI for the management teams in school communities.
Adopting the organic growth-based development plan within the School Attendance Initiative
meant assuming the innovative approach consisting of the complex, complementary and congruent
intervention, involving multiple decision-making levels and several sectors, complementary to the
education system.
That involved the specific contribution of partners with national expertise in different areas: the
methodology of Educational Priority Areas (IES), school and curriculum management (IES),
counselling (IES), parent education (HOLT), social assistance (CRIPS), child education and support for
teachers in activities with children with SEN (RENINCO), community development (“Împreună”
Agency). The qualitative and quantitative analyses carried out in the final evaluation have
highlighted significant differences, at the level of school communities, in the ways in which SAI
interventions were received and developed.

Page 194 of 198
The prioritisation of intervention levels is essential for the success of school interventions. There are
schools where the need for social services is the number one intervention priority, and schools
where educational services come first. Fundamental to ensuring the success of the global
intervention remain: a. the joint decision of the management team for school-level implementation;
b. the constant support of that decision by local/regional authorities (the CSI, mayoralty, social
assistance services, public health services, etc.).
The campaign has facilitated the creation of a multitude of educational resources, including in the
form of training modules for principals and teachers. For the medium- and long-term sustainability
of outcomes, beyond SAI lifetime, updating the training modules is essential, by adding new
examples and learned lessons, coupled with facilitating open access to the www.ise.training.ro
platform to all interested teachers, as well as to principals and school mediators, by type of interest
and training. The future success of the training courses designed depends greatly on the following
aspects: a. a complex diagnosis of the specific training needs of the participants; b. targeting the
specific development needs of the school community that the participants are a part of; c.
considering mostly practical aspects for solving the problems identified, using systematic activities
such as projects.
Data shows that the SAI target, namely communities, families and schools that are mobilised and
have functional networks to identify sustainable solutions to address and prevent school dropout,
was only partially achieved in some of the communities, the case studies supporting this finding with
arguments. In order to reach this target, a coordinated intervention is necessary, aiming at the
direct beneficiaries, especially at families with children at risk of dropping out mainly because of
poverty. The network must efficiently mobilise all the other stakeholders, together with the school:
social workers, community nurses and school/clinic doctors, school mediators (if they are employees
of the school), municipal councillors, etc. Data shows that the intervention plan only works where it
is developed by mutual agreement, and where the responsibility for the different lines of action is
clearly established and, especially, assumed.
Correlating the data resulting from case studies, from direct observation of school ethos elements
and from the analysis of questionnaires and in-depth interviews highlights the need to develop,
within the school community, a system for analysing the causes and individual cases of absenteeism,
which is generally a precursor of school dropout. This analysis must be supported by proactive
measured to motivate pupils with a high number of absences to return to school before they are
declared as having dropped out. This objective can be fulfilled by applying and constantly checking
the school attendance monitoring mechanisms already activated in the Initiative, coupled with
concrete measures addressing those cases. Measures must be flexible and address specific cases,
adapting to each situation since the “one size fits all” principle has been proven not to work in this
context.

Page 195 of 198
At the end of SAI, the case studies and the structured observation made during school visits show
that communities responded differently to the implementation of the different intervention
components. Where components were adapted to the specific community conditions (for example:
requesting and carrying out courses regarding children with SEN for teachers in kindergartens or
institutions that frequently face these aspects), the intervention was efficient, realistic and adequate
(for example, the case study of Horgeşti in Bacău County, where the RENINCO intervention aimed at
pupils with SEN focused on the kindergarten, a different school structure from the one where most
of the other intervention components were carried out).
A measure to guarantee the successful implementation of complex interventions, as were the ones
promoted under the School Attendance Initiative, is represented by a complex diagnosis of the
needs/necessities of the school, in the context of the community it represents. Based on this
diagnosis, key focus points must be set for the intervention, depending on the vulnerabilities and
specificities of each community. The implementation programme (including the components and
resources employed) thus has to be adequately adapted to the needs of the learning community.
This involves the need to develop a “community profile”, with strengths and weaknesses, credible
and complex enough, assumed by community members, which can form the basis for every future
intervention.
The explanation for the stagnation/decrease of the school dropout rate is, on the one hand, the
integrated school intervention on factors that can influence this phenomenon and, on the other
hand, a psychological dimension of bringing an important school problem to the forefront, which we
could generically call priority zero area in the hierarchy of school priorities. It is found that in
schools, especially in those with such problems, there are a variety of school life problems, difficult
to rank according to importance and their influence on pupils’ results. The roll-out of a campaign
focused on school dropout/early school leaving makes school employees and management be
concerned about this issue, causing a kind of unity of concerns and joint targeting of the activities
carried out, which leads to an increased success rate of achieving the expected outcomes.
Therefore, we support the idea that, apart from integrated interventions, there is a need to
articulate the psychological group dimension for the school staff, putting the targeted phenomenon
at the top of the priority list. In order to ensure the sustainability of measures meant to
reduce/address school dropout, the school team needs what we call recognition, a self-confidence
boost, which gives the team the strength to continue their work at least in the same way.
More focus on the management component (designing and implementing medium-term
development strategies) in the integrated intervention to decrease absenteeism and early school
leaving for children at risk is beneficial from the perspective of knowing the purpose, in the case of
all those involved, but also of the endogenous and exogenous actors that should intervene. In the
same area, building a mentality of ensuring the provision of quality services, at least at a minimum
level of quality, would be an important component in ensuring the sustainability of the implemented
measures because a fundamental principle in this area is the focus on beneficiaries, fulfilling their

Page 196 of 198
needs, not in the broad sense but in an more specific sense. For teachers, building such a mentality
by also creating mechanisms to improve their work needs to outline, in the future, two essential
elements: establishing self-assessment criteria and a sustainable self-assessment procedure both
through feedback from beneficiaries (pupils and parents) and by measuring the efficiency and
effectiveness of the lessons delivered (examples of self-assessment mechanisms for teachers’
lessons: filming the lesson and auto/analyse it in the methodology committee and/or individually;
requesting pupil feedback and redesigning the lesson accordingly).
7.4 POSSIBLE LIMITATIONS IN IMPLEMENTING RECOMMENDATIONS
In implementing the evaluation team’s recommendations, certain constraints could be encountered:
Harmonising intervention planning and implementation for schools with vulnerable children,
without a personalised analysis of the risk factors that affect children.
The institutions involved not acting simultaneously, or not knowing their roles in reducing the
risk of early school leaving.
Precise identification of children in the target group and of those at risk of entering the target
group (it is essential to periodically re-evaluate the conditions met).
The lack of opportunities to access microgrants due to a lack of allocated funds.
The accurate reporting of data and especially of absences, by establishing clear rules for schools,
the CSI and the MoE.
Setting, upon appointment, clear indicators to be developed by the management team and
continuously monitoring the progress of these indicators.
8. GENDER AND HUMAN RIGHTS IMPLICATIONS, INCLUDING CHILDREN’S
RIGHTS. TRANSPARENT INFORMATION FOR TACKLING GENDER
EQUALITY AND HUMAN RIGHTS ASPECTS, INCLUDING CHILDREN’S
RIGHTS
The gender dimension was considered to be involved in the School Attendance Initiative, according to
the “organic development model” adopted. The development of intervention components, the planning
and designing of activities were thought out respecting gender differences and children’s rights,
estimating and considering, based on previous experiences from the action research carried out during
the “Educational Priority Areas” project, the possible effects of gender differences that the designed
activities might have on the different groups involved.
The SAI planning and implementing process was organised considering the possible different gender
impact that SAI activities might have on boys and girls, respectively. The implementation strategy
mentions the following:
The role of the training programme in raising teachers’ awareness of gender differences;
The importance of involving the father in parent education;
Integrating a participatory and gender-friendly approach into community mobilisation;

Page 197 of 198
Promoting a gender equality perspective in supporting Roma children.47
The initial ethnic-based hypothesis regarding school participation was confirmed both by the data
collected “on the ground”, in the schools involved, and by the interim evaluations carried out at the end
of SAI years: the official detailed information regarding school participation, especially that of Roma
children, who face the most difficulties, is still not systematic in nature. The majority of the data
continues to come from studies carried out by organisations active “in the field”, which highlight the fact
that there is a stronger school dropout tendency in primary education compared to the rest of the
school population. Similarly, absenteeism is higher in Roma pupils, and ultimately leads to school
dropout in senior high school years, in a higher proportion of Roma pupils compared to the rest of the
school population.
The studies have also emphasised a decrease in education quality, correlated with an increase in the
number of Roma pupils. In the School Attendance Initiative, promoting access to education for Roma
pupils was one of the main objectives of the initiative, operationalised via training programmes
dedicated to relevant professionals (school mediators, Romani language teachers, courses in Roma
history and traditions, etc.) and by actively promoting role models. Hence, SAI initiated and carried out,
continuously and systematically, activities to facilitate the access of Roma pupils to quality inclusive
education: training principals in cultural diversity (Roma culture and traditions), training Romani
language teachers, training school mediators, systematically promoting successful Roma role models.
Similarly to interim evaluation exercises, at the end of each SAI year, the methodology of the final
evaluation has adopted in all the stages of its summative evaluation exercise the principles of inclusion,
participation and respect for gender differences and children’s rights: in the evaluation design, in
developing the tools, in collecting feedback from implementing partners, in applying the tools, in
analysing the data, and in drawing up the reports.
The evaluation tools designed for the summative evaluation were developed considering the
characteristics of the target group. Pupils’ involvement in the evaluation followed both the provisions of
the Convention on the Rights of the Child and UNICEF’s recommendations regarding the participation of
children.
All the data categories, from all the sources used in the evaluation, contain the girl/boy and rural/urban
criteria, covered by the National System for Education Indicators.
The evaluation complied with the National Education Law no. 1/2011 as regards ensuring transparency
of data and information concerning education and the socio-educational environment. The provisions of
Law no. 272/2004 regarding the protection and promotion of children's rights were observed.
Both the philosophy and the four-year development of the School Attendance Initiative focused on
following and respecting children’s rights, especially the right to education for the children in the target
group, those at risk of dropping out of school, coming from socioeconomically disadvantaged areas.
Through its interventions, SAI did not set out to approach the gender perspective specifically in
education or support services. The premise assumed was that, at the level of the Romanian education
system, no gender discrepancies were identified that could visibly distort the achievement of SAI
47 Cf. UNICEF’s educational policy document “Strategies to Improve School Attendance. Inclusive Education Targeting the Most Vulnerable Communities in Romania”, page 4.

Page 198 of 198
objectives and expected outcomes. On the other hand, through its set objectives, SAI did not aim to
carry out gender studies.