Embed Size (px)
Citation preview
AP Bio Exam Review
Ecology Unit
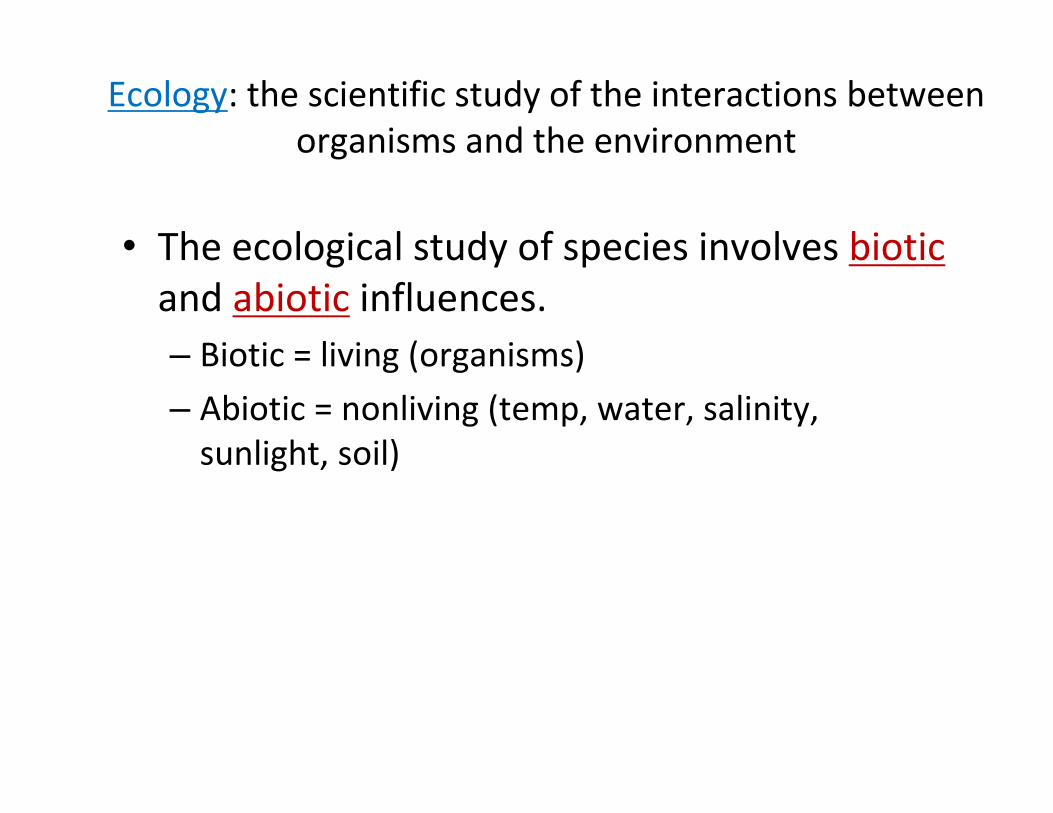
Ecology: the scientific study of the interactions between
organisms and the environment
• The ecological study of species involves biotic
and abiotic influences.
– Biotic = living (organisms)
– Abiotic = nonliving (temp, water, salinity,
sunlight, soil)
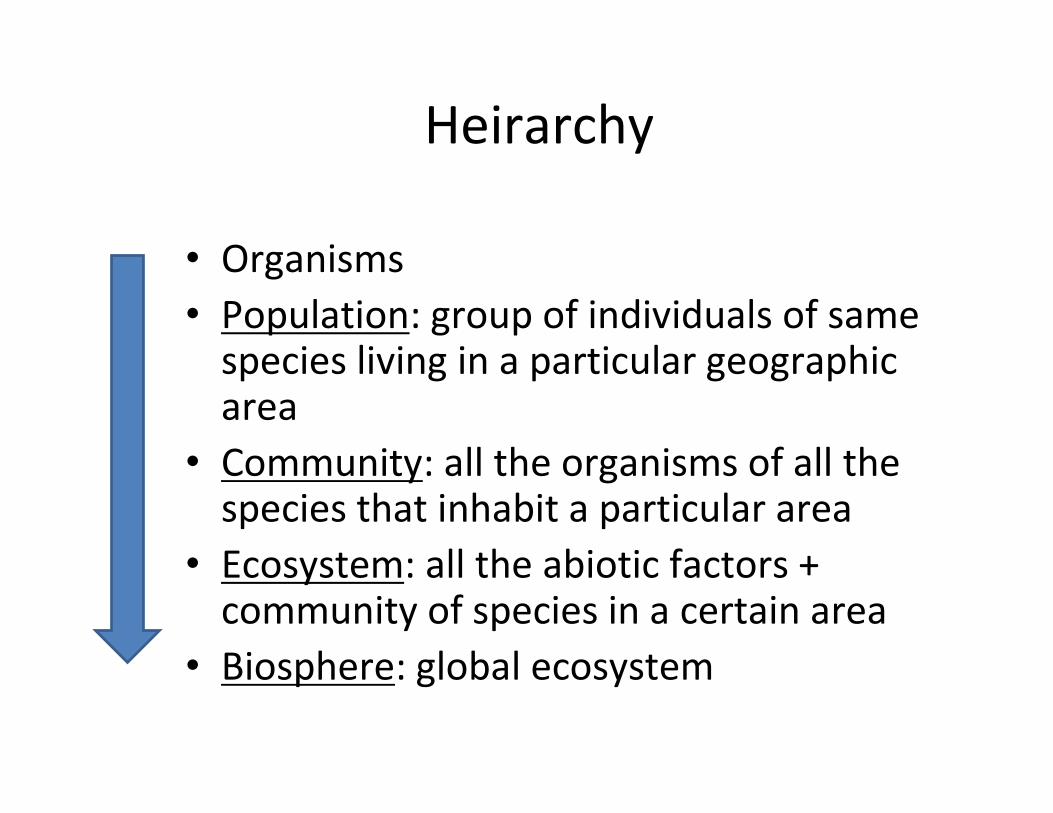
Heirarchy
• Organisms
• Population: group of individuals of same species living in a particular geographic area
• Community: all the organisms of all the species that inhabit a particular area
• Ecosystem: all the abiotic factors + community of species in a certain area
• Biosphere: global ecosystem
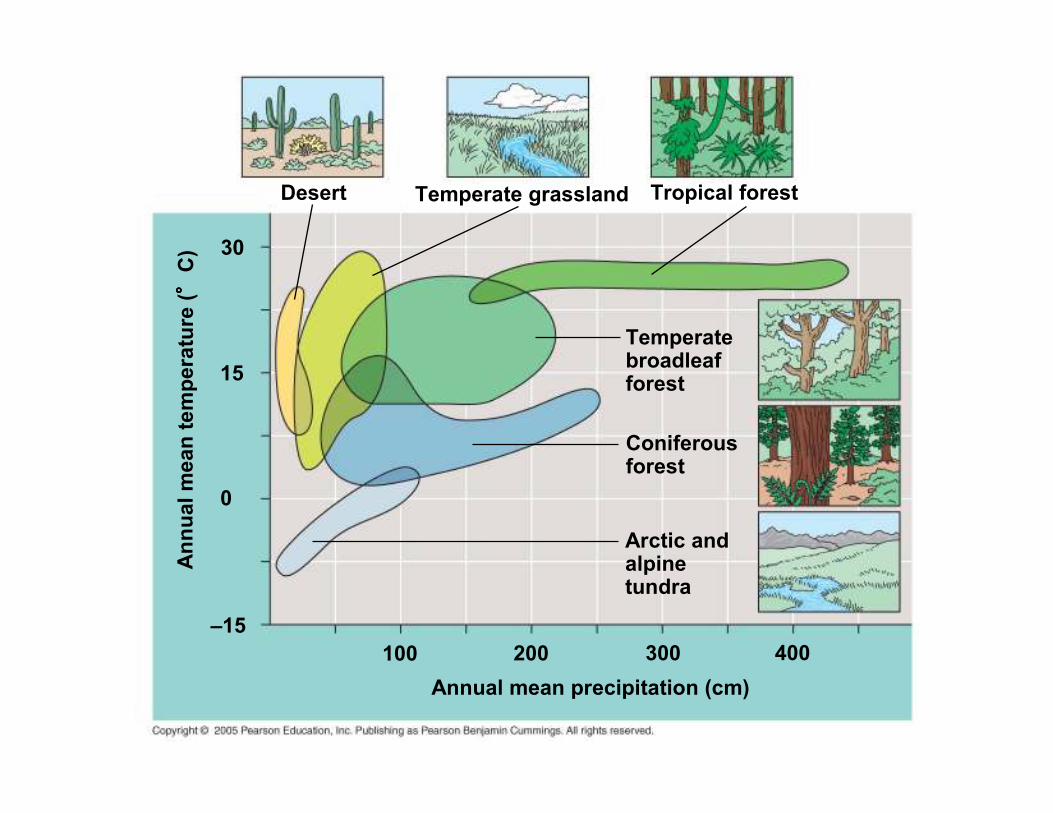
Temperate grassland Tropical forestDesert
Temperatebroadleafforest
Coniferousforest
Arctic andalpinetundra
Annual mean precipitation (cm)
Annual mean temperat ure (°° °°C)
400300200100
30
15
0
–15
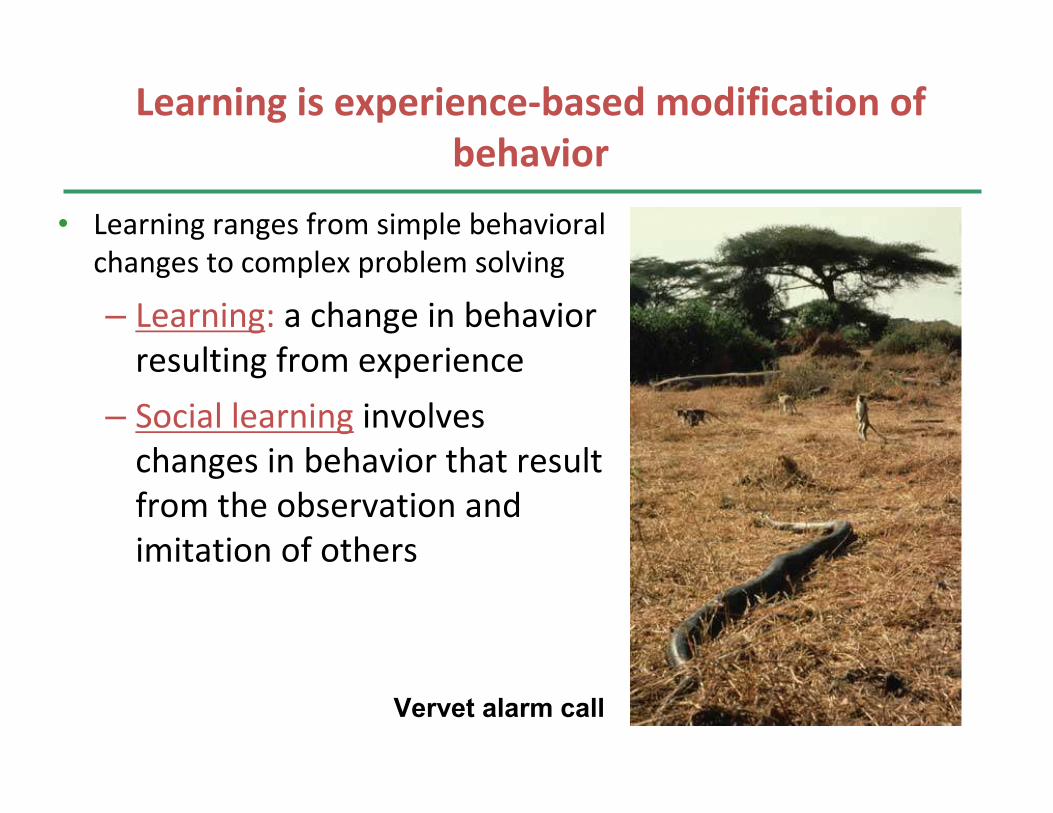
Learning is experience-based modification of
behavior
• Learning ranges from simple behavioral
changes to complex problem solving
– Learning: a change in behavior
resulting from experience
– Social learning involves
changes in behavior that result
from the observation and
imitation of others
Vervet alarm call
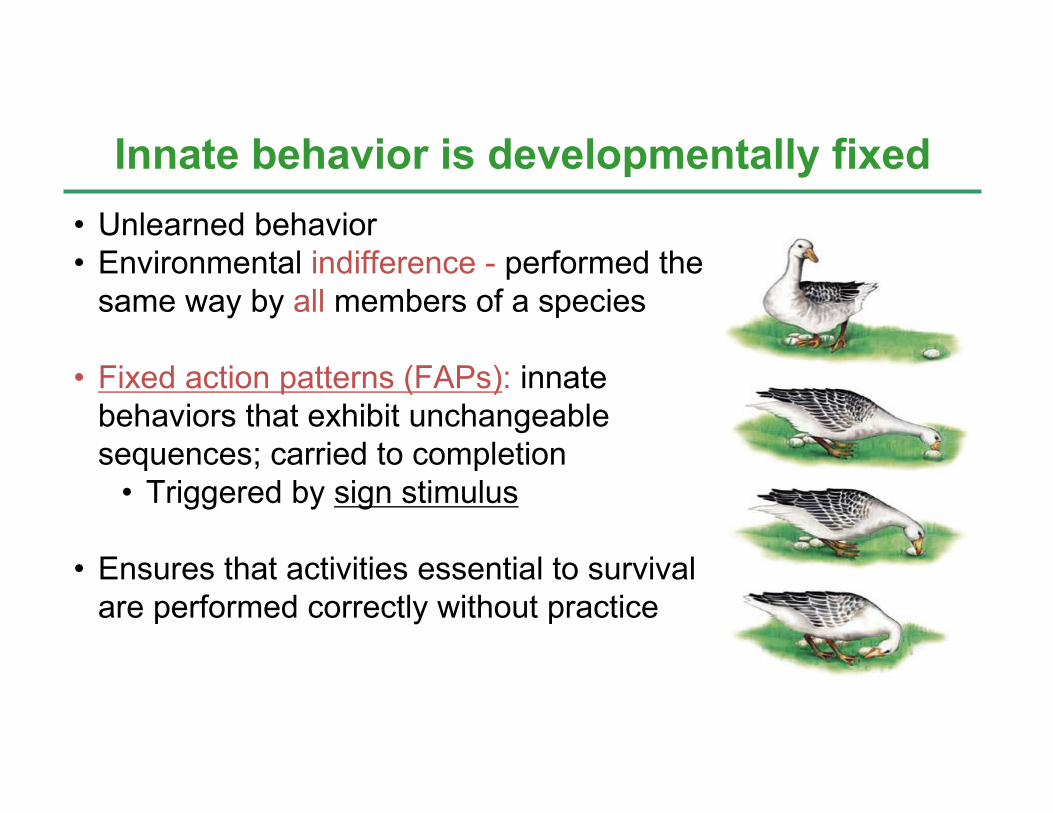
Innate behavior is developmentally fixed
• Unlearned behavior
• Environmental indifference - performed the
same way by all members of a species
• Fixed action patterns (FAPs): innate
behaviors that exhibit unchangeable
sequences; carried to completion
• Triggered by sign stimulus
• Ensures that activities essential to survival
are performed correctly without practice
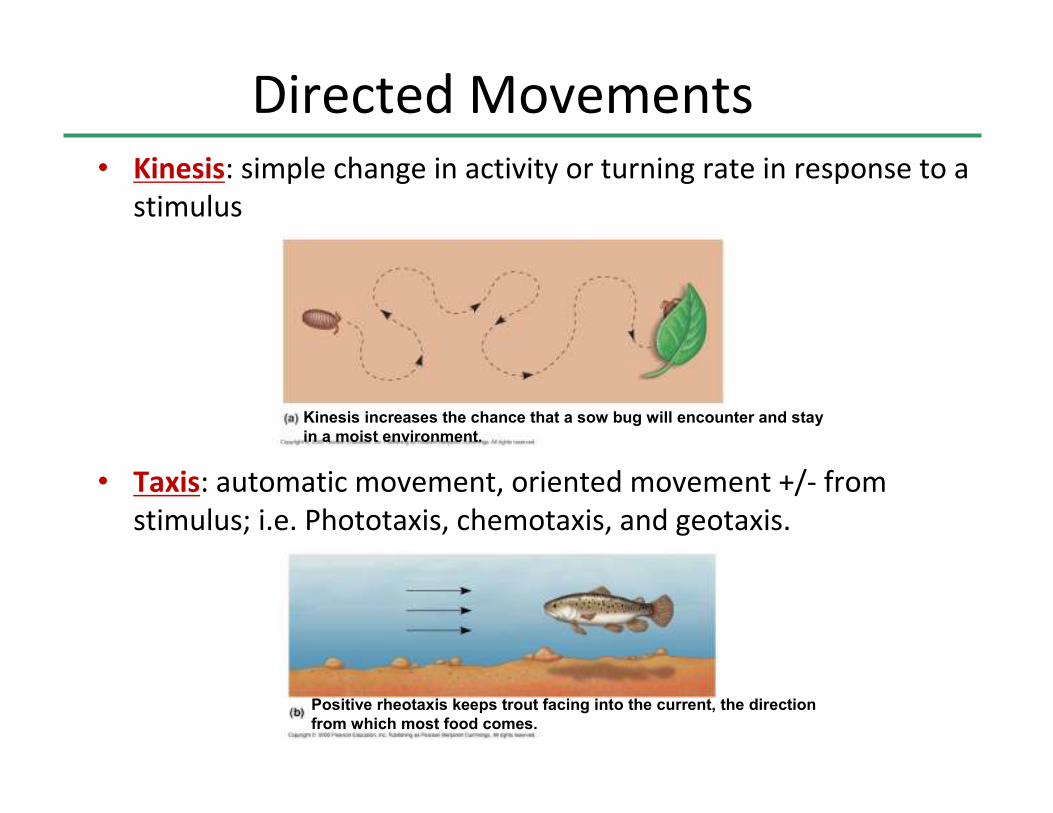
• Kinesis: simple change in activity or turning rate in response to a
stimulus
• Taxis: automatic movement, oriented movement +/- from
stimulus; i.e. Phototaxis, chemotaxis, and geotaxis.
Directed Movements
Kinesis increases the chance that a sow bug will encounter and stay
in a moist environment.
Positive rheotaxis keeps trout facing into the current, the direction
from which most food comes.
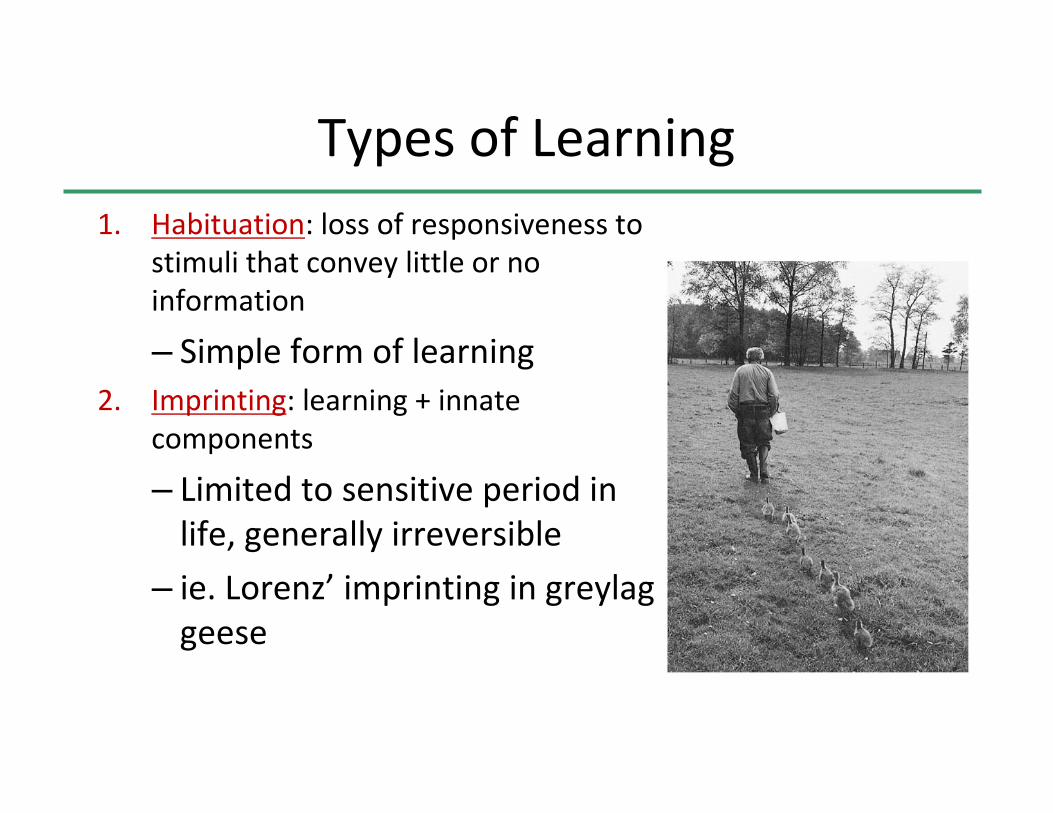
Types of Learning
1. Habituation: loss of responsiveness to
stimuli that convey little or no
information
– Simple form of learning
2. Imprinting: learning + innate
components
– Limited to sensitive period in
life, generally irreversible
– ie. Lorenz’ imprinting in greylag
geese
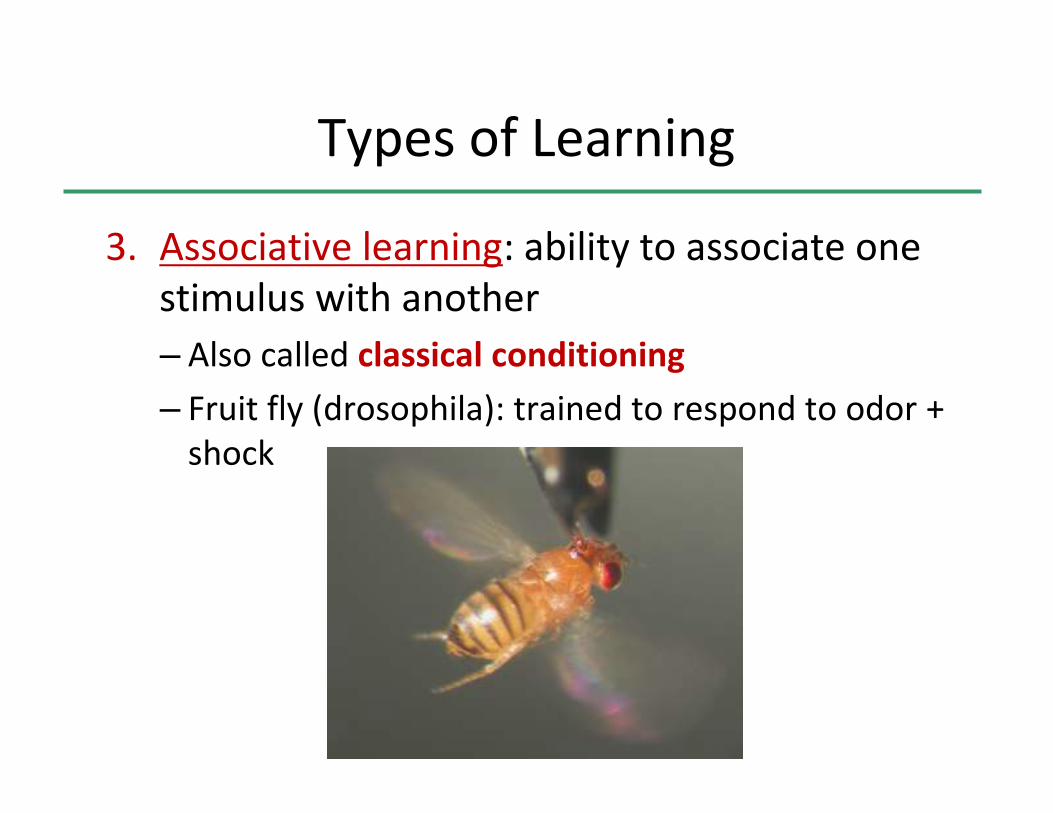
Types of Learning
3. Associative learning: ability to associate one
stimulus with another
– Also called classical conditioning
– Fruit fly (drosophila): trained to respond to odor +
shock
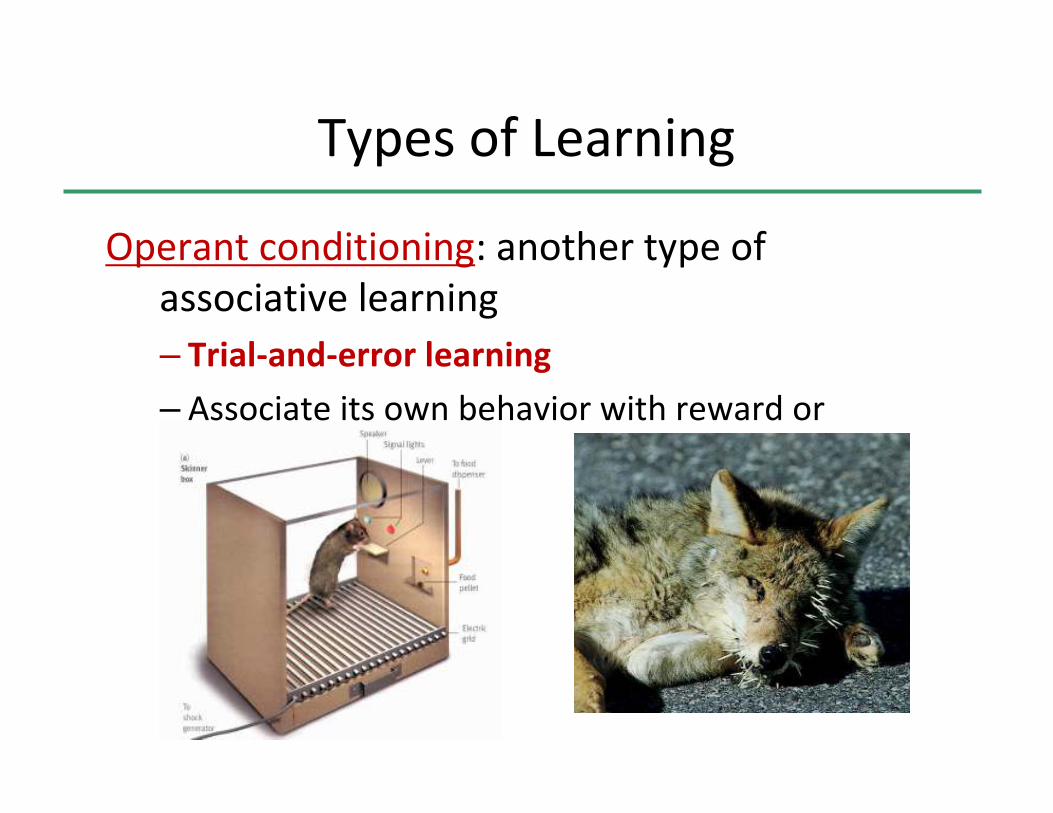
Types of Learning
Operant conditioning: another type of
associative learning
– Trial-and-error learning
– Associate its own behavior with reward or
punishment
Types of Learning
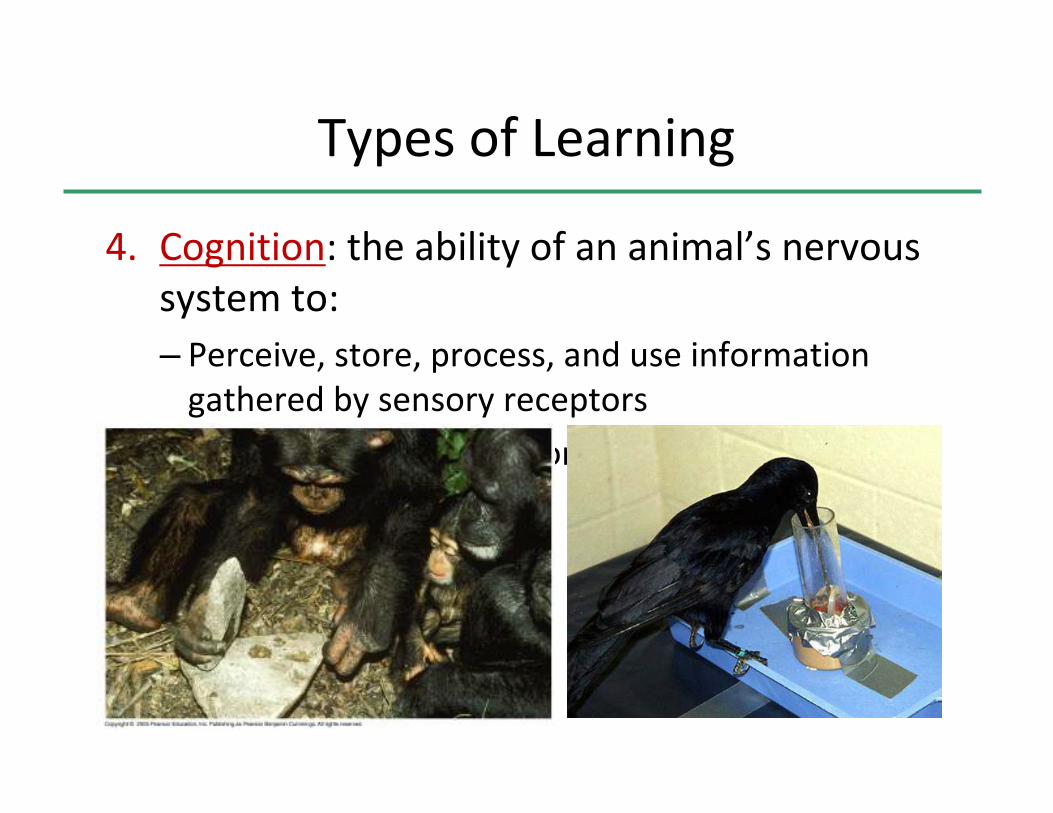
4. Cognition: the ability of an animal’s nervous
system to:
– Perceive, store, process, and use information
gathered by sensory receptors
– Problem-solving behavior relies on cognition
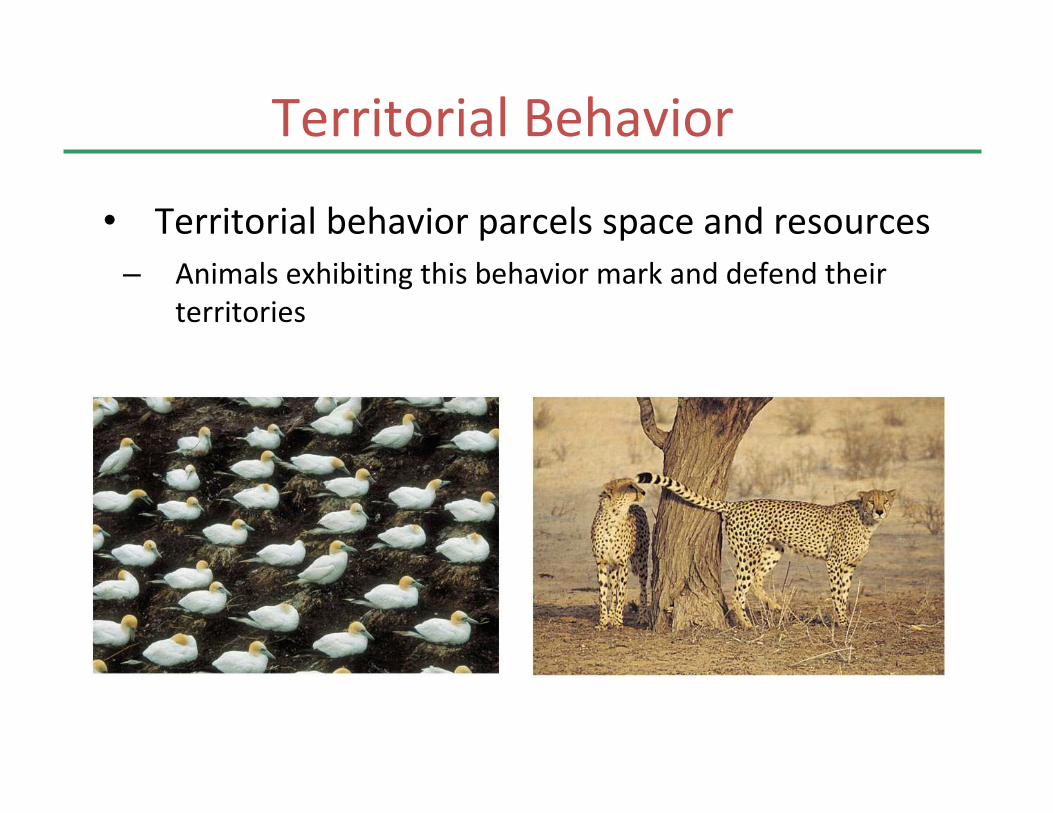
Territorial Behavior
• Territorial behavior parcels space and resources
– Animals exhibiting this behavior mark and defend their
territories
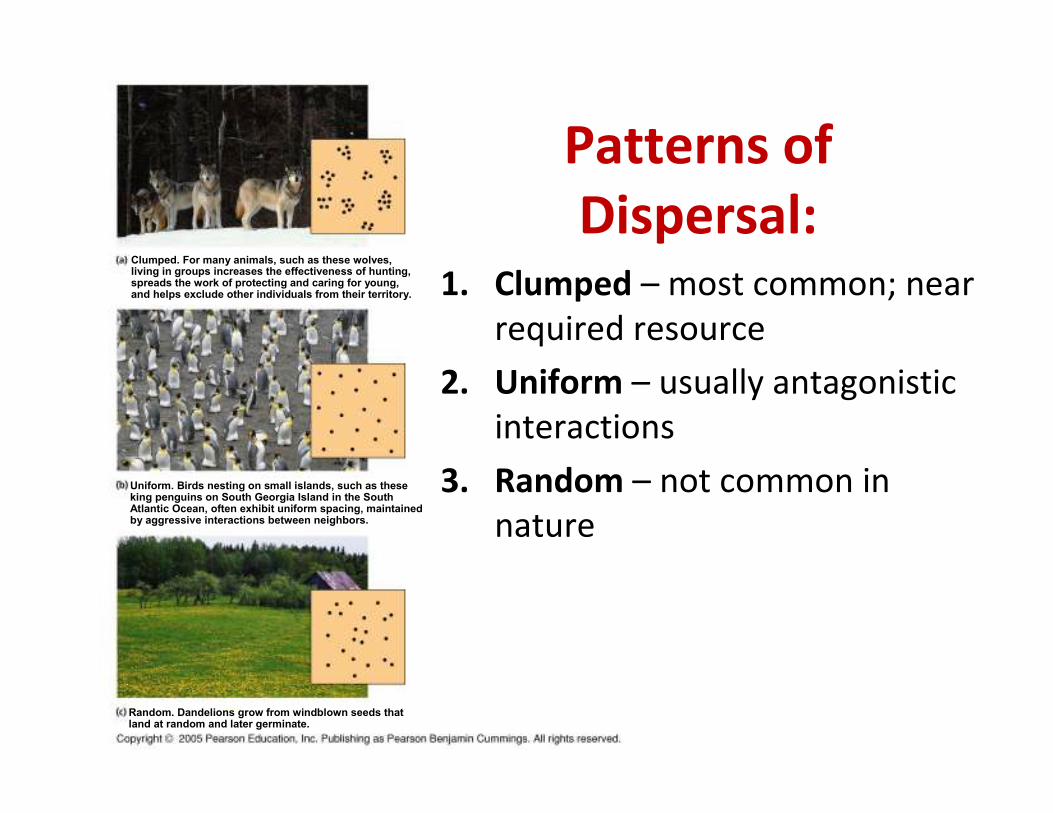
Clumped. For many animals, such as these wolves, living in groups increases the effectiveness of hunting, spreads the work of protecting and caring for young, and helps exclude other individuals from their territory.
Uniform. Birds nesting on small islands, such as these king penguins on South Georgia Island in the South Atlantic Ocean, often exhibit uniform spacing, maintained by aggressive interactions between neighbors.
Random. Dandelions grow from windblown seeds that land at random and later germinate.
Patterns of
Dispersal:1. Clumped – most common; near
required resource
2. Uniform – usually antagonistic
interactions
3. Random – not common in
nature
• Additions occur through birth, and subtractions occur
through death.
• A life table is an age-specific summary of the survival
pattern of a population.
• A graphical way of representing the data is a
survivorship curve.
– This is a plot of the number of individuals in a cohort
still alive at each age.
Demography: the study of vital statistics that
affect population size
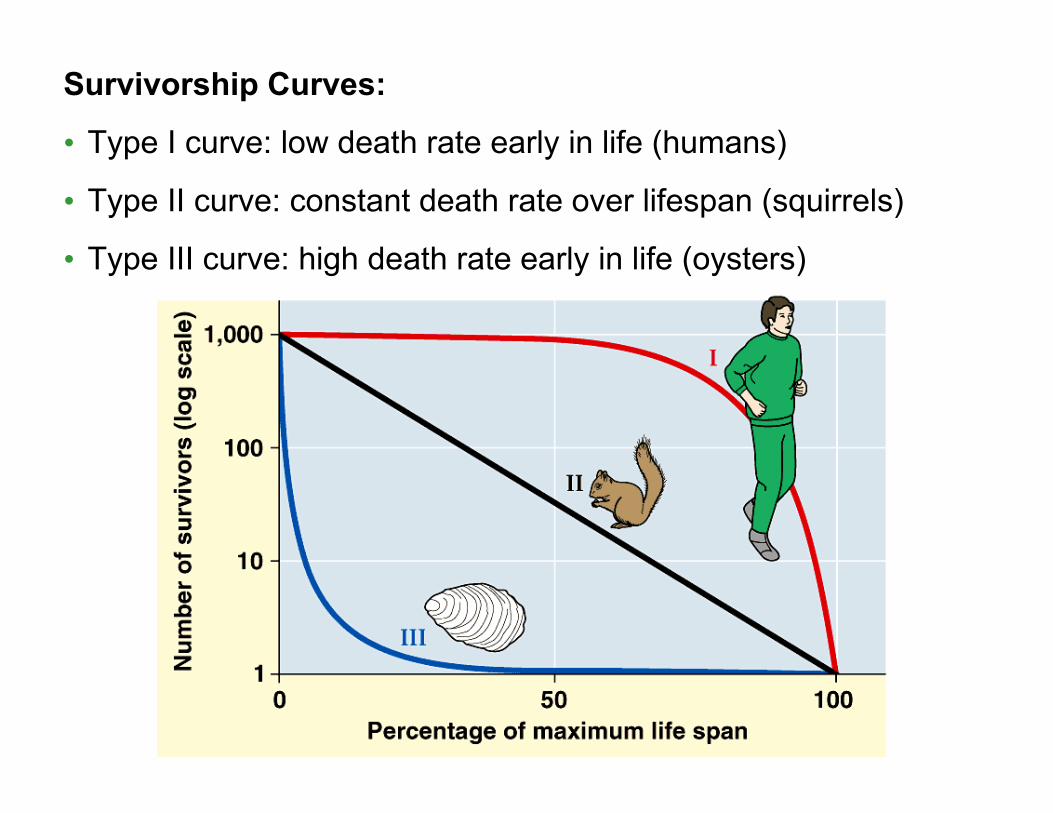
Survivorship Curves:
• Type I curve: low death rate early in life (humans)
• Type II curve: constant death rate over lifespan (squirrels)
• Type III curve: high death rate early in life (oysters)
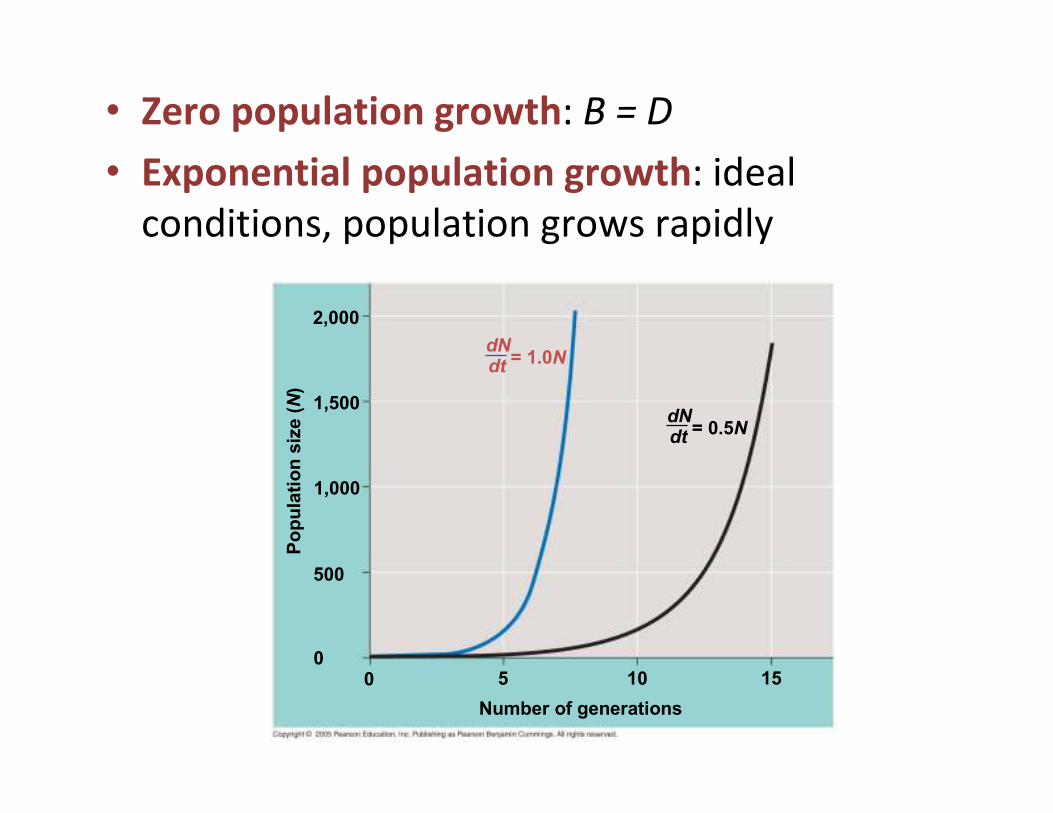
• Zero population growth: B = D
• Exponential population growth: ideal
conditions, population grows rapidly
Number of generations
Population size (N)
2,000
= 1.0N
1,000
1,500
500
0151050
dN
dt
= 0.5NdN
dt
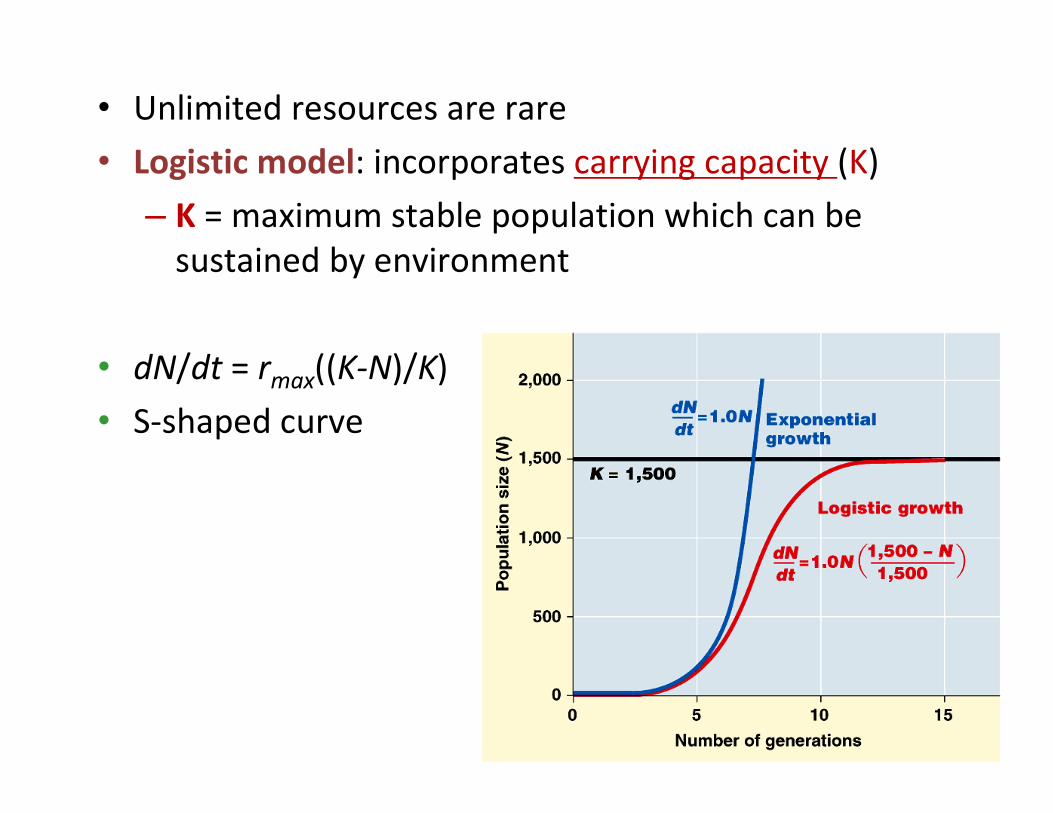
• Unlimited resources are rare
• Logistic model: incorporates carrying capacity (K)
– K = maximum stable population which can be
sustained by environment
• dN/dt = rmax
((K-N)/K)
• S-shaped curve
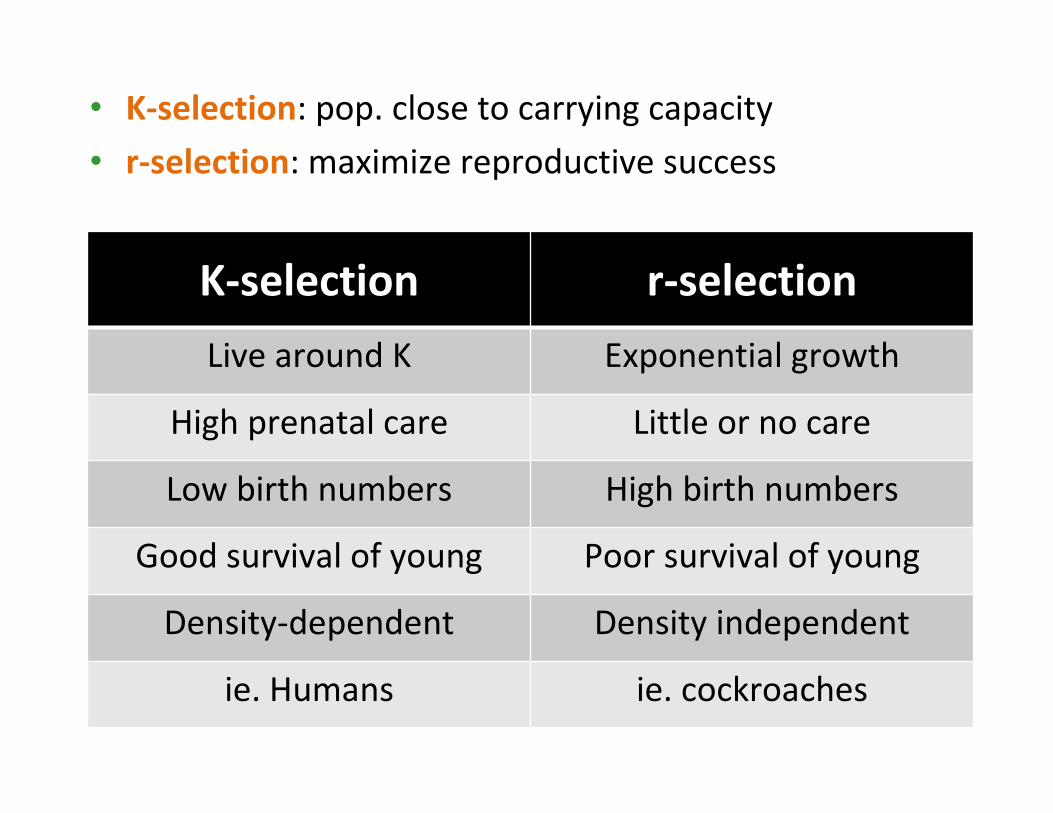
• K-selection: pop. close to carrying capacity
• r-selection: maximize reproductive success
K-selection r-selection
Live around K Exponential growth
High prenatal care Little or no care
Low birth numbers High birth numbers
Good survival of young Poor survival of young
Density-dependent Density independent
ie. Humans ie. cockroaches
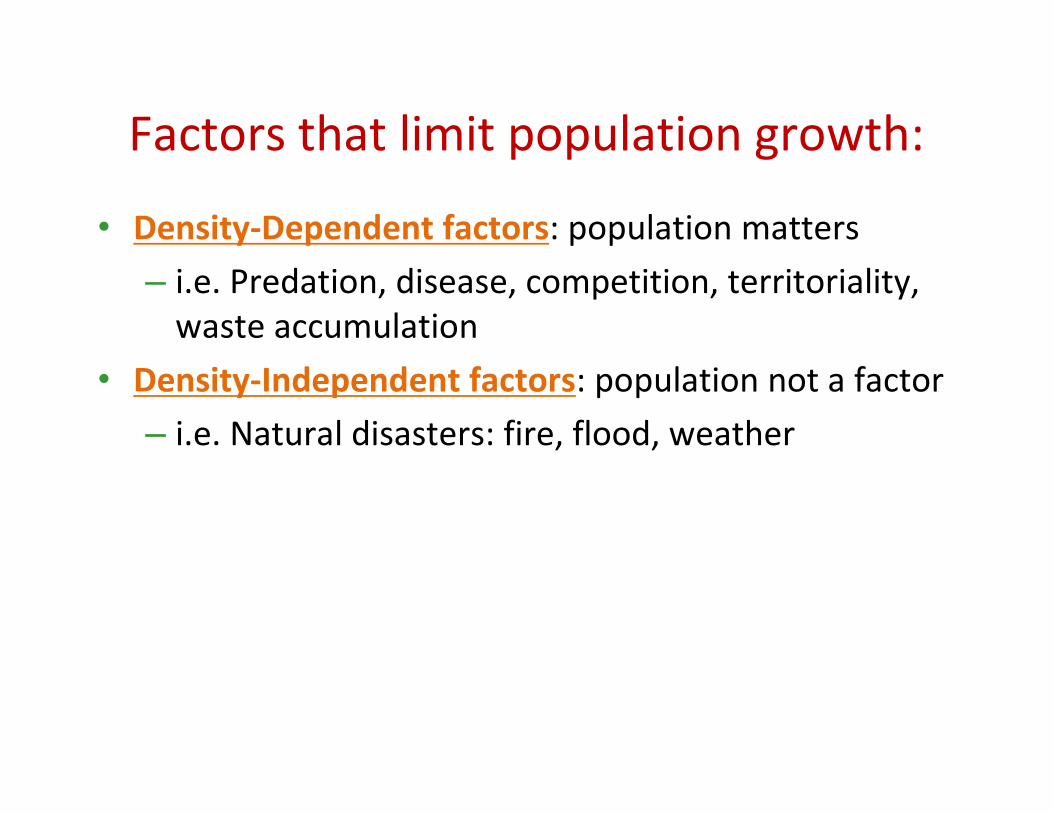
Factors that limit population growth:
• Density-Dependent factors: population matters
– i.e. Predation, disease, competition, territoriality,
waste accumulation
• Density-Independent factors: population not a factor
– i.e. Natural disasters: fire, flood, weather
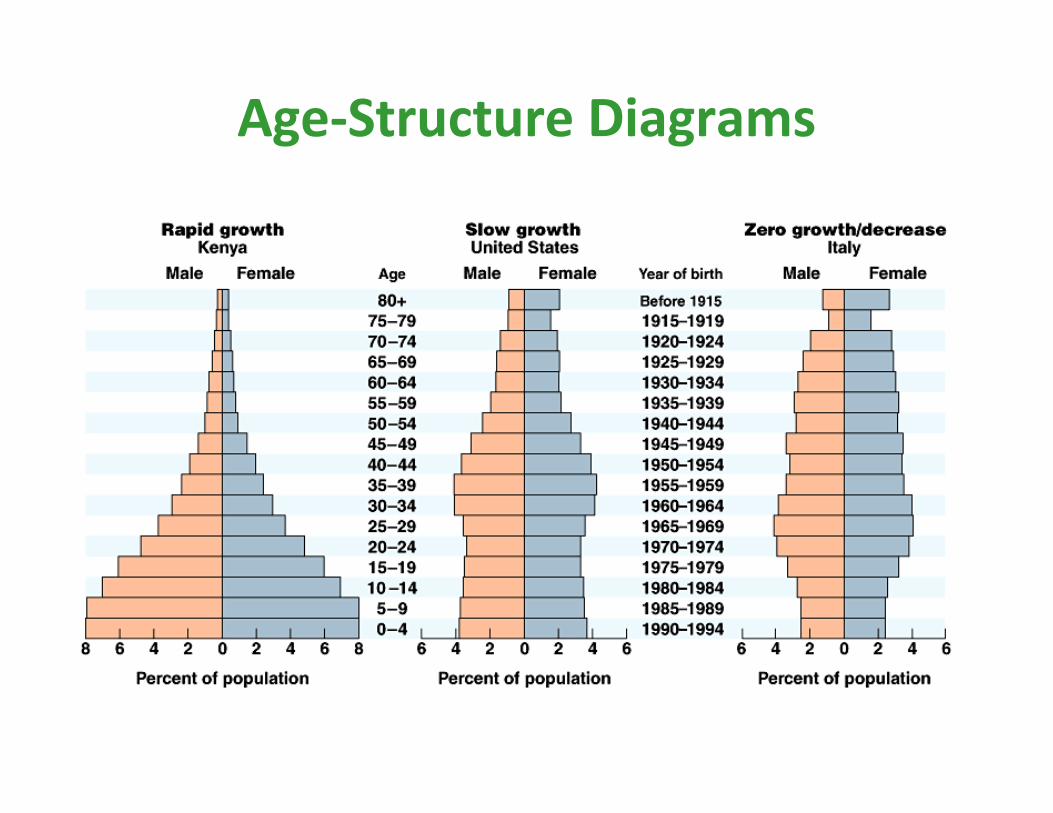
Age-Structure Diagrams
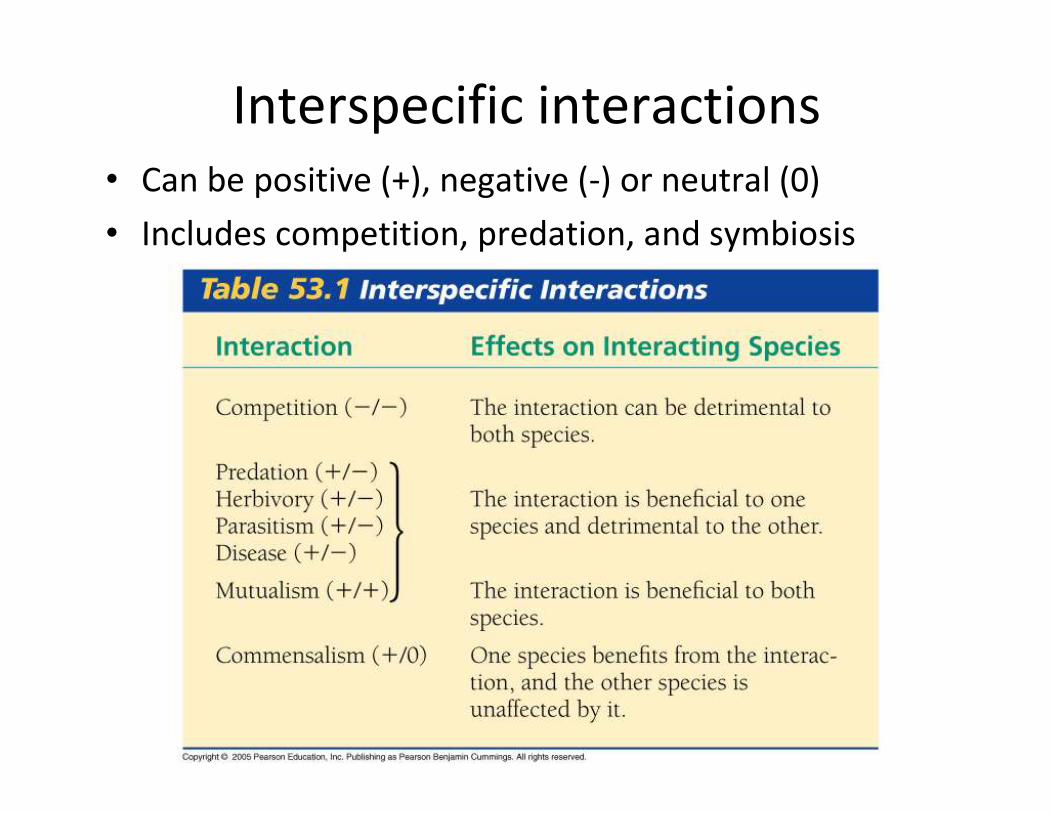
Interspecific interactions
• Can be positive (+), negative (-) or neutral (0)
• Includes competition, predation, and symbiosis
• Interspecific competition for resources can
occur when resources are in short supply
• Species interaction is -/-
• Competitive exclusion principle: Two species
which cannot coexist in a community if their
niches are identical.
– The one with the slight reproductive advantage will
eliminate the other
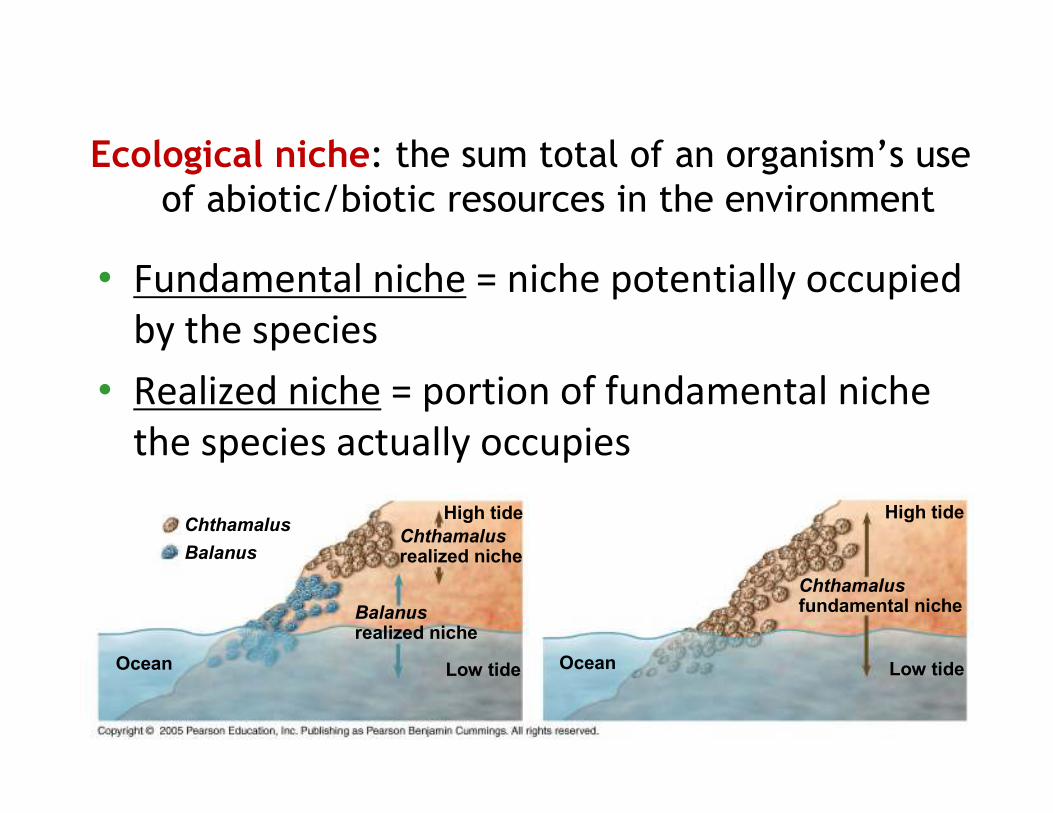
Ecological niche: the sum total of an organism’s use
of abiotic/biotic resources in the environment
• Fundamental niche = niche potentially occupied
by the species
• Realized niche = portion of fundamental niche
the species actually occupies
Chthamalus
fundamental niche
High tide
Low tideOcean
Chthamalus
realized niche
High tide
Low tideOcean
Balanus
realized niche
Chthamalus
Balanus
Predation (+/-)
Defensive adaptations include:
– Cryptic coloration – camouflaged by coloring
– Aposematic or warning coloration – bright color of
poisonous animals
– Batesian mimicry – harmless species mimic color
of harmful species
– Mullerian mimicry – 2 bad-tasting species
resemble each other; both to be avoided
– Herbivory – plants avoid this by chemical toxins,
spines, & thorns
Community Structure
Species diversity = species richness (the
number of different species they contain), and
the relative abundance of each species.
• Dominant species: has the highest biomass or
is the most abundant in the community
• Keystone species: exert control on community
structure by their important ecological niches
– Ex: loss of sea otter � increase sea urchins,
destruction of kelp forests
Disturbances influences species diversity and
composition
• A disturbance changes a community by
removing organisms or changing resource
availability (fire, drought, flood, storm, human
activity)
• Ecological succession: transitions in species
composition in a certain area over ecological
time
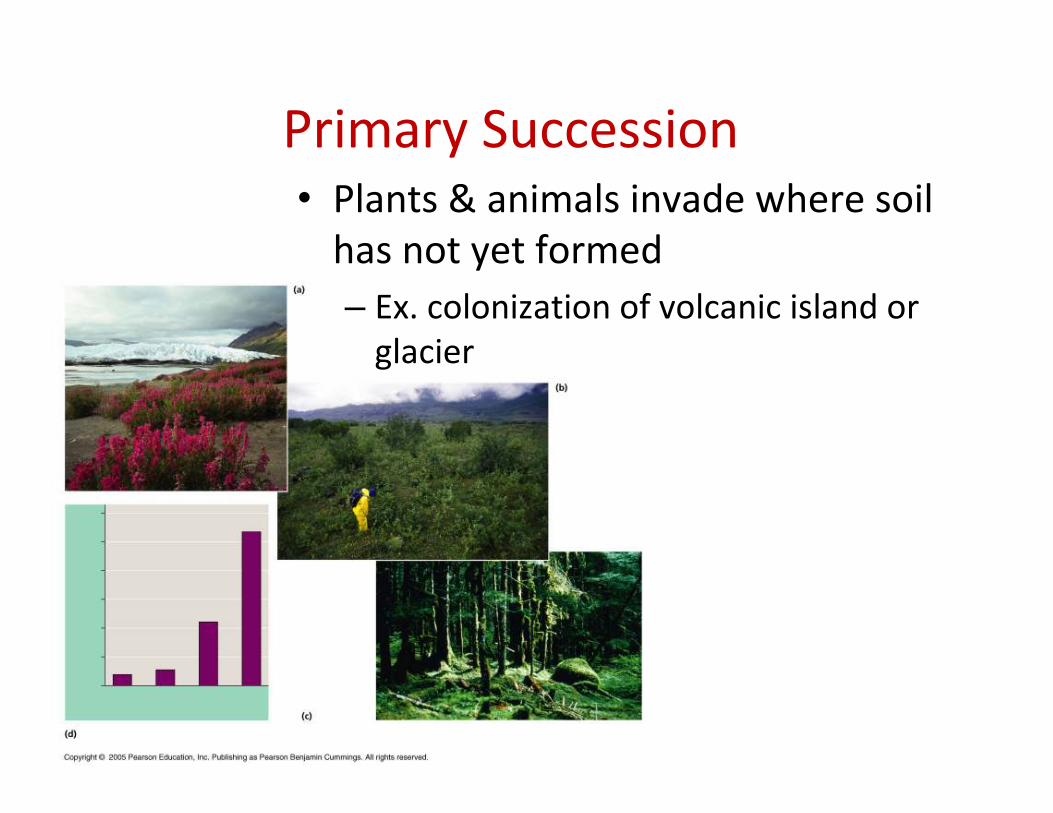
Primary Succession• Plants & animals invade where soil
has not yet formed
– Ex. colonization of volcanic island or
glacier
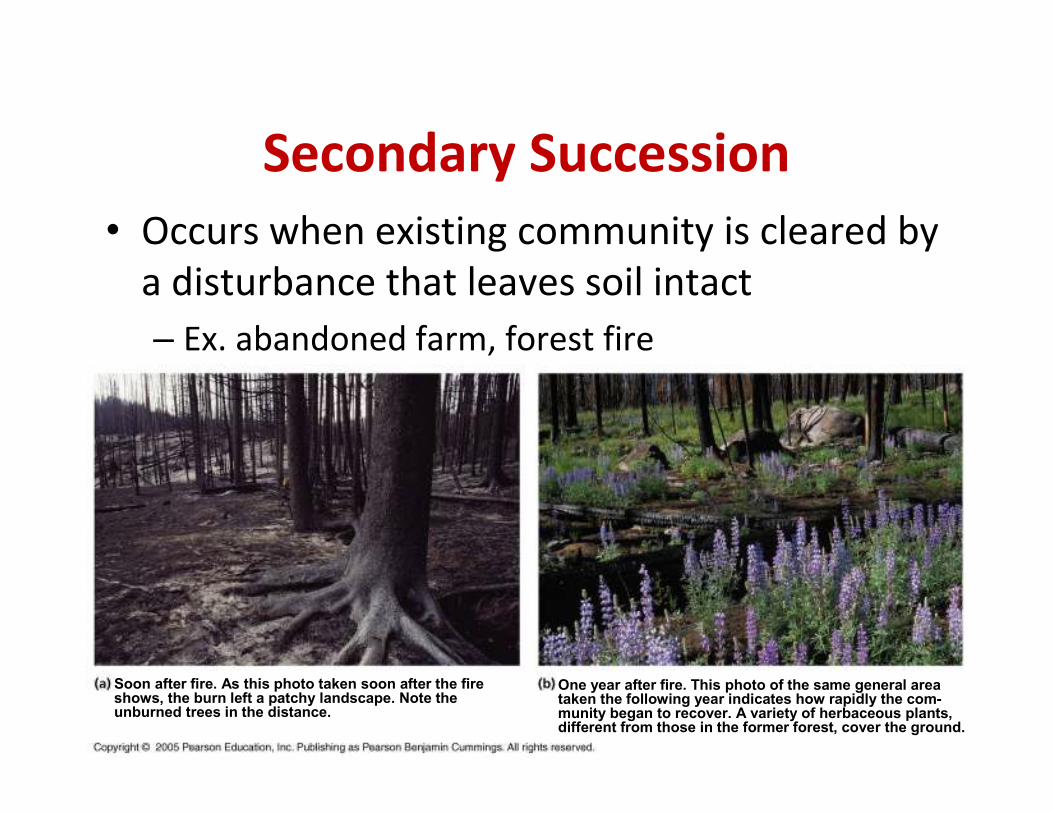
Secondary Succession
• Occurs when existing community is cleared by
a disturbance that leaves soil intact
– Ex. abandoned farm, forest fire
Soon after fire. As this photo taken soon after the fire shows, the burn left a patchy landscape. Note the unburned trees in the distance.
One year after fire. This photo of the same general area taken the following year indicates how rapidly the com-munity began to recover. A variety of herbaceous plants, different from those in the former forest, cover the ground.
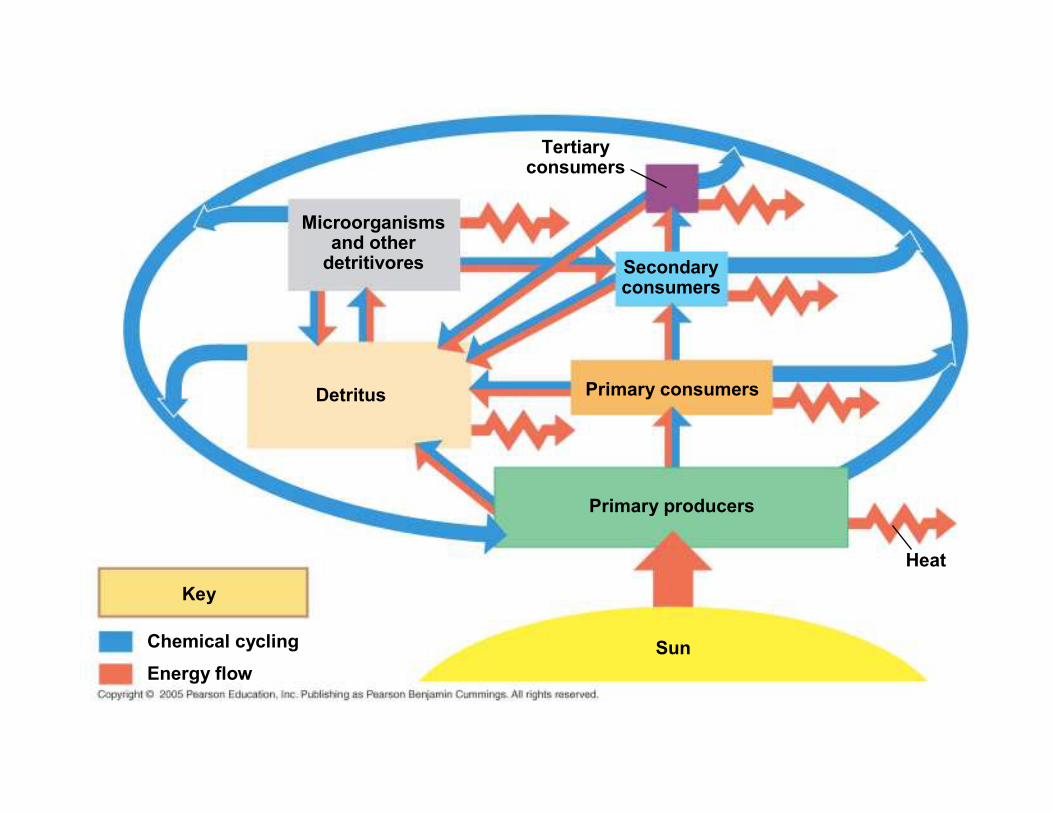
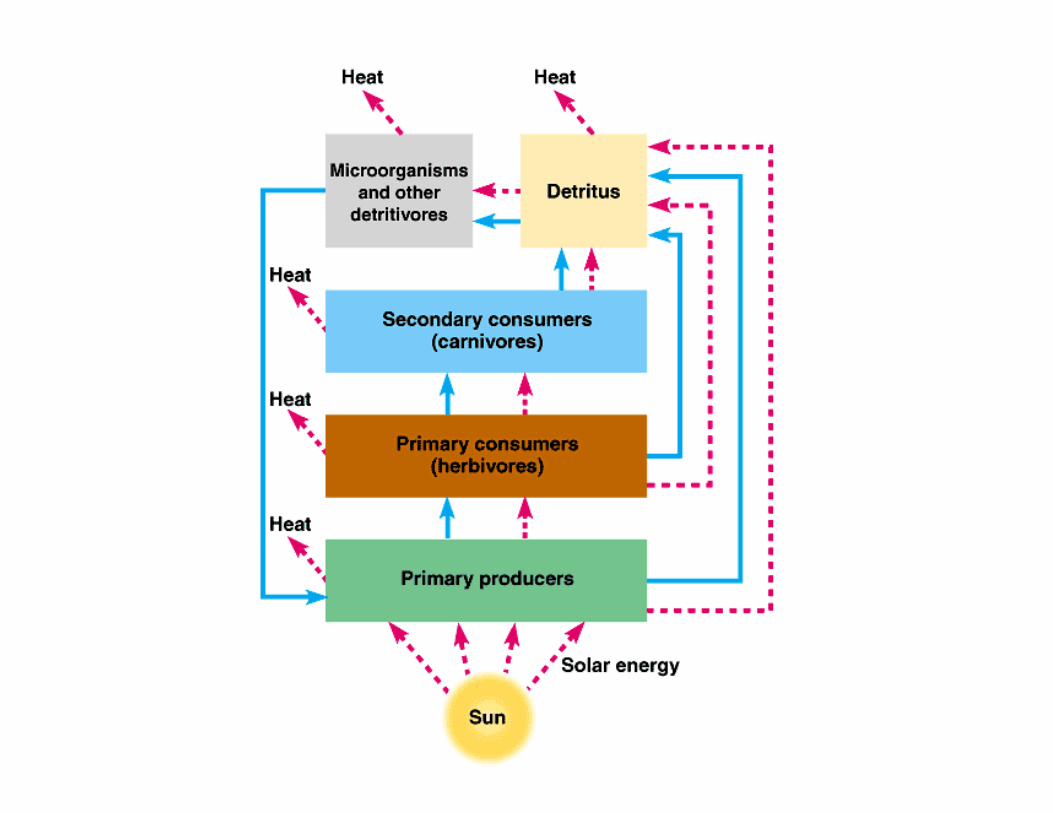
Ecosystems
Ecosystem = sum of all the organisms living
within its boundaries (biotic community) +
abiotic factors with which they interact
Involves two unique processes:
1. Energy flow
2. Chemical cycling
Microorganismsand otherdetritivores
Tertiaryconsumers
Secondaryconsumers
Detritus Primary consumers
Sun
Primary producers
Heat
Key
Chemical cycling
Energy flow
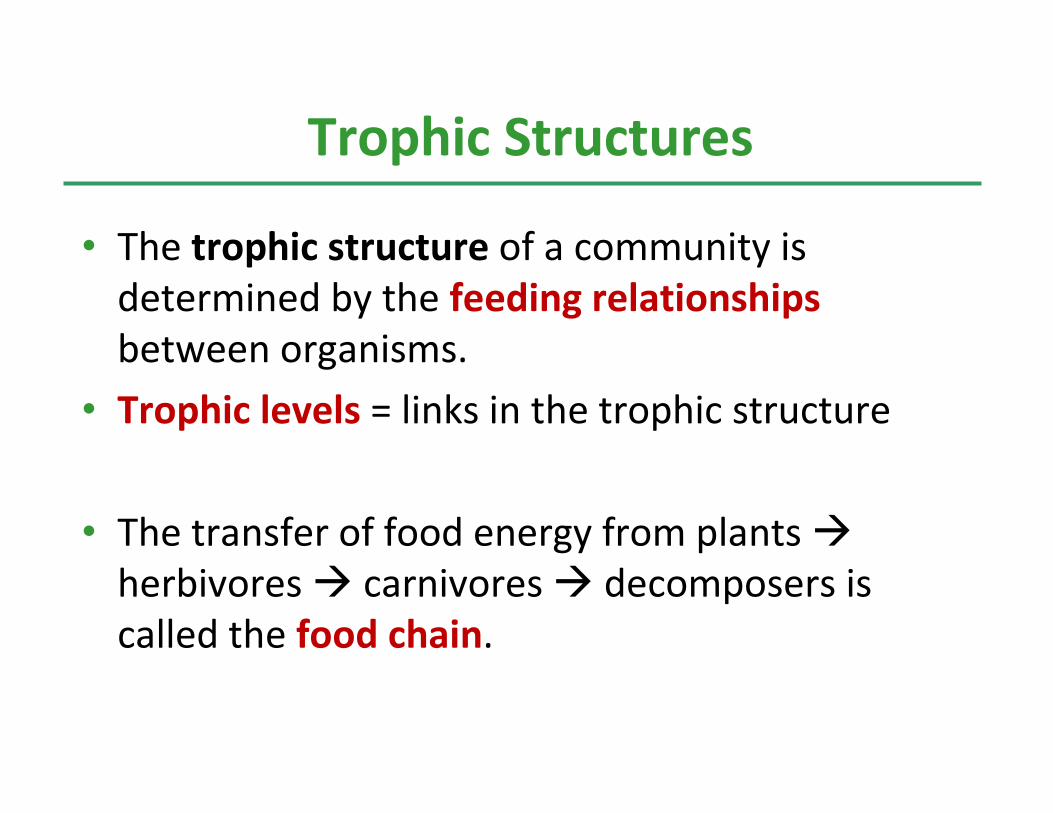
Trophic Structures
• The trophic structure of a community is
determined by the feeding relationships
between organisms.
• Trophic levels = links in the trophic structure
• The transfer of food energy from plants �
herbivores � carnivores � decomposers is
called the food chain.
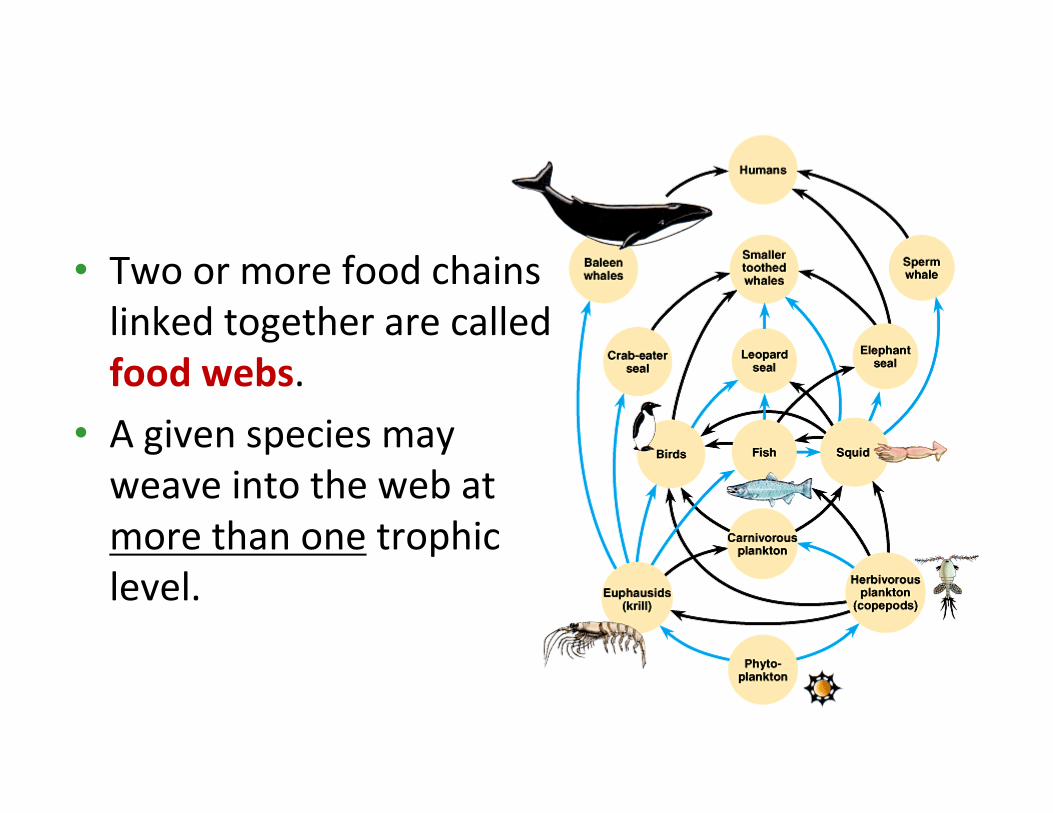
• Two or more food chains
linked together are called
food webs.
• A given species may
weave into the web at
more than one trophic
level.
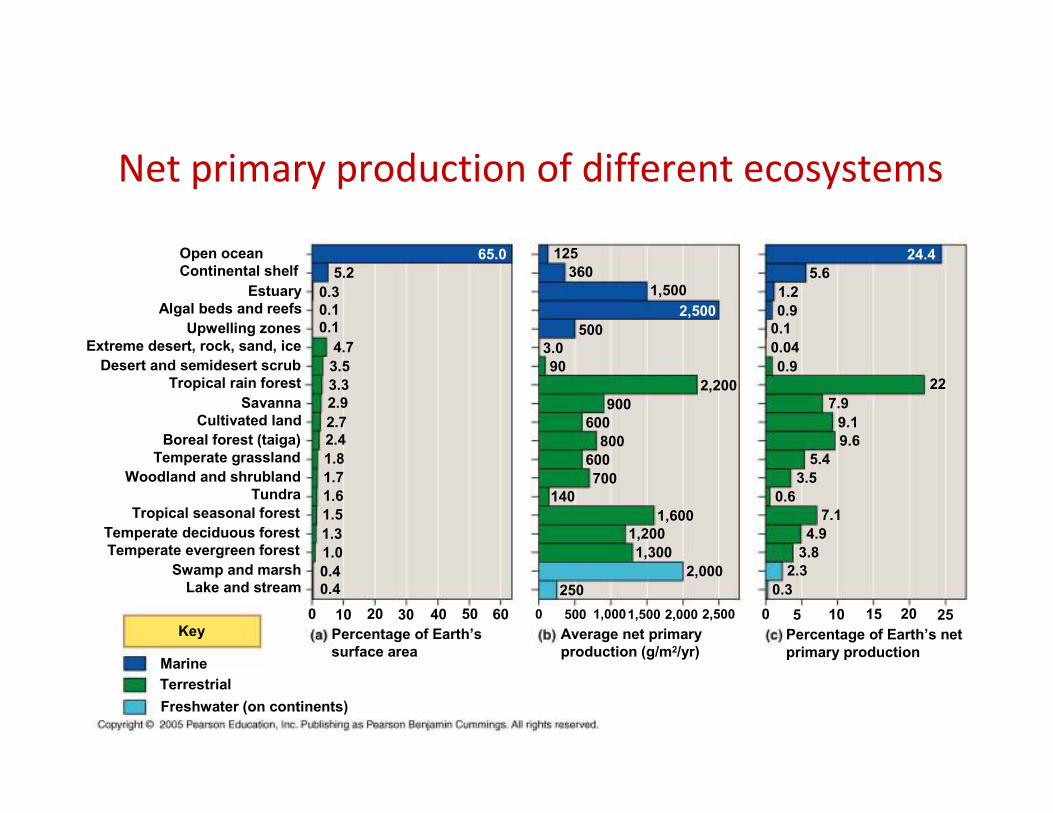
Primary Production
• Total primary production is known as gross
primary production (GPP).
– This is the amount of light energy that is
converted into chemical energy.
• The net primary production (NPP) is equal to
gross primary production minus the energy used
by the primary producers for respiration (R):
– NPP = GPP – R
• NPP = storage of chemical energy available to
consumers in an ecosystem
Open ocean
Continental shelf
Upwelling zones
Extreme desert, rock, sand, ice
Swamp and marsh
Lake and stream
Desert and semidesert scrub
Tropical rain forest
Temperate deciduous forest
Temperate evergreen forest
Tropical seasonal forest
Savanna
Cultivated land
Estuary
Algal beds and reefs
Boreal forest (taiga)
Temperate grassland
Woodland and shrubland
Tundra
0.4
0.4
1.0
1.3
1.5
1.6
1.7
1.8
2.4
2.7
2.9
3.3
3.5
4.7
0.3
0.1
0.1
5.2
65.0
Freshwater (on continents)
Terrestrial
Marine
Key Percentage of Earth’s
surface area
Average net primary
production (g/m2/yr)
6050403020100 2,5002,0001,5001,0005000
Percentage of Earth’s net
primary production
2520151050
125
2,500
360
1,500
500
3.0
90
900
600
800
2,200
600
250
1,600
1,200
1,300
2,000
700
140
0.3
7.9
9.1
9.6
5.4
3.5
0.6
7.1
4.9
3.8
2.3
24.4
5.6
1.2
0.9
0.1
0.04
0.9
22
Net primary production of different ecosystems
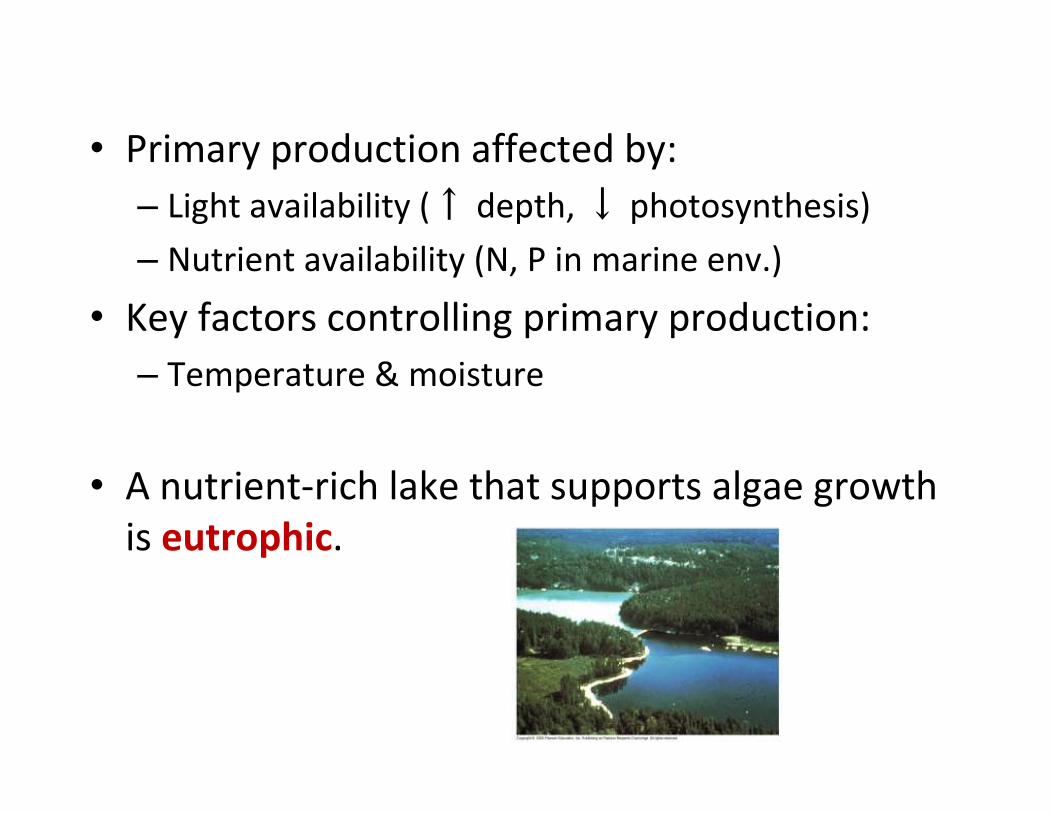
• Primary production affected by:
– Light availability (↑ depth, ↓ photosynthesis)
– Nutrient availability (N, P in marine env.)
• Key factors controlling primary production:
– Temperature & moisture
• A nutrient-rich lake that supports algae growth
is eutrophic.
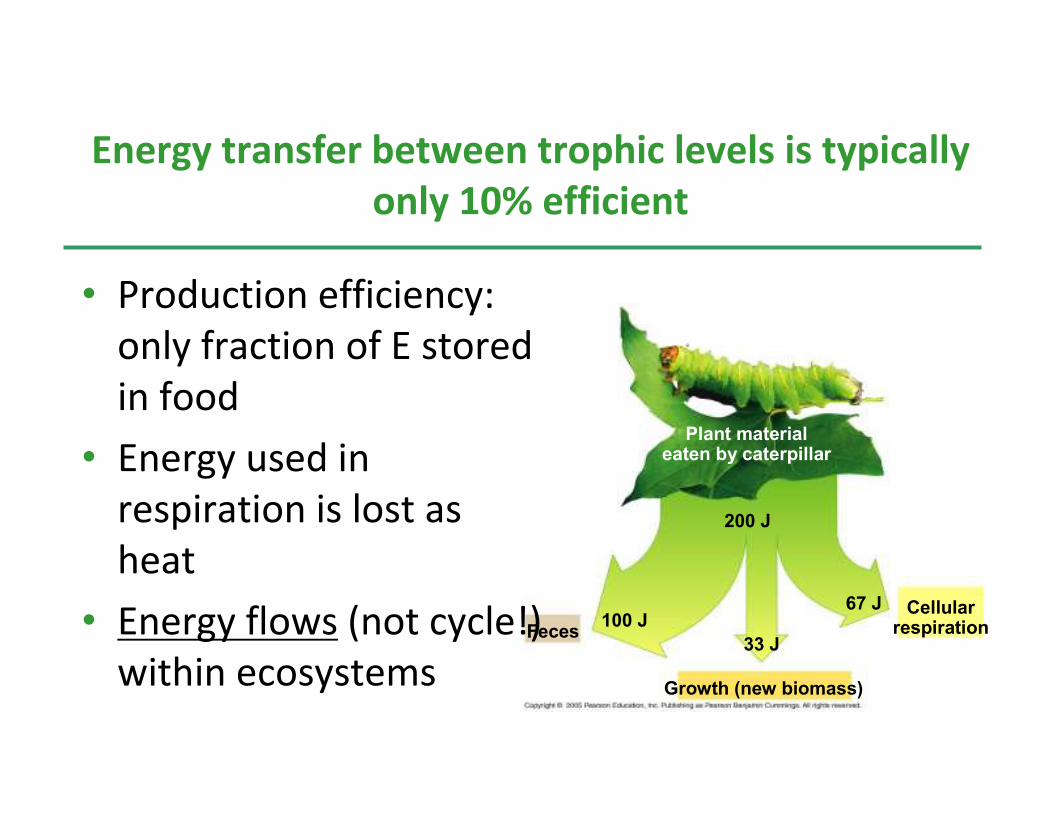
Energy transfer between trophic levels is typically
only 10% efficient
Growth (new biomass)
CellularrespirationFeces
100 J
33 J
67 J
200 J
Plant materialeaten by caterpillar
• Production efficiency:
only fraction of E stored
in food
• Energy used in
respiration is lost as
heat
• Energy flows (not cycle!)
within ecosystems
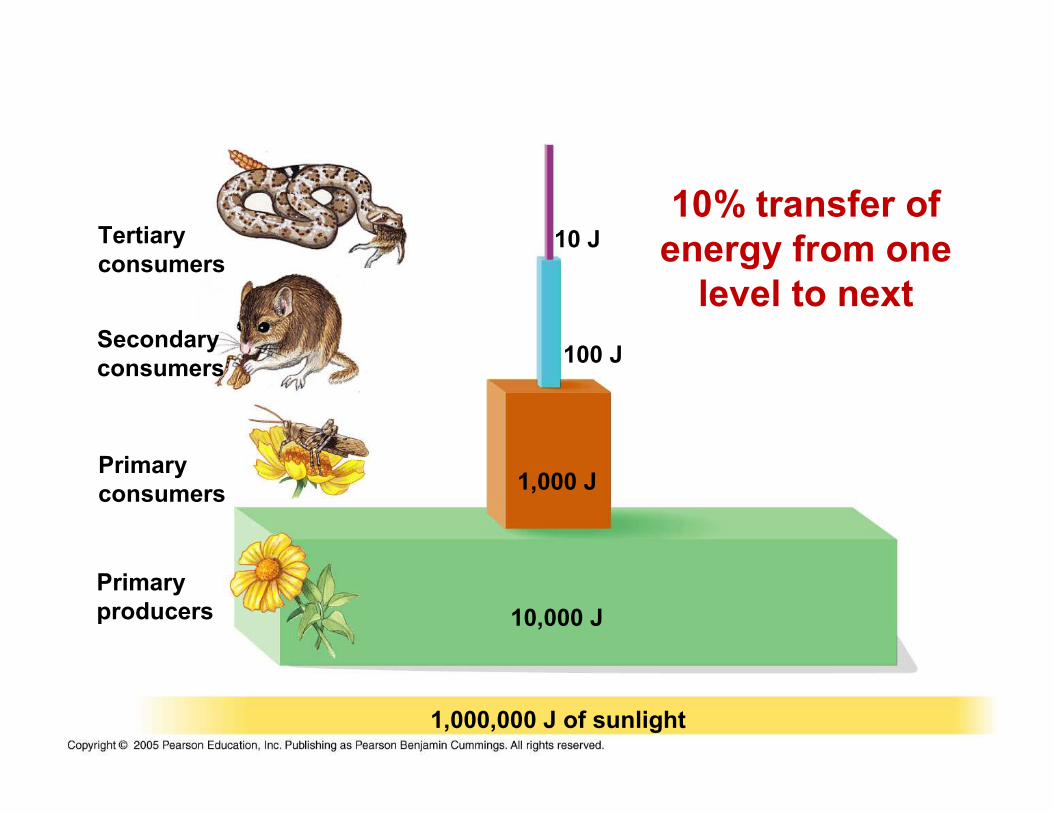
1,000,000 J of sunlight
10,000 J
1,000 J
100 J
10 JTertiary
consumers
Secondary
consumers
Primary
consumers
Primary
producers
10% transfer of
energy from one
level to next
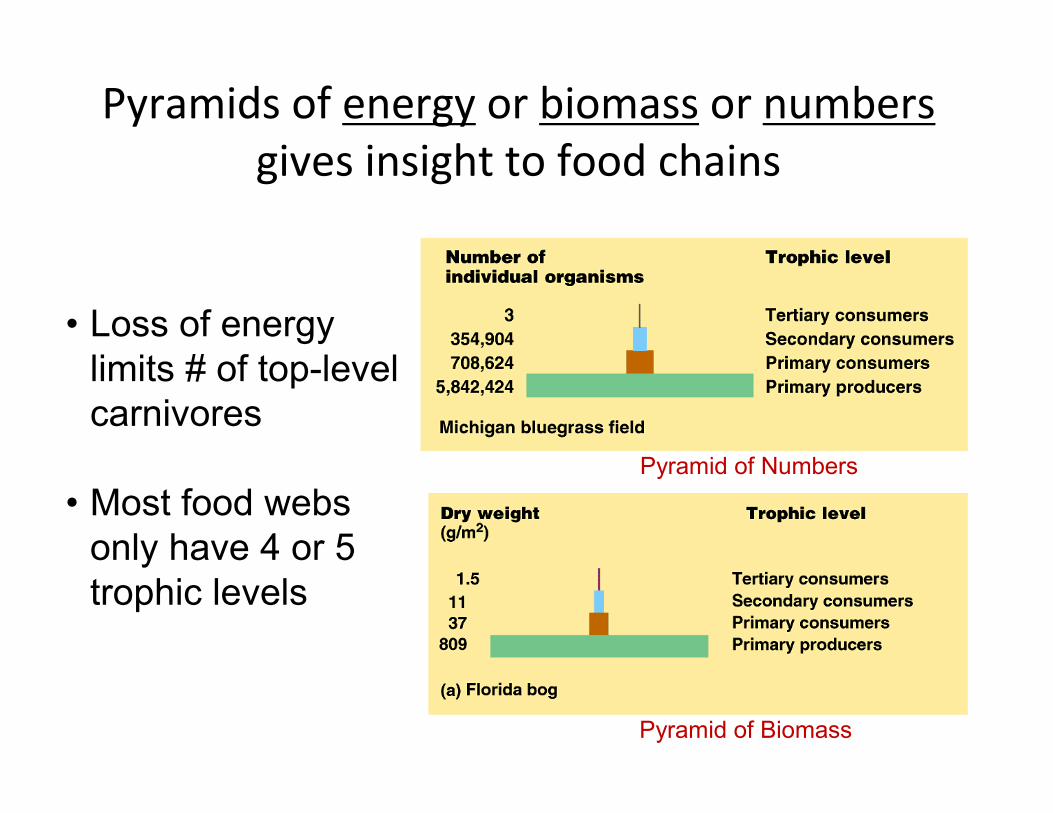
Pyramids of energy or biomass or numbers
gives insight to food chains
Pyramid of Numbers
Pyramid of Biomass
• Loss of energy
limits # of top-level
carnivores
• Most food webs
only have 4 or 5
trophic levels
Matter Cycles in Ecosystem
• Biogeochemical cycles: nutrient cycles that
contain both biotic and abiotic components
• organic � inorganic parts of an ecosystem
• Nutrient Cycles: water, carbon, nitrogen,
phosphprus
Cellular
respiration
Burning of
fossil fuels
and wood
Carbon compoundsin water
Photosynthesis
Primaryconsumers
Higher-levelconsumers
Detritus
Decomposition
CO2 in atmosphere
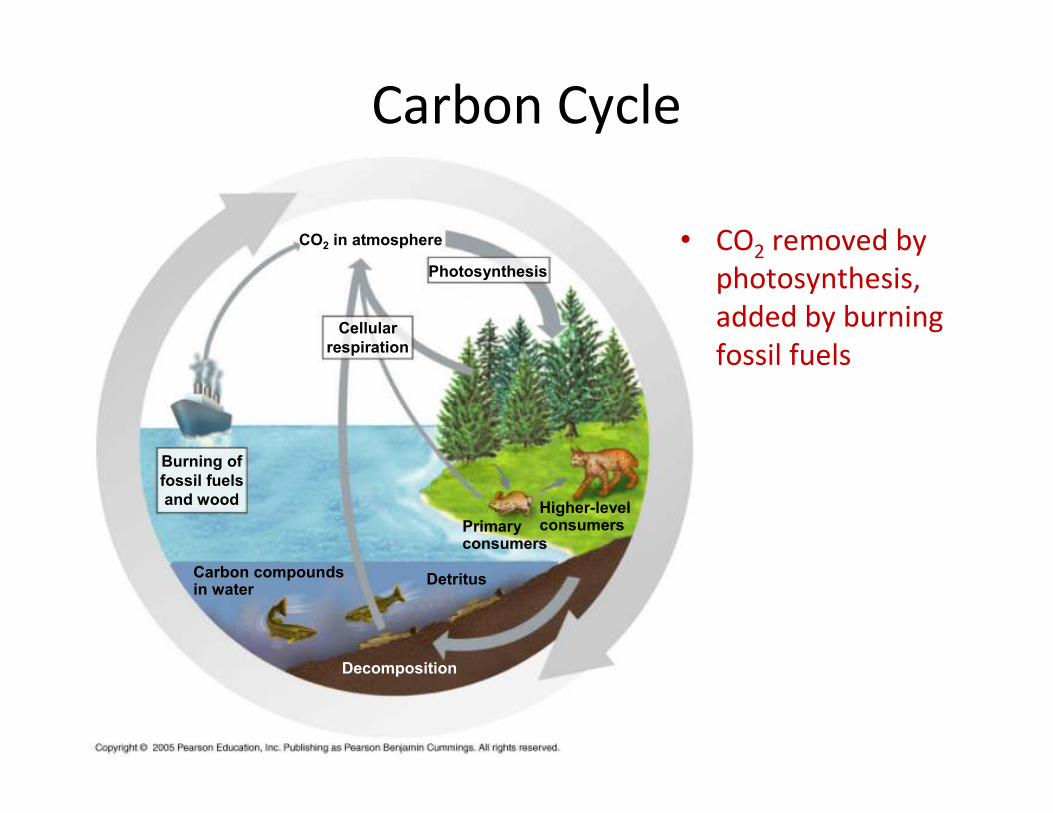
Carbon Cycle
• CO2 removed by
photosynthesis,
added by burning
fossil fuels
Assimilation
N2 in atmosphere
DecomposersNitrifyingbacteria
Nitrifyingbacteria
Nitrogen-fixingsoil bacteria
Denitrifyingbacteria
NitrificationAmmonification
Nitrogen-fixingbacteria in rootnodules of legumes
NO3–
NO2–NH4
+NH3
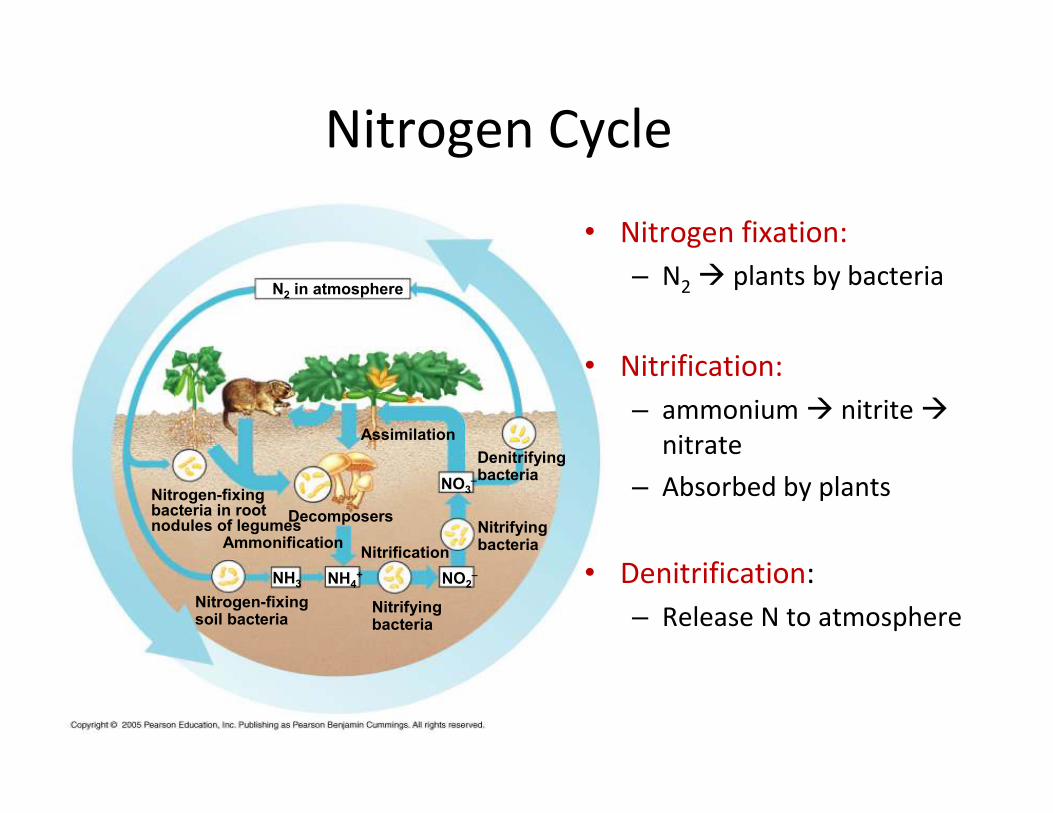
Nitrogen Cycle
• Nitrogen fixation:
– N2 � plants by bacteria
• Nitrification:
– ammonium � nitrite �
nitrate
– Absorbed by plants
• Denitrification:
– Release N to atmosphere
• Acid precipitation: rain, snow, or fog with a pH less
than 5.6
• Caused by burning of wood & fossil fuels
– Sulfur oxides and nitrogen oxides released
– React with water in the atmosphere to produce
sulfuric and nitric acids
• These acids fall back to earth as acid
precipitation, and can damage ecosystems
greatly.
• The acids can kill plants, and can kill aquatic
organisms by changing the pH of the soil and
water.
Acid Precipitation
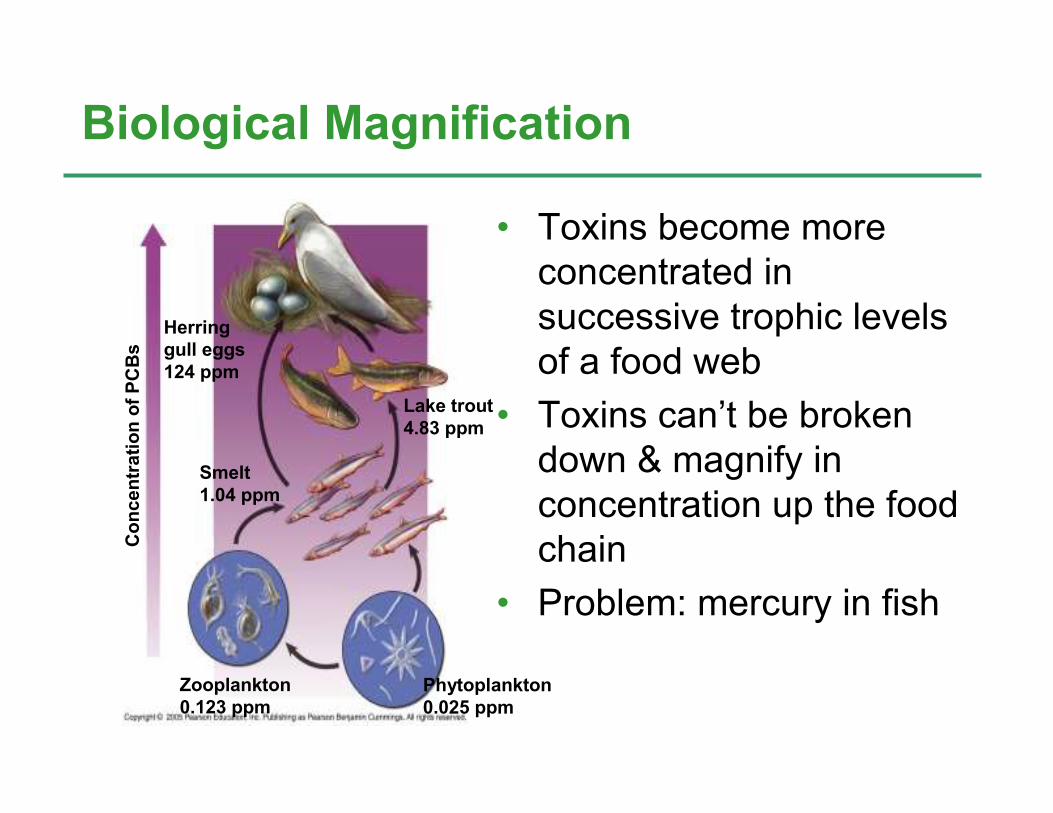
• Toxins become more
concentrated in
successive trophic levels
of a food web
• Toxins can’t be broken
down & magnify in
concentration up the food
chain
• Problem: mercury in fish
Biological Magnification
Zooplankton
0.123 ppm
Phytoplankton
0.025 ppm
Lake trout
4.83 ppm
Smelt
1.04 ppm
Herring
gull eggs
124 ppm
Concentration of PCBs
Greenhouse Effect
– Greenhouse Effect: absorption of heat the Earth
experiences due to certain greenhouse gases
• CO2 and water vapor causes the Earth to retain
some of the infrared radiation from the sun that
would ordinarily escape the atmosphere
– The Earth needs this heat, but too much could be
disastrous.
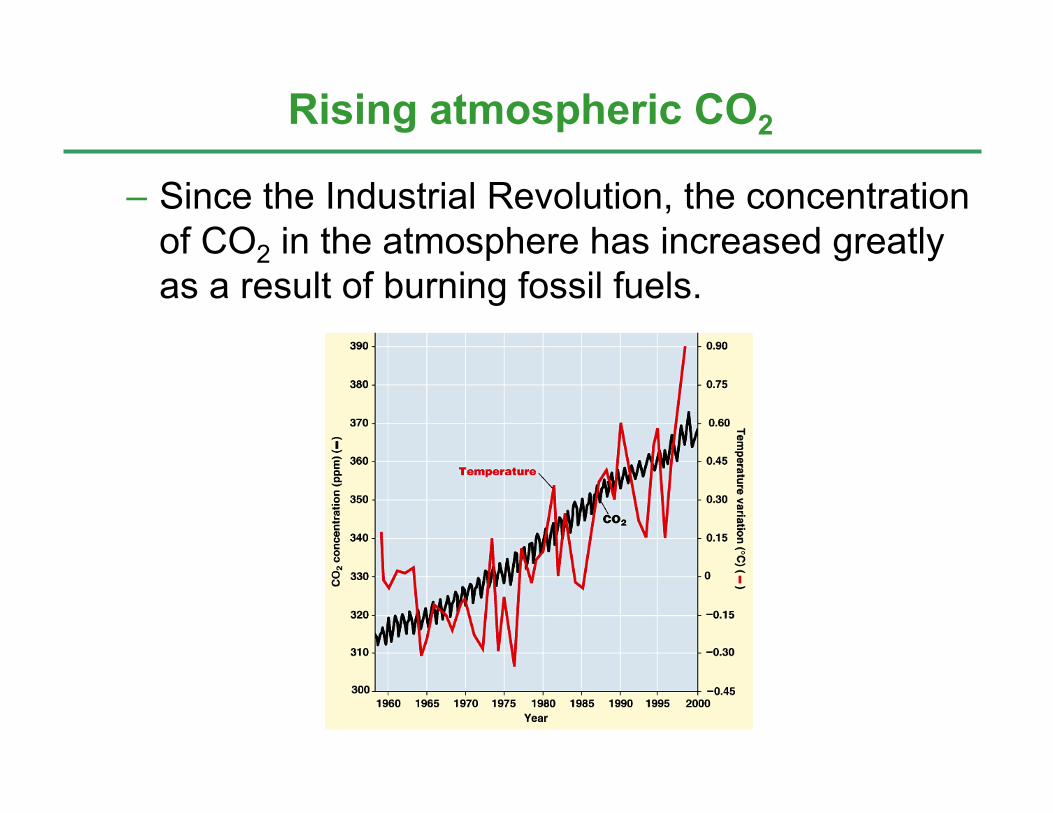
Rising atmospheric CO2
– Since the Industrial Revolution, the concentration
of CO2 in the atmosphere has increased greatly
as a result of burning fossil fuels.
Global Warming
• Scientists continue to construct models to predict
how increasing levels of CO2 in the atmosphere
will affect Earth.
• Several studies predict a doubling of CO2 in the
atmosphere will cause a 2º C increase in the
average temperature of Earth.
• Rising temperatures could cause polar ice cap
melting, which could flood coastal areas.
– It is important that humans attempt to stabilize
their use of fossil fuels.
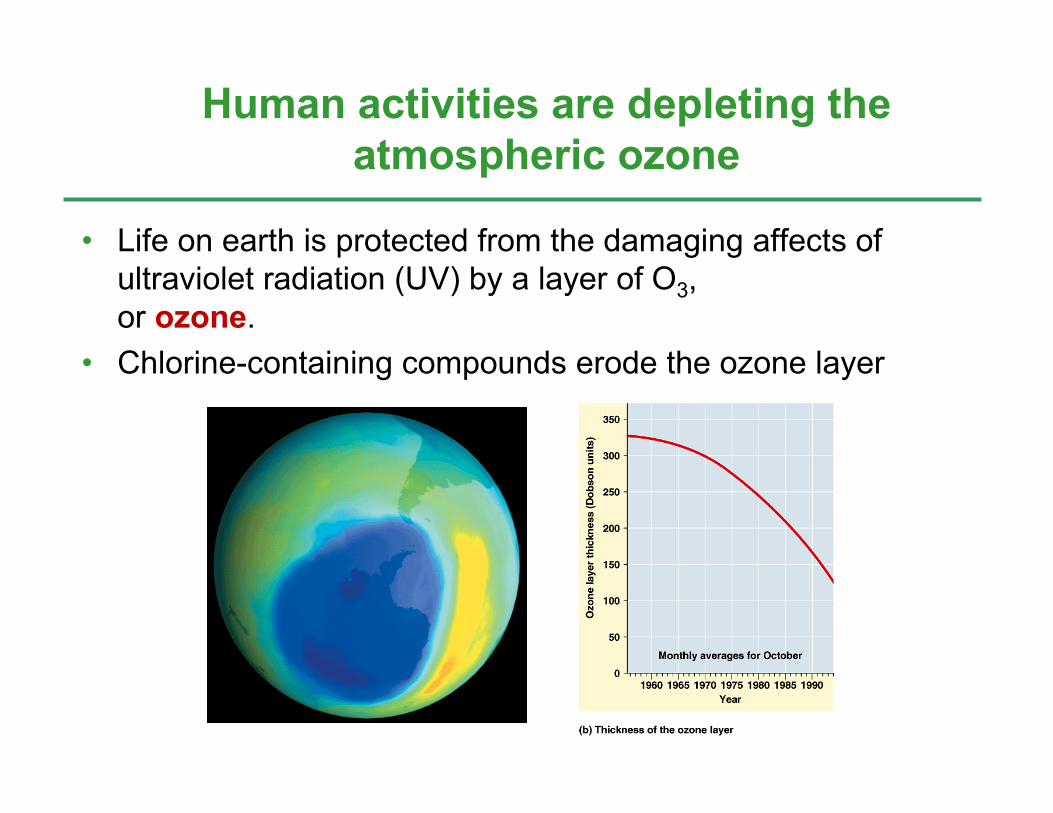
Human activities are depleting the
atmospheric ozone
• Life on earth is protected from the damaging affects of
ultraviolet radiation (UV) by a layer of O3,
or ozone.
• Chlorine-containing compounds erode the ozone layer
The four major threats to biodiversity:
1. Habitat destruction
– Human alteration of habitat is the single
greatest cause of habitat destruction.
2. Introduced species: invasive/nonnative/exotic
species
3. Overexploitation: harvest wild plants/animals
4. Food chain disruption: extinction of keystone
species