Embed Size (px)
Citation preview

AP Biology
Bright blue marble spinning in space
Ecology

AP Biologybiosphere
ecosystem
community
population
Studying organisms in their environment
organism

AP Biology
Interacting with the environment Biotic environment
prey (food) competitors predators, parasites, disease
Abiotic environment sunlight temperature water soil
AP Biology
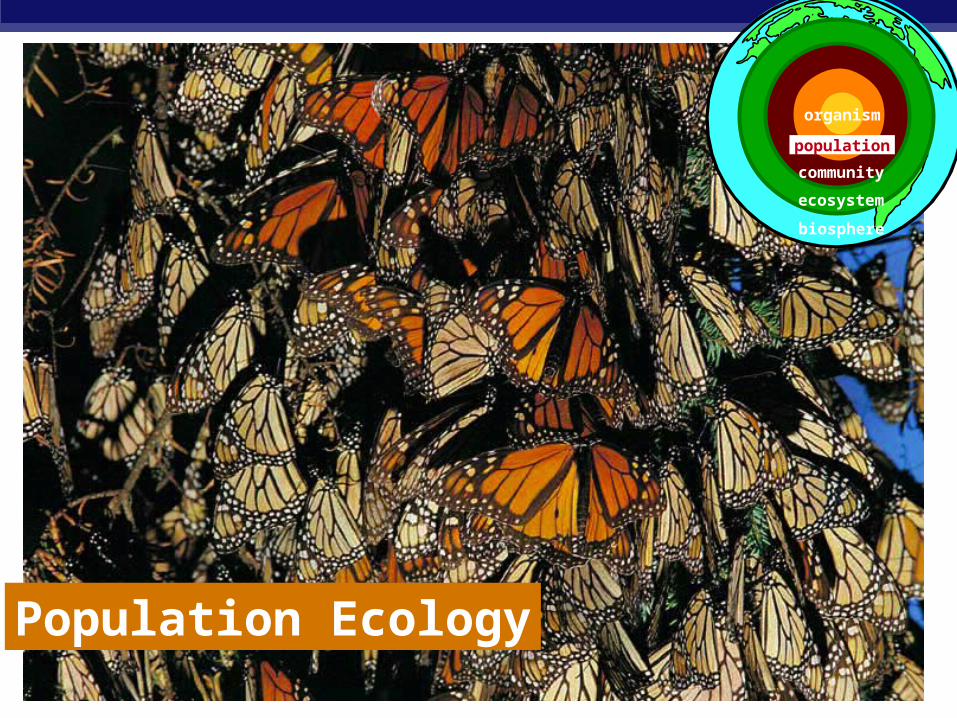
Population Ecology
population
ecosystem
community
biosphere
organism

AP Biology
Life takes place in populations Population
group of individuals of same species in same area at same time
rely on same resources
interact interbreed
rely on same resources
interact interbreed
Population Ecology: What factors affect a population?Population Ecology: What factors affect a population?

AP Biology
Characterizing a Population Describing a population
population range pattern of spacing
density size of population
1937
19431951
19581961
196019651964
1966 1970
1970
1956
Immigrationfrom Africa
~1900
Equator
range
density

AP Biology
Population Range Geographical limitations
biotic & abiotic factors food, predators, temperature, rainfall, etc.
habitat
adapted to polar regionadapted to polar region adapted to rainforestadapted to rainforest

AP Biology
Changes in range Range expansions & contractions
changing environment
Woodlands
Grassland, chaparral,and desert scrub
15,000 years agoglacial periodAlpine tundra
Spruce-fir forests
Mixed conifer forest
0 km
2 km
3 km
1 kmEle
vati
on
(km
)
PresentAlpine tundra
Spruce-fir forests
Mixed conifer forest
Woodlands
Grassland,chaparral, and
desert scrub
aspen oak, maple white birch sequoia
result of competitionresult of competition

AP Biology
At risk populations Endangered species
limitations to range / habitat places species at risk
Socorro isopod
Devil’s holepupfish
Iriomote cat
Northern white rhinoceros
New Guineatree kangaroo
IiwiHawaiian
bird
Catalina Island
mahoganytree

AP Biology
Population Spacing Dispersal patterns within a population
uniform
random
clumped
Provides insight into the environmental associations & social interactions of individuals in population
Provides insight into the environmental associations & social interactions of individuals in population

AP Biology
Clumped Pattern (most common)

AP Biology
Uniform
Clumped patterns
May result from direct interactions between individuals in the population territoriality

AP Biology
Difficult to count a moving target
Measuring population density How do we measure how many
individuals in a population? number of individuals in an area mark & recapture methods
sampling populations

AP Biology
Population Size Changes to
population size adding & removing
individuals from a population birth death immigration emigration

AP Biology
Population growth rates Factors affecting population growth rate
sex ratio how many females vs. males?
generation time at what age do females reproduce?
age structure how females at reproductive age in cohort?

AP Biology
Life tableLife table
What does this tell you about the population?
What does this tell you about the population?
Demography Factors that affect growth & decline of
populations vital statistics & how they change over time
Why do teenage boys pay high car insurance rates?Why do teenage boys pay high car insurance rates?
females males
AP Biology
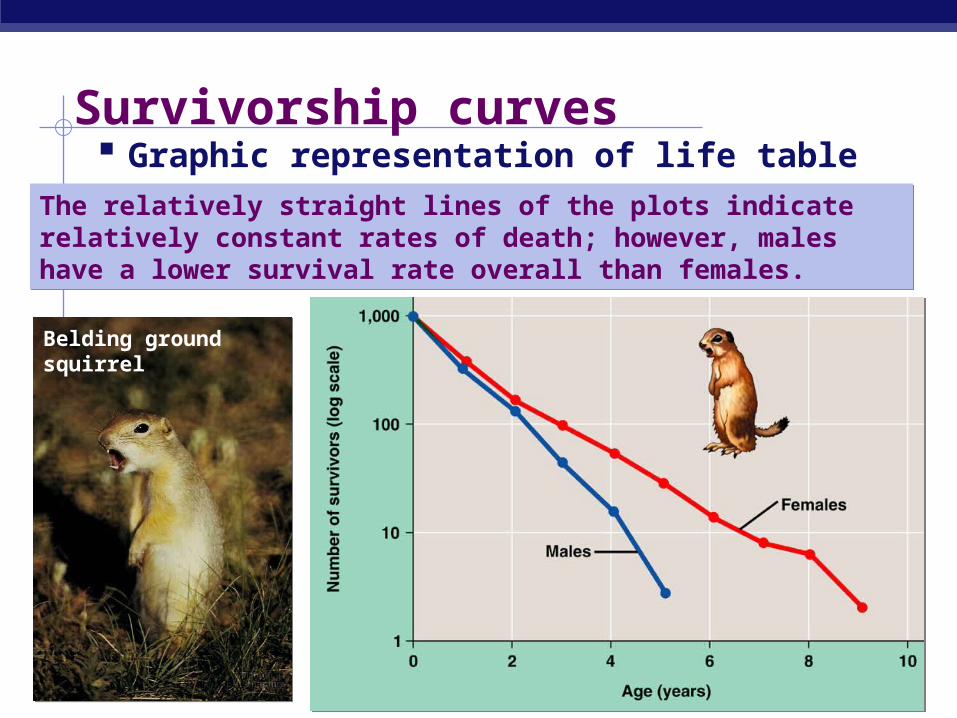
Survivorship curves Graphic representation of life table
Belding ground squirrel
The relatively straight lines of the plots indicate relatively constant rates of death; however, males have a lower survival rate overall than females.
The relatively straight lines of the plots indicate relatively constant rates of death; however, males have a lower survival rate overall than females.

AP Biology
Age structure Relative number of individuals of each age
What do the data imply about population growth in these countries?

AP Biology
Survivorship curves Generalized strategies
What do these graphs tell about survival & strategy of a species?
What do these graphs tell about survival & strategy of a species?
0 25
1000
100
Human(type I)
Hydra(type II)
Oyster(type III)
10
150
Percent of maximum life span
10075
Su
rviv
al p
er
tho
us
and
I. High death rate in post-reproductive years
I. High death rate in post-reproductive years
II. Constant mortality rate throughout life span
II. Constant mortality rate throughout life span
III. Very high early mortality but the few survivors then live long (stay reproductive)
III. Very high early mortality but the few survivors then live long (stay reproductive)