Embed Size (px)
Citation preview
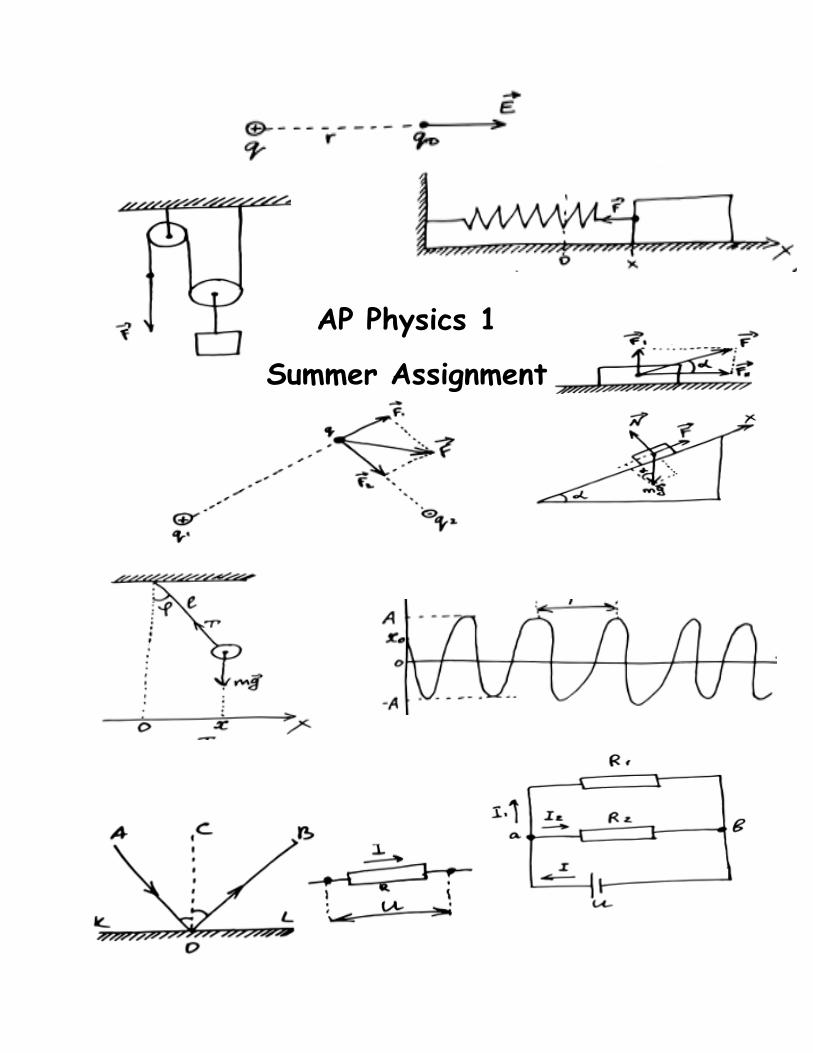
AP Physics 1
Summer Assignment
Dear Student,
Welcome to AP Physics 1! This is a college level Physics
course that is fun, interesting and academically challenging
on a level you might not have experienced yet. To complete
the material and the labs, we must pass quickly through
dimensional analysis and other basic topics.
This summer assignment will review all of the prerequisite
knowledge expected of you. It is very important that this
assignment be completed individually. Your summer work will
be due at the beginning of class on the first day of school.
It will count as your first test grade.
For help on these topics, please go to
http://aplusphysics.com/community/index.php?/videos/category
/29-general/. This website has wonderful videos for review
that cover all of AP Physics. Should you have a question that
you cannot figure out, please feel free to email me at
[email protected]. Please be patient as I may not have
access to email every day.
I will be praying for each and every one of you this summer
as I prepare for your arrival in August. May God keep you
safe and I hope you have a wonderful (and productive)
summer.
Mrs. Carson
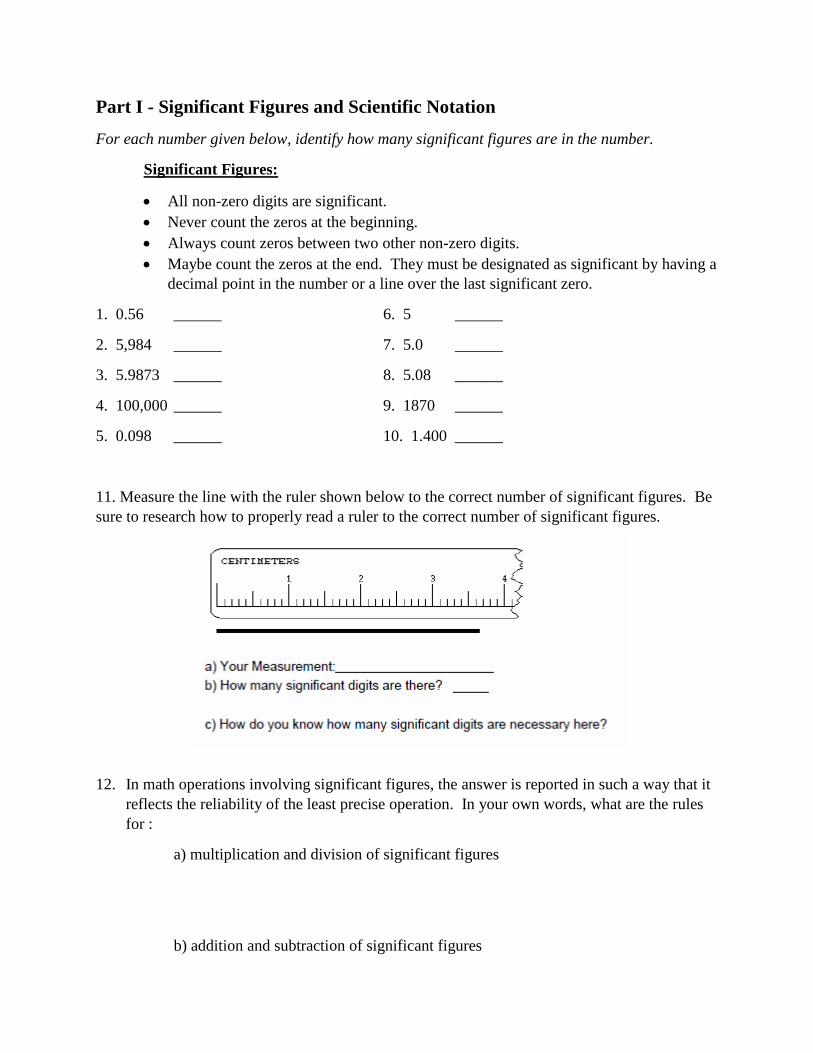
Part I - Significant Figures and Scientific Notation
For each number given below, identify how many significant figures are in the number.
Significant Figures:
• All non-zero digits are significant.
• Never count the zeros at the beginning.
• Always count zeros between two other non-zero digits.
• Maybe count the zeros at the end. They must be designated as significant by having a
decimal point in the number or a line over the last significant zero.
1. 0.56 ______ 6. 5 ______
2. 5,984 ______ 7. 5.0 ______
3. 5.9873 ______ 8. 5.08 ______
4. 100,000 ______ 9. 1870 ______
5. 0.098 ______ 10. 1.400 ______
11. Measure the line with the ruler shown below to the correct number of significant figures. Be
sure to research how to properly read a ruler to the correct number of significant figures.
12. In math operations involving significant figures, the answer is reported in such a way that it
reflects the reliability of the least precise operation. In your own words, what are the rules
for :
a) multiplication and division of significant figures
b) addition and subtraction of significant figures
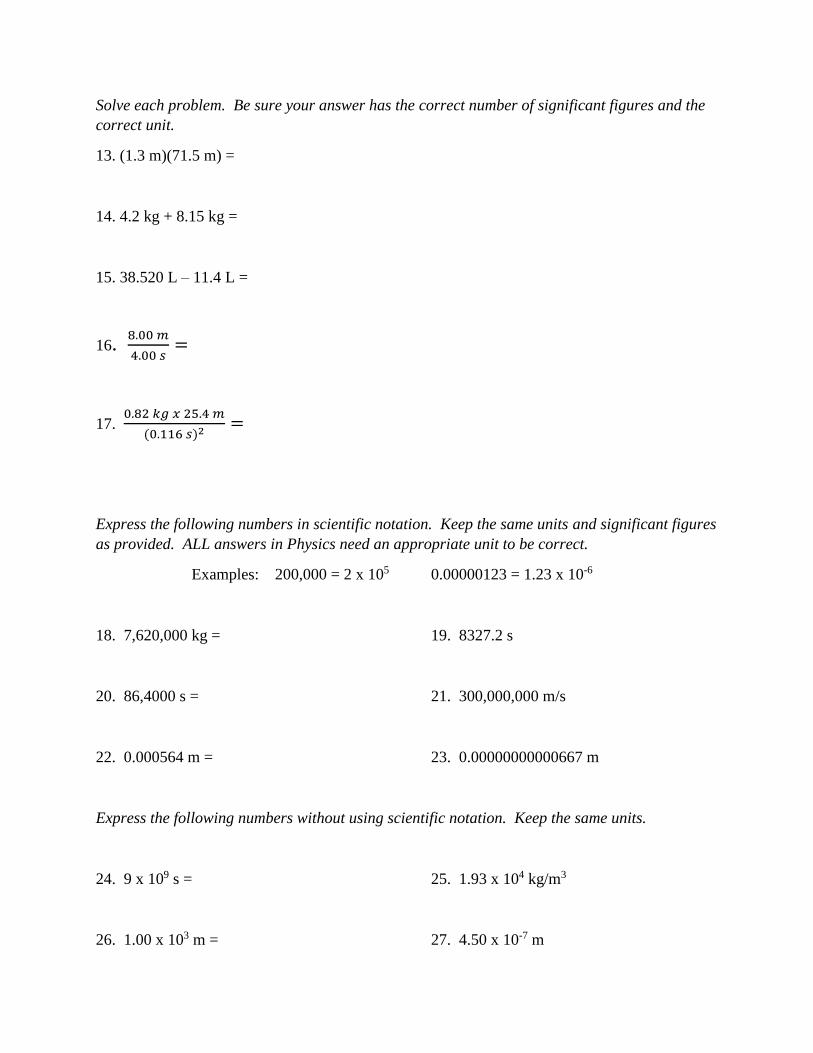
Solve each problem. Be sure your answer has the correct number of significant figures and the
correct unit.
13. (1.3 m)(71.5 m) =
14. 4.2 kg + 8.15 kg =
15. 38.520 L – 11.4 L =
16. 8.00 𝑚
4.00 𝑠=
17. 0.82 𝑘𝑔 𝑥 25.4 𝑚
(0.116 𝑠)2=
Express the following numbers in scientific notation. Keep the same units and significant figures
as provided. ALL answers in Physics need an appropriate unit to be correct.
Examples: 200,000 = 2 x 10⁵ 0.00000123 = 1.23 x 10⁻⁶
18. 7,620,000 kg = 19. 8327.2 s
20. 86,4000 s = 21. 300,000,000 m/s
22. 0.000564 m = 23. 0.00000000000667 m
Express the following numbers without using scientific notation. Keep the same units.
24. 9 x 10⁹ s = 25. 1.93 x 10⁴ kg/m3
26. 1.00 x 10³ m = 27. 4.50 x 10⁻⁷ m
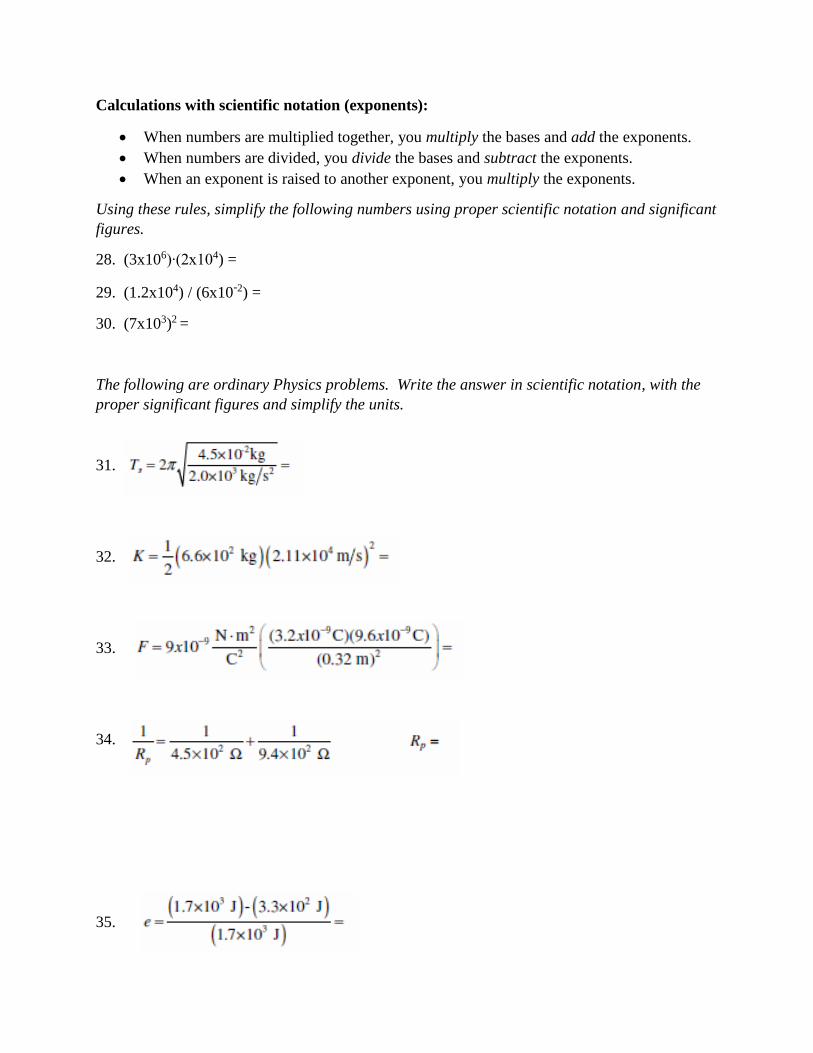
Calculations with scientific notation (exponents):
• When numbers are multiplied together, you multiply the bases and add the exponents.
• When numbers are divided, you divide the bases and subtract the exponents.
• When an exponent is raised to another exponent, you multiply the exponents.
Using these rules, simplify the following numbers using proper scientific notation and significant
figures.
28. (3x10⁶)∙(2x10⁴) =
29. (1.2x10⁴) / (6x10⁻²) =
30. (7x10³)2 =
The following are ordinary Physics problems. Write the answer in scientific notation, with the
proper significant figures and simplify the units.
31.
32.
33.
34.
35.
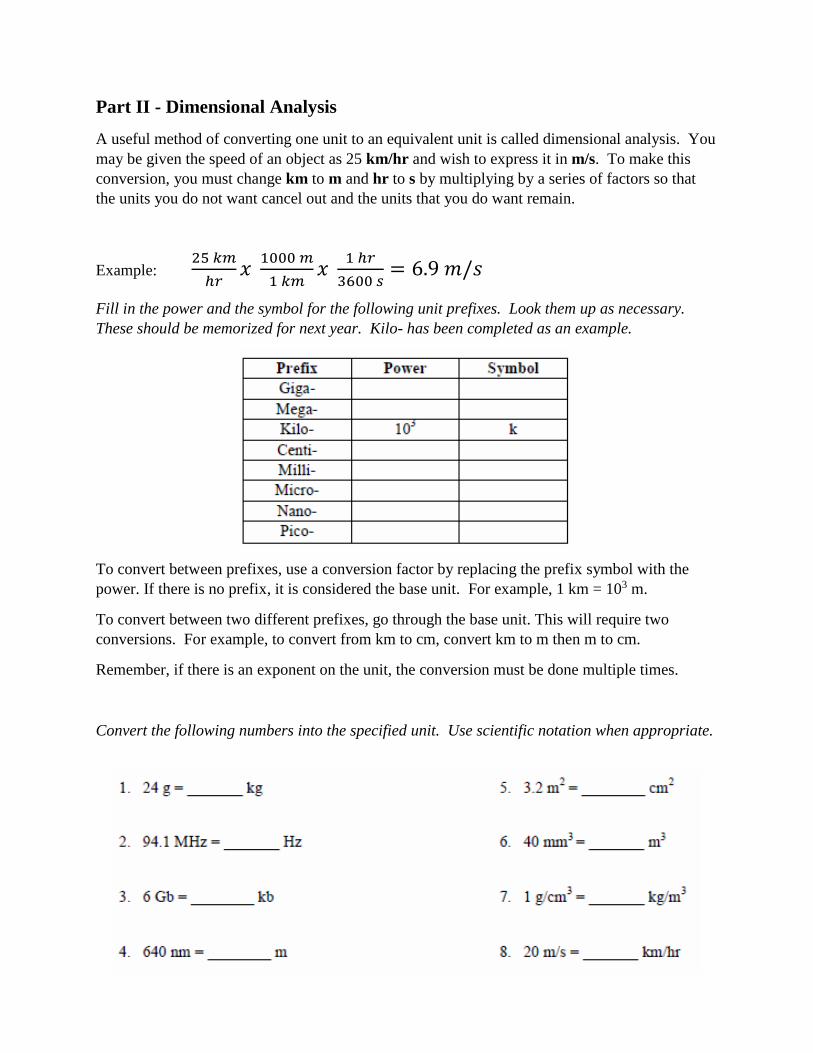
Part II - Dimensional Analysis
A useful method of converting one unit to an equivalent unit is called dimensional analysis. You
may be given the speed of an object as 25 km/hr and wish to express it in m/s. To make this
conversion, you must change km to m and hr to s by multiplying by a series of factors so that
the units you do not want cancel out and the units that you do want remain.
Example: 25 𝑘𝑚
ℎ𝑟𝑥
1000 𝑚
1 𝑘𝑚𝑥
1 ℎ𝑟
3600 𝑠= 6.9 𝑚/𝑠
Fill in the power and the symbol for the following unit prefixes. Look them up as necessary.
These should be memorized for next year. Kilo- has been completed as an example.
To convert between prefixes, use a conversion factor by replacing the prefix symbol with the
power. If there is no prefix, it is considered the base unit. For example, 1 km = 103 m.
To convert between two different prefixes, go through the base unit. This will require two
conversions. For example, to convert from km to cm, convert km to m then m to cm.
Remember, if there is an exponent on the unit, the conversion must be done multiple times.
Convert the following numbers into the specified unit. Use scientific notation when appropriate.
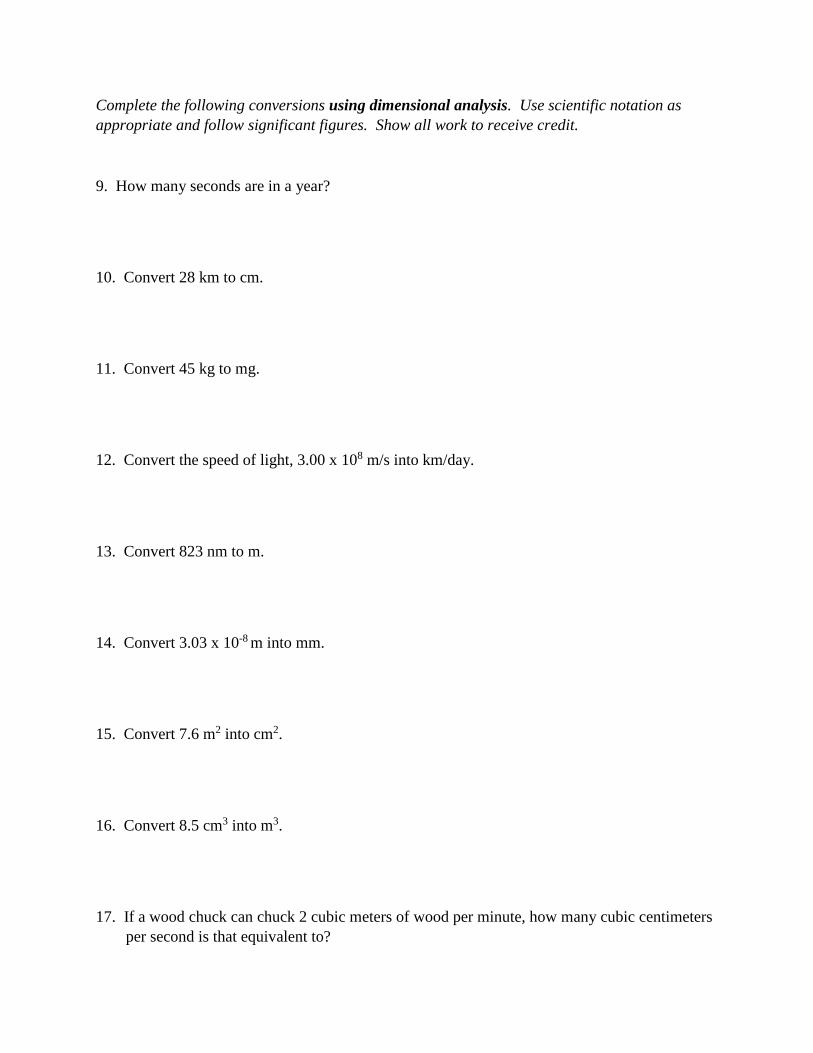
Complete the following conversions using dimensional analysis. Use scientific notation as
appropriate and follow significant figures. Show all work to receive credit.
9. How many seconds are in a year?
10. Convert 28 km to cm.
11. Convert 45 kg to mg.
12. Convert the speed of light, 3.00 x 10⁸ m/s into km/day.
13. Convert 823 nm to m.
14. Convert 3.03 x 10⁻⁸ m into mm.
15. Convert 7.6 m2 into cm2.
16. Convert 8.5 cm3 into m3.
17. If a wood chuck can chuck 2 cubic meters of wood per minute, how many cubic centimeters
per second is that equivalent to?
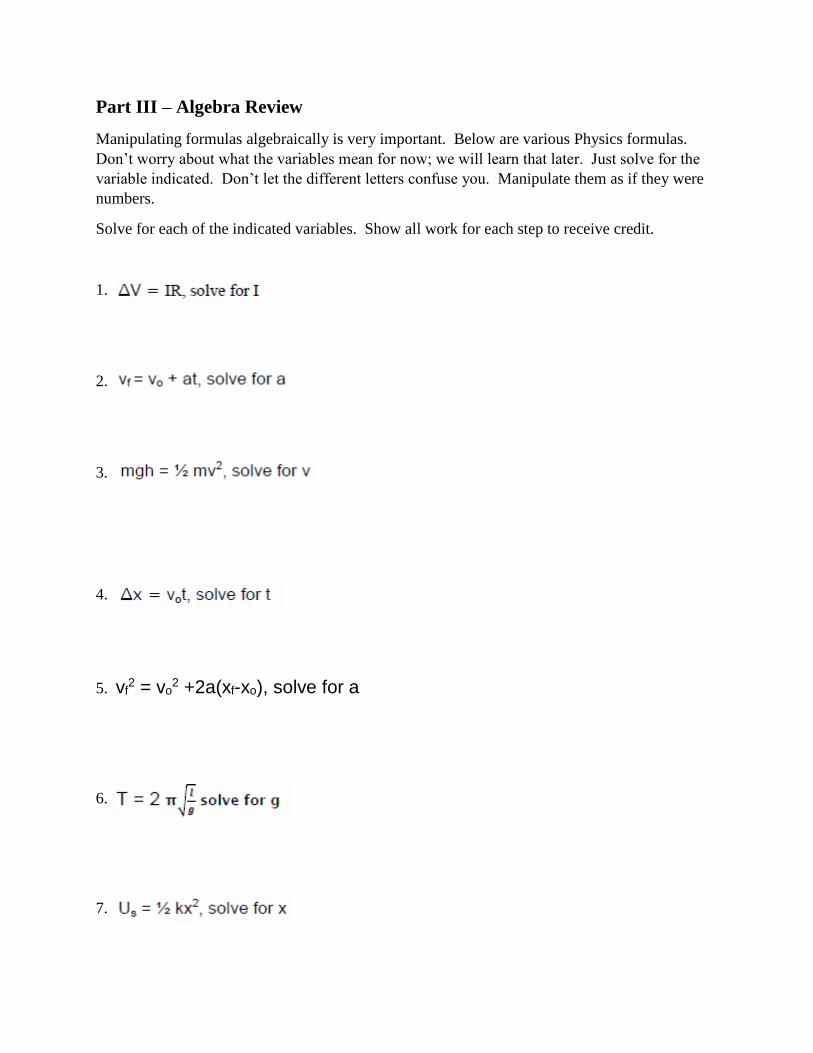
Part III – Algebra Review
Manipulating formulas algebraically is very important. Below are various Physics formulas.
Don’t worry about what the variables mean for now; we will learn that later. Just solve for the
variable indicated. Don’t let the different letters confuse you. Manipulate them as if they were
numbers.
Solve for each of the indicated variables. Show all work for each step to receive credit.
1.
2.
3.
4.
5. vf2 = vo
2 +2a(xf-xo), solve for a
6.
7.
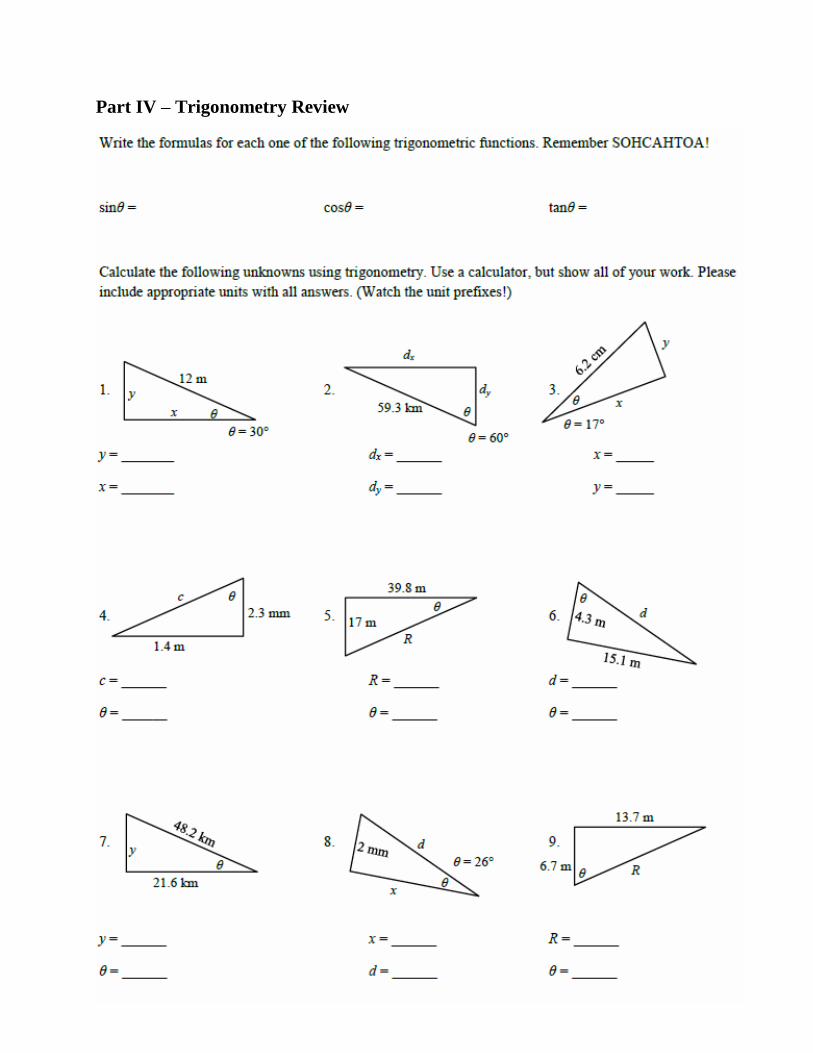
Part IV – Trigonometry Review
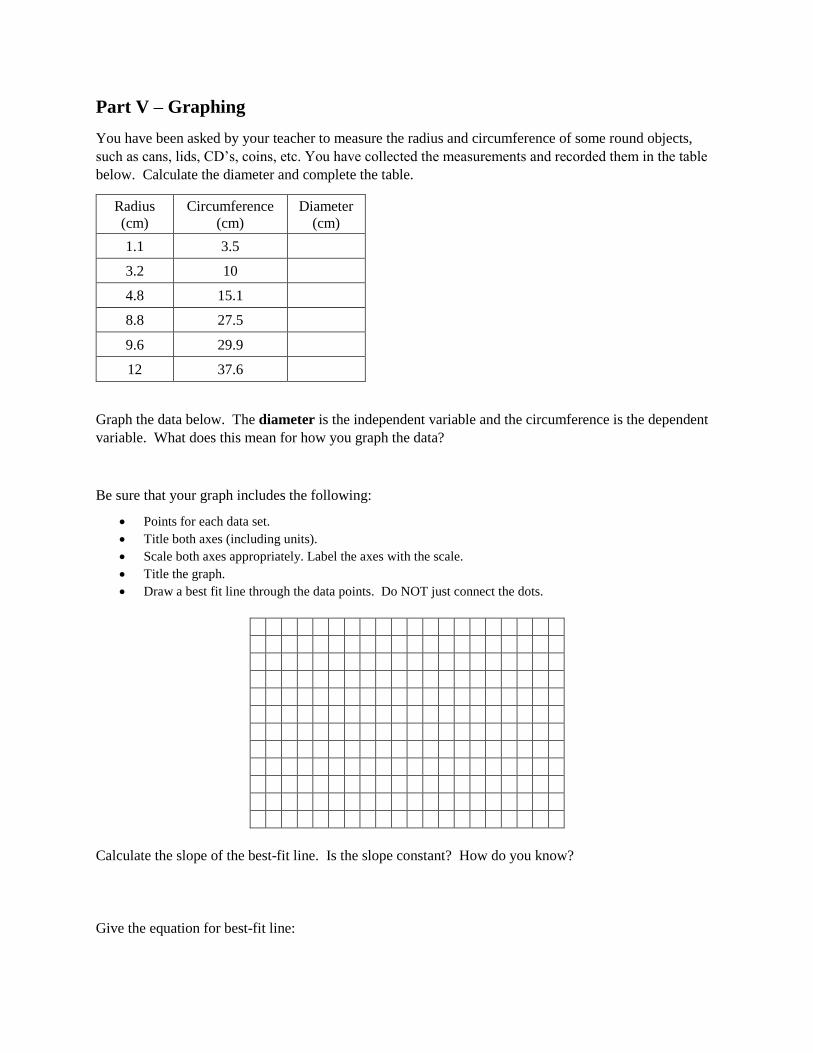
Part V – Graphing
You have been asked by your teacher to measure the radius and circumference of some round objects,
such as cans, lids, CD’s, coins, etc. You have collected the measurements and recorded them in the table
below. Calculate the diameter and complete the table.
Radius
(cm)
Circumference
(cm)
Diameter
(cm)
1.1 3.5
3.2 10
4.8 15.1
8.8 27.5
9.6 29.9
12 37.6
Graph the data below. The diameter is the independent variable and the circumference is the dependent
variable. What does this mean for how you graph the data?
Be sure that your graph includes the following:
• Points for each data set.
• Title both axes (including units).
• Scale both axes appropriately. Label the axes with the scale.
• Title the graph.
• Draw a best fit line through the data points. Do NOT just connect the dots.
Calculate the slope of the best-fit line. Is the slope constant? How do you know?
Give the equation for best-fit line:
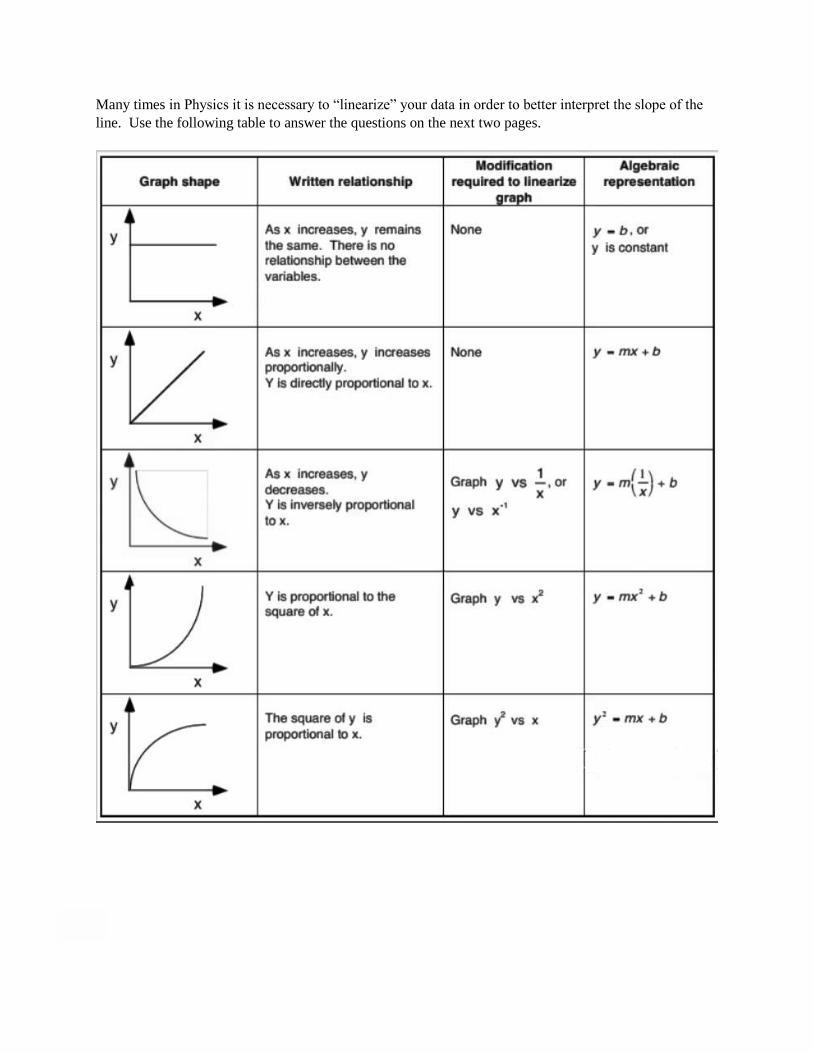
Many times in Physics it is necessary to “linearize” your data in order to better interpret the slope of the
line. Use the following table to answer the questions on the next two pages.
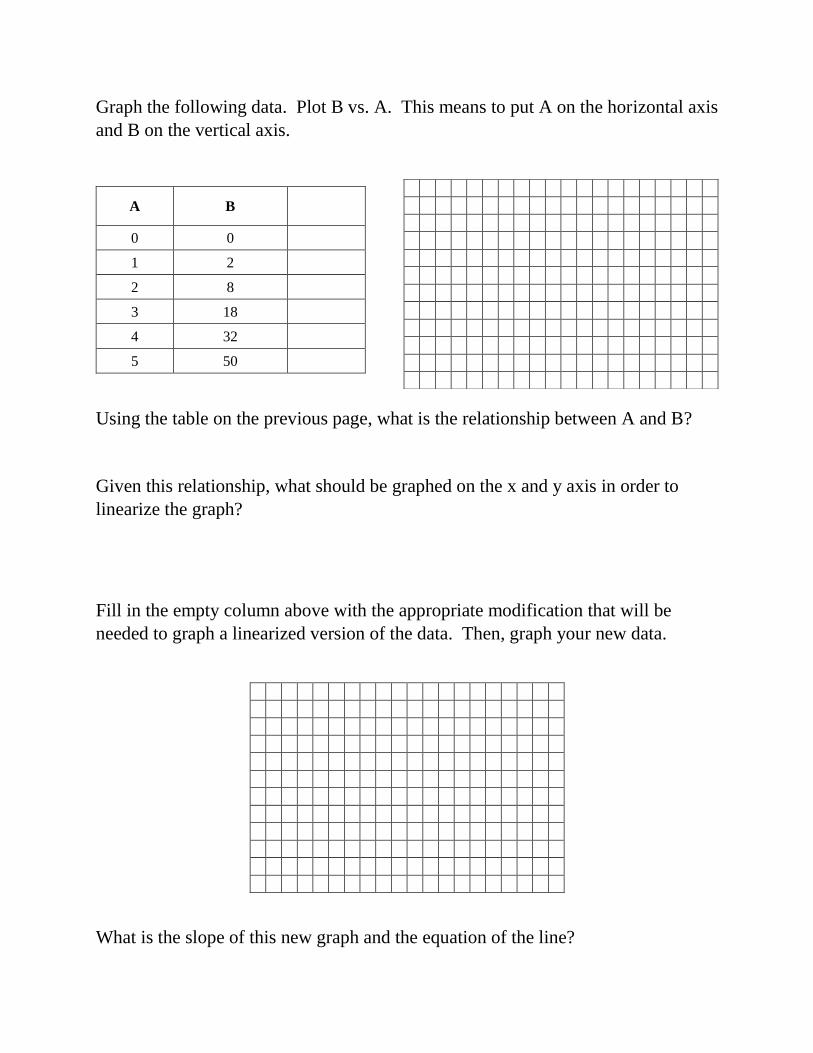
Graph the following data. Plot B vs. A. This means to put A on the horizontal axis
and B on the vertical axis.
A B
0 0
1 2
2 8
3 18
4 32
5 50
Using the table on the previous page, what is the relationship between A and B?
Given this relationship, what should be graphed on the x and y axis in order to
linearize the graph?
Fill in the empty column above with the appropriate modification that will be
needed to graph a linearized version of the data. Then, graph your new data.
What is the slope of this new graph and the equation of the line?
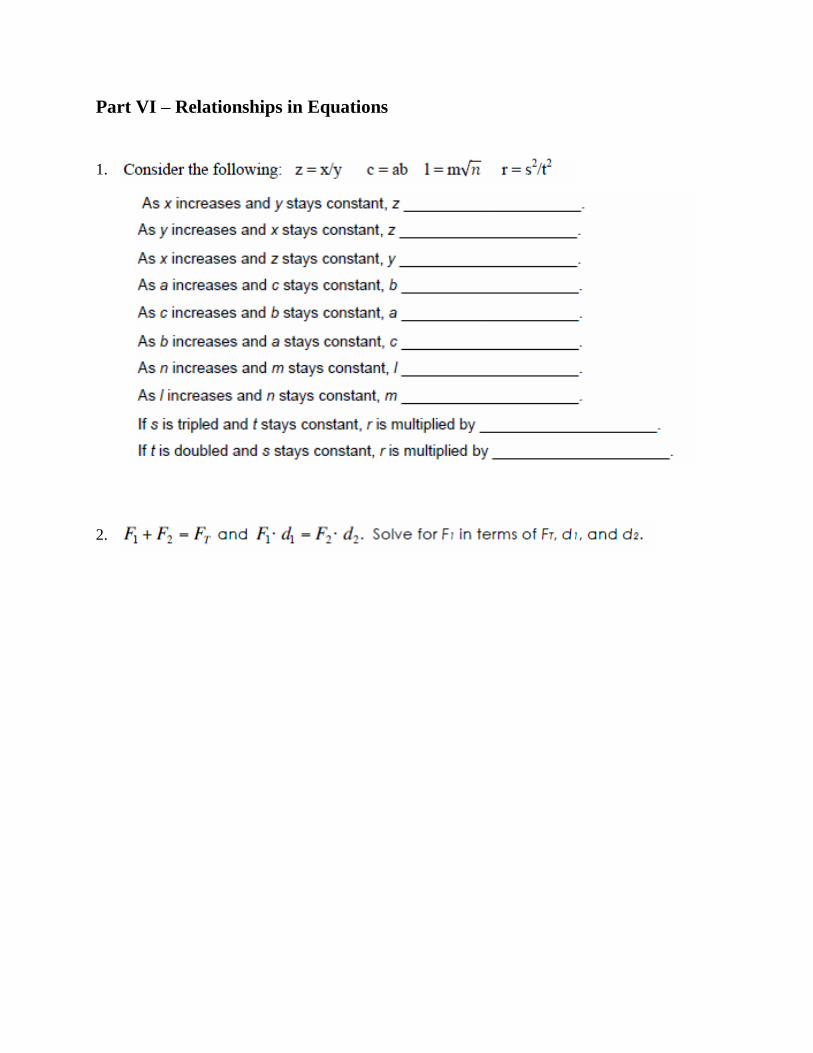
Part VI – Relationships in Equations
1.
2.


![ICSE QUESTION PAPER CLASS-X MATHS(2016) · 2018-12-18 · Question 5 (a) Solve the quadratic equation x2 3(x + 3) = 0; Give your answer correct two significant figures. [3] (b) A](https://img.pdfslide.net/doc/110x75/5f3fae0fde4b65234212b725/icse-question-paper-class-x-maths2016-2018-12-18-question-5-a-solve-the-quadratic.jpg)