Embed Size (px)
Citation preview
Oh
io
THE 10TH ANNUAL
AP® Report to the NationSTATE SUPPLEMENT FEBRUARY 11, 2014
2
T H E 1 0 T H A N N U A L A P R E P O R T T O T H E N A T I O N · O H I O S U P P L E M E N T
About This Report
This report provides educators and policymakers with information
they can use to celebrate their successes, understand their unique
challenges, and set meaningful goals to increase opportunity for all
students. It’s important to note that while AP® Exams are valid
measures of students’ content mastery of college-level studies in
specific academic disciplines, AP results should never be used as
the sole measure for gauging educational excellence and equity.
Because reliable demographic data for nonpublic schools are not
available for all states, this report represents public school students
only. Additionally, this report looks at students’ entire experience
with AP — tracking exams taken by graduates throughout their high
school careers as opposed to reporting exam results from a
particular calendar year.
Additional data are available at apreport.collegeboard.org.
Table of Contents
3 State Strategies
7 Fostering AP® Participation and Success
9 A Closer Look at Equity Gaps in AP Participation and Success
Note: Throughout this report, public high school graduates represent projections supplied in Knocking at the College Door (Western Interstate Commission for Higher Education, 2012).
Tbegan in fall 2012, and the �rst AP Exam based on those redesigned courseswas administered in May 2013. As a result, the data in this report re�ect a blend
he redesigned courses, Biology, Latin, and Spanish Literature and Culture,
of the old and redesigned exam results.
3
T H E 1 0 T H A N N U A L A P R E P O R T T O T H E N A T I O N · O H I O S U P P L E M E N T
STATE STRATEG IESSTATE STRATEG IES
Ohio has made progress in recent years in improving student access and supporting student performance in AP®. Just as we do in the national report, we wanted to take an opportunity to applaud your efforts and offer additional strategies for your consideration.
Current Picture
Congratulations. You are already using these strategies to build a robust AP Program. You:
Include AP in the state accountability system.
Celebrate the 37 districts that have earned a spot on the AP Honor Roll through their hard work and dedication to increasing participation and success in AP, particularly for underrepresented students. See page 5 for more details.
Encourage your educators to participate in the development of the AP Program, such as by becoming AP Exam Readers or participating in course and exam development committees. See page 5 for more details.
Ensure that public colleges and universities develop AP Exam credit and placement policies based on institutional goals, alignment with corresponding courses, and objective outcomes research.
Provide funding for students to take an online AP course.
4
T H E 1 0 T H A N N U A L A P R E P O R T T O T H E N A T I O N · O H I O S U P P L E M E N T
STATE STRATEG IESSTATE STRATEG IES
The following strategies have been proven effective. To build an even stronger AP program, you could:
¨ Create opportunities for other schools and districts to learn from your AP Honor Roll winners.
¨ Set clear, measurable statewide goals toward improvement.
¨ Provide funding for teachers in underserved areas of the state to participate in professional development.
¨ Hold an annual recognition event for schools demonstrating outstanding AP performance or growth.
¨ Provide targeted assistance and resources to schools serving traditionally underserved populations. For example, funding for materials, supplies, outreach efforts, and tutoring programs.
¨ Clearly communicate how AP fits into state graduation requirements, and share information about funding opportunities that enable students to participate and succeed in AP.
¨ Develop policies that allow AP course work and exam scores for sophomores and juniors to substitute for statewide graduation requirements and/or end-of-course assessments.
¨ Provide resources to schools and districts to support research-based programs that build content knowledge and skills — particularly in literacy and math — to prepare students for success in AP course work, and in college and careers.
¨ Participate in the Expedited AP data program, which provides states with their AP student data earlier than ever before, free of charge, by using a standardized data agreement and file format.
Opportunities
5
T H E 1 0 T H A N N U A L A P R E P O R T T O T H E N A T I O N · O H I O S U P P L E M E N T
STATE STRATEG IESSTATE STRATEG IES
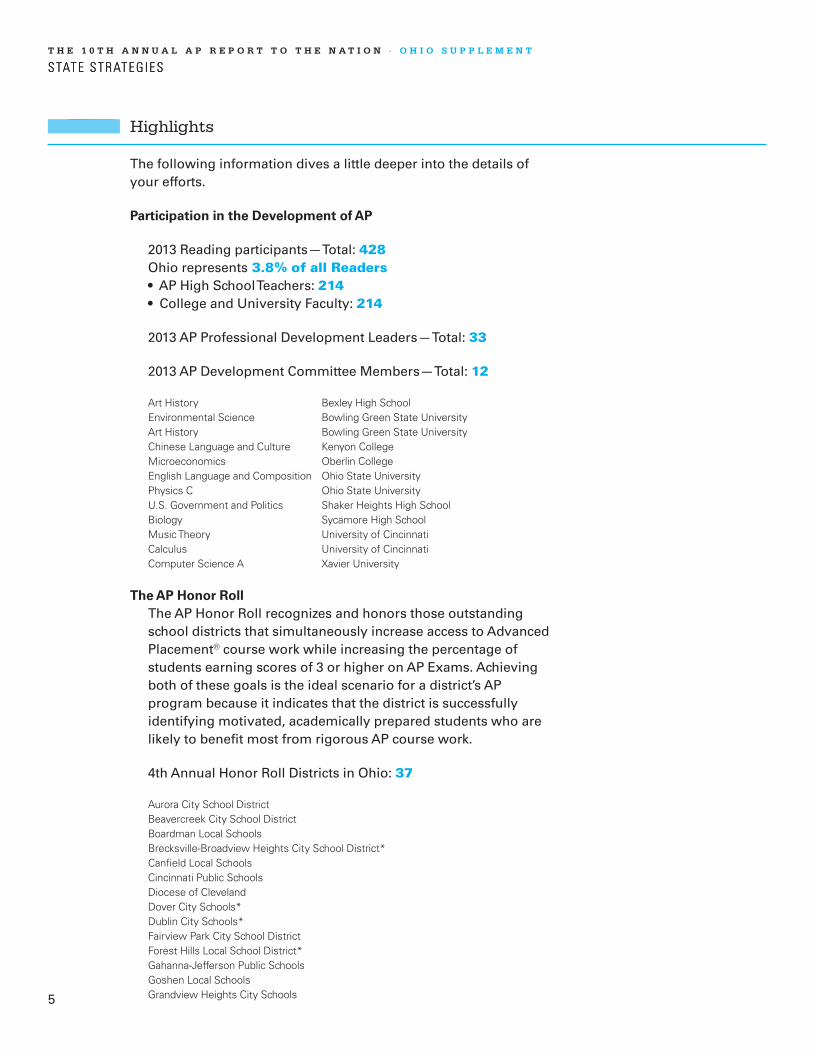
The following information dives a little deeper into the details of your efforts.
Participation in the Development of AP
2013 Reading participants — Total: 428 Ohio represents 3.8% of all Readers • AP High School Teachers: 214 • College and University Faculty: 214
2013 AP Professional Development Leaders — Total: 33
2013 AP Development Committee Members — Total: 12
Art History Bexley High SchoolEnvironmental Science Bowling Green State UniversityArt History Bowling Green State UniversityChinese Language and Culture Kenyon CollegeMicroeconomics Oberlin College English Language and Composition Ohio State UniversityPhysics C Ohio State UniversityU.S. Government and Politics Shaker Heights High SchoolBiology Sycamore High SchoolMusic Theory University of CincinnatiCalculus University of CincinnatiComputer Science A Xavier University
The AP Honor RollThe AP Honor Roll recognizes and honors those outstanding school districts that simultaneously increase access to Advanced Placement® course work while increasing the percentage of students earning scores of 3 or higher on AP Exams. Achieving both of these goals is the ideal scenario for a district’s AP program because it indicates that the district is successfully identifying motivated, academically prepared students who are likely to benefit most from rigorous AP course work.
4th Annual Honor Roll Districts in Ohio: 37
Aurora City School DistrictBeavercreek City School DistrictBoardman Local SchoolsBrecksville-Broadview Heights City School District*Canfield Local SchoolsCincinnati Public SchoolsDiocese of Cleveland Dover City Schools*Dublin City Schools*Fairview Park City School DistrictForest Hills Local School District*Gahanna-Jefferson Public SchoolsGoshen Local SchoolsGrandview Heights City Schools
Highlights
6
T H E 1 0 T H A N N U A L A P R E P O R T T O T H E N A T I O N · O H I O S U P P L E M E N T
STATE STRATEG IESSTATE STRATEG IES
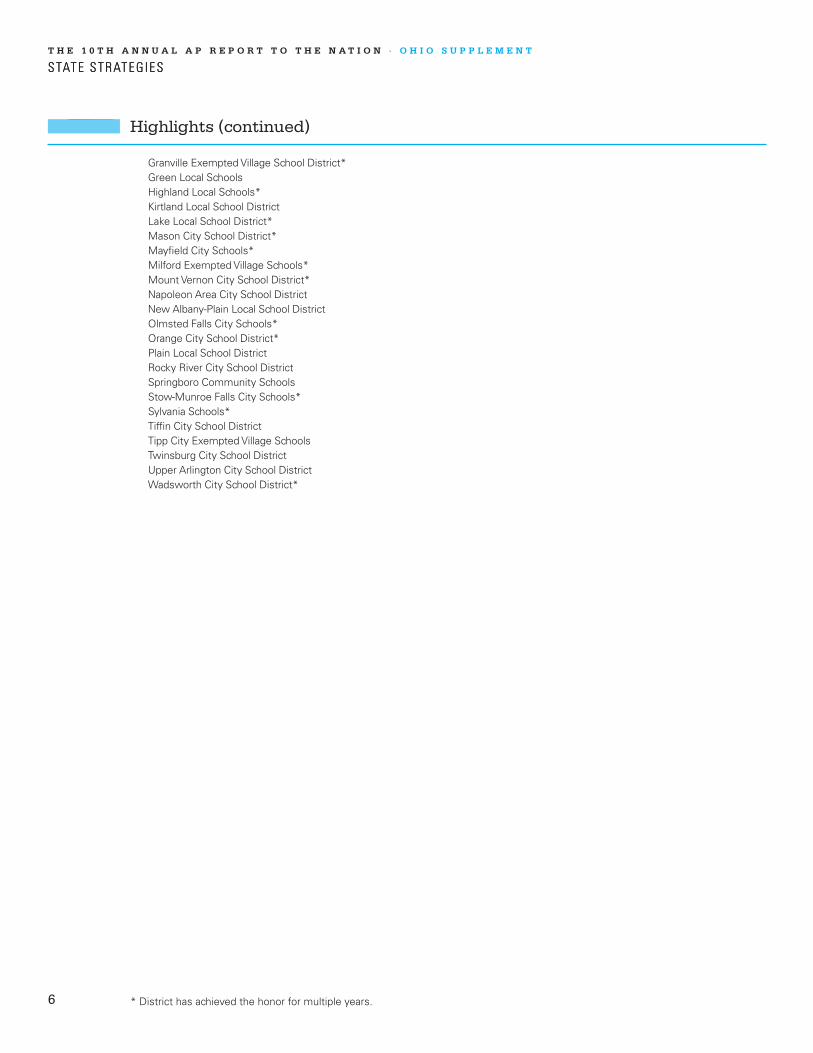
Granville Exempted Village School District*Green Local SchoolsHighland Local Schools*Kirtland Local School DistrictLake Local School District*Mason City School District*Mayfield City Schools*Milford Exempted Village Schools*Mount Vernon City School District*Napoleon Area City School DistrictNew Albany-Plain Local School DistrictOlmsted Falls City Schools*Orange City School District*Plain Local School DistrictRocky River City School DistrictSpringboro Community SchoolsStow-Munroe Falls City Schools*Sylvania Schools*Tiffin City School DistrictTipp City Exempted Village SchoolsTwinsburg City School DistrictUpper Arlington City School DistrictWadsworth City School District*
Highlights (continued)
* District has achieved the honor for multiple years.
7
T H E 1 0 T H A N N U A L A P R E P O R T T O T H E N A T I O N · O H I O S U P P L E M E N T
FOSTER ING AP PART IC IPAT ION AND SUCCESS
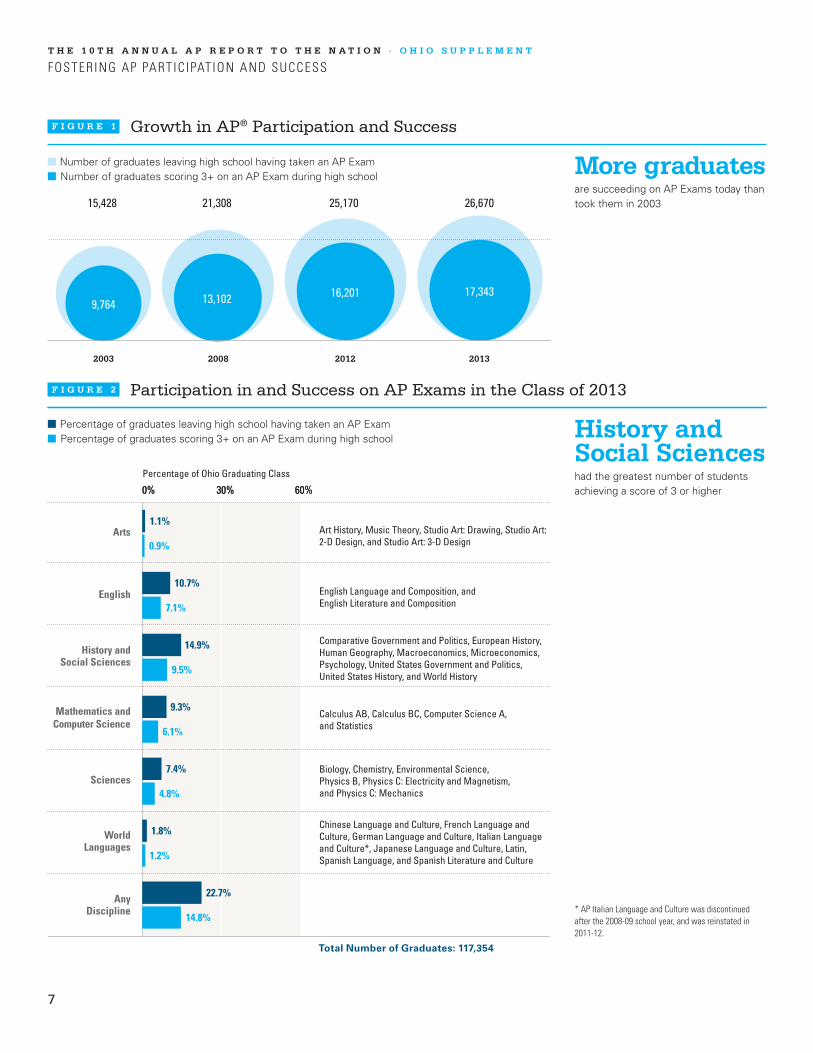
More graduatesare succeeding on AP Exams today than took them in 2003
History and Social Scienceshad the greatest number of students achieving a score of 3 or higher
F I G U R E 1 Growth in AP® Participation and Success
F I G U R E 2 Participation in and Success on AP Exams in the Class of 2013
Number of graduates leaving high school having taken an AP Exam Number of graduates scoring 3+ on an AP Exam during high school
2003 2008 2012 2013
21,308 15,428 25,170 26,670
13,102 9,764 16,201 17,343
60%30%0%
Percentage of Ohio Graduating Class
Arts
English
WorldLanguages
Mathematics andComputer Science
Sciences
History andSocial Sciences
AnyDiscipline
Total Number of Graduates: 117,354
1.1%
10.7%
14.9%
9.3%
7.4%
1.8%
22.7%
0.9%
7.1%
9.5%
6.1%
4.8%
1.2%
14.8%
60%30%0%
Percentage of graduates leaving high school having taken an AP Exam Percentage of graduates scoring 3+ on an AP Exam during high school
Art History, Music Theory, Studio Art: Drawing, Studio Art: 2-D Design, and Studio Art: 3-D Design
English Language and Composition, and English Literature and Composition
Comparative Government and Politics, European History, Human Geography, Macroeconomics, Microeconomics, Psychology, United States Government and Politics, United States History, and World History
Calculus AB, Calculus BC, Computer Science A, and Statistics
Biology, Chemistry, Environmental Science, Physics B, Physics C: Electricity and Magnetism, and Physics C: Mechanics
Chinese Language and Culture, French Language and Culture, German Language and Culture, Italian Language and Culture*, Japanese Language and Culture, Latin, Spanish Language, and Spanish Literature and Culture
* AP Italian Language and Culture was discontinued after the 2008-09 school year, and was reinstated in 2011-12.
8
T H E 1 0 T H A N N U A L A P R E P O R T T O T H E N A T I O N · O H I O S U P P L E M E N T
FOSTER ING AP PART IC IPAT ION AND SUCCESS
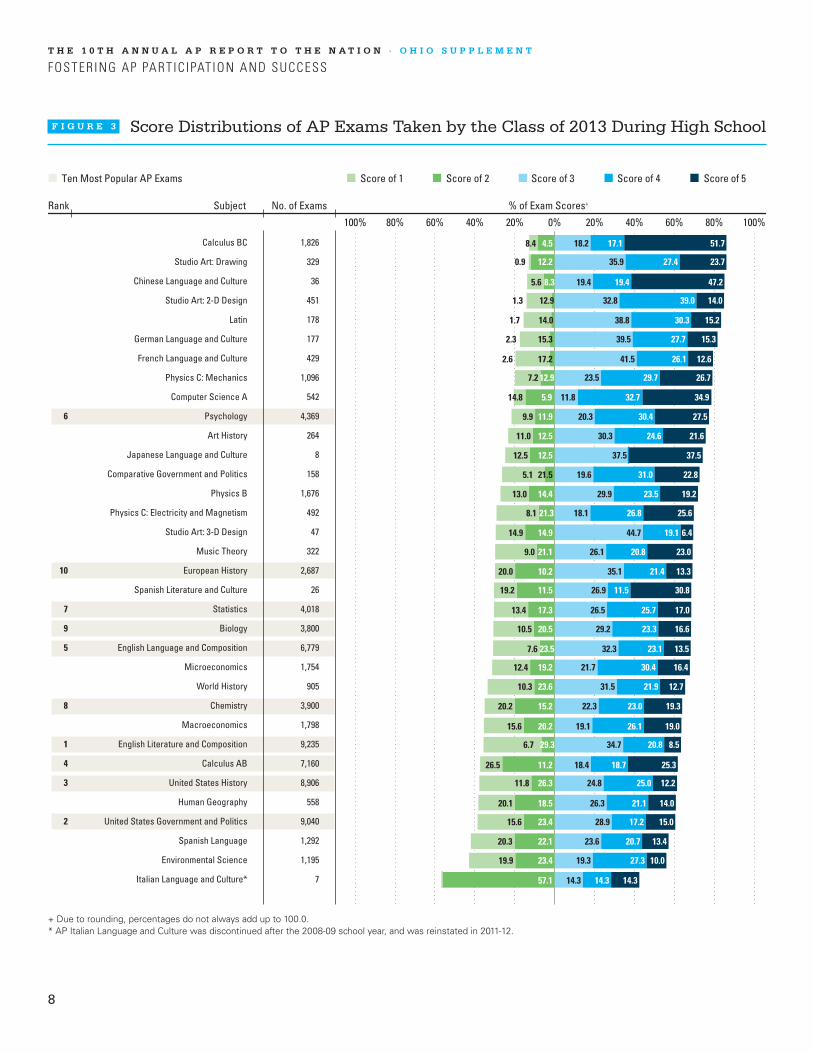
Rank
100% 80% 60% 40% 20% 0% 20% 40% 60% 80% 100%
Subject No. of Exams % of Exam Scores+
+ Due to rounding, percentages do not always add up to 100.0.* AP Italian Language and Culture was discontinued after the 2008-09 school year, and was reinstated in 2011-12.
F I G U R E 3 Score Distributions of AP Exams Taken by the Class of 2013 During High School
Calculus BC 1,826
Studio Art: Drawing 329
Chinese Language and Culture 36
Studio Art: 2-D Design 451
Latin 178
German Language and Culture 177
French Language and Culture 429
Physics C: Mechanics 1,096
Computer Science A 542
6 Psychology 4,369
Art History 264
Japanese Language and Culture 8
Comparative Government and Politics 158
Physics B 1,676
Physics C: Electricity and Magnetism 492
Studio Art: 3-D Design 47
Music Theory 322
10 European History 2,687
Spanish Literature and Culture 26
7 Statistics 4,018
9 Biology 3,800
5 English Language and Composition 6,779
Microeconomics 1,754
World History 905
8 Chemistry 3,900
Macroeconomics 1,798
1 English Literature and Composition 9,235
4 Calculus AB 7,160
3 United States History 8,906
Human Geography 558
2 United States Government and Politics 9,040
Spanish Language 1,292
Environmental Science 1,195
Italian Language and Culture* 7
18.2
35.9
19.4
32.8
38.8
39.5
41.5
23.5
11.8
20.3
30.3
37.5
19.6
29.9
18.1
44.7
26.1
35.1
26.9
26.5
29.2
32.3
21.7
31.5
22.3
19.1
34.7
18.4
24.8
26.3
28.9
23.6
19.3
14.3
17.1
27.4
19.4
39.0
30.3
27.7
26.1
29.7
32.7
30.4
24.6
31.0
23.5
26.8
19.1
20.8
21.4
11.5
25.7
23.3
23.1
30.4
21.9
23.0
26.1
20.8
18.7
25.0
21.1
17.2
20.7
27.3
14.3
51.7
23.7
47.2
14.0
15.2
15.3
12.6
26.7
34.9
27.5
21.6
37.5
22.8
19.2
25.6
6.4
23.0
13.3
30.8
17.0
16.6
13.5
16.4
12.7
19.3
19.0
8.5
25.3
12.2
14.0
15.0
13.4
10.0
14.3
4.5
12.2
8.3
12.9
14.0
15.3
17.2
12.9
5.9
11.9
12.5
12.5
21.5
14.4
21.3
14.9
21.1
10.2
11.5
17.3
20.5
23.5
19.2
23.6
15.2
20.2
29.3
11.2
26.3
18.5
23.4
22.1
23.4
57.1
8.4
0.9
5.6
1.3
1.7
2.3
2.6
7.2
14.8
9.9
11.0
12.5
5.1
13.0
8.1
14.9
9.0
20.0
19.2
13.4
10.5
7.6
12.4
10.3
20.2
15.6
6.7
26.5
11.8
20.1
15.6
20.3
19.9
9
T H E 1 0 T H A N N U A L A P R E P O R T T O T H E N A T I O N · O H I O S U P P L E M E N T
A CLOSER LOOK AT EQUITY GAPS IN AP PART IC IPAT ION AND SUCCESS
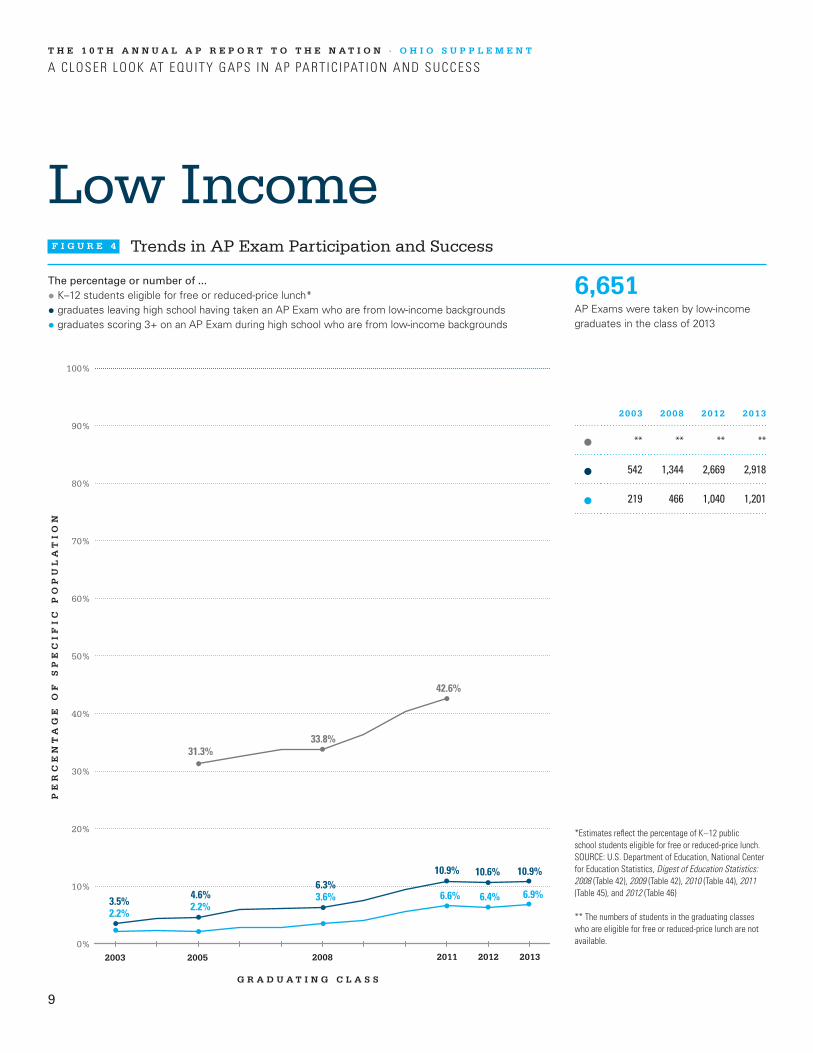
Low Income
6,651AP Exams were taken by low-income graduates in the class of 2013
The percentage or number of ...
• K–12 students eligible for free or reduced-price lunch*
• graduates leaving high school having taken an AP Exam who are from low-income backgrounds
• graduates scoring 3+ on an AP Exam during high school who are from low-income backgrounds
F I G U R E 4 Trends in AP Exam Participation and Success
2003 2005 2008 20122011 2013
PE
RC
EN
TA
GE
OF
SP
EC
IF
IC
PO
PU
LA
TI
ON
G R A D U A T I N G C L A S S
10%
20%
0%
30%
40%
50%
60%
70%
80%
90%
100%
31.3%
33.8%
3.5% 4.6%
2.2%
2.2%
6.4% 3.6%
6.6% 6.9%
6.3%
10.9% 10.6% 10.9%
42.6%
2003 2008 2012 2013
** ** ** **
542 1,344 2,669 2,918
219 466 1,040 1,201
*Estimates reflect the percentage of K – 12 public school students eligible for free or reduced-price lunch. SOURCE: U.S. Department of Education, National Center for Education Statistics, Digest of Education Statistics: 2008 (Table 42), 2009 (Table 42), 2010 (Table 44), 2011 (Table 45), and 2012 (Table 46)
** The numbers of students in the graduating classes who are eligible for free or reduced-price lunch are not available.
10
T H E 1 0 T H A N N U A L A P R E P O R T T O T H E N A T I O N · O H I O S U P P L E M E N T
A CLOSER LOOK AT EQUITY GAPS IN AP PART IC IPAT ION AND SUCCESS
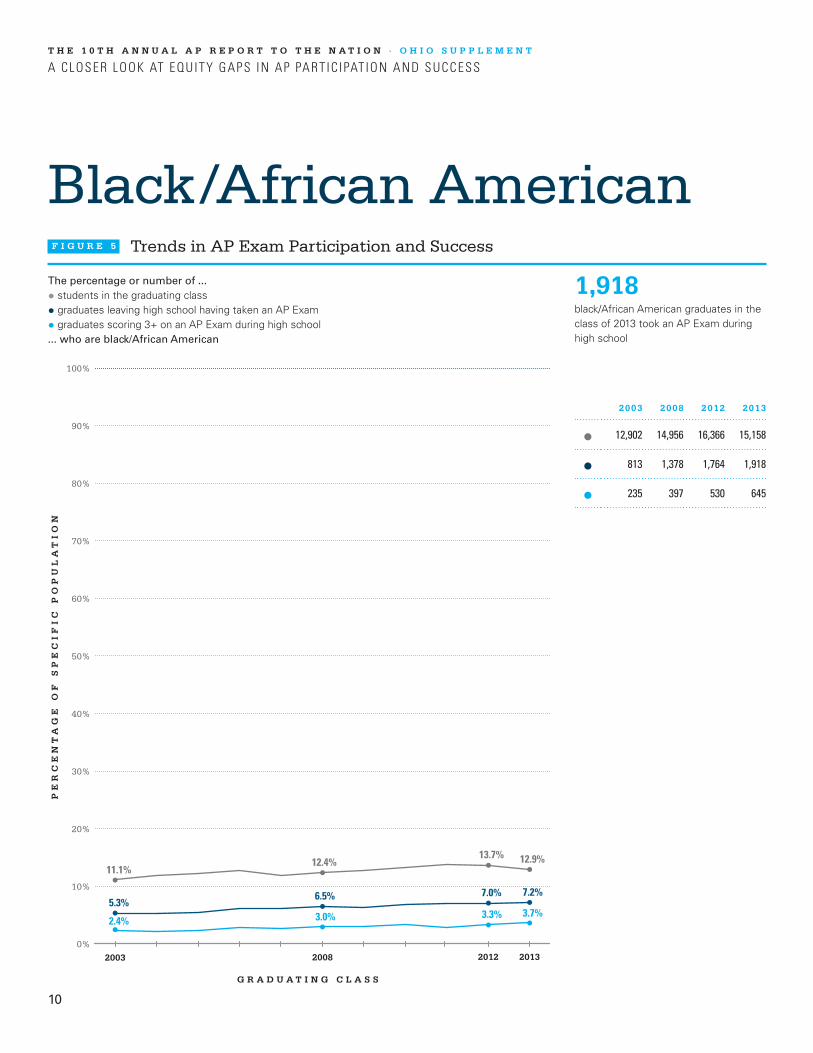
Black/African American
1,918black/African American graduates in the class of 2013 took an AP Exam during high school
The percentage or number of ...
• students in the graduating class
• graduates leaving high school having taken an AP Exam
• graduates scoring 3+ on an AP Exam during high school... who are black/African American
F I G U R E 5 Trends in AP Exam Participation and Success
2003 2008 2012 2013
PE
RC
EN
TA
GE
OF
SP
EC
IF
IC
PO
PU
LA
TI
ON
G R A D U A T I N G C L A S S
10%
20%
0%
30%
40%
50%
60%
70%
80%
90%
100%
11.1%
5.3%
2.4% 3.0% 3.3% 3.7%
6.5% 7.0% 7.2%
12.4% 13.7% 12.9%
2003 2008 2012 2013
12,902 14,956 16,366 15,158
813 1,378 1,764 1,918
235 397 530 645
11
T H E 1 0 T H A N N U A L A P R E P O R T T O T H E N A T I O N · O H I O S U P P L E M E N T
A CLOSER LOOK AT EQUITY GAPS IN AP PART IC IPAT ION AND SUCCESS
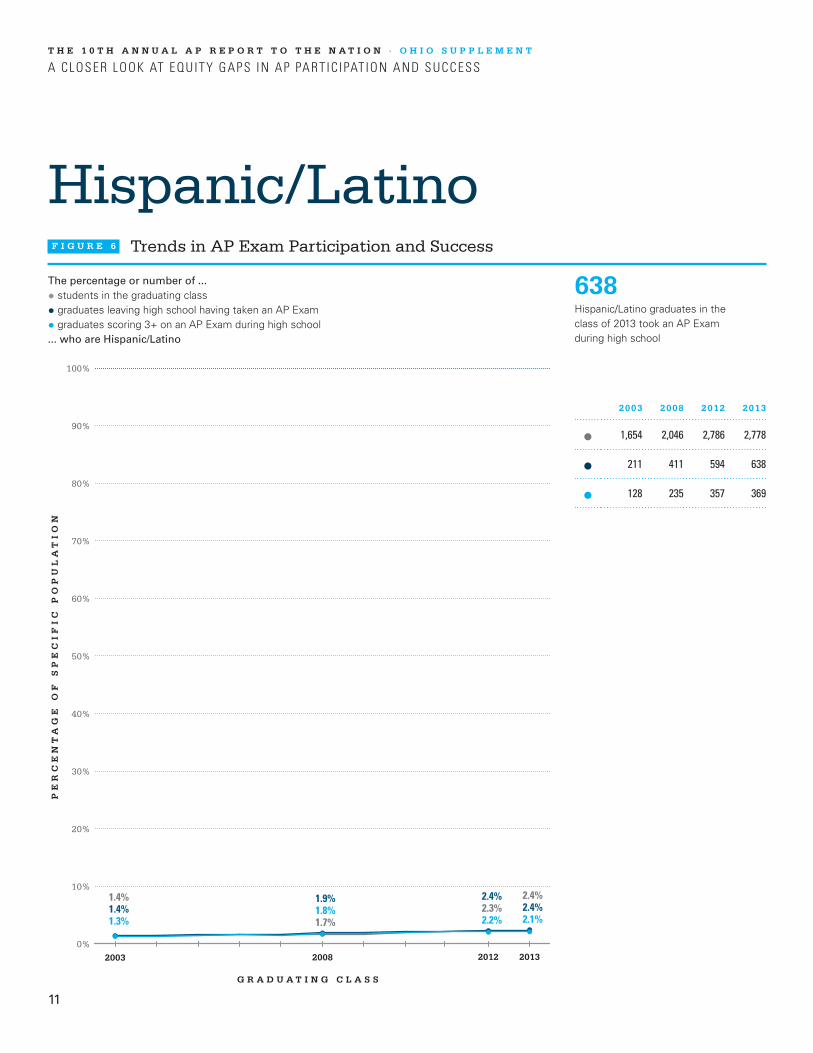
Hispanic/Latino
638Hispanic/Latino graduates in the class of 2013 took an AP Exam during high school
The percentage or number of ...
• students in the graduating class
• graduates leaving high school having taken an AP Exam
• graduates scoring 3+ on an AP Exam during high school... who are Hispanic/Latino
F I G U R E 6 Trends in AP Exam Participation and Success
2003 2008 2012 2013
PE
RC
EN
TA
GE
OF
SP
EC
IF
IC
PO
PU
LA
TI
ON
G R A D U A T I N G C L A S S
10%
20%
0%
30%
40%
50%
60%
70%
80%
90%
100%
1.4%
1.4%
1.3% 1.8%
2.2% 2.1%
1.9% 2.4% 2.4%
1.7%
2.3% 2.4%
2003 2008 2012 2013
1,654 2,046 2,786 2,778
211 411 594 638
128 235 357 369
12
T H E 1 0 T H A N N U A L A P R E P O R T T O T H E N A T I O N · O H I O S U P P L E M E N T
A CLOSER LOOK AT EQUITY GAPS IN AP PART IC IPAT ION AND SUCCESS
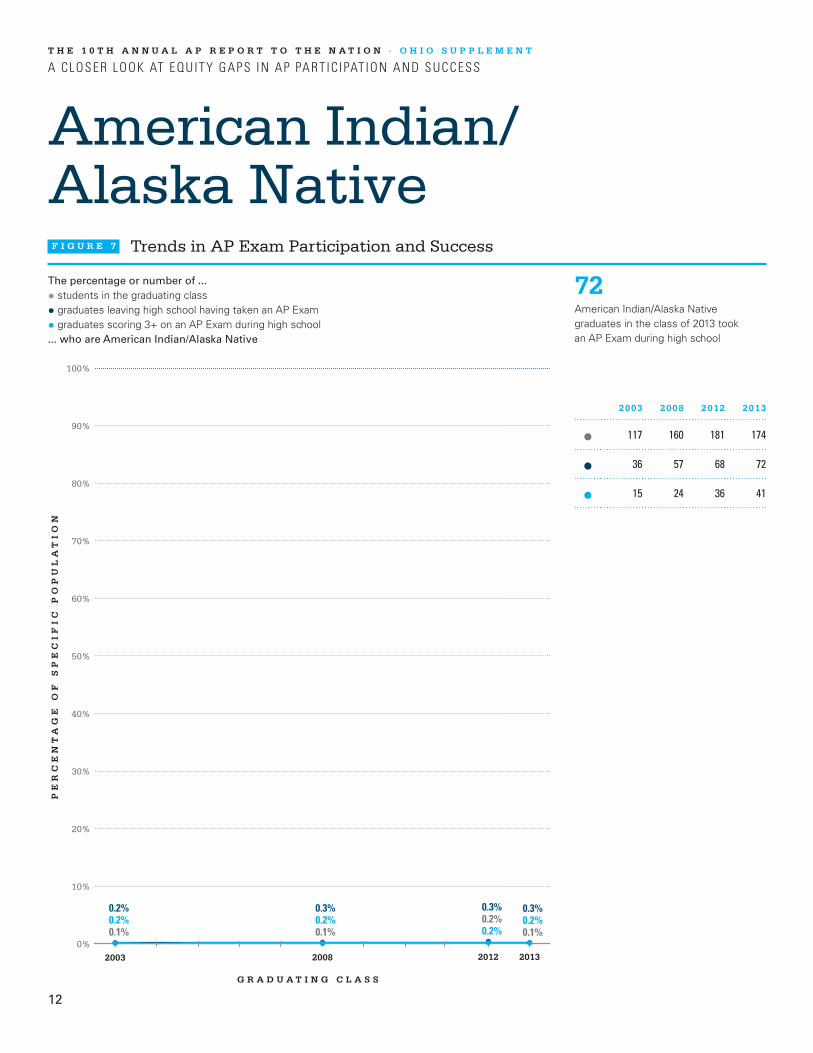
American Indian/ Alaska Native
72American Indian/Alaska Native graduates in the class of 2013 took an AP Exam during high school
The percentage or number of ...
• students in the graduating class
• graduates leaving high school having taken an AP Exam
• graduates scoring 3+ on an AP Exam during high school... who are American Indian/Alaska Native
F I G U R E 7 Trends in AP Exam Participation and Success
2003 2008 2012 2013
PE
RC
EN
TA
GE
OF
SP
EC
IF
IC
PO
PU
LA
TI
ON
G R A D U A T I N G C L A S S
10%
20%
0%
30%
40%
50%
60%
70%
80%
90%
100%
0.1%
0.2%
0.2% 0.2% 0.2%
0.2%
0.3%
0.3% 0.3%
0.1%
0.2% 0.1%
2003 2008 2012 2013
117 160 181 174
36 57 68 72
15 24 36 41
13
T H E 1 0 T H A N N U A L A P R E P O R T T O T H E N A T I O N · O H I O S U P P L E M E N T
A CLOSER LOOK AT EQUITY GAPS IN AP PART IC IPAT ION AND SUCCESS
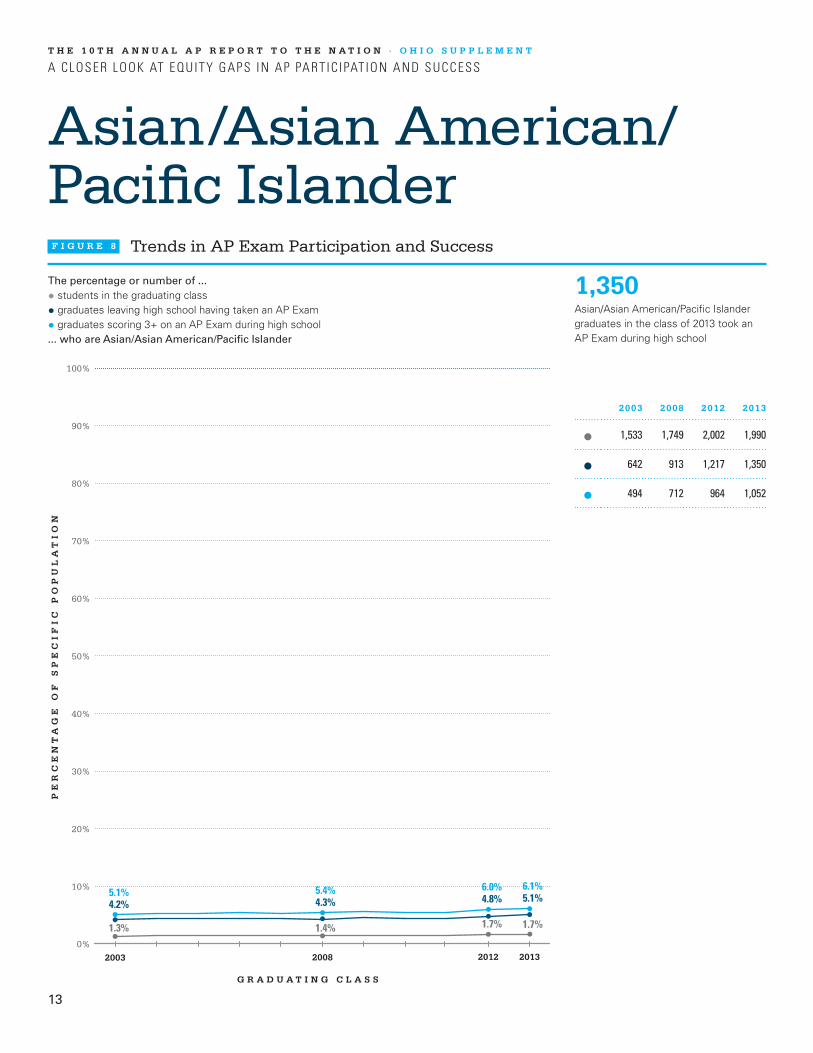
Asian/Asian American/ Pacific Islander
1,350Asian/Asian American/Pacific Islander graduates in the class of 2013 took an AP Exam during high school
The percentage or number of ...
• students in the graduating class
• graduates leaving high school having taken an AP Exam
• graduates scoring 3+ on an AP Exam during high school... who are Asian/Asian American/Pacific Islander
F I G U R E 8 Trends in AP Exam Participation and Success
2003 2008 2012 2013
PE
RC
EN
TA
GE
OF
SP
EC
IF
IC
PO
PU
LA
TI
ON
G R A D U A T I N G C L A S S
10%
20%
0%
30%
40%
50%
60%
70%
80%
90%
100%
1.3%
4.2% 5.1%
5.4%
6.0% 6.1% 4.3% 4.8% 5.1%
1.4%
1.7% 1.7%
2003 2008 2012 2013
1,533 1,749 2,002 1,990
642 913 1,217 1,350
494 712 964 1,052
14
T H E 1 0 T H A N N U A L A P R E P O R T T O T H E N A T I O N · O H I O S U P P L E M E N T
A CLOSER LOOK AT EQUITY GAPS IN AP PART IC IPAT ION AND SUCCESS
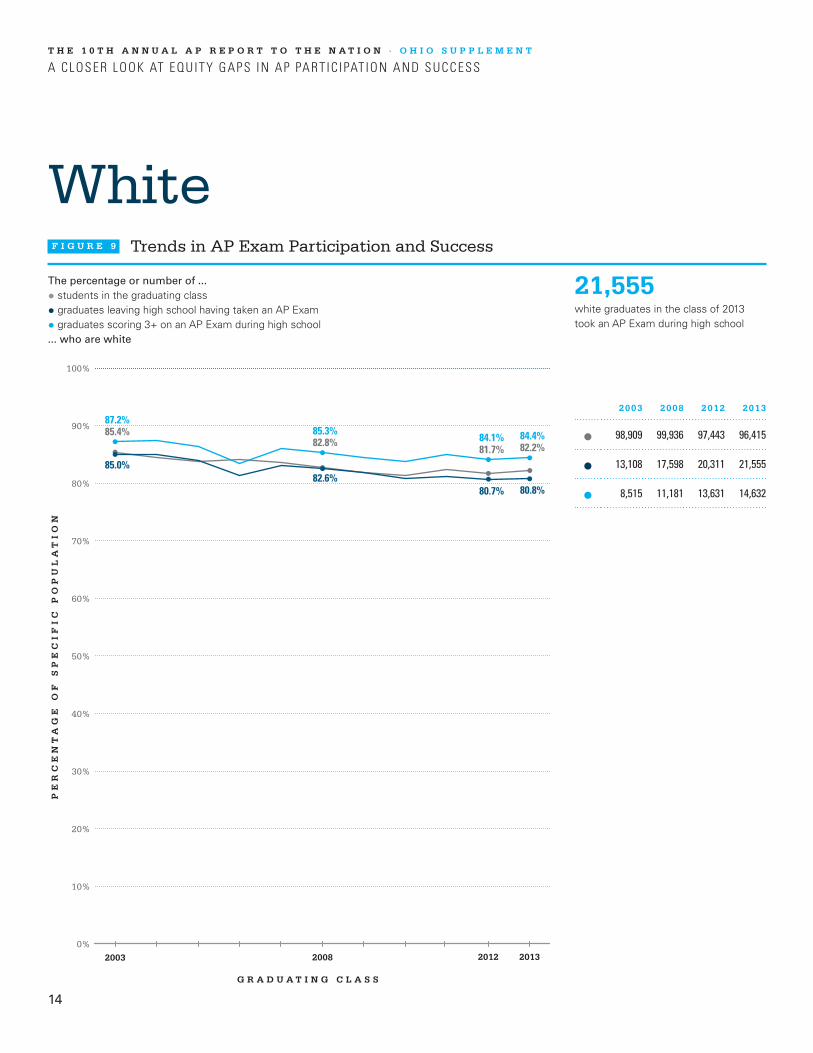
White
21,555white graduates in the class of 2013 took an AP Exam during high school
The percentage or number of ...
• students in the graduating class
• graduates leaving high school having taken an AP Exam
• graduates scoring 3+ on an AP Exam during high school... who are white
F I G U R E 9 Trends in AP Exam Participation and Success
2003 2008 2012 2013
PE
RC
EN
TA
GE
OF
SP
EC
IF
IC
PO
PU
LA
TI
ON
G R A D U A T I N G C L A S S
10%
20%
0%
30%
40%
50%
60%
70%
80%
90%
100%
85.4%
85.0%
87.2%
85.3%
84.1% 84.4%
82.6%
80.7% 80.8%
82.8%
81.7% 82.2%
2003 2008 2012 2013
98,909 99,936 97,443 96,415
13,108 17,598 20,311 21,555
8,515 11,181 13,631 14,632
15
ABOUT THE COLLEGE BOARD
The College Board is a mission-driven not-for-profit
organization that connects students to college success
and opportunity. Founded in 1900, the College Board
was created to expand access to higher education.
Today, the membership association is made up of over
6,000 of the world’s leading educational institutions
and is dedicated to promoting excellence and equity in
education. Each year, the College Board helps more
than seven million students prepare for a successful
transition to college through programs and services in
college readiness and college success — including
the SAT®, and the Advanced Placement Program®. The
organization also serves the education community through
research and advocacy on behalf of students, educators,
and schools.
For further information, visit www.collegeboard.org.
© 2014 The College Board. College Board, Advanced Placement, Advanced Placement Program, AP, SAT and the acorn logo are registered trademarks of the College Board. All other products and services may be trademarks of their respective owners. Visit the College Board on the Web: www.collegeboard.org.
apreport.collegeboard.org

![WELCOME [pa01001022.schoolwires.net] · 4 additional AP Courses will be available in 10th grade ~based on teacher recommendation and 9 th grade performance AP World History AP Statistics](https://img.pdfslide.net/doc/110x75/5e8a7be25b8703221e7a741b/welcome-4-additional-ap-courses-will-be-available-in-10th-grade-based-on-teacher.jpg)